Cycle route network planning using GIS Andrew G. Macbeth, BE, MEng, CPEng, FIPENZ (civil) ViaStrada Ltd, Christchurch [email protected] www.viastrada.co.nz Co-authors: Tricia Allen (formerly ARTA) and Tony Barton (VicRoads, Melbourne) Presentation to 6 th NZ Cycling Conference Napier, Friday 2 November 2007

Welcome message from author
This document is posted to help you gain knowledge. Please leave a comment to let me know what you think about it! Share it to your friends and learn new things together.
Transcript

Cycle route network planning using GIS
Andrew G. Macbeth, BE, MEng, CPEng, FIPENZ (civil)ViaStrada Ltd, Christchurch
Co-authors: Tricia Allen (formerly ARTA) and Tony Barton (VicRoads, Melbourne)
Presentation to 6th NZ Cycling ConferenceNapier, Friday 2 November 2007

Tricia Allen and Tony Barton
Auckland

Melbourne

Useful data for cycle planning in GIS• General topographical features such as rivers,
coastlines, railways and town or activity centres;• Centrelines of roads and cycle route networks (both
on-road and off-road);• Municipal boundaries;• Zone boundaries for conventional transport planning
computer models;• Census population and employment data,
aggregated into transport planning zones;• School rolls, aggregated to zone level; and• Cycle crash locations for the last five years

Demographic density
• Residential, employment and education totals from Census and school data
• Combine within transport planning model zones
• Display as persons per hectare using GIS• Cycle network should service highest
density areas first

Demographic density
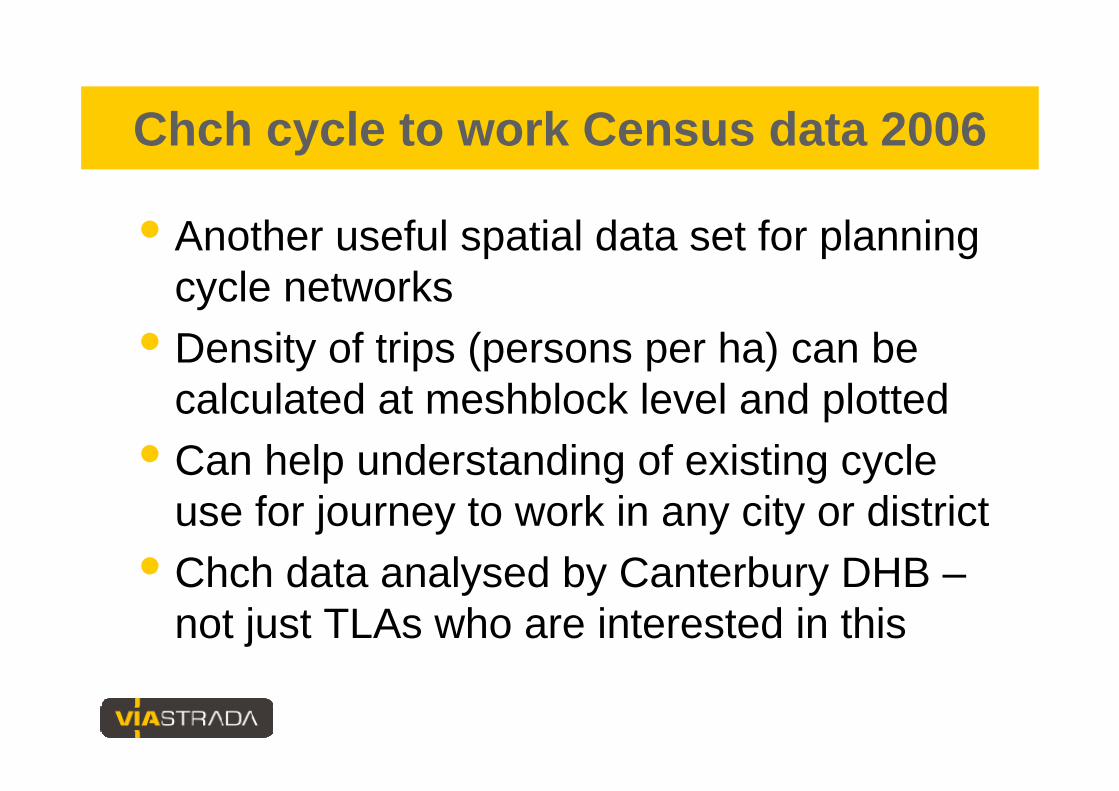
Chch cycle to work Census data 2006
• Another useful spatial data set for planning cycle networks
• Density of trips (persons per ha) can be calculated at meshblock level and plotted
• Can help understanding of existing cycle use for journey to work in any city or district
• Chch data analysed by Canterbury DHB –not just TLAs who are interested in this

Christchurch Cycle to Work Origins Census 2006

Crash data and cycle network
• Crash data and cycle network can be mapped
• Often cycle crash data align with proposed cycle routes
• Intention is to render cycle routes safe so that crashes diminish

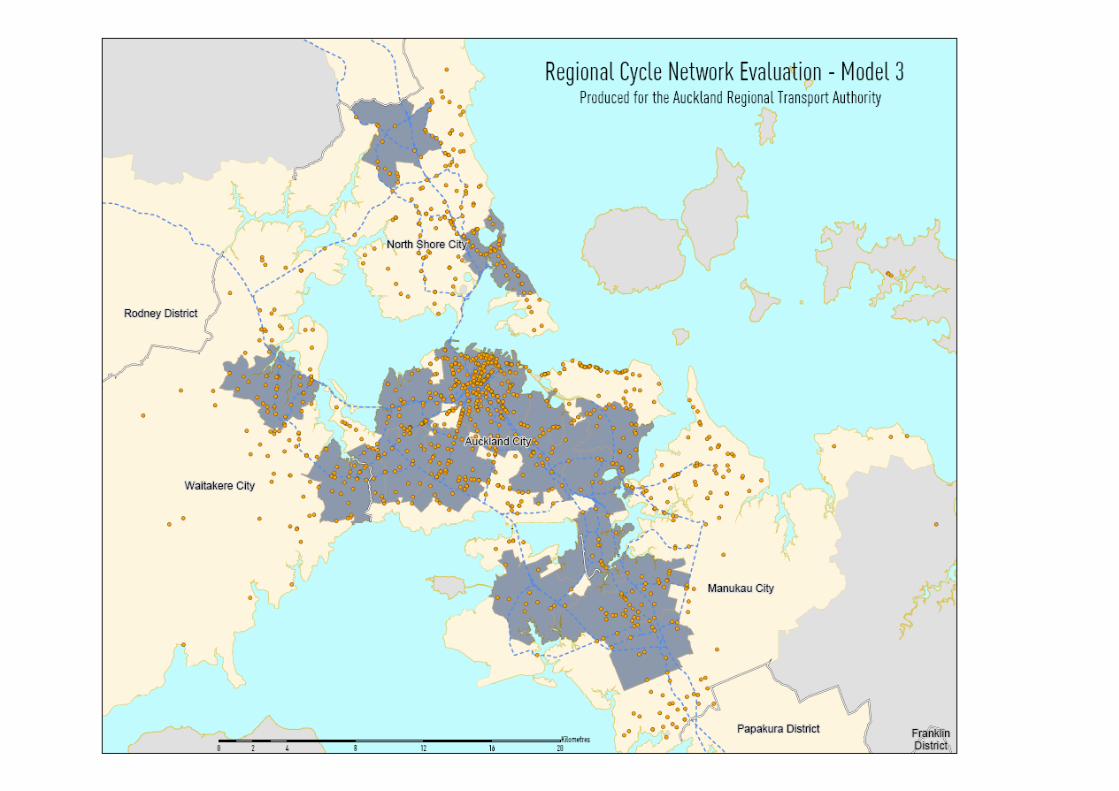
Auckland cycle network and crash data

Auckland network models
• Model 1: The sum of the parts• Model 2: Regionally strategic parts of
Model 1• Model 3: Town centres• Model 4: Town centres with regional
links


Network comparisons
0.11
1,420
154
80%
74%
Model 4
0.100.190.18Final Score (normal-ised by length)
1,192375854Cycle Network Length (km)
11571155Raw Score(out of 200)
60%24%74%Safety (crash coverage)
55%47%82%Demographic Coverage
Model 3Model 2Model 1

Model 2 network length, crashes
272
26
112
83
51
No.
Model 2 Cycle Crashes
24%
19%
65%
44%
8%
% of cycle
crashes
1138
135
173
188
642
2001-05
Total Cycle Crashes
9%
7%
11%
11%
6%
% of road length
4,395
937
804
1,300
1,354
km
Total Road Length
375
66
91
143
75
km
Model 2 Cycle Network Length
Waitakere City
Total
North Shore City
Manukau City
Auckland City

Model 2 (old & new) network length
14%1317%66937Waitakere City
375
91
143
75
km
Original Model 2
4,395
804
1,300
1,354
km
Total Road Length
15%6669%Total
15%11911%North Shore City
13%16911%Manukau City
18%2476%Auckland City
% of road length
km% of road length
New Model 2

Network comparisons
0.11
1,420
154
80%
74%
Model 4
0.260.100.190.18Final Score (normal-ised by length)
6661,192375854Cycle Network Length (km)
17311571155Raw Score (out of 200)
92%60%24%74%Safety (crash coverage)
82%55%47%82%Demographic Coverage
New Model 2
Model 3Model 2Model 1

Existing and proposed routes
• Buffers around cycle network show demographic coverage
• Can be superimposed on demographic densities to identify missing key links
• Visual inspection provides useful clues• Has been trialled in Melbourne• Further work needed to develop a tool to
optimise the technique

Existing and proposed routes, buffers

Coverage of different buffers
• Assume people living within 500 m of cycle network have access to it
• 500 m = 2 minutes at 15 km/h• Average time to access network = 1 min.• Can calculate demographic coverage for a
network for any given buffer• Can compare coverage of different networks
or existing and proposed networks

Coverage of 400 m, 800 m & 1.6 km buffers

Conclusions
• GIS helps analyse and visualise complex spatial data
• Improves objectivity of cycle route network planning
• Helps rationalise spending for most effective cycle network projects
Related Documents


