Cycle route choice Final survey and model report Report June 2012 Prepared for: Prepared by: Transport for London Windsor House 42-50 Victoria Street, London SW1H 0TL London Steer Davies Gleave 28-32 Upper Ground London SE1 9PD +44 (0)20 7910 5000 www.steerdaviesgleave.com

Welcome message from author
This document is posted to help you gain knowledge. Please leave a comment to let me know what you think about it! Share it to your friends and learn new things together.
Transcript

Cycle route choice
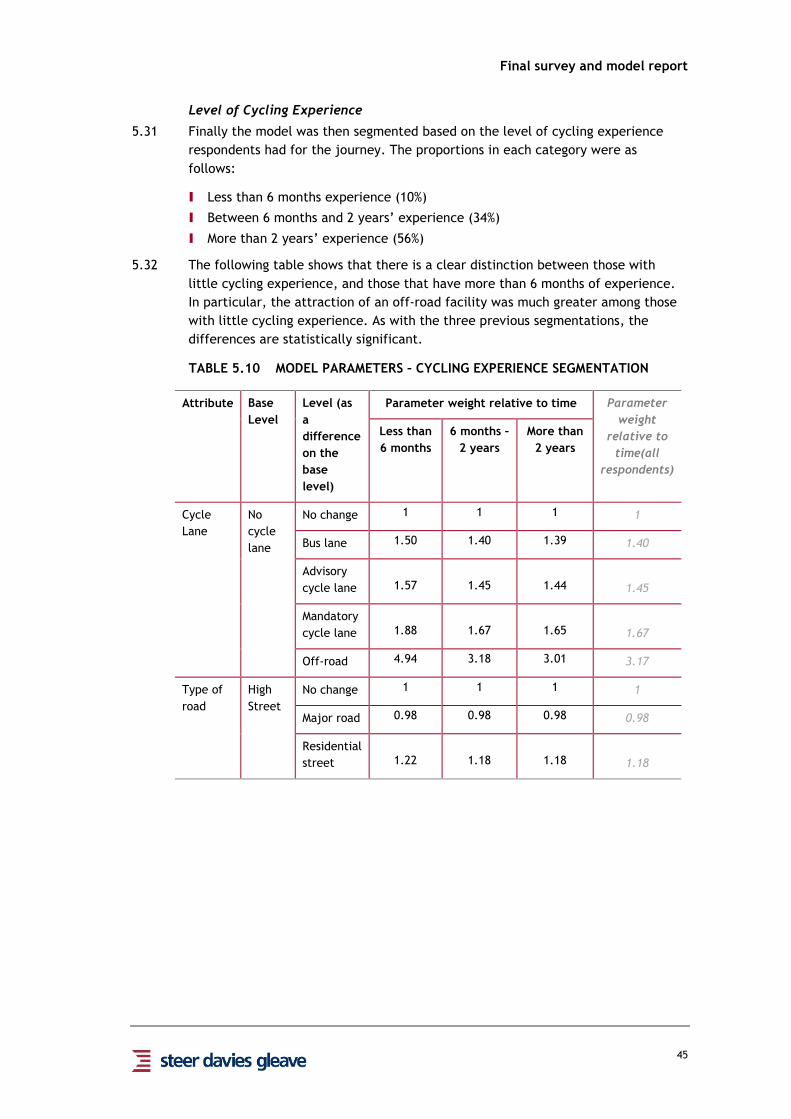
Final survey and model report
Report
June 2012
Prepared for: Prepared by:
Transport for London
Windsor House 42-50 Victoria Street, London SW1H 0TL London
Steer Davies Gleave
28-32 Upper Ground
London SE1 9PD
+44 (0)20 7910 5000
www.steerdaviesgleave.com


Final survey and model report
Contents
CONTENTS
EXECUTIVE SUMMARY ...................................................................................... I
Overview............................................................................................... i
Sample ................................................................................................. i
Cycling patterns ...................................................................................... i
Attitudes ............................................................................................... i
Impact of green spaces ............................................................................ ii
Impact of cycle lanes ............................................................................... ii
Journey profile ...................................................................................... ii
Junction safety ...................................................................................... ii
Stated preference model .......................................................................... iii
1 INTRODUCTION ..................................................................................... 1
The purpose of this study ........................................................................... 1
The Structure of this report ........................................................................ 1
2 METHODOLOGY AND SAMPLING ................................................................. 3
Introduction ........................................................................................... 3
Qualitative study ..................................................................................... 3
Quantitative study ................................................................................... 3
Health warnings ...................................................................................... 5
3 SAMPLE PROFILE AND ATTITUDES .............................................................. 7
Introduction ........................................................................................... 7
Demographics ......................................................................................... 7
Cycle use .............................................................................................. 8
Route choice considerations ..................................................................... 13
Journey profile ..................................................................................... 23
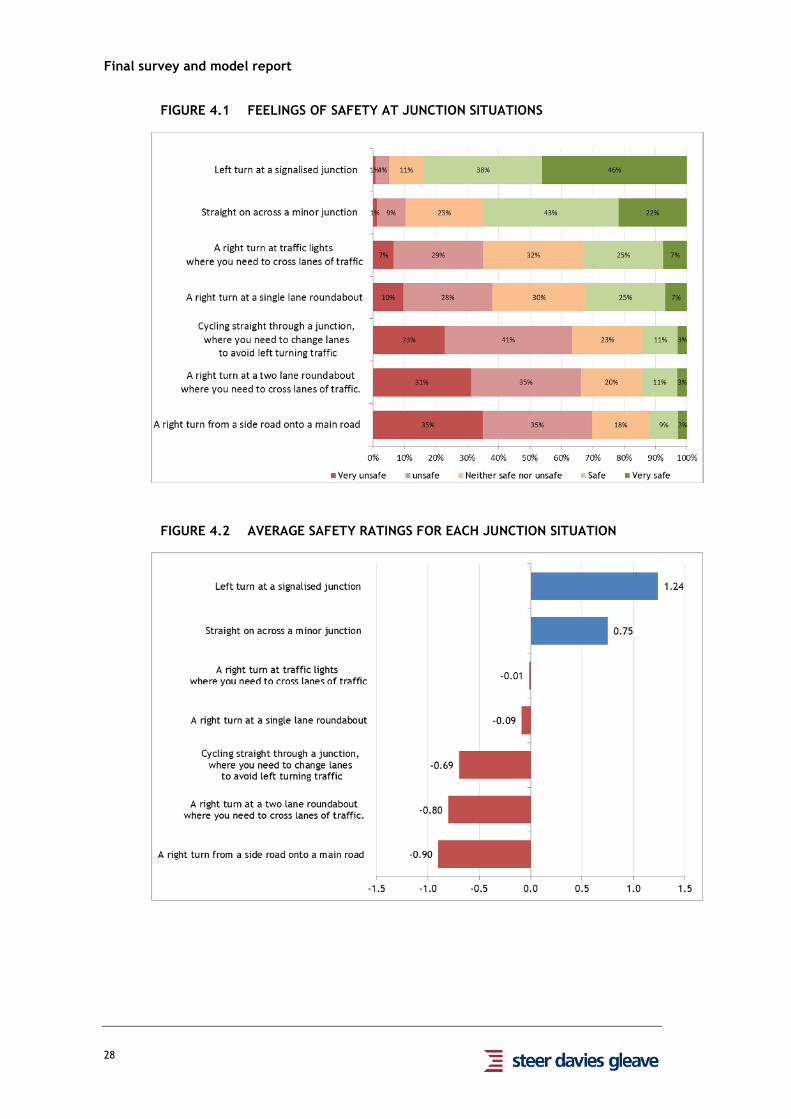
4 JUNCTION SAFETY ................................................................................ 27
Introduction ......................................................................................... 27
Safety rating ........................................................................................ 27
Detour experiment ................................................................................. 30
5 MODEL REPORT .................................................................................... 35
Introduction ......................................................................................... 35
Methodology ........................................................................................ 35
Stated preference theory ......................................................................... 37
Final survey and model report
Contents
Stated preference analysis ....................................................................... 37
NB. Route A always showed a 10 minute journey. ........................................... 39
Model parameter results .......................................................................... 39
Segmentations ...................................................................................... 41
6 CONCLUSION ....................................................................................... 47
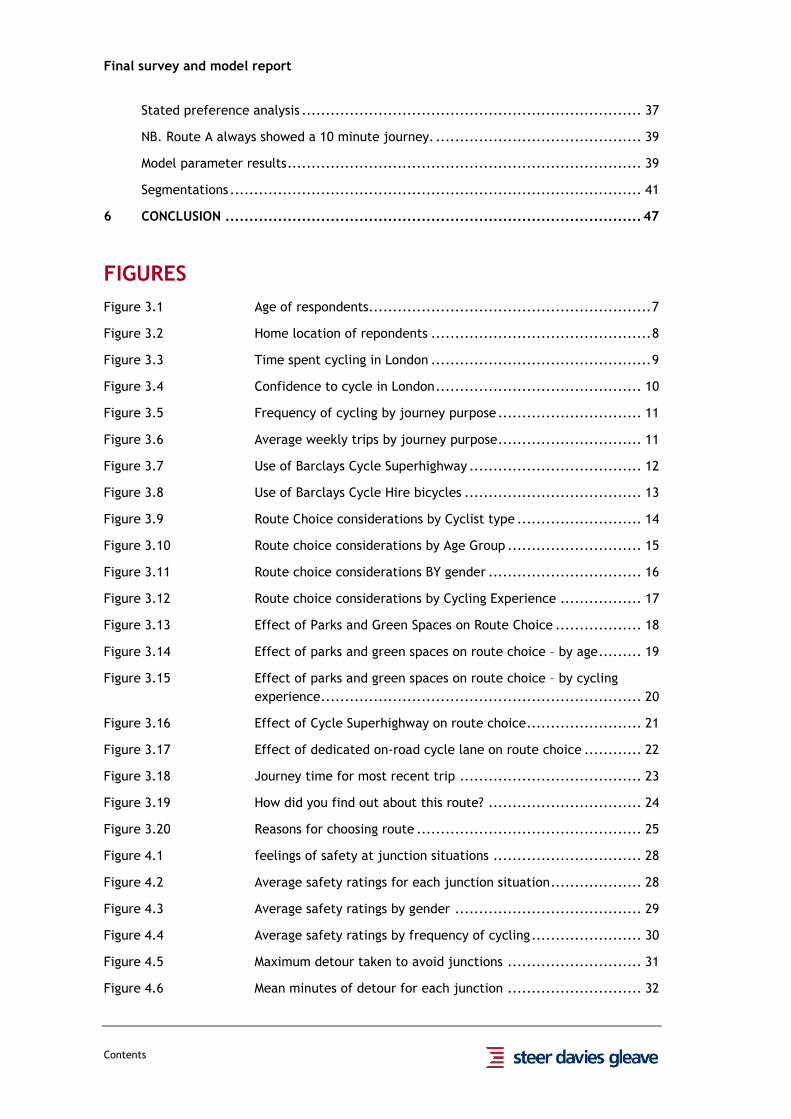
FIGURES
Figure 3.1 Age of respondents........................................................... 7
Figure 3.2 Home location of repondents .............................................. 8
Figure 3.3 Time spent cycling in London .............................................. 9
Figure 3.4 Confidence to cycle in London ........................................... 10
Figure 3.5 Frequency of cycling by journey purpose .............................. 11
Figure 3.6 Average weekly trips by journey purpose .............................. 11
Figure 3.7 Use of Barclays Cycle Superhighway .................................... 12
Figure 3.8 Use of Barclays Cycle Hire bicycles ..................................... 13
Figure 3.9 Route Choice considerations by Cyclist type .......................... 14
Figure 3.10 Route choice considerations by Age Group ............................ 15
Figure 3.11 Route choice considerations BY gender ................................ 16
Figure 3.12 Route choice considerations by Cycling Experience ................. 17
Figure 3.13 Effect of Parks and Green Spaces on Route Choice .................. 18
Figure 3.14 Effect of parks and green spaces on route choice – by age ......... 19
Figure 3.15 Effect of parks and green spaces on route choice – by cycling
experience ................................................................... 20
Figure 3.16 Effect of Cycle Superhighway on route choice ........................ 21
Figure 3.17 Effect of dedicated on-road cycle lane on route choice ............ 22
Figure 3.18 Journey time for most recent trip ...................................... 23
Figure 3.19 How did you find out about this route? ................................ 24
Figure 3.20 Reasons for choosing route ............................................... 25
Figure 4.1 feelings of safety at junction situations ............................... 28
Figure 4.2 Average safety ratings for each junction situation ................... 28
Figure 4.3 Average safety ratings by gender ....................................... 29
Figure 4.4 Average safety ratings by frequency of cycling ....................... 30
Figure 4.5 Maximum detour taken to avoid junctions ............................ 31
Figure 4.6 Mean minutes of detour for each junction ............................ 32
Final survey and model report
Contents
Figure 4.7 Responses by order of questionning ..................................... 33
Figure 5.1 Example SP Card ............................................................ 36
Figure 5.2 Stated Preference parameter weights – All respondents ............ 41
Figure 6.1 Index of Attribute Level of Benefits .................................... 48
Figure 6.2 Index of Attribute Level of Benefits – by gender ..................... 49
TABLES
Table 2.1 Achieved sample .............................................................. 4
Table 2.2 Frequency of cycling ......................................................... 5
Table 5.1 SP Attributes and Levels .................................................. 36
Table 5.2 Trading analysis ............................................................. 38
Table 5.3 Choice proportions – Cycle lane provision in route B ................ 38
Table 5.4 Choice proportions – Type of road in route B ......................... 39
Table 5.5 Choice proportions – Journey time in route B ......................... 39
Table 5.6 Model parameters – all respondents .................................... 40
Table 5.7 Model parameters – Gender segmentation ............................. 42
Table 5.8 Model parameters – Cyclist type segmentation ....................... 43
Table 5.9 Model parameters – Journey Purpose segmentation ................. 44
Table 5.10 Model parameters – Cycling Experience segmentation .............. 45
APPENDICES
A QUESTIONNAIRE
B QUALITATIVE REPORT
C PILOT REPORT

Final survey and model report
i
Executive Summary
Overview
1. This study has investigated the decisions that cyclists in London make when
deciding which route to take, and the relative importance of different route
features. The study has also looked at more general preferences and attitudes
among cyclists.
Sample
2. Following a short qualitative stage an online survey was designed. This was
completed by 100 participants during a pilot and by a further 2,307 cyclists during
the full fieldwork. 1,405 of these came from two TfL contacts databases, with the
remaining 902 from Research Now’s panel.
3. The TfL databases achieved very high response rates with 24.8% for Barclays Cycle
Hire users and 23.5% for those on the ‘expressed interest in cycling’ list.
Cycling patterns
4. Most of those interviewed cycled at least three times a week (1,312), with 569
cycling once to twice a week and the remaining 426 cycling at least once a month
but less than once a week.
5. On average cyclists made 2.4 commuter trips per week, and 1.5 to travel to a
leisure activity.
6. Use of the Barclays Cycle Superhighways was fairly mixed amongst respondents,
with 20% using them at least 3 days a week, and most people having some
experience of using one.
7. Though a significant proportion (27%) said that they had never used the Barclays
Cycle Hire scheme, the same proportion use it at least 3 days a week.
Attitudes
8. Across all cyclists, the key considerations around route choice centred on
choosing the safest routes, and avoiding traffic (either by cycling in a cycle lane
separate to the traffic, or on roads where traffic volume is lower). In particular
the highest score across all groups was for the statement “I would prefer cycling
in a cycle lane even if it meant a longer journey”.
9. It is certainly not the case that cyclists will always choose the most direct route
when making a journey – even among the most frequent cyclists.
10. Female respondents were much more likely to prefer safer routes, away from
other traffic, and away from difficult junctions.
11. Those with a lower amount of cycling experience in London (i.e. less than 2 years)
are also more safety conscious when cycling, preferring to travel on routes with
less traffic and a cycle lane, whilst avoiding the more difficult junctions.
Final survey and model report
ii
Impact of green spaces
12. Around half of all cyclists would change their route in order to travel through parks and/or green spaces, with around 15% saying that they would be prepared
to use a significantly longer route.
13. There was much greater willingness to change route for parks and green spaces
amongst the over 55s. Overall 67% of over 55s said they would change their route,
compared to 58% of 35-54 year olds, and 47% of under 35s.
Impact of cycle lanes
14. On average, 40% of all respondents said they would change their route in order to use a cycle superhighway, with 8% prepared to use a noticeably longer route in
order to do so. This was less than the equivalent answers for green spaces, where
54% and 14% said they would change, or change to a noticeably longer route.
15. Willingness to change route for a dedicated on-road cycle lane was higher than for
cycle superhighways, but lower than for parks and green spaces. 51% said that
they would change their route in order to use it, with 12% willing to use a
noticeably longer route in order to use it. This may be because dedicated cycle
lanes are often on quieter roads than cycle superhighways.
Journey profile
16. Respondents were asked in detail about the most recent trip they made. This trip
was then the focus for the stated preference exercise. The mean length of these
trips was 28 minutes and the median was 25 minutes. Forty-seven per cent of
respondents reported trips of 10-20 minutes (see Figure 3.18).
17. The trip length varied very little with age, gender, experience or frequency of cycling.
18. Respondents were asked how they found out about the route they chose. The most common response was that they knew the area (41% of respondents). This
increased for those who had been cycling in London for the longest.
19. The newest cyclists were much more likely to use a cycle journey planner (38%
compared to 24% for those cycling between 6months to 2 years and 17% for those
cycling for more than two years.
20. Women were slightly less likely to use a map and more likely to use a journey
planner (26% and 24% for women compared to 33% and 20% for men respectively).
21. The main reason for choosing the route taken was that it was the most direct
route available to them (42% of respondents cited this as one of their reasons).
This was followed by the volume of traffic (40%), familiarity with the route (38%)
and that the route was the most pleasant (36%).
Junction safety
22. The majority of cyclist causalities in London occur at junctions and it has also
been found that cyclists perceptions of the risk associated varies across different
types of junction. There are obviously implications for route choice and so the
questionnaire sought to explore this further.
23. Turning left at a signalised junction was perceived to be the safest of the range of junction scenarios shown, with 84% saying they felt safe or very safe in this

Final survey and model report
iii
situation. Travelling straight on across a minor junction was also perceived to be
fairly safe.
24. The least safe junctions were perceived to be a right turn at a two lane round-about and a right turn from a minor road onto a major one with, respectively, 66%
and 70% of respondents feeling unsafe or very unsafe. On average respondents
were willing to detour for 7.5 minutes to avoid these types of junction.
25. In general female respondents were slightly more likely to rate each junction as
less safe than male respondents.
26. Those who cycled most regularly felt safer at most junctions than less frequent
cyclists. Older respondents also tended to feel less safe than younger ones.
However, all these differences were very slight.
Stated preference model
27. Each respondent was shown a total of 12 scenarios. The three key attributes tested in the model were:
I journey time,
I provision of cycle lane, and
I the nature of the road (i.e. a major road, high street or residential street). This
attribute took into account the volume of traffic as well as the speed.
28. Overall there is a high level of trading (the number of respondents who varied the
route that they chose across the 12 cards), which indicates that people are
prepared to consider a change of route under the right conditions and that the
levels of each attribute have been set appropriately.
29. The most frequent cyclists were more likely to always opt for the fastest route,
regardless of conditions. Those travelling for a work-based trip (either commuting
to/from work or on a business trip) were again more likely to choose the fastest
route in every scenario.
30. All model parameters are highly significant. However, the model results show that
the extent of cycle lane provision was of far greater significance than the type of
road being used.
31. The presence of an off-road route was particularly highly valued. 32. The model parameters have been adjusted to represent the value, in terms of
additional time a cyclist would be prepared to add to their journey in order to use
each attribute. The figures relate to journey time changes on a 10 minute journey
and clearly indicate the relative value of different attributes. However, due to
different questioning methods these values should not be directly compared with
the times given during the junction detour game.
33. For every minute spent cycling on a road without a lane respondents would spend
1.4 minutes to cycle in a bus lane, 1.45 to cycle in an advisory (narrow) cycle
lane, 1.67 to cycle in a mandatory (wide) lane and 3.17 to cycle off-road.
34. When the results were segmented by demographics and frequency of cycling the
main difference was in the value of the off-road option, with women and newer
cyclists valuing it particularly highly.
35. For every minute in a cycle lane female respondents would spend 5.19 off-road.
36. The most regular cyclists had a weight of 2.7 minutes for the off-road option,
compared to the least regular cyclists whose weight was 7.2.

Final survey and model report
iv
37. In general, as cycling frequency reduces, so does the respondent’s time
sensitivity, and consequently the benefits for a higher ‘quality’ journey increases.
38. The one attribute where the choice proportions were not as expected were for the type of road. In the pilot survey, the results of the SP exercise were such that
it appeared that cycling on a high street was in fact perceived to be worse than
cycling on a major road. In the final survey this was reversed but the differences
between the two types of road were minimal.
39. For 1 minute cycling on a high street respondents were prepared to spend 0.98
minutes cycling on a major road. There was a small preference for the residential
road, with respondents willing to spend 1.18 minutes on residential streets for
each 1 minute on a high street. This did not vary greatly for demographic or
cycling frequency segments.

Final survey and model report
1
1 Introduction
The purpose of this study
1.1 The aim of this study was to investigate the relative value to cyclists of various
route attributes and options (such as cycle lanes and traffic speeds) and to better
understand how cyclists make route choices.
1.2 A key aim was to provide a quantified basis for assessing the appeal or deterrent
value of different route options. Where possible results have therefore been
presented in terms of the additional time that respondents would be spend to
cycle on a perceived ‘higher quality’ route, or conversely to avoid an unpleasant
route or aspect of a route (such as a complex junction).
1.3 The figures relate to journey time changes on a 10 minute journey and indicate
the relative value of different attributes. However, due to different questioning
methods the time values obtained in different sections of the questionnaire should
not be directly compared with each other. In particular the values placed on
avoiding junctions should not be directly compared to the stated preference
results.
1.4 The study outputs will be used to improve the representation of cyclists route
choice in Transport for London’s models. It will also help understand and predict
the impact of various route based interventions.
1.5 The study consisted of qualitative research, which was used to identify the
relevant route attributes, and then a quantitative on-line survey including a stated
preference section.
1.6 This report focuses on the online survey, with the qualitative findings reported in
an appendix.
The Structure of this report
I Chapter two sets out the method and reports on the achieved sample size.
I Chapter three covers the analysis of demographics, cycle use and attitudes.
I Chapter three presents the results of the junction safety questions.
I Chapter five is the stated preference model report.
I Chapter six presents the conclusion.
I Appendix A is the final, post-pilot questionnaire.
I Appendix B is the report from the qualitative study.
I Appendix C is the pilot report.

Final survey and model report
3
2 Methodology and sampling
Introduction
2.1 This chapter briefly summarises the findings from the qualitative study and the
pilot and explains how these were used to design the online questionnaire. The
chapter then sets out the approach to sampling and the response rates achieved.
Qualitative study
2.2 The purpose of the qualitative research was to inform the design of the stated
preference questions and particularly the description of the alternative route
options (or levels). An important consideration here was to make the research as
close to real life as possible. With this in mind, it was decided to interview cyclists
during their normal cycling trips. Cyclists were approached by interviewers (also
on bikes) at traffic lights and bike parks. This was done at a number of locations
across London, at different times of day (Morning and evening peak as well as off-
peak). They were then accompanied on a 10-15 minute section of their journey
and asked questions about the route they had taken and their reasons for choosing
it.
2.3 In total, 16 accompanied cycle rides were undertaken between 2nd and 13th April
2012.
2.4 As this was a new method, and perceived to be potentially invasive, participants
were offered a £20 Amazon Gift Voucher. However, a debrief with the interviewers
suggested that most respondents would have been happy to participate for a £10
incentive.
2.5 The research found that route safety, volume of traffic, and also speed (of both
the traffic and of the cyclist’s own journey) scored most highly and were the
factors that influenced route choice the most.
2.6 Given the small sample, the conclusions drawn from these results cannot be
considered statistically significant. However the findings were used in order to
inform the design of the online survey, in particular the stated preference
exercises. The full results are included in Appendix B.
Quantitative study
Pilot Survey
2.7 The online questionnaire was piloted by our fieldwork sub-contractors Research
Now, and was completed by 97 of their panel within 24 hours.
2.8 A link to the questionnaire was also sent out to 50 respondents from TfL
databases. Five complete responses were received within 15 hours, but one had to
be rejected as it was completed too quickly (implying that the questions had not
been read properly). 101 responses were therefore analysed.
2.9 The main purpose of the pilot was to test the design of the stated preference
questions. In summary, the results of the main surveys yielded sensible conclusions
Final survey and model report
4
and the stated preference analysis generated valuable results. However, the
results also highlighted some minor issues with the design and, as a result a
number of small changes were made to the design. These are set out, along with
more detail on the pilot findings in Appendix C.
Online Questionnaire
2.10 The final questionnaire is included in Appendix A and comprised questions on the
following:
I Screening questions to ensure that the respondent had cycled in London in the
last month;
I Socio-demographic characteristics;
I Frequency of cycling;
I Attitudes;
I Perceptions of junction safety;
I Stated preference experiment on route choice.
Sample
2.11 The sample was drawn from three sources:
I Research Now’s panel of respondents;
I TfL’s database of people who have expressed an interest in cycling;
I TfL’s database of Barclay’s cycle hire users.
2.12 An email invite was sent to TfL sample respondents, which was followed by a
reminder one week later.
TABLE 2.1 ACHIEVED SAMPLE
TfL sample RN panel Total
Total 1,405 902 2,307
2.13 The sample was segmented by frequency of cycling into three categories: those
cycling at least three times a week; those cycling at least once but less than three
times a week; and those who cycle less often, but at least once a month. The
majority of respondents were in the most frequent category (see Table 2.2). This
represents the fact that these cyclists actually carry out the greatest proportion of
trips.
Final survey and model report
5
TABLE 2.2 FREQUENCY OF CYCLING
At least 3 times
a week
1-2 times a
week
Other cyclists
Total 1,312 569 426
Response rates
2.14 The response rates were very similar for both the TfL samples at 24.8% for the
Barclays Cycle Hire users and 23.5% for those who had expressed an interest in
cycling. This is very high for an online survey and probably reflects the fact that
the sample were interested in the subject of the survey. In comparison the
Research Now panel response rate was 10%.
Health warnings
2.15 As with any survey it is likely that those with more interest in the subject matter
are more likely to respond, which may cause a bias in some of the answers.

Final survey and model report
7
3 Sample profile and attitudes
Introduction
3.1 This chapter describes the results from the questions on demographics, cycle use
and attitudes.
Demographics
3.2 The majority of respondents were male: 65% compared with 35% female. There
was a reasonable spread of ages, with the greatest proportion aged 25-34 (see
Figure 3.1).
FIGURE 3.1 AGE OF RESPONDENTS
3.3 The majority of respondents lived in inner London (59%). Twenty-nine per cent
lived in outer London and the remaining 12% outside of London (see Figure 3.2). All
respondents were screened at the beginning of the questionnaire to ensure that
they had all cycled within London in the last month.
Final survey and model report
8
FIGURE 3.2 HOME LOCATION OF REPONDENTS
Cycle use
3.4 The following section examines the cycling profile of the 2,307 survey
respondents, in terms of how frequently they travel by bike (and for what purpose
they are travelling for), how they view themselves as cyclists, and (prior to the
junction and stated preference exercises) what factors are most important to
them when deciding upon their route.
3.5 The majority of respondents (71%) have been cycling in London for a reasonably
long period of time (i.e. over a year, with 29% having cycled for more than 5
years). However, a significant minority have only started cycling relatively
recently with 13% having only started within the last six months.
Final survey and model report
9
FIGURE 3.3 TIME SPENT CYCLING IN LONDON
3.6 Reflecting the length of time that survey respondents have been cycling in London,
most said that they felt confident cycling on any kind of road in the city: 69% said
that they felt confident enough to be able to cycle on all roads, with a further
30% saying that they felt confident to cycle on quiet roads, but less so on busy
roads.
3.7 There was a significant difference in the level of confidence between male and
female respondents, with 79% of male respondents saying they felt confident
enough to cycle on all roads, compared to only 50% of female respondents. This
may in part be explained by the greater proportions of male respondents who have
been cycling for a long period of time with 75% of male respondents having cycled
for over a year, compared with 67% of females.

Final survey and model report
10
FIGURE 3.4 CONFIDENCE TO CYCLE IN LONDON
3.8 Commuting to and from work is the principal reason for cycling most frequently.
Over a quarter of respondents said that they cycle to/from work at least 5 days a
week, with a further 27% doing so 3 or 4 days a week. Though there are more
people who commute by bike on a frequent basis, overall there were more people
who had cycled to get to a leisure activity in the last month (83%) than had
commuted (75%).
Final survey and model report
11
FIGURE 3.5 FREQUENCY OF CYCLING BY JOURNEY PURPOSE
3.9 Frequency of travel by journey purpose has been converted using assumptions on
trip rates in order to estimate an average number of weekly trips for each journey
purpose. The result is illustrated in Figure 3.6 which shows that on average cyclists
make 2.4 commuter trips per week, and 1.5 to travel to a leisure activity.
FIGURE 3.6 AVERAGE WEEKLY TRIPS BY JOURNEY PURPOSE

Final survey and model report
12
3.10 Use of the Barclays Cycle Superhighways was fairly mixed amongst respondents,
with 20% using them at least 3 days a week, and most people having some
experience of using one. However over 20% said that they had never used one and
10% were not sure.
FIGURE 3.7 USE OF BARCLAYS CYCLE SUPERHIGHWAY
3.11 Though a significant proportion (27%) said that they had never used the Barclays
Cycle Hire scheme, the same proportion use it at least 3 days a week. Half of all
the most frequent cyclists use Cycle Hire bikes for their journeys.

Final survey and model report
13
FIGURE 3.8 USE OF BARCLAYS CYCLE HIRE BICYCLES
Route choice considerations
3.12 Respondents were asked a series of ten attitudinal questions concerning how they
choose their route when cycling. They were asked to rate each on a five point
scale from strongly agree (+2) to strongly disagree (-2). Average scores have been
calculated for each statement for each of the segments. The following chart
compares the differences between those that cycle very frequently (the 3-times a
week cyclists) and those that cycle less so.
3.13 Across all cyclists, the key considerations around route choice centred around
choosing the safest routes, and avoiding traffic (either by cycling in a cycle lane
separate to the traffic, or on roads where traffic volume is lower). In particular
the highest score across all groups for the statement “I would prefer cycling in a
cycle lane even if it meant a longer journey” suggest that most cyclists would
rather take a longer journey in order to maintain at least some distance between
themselves and other traffic on the road.
3.14 It is certainly not the case that cyclists will always choose the most direct route
when making a journey – even the most frequent cyclists, and those that had a
fixed time they had to arrive at their destination had an average score close to
zero for this statement. This would imply that although some cyclists have a fixed
time that they had to arrive, they would start their journey earlier in order to
have an easier journey.
3.15 All groups disagreed with the idea that they would avoid routes where there were
lots of other cyclists – in particular the most frequent cyclists. This suggests that
for many, having other cyclists around them when cycling is a comfort rather than
a hindrance.
Final survey and model report
14
FIGURE 3.9 ROUTE CHOICE CONSIDERATIONS BY CYCLIST TYPE
3.16 Those aged 55 or over, and those aged under 35 were more likely to choose to
cycle on safer routes with less traffic (or in a cycle lane separating them from the
traffic).
3.17 Over 55s were also the most likely to want to cycle on routes with a higher volume
of other cyclists. Those under 35, were the least likely (score of -0.3 compared to -
0.56 for over 55s), though the score for that statement was below zero for each
group, meaning that every group would rather cycle on routes with more cyclists.

Final survey and model report
15
3.18 Those under 35 were much more likely to stick to the routes that they know and
are familiar with (they gave an average score of 0.33, compared to 0.13 for 35-54
year olds, and -0.08 for over 55s).
FIGURE 3.10 ROUTE CHOICE CONSIDERATIONS BY AGE GROUP

Final survey and model report
16
3.19 Female respondents were much more likely to prefer safer routes, away from
other traffic, and away from difficult junctions. The average score for “Safety is
the most important consideration when choosing a cycle route” for females was
0.89, compared to 0.53 for males.
3.20 Though male respondents also agreed on average that they would avoid a route if
they had to negotiate a number of difficult junctions, they were less certain that
they would avoid that particular route (0.66 compared to 1.04 for females).
FIGURE 3.11 ROUTE CHOICE CONSIDERATIONS BY GENDER
Final survey and model report
17
3.21 Those with a lower amount of cycling experience in London (i.e. less than 2 years)
are more safety conscious when cycling, preferring to travel on routes with less
traffic and a cycle lane, whilst avoiding the more difficult junctions. Those with
more experience are seemingly more comfortable on difficult routes, but
nonetheless prefer to cycle more on routes with other cyclists.
FIGURE 3.12 ROUTE CHOICE CONSIDERATIONS BY CYCLING EXPERIENCE
Final survey and model report
18
Effect of Parks and Green Spaces
3.22 Respondents were asked if they would change their route in order to cycle through
a park or green space. There were no images shown for this questions. Around half
of all cyclists would change their route in order to travel through parks and/or
green spaces, with around 15% saying that they would be prepared to use a
significantly longer route. There was very little variation across the different
cyclist types, but those with more time pressure attached to their journey (i.e.
where they had to arrive at a fixed time) showed less willingness to change their
route (50%) compared to those with greater flexibility in their arrival time (56%).
3.23 Those that cited the health benefits or fun and enjoyment as having a big
influence on their decision to cycle were more willing to change their route in
order to cycle in parks and green spaces compared with those that chose to cycle
in order to save time or money.
3.24 The effect of park and green spaces on route choice was also slightly dependent on
the journey purpose, with 50% of commuters indicating that they would be
prepared to change their route, compared to 62% of leisure cyclists.
FIGURE 3.13 EFFECT OF PARKS AND GREEN SPACES ON ROUTE CHOICE

Final survey and model report
19
3.25 There was much greater willingness to change route for parks and green spaces
amongst the over 55s. Though the willingness to use a noticeably longer route was
very similar across all age groups, overall 67% of over 55s said they would change
their route, compared to 58% of 35-54 year olds, and 47% of under 35s.
FIGURE 3.14 EFFECT OF PARKS AND GREEN SPACES ON ROUTE CHOICE – BY AGE

Final survey and model report
20
3.26 Those with very little cycling experience were less willing to change their route in
order to travel through a park or a green space: 38% said that they would change
their route (11% substantially so), compared with 54% of those with 6 months to 2
years’ experience, and 58% of those with more than 2 years’ experience. This may
be due to those with little experience being less willing to deviate from the route
that they know and are familiar with – and that taking a “greener” route away
from this for part of the journey would mean they were unsure of where to go
upon leaving that route.
FIGURE 3.15 EFFECT OF PARKS AND GREEN SPACES ON ROUTE CHOICE – BY
CYCLING EXPERIENCE
Effect of Cycle Superhighway and Cycle Lanes
3.27 Respondents were also asked if they would change their route in order to cycle on
a cycle superhighway or other dedicated cycle lane. Again, there were no images
shown for this questions. On average, 40% of all respondents said they would
change their route in order to use a cycle superhighway, with 8% prepared to use a
noticeably longer route in order to do so. This was less than the equivalent
answers for green spaces, where 54% and 14% who said they would change, or
change to a noticeably longer route.

Final survey and model report
21
3.28 Again there was little variation amongst cyclist types, though cycle superhighways
had slightly less influence on the route choice of the most regular cyclists. There
was no variation between male and female cyclists, and generally the willingness
to consider change routes to use a cycle superhighway increases slightly with age.
FIGURE 3.16 EFFECT OF CYCLE SUPERHIGHWAY ON ROUTE CHOICE

Final survey and model report
22
3.29 Willingness to change route for a dedicated on-road cycle lane was higher than for
cycle superhighways, but lower than for parks and green spaces. 51% said that they
would change their route in order to use it, with 12% willing to use a noticeably
longer route in order to use it. This may be because dedicated cycle lanes are
often on quieter roads than cycle superhighways.
3.30 There was again no significant variation amongst the different cyclist types or
between the different experience levels, and unlike parks and green spaces, there
was little difference between age groups. On the other hand, female cyclists were
slightly more willing to change their route in order to use a dedicated on-road
cycle lane (56% of females said they would change their route, compared to 48% of
males).
FIGURE 3.17 EFFECT OF DEDICATED ON-ROAD CYCLE LANE ON ROUTE CHOICE
Final survey and model report
23
Journey profile
3.31 Respondents were asked to think about a specific trip that they had recently
taken, that lasted at least 10 minutes. The stated preference questions were asked
in relation to this journey. This helps ensure that the results represent real choices
as far as possible.
3.32 The mean length of these trips was 28 minutes and the median was 25 minutes.
Forty-seven per cent of respondents reported trips of 10-20 minutes (see Figure
3.18). The trip length varied very little with age, gender, experience or frequency
of cycling.
FIGURE 3.18 JOURNEY TIME FOR MOST RECENT TRIP
Final survey and model report
24
3.33 Respondents were asked how they found out about the route they chose on their
most recent journey. The most common response was that they knew the area
(41% of respondents). This increased for those who had been cycling in London for
the longest. This was followed by using a map, and then ‘trial and error. The
newest cyclists however, were much more likely to use a cycle journey planner
(38% compared to 24% for those cycling between 6 months to 2 years and 17% for
those cycling for more than two years.
3.34 Women were slightly less likely to use a map and more likely to use a journey
planner (26% and 24% for women compared to 33% and 20% for men respectively).
Older people were less likely to use a map (11% for over 55s compared to 30%
average) or a journey planner (9% for over 55s compared to 21% average), and
more likely to rely on knowing the local area (78% for over 55s compared to 58%
average).
FIGURE 3.19 HOW DID YOU FIND OUT ABOUT THIS ROUTE?

Final survey and model report
25
3.35 The main reason for choosing the route taken was that it was the most direct route
available to them (42% of respondents cited this as one of their reasons). This was
followed by the volume of traffic (40%), familiarity with the route (38%) and that
the route was the most pleasant (36%).
3.36 There was some difference depending on length of time respondents had been
cycling in London (see Figure 3.20). The most notable difference is between those
cycling for less than six month in London and other cyclists. The newest cyclists
were less likely to choose a route due to familiarity, pleasantness, or speed of the
route. They were however, more likely to choose a route based on the speed of
the traffic and the signage.
3.37 Those with less confidence cycling on busy roads were slightly more likely to
choose a route based on the speed or volume of traffic, otherwise there was very
little difference in the route choice considerations with those of more confidence.
FIGURE 3.20 REASONS FOR CHOOSING ROUTE

Final survey and model report
27
4 Junction safety
Introduction
4.1 The majority of cyclist causalities in London occur at junctions and it has also been
found that cyclists perceptions of the risk associated varies across different types
of junction1. There are obviously implications for route choice and so the
questionnaire sought to explore this further. Respondents were first asked a simple
safety rating and were subsequently taken through a ‘detour experiment’.
Safety rating
4.2 Respondents were first asked to simply rate eight types of junction situation for
how safe they would feel cycling through them. The scale used was five points
from very unsafe to very safe. The junction situations were all shown pictorially
(see question B7 in appendix A). The results are shown as percentages of responses
in Figure 4.1. The responses have also been presented as a relative rating, with
zero being neutral, very safe being ‘2’ and very unsafe ‘-2’. The average ratings
for each junction situation are shown in Figure 4.2.
4.3 Turning left at a signalised junction was perceived to be the safest, with 84%
saying they felt safe or very safe in this situation, and an average rating of 1.2.
Travelling straight on across a minor junction was also perceived to be fairly safe.
4.4 The least safe junctions were perceived to be a right turn at a two lane round-
about and a right turn from a minor road onto a major one with, respectively, 66%
and 70% of respondents feeling unsafe or very unsafe and average ratings of -0.8
and -0.9.
1 Parkin, J., Wardman, M. and Page, M. 2007 ‘Models of perceived cycling risk and route acceptability’. Accident
Analysis and Prevention 39 (364-371)
Final survey and model report
28
FIGURE 4.1 FEELINGS OF SAFETY AT JUNCTION SITUATIONS
FIGURE 4.2 AVERAGE SAFETY RATINGS FOR EACH JUNCTION SITUATION

Final survey and model report
29
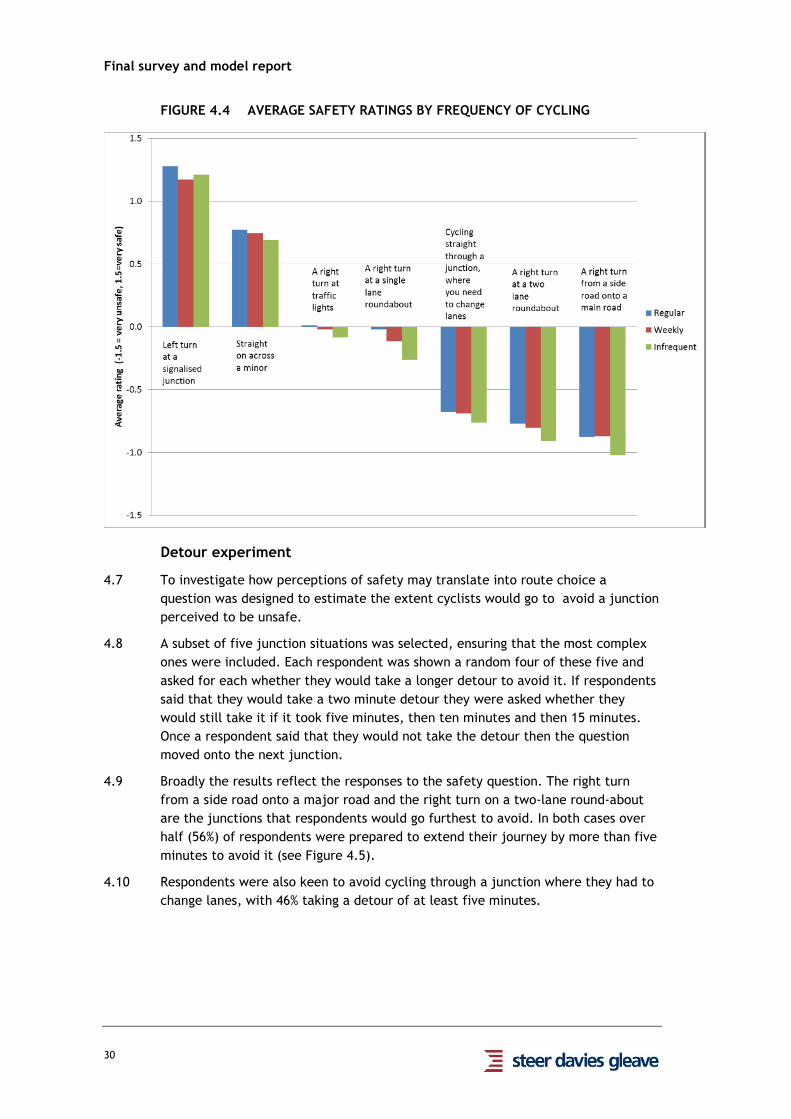
4.5 In general female respondents were slightly more likely to rate each junction as
less safe than male respondents (see Figure 4.3). As might be expected, those who
cycled most regularly felt safer at most junctions than less frequent cyclists (see
Figure 4.4). Older respondents also tended to feel less safe than younger ones.
However, these differences were very slight.
4.6 Those with less cycling experience also tended to feel less safe overall than those
with more experience, though again these differences were very small.
FIGURE 4.3 AVERAGE SAFETY RATINGS BY GENDER
Final survey and model report
30
FIGURE 4.4 AVERAGE SAFETY RATINGS BY FREQUENCY OF CYCLING
Detour experiment
4.7 To investigate how perceptions of safety may translate into route choice a
question was designed to estimate the extent cyclists would go to avoid a junction
perceived to be unsafe.
4.8 A subset of five junction situations was selected, ensuring that the most complex
ones were included. Each respondent was shown a random four of these five and
asked for each whether they would take a longer detour to avoid it. If respondents
said that they would take a two minute detour they were asked whether they
would still take it if it took five minutes, then ten minutes and then 15 minutes.
Once a respondent said that they would not take the detour then the question
moved onto the next junction.
4.9 Broadly the results reflect the responses to the safety question. The right turn
from a side road onto a major road and the right turn on a two-lane round-about
are the junctions that respondents would go furthest to avoid. In both cases over
half (56%) of respondents were prepared to extend their journey by more than five
minutes to avoid it (see Figure 4.5).
4.10 Respondents were also keen to avoid cycling through a junction where they had to
change lanes, with 46% taking a detour of at least five minutes.

Final survey and model report
31
FIGURE 4.5 MAXIMUM DETOUR TAKEN TO AVOID JUNCTIONS

Final survey and model report
32
4.11 These findings have been transformed into an average detour length for each
junction (see Figure 4.6). This method provides a relative rating for each junction,
but does not necessarily provide an accurate result for each junction specifically.
This is because the question was framed in terms of time intervals and to calculate
an average we have had to make assumptions about the values these intervals
represent.
4.12 The mid-point was taken for the first four intervals2. However, there is no mid-
point for the last category (>15 mins) so answers in this category were allocated as
20 minutes. The results range from an average of 4.6 minutes delay to avoid a
right turn at traffic lights, to a 7.5 minutes delay to avoid a right turn at a two
lane roundabout, or a right turn from a side road onto a main road.
FIGURE 4.6 MEAN MINUTES OF DETOUR FOR EACH JUNCTION
2 In reality many of those selecting less than 2 minutes of detour may actually have effectively been saying that
they would not accept any time delay

Final survey and model report
33
4.13 This was a long question and as Figure 4.7 shows, there was a gradual increase in
the proportion of respondents taking the two minute detour as they moved through
the questions3. To minimise the bias as a result of this trend, the order in which
the junctions were shown was randomised. The overall effect is therefore limited.
However, it should be recognised that the real detour values may in fact be
slightly higher than the findings show here. This is because as respondents have
worked through the questions they may have chosen to reject detours that they
would in reality take, in order to reduce the number of questions they were asked.
FIGURE 4.7 RESPONSES BY ORDER OF QUESTIONNING
3 This effect was also seen in the pilot and, as a result the number of junctions shown was decreased from five to
four. The effect is now less pronounced.

Final survey and model report
35
5 Model report
Introduction
5.1 The following chapter details the development and analysis of the Stated
Preference (SP) section of the online survey. It presents the methodology behind
the SP exercise, the parameters from the models calibrated from the SP results,
and an interpretation of the impact of each parameter on cycle route choice. The
final section of this chapter outlines the results of tests carried out on different
segmentations, in order to assess whether the model parameters vary between
segments (i.e. are different groups of people willing to travel different amounts of
time on a certain type of cycle route).
Methodology
5.2 The online survey included a single Stated Preference (SP) exercise, together with
a separate junction-based exercise, which were designed to identify the impact on
cycle route choice of a number of different key attributes.
5.3 The key attributes were decided upon following the completion of the
accompanied cycle rides conducted in April 2012. In addition to the nature of
different junctions (which was assigned to a separate exercise and is discussed
earlier in this report), the three key attributes were deemed to be:
I journey time,
I provision of cycle lane4, and
I the nature of the road that the person would be travelling on: i.e. a major road
(30mph , medium traffic), high street (20mph, heavy traffic) or residential
street (20mph, low traffic). This attribute took into account the volume of
traffic as well as the speed.
5.4 For the questions leading into the SP exercise, respondents were asked to think of
the most recent journey that involved at least a 10 minute journey by bicycle, and
were then asked about the specific details of that journey (i.e. the time of day,
where the journey started and ended, and why they had chosen that route)5. For
the SP exercise itself, respondents were then asked to imagine that they were
making a new journey similar to that journey, and that for a 10 minute section of
that journey they would have a choice of two cycle routes with certain varying
characteristics, these being the key attributes of journey time, provision of cycle
lane, and nature of the road.
5.5 The cycle route characteristics of road type and the nature of the cycle lane were
presented as images to respondents, with a description of each of the images
shown to them at the beginning of the exercise. These are included in the
questionnaire in Appendix A.
4 3 levels of cycling lane were shown: no lane; a narrow advisory lane (i.e. a poor quality cycle lane); and a wide
mandatory cycle lane (i.e. a good quality cycle lane)
5 The findings from these questions are presented in chapter 3.
Final survey and model report
36
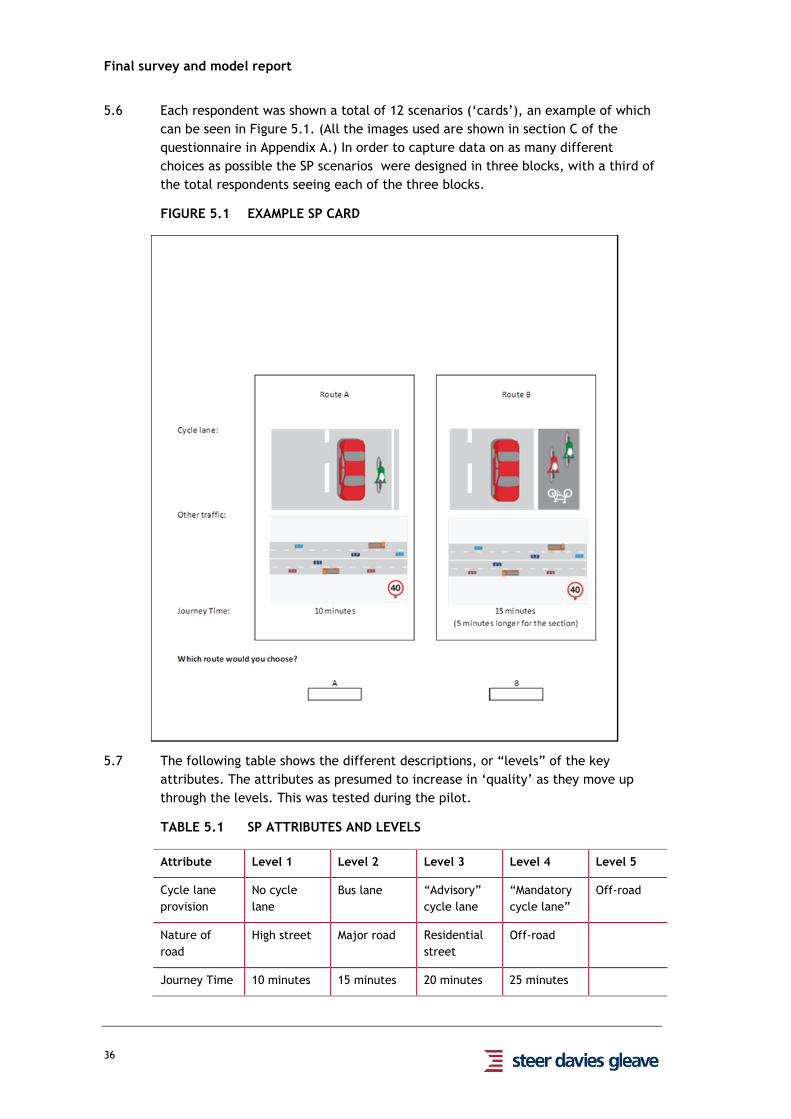
5.6 Each respondent was shown a total of 12 scenarios (‘cards’), an example of which
can be seen in Figure 5.1. (All the images used are shown in section C of the
questionnaire in Appendix A.) In order to capture data on as many different
choices as possible the SP scenarios were designed in three blocks, with a third of
the total respondents seeing each of the three blocks.
FIGURE 5.1 EXAMPLE SP CARD
5.7 The following table shows the different descriptions, or “levels” of the key
attributes. The attributes as presumed to increase in ‘quality’ as they move up
through the levels. This was tested during the pilot.
TABLE 5.1 SP ATTRIBUTES AND LEVELS
Attribute Level 1 Level 2 Level 3 Level 4 Level 5
Cycle lane
provision
No cycle
lane
Bus lane “Advisory”
cycle lane
“Mandatory
cycle lane”
Off-road
Nature of
road
High street Major road Residential
street
Off-road
Journey Time 10 minutes 15 minutes 20 minutes 25 minutes

Final survey and model report
37
5.8 Respondents were consistently presented with all attributes at level 1 as their
Route A (i.e. a 10 minute journey on a high street with no cycle lane) to ensure
that comparisons can be made across the different cards, with the levels on Route
B varying from card to card. Certain attribute levels were restricted on what other
attribute levels were shown; for example, the two off-road attribute levels could
only be shown together.
Stated preference theory
5.9 Stated Preference analysis is based on Random Utility Theory. We assume that the
‘attractiveness’ or utility of a choice is related to the attribute levels or values.
So, for example, if the utility of choice A is higher than that of B, it is more likely
a respondent will choose A. Conversely, if choice A is chosen we infer that its
utility is likely to be higher than that of B. It is important to note that utility is
only a modelling device; it does not have a physical existence, therefore it is not
possible to know precise relationships between attributes.
5.10 We assume a relationship of the form:
��������� = �� ���,��
� ∗ �� where ai are parameters to be estimated, xi,A are the attribute levels and tA is the
benefit associated with A (i.e. the parameter weight relative to time).
5.11 The SP exercises have been analysed using Multinomial Logistic Regression Models
using the Stata software package.
Stated preference analysis
Overview
5.12 The data from the SP exercise was collated together with the results from the rest
of the survey, and was then cleaned by Research Now, with final cleaning
completed by SDG. In total, all 2,307 respondents that completed the rest of the
survey also completed the SP exercise, and were taken forward for analysis.
Trading analysis
5.13 Trading analysis, or analysis of the number of respondents who varied the route
that they chose across the 12 cards that they were shown, looks at the proportions
of respondents who would always choose either the fastest route, or the highest
“quality” route. It also provides a good indication of the quality of the SP exercise,
in that if the different attribute levels are defined in such a way that respondents
are receptive to them, then the level of trading will be high, and the model
parameter estimates will be more robust.
5.14 The following table shows the trading analysis results for the SP exercise, both
overall and then segmented by cyclist type. Overall there is a high level of trading,
which indicates that people are prepared to consider a change of route under the
right conditions. The more frequent commuter cyclists were more likely to always
opt for the fastest route, regardless of conditions. Those travelling for a work-
Final survey and model report
38
based trip (either commuting to/from work or on a business trip) were again more
likely to choose the fastest route in every scenario. It is worth noting however,
that a person’s habits will in reality reduce the likelihood of choosing a different
route.
TABLE 5.2 TRADING ANALYSIS
Overall (100%) At least 3
times a week
cyclists (57%)
1-2 times a
week cyclists
(25%)
Other cyclists
(18%)
Traded 87% 85% 88% 89%
Always chose
fastest route 10% 12% 8% 6%
Always chose
highest quality
route
3% 3% 4% 5%
Choice proportions
5.15 The choice proportions for each attribute level allows us to sense check the
proportions of respondents choosing the alternative route when each of the levels
are shown.
5.16 As demonstrated in the following tables, the results of the choice proportion
analysis were intuitively sensible, with greater proportions of respondents opting
for the alternative route (route B) as the quality of each attribute increased in
route B. Route A always showed a 10 minute journey on a residential road, with no
cycle lane.
5.17 The following three tables highlight how choices changed across each of the three
attributes. Taking the choices on all cards we can see, for each attribute level,
what proportion chose route A and route B on all cards where that level was
shown. The one attribute where the choice proportions were not as expected were
for the type of road. In the pilot survey, the results of the SP exercise were such
that it appeared that cycling on a high street was in fact perceived to be worse
than cycling on a major road. In the final survey however, the reverse was true,
because more people selected Route A (which always had high street) when major
road appeared in Route B than when high street was on Route B, as Table 5.4
demonstrates. The actual differences were very small however.
TABLE 5.3 CHOICE PROPORTIONS – CYCLE LANE PROVISION IN ROUTE B
No cycle
lane in B
Bus lane in
B
Advisory
cycle lane
in B
Mandatory
cycle lane
in B
Off-road in
B
Chose Route A 76% 64% 62% 53% 30%
Chose Route B 24% 36% 38% 47% 70%
NB. Route A always showed no cycle lane.
Final survey and model report
39
TABLE 5.4 CHOICE PROPORTIONS – TYPE OF ROAD IN ROUTE B
High Street in
B
Major Road in
B
Residential
Street in B
Off-road in B
Chose Route A 60% 71% 56% 30%
Chose Route B 40% 29% 44% 70%
NB. Route A always showed a residential road.
TABLE 5.5 CHOICE PROPORTIONS – JOURNEY TIME IN ROUTE B
15 minutes in B 20 minutes in B 25 minutes in B
Chose Route A 38% 64% 78%
Chose Route B 62% 36% 22%
NB. Route A always showed a 10 minute journey.
Model parameter results
5.18 The next section of this chapter outlines the final models together with the
associated parameter values. The analysis has been carried out taking account of
the fact that the value of the parameters will interact with journey length. The
parameter values are therefore presented on a per minute of journey basis.
Parameters reported – units and meanings
5.19 The following table demonstrates the following parameters and the meaning
associated with them:
I Coefficients: these are used to calculate the relative importance of each
attribute level. The units of these coefficients are ‘utils’ and do not relate to
any physical units. – these are then factored using the journey time parameter
to calculate a journey time increase.
I Parameter weight relative to time: this is, essentially, the benefit that
respondents placed on each particular “improvement” in relation to the base
level. This is calculated on a per minute basis. For example, a parameter
weight of 1.4 for a bus lane (compared to the base level of 1 for no cycle lane)
means that cyclists perceive the benefits of using a bus lane to be worth an
additional 0.4 minutes for every minute of cycling without any cycle lane.
5.20 The level of significance of each parameter is shown in the z-statistic column. A z-
statistic of 1.96 or greater shows significance at a 95% level – i.e. we can be 95%
certain that the value of the parameter is not zero.
5.21 Ninety-five per cent confidence intervals have also been calculated for both the
coefficients and for the additional journey time. This means that we can be 95%
certain that the coefficients (and consequently the additional journey time) lie
within that particular interval.
Final survey and model report
40
TABLE 5.6 MODEL PARAMETERS – ALL RESPONDENTS
Attribute Base Level Level (as a
difference on the
base level)
Z-statistic Parameter co-
efficient estimate
Parameter weight
relative to time
95% Confidence Interval
Parameter Parameter
weight relative to
time
Cycle Lane No cycle lane No change n/a n/a 1 n/a n/a
Bus lane 25.85 0.0594 1.40 (0.0549, 0.0639) (1.34, 1.48)
Advisory cycle lane 28.04 0.0644 1.45 (0.0599, 0.0689) (1.38, 1.54)
Mandatory cycle
lane 35.14 0.0832 1.67 (0.0786, 0.0879) (1.57, 1.81)
Off-road 43.07 0.141 3.17 (0.135, 0.148) (2.65, 4.06)
Type of road High Street No change n/a n/a 1 n/a n/a
Major road -2.43 -0.00337 0.98 (-0.00609, -0.000654) (0.97, 1.00)
Residential street 25.99 0.0321 1.18 (0.0297, 0.0345) (1.16, 1.21)
Journey Time -39.03 -0.207 n/a (-0.217, -0.196) n/a

Final survey and model report
41
FIGURE 5.2 STATED PREFERENCE PARAMETER WEIGHTS – ALL RESPONDENTS
5.22 The model results show that the extent of cycle lane provision was of far greater
significance than the type of road being used. All model parameters are highly
significant. Though some parameter weights (particularly the off-road parameter)
are quite high, the response to earlier questions in the survey around route choice
preferences, and the lengths respondents would go to remain on an off-road route,
the likelihood is that there is strong preference for off-road routes across all
respondents.
5.23 The negative parameter value for “upgrading” from a high street to a major road
demonstrates that the results of the pilot surveys have been reversed, and that
the major road is perceived to be worse than a high street for cyclists. It is
important to note however that the difference is very small, and so in reality
people are relatively indifferent between the two.
Segmentations
5.24 This section summarises the analysis undertaken of the different parameter values
between different segments of respondents. All segmentations have been tested
on the all-respondents model. The segmentations tested and detailed in this
section are:
I Gender;
I Cyclist type;
I Journey purpose; and
I Level of cycling experience

Final survey and model report
42
Gender
5.25 The split between male and female respondents (as described in the demographics
section) was 65% male, 35% female.
5.26 Reflecting the results of the attitudinal questions, where female respondents were
more likely to want to avoid fast traffic, and cycle in a designated cycle lane,
females placed much greater weight on being able to use certain facilities, in
particular an off-road route. It is important to note however, that a higher
proportion of females always selected the off-road option, and also were prepared
to accept lengthy diversions in the detour experiment on several journeys, which
suggests that for many females, they would always choose to cycle off-road,
regardless of the available alternatives. Although some of the differences in the
table are negligible, due to the large sample size, all are statistically significant.
TABLE 5.7 MODEL PARAMETERS – GENDER SEGMENTATION
Attribute Base
Level
Level (as a
difference on
the base
level)
Parameter weight relative to
time
Parameter
weight relative
to time (all
respondents) Male Female
Cycle
Lane
No cycle
lane
No change 1 1 1
Bus lane 1.36 1.51 1.40
Advisory cycle
lane 1.40 1.58 1.45
Mandatory
cycle lane 1.59 1.90 1.67
Off-road 2.73 5.19 3.17
Type of
road
High
Street
No change 1 1 1
Major road 0.99 0.98 0.98
Residential
street 1.17 1.23 1.18
Final survey and model report
43
Cyclist type
5.27 The second segmentation looks at the three cyclist types, which were at least
three times a week cyclists (57%), once-twice a week cyclists (25%) and others
(18%).
5.28 The table shows that as cycling frequency reduces, so does the respondent’s time
sensitivity, and consequently the benefits for a higher ‘quality’ journey increases.
The difference is, as with other segmentations, most noticeable for the off-road
option, where the most regular cyclists had a weight of 2.7, compared to the least
regular cyclists whose weight was 7.2. Again many of the least regular cyclists
were cycling for leisure, with no time pressure to the journey, and so would
always select the off-road option. Again, although some differences are small, all
are statistically significant due to the sample size.
TABLE 5.8 MODEL PARAMETERS – CYCLIST TYPE SEGMENTATION
Attribute Base
Level
Level (as a
difference
on the
base level)
Parameter weight relative to time Parameter
weight
relative to
time (all
respondents)
At least 3
times a
week
cyclists
1-2 times a
week
cyclists
Other
cyclists
Cycle
Lane
No cycle
lane
No change 1 1 1 1
Bus lane 1.35 1.45 1.56 1.40
Advisory
cycle lane 1.39 1.50 1.64 1.45
Mandatory
cycle lane 1.58 1.76 2.02 1.67
Off-road 2.66 3.82 7.25 3.17
Type of
road
High
Street
No change 1 1 1 1
Major road 0.99 0.98 0.98 0.98
Residential
street 1.17 1.20 1.24 1.18

Final survey and model report
44
Journey purpose
5.29 Journey purpose was collapsed into two categories from four, work-based and non-
work-based. Work-based trips comprise of trips that were made either for
commuting or business reasons, non-work based trips comprise all other trips.
5.30 The following table shows that respondents making a work-based journey were
slightly more sensitive to time, with the benefits of each improvement rated lower
than for non-work based trips. Again the difference is more noticeable for the
larger parameter values, for example off-road, which is worth 2.8 minutes for
every minute without any form of cycle lane for work based journeys, and 4.2 for
non-work based journeys. These differences were also near identical to what was
observed when comparing the split between leisure and non-leisure trips. Again,
all differences are statistically significant.
TABLE 5.9 MODEL PARAMETERS – JOURNEY PURPOSE SEGMENTATION
Attribute Base
Level
Level (as a
difference on
the base
level)
Parameter weight relative to
time
Parameter
weight relative
to time (all
respondents) Work-based
journey
Non-work
based journey
Cycle
Lane
No cycle
lane
No change 1 1 1
Bus lane 1.37 1.47 1.40
Advisory cycle
lane 1.41 1.53 1.45
Mandatory
cycle lane 1.61 1.81 1.67
Off-road 2.81 4.22 3.17
Type of
road
High
Street
No change 1 1 1
Major road 0.99 0.98 0.98
Residential
street 1.17 1.21 1.18
Final survey and model report
45
Level of Cycling Experience
5.31 Finally the model was then segmented based on the level of cycling experience
respondents had for the journey. The proportions in each category were as
follows:
I Less than 6 months experience (10%)
I Between 6 months and 2 years’ experience (34%)
I More than 2 years’ experience (56%)
5.32 The following table shows that there is a clear distinction between those with
little cycling experience, and those that have more than 6 months of experience.
In particular, the attraction of an off-road facility was much greater among those
with little cycling experience. As with the three previous segmentations, the
differences are statistically significant.
TABLE 5.10 MODEL PARAMETERS – CYCLING EXPERIENCE SEGMENTATION
Attribute Base
Level
Level (as
a
difference
on the
base
level)
Parameter weight relative to time Parameter
weight
relative to
time(all
respondents)
Less than
6 months
6 months –
2 years
More than
2 years
Cycle
Lane
No
cycle
lane
No change 1 1 1 1
Bus lane 1.50 1.40 1.39 1.40
Advisory
cycle lane 1.57 1.45 1.44 1.45
Mandatory
cycle lane 1.88 1.67 1.65 1.67
Off-road 4.94 3.18 3.01 3.17
Type of
road
High
Street
No change 1 1 1 1
Major road 0.98 0.98 0.98 0.98
Residential
street 1.22 1.18 1.18 1.18

Final survey and model report
47
6 Conclusion
6.1 This study has comprised a short qualitative stage, which directly fed into the
design of an online survey including a stated preference section. The response rate
was very high and the analysis has generated significant conclusions relating to the
reasons cyclists choose specific routes. In particular:
I Attitudes around route choice
I Relative perceived safety of different junction types and how this may
influence route choice.
I The relative value of different types of cycle lane, bus lane and off-road routes
I The importance of the type of street (including traffic levels and speeds)
Attitudes
6.2 Safety appeared to be an important overall factor for all respondents, but
particularly for women and newer cyclists. Although the most regular cyclists and
those who were under time-pressure were more likely to choose shorter journey
times, very few respondents claimed to ‘always take the most direct route’.
Directness was a strong influence on route choice but others included the
attraction of cycle lanes and off-road routes, volume of traffic and familiarity with
the route.
Junction safety
6.3 There was a strong consensus among respondents in terms of perceived junction
safety with left turns the safest and right turns, particularly when involving
crossing several lanes of traffic the most unsafe. On average respondents were
prepared to add 7.5 minutes to their most recent journey to avoid a right turn at a
two lane roundabout or a right turn from a side road onto a main road. Again,
women, newer cyclists and older cyclists were prepared to detour most.
Final survey and model report
48
Stated Preference
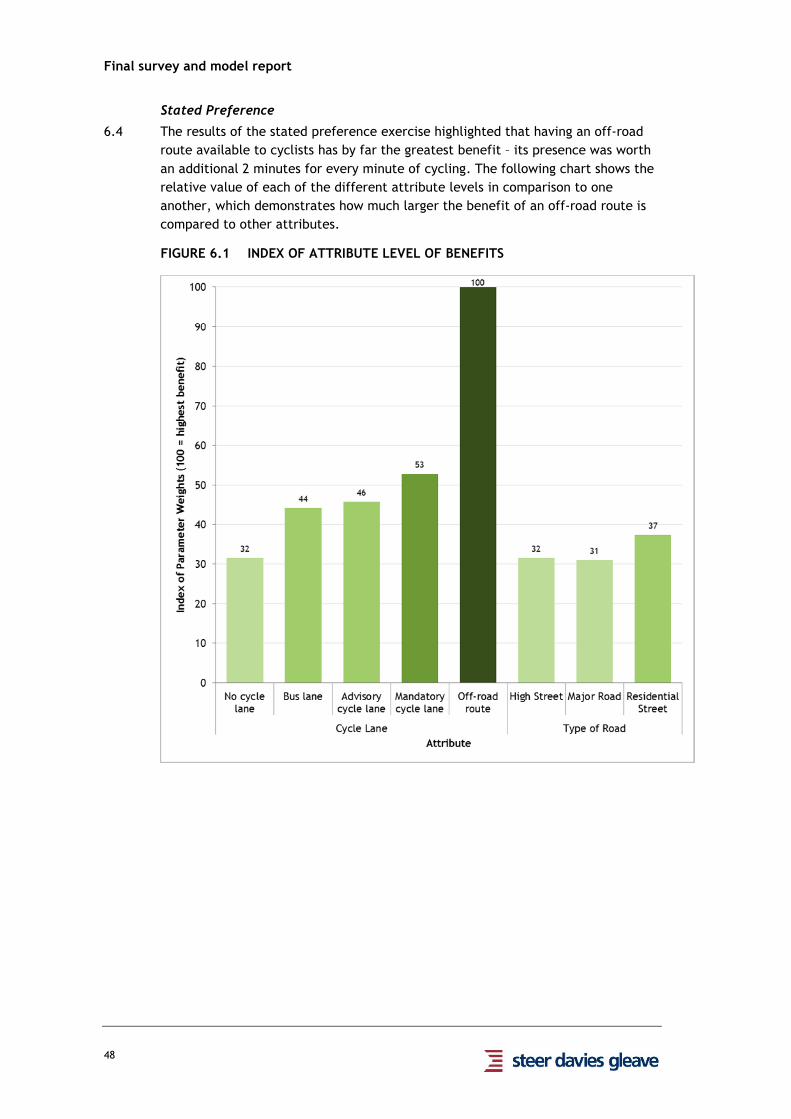
6.4 The results of the stated preference exercise highlighted that having an off-road
route available to cyclists has by far the greatest benefit – its presence was worth
an additional 2 minutes for every minute of cycling. The following chart shows the
relative value of each of the different attribute levels in comparison to one
another, which demonstrates how much larger the benefit of an off-road route is
compared to other attributes.
FIGURE 6.1 INDEX OF ATTRIBUTE LEVEL OF BENEFITS
Final survey and model report
49
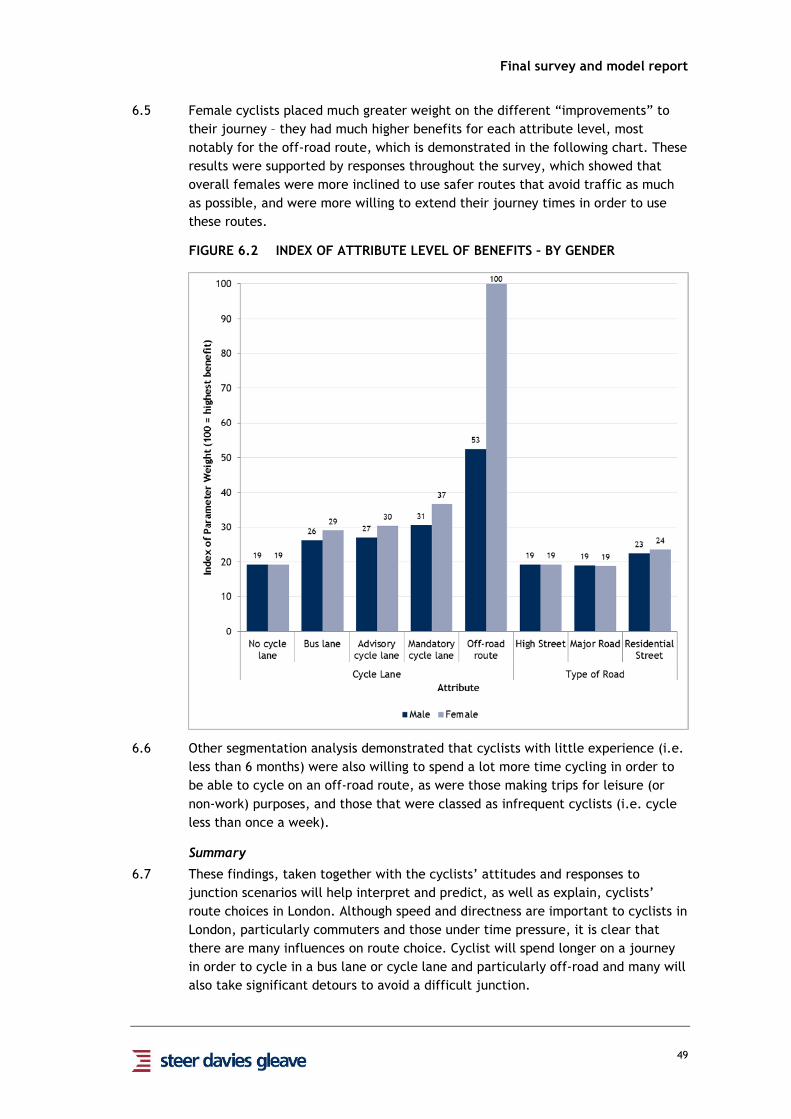
6.5 Female cyclists placed much greater weight on the different “improvements” to
their journey – they had much higher benefits for each attribute level, most
notably for the off-road route, which is demonstrated in the following chart. These
results were supported by responses throughout the survey, which showed that
overall females were more inclined to use safer routes that avoid traffic as much
as possible, and were more willing to extend their journey times in order to use
these routes.
FIGURE 6.2 INDEX OF ATTRIBUTE LEVEL OF BENEFITS – BY GENDER
6.6 Other segmentation analysis demonstrated that cyclists with little experience (i.e.
less than 6 months) were also willing to spend a lot more time cycling in order to
be able to cycle on an off-road route, as were those making trips for leisure (or
non-work) purposes, and those that were classed as infrequent cyclists (i.e. cycle
less than once a week).
Summary
6.7 These findings, taken together with the cyclists’ attitudes and responses to
junction scenarios will help interpret and predict, as well as explain, cyclists’
route choices in London. Although speed and directness are important to cyclists in
London, particularly commuters and those under time pressure, it is clear that
there are many influences on route choice. Cyclist will spend longer on a journey
in order to cycle in a bus lane or cycle lane and particularly off-road and many will
also take significant detours to avoid a difficult junction.

Final survey and model report
50
6.8 These findings imply that there are many route treatments or designs that could
have a significant effect on both the number of cyclists using a specific route, and
potentially the overall levels of cycling in London.

Final survey and model report
Appendix A
APPENDIX
A
QUESTIONNAIRE

Final survey and model report
Appendix A
A1 QUESTIONNAIRE
SURVEY NAME: Cycle Route Choice 2012
SURVEY LENGTH (MINS): 15
Section A: Introduction/Screening
ASK ALL
TERMINATE IF OPTION 7 NOT SELECTED
Region. Within which of the following regions have you regularly travelled in the last
month?
Please select all that apply
1. North East
2. North West
3. Yorkshire and Humberside
4. East Midlands
5. West Midlands
6. East of England
7. Greater London
8. South East
9. South West
10. Wales
11. Scotland
12. Northern Ireland
13. Channel Islands/Isle of Man
99. None of the above

Final survey and model report
Appendix A
ASK ALL
TERMINATE IF ROW 5 OR 6 =!1,2,3,4
A1. How often have you used the following modes of transport in London in the last
month?
Single code per row
1 2 3 4 5 6 99
5 or more
days a week
3 or 4
days a
week
Once a
week
Once or twice
in the last 4
weeks/ month
Not at all
in the
last
month
Not in
the last
12
months
Never
1. Car
2. Bus
3.Underground
/DLR
4. Train/
overground
5. Bicycle
(your
own/borrowed
bicycle)
6. Barclays
Cycle Hire
scheme bicycle
DUMMY TO ALLOCATE RESPONDENTS FROM QA1
SET QUOTAS HERE – CROSS WITH DSAMPLE
DSEGMENT.
1. SEGMENT1(Commuter Cyclists) = IF ROW 5 OR 6 = COLUMN 1 OR 2
2. SEGMENT2(At least once a week cyclists) = IF ROW 5 OR 6=COLUMN 3 AND NOT ALLOCATED IN SEGMENT1
3. SEGMENT3(Other cyclists)=IF ROW 5 OR 6=COLUMN 4 AND NOT ALLOCATED - IN SEGMENT1 AND SEGMENT2
Final survey and model report
Appendix A
ASK ALL
TERMINATE IF OPTION 2 SELECTED
A2. Of the journeys by bicycle that you have made in London in the last month, can you
think of one that was longer than 10 minutes?
(1) Yes
(2) No
ASK ALL
A3. What was the reason for making that journey?
(1) Commuting to/from work
(2) Business travel (travel as part of your job during working hours)
(3) Travel to/from school/college/university
(4) To get to a leisure activity (i.e. meeting friends, going shopping etc.)
(5) For leisure/exercise with no appointment at your destination (i.e. cycling around a
park)
98. Other (please specify)
ASK IF QA3=5
TERMINATE IF OPTION 5 SELECTED
A4. Have you made any other journey by bicycle for a different reason?
(1) Yes - Commuting to/from work
(2) Yes - Business travel (travel as part of your job during working hours)
(3) Yes - Travel to/from school/college/university
(4) Yes - To get to a leisure activity (i.e. meeting friends, going shopping etc.)
(5) No - only for leisure/exercise with no appointment at your destination (i.e. cycling
around a park)
Section B: Cycle Use

Final survey and model report
Appendix A
ASK ALL
B1. How often do you travel by bicycle for the following reasons?
Single code per row
1 2 3 4 5 99
5 or more
days a week
3 or 4 days a
week Once a week
Once or
twice in the
last 4
weeks/
month
Not at all in
the last
month
Never
1. Commuting to/from work
2. Travelling for business (during
working hours)
3. Commuting to
school/college/university
4. To get to a leisure activity (i.e.
meeting friends, going shopping
etc.)
5. For leisure/exercise with no
appointment at your destination
(i.e. cycling around a park)
ASK ALL
B2. How often do you cycle on a Barclays cycle superhighway?
1. 5 or more days a week
2. 3 or 4 days a week
3. Once a week
4. Once or twice in the last 4 weeks/ month
5. Not at all in the last month
99. Never
97. Don’t know
ASK IF A1.5 Bicycle = 1,2,3 OR A1.6 Barclays Bike = 1,2,3
B3. How long have you been cycling regularly within London?
(1) Less than 1 month
(2) Between 1 and 6 months
(3) Between 6 months and a year
(4) Between 1 and 2 years
(5) Between 3 and 5 years
(6) More than 5 years.

Final survey and model report
Appendix A
ASK ALL
B4. How would you describe yourself as a cyclist?
(1) Confident to be able to cycle on all roads.
(2) Confident to cycle on quiet roads, but less confident on busy roads.
(3) Not confident cycling on any road.
ASK ALL
RANDOMIZE ROWS
B5
Thinking about your choice of cycle route, please indicate how strongly you agree or
disagree with each of the following statements
Single code per row
1 2 3 4 5
Strongly
agree Agree
Neither
agree nor
disagree
Disagree Strongly
disagree
1 I try to avoid
cycling on roads
where there is
fast-moving
traffic.
2 Safety is the most
important
consideration
when I choose my
cycle route.
3 I would prefer
cycling in a cycle
lane which is
separate from the
traffic even if it
meant a longer
journey.
4 The quality of
signage and cycle
markings has no
influence on which
route I take.
5 I try to avoid using
routes where there
are lots of other
cyclists.
6 I choose to travel
on roads with less
traffic
7 If I had to
Final survey and model report
Appendix A
1 2 3 4 5
Strongly
agree Agree
Neither
agree nor
disagree
Disagree Strongly
disagree
negotiate a
number of difficult
junctions I would
try to find another
route.
8 All that matters
when I cycle is
finding the most
direct route.
9 I always stick to
the routes that I
know.
10 Sometimes I
choose longer or
more challenging
routes to improve
my fitness.
ASK ALL
B6. How do the following factors influence your choice of route:
Single code per row
1 2
3
4
Has no influence on my choice of route
I would prefer to use this, but would not change my route to do so
I would change my route to use this
I would be prepared to use a noticeably longer route to use this
1 Travel through parks or green spaces
2 Cycle Superhighway
3 Dedicated on road cycle lane
START LOOP FOR - JUNCTION IMAGES (7 IMAGES) - STATEMENTS
PLEASE FIT TO ONE SCREEN-NO SCROLL DOWN
PAGE LOOKS ORDER = QUESTION - IMAGE – STATEMENT – SLIDER

Final survey and model report
Appendix A
ASK ALL
SLIDER 1-5
1. Very Unsafe
5. Very Safe
B7. For the following junction type please indicate how safe you would feel in each situation. SHOW JUNTION IMAGES AS STATED BELOW Please click to enlarge RANDOMIZE BELOW IN THE LOOP
1. A right turn at a two lane roundabout where you need to cross lanes of traffic.
2. A right turn at a single lane roundabout
3. 3. A right turn at traffic lights where you need to cross lanes of traffic.
4. A right turn from a side road onto a main road
5. Cycling straight through a junction where you need to change lanes to avoid
left turning traffic
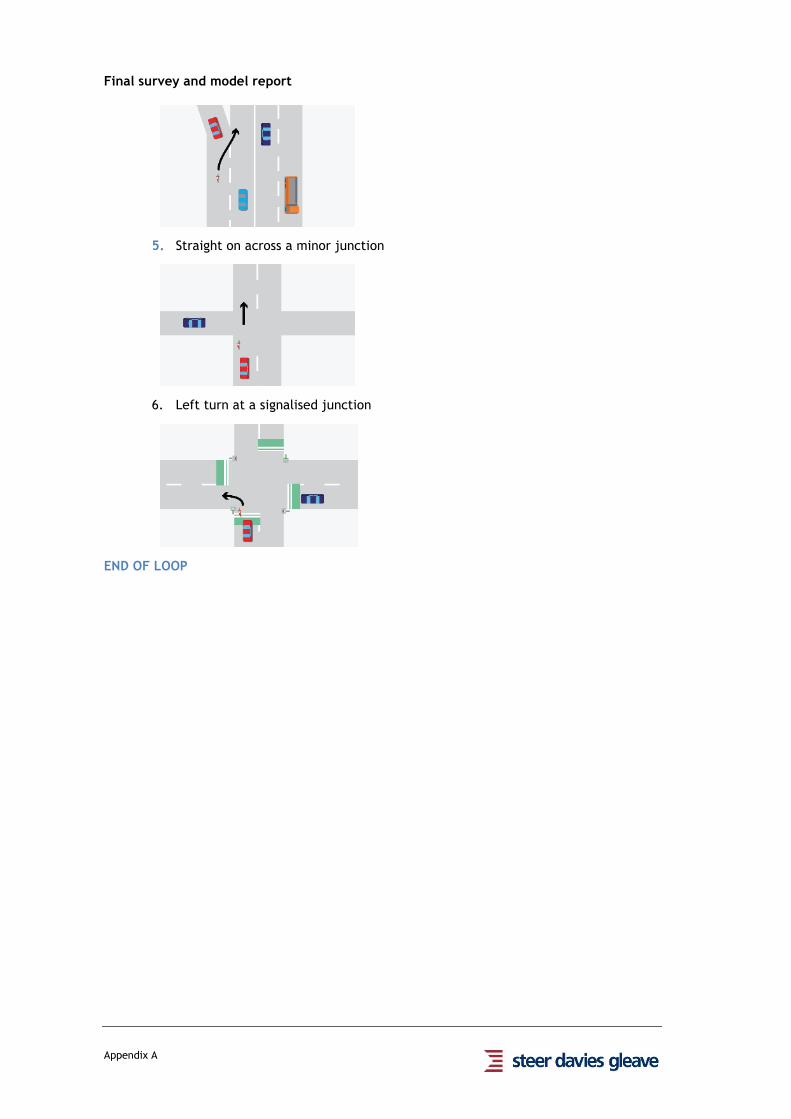
Final survey and model report
Appendix A
5. Straight on across a minor junction
6. Left turn at a signalised junction
END OF LOOP

Final survey and model report
Appendix A
Section C: Most Recent Trip
INFO1-SEPARATE PAGE
For the rest of the survey we would like you to think about the most recent trip that
you made for the purpose of [pipe answer to A3 (or A4 if A3 = 5)] which involved at
least a 10 minute journey by bicycle.
This can include a journey which also used other modes, but when answering these
questions please only consider the cycling part of your journey.
Please click `NEXT` to continue.
ASK ALL
C1. Did you travel by any other modes as part of the entire journey?
(1) Yes
(2) No, I cycled the entire journey
ASK IF QC1=1
C1a. Which mode did you use immediately before starting your cycle journey?
(1) Car (as driver or passenger)
(2) National Rail
(3) Underground/DLR
(4) Bus
98. Other (please specify)
ONLY SHOW IF QC1=1 INFO 2- SEPARATE PAGE
Please remember to answer the following questions thinking about the cycle part of
your journey only.
Please click `NEXT` to continue.
ASK ALL
C2. Did you use your own (or a borrowed) bicycle or a Barclays Cycle Hire bicycle?
(1) My own bicycle (or borrowed)
(2) Barclays Cycle Hire scheme bicycles (ie. Boris Bike)
98. Other
ASK ALL
C3. Please write in the postcode or borough name which you started and ended your
journey
SHOW LONDON BOROUGH MAP
Please click to enlarge to see London Borough Map

Final survey and model report
Appendix A
JOURNEY STARTED TITLE - AT LEAST ONE ANSWER NEEDED
1. Borough Name (Please specify)– DROP DOWN LIST - SEE BOROUGH EXCEL LIST –
2. Postcode: FIRST PART OF POSTCODE MUST BE VALID
97. Don`t know EXCLUSIVE
JOURNEY ENDED TITLE - AT LEAST ONE ANSWER NEEDED
1. Borough Name (Please specify)– DROP DOWN LIST - SEE BOROUGH EXCEL LIST
2. Postcode: FIRST PART OF POSTCODE MUST BE VALID
97. Don`t know EXCLUSIVE
ASK ALL
C4. To what extent did each of these influence your decision to cycle this trip?
Single code per row
1 2 3
Had a large
influence on my
decision
Had some
influence on my
decision
Had no influence
on my decision
1 Fastest way to
travel
2 Cheapest way to
travel
3 I like the health
benefits that
come from
cycling
4 The least
stressful way to
travel
8 Fun, pleasant,
enjoyable
98 Other (Please
specify)

Final survey and model report
Appendix A
ASK ALL
(MIN 10 – MAX 120)
C5. How long did this journey take to cycle? (In minutes)
Please enter numbers
ASK ALL
C6. Did you undertake this journey on a weekday or a weekend?
(1) Weekday
(2) Weekend
ASK ALL
DROP DOWN LIST
C7.At what time did you begin your journey?
1. 05:00 – 05:59
2 06:00 – 06:59
3. 07:00 – 07:59
4. 08:00 – 08:59
5. 09:00 – 09:59
6. 10:00 – 10:59
7. 11:00 – 11:59
8. 12:00 – 12:59
9. 13:00 – 13:59
10. 14:00 – 14:59
11. 15:00 – 15:59
12 16:00 – 16:59
13. 17:00 – 17:59
14. 18:00 – 18:59
15. 19:00 – 19:59
16. 20:00 – 20:59
17. 21:00 – 21:59
18. 22:00 – 22:59
19. 23:00 – 23:59
20. After midnight 00:00 – 04:59
ASK ALL
C8. How often do you make this journey?
(1) More than 3 times a week
(2) 2-3 times a week
(3) Once a week
(4) At least once a month, but less than once a week
(5) Less than once a month

Final survey and model report
Appendix A
ASK ALL
C9. Was this journey time-pressured (i.e. was there a fixed time you had to arrive at
your destination, or a fixed time period within which you had to complete your
journey?)
(1) Yes – I had a fixed time that I had to arrive at my destination
(2) Yes, but it didn’t matter if I arrived up to 15 minutes later
(3) Yes, but it didn’t matter if I arrived up to 1 hour later
(4) No, there was no time-pressure
INFO 2- SEPARATE PAGE
We would now like to ask more specifically about the route that you took on this
journey.
Please click `NEXT` to continue.
ASK ALL
C10. How did you find out about this route?
Please select ALL that apply
(1) Someone showed me the route
(2) I used a cycle journey planner
(3) I used a map
(4) I was unsure of the route and followed street signage
(5) Trial and error
(6) Know the area
(7) Used route by another mode
98. Other (please specify)
ASK ALL
C11. Have you ever cycled using an alternative route to make this journey?
(1) Yes
(2) No
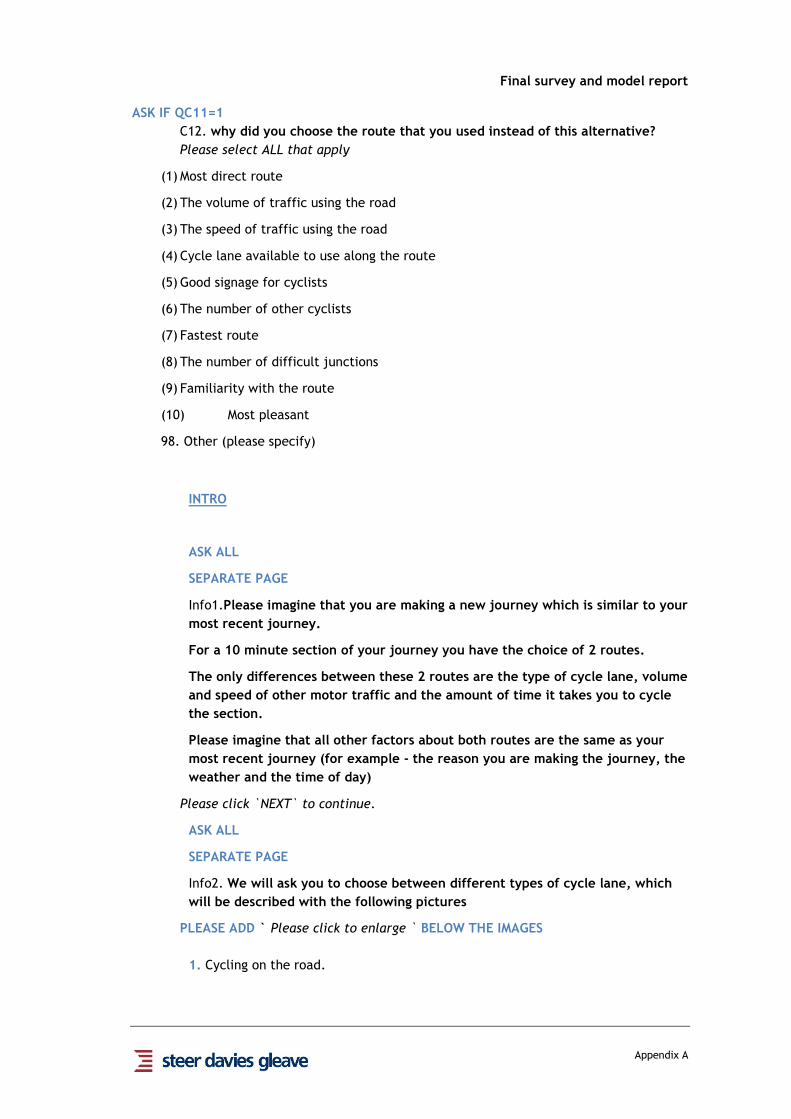
Final survey and model report
Appendix A
ASK IF QC11=1
C12. why did you choose the route that you used instead of this alternative?
Please select ALL that apply
(1) Most direct route
(2) The volume of traffic using the road
(3) The speed of traffic using the road
(4) Cycle lane available to use along the route
(5) Good signage for cyclists
(6) The number of other cyclists
(7) Fastest route
(8) The number of difficult junctions
(9) Familiarity with the route
(10) Most pleasant
98. Other (please specify)
INTRO
ASK ALL
SEPARATE PAGE
Info1.Please imagine that you are making a new journey which is similar to your
most recent journey.
For a 10 minute section of your journey you have the choice of 2 routes.
The only differences between these 2 routes are the type of cycle lane, volume
and speed of other motor traffic and the amount of time it takes you to cycle
the section.
Please imagine that all other factors about both routes are the same as your
most recent journey (for example - the reason you are making the journey, the
weather and the time of day)
Please click `NEXT` to continue.
ASK ALL
SEPARATE PAGE
Info2. We will ask you to choose between different types of cycle lane, which
will be described with the following pictures
PLEASE ADD ` Please click to enlarge ` BELOW THE IMAGES
1. Cycling on the road.
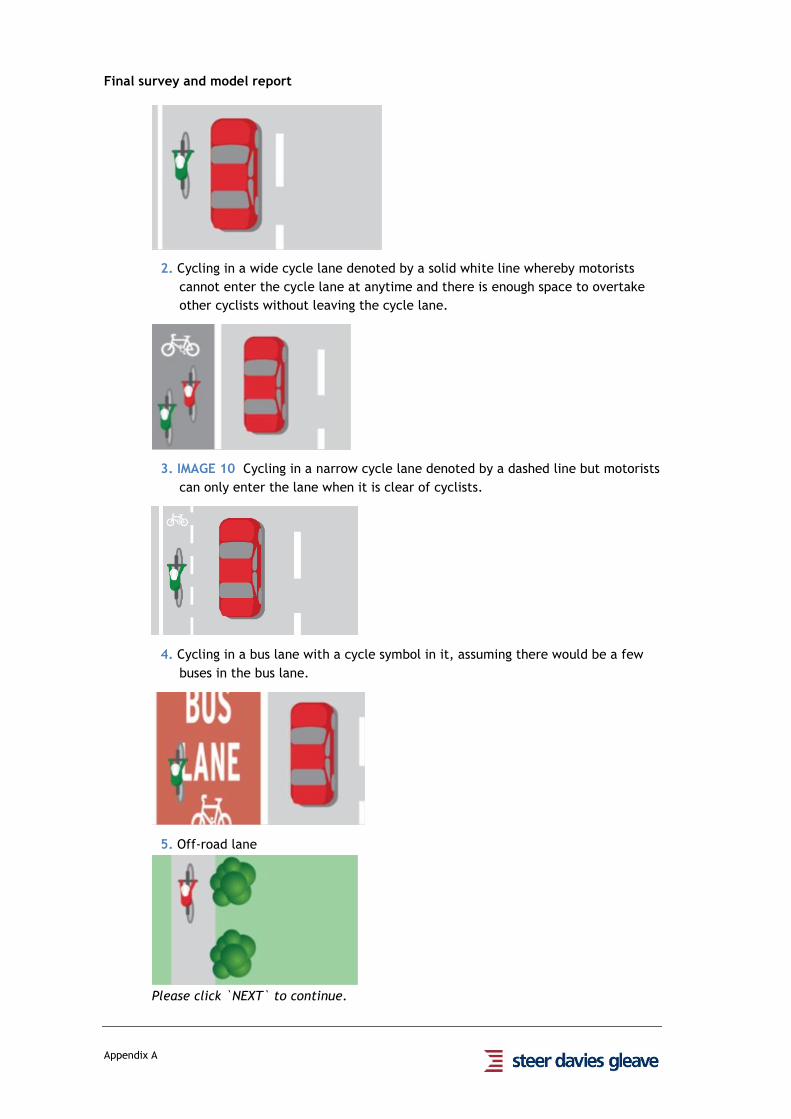
Final survey and model report
Appendix A
2. Cycling in a wide cycle lane denoted by a solid white line whereby motorists
cannot enter the cycle lane at anytime and there is enough space to overtake
other cyclists without leaving the cycle lane.
3. IMAGE 10 Cycling in a narrow cycle lane denoted by a dashed line but motorists
can only enter the lane when it is clear of cyclists.
4. Cycling in a bus lane with a cycle symbol in it, assuming there would be a few
buses in the bus lane.
5. Off-road lane
Please click `NEXT` to continue.

Final survey and model report
Appendix A
ASK ALL
SEPARATE PAGE
Info3. We will ask you to choose between levels of traffic and traffic speed, which
will be described with the following pictures
1. A residential road with parked cars and a low level of slow moving traffic (less than
20mph), like this.
2. District High Street, with a mix of shops and residential blocks, and a high level of slow
moving traffic (less than 20mph)
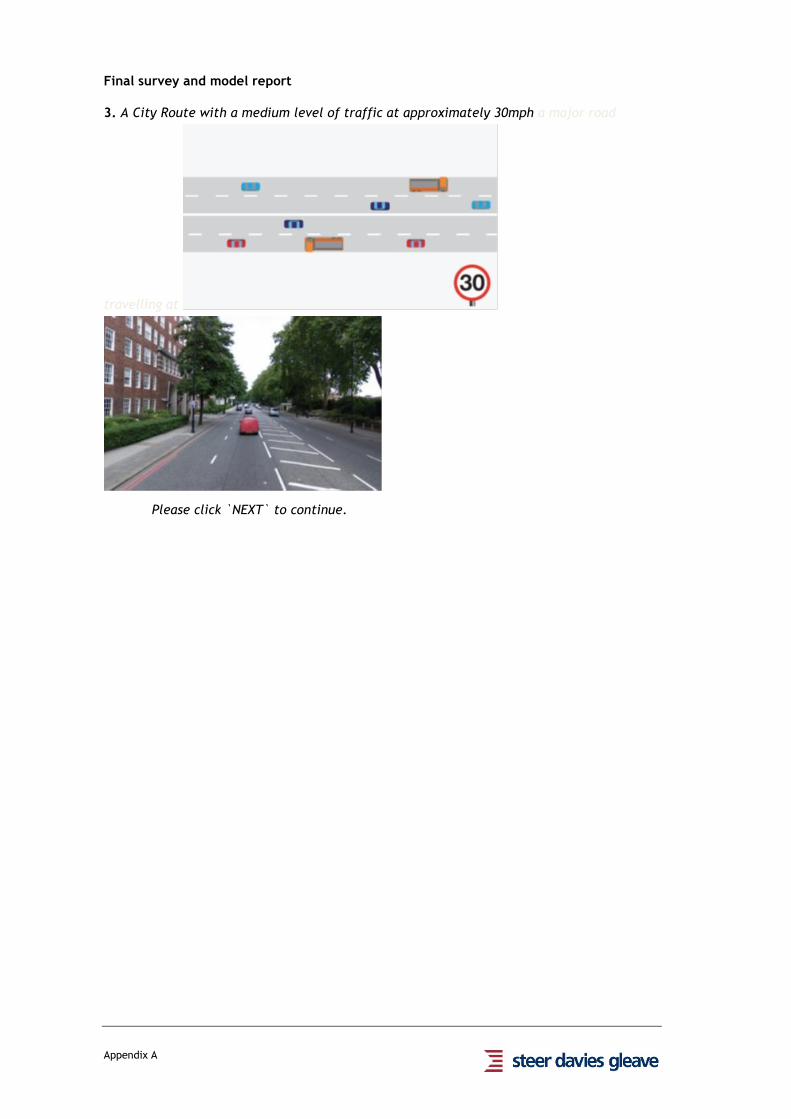
Final survey and model report
Appendix A
3. A City Route with a medium level of traffic at approximately 30mph a major road
travelling at
Please click `NEXT` to continue.
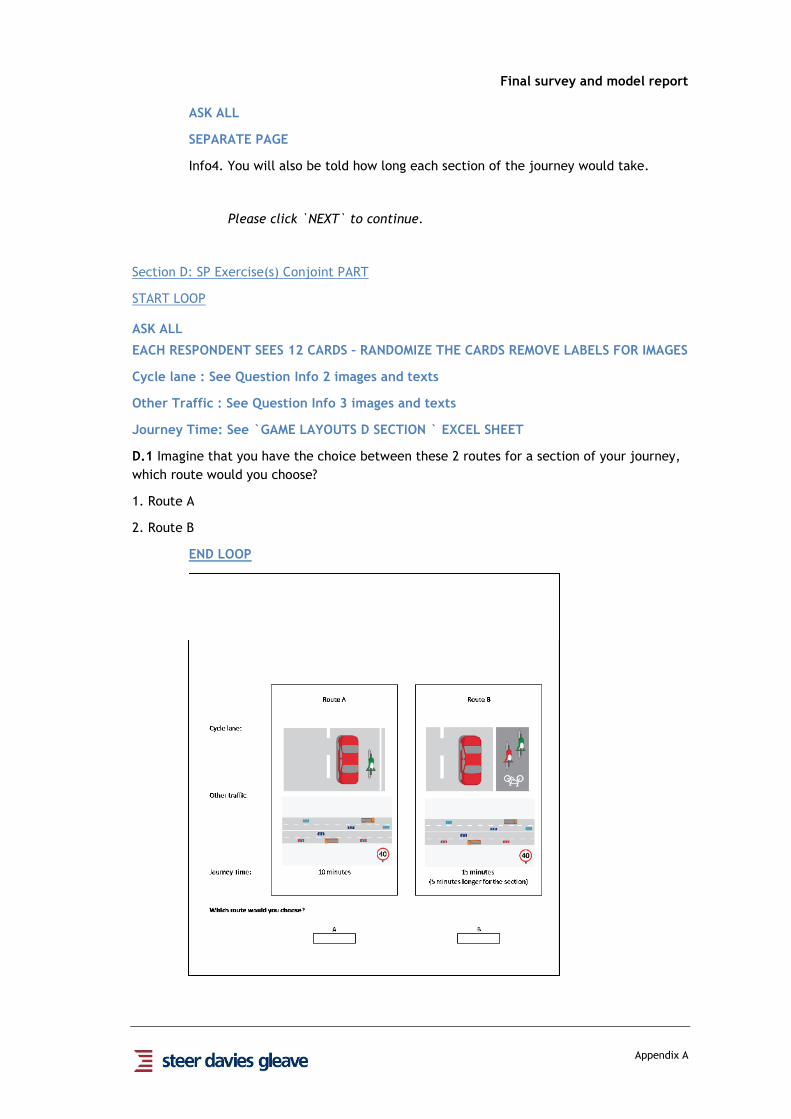
Final survey and model report
Appendix A
ASK ALL
SEPARATE PAGE
Info4. You will also be told how long each section of the journey would take.
Please click `NEXT` to continue.
Section D: SP Exercise(s) Conjoint PART
START LOOP
ASK ALL
EACH RESPONDENT SEES 12 CARDS – RANDOMIZE THE CARDS REMOVE LABELS FOR IMAGES
Cycle lane : See Question Info 2 images and texts
Other Traffic : See Question Info 3 images and texts
Journey Time: See `GAME LAYOUTS D SECTION ` EXCEL SHEET
D.1 Imagine that you have the choice between these 2 routes for a section of your journey,
which route would you choose?
1. Route A
2. Route B
END LOOP

Final survey and model report
Appendix A
JUNCTION DETOUR GAME
Junction1. RANDOMIZE THE BELOW JUNCTIONS IN THE LOOP
1. A right turn at a two-lane roundabout where you need to cross lanes of traffic.
2. A right turn at a single lane roundabout
3. A right turn at traffic lights where you need to cross lanes of traffic.
4. A right turn from a side road onto a main road
5. straight through a junction where you need to change lanes to avoid left turning traffic
ADD BEFORE THE LOOP
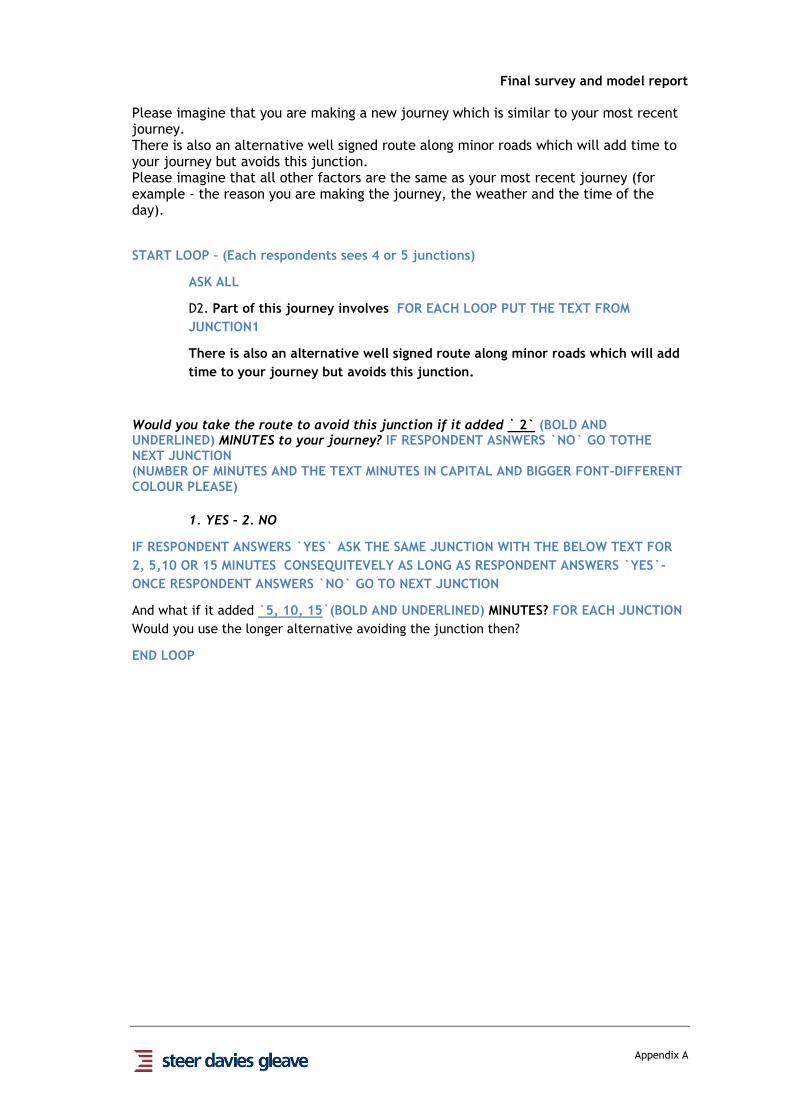
Final survey and model report
Appendix A
Please imagine that you are making a new journey which is similar to your most recent journey. There is also an alternative well signed route along minor roads which will add time to your journey but avoids this junction. Please imagine that all other factors are the same as your most recent journey (for example - the reason you are making the journey, the weather and the time of the day).
START LOOP – (Each respondents sees 4 or 5 junctions)
ASK ALL
D2. Part of this journey involves FOR EACH LOOP PUT THE TEXT FROM
JUNCTION1
There is also an alternative well signed route along minor roads which will add
time to your journey but avoids this junction.
Would you take the route to avoid this junction if it added ` 2` (BOLD AND UNDERLINED) MINUTES to your journey? IF RESPONDENT ASNWERS `NO` GO TOTHE NEXT JUNCTION (NUMBER OF MINUTES AND THE TEXT MINUTES IN CAPITAL AND BIGGER FONT-DIFFERENT COLOUR PLEASE)
1. YES - 2. NO
IF RESPONDENT ANSWERS `YES` ASK THE SAME JUNCTION WITH THE BELOW TEXT FOR
2, 5,10 OR 15 MINUTES CONSEQUITEVELY AS LONG AS RESPONDENT ANSWERS `YES`–
ONCE RESPONDENT ANSWERS `NO` GO TO NEXT JUNCTION
And what if it added `5, 10, 15`(BOLD AND UNDERLINED) MINUTES? FOR EACH JUNCTION
Would you use the longer alternative avoiding the junction then?
END LOOP

Final survey and model report
Appendix A
Yes No
Please imagine that you are making a new journey which is similar to your most recent
journey.
Part of this journey involves a [right turn at a roundabout]
There is also an alternative well signed route along minor roads which will add time to your
journey but avoids this junction.
Please imagine that all other factors are the same as your most recent journey (for example -
the reason you are making the journey, the weather and the time of day).
Would you take the route to avoid this junction if it added [5 minutes] to your journey?

Final survey and model report
Appendix A
Section E: Demographics
ASK ALL
E1. Which age group do you fall into?
(1) 16-24
(2) 25-34
(3) 35-44
(4) 45-54
(5) 55-64
(6) 65-74
(7) 75+
ASK ALL
E2. What is your gender?
(1) Male
(2) Female
ASK ALL
E3. What is your current employment status?
(1) Working full time (30+ hours a week)
(2) Working part time (<30 hours a week)
(3) Student
(4) Retired
(5) Unemployed
(6) Looking after family and home
(7) Other (please specify)
96. Prefer not to answer
ASK ALL
E4. What is your current annual household income? (Please include all sources of
income, e.g. salary, benefits)
(1) Under £4,999
(2) £5,000 to £9,999
(3) £10,000 to £14,999
(4) £15,000 to £19,999
(5) £20,000 to £29,999

Final survey and model report
Appendix A
(6) £30,000 to £39,999
(7) £40,000 to £49,999
(8) £50,000 to £75,000
(9) £75,000 or over
99. Don't know/prefer not to say
ASK ALL
E5.What is your ethnicity?
(1) White
(2) Mixed or multiple ethnic groups
(3) Asian or Asian British
(4) Black or Black British
(5) Other Ethnic Group
96. Prefer not to answer
ASK ALL
STANDARD POSTCODE VALIDATION CHAR AND NUM
UNLESS 96 SELECTED FIRST PART OF THE POSTCODE IS NECESSARY
OPTION 96 EXCLUSIVE
Please enter the first part of your home postcode
96. Prefer not to answer
ASK ALL
Bfo4. Where do you live?
SHOW THE MAP FOR Q E61
Please click to enlarge
1. Inner London
2. Outer London
3. Outside London
ASK ALL
E7. Are you a member of any of the following?
(1) Cyclists Touring Club (CTC)
(2) London Cycling campaign
(3) Other cycling group or organisation
99. None

Final survey and model report
Appendix A
ASK ALL
E8. Do you take part in cycling-based events?
(1) Yes
(2) No
E9. Would you be happy to be contacted by email in future for similar research?
(1) Yes
(2) No

Final survey and model report
Appendix B
APPENDIX
B
QUALITATIVE REPORT

Final survey and model report
Appendix B
B1 QUALITATIVE REPORT
Introduction
The following memo provides a summary of the findings of the accompanied cycle
rides undertaken between 2nd and 13th April 2012. A total of 16 interviews were
conducted.
Methodology
Participants were recruited by interviewers as they were making a journey by
bicycle. This was done at a number of locations across London, at different times
of day (Morning and evening peak as well as off-peak).
Interviewers followed the participant on their journey for 10-15 minutes, before
conducting a short roadside interview with them to establish more information
about their propensity to cycle, the journey that they were currently making, and
the level of importance they place on a number of attributes when deciding to use
that particular route. The interviewer also noted the type of route used by the
cyclist (i.e. whether it was a main road, quiet road or off-road, and whether there
was a cycle/bus lane available to use).
As this was a new method, and perceived to be potentially invasive, participants
were offered a £20 amazon voucher. However, a debrief with the interviewers
suggested that most respondents would have been happy to participate for a £10
incentive.
Participant Profile
Seven participants were female. Four of the participants were aged 30 or under,
six were aged 35-40 and five over 45 (one missing). All participants were frequent
cyclists, with each one stating that they cycle at least twice a week. A couple who
were making a recreational journey (i.e. not commuting to/from work or
school/college) were tourists, so although cycling every day would have been
unfamiliar with their location.
Ten were cycling to or from work or education and six were making non-work
related trips. All participants said that, even if the particular journey was not a
commuting trip, they do cycle to and from work or school/college. There was
nobody interviewed that said they would make leisure/recreational trips by bike
but did not also cycle to and from work/college. Around 75% of participants
travelled by bicycle for more than one reason generally (i.e. commuting & leisure,
commuting & personal business).
Journey Profile
Ten journeys were at least in part on main roads, eight on quiet roads and four
off-roads. Six journeys included a cycle superhighway, four included an on-road
cycle lane, four included an off-road cycle lane and two did not include a cycle
lane at all. Nine journeys included a bus lane.
The length of journey that participants were undertaking varied considerably, with
some making short 5-10 minute journeys, but others making journeys of over an
hour.
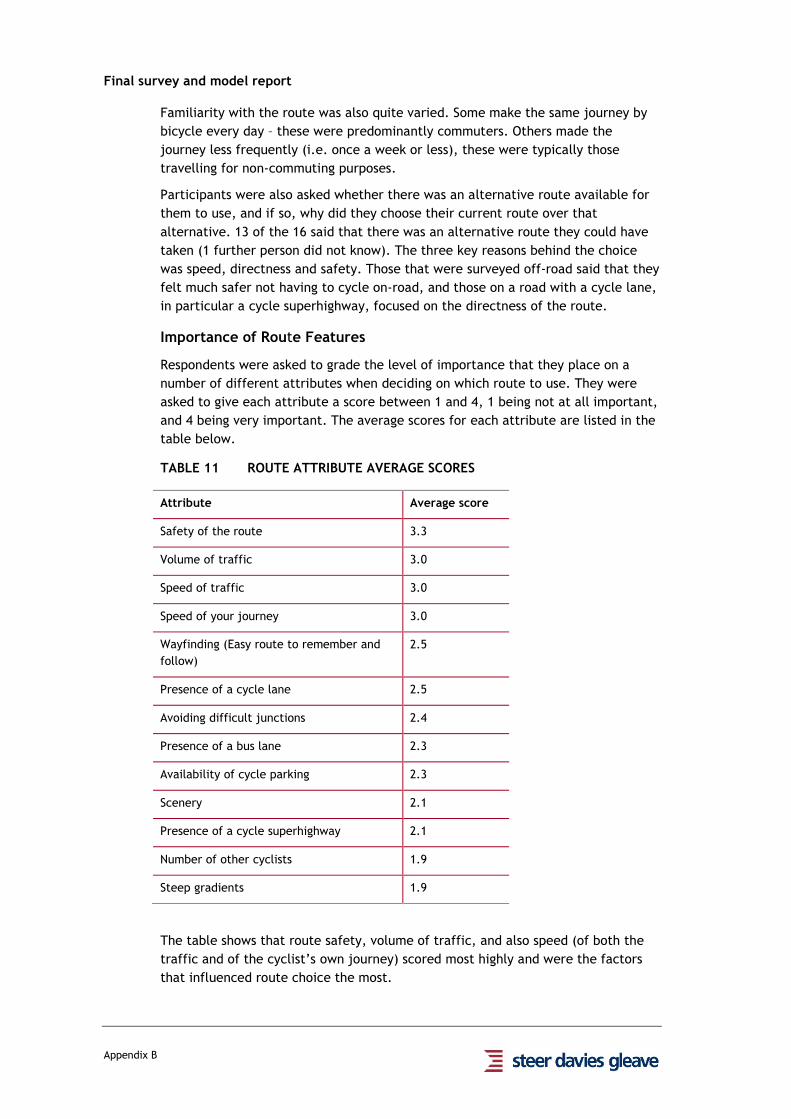
Final survey and model report
Appendix B
Familiarity with the route was also quite varied. Some make the same journey by
bicycle every day – these were predominantly commuters. Others made the
journey less frequently (i.e. once a week or less), these were typically those
travelling for non-commuting purposes.
Participants were also asked whether there was an alternative route available for
them to use, and if so, why did they choose their current route over that
alternative. 13 of the 16 said that there was an alternative route they could have
taken (1 further person did not know). The three key reasons behind the choice
was speed, directness and safety. Those that were surveyed off-road said that they
felt much safer not having to cycle on-road, and those on a road with a cycle lane,
in particular a cycle superhighway, focused on the directness of the route.
Importance of Route Features
Respondents were asked to grade the level of importance that they place on a
number of different attributes when deciding on which route to use. They were
asked to give each attribute a score between 1 and 4, 1 being not at all important,
and 4 being very important. The average scores for each attribute are listed in the
table below.
TABLE 11 ROUTE ATTRIBUTE AVERAGE SCORES
Attribute Average score
Safety of the route 3.3
Volume of traffic 3.0
Speed of traffic 3.0
Speed of your journey 3.0
Wayfinding (Easy route to remember and
follow)
2.5
Presence of a cycle lane 2.5
Avoiding difficult junctions 2.4
Presence of a bus lane 2.3
Availability of cycle parking 2.3
Scenery 2.1
Presence of a cycle superhighway 2.1
Number of other cyclists 1.9
Steep gradients 1.9
The table shows that route safety, volume of traffic, and also speed (of both the
traffic and of the cyclist’s own journey) scored most highly and were the factors
that influenced route choice the most.

Final survey and model report
Appendix B
Certain attributes, such as “presence of a cycle superhighway”, were very
dependent on participants having that feature on their current route. For
example, those that were not using a cycle superhighway all said that the
presence of one was not at all important. In contrast, those that were using one all
said it was either quite important or very important. Another example of this was
availability of cycle parking, for which users of the Barclays Cycle Hire scheme
placed more importance.
Given the small sample, the conclusions drawn from these results can be
considered statistically significant. However the findings will be used in order to
inform the design of the online survey, in particular the stated preference
exercises.


Final survey and model report
Appendix C
APPENDIX
C
PILOT REPORT


Final survey and model report
Appendix C
C1 PILOT REPORT
Introduction
C1.1 This report presents the findings from the piloting of the Cycle Route Choice online
questionnaire. Key questions are analysed here and full tables are provided
separately. The report is structured as follows:
I Methods and response rates
I Sample profile
I Stated preference results
I Junction detour game responses
I Summary and recommendations
I Next steps
I Appendix A is the email sent out to the TfL sample
Pilot Survey
C1.2 The questionnaire was launched online by our fieldwork sub-contractors Research
Now, and was completed by 97 of their panel within 24 hours.
C1.3 A link to the questionnaire was also sent out to 50 respondents from TfL
databases. Five complete responses were received within 15 hours. Although this is
a small sample it represents a 10% response rate, which is higher than expected.
However, one response had to be rejected due to being completed too quickly.
C1.4 Once 101 responses had been received the link was closed for analysis.
C1.5 The questionnaire took an average of 16 minutes to complete.
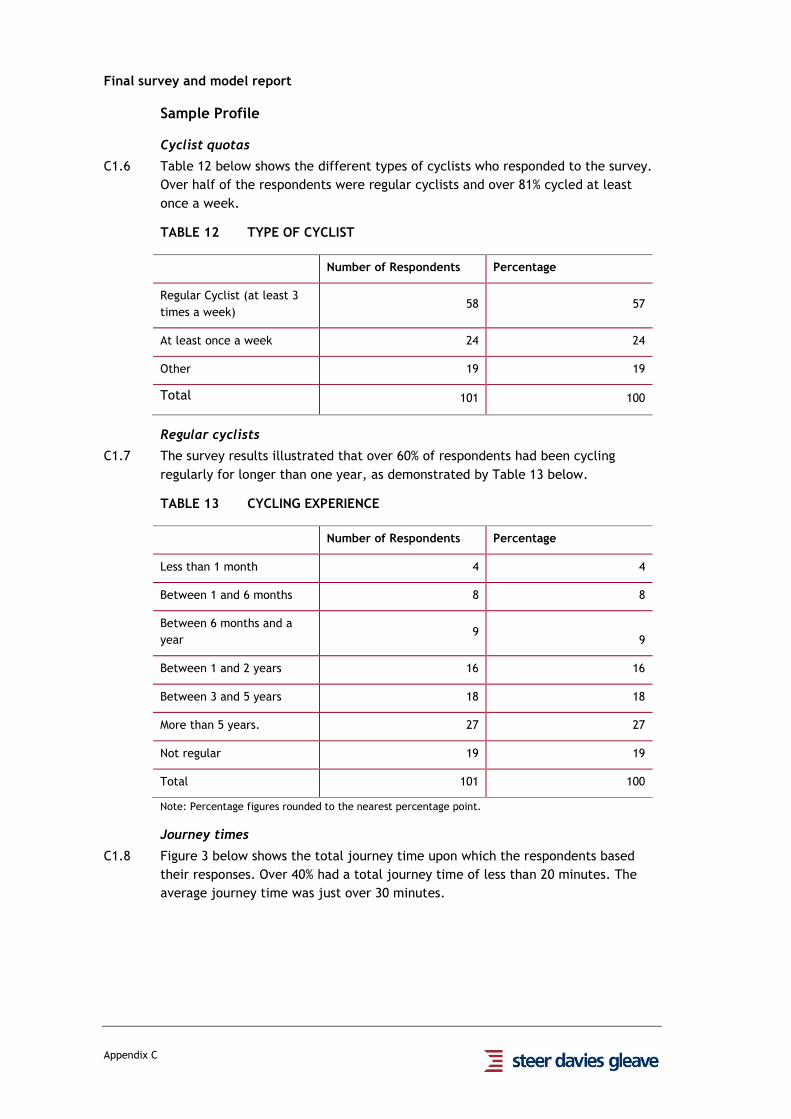
Final survey and model report
Appendix C
Sample Profile
Cyclist quotas
C1.6 Table 12 below shows the different types of cyclists who responded to the survey.
Over half of the respondents were regular cyclists and over 81% cycled at least
once a week.
TABLE 12 TYPE OF CYCLIST
Number of Respondents Percentage
Regular Cyclist (at least 3
times a week) 58 57
At least once a week 24 24
Other 19 19
Total 101 100
Regular cyclists
C1.7 The survey results illustrated that over 60% of respondents had been cycling
regularly for longer than one year, as demonstrated by Table 13 below.
TABLE 13 CYCLING EXPERIENCE
Number of Respondents Percentage
Less than 1 month 4 4
Between 1 and 6 months 8 8
Between 6 months and a
year 9
9
Between 1 and 2 years 16 16
Between 3 and 5 years 18 18
More than 5 years. 27 27
Not regular 19 19
Total 101 100
Note: Percentage figures rounded to the nearest percentage point.
Journey times
C1.8 Figure 3 below shows the total journey time upon which the respondents based
their responses. Over 40% had a total journey time of less than 20 minutes. The
average journey time was just over 30 minutes.

Final survey and model report
Appendix C
FIGURE 3 JOURNEY TIME
Type of bicycle
C1.9 77% of the sample used their own bicycle or a borrowed bicycle for the journey
upon which they were basing their responses on. The remainder had used a
Barclays Cycle Hire bicycle.
Level of time pressure
C1.10 It is evident from Figure 4 below, that commuter journeys were the most likely to
be restricted by time. Just under half of commuter respondents had a fixed time
at which they must reach their destination. A large number of commuters also
have 15 minutes flexibility around their arrival time. Leisure travellers tend to
have no time pressure
0
5
10
15
20
25
30
35
40
45
10-20mins 21-30mins 31-40mins 41-50mins 51-60mins 60mins+
% o
f R
esp
on
de
nts
Journey Time

Final survey and model report
Appendix C
FIGURE 4 TIME PRESSURE BY TYPE OF JOURNEY
Alternative route
C1.11 Over half of respondents surveyed stated that they had used an alternative route
at some stage to make the same journey. The most popular reason for choosing
their current route were the fact that it was the most direct.
Preferences
SP Game
C1.12 Table 14 illustrates that 77% of respondents traded between the stated
preferences cards with just under 6% of the sample always choosing the quickest
option and 17% always the choosing the higher quality route.
TABLE 14 OVERALL TRADING LEVELS
Frequency Percentage
Traded 78 77
Always left -
quickest 6 6
Always right -
quality 17 17
C1.13 Figure 5 demonstrates that all the respondents who always choose the quickest
option were all commuters while leisure cyclists had the highest proportion of
respondents who always chose the higher quality option.
0
5
10
15
20
25
30
Fixed time Up to 15 minutes Up to 1 hour None
Nu
mb
er
of
resp
on
de
nts
Time pressure
Commute
Business
Education
Leisure
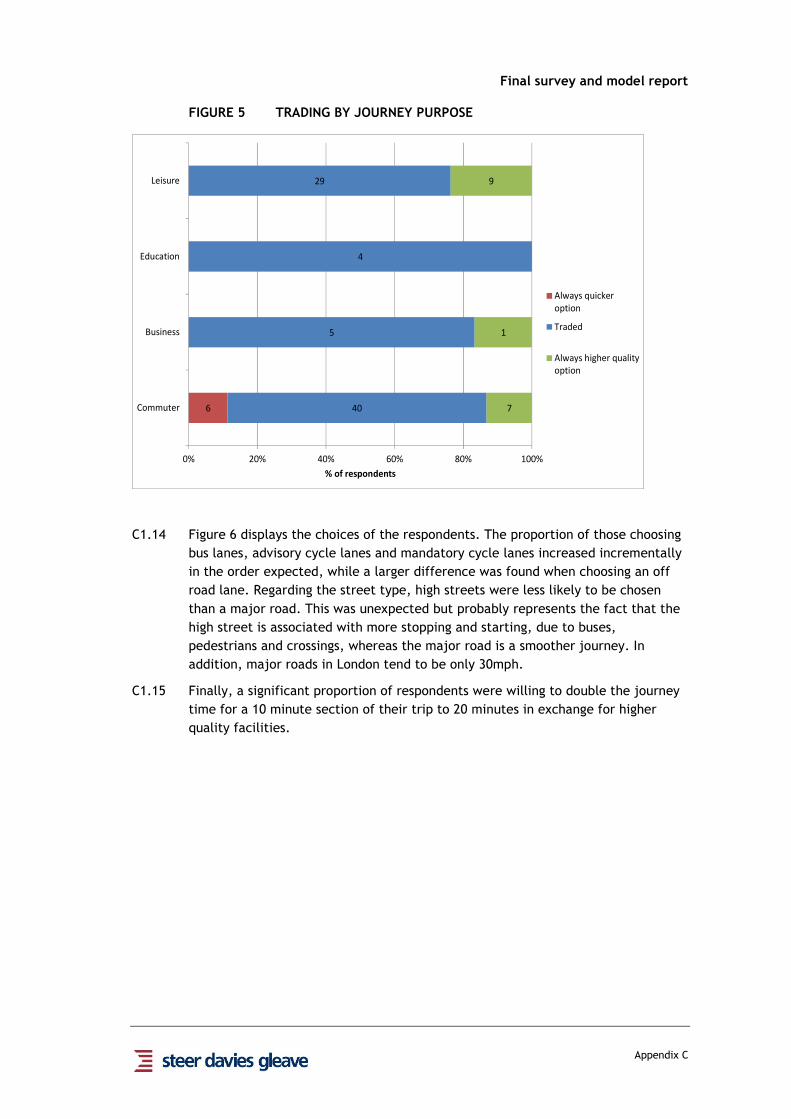
Final survey and model report
Appendix C
FIGURE 5 TRADING BY JOURNEY PURPOSE
C1.14 Figure 6 displays the choices of the respondents. The proportion of those choosing
bus lanes, advisory cycle lanes and mandatory cycle lanes increased incrementally
in the order expected, while a larger difference was found when choosing an off
road lane. Regarding the street type, high streets were less likely to be chosen
than a major road. This was unexpected but probably represents the fact that the
high street is associated with more stopping and starting, due to buses,
pedestrians and crossings, whereas the major road is a smoother journey. In
addition, major roads in London tend to be only 30mph.
C1.15 Finally, a significant proportion of respondents were willing to double the journey
time for a 10 minute section of their trip to 20 minutes in exchange for higher
quality facilities.
6 40
5
4
29
7
1
9
0% 20% 40% 60% 80% 100%
Commuter
Business
Education
Leisure
% of respondents
Always quicker
option
Traded
Always higher quality
option

Final survey and model report
Appendix C
FIGURE 6 CHOICE PROPORTIONS BY LEVEL
0
10
20
30
40
50
60
70
80
90
No
ne
Bu
s La
ne
Ad
vis
ory
Ma
nd
ato
ry
Off
ro
ad
Ma
jor
Ro
ad
Hig
h S
tre
et
Re
sid
en
tia
l S
tre
et
12
15
20
% o
f re
spo
nd
en
ts c
ho
osi
ng
e
ach
le
ve
l
Journey Time
Cycle Lane
Street Type
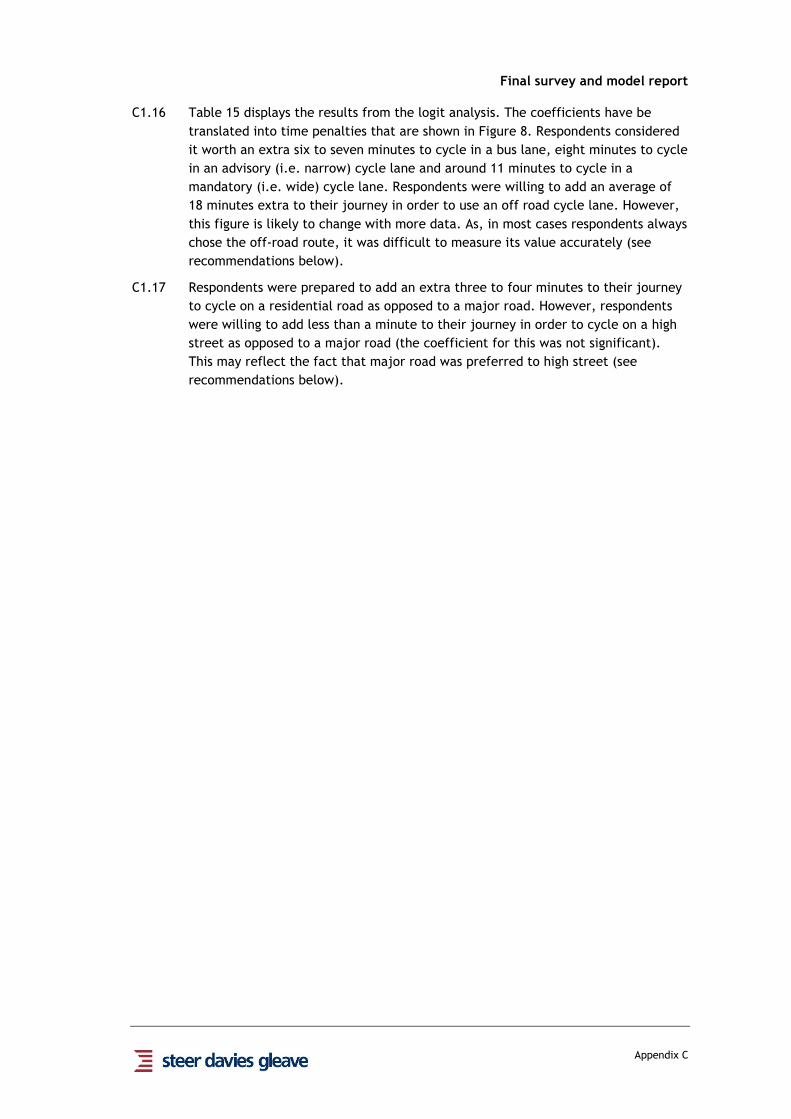
Final survey and model report
Appendix C
C1.16 Table 15 displays the results from the logit analysis. The coefficients have be
translated into time penalties that are shown in Figure 8. Respondents considered
it worth an extra six to seven minutes to cycle in a bus lane, eight minutes to cycle
in an advisory (i.e. narrow) cycle lane and around 11 minutes to cycle in a
mandatory (i.e. wide) cycle lane. Respondents were willing to add an average of
18 minutes extra to their journey in order to use an off road cycle lane. However,
this figure is likely to change with more data. As, in most cases respondents always
chose the off-road route, it was difficult to measure its value accurately (see
recommendations below).
C1.17 Respondents were prepared to add an extra three to four minutes to their journey
to cycle on a residential road as opposed to a major road. However, respondents
were willing to add less than a minute to their journey in order to cycle on a high
street as opposed to a major road (the coefficient for this was not significant).
This may reflect the fact that major road was preferred to high street (see
recommendations below).
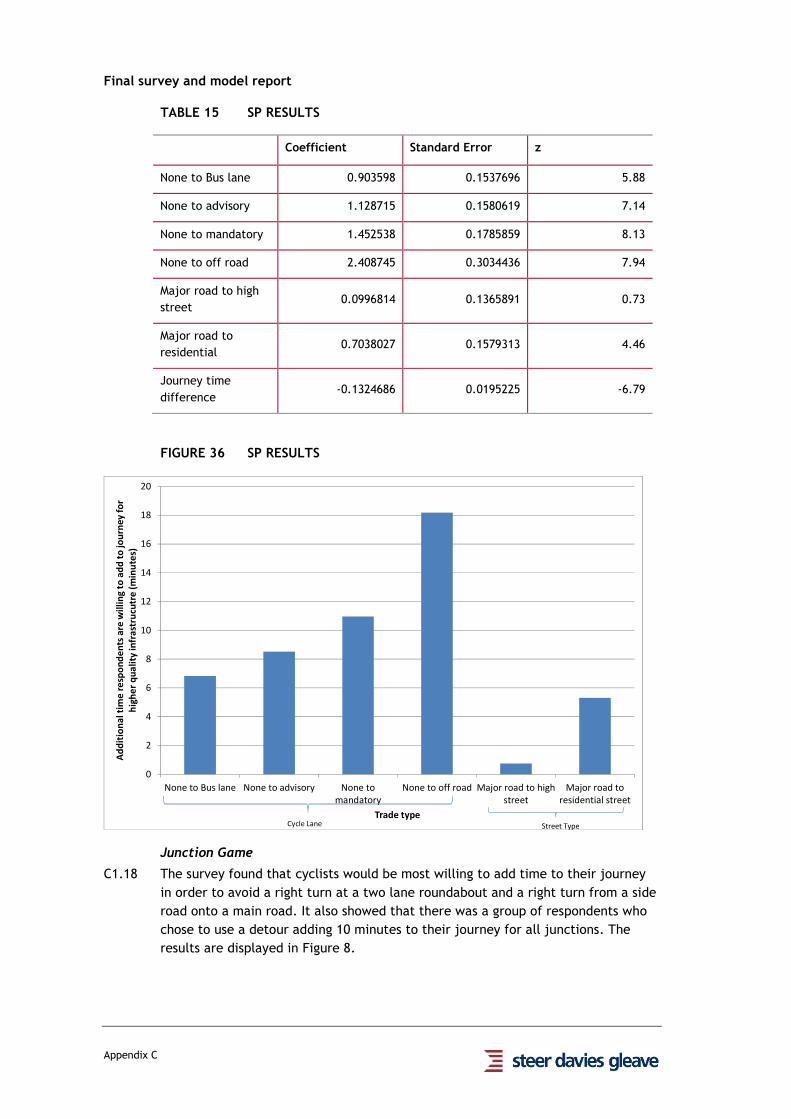
Final survey and model report
Appendix C
TABLE 15 SP RESULTS
Coefficient Standard Error z
None to Bus lane 0.903598 0.1537696 5.88
None to advisory 1.128715 0.1580619 7.14
None to mandatory 1.452538 0.1785859 8.13
None to off road 2.408745 0.3034436 7.94
Major road to high
street 0.0996814 0.1365891 0.73
Major road to
residential 0.7038027 0.1579313 4.46
Journey time
difference -0.1324686 0.0195225 -6.79
FIGURE 36 SP RESULTS
Junction Game
C1.18 The survey found that cyclists would be most willing to add time to their journey
in order to avoid a right turn at a two lane roundabout and a right turn from a side
road onto a main road. It also showed that there was a group of respondents who
chose to use a detour adding 10 minutes to their journey for all junctions. The
results are displayed in Figure 8.
0
2
4
6
8
10
12
14
16
18
20
None to Bus lane None to advisory None to
mandatory
None to off road Major road to high
street
Major road to
residential street
Ad
dit
ion
al
tim
e r
esp
on
de
nts
are
wil
lin
g t
o a
dd
to
jo
urn
ey
fo
r
hig
he
r q
ua
lity
in
fra
stru
cutr
e (
min
ute
s)
Trade typeCycle Lane Street Type
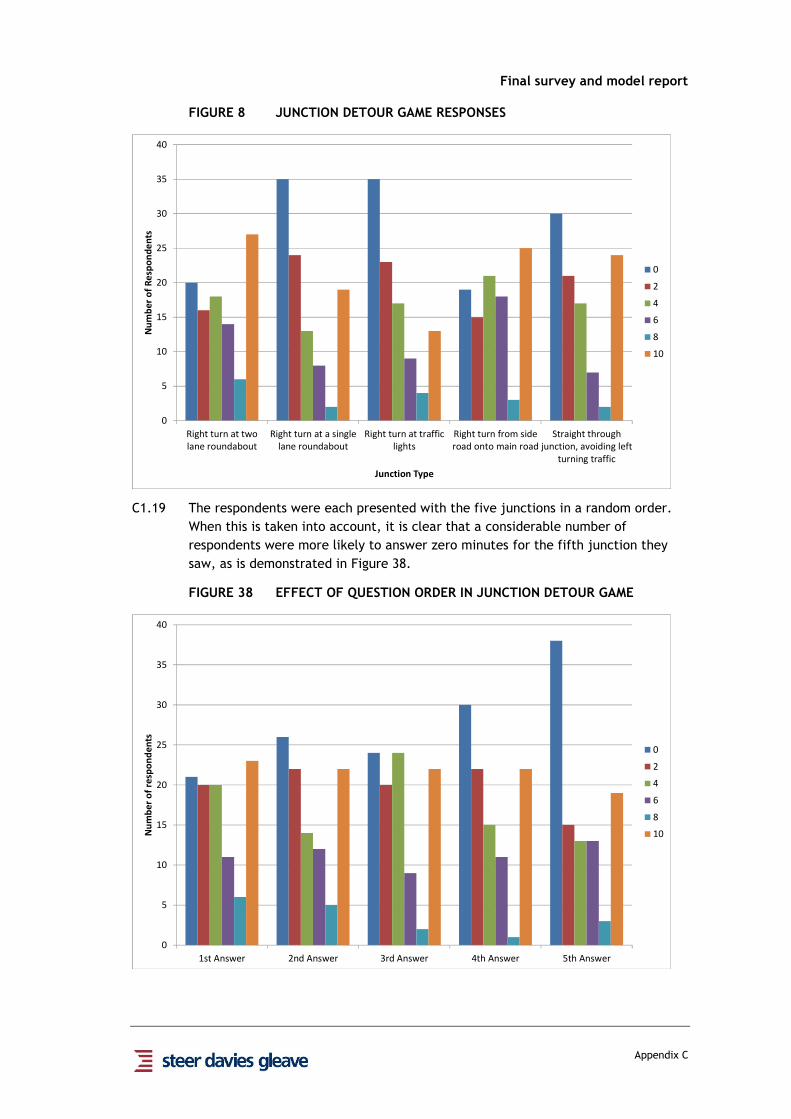
Final survey and model report
Appendix C
FIGURE 8 JUNCTION DETOUR GAME RESPONSES
C1.19 The respondents were each presented with the five junctions in a random order.
When this is taken into account, it is clear that a considerable number of
respondents were more likely to answer zero minutes for the fifth junction they
saw, as is demonstrated in Figure 38.
FIGURE 38 EFFECT OF QUESTION ORDER IN JUNCTION DETOUR GAME
0
5
10
15
20
25
30
35
40
Right turn at two
lane roundabout
Right turn at a single
lane roundabout
Right turn at traffic
lights
Right turn from side
road onto main road
Straight through
junction, avoiding left
turning traffic
Nu
mb
er
of
Re
spo
nd
en
ts
Junction Type
0
2
4
6
8
10
0
5
10
15
20
25
30
35
40
1st Answer 2nd Answer 3rd Answer 4th Answer 5th Answer
Nu
mb
er
of
resp
on
de
nts
0
2
4
6
8
10
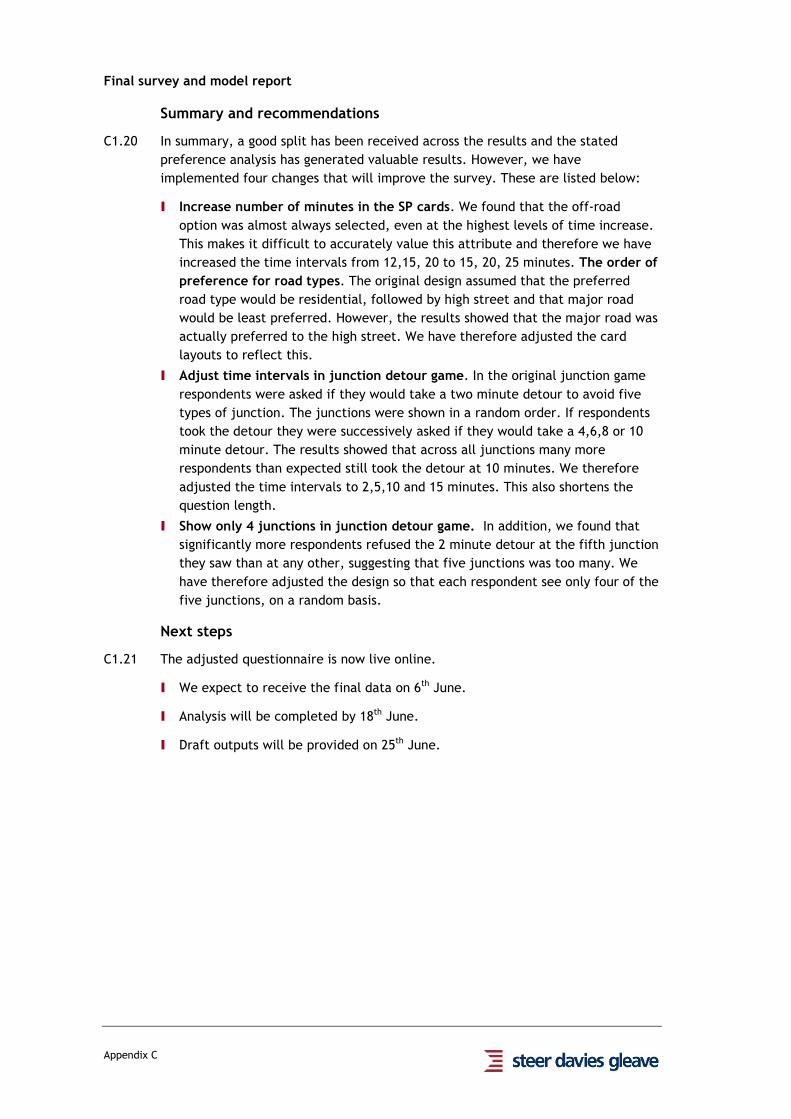
Final survey and model report
Appendix C
Summary and recommendations
C1.20 In summary, a good split has been received across the results and the stated
preference analysis has generated valuable results. However, we have
implemented four changes that will improve the survey. These are listed below:
I Increase number of minutes in the SP cards. We found that the off-road
option was almost always selected, even at the highest levels of time increase.
This makes it difficult to accurately value this attribute and therefore we have
increased the time intervals from 12,15, 20 to 15, 20, 25 minutes. The order of
preference for road types. The original design assumed that the preferred
road type would be residential, followed by high street and that major road
would be least preferred. However, the results showed that the major road was
actually preferred to the high street. We have therefore adjusted the card
layouts to reflect this.
I Adjust time intervals in junction detour game. In the original junction game
respondents were asked if they would take a two minute detour to avoid five
types of junction. The junctions were shown in a random order. If respondents
took the detour they were successively asked if they would take a 4,6,8 or 10
minute detour. The results showed that across all junctions many more
respondents than expected still took the detour at 10 minutes. We therefore
adjusted the time intervals to 2,5,10 and 15 minutes. This also shortens the
question length.
I Show only 4 junctions in junction detour game. In addition, we found that
significantly more respondents refused the 2 minute detour at the fifth junction
they saw than at any other, suggesting that five junctions was too many. We
have therefore adjusted the design so that each respondent see only four of the
five junctions, on a random basis.
Next steps
C1.21 The adjusted questionnaire is now live online.
I We expect to receive the final data on 6th June.
I Analysis will be completed by 18th June.
I Draft outputs will be provided on 25th June.

Final survey and model report
Appendix C
Appendix 1 – invite email for TfL sample
[Email Subject:]TfL cycling research – please complete our survey – £100 prize draw
Dear [name]
Please can we ask for your help with some research being conducted on behalf of Transport
for London? The research will be used to improve our understanding about what matters to
cyclists in London and to inform future planning for cycling across London.
Below you’ll see a link to an online questionnaire. Please click on this and answer the
survey that comes up. It will take about 15 minutes to complete, and the questions are
easy to answer.
All respondents will be entered into a Prize Draw to win £100.
[LINK HERE]
TfL have commissioned Research Now to carry out this survey. Research Now is a leading
market research agency, and the research is being conducted in strict accordance with the
Code of Conduct of the UK Market Research Society. All responses will remain confidential
and there will be no further unsolicited contact as a direct result of your participation in
this research. Your answers will be incorporated with those from many other respondents.
With many thanks in advance for your help
-------
The draw for the prize will take place on 3rd July 2012. There will be three winners, who will be
notified by email. Please email [email protected] if you have any questions
about this research, or have any problems with the survey.
About this email
This message was originated by: Research Now Ltd, 1th Floor, Elizabeth House, 39 York Road, London,
SE1 7NQ (“Research Now”) on behalf of Transport for London(“the Client”).
Neither Research Now nor the Client is responsible if this email was forwarded to you by a third party.
Research Now is processing your personal data as the data processor of the Client. If you have any
queries regarding the privacy agreement please contact the Client on the following email

Final survey and model report
Appendix C
Neither Research Now nor the Client accepts responsibility for software viruses and you should check
for viruses before opening any attachments.
You have received this email as you have provided your email address or have either consented to the
Client sending you direct marketing information by e-electronic communication (directly or via a third
party such as Research Now) or if an exemption to the Privacy and Electronic Communications (EC
Directive) Regulations 2003 permits the Client to send you the email.
To unsubscribe from receiving this mailing from the Client please click on the unsubscribe button
below. Please note that if you unsubscribe the only email you will receive from the Client in the
future will be confirmation of the cancellation of your agreement to receive marketing via email. As
this email is sent on behalf of the Client should you decide to unsubscribe you will only be terminating
your consent for the Client to send you electronic marketing information. Should you also be a
member of the Valued Opinions panel you will continue to receive information by email until you
unsubscribe from that service or terminate your membership of the panel.
Unsubscribe link

P:\Projects\224\8\17\01\Outputs\Reports\Final report CRC.docx
Control Sheet
CONTROL SHEET
Project/Proposal Name Cycle route choice
Document Title Final survey and model report
Client Contract/Project No. Click here to enter text.
SDG Project/Proposal No. 22481701
ISSUE HISTORY
Issue No. Date Details
REVIEW
Originator Ruth Salmon (SDG)
Other Contributors Chris Chinnock, Tony Duckenfield
Review by: Print Tony Duckenfield
Sign Tony Duckenfield (electronically)
DISTRIBUTION
Client: Transport for London
Steer Davies Gleave:
Related Documents