Currency Unions and Trade: How Large is the Treatment Effect? ∗ Torsten Persson Institute for International Economic Studies May 30, 2001 1 INTRODUCTION It has been conspicuously hard to empirically identify clear-cut effects of xed exchange rates and other monetary regimes on the real economy. 1 This paucity of empirical ndings has lead many academic economists as well as other ob- servers to the view that radical monetary reform such as the adoption of a common currency might have limited economic consequences. For example, it probably explains the common view that the EMU is rst and foremost a political rather than an economic project. A recent Economic Policy paper by Andy Rose challenges the conventional wisdom (Rose, 2000). He uses evidence from existing currency unions in the world economy to estimate the effects of a common currency on trade. According to his regression estimates, a currency union expands bilateral trade between two average member countries by a dazzling 200 percent or more. Given the novelty of the nding and the importance of the issues, these results have received considerable attention. Critics voiced a number of concerns about Roses methodology, questioning the accuracy of his ndings. Provoked by the critique, Rose (2000) conducted a large battery of robustness checks, however, showing that the central result holds up to the points raised by the critics. Recent work by Rose and van ∗ Paper presented at the Economic Policy panel meeting in Stockholm on April 6-7, 2001. I would like to thank members of the panel, as well as Robert Barro, Harry Flam, Patrick Honohan, Hide Ichimura, Per Pettersson, Andy Rose, David Str¤omberg and Lars Svensson for their comments. I am also grateful to Alessandra Bonglioli for research assistance and Christina L¤ onnblad for editorial assistance. The research was supported by a grant from FRIE. Stockholm University E-mail: [email protected] Web: http://www.iies.su.se/perssont/ 1 Baxter and Stockman (1989) is one of the rst systematic studies of the consequences for the real economy of different exchange rate regimes. See Frankel and Rose (1995) for an overview. 1

Welcome message from author
This document is posted to help you gain knowledge. Please leave a comment to let me know what you think about it! Share it to your friends and learn new things together.
Transcript
Currency Unions and Trade:
How Large is the Treatment Effect?∗
Torsten PerssonInstitute for International Economic Studies�
May 30, 2001
1 INTRODUCTION
It has been conspicuously hard to empirically identify clear-cut effects of Þxedexchange rates and other monetary regimes on the real economy.1 This paucityof empirical Þndings has lead many academic economists as well as other ob-servers to the view that radical monetary reform � such as the adoption of acommon currency � might have limited economic consequences. For example,it probably explains the common view that the EMU is �Þrst and foremost apolitical rather than an economic project�.A recent Economic Policy paper by Andy Rose challenges the conventional
wisdom (Rose, 2000). He uses evidence from existing currency unions in theworld economy to estimate the effects of a common currency on trade. Accordingto his regression estimates, a currency union expands bilateral trade between twoaverage member countries by a dazzling 200 percent or more. Given the noveltyof the Þnding and the importance of the issues, these results have receivedconsiderable attention.Critics voiced a number of concerns about Rose�s methodology, questioning
the accuracy of his Þndings. Provoked by the critique, Rose (2000) conducteda large battery of robustness checks, however, showing that the central resultholds up to the points raised by the critics. Recent work by Rose and van
∗Paper presented at the Economic Policy panel meeting in Stockholm on April 6-7, 2001.I would like to thank members of the panel, as well as Robert Barro, Harry Flam, PatrickHonohan, Hide Ichimura, Per Pettersson, Andy Rose, David Stromberg and Lars Svenssonfor their comments. I am also grateful to Alessandra BonÞglioli for research assistance andChristina Lonnblad for editorial assistance. The research was supported by a grant fromFRIE.
�Stockholm UniversityE-mail: [email protected]: http://www.iies.su.se/�perssont/
1Baxter and Stockman (1989) is one of the Þrst systematic studies of the consequencesfor the real economy of different exchange rate regimes. See Frankel and Rose (1995) for anoverview.
1
Wincoop (2001) goes beyond within-sample estimation to the more difficultquestion of out-of-sample prediction, investigating the hypothetical trade andwelfare effects of new currency unions with alternative country constellations.In this short paper, I take another look at Rose�s within-sample estimates of
the �treatment effect of currency unions on trade�, borrowing this language andsome methodology from the labor literature. I argue that these estimates mightbe seriously biased if the countries belonging to existing currency unions arenon-randomly selected and the relation from measured trading costs to tradeis non-linear; I also argue that such complications are likely to exist in reality.I thus suggest an alternative empirical strategy that is more robust to mis-speciÞcation than Rose�s linear regression strategy. More speciÞcally, I use sim-ple, non-parametric matching estimators that allow for systematic selection intocurrency unions as well as non-linear effects of trading costs on trade. Whilethese techniques were originally developed for medical applications, they arenow quickly making their way into the standard tool-box of labor economists.Applying them, I obtain considerably smaller treatment effects of a commoncurrency than the 200 plus percent obtained by Rose: my preferred point esti-mates range from 13 to 65 percent, but with large enough standard errors thatthey are not signiÞcantly different from zero.The next section explains the prospective problems with Rose�s empirical
strategy, Section 3 suggests an alternative matching approach, while Sections4-6 present my empirical results and discuss why they are so different from thoseobtained by Rose.
2 ROSE’S EMPIRICAL STRATEGY — WHAT’STHE PROBLEM?
Rose (2000) uses United Nations data on trade among close to 200 countries inÞve consecutive Þve-year periods from 1970, yielding more than 33,000 observa-tions of bilateral trade ßows. About 330 of these trading pairs share a commoncurrency. (See the original paper for a more detailed discission of the data andtheir sources.) As there are very few regime changes � countries entering orleaving common currencies � in these data, the treatment effect of a commoncurrency on trade must be identiÞed from the cross-sectional variation.SpeciÞcally, Rose estimates a linear gravity equation, where the log of bilat-
eral trade ßows in country pair i, ti, is regressed on a vector xi, including about10 different measures of trading costs in a wide sense. To this equation, headds an indicator variable ci which takes a value of 1 if pair i shares a commoncurrency and 0 if it does not. The coefficient γ on ci measures the treatmenteffect of a common currency. The default estimate (Table 2, column 6) of γ is1.21 with a relatively tight conÞdence band. As e1.21 − 1 ∼= 2.35, this suggestsan expansion of trade by 235%. Countries entering into common currenciesalso achieve bilateral exchange rate stability, which might further expand trade.Rose�s point of estimate of this effect is much smaller; evaluating it at the sample
2
mean of exchange rate volatility, adds about another 10% to bilateral trade.In response to doubtful or disbelieving readers of the paper � not least the
members of the Economic Policy panel � Rose subjects his basic estimates to alarge number of careful robustness checks, investigating their sensitivity to thesample, the speciÞcation, and the method of estimation. None of these checkssubstantially change the magnitude of the treatment effect, however.From these results it thus appears that the effect of a common currency on
trade is much larger than previously thought. If this is true, the trade implica-tions are indeed spectacular for countries contemplating unilateral dollarization,euroization or the formation of a new common currency.I want to argue that Rose�s empirical strategy could substantially bias his
estimates. Let me Þrst explain the general problem. Rose runs a variety of linearregressions of ti on xi and ci. Suppose now that the effect of either xi or ci on tidepends on the level of xi. In addition to this non-linearity, suppose that ci isnon-randomly selected such that it is systematically correlated with xi. Underthese conditions, a linear estimate of γ can be an unreliable estimate of thetreatment effect for two reasons. Existing currency unions (observations withci = 1) might have a large effect on trade due to their speciÞc characteristics(values of xi), which do not generalize to other country pairs with differentcharacteristics (different values of xi).2 Or, omitted non-linear terms in therelation between some component of xi and ti might be picked up by ci (as xi
and ci are correlated).3 In both cases, the estimate of the average treatment
effect is subject to selection bias. Note, however, that the prospective problemhere is neither selection on unobservables (omitted variables), nor non-randomselection of missing observations � problems that Rose does attempt to addresswith instrumental-variable and Heckit estimators, respectively. Rather, it is aninstance of selection on observables (i.e., of ci on xi).
4
Is the prospective speciÞcation bias more than a remote theoretical possi-bility in a long laundry list of imaginable statistical difficulties? I would like toargue that we have good � theoretical as well as empirical � reasons to believethat it might strike with particular force against Rose�s data and speciÞcation.Consider Þrst the relation between trading costs and trade. The work by
McCallum (1996) and others on the home-bias puzzle in trade strongly sug-gests that low trading costs can have massive effects on trade. Obstfeld andRogoff�s (2000) analysis of major puzzles in international macroeconomics also
2In this case � referred to as heterogeneous treatment effects in the labor literature � theestimate of the so-called average effect of treatment on the treated does not coincide with theaverage treatment effect (the expected effect on bilateral trade of a common currency on arandomly drawn country pair).
3In this case both the average treatment effect and the average effect of treatment on thetreated will be estimated with bias.
4Labor economists have compared different sources of bias when estimating treatmenteffects with non-experimental data, using the results obtained by controlled experiments as abenchmark. For example, in their study of the JTPA (a major U.S. job training program),Heckman, Ichimura and Todd (1997) Þnd that an unbalanced distribution of observablesamong treated and non-treated is a considerably more important source of bias than theconventional selection problem.
3

suggests a non-linear relation � on both theoretical and empirical grounds �as does the model of currency-union formation in the recent work of Alesinaand Barro (2000); see further below. Furthermore, we do not measure tradingcosts directly but only some of their proximate determinants (xi in the notationabove). Why on earth would the relation between these proxies and true tradingcosts be linear? For instance, sharing a common colonial history (and thus sim-ilar institutions) together with geographical proximity, or a common languagetogether with a regional trade agreement, might reduce trading costs betweentwo countries by more than the summed partial effects of these features.What about non-random selection? In one of the few positive models of
the adoption of common currencies, Alesina and Barro (2000) suggest that thebeneÞts of a common currency � as well as the trade effects thereof � are likelyto be particularly high if trading costs are low for other reasons. In terms ofour notation, this corresponds to a systematic link between xi and ci. A Þrstcursory look also suggests that such a correlation is present in Rose�s data set.5
Indeed, the correlation with ci is 0.2 or higher (in absolute value) for six out ofthe nine variables in xi (excluding exchange rate variability, which is zero whenci = 1, by deÞnition) (see Rose, 2000, Table A4) � 0.2 is a high number with thislarge amount of data. Another way of expressing the non-random selection, isto compare the means of the variables in xi across the country pairs with ci = 1and ci = 0. As Table 1 shows, pairs with a common currency are smaller,poorer, and geographically closer; they more often share a common language,common borders, a common free trade area, a common colonizer, and a commoncountry, and more often involve a previous colonial relationship. Formal testsresoundingly reject equality of means across groups for every variable in thetable. We may also note that common-currency country pairs have a slightlysmaller bilateral trade.In summary, the problem seems worth taking seriously.
3 AN ALTERNATIVE STRATEGY
How can we better cope with the possibility of selection on observables and,at the same time, avoid making strong assumptions about functional form?An empirical strategy with precisely these properties is the so-called matchingapproach for estimating treatment effects on the basis of observational (non-experimental) data. With their roots in medical research, matching methodsare becoming increasingly popular with labor economists, who use them for es-timating, say, the effect of training programs on income or employment. Asfar as I know, they have never been used in macroeconomics.6 Blundell andCosta Dias (2000) provide a useful and easily accessible introduction, whereasAngrist and Kreuger (1999), Heckman, Ichimura and Todd (1998), and Heck-
5All empirical estimates in the present paper are based on Rose�s original data set, which ismade available, in a very user-friendly way, at: http://haas.berkeley.edu/�arose/RecRes.htm
6Persson, Tabellini and Trebbi (2000) apply matching methods to estimate the effect ofalternative electoral rules on corruption.
4
man, Lalonde and Smith (1999) contain more technical discussions of matchingand its relation to other methods. These papers give references to the relevantstatistical literature.The basic idea in matching is to mimic a controlled (randomized) experi-
ment. In the present context, we thus want to design a control group amongthe country pairs not receiving the treatment of a common currency (ci = 0)with characteristics matching those that do receive treatment (ci = 1). Clearly,this requires an observable vector of covariates, yi. To obtain an unbiased mea-sure of the treatment effect, we can appeal to a property known as �conditional(mean) independence�, or �selection on observables (only)�. Assume that, con-ditional on the vector yi, the expected value of trade ti in the absence of acommon currency is the same for treated and untreated country pairs. Underthis assumption, it is legitimate to use a fabricated control group for estimatingan unobservable counterfactual: the bilateral trade we would (hypothetically)observe in the absence of treatment in those country pairs (actually) treatedwith a common currency. Now, the plausibility of this identifying assumptionclearly depends on what variables enter into yi. Given that we want to investi-gate the results in Rose�s paper, it is natural to choose yi = xi, i.e., to match onall the variables, except ci, that enter on the right-hand side in his default spec-iÞcation of the gravity equation.7 In this way, we directly address the source ofthe selection problem discussed in the previous section by removing the differentcomposition of xi in the country pairs with and without common currencies.With 10 variables in xi, and the differences across the two groups of country
pairs noted in Section 2, direct matching would be too data-hungry a method,however. Finding close matches for 252 treated observations would be impos-sible, even with 26,336 prospective controls (the numbers refer to the countrypairs for which there are no missing data). Some data reduction is required.Luckily, there exists a simple, yet powerful, way of reducing the dimensional-
ity of the matching problem. Under the conditional independence assumption,we can also match on a function of xi and, in particular, on the so-called propen-sity score, a result due to Rosenbaum and Rubin (1983, 1984). In the presentcontext, this score is the (estimated) probability of being treated with a commoncurrency (ci = 1) as a function of trading costs xi. A more balanced controlgroup is thus found by matching on the propensity score, which we label p(xi).Such matching can be done in a number of ways. Each way corresponds to adifferent estimate of the treatment effect, namely the (average) effect on ti ofhaving ci = 1 rather than ci = 0. Moreover, these estimates can be obtainednon-parametrically, i.e., without any assumption of a particular functional form:we can just compute the mean of ti across the treated and control groups.8
7Note that we are then effectively making the same identifying assumption as Rose. Iden-tifying � as he does � γ from the regression:
ti = βxi + γci + εi ,
requires εi to be uncorrelated with xi.8Deheija and Wahba (1999) apply propensity score estimation to estimate the treatment
effect of a training program on the same data set as in the well-known study by Lalonde
5
Our task ahead thus involves two steps of estimation: Þrst of the propensityscore, then of the treatment effect. The following two sections present the resultsfrom this two-step exercise.
4 THE PROPENSITY SCORE
I estimate the propensity score by running a linear logit regression of the treat-ment indicator ci on nine observable variables. Among the 10 variables enteringRose�s default speciÞcation, I leave out the measure of exchange rate volatility(see further below). But the remaining nine variables in xi � output, output percapita, distance, contiguity, common language, common free trade area, samenation, same colonizer, and colonial relationship � are all included. The resultsfrom the logit are reported in Table 2. Consistent with non-random selection,the trading costs are strong predictors of a common currency: eight out of ninevariables are signiÞcant at the 1% level or better. Most of the signs are in linewith expectations, namely lower trading costs raise the probability of a commoncurrency between the countries in the pair. An exception is that a free-tradearea renders a common currency less likely, thereby suggesting that free tradeareas and common currencies might be substitute arrangements for promotingbilateral trade between countries with low inherent trading costs. The Þt of thelogit appears decent, with a pseudo-R2 close to 0.5.It is important to point out, however, that the objective here is not to build
a statistical (let alone an economic or political) model explaining currency-unionmembership in the best possible way. For my purposes, it is not a problem ifsome variables systematically inßuencing memberships in currency unions, butnot trade, are missing in the estimation of the propensity score.9 In fact, a closeto perfect Þt of the logit would be destructive, as matching on p(xi) requiresthat we have both treated and untreated country pairs at similar levels of p(xi).This is why I exclude Rose�s measure of exchange rate volatility: including itwould allow me to explain ci = 1 with probability one. From the viewpointof identifying the treatment effect, additional variables should be added to thelogit if they systematically inßuence bilateral trade. But then, these additionalvariables should have been included in Rose�s default speciÞcation of the gravityequation in the Þrst place. If such omitted variables of the trade relation are alsocorrelated with the common-currency indicator, then I certainly have a problemwith selection on unobservables, but so has Rose.10
When estimating the treatment effect, I want to make sure that the treat-ment (ci = 1) and prospective control (ci = 0) groups are comparable; i.e., that
(1986). They show that matching on the propensity score substantially reduces bias due to anon-experimentally deÞned control group obtained from a set of individuals with very differentcharacteristics than the treated group.
9Variables correlated with ci but not with ti would, naturally, be good instruments for ci, ifwe were to address the alternative problem of omitted variables (selection on unobservables),mentioned at the end of Section 2.
10In terms of the regression in Footnote 7, such omitted variables would introduce a corre-lation between εi and ci, biasing the estimates of γ.
6
they share a common support for p(xi) (or xi). Among the 26,336 pairs with-out a common currency, 7,499 had an estimated propensity score lower thanthe lowest score among the treated pairs. These country pairs were thus dis-carded as non-comparable to any common-currency pair. There was no needfor discarding pairs at the upper end of the estimated propensity scores.Before proceeding to the matching, I also want to verify that conditioning
on p(xi) produces similar results as conditioning on the vector xi. That is, I askwhether the distribution of xi is similar across the treatment and prospectivecontrol groups, conditional on the propensity score. To answer that question,I Þrst rank the 18,837 observations on the common support according to theirestimated propensity scores. Following the procedure in Dehejia and Wahba(1999), I then group the observations into strata: the Þrst stratum includesobservations with the lowest estimated probability of having a common currency0 < p(·) < 0.1, the second those where 0.1 < p(·) < 0.25, whereas the third,fourth and Þfth strata each have a width of 0.25.Based on this grouping, I test for equality of means between the treated and
non-treated observations for each of the nine variables in xi within each stratum;recall that the hypothesis of common means was rejected for all nine variablesin the full sample. In the two uppermost strata, I reject common means (at the1 % level) only for one out of nine variables, and in the third and fourth stratafrom the top, I reject for two and four variables, respectively. Observationswith a probability below 0.1 of a common currency are more problematic: Ireject equal means for all variables except one. But when I reject, the meansare typically much closer than in the full sample. While the propensity scoreestimation does not work perfectly, it still allows me to design control groupswhose distribution of xi is much more balanced relative to the treated groupthan the full sample.I have also performed the same tests based on estimates of the propensity
score from a linear probit. The probit produced a relatively similar pattern ofpoint estimates as the logit, but yielded a less balanced distribution betweenthe treated group and the prospective controls.11
5 THE TREATMENT EFFECT
In this section, I estimate the treatment effect of a common currency with twodifferent non-parametric estimators. Detailed formulas for these estimators andtheir (approximated) standard errors are given in Persson, Tabellini and Trebbi(2000, Statistical Appendix).12 Here, I just describe their properties and reportthe results.
11Results from the probit, as well as the equality-of-means tests are available on my home-page: http://www.iies.su.se/�perssont/.
12The standard errors do not take into account the correlation across observations producedby individual countries entering into different country pairs. Neither do they take into ac-count the uncertainty in the estimated propensity score. To address these issues, it would bepreferable to calculate the standard errors by a bootstrap procedure.
7
The Þrst estimator is based on stratification and balances the treated andnon-treated observations group-wise, within the Þve strata deÞned in the previ-ous section. SpeciÞcally, it compares each common-currency (ci = 1) observationwith all the non-treated (ci = 0) observations in the same stratum for p(xi).Having computed the average difference in bilateral trade ti within each stra-tum, the stratiÞcation estimator forms a weighted average of these differences,weighing each stratum by its number of treated observations.The overlap between control and treatment observations varies across the
Þve strata. As expected, we get more treated observations relative to controlobservations as the estimated propensity score increases. But some overlap oftreatment and controls is present in every stratum. Thus, the lowermost bin(p < 0.1) includes 75 treated vs. 18,483 controls, the middle bin (0.25 < p <0.5), has 49 treated vs. 120 controls, whereas the uppermost bin (p > 0.75)contains 39 treated vs. 4 controls. A small overlap does not bias the estimate ofthe treatment effect, as long as the two groups are homogeneous enough in termsof the covariates in xi. But a low number of controls relative to treatments inthe higher strata raises the standard error of the estimate.The next estimator is based on nearest matching. Instead of utilizing the full
set of controls on the common support (as in stratiÞcation), I discard all but thenearest controls and use some controls more than once. Each treated (ci = 1)observation is now matched with only one non-treated (ci = 0) observation,namely the nearest match in terms of propensity score. This way, I obtain 252pairs, based on 252 treated observations and 181 controls. The nearest matchingestimator is just the average difference in bilateral trade ti across these pairs oftreated and control countries.The rationale for this estimator is to reduce the bias due to different co-
variates, by Þnding the nearest match in the control group for every treatedobservation. If a certain control is the nearest match for more than one treatedobservation, it is used more than once. While multiple use of certain controlsis desirable in terms of reducing bias, it gives less precise estimates, i.e., itincreases the standard error. Nearest matching often produces quite intuitive�twins�. Thus, many twins with high propensity scores involve two Caribbeancountry pairs, one where both belong to the East Caribbean Currency Area,another where they do not. For example, among the controls, Antigua andBarbados were about as likely (p = 0.748) to have a common currency in 1970as Grenada and St. Vincent in 1985 (p = 0.703). Similarly, many twins withintermediate propensity scores involve West African country pairs, one pair fullyin the CFA-zone, the other not: Cameron and Mali 1975 (p = 0.178), e.g., arepaired with Ivory Coast and Senegal 1970 (p = 0.178). An example at thelowermost end is the matching of US and El Salvador 1985 (p = 0.00052) withthe common-currency pair of USA and Panama 1970 (p = 0.00055).13 Natu-rally, there are also some non-intuitive matches. But a regression analysis onthe whole sample implicitly includes a much greater number of non-intuitive
13According to the estimated logit, the recent dollarization of El Salvador was thus asunexpected as the pre-existing dollarization of Panama,
8
comparisons.Table 3 reports the treatment effect of a common currency as estimated
with these two methods. These should be compared to Rose�s point estimate,implying an expansion of trade by 235%.14 The stratiÞcation estimator yields apoint estimate of 0.12 � an expansion of trade by a more modest 13%. With thenearest-matching estimator, the point estimate is 0.51, corresponding to a 66%expansion. But the standard errors of these estimates are about double those ofRose�s OLS estimate. If we take the nul hypothesis to be a zero effect on trade,the nearest-matching estimate only reaches borderline statistical signiÞcance,while the stratiÞcation estimate clearly does not. On the other hand, if the nulhypothesis is Rose�s estimate, both estimates are signiÞcantly smaller.Should we be concerned about the wider conÞdence bands? Not necessar-
ily. As already mentioned, the idea behind the non-parametric estimators isprecisely to trade off reduced bias due to speciÞcation error against less effi-ciency. In particular, more precise estimates might have to come at the price ofmore restrictive functional-form assumptions.Note that the two estimators rely on samples of very different size. In both
cases, the number of treatments are 252, which coincides with the number enter-ing in Rose�s regression estimates. While the nearest matching method exploitsa mere 181 controls, the stratiÞcation method relies on a control group whichis a hundred times larger. Thus, it is reassuring that the two methods producerelatively close estimates.15
6 WHERE’S THE RABBIT?
Why are my results so different from those of Rose (2000)? And do the dif-ferences indeed reßect the statistical problems suggested in Section 2: biasedestimations due to non-linearities in the relation from measured trading coststo trade and non-random selection into common currencies?One way of approaching these questions is obviously to extend the regression
analysis, searching for direct evidence of important non-linear terms, correlatedwith common currencies. This is easier said than done, however, because onecould imagine an inÞnite number of non-linear formulations over the ten vari-ables appearing in the basic speciÞcation of the gravity equation.Nevertheless, I have done some experimentation, in order to illustrate how a
bias might arise. I Þrst add some quadratic terms to Rose�s default speciÞcationas estimated on the full (22,948 observation) sample. Two parsimonious spec-
14Note that my non-parametric estimators cannot, by deÞnition, give a separate estimateof the effect on trade from the decline in exchange rate volatility. When comparing my resultswith Rose�s estimates, one should thus really add to the latter the effect of eliminated volatility,which (recall Section 1) is on the order of 10%.
15As mentioned in Section 4, I have also estimated the propensity score with a probit. Eventhough these estimates appeared to produce a less balanced control group, I used them toobtain alternative estimates of the treatment effect. The nearest matching and stratiÞcationestimates are � 27% and � 18%, respectively, both insigniÞcantly different from a zero (or amodestly positive) treatment effect.
9
iÞcations and the associated treatment effects are reported in Table 4 (whereagain Rose�s results have been added for ease of comparison). In column (1),I add interaction terms between, on the one hand, a common language and afree trade area (expected to raise bilateral trade) and, on the other hand, acommon colonial history and output (expected to ßatten the relation betweenoutput and trade). Coefficients on both these terms have the expected sign andare strongly signiÞcant. The estimated treatment effect drops, from 235% toabout 150%, but still preserves the same order of magnitude.In column (2), I instead add squared output to the default speciÞcation.
This produces a more substantial drop in the treatment effect, which is nowabout 97%, though still highly signiÞcant.16 What is going on here? Figure 1provides an illustration. The Þgure shows the partial relation between bilateraltrade and output in the full sample. More precisely, it plots output against theresiduals from a linear regression of ti on all variables in xi except output andci. Observations with ci = 0 are indicated by black dots, and those with ci = 1by ovals. The dashed line shows the estimated linear relation between bilateraltrade and output, when I only add output to the underlying regression. Becausemost of the circles lie above the dashed line, adding also the common-currencyindicator to the regression produces the large estimate of the treatment effectfound by Rose.But as the Þgure illustrates, the output-trade relation appears quite non-
linear; in particular, trade is larger than suggested by the estimated linearrelation both at low and high levels of output. This is veriÞed by the solid line,showing the estimated trade-output relation when output and output squaredare added to the regression underlying the Þgure.17 Because we Þnd a largernumber of common-currency observations below the solid line than below thedashed line, we get a lower estimate of the treatment effect in column (2).Moreover, as Table 1 showed and Figure 1 illustrates, ci = 1 observationsare more concentrated at low levels of output than ci = 0 observations. Thiscorrelation between output and the common currency indicator makes the latterpick up the omitted nonlinearity in Rose´s default speciÞcation, biasing upwardshis estimate of the treatment effect.The next two columns of Table 4 present further evidence obtained by
regression analysis on the matched sample deÞned by the nearest-neighbor pro-cedure in the previous section. As discussed above, this sample is more balancedbetween the treated and control groups when it comes to the distribution of co-variates. The sample is also more balanced in the number of observations withand without common currencies, meaning that the estimated relations betweentrade and the components of xi are not as dominated by the non common-
16Rose (2000) indeed adds squared output in one of the regressions (cf. the last columnin his Table 6a) and obtains a similar result. In fact, this is the lowest estimate of γ in thewhole paper, but Rose does not discuss it further.
17The layout of the Þgure might give the impression that the non-linearity derives onlyfrom the ci = 1 observations. This is not the case. When I run Rose�s default speciÞcation,dropping the ci dummy but adding squared output, on the full sample, the coefficients onoutput and squared output (std. errors in brackets) are: −1.09 (.092) and .278 (.0013). If Idrop the ci = 1 observations, I obtain the coefficients −0.93 (.082) and 0.254 (.0012).
10

currency pairs as they are in the full sample.18
Column (3) reports the results of running Rose�s default speciÞcation on thematched sample. Now, the point estimate of the treatment effect is down to0.52, corresponding to an expansion of trade by 66%. But the standard erroris large enough that it is not statistically signiÞcant at conventional levels (thep-value is 0.11). Furthermore, the coefficient on output drops from 0.80 to 0.59.As common-currency pairs are smaller, on average, this is consistent with theÞnding of a ßatter relation between output and trade at lower output levels.In column (4), I once again add squared output to the default speciÞcation.
The squared output term is still highly signiÞcant and the treatment effect is nowestimated to 45%, again insigniÞcantly different from zero (p-value 0.25). In-terestingly, this parametric estimate is right in between the two non-parametricestimates presented in the previous section.19
It should be borne in mind that the results presented in this section arereally just illustrations of how a bias might arise. Nevertheless, I believe theysupport my claim that non-random selection and heterogeneity might explain alarge share of the spectacular treatment effect found by Rose.
7 CONCLUSION
I have argued that Rose�s (2000) Þndings of a huge treatment effect of a com-mon currency on bilateral trade are likely to reßect systematic selection intocommon currencies of country pairs with peculiar characteristics. Using thesame data set as Rose, I have provided alternative non-parametric estimates ofthe treatment effect that should be more robust to selection and non-linearities.These estimates suggest a much more modest expansion of trade: the pointestimates are positive but associated with more uncertainty. I have also pro-vided parametric regression estimates which either allow for non-linearities inthe speciÞcation, or rely on a more balanced sample. The results are similarto the non-parametric estimates and give additional support for my proposedexplanation.My alternative estimates are certainly not the last word. Even if a common
currency expands trade only by, say, 40% � a number in the mid-range of myestimates � that is still a very sizeable effect. Additional work on this importantissue is badly needed. My Þndings suggest that such work would beneÞt frommodeling � theoretically and empirically � the selection into common currenciesjointly with the effect of those currencies on trade or other variables.
1823 of the 433 observations deÞned by the matching in the previous section must be dis-carded for lack of data on exchange rate volatility.
19Repeating the same exercise on a matched sample obtained from the probit-generatedpropensity score, produces estimates very similar to those reported in columns (3) and (4).
11
REFERENCES
Alesina, A. and R. Barro (2000), �Currency Unions�, NBER Working Paper,No. 7927.
Angrist, J. and A. Kreuger (1999), �Empirical Strategies in Labor Economics�,in Ashenfelter, O. and D. Card (eds.), Handbook of Labor Economics, VolIIIC, North-Holland.
Baxter, M. and A. Stockman (1989), �Business Cycles and the Exchange-RateSystem�, Journal of Monetary Economics 23: 377-400.
Blundell, R. and M. Costa Dias (2000), “Evaluation Methods for Non-ExperimentalData,� mimeo, University College London.
Dehejia, R., and S. Wahba (1999), “Causal Effects in Non-Experimental Stud-ies: Re-evaluating the Evaluation of Training Programs,� Journal of theAmerican Statistical Association 94: 1053-1062.
Frankel, J and A. Rose (1995), �Empirical Research on Nominal ExchangeRates�, Chapter 33 in Grossman, G. and K. Rogoff (eds.), Handbook ofInternational Economics Vol III, North-Holland.
Heckman, J., H. Ichimura, and P. Todd (1997), “Matching as an Economet-ric Evaluation Estimator: Evidence from Evaluating a Job Training Pro-gram�, Review of Economic Studies 64: 605-654.
Heckman, J., H. Ichimura, and P. Todd (1998), “Matching as an EconometricEvaluation Estimator�, Review of Economic Studies 65: 261-294.
Heckman, J., R. Lalonde, and J. Smith (1999), �The Economics and Econo-metrics of Active Labor Market Programs�, in Ashenfelter, O. and D.Card (eds.), Handbook of Labor Economics, Vol IIIC, North-Holland.
Lalonde, R. (1986), �Evaluating the Econometric Evaluations of Training Pro-grams with Experimental Data�, American Economic Review 76: 604-620.
Mc Callum, J. (1996), �National Borders Matter: Canada-U.S. Regional TradePatterns, American Economic Review 85: 615-623.
Obstfeld, M. and K. Rogoff (2000), �The Six Major Puzzles in InternationalMacroeconomics: Is There a Common Cause?�, NBER Working Paper,No. 7777.
Persson, T., G. Tabellini and F. Trebbi (2000), “Electoral Rules and Corrup-tion�, mimeo, Institute for International Economic Studies.
Rose, A. (2000), �One Money, One Market: The Effect of Common Currencieson Trade�, Economic Policy 30: 7-46.
12
Rose, A. and E. van Wincoop (2001), �National Money as a Barrier to Trade:The Real Case for Currency Union�, forthcoming in American EconomicReview, Papers and Proceedings.
Rosenbaum, P. and D. Rubin (1983), “The Central Role of the PropensityScore in Observational Studies for Causal Effects,� Biometrika 70: 41-55.
Rosenbaum, P. and D. Rubin (1984), “Reducing Bias in Observational StudiesUsing SubclassiÞcation on the Propensity Score,� Journal of the AmericanStatistical Association 79: 516-524.
13

Table 1Distribution of covariates
Non common-currency pairs Common-currency pairs
MaxVariable Obs Mean Std.Dev Min Max Obs Mean Std.Dev Min
Output 26356 34.428 2.679 20.026 43.526 252 28.866 3.964 20.326 37.991
Output/per capita 26356 16.238 1.366 11.728 20.805 252 15.248 1.641 12.280 19.355
Distance 26356 8.201 0.793 3.991 9.422 252 6.469 1.387 2.967 9.258
Contiguity 26356 0.025 0.155 0 1 252 0.111 0.315 0 1
Language 26356 0.136 0.343 0 1 252 0.806 0.397 0 1
Free trade area 26356 0.017 0.131 0 1 252 0.298 0.458 0 1
Same country 26356 0.001 0.034 0 1 252 0.143 0.351 0 1
Same colonizer 26356 0.081 0.273 0 1 252 0.710 0.455 0 1
Colonial relation 26356 0.013 0.115 0 1 252 0.028 0.165 0 1
Trade 26356 9.413 3.307 0.132 19.367 252 8.609 2.996 1.742 16.872
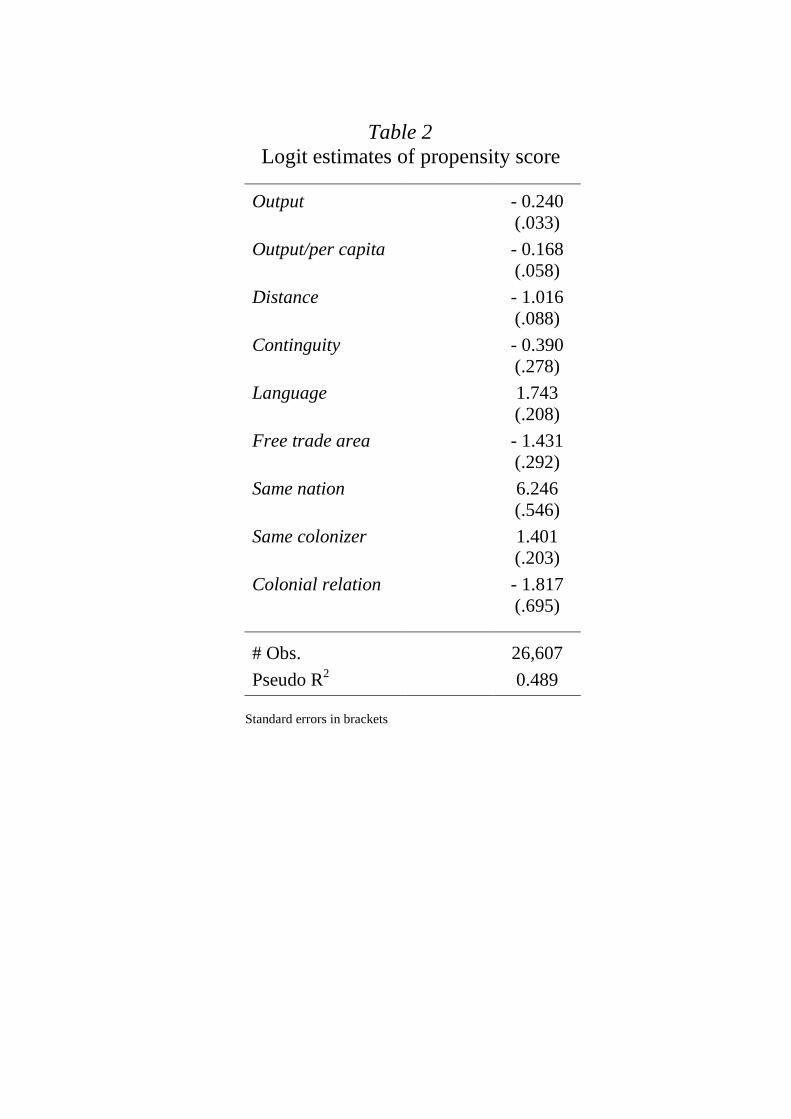
Table 2 Logit estimates of propensity score
Output - 0.240(.033)
Output/per capita - 0.168(.058)
Distance - 1.016(.088)
Continguity - 0.390(.278)
Language 1.743(.208)
Free trade area - 1.431(.292)
Same nation 6.246(.546)
Same colonizer 1.401(.203)
Colonial relation - 1.817(.695)
# Obs. 26,607Pseudo R2 0.489
Standard errors in brackets

Table 3Non-parametric estimates of treatment effect
Rose Stratification Nearest Matching
Currencyunion
1.221(.142)
0.123(.254)
0.506(.257)
% expansionof trade
235 13 66
# Obs. 22,948 18,837 433Treated 252 252 252Controls 22,696 18,585 181
Standard errors in brackets

Table 4Regression estimates of treatment effect
Rose (1) (2) (3) (4)
Currencyunion
1.221(.142)
0.927(.150)
0.685(.147)
0.519(.320)
0.370(.320)
% expansionof trade 235 150 97 66 44
Output 0.803(.006)
0.819(.006)
- 0.868(.086)
0.586(.075)
- 1.009(0.624)
Free trade area ×Language
0.506(.158)
Same colonizer ×Output
- 0.138(.020)
Output × Output 0.024(.001)
0.027(.009)
# Obs. 22,948 22,948 22,948 410 410R2 0.629 0.630 0.636 0.525 0.544
Robust standard errors in brackets Columns (1) and (2) estimated by OLS, columns (3) and (4) by WLS (observations among controls are weighted by the number of times they are used in matching).

ln T
rade
(res
idua
ls)
ln Output20.0256 43.5263
-10.5777
10.7016
Figure 1
Bilateral trade and output
Related Documents