CULTURAL INDICATORS FOR NEW ZEALAND Tohu Ahurea mō Aotearoa

Welcome message from author
This document is posted to help you gain knowledge. Please leave a comment to let me know what you think about it! Share it to your friends and learn new things together.
Transcript

CULTURAL INDICATORS FOR NEW ZEALANDTohu Ahurea mō Aotearoa

CULTURAL INDICATORS FOR NEW ZEALANDTohu Ahurea mō Aotearoa
2009
aaron meeking
Text Box
Published in June 2009 by Ministry for Culture and Heritage Te Manatū Taonga Wellington, New Zealand ISBN 978-0-478-18466-2

Cultural Indicators for New Zealand | Preface
Cultural Indicators for New Zealand 2009 is the latest product of the Ministry for Culture and Heritage’s Cultural Statistics Programme, and another important step in making more information about cultural activity in New Zealand available to the public.
The indicator set consists of twenty-four indicators, and is designed to monitor trends in the contribution of cultural activity to New Zealand society and its economy. Since the first indicators report was published in July 2006, the Ministry has been working actively to expand the number of indicators for which information is available. In this, the second edition of Cultural Indicators, the number of indicators now ‘populated’ with data has increased to nineteen, up from fourteen in the earlier report. Many of them now also have additional time-series data included.
The indicators remain arranged within a framework of five theme areas, which broadly reflect key development goals for cultural activity in New Zealand. As the Cultural Statistics Programme develops, and as the priorities for the cultural sector itself change, new indicators may be introduced.
This new edition of the Cultural Indicators report represents an important expansion of the range of indicator information available about cultural activities. It is my hope that the report will be used widely within the cultural sector, and be of interest and value to those who take an interest in cultural activity in New Zealand.
Lewis Holden
Chief Executive
Ministry for Culture and Heritage
PREFACE InFoRmAtIon And ACknowlEdgEmEnts
This report is part of the Cultural Statistics Programme operated by the Ministry for Culture and Heritage.
The Ministry wishes to acknowledge the contribution made to the report by the Business, Financial & Structural Statistics, Social Conditions, and Standard of Living units of Statistics New Zealand, which provided data, analysis, and follow-up assistance.
The Ministry acknowledges also the contribution of the New Zealand Historic Places Trust, and in particular Robert McClean, for his assistance with the data on heritage protection.
Substantial research and drafting was undertaken by Patrick Ongley, along with Ministry for Culture and Heritage staff.
For further information on the statistics in this report, or on other reports produced by the Ministry for Culture and Heritage as part of the Cultural Statistics Programme, please contact:
lIAbIlIty stAtEmEnt
The Ministry for Culture and Heritage gives no warranty that the information or data supplied in this report is error free. All care and diligence has been used, however, in processing, analysing and extracting information. The Ministry for Culture and Heritage will not be liable for any loss or damage suffered by customers consequent upon the use, directly or indirectly, of information in this report.
REPRoduCtIon oF mAtERIAl
Any table or other material published in this report may be reproduced and published without further licence, provided that it does not purport to be published under government authority and that acknowledgement is made of this source.

Page 2 Page 3Cultural Indicators for New Zealand
ContEnts
Introduction
Theme 1: EngagementDiscussionIndicator 1a: Cultural employmentIndicator 1b: Employment in creative occupationsIndicator 1c: Median incomes from creative occupationsIndicator 1d: Cultural experiencesIndicator 1e: Barriers to cultural experiencesIndicator 1f: Household spending on cultural itemsIndicator 1g: Heritage protectionIndicator 1h: Access to arts, culture and heritage activities and eventsUnpopulated Engagement indicators
Theme 2: Cultural IdentityDiscussionIndicator 2a: Speakers of te reo MāoriIndicator 2b: Local Content on televisionIndicator 2c: Māori TV ratingsIndicator 2d: The importance of culture to national identityIndicator 2e: New Zealand events
Theme 3: DiversityDiscussionIndicator 3a: Cultural grants to minority ethnic groupsIndicator 3b: Attendance at and participation in ethnic cultural activitiesIndicator 3c: Minority culture activities
Theme 4: Social CohesionDiscussionUnpopulated Social Cohesion indicators
Theme 5: Economic DevelopmentDiscussionIndicator 5a: Income of the cultural industriesIndicator 5b: Value-added contributed by the creative industriesIndicator 5c: The creative industries’ proportion of total industry value-added
Summary
Conclusion
Definitions and Notes
Appendix A: Cultural and Creative OccupationsAppendix B: Cultural IndustriesAppendix C: Household Economic Survey Cultural CategoriesAppendix D: Lottery Grants Board grantsAppendix E: Heritage Protection
3
6671421262933353740
41414246515256
5858596265
676767
6969707476
78
82
83
8587899293
Introduction | Cultural Indicators for New Zealand
New Zealanders have long recognised the important role that culture plays in the life of the nation. Confidence in that culture, an appreciation of its unique aspects, and a strong sense of cultural identity contribute positively to employment, economic growth, social cohesion, the acceptance and encouragement of diversity, and creative thinking in a range of fields. Furthermore, the cultural aspects of development sit alongside the economic, social and environmental dimensions of sustainability. Growth and development in the cultural sector has intrinsic benefits in itself, but also positive social and economic side effects.
PuRPosE oF thE REPoRt
Government involves itself in the cultural sector for many reasons. These include ensuring the ongoing stability of key cultural organisations, which in turn ensures that access to, and participation in, cultural activity can be maintained.
Decision making about the long-term development of the cultural sector benefits considerably from the availability of high-quality and regular statistical information about its performance, its size, and its contribution to the economic and social well-being of New Zealand.
This report presents a set of cultural indicators. Indicators are high-level, summary measures of key issues or phenomena that are used to monitor positive or negative changes over time. The evaluative nature of indicators distinguishes them from the descriptive nature of statistics. One of the key purposes of indicators is to reduce the large volume of statistical information available to a small number of key measures that allow trends to be monitored.
The aims of this report are to:
provide high-level measures of the effectiveness of government policy interventions in the cultural sector -enable linkages to be made with indicators in other sectors of the economy -provide measures of the contribution of cultural activity to the social, environmental and economic well-being -of New Zealanderscontribute to the quality of information available to government and key decision makers, as well -as to the sector itselfprovide a benchmark against the ‘status’ of cultural activity in New Zealand which can be monitored over time -contribute to meaningful debate about the role, value and function of culture. -
The continuing development of these indicators ensures that debates about the cultural sector’s value and contribution to New Zealand society can take place in the context of greater knowledge and understanding than at present. They also allow the ‘health’ of the sector to be monitored over time.
thE CultuRAl stAtIstICs PRogRAmmE
The development of a set of cultural indicators, to provide high-level measures about the state of cultural activity in New Zealand, was identified as a priority for the Ministry for Culture and Heritage’s Cultural Statistics Programme.
This Programme was established in 1993 by the Ministry for Culture and Heritage and Statistics New Zealand. Its purpose is to provide high-quality statistical data on the cultural sector, for use by policymakers in central and local government, cultural-sector agencies, organisations, academics, and other interested parties.
Since 1995, the Programme has made available a range of useful data, and has allowed the establishment of some benchmarks in order to track the economic and social contribution of the cultural sector, and track key trends over time.
IntRoduCtIon

Page 4 Page 5Cultural Indicators for New Zealand | Introduction
The Programme is based on the New Zealand Framework for Cultural Statistics, which establishes a standardised way of organising the collection and reporting of data about the cultural sector. This framework classifies cultural activity in New Zealand into categories. Nine categories of the framework have been developed:
Taonga Tuku Iho -Heritage -Libraries -Literature -Performing Arts -Visual Arts -Film and Video -Broadcasting -Community and Government Activities. -
These categories form the foundation on which all work in the Cultural Statistics Programme, including the Cultural Indicators Project, has been developed.1
stRuCtuRE oF thE REPoRt
In order to structure the development of cultural indicators a number of theme areas were proposed. The five themes are:
engagement -cultural identity -diversity -social cohesion -economic development. -
Each theme has within it a number of desired outcomes. The indicators related to each theme have been designed to provide insight into the extent to which these outcomes are being achieved. A total of ten outcomes have been identified, as set out in the table below. The table also shows which of the populated indicators relate to each outcome. Indicators may contribute to our understanding of more than one outcome.
Outcomes Framework for Cultural Indicators
thEmEs outComEs RElAtEd IndICAtoRs
ENGAGEMENTEngagement: New Zealanders engage in arts, culture and heritage events and activities as participants, consumers, creators or providers.
1a, 1b, 1d, 1f, 2c
Environment: There is an environment that supports creativity and innovation for all cultures.
1b, 1c, 3c
Access: All New Zealanders have access to arts, culture and heritage events and activities.
1d, 1e, 1g, 1h
Value: Arts, culture and heritage activities are valued by New Zealanders.
1a, 1b, 1d, 1f, 1g
thEmEs outComEs RElAtEd IndICAtoRs
CULTURAL IDENTITYIdentity: New Zealanders have a strong sense of identity, based on their distinct heritage and cultures.
1g, 2a, 2b, 2c, 2d, 2e
Strength: The cultures of Māori and Pākehā are strong and living, with both cultures being valued by New Zealanders.
2a, 2b, 2c, 2e
DIVERSITYDiversity: New Zealand’s growing cultural diversity is freely expressed, respected and valued.
3a, 3b, 3c
SOCIAL COHESIONEnhancement: Community relationships are enhanced by involvement in arts, culture and heritage events and activities.
No currently populated indicators
Cohesion: New Zealanders’ shared cultural identity fosters a tolerant, inclusive society.
No currently populated indicators
ECONOMIC DEVELOPMENTDevelopment: Arts, culture and heritage make a growing contribution to the economy.
1a, 5a, 5b, 5c
The cultural indicators presented in this report are designed to measure the extent to which the cultural sector is moving towards, or away from, the high-level outcomes – that is, they indicate whether there is an improvement or deterioration in the well-being of the cultural sector.
The indicators themselves are presented in groups corresponding to the themes set out above. In the text, the rationale for selecting each indicator is outlined, as are any assumptions that have been used, the data sources, and the headline trend information. Where possible, there is a further breakdown of data to provide more detailed information for a range of variables such as gender, ethnicity, age and income.
The report identifies a number of indicators that are considered to provide suitable evaluative measures of progress towards the outcomes, but which cannot be ‘populated’ with information currently, as there are no existing data sources. These indicators have been grouped together at the end of each chapter and earmarked for future development. They will be populated as resources allow.
The degree to which outcomes are being achieved cannot always be measured directly and it may be necessary to use ‘proxy’ indicators. For example, indicator 1b is intended to ‘measure’ the outcome “There is an environment that supports creativity and innovation for all cultures.” It does not do so, however, directly. Rather, the assumption underlying this indicator is that if the environment is supportive of creative endeavours then more people will be employed in the sector.
In many cases, the information available simply does not allow direct measures of the extent of progress towards outcomes. There is also a range of complex influences that combine to determine trends in the cultural sector. Any assessment of the achievement of outcomes cannot necessarily be directly attributed to changes or trends in indicators and should be considered as ‘indicative’ only. It is hoped the indicators that have been identified and presented here will lead to greater understanding of the performance of the cultural sector.
At this stage, international comparisons are not possible. When the first edition of this report was published in 2006, it was one of the first comprehensive national attempts to produce such a set of indicators in the world. Since that time, significant new work has been undertaken by other countries, and by international organisations such as UNESCO, towards establishing frameworks for internationally comparable cultural indicators. The Ministry for Culture and Heritage is monitoring developments in other countries and with other international indicator frameworks. This may result in changes being made to the New Zealand indicator set in future, in order to make international comparisons possible.
Introduction | Cultural Indicators for New Zealand
TABLE 1
1 The framework can be found on Statistics New Zealand’s website at www.stats.govt.nz/analytical-reports/new-zealand-framework-for-cultural-statistics.htm.
Page 6 Page 7Cultural Indicators for New Zealand | Engagement
Theme 1: EngagementdIsCussIon
Engagement in cultural activities as a creator, producer, consumer, or participant contributes to the general well-being of New Zealanders and has a number of facets:
Participating - in cultural events and activities, and consuming cultural goods and services, creates income for creative workers and contributes to the productivity of the nation. Maintaining and improving - the state of arts, culture and heritage resources ensures their continued use and enjoyment by current and future generations. Developing - a sound administrative infrastructure ensures that creative workers function in a supportive, efficient and effective business environment. Improving - access to cultural events and activities for all New Zealanders, regardless of location or income levels, helps create a fair and equitable society.
IndICAtoRs
Indicator 1a: Cultural employment -Indicator 1b: Employment in creative occupations -Indicator 1c: Median incomes from creative occupations -Indicator 1d: Cultural experiences -Indicator 1e: Barriers to cultural experiences -Indicator 1f: Household spending on cultural items -Indicator 1g: Heritage protection -Indicator 1h: Access to arts, culture and heritage activities and events -
Engagement: Indicator 1a | Cultural Indicators for New Zealand
dEFInItIon
The number of people in cultural employment as a percentage of total employment.
RAtIonAlE
The proportion of workers who are in cultural employment provides an indication of the extent to which the current social and economic environment supports cultural activities.
In summary, for the purposes of this indicator, cultural employment includes:
cultural occupations in cultural industries -cultural occupations in non-cultural industries -non-cultural and unspecified occupations in cultural industries. -
Cultural occupation is a broader term than creative occupation and includes workers such as ministers of religion, librarians and early childhood teachers, as well as creative workers (see appendix A for more detail). In addition, some non-cultural workers are employed in cultural industries – for example, accountants and administrators. These administrative roles are intrinsic and specific to the functioning of the cultural sector, and so they are counted as cultural employment.
dAtA souRCE
Statistics New Zealand: Censuses of Population and Dwellings.
It should be noted that the census data relates to people’s main job only, so those for whom cultural employment is a second job will not be recorded in these figures.
CuRREnt lEvEl And tREnds
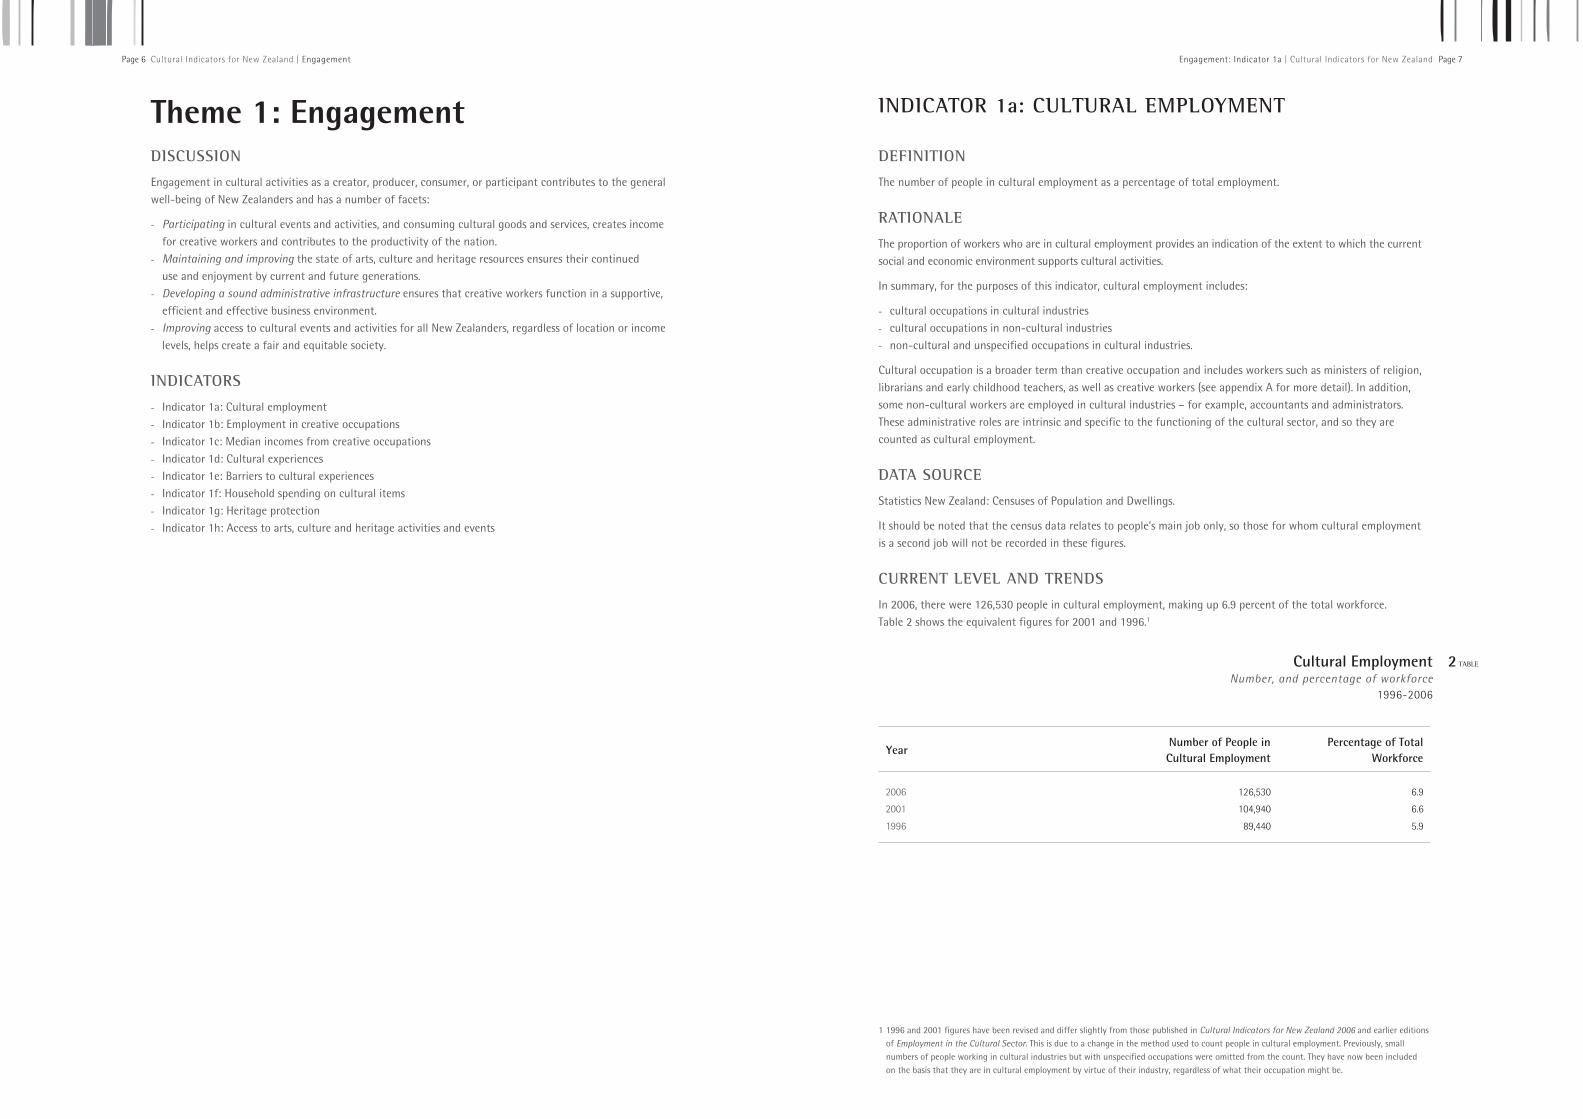
In 2006, there were 126,530 people in cultural employment, making up 6.9 percent of the total workforce. Table 2 shows the equivalent figures for 2001 and 1996.1
Cultural EmploymentNumber, and percentage of workforce
1996-2006
YearNumber of People in Cultural Employment
Percentage of Total Workforce
2006 126,530 6.9
2001 104,940 6.6
1996 89,440 5.9
1 1996 and 2001 figures have been revised and differ slightly from those published in Cultural Indicators for New Zealand 2006 and earlier editions of Employment in the Cultural Sector. This is due to a change in the method used to count people in cultural employment. Previously, small numbers of people working in cultural industries but with unspecified occupations were omitted from the count. They have now been included on the basis that they are in cultural employment by virtue of their industry, regardless of what their occupation might be.
IndICAtoR 1a: CultuRAl EmPloymEnt
2 TABLE

Page 8 Page 9
Cultural EmploymentNumbers Employed
1996–2006
A relatively high proportion of people in cultural employment work part-time (less than 30 hours a week). Thirty percent of the cultural workforce were employed part-time in 2006, down slightly from 31 percent in 2001, but considerably higher than the 23 percent of the total workforce who worked part-time. Part-timers accounted for 23 percent of the growth in cultural employment and 22 percent of the growth in total employment between 2001 and 2006.
Table 3 shows the ten cultural occupations and industries which experienced the greatest increases in numbers employed between 2001 and 2006. A major component of the increase in cultural employment has been in early childhood education, which falls within the community and government activities category of the Framework for Cultural Statistics. Early childhood and kohanga reo teachers accounted for 30 percent of the growth in cultural occupations, while pre-school education provided 20 percent of the growth in cultural industries. Other cultural occupations to experience growth of over 1,000 people were graphic designers; architects; and sculptors, painters and related artists. Cultural industries that experienced comparable growth included architectural services, religious organisations and interest groups. The majority of cultural occupations and industries grew at a faster rate than the growth in total employment between 2001 and 2006.
0
1
2
3
4
5
6
7
8
Cultural occupations Cultural industries Total cultural employment
199620012006
Cultural Indicators for New Zealand | Engagement: Indicator 1a
FIgURE 1
0
10
20
30
40
50
60
Cultural occupations in cultural industries Cultural occupations in non-culturalindustries
Non-cultural occupations in culturalindustries
199620012006
2 FIgURE
Engagement: Indicator 1a | Cultural Indicators for New Zealand
Figure 1 shows that both cultural occupations and cultural industries2 continued to increase their share of the workforce between 2001 and 2006, the former from 3.3 to 3.7 percent of all employment and the latter from 4.8 to 5.0 percent. Although these may appear relatively small proportions, the cultural workforce grew at a faster rate than the total workforce - 21 percent compared with 15 percent.
Figure 2 shows the components of cultural employment from 1996 to 2006. In each year, cultural occupations accounted for just over half of all cultural employment, with non-cultural occupations in cultural industries making up the remainder. The majority of people in cultural occupations were also working in cultural industries. Employment in this category grew by 6,940 between 2001 and 2006, which was slightly less than the growth in cultural occupations in non-cultural industries (7,230) and in non-cultural occupations in cultural industries (7,180).
Cultural EmploymentAs a percentage of total employment1996–2006
2 See Appendices A and B for complete definitions of these terms.

Page 10 Page 11Cultural Indicators for New Zealand | Engagement: Indicator 1a
Growth in Cultural EmploymentMain occupations and industries2001–2006
CHANGE
2001 2006 Number Percent
OCCUPATION
Early childhood teacher and kōhanga reo teacher 10,377 14,706 4,329 41.7
Graphic designer 4,224 5,817 1,593 37.7
Architect 2,028 3,588 1,560 76.9
Sculptor, painter and related artist 2,667 3,825 1,158 43.4
Industrial designer and interior designer 1,920 2,733 813 42.3
Resource management planner 936 1,629 693 74.0
Artistic director 984 1,602 618 62.8
Editor 1,254 1,674 420 33.5
Photographer 1,422 1,770 348 24.5
Fashion designer 588 921 333 56.6
Other cultural occupations 27,717 30,162 2,445 8.8
All cultural occupations 54,123 68,427 14,304 26.4
INDUSTRY
Pre-school education 8,604 11,496 2,892 33.6
Architectural services 4,932 7,074 2,142 43.4
Religious organisations 4,956 6,726 1,770 35.7
Interest groups not elsewhere classified1 8,877 9,996 1,119 12.6
Advertising services 4,587 5,568 981 21.4
Creative arts 2,442 3,369 927 38.0
Film and video production 3,567 4,485 918 25.7
Libraries 3,144 3,912 768 24.4
Commercial art and display services 4,743 5,355 612 12.9
Museums 1,650 2,238 588 35.6
Other cultural industries 31,356 32,865 1,509 4.8
Total 78,858 93,084 14,226 18.0
1 Interest groups nec (not elsewhere classified) includes associations, clubs or organisations for the promotion of community interests. It also includes units of political parties.
Note: columns may not total exactly due to random rounding of source data.
TABLE 3
0
2
4
6
8
10
Male Female
1996
2001
2006
sub-PoPulAtIon dIFFEREnCEs
SexWomen workers are more likely than men to be in cultural employment. Figure 3 shows that almost 9 percent of employed women were in cultural occupations or industries in 2006, compared with just over 5 percent of employed men. While the proportion of both males and females in cultural employment has been increasing since 1996, the rate of increase has been faster for women than men. Women made up 61 percent of workers in cultural employment in 2006, compared with 59 percent in 2001 and 58 percent in 1996.
Workers in Cultural EmploymentBy sex
1996–2006
In the cultural workforce, as in other sectors, women are far more likely than men to work part-time. In 2006, 37 percent of women in cultural employment worked fewer than 30 hours a week, compared with 19 percent of men. For women, this was slightly above the national figure of 35 percent, while for men, it was considerably higher than the national figure of 12 percent. The proportion of part-timers in the cultural workforce fell slightly for both sexes between 2001 and 2006.
In 2006, women outnumbered men in 20 of the 42 cultural occupations. Their representation was highest among early childhood and kohanga reo teachers, librarians and library assistants, dancing teachers and choreographers, and fashion designers – accounting for at least eight out of every ten workers in these jobs. Their representation was lowest among musical instrument makers or repairers and tuners, sound recording equipment controllers, cinema projectionists, camera operators and signwriters – accounting for less than two out of every ten people in these occupations.
In the same year, women outnumbered men in 17 of the 26 cultural industries. They were most strongly represented in pre-school education, libraries, newspaper and book and stationery retailing, interest groups, and book and magazine wholesaling – providing at least two-thirds of workers in these industries. On the other hand, they had a relatively low representation in sound recording studios, architectural services, film and video production, and commercial art and display services, where they provided fewer than five out of every ten workers.
3 FIgURE
Engagement: Indicator 1a | Cultural Indicators for New Zealand

Page 12 Page 13
0
2
4
6
8
10
15-19 20-24 25-29 30-34 35-39 40-44 45-49 50-54 55-59 60-65 65+
1996
2001
2006
Cultural Indicators for New Zealand | Engagement: Indicator 1a
AgeThere is some variation in levels of cultural employment by age. As Figure 4 shows, the workers most likely to be in cultural employment are those aged 65 and over, of whom 8.5 percent were in cultural occupations or industries in 2006. However, as this is a group with a low level of labour force participation, they made up only 4 percent of the cultural workforce. Levels of cultural employment were also relatively high among people in their 20s and 30s, with around 8 percent of workers aged 25-29 and 30-34 engaged in cultural jobs in 2006, along with around 7 percent of those aged 20–24 and 35–39. Young people aged 15–19 had the lowest representation in cultural employment at just over 5 percent. This age group along with those aged 60 and over were the only groups to experience falls in the proportion of workers in cultural employment between 2001 and 2006.
Workers in Cultural EmploymentBy age1996–2006
EthnicityThe likelihood of people being in cultural employment also varies by ethnicity. As Figure 5 shows, the highest rates of cultural employment in 2006 were among those of European ethnicity (7.1 percent) and those in the ‘other’ ethnic group category which includes people of Middle Eastern, Latin American and African ethnicities (7.2 percent). While cultural employment has been increasing among Europeans since 1996, it has been decreasing among those in the ‘other’ category. Māori had the next highest rate of cultural employment in 2006 at 6.4 percent, the same level as in 2001. Pacific and Asian people had the lowest rates of cultural employment at 5.9 percent but the rates for both groups have been increasing since 1996.
In terms of its ethnic composition, the cultural workforce reflects the makeup of the New Zealand workforce as a whole and is overwhelmingly European. In 2006, 85 percent of people in cultural employment belonged to European ethnic groups, 10 percent were Māori, 7 percent were Asian, 4 percent were Pacific peoples and less than 1 percent were from other ethnic groups.3 By comparison with the total New Zealand workforce, people in cultural employment were in fact slightly more likely to be European and slightly less likely to be of Māori, Pacific or Asian ethnicity.
3 These figures add to more than 100 percent because people can belong to more than one ethnic group and are counted in each group they specify.
FIgURE 4
0
1
2
3
4
5
6
7
8
9
European Maori Pacific peoples Asian Other
1996
2001
2006
5 FIgUREWorkers in Cultural EmploymentBy ethnicity
1996–2006
Note: People giving their ethnicity as New Zealander are included in the European category.
Engagement: Indicator 1a | Cultural Indicators for New Zealand

Page 14 Page 15Cultural Indicators for New Zealand | Engagement: Indicator 1b
IndICAtoR 1b: EmPloymEnt In CREAtIvE oCCuPAtIons
dEFInItIon
The number of people employed in creative occupations as a percentage of total employment.1
RAtIonAlE
People can be engaged in cultural activities both as suppliers and consumers. This indicator acts as a measure of those who are employed as cultural creators, and provides an indication of the degree to which the social and economic environment supports creativity and innovation. This is a subset of cultural employment, which was analysed in the previous indicator.
While this indicator is presented as the percentage of people employed in creative occupations, the analysis also provides substantial discussion of the numbers of people employed in these occupations, given that the percentage figures are relatively small.
dAtA souRCE
Statistics New Zealand: Censuses of Population and Dwellings.
It should be noted the census records a person’s main job only, so those who support themselves primarily through another job while pursuing a creative occupation part-time will not be recorded in these figures.
CuRREnt lEvEl And tREnds
In 2006, 1.8 percent of the total workforce was employed in a creative occupation as their main job. This was an increase from 1.6 percent in 2001 and 1.4 percent in 1996. Between 2001 and 2006 the number of people in creative occupations increased from 26,650 to 34,540. This represented an intercensal increase of 30 percent, which was well above the 15 percent growth in total employment.
Figure 6 provides a breakdown by individual occupations. By far the largest increases between 2001 and 2006 were in the largest occupational groups – graphic designers (an increase of 1,590 people or 38 percent), architects (1,560 people or 77 percent) and sculptors, painters and related artists (1,560 people or 43 percent). Other occupations which experienced increases of over 300 workers were artistic directors, interior designers, editors, photographers, fashion designers and industrial designers. The only creative occupations to fall in number over the five years were actors; the combined category of clowns, magicians, acrobats and related workers; singers; and musical instrument makers, repairers and tuners – although each of these was a relatively small fall of 100 people or fewer.
The proportion of people in creative occupations who worked part-time in 2006 was 22 percent – slightly below the figure of 23 percent in 2001 and slightly below the proportion of the total workforce who worked part-time in 2006 (also 23 percent). However, some occupations were characterised by particularly high proportions of part-timers, including singers (58 percent), instrumentalists (57 percent), clowns, magicians, acrobats and related workers (56 percent) and actors (46 percent).
1 See Appendix A for definition of creative occupations.
Workers in Creative Occupations2001 and 2006
Note: Paste-up artists have been excluded from the graph because of low numbers.
6 FIgURE
- 1,000 2,000 3,000 4,000 5,000 6,000 7,000
Dancer
Musical instrument maker, repairer and tuner
Singer
Composer, arranger and/or conductor
Copywriter
Display and window dresser
Sub-Editor
Sound recording equipment controller
Actor
Art gallery and museum curator
Clown, magician, acrobat and related worker
Camera operator
Landscape architect
Fashion designer
Broadcasting transmitting and studio equipment operator
Instrumentalist
Industrial designer
Broadcasting and theatrical production manager
Interior designer
Artistic director
Editor
Author and critic
Photographer
Reporter
Architect
Sculptor, painter and related artist
Graphic designer
Engagement: Indicator 1b | Cultural Indicators for New Zealand

Page 16 Page 17Cultural Indicators for New Zealand | Engagement: Indicator 1b
sub-PoPulAtIon dIFFEREnCEs
SexMen make up the majority of people in creative occupations – 55 percent in 2006, down from 57 percent in 2001. However, as Figure 7 shows, the increase in the number of people in creative occupations between 2001 and 2006 was greater for women than for men – the number of women grew by 4,100 or 36 percent while the number of men grew by 3,790 or 25 percent. For both sexes this was considerably greater than the rate of growth in total employment (14 percent for men and 16 percent for women).
Workers in Creative OccupationsBy sex1996–2006
Although men were in the majority in 16 of the 28 creative occupations in 2006, women dominated some occupations including fashion designers (84 percent), interior designers (77 percent), display and window dressers (75 percent) and sub-editors (63 percent). On the other hand, men made up the vast majority of musical instrument makers, repairers and tuners (92 percent), sound recordists (89 percent), camera operators (83 percent) and architects (80 percent). In most occupations, the proportion of female workers increased between 2001 and 2006.
Women in creative occupations were twice as likely as their male counterparts to work part-time. In 2006, 30 percent of females and 15 percent of males in creative occupations worked fewer than 30 hours a week. For both sexes this was slightly lower than the proportions in 2001.
FIgURE 7
0
5
10
15
20
Male Female
Thousands
1996 2001
2006
AgeThe age distribution of people in creative occupations generally mirrors that of the total workforce (see Figure 8), with numbers peaking between the ages of 25 and 44 – a group which accounted for over half (53 percent) of creative employment in 2006. Employment in creative occupations grew in all age groups between 2001 and 2006, with the greatest increases being in the 30–34 age group (an increase of 1,300 people or 35 percent) and in the 55–59 age group (an increase of 1,000 people or 63 percent). Increases of over 600 creative workers also occurred in each of the other age groups between 20 and 54. With the exception of people at either end of the age scale (the under 20s and the over 65s) the rate of increase in creative employment was greater than the rate of increase in total employment between 2001 and 2006.
Workers in Creative OccupationsBy age
1996–2006
8 FIgURE
-
1
2
3
4
5
6
15-19 20-24 25-29 30-34 35-39 40-44 45-49 50-54 55-59 60-64 65+
Thousands
199620012006
Engagement: Indicator 1b | Cultural Indicators for New Zealand

Page 18 Page 19Cultural Indicators for New Zealand | Engagement: Indicator 1b
EthnicityWorkers in creative occupations in 2006 are overwhelmingly of European ethnicity (90 percent), in comparison with their representation in the total workforce (81 percent). All the other major ethnic groups were under-represented in creative employment by comparison with their share of total employment. Māori made up 7.6 percent of creative workers in 2006, Asians 5.5 percent and Pacific peoples 2.2 percent.
As Figure 9 shows, all these groups experienced increases in creative employment between 2001 and 2006. The vast majority of the overall numerical increase was among Europeans (6,720 people) but proportionally the greatest increase was among Asians (111 percent), reflecting more rapid population growth due to immigration. All the major ethnic groups with the exception of those in the “other” category experienced faster rates of growth in creative employment than in total employment between 2001 and 2006.
Workers in Creative OccupationsBy ethnicity1996–2006
Note: People giving their ethnicity as New Zealander are included in the European category.
FIgURE 9
EducationPeople with tertiary qualifications make up the majority of workers in creative occupations – 67 percent in 2006, compared with 47 percent of the total workforce. As Figure 10 shows, almost all of the increase in creative employment between 2001 and 2006 was among people with tertiary qualifications. The largest increase was among those with bachelor degrees (3,820 people or 61 percent), followed by those with vocational qualifications (2,950 or 43 percent). While there was very little increase in creative employment among those with only school qualifications or no qualifications, this reflects more general changes in the total workforce as education levels increase and the proportion of people without tertiary qualifications declines.
Workers in Creative OccupationsBy highest qualification
1996–2006
10 FIgURE
0
2
4
6
8
10
12
No qualification School qualification Vocationalqualification
Bachelor degree Higher degree
Thousands
199620012006
Engagement: Indicator 1b | Cultural Indicators for New Zealand
0
5
10
15
20
25
30
35
European Pacific Peoples Asian Other
1996
20012006
Maori-

Page 20 Page 21Cultural Indicators for New Zealand | Engagement: Indicator 1b
RegionDisproportionate percentages of creative workers live in Auckland and Wellington. In 2006, 43 percent of people in creative occupations resided in the Auckland region, compared with 32 percent of the total workforce. Another 17 percent of creative workers lived in Wellington, which was home to 12 percent of the total workforce. Canterbury accounted for 12 percent of the national total, but this was slightly less than its share of the total workforce (14 percent).
Figure 11 shows that all regions in the country experienced increases in the number of creative workers between 2001 and 2006. In Auckland, the number of creative workers grew by 3,690 (33 percent), almost half of the national increase. In Wellington the number increased by 900 (18 percent) and in Canterbury by 840 (26 percent). In other regions the numerical increases were comparatively small but there were significant proportional increases in most regions, most notably Northland (53 percent), Gisborne and Hawkes Bay (47 percent) and Bay of Plenty (40 percent).
Workers in Creative OccupationsBy region1996–2006
FIgURE 11
0 2 4 6 8 10 12 14 16
Southland
Otago
Canterbury
Tasman / Nelson / Marlborough/ West Coast
Wellington
Manawatu-Wanganui
Taranaki
Gisborne / Hawkes Bay
Bay of Plenty
Waikato
Auckland
Northland
Thousands
Region
199620012006
Engagement: Indicator 1c | Cultural Indicators for New Zealand
IndICAtoR 1c: mEdIAn InComEs FRom CREAtIvE oCCuPAtIons
dEFInItIon
The median income received by people in creative occupations as a percentage of the median income of all employed people (see appendix A for definitions of creative occupations).
RAtIonAlE
The indicator demonstrates how well creative workers are able to support themselves, relative to all workers in New Zealand. The relative levels of income suggest how conducive the environment is for supporting creativity and innovation. An ability to support oneself in creative work indicates that New Zealanders are engaging with arts and culture activity as consumers (spending) and this spending is an indicator of the value placed on creative activity.
dAtA souRCE
Statistics New Zealand: Censuses of Population and Dwellings.
It should be noted that census income data includes income from all sources, while occupation data relates to people’s main job only. The incomes of people in creative occupations may therefore include income from other part-time employment or from investments or benefits, and is not necessarily a precise indicator of their ability to support themselves through creative work.
CuRREnt lEvEl And tREnds
People in creative occupations overall have a level of income which is slightly higher than the norm. In 2006, the median income for people in creative occupations was $36,800, equal to 109 percent of the median income for all employed people ($33,700).1 This figure was slightly lower than it had been in 2001 (112 percent) and 1996 (115 percent).
Both full-time and part-time workers in creative occupations have median incomes which exceed the comparable figures for the total workforce. For full-time workers in creative occupations the median income in 2006 was $41,600, or 108 percent of the overall median for full-timers ($38,400). Part-timers in creative occupations earned a median of $17,800, which was 127 percent of the median for all part-timers ($13,900).
Figure 12 shows a breakdown by occupation. Of the 28 occupations which are categorised as creative, 16 had median incomes which exceeded the median for the total workforce in 2006. The creative occupations with the highest median incomes in 2006 were architects ($54,800 or 163 percent of the overall median), broadcasting and theatrical production managers ($49,600 or 147 percent) and reporters ($46,300 or 137 percent). At the other end of the scale were clowns, magicians and acrobats along with singers (both $18,600 or 55 percent of the overall median) and sculptors, painters and related artists ($19,600 or 58 percent).
1 Median income figures cited in the text have been rounded to the nearest $100, while percentage figures have been calculated on unrounded medians, which accounts for any apparent discrepancies in the figures.

Page 22 Page 23Cultural Indicators for New Zealand | Engagement: Indicator 1c
Median Incomes of People in Creative OccupationsAs a percentage of median for all employed people2001 and 2006
Note: Paste-up artists have been excluded from the graph because of low numbers.
Between the 2001 and 2006 censuses, 8 of the 28 creative occupations experienced an increase in the level of their median incomes relative to the median for all occupations. The largest increase was among authors and critics, whose median income rose from 98 to 110 percent of the overall median, followed by musical instrument makers, repairers and tuners (up from 73 to 83 percent) and landscape architects (up from 99 to 109 percent). Occupations which experienced falls in the relative levels of their incomes included broadcasting and theatrical production managers (from 170 to 147 percent of the overall median), editors (from 146 to 130 percent) and composers, arrangers and/or conductors (from 110 to 94 percent).
All creative occupations experienced increases in the dollar value of their median incomes between 2001 and 2006, with musical instrument makers, repairers and tuners enjoying the largest percentage increase (39 percent), followed by authors and critics, singers, and instrumentalists (all 35 percent).
FIgURE 12 sub-PoPulAtIon dIFFEREnCEs
SexIn creative occupations, as in the total workforce, men tend to have higher incomes than women. In 2001, the male median in creative occupations was $41,700, compared with $31,800 for women. For men this equated to 124 percent of the median for all employed people of both sexes, while for women it was 94 percent. As Figure 13 shows, median incomes for both men and women in creative occupations have fallen slightly in relation to the median for all employed people since 1996.
If the median incomes of men and women in creative occupations are compared with the overall medians of the same sex, women fare slightly better than men. In 2006, the median income for women in creative occupations equated to 115 percent of the median for all employed women, while men in creative occupations earned 108 percent of the median for all employed men.
The difference between male and female incomes is affected by higher rates of part-time work among women, but even among full-time workers in creative occupations males still had a considerably higher median than females in 2006 ($45,800 compared with $37,100). While the median income for men in creative occupations working full-time was higher than that of all full-time workers (119 percent), for women it was slightly lower than the median for all full-time workers (97 percent).
Median Incomes of People in Creative OccupationsAs a percentage of median for all employed people
By sex, 1996–2006
13 FIgURE
0
20
40
60
80
100
120
140
Male Female
Percent
199620012006
Engagement: Indicator 1c | Cultural Indicators for New Zealand

Page 24 Page 25Cultural Indicators for New Zealand | Engagement: Indicator 1c
AgeDifferences in income levels for age groups in creative occupations tend to mirror patterns in the workforce as a whole, with medians peaking among those aged from 30 to their mid-50s. At either end of the age scale where part-time work is more common and people are in the early or late stages of careers, medians are considerably lower. Figure 14 shows that in creative occupations people aged 35-39 had the highest median incomes in 2006 at 128 percent of the median for the total workforce, or $43,200. Those aged 45-49 were only slightly behind at 127 percent of the overall median ($42,800). The under 25s and the over 65s were the only age groups which had median incomes below the total workforce median in 2006.
In most age groups, people in creative occupations have experienced a decline in the level of their median incomes relative to those of the total workforce since 1996. Between 2001 and 2006 there were improvements in the relative income levels of those aged 20-24 and over 55, but the only group whose position in 2006 was better than in 1996 was the 65-plus age group.
Median Incomes of People in Creative OccupationsAs a percentage of median for all employed peopleBy age, 1996–2006
EthnicityAs Figure 15 shows, Europeans had the highest median income among people in creative occupations in 2006 at 112 percent of the median for the total workforce, or $37,500. The other major ethnic groups with the exception of those in the “other” category had medians below that of the total workforce. Among creative workers, Māori, Pacific peoples, and Other experienced improvements in their relative position between 2001 and 2006, with Māori enjoying the largest increase in median incomes during this period (from $21,400 to $31,800).
FIgURE 14
0
20
40
60
80
100
120
140
15-19 20-24 25-29 30-34 35-39 40-44 45-49 50-54 55-59 60-65 65+
Percent
199620012006
Median Incomes of People in Creative OccupationsAs a percentage of median for all employed people
By ethnicity, 1996–2006
Note: People giving their ethnicity as New Zealander are included in the European category.
15 FIgURE
0
20
40
60
80
100
120
European Maori Pacific peoples Asian Other
Percent
199620012006
-
Engagement: Indicator 1c | Cultural Indicators for New Zealand
Page 26 Page 27
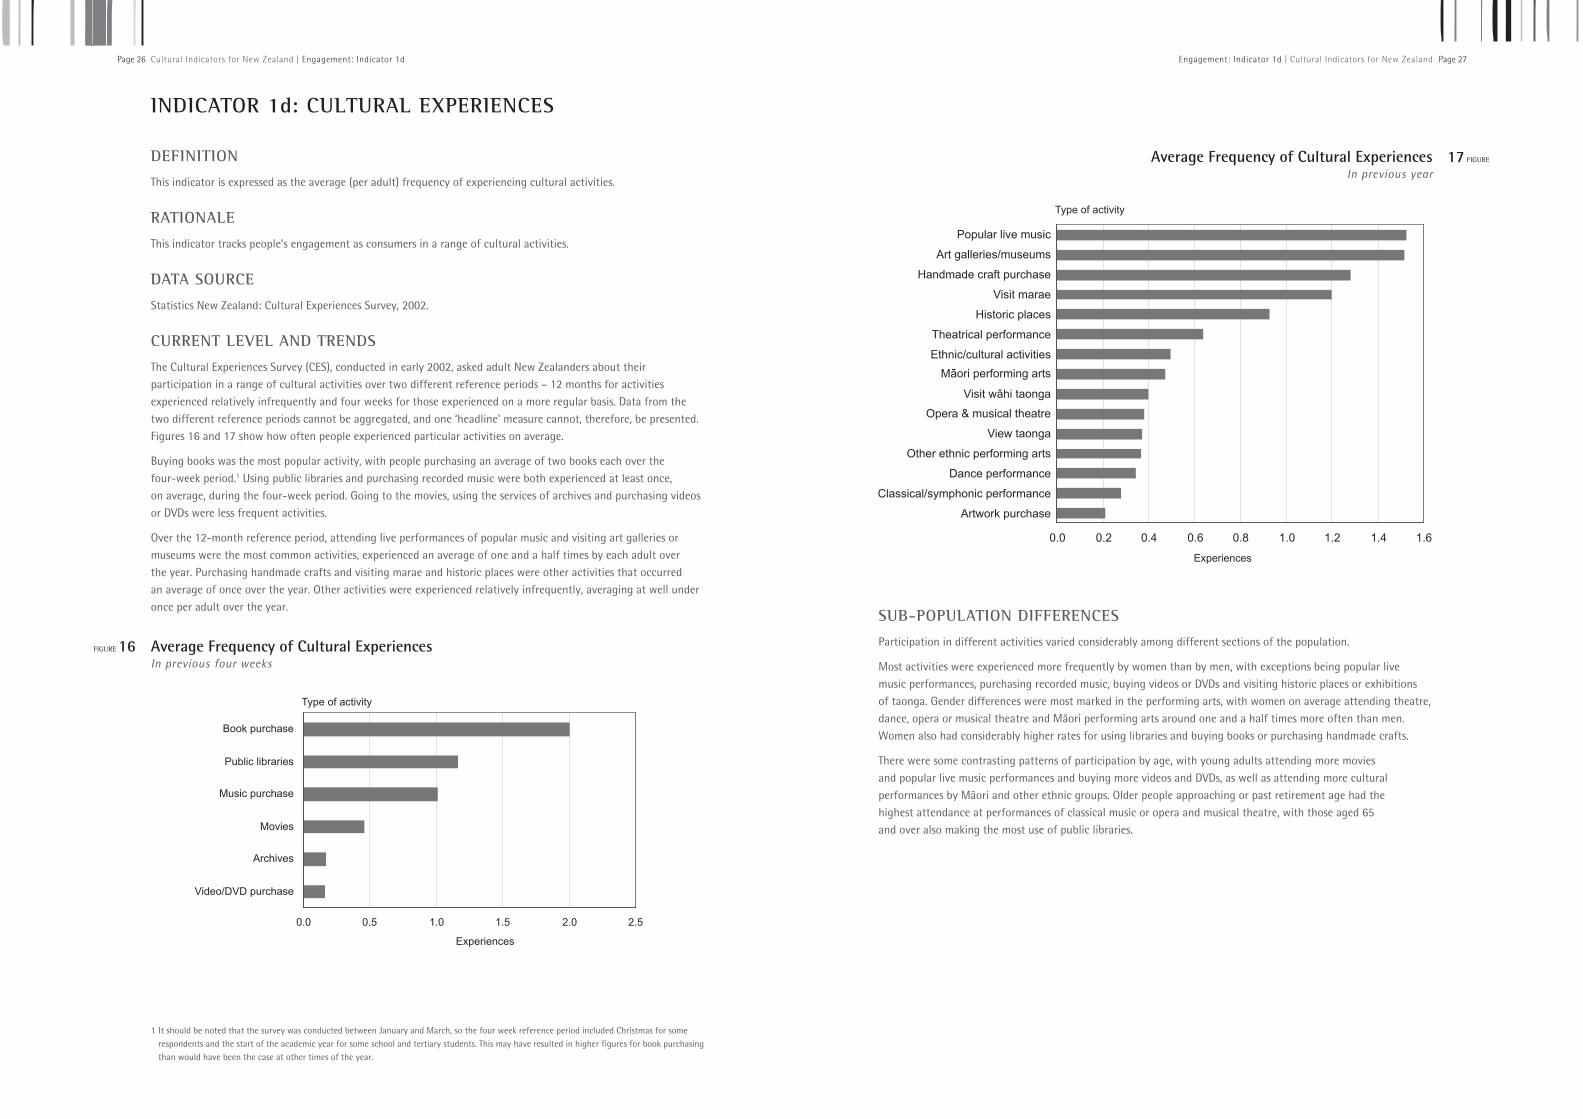
Average Frequency of Cultural ExperiencesIn previous year
sub-PoPulAtIon dIFFEREnCEs
Participation in different activities varied considerably among different sections of the population.
Most activities were experienced more frequently by women than by men, with exceptions being popular live music performances, purchasing recorded music, buying videos or DVDs and visiting historic places or exhibitions of taonga. Gender differences were most marked in the performing arts, with women on average attending theatre, dance, opera or musical theatre and Māori performing arts around one and a half times more often than men. Women also had considerably higher rates for using libraries and buying books or purchasing handmade crafts.
There were some contrasting patterns of participation by age, with young adults attending more movies and popular live music performances and buying more videos and DVDs, as well as attending more cultural performances by Māori and other ethnic groups. Older people approaching or past retirement age had the highest attendance at performances of classical music or opera and musical theatre, with those aged 65 and over also making the most use of public libraries.
0.0 0.5 1.0 1.5 2.0 2.5
Book purchase
Public libraries
Music purchase
Movies
Archives
Video/DVD purchase
Cultural Indicators for New Zealand | Engagement: Indicator 1d
IndICAtoR 1d: CultuRAl ExPERIEnCEs
dEFInItIon
This indicator is expressed as the average (per adult) frequency of experiencing cultural activities.
RAtIonAlE
This indicator tracks people’s engagement as consumers in a range of cultural activities.
dAtA souRCE
Statistics New Zealand: Cultural Experiences Survey, 2002.
CuRREnt lEvEl And tREnds
The Cultural Experiences Survey (CES), conducted in early 2002, asked adult New Zealanders about their participation in a range of cultural activities over two different reference periods – 12 months for activities experienced relatively infrequently and four weeks for those experienced on a more regular basis. Data from the two different reference periods cannot be aggregated, and one ‘headline’ measure cannot, therefore, be presented. Figures 16 and 17 show how often people experienced particular activities on average.
Buying books was the most popular activity, with people purchasing an average of two books each over the four-week period.1 Using public libraries and purchasing recorded music were both experienced at least once, on average, during the four-week period. Going to the movies, using the services of archives and purchasing videos or DVDs were less frequent activities.
Over the 12-month reference period, attending live performances of popular music and visiting art galleries or museums were the most common activities, experienced an average of one and a half times by each adult over the year. Purchasing handmade crafts and visiting marae and historic places were other activities that occurred an average of once over the year. Other activities were experienced relatively infrequently, averaging at well under once per adult over the year.
Average Frequency of Cultural ExperiencesIn previous four weeks
1 It should be noted that the survey was conducted between January and March, so the four week reference period included Christmas for some respondents and the start of the academic year for some school and tertiary students. This may have resulted in higher figures for book purchasing than would have been the case at other times of the year.
FIgURE 16
0.0 0.2 0.4 0.6 0.8 1.0 1.2 1.4 1.6
Artwork purchase
Classical/symphonic performance
Dance performance
Other ethnic performing arts
View taonga
Opera & musical theatre
Maori performing artsEthnic/cultural activities
Theatrical performance
Historic places
Visit marae
Handmade craft purchase
Art galleries/museums
Popular live music
Visit wahi taonga-
-
17 FIgURE
Engagement: Indicator 1d | Cultural Indicators for New Zealand
Page 28 Page 29Cultural Indicators for New Zealand | Engagement: Indicator 1d
Ethnic variations were most marked in those activities with a non-European ethnic dimension. In particular, all activities within the category of taonga tuku iho were much more commonly experienced by Māori, with an average of almost nine marae visits a year and around two attendances at kapa haka performances and visits to wāhi taonga. Non- Māori ethnic cultural performances and other ethnic cultural activities were most commonly experienced by Pacific people. Māori people also had the highest rate of attendance at popular music performances and bought more books than people of other ethnicities (excluding European).
Education also has an effect on people’s participation in cultural activities. Those with tertiary qualifications experienced most activities more frequently than other people, particularly performing arts events and purchasing of books, handmade crafts and artworks. People whose highest qualification was at secondary level experienced moviegoing, buying of recorded music and videos or DVDs, and using public libraries more frequently than people with tertiary or no qualifications.
Given the relationship between education and income, as well as the cost of participating in some cultural activities, it is not surprising to find that people in higher income brackets participated more frequently in most activities. This included most of the performing arts activities and the purchase of most cultural items. However, low income earners were the most frequent users of public libraries and attended Māori and other ethnic performing arts events more frequently than others.
Regional variations in participation tend to reflect the location of different activities and population groups. Participation in Māori cultural activities was highest in the Northland and Bay of Plenty regions where there are large Māori populations. Other ethnic activities and performances were most frequently attended in Wellington and Auckland. Attendance at performing arts events was generally highest in Wellington – though this may have been influenced by the fact that the International Festival of the Arts was held in Wellington during the reference period. An exception was live popular music, which was attended most frequently by people in Southland and Taranaki. Visiting art galleries and museums was most common in Wellington, while purchase of handmade crafts was most popular in the Nelson/Tasman/Marlborough/West Coast region, and purchase of artworks was highest in Otago.
Engagement: Indicator 1e | Cultural Indicators for New Zealand
IndICAtoR 1e: bARRIERs to CultuRAl ExPERIEnCEs
dEFInItIon
This indicator is expressed as the proportion of adults encountering barriers which prevent them from experiencing particular cultural activities.
RAtIonAlE
Measuring the proportion of people facing barriers to having cultural experiences provides a measure of how accessible cultural experiences are. Examination of the incidence and nature of those barriers allows policymakers and providers to determine which barriers are preventing people from accessing cultural experiences and how to improve that access.
dAtA souRCE
Statistics New Zealand: Cultural Experiences Survey (CES), 2002.
It should be noted that use of the CES data has prevented one single ‘headline’ indicator from being produced. As noted above in indicator 1d, the CES asked adult New Zealanders about their participation in and barriers to a range of cultural activities over two different reference periods – 12 months for activities experienced relatively infrequently and four weeks for those experienced on a more regular basis. These are unable to be aggregated into one overall figure.
CuRREnt lEvEl And tREnds
The CES asked people who had not taken part in each cultural activity but had wanted to, and those who had taken part in the activity and had wanted to do so more often, whether there were any barriers that prevented them from doing so.1
Typical examples of barriers included:
cost of tickets and other costs -lack of time -transport problems -cultural experience not available locally -caregiver responsibilities -limited selection -uncomfortable physical environment -disability/illness -no-one to go with -uncomfortable going out at night -lack of information about events -feel out of place. -
More specific barriers applied to activities such as going to marae, attending ethnic events, using the public library, or book buying. Examples of these more specific barriers included:
not having links with either a local or any other marae, or an invitation to go -not having any links with ethnic groups -activity not being open at convenient times -fees/fines/cost of services -cost of items -limited selection. -
1 Only those who had found it ‘very hard’ or ‘somewhat hard’ to experience the activity were included in the analysis, as it was assumed that those who responded ‘not very hard’ or ‘did not know’ (why they had not taken part) were not sufficiently interested in doing so.
Page 30 Page 31Cultural Indicators for New Zealand | Engagement: Indicator 1e
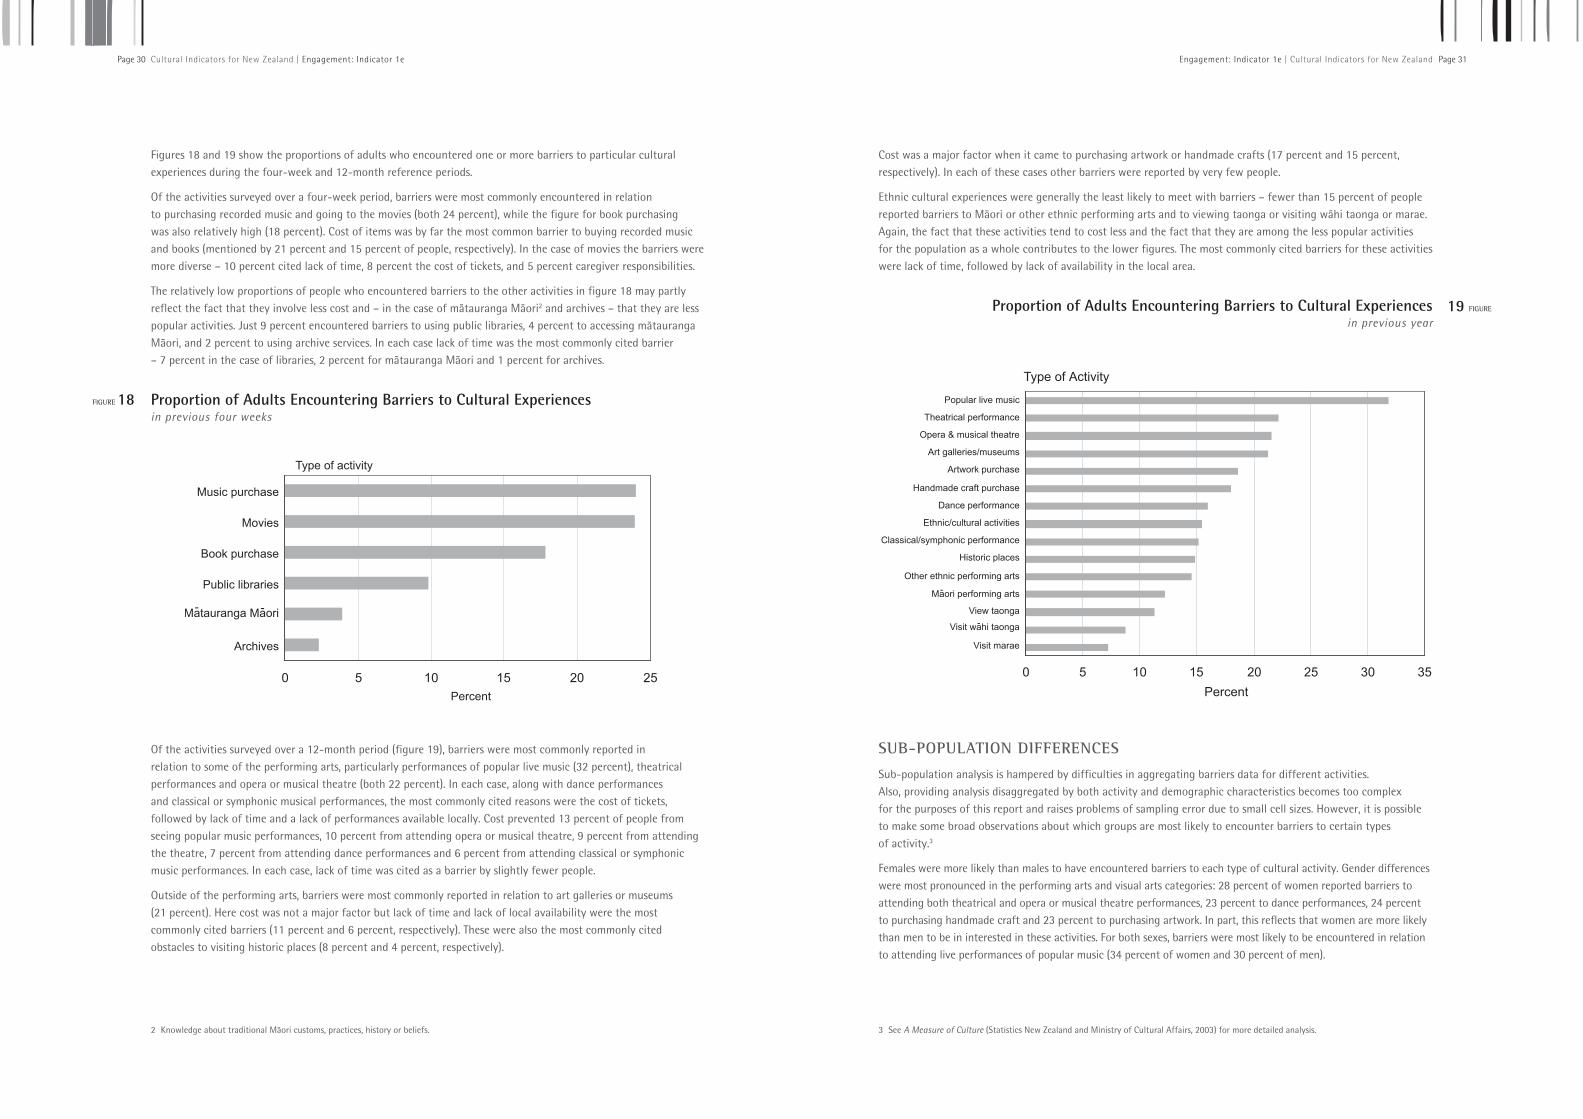
Figures 18 and 19 show the proportions of adults who encountered one or more barriers to particular cultural experiences during the four-week and 12-month reference periods.
Of the activities surveyed over a four-week period, barriers were most commonly encountered in relation to purchasing recorded music and going to the movies (both 24 percent), while the figure for book purchasing was also relatively high (18 percent). Cost of items was by far the most common barrier to buying recorded music and books (mentioned by 21 percent and 15 percent of people, respectively). In the case of movies the barriers were more diverse – 10 percent cited lack of time, 8 percent the cost of tickets, and 5 percent caregiver responsibilities.
The relatively low proportions of people who encountered barriers to the other activities in figure 18 may partly reflect the fact that they involve less cost and – in the case of mātauranga Māori2 and archives – that they are less popular activities. Just 9 percent encountered barriers to using public libraries, 4 percent to accessing mātauranga Māori, and 2 percent to using archive services. In each case lack of time was the most commonly cited barrier – 7 percent in the case of libraries, 2 percent for mātauranga Māori and 1 percent for archives.
Proportion of Adults Encountering Barriers to Cultural Experiencesin previous four weeks
Of the activities surveyed over a 12-month period (figure 19), barriers were most commonly reported in relation to some of the performing arts, particularly performances of popular live music (32 percent), theatrical performances and opera or musical theatre (both 22 percent). In each case, along with dance performances and classical or symphonic musical performances, the most commonly cited reasons were the cost of tickets, followed by lack of time and a lack of performances available locally. Cost prevented 13 percent of people from seeing popular music performances, 10 percent from attending opera or musical theatre, 9 percent from attending the theatre, 7 percent from attending dance performances and 6 percent from attending classical or symphonic music performances. In each case, lack of time was cited as a barrier by slightly fewer people.
Outside of the performing arts, barriers were most commonly reported in relation to art galleries or museums (21 percent). Here cost was not a major factor but lack of time and lack of local availability were the most commonly cited barriers (11 percent and 6 percent, respectively). These were also the most commonly cited obstacles to visiting historic places (8 percent and 4 percent, respectively).
2 Knowledge about traditional Māori customs, practices, history or beliefs.
FIgURE 18
0 5 10 15 20 25
Music purchase
Movies
Book purchase
Public libraries
Archives
Matauranga Maori- -
Cost was a major factor when it came to purchasing artwork or handmade crafts (17 percent and 15 percent, respectively). In each of these cases other barriers were reported by very few people.
Ethnic cultural experiences were generally the least likely to meet with barriers – fewer than 15 percent of people reported barriers to Māori or other ethnic performing arts and to viewing taonga or visiting wāhi taonga or marae. Again, the fact that these activities tend to cost less and the fact that they are among the less popular activities for the population as a whole contributes to the lower figures. The most commonly cited barriers for these activities were lack of time, followed by lack of availability in the local area.
Proportion of Adults Encountering Barriers to Cultural Experiencesin previous year
sub-PoPulAtIon dIFFEREnCEs
Sub-population analysis is hampered by difficulties in aggregating barriers data for different activities. Also, providing analysis disaggregated by both activity and demographic characteristics becomes too complex for the purposes of this report and raises problems of sampling error due to small cell sizes. However, it is possible to make some broad observations about which groups are most likely to encounter barriers to certain types of activity.3
Females were more likely than males to have encountered barriers to each type of cultural activity. Gender differences were most pronounced in the performing arts and visual arts categories: 28 percent of women reported barriers to attending both theatrical and opera or musical theatre performances, 23 percent to dance performances, 24 percent to purchasing handmade craft and 23 percent to purchasing artwork. In part, this reflects that women are more likely than men to be in interested in these activities. For both sexes, barriers were most likely to be encountered in relation to attending live performances of popular music (34 percent of women and 30 percent of men).
3 See A Measure of Culture (Statistics New Zealand and Ministry of Cultural Affairs, 2003) for more detailed analysis.
19 FIgURE
Engagement: Indicator 1e | Cultural Indicators for New Zealand
0 5 10 15 20 25 30 35
Visit marae
View taonga
Other ethnic performing arts
Historic places
Classical/symphonic performance
Ethnic/cultural activities
Dance performance
Handmade craft purchase
Artwork purchase
Art galleries/museums
Opera & musical theatre
Theatrical performance
Popular live music
Maori performing arts
Visit wahi taonga
-
-

Page 32 Page 33Cultural Indicators for New Zealand | Engagement: Indicator 1e
The incidence of barriers for different age groups varied according to the type of activity. People aged between 25 and 44 years were generally the most likely to report barriers. Those aged 25 to 34 reported the highest incidence of barriers to ethnic cultural activities, both Māori and non-Māori, as well as literary activities – the purchase of books and the use of libraries. People aged between 35 and 44 years were more likely to encounter barriers with performing arts such as theatre and dance, and with purchasing visual arts. People aged 65 and over were generally the least likely to report barriers, except in the case of some of the performing arts.
Māori were more likely than other ethnic groups to report barriers to most activities. Figures for Māori were particularly high in the category of taonga tuku iho: 34 percent reported barriers to attending Māori performing arts, 31 percent to viewing exhibitions of taonga and 24 percent to visiting wāhi taonga. In addition, 40 percent of Māori reported barriers to attending live performances of popular music and 32 percent to purchasing recorded music. Those in the European/Pākehā ethnic group were generally the least likely to encounter barriers to cultural experiences, although in the case of theatre and opera or musical theatre they reported more barriers than any other groups, perhaps reflecting greater interest in these activities.
Educational differences clearly influence people’s interest in certain cultural experiences and this is also reflected in the barriers data, with tertiary educated people being more likely than others to report barriers to all activities, with the exception of popular music performances and the purchase of recorded music. Conversely, people with no formal qualifications were the least likely to report barriers for all activities, with the exception of those in the category of taonga tuku iho.
Labour force status and income data clearly show the importance of cost as a barrier to many cultural experiences, with low income earners and the unemployed being the most likely to report barriers to most activities. Unemployed people reported particularly high incidence of barriers to attending live popular music performances (43 percent), purchasing recorded music (39 percent) and going to the movies (33 percent). These were also the activities for which people on incomes under $15,000 were most likely to encounter barriers. Those not in the labour force were the least likely to report barriers, reflecting the high proportion of retired people in this group, many of whom may be less interested in several of the activities. People with incomes over $50,000 were less likely than those on lower incomes to report barriers to most activities, although they were the most likely to report barriers to activities such as attending classical music and opera or musical theatre performances as well as purchasing artwork and visiting art galleries or museums.
Engagement: Indicator 1f | Cultural Indicators for New Zealand
IndICAtoR 1f: housEhold sPEndIng on CultuRAl ItEms
dEFInItIonThis indicator shows the value of household spending on cultural items as a proportion of all household expenditure.
RAtIonAlE
Household expenditure data provides a further measure of people’s engagement with culture by showing the proportion of total expenditure households are prepared to spend on cultural goods and services, and how this compares with other types of expenditure.
dAtA souRCE Statistics New Zealand: Household Economic Survey (HES).
Cultural spending is not a category normally used in analysing HES expenditure data, but a number of cultural items can be identified from the survey (see Appendix D). Some of this data needs to be treated with caution due to large sampling variability.
CuRREnt lEvEl And tREndsIn the year ended June 2007, New Zealand households spent a total of $2.84 billion on cultural items – an average of $35 a week per household. This amounted to 3.6 percent of all household expenditure, down from 4.2 percent in the 2003/04 year and 4.0 percent in the 2000/01 year.
The Survey figures indicate that cultural spending in 2006/07 was $2.843 billion, compared to $2.937 billion in 2003/04, and $2.290 billion in 2000/01. However, this comparison should be treated with some caution as the latest survey used a new classification of expenditure items which included some major changes from that used in previous surveys. This may account for some of the apparent fall in cultural spending between the last two surveys.
Figure 20 shows how cultural spending compares with expenditure on other types of goods and services. In the year to June 2007 New Zealand households spent more on cultural items than they did on clothing and footwear, health care or passenger transport. Cultural spending amounted to slightly less than spending on household energy but considerably less than spending on food, mortgage or rent payments and vehicle expenses.
Total Household Spending on Selected Goods and ServicesYear ended June 2007
20 FIgURE

Page 34 Page 35
Figure 21 shows a breakdown of cultural spending by category. Broadcasting accounted for over a third (35 percent) of the total spending on culture by households in 2006/07, at $1.01 billion or an average of $12.30 per household each week. This category includes spending on audio-visual appliances, which are classified as cultural items because they are used to access cultural products including broadcasting services.
The next largest category of cultural spending was literature, which covers expenditure on books, magazines and newspapers. New Zealanders spent around $551 million on these items in 2006/07 – an average of $6.70 per household per week.
Community and government activities, visual arts and film and video all accounted for similar amounts of spending – between $348 and $350 million or around $4.30 per household per week. Community and government activities includes cultural education and training as well as community cultural activities. The visual arts category includes expenditure on art and craft objects, the purchase of raw materials and equipment used to make those objects and the professional fees of visual artists such as photographers and designers. The film and video category includes the purchase and hire of videos and DVDs as well as cinema admissions.
Total Household Spending on Cultural ItemsBy categoryYear ended June 2007
Total household expenditure on performing arts – including admission to events such as theatre, concerts and dance – amounted to $223 million in 2006/07, an average of $2.70 per household per week.
By comparison with the other categories, household spending on library services and heritage activities is relatively low - $8.2 million for heritage activities (which includes visits to museums and art galleries as well as the purchase of antiques) and $5.7 million for library services. This reflects the fact that much of the activity in these categories involves little or no cost to users.
Cultural Indicators for New Zealand | Engagement: Indicator 1f
FIgURE 21
Engagement: Indicator 1g | Cultural Indicators for New Zealand
IndICAtoR 1g: hERItAgE PRotECtIon
dEFInItIon
The proportion of those sites either registered with the New Zealand Historic Places Trust, or listed as places with heritage value in territorial authority District Plans that have been destroyed, relocated or partly removed during the period.
RAtIonAlE
A crucial component of success in sustaining the nation’s culture is that irreplaceable cultural material is not lost or destroyed. One reasonably well-defined set of items of cultural value is that of recorded historic places, which can be monitored to assess one aspect of cultural protection.
dAtA souRCEs And mEthodology
The Heritage Protection Indicator Report (Opus International Consultants, 2007); Update for Cultural Indicators for New Zealand – Statistics for the period 2007-2008 (New Zealand Historic Places Trust, March 2009).
Heritage sites and places include:
Buildings: built heritage used primarily for occupation: -Structures: built heritage not used primarily for occupation; -Objects: other built heritage that does not fit into either of these two categories; -Areas: places in which a collection of built heritage resides; and -Wāhi tapu: places sacred to Māori in the traditional, spiritual, religious, ritual, or mythological sense. -
Information was sourced from the New Zealand Historic Places Trust Register, territorial authority District Plan heritage listings, and listings of heritage sites managed by the Department of Conservation. The Historic Places Trust and territorial local authorities were then contacted for information about destruction and damage to historic places.
Further information is contained in Appendix E.
CuRREnt lEvEl And tREnds
The numbers of heritage buildings and places lost, compared to the total stock of listed or registered heritage, is very small, which is a positive situation for New Zealand heritage. Forty sites were lost in 2005 and 2006 (0.4 percent), and 21 sites in 2007 and 2008 (0.18 percent). This is an improvement in the rate at which heritage is being lost. However, it is difficult to base firm conclusions about trends in heritage protection on the low numbers involved.
At the end of 2006, the total number of listed heritage sites in New Zealand was 11,633. Over the period 1 January 2005 to 31 December 2006, 40 sites were reported as destroyed or otherwise significantly diminished in heritage value resulting in their removal from the Historic Places Trust Register/District Plan listings. A number of territorial authorities did not, however, provide information about destroyed heritage places for this period. The 40 sites represent a loss of 0.4% of the 10,106 heritage places from councils for which destruction figures were available.
By the end of 2008, the total number of listed heritage sites in New Zealand had risen to 11,867, a net increase of 234. Over the period 1 January 2007 to 31 December 2008, a total of 21 sites were destroyed or otherwise significantly diminished in heritage value. This is a loss of 0.18% of the total heritage stock. Information was available from all councils in this period.
While it is positive that such small numbers of listed heritage sites have been subject to destruction, the numbers do not indicate the loss to historic heritage occurring as a result of slow deterioration or ‘demolition by neglect’.
Figure 22 shows the distribution of heritage sites by region at the end of 2008. The regions are based on regional council boundaries.

Page 36 Page 37
0
200
400
600
800
1000
1200
1400
1600
1800
2000
2005-06
2007-08
Northla
nd
Auckla
nd
Waikato
Bay o
f Plen
ty
Hawke
's Ba
y
Wanga
nui
(Tara
naki
and
Manaw
atu)
Welling
ton
Nelson
/Marl
borou
gh
Cante
rbury
West C
oast
Otago
South
land
Cultural Indicators for New Zealand | Engagement: Indicator 1g
Listed and Registered Heritage PlacesBy region2005-2008
Auckland, Otago, Wellington and Canterbury have the highest numbers of recorded heritage sites, accounting for 60 percent of the total number. Areas with lower populations, such as Northland, West Coast and Southland, have fewer recorded heritage sites.
Heritage sites destroyed, by regionAlthough statistics are presented in Table 4 by region, it is difficult to draw conclusions about differences in heritage protection in different parts of New Zealand, due to the very small numbers of sites destroyed. The percentage decline for all regions is less than 1 percent.
In the future, it may be that the data will reveal more statistically significant trends, which could be supplemented by qualitative research. This might allow firm conclusions to be reached about the varying protection of heritage sites in different parts of the country.
Heritage Sites Destroyed, Removed or RelocatedBy region2005-2008
2005/2006 2007/2008
Northland 2 0Auckland 3 6Waikato 3 1Bay of Plenty 0 0Hawke’s Bay 5 3Wanganui (Taranaki and Manawatu) 2 4Wellington 7 2Nelson/Marlborough 1 0Canterbury 7 3West Coast 1 2Otago 9 0Southland 0 0Total 40 21
FIgURE 22
TABLE 4
Engagement: Indicator 1h | Cultural Indicators for New Zealand
IndICAtoR 1h: ACCEss to ARts, CultuRE And hERItAgE ACtIvItIEs And EvEnts
dEFInItIon
The proportion of shows, performances and exhibitions at a sample of venues outside the five main centres.
RAtIonAlE
Accessibility is primarily measured by the presence or absence of barriers to access; something that was examined by the 2002 Cultural Experiences Survey (see Indicator 1e). A wide variety of barriers were reported, but two of the most significant were that particular cultural experiences were not available locally, or that the selection was limited. The Ministry for Culture and Heritage undertook a survey of venues in 2008 to establish the extent of availability of cultural shows, performances and exhibitions outside the main centres of New Zealand, where cultural activities are most widely available.
dAtA souRCE
Ministry for Culture and Heritage: Venues Survey, 2008; New Zealand Census of Population and Dwellings, 2006, Statistics New Zealand.
The five main centres, for the purposes of this indicator, were defined as Auckland (including North Shore City, Waitakere City, Auckland City and Manukau City), Hamilton, Wellington (including Upper Hutt City, Lower Hutt City, Porirua City, and Wellington City), Christchurch, and Dunedin.
The Venues Survey sample was constructed so as to survey venues around the country in similar proportions to the population. Of the 322 responses to the survey overall, 310 provided information from which the territorial authority area for the venue could be determined. Of these, 168 (54 percent) were from outside the main centres, and 142 (46 percent) from the main centres (i.e. responses from outside the main centres were slightly over-represented).
CuRREnt lEvEl And tREnds
The 2008 Venues Survey identified 3,976 arts, culture and heritage events which took place outside the five main centres of New Zealand. This was 25 percent of the total 15,898 events reported by all surveyed venues in New Zealand1. This represents a marked under-representation of such events outside the main centres of New Zealand: 48 percent of New Zealand’s population live outside the main centre areas. By contrast, 75 percent of arts, culture and heritage activities take place within the main centres, which comprise 52 percent of the New Zealand population.
Venues within the five main centres clearly have a much greater frequency of hosting arts, culture and heritage events than venues outside the main centres. On average, venues outside the main centres hosted 24 events each in the 12 surveyed months, compared to 84 each for venues within the main centres.
tyPEs oF EvEnts
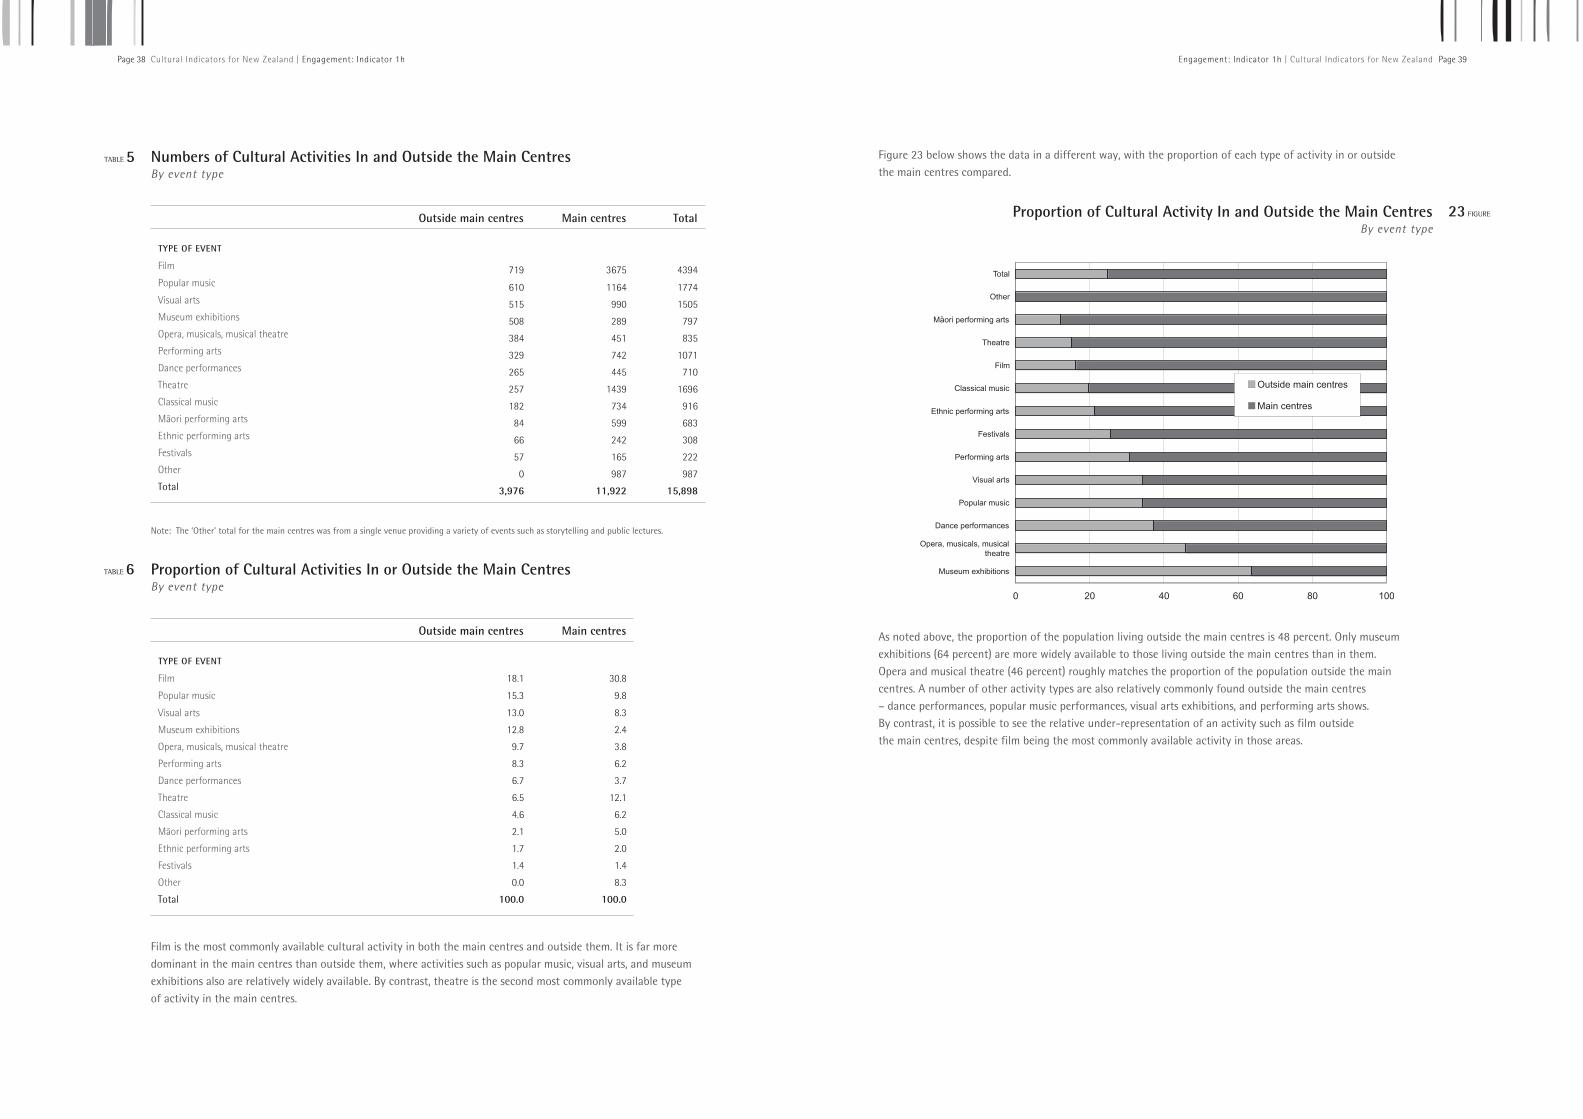
The Venues Survey also asked respondents about the type of shows, performances or exhibitions at their venue. Table 5 shows the numbers of different types of cultural activities in and outside the main centres, while Table 6 shows the same information as proportions of the total activities either in or outside the main centres.
1 This figure excludes 67 responses which did not identify the location of the venue.
Page 38 Page 39Cultural Indicators for New Zealand | Engagement: Indicator 1h
Numbers of Cultural Activities In and Outside the Main CentresBy event type
Outside main centres Main centres Total
TYPE OF EVENT
Film 719 3675 4394Popular music 610 1164 1774Visual arts 515 990 1505Museum exhibitions 508 289 797Opera, musicals, musical theatre 384 451 835Performing arts 329 742 1071Dance performances 265 445 710Theatre 257 1439 1696Classical music 182 734 916Māori performing arts 84 599 683Ethnic performing arts 66 242 308Festivals 57 165 222Other 0 987 987Total 3,976 11,922 15,898
Note: The ‘Other’ total for the main centres was from a single venue providing a variety of events such as storytelling and public lectures.
Proportion of Cultural Activities In or Outside the Main CentresBy event type
Outside main centres Main centres
TYPE OF EVENT
Film 18.1 30.8
Popular music 15.3 9.8
Visual arts 13.0 8.3
Museum exhibitions 12.8 2.4
Opera, musicals, musical theatre 9.7 3.8
Performing arts 8.3 6.2
Dance performances 6.7 3.7
Theatre 6.5 12.1
Classical music 4.6 6.2
Māori performing arts 2.1 5.0
Ethnic performing arts 1.7 2.0
Festivals 1.4 1.4
Other 0.0 8.3
Total 100.0 100.0
Film is the most commonly available cultural activity in both the main centres and outside them. It is far more dominant in the main centres than outside them, where activities such as popular music, visual arts, and museum exhibitions also are relatively widely available. By contrast, theatre is the second most commonly available type of activity in the main centres.
TABLE 5
TABLE 6
Figure 23 below shows the data in a different way, with the proportion of each type of activity in or outside the main centres compared.
Proportion of Cultural Activity In and Outside the Main CentresBy event type
As noted above, the proportion of the population living outside the main centres is 48 percent. Only museum exhibitions (64 percent) are more widely available to those living outside the main centres than in them. Opera and musical theatre (46 percent) roughly matches the proportion of the population outside the main centres. A number of other activity types are also relatively commonly found outside the main centres – dance performances, popular music performances, visual arts exhibitions, and performing arts shows. By contrast, it is possible to see the relative under-representation of an activity such as film outside the main centres, despite film being the most commonly available activity in those areas.
23 FIgURE
Engagement: Indicator 1h | Cultural Indicators for New Zealand

Page 40 Page 41
unPoPulAtEd EngAgEmEnt IndICAtoRs
Cultural Indicators for New Zealand | Engagement: Unpopulated Engagement Indicators
Indicator: Audience numbers
Definition: Index of audience numbers at a sample of performances by New Zealand cultural organisations.
Rationale: Sustaining artistic endeavours requires several resources, one of which is a sufficient number of consumers. Events that are expensive to stage are particularly dependent on achieving substantial audiences.
Discussion: This indicator cannot be populated at present. The first step is to define the organisations that would make up the population to be sampled. A possible criterion is that the organisation employs performers on a professional basis. To select the sample, all performances by these organisations during the period to be sampled will need to be established.
Indicator: Enjoyment of arts, culture and heritage events and activities
Definition: An index of satisfaction ratings from an exit survey at a sample of museums, heritage sites and performance venues.
Rationale: While sales revenue and income is one measure of value, not all cultural activities cost money – and income does not measure the degree to which events and activities were actually enjoyed.
Discussion: Such a survey does not currently exist. Designing and coordinating a customised exit survey would be necessary to populate this indicator. Such a survey would need to produce a consistent rating system across a sample of different types of venues, managed by a variety of organisations.
Theme 2: Cultural IdentitydIsCussIon
Three key ideas underlie the theme of cultural identity:
New Zealanders identify their common culture and heritage as being distinctive to this nation. -Expressions of our culture are valued because they link past, present and future generations of New Zealanders. -Māori culture is valued for the contribution it makes to New Zealand’s identity. -
The essence of the theme of cultural identity is that New Zealanders identify with a distinctly ‘New Zealand’ cultural identity. Defining a national identity is not a simple matter. New Zealand is a diverse nation, made up of many cultural groups each with its own customs and traditions, and so the emphasis is on those aspects and expressions of culture that are not normally found in other countries. Inevitably, these aspects and expressions include a high proportion that draw on Māori culture, since Māori culture is unique to New Zealand and forms part of our identity in the outside world.
The standard measure of value (willingness to pay) is not helpful in this context. The outcome relates to the largely intangible aspects of culture, which people already possess and would not expect to purchase. Other means are needed to establish changes in the extent to which people identify with and value New Zealand culture.
Cultural identity is important for people’s sense of self and how they relate to others. A strong cultural identity can contribute to overall well-being. Identifying with a particular culture gives feelings of belonging and security, and accesses social networks that provide support and shared values and aspirations. These can help break down barriers and build a sense of trust between people – sometimes referred to as social capital – although excessively strong cultural identity can also contribute to barriers between groups.
IndICAtoRs
Indicator 2a: Speakers of te reo Māori -Indicator 2b: Local Content on television -Indicator 2c: Māori TV ratings -Indicator 2d: The importance of culture to national identity -Indicator 2e: New Zealand events -
Cultural Identity | Cultural Indicators for New Zealand

Page 42 Page 43
dEFInItIon
This indicator is expressed as the proportion of Māori able to hold an everyday conversation in Māori.
RAtIonAlE
One of the essential components of any culture is the language in which it is communicated. The degree to which Māori is spoken, both by Māori and non-Māori, is a measure of the extent to which Māori culture permeates New Zealand society and is valued by it. The indicator is focused on Māori but some information on non-Māori speakers of Māori is provided.
dAtA souRCE
Statistics New Zealand: 1996, 2001 and 2006 Censuses of Population and Dwellings. The census question asks people in which languages they can have a conversation about a lot of everyday things. It does not indicate how fluent or proficient people are in a given language, and is subject to variations in people’s assessment of their own ability to converse in the language.
CuRREnt lEvEl And tREnds
At the 2006 Census, 24 percent of those people identifying themselves as of Māori ethnicity stated they were able to hold an everyday conversation in Māori. This is slightly lower than the figure of 25 percent recorded in the 1996 and 2001 Censuses.
By contrast, in 2006 less than 1 percent of the non-Māori population identified themselves as being able to speak Māori, bringing the total number of Māori speakers to 157,110 or just over 4 percent of the total population. This was a slight fall from the 2001 total of 160,530 Māori speakers.
The apparent fall in the proportion of Māori language speakers should be treated with some caution as it is a relatively slight movement and it is not supported by data from the Survey on the Health of the Māori Language.1 This survey showed that 51 percent of Māori aged 15 years and over had some Māori speaking skills in 2006, up from 42 percent in 2001. The survey results are not directly comparable with those from the census, as the survey did not include people under the age of 15 years, and used a different methodology and a different measure of the ability to speak Māori. The survey counted as Māori speakers, all those who could “talk about simple/basic things in Māori” which results in a higher figure than the census question which asks whether people could “have a conversation about a lot of everyday things” in Māori.
The Survey on the Health of the Māori Language also provides data on the level of fluency in te reo which is not available from the census. The survey showed that of those who spoke Māori in 2006, 14 percent professed a high level of fluency, reporting that they could speak te reo Māori well or very well (up from 9 percent in 2001). However, almost half (48 percent) could speak no more than a few words or phrases in Māori.
sub-PoPulAtIon dIFFEREnCEs
AgeThe age profile of Māori speakers is clearly an important indicator of the future number and proportion of Māori speakers, given that the Māori population overall is heavily concentrated in the younger age groups. As Figure 24 shows, the proportion of Māori who speak te reo tends to increase with age. In 2006, less than quarter of people in all age groups under 40 reported being able to speak Māori, compared with around half of those in the 70-plus age groups. Between 2001 and 2006 most age groups experienced a decline in the proportions who could speak Māori. This might be expected in the older age groups as the oldest cohorts who were more likely to speak Māori declined in number while younger cohorts who were less likely to speak te reo moved into the older age groups. However, there was also a slight decline in the proportion of people under the age of 20 who were able to speak Māori.
1 Te Puni Kōkiri (2008), Te Oranga o te Reo Māori 2006: The Health of the Māori Language in 2006. Te Puni Kōkiri, Wellington. Available: http://www.tpk.govt.nz/en/in-print/our-publications/publications/the-health-of-the-Māori-language-in-2006/?q=language+survey [30 June 2009].
IndICAtoR 2a: sPEAkERs oF tE REo mAoRI¯
Cultural Indicators for New Zealand | Cultural Identity: Indicator 2a Cultural Identity: Indicator 2a | Cultural Indicators for New Zealand
Proportion of Māori Speaking Te Reo MāoriBy age group
2001–2006
Although the proportion of Māori speakers is lower in the younger age groups, the youthful age profile of the Māori population means that young people make up the greatest numbers of Māori speakers, as Figure 25 shows. In 2006, half of all Māori who spoke te reo were under the age of 30, including a quarter under the age of 15. However, there was a decline in the number of Māori speakers in the under-15 age groups between 2001 and 2006. In the same period, there were increases in the number of Māori speakers aged 40 and over owing to population growth in these age groups.
24 FIgURE

Page 44 Page 45Cultural Indicators for New Zealand | Cultural Identity: Indicator 2a
FIgURE 25 Number of Māori Speaking Te Reo MāoriBy age group2001–2006
GenderAmong Māori, a higher number of females (69,570, or 24 percent) than males (62,050, or 23 percent) reported the ability to speak Māori in 2006. This difference was similar to that in 2001. The 2002 Te Puni Kokiri report, Speakers of Māori within the Māori Population, made the point that “it is important to recognise the key role that many Māori women play in the transmission of the Māori language to future generations, as primary caregivers to their children.”2
EducationThe 2006 Census showed an association between level of educational achievement and the ability to speak Māori. Those with higher qualifications were more likely than others to speak Māori, including 37 percent of those with post-graduate degrees, 33 percent of those with bachelor’s degrees and 34 percent of those with tertiary diplomas. By comparison, just 26 percent of those with level 1-4 certificates (either school or post-school) and 24 percent of those with no qualifications were able to speak Māori.
RegionFigure 26 shows the proportion of Māori who spoke te reo Māori in each region in 2006. The highest proportion was in the Gisborne region where 32 percent of Māori spoke te reo. The three regions with the highest proportions of Māori in the local population – namely Gisborne, Bay of Plenty and Northland – were also the three regions with the highest proportions of Māori speakers of te reo Māori. Conversely, the seven South Island regions had the lowest proportions of Māori population and the lowest proportions of Māori speakers of te reo Māori. Te reo Māori therefore appears to be in better health in those regions with greater concentrations of Māori population. One of the great challenges would appear to be the improvement of Māori speaking rates in more populated areas, such as Auckland and Wellington. All regions experienced a decline in the proportion of Māori who spoke te reo, between 2001 and 2006.
2 Speakers of Māori within the Māori Population (2002), Te Puni Kōkiri, p15.
Cultural Identity: Indicator 2a | Cultural Indicators for New Zealand
Proportion of Māori Speaking Te Reo MāoriBy region
2006
26 FIgURE

Page 46 Page 47
IndICAtoR 2b: loCAl ContEnt on tElEvIsIon
dEFInItIon
First-run hours of local content as a proportion of the total television schedule.
The data covers the six major free-to-air channels. It includes TV1, TV2 and TV3, with the addition of Prime from 2005 onwards, and Māori TV and C4 from 2006 onwards. Subscription-based channels such as those on Sky television are excluded.
Local content is defined as material that is both predominantly made in New Zealand and reflects New Zealand identity and culture.
First-run hours exclude repeats. First-run hours include both peak or ‘prime’ (6pm-10pm) and off-peak programming between the hours of 6am and midnight. Prior to 2003, programming over a full 24 hours was recorded.
RAtIonAlE
The fact that television is the dominant cultural medium for many New Zealanders makes it a powerful means for communicating material that is made by, for, and about New Zealanders. Material which incorporates and expresses New Zealand themes provides a forum in which national identity may both be reinforced, but also questioned and reflected upon. A local content measure shows the extent to which we see elements of our culture reflected through this medium.
dAtA souRCE
New Zealand on Air: Local Content reports 2005-2008.
CuRREnt lEvEl And tREnds
Figure 27 shows first-run local content hours as a percentage of the total schedule. In 2008, around 26 percent of broadcast material was first run local content. The graph shows that the proportion of first-run local content has been lower in the last few years.
The drop in 2005 is largely explained by the inclusion of figures for Prime, which is a channel with a low proportion of local content programming. In that year, both TV2 and TV3 recorded lower local content figures also. From 2006, the proportion of first-run local content began to rise again, with the entry of Māori Television (showing 34 percent first-run local content in 2006) and C4 (showing 22 percent). By 2008, both these latter two channels had raised their first-run local content hours (40 percent for Māori TV and 25 percent for C4), at the same time as TV1 and TV3 had increased their first-run hours as well.
When the figures for the channels for which data was only recorded in the last three years are excluded, the proportion of first-run local content hours on TV1, TV2 and TV3 was largely static through 2003-2005 at around 26 percent. It dropped to below 26 percent in 2006, before increasing to 27 percent in 2007, and almost to 30 percent in 2008.
Cultural Indicators for New Zealand | Cultural Identity: Indicator 2b Cultural Identity: Indicator 2b | Cultural Indicators for New Zealand
First-run Local Content HoursAs percentage of total schedule
1999-2008
Notes
1) Figures for 1999-2004 are for three channels (TV1, TV2, TV3). From 2005, the data includes hours recorded for Prime. From 2006, the data includes hours recorded for C4 and Māori Television.
2) From 2003, figures are recorded for the hours 6am-midnight. For 1999-2002, the figures are for 24 hours.
3) Māori TV and C4 did not broadcast a full 18 hour free-to-air schedule in the years shown. For example, Māori TV broadcast around 3100 hours in all of 2006-2008, and C4 around 4500 hours, compared to a full 18-hour schedule of 6570 (6588 in a leap year). These exact figures for the reduced hours have been taken into account when calculating overall first-run local content hours.
27 FIgURE

Page 48 Page 49Cultural Indicators for New Zealand | Cultural Identity: Indicator 2b
TABLE 7
Table 7 shows that total hours of first-run local content on New Zealand television rose consistently over the past three years. Only TV2 and Prime recorded lower total hours in 2008 than in 2007, a drop that was more than compensated for by more local content being shown on channels such as TV1, TV3, and C4. Although not shown here, the additional channels now included in the figures means that total first-run hours are at a level considerably higher than in the past. There were 5698 first-run hours of local content in 2005 (over 4 channels), and 5231 in 2004 (over 3 channels).
First-run Hours of Local Content by ChannelTotal hours, and proportion of schedule2006-2008
2006 2007 2008
TV1 First-run hours 2997 3240 3427
Percent of schedule 46 49 52
TV2 First-run hours 875 689 622
Percent of schedule 13 10 9
TV3 First-run hours 1193 1416 1846
Percent of schedule 18 22 28
PRIME First-run hours 784 739 685
Percent of schedule 12 11 10
MĂORI TV First-run hours 1057 1233 1243
Percent of schedule 34 40 40
C4 First-run hours 993 908 1113
Percent of schedule 22 20 25
Total First-run hours 7899 8225 8936
Percent of schedule 23 24 26
8 TABLE
Table 8 presents data about first-run local content hours, by genre. In 2006, all genres had increased numbers of broadcast local content hours, with entertainment hours increasing by 128 percent, sport by 80 percent, and information programming by 50 percent. While some of these increases may be attributed to the additional channels (for example, C4 contributed 984 of 1431 entertainment hours in 2006), most genres continued to grow, with many showing increases in 2008 also; notably, news and current affairs had an increase of 723 hours (27 percent). It will be interesting to see whether these trends continue.
First-run Local Content HoursBy genre
1999-2008
2008 2007 2006 2005 2004 2003 2002 2001 2000 1999
Drama/ Comedy 245 351 251 230 175 217 247 206 182 180
Children’s 528 538 498 384 309 411 314 316 308 298
Documentary 302 299 374 313 227 190 164 197 168 230
Information 1386 1474 1069 715 866 920 963 991 893 743
Entertainment 1511 1271 1431 629 470 419 604 391 313 419
Māori 191 236 273 228 237 231 287 296 257 195
News, Current Affairs 3364 2641 2502 2362 2073 1945 2013 1692 1876 1835
Sport 1410 1415 1502 838 874 838 1157 766 1188 932
Total 8936 8225 7899 5698 5231 5171 5748 4855 5185 4832
Notes
1) 2000, 2004 and 2008 were leap years, thus providing an extra opportunity for local content programming.
2) Figures for 1999-2004 are for three channels (TV1, TV2, TV3). From 2005, the data includes hours recorded for Prime. From 2006, the data includes hours recorded for C4 and Māori Television.
3) From 2003, figures are recorded for the hours 6am-midnight. For 1999-2002, the figures are for 24 hours.
Another useful measure of local content programming is the proportion of prime time (6pm-10pm) local content. During these four hours, the networks compete to attract the greatest number of viewers to generate maximum income. The bulk of network commissioning budgets is spent in this time band.
Cultural Identity: Indicator 2b | Cultural Indicators for New Zealand

Page 50 Page 51Cultural Indicators for New Zealand | Cultural Identity: Indicator 2b
FIgURE 28
Figure 28 shows figures for prime time programming over ten years. As with previous measures, figures for Prime TV have been added from 2005, and Māori TV and C4 from 2006. The graph shows that the proportion of local content in prime time declined significantly in 2005 with the entry of Prime (which delivered only 9 percent of local content in 2005). Since then the proportion has recovered to previous levels, with Prime improving its percentage of prime time local content, and both Māori TV and C4 having high proportions of local content in these hours. There is no clear pattern underlying the recent slight decline in local content, with levels of prime time local content fluctuating from year to year across all of the channels.
Prime Time Local Content HoursAs percentage of prime time schedule (6pm-10pm)1999-2008
Cultural Identity: Indicator 2c | Cultural Indicators for New Zealand
dEFInItIon
Viewer ratings for Māori TV by Māori and non-Māori viewers of this channel.
RAtIonAlE
Māori TV began broadcasting in 2004. The ratings for Māori TV provide one measure of the level of interest in Māori culture.
dAtA souRCE
AGB Nielsen Media Research, Quarterly ratings data.
Nielsen uses measuring equipment (“the peoplemeter”) hooked up to each television set in 500 households across New Zealand. This equates to a sample of approximately 1250 people. Each household member is assigned a button on a special remote which records their viewing.
The indicator shows the average proportion of people watching Māori TV out of all the people watching television throughout the day, or ‘all-day channel share’. ‘Channel share’ is a measure of which channels people watch when they are watching television.
At present, ethnicity data for viewers of Māori TV is not available.
CuRREnt lEvEl And tREnds
Ratings data has recently become available for Māori TV. The data shows that in both Quarter Four of 2008 and Quarter One of 2009, the average all-day channel share for Māori TV was 0.6 percent. By way of context, on average around 13 percent of the population over five years old was watching television at any time of the day, and 33 percent of the population over five was watching television during peak time.
Figure 29 shows how Māori TV’s audience share compares to other channels in New Zealand. While the Māori TV figure is low, it is only recently that its channel share figure has been high enough for separate figures for Māori TV to be released by Nielsen AGB Media Research. In itself, this is a positive development. When the cultural indicators are published again, this indicator will have a significantly longer time series available.
All-day Audience Share, Selected ChannelsPercentage
Quarter 4 2008 and Quarter 1 2009
The channel share for Māori TV is somewhat higher for peak time audiences, with a 0.7 percent rating being achieved in both quarters for which data is available.
The all-day channel share was also 0.7 percent in the Auckland region for Māori TV, while the peak time channel share for Auckland was 0.9 percent.
29 FIgURE
IndICAtoR 2c: mAoRI tv RAtIngs¯

Page 52 Page 53Cultural Indicators for New Zealand | Cultural Identity: Indicator 2d
IndICAtoR 2d: thE ImPoRtAnCE oF CultuRE to nAtIonAl IdEntIty
dEFInItIon
The proportion of New Zealanders who believe that culture and cultural activities are important to New Zealand’s sense of national identity.
For the purposes of the survey underlying this indicator, culture and cultural activities are defined as a combination of:
our past and present languages, traditions and beliefs, as reflected in museums, historic places and libraries, -on marae, television, radio, the internet and in films; andactivities such as dance, classical and modern music, the visual arts, theatre, reading books and magazines, -and other forms of crafts and hobbies.
RAtIonAlE
Many things influence and generate a sense of national identity. This indicator isolates perceptions of the role of culture and cultural activities in forming that identity and provides comparisons with the role of other factors which are important to national identity.
dAtA souRCE
Ministry for Culture and Heritage: How Important is Culture? New Zealanders’ Views in 2008, February 2009.
CuRREnt lEvEl And tREnds
Figure 30 shows that in 2008, almost three-quarters (73 percent) of New Zealanders surveyed responded that culture and cultural activities were either very important (45 percent), extremely important (18 percent) or critically important (11 percent) to New Zealand’s sense of national identity.1 Another 24 percent rated culture and cultural activities as ‘somewhat important’.
Importance of Culture and Cultural Activities to New Zealand’s Sense of National Identity2008
1 Figures do not add to total due to rounding.
FIgURE 30
When compared with a number of other factors which contribute to national identity (see Figure 31), the proportion who ranked culture and cultural activities as at least very important was below that of landscape and environment (81 percent), and innovation, science and technology (77 percent), but higher than sports (64 percent), or business and the economy (70 percent).
Importance of Contributing Factors to New Zealand’s Sense of National Identity2008
When asked which of these factors was the most important in creating a sense of national identity, 17 percent of respondents chose culture and cultural activities – second only to landscape and the environment (21 percent) and equal with race relations and diversity.
This, and previous surveys in 1994 and 1997, also asked respondents for their views on the statement: New Zealand’s culture and cultural activities give people a sense of national identity. In each of the surveys just over half the respondents strongly agreed with this statement: 53 percent in 2008, compared with 51 percent in 1997, and 54 percent in 1994.
31 FIgURE
Cultural Identity: Indicator 2d | Cultural Indicators for New Zealand

Page 54 Page 55Cultural Indicators for New Zealand | Cultural Identity: Indicator 2d
sub-PoPulAtIon dIFFEREnCEs
GenderWomen were more likely than men to rate culture and cultural activities as being at least very important to New Zealand’s sense of national identity. In all, 78 percent of women rated culture and cultural activities as either very important (47 percent), extremely important (20 percent) or critically important (11 percent). By comparison, 69 percent of men rated culture and cultural activities as very important or higher (43 percent very important, 16 percent extremely important and 10 percent critically important).
While 21 percent of women felt that culture and cultural activities represented the most important contributor to national identity, just 14 percent of men did so. For women, this made it the most important contributor alongside race relations and diversity, while for men it ranked below landscape and environment, and sports.
AgeAround three-quarters of people in all age groups up to 60 rated culture and cultural activities as being at least very important to New Zealand’s sense of national identity, as Figure 32 shows. Those in the 60-plus age group were less likely to do so, with two-thirds rating culture as very important or higher. People aged 25– 39 were the most likely to regard culture as extremely important or critically important to national identity (34 percent).
Importance of Culture and Cultural Activities to New Zealand’s Sense of National IdentityBy age group2008
FIgURE 32
When asked which factor was the most important in creating a sense of national identity, culture and cultural activities was chosen by 13 percent of 18-24 year-olds, 19 percent of 25-39 year-olds, 20 percent of 40-59 year-olds and 11 percent of those aged 60 and over. This made it the second most important factor for the 25-39 and 40-59 age groups, behind landscape and environment.
RegionPeople who lived in Otago were the most likely to regard culture and cultural activities as being at least very important to New Zealand’s sense of national identity (80 percent), followed by Wellington (77 percent), and Auckland and the non-metropolitan North Island regions (both 74 percent). People in Waikato and Canterbury were the least likely to rate culture as very important or higher (both just under 70 percent).
Wellingtonians were the most likely to rate culture and cultural activities as the most important factor in creating a sense of national identity (27 percent), followed by those in Waikato and Otago (both 20 percent). The regions where culture rated least highly were the non-metropolitan South Island regions (12 percent), the non-metropolitan North Island regions and Canterbury (both 15 percent).
Importance of Culture and Cultural Activities to New Zealand’s Sense of National Identity
By region2008
33 FIgURE
Cultural Identity: Indicator 2d | Cultural Indicators for New Zealand

Page 56 Page 57Cultural Indicators for New Zealand | Cultural Identity: Indicator 2e
IndICAtoR 2e: nEw ZEAlAnd EvEnts
dEFInItIon
Proportion of New Zealand shows, performances and exhibitions at a national sample of venues.
RAtIonAlE
One way of monitoring the vitality of New Zealand culture is to track the outputs from creative activities that are available to New Zealanders. Surveying a range of venues around New Zealand about the New Zealand content in the cultural activities taking place at these venues provides one way of measuring such vitality.
dAtA souRCE
Ministry for Culture and Heritage: Venues Survey, 2008; New Zealand Census of Population and Dwellings, 2006, Statistics New Zealand.
New Zealand content, for the purposes of this indicator, is defined as: “shows, performances or exhibitions where the content is substantially about New Zealand or New Zealand themes. ” For example, a film such as Lord of the Rings would not be counted as a New Zealand event despite its production being substantially New Zealand based.
CuRREnt lEvEl And tREnds
In the 2008 Venues Survey, 5260 events with a substantial New Zealand content were held in the previous year (July 2007 to June 2008 inclusive). This represents 33 percent out of a total of 15,965 events.
The events with New Zealand content can be looked at by event type. This distribution is shown in Table 9 and Figure 34. While film was the largest category of activity or event overall, it had a relatively small number of events with New Zealand content. There were more visual art exhibitions with New Zealand content than any other type of activity, with there also being a large number of New Zealand content based popular music performances. ‘Other’ events was made up of such activities as storytelling, talks and lectures on New Zealand cultural themes, craft workshops, historical re-enactments, and non-museum based exhibitions.
Figure 34 shows the proportion of New Zealand content events in each event type. The highest category, unsurprisingly, is Māori performing arts. Such events are by definition made up of New Zealand content. New Zealand themes comprised the content of well in excess of half of both visual art exhibitions and museum exhibitions, and around half of all popular music performances. The lowest proportion, leaving aside ethnic performing arts, was film, followed closely by opera and musicals.
9 TABLE Number of New Zealand Shows, Performances and ExhibitionsBy event type
New Zealand content Total
Visual art - exhibitions 937 1571
Popular music performances 884 1774
Māori performing arts 682 682
Theatre performances 638 1696
Museum exhibitions 539 797
Classical music performances 329 916
Other performing arts 296 1072
Other 273 987
Film 272 4394
Dance performances 244 710
Opera, musicals or other musical theatre 119 835
Festivals 68 223
Ethnic performing arts 0 308
Total 5281 15965
Proportion of New Zealand Shows, Performances and ExhibitionsBy event type
34 FIgURE
-
Cultural Identity: Indicator 2e | Cultural Indicators for New Zealand

Page 58 Page 59Cultural Indicators for New Zealand | Diversity
Theme 3: DiversitydIsCussIon
Three key ideas underlie this theme:
New Zealanders are positive about the contribution that cultural diversity makes to the fabric -of their communitiesNew Zealanders of all cultural backgrounds are free to express themselves through arts, culture and heritage -events and activities The diversity of New Zealand’s communities is recognised as an essential part of New Zealand’s culture. -
New Zealanders, or their forebears, come from a wide range of cultural backgrounds. Acceptance of these cultures, and avoidance of discriminatory attitudes towards them, is important to the maintenance of peace and harmony in New Zealand society. This acceptance can be seen in the expression of a wide variety of artistic and other cultural activities.
Artistic cultural expressions are attractive as a means for encouraging the acceptance of diverse cultures, because they are seen as legitimate expressions of a particular culture’s identity. There are not the same pressures to conform to the main culture(s) as there might be in other activities.
One important aspect of the diversity outcome is the level of recognition by the wider community that cultural diversity exists. This is shown by the extent of active involvement in, or assistance towards these cultural activities by the wider community.
IndICAtoRs
Indicator 3a: Grants to minority ethnic cultural groups -Indicator 3b: Attendance/participation at/in ethnic cultural activities -Indicator 3c: Minority culture activities -
Diversity: Indicator 3a | Cultural Indicators for New Zealand
IndICAtoR 3a: CultuRAl gRAnts to mInoRIty EthnIC gRouPsdEFInItIon
This indicator is an index of the percentage of grants made by the New Zealand Lottery Grants Board (LGB) for arts, culture and heritage purposes to non-Māori and non-New Zealand European ethnic organisations and individuals, relative to those ethnic groups’ percentage of the population of New Zealand.
RAtIonAlE
This indicator looks at the level of support that is directed toward minority ethnic cultures, as opposed to the more dominant ones.
The New Zealand LGB is a significant funder of cultural activities through the allocation of the proceeds of lotteries collected by the New Zealand Lotteries Commission. While it only represents a proportion of the grants made to cultural activities each year from a variety of sources, its importance and the availability of information about its grants make it a useful indicator.
dAtA souRCE
The New Zealand Lottery Grants Board grants applications/allocations, 2004-08.
See Appendix D for notes on how the indicator is constructed. In particular, minority broadly means non-Māori and non-New Zealand European (or equivalent classifications) ethnic groups. The Appendix explains the particular groups which are included.
The analysis excludes the Lottery grants made to Creative New Zealand, the New Zealand Film Commission, and the New Zealand Film Archive.
Population data is sourced from the 2006 Census of Population and Dwellings.
CuRREnt lEvEl And tREnds
In the 2007-08 funding year, the LGB distributed $26.9 million of grants for cultural activities (as classified by the New Zealand Framework for Cultural Statistics), across 688 funding groups or individuals. Of these cultural grants, $2.5 million (9.4 percent) was distributed to minority ethnic organisations or individuals. This compares with the 19.3 percent of the population who had a minority ethnic affiliation at the 2006 Census. Therefore, the Index stands at 49 percent, down from 60 percent in 2006-07, but significantly higher than in 2004-05 (14 percent).

Page 60 Page 61Cultural Indicators for New Zealand | Diversity: Indicator 3a
Percentage of Cultural Grants to Ethnic Minority GroupsRelative to proportion in population2004-2008
Table 10 presents data about the dollar value of grants to various ethnic groupings for the last four financial years. The value of overall cultural grants made by the LGB rose 98 percent, which is in line with the overall rise in grants made for all purposes of 93 percent (cultural grants made up 27.4 percent of all grants in 2004-05, rising to 28 percent in 2007-08). This rise is far outstripped by the rise in cultural grants made to minority ethnic groups (604 percent). This rise has occurred at the same time as a significant rise in the number of people within the New Zealand population identifying with one or more ethnic minorities (from around 14 percent in 2001 to 19 percent in 2006). For this reason, the Index itself has not risen to the same degree.
The figures have been broken down into three broad ethnic minority groupings. Grants to all three of the ethnic minority groupings have risen significantly, but it is the Asian minority cultures which have had the most significant rise in Lottery Grants funds (1563 percent over four years). Grants to Pacific ethnicities have grown at a similar rate to the overall growth (593 percent), while growth in grants to other ethnicities has been more in line with the overall growth in Lottery Grants funds more generally (cultural and non-cultural).
Allocation of Lottery Grants Board Grants for Cultural Purposes (Dollars)2004-2008
Funding year Total cultural grants
Total cultural grants to minority ethnic groups
Asian PacificOther
minorities
2004-05 13,535,558 360,678 44,725 251,733 88,720
2005-06 15,567,927 674,808 212,975 371,066 93,717
2006-07 18,424,616 2,143,960 377,845 1,683,655 151,950
2007-08 26,859,663 2,537,719 743,912 1,743,677 177,156
FIgURE 35
TABLE 10
A significant portion of grants made for cultural purposes are not directed specifically at one or more particular ethnic groups, whether New Zealand European, Māori, or one of the minority cultural groupings. Another way of considering the data is to exclude these non-ethnic specific grants. With these grants excluded, the proportion of grants made by the LGB comes much closer to the proportion of the population made by ethnic minorities. In 2007-08, of all ethnically specified cultural grants, 16.4 percent went to ethnic minorities, compared to their proportion in the population at the 2006 Census of 19.3 percent. Figure 36 presents data for individual
ethnic groupings.
Ethnically Specified Grants by Minority Ethnic GroupingAs proportion of all ethnically specified cultural grants
2004-2008
Figure 36 shows that despite more grants being made to Asian ethnicities, this group is still significantly under-represented in grant funding, as are ‘Other’ ethnic groups. This is contrasted by the Pacific ethnicities, which have been over-represented over the last two years.
More generally, the most noticeable trend appears to be the leap in grants made to the Asian and Pacific groupings from the 2005-06 financial year to the 2006-07 financial year. A combination of several large grants for capital projects, and increased specificity in identifying the groups associated with funded projects, is responsible for this jump. The number of grants not specifically associated with an ethnicity dropped in 2006-07 to around a third, from its usual level of around a half of all grants (though the proportion of ethnically unspecified grants rose again the following year).
36 FIgURE
Diversity: Indicator 3a | Cultural Indicators for New Zealand

Page 62 Page 63Cultural Indicators for New Zealand | Diversity: Indicator 3b
IndICAtoR 3b: AttEndAnCE At And PARtICIPAtIon In EthnIC CultuRAl ACtIvItIEsdEFInItIon
This indicator is expressed as the percentage of the population aged 15 years and over attending/participating in at least one cultural activity in the year before the survey.
It is important to note that ethnic cultural activities in both categories exclude New Zealand European/Pākehā or Māori activities. It should also be noted that no distinction can be made between attending an event and participating actively. More information about participation would allow conclusions to be drawn not only about diversity but also about links between groups (and about one aspect of social cohesion).
RAtIonAlE
Attendance at ethnic events is one measure of the general population’s level of interest in diverse cultural groups and in communicating across cultural groupings.
This indicator is a subset of an unpopulated indicator that is intended to encompass involvement in the wider span of community activities, as defined by the New Zealand Framework for Cultural Statistics. This would include religious activities, ethnic cultural activities, and other secular activities.
dAtA souRCE
Statistics New Zealand: Cultural Experiences Survey, 2002.
Information about two types of ethnic events is presented. The first was referred to in the CES questionnaire as “ethnic cultural activit[ies] such as food fairs, film evenings or any other ethnic activity”, but excluded church activities and performing arts activities. The other type of ethnic event which the CES questionnaire covered was any “cultural performance of ethnic song or dance”. Data from the two questions cannot simply be aggregated to produce a single ethnic activity indicator as the questions in the CES dealing with the two types of activity were not necessarily exclusive of each other.
CuRREnt lEvEl And tREnds
Overall, it is estimated that 18 percent of the population attended at least one ethnic cultural activity in the year before the survey, while 15 percent of the population attended at least one ethnic performing arts activity in the year before the survey. Trend data will not be available until the Cultural Experiences Survey is repeated, or new data becomes available through other sources.
sub-PoPulAtIon dIFFEREnCEs – EthnIC CultuRAl ACtIvItIEs
The CES showed that 14 percent of European/Pākehā, 20 percent of Māori, 39 percent of Pacific peoples, and 37 percent of other ethnicities attended or participated in an ethnic activity during the year. Of those attending such an activity, 61 percent were European/Pākehā, 11 percent were Māori, 11 percent were Pacific peoples, and 17 percent belonged to other ethnic groups. By comparison, the ethnic breakdown of the adult population was 77 percent European, 10 percent Māori, 5 percent Pacific peoples and 8 percent of ther ethnicities. Unsurprisingly, the figures are relatively high for people from Pacific and Other ethnic groups , who are likely to be attending events relating to their own cultures (though it is not possible from the data to tell exactly what type of ethnic events are being attended by which people). It does show that a large number of European/Pākehā and Māori are also attending other ethnic cultural events.
The majority of those attending or taking part in ethnic cultural activities were women – at 54 percent this was slightly higher than their representation in the surveyed population.
When looked by age group, attendance is relatively consistent for age groups between 15 and 54 years, with about one-fifth of people within this age range attending or participating in an ethnic cultural activity. The rate of attendance then tails off, so that for those over 65 years, only 9 percent attended such activities. Those in the younger age groups are therefore somewhat over-represented, and those in the older age groups very much under-represented.
Whether people were employed or unemployed made little difference to attendance rates, though those ‘not in labour force’ attended slightly less – perhaps because this group includes large proportions of older people. Those who had no educational qualification (about 25 percent of the surveyed population) attended considerably less than those who had a secondary qualification or higher. Between secondary and tertiary qualifications there was little difference in attendance rates. Neither did personal income seem to have a substantial impact on attendance rates.
One factor which unsurprisingly was associated with markedly different rates of attendance at ethnic cultural events was location. Over one-fifth (21 percent) of those in the main urban areas had attended an event in the previous year, compared with 12 percent and 9 percent in secondary urban, and minor urban/rural areas, respectively. This trend was driven particularly by Auckland and Wellington, as can be seen in Figure 37, reflecting the larger ethnic communities in these regions.
Percentage of Population in Each Region Attending an Ethnic Cultural Activity in Last 12 Months
37 FIgURE
Diversity: Indicator 3b | Cultural Indicators for New Zealand
0 5 10 15 20 25 30
Northland
Auckland
Waikato
Bay of Plenty
Gisborne / Hawke's Bay
Taranaki
Manawatu / Wanganui
Wellington
Nelson / Tasman / Marlborough /
West Coast
Canterbury
Otago
Southland

Page 64 Page 65Cultural Indicators for New Zealand | Diversity: Indicator 3b
sub-PoPulAtIon dIFFEREnCEs – EthnIC PERFoRmIng ARts
For ethnic performing arts, the proportions of each population attending were 11 percent of European/Pākehā, 21 percent of Māori, 51 percent of Pacific Peoples, and 30 percent of other ethnicities. This meant that of those attending such events, 54 percent were European/Pākehā, 13 percent Māori, 17 percent Pacific Peoples and 16 percent Other. As with ethnic cultural activities, this is not a surprising result, as many of the ethnic performing arts activities are likely to attract disproportionately high numbers of people from ethnic groups related to those performances. At the same time, two-thirds of the attendees were either European/Pākehā or Māori, which suggests that these performing arts are not simply minority activities for minority cultures.
Those in the 15- to 24-years age group were the most likely to attend ethnic performing arts, with over a fifth of people in this age group having attended an event in the previous 12 months. Around 16 percent of those between 15 and 54 years had attended such an event, with declining attendance in the older age groups.
The pattern of attendance by education was similar to that seen for ethnic cultural activities, in that those with secondary or tertiary qualifications had similar attendance rates. Those with no qualification had considerably lower attendance at ethnic performing arts.
Labour force status did seem to be an important factor, with around a quarter of unemployed people having attended an event in the past 12 months, compared with only 16 percent of employed people and 14 percent of those not in the labour force. It is not entirely clear why this pattern is different to that for ethnic cultural activities (see above), and is not duplicated when one looks at personal income, where similar proportions of people in each income group (15–16 percent) attended performances. When information on barriers to cultural performing arts events is considered, the picture remains unclear. One of the most commonly cited reasons for not attending was lack of time. Cost of tickets was also a factor, though not as frequent a barrier as lack of time. Because of the sample size it is not possible to analyse barriers for various demographic groups (such as unemployed people).
The main urban areas dominated attendance rates, although compared with ethnic cultural activities, Wellington is much less prominent, with around 18 percent of people attending an ethnic performing arts event. Most other regions had slightly higher attendance rates for ethnic performing arts than for ethnic cultural activities. It may be that there are differences between actually participating (in the cultural activities) and simply attending (for performing arts), but as noted above, this distinction is not able to be made from the data.
FREquEnCy oF AttEndAnCE
The Cultural Experiences Survey also collected data on the frequency with which people attended activities.
Of those who had attended ethnic cultural activities in the 12-month reference period, almost half attended only once. About a quarter had attended each of two activities (27 percent), or three or more activities (24 percent). A similar pattern existed for age groups, although those aged 15–34 years were more likely to have attended two or more ethnic activities in the year. The only significant difference in the pattern was associated with ethnicity. Well over half (57 percent) of European/Pākehā people attended only one ethnic cultural activity, with less than a fifth (18 percent) attending three or more activities. By contrast, more Pacific people attended three or more activities (41 percent) than either one (31 percent) or two (28 percent) activities. For other ethnicities, the distribution was more even across the categories. When looked at by region, the likelihood of attending just one activity was strongest in the provincial regions (where there are presumably fewer opportunities to attend), and weakest in the metropolitan regions.
For ethnic performing arts, very similar trends were evident, with minor variations. Overall, 58 percent of people who attended ethnic performing arts activities in the reference period did so only once; with 21 percent attending twice, and 21 percent three or more times. The age group most likely to attend three or more ethnic performing arts events was the over 65 years group. The Cultural Experiences Survey identified lack of time as the most common reason people did not attend more ethnic cultural performances, so this may be an explanation. Those of Pacific ethnicity were also more likely to have gone to multiple performances in the 12 months, with those of Other ethnicities and Māori people somewhat more likely to have attended more than once. Again, main urban areas were more commonly associated with multiple attendance, though not as strongly as for ethnic cultural activities.
Diversity: Indicator 3c | Cultural Indicators for New Zealand
IndICAtoR 3c: mInoRIty CultuRE ACtIvItIEs
dEFInItIon
The proportion of arts, culture and heritage events and activities produced by minority cultures, taking place at a national sample of venues.
For the purposes of the Venues Survey, minority ethnicities are ethnic groups other than Māori or New Zealand European.
RAtIonAlE
If the number of events and activities taking place and produced by minority cultures is small, then there are likely to be constraints on freedom of expression, and limits to the degree of cultural diversity finding expression, through the arts, culture and heritage.
dAtA souRCE
Ministry for Culture and Heritage: Venues Survey, 2008.
CuRREnt lEvEl And tREnds
The Venues Survey recorded 606 minority culture events in the previous year. This represents 4 percent of the total number (15,965) of events cited in the survey. This compares to the 19.3 percent of the population who had a minority ethnic affiliation at the 2006 Census. 24 percent of venues indicated that their venue had hosted at least one minority culture event over the past year.
Respondents were asked to nominate the main ethnicity associated with the events held. Several of the Pacific Island nations featured strongly, with 259 Pacific peoples’ events being held. This was 1.6 percent of the events recorded by the survey (compared to those identifying as Pacific ethnicity comprising 7 percent of the New Zealand population at the 2006 Census).
There were 210 Asian events recorded by respondents. This was 1.3 percent of the events recorded by the survey (compared to those identifying as Asian ethnicity comprising 9 percent of the population).
There were also a large number of events (137) which respondents identified as minority culture events, but they were not assigned a main ethnicity, or were outside the 15 ethnicity options provided.
Figure 38 shows that 50 venues hosted minority culture visual art exhibitions, 46 venues hosted festivals, and 41 venues hosted dance performances.

Page 66 Page 67Cultural Indicators for New Zealand | Diversity: Indicator 3c
Number of Venues Holding Minority Ethnic EventsBy event type
FIgURE 38
Social Cohesion | Cultural Indicators for New Zealand
Theme 4: Social CohesiondIsCussIon
The theme of social cohesion addresses the issue of social connectedness. It also addresses the role that participation in arts, culture and heritage events and activities play in those connections.
This is based on the idea that arts, culture and heritage events and activities are a means by which New Zealanders can communicate across social, economic, cultural and ethnic groups. Diverse communities and individuals share common understandings that enable them to work collaboratively to achieve common goals.
Social cohesion is fostered both by membership of community groups and by communication between such groups. Participation provides a sense of belonging for individuals at a personal level – and the contacts which those groups make at a collective level go on to provide individuals with a sense of awareness and tolerance for both the different and the common perspectives of others. Cultural events and activities have a potential role in creating points at which people from diverse cultural backgrounds can interact positively.
IndICAtoRs
No indicators for this theme are populated at present, although two have been identified for future development when information is available.
Indicator: Non-Māori attendance at Māori cultural events
Definition: Proportion of non-Māori attending a sample of Māori cultural events.
Rationale: One element of social cohesion is the degree to which people belong to various groups and communities in society. Another is the degree to which those groups communicate and interact with each other. This indicator is intended to measure how non-Māori New Zealanders engage with the culture of the indigenous people of New Zealand.
Discussion: This indicator will require a special survey of Māori cultural events. A suitable sample of events will need to be agreed upon. To enable meaningful comparisons from one year to another, the sampled events will need to be restricted to those that are repeated on a regular basis. It is likely that the indicator will require a separate custom survey as there is little commonality with other survey-based indicators.
Indicator: Other-ethnicities attendance
Definition: Involvement in community arts, culture and heritage groups by members of ethnic groups which are not Māori or New Zealand European/Pākehā.
Rationale: Cultures other than Māori and New Zealand European/Pākeha have important contributions to make to shared cultural identity. The degree to which people of these ethnic identities participate both in arts, culture and heritage activities of other ethnic groups and also within their own ethnic group is intended to be one measure of social inclusion and cohesion.
Discussion: This indicator requires considerable development before it can be populated. This will include being clear about what is intended to be measured, and how that might actually occur.
Page 68 Page 69
Indicator: Community cultural experiences
Definition: The percentage of people taking part in religious activities, ethnic cultural activities, and other secular activities (NZFCS sub-categories 811, 821 and 822), and the frequency of participation.
Rationale: There are two key issues here. One is that social cohesion and capital is built by creating strong community and cultural groups. Another is that social cohesion can be built by increasing relationships and understanding across and between different cultural communities. The first of these simply requires that people are getting involved in such groups. The second would require an indicator to show the extent to which people of one ethnicity were, for example, participating in the activities of other ethnicities.
Discussion: The closest measure of involvement that is feasible from presently available information comes from the Cultural Experiences Survey (CES). This survey classifies the respondents attending by their ethnicity, but does not classify the ethnicity of the events that respondents took part in. And so the extent to which cross-cultural relationships are being enhanced cannot be directly addressed.
Furthermore, the 2002 CES asked respondents only about participation/attendance in ethnic cultural activities (NZFCS sub-category 821); it did not ask about religious or other secular community activities. This indicator cannot, therefore, be populated.
Economic Development | Cultural Indicators for New Zealand
Theme 5: Economic DevelopmentdIsCussIon
Economic development is about the ability of the cultural sector to contribute to the overall growth of the New Zealand economy. A cultural sector that is financially healthy is able to provide more employment opportunities for New Zealanders – and also provides the opportunity to raise the incomes of those working in the cultural sector. A cultural sector that is growing because it is receiving increased income from cultural consumers is also indicative of a population that appreciates the contribution that the creative and cultural industries make to New Zealand life.
Data on employment and incomes have been discussed in earlier parts of this report – see Theme 1: Engagement (indicators 1a to 1c). This section focuses more closely on the amount of value-added by the cultural sector (and in particular the creative industries) from its ‘raw materials’ of people and capital. This is looked at both as a stand-alone measure and compared with the economy as a whole. In other words, is the cultural sector growing and how does its growth compare with that of other industries?
IndICAtoRs
Indicator 5a: Income of the cultural industries -Indicator 5b: Value-added contributed by the creative industries -Indicator 5c: The creative industries’ proportion of total industry value-added -
Cultural Indicators for New Zealand | Social Cohesion

Page 70 Page 71Economic Development: Indicator 5a | Cultural Indicators for New Zealand
IndICAtoR 5a: InComE oF thE CultuRAl IndustRIEs
dEFInItIon
This indicator is expressed as the value of the sales of goods and services and other income of the cultural industries in constant prices.
RAtIonAlE
The long-term viability of the cultural industries depends on the value people place on them. One measure of this value is the willingness of people to spend their money on the products and services of the cultural industries.
dAtA souRCE
Statistics New Zealand: Annual Enterprise Survey (AES).
The results reported below must be treated with some caution as the data has been interpreted in a way which was not originally intended when it was collected as part of the AES. Many of the series here are therefore unofficial. Also, due to confidentiality requirements Statistics New Zealand cannot release certain financial data where the industries consist of a small number of businesses, or where industries are dominated by one or two large businesses.
CuRREnt lEvEl And tREnds
Figure 39 shows changes in the level of income between 2005 and 2007 in constant prices, deflated to dollar values for the year 2005 in order to remove the effect of price changes.1 From 2005 to 2006 the income of the cultural industries increased by four percent in real terms, from $11.9 billion to $12.4 billion. The following year saw a slight fall to $12.3 billion – still three percent higher than in 2005.2
In current prices, the value of sales of goods and services and other income in the cultural industries amounted to $12.5 billion in 2007.
1 See the definitions and notes section for a description of the methods used to deflate the data. 2 Owing to classification changes, these figures are not comparable with those reported in Cultural Indicators for New Zealand 2006. In that report
cultural industries were classified according the ANZSIC96 classification, while the current indicator is based on the ANZSIC06 classification. While some cultural industries are unaffected by the classification changes, in other cases there have been some changes in the activities covered by particular industry categories, meaning that the aggregated data for all cultural industries cannot be compared.
Cultural Indicators for New Zealand | Economic Development: Indicator 5a
Sales of Goods and Services and Other Income for Cultural IndustriesConstant price series
2005–2007
Table 11 shows a breakdown of the income of individual industries within the cultural sector in constant prices. The publishing, printing, advertising services and broadcasting industries were the four biggest income earners in the cultural sector from 2005 to 2007. Most industries experienced increases in real incomes during this period, with the largest numerical increases being in advertising services; newspaper, book and stationary retailing; and architectural services. Significant percentage increases were also recorded for some smaller earners such as pre-school education, arts education and library and other information services. The largest fall in income between 2005 and 2007 was in the largest earning industry – publishing. Motion picture and sound recording activities also experienced a considerable drop in income between 2006 and 2007.
These trends are reflected in Table 12, which shows changes in the relative contribution of individual industries to the total income of the cultural sector. While there was no change in the order of the largest income earners between 2005 and 2007, there were slight falls in the share of cultural sector income provided by the publishing and motion picture and sound recording industries. No industries increased their share of cultural sector income by more than one percentage point over this period.
39 FIgURE

Page 72 Page 73
Sales of Goods and Services and Other Income for Cultural Industries1
Constant price series $(million)2
2005–2007
Industry 2005 20063 20073
Printing (including reproduction of recorded media) 1,818 1,788 1,806
Book and magazine wholesaling 299 284 287
Entertainment media retailing 157 189 145
Newspaper, book and stationery retailing 897 964 1,036
Publishing (except Internet and music publishing) 2,263 2,210 2,053
Motion picture and sound recording activities 1,284 1,376 1,130 Broadcasting (except Internet) 1,320 1,381 1,418
Library and other information services 339 401 434
Video and other electronic media rental 133 207 142
Architectural services 504 491 617 Other specialised design services 578 667 671 Advertising services 1,407 1,510 1,558
Professional photographic services 79 86 93
Pre-school education 115 126 190 Arts education 14 13 19
Museum operation 68 59 67 Creative and performing arts activities 319 314 308 Other interest group services nec4 288 304 305
Total 11,881 12,370 12,280
1 This data is mostly at a lower level than designed industry groupings. Because sample sizes and weights are designed at a higher level, sample error at lower levels is not controlled for, and year on year data movements should be interpreted in the context of possible changing sample sizes.
2 Each industry is deflated by the most relevant PPI or CPI deflator available. Some of these deflators have limited representation of prices in the AES industries, as they are below design level and may only include prices on a small number of items.
3 Figures for 2006 and 2007 are provisional.
4 Interest groups nec (not elsewhere classified) includes associations, clubs or organisations for the promotion of community interests. It also includes units of political parties. Although not all of this activity is ‘cultural’, some does fall within the community and government activities category of the Framework for Cultural Statistics.
TABLE 11
Economic Development: Indicator 5a | Cultural Indicators for New ZealandCultural Indicators for New Zealand | Economic Development: Indicator 5a
Sales of Goods and Services and Other Income for Cultural IndustriesPercentage of total cultural sector income
Constant price series 2005–2007
Industry 2005 2006 2007
Printing (including reproduction of recorded media) 15.3 14.5 14.7
Book and magazine wholesaling 2.5 2.3 2.3
Entertainment media retailing 1.3 1.5 1.2
Newspaper, book and stationery retailing 7.5 7.8 8.4
Publishing (except Internet and music publishing) 19.0 17.9 16.7
Motion picture and sound recording activities 10.8 11.1 9.2
Broadcasting (except Internet) 11.1 11.2 11.5
Library and other information services 2.9 3.2 3.5
Video and other electronic media rental 1.1 1.7 1.2
Architectural services 4.2 4.0 5.0
Other specialised design services 4.9 5.4 5.5
Advertising services 11.8 12.2 12.7
Professional photographic services 0.7 0.7 0.8
Pre-school education 1.0 1.0 1.5
Arts education 0.1 0.1 0.2
Museum operation 0.6 0.5 0.5
Creative and performing arts activities 2.7 2.5 2.5
Other interest group services nec (4) 2.4 2.5 2.5
Total 100.0 100.0 100.0
Notes: See Table 11.
12 TABLE

Page 74 Page 75Economic Development: Indicator 5b | Cultural Indicators for New Zealand
IndICAtoR 5b: vAluE-AddEd ContRIbutEd by thE CREAtIvE IndustRIEsdEFInItIon
This indicator is expressed as the value added by the creative industries in year 2005 dollars expressed as an index (2005 equals 100 on the index).
Value-added is defined by Statistics New Zealand as: “The amount added to goods and services by the contributions of capital and labour (that is, the costs of bought-in materials and services have been deducted from the total value of output).” The creative industries are: publishing, motion picture and sound recording activities, broadcasting, architectural services, other specialised design services, professional photographic services, and creative and performing arts activities.1
RAtIonAlE
This is a measure of the value-added within New Zealand’s creative industries sector, and how it is changing over time.
dAtA souRCE
Statistics New Zealand: Annual Enterprise Survey (AES)
Statistics New Zealand: Prices
Statistics New Zealand: National Accounts.
It should be noted that value-added calculation is an approximation. It has not been through New Zealand’s system of National Accounts and so is not an official measure.
The following results should be treated with some caution as the data has been used in a way not originally intended when it was collected as part of the AES. Many of the series are therefore unofficial. Also, due to confidentiality requirements Statistics New Zealand cannot release certain financial data where the industries consist of a small number of businesses, or where industries are dominated by one or two large businesses.
CuRREnt lEvEl And tREnds
Table 13 illustrates changes in the level of value-added contributed by creative industries between 2005 and 2007 using constant prices.2 This shows that in real terms value-added increased by 2.4 percent over the full period, from $3.08 billion to $3.15 billion. This represented the net result of a 5.8 percent increase between 2005 and 2006, followed by a 3.2 percent decrease the following year.
In current prices the value-added contributed by the creative industries amounted to $3.23 billion in 2007.
1 Some of these industries differ from those included in this indicator in Cultural Indicators for New Zealand 2006 due to changes in the standard classification of industries, from ANZSIC96 to ANZSIC06. Consequently, the aggregated data for creative industries in this indicator and indicator 5c is not comparable with data presented in the earlier report.
2 See the definitions and notes section for a description of the methods used to deflate the data.
Cultural Indicators for New Zealand | Economic Development: Indicator 5b
Value-added Contributed by the Creative Industries1
Constant price series2005–2007
Industry 2005 20062 20072
Value-added in 2005 dollars ($ million) 3,078 3,256 3,151
Change from previous year (%) 5.8 -3.2
Change from 2005 (%) 5.8 2.4
Index (relative to 100) 100.0 105.8 102.4
1 Value added is defined as the amount added to goods and services by the contributions of capital and labour (ie the costs of bought-in materials and services have been deducted from the total value of output). Note that the value-added calculated in this table is only an indicator, and is not an official measure of value-added. It has not been through the System of National Accounts and should only be treated as an approximation.
2 Figures for 2006 and 2007 are provisional.
A breakdown of industries within the creative sector (Table 14) shows that publishing, broadcasting and advertising services were the largest contributors of value-added for each of the three years. However, both publishing and broadcasting recorded decreases in value-added over the period. While most of the creative industries recorded increases from 2005 to 2006, the following year saw most recording decreases. Over the full period from 2005 –2007 the largest dollar increase was in architectural services (from $311 to $388 million) while the largest percentage increase was in photographic services (30 percent). The publishing industry recorded by far the largest fall in value-added over the full period, with all of the decrease occurring in the latest year.
Value-added in the Creative Industries1
Constant price series $(million) 2
2005–2007
Industry 2005 20063 20073
Publishing (except internet and music publishing) 891 907 827
Motion picture and sound recording activities 329 407 326
Broadcasting (except internet) 618 604 602
Architectural services 311 321 388
Other specialised design services 264 315 304
Advertising services 505 540 534
Professional photographic services 36 44 46
Creative and performing arts activities 125 119 124
Total creative industries 3,078 3,256 3,151
1 This data is mostly at a lower level than designed industry groupings. Because sample sizes and weights are designed at a higher level, sample error at lower levels is not controlled for, and year on year data movements should be interpreted in the context of possible changing sample sizes.
2 Each industry is deflated by the most relevant PPI or CPI deflator available. Some of these deflators have limited representation of prices in the AES industries, as they are below design level and may only include prices on a small number of items.
3 Figures for 2006 and 2007 are provisional.
13 TABLE
14 TABLE

Page 76 Page 77Economic Development: Indicator 5c | Cultural Indicators for New Zealand
IndICAtoR 5c: thE CREAtIvE IndustRIEs’ PRoPoRtIon oF totAl IndustRy vAluE-AddEddEFInItIon
This indicator is expressed as the proportion of total industry value-added produced by the creative industries. It can be read in conjunction with the previous indicator (5b), which measured changes in value-added in the creative industries. Total industry value-added is gross domestic product less unallocated indirect taxes (ie less GST, import duties and stamp duty).
RAtIonAlE
This indicator is a measure of the contribution the creative industries make to New Zealand’s economic development and whether that contribution is increasing over time. It directly relates to the desired outcome for the economic development theme (“arts, culture and heritage make a growing contribution to the economy”).
dAtA souRCE
Statistics New Zealand: Annual Enterprise Survey (AES)
Statistics New Zealand: National Accounts
Statistics New Zealand: Prices.
Value-added calculation is an approximation. It has not been through New Zealand’s system of National Accounts and so is not an official measure.
The following results should be treated with some caution as the data has been interpreted for use outside of the design parameters of the AES.
CuRREnt lEvEl And tREnds
In current prices the creative industries contributed 2.1 percent of total industry value-added in 2007. Figure 40 illustrates changes between 2005 and 2007 using constant prices. This shows that the creative industries’ contribution to total industry value-added has changed little over the three years, increasing slightly from 2.22 to 2.28 percent between 2005 and 2006 before falling back again to 2.18 percent in the following year.
Figure 41 shows how changes in the level of value-added in the creative industries compare with changes in total industry value-added between 2005 and 2007, using constant prices. Between 2005 and 2006, value-added in the creative industries grew at more than double the rate for all industries (5.8 percent compared with 2.8 percent). However, from 2006 to 2007 value-added in the creative industries fell by 3.2 percent while the value-added for all industries increased by 1.4 percent.
Creative Industries’ Contribution to Total Industry Value-addedConstant price series
2005–2007
Changes in Creative Industry and Total Industry Value-addedConstant price series
2005–2007
40 FIgURE
41 FIgURE
Cultural Indicators for New Zealand | Economic Development: Indicator 5c

Page 78 Page 79Summary | Cultural Indicators for New Zealand
summARy
EngAgEmEnt
New Zealanders’ engagement in cultural activity is measured by way of data on cultural employment, participation, and spending.
Between 2001 and 2006, the cultural workforce grew at a greater rate than the workforce overall: 21 percent as opposed to 15 percent (indicator 1a). This maintains a trend which has been seen since 1996. It means that the cultural workforce has grown to almost 7 percent of the total workforce in 2006, up from almost 6 percent ten years earlier at the 1996 Census. Cultural occupations to experience significant growth were graphic designers; architects; early childhood and kohanga reo teachers; and sculptors, painters and related artists.
Almost 2 percent of the total workforce was employed in creative occupations at the 2006 Census (indicator 1b). As with cultural employment overall, this is an increase from 2001 and 1996. Driving this rise were increases in numbers employed in the largest occupational groupings, such as graphic designers, architects, and sculptors, painters and related artists.
This indicator also provided information about the ethnicity of workers in creative occupations. In 2006, creative workers were overwhelmingly of European ethnicity (90 percent), in comparison with their representation in the total workforce (81 percent). All the other major ethnic groups were under-represented in creative employment by comparison with their share of total employment. Māori made up 7.6 percent of creative workers in 2006, Asians 5.5 percent and Pacific peoples 2.2 percent.
As in 2001, the median income of creative occupations (indicator 1c) was slightly higher ($41,600) than the median income for all occupations ($38,400). This means that the median income for people in creative occupations was 109 percent of the median income for all employed people. This figure was, however, slightly lower than it had been in 2001 (112 percent) and 1996 (115 percent). This indicator is, therefore, slowly trending downwards.
The 2002 Cultural Experiences Survey (CES) showed that buying books, using public libraries and purchasing recorded music were the most popular cultural activities (indicator 1d). Another key part of the CES was to examine barriers to people’s participation in cultural activity (indicator 1e). Barriers were looked at in terms of each different cultural activity and were quite diverse. Music purchases and going to the movies appeared to be the activities for which barriers were most often experienced, with barriers to activities such as using libraries, mātauranga Māori and using archives being much less common. It could be inferred from the survey that the cost of the activity was a major factor, as well as the lack of availability of the activity in various geographical locations.
Spending by New Zealanders on cultural items ,declined between 2003/04 and 2006/07 by 3 percent (indicator 1f). Nonetheless, spending was still higher, by 24 percent, in 2006/07 than in 2000/01.
A new indicator showed that New Zealand has a large, varied, and geographically diverse stock of heritage places. The rate at which this stock is being depleted by demolition is very small: 0.18 percent in 2007/08 (indicator 1g). The geographical spread of heritage places shows, unsurprisingly, that the greatest number of heritage places are in the larger centres of population – Auckland, Wellington, Christchurch and Dunedin. In the future, monitoring the loss of heritage may help with understanding whether changes in the economic or regulatory environment have an impact on New Zealand’s heritage stock.
Twenty-five percent of the total events reported by all surveyed venues took place outside the main centres (indicator 1h). This is a marked under-representation of such events outside the main centres of New Zealand, as 48 percent of New Zealand’s population live outside the main centre areas. By contrast, 75 percent of arts, culture and heritage activities take place within the main centres, which comprise 52 percent of the New Zealand population. This finding partly confirms the finding from the CES that geographical availability is a barrier to many in seeking out cultural activity.
Where time series data is available for the engagement outcome indicators, the picture is largely positive. Cultural employment has consistently grown over ten years, as has the number employed in creative occupations. That almost 7 percent of New Zealanders can sustain main employment in cultural occupations makes the cultural sector an important contributor to economic activity, and provides evidence of the degree to which New Zealanders’ interest in such activity translates into jobs. Nonetheless, the continuing (albeit slow) decline in the median income for creative occupations, and the slight decline in household spending on culture, will need to be closely monitored into the future.
CultuRAl IdEntIty
The five indicators in the Cultural Identity Theme relate to New Zealanders’ sense of their identity, and the heritage and cultures which contribute to it.
Census data from 2006 shows the proportion of Māori able to speak Māori appears as relatively stable (indicator 2a). The youthful age profile of the Māori population shows that the largest number of Māori speakers is in the younger age groups, with around 27,000 Māori speakers aged 10-19. The number of speakers in the 15-19 age group was one age group which recorded a rise from the 2001 Census to the 2006 Census.
The proportion of local content on New Zealand television has been lower in recent years, though it has recovered in 2008 to almost the same proportion it had in 2003-4 when the local content proportion was its highest (indicator 2b). However, overall hours of local content on New Zealand television have risen dramatically.
Māori TV has been a significant contributor to the increased hours of local content on New Zealand television in the last three years. Its high proportion of first-run hours of local content has counterbalanced the very low proportion of local content broadcast by the Prime channel, particularly in prime-time. In these peak hours around 62 percent of broadcast hours on Māori TV were local content in both 2007 and 2008, the highest of any channel (NZ on Air, Local Content 2008 report).
The newly available data about Māori TV ratings promises to be an important source of information. Data was only available for two quarter-year periods at the time of publication. These show that, of those watching television at any time during the day, on average 0.6 percent watched Māori TV (indicator 2c). This percentage was higher in Auckland, and higher in prime-time.
Cultural Indicators for New Zealand | Summary

Page 80 Page 81
In terms of New Zealanders’ perceptions of the importance of culture and cultural activities, data shows that almost three-quarters of respondents were of the view that these activities were very, extremely or critically important to New Zealand’s sense of national identity (indicator 2d). Culture ranked comfortably alongside other factors such as innovation, science and technology in creating a sense of national identity, more important than sport, though less important than landscape and environment.
Around 33 percent of shows, performances and exhibitions in a recent sample of New Zealand venues were substantially about New Zealand themes (indicator 2e). As this was the first time the Venues Survey was undertaken, this indicator is simply the benchmark for the future. The level is, however, relatively comparable (though higher) than the television local content figure. Among the New Zealand themed events and activities, Māori performing arts events were the third largest category of event, comprising 13 percent of such events.
In broad terms, the Cultural Identity indicators show a stable picture. Levels of Māori language fluency have been maintained, Māori TV ratings are now available, and local content on television and venues is at levels comparable to those in the past. Culture is seen by New Zealanders as an important contributor to national identity, without being the most important element in a sense of ‘New Zealand-ness’.
The indicators suggest that the availability of cultural media for Māori and other New Zealand cultures is healthy. What will be most telling in the future, however, is whether the uptake of those events, as shown by such indicators as Māori TV ratings, is improving. Populating the social cohesion indicator on non-Māori attendance at Māori cultural events, and the engagement indicator on audience numbers, would be useful to assess the strength of various cultures in New Zealand.
dIvERsIty
The Diversity Theme focuses on the degree to which New Zealand’s cultural diversity is freely expressed, respected, and valued.
The proportion of cultural grants to minority groups by the Lottery Grants Board was 9 percent in 2007-08 (indicator 3a). Although this was a fall from 2006-07, it was a dramatic rise from around 3 percent in 2004-05. The rising proportion reflects significant rises in the value of grants going to ethnic minority groups, from $360,000 in 2004-05 to $2.5 million in 2007-08. Overall, however, grants for cultural purposes going to all groups have also risen dramatically. While these figures fall short of the 19 percent of people in the population who identify with an ethnic minority, many Lottery Grants are not associated with a specific ethnic group. When these ethnically ‘unspecified’ grants are ignored, the proportion of ethnic minority grants is over 16 percent in 2007-08.
The 2002 CES estimated that 18 percent of the population attended at least one ethnic cultural activity in the year before the survey, while 15 percent of the population attended at least one ethnic performing arts activity in the year before the survey (indicator 3b).
There was a marked under-representation of arts, culture and heritage events produced by and for minority ethnic groups (indicator 3c). In the Venues Survey of 2008, around 4 percent of shows, performances or exhibitions were by or for ethnic minority cultures. More positively, around a quarter of all surveyed venues had hosted at least one ethnic minority cultural event or activity, suggesting that although the frequency of events is not high, there are venues available to support the events and activities of these cultural groups.
Summary | Cultural Indicators for New Zealand
soCIAl CohEsIon
No social cohesion indicators were able to be populated for this report. One of the ongoing challenges for future reports is to maintain momentum to fill more of the indicators for which no data is presently available. While cohesion is a difficult Theme to measure, the data required is potentially similar to that collected under the diversity indicators.
EConomIC dEvEloPmEnt
The Economic Development Theme deals with the economic contribution of culture in New Zealand.
The income of the cultural industries grew 3 percent in real terms from 2005 to 2007 (indicator 5a). While the indicator has had to exclude the figures from the previous Cultural Indicators for New Zealand report due to industry classification changes, it is interesting that this trend – slow growth in real terms – was also evident in that previous report.
For the creative industries a similar overall trend occurred: a 2.4 percent growth in value-added by the creative industries from 2005 to 2007 (indicator 5b). What this growth masks, however, was that there was strong growth from 2005 to 2006, followed by a decline.
The proportion of creative industry value-added compared to total industry value-added has remained largely steady over the three years at a little over 2 percent in each of the three years (indicator 5c).
For all three of these indicators, three years is too few to draw firm conclusions, though taken together, they seem to show that, as the economy as a whole has grown, cultural and creative industries have also grown. What will be interesting to observe in the coming years is whether these industries can be resilient in the face of lower economic growth. With the industry classification expected to remain largely unchanged before the next Cultural Indicators report is to be published, a longer time series will allow trends to be more readily identified.
Cultural Indicators for New Zealand | Summary

Page 82 Page 83
ConClusIon
Cultural Indicators for New Zealand | Conclusion
When the first Cultural Indicators report was published in 2006, only 13 indicators were able to be populated. That number has now increased to 19, and there are significantly more indicators which have additional data now available. This is a very positive development, and has allowed a wider range of activity in the cultural sector to be examined.
The data presented in this report allows a degree of cautious optimism about New Zealanders’ involvement with cultural activity. The strong growth in cultural employment demonstrates that more New Zealanders are able to make a career from working in the cultural sector, though the incomes of creative workers are only slightly above the median incomes for all New Zealand workers. It would appear that as the proportion of creative workers in the New Zealand economy increases, there is a downward trend in median incomes for these workers, bringing it closer to the national median for all of those employed.
While the economic data presented shows that cultural sector income has grown along with the economy as a whole, the declining trend evident in the 2007 figures is perhaps supported by the indicator on household spending, which has shown an overall decline in household spending on culture of 3 percent. Whether this translates into lower rates of cultural employment in the 2011 Census figures will be one of the most interesting elements for the next edition of Cultural Indicators for New Zealand to examine.
The new heritage protection indicator provides somewhat of a counterpoint to the economic and employment data. The indicator quantifies the size of New Zealand’s heritage stock, and shows that at the present time, this stock is relatively secure against destruction and damage. This suggests that New Zealand’s heritage is very much a valued part of the New Zealand landscape.
Local content in New Zealand’s venues and on its television screens appears to be now well-established and, in the case of television, growing. The advent of channels such as C4 and Māori TV which show very large proportions of local content are not only reflected in overall hours of local content, but also the proportion of local content, which in 2008 reached a level almost equivalent to the highest ever recorded.
A growing proportion of New Zealanders identified with an ethnic minority at the last Census – over 19 percent. This growing diversity is reflected by the growing value of grants directed towards such groups by the Lottery Grants Board, and the availability of venues which ethnic minority groups are able to express their own culture. Nonetheless, further development is required to explore all the facets of the cultural indicators’ framework. As noted in the previous edition of this report, undertaking the Cultural Experiences Survey again would be an invaluable step in understanding what kinds of cultural activities New Zealanders participate in on a regular basis.
The Cultural Indicators report sits within the Cultural Statistics programme operated by the Ministry for Culture and Heritage. Many indicators will continue to be updated using existing data collections maintained by Statistics New Zealand, such as the Census, Annual Enterprise Survey, and Household Economic Survey. Other indicators will continue to develop lengthy time series from other sources, such as Māori TV ratings and Local Content on Television. The Ministry hopes to further develop some of the other indicators in the report, currently ‘unpopulated’ with data, before the next publication (projected for 2012).
In the meantime, this second edition of Cultural Indicators is a significant step forward in producing a comprehensive picture of the ‘health’ of cultural activity in New Zealand. In large part, most of the indicators show a degree of stability or improvement towards the desired outcomes.
dEFInItIons And notEs
Annual Enterprise Survey (AES) The AES is New Zealand’s most comprehensive source of financial statistics and provides annual financial performance and financial position information about industry groups operating within New Zealand. The industries covered in the survey contribute approximately 90 percent of New Zealand’s gross domestic product (GDP). The AES is an important source of data for GDP as it is used to calculate detailed annual industry and sector National Accounts.
Constant price seriesPrice deflators, using a base year of 2005, have been used to ensure that the effect of changes in prices is removed from time series which measure levels of income and value-added in cultural industries (indicators 5a, 5b, and 5c).
A constant price series is a time series expressed in the prices of one selected year of that series. The aim of a constant price series is to remove the direct effect of price changes on that series, to present the real change from one period to another. For this publication, they are obtained by dividing a current price series by a relevant price index (this method is referred to as price deflation).
Where possible, a price index designed to measure the output of the industry or sub-industry concerned was used. For example, the value series for the revenue of firms in the newspaper, book and stationery retailing industry has been deflated by the newspaper, book and stationery component of the Consumers Price Index. Similarly, the value series for the revenue of firms in the professional photographic services industry has been deflated by the photographic studios index component of the Producers Price Index.
Calculation of deflators for total industry value-addedDeflators for total industry value-added were calculated by taking the constant price GDP from QGDP (E) using the annual March year, and the current price GDP figures, to calculate the Implicit Price Deflator (IPD). The IPD was then applied to the current price total industry value-added.
Value-added for market industriesSome of the value added numbers are negative. This is because some businesses in these industries are non-market. The System of National Accounts treats non-market differently to market. Non-market organisations provide services at little or no charge and are funded by general taxation, donations or subscriptions. The AES does not differentiate between the two, treating all activity as market.
Note on summing constant price seriesFor the purposes of this report the value-added for all the cultural industries was deflated by a price index to calculate the constant price series. This is not necessarily the method National Accounts would use for all the cultural industries. The New Zealand System of National Accounts creates constant price total series by chaining component industry series. The components of the cultural industries have instead been summed to create the total value. This produces a slightly different result than if they were chained.
Cultural employmentThe census provides figures for employment in cultural occupations and cultural industries, but to obtain a figure for total cultural employment is not simply a matter of adding the two together as this would lead to double-counting of people who are in both cultural occupations and cultural industries. The method used to obtain the totals for cultural employment was to add the total number of people in cultural occupations, the number or people in non-cultural occupations in cultural industries, and the number of people with unspecified occupations in cultural industries. The proportion of people in cultural employment was then calculated by taking this figure as a percentage of all employed people who had provided sufficient information to ascertain whether or not they were in cultural employment.
The figures for total cultural employment in 1996 and 2001 published in the previous version of this report have been revised for this report due to a change in the method used to count cultural employment. Previously, small numbers of people working in cultural industries but with unspecified occupations were omitted from the count. They have now been included on the basis that they are in cultural employment by virtue of their industry, regardless of what their occupation might be.
Definitions and Notes | Cultural Indicators for New Zealand

Page 84 Page 85Cultural Indicators for New Zealand | Definitions and Notes
Cultural Experiences Survey (CES)The CES was conducted by Statistics NZ as a supplement to the Household Labour Force Survey (HLFS) over a three-month period from January 2002. A nationally representative sample of 13,475 adults aged 15 years and over and living in private dwellings responded to the survey. The objectives of the survey were:
To determine who consumes cultural goods and -services generally in New Zealand; what type; through what means; and the levels of consumption. Also to identify any significant differences among population groups. To determine the typical characteristics associated -with particular patterns of cultural consumption in New Zealand (including age, sex, ethnicity, labour force status, income, education, location).To identify barriers to the consumption of cultural -products.
EthnicityEthnicity is a measure of cultural affiliation, as opposed to race, ancestry, nationality or citizenship. The census ethnicity question allows respondents to report more than one ethnicity. When a person reports more than one response they are counted in each group they report. The sum of ethnic group populations therefore exceeds the total population of New Zealand.
When census data is used in this report, people giving their ethnicity as New Zealander are included in the European category. This is to maintain comparability with data from previous Censuses.
Full-time and part-time employmentFull-time employment is defined as 30 hours or more of work per week. Part-time employment is defined as fewer than 30 hours of work per week.
The total number of hours worked per week does not have to be in a single job. For example, a person who is employed full-time may work 20 hours in one job, and 15 hours in a different job.
Household Economic Survey (HES)The HES collects itemised information on household income and expenditure, as well as demographic information, from a representative sample of approximately 4,500 permanent, private households. Results are weighted to provide estimated figures for the total population. Cultural spending is not a category normally used in analysing HES expenditure data, but a number of cultural items can be identified from the survey to provide a picture of cultural spending and the characteristics of consumers.
Median incomeIncome data represents income from all sources, not just a person’s main job. The median income is calculated by ranking incomes from highest to lowest and selecting the middle value. Because census income data is collected in ranges, the median figures are estimates only. Median income values are rounded to the nearest hundred dollars.
Value-addedValue-added is the amount added to goods and services by the contributions of capital and labour (ie the costs of bought-in materials and services has been deducted from the total value of output).
APPEndIx A: CultuRAl And CREAtIvE oCCuPAtIons
Occupation categories from the New Zealand Standard Classification of Occupations (NZSCO) that are designated as cultural within the terms of the New Zealand Framework for Cultural Statistics are listed below, along with their five digit codes. Occupations that are also designated as creative are identified with an asterisk. The occupation data presented in this publication uses the NZSCO99 classification for the 2001 and 2006 Census and NZSCO95 for the 1996 Census. Both versions of the classification are listed. Because of changes between these two classifications, some data for particular occupations may not be fully comparable between the 1996 Census and the 2001 and 2006 Censuses. However, this does not affect the comparability of the aggregated data for total cultural occupations and total creative occupations.
Creative occupations are marked with an asterisk (*).
Cultural occupations(NZSCO99)
Cultural occupations(NZSCO95)
12212 Broadcasting and Theatrical Production Manager * 12212 Broadcasting and Theatrical Production Manager *
21411 Architect * 21411 Architect *
21412 Resource Management Planner 21412 Town and Country Planner
21413 Landscape Architect * 21413 Landscape Architect *
23321 Early Childhood Teacher 23321 Early Childhood Teacher and Kōhanga Reo Teacher
23322 Kōhanga Reo Teacher
24311 Archivist 24311 Archivist
24312 Art Gallery and/or Museum Curator * 24312 Art Gallery and Museum Curator *
24321 Librarian 24321 Librarian
24511 Minister of Religion 24511 Minister of Religion
31311 Photographer * 31311 Photographer *
31312 Camera Operator * 31312 Camera Operator *
31313 Sound Recording Equipment Controller * 31313 Sound Recording Equipment Controller *
31321 Broadcasting Transmitting and Studio Equipment
Operator *
31321 Broadcasting Transmitting and Studio Equipment
Operator *
31323 Cinema Projectionist 31323 Cinema Projectionist
33611 Author and Critic * 33611 Author and Critic *
33612 Reporter * 33612 Reporter *
33613 Editor * 33613 Editor *
33614 Sub-Editor * 33614 Sub-Editor *
33615 Copywriter * 33615 Copywriter *
33621 Sculptor, Painter and Related Artist * 33621 Sculptor, Painter and Related Artist *
33631 Graphic Designer * 33631 Commercial Artist *
33632 Fashion Designer * 33632 Clothing Designer *
33633 Display and Window Dresser * 33633 Display and Window Dresser *
33634 Industrial Designer * 33634 Commercial Designer *
33636 Interior Designer *
Appendix A | Cultural Indicators for New Zealand
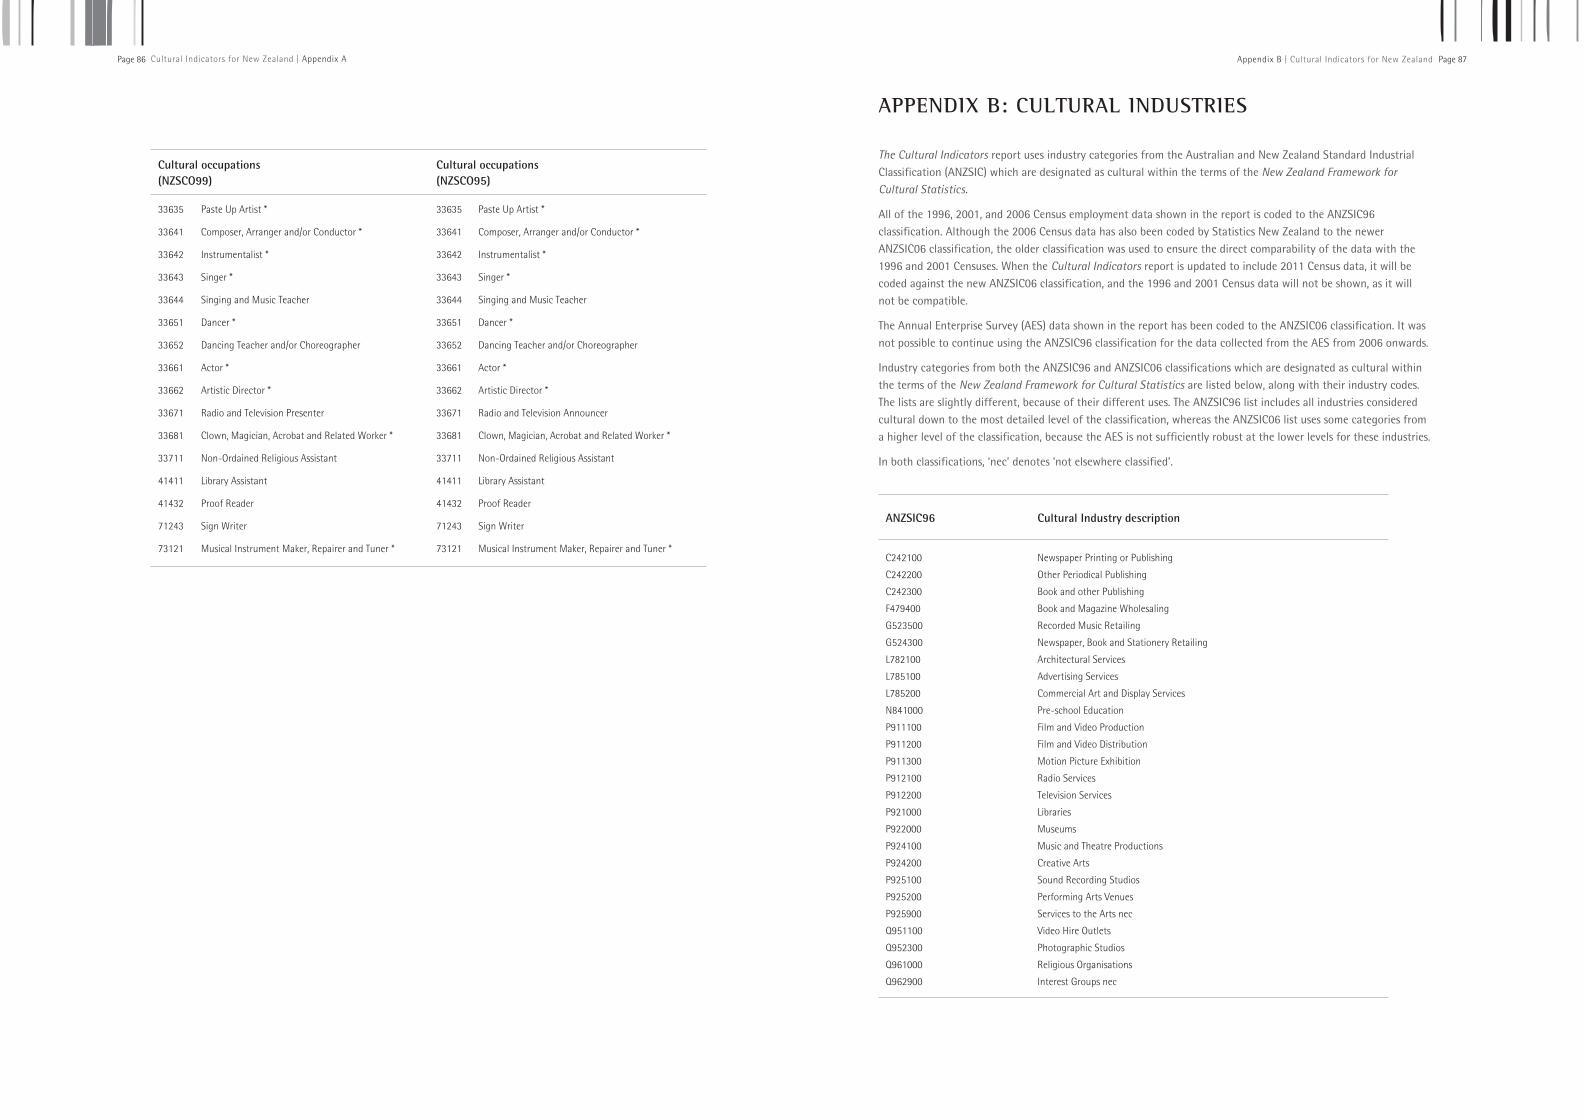
Page 86 Page 87Appendix B | Cultural Indicators for New Zealand
Cultural occupations(NZSCO99)
Cultural occupations(NZSCO95)
33635 Paste Up Artist * 33635 Paste Up Artist *
33641 Composer, Arranger and/or Conductor * 33641 Composer, Arranger and/or Conductor *
33642 Instrumentalist * 33642 Instrumentalist *
33643 Singer * 33643 Singer *
33644 Singing and Music Teacher 33644 Singing and Music Teacher
33651 Dancer * 33651 Dancer *
33652 Dancing Teacher and/or Choreographer 33652 Dancing Teacher and/or Choreographer
33661 Actor * 33661 Actor *
33662 Artistic Director * 33662 Artistic Director *
33671 Radio and Television Presenter 33671 Radio and Television Announcer
33681 Clown, Magician, Acrobat and Related Worker * 33681 Clown, Magician, Acrobat and Related Worker *
33711 Non-Ordained Religious Assistant 33711 Non-Ordained Religious Assistant
41411 Library Assistant 41411 Library Assistant
41432 Proof Reader 41432 Proof Reader
71243 Sign Writer 71243 Sign Writer
73121 Musical Instrument Maker, Repairer and Tuner * 73121 Musical Instrument Maker, Repairer and Tuner *
APPEndIx b: CultuRAl IndustRIEs
The Cultural Indicators report uses industry categories from the Australian and New Zealand Standard Industrial Classification (ANZSIC) which are designated as cultural within the terms of the New Zealand Framework for Cultural Statistics.
All of the 1996, 2001, and 2006 Census employment data shown in the report is coded to the ANZSIC96 classification. Although the 2006 Census data has also been coded by Statistics New Zealand to the newer ANZSIC06 classification, the older classification was used to ensure the direct comparability of the data with the 1996 and 2001 Censuses. When the Cultural Indicators report is updated to include 2011 Census data, it will be coded against the new ANZSIC06 classification, and the 1996 and 2001 Census data will not be shown, as it will not be compatible.
The Annual Enterprise Survey (AES) data shown in the report has been coded to the ANZSIC06 classification. It was not possible to continue using the ANZSIC96 classification for the data collected from the AES from 2006 onwards.
Industry categories from both the ANZSIC96 and ANZSIC06 classifications which are designated as cultural within the terms of the New Zealand Framework for Cultural Statistics are listed below, along with their industry codes. The lists are slightly different, because of their different uses. The ANZSIC96 list includes all industries considered cultural down to the most detailed level of the classification, whereas the ANZSIC06 list uses some categories from a higher level of the classification, because the AES is not sufficiently robust at the lower levels for these industries.
In both classifications, ‘nec’ denotes ‘not elsewhere classified’.
ANZSIC96 Cultural Industry description
C242100 Newspaper Printing or Publishing
C242200 Other Periodical Publishing
C242300 Book and other Publishing
F479400 Book and Magazine Wholesaling
G523500 Recorded Music Retailing
G524300 Newspaper, Book and Stationery Retailing
L782100 Architectural Services
L785100 Advertising Services
L785200 Commercial Art and Display Services
N841000 Pre-school Education
P911100 Film and Video Production
P911200 Film and Video Distribution
P911300 Motion Picture Exhibition
P912100 Radio Services
P912200 Television Services
P921000 Libraries
P922000 Museums
P924100 Music and Theatre Productions
P924200 Creative Arts
P925100 Sound Recording Studios
P925200 Performing Arts Venues
P925900 Services to the Arts nec
Q951100 Video Hire Outlets
Q952300 Photographic Studios
Q961000 Religious Organisations
Q962900 Interest Groups nec
Cultural Indicators for New Zealand | Appendix A

Page 88 Page 89Appendix C | Cultural Indicators for New Zealand
ANZSIC06 Cultural Industry description
C16 Printing (including the Reproduction of Recorded Media)
F373500 Book and Magazine Wholesaling
G424200 Entertainment Media Retailing
G424400 & G427200 Newspaper, Book and Stationery Retailing
J54 Publishing (except Internet and Music Publishing)
J55 Motion Picture and Sound Recording Activites
J56 Broadcasting (except Internet)
J60 Library and Other Information Services
L663200 Video and Other Electronic Media Rental
M692100 Architectural Services
M692400 Other Specialised Design Services
M694000 Advertising Services
M699100 Professional Photographic Services
P801000 Pre-school Education
P821200 Arts Education
R891000 Museum Operation
R90 Creative and Performing Arts Activities
S955900 Other Interest Group Services nec
APPEndIx C: housEhold EConomIC suRvEyCultuRAl CAtEgoRIEsCultural Spending categories by 2006/07 NZHEC codesnec=not elsewhere classified nfd=not further defined
Framework Category NZHEC code NZHEC description
HERITAGE 05.1.01.0.0.12 Antique furniture
11.3.02.2.0.12 Antiques other than furniture
09.4.02.2.1.01 Admission charges to art galleries, museums, painting exhibitions
LIBRARY SERVICES 09.4.02.2.2.01 Subscriptions and donations to libraries
09.4.02.2.2.02 Casual library charges, book hire
LITERATURE 09.5.02.0.0.01 Newspapers
09.5.02.0.0.99 Other magazines and periodicals
09.5.01.0.0.02 Encyclopaedias and atlases
09.5.01.0.0.03 Dictionaries, thesaurus
09.5.01.0.0.04 Instruction books
09.5.02.0.0.02 Comics
09.5.01.0.0.05 Leisure books
09.5.03.0.0.03 Programmes for concerts, theatre and sporting fixtures
09.5.01.0.0.06 Religious books
09.5.01.0.0.07 Children’s books
09.5.01.0.0.08 Music books, sheet music
09.5.03.0.0.01 Calendars
09.5.03.0.0.02 Maps
09.5.01.0.0.10 Book and audio tape sets
09.5.01.0.0.09 Textbooks
09.5.03.0.0.00 Miscellaneous printed matter nfd
09.5.01.0.0.01 Second-hand books
09.5.01.0.0.99 Books nec
09.5.03.0.0.99 Miscellaneous printed matter nec
09.5.01.0.0.00 Books nfd, book vouchers, book clubs
PERFORMING ARTS 09.4.02.1.0.02 Admission charges to theatres, ballets, concerts, plays
09.2.00.2.0.02 Pianos
09.2.00.2.0.03 Stringed non-electrical instruments
09.2.00.2.0.04 Wind instruments
09.2.00.2.0.05 Percussion instruments
09.2.00.2.0.06 Electrical/electronic musical instruments
09.2.00.2.0.07 Accessories for musical instruments
09.2.00.2.0.01 Second-hand musical instruments
09.2.00.2.0.99 Musical instruments nec
09.2.00.2.0.00 Musical instruments nfd
09.1.03.0.0.05 Records
09.1.03.0.0.02 Compact discs
09.1.03.0.0.00 Stereo cassette tapes, tapes nfd
09.4.02.3.2.04 Hire of stereo cassette tapes, records and compact discs
Cultural Indicators for New Zealand | Appendix B

Page 90 Page 91Appendix C | Cultural Indicators for New Zealand
VISUAL ARTS 04.2.03.0.0.01 Design services
05.1.01.0.0.39 Wall décor
05.1.01.0.0.05 Pottery nfd
05.4.00.1.0.10 Vases
05.1.01.0.0.40 Ornaments
05.1.01.0.0.41 Ornamental plant containers
09.3.03.0.0.02 Artificial plants and flowers
09.4.02.4.1.02 Picture framing
05.6.01.2.0.26 Cake decorations (non-edible)
09.4.02.4.1.04 Photographers’ fees
09.1.01.2.0.00 Magnifying glasses, binoculars and other optical instruments
09.1.01.1.0.06 Digital projectors
09.1.01.1.0.07 Film and slide projectors
09.1.01.1.0.22 Photographic cameras, camera attachments
09.1.01.1.0.08 Projection screens
09.1.01.1.0.23 Slide racks, darkroom equipment and supplies
09.1.01.1.0.98 Photographic and cinematographic equipment nec
09.1.01.1.0.03 Second-hand photographic and cinematographic equipment
09.1.01.1.0.01 Photographic and cinematographic equipment nfd
09.5.04.0.0.06 Artist’s materials
09.3.01.0.0.11 Handcraft equipment
09.3.01.0.0.14 Materials for pottery and ceramics
09.3.01.0.0.15 Handcraft materials (for canework, leatherwork, embroidery)
09.4.02.4.1.99 Charges for other cultural services nec
FILM AND VIDEO 09.1.03.0.0.03 Video cassette tapes
09.1.03.0.0.01 DVD discs, discs nfd
09.4.02.3.2.03 Hire of video cassette tapes
09.4.02.3.2.05 Hire of DVD discs
09.4.02.1.0.01 Admission charges to cinemas, contributions to cinema clubs
BROADCASTING 09.1.01.1.0.10 Television sets, televideos, teledvds
09.1.01.1.0.02 Second-hand audio and visual equipment and appliances
09.1.01.1.0.04 Video cassette recorders, video tuner/timers
09.1.01.1.0.14 Stereo system
09.1.01.1.0.15 Amplifiers, stereo tuners, receivers, stereo timers
09.1.01.1.0.13 Stereo cassette decks, stereo turntables
09.1.01.1.0.12 Compact disc players, minidisc players, MP3 players and the like
09.1.01.1.0.17 Speakers
09.1.01.1.0.16 Radios (portable, mantel), clock radios
09.1.01.1.0.05 DVD players and recorders
09.1.01.1.0.11 Video cameras
09.1.01.1.0.09 Home theatre systems
09.1.01.1.0.24 Combinations of audio or audio-visual equipment
09.1.01.1.0.18 Replacement parts for audio and visual equipment
09.1.01.1.0.19 Accessories for audio and visual equipment
09.1.01.1.0.00 Audio and visual equipment and accessories nfd
09.1.01.1.0.99 Audio and visual equipment and accessories nec
09.4.02.3.2.01 Rental charges or hire of television sets
09.4.02.3.2.02 Rental charges or hire of DVD players and video cassette recorders
09.1.04.0.0.01Service contracts for audio-visual, photographic and information processing
equipment 09.1.04.0.0.02 Servicing and repairs of audio-visual equipment and accessories
09.4.02.3.1.01 Subscriptions to subscriber television
09.4.02.3.1.02 Installation and modification charges for subscriber television
COMMUNITY AND
GOVERNMENT ACTIVITIES
09.4.02.4.2.02 Subscriptions and donations to community service clubs
09.4.02.4.2.07 Subscriptions and donations to garden societies, floral societies
09.4.02.4.2.04 Subscriptions and donations to cultural societies
09.4.02.4.2.08 Subscriptions and donations to charitable, church, or civic organisations
09.4.02.4.2.09 Subscriptions and donations to personal-interest groups
09.4.01.0.1.01 Music lessons, singing lessons
09.4.01.0.1.02 Dancing lessons
09.4.01.0.1.04 Art courses, hobby classes
09.4.01.0.1.05 Speech lessons, drama lessons
10.1.00.0.2.00 Payments to kindergartens, playcentres and other pre-schools
Cultural Indicators for New Zealand | Appendix C

Page 92 Page 93Appendix E | Cultural Indicators for New Zealand
APPEndIx d: lottERy gRAnts boARd gRAnts
In this indicator, ‘minority ethnic cultural groups’ refers to Asian ethnic groups, Pacific ethnic groups, and Other ethnic groups. The latter includes African, Latin American, and Middle Eastern peoples. For the purposes of this indicator, it has been decided to also include continental European groups (Dutch, Russian, Polish, and so on). Other ‘European’ groups such as English, Welsh, Australian, American, and Canadian have been considered part of the majority New Zealand European ethnic grouping and excluded. While this distinction is somewhat arbitrary, it is partly a response to the fact that in the LGB grants listings, the continental European groups feature at least as significantly as some other ethnic groups such as, for example, African.
The indicator is derived by first assessing the entire list of LGB applications, and isolating only those grants deemed to have a cultural purpose, in terms of the New Zealand Framework for Cultural Statistics. The indicator excludes the grants made to Creative New Zealand, the New Zealand Film Commission, and the New Zealand Film Archive, because these are not discretionary grants. The key factors are the description of the project given by the applicant, and the name of the organisation.
Once all grants for cultural purposes are isolated, the figures are analysed by ethnicity. There are two main fields, with subgroup fields also available (four fields in total). This means that some grants are double counted, as they may, for example, be listed as both Asian and Pacific. This affects around 4 percent of the total dollar value of grants over the four financial years provided.
The figures for 2004-05 were previously published in the first edition of the Cultural Indicators for New Zealand report in 2006. The figures in this edition differ markedly, because the original source data has been reassessed and recalculated. In the previous edition, some significant classes of grants were included (such as literacy programmes for migrants, and other social programmes which, while they may have involved ethnic minority groups, may have had negligible or no cultural content). These have been excluded in the revised figures.
APPEndIx E: hERItAgE PRotECtIon
Archaeological sites have been excluded (except where they are wahi tapu sites), because where an authority to destroy, damage or modify a site is sought, consent is granted in most cases, subject to conditions, particularly the requirement for an archaeological investigation to take place prior to development of the site.
The measurement relates to sites actually destroyed during the period, rather than simply removed from a District Plan or the Historic Places Trusts Register during the period. A number of places were removed from the Historic Places Trust Register during 2007 and 2008 which were actually demolished some years earlier. This is because, in some cases, there is a time lag between the destruction of the historic place and the Trust becoming aware of it and removing the place from its Register. These are not included in the figures. This time lag also means that in future publications, some of the figures reported here may change, as new information about places that have been destroyed becomes available, and listings are updated.
Cultural Indicators for New Zealand | Appendix D

Published in July 2009 byMinistry for Culture and Heritage
Te Manatū TaongaWellington, New Zealand
IBSN 978-0-478-18465-5
ContactMinistry for Culture and HeritageP O Box 5364Wellington, New ZealandPhone: 04 499 [email protected]

Related Documents