CS 235: User Interface Design November 26 Class Meeting Department of Computer Science San Jose State University Fall 2014 Instructor: Ron Mak www.cs.sjsu.edu/~mak

CS 235: User Interface Design November 26 Class Meeting Department of Computer Science San Jose State University Fall 2014 Instructor: Ron Mak mak.
Dec 27, 2015
Welcome message from author
This document is posted to help you gain knowledge. Please leave a comment to let me know what you think about it! Share it to your friends and learn new things together.
Transcript

CS 235: User Interface DesignNovember 26 Class Meeting
Department of Computer ScienceSan Jose State University
Fall 2014Instructor: Ron Mak
www.cs.sjsu.edu/~mak
Computer Science Dept.Fall 2014: November 26
CS 235: User Interface Design© R. Mak
2
Online Course Evaluations
Evaluation period closes Wednesday, Dec. 10.
If you don’t fill out the online SOTES by Dec. 10, you will have a 3-week delay in the release of your grades.

Computer Science Dept.Fall 2014: November 26
CS 235: User Interface Design© R. Mak
3
Examples of Quantitative Relationships
Quantitative information Relationship
Units of a product sold per geographic region
Sales related to geography
Revenue by quarter Revenue related to time
Expenses by department and month Expenses related to organizational structure and time
A company’s market share compared to that of its competitors
Market share related to companies
The number of employees who received each of five possible performance ratings (1-5) during the last annual performance review
Employee counts related to performance ratings
Show Me the Numbers, 2nd ed.by Stephen FewAnalytics Press, 2012
Computer Science Dept.Fall 2014: November 26
CS 235: User Interface Design© R. Mak
4
Relationships within Categories
Nominal Ordinal Interval Hierarchical

Computer Science Dept.Fall 2014: November 26
CS 235: User Interface Design© R. Mak
5
Relationships within Categories: Nominal
Values in a category are discreteand have no intrinsic order.
Example:
Show Me the Numbers, 2nd ed.by Stephen FewAnalytics Press, 2012

Computer Science Dept.Fall 2014: November 26
CS 235: User Interface Design© R. Mak
6
Relationships within Categories: Ordinal
Categorical items have a prescribed order.
Meaningless to display them out of order. Except perhaps in reversed order.
Examples:
First, second, third, … Small, medium, large Best, second best, …

Computer Science Dept.Fall 2014: November 26
CS 235: User Interface Design© R. Mak
7
Relationships within Categories: Interval
Categorical items consist of a sequential series of numerical ranges that subdivide a larger range of quantitative values into smaller ranges.
Examples:
Show Me the Numbers, 2nd ed.by Stephen FewAnalytics Press, 2012

Computer Science Dept.Fall 2014: November 26
CS 235: User Interface Design© R. Mak
8
Relationships within Categories: Hierarchical
Multiple categories that are closely associated with each other as separate levels in a series of parent-child connections.
Example:
Show Me the Numbers, 2nd ed.by Stephen FewAnalytics Press, 2012
Computer Science Dept.Fall 2014: November 26
CS 235: User Interface Design© R. Mak
9
Relationships between Quantities
Ranking Ratio Correlation

Computer Science Dept.Fall 2014: November 26
CS 235: User Interface Design© R. Mak
10
Relationships between Quantities: Ranking
The order in which categorical items are displayed is based on associated quantitative values.
Example:
Show Me the Numbers, 2nd ed.by Stephen FewAnalytics Press, 2012

Computer Science Dept.Fall 2014: November 26
CS 235: User Interface Design© R. Mak
11
Relationships between Quantities: Ratio
A number that expresses the relative quantities of two values obtained by dividing one by the other.
The ratio of a part to the whole is generally expressed as a percentage.
Example:
Show Me the Numbers, 2nd ed.by Stephen FewAnalytics Press, 2012

Computer Science Dept.Fall 2014: November 26
CS 235: User Interface Design© R. Mak
12
Relationships between Quantities: Correlation
A comparison of two paired sets of quantitative values to determine whether increases in one value correspond to either increases or decreases in the other.
Allows us to predict the values of one variable by knowing or controlling the values of another.
Example: Number of years employees have been doing
particular jobs vs. productivity in those jobs. Does productivity increase or decrease with tenure?

Computer Science Dept.Fall 2014: November 26
CS 235: User Interface Design© R. Mak
13
Numbers that Summarize
Measures of average Mean Median
Measures of variation Spread Standard deviation
Measures of ratio
Measures of correlation Linear correlation coefficient
Computer Science Dept.Fall 2014: November 26
CS 235: User Interface Design© R. Mak
14
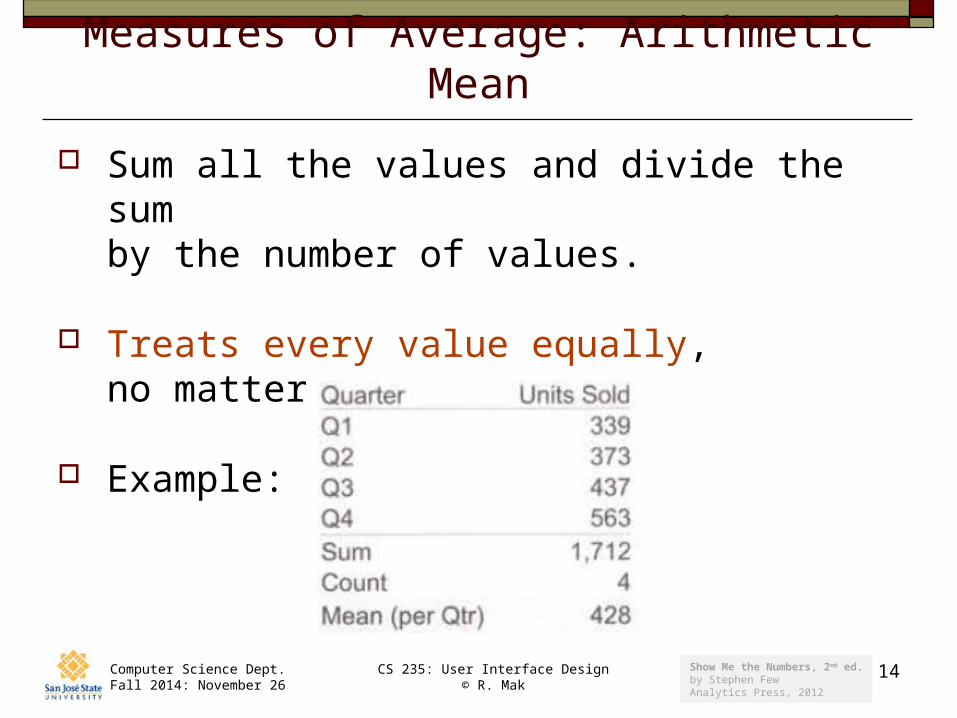
Measures of Average: Arithmetic Mean
Sum all the values and divide the sum by the number of values.
Treats every value equally, no matter now extreme.
Example:
Show Me the Numbers, 2nd ed.by Stephen FewAnalytics Press, 2012
Computer Science Dept.Fall 2014: November 26
CS 235: User Interface Design© R. Mak
15
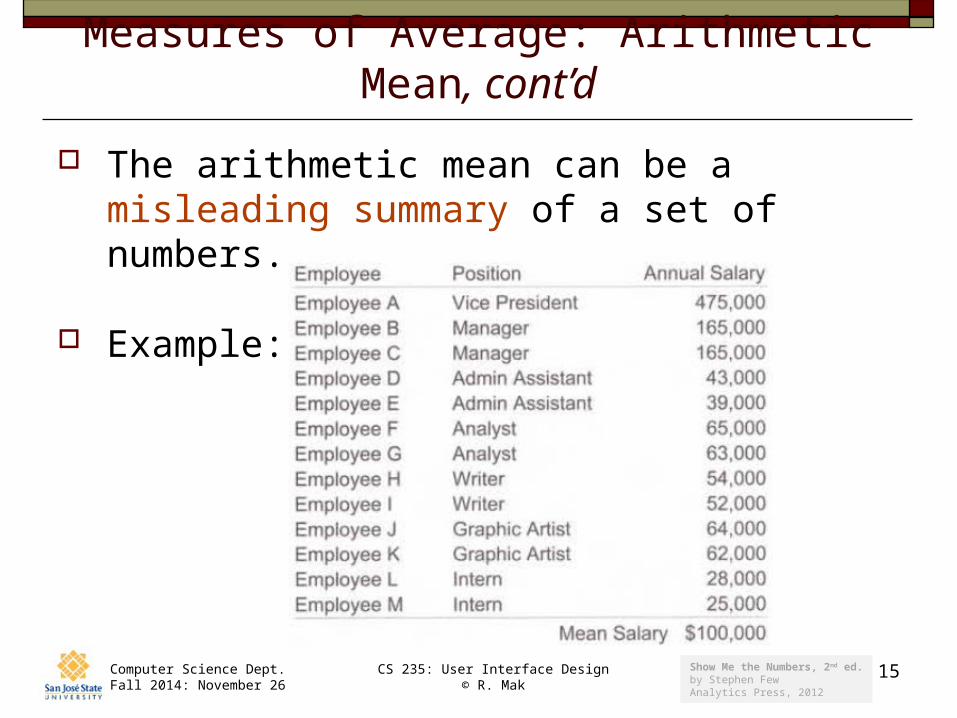
Measures of Average: Arithmetic Mean, cont’d
The arithmetic mean can be a misleading summary of a set of numbers.
Example:
Show Me the Numbers, 2nd ed.by Stephen FewAnalytics Press, 2012

Computer Science Dept.Fall 2014: November 26
CS 235: User Interface Design© R. Mak
16
Measures of Average: Median
The middle value of a sorted set of values. Not sensitive to extreme values. Better at expressing what’s a typical value.
Example:
Show Me the Numbers, 2nd ed.by Stephen FewAnalytics Press, 2012

Computer Science Dept.Fall 2014: November 26
CS 235: User Interface Design© R. Mak
17
Measures of Variation: Spread
The difference between the lowest and the highest of a set of values.
Show Me the Numbers, 2nd ed.by Stephen FewAnalytics Press, 2012
Computer Science Dept.Fall 2014: November 26
CS 235: User Interface Design© R. Mak
18
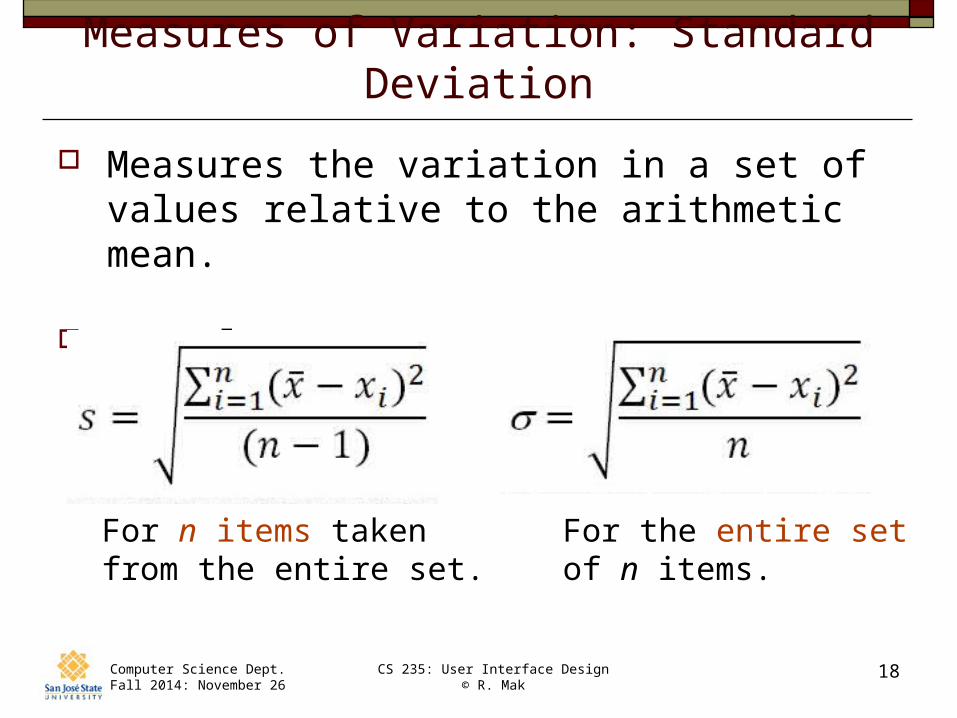
Measures of Variation: Standard Deviation
Measures the variation in a set of values relative to the arithmetic mean.
Formulas:
For n items takenfrom the entire set.
For the entire setof n items.

Computer Science Dept.Fall 2014: November 26
CS 235: User Interface Design© R. Mak
19
Measures of Variation: Standard Deviation, cont’d
Percentage of values that fall within 1, 2, or 3 standard deviations from the mean in a normal distribution.
68%of the values
95%of the values
99.7%of the values
Show Me the Numbers, 2nd ed.by Stephen FewAnalytics Press, 2012

Computer Science Dept.Fall 2014: November 26
CS 235: User Interface Design© R. Mak
20
Ways to Express Measures of Ratio
Sentence Example: Two out of five customers …
Fraction Examples: ½ ⅔ ⅞
Rate Example: 0.4
Percentage Example: 45%
Computer Science Dept.Fall 2014: November 26
CS 235: User Interface Design© R. Mak
21
Types of Analyses
Time series Part-to-Whole and Ranking Deviation Distribution Correlation Multivariate
Ultimate goal: Provide insight for the user.
Computer Science Dept.Fall 2014: November 26
CS 235: User Interface Design© R. Mak
22
Correlation Analysis
Characteristics of correlation:
Direction Strength Shape

Computer Science Dept.Fall 2014: November 26
CS 235: User Interface Design© R. Mak
23
Linear Correlation Coefficient
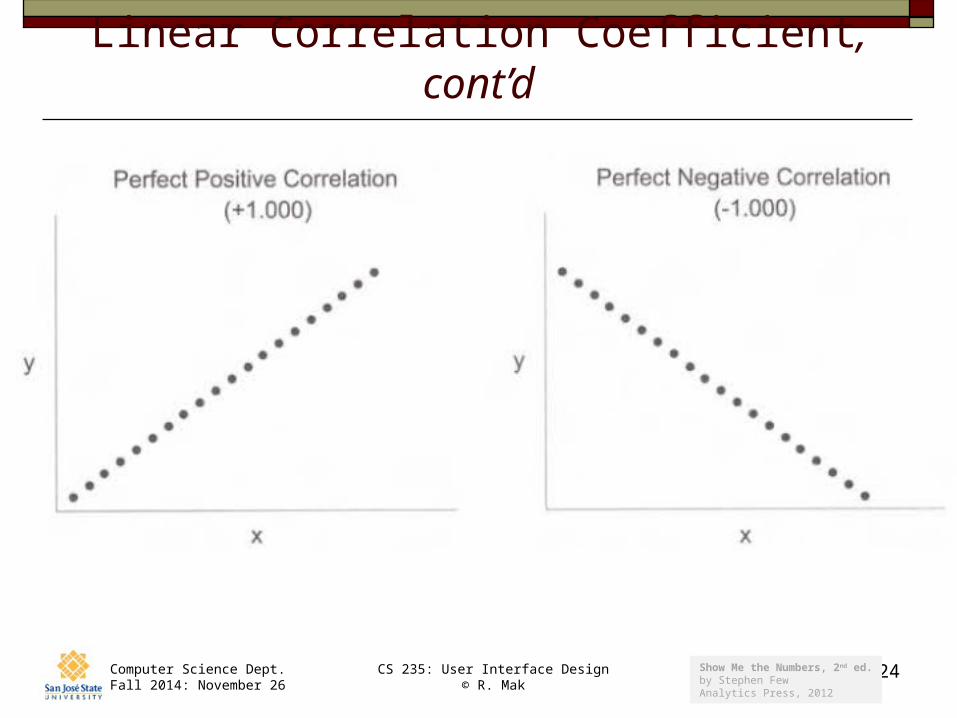
All values are between -1 and +1. 0 = no correlation. +1 = perfect positive linear correlation -1 = perfect negative linear correlation The closer the value is to -1 or +1,
the stronger the linear correlation.
Computer Science Dept.Fall 2014: November 26
CS 235: User Interface Design© R. Mak
24
Linear Correlation Coefficient, cont’d
Show Me the Numbers, 2nd ed.by Stephen FewAnalytics Press, 2012

Computer Science Dept.Fall 2014: November 26
CS 235: User Interface Design© R. Mak
25
Linear Correlation Coefficient, cont’d
Show Me the Numbers, 2nd ed.by Stephen FewAnalytics Press, 2012

Computer Science Dept.Fall 2014: November 26
CS 235: User Interface Design© R. Mak
26
Linear Correlation Coefficient, cont’d
Show Me the Numbers, 2nd ed.by Stephen FewAnalytics Press, 2012

Computer Science Dept.Fall 2014: November 26
CS 235: User Interface Design© R. Mak
27
Logarithmic Correlation
Now You See Itby Stephen FewAnalytics Press, 2009

Computer Science Dept.Fall 2014: November 26
CS 235: User Interface Design© R. Mak
28
Exponential Correlation
Now You See Itby Stephen FewAnalytics Press, 2009

Computer Science Dept.Fall 2014: November 26
CS 235: User Interface Design© R. Mak
29
Polynomial Correlation
Show Me the Numbers, 2nd ed.by Stephen FewAnalytics Press, 2012

Computer Science Dept.Fall 2014: November 26
CS 235: User Interface Design© R. Mak
30
Correlation Does Not Imply Causation!
A strong correlation between two variablesdoes not imply that one causes the other.
Further statistical tests are necessaryto calculate the likelihood of true causation.
See http://en.wikipedia.org/wiki/
Correlation_does_not_imply_causation

Computer Science Dept.Fall 2014: November 26
CS 235: User Interface Design© R. Mak
31
Correlation Does Not Imply Causation! cont’d
See http://en.wikipedia.org/wiki/
Correlation_does_not_imply_causation
Invalid insight:Eating ice cream causes crime.(Actually, both are causedby warmer weather.)

Computer Science Dept.Fall 2014: November 26
CS 235: User Interface Design© R. Mak
32
Correlation Does Not Imply Causation! cont’d Highly correlated:
Infants sleeping with the lights on and the development of myopia (near sightedness).
Invalid insight:Sleeping with the lights on causes a child to become near-sighted.
True causation: Parents who are near-sighted have more lights on. Children inherit near-sightedness from their parents.
Computer Science Dept.Fall 2014: November 26
CS 235: User Interface Design© R. Mak
33
Beware of False Correlations!
See:
http://www.tylervigen.com
http://www.dailymail.co.uk/sciencetech/article-2640550/Does-sour-cream-cause-bike-accidents-No-looks-like-does-Graphs-reveal-statistics-produce-false-connections.html
http://www.buzzfeed.com/kjh2110/the-10-most-bizarre-correlations
Computer Science Dept.Fall 2014: November 26
CS 235: User Interface Design© R. Mak
34
Multivariate Analysis
Compare multiple instances of several variables at once.
Identify similarities and differences among items that are each characterized by a common set of variables.
Which items are most alike? Which items are most exceptional? How can items be grouped based on similarity? What multivariate profile corresponds best to a
particular outcome?

Computer Science Dept.Fall 2014: November 26
CS 235: User Interface Design© R. Mak
35
Multivariate Displays
Glyphs Whiskers and stars Multivariate heatmaps Parallel coordinate plots

Computer Science Dept.Fall 2014: November 26
CS 235: User Interface Design© R. Mak
36
Multivariate Displays: Glyphs
Variable Visual attribute
Body temperature Color
Blood type Head shape
Body mass index Torso thickness
Heart rate Position of the arms
Blood sugar level Position of the legs
Now You See Itby Stephen FewAnalytics Press, 2009

Computer Science Dept.Fall 2014: November 26
CS 235: User Interface Design© R. Mak
37
Multivariate Displays: Glyphs, cont’d
Chernoff faces
http://mathworld.wolfram.com/ChernoffFace.html

Computer Science Dept.Fall 2014: November 26
CS 235: User Interface Design© R. Mak
38
Multivariate Displays: Whiskers and Stars
Each line represents a different variable. The line length encodes the variable’s value.
Now You See Itby Stephen FewAnalytics Press, 2009
Computer Science Dept.Fall 2014: November 26
CS 235: User Interface Design© R. Mak
39
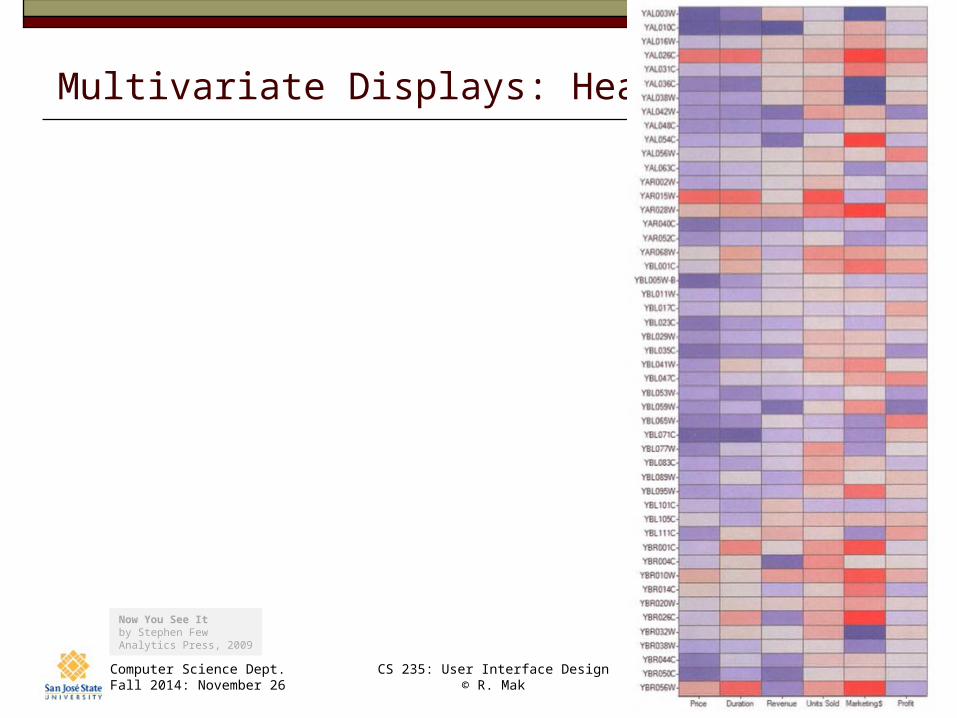
Multivariate Displays: Heatmaps
Now You See Itby Stephen FewAnalytics Press, 2009

Computer Science Dept.Fall 2014: November 26
CS 235: User Interface Design© R. Mak
40
Multivariate Displays: Parallel Plots
Now You See Itby Stephen FewAnalytics Press, 2009
Computer Science Dept.Fall 2014: November 26
CS 235: User Interface Design© R. Mak
41
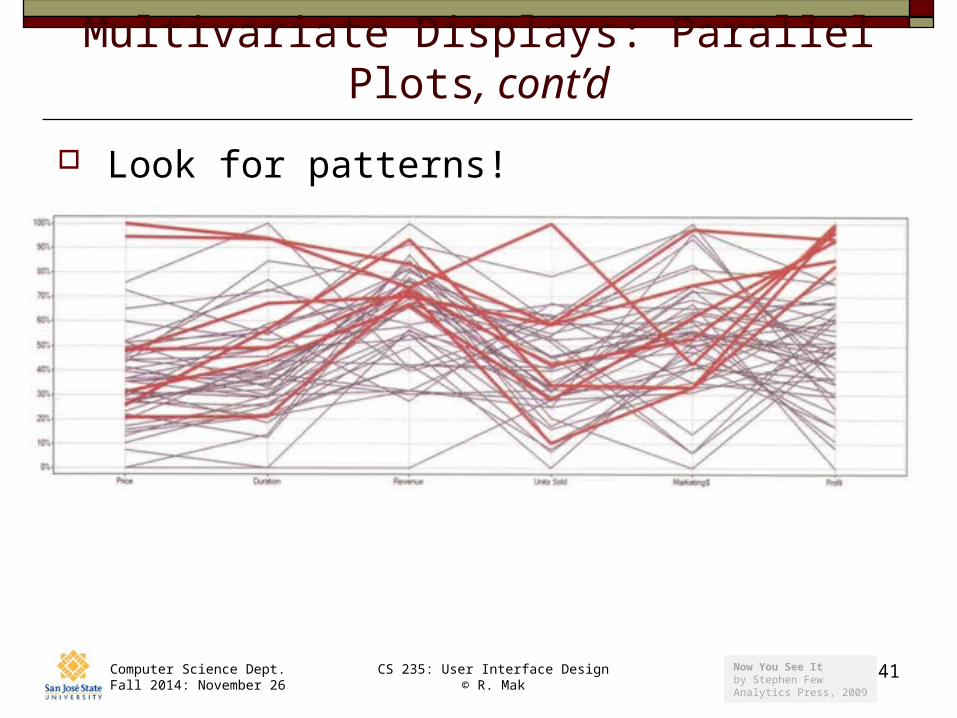
Multivariate Displays: Parallel Plots, cont’d
Look for patterns!
Now You See Itby Stephen FewAnalytics Press, 2009
Related Documents