Washington University School of Medicine Washington University School of Medicine Digital Commons@Becker Digital Commons@Becker Open Access Publications 2011 Cross-species comparison of orthologous gene expression in Cross-species comparison of orthologous gene expression in human bladder cancer and carcinogen-induced rodent models human bladder cancer and carcinogen-induced rodent models Yan Lu Washington University School of Medicine in St. Louis Pengyuan Liu Washington University School of Medicine in St. Louis Weidong Wen Washington University School of Medicine in St. Louis Clinton J. Grubbs University of Alabama - Birmingham Reid R. Townsend Washington University School of Medicine in St. Louis See next page for additional authors Follow this and additional works at: https://digitalcommons.wustl.edu/open_access_pubs Recommended Citation Recommended Citation Lu, Yan; Liu, Pengyuan; Wen, Weidong; Grubbs, Clinton J.; Townsend, Reid R.; Malone, James P.; Lubet, Ronald A.; and You, Ming, ,"Cross-species comparison of orthologous gene expression in human bladder cancer and carcinogen-induced rodent models." American Journal of Translational Research. 3,1. 8-27. (2011). https://digitalcommons.wustl.edu/open_access_pubs/3077 This Open Access Publication is brought to you for free and open access by Digital Commons@Becker. It has been accepted for inclusion in Open Access Publications by an authorized administrator of Digital Commons@Becker. For more information, please contact [email protected].

Welcome message from author
This document is posted to help you gain knowledge. Please leave a comment to let me know what you think about it! Share it to your friends and learn new things together.
Transcript
Washington University School of Medicine Washington University School of Medicine
Digital Commons@Becker Digital Commons@Becker
Open Access Publications
2011
Cross-species comparison of orthologous gene expression in Cross-species comparison of orthologous gene expression in
human bladder cancer and carcinogen-induced rodent models human bladder cancer and carcinogen-induced rodent models
Yan Lu Washington University School of Medicine in St. Louis
Pengyuan Liu Washington University School of Medicine in St. Louis
Weidong Wen Washington University School of Medicine in St. Louis
Clinton J. Grubbs University of Alabama - Birmingham
Reid R. Townsend Washington University School of Medicine in St. Louis
See next page for additional authors
Follow this and additional works at: https://digitalcommons.wustl.edu/open_access_pubs
Recommended Citation Recommended Citation Lu, Yan; Liu, Pengyuan; Wen, Weidong; Grubbs, Clinton J.; Townsend, Reid R.; Malone, James P.; Lubet, Ronald A.; and You, Ming, ,"Cross-species comparison of orthologous gene expression in human bladder cancer and carcinogen-induced rodent models." American Journal of Translational Research. 3,1. 8-27. (2011). https://digitalcommons.wustl.edu/open_access_pubs/3077
This Open Access Publication is brought to you for free and open access by Digital Commons@Becker. It has been accepted for inclusion in Open Access Publications by an authorized administrator of Digital Commons@Becker. For more information, please contact [email protected].

Authors Authors Yan Lu, Pengyuan Liu, Weidong Wen, Clinton J. Grubbs, Reid R. Townsend, James P. Malone, Ronald A. Lubet, and Ming You
This open access publication is available at Digital Commons@Becker: https://digitalcommons.wustl.edu/open_access_pubs/3077

Introduction Bladder cancer is one of the most common can-cers in the United States, especially in men. In 2009, there will be an estimated 70,980 new cases of bladder cancer with 52,810 cases in males [1]. Approximately 15% of bladder tumors evolve into invasive tumors after infiltration through the basement membrane. Patients with muscle-invasive disease are at high risk for re-currence, progression, and metastasis. Although early stage bladder cancer can be treated surgi-cally, the five-year survival is 45% and 6% for
patients with regional and distant recurrences, respectively. Mice or rats administered N-butyl-N-(4-hydroxybutyl)-nitrosamine (OH-BBN) develop transitional and squamous cell urinary bladder cancers that have significant histopathological similarities to human bladder cancer and are frequently invasive. These rodent models have been used previously to characterize the tumori-genic process for urinary bladder cancer and to assess the efficacy of potential chemopreven-tive agents to inhibit the development of blad-
Am J Transl Res 2011;3(1):8-27 www.ajtr.org /AJTR1008001
Original Article Cross-species comparison of orthologous gene expression in human bladder cancer and carcinogen-induced rodent models Yan Lu1,5, Pengyuan Liu1,5, Weidong Wen1, Clinton J Grubbs2, Reid R Townsend3, James P. Malone3, Ronald A Lubet4, and Ming You1,6 1 Department of Surgery and the Alvin J. Siteman Cancer Center, Washington University School of Medicine, St. Louis, MO 63110, USA; 2Departments of Surgery, Genetics, and Medicine, University of Alabama at Birmingham, Birmingham, AL 35294, USA; 3Department of Internal Medicine, Washington University School of Medicine, St. Louis, MO 63110, USA; 4Chemoprevention Agent Development Research Group, National Cancer Institute, Rockville, MD 20892, USA; 5Department of Physiology and the Cancer Center, Medical college of Wisconsin, Milwaukee, WI 53226, USA; 6Department of Pharmacology and Toxicology and the Cancer Center, Medical college of Wisconsin, Milwaukee, WI 53226, USA. Received August 3, 2010; accepted September 15, 2010; Epub: September 20, 2010; Published January 1, 2011 Abstract: Genes differentially expressed by tumor cells represent promising drug targets for anti-cancer therapy. Such candidate genes need to be validated in appropriate animal models. This study examined the suitability of ro-dent models of bladder cancer in B6D2F1 mice and Fischer-344 rats to model clinical bladder cancer specimens in humans. Using a global gene expression approach cross-species analysis showed that 13~34% of total genes in the genome were differentially expressed between tumor and normal tissues in each of five datasets from humans, rats, and mice. About 20% of these differentially expressed genes overlapped among species, corresponding to 2.6 to 4.8% of total genes in the genome. Several genes were consistently dysregulated in bladder tumors in both humans and rodents. Notably, CNN1, MYL9, PDLIM3, ITIH5, MYH11, PCP4 and FMO5 were found to commonly down-regulated; while TOP2A, CCNB2, KIF20A and RRM2 were up-regulated. These genes are likely to have conserved functions contributing to bladder carcinogenesis. Gene set enrichment analysis detected a number of molecular path-ways commonly activated in both humans and rodent bladder cancer. These pathways affect the cell cycle, HIF-1 and MYC expression, and regulation of apoptosis. We also compared expression changes at mRNA and protein levels in the rat model and identified several genes/proteins exhibiting concordant changes in bladder tumors, including ANXA1, ANXA2, CA2, KRT14, LDHA, LGALS4, SERPINA1, KRT18 and LDHB. In general, rodent models of bladder cancer represent the clinical disease to an extent that will allow successful mining of target genes and permit studies on the molecular mechanisms of bladder carcinogenesis. Keywords: Human bladder cancer, rodent models, gene expression, proteomics, and cross-species comparison.

Cross-species gene-expression of bladder cancer
9 Am J Transl Res 2011;3(1):8-27
der cancers [2-6]. However, to what degree car-cinogen-induced rodent models recapitulate molecular features and biological pathways of human bladder cancer has not been character-ized. Many biological systems operate in an evolu-tionarily conserved manner across a large num-ber of species. Cross-species analysis of se-quence and gene interaction is often applied to determine the function of new genes. In con-trast to these static measurements, microarrays measure the dynamic, condition-specific re-sponse of complex biological systems. The re-cent exponential growth in microarray expres-sion datasets allows researchers to combine expression experiments from multiple species to identify genes that are not only conserved in sequence but also regulated in a similar way across species. In this study we performed cross-species analysis of microarray data for human bladder cancer and carcinogen induced rodent bladder cancer. The major objectives of this study were to identify the degree of cross-species overlap on the single-gene level and to determine the similarity of the biological path-ways in the cross-species comparison that may be relevant to the mechanism of bladder car-cinogenesis. Our analysis demonstrates that cross-species comparisons can be used to ob-tain important information on gene expression and pathway activation that cannot be obtained when analyzing data from a single species. Materials and Methods Rodent models of bladder cancer Female Fischer-344 rats and male B6D2F1 (C57Bl/6 x DBA/2 F1) mice were obtained from Harlan Sprague-Dawley, Inc. (Indianapolis, IN; virus-free colony 202) at 28 days of age and were housed in polycarbonate cages (five per cage). The animals were kept in a lighted room 12 hours each day and maintained at 22 ± 0.5°C. Teklad 4% mash diet (Harlan Teklad, Madi-son, WI) and tap water were provided ad libi-tum. In the mouse study, at 56 days of age, ani-mals received the first of 12 weekly gavage treatments with OH-BBN (TCI America, Portland, OR). Each 7.5-mg dose was dissolved in 0.1 ml ethanol: water (25:75). For the rat study, OH-BBN (150 mg/gavage, 2x/week) was started when the rats were 49 days of age and contin-ued for 8 weeks. The carcinogen vehicle was
ethanol:water (20:80) in 0.5 ml. All animals were sacrificed 8 months following the initial OH-BBN treatment. Bladder tumors were removed and frozen for subsequent molecular assays. All frozen tumor tissues were microdissected to determine the tumor vs normal cell ratio for each specimen. Only microscopic sections from tumor tissues containing more than 80% tumor cells were isolated and stored at -80°C for subsequent RNA isolation. A portion of each tumor was fixed and processed for routine paraffin embedding, cut into 5-µm sections, and mounted for hema-toxylin and eosin (H&E) staining. All bladder tu-mors used in this study were diagnosed as blad-der cancers with a mixed histology showing ele-ments of both transitional and squamous cells. Matching normal epithelia came from the same sex and age-matched controls were also micro-dissected to ensure that specimens consisted of purely normal lung tissue. To isolate bladder epithelia, we separated epithelial cells from the stroma and muscle tissues by cutting the blad-der into half and scraping off the epithelium. Total RNA from normal bladder epithelia and bladder tumors were isolated by Trizol (Invitrogen, Carlsbad, CA) and purified using the RNeasy Mini Kit and RNase-free DNase Set (QIAGEN, Valencia, CA) according to the manu-facturer's protocols. In vitro transcription-based RNA amplification was then performed on each sample. cDNA for each sample was synthesized using a Superscript cDNA Synthesis Kit (Invitrogen) and a T7-(dT)24 primer, 5′-G G C C A G T G A A T T G T A A T A C G A C T C A C T A -TAGGGAGGCGG-(dT)24-3′. cDNA were cleaned using phase-lock gels (Fisher cat ID E0032005101) and phenol/chloroform extrac-tion. Then, biotin-labeled cRNA were transcribed in vitro from cDNA using a BioArray High Yield RNA Transcript Labeling Kit (ENZO Biochem, New York, NY) and purified again using the RNeasy Mini Kit. The labeled mouse cRNA were applied to Affymetrix MGU74Av2 GeneChips and the labeled rat cRNA were applied to Affymetrix Rat230 2.0 GeneChips or Rat Exon 1.0 ST Array (Affymetrix) according to the manufacturer's recommendations. The raw fluorescence inten-sity data within CEL files from the platform Affy-metrix MGU74Av2 and Rat230 2.0 were pre-processed with Robust Multichip Average (RMA) algorithm [7], as implemented with R packages A f f y f r o m B i o c o n d u c t o r ( h t t p : / /
Cross-species gene-expression of bladder cancer
10 Am J Transl Res 2011;3(1):8-27
www.bioconductor.org). This algorithm analyzes the microarray data in three steps: a back-ground adjustment, quantile normalization, and finally summation of the probe intensities for each probe set using a log scale linear additive model for the log transform of (background cor-rected, normalized) PM intensities. Gene-level signal estimates for the CEL files from the plat-form Rat Exon 1.0 ST Array were derived by quantile sketch normalization using Iterplier algorithm, as implemented with Expression Con-sole v1.1.1 (http://www.affymetrix.com/p r o d u c t s_ se r v i c e s / s o f t w ar e / s p e c i f i c /expression_console_software.affx). For 1D protein gel electrophoresis, rat samples were solubilized in the following lysis buffers: 25 mM Hepes buffer containing 150 mM NaCl, 10 mM MgCl2, 1% Igepal, 0.25% sodium deoxycho-late, 10% glycerol, 2.5 mM EDTA, and protease/phosphatase inhibitors. For 2D protein differ-ence electrophoresis, rat samples were solubi-lized in 100 μL of lysis buffer (30 mM Tris-Cl, pH 8.5; 7 M urea, 2 M thiourea, 4% CHAPS) con-taining protease inhibitor cocktail (Roche, Indi-anapolis, IN) and phosphatase inhibitor cock-tails I and II) (Sigma-Aldrich, St. Louis, MO). After centrifugation at 15,000 rpm for 30 min, the supernatant was recovered as cellular protein for the protein expression study. Protein sam-ples from carcinogen-treated and control rats were labeled with DIGE fluorescent dye (GE Healthcare Amersham Biosciences, Piscataway, NJ), and analysis was performed as described previously [8]. A pooled sample consisting of a mixture of small portions of all protein samples obtained was used as internal control. Briefly, after extraction in lysis buffer, three cyanine dyes, Cy2, Cy3, and Cy5 were used to label the protein samples from normal rats, pooled sam-ple, and carcinogen-treated rats, respectively. The same amount of protein were combined and analyzed on the same gel. For the first-dimension separation, the labeling mixture was applied to Immobiline DryStrips (24 cm long, pH 3 to 10; GE Healthcare). The second dimension was carried out with 10-20% SDS-PAGE gels. The Cy2, Cy3, and Cy5-labeled images were subsequently acquired at the recommended wavelengths using a Typhoon 9400 scanner (GE Healthcare). Comprehensive image analysis was performed using DeCyder-2D Differential Analy-sis Software 5.0 (GE Healthcare). For spot de-tection and quantification, the differential in-gel analysis (DIA) module of DeCyder was em-
ployed. The biological variance analysis module (BVA) was then used to match the quantified spots of all gels to a chosen master gel. The statistical significance of each expression level was calculated using the Student’s t-test in the BVA module. Protein expression levels which showed a statistically significant (p<0.05) in-crease or decrease were defined as being sig-nificant. In addition to log standardized abun-dances, the matched spot raw volume data of each sample was used in this analysis. A ratio was created by comparing the raw volume of each protein spot to that of its intra-gel internal standard. Selected gel features were excised and digested in situ with trypsin as described previously [8]. The resulting peptide pools were analyzed by tandem mass spectrometry using both MALDI-TOF/TOF instrument (Proteomics 4700, Applied Biosystems, Framingham, MA) and LC-MS/MS (LTQ-FTMS, Thermolelectron, San Jose, CA) performed as described [9]. The peptide fragmentation spectra were processed using Data Explorer, v 4.5 and Analyst software (Applied BioSystems, Framingham, MA and To-ronto, Ontario). The processed spectra were used to search protein and conceptually-translated database with MASCOT, v 1.9 (Matrix Sciences, London, UK). Precursor error toler-ance was set to 100 ppm and MS/MS fragment error tolerance, 0.8 Da. All the proteins identi-fied should have protein scores greater than 40 and individual ions scores greater than 20 with expected value < 0.05. All the MS/MS spectra were further validated manually. When multiple proteins were identified in a single spot, the proteins with the highest number of peptides were considered as those corresponding to the spot. Human bladder cancer The expression data for human clinical speci-mens from two published study were used. Both of these two studies performed gene expression profiles on the Human Genome U133A human GeneChips containing 22,283 probes repre-senting known genes and expression sequence tags (Affymetrix). One dataset is the study of Dyrskjøt et al. [10] including biopsies of normal bladder mucosa from 9 patients without a blad-der cancer history, histologically normal mucosa biopsies from 5 cystectomy specimens, biopsies from 28 superficial transitional cell bladder tu-mors (13 tumors with surrounding carcinoma in situ and 15 without surrounding carcinoma in
Cross-species gene-expression of bladder cancer
11 Am J Transl Res 2011;3(1):8-27
situ) and 13 invasive transitional cell carcino-mas. The CEL files were downloaded from Gene Expression Omnibus (GEO accession number: GSE3167). The raw fluorescence intensity data within CEL files were preprocessed with RMA algorithm. Another dataset is the study of San-chez-Carbayo et al. [11], including 49 normal urothelium specimens which were obtained at distant sites from the bladder tumors resected by cystectomy or cystoprostatectomy and 109 bladder cancer (28 superficial and 81 invasive lesions). The expression data of the 157 blad-der tissues under study derived by the Affy-metrix Microarray Suite 5.0 (MAS 5.0) were in-cluded in Supplemental table 10 of the original paper (http://jco.ascopubs.org/cgi/content/full/JCO.2005.03.2375/DC1). Basic informa-tion of these five microarray datasets used for cross-species gene-expression analysis of blad-der cancer is found in Table 1. Statistical analyses The probe sets with the average gene expres-sion level of both tumor and normal groups less than 64 derived by MAS 5.0 and Iterplier or less than 6 derived by RMA were excluded in the following statistical analyses. Two-sample stu-dent t test was used to identify differentially expressed genes (DEGs) between tumor and normal groups for each dataset. To adjust the multiple testing in the study of high-dimensional microarray data, both tail area-based false dis-covery rate values (Q values) and local false discovery rate (LFDR) were estimated [12], which was implemented in R package fdrtool (http://www.r-project.org/). The DEGs were de-fined as genes with Q value < 0.01, LFDR < 0.05 and fold change > 1.5 between two groups.
Gene set enrichment analysis (GSEA) was per-
formed to analyze the pattern of differential gene expression in each dataset respectively. GSEA is a computational method that deter-mines whether a set of genes shows statistically significant differences in expression between two biological states, which has proved success-ful in discovering molecular pathways involved in human diseases (http://www.broad.mit.edu/gsea). Using the Kolmogorov-Smirnov statistic, GSEA assesses the degree of “enrichment” of a set of genes (e.g. a pathway) in the entire range of the strength of associations with the pheno-type of interest. It was used to identify a priori defined sets of genes that were differentially expressed [13, 14]. We used curated gene sets (c2) which contain genes on certain molecular pathways, and GO gene sets (c5) which consist of genes annotated by the same GO terms in the Molecular Signature Database (MSigDB, http://www.broad.mit.edu/gsea/msigdb/msigdb_index.html). For datasets of rodent models, because of small sample size, GSEA with gene permutation option was performed. Selected gene sets identified from GSEA were then visualized with MetaCore™ (http://www.genego.com/).
Quantitative Real-time PCR Using the samples from rat model of bladder cancer, the relative expressions of eight random selected genes associated with survival were determined by QRT-PCR. RNA was isolated using Trizol reagent per manufacturer’s instructions (Invitrogen). One micrograms of total RNA per sample were converted to cDNA using the Im Prom-II RT kit (Promega Co. Madison, WI) for RT-PCR (Invitrogen). Primers for QRT-PCR analysis (Table 2) were designed using Primer Express software version 2.0 (Applied Biosystems, Fos-ter City, CA). Amplification of each target DNA was performed with SYBR Green PCR Supermix
Table 1. Datasets in cross-species gene-expression analysis of bladder cancer
Datasets No. of normal No. of tumor GEO PubMed
Human_1 14 41 GSE3167 15173019 Human_2 49 109 N/A 16432078 Rat_1 5 5 N/A 17401461 Rat_2* 7 11 N/A N/A Mouse 4 4 N/A 15548366 *These are new microarray data from Rat Exon 1.0 ST arrays used for the present study.
Cross-species gene-expression of bladder cancer
12 Am J Transl Res 2011;3(1):8-27
(BIO-RAD, Hercules, CA) in BIO-RAD Single Color Real-Time PCR Detection system according to the protocols provided. One microliter of cDNA was added to a 25 mL total volume reaction mixture containing water, SYBR Green PCR Su-perMix, and primers. Each real-time assay was done in triplicate on a BioRad MyIQ thermal cycler. Data were collected and analyzed with iQ5 optical system software, version 2.1 soft-ware. The internal control gene GAPDH and tar-get genes were amplified with equal efficien-cies. The method for assessing if two amplicons have the same efficiency is to look at how ΔCT (CT,target – CT,GAPDH, CT is cycle number at which the fluorescence signal exceeds background)
varies with template dilution. Smaller ΔCT indi-cates higher gene expression. The fold change of gene expression in the tumor tissues relative to the normal tissues was calculated as 2-ΔΔCT (ΔΔCT = ΔCT tumor – ΔCT normal). The differences in expression between two groups were deter-mined by two-tailed Student’s t-test. A P-value of less than 0.05 was considered to indicate sta-tistical significance.
Results Differentially expressed bladder cancer genes in each species Five microarray datasets were used for cross-species gene-expression analysis of bladder cancer including two human datasets, two rat datasets and one mouse dataset (Table 1). One of two rat datasets is our new microarray data from Rat Exon 1.0 ST arrays. We applied a cut-off of Q value < 0.01, LFDR < 0.05 and fold change > 1.5 to detect genes differentially regu-lated between tumors and normal bladder tis-sues in all datasets. Table 3 listed total num-bers and proportion of genes differentially regu-lated between tumor and normal bladder tis-sues in each dataset. We first randomly chose eight DEGs and evaluated the microarray gene expression results from the cross-species analy-sis. The relative expression of these candidate bladder cancer genes was determined by QRT-PCR analysis using the samples from the rat model. We confirmed the expression results for
Table 2. Oligonucleotide primers and probes used for quantitative real-time PCR Analysis
Gene Sense primer Anti-sense primer
GAPDH GACATGCCGCCTGGAGAA CTCGGCCGCCTGCTT ANXA2 GACATTGCCTTCGCCTACCA ACCAGACAAGGCCGACTTCA TUBB5 TCCGTTCGCTCAGGTCCTT CTGCCCCAGACTGACCAAAA NDN GGACAGAGTCGCGCTGAAC TCACATAGATGAGACTCAGGATCATGA KIF2c GGAAGGTATTTGATCTGCTCAACAA CAACCTGCACCTGCTGCTT KIF22 CCCAGAAATTAAGCCTCTTACAGAA CCCAGCAAACGTTCCATACTC CCNA2 ACAGTATGCGGGCCATCCT AGCCAAATGCAGGGTCTCAT INHBA GGCAGGAGGGCCGAAAT CCTGACTCGGCAAAGGTGAT E2F8 ACTTTCCCCAAACCACAGGAT CGACGCCACTGGGATCA
Table 3. Total number and proportion of genes differentially regulated between tumor and normal bladder tissues*
Up-regulated in tumor Down-regulated in tumor
Number Proportion (%) Number Proportion (%)
Human_1 2729 14.7 2233 12.0 Human_2 3104 24.5 1352 10.7 Rat_1 816 6.5 789 6.3 Rat_2 1069 6.8 1137 7.2 Mouse 514 6.5 621 7.8 *The DEGs were defined as genes with Q value < 0.01, LFDR < 0.05 and fold change > 1.5 between two groups.
Cross-species gene-expression of bladder cancer
13 Am J Transl Res 2011;3(1):8-27
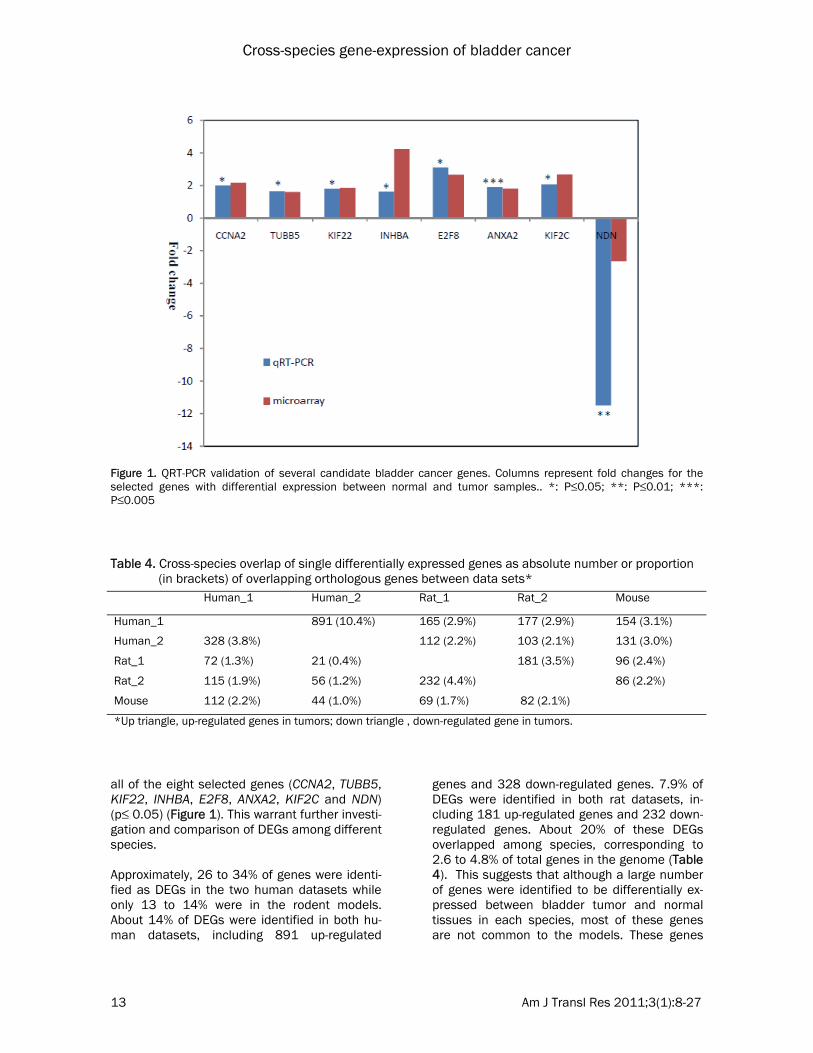
all of the eight selected genes (CCNA2, TUBB5, KIF22, INHBA, E2F8, ANXA2, KIF2C and NDN) (p≤ 0.05) (Figure 1). This warrant further investi-gation and comparison of DEGs among different species. Approximately, 26 to 34% of genes were identi-fied as DEGs in the two human datasets while only 13 to 14% were in the rodent models. About 14% of DEGs were identified in both hu-man datasets, including 891 up-regulated
genes and 328 down-regulated genes. 7.9% of DEGs were identified in both rat datasets, in-cluding 181 up-regulated genes and 232 down-regulated genes. About 20% of these DEGs overlapped among species, corresponding to 2.6 to 4.8% of total genes in the genome (Table 4). This suggests that although a large number of genes were identified to be differentially ex-pressed between bladder tumor and normal tissues in each species, most of these genes are not common to the models. These genes
Figure 1. QRT-PCR validation of several candidate bladder cancer genes. Columns represent fold changes for the selected genes with differential expression between normal and tumor samples.. *: P≤0.05; **: P≤0.01; ***: P≤0.005
Table 4. Cross-species overlap of single differentially expressed genes as absolute number or proportion (in brackets) of overlapping orthologous genes between data sets*
Human_1 Human_2 Rat_1 Rat_2 Mouse
Human_1 891 (10.4%) 165 (2.9%) 177 (2.9%) 154 (3.1%)
Human_2 328 (3.8%) 112 (2.2%) 103 (2.1%) 131 (3.0%)
Rat_1 72 (1.3%) 21 (0.4%) 181 (3.5%) 96 (2.4%)
Rat_2 115 (1.9%) 56 (1.2%) 232 (4.4%) 86 (2.2%)
Mouse 112 (2.2%) 44 (1.0%) 69 (1.7%) 82 (2.1%)
*Up triangle, up-regulated genes in tumors; down triangle , down-regulated gene in tumors.
Cross-species gene-expression of bladder cancer
14 Am J Transl Res 2011;3(1):8-27
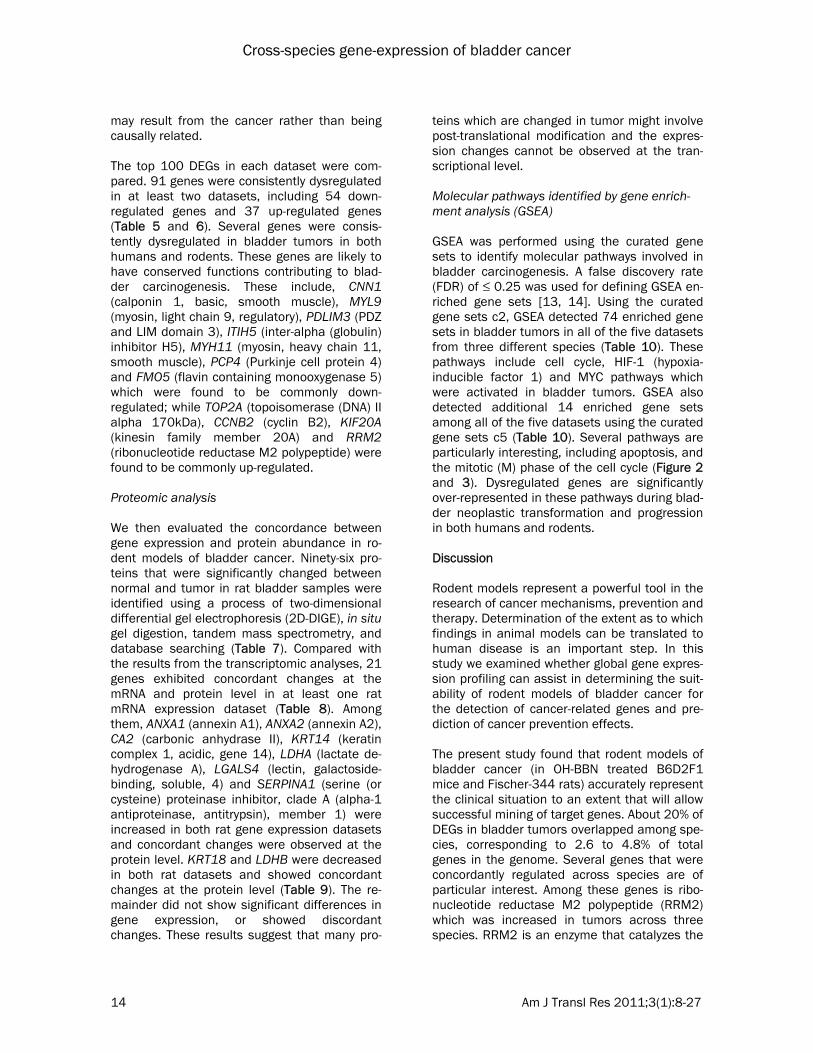
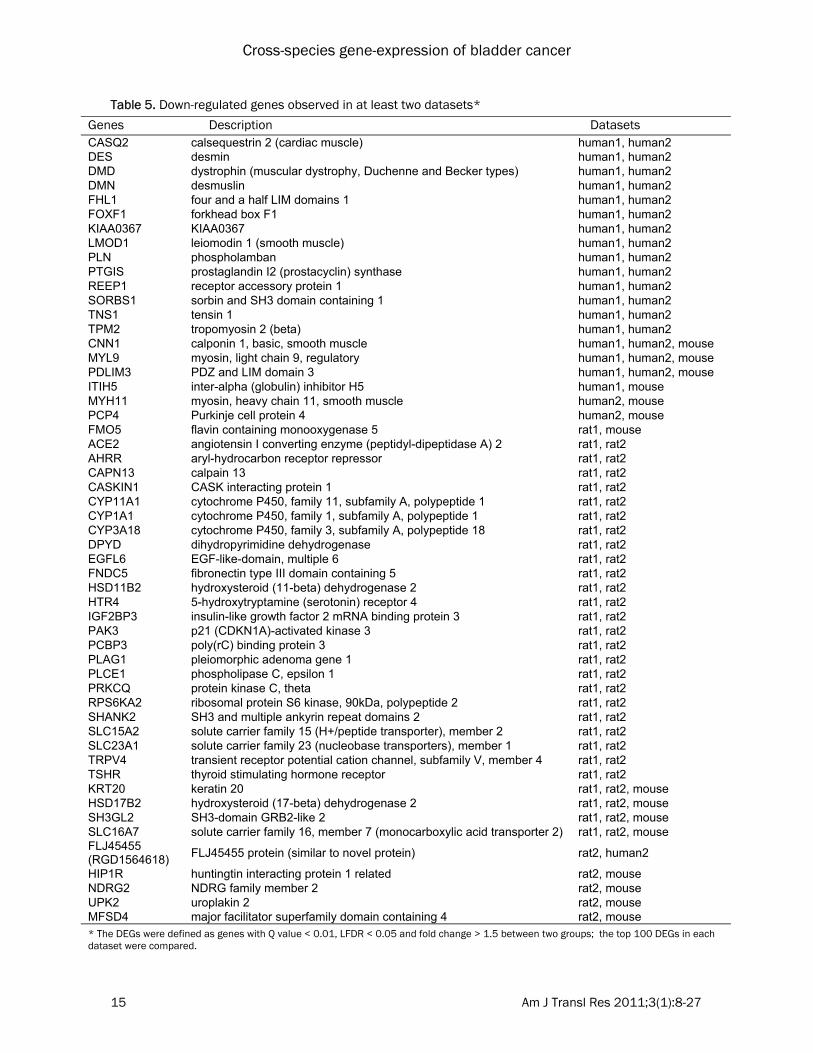
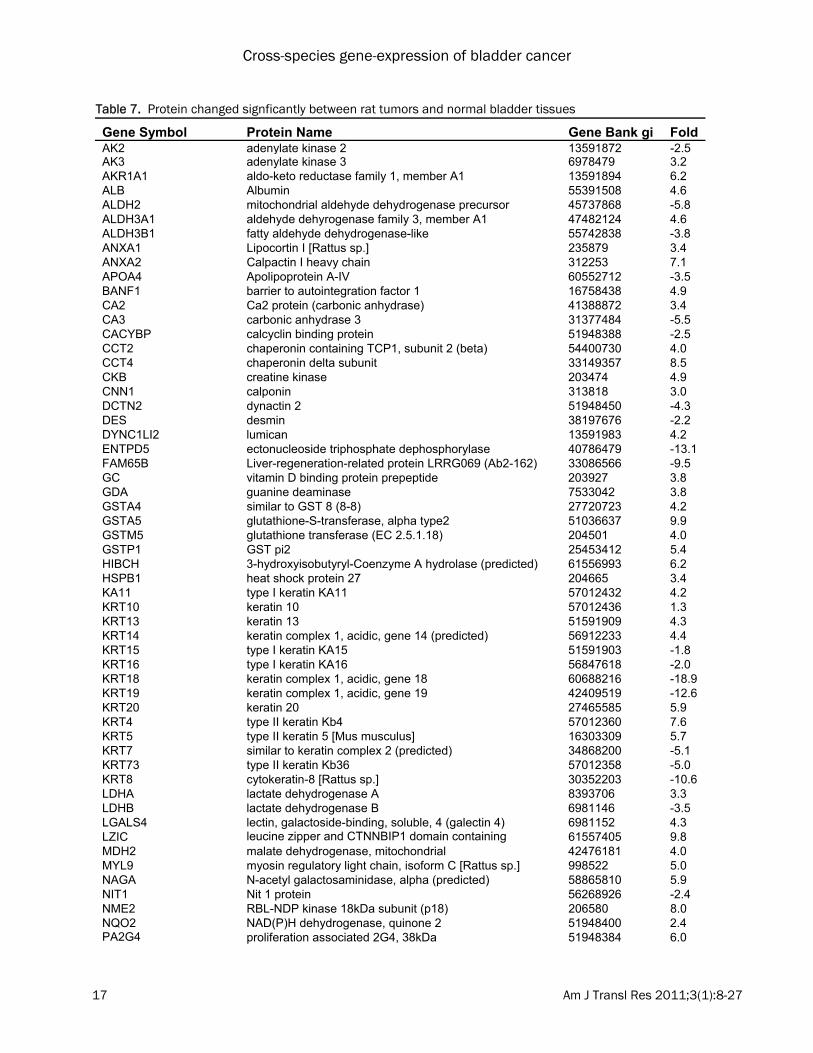
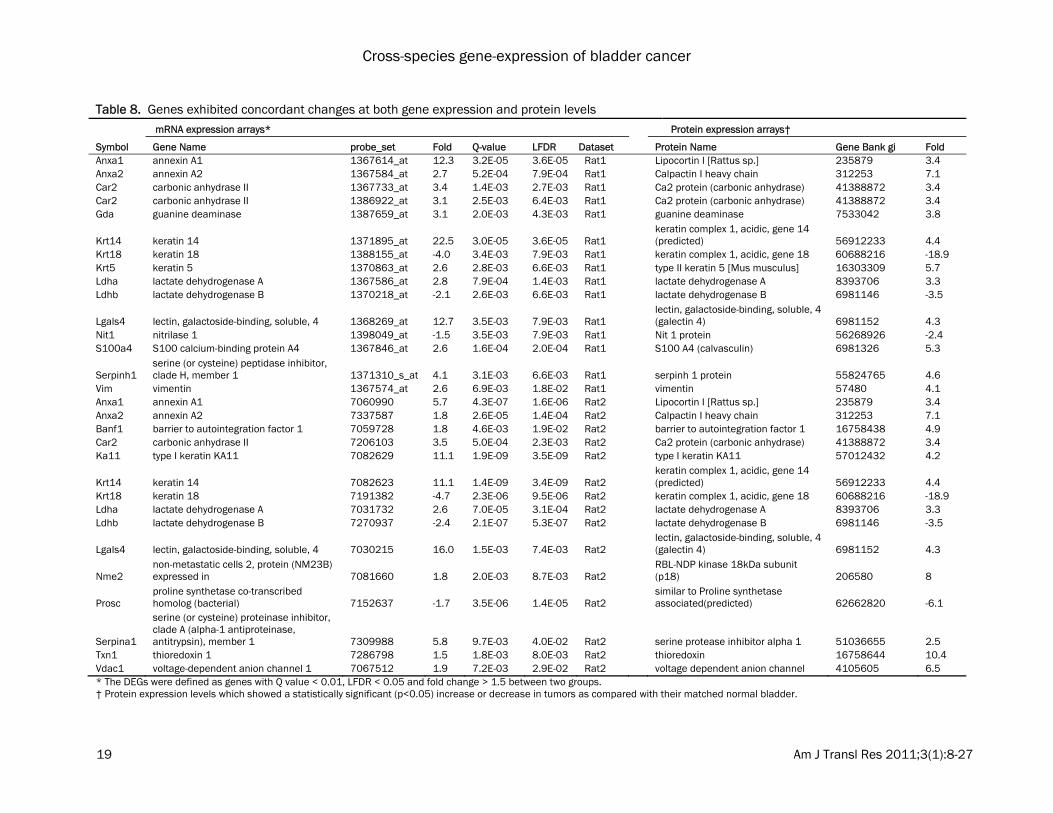
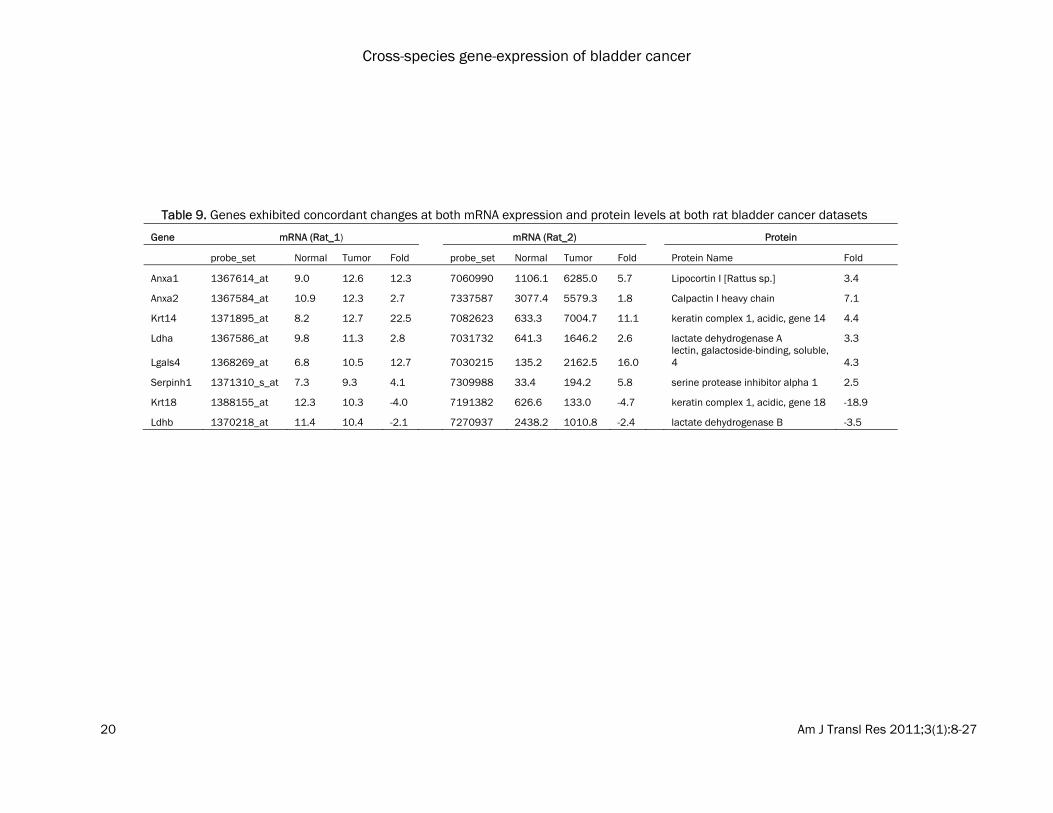
may result from the cancer rather than being causally related. The top 100 DEGs in each dataset were com-pared. 91 genes were consistently dysregulated in at least two datasets, including 54 down-regulated genes and 37 up-regulated genes (Table 5 and 6). Several genes were consis-tently dysregulated in bladder tumors in both humans and rodents. These genes are likely to have conserved functions contributing to blad-der carcinogenesis. These include, CNN1 (calponin 1, basic, smooth muscle), MYL9 (myosin, light chain 9, regulatory), PDLIM3 (PDZ and LIM domain 3), ITIH5 (inter-alpha (globulin) inhibitor H5), MYH11 (myosin, heavy chain 11, smooth muscle), PCP4 (Purkinje cell protein 4) and FMO5 (flavin containing monooxygenase 5) which were found to be commonly down-regulated; while TOP2A (topoisomerase (DNA) II alpha 170kDa), CCNB2 (cyclin B2), KIF20A (kinesin family member 20A) and RRM2 (ribonucleotide reductase M2 polypeptide) were found to be commonly up-regulated. Proteomic analysis We then evaluated the concordance between gene expression and protein abundance in ro-dent models of bladder cancer. Ninety-six pro-teins that were significantly changed between normal and tumor in rat bladder samples were identified using a process of two-dimensional differential gel electrophoresis (2D-DIGE), in situ gel digestion, tandem mass spectrometry, and database searching (Table 7). Compared with the results from the transcriptomic analyses, 21 genes exhibited concordant changes at the mRNA and protein level in at least one rat mRNA expression dataset (Table 8). Among them, ANXA1 (annexin A1), ANXA2 (annexin A2), CA2 (carbonic anhydrase II), KRT14 (keratin complex 1, acidic, gene 14), LDHA (lactate de-hydrogenase A), LGALS4 (lectin, galactoside-binding, soluble, 4) and SERPINA1 (serine (or cysteine) proteinase inhibitor, clade A (alpha-1 antiproteinase, antitrypsin), member 1) were increased in both rat gene expression datasets and concordant changes were observed at the protein level. KRT18 and LDHB were decreased in both rat datasets and showed concordant changes at the protein level (Table 9). The re-mainder did not show significant differences in gene expression, or showed discordant changes. These results suggest that many pro-
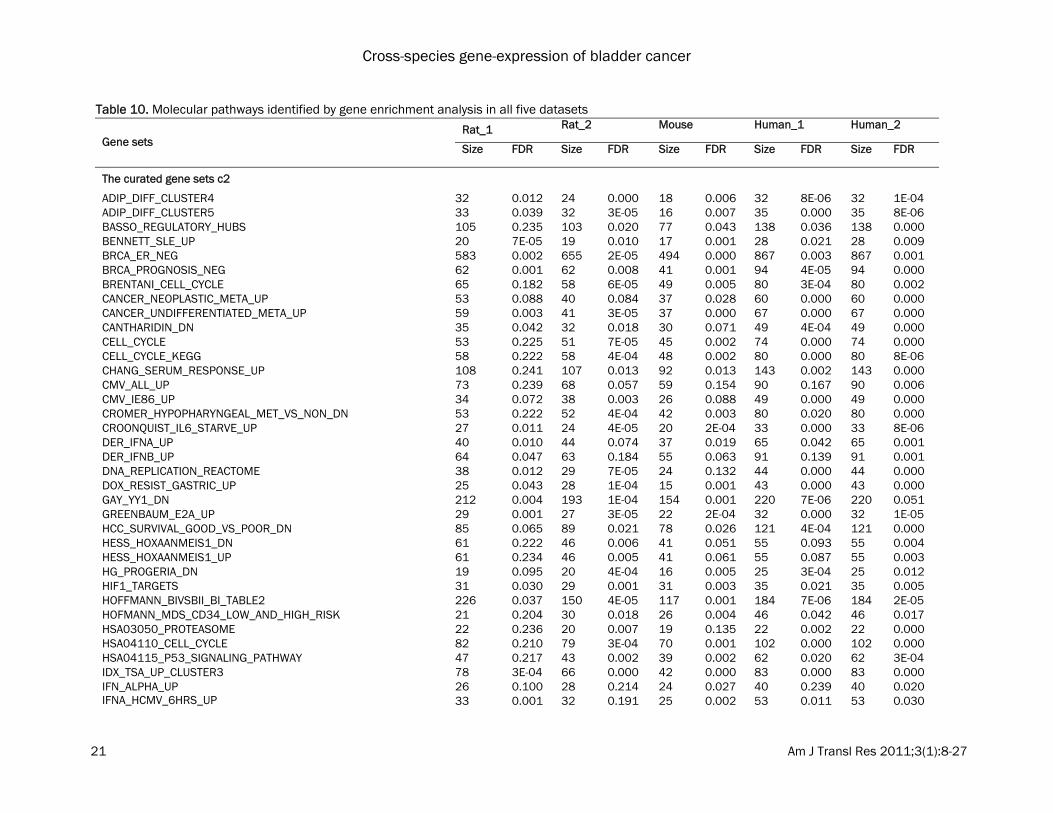
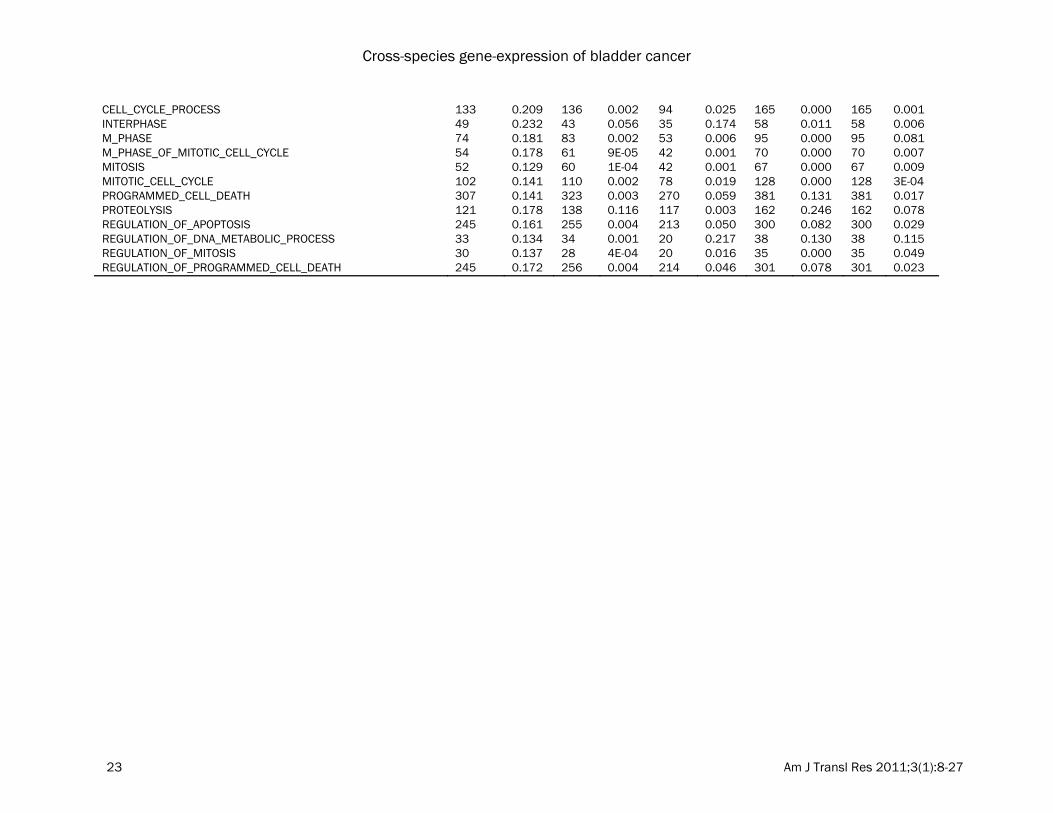
teins which are changed in tumor might involve post-translational modification and the expres-sion changes cannot be observed at the tran-scriptional level. Molecular pathways identified by gene enrich-ment analysis (GSEA) GSEA was performed using the curated gene sets to identify molecular pathways involved in bladder carcinogenesis. A false discovery rate (FDR) of ≤ 0.25 was used for defining GSEA en-riched gene sets [13, 14]. Using the curated gene sets c2, GSEA detected 74 enriched gene sets in bladder tumors in all of the five datasets from three different species (Table 10). These pathways include cell cycle, HIF-1 (hypoxia-inducible factor 1) and MYC pathways which were activated in bladder tumors. GSEA also detected additional 14 enriched gene sets among all of the five datasets using the curated gene sets c5 (Table 10). Several pathways are particularly interesting, including apoptosis, and the mitotic (M) phase of the cell cycle (Figure 2 and 3). Dysregulated genes are significantly over-represented in these pathways during blad-der neoplastic transformation and progression in both humans and rodents. Discussion Rodent models represent a powerful tool in the research of cancer mechanisms, prevention and therapy. Determination of the extent as to which findings in animal models can be translated to human disease is an important step. In this study we examined whether global gene expres-sion profiling can assist in determining the suit-ability of rodent models of bladder cancer for the detection of cancer-related genes and pre-diction of cancer prevention effects. The present study found that rodent models of bladder cancer (in OH-BBN treated B6D2F1 mice and Fischer-344 rats) accurately represent the clinical situation to an extent that will allow successful mining of target genes. About 20% of DEGs in bladder tumors overlapped among spe-cies, corresponding to 2.6 to 4.8% of total genes in the genome. Several genes that were concordantly regulated across species are of particular interest. Among these genes is ribo-nucleotide reductase M2 polypeptide (RRM2) which was increased in tumors across three species. RRM2 is an enzyme that catalyzes the
Cross-species gene-expression of bladder cancer
15 Am J Transl Res 2011;3(1):8-27
Table 5. Down-regulated genes observed in at least two datasets* Genes Description Datasets
CASQ2 calsequestrin 2 (cardiac muscle) human1, human2 DES desmin human1, human2 DMD dystrophin (muscular dystrophy, Duchenne and Becker types) human1, human2 DMN desmuslin human1, human2 FHL1 four and a half LIM domains 1 human1, human2 FOXF1 forkhead box F1 human1, human2 KIAA0367 KIAA0367 human1, human2 LMOD1 leiomodin 1 (smooth muscle) human1, human2 PLN phospholamban human1, human2 PTGIS prostaglandin I2 (prostacyclin) synthase human1, human2 REEP1 receptor accessory protein 1 human1, human2 SORBS1 sorbin and SH3 domain containing 1 human1, human2 TNS1 tensin 1 human1, human2 TPM2 tropomyosin 2 (beta) human1, human2 CNN1 calponin 1, basic, smooth muscle human1, human2, mouse MYL9 myosin, light chain 9, regulatory human1, human2, mouse PDLIM3 PDZ and LIM domain 3 human1, human2, mouse ITIH5 inter-alpha (globulin) inhibitor H5 human1, mouse MYH11 myosin, heavy chain 11, smooth muscle human2, mouse PCP4 Purkinje cell protein 4 human2, mouse FMO5 flavin containing monooxygenase 5 rat1, mouse ACE2 angiotensin I converting enzyme (peptidyl-dipeptidase A) 2 rat1, rat2 AHRR aryl-hydrocarbon receptor repressor rat1, rat2 CAPN13 calpain 13 rat1, rat2 CASKIN1 CASK interacting protein 1 rat1, rat2 CYP11A1 cytochrome P450, family 11, subfamily A, polypeptide 1 rat1, rat2 CYP1A1 cytochrome P450, family 1, subfamily A, polypeptide 1 rat1, rat2 CYP3A18 cytochrome P450, family 3, subfamily A, polypeptide 18 rat1, rat2 DPYD dihydropyrimidine dehydrogenase rat1, rat2 EGFL6 EGF-like-domain, multiple 6 rat1, rat2 FNDC5 fibronectin type III domain containing 5 rat1, rat2 HSD11B2 hydroxysteroid (11-beta) dehydrogenase 2 rat1, rat2 HTR4 5-hydroxytryptamine (serotonin) receptor 4 rat1, rat2 IGF2BP3 insulin-like growth factor 2 mRNA binding protein 3 rat1, rat2 PAK3 p21 (CDKN1A)-activated kinase 3 rat1, rat2 PCBP3 poly(rC) binding protein 3 rat1, rat2 PLAG1 pleiomorphic adenoma gene 1 rat1, rat2 PLCE1 phospholipase C, epsilon 1 rat1, rat2 PRKCQ protein kinase C, theta rat1, rat2 RPS6KA2 ribosomal protein S6 kinase, 90kDa, polypeptide 2 rat1, rat2 SHANK2 SH3 and multiple ankyrin repeat domains 2 rat1, rat2 SLC15A2 solute carrier family 15 (H+/peptide transporter), member 2 rat1, rat2 SLC23A1 solute carrier family 23 (nucleobase transporters), member 1 rat1, rat2 TRPV4 transient receptor potential cation channel, subfamily V, member 4 rat1, rat2 TSHR thyroid stimulating hormone receptor rat1, rat2 KRT20 keratin 20 rat1, rat2, mouse HSD17B2 hydroxysteroid (17-beta) dehydrogenase 2 rat1, rat2, mouse SH3GL2 SH3-domain GRB2-like 2 rat1, rat2, mouse SLC16A7 solute carrier family 16, member 7 (monocarboxylic acid transporter 2) rat1, rat2, mouse FLJ45455 (RGD1564618) FLJ45455 protein (similar to novel protein) rat2, human2
HIP1R huntingtin interacting protein 1 related rat2, mouse NDRG2 NDRG family member 2 rat2, mouse UPK2 uroplakin 2 rat2, mouse MFSD4 major facilitator superfamily domain containing 4 rat2, mouse * The DEGs were defined as genes with Q value < 0.01, LFDR < 0.05 and fold change > 1.5 between two groups; the top 100 DEGs in each dataset were compared.

Cross-species gene-expression of bladder cancer
16 Am J Transl Res 2011;3(1):8-27
formation of deoxyribonucleotides from ribonu-cleotides [15]. Deoxyribonucleotides in turn are used in the synthesis of DNA. The reaction cata-lyzed by RRM2 is strictly conserved in all living organisms [16]. Furthermore RRM2 plays a criti-cal role in regulating the total rate of DNA syn-thesis so that DNA to cell mass is maintained at a constant ratio during cell division and DNA repair [17]. RRM2 plays an important role in tumor angiogenesis and growth through regula-
tion of the expression of TSP-1 and VEGF [18]. TOP2A was consistently increased across data-sets and encodes a DNA topoisomerase, an enzyme that controls and alters the topologic states of DNA during transcription. TOP2A plays an important role in checkpoint activation and the maintenance of genomic stability [19]. Increased TOP2A correlated with advanced his-tological grading, microvascular invasion, and an early age onset of the hepatocellular
Table 6. Up-regulated genes observed in at least two datasets*
Genes Description Datasets CDH1 cadherin 1, type 1, E-cadherin (epithelial) human1, human2 EIF2AK1 eukaryotic translation initiation factor 2-alpha kinase 1 human1, human2 KPNA2 karyopherin alpha 2 (RAG cohort 1, importin alpha 1) human1, human2 KRT7 keratin 7 human1, human2 LSR lipolysis stimulated lipoprotein receptor human1, human2 MLF1IP MLF1 interacting protein human1, human2 PRC1 protein regulator of cytokinesis 1 human1, human2 SLC38A1 solute carrier family 38, member 1 human1, human2 SPINT1 serine peptidase inhibitor, Kunitz type 1 human1, human2 TH1L TH1-like (Drosophila) human1, human2 TOP2A topoisomerase (DNA) II alpha 170kDa human1, human2, mouse CCNB2 cyclin B2 rat1, human1 KIF20A kinesin family member 20A rat1, human1 RRM2 ribonucleotide reductase M2 polypeptide rat1, human1, mouse
CEACAM1 carcinoembryonic antigen-related cell adhesion molecule 1 (biliary glycoprotein) rat1, mouse
CTGF connective tissue growth factor rat1, mouse MMP7 matrix metallopeptidase 7 (matrilysin, uterine) rat1, mouse S100A9 S100 calcium binding protein A9 rat1, mouse SERPINB2 serpin peptidase inhibitor, clade B (ovalbumin), member 2 rat1, mouse DDIT4 DNA-damage-inducible transcript 4 rat1, rat2
KCNN4 potassium intermediate/small conductance calcium-activated channel, subfamily N, member 4 rat1, rat2
MALL mal, T-cell differentiation protein-like rat1, rat2 MMP3 matrix metallopeptidase 3 (stromelysin 1, progelatinase) rat1, rat2 PROM1 prominin 1 rat1, rat2 RGD1563692 rat1, rat2 TNFRSF12A tumor necrosis factor receptor superfamily, member 12A rat1, rat2
TRPV2 transient receptor potential cation channel, subfamily V, mem-ber 2 rat1, rat2
TSPAN1 tetraspanin 1 rat1, rat2 VWA1 von Willebrand factor A domain containing 1 rat1, rat2 VWF von Willebrand factor rat1, rat2 WIF1 WNT inhibitory factor 1 rat1, rat2 FGFBP1 fibroblast growth factor binding protein 1 rat1, rat2, mouse GPX2 glutathione peroxidase 2 (gastrointestinal) rat1, rat2, mouse MMP12 matrix metallopeptidase 12 (macrophage elastase) rat1, rat2, mouse ANXA8 annexin A8 rat2, mouse BHLHB2 basic helix-loop-helix domain containing, class B, 2 rat2, mouse MMP13 matrix metallopeptidase 13 (collagenase 3) rat2, mouse * The DEGs were defined as genes with Q value < 0.01, LFDR < 0.05 and fold change > 1.5 between two groups; the top 100 DEGs in each dataset were compared.
Cross-species gene-expression of bladder cancer
Table 7. Protein changed signficantly between rat tumors and normal bladder tissues
Gene Symbol Protein Name Gene Bank gi FoldAK2 adenylate kinase 2 13591872 -2.5AK3 adenylate kinase 3 6978479 3.2 AKR1A1 aldo-keto reductase family 1, member A1 13591894 6.2 ALB Albumin 55391508 4.6 ALDH2 mitochondrial aldehyde dehydrogenase precursor 45737868 -5.8 ALDH3A1 aldehyde dehyrogenase family 3, member A1 47482124 4.6 ALDH3B1 fatty aldehyde dehydrogenase-like 55742838 -3.8 ANXA1 Lipocortin I [Rattus sp.] 235879 3.4 ANXA2 Calpactin I heavy chain 312253 7.1 APOA4 Apolipoprotein A-IV 60552712 -3.5 BANF1 barrier to autointegration factor 1 16758438 4.9 CA2 Ca2 protein (carbonic anhydrase) 41388872 3.4 CA3 carbonic anhydrase 3 31377484 -5.5 CACYBP calcyclin binding protein 51948388 -2.5 CCT2 chaperonin containing TCP1, subunit 2 (beta) 54400730 4.0 CCT4 chaperonin delta subunit 33149357 8.5 CKB creatine kinase 203474 4.9 CNN1 calponin 313818 3.0 DCTN2 dynactin 2 51948450 -4.3 DES desmin 38197676 -2.2 DYNC1LI2 lumican 13591983 4.2 ENTPD5 ectonucleoside triphosphate dephosphorylase 40786479 -13.1 FAM65B Liver-regeneration-related protein LRRG069 (Ab2-162) 33086566 -9.5 GC vitamin D binding protein prepeptide 203927 3.8 GDA guanine deaminase 7533042 3.8 GSTA4 similar to GST 8 (8-8) 27720723 4.2 GSTA5 glutathione-S-transferase, alpha type2 51036637 9.9 GSTM5 glutathione transferase (EC 2.5.1.18) 204501 4.0 GSTP1 GST pi2 25453412 5.4 HIBCH 3-hydroxyisobutyryl-Coenzyme A hydrolase (predicted) 61556993 6.2 HSPB1 heat shock protein 27 204665 3.4 KA11 type I keratin KA11 57012432 4.2 KRT10 keratin 10 57012436 1.3 KRT13 keratin 13 51591909 4.3 KRT14 keratin complex 1, acidic, gene 14 (predicted) 56912233 4.4 KRT15 type I keratin KA15 51591903 -1.8 KRT16 type I keratin KA16 56847618 -2.0 KRT18 keratin complex 1, acidic, gene 18 60688216 -18.9 KRT19 keratin complex 1, acidic, gene 19 42409519 -12.6 KRT20 keratin 20 27465585 5.9 KRT4 type II keratin Kb4 57012360 7.6 KRT5 type II keratin 5 [Mus musculus] 16303309 5.7 KRT7 similar to keratin complex 2 (predicted) 34868200 -5.1 KRT73 type II keratin Kb36 57012358 -5.0 KRT8 cytokeratin-8 [Rattus sp.] 30352203 -10.6 LDHA lactate dehydrogenase A 8393706 3.3 LDHB lactate dehydrogenase B 6981146 -3.5 LGALS4 lectin, galactoside-binding, soluble, 4 (galectin 4) 6981152 4.3 LZIC leucine zipper and CTNNBIP1 domain containing 61557405 9.8 MDH2 malate dehydrogenase, mitochondrial 42476181 4.0 MYL9 myosin regulatory light chain, isoform C [Rattus sp.] 998522 5.0 NAGA N-acetyl galactosaminidase, alpha (predicted) 58865810 5.9 NIT1 Nit 1 protein 56268926 -2.4 NME2 RBL-NDP kinase 18kDa subunit (p18) 206580 8.0 NQO2 NAD(P)H dehydrogenase, quinone 2 51948400 2.4 PA2G4 proliferation associated 2G4, 38kDa 51948384 6.0
17 Am J Transl Res 2011;3(1):8-27

Cross-species gene-expression of bladder cancer
PDIA6 CaBP1 488838 -7.7 PDLIM1 LIM protein 8393153 3.9 PECR peroxisomal trans-2-enoyl-CoA reductase 18959236 4.3 PGRMC1 progesterone receptor membrane component 1 11120720 3.7 PKLR L-type pyruvate kinase 297533 4.2 PKM2 Unnamed protein product 56929 4.2 PPM1F protein phosphatase 1F (PP2C domain containing) 28461153 5.9 PPP1R7 Protein phosphatase 1, regulatory (inhibitor) subunit 7 57032943 -34.9 PRDX2 peroxiredoxin 2 8394432 8.0 PRELP proline arginine-rich end leucine-rich repeat protein 16758116 8.5 PRKCDBP protein kinase C, delta binding protein 19745164 -3.5 PROSC similar to Proline synthetase associated(predicted) 62662820 -6.1 PSMC4 proteasome 26S ATPase subunit 4 25742677 -3.9 PTGR1 Leukotriene B4 12-hydroxydehydrogenase 59809128 8.1 PZP alpha-1-macroglobulin 202857 -3.5 RPSA laminin receptor 1 8393693 -4.3 RUVBL1 RuvB-like protein 1 22208848 4.0 RUVBL2 RuvB-like 2 70794778 -15.7 S100A4 S100 A4 (calvasculin) 6981326 5.3 S100A6 S100 calcium binding protein A6 (calcyclin) 16758986 4.9 SAE1 Ubiquitin-like 1 (sentrin) activating enzyme E1A 50925905 -3.5 SELENBP1 selenium binding protein 2 18266692 4.0 SERPINA1 serine protease inhibitor alpha 1 51036655 2.5 SERPINH1 serpinh 1 protein 55824765 4.6 SNCG synuclein, gamma [Mus musculus] 6755592 -3.2 STRAP serine/threonine kinase receptor associated protein 4063383 -18.5 TALDO1 transaldolase 12002054 4.1 TCAG7.1260 aldoketoreductase family 1 27465603 8.8 TGM2 transglutaminase 2, C polypeptide 42476287 5.1 TKT transketolase 1729977 6.0 TPM1 tropomyosin alpha isoform 14134104 4.0 TUBA1C tubulin, alpha 6 (predicted) 58865558 -2.8 TXN thioredoxin 16758644 10.4 UBE2V2 Ubiquitin-conjugating enzyme E2 variant 2 24817674 4.3 UCHL1 ubiquitin carboxy-terminal hydrolase L1 61098212 3.4 VDAC1 voltage dependent anion channel 4105605 6.5 VIM vimentin 57480 4.1 YARS Yars predicted protein 68534287 6.0 YWHAE Tyrosine 3-monooxygenase 30583161 -3.8
18 Am J Transl Res 2011;3(1):8-27
Cross-species gene-expression of bladder cancer
Table 8. Genes exhibited concordant changes at both gene expression and protein levels
Symbol
mRNA expression arrays* Protein expression arrays†
Gene Name probe_set Fold Q-value LFDR Dataset Protein Name Gene Bank gi Fold Anxa1 annexin A1 1367614_at 12.3 3.2E-05 3.6E-05 Rat1 Lipocortin I [Rattus sp.] 235879 3.4 Anxa2 annexin A2 1367584_at 2.7 5.2E-04 7.9E-04 Rat1 Calpactin I heavy chain 312253 7.1 Car2 carbonic anhydrase II 1367733_at 3.4 1.4E-03 2.7E-03 Rat1 Ca2 protein (carbonic anhydrase) 41388872 3.4 Car2 carbonic anhydrase II 1386922_at 3.1 2.5E-03 6.4E-03 Rat1 Ca2 protein (carbonic anhydrase) 41388872 3.4 Gda guanine deaminase 1387659_at 3.1 2.0E-03 4.3E-03 Rat1 guanine deaminase 7533042 3.8
Krt14 keratin 14 1371895_at 22.5 3.0E-05 3.6E-05 Rat1 keratin complex 1, acidic, gene 14 (predicted) 56912233 4.4
Krt18 keratin 18 1388155_at -4.0 3.4E-03 7.9E-03 Rat1 keratin complex 1, acidic, gene 18 60688216 -18.9 Krt5 keratin 5 1370863_at 2.6 2.8E-03 6.6E-03 Rat1 type II keratin 5 [Mus musculus] 16303309 5.7 Ldha lactate dehydrogenase A 1367586_at 2.8 7.9E-04 1.4E-03 Rat1 lactate dehydrogenase A 8393706 3.3 Ldhb lactate dehydrogenase B 1370218_at -2.1 2.6E-03 6.6E-03 Rat1 lactate dehydrogenase B 6981146 -3.5
Lgals4 lectin, galactoside-binding, soluble, 4 1368269_at 12.7 3.5E-03 7.9E-03 Rat1 lectin, galactoside-binding, soluble, 4 (galectin 4) 6981152 4.3
Nit1 nitrilase 1 1398049_at -1.5 3.5E-03 7.9E-03 Rat1 Nit 1 protein 56268926 -2.4 S100a4 S100 calcium-binding protein A4 1367846_at 2.6 1.6E-04 2.0E-04 Rat1 S100 A4 (calvasculin) 6981326 5.3
Serpinh1 serine (or cysteine) peptidase inhibitor, clade H, member 1 1371310_s_at 4.1 3.1E-03 6.6E-03 Rat1 serpinh 1 protein 55824765 4.6
Vim vimentin 1367574_at 2.6 6.9E-03 1.8E-02 Rat1 vimentin 57480 4.1 Anxa1 annexin A1 7060990 5.7 4.3E-07 1.6E-06 Rat2 Lipocortin I [Rattus sp.] 235879 3.4 Anxa2 annexin A2 7337587 1.8 2.6E-05 1.4E-04 Rat2 Calpactin I heavy chain 312253 7.1 Banf1 barrier to autointegration factor 1 7059728 1.8 4.6E-03 1.9E-02 Rat2 barrier to autointegration factor 1 16758438 4.9 Car2 carbonic anhydrase II 7206103 3.5 5.0E-04 2.3E-03 Rat2 Ca2 protein (carbonic anhydrase) 41388872 3.4 Ka11 type I keratin KA11 7082629 11.1 1.9E-09 3.5E-09 Rat2 type I keratin KA11 57012432 4.2
Krt14 keratin 14 7082623 11.1 1.4E-09 3.4E-09 Rat2 keratin complex 1, acidic, gene 14 (predicted) 56912233 4.4
Krt18 keratin 18 7191382 -4.7 2.3E-06 9.5E-06 Rat2 keratin complex 1, acidic, gene 18 60688216 -18.9 Ldha lactate dehydrogenase A 7031732 2.6 7.0E-05 3.1E-04 Rat2 lactate dehydrogenase A 8393706 3.3 Ldhb lactate dehydrogenase B 7270937 -2.4 2.1E-07 5.3E-07 Rat2 lactate dehydrogenase B 6981146 -3.5
Lgals4 lectin, galactoside-binding, soluble, 4 7030215 16.0 1.5E-03 7.4E-03 Rat2 lectin, galactoside-binding, soluble, 4 (galectin 4) 6981152 4.3
Nme2 non-metastatic cells 2, protein (NM23B) expressed in 7081660 1.8 2.0E-03 8.7E-03 Rat2
RBL-NDP kinase 18kDa subunit (p18) 206580 8
Prosc proline synthetase co-transcribed homolog (bacterial) 7152637 -1.7 3.5E-06 1.4E-05 Rat2
similar to Proline synthetase associated(predicted) 62662820 -6.1
Serpina1
serine (or cysteine) proteinase inhibitor, clade A (alpha-1 antiproteinase, antitrypsin), member 1 7309988 5.8 9.7E-03 4.0E-02 Rat2 serine protease inhibitor alpha 1 51036655 2.5
Txn1 thioredoxin 1 7286798 1.5 1.8E-03 8.0E-03 Rat2 thioredoxin 16758644 10.4 Vdac1 voltage-dependent anion channel 1 7067512 1.9 7.2E-03 2.9E-02 Rat2 voltage dependent anion channel 4105605 6.5 * The DEGs were defined as genes with Q value < 0.01, LFDR < 0.05 and fold change > 1.5 between two groups. † Protein expression levels which showed a statistically significant (p<0.05) increase or decrease in tumors as compared with their matched normal bladder.
19 Am J Transl Res 2011;3(1):8-27
Cross-species gene-expression of bladder cancer
Table 9. Genes exhibited concordant changes at both mRNA expression and protein levels at both rat bladder cancer datasets
Gene mRNA (Rat_1) mRNA (Rat_2)
Protein
probe_set Normal Tumor Fold probe_set Normal Tumor Fold
Protein Name Fold
Anxa1 1367614_at 9.0 12.6 12.3 7060990 1106.1 6285.0 5.7
Lipocortin I [Rattus sp.] 3.4
Anxa2 1367584_at 10.9 12.3 2.7 7337587 3077.4 5579.3 1.8
Calpactin I heavy chain 7.1
Krt14 1371895_at 8.2 12.7 22.5 7082623 633.3 7004.7 11.1
keratin complex 1, acidic, gene 14 4.4
Ldha 1367586_at 9.8 11.3 2.8 7031732 641.3 1646.2 2.6
lactate dehydrogenase A 3.3
Lgals4 1368269_at 6.8 10.5 12.7 7030215 135.2 2162.5 16.0 lectin, galactoside-binding, soluble,
4 4.3
Serpinh1 1371310_s_at 7.3 9.3 4.1 7309988 33.4 194.2 5.8
serine protease inhibitor alpha 1 2.5
Krt18 1388155_at 12.3 10.3 -4.0 7191382 626.6 133.0 -4.7
keratin complex 1, acidic, gene 18 -18.9
Ldhb 1370218_at 11.4 10.4 -2.1 7270937 2438.2 1010.8 -2.4
lactate dehydrogenase B -3.5
20 Am J Transl Res 2011;3(1):8-27
Cross-species gene-expression of bladder cancer
Table 10. Molecular pathways identified by gene enrichment analysis in all five datasets
Gene sets Rat_1 Rat_2 Mouse Human_1 Human_2
Size FDR Size FDR Size FDR Size FDR Size FDR
The curated gene sets c2
ADIP_DIFF_CLUSTER4 32 0.012 24 0.000 18 0.006 32 8E-06 32 1E-04 ADIP_DIFF_CLUSTER5 33 0.039 32 3E-05 16 0.007 35 0.000 35 8E-06 BASSO_REGULATORY_HUBS 105 0.235 103 0.020 77 0.043 138 0.036 138 0.000 BENNETT_SLE_UP 20 7E-05 19 0.010 17 0.001 28 0.021 28 0.009 BRCA_ER_NEG 583 0.002 655 2E-05 494 0.000 867 0.003 867 0.001 BRCA_PROGNOSIS_NEG 62 0.001 62 0.008 41 0.001 94 4E-05 94 0.000 BRENTANI_CELL_CYCLE 65 0.182 58 6E-05 49 0.005 80 3E-04 80 0.002 CANCER_NEOPLASTIC_META_UP 53 0.088 40 0.084 37 0.028 60 0.000 60 0.000 CANCER_UNDIFFERENTIATED_META_UP 59 0.003 41 3E-05 37 0.000 67 0.000 67 0.000 CANTHARIDIN_DN 35 0.042 32 0.018 30 0.071 49 4E-04 49 0.000 CELL_CYCLE 53 0.225 51 7E-05 45 0.002 74 0.000 74 0.000 CELL_CYCLE_KEGG 58 0.222 58 4E-04 48 0.002 80 0.000 80 8E-06 CHANG_SERUM_RESPONSE_UP 108 0.241 107 0.013 92 0.013 143 0.002 143 0.000 CMV_ALL_UP 73 0.239 68 0.057 59 0.154 90 0.167 90 0.006 CMV_IE86_UP 34 0.072 38 0.003 26 0.088 49 0.000 49 0.000 CROMER_HYPOPHARYNGEAL_MET_VS_NON_DN 53 0.222 52 4E-04 42 0.003 80 0.020 80 0.000 CROONQUIST_IL6_STARVE_UP 27 0.011 24 4E-05 20 2E-04 33 0.000 33 8E-06 DER_IFNA_UP 40 0.010 44 0.074 37 0.019 65 0.042 65 0.001 DER_IFNB_UP 64 0.047 63 0.184 55 0.063 91 0.139 91 0.001 DNA_REPLICATION_REACTOME 38 0.012 29 7E-05 24 0.132 44 0.000 44 0.000 DOX_RESIST_GASTRIC_UP 25 0.043 28 1E-04 15 0.001 43 0.000 43 0.000 GAY_YY1_DN 212 0.004 193 1E-04 154 0.001 220 7E-06 220 0.051 GREENBAUM_E2A_UP 29 0.001 27 3E-05 22 2E-04 32 0.000 32 1E-05 HCC_SURVIVAL_GOOD_VS_POOR_DN 85 0.065 89 0.021 78 0.026 121 4E-04 121 0.000 HESS_HOXAANMEIS1_DN 61 0.222 46 0.006 41 0.051 55 0.093 55 0.004 HESS_HOXAANMEIS1_UP 61 0.234 46 0.005 41 0.061 55 0.087 55 0.003 HG_PROGERIA_DN 19 0.095 20 4E-04 16 0.005 25 3E-04 25 0.012 HIF1_TARGETS 31 0.030 29 0.001 31 0.003 35 0.021 35 0.005 HOFFMANN_BIVSBII_BI_TABLE2 226 0.037 150 4E-05 117 0.001 184 7E-06 184 2E-05 HOFMANN_MDS_CD34_LOW_AND_HIGH_RISK 21 0.204 30 0.018 26 0.004 46 0.042 46 0.017 HSA03050_PROTEASOME 22 0.236 20 0.007 19 0.135 22 0.002 22 0.000 HSA04110_CELL_CYCLE 82 0.210 79 3E-04 70 0.001 102 0.000 102 0.000 HSA04115_P53_SIGNALING_PATHWAY 47 0.217 43 0.002 39 0.002 62 0.020 62 3E-04 IDX_TSA_UP_CLUSTER3 78 3E-04 66 0.000 42 0.000 83 0.000 83 0.000 IFN_ALPHA_UP 26 0.100 28 0.214 24 0.027 40 0.239 40 0.020 IFNA_HCMV_6HRS_UP 33 0.001 32 0.191 25 0.002 53 0.011 53 0.030
21 Am J Transl Res 2011;3(1):8-27

Cross-species gene-expression of bladder cancer
IFNALPHA_HCC_UP 23 0.012 18 0.157 23 0.005 29 0.047 29 0.005 IFNALPHA_NL_UP 18 0.018 17 0.218 18 0.012 27 0.013 27 0.002 INOS_ALL_UP 45 0.177 40 0.036 35 0.159 52 0.005 52 0.000 KENNY_WNT_UP 34 0.046 34 0.200 29 0.025 46 0.129 46 0.005 LE_MYELIN_UP 105 0.000 63 0.000 50 0.002 82 3E-05 82 0.000 LEE_MYC_E2F1_UP 42 0.001 44 0.122 38 3E-04 55 0.015 55 0.051 LEE_TCELLS2_UP 587 0.082 669 0.005 489 0.011 939 0.037 939 0.004 LEE_TCELLS3_UP 53 0.010 63 3E-05 34 3E-04 93 0.000 93 1E-05 LEI_MYB_REGULATED_GENES 239 0.032 234 0.023 200 0.001 317 0.057 317 0.000 LI_FETAL_VS_WT_KIDNEY_DN 114 0.051 106 0.003 85 0.001 159 0.000 159 0.000 MYC_ONCOGENIC_SIGNATURE 105 0.217 123 0.096 96 0.062 173 0.021 173 0.005 MYC_TARGETS 38 0.222 34 0.001 37 0.010 39 0.104 39 0.003 OLDAGE_DN 38 0.040 33 2E-05 29 0.001 47 0.000 47 0.000 P21_ANY_DN 26 0.004 27 0.002 22 0.008 32 0.000 32 2E-04 POD1_KO_UP 256 0.166 282 0.070 210 2E-04 339 0.011 339 0.037 PRMT5_KD_UP 158 0.082 130 0.013 99 4E-04 166 0.007 166 0.000 PROTEASOME 17 0.095 15 0.021 16 0.115 17 1E-04 17 2E-05 PROTEASOME_DEGRADATION 29 0.192 20 0.019 27 0.213 31 0.015 31 9E-06 RADAEVA_IFNA_UP 33 0.004 32 0.147 37 0.001 50 0.003 50 0.001 RADIATION_SENSITIVITY 19 0.075 19 0.095 19 0.046 24 0.063 24 0.005 SANA_IFNG_ENDOTHELIAL_UP 34 0.020 43 0.004 31 0.000 60 0.161 60 0.196 SCHUMACHER_MYC_UP 43 0.081 35 0.020 31 0.023 50 0.002 50 0.000 SERUM_FIBROBLAST_CELLCYCLE 83 1E-04 90 0.000 53 0.000 110 0.000 110 0.000 SERUM_FIBROBLAST_CORE_UP 123 0.132 138 0.010 105 0.049 174 2E-04 174 0.000 SHEPARD_BMYB_MORPHOLINO_DN 128 0.023 129 0.010 99 0.009 152 4E-05 152 0.020 SHEPARD_CRASH_AND_BURN_MUT_VS_WT_DN 100 0.120 109 0.115 81 0.056 137 8E-05 137 0.011 SHEPARD_GENES_COMMON_BW_CB_MO 48 0.004 49 0.072 37 0.064 60 0.000 60 0.008 SHIPP_FL_VS_DLBCL_DN 29 0.103 27 0.190 28 0.056 34 3E-05 34 0.000 STEMCELL_EMBRYONIC_UP 1162 0.189 909 0.083 717 0.075 1165 0.050 1165 0.000 TARTE_PLASMA_BLASTIC 244 0.038 221 5E-05 198 0.001 305 0.000 305 0.000 UVB_NHEK3_ALL 316 0.084 280 0.001 279 0.004 390 0.237 390 0.000 UVB_NHEK4_6HRS_UP 21 0.157 19 0.075 19 0.043 27 0.067 27 0.001 VANTVEER_BREAST_OUTCOME_GOOD_VS_POOR_DN 51 0.001 45 0.006 37 0.002 63 4E-05 63 0.001 WIELAND_HEPATITIS_B_INDUCED 63 0.000 66 0.018 60 3E-05 106 0.001 106 0.050 YU_CMYC_UP 43 0.000 28 0.003 20 0.002 27 0.000 27 0.000 ZELLER_MYC_UP 23 0.047 19 0.014 23 0.057 23 0.030 23 0.001 ZHAN_MMPC_SIMAL 36 0.239 37 0.011 34 0.008 47 0.071 47 0.011 ZUCCHI_EPITHELIAL_UP 30 0.095 30 0.072 30 3E-04 41 0.034 41 5E-04
The curated gene sets c5
APOPTOSIS_GO 307 0.136 322 0.003 269 0.062 380 0.131 380 0.020 CELL_CYCLE_PHASE 115 0.217 121 0.002 83 0.018 145 0.000 145 0.009
22 Am J Transl Res 2011;3(1):8-27
Cross-species gene-expression of bladder cancer
CELL_CYCLE_PROCESS 133 0.209 136 0.002 94 0.025 165 0.000 165 0.001 INTERPHASE 49 0.232 43 0.056 35 0.174 58 0.011 58 0.006 M_PHASE 74 0.181 83 0.002 53 0.006 95 0.000 95 0.081 M_PHASE_OF_MITOTIC_CELL_CYCLE 54 0.178 61 9E-05 42 0.001 70 0.000 70 0.007 MITOSIS 52 0.129 60 1E-04 42 0.001 67 0.000 67 0.009 MITOTIC_CELL_CYCLE 102 0.141 110 0.002 78 0.019 128 0.000 128 3E-04 PROGRAMMED_CELL_DEATH 307 0.141 323 0.003 270 0.059 381 0.131 381 0.017 PROTEOLYSIS 121 0.178 138 0.116 117 0.003 162 0.246 162 0.078 REGULATION_OF_APOPTOSIS 245 0.161 255 0.004 213 0.050 300 0.082 300 0.029 REGULATION_OF_DNA_METABOLIC_PROCESS 33 0.134 34 0.001 20 0.217 38 0.130 38 0.115 REGULATION_OF_MITOSIS 30 0.137 28 4E-04 20 0.016 35 0.000 35 0.049 REGULATION_OF_PROGRAMMED_CELL_DEATH 245 0.172 256 0.004 214 0.046 301 0.078 301 0.023
23 Am J Transl Res 2011;3(1):8-27

Cross-species gene-expression of bladder cancer
24 Am J Transl Res 2011;3(1):8-27
malignancy [20]. TOP2A has been reported to be over-expressed in pancreatic adenocarci-noma [21], renal medullary carcinomas [22], ovarian cancer [23], acute lymphocytic leuke-mia [24], colorectal cancer [25], gastric carcinoma [26] and laryngeal squamous cell carcinoma [27]. CCNB2 (Cyclin B2), found commonly upregulated, is a member of the cyclin family, specifically the B-type cyclins. Cyclin B2 also binds to transforming growth factor beta RII and thus cyclin B2/cdc2 may play a key role in transforming growth factor beta-mediated cell cycle control [28]. These commonly regulated genes across mouse, rat and human may be functionally important regulators of bladder tumorigenesis. To integrate the expression changes observed in multiple datasets we utilized pathway analy-sis algorithms to identify functional classifica-tions that were altered in bladder tumors com-
pared to normal bladder epithelium of mouse, rat and human. Biological processes and mo-lecular functions that were enriched in tumors included apoptosis, cell cycle, and DNA replica-tion. In particular, TOP2A was consistently acti-vated in the biological classification of regula-tion of programmed cell death. Several genes including CCNB2, KIF20A and TOP2A have pre-viously been reported to be up-regulated in bladder carcinogenesis [29]. CCNB2 was also found to be up-regulated in the cell cycle. Addi-tional pathways enriched in bladder tumors in-cluded those for interphase and proteolysis. Our data suggest that human bladder cancer and carcinogen-induced rodent models may show more common similarity at global cellular path-way levels than at the single-gene levels previ-ously described. The proportion of dysregulated orthologous genes overlapped in two species is low which
Figure 2. Cell cycle genes consistently altered across species during bladder carcinogenesis. Red and blue indicates overexpressed and underexpressed genes in tumor samples, respectively. 1, dataset Rat_1; 2, Rat_2; 3, Mouse; 4, Human_1; and 5, Human_2.

Cross-species gene-expression of bladder cancer
25 Am J Transl Res 2011;3(1):8-27
may be partly explained by the histological dif-ference in bladder cancer among mouse, rat and human. Histopathology of B6D2F1 mouse bladder cancers have previously shown that these urinary bladder carcinomas had either transitional cell differentiation alone or in com-bination with either squamous or glandular dif-ferentiation or both squamous and glandular differentiation [2]. These patterns were also observed in highly invasive variants of human transitional cell bladder carcinoma [30]. Immu-nohistochemical staining of intermediate fila-ment types showed that OH-BBN-induced rat
bladder tumors had marked quantitative and qualitative differences from the most common, purely transitional, human bladder carcinomas [31]. Smaller lesions were similar to human urothelial dysplasia both histologically and im-munohistochemically. Progression of the lesions demonstrated large exophytic papillomas with extensive endophytic epithelial growth into abundant stroma and these lesions showed increasing predominance of squamous over transitional elements. Immunohistochemical findings confirmed these results and also dem-onstrated that morphologically indistinct cells,
Figure 3. Network analyses of apoptosis, programmed cell death and cell death. Multiple genes in this network are dysregulated in bladder tumors. Red and blue indicates overexpressed and underexpressed genes in tumor samples, respectively.

Cross-species gene-expression of bladder cancer
26 Am J Transl Res 2011;3(1):8-27
even in early lesions, express heavier cy-tokeratins characteristic of keratinizing squamous epithelium [30, 31]. The proportion of invasive transitional cell carcinomas in hu-man bladder cancer biopsies from Sanchez-Carbayo et al. (81/108) is much higher than that from Dyrskjøt et al. (13/41) [10] and this may explain why there was more gene expres-sion overlap between the rodent models and human bladder cancer from Sanchez-Carbayo et al. than those from Dyrskjøt et al. (4.1-4.8% vs. 2.6-4.0%). These data also suggest that histol-ogy information should be taken into account when analyzing animal models of bladder can-cer. Acknowledgments The authors thank Alan Davis, Petra Erdmann-Gilmore and Julia Gross for expert technical assistance. This work was supported, in part, by NCI Contract Number HHSN-261200433008C (N01-CN43308) and the National Centers of Research Resources of the National Institutes of Health (P41-RR00954). Please address correspondence to: Ming You, MD, PhD, Department of Pharmacology and Toxicology and the Cancer Center, Medical college of Wisconsin, Milwaukee, WI 53226, USA. Tel: 414-955-2565 Fax: 414-955-6058, E-mail: [email protected] References [1] Jemal A, Siegel R, Ward E, Hao Y, Xu J and Thun
MJ. Cancer Statistics, 2009. CA Cancer J Clin 2009; caac.20006.
[2] Becci PJ, Thompson HJ, Strum JM, Brown CC, Sporn MB and Moon RC. N-Butyl-N-(4-Hydroxybutyl)nitrosamine-induced Urinary Blad-der Cancer in C57BL/6 x DBA/2 F1 Mice as a Useful Model for Study of Chemoprevention of Cancer with Retinoids. Cancer Res 1981; 41: 927-932.
[3] Grubbs CJ, Lubet RA, Koki AT, Leahy KM, Masfer-rer JL, Steele VE, Kelloff GJ, Hill DL and Seibert K. Celecoxib Inhibits N-Butyl-N-(4-hydroxybutyl)-nitrosamine-induced Urinary Bladder Cancers in Male B6D2F1 Mice and Female Fischer-344 Rats. Cancer Res 2000; 60: 5599-5602.
[4] Grubbs CJ, Moon RC, Squire RA, Farrow GM, Stinson SF, Goodman DG, Brown CC and Sporn MB. 13-cis-Retinoic acid: inhibition of bladder carcinogenesis induced in rats by N-butyl-N-(4-hydroxybutyl)nitrosamine. Science 1977; 198: 743-744.
[5] McCormick DL, Ronan SS, Becci PJ and Moon RC. Influence of total dose and dose schedule on induction of urinary bladder cancer in the
mouse by N-butyl-N-(4-hydroxy-butyl)nitrosamine. Carcinogenesis 1981; 2: 251-254.
[6] Moon RC, Kelloff GJ, Detrisac CJ, Steele VE, Tho-mas CF and Sigman CC. Chemoprevention of OH-BBN-induced bladder cancer in mice by piroxi-cam. Carcinogenesis 1993; 14: 1487-1489.
[7] Irizarry RA, Bolstad BM, Collin F, Cope LM, Hobbs B and Speed TP. Summaries of Affymetrix Ge-neChip probe level data. Nucleic Acids Res 2003; 31: e15.
[8] Bredemeyer AJ, Lewis RM, Malone JP, Davis AE, Gross J, Townsend RR and Ley TJ. A proteomic approach for the discovery of protease sub-strates. Proc Natl Acad Sci U S A 2004; 101: 11785-11790.
[9] King JB, Gross J, Lovly CM, Rohrs H, Piwnica-Worms H and Townsend RR. Accurate mass-driven analysis for the characterization of protein phosphorylation. Study of the human Chk2 pro-tein kinase. Anal Chem 2006; 78: 2171-2181.
[10] Dyrskjot L, Kruhoffer M, Thykjaer T, Marcussen N, Jensen JL, Moller K and Orntoft TF. Gene ex-pression in the urinary bladder: a common carci-noma in situ gene expression signature exists disregarding histopathological classification. Cancer Res 2004; 64: 4040-4048.
[11] Sanchez-Carbayo M, Socci ND, Lozano J, Saint F and Cordon-Cardo C. Defining molecular profiles of poor outcome in patients with invasive blad-der cancer using oligonucleotide microarrays. J Clin Oncol 2006; 24: 778-789.
[12] Strimmer K. A unified approach to false discov-ery rate estimation. BMC Bioinformatics 2008; 9: 303.
[13] Mootha VK, Lindgren CM, Eriksson KF, Subrama-nian A, Sihag S, Lehar J, Puigserver P, Carlsson E, Ridderstrale M, Laurila E, Houstis N, Daly MJ, Patterson N, Mesirov JP, Golub TR, Tamayo P, Spiegelman B, Lander ES, Hirschhorn JN, Alt-shuler D and Groop LC. PGC-1alpha-responsive genes involved in oxidative phosphorylation are coordinately downregulated in human diabetes. Nat Genet 2003; 34: 267-273.
[14] Subramanian A, Tamayo P, Mootha VK, Mukher-jee S, Ebert BL, Gillette MA, Paulovich A, Pomeroy SL, Golub TR, Lander ES and Mesirov JP. Gene set enrichment analysis: a knowledge-based approach for interpreting genome-wide expression profiles. Proc Natl Acad Sci U S A 2005; 102: 15545-15550.
[15] Elledge SJ, Zhou Z and Allen JB. Ribonucleotide reductase: regulation, regulation, regulation. Trends Biochem Sci 1992; 17: 119-123.
[16] Torrents E, Aloy P, Gibert I and Rodriguez-Trelles F. Ribonucleotide reductases: divergent evolu-tion of an ancient enzyme. J Mol Evol 2002; 55: 138-152.
[17] Herrick J and Sclavi B. Ribonucleotide reductase and the regulation of DNA replication: an old story and an ancient heritage. Mol Microbiol 2007; 63: 22-34.
[18] Zhang K, Hu S, Wu J, Chen L, Lu J, Wang X, Liu X,
Cross-species gene-expression of bladder cancer
27 Am J Transl Res 2011;3(1):8-27
Zhou B and Yen Y. Overexpression of RRM2 de-creases thrombspondin-1 and increases VEGF production in human cancer cells in vitro and in vivo: implication of RRM2 in angiogenesis. Mol Cancer 2009; 8: 11.
[19] Luo K, Yuan J, Chen J and Lou Z. Topoisomerase IIalpha controls the decatenation checkpoint. Nat Cell Biol 2009; 11: 204-210.
[20] Wong N, Yeo W, Wong WL, Wong NL, Chan KY, Mo FK, Koh J, Chan SL, Chan AT, Lai PB, Ching AK, Tong JH, Ng HK, Johnson PJ and To KF. TOP2A overexpression in hepatocellular carci-noma correlates with early age onset, shorter patients survival and chemoresistance. Int J Cancer 2009; 124: 644-652.
[21] Baiocchi GL, Villanacci V, Rossi E, Gheza F, Por-tolani N and Giulini SM. HER-2/neu and topoi-somerase-II-alpha expression and genic amplifi-cation in pancreatic adenocarcinoma. Dig Dis Sci 2009; 54: 2049-2051.
[22] Albadine R, Wang W, Brownlee NA, Toubaji A, Billis A, Argani P, Epstein JI, Garvin AJ, Cousi R, Schaeffer EM, Pavlovich C and Netto GJ. Topoi-somerase II alpha status in renal medullary car-cinoma: immuno-expression and gene copy al-terations of a potential target of therapy. J Urol 2009; 182: 735-740.
[23] Faggad A, Darb-Esfahani S, Wirtz R, Sinn B, Se-houli J, Konsgen D, Lage H, Weichert W, Noske A, Budczies J, Muller BM, Buckendahl AC, Roske A, Eldin Elwali N, Dietel M and Denkert C. Topoi-somerase IIalpha mRNA and protein expression in ovarian carcinoma: correlation with clinicopa-thological factors and prognosis. Mod Pathol 2009; 22: 579-588.
[24] Wang YH, Takanashi M, Tsuji K, Tanaka N, Shiseki M, Mori N and Motoji T. Level of DNA topoisomerase IIalpha mRNA predicts the treat-ment response of relapsed acute leukemic pa-tients. Leuk Res 2009; 33: 902-907.
[25] Coss A, Tosetto M, Fox EJ, Sapetto-Rebow B,
Gorman S, Kennedy BN, Lloyd AT, Hyland JM, O'Donoghue DP, Sheahan K, Leahy DT, Mulcahy HE and O'Sullivan JN. Increased topoisomerase IIalpha expression in colorectal cancer is associ-ated with advanced disease and chemothera-peutic resistance via inhibition of apoptosis. Cancer Lett 2009; 276: 228-238.
[26] Liang Z, Zeng X, Gao J, Wu S, Wang P, Shi X, Zhang J and Liu T. Analysis of EGFR, HER2, and TOP2A gene status and chromosomal polysomy in gastric adenocarcinoma from Chinese pa-tients. BMC Cancer 2008; 8: 363.
[27] Shvero J, Koren R, Shvili I, Yaniv E, Sadov R and Hadar T. Expression of human DNA Topoisom-erase II-alpha in squamous cell carcinoma of the larynx and its correlation with clinicopathologic variables. Am J Clin Pathol 2008; 130: 934-939.
[28] Bellanger S, de Gramont A and Sobczak-Thepot J. Cyclin B2 suppresses mitotic failure and DNA re-replication in human somatic cells knocked down for both cyclins B1 and B2. Oncogene 2007; 26: 7175-7184.
[29] Yu D, Cozma D, Park A and Thomas-Tikhonenko A. Functional validation of genes implicated in lymphomagenesis: an in vivo selection assay using a Myc-induced B-cell tumor. Ann N Y Acad Sci 2005; 1059: 145-159.
[30] Koss LG. Tumors of the urinary bladder. In: Firm-inger HI, editors. Atlas of Tumor Pathology. Washington, DC: Armed Forces Institute of Pa-thology; 1975. p.
[31] Herman CJ, Vegt PD, Debruyne FM, Vooijs GP and Ramaekers FC. Squamous and transitional elements in rat bladder carcinomas induced by N-butyl-N-4-hydroxybutyl-nitrosamine (BBN). A study of cytokeratin expression. Am J Pathol 1985; 120: 419-426.
Related Documents