1 Cross-Generational Vowel Differences in the Spontaneous Speech of Central Ohio Speakers A Senior Honor Thesis Presented in Partial Fulfillment of the Requirements for Graduation with Honors Research Distinction in Speech and Hearing Science in the undergraduate colleges of The Ohio State University by: Katarzyna Lozanska The Ohio State University May 2012 Research Advisor: Robert A. Fox, Ph.D, Department of Speech and Hearing Science

Welcome message from author
This document is posted to help you gain knowledge. Please leave a comment to let me know what you think about it! Share it to your friends and learn new things together.
Transcript

1
Cross-Generational Vowel
Differences in the
Spontaneous Speech of
Central Ohio Speakers
A Senior Honor Thesis
Presented in Partial Fulfillment of the Requirements for
Graduation with Honors Research Distinction in Speech and
Hearing Science in the undergraduate colleges of The Ohio
State University
by:
Katarzyna Lozanska
The Ohio State University May 2012
Research Advisor: Robert A. Fox, Ph.D, Department of Speech and Hearing Science

2
Acknowledgments
I would like to thank Dr. Robert A. Fox and Dr. Ewa Jacewicz for their continuous guidance
and support throughout this research project. Thank you Dr. Fox, Dr. Jacewicz, and Dr. Grinstead
for serving on my defense team. Thank you to my family for their encouragement and support
throughout this process. Finally, I would like to thank my trusted lab partner Caroline Chang, who
spent many hours in the lab working with me and who made this project a joy to work on.
This project was supported by The Ohio State University College of the Arts and Sciences,
the College of Social and Behavioral Sciences, and the Speech Perception & Acoustics
Laboratories.

3
Table of Contents
Abstract ............................................................................................................................................... 4
List of Tables ...................................................................................................................................... 5
List of Figures ..................................................................................................................................... 6
Chapter 1: Introduction ....................................................................................................................... 7
1.1 Major regional dialects of American English ........................................................................... 8
1.2.The Northern Cities Shift ....................................................................................................... 10
1.3. Vowel characteristics in Central Ohio ................................................................................... 12
1.4 Aims of the present study ....................................................................................................... 14
Chapter 2: Methodology ................................................................................................................... 16
2.1 Participants ............................................................................................................................. 16
2.2 Stimuli .................................................................................................................................... 17
2.3 Data Collection/Recording ..................................................................................................... 18
2.4 Data Analysis .......................................................................................................................... 19
Chapter 3: Results ............................................................................................................................. 28
3.1 Vowel Duration Analysis ....................................................................................................... 28
3.2 Frequency Analysis ................................................................................................................ 30
Chapter 4: Discussion / Conclusion.................................................................................................. 38
References ........................................................................................................................................ 40
Appendix A: Participant Information ............................................................................................... 42
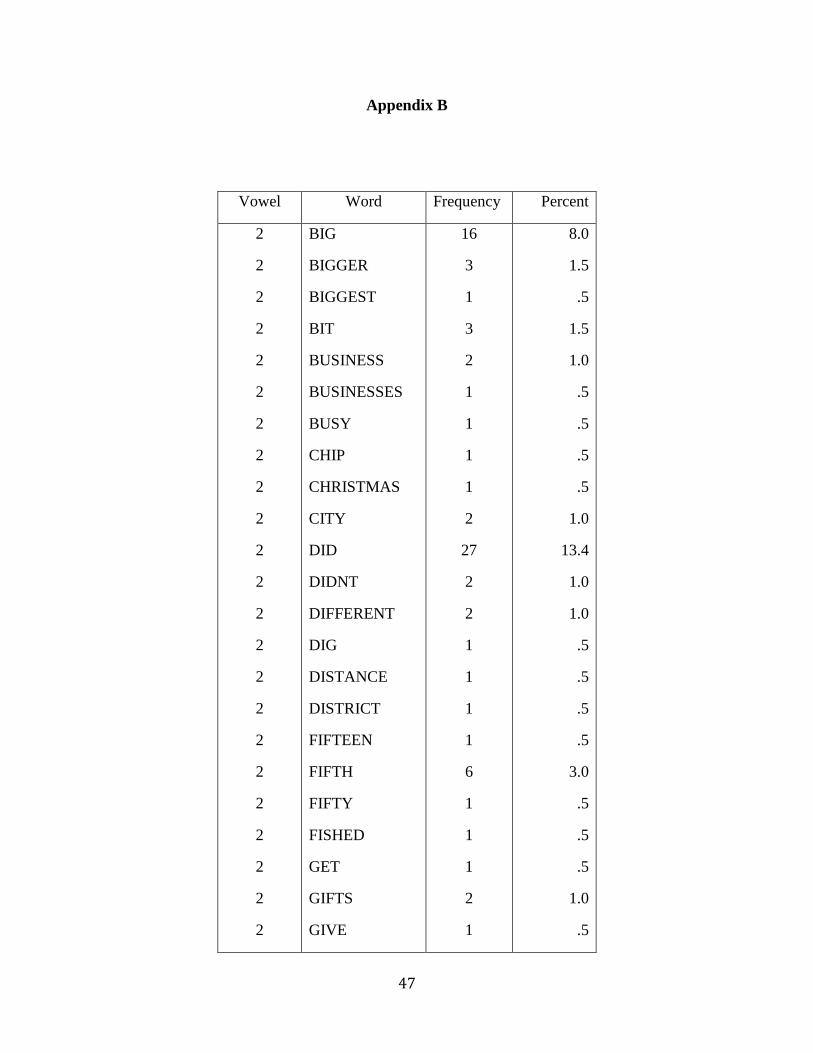
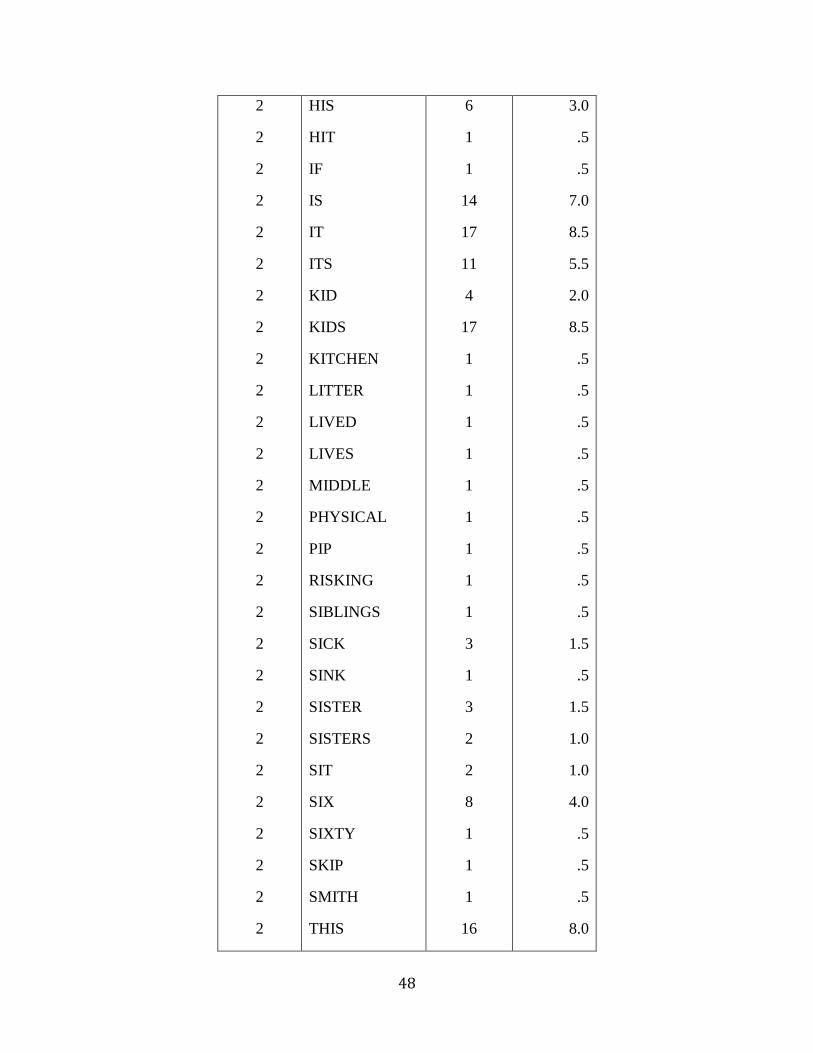
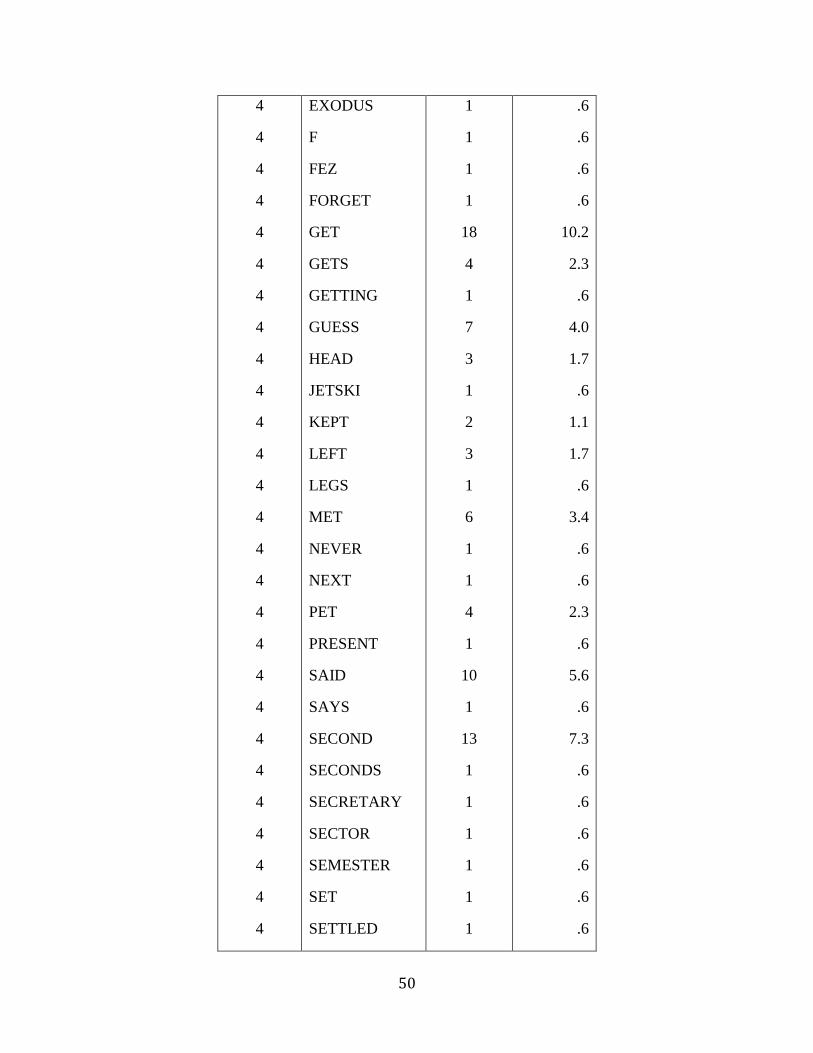
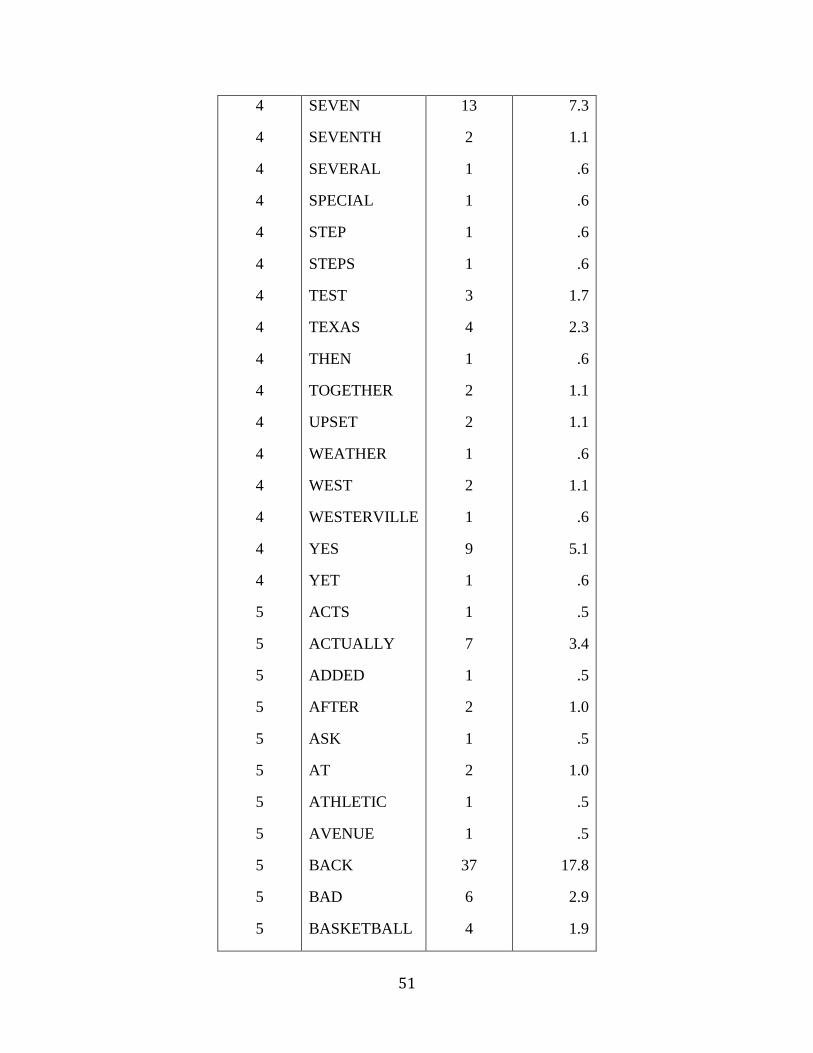
Appendix B: Vowel frequency Information ..................................................................................... 47

4
Abstract
The Northern Cities Shift is a vowel chain shift (a type of sound change) that occurs in the
Northern dialect region, including Northern Ohio. Consensus in the research literature is that the
Northern Cities Shift is not operative in central Ohio but data that support this position are
relatively old. Recent findings have suggested that speakers in the Central Ohio region do
participate in a chain shift. However, the data supporting this view are based on recordings from
read speech obtained under careful laboratory conditions. Spontaneous speech samples have not as
yet been analyzed. The purpose of this study is to determine whether or not elements of the
Northern Cities shift have spread to the spontaneous speech of Central Ohio speakers as seen in
changes the positions of vowels in the acoustic vowel space across age groups. A pattern of vowel
position changes would indicate a chain shift in progress. Previously collected recordings of
spontaneous speech samples were transcribed and analyzed acoustically. Stressed words that
contained one of the six vowels in the Northern Cities Shift were selected for analysis. The speech
analysis programs Adobe Audition and TF32 were used to analyze each word token. Acoustic
measurements made included word and vowel duration and the frequencies of the first three
formants at three points in time (to allow an examination of spectral change). Statistical analysis of
these data is still undergoing but is close to completion. Preliminary results indicate that the
Northern Cities Shift is not operative in Central Ohio. However, there are more recent changes to
these vowels which were found in the children’s spontaneous speech which are in agreement
results from read speech. Preliminary results imply that dialect boundaries are strong and dialect
features do not spread freely as a function of population mobility or incidental interpersonal
contacts.

5
List of Tables
Table 1. Participant Data. ............................................................................................................... 17

6
List of Figures
Figure 1. The major dialects of American English ..................................................................................... 8
Figure 2. The six stages of the Northern Cities Shift ............................................................................... 11
Figure 3. Canadian Vowel Shift................................................................................................................ 13
Figure 4. Example of the word “back” with vowel onset and offset shown ............................................. 20
Figure 5. Example of the word “bad” with vowel onset and offset shown .............................................. 21
Figure 6. Example of the word “cats” with vowel onset and offset shown .............................................. 22
Figure 7. Example of the word “have” with vowel onset and offset shown ............................................. 23
Figure 8. Talks Locations check ............................................................................................................... 25
Figure 9. Formant analysis using Matlab program ................................................................................... 26
Figure 10. Check of formant frequencies at five points ............................................................................ 27
Figure 11. Vowel Duration by dialect by category ................................................................................... 28
Figure 12. Midpoints and standard error of OH Female speakers ............................................................ 30
Figure 13. Midpoints and standard error of WI female speakers ............................................................. 32
Figure 14. Midpoints and standard error of OH male speakers ................................................................ 34
Figure 15. Midpoints and standard error of WI male speakers................................................................. 36
7
Chapter 1: Introduction
American English can be divided into several regional dialects that differ considerably in their
pronunciation patterns. It is therefore important in speech and hearing science to know whether a
person’s speech is a characteristic of a certain dialect and/or whether the person has a speech or
language disorder. In order to determine whether or not a person’s speech is specific to a certain dialect,
we can examine closely vowel production.
This study specifically concentrates on vowel production because vowels are considered the most
salient variables that differentiate dialects (Labov, Ash, and Boberg, 2006). There are six main dialect
regions in the United States, each with their own pattern of vowel production. Vowel characteristics
vary not only from dialect to dialect but they also change over time within a specific dialect variety. For
instance, speakers from two different generations who live in the same dialect region can pronounce
differently a subset of vowels and these variations are far from random. Rather, they are systematic and
have been identified in the fields of dialectology, sociolinguistics and historical phonology as vowel
shifts and vowel mergers. A vowel chain shift can occur as either a pull chain or a push chain. A push
chain occurs when one sound in the vowel space moves into the position of another sound and the
second sound must then move to make room for the first. A pull chain occurs when one sound moves
and creates an empty space that forces a second sound to move to fill the empty space. A vowel merger
occurs when two sounds merge into a single sound so that contrast between two words is lost such as in
Don and Dawn, a merger of /ɑ/ and /ɔ/.
The pronunciation of vowels can shift over time (a well-known form of sound change) in a language
or dialect. These are common among languages with many vowels, especially in Germanic Languages.
For example, the English language has experienced three main periods, Old English, Middle English,
8
and Modern English. There was very slight change in long vowels between the Old English and Middle
English periods. By the Modern English period, however, there was a shift of all of the long vowels.
This shift is known as the Great Vowel Shift. Some examples of this shift include the raising and
fronting of the Middle English vowels /ā/ (as in name) and /ē/ (as in sweet) into /e/ and /i/, respectively.
By looking at the history of sound change in Germanic languages, one can see that vowel shifts and
mergers are to be expected over time.
1.1 Major regional dialects of American English
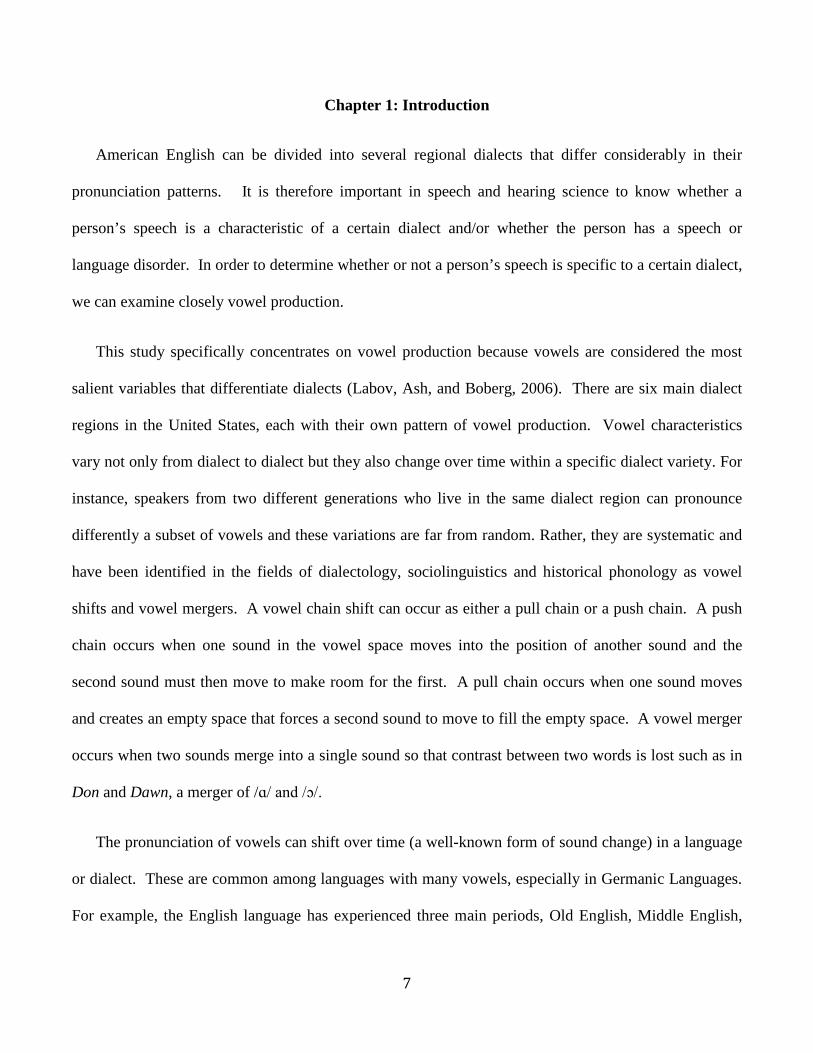
There are six main dialect regions in the United States. These regions include the North, the
South, New England, Mid Atlantic, Midland, and the West.
The Northern dialect region includes the states around the Great Lakes, specifically in the cities
in Northern Ohio, Northern Illinois, Eastern Michigan and Wisconsin. The Southern dialect region
Figure 1. The major dialects of American English Source: Clopper, Pisoni, & Jong, 2005, p. 2
9
includes 16 states in the South Eastern and Southern parts of the United States. These states include
New Mexico, Texas, Oklahoma, Missouri, Arkansas, Louisiana, Mississippi, Tennessee, Alabama,
Kentucky, Georgia, Florida, North Carolina, South Carolina, Virginia, and West Virginia. The Western
dialect region includes states west of Wyoming, Colorado, and New Mexico. The Midland dialect
region includes states between the northern and southern dialect regions. The New England dialect
region includes the states in the North East part of the United States, specifically Maine, Vermont, New
Hampshire, Massachusetts, Connecticut, and Rhode Island. The Mid Atlantic dialect region includes
Maryland, New Jersey, and Delaware.
Two of the six dialect regions, the North and the South, are undergoing chains shifts. Chain
shifts involve a series of coordinated vowel rotations in the acoustic space so that vowels rotate their
positions like in a chain. The other four dialect regions, i.e., New England, Mid Atlantic, Midland, and
the West do not undergo chain shifts but do show evidence of other vowel changes such as mergers. The
Northern Cities Shift (to be described in more detail below) is a widespread chain shift in the North. It
is described as the clockwise rotation of the six vowels /ɪ, ɛ, æ, ɑ, ʌ, ɔ/, such as in bit, bet, cat, cot, but,
and caught (Clopper, Pisoni, & de Jong, 2005). The second major chain shift, the Southern Shift, takes
place in the South. This vowel shift is different from the Northern Cities Shift. In this vowel shift the
/u/ and /o/ vowels are fronted. The front, lax vowels /ɪ/ and /ɛ/ are raised and fronted and the /i/ and /e/
vowels are lowered and backed. These “reversed” positions in the vowel space are termed ɪ/i and ɛ/e
reversals. Southern speakers are also known to have longer lax vowels, which reduces the distinction
between tense and lax vowels for Southern speakers (Clopper et al., 2005).
Other vowel changes in American English include a merger or partial merger of the /ɑ/ and /ɔ/
vowels, termed the Low Back Merger. This merger can be found in New England, Midland and in the
West and is currently the most rapidly spreading vowel change in American English (Majors, 2005;

10
Irons, 2007). The Mid Atlantic dialect region shows no merger, the /ɔ/ is raised, making it distinct in
terms of vowel position from /ɑ/ (Clopper et al., 2005). Many studies have been conducted on vowel
shifts and mergers to better understand their underlying mechanisms and sources (Labov, 1994). The
present thesis focuses on vowel production across generations of central Ohio speakers and examines
whether vowel characteristics change over time and whether these changes may represent a systematic
shift such as the Northern Cities Shift occurring in the northern part of Ohio in the Cleveland area.
1.2. The Northern Cities Shift
This study examines the six lax vowels that are involved in the Northern Cities Shift: /ɪ, ɛ, æ, ɑ,
ʌ, ɔ/. Since the Northern Cities Shift is common among the speakers in northern Ohio around
Cleveland, this research will determine whether or not its traces can be found in Central Ohio around
Columbus, which is within a short distance (about three-hour drive) from the north.
The Northern Cities Shift is discussed in depth in the Atlas of North American English (Labov et
al., 2006). The first stage of the shift, the raising and tensing of the /æ/ vowel, was first observed in
1969 (Labov et al., 2006; Fasold, 1969). Fasold’s discovery of the raising and tensing of /æ/ sparked the
interest of the linguistic community which continued searching for evidence of vowel shifts. In 1972,
the Northern Cities Shift was initially identified as the rotation of five vowels (Labov, Yaeger, &
Steiner, 1972). Another stage, the backing of the /ʌ/ vowel, was observed later by Eckert (1986) and
further discussed in Eckert (2000). Today the Northern Cities Shift is described as the rotation of the six
vowels /ɪ, ɛ, æ, ɑ, ʌ, ɔ/, as shown schematically in Figure 1.

11
As previously mentioned, the first stage of the Northern Cities Shift is the raising and fronting of
/æ/. This movement of /æ/ creates an empty space to be filled by the /ɑ/ vowel which must undergo
fronting. This fronting of the /ɑ/ vowel is identified as stage two. The third stage is the lowering and
fronting of /ɔ/ which now moves into the position of /ɑ/. The fourth stage is the lowering and backing of
/ɛ/ which now approximates the position of /ʌ/. The fifth stage is the backing of the /ʌ/ vowel. The
rotation of the Northern Cities Shift ends with the backing of the /ɪ/ vowel (Labov et al., 2006). In this
chain shift, with each positional vowel change another vowel is forced to move to take the space of the
previous vowel.
Vowel changes resulting from the Northern Cities Shift are not equally distributed across the
Northern region. In fact, not all cities in the North are affected by the Northern Cities Shift. There are
concentrations of features of the chain shift in urban areas and the Northern Cities Shift is identified
especially in large cities like Rochester, Syracuse, Buffalo, Cleveland, Detroit, Chicago, Kenosha, and
Figure 2. The six stages of the Northern Cities Shift. Source: Labov et al., 2006, p 121

12
Milwaukee. Smaller cities may not be as involved in the complete cycle of vowel rotations and may
only show particular stages of the Northern Cities Shift.
1.3. Vowel characteristics in Central Ohio
While speakers in Northern areas of Ohio have been known to participate in the Northern Cities
Shift, Central Ohio speakers have not been known to participate in any chain shift (Labov et al., 2006;
Thomas, 1989). However, recent findings by Jacewicz, Fox, & Salmons (2011) have suggested that
speakers in the Central Ohio region do in fact participate in a chain shift. The chain shift that may be
possible in Central Ohio is described as being similar to the Canadian Shift, as well as showing elements
of the low back merger (Jacewicz et al., 2011).

13
The Canadian Shift was first reported by Clarke et al., (1995) as a vowel rotation found in
Ontario, Canada. In this shift, there is a lowering of /i/ and /e/. However, unlike in the Northern Cities
Shift, there is no retraction of /ɛ /, the /ʌ/ vowel lowers and becomes more centralized, the /æ/ vowel
retracts and lowers instead of being raised, and there is evidence of the Low Back Merger (Clarke et al.,
1995). Recent evidence suggests that the shift is a parallel vowel shift of the three vowels /ɪ, ɛ, æ/
(Boberg, 2005).
Figure 3. Canadian Vowel Shift. Source: Clarke et al., 1995, p. 42

14
1.4 Aims of the present study
This study examines the possibility of the occurrence of the Northern Cities Shift in the
spontaneous speech of Central Ohio speakers. The majority of other studies have used read speech,
rather than spontaneous talks, so this represents an innovation in addressing this question. Three
questions will be addressed.
1. Have elements of the Northern Cities Shift spread from the Cleveland area to the Columbus
area?
2. Are there differences in vowel positions across age groups reflecting a cross-generational
sound change?
3. How do the vowels of Central Ohio speakers compare to the vowels of Wisconsin speakers,
who are assumed to participate in the Northern Cities Shift (Labov et al., 2006)?
Of interest is to determine if the Northern Cities Shift has spread from the Cleveland area to the
Columbus area because areas of Northern Ohio have been known to participate in the Northern Cities
Shift. With Cleveland being relatively close to Columbus, one would anticipate the speech of Northern
Ohio, Cleveland, speakers to affect the speech of Central Ohio, Columbus, speakers. Data from Labov
et al., (2006) indicate a strong dialect boundary between the North and the Midland that divides Ohio
into two dialect regions. However, this data come from adult speakers representing an older generation,
who interviewed between 1991 and 1993, thus about twenty years ago. The speech sample used here
includes adults as well as children who represent the most recent speech patterns in Central Ohio. It
might be the case that the elements of the Northern Cities Shift have spread to only this youngest
population.
15
Since it is important to compare speech across several generations of speakers because many
changes in word and vowel production can occur in cross-generational vowel transmission, this study
includes three generations of speakers, old adults, young adults, and children. As previously mentioned,
including children as a part of the speech sample will allow us to see the most recent changes in vowel
production of Central Ohio speakers.
The vowel productions of Central Ohio speakers will be compared to the vowel productions of
Wisconsin speakers because the Wisconsin region has been known to participate in the Northern Cities
Shift. That is, while the Central Ohio speech is the main focus of this study, the comparison of the
positions in the acoustics space of the six vowels involved in the Northern Cities Shift within these two
dialect regions will allow detection of any differences between the two vowel systems that occur over
generations.
The present study will examine the positional vowel changes in spontaneous speech.
Spontaneous speech was used by Labov et al., (2006) in their data collection for the Atlas. However, this
was a telephone survey and the quality of some recordings may have been compromised. The data in
Jacewicz et al., (2011), both for the Central Ohio and Southeastern Wisconsin dialects, come from read
speech obtained in careful laboratory conditions but spontaneous speech samples have not been
analyzed. The present study will therefore examine whether the elements of the chain shift reported in
Jacewicz et al., (2011) for Central Ohio also occur in the spontaneous speech or whether Central Ohio
shows traces of the Northern Cities Shift which can be found in spontaneous speech and not in read
speech.

16
Chapter 2: Methodology
2.1 Participants
The spontaneous speech talks used in this study were previously collected in the years 2006-
2008 as a part of a larger project. Speech samples from 107 participants were selected for the present
study. 53 of the participants were from Ohio and 54 were from Wisconsin. The selection criteria for
subject recruitments included being born, raised and spending most of their lives in either Central Ohio
(Columbus and suburbs) or Southeastern Wisconsin (Madison and suburbs), the areas of interest to the
study. The regional dialect of each participant was verified by the research assistant who collected the
data. The participants used in this study were not known to have any speech disorders.
The speakers were spilt into three age groups: old adults who are called here Grandparents (GP),
young adults called here Parents (P), and children (C), although no actual biological relationship is
expected. Collecting data from speakers representing these three generations allows for measurement of
cross-generational changes in vowel production. The Ohio participants consisted of 15 old adults, 19
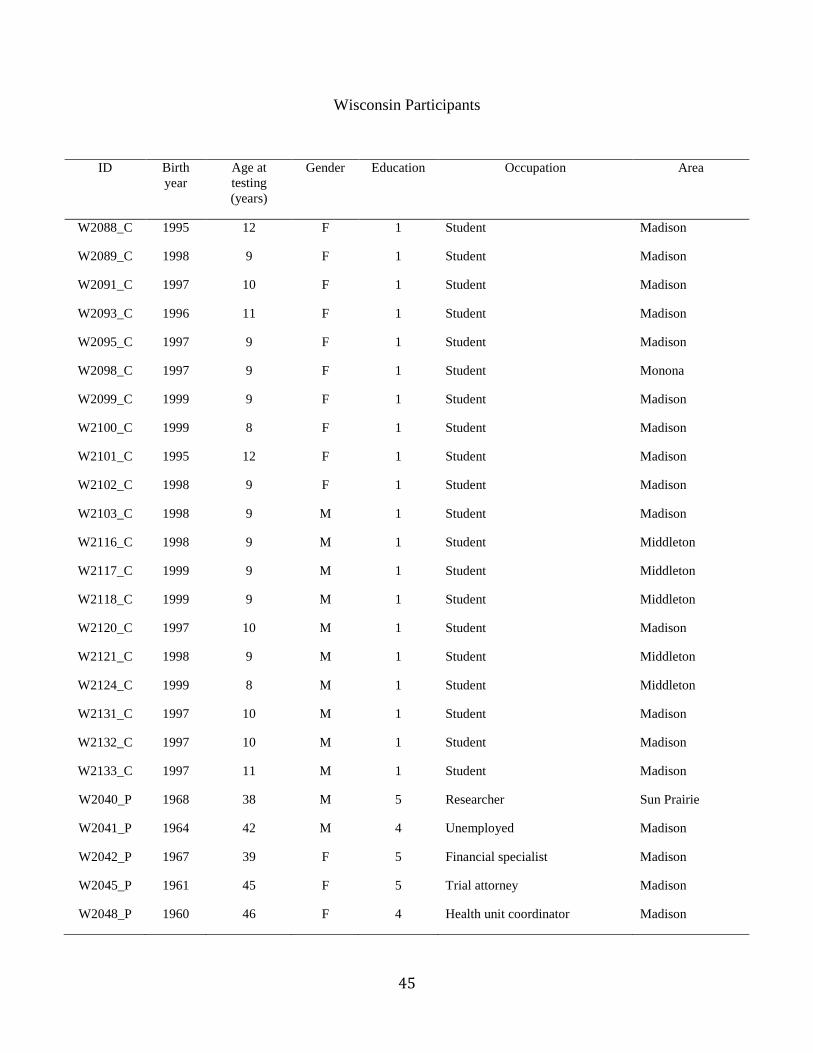
young adults, and 19 children split by gender as shown in Table 1. The Wisconsin participants consisted
of 16 old adults, 18 young adults, and 20 children, and their gender is shown in Table 1. The participants
for the two dialect groups were of comparable ages.
The age range for data collection for old adults was 68-90, for young adults 35-50, and for
children 8-16. The means for each age group were 74.6, 42.0, and 10.2, respectively. Table 1 shows
information for number of participants in each age and gender group as well as mean age of the
participants. More details about each participant in terms of age, occupation and area of residence can be
found in Appendix I.
17
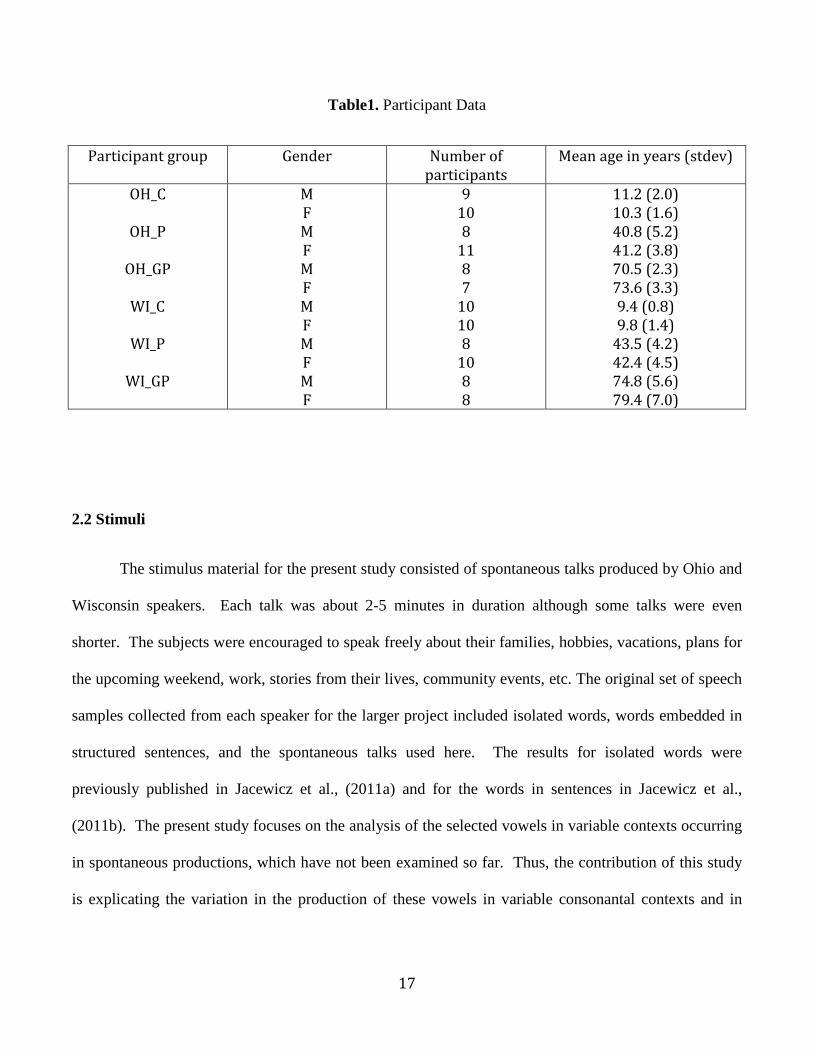
Table1. Participant Data
Participant group Gender Number of participants
Mean age in years (stdev)
OH_C
OH_P
OH_GP
WI_C
WI_P
WI_GP
M F M F M F M F M F M F
9 10 8
11 8 7
10 10 8
10 8 8
11.2 (2.0) 10.3 (1.6) 40.8 (5.2) 41.2 (3.8) 70.5 (2.3) 73.6 (3.3) 9.4 (0.8) 9.8 (1.4)
43.5 (4.2) 42.4 (4.5) 74.8 (5.6) 79.4 (7.0)
2.2 Stimuli
The stimulus material for the present study consisted of spontaneous talks produced by Ohio and
Wisconsin speakers. Each talk was about 2-5 minutes in duration although some talks were even
shorter. The subjects were encouraged to speak freely about their families, hobbies, vacations, plans for
the upcoming weekend, work, stories from their lives, community events, etc. The original set of speech
samples collected from each speaker for the larger project included isolated words, words embedded in
structured sentences, and the spontaneous talks used here. The results for isolated words were
previously published in Jacewicz et al., (2011a) and for the words in sentences in Jacewicz et al.,
(2011b). The present study focuses on the analysis of the selected vowels in variable contexts occurring
in spontaneous productions, which have not been examined so far. Thus, the contribution of this study
is explicating the variation in the production of these vowels in variable consonantal contexts and in
18
monosyllabic and polysyllabic words. Only words in stressed positions in utterances were selected for
the present analysis.
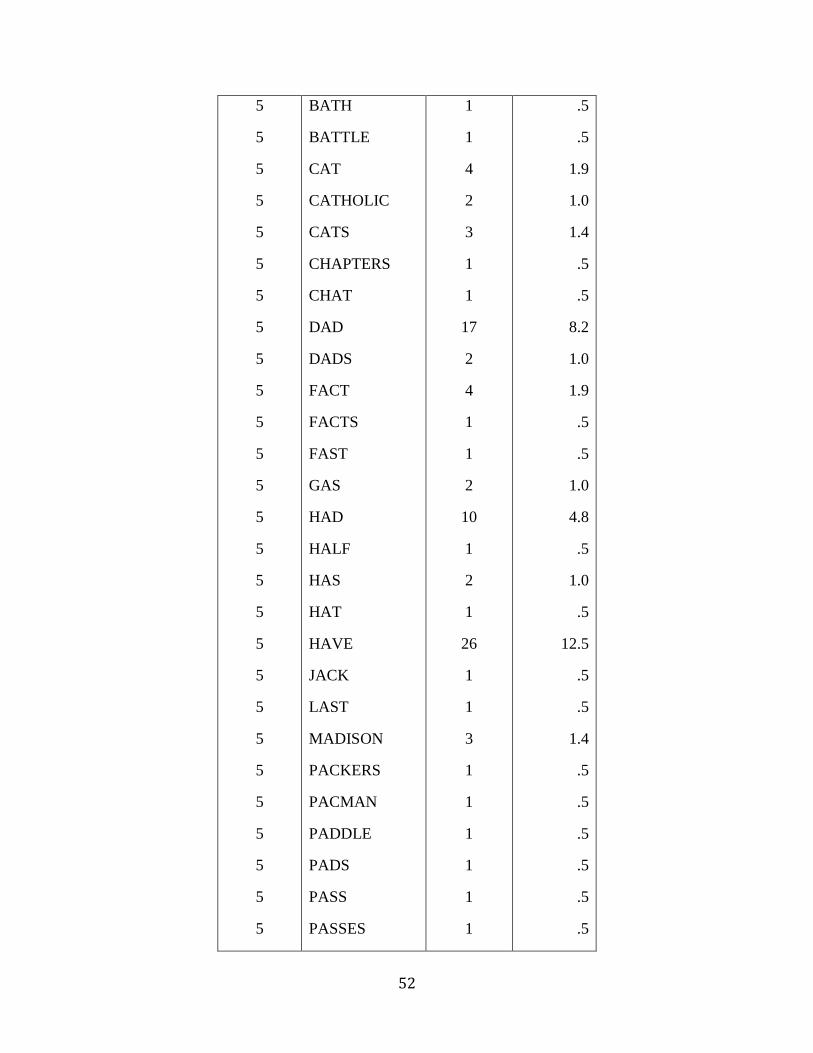
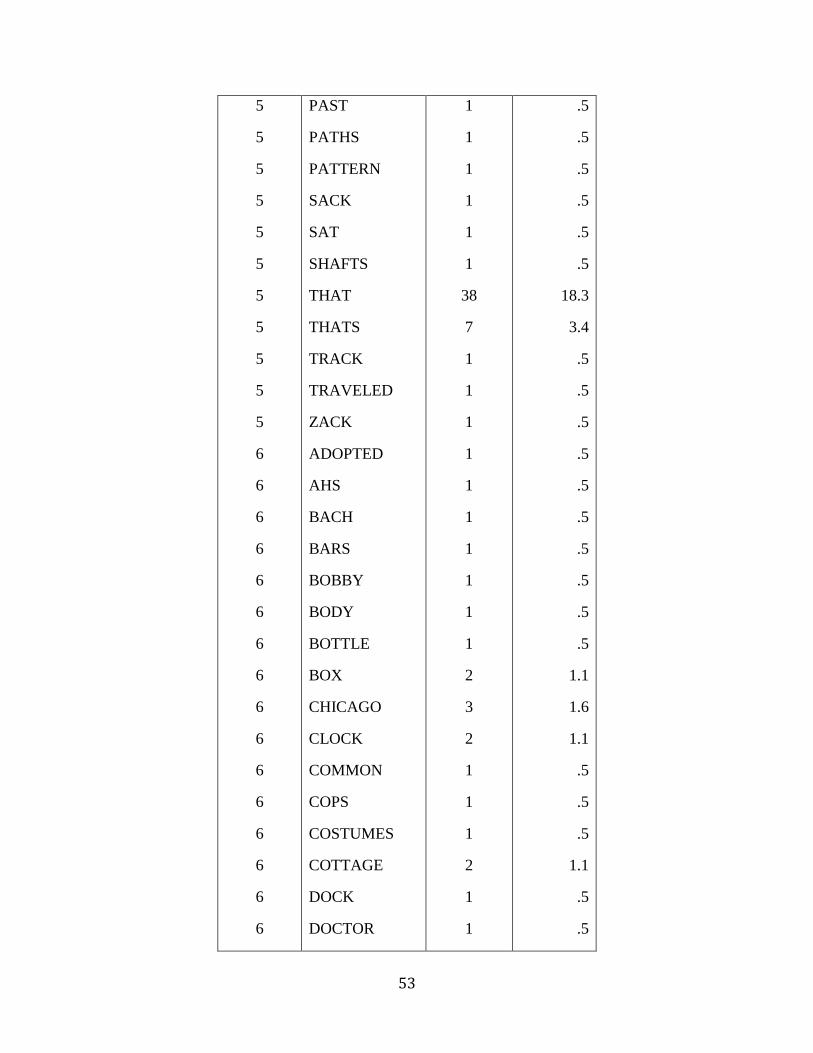
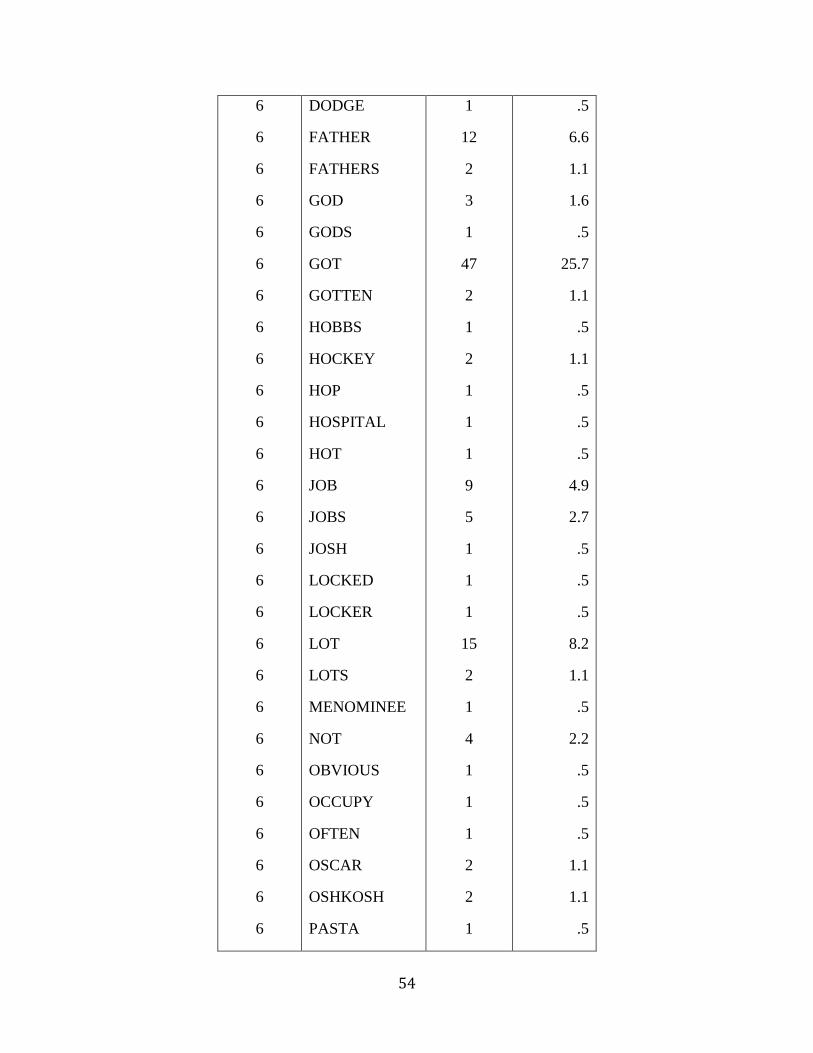
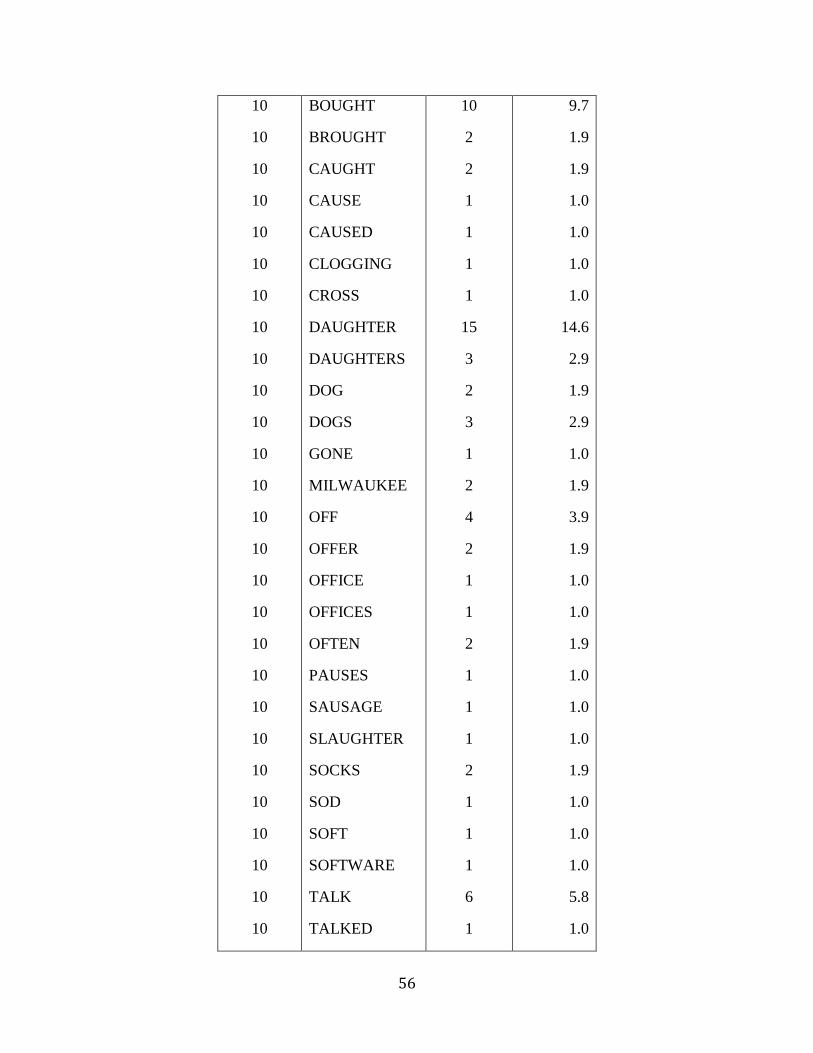
A total of 1050 words from all 107 speakers were analyzed in the present study. The most
frequent vowels in the sample were the /æ/ vowel, such as in the word cat and the /ɪ/ vowel, such as in
the word this. The /æ/ vowel occurred 208 times, which accounts for 19.8% of all productions and the
/ɪ/ occurred 201 times, 19.1% of the sample. The least frequent vowel was the /ɔ/ vowel, such as in the
word caught. This vowel occurred only 103 times, 9.8% of all productions. The remaining vowels were
represented with similar frequency. In particular, the /ɑ/ vowel occurred 183 times (17.4%), the /ʌ/
vowel 178 times (17%) and the /ɛ/ vowel 177 times (16.9%). The cumulative list of all words used for
each vowel and the frequency of each word in the entire data set are shown in Appendix II.
2.3 Data Collection/Recording
Data collection for the larger corpus took place in the years 2006-2008. During a one hour
session, each participant recorded words in isolation, words in sentences, and a spontaneous talk.
Participants were given a nominal fee for participation. For the words in isolation and the sentence set,
the test items were prompted on a computer screen and read by the participant seated in a sound-
attenuating booth. This part of the recordings was controlled by a program written in Matlab. A slightly
different procedure was used for the spontaneous talks. In particular, the participants were not required
to attend to any prompts on the computer screen but were asked to speak freely about families, hobbies,
daily lives, etc. for the purposes of obtaining a more natural speech samples representative of each
dialect region. The same microphone was used but the experimenter recorded the spontaneous talks
19
using the program Adobe Audition. Leading questions were sometimes asked by the experimenter to
engage the participant in a conversation if he/she did not know what to talk about or ran out of topics.
2.4 Data Analysis
The spontaneous talks were transcribed and analyzed acoustically. The recorded talks were
listened to and words that contained the six vowels in the Northern Cities Shift (/ɪ, ɛ, æ, ɑ, ʌ, ɔ/) were
selected and edited out. Only stressed words such as this, best, bad, job, stuff, and bought were selected.
The speech analysis programs Adobe Audtion and TF32 were used to analyze each word token. The
locations of word onset and offset and vowel onset and offset were carefully located using Adobe
Audition. Vowel onset was defined as the location at the zero-crossing before the first positive peak in
the periodic waveform following a word initial consonant and vowel offset was defined as the beginning
of the stop closure (location of abrupt decrement in the amplitude of the waveform), which are the
standard measurement criteria used in the literature (e.g., Jacewicz et al., 2011b). Because spontaneous
speech talks were used, the conditions were not as controlled as typical speech production experiments
where subjects record isolated words and sentences.

20
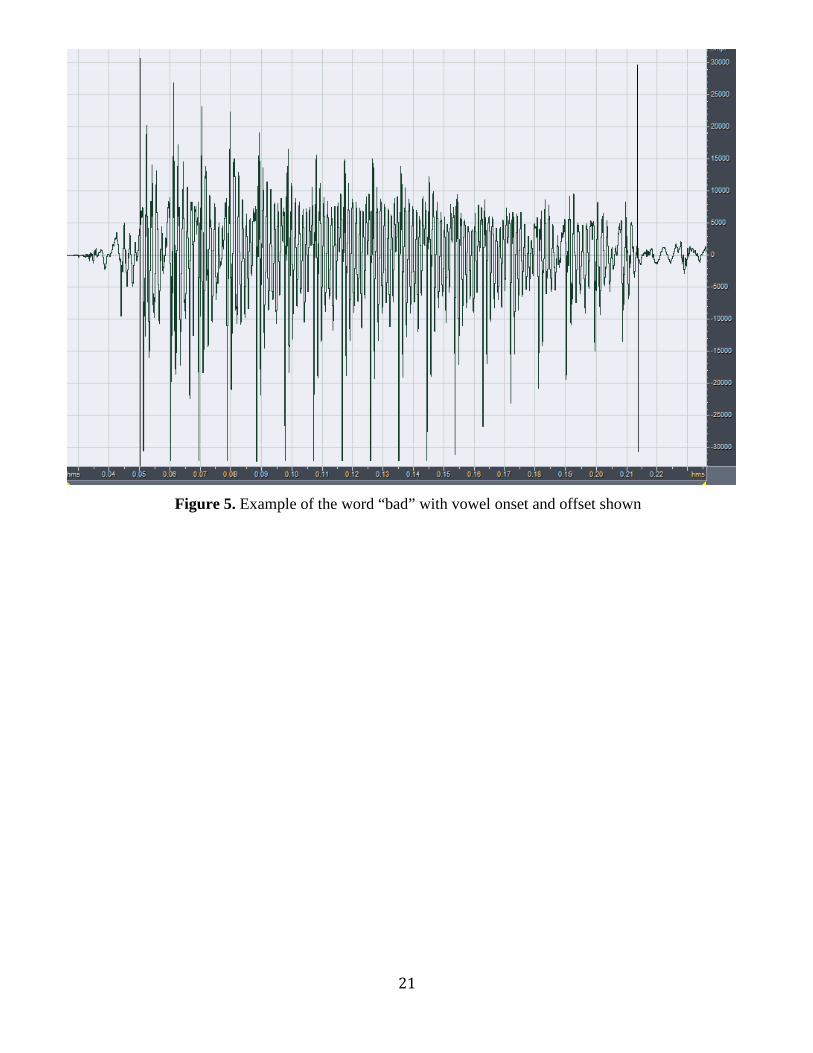
For example, in figure 4, the word back is shown. This is a word showing a voiced stop, vowel,
and a voiceless stop. The vowel onset is shown by the left vertical mark. The vowel offset is shown by
the right vertical mark. In this example, the stop following the vowel is a voiceless stop [k], which
begins with a silent closure. In figure 5, the word bad is shown. This is an example of a voiced stop,
vowel, and a voiced stop. The stop [d] following the vowel is voiced, which can be seen in the low
energy, periodic waveform during the closure. In figure 6, the word cats is shown. This is an example
of a voiceless stop, vowel, and a voiceless stop. In a voiceless stop there is a long voice onset time
(VOT). The word have is shown in figure 7. This is an example of a voiceless fricative, vowel, and
voiced fricative.
Figure 4. Example of the word “back” with vowel onset and offset shown
21
Figure 5. Example of the word “bad” with vowel onset and offset shown

22
Figure 6. Example of the word “cats” with vowel onset and offset shown

23
Figure 7. Example of the word “have” with vowel onset and offset shown

24
Figure 8 shows a talks location check program, which was used to check on the acoustic
landmark locations. The first image shown in the figure is a waveform of the whole utterance said
containing the word “kids.” From that point the word was taken out of the utterance and the word onset
and offset were measured. The second image in figure 8 shows the token word “kids.” The final image
in the figure shows the vowel /ɪ/ taken out of the word “kids,” and shows the beginning and end of the
vowel.
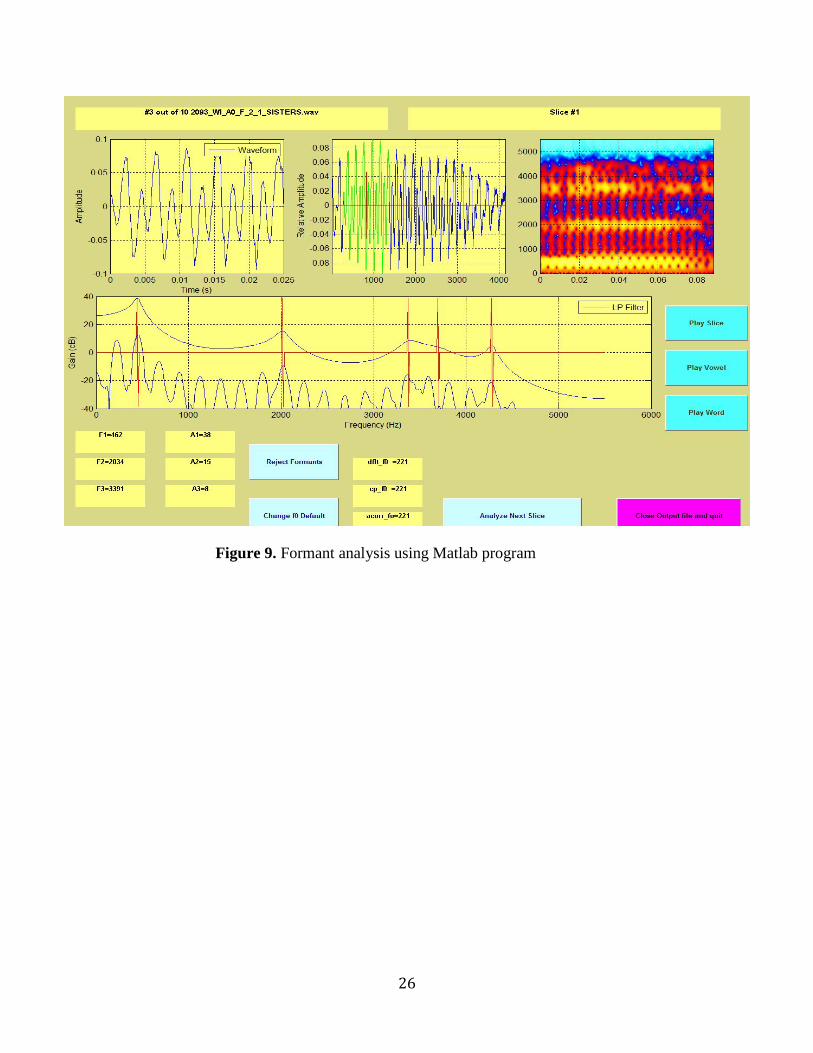
Figure 9 also shows the formant analysis done in the Matlab program. The formant peaks with
the red vertical lines cutting through them represent the first, second, third, fourth, and fifth formants of
the vowel being measured. Although all five formants are shown in the figure, the first two formants are
the most important because they distinguish the vowel shown from other vowels. The first formant
corresponds to tongue height, while the second formant corresponds to tongue front or backness. Using
this information, one can easily determine which vowel is being said based on tongue position in the oral
cavity. Formant frequencies (F1 and F2) were measured automatically at five points in time, 20%, 35%,
50%, 65%, and 80%. The F1 and F2 values corresponding to these time points were then used in
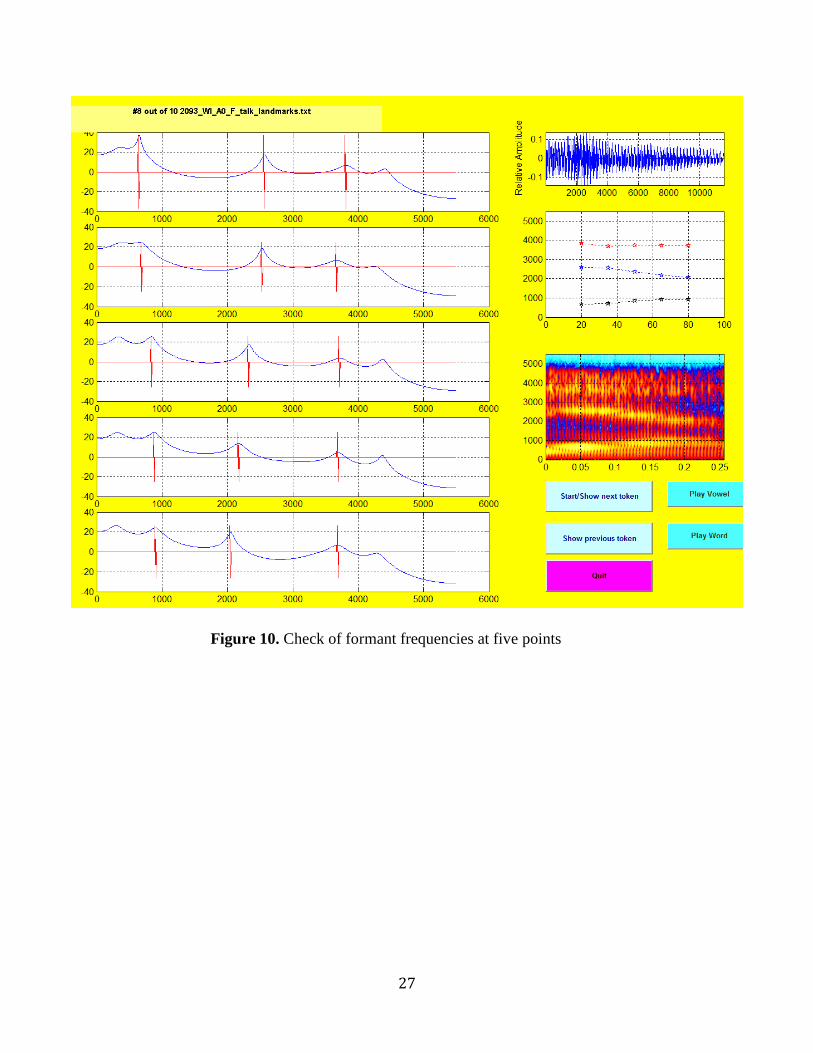
statistical analysis to assess the changes in vowel production. Figure 10 shows the formant analysis in
the custom Matlab program with the five points in time shown.

25
Figure 8. Acoustic landmark locations in a talk waveform (upper panel), along with word waveform, (middle panel), and vowel waveform (lower panel).
26
Figure 9. Formant analysis using Matlab program
27
Figure 10. Check of formant frequencies at five points

28
Chapter 3: Results
3.1 Vowel Duration Analysis
Figure 11 displays the duration of individual vowel categories in each dialect. Overall mean
vowel duration is longer for Ohio speakers than for Wisconsin speakers. Vowel duration was measured
in milliseconds. The means were 142.4 and 138.7 m.s., respectively. In regards to gender, the mean
Figure 11. Vowel Duration by dialect by category

29
vowel duration for females was 143.5 and for males was 136.8 m.s. This shows that females have
longer vowels than males on average. In terms of generations, children had the longest vowel duration,
parents had shorter vowel duration, and grandparents had the shortest vowel duration. The means were
147.7, 137.5, and 135.8 m.s., respectively. According to Figure 8, the vowel /æ/ is longest for both Ohio
and Wisconsin speaker production. The /ɔ/ vowel is almost equally as long when produced by
Wisconsin speakers but is comparably shorter when produced by Ohio speakers. The figure also shows
that production of /ɛ/ is shortest for Wisconsin speakers, followed by /ɪ/. For Ohio speakers, however, it
appears that the production of /ɪ/ is shortest, followed by the production of /ɛ/.
30
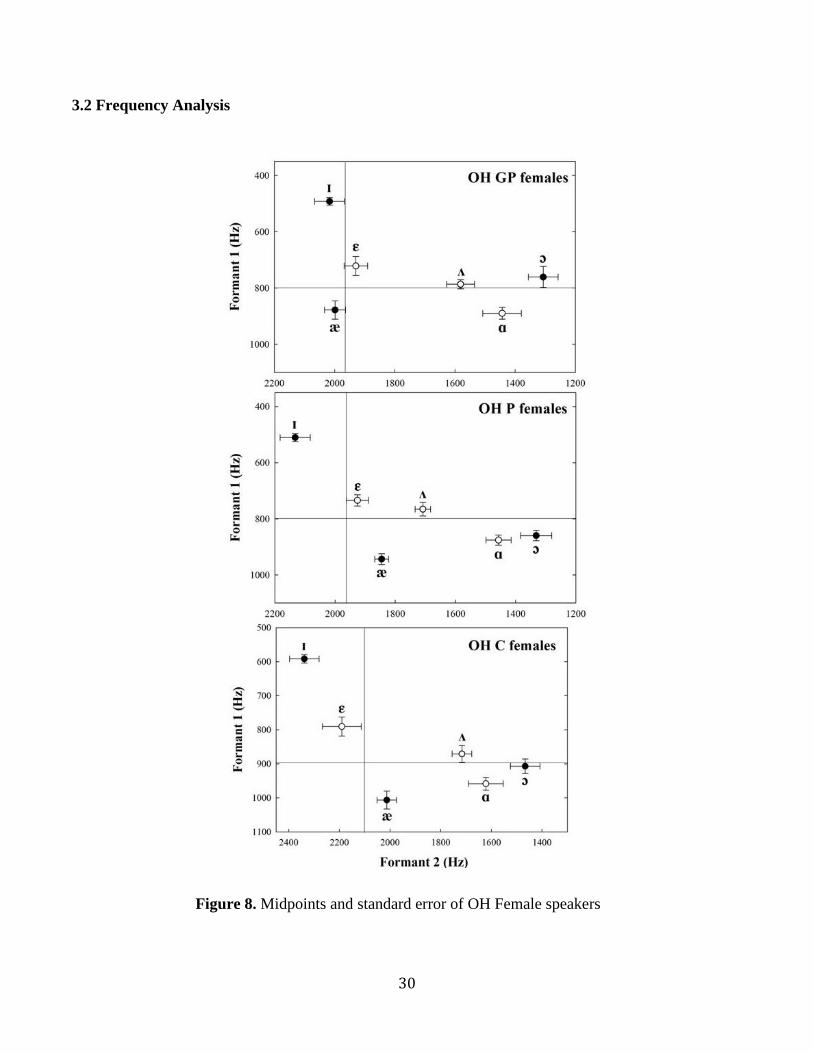
3.2 Frequency Analysis
Figure 8. Midpoints and standard error of OH Female speakers
31
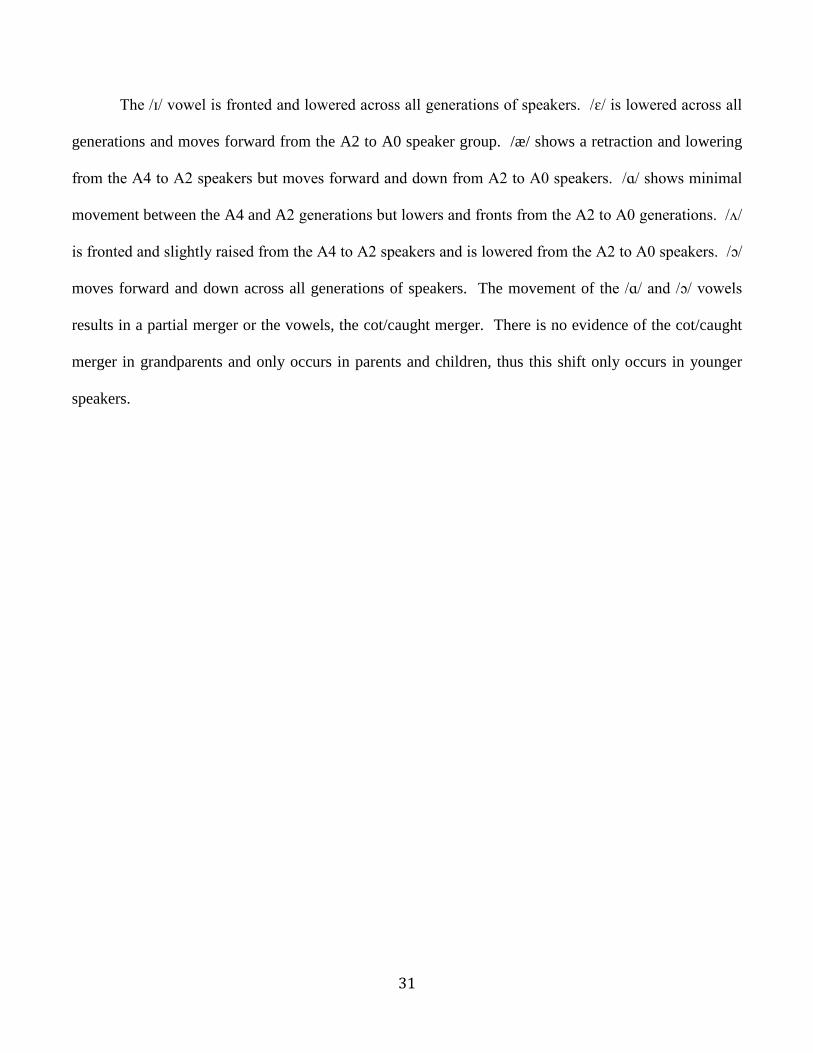
The /ɪ/ vowel is fronted and lowered across all generations of speakers. /ɛ/ is lowered across all
generations and moves forward from the A2 to A0 speaker group. /æ/ shows a retraction and lowering
from the A4 to A2 speakers but moves forward and down from A2 to A0 speakers. /ɑ/ shows minimal
movement between the A4 and A2 generations but lowers and fronts from the A2 to A0 generations. /ʌ/
is fronted and slightly raised from the A4 to A2 speakers and is lowered from the A2 to A0 speakers. /ɔ/
moves forward and down across all generations of speakers. The movement of the /ɑ/ and /ɔ/ vowels
results in a partial merger or the vowels, the cot/caught merger. There is no evidence of the cot/caught
merger in grandparents and only occurs in parents and children, thus this shift only occurs in younger
speakers.
32
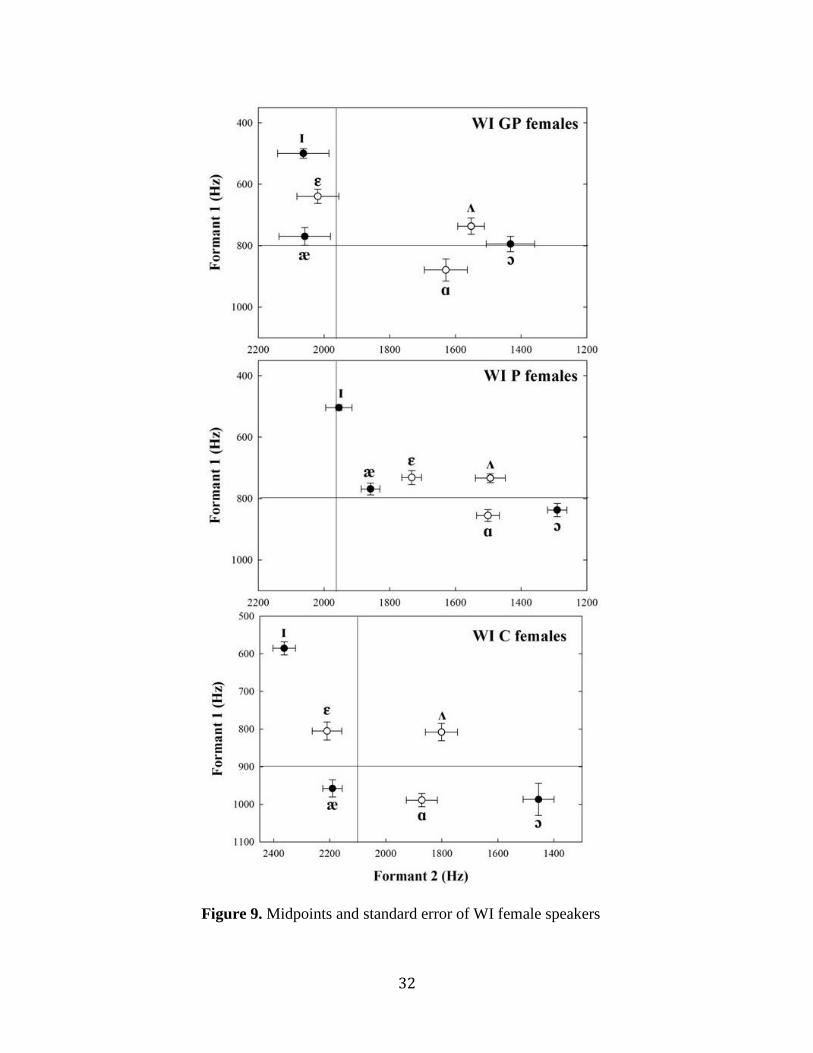
Figure 9. Midpoints and standard error of WI female speakers
33
The /ɪ/ vowel is retracted from the A4 to A2 generation of speakers but moves forward and down
from the A2 to A0 generation of speakers. /ɛ/ moves back and down (stage 4) from the A4 to A2
speakers but moves forward and down from the A2 to A0 speakers. /æ/ is retracted from the A4 to A2
speakers but moves forward and down from the A2 to A0 speakers. /ɑ/ is retracted from the A4 to A2
speakers but moves forward and down from the A2 to A0 speakers. /ʌ/ moves slightly forward from the
A4 to A2 generations and moves forward and down from the A2 to A0 generation speakers. /ɔ/ is
retracted and lowered from the A4 to A2 speakers but moves forward and down from the A2 to A0
speakers.
34
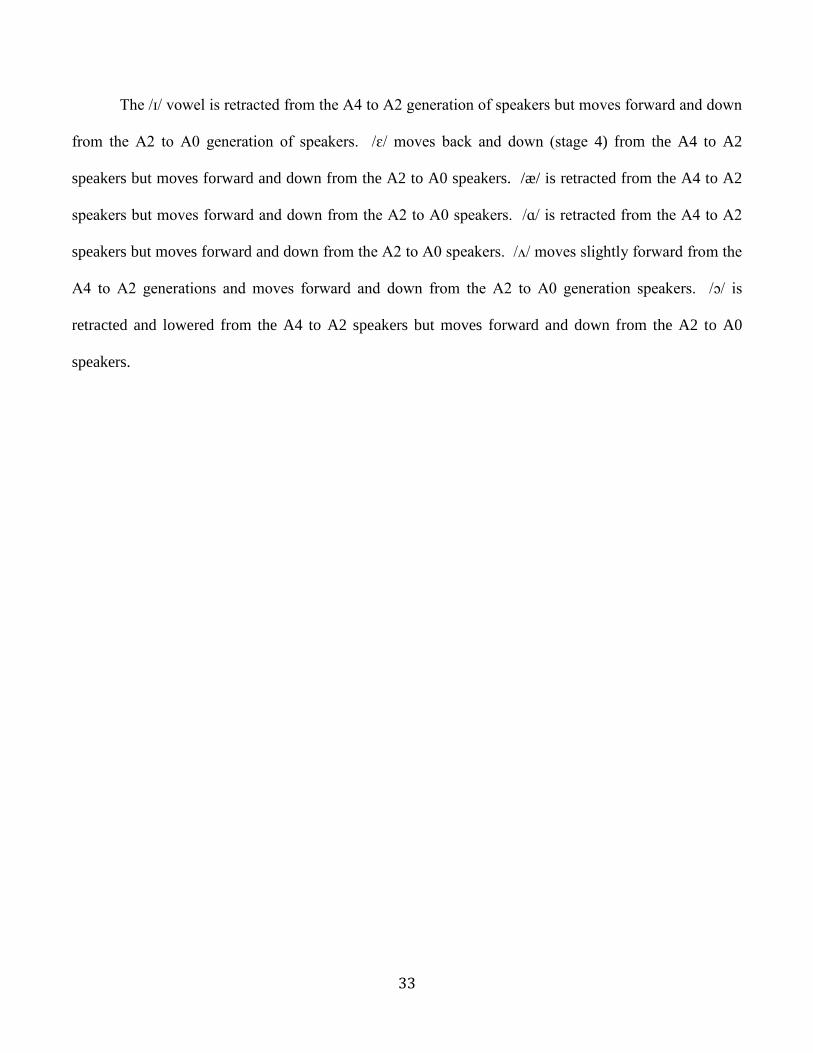
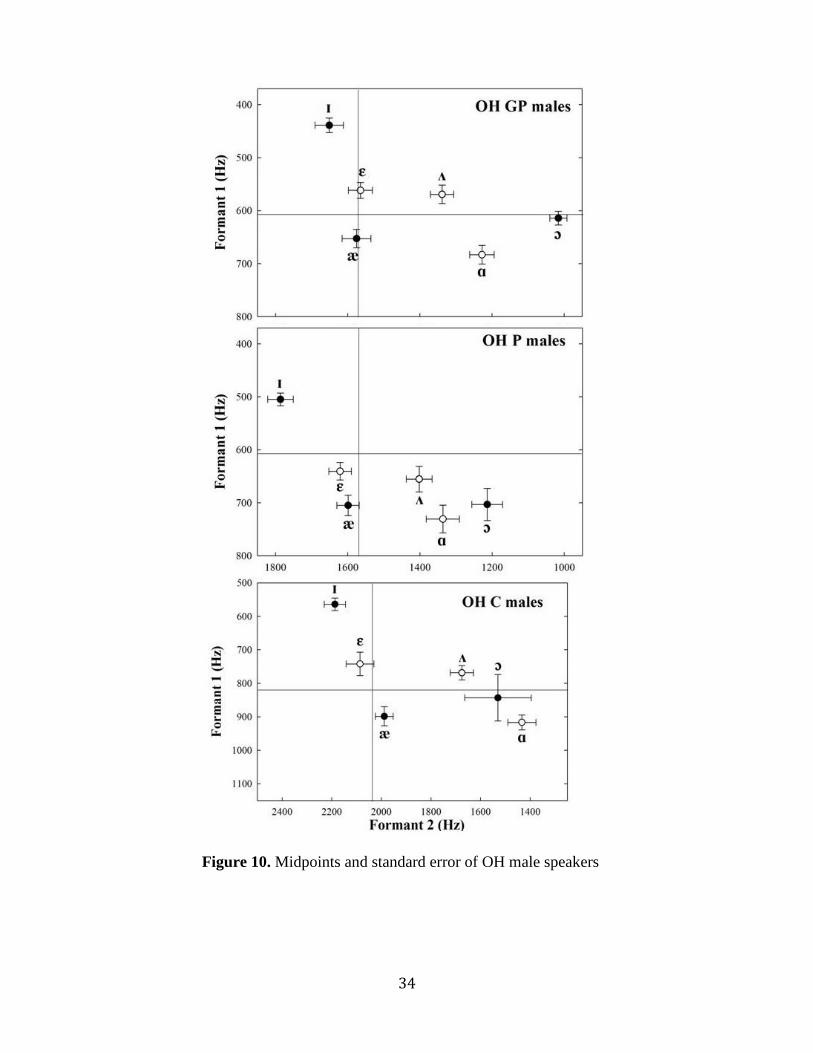
Figure 10. Midpoints and standard error of OH male speakers

35
There are positional vowel changes across generations of Ohio male speakers. All vowels /ɪ, ɛ,
æ, ʌ, ɑ, and ɔ/ are lowered and fronted across all generations. This is interesting because there is much
more consistency in the movement of vowels for Ohio male speakers as compared to Ohio female
speakers or Wisconsin male speakers.

36
Figure 11. Midpoints and standard error of WI male speakers

37
There are several positional vowel changes in WI _A2 speakers relative to WI_A4 speakers. The
vowel /ɪ/ moves forward and down from the grandparent to the parent generation. This vowel
movement continues into the WI_A0 speakers and the /ɪ/ moves further forward and down. The /ɛ/
vowel moves forward and lower across all generations of speakers. /æ/ is retracted and lowered from
A4 to A2 speakers but moves forward and down from A2 to A0 speakers. Although the horizontal
movement of the vowel in the vowel space varies from generation to generation, /æ/ continues to lower
throughout all generations of speakers. /ʌ/ has little movement from A4 to A2 speakers but moves
forward and down from A2 to A0 speakers. /ɑ/ moves lower from A4 to A2 speakers and is fronted and
lowered from A2 to A0 speakers. /ɔ/ moves forward and down across all generations of speakers.
38
Chapter 4: Discussion / Conclusion
The purpose of this study was to determine whether or not elements of the Northern Cities shift
have spread to the spontaneous speech of Central Ohio speakers as seen in changes in the positions of
vowels in the acoustic vowel space across age groups. Primary results indicate that the Northern Cities
Shift has not spread to the spontaneous speech of Central Ohio Speakers. These results are consistent
with results of previous research studies that show that the Northern Cities shift is not operative in
Central Ohio. Findings by Jacewicz, Fox, and Salmons (2011) have suggested that speakers in the
Central Ohio region do in fact participate in a chain shift. This is a new shift in Central Ohio, the North
American Shift. However, the data supporting this view are based on recordings from read speech
obtained under careful laboratory conditions. While the current spontaneous speech data support the
existence of the new North American Shift, there is no indication of any traces of the Northern Cities
Shift in the speech of the present participants.
Previous data from Labov et al., (2006) indicate a strong dialect boundary between the North and
the Midland that divides Ohio into two dialect regions. Because the data used in Labov’s study comes
from speakers interviewed between 1991 and 1993, the results may have changed in the past twenty
years. This study presents a current view on the dialect boundary. The results from this study are
consistent with Labov’s data. Since the Northern Cities Shift has not spread from Northern to Central
Ohio, it can be concluded that there is still a strong dialect boundary between the North and the Midland.
The results of this study are relevant to research in Speech and Hearing Science because it
provides further evidence that the Northern Cities Shift is not present in the spontaneous speech of
Central Ohio speakers. This shows that the Northern Cities Shift has not changed across generations of
Central Ohio speakers in the past twenty years. In research it is important to continue to update your
findings with current populations.

39
Potential weaknesses of this study include the variability of speakers and the variety of target
words used. Because the study uses recorded materials of spontaneous speech, each speaker has great
variability and it can sometimes be hard to correctly transcribe what was said. The spontaneous talks
used present an innovation in studies of the Northern Cities Shift because most previous studies have
used controlled recordings. Although the study provides a more accurate sample of everyday speech, it
is harder to control the conditions of the study.
40
References
Boberg, C. (2005). “The Canadian shift in Montreal,” Language Variation and Change 17, 133-154.
Clarke, S., Elms, F., & Youssef, A. (1995). “The third dialect of English: Some Canadian evidence,”
Language Variation and Change, 7, 209-228.
Clopper, C., Pisoni, D., & Jong, K. d. (2005). “Acoustic characteristics of the vowel systems of six
regional varieties of American English,” Journal of Acoustical Society of America, 118(3),
1661-1676.
Eckert,P. (1986). The roles of high school social structure in phonological change. Proceedings of the Chicago Linguistic Society’s meeting. Chicago, IL: CLS.
Eckert, P. (2000). Linguistic variation as a social practice. (Blackwell, Oxford).
Fasold, Ralph. (1969). A sociolinguistic study of the pronunciation of three vowels in Detroit speech. Mimeographed.
Irons, T. (2007). “On the status of low back vowels in Kentucky English: More evidence of merger,”
Language Variation and Change, 19, 137-180.
Jacewicz, E., Fox, R., & Salmons, J. (2007). “Vowel duration in three American English dialects,”
American Speech, 82(4), 367-385.
Jacewicz, E., Fox, R., & Salmons, J. (2011). “Cross-generational vowel change in American English,”
Language Variation and Change, 23, 45-86.
Labov, W. (1994). Principles of Linguistic Change: Internal Factors. (Blackwell, Malden, MA).
Labov, W., Yaeger, M., & Steiner, R. (1972). A quantitative study of sound change in progress.
Philadelphia, PA: U.S. Regional Survey.
41
Labov, W., Ash, S., & Boberg, C. (2006). The Atlas of North American English: phonetics, phonology,
and sound change: a multimedia reference tool. (Mouton de Gruyter, New York).
Majors, T. (2005). “Low back vowel merger in Missouri speech: Acoustic description and explanation,”
American Speech, 80(2), 165-179.
Thomas, E. (1989). “Vowel changes in Columbus, Ohio,” Journal of English Linguistics, 2, 205-215.

42
Appendix A
Basic demographic background of the participants (self reported). Education level is coded as: 1 = elementary, 2 = high school, 3 = two-year college, 4 = four-year college, 5 = graduate degree. ID: C = child, P = parent, GP = grandparent.
Ohio participants
ID Birth year
Age at testing (years)
Gender Education Occupation Area
OH1030_C
OH1031_C
OH1037_C
OH1049_C
OH1056_C
OH1057_C
OH1058_C
OH1061_C
OH1063_C
OH1065_C
OH1067_C
OH1069_C
OH1072_C
OH1073_C
OH1075_C
OH1078_C
OH1083_C
OH1088_C
OH1092_C
OH1039_P
OH1046_P
1994
1996
1995
1995
1997
1998
1997
1997
1995
1997
1995
1997
1996
1998
1995
1994
1998
1994
1998
1962
1968
12
10
11
12
10
9
10
10
12
10
12
10
11
9
8
12
9
12
9
44
39
F
M
F
M
M
F
M
M
M
M
F
M
M
F
F
F
F
F
F
M
M
1
1
1
1
1
1
1
1
1
1
1
1
1
1
1
1
1
1
1
5
5
Student
Student
Student
Student
Student
Student
Student
Student
Student
Student
Student
Student
Student
Student
Student
Student
Student
Student
Student
Bus driver
Research assistant
Columbus
Columbus
Columbus
Columbus
Columbus
Columbus
Columbus
Worthington
Powell
Columbus
Worthington
Westerville
Granville
Granville
Upper Arlington
Columbus
Grove City
Glenford
Columbus
Columbus
Columbus

43
OH1051_P
OH1062_P
OH1068_P
OH1071_P
OH1076_P
OH1077_P
OH1089_P
OH1090_P
OH1093_P
OH1094_P
OH1103_P
OH1104_P
OH1111_P
OH1112_P
OH1113_P
OH1127_P
OH1140_P
OH1052_GP
OH1053_GP
OH1054_GP
OH1098_GP
OH1106_GP
OH1118_GP
OH1119_GP
OH1121_GP
OH1128_GP
OH1130_GP
OH1131_GP
OH1132_GP
OH1133_GP
1968
1968
1970
1965
1965
1958
1963
1969
1968
1960
1958
1965
1973
1972
1968
1964
1973
1935
1939
1935
1931
1938
1935
1934
1939
1937
1940
1931
1932
1940
39
39
37
42
42
49
44
38
39
47
49
42
35
35
39
44
36
72
68
72
76
69
73
74
69
71
68
77
76
68
F
F
F
F
F
F
M
F
F
F
M
F
M
M
F
M
M
M
F
F
F
M
M
M
M
F
M
F
F
M
4
3
5
4
5
3
4
5
4
5
3
4
5
4
4
5
4
5
2
3
3
3
5
2
2
3
2
2
3
3
University staff
Preschool teacher
Substitute teacher
Homemaker, previous teacher
Speech language pathologist
Nurse
Graphic designer
Homemaker
Homemaker
Occupational therapist
Compliance facility director
Registered nurse
Teacher
IT technician
University staff
Student
Retired, private investor
Retired manager
Retired
Beautician
Retired
School bus driver
Retired
Retired
Retired
Homemaker
Retired Telephone Co worker
Homemaker
Retired legal secretary
Retired
Worthington
Powell
Worthington
Grandville
Columbus
Columbus
Grandview Heights
Hilliard
Columbus
Worthington
Columbus
Columbus
Westerville
Hilliard
Columbus
Ashville
Columbus
Worthington
Columbus
Columbus
Columbus
Columbus
Columbus
Delaware
Columbus
Groveport
Columbus
Columbus
Columbus
Columbus

44
OH1141_GP
OH1129_GP
1934
1937
75
71
F
M
4
4
Retired teacher
Retired fire fighter
Westerville
Columbus
45
Wisconsin Participants
ID Birth year
Age at testing (years)
Gender Education Occupation Area
W2088_C
W2089_C
W2091_C
W2093_C
W2095_C
W2098_C
W2099_C
W2100_C
W2101_C
W2102_C
W2103_C
W2116_C
W2117_C
W2118_C
W2120_C
W2121_C
W2124_C
W2131_C
W2132_C
W2133_C
W2040_P
W2041_P
W2042_P
W2045_P
W2048_P
1995
1998
1997
1996
1997
1997
1999
1999
1995
1998
1998
1998
1999
1999
1997
1998
1999
1997
1997
1997
1968
1964
1967
1961
1960
12
9
10
11
9
9
9
8
12
9
9
9
9
9
10
9
8
10
10
11
38
42
39
45
46
F
F
F
F
F
F
F
F
F
F
M
M
M
M
M
M
M
M
M
M
M
M
F
F
F
1
1
1
1
1
1
1
1
1
1
1
1
1
1
1
1
1
1
1
1
5
4
5
5
4
Student
Student
Student
Student
Student
Student
Student
Student
Student
Student
Student
Student
Student
Student
Student
Student
Student
Student
Student
Student
Researcher
Unemployed
Financial specialist
Trial attorney
Health unit coordinator
Madison
Madison
Madison
Madison
Madison
Monona
Madison
Madison
Madison
Madison
Madison
Middleton
Middleton
Middleton
Madison
Middleton
Middleton
Madison
Madison
Madison
Sun Prairie
Madison
Madison
Madison
Madison

46
W2051_P
W2052_P
W2054_P
W2055_P
W2057_P
W2058_P
W2062_P
W2068_P
W2076_P
W2079_P
W2081_P
W2092_P
W2129_P
W2049_GP
W2061_GP
W2070_GP
W2071_GP
W2072_GP
W2073_GP
W2080_GP
W2083_GP
W2086_GP
W2087_GP
W2104_GP
W2128_GP
W2130_GP
W2134_GP
W2135_GP
W2142_GP
1968
1968
1961
1962
1957
1966
1970
1960
1959
1958
1966
1959
1968
1928
1936
1936
1931
1931
1932
1931
1924
1920
1924
1932
1935
1939
1918
1922
1935
38
38
45
44
50
41
36
46
47
49
40
48
40
79
70
70
75
75
74
76
83
86
83
75
72
68
90
85
72
F
F
F
M
M
F
F
M
F
F
M
M
M
M
M
M
F
M
F
M
F
F
F
M
F
M
F
M
F
4
5
4
5
5
5
4
5
3
5
5
5
3
3
5
4
2
5
4
5
2
2
4
5
5
3
1
5
2
Health care manager
Network engineer
Small business owner
Electrical engineer
University professor
Director of development
Registered nurse
Research program manager
Correction officer
Attorney
Teacher (Middle school)
Student
Clerk at Walgreens
Retired
Retired physician
Retired civil engineer
Retired
Retired
Retired
Professor
Florist, retired teacher
Retired registered nurse
Retired registered nurse
Retired –VP purchasing
Registered nurse
Retired farmer
Retired
Retired
Retired
Madison
Madison
Oregon
Oregon
Madison
Verona
Madison
Madison
Fond du lac
Madison
Madison
Madison
Sun Prairie
Madison
Madison
Madison
Monona
Madison
Madison
Madison
Madison
Madison
Monona
Madison
Madison
Sun Prairie
De Forest
Madison
Menominee Falls
47
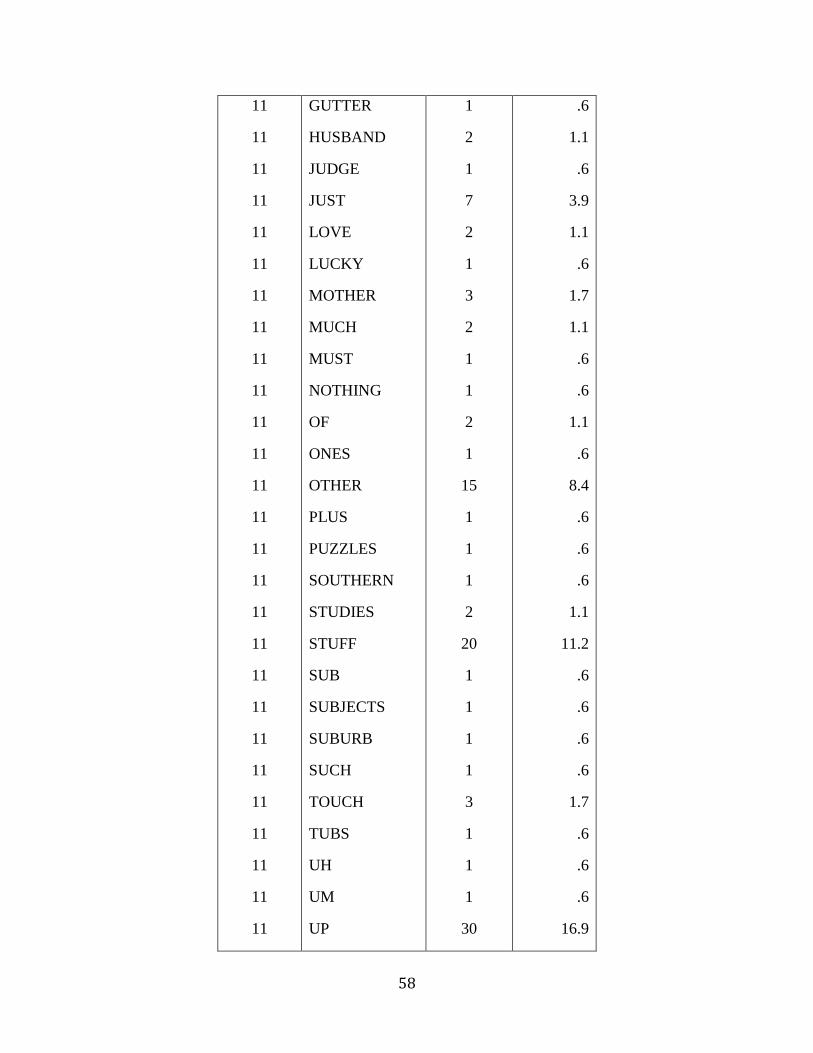
Appendix B
Vowel Word Frequency Percent
2
2
2
2
2
2
2
2
2
2
2
2
2
2
2
2
2
2
2
2
2
2
2
BIG
BIGGER
BIGGEST
BIT
BUSINESS
BUSINESSES
BUSY
CHIP
CHRISTMAS
CITY
DID
DIDNT
DIFFERENT
DIG
DISTANCE
DISTRICT
FIFTEEN
FIFTH
FIFTY
FISHED
GET
GIFTS
GIVE
16
3
1
3
2
1
1
1
1
2
27
2
2
1
1
1
1
6
1
1
1
2
1
8.0
1.5
.5
1.5
1.0
.5
.5
.5
.5
1.0
13.4
1.0
1.0
.5
.5
.5
.5
3.0
.5
.5
.5
1.0
.5
48
2
2
2
2
2
2
2
2
2
2
2
2
2
2
2
2
2
2
2
2
2
2
2
2
2
2
2
HIS
HIT
IF
IS
IT
ITS
KID
KIDS
KITCHEN
LITTER
LIVED
LIVES
MIDDLE
PHYSICAL
PIP
RISKING
SIBLINGS
SICK
SINK
SISTER
SISTERS
SIT
SIX
SIXTY
SKIP
SMITH
THIS
6
1
1
14
17
11
4
17
1
1
1
1
1
1
1
1
1
3
1
3
2
2
8
1
1
1
16
3.0
.5
.5
7.0
8.5
5.5
2.0
8.5
.5
.5
.5
.5
.5
.5
.5
.5
.5
1.5
.5
1.5
1.0
1.0
4.0
.5
.5
.5
8.0

49
2
2
2
2
4
4
4
4
4
4
4
4
4
4
4
4
4
4
4
4
4
4
4
4
4
4
4
VIDEO
VIDEOS
VIRGINIA
VISIT
BED
BEDROOM
BEDS
BEDSET
BEST
BETTER
BLESSED
CHESS
DECADES
DECK
DESERT
DESK
DESTINY
DEVIL
DEVILS
EDGE
EDGEWOOD
EFFORT
EVER
EVERGLADES
EVERY
EVERYONE
EVERYTHING
1
1
1
2
5
1
3
1
6
2
1
1
1
1
1
1
1
1
1
2
1
1
5
1
6
1
1
.5
.5
.5
1.0
2.8
.6
1.7
.6
3.4
1.1
.6
.6
.6
.6
.6
.6
.6
.6
.6
1.1
.6
.6
2.8
.6
3.4
.6
.6
50
4
4
4
4
4
4
4
4
4
4
4
4
4
4
4
4
4
4
4
4
4
4
4
4
4
4
4
EXODUS
F
FEZ
FORGET
GET
GETS
GETTING
GUESS
HEAD
JETSKI
KEPT
LEFT
LEGS
MET
NEVER
NEXT
PET
PRESENT
SAID
SAYS
SECOND
SECONDS
SECRETARY
SECTOR
SEMESTER
SET
SETTLED
1
1
1
1
18
4
1
7
3
1
2
3
1
6
1
1
4
1
10
1
13
1
1
1
1
1
1
.6
.6
.6
.6
10.2
2.3
.6
4.0
1.7
.6
1.1
1.7
.6
3.4
.6
.6
2.3
.6
5.6
.6
7.3
.6
.6
.6
.6
.6
.6
51
4
4
4
4
4
4
4
4
4
4
4
4
4
4
4
4
5
5
5
5
5
5
5
5
5
5
5
SEVEN
SEVENTH
SEVERAL
SPECIAL
STEP
STEPS
TEST
TEXAS
THEN
TOGETHER
UPSET
WEATHER
WEST
WESTERVILLE
YES
YET
ACTS
ACTUALLY
ADDED
AFTER
ASK
AT
ATHLETIC
AVENUE
BACK
BAD
BASKETBALL
13
2
1
1
1
1
3
4
1
2
2
1
2
1
9
1
1
7
1
2
1
2
1
1
37
6
4
7.3
1.1
.6
.6
.6
.6
1.7
2.3
.6
1.1
1.1
.6
1.1
.6
5.1
.6
.5
3.4
.5
1.0
.5
1.0
.5
.5
17.8
2.9
1.9
52
5
5
5
5
5
5
5
5
5
5
5
5
5
5
5
5
5
5
5
5
5
5
5
5
5
5
5
BATH
BATTLE
CAT
CATHOLIC
CATS
CHAPTERS
CHAT
DAD
DADS
FACT
FACTS
FAST
GAS
HAD
HALF
HAS
HAT
HAVE
JACK
LAST
MADISON
PACKERS
PACMAN
PADDLE
PADS
PASS
PASSES
1
1
4
2
3
1
1
17
2
4
1
1
2
10
1
2
1
26
1
1
3
1
1
1
1
1
1
.5
.5
1.9
1.0
1.4
.5
.5
8.2
1.0
1.9
.5
.5
1.0
4.8
.5
1.0
.5
12.5
.5
.5
1.4
.5
.5
.5
.5
.5
.5
53
5
5
5
5
5
5
5
5
5
5
5
6
6
6
6
6
6
6
6
6
6
6
6
6
6
6
6
PAST
PATHS
PATTERN
SACK
SAT
SHAFTS
THAT
THATS
TRACK
TRAVELED
ZACK
ADOPTED
AHS
BACH
BARS
BOBBY
BODY
BOTTLE
BOX
CHICAGO
CLOCK
COMMON
COPS
COSTUMES
COTTAGE
DOCK
DOCTOR
1
1
1
1
1
1
38
7
1
1
1
1
1
1
1
1
1
1
2
3
2
1
1
1
2
1
1
.5
.5
.5
.5
.5
.5
18.3
3.4
.5
.5
.5
.5
.5
.5
.5
.5
.5
.5
1.1
1.6
1.1
.5
.5
.5
1.1
.5
.5
54
6
6
6
6
6
6
6
6
6
6
6
6
6
6
6
6
6
6
6
6
6
6
6
6
6
6
6
DODGE
FATHER
FATHERS
GOD
GODS
GOT
GOTTEN
HOBBS
HOCKEY
HOP
HOSPITAL
HOT
JOB
JOBS
JOSH
LOCKED
LOCKER
LOT
LOTS
MENOMINEE
NOT
OBVIOUS
OCCUPY
OFTEN
OSCAR
OSHKOSH
PASTA
1
12
2
3
1
47
2
1
2
1
1
1
9
5
1
1
1
15
2
1
4
1
1
1
2
2
1
.5
6.6
1.1
1.6
.5
25.7
1.1
.5
1.1
.5
.5
.5
4.9
2.7
.5
.5
.5
8.2
1.1
.5
2.2
.5
.5
.5
1.1
1.1
.5

55
6
6
6
6
6
6
6
6
6
6
6
6
6
6
6
6
6
6
6
10
10
10
10
10
10
10
10
PLOT
POP
POPULATION
POSSIBLE
PROBABLY
PROBLEMS
PROCESSED
SCOTCH
SHOP
SHOPPING
SHOT
SOCCER
SPOT
STOP
STOPPED
STOPS
TOP
WISCONSIN
AUDIT
AUGUST
AUSTRIA
AW
AWKWARD
BECAUSE
BOSS
BOSTON
1
1
1
1
1
2
2
1
1
3
2
1
11
2
6
2
1
1
1
1
2
1
2
1
6
1
2
.5
.5
.5
.5
.5
1.1
1.1
.5
.5
1.6
1.1
.5
6.0
1.1
3.3
1.1
.5
.5
.5
1.0
1.9
1.0
1.9
1.0
5.8
1.0
1.9
56
10
10
10
10
10
10
10
10
10
10
10
10
10
10
10
10
10
10
10
10
10
10
10
10
10
10
10
BOUGHT
BROUGHT
CAUGHT
CAUSE
CAUSED
CLOGGING
CROSS
DAUGHTER
DAUGHTERS
DOG
DOGS
GONE
MILWAUKEE
OFF
OFFER
OFFICE
OFFICES
OFTEN
PAUSES
SAUSAGE
SLAUGHTER
SOCKS
SOD
SOFT
SOFTWARE
TALK
TALKED
10
2
2
1
1
1
1
15
3
2
3
1
2
4
2
1
1
2
1
1
1
2
1
1
1
6
1
9.7
1.9
1.9
1.0
1.0
1.0
1.0
14.6
2.9
1.9
2.9
1.0
1.9
3.9
1.9
1.0
1.0
1.9
1.0
1.0
1.0
1.9
1.0
1.0
1.0
5.8
1.0

57
10
10
10
10
10
10
11
11
11
11
11
11
11
11
11
11
11
11
11
11
11
11
11
11
11
11
11
TALKIN
TALKING
TAUGHT
THOUGHT
WALK
WAUKESHAH
ANOTHER
BROTHER
BROTHERS
BUCKS
BUNCH
BUS
BUST
BUT
CHUCK
COMPANY
COUSIN
COUSINS
CUP
CUSSED
CUSTARD
DISGUSTING
DOES
DOUBLE
DUBLIN
DUDGEON
DUG
1
2
2
11
1
1
1
2
1
1
1
4
1
44
1
2
2
2
1
1
1
1
2
1
1
1
1
1.0
1.9
1.9
10.7
1.0
1.0
.6
1.1
.6
.6
.6
2.2
.6
24.7
.6
1.1
1.1
1.1
.6
.6
.6
.6
1.1
.6
.6
.6
.6
58
11
11
11
11
11
11
11
11
11
11
11
11
11
11
11
11
11
11
11
11
11
11
11
11
11
11
11
GUTTER
HUSBAND
JUDGE
JUST
LOVE
LUCKY
MOTHER
MUCH
MUST
NOTHING
OF
ONES
OTHER
PLUS
PUZZLES
SOUTHERN
STUDIES
STUFF
SUB
SUBJECTS
SUBURB
SUCH
TOUCH
TUBS
UH
UM
UP
1
2
1
7
2
1
3
2
1
1
2
1
15
1
1
1
2
20
1
1
1
1
3
1
1
1
30
.6
1.1
.6
3.9
1.1
.6
1.7
1.1
.6
.6
1.1
.6
8.4
.6
.6
.6
1.1
11.2
.6
.6
.6
.6
1.7
.6
.6
.6
16.9

59
11 US 2 1.1
Related Documents