^ .^^ CONFIDENT!^ S INCLASSIFIEDI CRONUS Controlled Reentry Orbiting NUclear System i\^./^m~ti>i RESTRICTED^TA This document contains restricted data a% defined in the Atomic Energy Act of 1954. Its transmittal or the disclosure of its contents in any monner to an unauthorized person is prohibited. glk aiy |MK Study for 250-Watt Controlled Reentry Orbiting NUclear Systel yw^D-^'So-F- 2 (VOLUME wc CONFIDENTTXL

Welcome message from author
This document is posted to help you gain knowledge. Please leave a comment to let me know what you think about it! Share it to your friends and learn new things together.
Transcript

^
. ^ ^
CONFIDENT!^ S
INCLASSIFIEDI
CRONUS Control led Reentry Orbi t ing NUclear System
i\^./^m~ti>i
RESTRICTED^TA This document contains restricted data a% defined
in the Atomic Energy Act of 1954. Its transmittal
or the disclosure of its contents in any monner to
an unauthorized person is prohibited.
g l k a i y |MK
Study for 250-Watt Controlled Reentry Orbiting NUclear Systel
yw^D-^'So-F- 2 ( V O L U M E II
wc CONFIDENTTXL

DISCLAIMER
This report was prepared as an account of work sponsored by an agency of the United States Government. Neither the United States Government nor any agency Thereof, nor any of their employees, makes any warranty, express or implied, or assumes any legal liability or responsibility for the accuracy, completeness, or usefulness of any information, apparatus, product, or process disclosed, or represents that its use would not infringe privately owned rights. Reference herein to any specific commercial product, process, or service by trade name, trademark, manufacturer, or otherwise does not necessarily constitute or imply its endorsement, recommendation, or favoring by the United States Government or any agency thereof. The views and opinions of authors expressed herein do not necessarily state or reflect those of the United States Government or any agency thereof.

DISCLAIMER Portions of this document may be illegible in electronic image products. Images are produced from the best available original document.

/^gdr^
UNCLASSIFIEO
C-92A Distribution M-3679 (48th Ed.)
AEC Research and Development Report
CRONUS Controlled Reentry Orbiting NUclecr System
•DV ^
Study for 250-Wat t
Controlled Reentry Orbiting NUclecr System
This States
A racy, of an priva
£ use o
A ployei such dissei with t
- N O T I C E -This report was prepared as an account of v/otk sponsored by the United States Government. Neither the United States nor the United States Atomic Energy Commission, nor any of their employees, nor any of their contractors, subcontractors, or their employees, makes any warranty, express or implied, or assumes any legal liability or responsibility for the accuracy, completeness or usefulness of any information, apparatus, product or process disclosed, or represents that its use would not infringe privately owned rights.
RESTRteTED This documen&E(^|9*»S^Vestr icted data a s defined in the Atomic Energyt^BiCTof 1954. Its tr a n s m i t t a l o r the d i s c lo su re of i ts contents n any manner to an unauthorized person is prohibi ted .
C i r o u p 1
E x c l u d e d f r o m a u t o m a t i c r e g r a d i n g ,
accu-le use Fringe
' em-t that rares, itract
VOLUME II APPENDICES
S P E C I A L l-r R E V I E W
D E T E H M I W A T I O N Class: L\
Reviewer Class. Date
MAnriN COMPANV BALTIMORE, MARYLAND 21203
November 2, 1966
MND-2050-F-2(y«i^^^
IHSra»«T»N Of ffiiS DOCUMENT IS W ! ^
UNQM\saFlfPI

LEGAL NOTICE
This report was prepared as an account of Government sponsored work. Neither the United States, nor the Commission, nor any person acting on behalf of the Commission:
A. Makes any warranty or representation, expressed or implied, with respect to the accuracy, completeness, or usefulness of the information contained in this report, or that the use of any information, apparatus, method, or process disclosed in this report may not infringe privately owned rights; or
B. Assumes any liabilities with respect to the use of, or for damages resulting from the use of any information, apparatus, method, or process disclosed in this report.
As used in the above, "person acting on behalf of the Commission" includes any employee or contractor of the Commission, or employee of such contractor, to the extent that such employee or contractor of the Commission, or employee of such contractor prepares, disseminates, or provides access to, any information pursuant to his employment or contract with the Commission, or his employment with such contractor.
..^ ... . . ^..JVSNp-gg-SQ-F-a *

FOREWORD
The United States Atomic Energy Commission awarded the Mart in Company Contract AT (29-2)-2050 for a six-month study, effective May 2, 1966, to develop and evaluate a feasible concept(s) for a 250-watt(e) radioisotopic t he rmoe lec t r i c genera tor providing controlled intact~reentry of the fuel from ear th orb i t . A concept{s) for handling and fueling the RTG at a Titan III launch site was also to be developed and evaluated. Based upon the selected sys tem concept, a development p rogram plan was to be p repared , including es t imated cos ts , for the design, development, flight tes t and del ivery of operationally flight qualified hardware s y s t e m s .
The flight and ground sys t ems have been integrated by Martin into a single sys tem concept designated CRONUS, an abbreviation for Cont ro l led Reent ry Orbiting NUclear System. Major CRONUS sys tems include the 250-watt(e) g e n e r a t o r / r e e n t r y body ( R T G / R B ) , the controlled intact r e en t ry (CIR), and requ i red ground support (AGE) sys tems which include fuel loading (GHE).
The following is a complete l is t of the documents p repared and submit ted in accordance with Contract AT (29-2)-2050.
Volume I - - S u m m a r y
Volume I I - -Technica l
Volume II--Appendices
Volume III--Development P r o g r a m Plan
Volume IV--Specifications and Data Management
Volume V--Budgeta ry Es t ima te
Volume VI--Quali ty Assurance Plan

• •••
o
• •••
I
f
©:i=
• •
••
!•• •
• t3d

CONTENTS
Page
Legal Notice ii
Foreword iii
Contents v
A. Ba re Heat Source T e m p e r a t u r e Calculation 1
B. Steady State Fuel Capsule Tempera tu re 5
C. RTG/RB The rma l Analysis 9
D. Fuel Capsule The rma l Shock Analysis 59
E. Fuel Capsule S t ruc tura l Ana lys i s - -Ex te rna l P r e s s u r e Capability 61
F . Fuel Capsule Impact Analysis 69
G. Radiator S t ruc tura l Analysis with Respect to Blast O v e r p r e s s u r e . . . . . . . 71
H. The rma l Efficiency Analysis 73
I. The rma l Insulation Conductivity Data 75
J. The rmoe lec t r i c Data and Integrated Averages 83
K. Capsule-Surface T e m p e r a t u r e P a r a m e t r i c Study 95
L. SiGe V e r s u s PbTe RTG Compar ison I l l
M. Sampled Per turba t ion Theory 123
N. Absorption Fac to r s 137
O. Descript ion of Martin T-Cap-II I Thermo-Chemica l
Ablation P r o g r a m 141
P . Dispers ion Analysis 145
Q. The rmoe lec t r i c Analysis 157
R. Beginning-of-Life E l ec t r i ca l Cha rac t e r i s t i c s 167
MND-»205O-?FT2 •• : : • ' • •• : :

CONTENTS (continued)
Page
S. Segmented The rmoe lec t r i c Subsystem 175
T. In ternal Capsule P r e s s u r e Buildup Analysis 181
U. Cascaded The rmoe lec t r i c System 189
V. Power Conditioning for Peak Loads 207
W. Derivation of Cascaded Efficiency Express ion 221
X. Capsule T e m p e r a t u r e - T i m e History for Pu-238 227
Y. Aerodynamic Coefficients and P r e s s u r e Dis t r ibut ions . . . . 237
Z. Launch Pad F i reba l l Data 253
AA. Analytical Es t ima tes of Tumbling and Osci l la tory
Motions of CRONUS Reentry Body 267
BB. Guidance Control C h a r a c t e r i s t i c s 281
CC. S ix -Degree -o f -F reedom Stability P r o g r a m 305
DD, Propuls ion Analysis 329
EE . Micrometeoroid Penet ra t ion Probabi l i ty 337
F F . SGLS Descript ion 341
GG. Hydrosta t ic Gas Bear ing Analysis 351
HH. Reentry Tra jec to r i e s 359
II. Abort and Impact Area Control 379
J J. Reentry Heating Analysis 393
KK. Separat ion and Deorbit Stabilization 405
LL. Velocity Impulse Requi rements 415
MM. Dynamic Reentry Analysis 427
NN. Te rmina l Velocit ies 434
i
: : :• : ' : • • MN.D^205O^-.F.-2

CONTENTS (continued)
Page
GO. Relative Motion of the Umbilical Tower and
Launch Vehicle 438
P P . Idealized GHE Concepts 443
QQ. Structural Analysis S tud ies - -Ai rborne Systems 485
MND.,205G-F.-2..
Wtii

$
46 »
..
.I
...I
td
> •
•
^ 5"
-

APPENDIX A
BARE HEAT SOURCE TEMPERATURE CALCULATION
An analysis was performed to predict average heat source surface t empera tu re in a i r with natural convection and radiat ion. This condition will approximate that exis tent on the launch pad pr ior to fueling but after r emova l of the heat source from the shipping cask.
Also, this heat source surface t empe ra tu r e can be used l a te r as an initial condition for predict ing t rans ient genera tor behavior on the pad following inser t ion of the heat source into the RTG.
The heat source average surface t empera tu re with natural convection and radia t ion is descr ibed by the following equation:
q = CTeA (T^ - e^) + h A (T - e) c
0.59 k , h^ = - ^ ^ (Gr Pr)J/4
where
q = beginning-of-life fuel inventory = 23, 500 Btu/hr
CT = Stefan-Boltzmann constant 2
A = l a t e r a l a r e a of heat source = 6.15 ft
6 = ambient t empera tu re = 100° F
T = average surface t empera tu re of heat source
h = na tura l convection heat t r ans fe r coefficient c 2
( laminar flow in this case) (Btu/ft -h r - °F)
k = a i r t h e r m a l conductivity at film tempera tu re
(i. e . , average between T and e ) (Btu/f t -hr-°F)
e = heat source emiss iv i ty = a var iable
Gr = Grashof number
P r = Prandt l number
L = fuel capsule height = 1 . 0 5 feet
conncicMTij^iii MND.-:^0-5prPT2-

:' tONriDizr JTIJM
1000
fe
u 3
-H oi U tu
a
a H (1) o :3
en
to a oi
U
900
8 0 0 -
700
ambient Heat source d iameter = 22, Capsule height = 12. 5 in.
5 in.
0 .4 0 .5 0.6 0,7 0 .8 Capsule Surface Emiss iv i ty (dimensionless)
0.9
Fig. A-1, Capsule Surface Temperature Versus Emissivity in Air
.- M'I^Q-2j0gre-:ii:-2

The solution, obtained by the Newton-Raphson technique, is presented in Fig. A-1 as a function of emissivity.
A heat source emissivity of 0. 80 is expected. From Fig. A-1, for combined radiation and natural convection, the resultant average steady-state temperature in air will be approximately 775° F.
»MND-a050.-F-2. - •.

i -»K
o
^
...^
O
I ;
o
:: 'f

APPENDIX B
STEADY STATE FUEL CAPSULE TEMPERATURE
For steady s ta te conditions, capsule t empera tu re can be computed by a hand calculation at both beginning and end of life. At end of life, capsule t empe ra tu r e was computed for normal operation only. At be ginning of life, capsule t e m p e r a t u r e s were computed for both normal operation and open c i rcui t conditions.
A. CASE I: BEGINNING OF LIFE--NORMAL OPERATION
At the beginning of life, the hot junction tempera ture is 1590°F (Chapte r III). Since the A T through the hot shoe will be 50°F, the maximum hot shoe t empera tu re will be 1640°F. The resul tant capsule surface t empera tu re due to radiat ive heat t r ans fe r is given by:
1/4
cap
where
F 12
a
T
UBOL (^12
oA^
+ + A2 ^ )
+ T shoe
q = beginning-of-life fuel inventory = 21,850 Btu /hr
shoe
= view factor from capsule to shoe = 1
= capsule reflectivity = 0 . 2
= shoe reflectivity = 0 . 2
= capsule emiss iv i ty = 0 . 8
= shoe emiss iv i ty = 0 . 8 2
= heat source l a t e r a l a r e a = 6.15 ft 2
= hot shoe a r ea = 7.0 ft
= Stefan-Boltzmann constant
= shoe t empera tu re = 1640° F = 2100° R
CONriDENTIAI^ • « w • • • • • • «
MNp.?e50-F-3:
The resu l t is
T = 2180° R = 1720° F . cap
This capsule t e m p e r a t u r e applies to the surface exposed to the hot shoes .
With the present heat source configuration, a t empe ra tu r e gradient exis ts c i rcumferent ia l ly around the capsule wall to the hot spot at the midline on the back wall . This AT can be approximated by a hand ca l culation for Phase 0. In Phase I, r e c o u r s e should be taken to the digital computer for this t h e r m a l ana lys i s .
The following assumpt ions a r e made for the hand calculat ion:
(1) The front surface of the capsule as " seen" by the hot shoes is i so the rma l .
(2) All the heat is t r ans f e r r ed uniformly from the fuel into the capsule wall . The heat on the back surface of the capsule is then conducted to the front sur face . This assumption effectively allows no contribution from heat flow through the fuel. This model is somewhat conservat ive as the conductance of the capsule is about an o rde r of magnitude higher than the conductance of the fuel.
With these assumpt ions
SL^ AT = ^ ^ = 67° F where
S = ^ ^ V
AT = delta t empe ra tu r e between i so the rmal front surface of capsule and back midline
q = beginning-of-life fuel inventory per capsule = 178 watts 3
V = fuel capsule side wall volume = 6 in. (corresponds to a wall th ickness of ~90 mils on a 1. 75-inch OD; capsule length is 12 .5 inches)
L = path length for heat flow (quarter a r c of capsule inches = 1. 3 inches)
K = Haynes-25 conductivity at 1700° F = 15.9 B tu / f t -h r - °F
Thus, the maximum back wall t empera tu re is 1787° F .
COI^riDENTlM MWD7'2050-P-:2:"
• • • «

B . CASE II: BEGINNING O F L I F E - - O P E N CIRCUIT
In the even t of an open c i r c u i t in the RTG e l e c t r i c a l c i r c u i t ( such a s could o c c u r when the r e e n t r y v e h i c l e is s e p a r a t e d f r o m t h e s p a c e c r a f t p r i o r to r e e n t r y ) , h i g h e r hot j u n c t i o n and c a p s u l e t e m p e r a t u r e s o c c u r b e c a u s e of the l o s s of P e l t i e r coo l ing (a c u r r e n t dependen t effect) in the t h e r m o e l e m e n t s . On open c i r c u i t , t he r e s u l t a n t s t e a d y - s t a t e hot j unc t ion t e m p e r a t u r e can be d e t e r m i n e d f r o m the fol lowing h e a t b a l a n c e on the t h e r m o e l e m e n t s :
w h e r e
„ • . • - , . ^ a r 610 w a t t s o a r ^ p a r a s i t i c c o n d u c t a n c e « - ^ = 1450.5500 p =
2 . 3 B t u / h r . -°F p a r
NA N n u m b e r of c o u p l e s x N - e l e m e n t a r e a „ nn i? ^
~ ^7—1 n — z ^ - 4 . 00 feet jfp^ N - e l e m e n t l e n g t h
NA P _ n u m b e r of c o u p l e s x P - e l e m e n t a r e a 9 4c f +
i p P - e l e m e n t l eng th ~ ^ . ^ a t e e t
'^-ar\j ~ b e g i n n i n g - o f - l i f e fuel i n v e n t o r y of 6420 w a t t s = 2 1 , 8 5 0 ^^^ Btu/hr
T„ = open circuit cold junction temperature at beginning of ^ life = 590° F
Kp, K = integrated average thermal conductivity on the P and ^ N thermoelements = 2.68 Btu/ft-hr-°F, 2.26Btu/ft-
hr-°F, respectively
T = hot junction open circuit temperature at beginning of " life
The steady-state solution is T„ = 1795° F.
As in the previous case, the AT through the hot shoe is 50° F so that Tgj g = 1845° F = 2305° R.
COMriDQJThM
• • • • • • • f •• • • • •
• ••• ••
The resul tan t capsule t empera tu re is given by
cap a A, + T
shoe
1/4
2370°R = 1910°F
Since the c i rcumferent ia l AT from the front wall to the back wall on the capsule is 67° F, the maximum back wall capsule t empe ra tu r e under open c i rcui t conditions is 1977° F .
C. CASE III: END O F LIFE--NORMAL OPERATION
At end of life (design point), capsule t empera tu re is given by
' i B O L l F i a ^ ^ "" A2^2> T
cap + T
a A, = 2040°R = 1580°F
where
"^EOL ^ end-of-life fuel inventory = 5660 watts = 19,300 Btu /hr
T , = 1495° F shoe
At the end of life, the c i rcumferent ia l AT to the back wall is ~ 60° F so that the maximum back wall t empe ra tu r e is 1640° F .
C0NriD:rjThM.i • • • M^p-ISO^Or^-?:;

APPENDIX C
RTG/RB THERMAL ANALYSIS
A. INTRODUCTION AND SUMMARY
Trans ient and s teady-s ta te t he rma l analyses were performed on the genera tor sys t em with an IBM 1130 digital computer . In par t i cu la r , the following conditions were examined to establ ish feasibility and /o r aid in the rad ia to r design:
Investigation
Steady s tate in orbit ; end of life; normal operat ion of the the rmoe lec t r i c module
Steady s tate in orbit ; b e ginning of life; open circui t operat ion of the t h e r m o e lec t r i c module
Reentry (descent) using flight path angles of - 8 , - 0 . 1 and -2 degrees coupled with separa te hea t ing r a t e s on the forward, middle and aft s ec to r s of the rad ia to r
F i reba l l (entire genera tor sys tem and individual fuel capsule)
Purpose
To es tabl ish rad ia to r charac ' t e r i s t i c s
Resultant t empera tu re p r o file s e r v e s as worst case init ial conditions for the r e e n t r y
Feasibi l i ty (of par t icular concern a r e the maximum t empera tu r e s that resu l t on the rad ia to r and the fuel capsule)
Examine capsule integrity
These studies a r e presented in the following. The conclusions of these numer ica l analyses a r e :
(1) The reference genera tor sys tem will survive the intense reent ry heating even when the descent is initiated from the wors t case initial condition in o rb i t - - tha t of an open-ci rcui ted
• •• • • • :MND-.2Q50-F-2:
i.= =:. =.€a*©iN«M
generator at beginning of life. For the selected system, the most severe flight path angle was the -0.1 degree. In this particular case, the hot spot on the capsule ( i .e . , the back wall) reached a maximum of 2050° F at time of impact, 2100 seconds, while the extremities of the conical shell radiator (beryllium) reached a maximum of 1424° F at 1700 seconds.
As a general conclusion, capsule temperature rose 12°, 30° and 70° F for flight path angles of -8, -2 and -0,1 degrees, respectively.
(2) Both an entire generator system and an individual fuel capsule will survive the expected 16-second Titan fireball.
B. THERMAL MODEL
All transient and steady-state thermal analyses on the generator system were performed with the IBM 1130 digital computer using the sampled perturbation theory (Appendix M). Figure C-1 is a schematic of the 15-node thermal model used in these studies. Also shown in the figure are the dimensions finally selected for the system.
Node 1 in the figure is the ablator section of the spacecraft. Nodes 2, 3, 4, 5 and 6 are those which comprise the radiator section of the system with Node 4 as the center section of the radiator and attached directly to the thermoelectric elements in the system. Nodes 2, 3, 5 and 6 are considered as truncated conical shells of equal length. Node 4 is in conductive contact with Node 13 (thermoelectric elements). Node 11 (insulation between the hot shoes and radiator) and Nodes 3 and 5.
The forward section of the model (cross hatched area in Fig. C-1) is insulated sufficiently that heat transfer between the ablator (Node 1) and other nodes in the generator system is negligible.
Internal radiative interchange is provided in the aft section from Nodes 5 and 6 to Nodes 7 and 14 as well as between Nodes 7 and 14.
The isotope is represented by Node 8 which is conductively coupled with the capsule. Node 9. The hot shoes are represented by Node 10 which is coupled to the capsule by radiative heat transfer only. Nodes 9 and 10 are approximated by concentric cylinders, each radiating with an emissivity of 0.8. Although the hot shoe node is taken as one node, there are many hot shoes in the system that are lumped into this single node. This approach does not affect the thermal balance to an appreciable extent as long as the true area of all hot shoes is encompassed in
i co^J^D:^jTlAL
:•. :•• .-. :MND.-*20^a-:P-2:" :•. • • • • • • • • • • • • • • • • • • • • • • • • • • • 1 (I , , , , , ,

•••rz:
• • • t c
: v
• i :«<s5
1 2, 3, 4, 5, 6 7 8 9
Ablator Radiator Aft cap Fuel Capsule
10 11 12, 14 15
13
Hot shoe Module insulation Thermoelements Heat source insulation Space
Fig. C-1. Thermal Model Under Consideration
this lumped node sys t em. Nodes 12 and 13 a r e the t he rmoe lec t r i c e lements within the sys tem and a r e conductively attached to the hot shoes (Node 10) on one end and the rad ia to r (Node 4) on the other end and surrounded by insulation (Node 11). Once again. Nodes 12 and 13 a r e a lumped represen ta t ion of al l the the rmoelec t r i c e lements within the sys t em. Two nodes were used to allow for proper ty var ia t ions through the e l emen t s . Node 14 is the heat source insulation. Node 15 is the environment node whether it is in space or the a tmosphere .
Table C-1 shows the t he rma l p roper t i es associa ted with the nodes for both beginning- and end-of-life conditions. Note that the t h e r m a l conductivity on the rad ia to r nodes va r i e s according to the approximate s teady-s ta te t e m p e r a t u r e s found for the respec t ive node when in orbit condit ions. The t he rma l conductivity of Node 7 (the back sect ion of the genera tor ) was minimized in o rde r that heat t r anspor t by conduction between Nodes 7 and 6 would be sma l l and that the main mode of heat t r ans fe r would be by radia t ion. All ex te r ior nodes in the sy s t em were assumed to have an emiss iv i ty of 0 .8 5 by virtue of a coating.
C, BEGINNING-OF-LIFE
The beginning-of-life s teady-s ta te condition under open c i rcu i t is of importance in that it is used as the wors t case initial condition for the t rans ien t reen t ry heating of the sys tem.
This s teady-s ta te orbi t condition was investigated on the 1130 IBM computer with the genera tor sys tem the rma l model . Fo r this analysis solar , solar reflected and t e r r e s t r i a l heat inputs were not cons idered since it is a reasonable f i r s t approximation to neglect them due to the high t empera tu re operat ion of a SiGe system (provided a low opt ica l -wavelength coating is used on the beryl l ium radia tor ) .
The beginning-of-life t empera tu re profile se rves as the initial t e m pe ra tu re condition for the descent . In addition, it was conservat ively assumed that at the time of separat ion, the nature of the separat ion was such that an open c i rcui t* jvas produced on the module. (If it had been neces sa ry , a shorting plug could have been introduced into the gene ra tor design so that, with a ce r ta in rel iabi l i ty, open c i rcu i t would not be poss ib le , )
*By definition, an open circui t involves zero cur ren t and, the re fore , zero Pe l t i e r cooling. The net r e su l t is that hot junction and capsule t e m p e r a t u r e s a re 200° F higher than with a module under no rma l load.
CONriDEI JTIAL
12
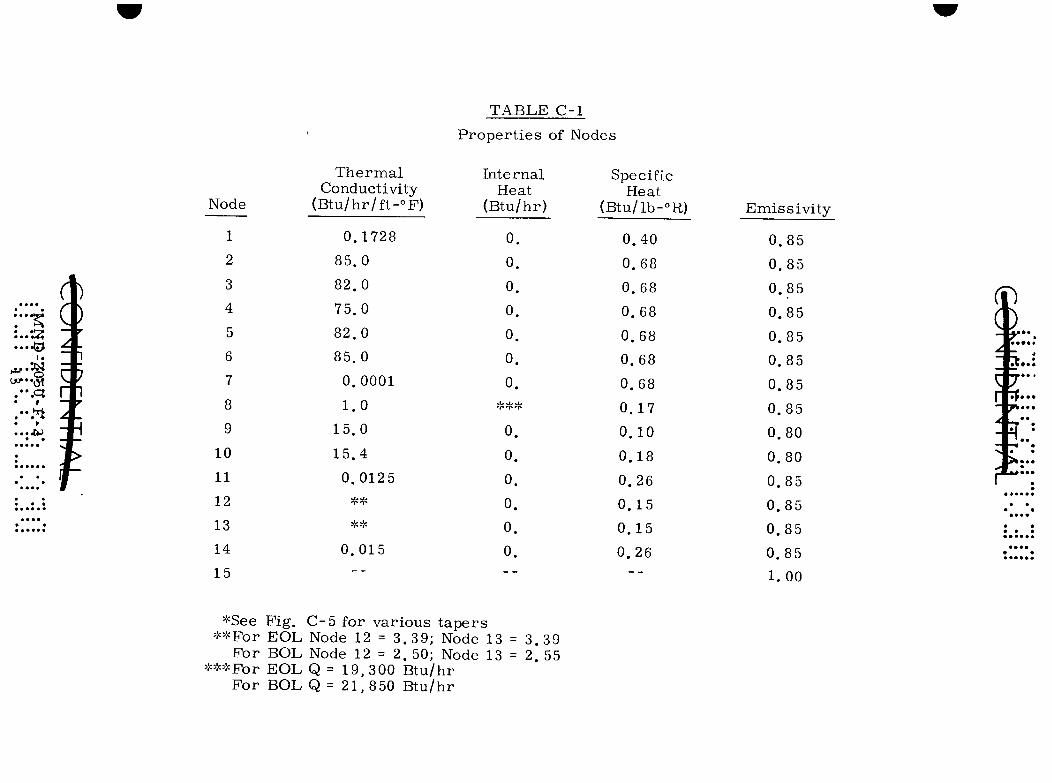
T A B L E C-1
P r o p e r t i e s of Nodes
Node
1
2
3
4
5
6
7
8
9
10
11
12
13
14
15
*See * * F o r
F o r • • • F o r
F o r
T h e r m a l Conduc t iv i ty
( B t u / h r / f t - ° F )
0 . 1 7 2 8
8 5 . 0
8 2 . 0
7 5 . 0
8 2 . 0
8 5 . 0
0 . 0 0 0 1
1.0
1 5 . 0
1 5 . 4
0 . 0 1 2 5
• •
0 . 0 1 5
I n t e r n a l Hea t
( B t u / h r )
0.
0.
0.
0.
0.
0.
0. > , - * > , < . - , • »
0.
0.
0.
0 .
0.
0 . _ _
F i g . C - 5 for v a r i o u s t a p e r s E O L Node 12 = 3 . 3 9 ; Node 13 = 3 . 3 9 BOL Node 12 = 2 . 50; Node 13 = 2 . 55 E O L Q = 1 9 , 3 0 0 B t u / h r B O L Q = 2 1 , 8 5 0 B t u / h r
Speci f ic Heat
( B t u / l b - ° R )
0 . 4 0
0 . 6 8
0 . 6 8
0 . 6 8
0 . 6 8
0 . 6 8
0 . 6 8
0 . 1 7
0 . 1 0
0 . 1 8
0 . 2 6
0 . 1 5
0 . 1 5
0 . 2 6 — _
E m i s s i v i t y
0 . 8 5
0 , 8 5
0 . 8 5
0 . 8 5
0 . 8 5
0 . 8 5
0 . 8 5
0 . 8 5
0 . 8 0
0 . 8 0
0 . 8 5
0 . 8 5
0 . 8 5
0 . 8 5
1.00
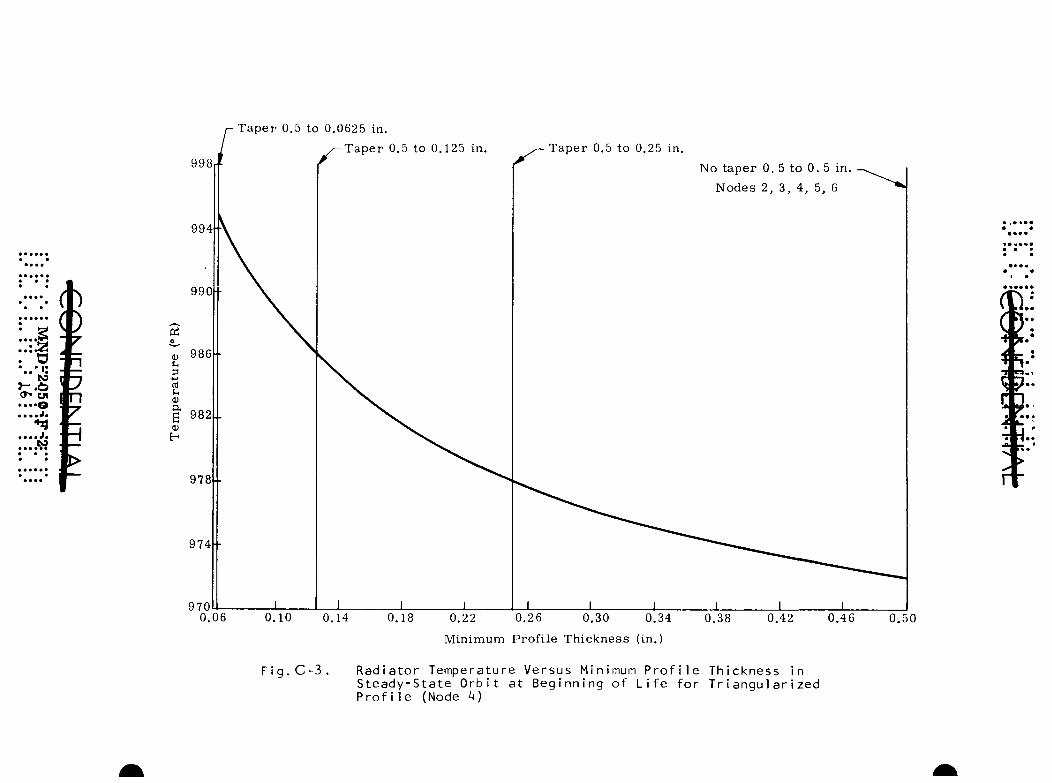
Figures C-2, C- 3 and C-4 show the r e su l t s of the s teady-s ta te beginning-of-life conditions as a function of the t ape r s cons idered . Figure C-2 graphs Nodes 2, 3, 5 and 6 on the r ad ia to r , showing a gene r a l dec rease in the t e m p e r a t u r e s of Nodes 3 and 5 as the t aper d imini shes , whereas Nodes 2 and 6 show a r i s e as the taper d iminishes . Figure C- 3 is a graph of Node 4 as a function of t e m p e r a t u r e , showing a decreas ing t empe ra tu r e as t aper d imin ishes . The leas t affected nodes, 8 and 9 (fuel and capsule) a r e shown in Fig. C- 4 and show, as expected, a slight drop in t empera tu re as the taper d imin ishes .
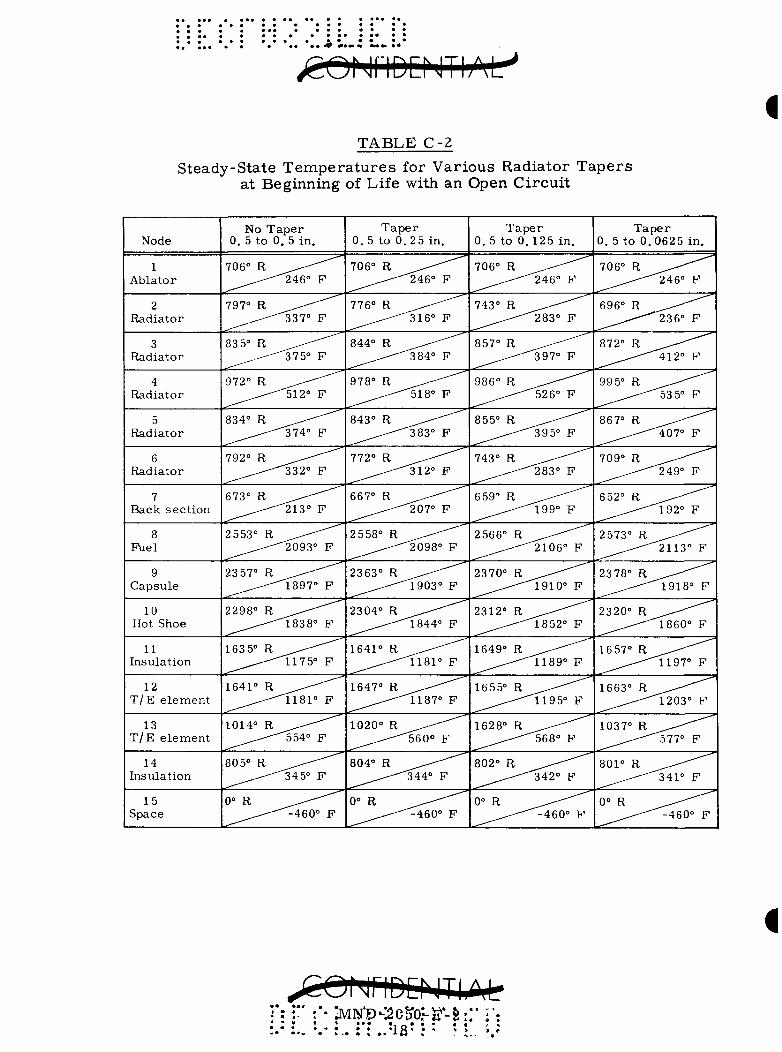
In tabular form, the r e su l t s for the ent i re 15-node problem a re p r e sented in Table C-2.
Again, it is noted that the re is only one design set of t empera tu re s , and the differences that a r e apparent in F igs . C-2, C- 3 and C- 4 r e sult from the different t ape r s studied. Thus, al l t e m p e r a t u r e s in F igs . C-2, C- 3 and C- 4 a r e nominal and should definitely be adjusted to a common base (the design point). The effect on capsule t empera tu re (Fig. C- 4 ) and on the r e su l t s obtained la te r in the descent study is not important , however, and therefore this adjustment was not made . For accura te capsule t empe ra tu r e at beginning of life (and for other conditions) reference is made to Appendix B. The r e su l t s do agree favorably.
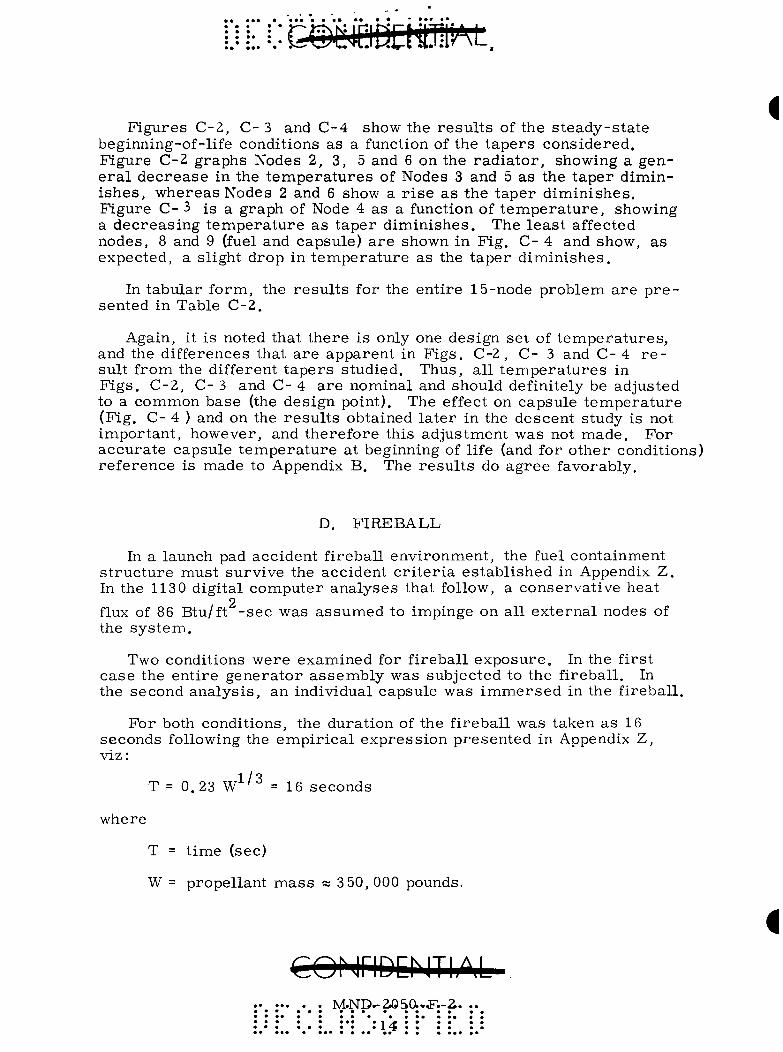
D. FIREBALL
In a launch pad accident f ireball environment, the fuel containment s t ruc tu re must survive the accident c r i t e r i a es tabl ished in Appendix Z . In the 113 0 digital computer analyses that follow, a conservat ive heat
2 flux of 86 Btu/ft - sec was assumed to impinge on all external nodes of the sys t em.
Two conditions were examined for f i rebal l exposure . In the first case the ent i re genera tor a ssembly was subjected to the f ireball . In the second ana lys is , an individual capsule was i m m e r s e d in the f i rebal l .
For both conditions, the duration of the f i rebal l was taken as 16 seconds following the empi r i ca l express ion presented in Appendix Z, viz:
1/3 T = 0.23 W ' = 16 seconds
where
T = t ime (sec)
W = propellant m a s s a 3 50, 000 pounds.
i
CQMriDEMTIAL M.Np.-2«S0t-J'.-Z.
• • • • • ••

K
0 ) S-,
a g 0)
840 •
800
7 6 0 -
720..
680 0.06
Tape r 0.5 to 0.0625 in.
-Taper 0.5 to 0.125 in Taper 0.5 to 0.25 in. No t ape r
0.10 0.14 0.18 0.22 0.26 0.30 0.34
Minimum Profile Thickness (in.)
0,38 0,42 0.46 0.50
Fig, C-2, Radiator Temperature Versus Minimum Profile Thickness in Steady State Orbit at Beginning of Life for Triangularized Profile
/
Taper 0.5 to 0.0625 in.
Taper 0.5 to 0.125 in
970 0.06
Taper 0.5 to 0.25 in.
No taper 0. 5 to 0. 5 in.
Nodes 2, 3, 4, 5, 6
0.10 0.14 0.18 0.22 0.26 0,30 0,34
Minimum Profile Thickness (in.)
0.38 0.42 0.46 0.50
Fig.C-3. Radiator Temperature Versus Minimum Profile Thickness in Steady-State Orbit at Beginning of Life for Triangularized Profile (Node h)

K
ID U
nj U (U
a
Taper 0.5 to 0.0625 in.
2600r-
^ T a p e r 0.5 to 0.125 in. ^ Taper 0.5 to 0.25 in. No t a p e r — 0 . 5 to 0, 5 in . Nodes 2, 3 , 4, 5, 6
2500-.
2400. .
2300 0,06 0,10 0,14 0,18 0,22 0,26 0,30 0,34
Minimum Profile Thickness (in,)
0,38 0,42 0,46 0,50
Fig, C-4, Fuel and Capsule Temperatures Versus Minimum Profile Thickness in Steady-State Orbit at Beginning of Life for Triangularized Profile
^CeNflDQJThM-^
TABLE C-2 Steady-State Temperatures for Various Radiator Tapers
at Beginning of Life with an Open Circuit
Node
1 Ab la to r
2 Rad ia to r
3 Rad ia to r
4 Radia tor
5 Rad ia to r
6 Rad ia to r
7 Back s e c t i o n
8 Fuel
9 Capsu le
10 Hot Shoe
11 Insula t ion
12 T / E e l e m e n t
13 T / E e l e m e n t
14 Insula t ion
15 Space
No T a p e r 0. 5 to 0, 5 in .
706° R ^^--"^^ ^ ^ . , . , - - ^ 4 6 ° F
797° R ^^^^^^^ ^ ^ , , - - - - ^ 3 7° F
83 5° R ^^.^-"^^^ ^ ^ , , - - - - ^ 7 5 ° F
972° R ^^--^^^ ^ ^ , , . , - - ' ^ 1 2 ° F
834° R ^.^^-"'^
792° R ^ ^ - ^ ^ ^ ^ ^ . , , - - - ^ 3 2 ° F
673° R ^^-^^^^ ^ ^ , . , , - - ^ 1 3 ° F
2553° R ^ ^ ^ - ^ ^
2357° K ^^^-^^^ ^ ^ , , , - - - ^ 8 9 7 ° F
2298° K ^^^-^""^ ^ ^ . ^ - - ' ^ 8 3 8 ° F
1635° K ^^^-^'^^ ^ ^ ^ ^ ^ ^ ^ 1 7 5 ° F
1641° K ^^^^^^"^ ^ ^ ^ , - - - ^ 1 8 1 ° F
1014° R ^^..^^^^ ^ ^ , , , . . ^ ' ^ 5 4 ° F
805° R ^,^^^^^ ^ _ . ^ . - - - ^ 4 5° F
0° R ^ ^ - - ^ ' ^ ^ ^ , , . . ^ ^ ^ 4 6 0 ° F
T a p e r 0. 5 to 0 . 2 5 in.
706° R ^^•^"^"'^ ^ ^ , , - - - ^ 4 6 ° F
776° R ^ ^ ^ - ' ' ' ^ ^ ^ , , . , - - - ^ ^ 1 6 ° F
844° R ^^^---^^ ^^. , , - - - • -^84° F
978° R ^^-""'^ ^ ^ , , , - - - ^ 1 8 ° F
843° R ^ ^ ^ - ^ " " ^ ^ ^ , , - - • - - ^ 8 3 ° F
772° R ^^.^^^^^
667° R ^..^^-"^^ ^ ^ , . , — - ^ 0 7 ° F
2558° R ^^.-^-"^^ ^ ^ . , . - - - - ' ^ 9 8 ° F
2363° R ^ , , - - - - ' ' " ^ ^ ^ , . , , - - - ^ 9 0 3 ° F
2304° R ^ ^ - - - ' ' ^ " ^ ^^ , , - - - •^1844° F
1641° R ^ ^ - " - " ' ' ' ^ ^ ^ , , . . - - - ^ 1 8 1 ° F
1647° R ^ ^ - - ^ " ^ " ^ ^ ^ , ^ - - ' ^ 1 8 7 ° F
1020° K^^^-^^"^
804° R ^ ^ - - " ^ ^
0° R ^ ^ . ^ - - ' ' ^ ^ ^ - - ' ' ^ 6 0 ° F
T a p e r 0 . 5 to 0. 125 in .
706° R ^...^^'^^ ^^-^^^\^° F
743° R ^^--^^^ ^ ^ , . . - - - ^ 8 3 ° F
857° R ^ ^ ^ - " " ^ ^^ , ,^-^- ' ' ^97° F
986° R ^^^--"''^ ^ ^ , , - - ' ^ 2 6 ° F
855° R ^ . . ^ - - ' ' ' ' ^ ^ ^ , , . - - - - ^ 9 5° F
743° R ^^-"-"'^ ^ ^ . , - - - • ^ 8 3 ° F
659° R ^ . , , - - ^ ' ^ ^ _ , . , , - - ' ^ 9 9 ° F
2566° K^^.^^^^^ ^ ^ , . . - - - ' ' ^ 1 0 6 ° F
2370° R ^ ^ - " " ' ' ' ' ^ ^ , , . , - - ' ' 1 9 1 0 ° F
2312° K ^^"^'^^ ^ ^ , , - - - - ^ 8 5 2 ° F
1649° K^^-"^'"'^^
1655° K^^^^^^
1628° K ^^-^-^^ ^ ^ , , . . - - - ' ^ 6 8 ° F
802° R ^^^^^'^
0° R ^ ^ - ^ ^
T a p e r 0. 5 to 0 . 0 6 2 5 in .
706° R ^ , ^ - ^ ^ ^ ^ ^ . . , - - - - ' ^ 4 6 ° F
696° R ^^--'^^^ ^ ^ . ^ - ^ - ^ 3 6 ° F
872° R ^ ^ ^ " " ^ ^ ^ ^ - - ^ 4 1 2 ° F
99 5° R ^^•^-"""' ' '^ ^ ^ ^ , ^ - - - ^ 3 5° F
867° R ^^^^^'^ ^ ^ , , . - - - - ^ 0 7 ° F
709° R ^ , , - - - ' ^ ^ ^ ^ ^ , - - - - ^ 4 9 ° F
652° R ^ ^ - - ^ ^ ^ ^ , , . . , - - ^ 9 2 ° F
2573° K^^-"^"^^
2378° R ^ , , - ^ - " " ' ^ ^ ^ , . . , . - - ' ^ 9 1 8 ° F
2320° R ^ ^ - ^ - ' ' ^
16 57° R ^ , ^ - - ^ ^ ^ ^ , , ^ - - ^ 1 1 9 7 ° F
1663° R ^ . , . ^ ^ ^ ^ ^ , , , . ^ - • ^ 2 0 3 ° F
1037° R ^ , . . ^ - " " ' ^ '
801° R ^^^^--""^ ^ ^ , , , ^ - - - ^ 4 1 ° F
0° R ^ ^ - - ' ^ ^ ^ ^ , - - - ' ' ^ 4 6 0 ° F
>:0 f iriDD lT.U'nL' •:••• ;•• >INt)-2cKoJ-»-^:'i':

1. Genera to r System Study
This t rans ient the rmal analysis was performed pa ramet r i ca l ly using the the rmal model of the genera to r assembly es tabl ished for Phase 0 (see Fig . C-1) . Initial conditions assumed to exist on the launch pad p r i o r to the f i rebal l a re p resen ted in Table C - 3 . These initial t empera tu re s a re only es t ima tes but a re reasonable values, and expected changes should not change the conclusions.
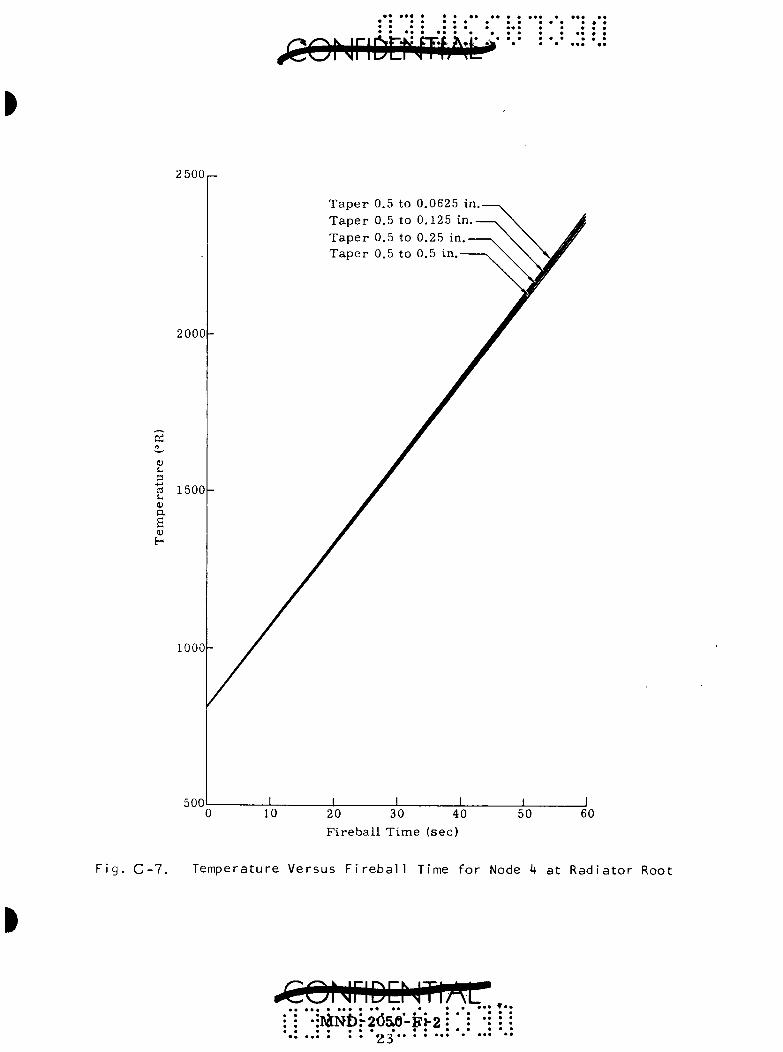
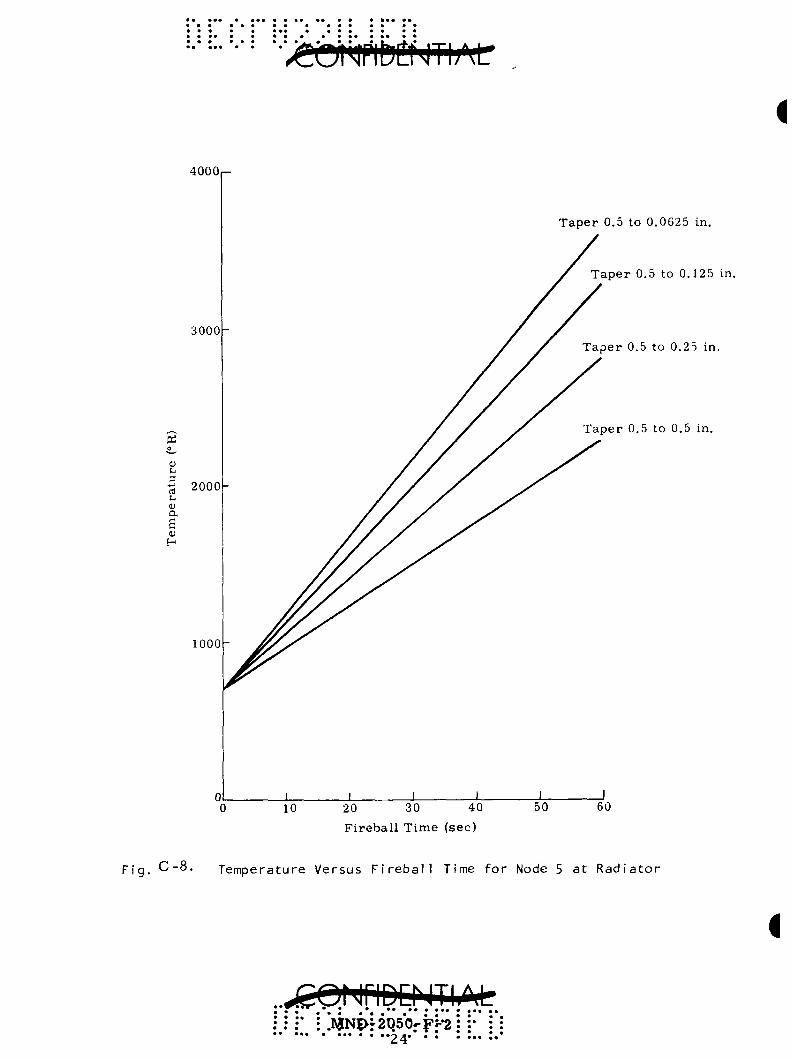
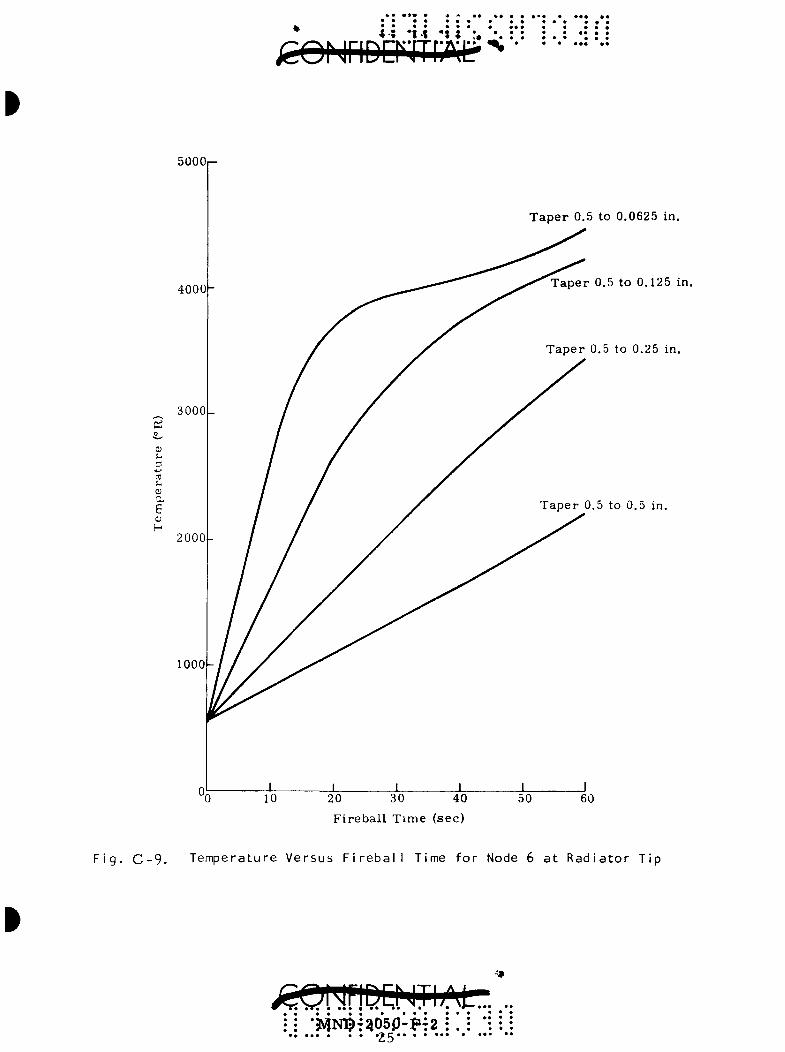
By the sampled per turbat ion theory (see Appendix M), the t e m p e r a t u r e - t ime h is tory of each node was ascer ta ined . For conserva t i sm, the ent i re genera tor was isolated in the sense that it was not allowed to r e r ad i a t e or convect to the sur roundings . The problem was run for 60 seconds although the f i rebal l l a s t s for only 16 seconds .
F r o m Figs . C- 5 to C-9 , it is seen that Nodes 2 and 6 (radiator tips) melt during the f i rebal l for the most severe taper configuration (0. 5 inch on Node 4 to 0. 062 5 inch on Nodes 2 and 6). On the other three t a p e r s , rad ia tor melt ing does not occur over the 16-second per iod.
F r o m Fig. C-10, it may be seen that the capsule is near ly unchanged from its init ial value of -1600° F because of the la rge the rma l iner t ia of the r ad i a to r . This r e sponse lag of the capsule accounts for i ts non-dependency on the configuration of the rad ia to r ( i . e . , the taper) and fur thermore is the bas is for the previous comment that an e r r o r in the initial conditions would not affect the r e su l t that the capsule does not mel t .
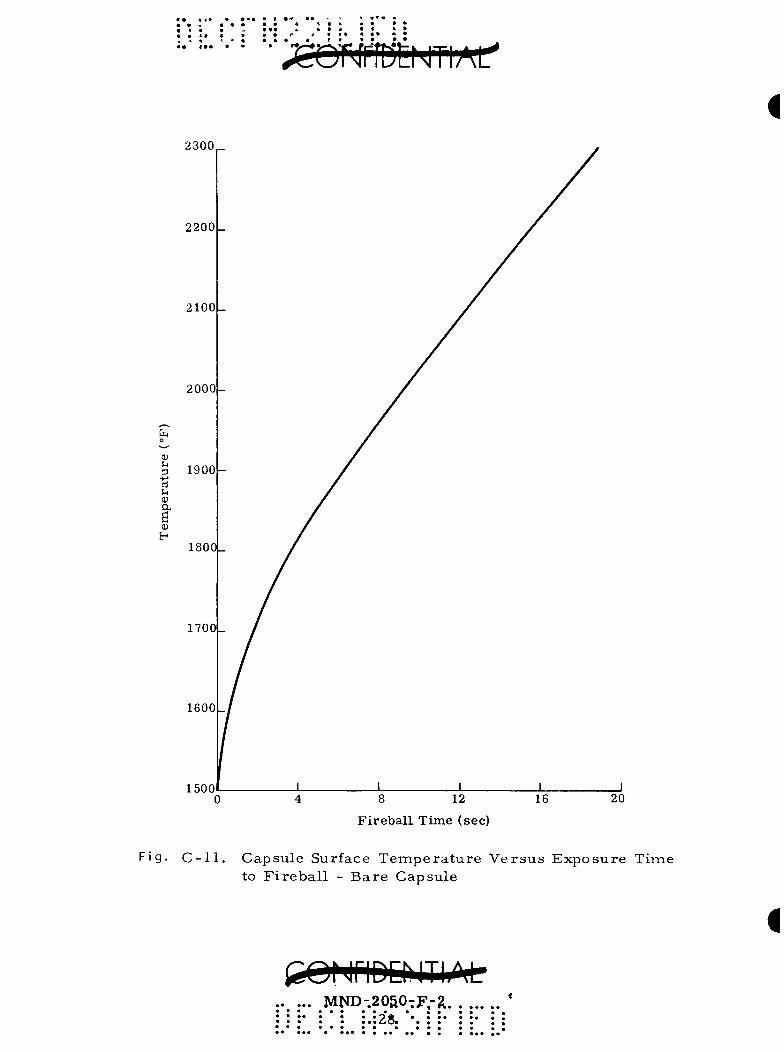
2. Capsule Study 2
As a more severe case , the heat flux of 86 Btu/ft - s ec was assumed to impinge d i rec t ly on the fuel capsule . In this case , the init ial t e m pera tu re was taken as 1500° F and the capsule emiss ivi ty was assumed to be 0 .85 . The resul tant t rans ien t behavior is presented in Fig. C-11. Capsule melt ing did not occur over the 16-second f i rebal l .
It is unlikely that an individual capsule would ever be exposed direct ly to the f ireball since the CRONUS is able to withstand the shock o v e r p r e s s u r e s and r e m a i n intact . The condition is theoret ical ly possible, however , and thus is of some in t e re s t .
.•; -MND-atJBO'-it'-z : •*: ".: :*:
i.i .:i 1 i Ma =:. v:..: ••= ••; -^
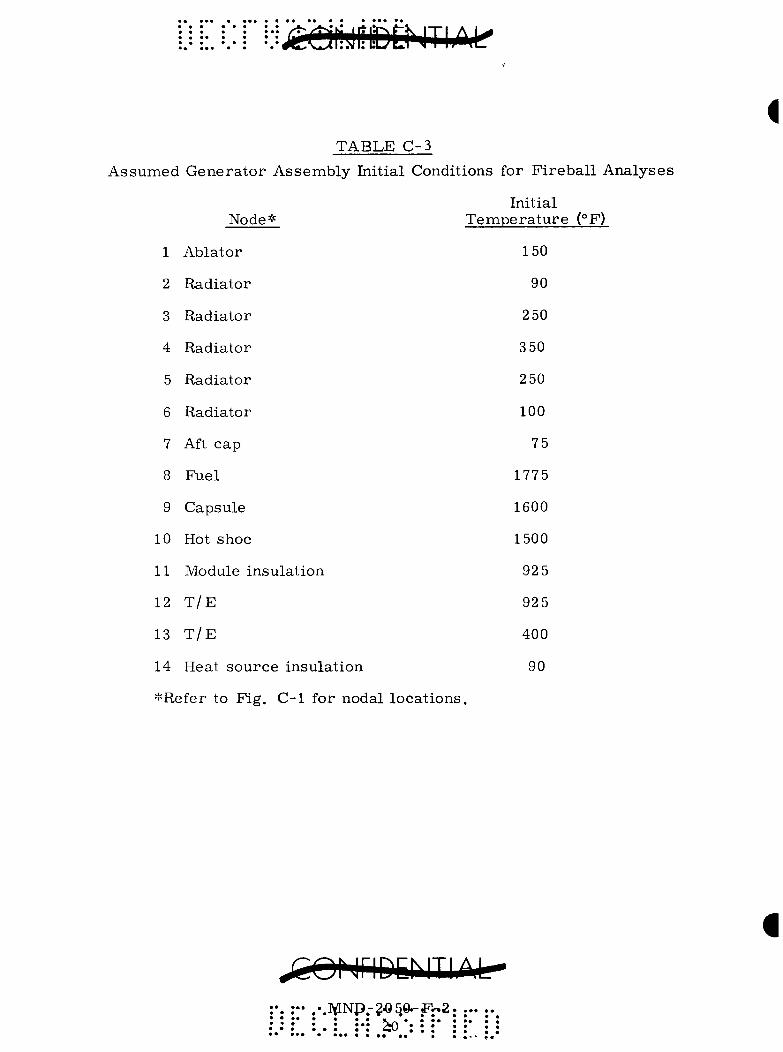
T A B L E C - 3
ned G e n e r a t o r A s s e m b l y In i t i a l Condit
N o d e *
1 A b l a t o r
2 R a d i a t o r
3 R a d i a t o r
4 R a d i a t o r
5 R a d i a t o r
6 R a d i a t o r
7 Aft c a p
8 F u e l
9 C a p s u l e
10 Hot s h o e
11 Module i n s u l a t i o n
12 T / E
13 T / E
14 Heat s o u r c e ins
*Re fe r to F i g . C-1
u l a t i on
for noda l l o c a t i o n s
ions for F i r e b a l l A
In i t i a l T e m p e r a t u r e (°F)
•
150
90
250
3 50
250
100
75
1775
1600
1500
925
925
400
90
...]ViNp.-?«^0^fr2 • • • • • ^ 4 ^ • • «
• • • • • • • »

lO.OOOi-
9 , 0 0 0 -
Tape r 0.5 to 0.0625 in.
Taper 0.5 to 0.125 in.
Taper 0.5 to 0.25 in.
Taper 0.5 to 0.5 in.
10 20 30 40 F i reba l l Time (sec)
50
Fig.C-5. Temperature Versus Fireball Time for Node 2 at Radiator Tip
jrnri ir inrh ITI ^ i ^ •>M5ff)r2i)5'Cl-F!-2
• • •••—.,• ••• « • 9 • • A ]* • • • • • • • • i% -^ •* • • •*

'jtOmW JThM* •
i
4000r
Tape r 0.5 to 0.0625 in.
Tape r 0.5 to 0.125 in.
Taper 0.5 to 0.25 in.
Taper 0.5 to 0.5 in.
10 20 30 40 F i reba l l Time (sec)
50 60
Fig. C-6. Temperature Versus Fireball Time for Node 3 at Radiator
: MND*i2650*f*-:S : • ••• • • •• •• • » •
• •• • •
^eoMriDtf mM- "'-
2 500
2000
Oi
o
^ - > OJ
o.
s H
1500
1000
500
T a p e r 0.5 to 0.0625 in.-Tape r 0.5 to 0.125 in.-Tape r 0.5 to 0.25 in. Taper 0,5 to 0.5 in.
_L 10 20 30 40
F i reba l l Time (sec) 50 60
Fig. C-7. Temperature Versus Fireball Time for Node k at Radiator Root
• • • ]\aNt)i-2<5&e-Ei-2 • • • • • • •
•'/ ©WWHWre
i
4000
3000
Di
m (^ a -^ rt u 0)
a g m H
2000
1000
Taper 0.5 to 0.0625 in.
Tape r 0.5 to 0.125 in.
Tape r 0.5 to 0.25 in.
Taper 0.5 to 0.5 in.
10 20 30 40 F i r eba l l T ime (sec)
50 60
Fig. C-8. Temperature Versus Fireball Time for Node 5 at Radiator
i
.]NjN|>r2Q50rFr-2
• • • • • • • •
• • • •
jCONriDMfAi:''^-
5000
4000-
3000 C£
0)
6 m H
2000-
1000-
Taper 0.5 to 0.0625 in.
Taper 0.5 to 0.125 in.
Taper 0.5 to 0.25 in.
Taper 0.5 to 0.5 in.
10 20 30 40 Fi rebal l Time (sec)
50 60
F i g . C - 9 . T e m p e r a t u r e Ve rsus F i r e b a l l Time f o r Node 6 a t R a d i a t o r T i p
•3VlNTj>Ta05p-pT2
':';fe€)NriDi:NTI;\r
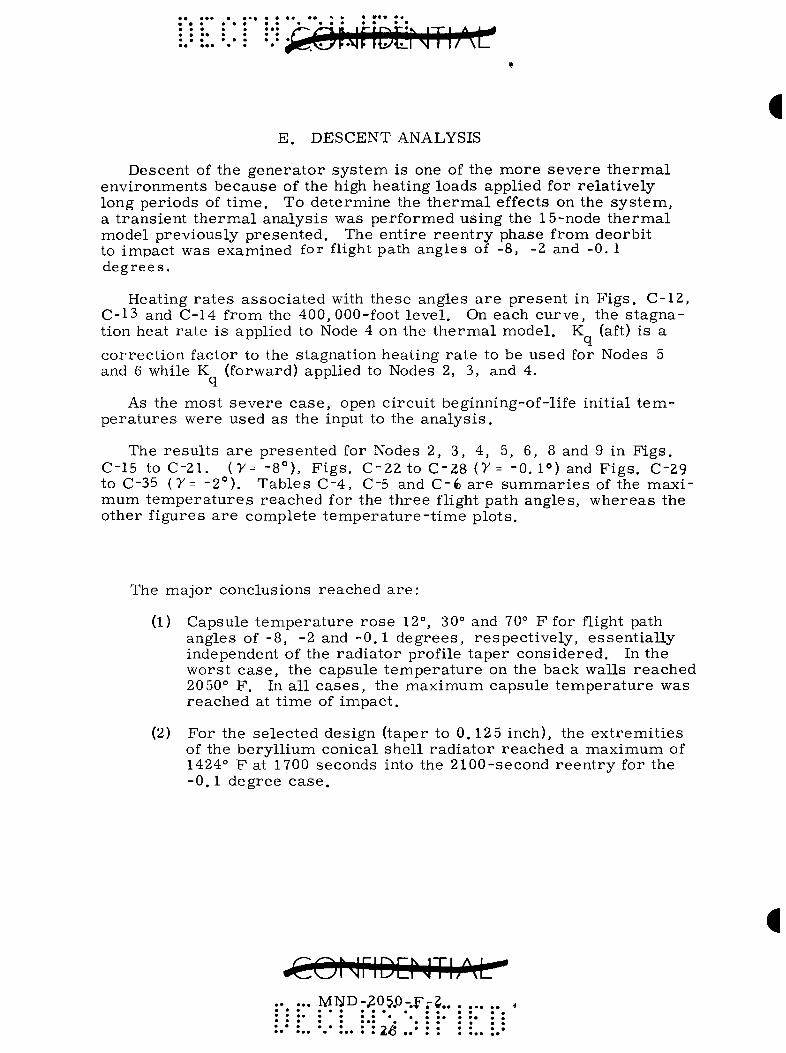
E. DESCENT ANALYSIS
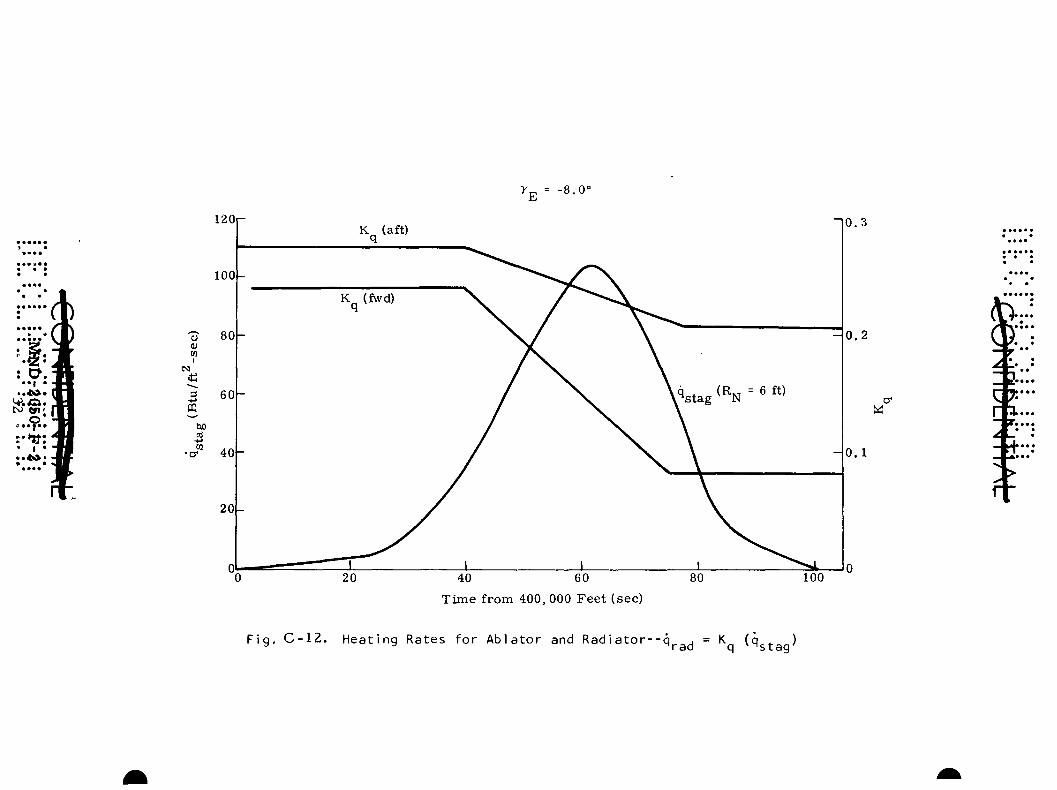
Descent of the genera tor sys tem is one of the more seve re t h e r m a l environments because of the high heating loads applied for re la t ively long periods of t ime . To determine the t h e r m a l effects on the sys tem, a t rans ient t h e r m a l analysis was performed using the 15-node t h e r m a l model previously presen ted . The ent i re r e e n t r y phase from deorbit to impact was examined for flight path angles of -8 , -2 and -0 , 1 degrees .
Heating r a t e s assoc ia ted with these angles a r e present in F igs . C-12, C-13 and C-14 from the 400,000-foot level . On each curve , the s t agnation heat ra te is applied to Node 4 on the t h e r m a l model . K (aft) is a
cor rec t ion factor to the stagnation heating ra t e to be used for Nodes 5 and 6 while K (forward) applied to Nodes 2, 3, and 4.
T.
As the most s eve re ca se , open c i rcui t beginning-of-life initial t e m pera tu res were used as the input to the ana lys i s .
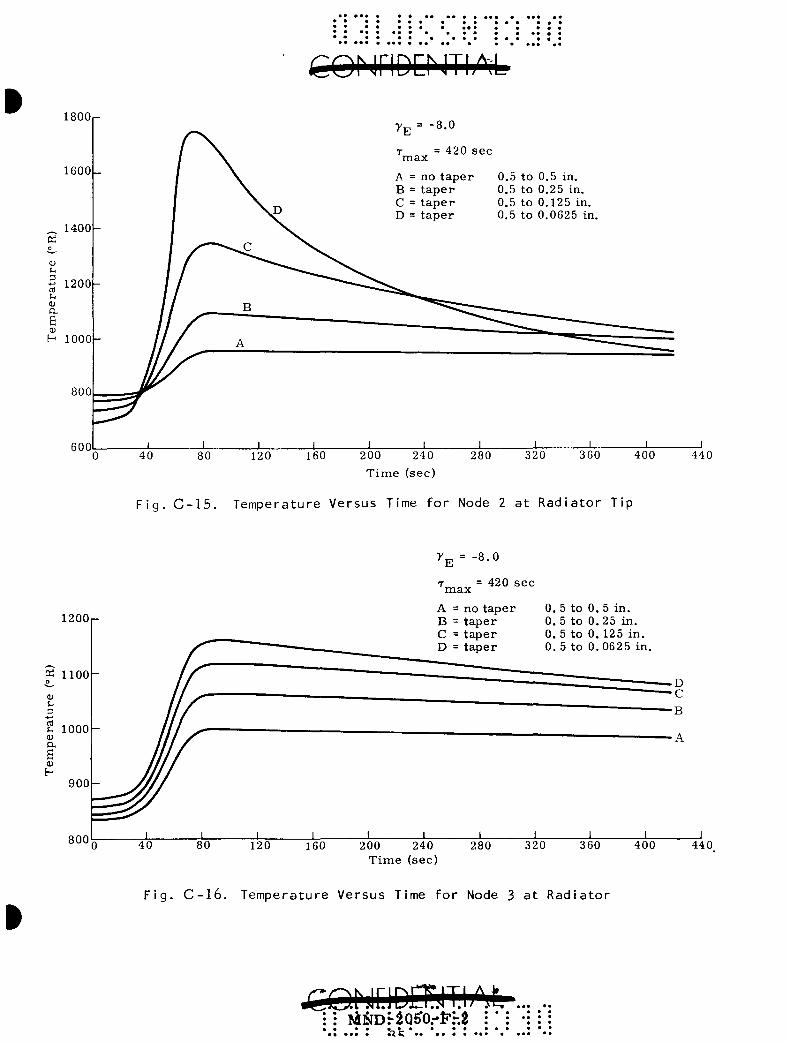
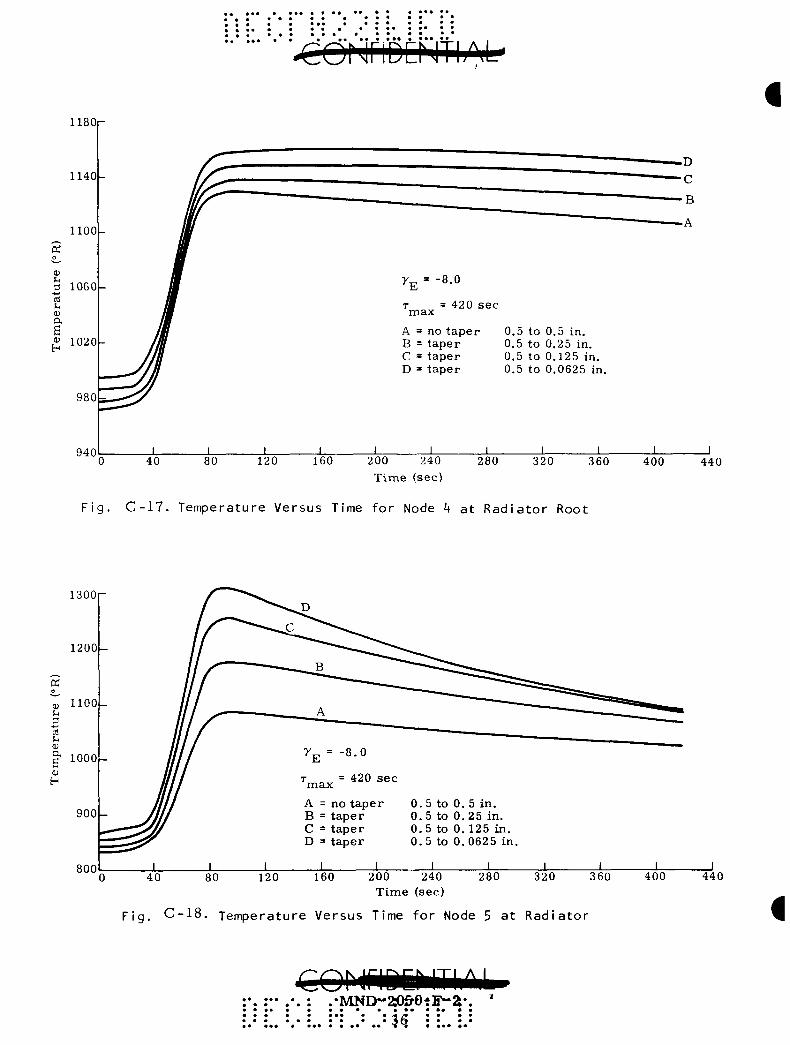
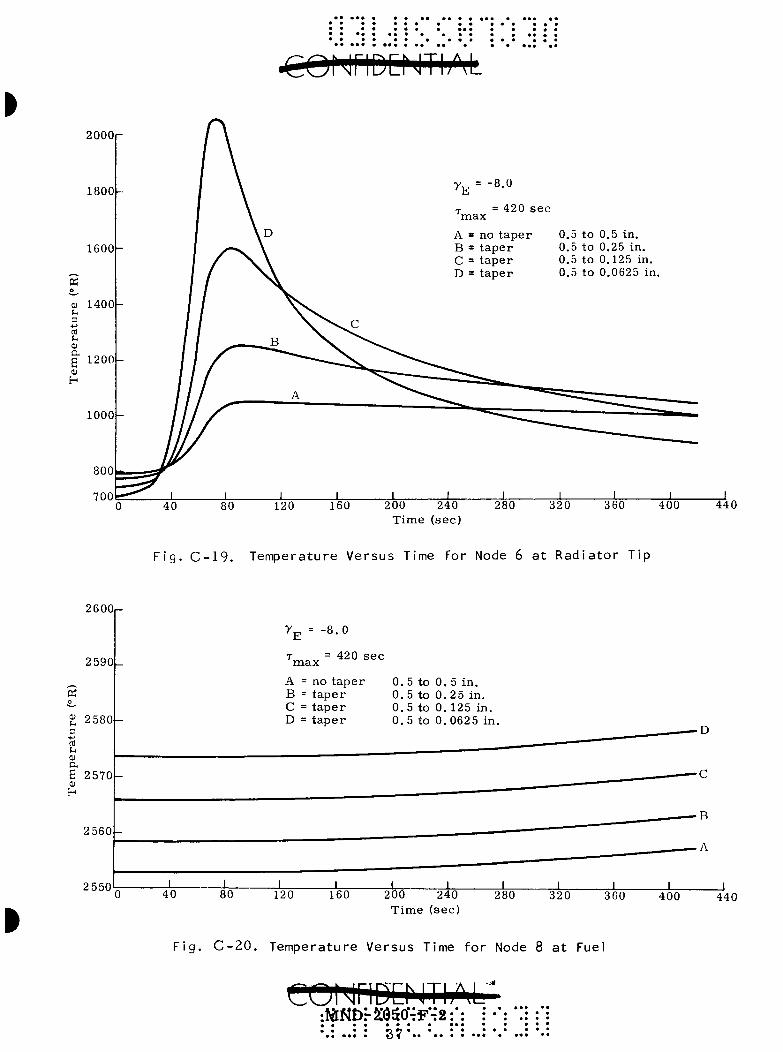
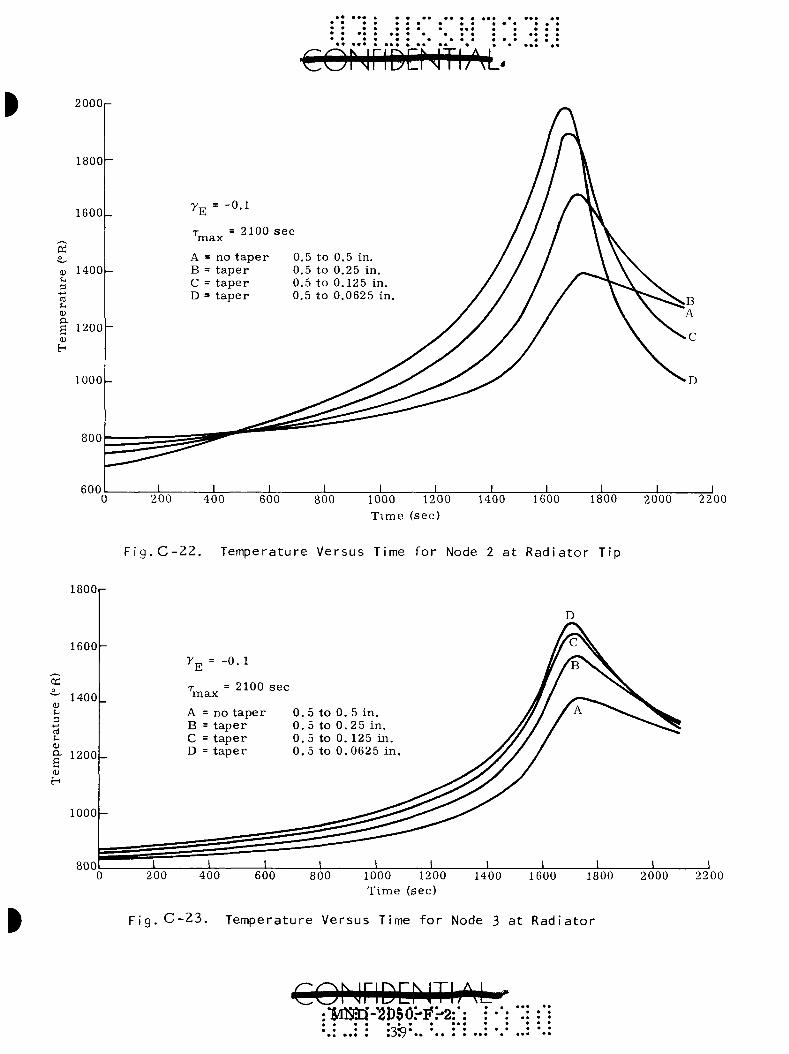
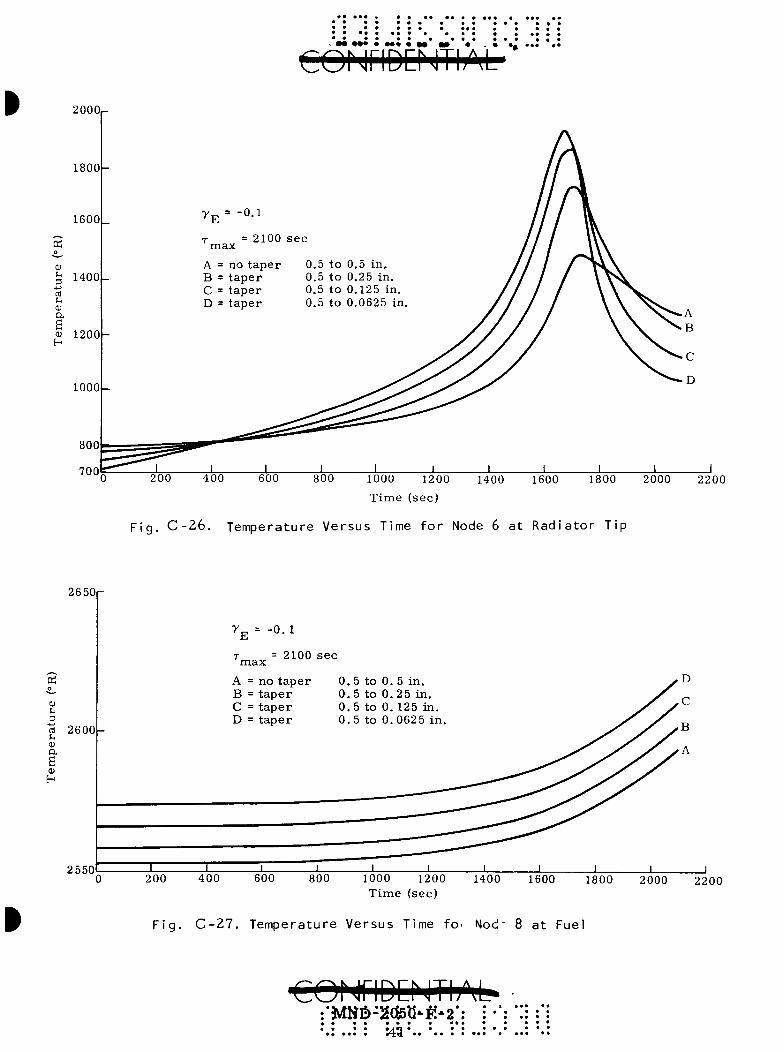
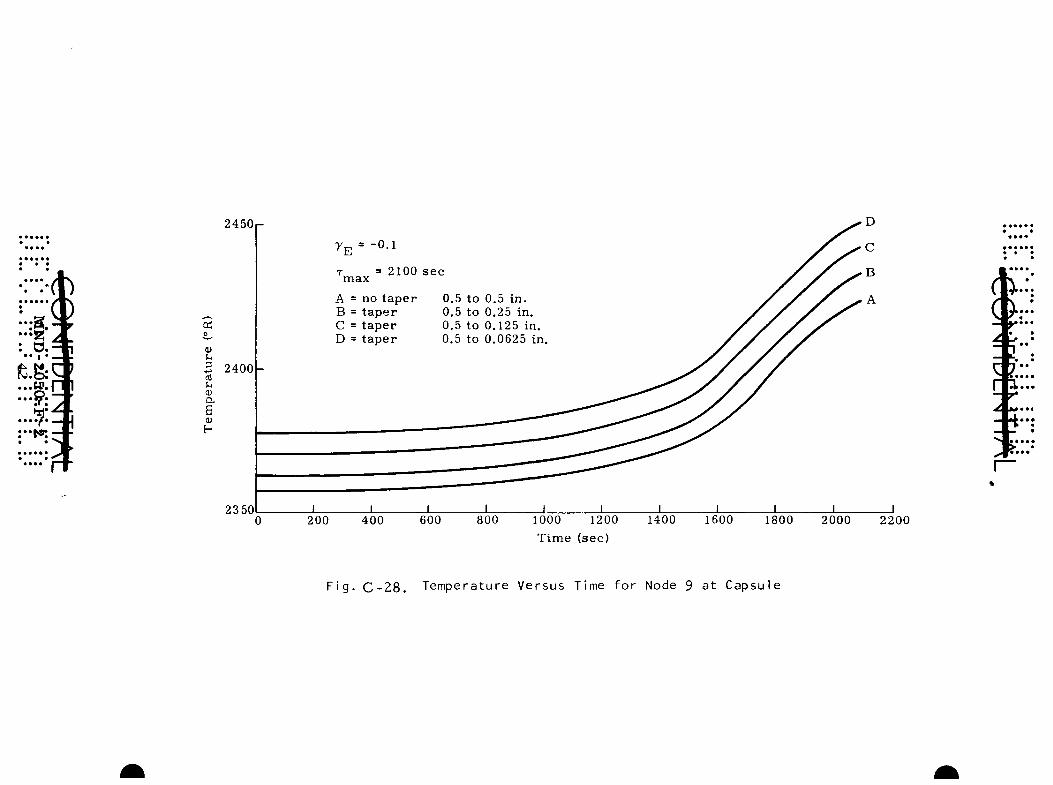
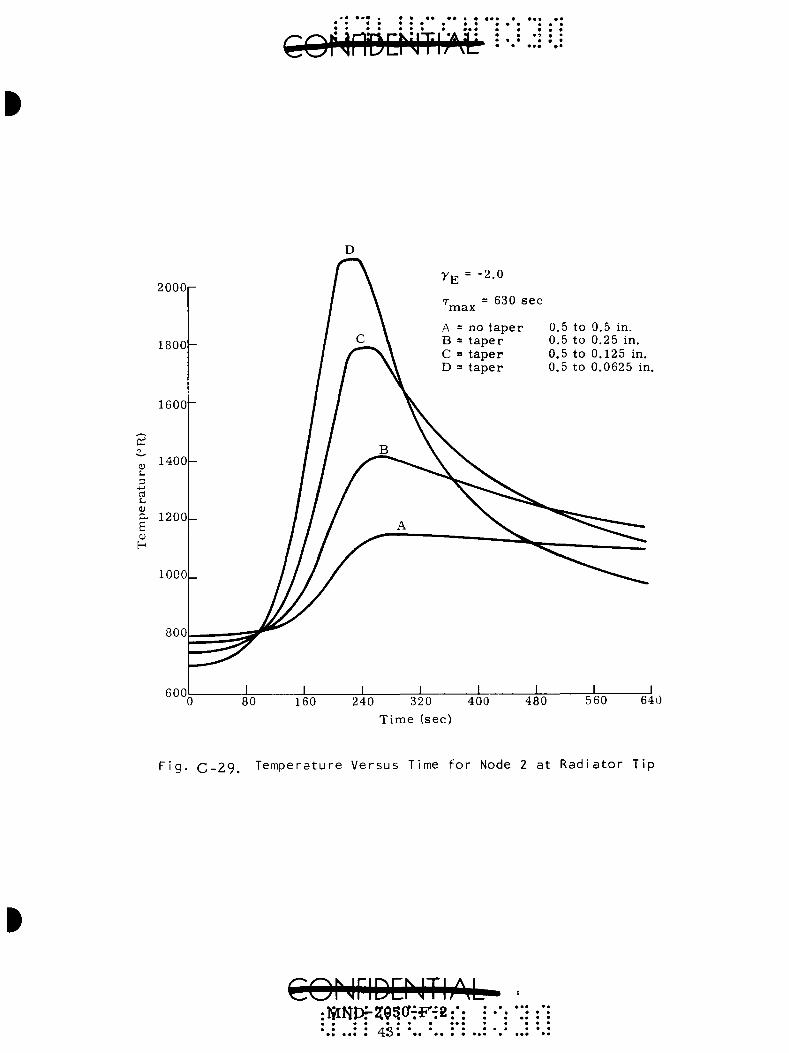
The re su l t s a r e presented for Nodes 2, 3, 4, 5, 6, 8 and 9 in F igs . C-15 to C-21, ( y = -8°) , F igs , C-22 to C-28 (y = "0. 1°) and F igs , C-29 to C-35 (y= -2°) . Tables C-4, C-5 and C-fc a re s u m m a r i e s of the max i mum t e m p e r a t u r e s reached for the th ree flight path angles, whereas the other f igures a r e complete t e m p e r a t u r e - t i m e p lo ts .
The major conclusions reached a r e :
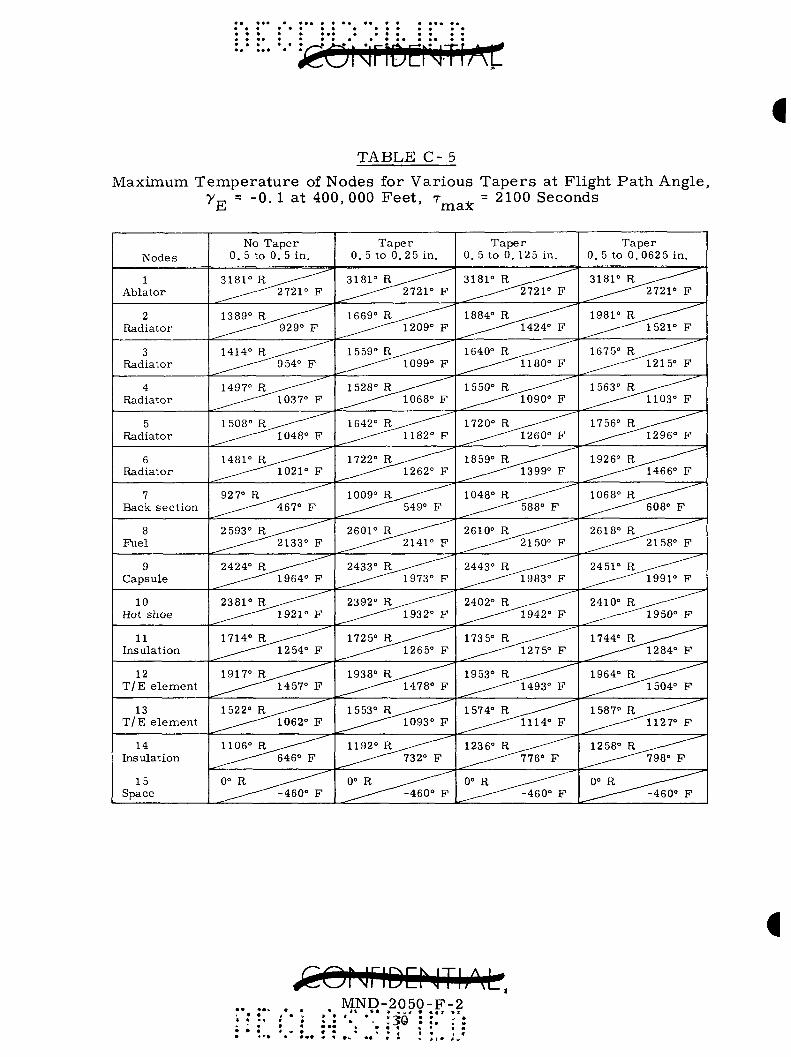
(1) Capsule t empe ra tu r e ro se 12°, 30° and 70° F for flight path angles of - 8 , -2 and - 0 . 1 degrees , respect ive ly , essent ia l ly independent of the rad ia to r profile taper considered. In the wors t ca se , the capsule t e m p e r a t u r e on the back walls reached 2050° F . In al l c a s e s , the maximum capsule t empera tu re was reached at t ime of impact ,
(2) For the selected design (taper to 0 .125 inch), the ex t r emi t i e s of the bery l l ium conical shel l r ad i a to r reached a maximum of 1424° F at 1700 seconds into the 2100-second r e e n t r y for the - 0 . 1 degree c a s e .
MND-,305.0-:F.-?.. • • • • • • « « • • • • • • • • • • • • ••• • • • • • ••• • I 2o ••* r •

• -• « ••
K
£-1
a. S
2300
2200
2100
2000
1500
Node 8 a l l t a p e r s
Node 9 a l l t a p e r s
-J_ _L _L 10 20 30 40
F i reba l l T ime (sec) 50 60
F i g , C - 1 0 . T e m p e r a t u r e V e r s u s F i r e b a l l T i m e f o r N o d e s 8 a n d 9 a t F u e l a n d C a p s u l e - C a p s u l e w i t h i n R T G .
••iMNTD*205t)-F'2
• •*
• • • ^ I • • • • • !
• • . • « • 4 • •
'-"jcoUmtmiA^
2300
2 2 0 0 -
2100
2 0 0 0 -
fo
0)
u V a a a>
1 9 0 0 -
1800
1700_
1600-
15001 0 8 12
F i r e b a l l T ime (sec)
16 20
F i g . C - 1 1 , C a p s u l e S u r f a c e T e m p e r a t u r e V e r s u s E x p o s u r e T i m e to F i r e b a l l - B a r e C a p s u l e
. . . . M N D - 2 0 a O T F , - a . :28 . •.

'fedNfrPttWi<^ if-" •' '•'•
TABLE C-4 Maximum T e m p e r a t u r e of Nodes for Var ious T a p e r s at Flight Path Angle,
y „ = 8, 0 at 400, 000 Feet , T = 420 Seconds E max
Nodes
1 Ablator
2 Radiator
3 Radiator
4 Radiator
5 Radiator
6 Radiator
7 Back section
8 Fuel
9 Capsule
10 Hot shoe
11 Insulation
12 T / E e lement
13 T / E e lement
14 Insulation
15 Space
No Taper 0, 5 to 0. 5 in.
3113° K^^^--^^ ^ ^ ^ . , , l - - - ^ 6 5 3 ° F
961° R ^^^.^-''^'^^ ^ ^ ^ . ^ - - ^ O l " F
998° R ^^^^-^""^ ^ ^ _ , - - ' ' ' 5 3 8 ° P
1130° ^^.^^-^^^ ^ 670° F
1085° K^^'^^'^ ^^^^_,-- ' -^25° F
1046° R^ , , - - - - ' ' ' ' ' ^ ^ _ _ , - - - - ' ^ 8 6 ° F
709° R ^^^-"^^^ ^ 249° F
2558° K^.^-'-'"'^ ^ _ ^ , . - - - ' ' ^ 0 9 8 ° F
2370° K^,^^^^^^^
2316° "^^^--^'^'^ ^ ^ , . , , - - ' ' ^ 8 5 6 ° F
1648° R^,,---' ' ' ' ' ' ' ' '^ ^ 1188° P
1710° R^^-^^"^ ^ ^ , , , , - - ' ^ 2 5 0 ° F
1166° R ^^^-'''^ ^ ^ „ _ , - - - ' ^ 6 ° F
850° R ^ ^ ^ ^ - ^ ^ ^ ^ ^ - - ^ 3 9 0 ° F
0° R ^^^^-^^^
Taper 0. 5 to 0.2 5 in.
3113° K^^--^^^ ^ ^ , , , - - - - ^ 6 5 3 ° F
1095° K^^^-"'^''^ ^ — 635° F
1061° R^.,----- ' ' ' '^ ^ ^ , , , - - - - ' ^ 0 1 ° F
1138° K^^^-'"""^ ^ ^ _ , , - - ^ 6 7 8 ° F
1176° K^^--'^'^ ^^ , . , - - • - - •^16° F
12 53° ^^^^--^^^ ^ ^793° F
730° R ^^-^-^^^
2563° R ^ , - - - ' ' ' ' ' ^ ^^.,.,---'''''^2103° F
2376° K^^^-^^^ ^^ . , . . - - - - ' ^916° F
2323° R^ , - -—•" '^ ^ ^ , , , . , - — ^ 8 6 3 ° F
16 55° K^^-"^^^ ^ ^ , , - - - - ' ^ 1 9 5 ° F
1719° K^^-^^^ ^ , . , ^ - - •^^259° F
1174° K^,^^^'^ ^ ^ , , - - • - ^ 7 1 4 ° F
875° R ^ , ^ - ^ ' ^ ^ ^ . , - - - ' ^ 1 5 ° F
0° R ^^-"-'"'^ ^^ , . - - - ' ' ' ' ' ^ -460° F
Taper 0. 5 to 0. 125 in.
3113° R ^ ^ ^ , ^ , ^ • ' ^ 5 3 ° F
1345° R ^^^^'"^^ ^ ^ , . , - ^ ^ 8 8 5 ° F
1117° R ^ , ^ - ^ " ^ ^^ , , -^- -^657° F
1149° R ^^^^•^''^^ ^ _ _ , , , - - - ^ 8 9 ° F
1253° ^^^^^^"^
1592° K^^.-^"'^^^ ^^ , , , - - - - -^132° F
753° R ^^..^^''^^
2571° K ^^^-''^^
2384° K ^^-^^"^ ^ ^ _ „ - - ' - ' ^ 2 4 ° F
2332° K^^^'-'^^ ^ ^ ^ ^ - " ^ 8 7 2 ° F
1663° K^^-^^^^
1731° R ^^^^--'^'^ ^ ^ . ^ - - - ^ 7 1 ° F
1186° R ^ ^ ^ - " ^ ^ ^ ^ ^ - ^ ^ 6 ° F
901° R ^ ^ ^ ^ " ^ ^ _ _ , . ^ ^ ^ ^ ^ 1 ° F
0° R ^ ^ - ^ " " ^ ^ ^ ^ ^ ^ ^ ^ ^ 4 6 0 ° F
Taper 0. 5 to 0.0625 in.
3113° ^ ^^^^^^'^^ ^ ^ , , , - - ' ^ 6 53° F
1746° F ^ ^ - - - ' ' ' ' ' ' ' ^ ^ ^ , - - ' ^ 2 8 6 ° F
1158° "^^^^^-"^^^ ^^ . . , , - - - -^98° F
1160° R ^ , - - - - ^ " ^ ^ ^ ^ . , - - - ^ 0 0 ° F
1310° K^^--^^^
2054° K^^^--^^'^^ ^^^^'-^X^'^V P
767° R ^^^-^^^
2579° R^ , , - - - - ' ^ ' ' ^ ^ ^ , . ^ - - - ^ 1 1 9 ° P
2392° R ^ , , ^ - - ' ' ' ' ' ^ ^ ^ , . - - ' ' - ^ 9 3 2 ° P
2341° K^--'"'^ ^^.^^^^XZZX" F
1672° R ^ , . , - - ' ' ' ' ' ^ ^ ^ , , , , - - - - ^ 2 1 2 ° F
1741° K ^^-^-^"^ ^^^--^^2%X° F
1197° R ^ ^ ^ ^ ^ " - ^ 7 3 7 ° F
918° R ^ . . ^ - ^ ^ ^ ^ ^ - - - ^ ^ 5 8 ° F
0° R ^ , ^ ^ - - - ' ^ ^ ^ _ , , ^ - ' ' ' ^ - 4 6 0 ° F
^N.p-205.0.-.F,-2 .. . : : » . 2<^. • ' • • • : ? : i ;
••• •• -^^^jtmrnmrc
TABLE C- 5
Maximum T e m p e r a t u r e of Nodes for Var ious T a p e r s at Flight Pa th Angle, y „ = -0 . 1 at 400,000 Feet , T , = 2100 Seconds
Hi max
Nodes
1 Ablator
2 Radiator
3 Radiator
4 Radiator
5 Radiator
6 Radiator
7 Back sect ion
8 Fuel
9 Capsule
10 Hot shoe
11 Insulation
12 T /E element
13 T /E element
14 Insulation
15 Space
No Taper 0. 5 to 0. 5 in.
3181° R
1389° R
1414° R
1497° R
1508° R
1481° R
927° R
2593° R
2424° R
2381° R
1714° R
1917° R
1522° R
1106° R
0° R
2721° P
929° P
9 54° P
1037° F
1048° F
1021° F
467° P
2133° F
1964° P
1921° P
1254° F
1457° F
1062° F
646° F
-460° F
Taper 0. 5 to 0 .25 in.
3181°
1669°
1559°
1528°
1642°
1722°
1009°
2601°
2433°
2392°
1725°
1938°
1553°
1192°
0° R
R
R
R
R
R
R
R
R
R
R
R
R
R
R
^
2721°
1209°
1099°
1068°
1182°
1262°
549°
2141°
1973°
1932°
1265°
1478°
1093°
732°
-460°
F
F
F
F
F
F
F
F
P
P
F
F
F
F
F
Taper 0. 5 to 0. 125 in.
3181°
1884°
1640°
1550°
1720°
1859°
1048°
2610°
2443°
2402°
173 5°
1953°
1574°
1236°
0° R
R
R
R
R
R
R
R
R
R
R
R
R
R
R
2721° F
1424° P
1180° P
1090° P
1260° F
1399° P
588° P
2150° P
1983° F
1942° F
1275° F
1493° F
1114° F
776° F
-460° F
0. 5 to
3181°
1981°
167 5°
1563°
1756°
1926°
1068°
2618°
2451°
2410°
1744°
1964°
1587°
1258°
0° R
Taper 0.0625 in.
- - - ^ 7 2 1 ° P
- " ^ 5 2 1 ° F
' " ^ 2 1 5 ° F
-"'''^1103° F
-"•'''^1296° F
^ ^ 4 6 6 ° F
- - ^ 0 8 ° F
^ " ^ 1 5 8 ° F
-^^1991° P
R ^ ^ ^ 1 9 5 0 ° P
- - ^ 2 8 4 ° F
- - ^ 5 0 4 ° F
- - ^ 1 2 7 ° F
- ' ^ 9 8 ° F
^ ^ ^ 6 0 ° F
MND-2050-F-2 30
* • f
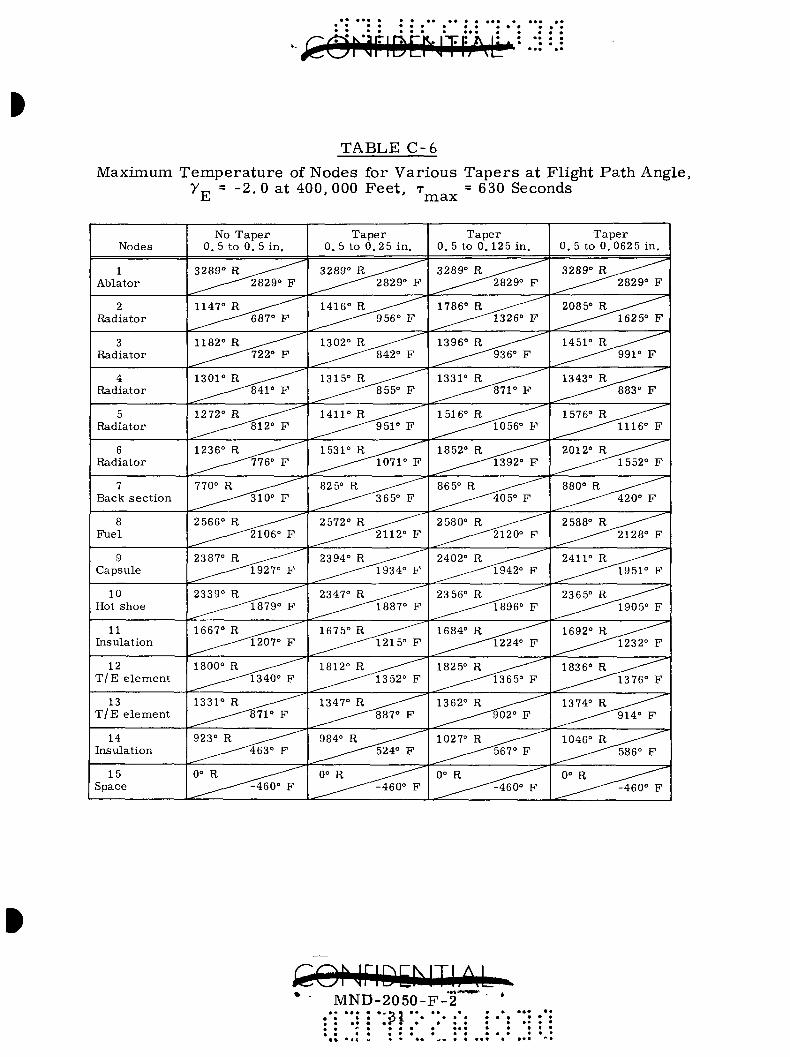
TABLE C-6 Maximum Temperature of Nodes for Various Tapers at Flight Path Angle,
y„ = -2,0 at 400,000 Feet, T = 630 Seconds E ' ' max
Nodes
1 Ablator
1 Radiator
1 Radiator
1 Radiator
5 Radiator
6 Radiator
7 Back sect ion
8 Fuel
9 Capsule
10 Hot shoe
11 Insulation
12 T / E element
13 T / E e lement
14 Insulation
15 Space
No Taper 0. 5 to 0. 5 in.
3289° K^^^^'^^'^ ^^ , , , ^ - - - ' ^829° F
1147° R ^ ^ ^ " ^ ^ ^ ^ , , , . - - ' - ^ 8 7 ° F
1182° K ^.^^^^^^ ^ ^ - - " ^ 2 2 ° F
1301° R ^^.^^^^
1272° R ^^^-""^ ^^.^-^^XV F
1236° R ^ ^ ^ ' ' ^
770° R ^^-^^^ ^^^^^XQ" F
2566° R ^...^-^'^^ ^^ , , - . - - - - ^06° F
2387° R ^...'--'-''^ ^ ^ , , , - - - ' ^ 2 7 ° P
2339° R ^.^---^'^ ^ ^ , ^ - ' ' 1 8 7 9 ° F
1667° R ^^^-""^ ^ ^ , , , - - - - - ^ 0 7 ° F
1800° R ^^..'-^-''^ ^^,,._---1f340° F
1331° R ^^^^-^^^
923° R ^^--^^^
0° R ^^^---^^ ^ — - ^ 6 0 ° F
Taper 0. 5 to 0.25 in.
3289° K^.,^^'"'^^ ^^^.^-^ ' ' '^2829° P
1416° K^,^^^^
1302° K^,^^--""^ ^ ^ , . - . - - - ^ 4 2 ° F
1315° K^^-^^^ ^ ^ , , - - - ' ^ 5 5 ° F
1411° ^ ^ . ^ ^ - ^ ^ ^ , , , - - - ^ 5 1 ° P
1531° K ^^^--^^^ ^^^^^Q1X° F
82 5° R ^^-"-""^ ^ ^ . , - - - - ' ^ 6 5 ° F
2572° R ^ , . , - - - ' ' ^ ^ ^ , . , . - - - - ^ 1 1 2 ° F
2394° R ^ , ^ - " " ' ^ ^__. , . , - --^934° P
2347° R^, . - - - - ' ' ' "^ ^ ^ , , - - - - - ^ 8 8 7 ° P
1675° R ^ , , - - - - ^ ^ ' ^ ^ , , . - - - ^ 2 1 5 ° F
1812° B. ^^.^-^^ ^ ^ , , . - - - - ^ 3 5 2 ° F
1347° B ^^^^'"^
984° R ^ ^ ' ^ ' ^
0° R ^,..,^^^
Taper 0. 5 to 0. 125 in.
3289° K^.^^^'"'^ ^ ^ , - - ' ^ 8 2 9 ° F
1786° R ^ ^ - - - - ' ' ' ^ ^ ^ , , - - - ' ^ 3 2 6 ° F
1396° K ^^^^-^^ ^ ^ ^ - - - ' ^ 3 6 ° F
1331° K ^^"""^ ^^^"-•^IX" F
1516° R ^^^"^^ ^ ^ , - - - ^ 0 5 6 ° F
1852° R ^ ^ - ^ ^ ^ _ . , . - - ' ' ^ 9 2 ° F
865° R ^^^--'^ ^ _ „ , . - - - ' ^ 5 ° P
2580° R ^^^---^^ ^ ^ . , , , - - - - ^ 2 0 ° P
2402° R ^.^.^--^^ ^^ , , , - -^ - ' ^42° F
23 56° R ^ ^ - - " ' ' ^ ^ ^ . , , - - ' - - ^ 9 6 ° F
1684° R ^^--^^ ^ ^ , ^ . - ^ ^ ^ 2 4 ° F
1825° R ^^^-^"^ ^ ^ . , . - - - • - ^ 6 5 ° F
1362° R ^^^-^^^ ^^, , , - - -^§02° F
1027° R ^^^-""^
0° R ^ ^ ^ ' ^ ^ ^ . , , - - • - ^ 6 0 ° F
Taper 1 0. 5 to 0.0625 in.
3289° E l , - - - - ' - ' ' ^ ^ ^ ^ - - ' ' ^ 8 2 9 ° F
2085° R ^ . ^ ^ ^ ^ 1 ^ ^ ^ - ^ - ^ 6 2 5 ° F
1451° R,,,---^"'^^!
1343° K^^.^^^\ ^ ^ , , ^ - - ' ^ 8 3 ° F
1576° B^^-^^^\ ^ _ ^ ^ - - ^ ^ 1 1 6 ° P
2012° R ^ , ^ - " " ^ ^ ^ , , . - - - - ^ 5 5 2 ° P
880° R ^ ^ - - ^ ^ ^ ^ , , , - - - ^ 2 0 ° F
2588° K^^^^'^ ^ ^ , . , - - - - ^ 1 2 8 ° F
2411° R ^ . , - - ' ' ' ' ^ ^ ^ ^ , , , - - - ^ 9 5 1 ° F
2365° K^^-^-'^^ ^__^.,.----^905° F
1692° K^^^-^^^ ^ ^ ^ - - ^ 2 3 2 ° F
1836° B.^^"^"^ ^ ^ ^ - - - - ^ 3 7 6 ° P
1374° R ^ , . ^ - " " ' ^ ^ ^ _ ^ - - - - ^ 1 4 ° F
1046° K^^^^^^^ ^ ^ , . , , - - - ^ 8 6 ° F
0° R ^ ^ ^ - - ^ " ^
MND-2050-F-2
y ^ = -8 .0°
120r
• I •
- 0 , 2
0.3
cr W
- 0 . 1
40 60
T ime from 400, 000 Fee t (sec)
• •
(r
r !•
»»
^
Fig. C-12. Heating Rates for Ablator and Radiator--q j = K (q ^ ) ^ ^ ^rad q ^staq

r^ = -2 .0 '
f
^stag(f^N = 6ft)
200 300
Time from 400,000 Feet (sec)
0.3
-0.2
W
-0,1
400
^ ( ) . .
? .
• • • •
• •
Fiq. C-13. Heating Rates for Ablator and Radiatoi q . = K (q ,. ) ^ ^rad q ^^staq'

y^- -o.v
» •
t
6 Or - . 0 .3
- 0 . 2
d
- 0 . 1
600 800 1000 1200 1400 1600 1800 2000
Time from 400,000 Fee t (sec)
F i g . C - 1 4 . H e a t i n g Rates f o r A b l a t o r and R a d i a t o r - - q . = K (q .. ) ^ ^ ^ r a d q ^ ^ s t a q '
eohjriDDJTiAL
IBOOr
T = 420 sec max
A = no taper B = taper C = taper D = taper
0.5 to 0.5 in. 0,5 to 0.25 in. 0.5 to 0.125 in. 0.5 to 0.0625 in.
120 160 200 240 Time (sec)
440
F i g . C - 1 5 . T e m p e r a t u r e Ve rsus Time f o r Node 2 a t R a d i a t o r T i p
1200
K 1100
-•-»
£ 1000 0)
9 0 0 -
800 40
E -8 ,0
T = 420 sec m.ax
A = no taper 0, 5 to 0. 5 in.
80 120 160 200 240 Time (sec)
280 320 360
^ —
r u
\ 1 1
B = taper C = taper
_ D = taper
1 1 1 1
0, 5 to 0.25 m. 0,5 to 0.125 in. 0. 5 to 0.0625 in.
1 1 1
— D — C — B
— A
. 1 400 440
F i g . C - 1 6 . T e m p e r a t u r e Ve rsus Time f o r Node 3 a t R a d i a t o r
1180
1140
1100
tf
0)
3 -t-» tfl U 1) a S 0)
1060
1020
980
940
T = 420 sec max
A = no taper B = taper C = taper D " t a p e r
0.5 to 0.5 in. 0.5 to 0.25 in. 0.5 to 0.125 in. 0.5 to 0.0625 in.
_L _L 40 80 120 160 200 240
T ime (sec) 280 320 360 400 440
F i g . C - 1 7 . Tempe ra tu re Ve rsus Time f o r Node k a t R a d i a t o r Root
K
0 u
3
0)
a B
i 3 0 0 r
1200-
1100-
1000-
900
800 40 80 120 160 200 240 280 320 360
Time (sec)
F i g . C - 1 8 , T e m p e r a t u r e Ve rsus Time f o r Node 5 a t R a d i a t o r
400 440
^ONriDCNTIAL
1800
T = 420 s e c max
A » no t a p e r B = t a p e r C = t a p e r D = t a p e r
0.5 to 0.5 in . 0.5 to 0.25 in. 0.5 to 0.125 in. 0.5 to 0.0625 in.
200 240 280 T i m e ( sec )
440
2600r
Fig. C-19. Temperature Versus Time for Node 6 at Radiator Tip
-8 .0
2590-
!£
1 2580-3
•+-J ni U (U
a, a 2570-H
2560-
25501-40 80
T = 420 s e c m a x
A = no t a p e r B = t a p e r C = t a p e r D = t a p e r
0 . 5 to 0 . 5 in . 0 . 5 to 0 . 2 5 in . 0 . 5 to 0. 125 in . 0 . 5 to 0 . 0 6 2 5 in .
120 160 J_
200 240 T i m e ( sec )
280 320 360 400 440
F i g . C - 2 0 . Temperature Versus Time fo r Node 8 a t Fuel
COI JriDD JThM' :»Nt)r2;«3ffiP'-;2:' • • * • • • • • • • • • • 2 * 7 * • • • • • • • O^ ** **

y^ - -8 .0
-max = 420 sec
"2, .0
•••r 00
$
^
o
; < 3
U 1)
a
s H
2400
2390
2380
2370
2360
2350
A = no t ape r B = t ape r C » t ape r D = t ape r
-
_ ^ — - - ^
.
_ _ ^
1 1 1
0.5 to 0.5 in. 0.5 to 0.25 in. 0.5 to 0.125 in. 0.5 to 0.0625 in.
—1 L. 1 1 1
— ' ° C
B
-A
1 1 1 0 40
(t) :£
^ ^
80 120 160 200 240 280 320 360 400 440
Time (sec)
Fig. C-21, Temperature Versus Time for Node 9 at Capsule
cor riDCNTUM. 2000r
1 8 0 0 -
1 6 0 0 -
o
'Z 1400 3
u (1)
g 1200
1 0 0 0 -
800
600
_
-
—
-
•^;^Z^
Y^ = -0.1 /
-max = 2100 sec / >
A = no taper 0.5 to 0.5 in. / / B = taper 0.5 to 0.25 in. / / C = taper 0.5 to 0.125 in. / / 1 D = taper 0.5 to 0.0625 in. / / /
1 1 1 1 1 1 1
A
MV / /^^\^!vv / Vx^ V^^
1 1 1 1 200 400 600 800 1000 1200
T i m e (sec) 1400 1600 1800 2000 2200
F i g . C - 2 2 . Tempe ra tu re Ve rsus Time f o r Node 2 a t R a d i a t o r T i p
K
1800
1600
1400 u 3
u
o- 1200 n 0)
H 1 0 0 0 -
800
y = E
2100 s e c
A = no t a p e r B = t a p e r C = t a p e r D = t a p e r
0 . 5 to 0. 5 in . 0 . 5 to 0. 25 in . 0 . 5 to 0. 125 in . 0 . 5 to 0 . 0 6 2 5 in
1000 1200 T i m e (sec)
1400 1600 2000 2200
F i g . C - 2 3 . Tempe ra tu re Ve rsus Time f o r Node 3 a t R a d i a t o r
r n h innrMTi AI 3:9

•COl riDENTIAL
K
u 3
a £ H
1600r
1500-
1400-
1300-
1200-
1100-
1000
900 200 400 600 800 1000 1200 1400 1600 1800 2000 2200
Time (sec)
Fig. C-24. Temperature Versus Time for Node k at Radiator Root
a
a) 3
-t-> 01 U
a £
1800^
1 6 0 0 -
1 4 0 0 -
1 2 0 0 -
1 0 0 0 -
800
y^--o.x
7 = 2100 s e c m a x
A = no t a p e r B = t a p e r C = t a p e r D = t a p e r
0. 5 to 0, 5 in . 0. 5 to 0 . 25 in . 0 . 5 to 0. 125 in . 0. 5 to 0 .0625 in .
X. _L -L _L _L _L J_
C0M^lDQm)^4, MND-2030rP.-3 ... . ... .. • . . An . . . . . . . . . ..*±vj . . ...
J 0 200 400 600 800 1000 1200 1400 1600 1800 2000 2200
Time (sec)
Fig. C-25. Temperature Versus Time for Node 5 at Radiator
2000,-
1800-
1600_
l£
u ^ 1400 -4->
ni
S <u 1200 H
1000-
700 200
CONriDCNTIAL
-
-
-
: : : = = =
y ^ - o - i
T = 2100 m a x
A = no t a p e r B = t a p e r C = t a p e r D = t a p e r
1 1 1
/
s e c / /
0.5 t o 0.5 in . / / 0.5 t o 0.25 in. / / i 0.5 to 0.125 in. / / / 0.5 to 0.0625 in. / / /
y!y/
^ ^ ^ ^ ^
1 1 1 1
A A / ^V
/w^^ \^c
1 1 1 400 600 800 1000 1200
T i m e (sec)
1400 1600 1800 2000 2200
F i g . C - 2 6 . Temperature Versus Time f o r Node 6 at Radiator Tip
26 5 0 r
tf
u 3 rt 2600
a S H
2 550 1
y^ '- - 0 . 1
V a x = 2100
A = no t a p e r B = t a p e r C = t a p e r D = t a p e r
1 1
s e c
0 . 5 to 0. 5 in . 0 . 5 to 0 , 2 5 in . 0 . 5 to 0. 125 in . 0 . 5 to 0 . 0 6 2 5 i n .
1 1 1 1 1
/° A" ^ ' ^ ^
1 1 1 0 200 400 600 800 1000 1200
T i m e (sec) 1400 1600 1800 2000 2200
F i g . C - 2 7 , Temperature Versus Time fO' Nod" 8 at Fuel
CONflDCNTIAL' :MH6-2ci5ti'fi-2-• • • • • • « • ••
• • • •« • * ^ * J . * • • • •
• « »
: O.- i • • I •— -
...w.r 1 • • • ^
P£
(U
3 -t-» ClJ
a
2450
2400
23 50
r-
y^^-o.x
T = 2100 max
A = no t ape r B = t ape r C = t ape r D = t ape r
1 1
sec
0.5 to 0.5 in. 0,5 to 0,25 in. 0.5 to 0.125 in. 0.5 to 0.0625 in.
^^0 1 1 1 1 1
^ D
y^c >/V^B
/yyy'
y I I I !
200 400 600 800 1000 1200 Time (sec)
1400 1600 1800 2000 2200
r a..
J^'
Fig. C-28, Temperature Versus Time for Node 9 at Capsule
0 80 160 240 320 400 480 560 640
Time (sec)
Fig. C-29. Temperature Versus Time for Node 2 at Radiator Tip
COhJriDDJTIAL- ' :lSlNK-2e5C[TrTE:;: I ••: "j f:
• • • • • • ^ O • * • • • • • « • • • • • • • • •
1500r
1400-
1300-
Qi
?; 1200 3
01
a 1100-
1000-
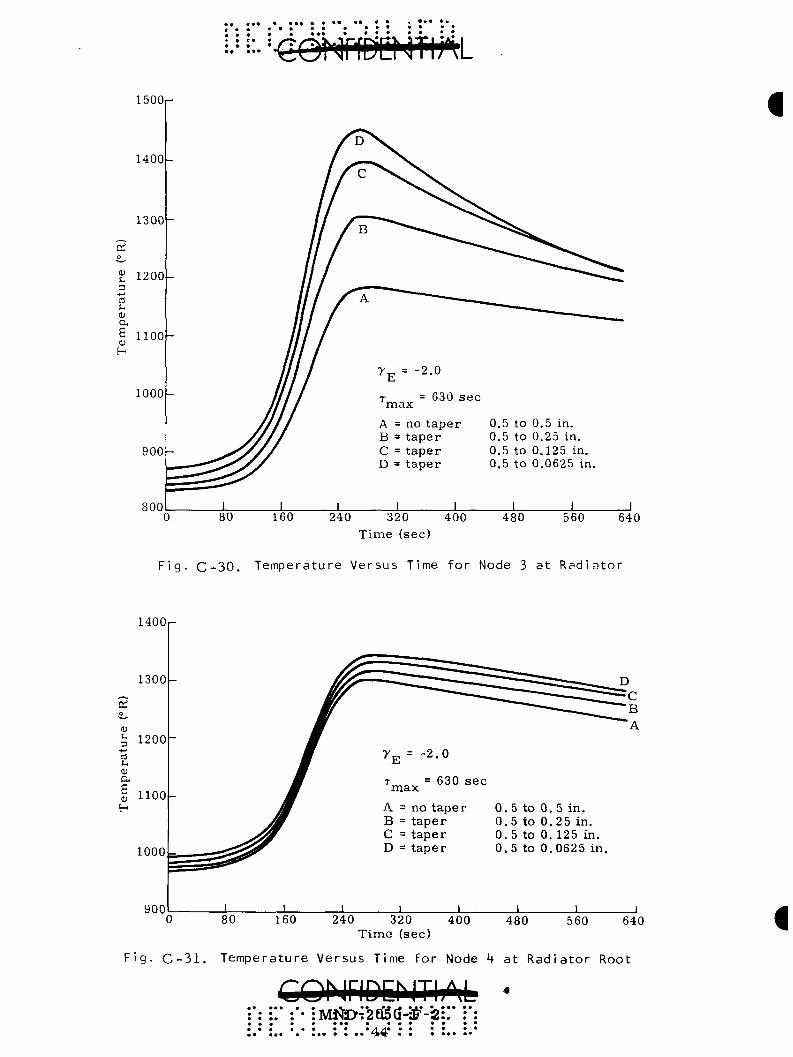
Fig- C-30. Temperature Versus Time for Node 3 at Radiator
11UU
1300
2 o (U ^ 1200
0) a ^ 1100 H
1000
900
^
^» # yE = -2 -o
# T = 630 sec ^ max
M A = no t a p e r > y B = t a p e r
^^fw C = t a p e r ^^0-^0^ D = t a p e r
1 1 1 1 1
0. 5 to 0. 5 in . 0 .5 to 0 .25 in. 0 .5 to 0. 125 in. 0 .5 to 0.0625 in.
1 1
D
~~B ~~"A
—1 80 160 240 320 400
Time (sec) 480 560 640
Fig. C-31. Temperature Versus Time for Node h at Radiator Root
CQhiriDEhlTliM Mi^J>7'2eB(i-5F-2
••• • • • • • • • • • • • 4 V • • •

5 o
D • • - '
nJ
u a)
s H
1600
1400
1200
1000
800
r °
///"^^
If / A
1 1 1
V - ^ ^
> ' E = - 2 - 0
V a x = 630 ^^^
A = no t ape r B = t a p e r C = t a p e r D = t a p e r 1 1
^ ^ ^ = =
0. 5 to 0. 5 in. 0 .5 to 0 .25 in. 0 .5 to 0. 125 in. 0 .5 to 0.0625 in. 1 1 1
80 160 240 320 400 Time (sec)
480 560 640
F i g . C - 3 2 . Tempera tu re Ve rsus Time f o r Node 5 a t R a d i a t o r
2000n-y ^ = -2.0
T = 630 sec m a x A = no t ape r B = t ape r C = t ape r D = t a p e r
0.5 to 0.5 in. 0.5 to 0.25 in. 0.5 to 0.125 in. 0.5 to 0.0625 in.
160 240 320 400 480 Time (sec)
560 640
Fig. C-33. Temperature Versus Time for Node 6 at Radiator Tip
• • ••• • A^ • •• ••

rE = -2.o 2 590^
o; 2 5 8 0 -
a> 3
£ 2570
a
0)
2 5 6 0 -
2 550,
" ^ m a x = 6 3 0 s e c
A = no t ape r B = taper C = taper D = taper
-
1 i
0 .5 to 0. 5 in. 0. 5 to 0 .25 in. 0 .5 to 0.125 in. ^ 0. 5 to 0. 0625 i n . ^ —
_ _ ^ - - ^
^ ^ ^ ^ ^
^ . ^ ^ - - ^ ' " ^
1 1 1 1
^D
C
^ B
1 1 0 80 160 240 320 400
Time (sec) 480 560 640
F i g . C - 3 4 . Temperature Versus Time fo r Node 8 at Fuel
2410^
2 4 0 0 -
DS 2 3 9 0 -
^E = -2-0
r =• 630 sec max
A " no tap B » tape C = tape D = tape
2350
Fig. C-35. Temperature Versus Time for Node 9 at Capsule
CONriDENThM • • • • • * A /t * * * * * *

Pages 47 thru 57 have been deleted.
*' '4^ •"

millerc
Text Box
Blank

millerc
Text Box
Blank

millerc
Text Box
Blank

millerc
Text Box
Blank

millerc
Text Box
Blank

millerc
Text Box
Blank

millerc
Text Box
Blank

millerc
Text Box
Blank

millerc
Text Box
Blank

millerc
Text Box
Blank

....
.0
$ S
APPENDIX D
FUEL CAPSULE THERMAL SHOCK ANALYSIS
From "Approximate Solution to Thermal Shock Problems in Plates, e tc . , with Heat Transfer at Two Surfaces," by Mendelson and Manson, the dimensionless s t ress CT* as a result of thermal shock is given as:
"~ ~ Ea{l - v)AT
where a represents the circumferential s t ress in the capsule wall. The consideration of thermal shock is based upon a fuel capsule at 2000° F during descent and suddenly immersed in sea water. Therefore, the AT is approximately 1930° F .
The dimensionless s t ress is some value 0 < a* < 1 and is a function of the Biot modulus at the inside and outside surfaces of the capsule.
Thus, the actual s t ress is some fraction of E c (1 - v) AT. At 70° F and 2000° F, E a is 224 and 193, respectively. Therefore,
. < ( 2 2 i i l M ) , i _ 0.3) (1930)
or
a < 282,000 psi.
It should be noted that therm.al shock may promote a catastrophic failure in very brittle materials . However, Haynes-25 is ductile and has a large plastic strain capability. This is shown by the fact that to solution heat treat Haynes-2 5, the material is water quenched from about 2275° F in the sheet, plate and bar forms.
CO^j^lDENTIAb-

• •
• •
• • •
••
..:.
Ci
....
M
r *
:•
•
APPENDIX E
FUEL CAPSULE STRUCTURAL ANALYSIS--EXTERNAL PRESSURE CAPABILITY
F r o m a shock o v e r p r e s s u r e due to a potential booster vehicle explosion during the launch phase (T = 1600° F) and submergence in seawater after descent and water impact , the capsule must have the s t ruc tu r a l capability to withstand buckling modes as a r e su l t of these environments .
F o r design flexibility, the c r i t i ca l buckling p r e s s u r e s and/or yield p r e s s u r e s were cons idered as a function of capsule wall thickness, t, from 0.040 to 0. 160 inch. The inside shell d iameter , d, is held constant at 1.286 inches and the length of the shell , L, is taken as 3.88 inches. This length is cons idered as the constant thickness span between reinforced sect ions . The analysis is conservat ive since the foundation support provided by the l iner and fuel is not cons idered .
2 On the bas i s of var ious geometr ic p a r a m e t e r s such as r / t and L / r t ,
the shel l falls within the category of e i ther a "long" or "very long" cylinder. On this b a s i s , the c r i t i ca l buckling p r e s s u r e is obtained by
P^^ = 0.93 E (-1)^/2 (£-)
where for the fuel capsule
r = 0. 643 + 1
Ref. : Gera rd and Becker , Handbook of S t ruc tura l Stability, P a r t III. NASA TN 3783, 1957.
The p r e s s u r e n e c e s s a r y for a yield condition in the c i rcumferent ia l d i rect ion (maximum pr inc ipa l s t r e s s ) i s s imply
p = y y - ^ J r
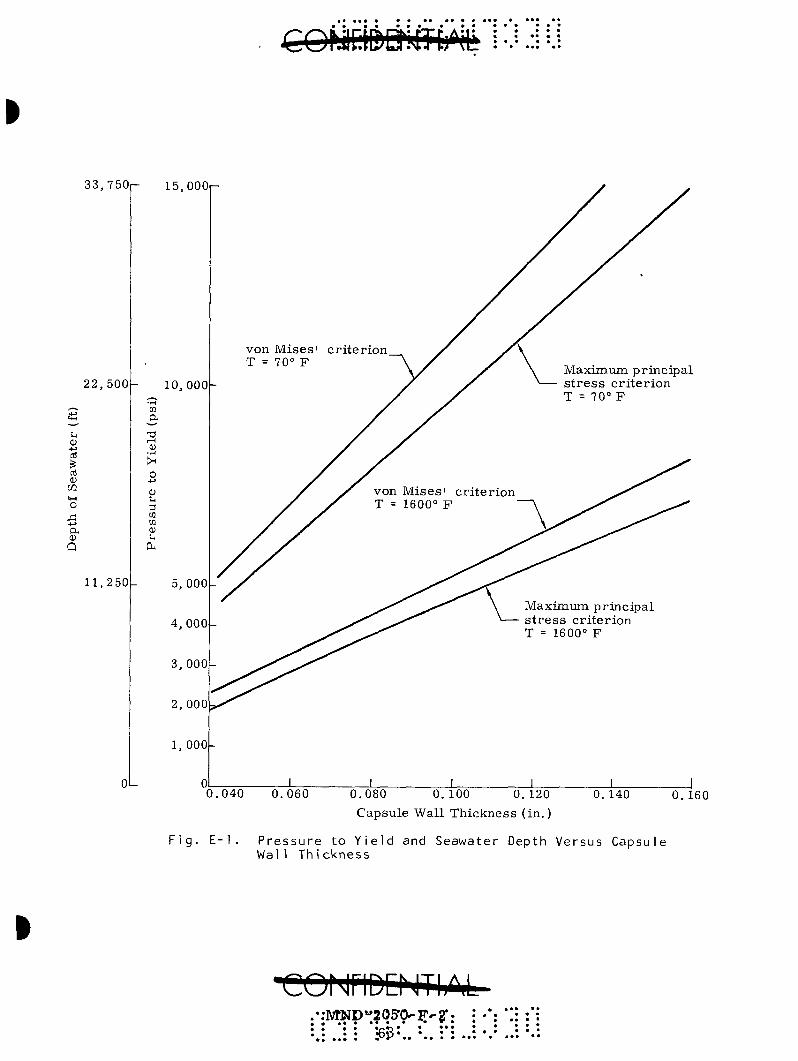
For the wall thickness range considered, the cr i t ica l buckling p r e s s u r e and yielding p r e s s u r e a r e p resen ted in Table E - 1 . The la t ter is also p resen ted as a function of wall thickness and depth in seawater by Fig. E - 1 . In al l c a s e s , the p r e s s u r e n e c e s s a r y to provide yielding becomes the c r i t i ca l value for design compar isons since yielding would init iate buckling.
COMriDEMTIiA,U : " •»KCi-a'd6Ci:-B'-^2 : •': " : : ' : • • • • • • „ • • • • • • • • • ' • • • • • aC^d • • • • • • • •
• • • • • » • 4-J 1»* • • • • • * • « • • • *

TABLE E - 1
Cr i t i ca l Buckling P r e s s u r e and Yielding P r e s s u r e (maximum pr incipal s t r e s s )
Case 1: T - 70° F
0, 160
0. 140
0. 120
0. 100
0.080
0.060
0.040
"y E
0.
0.
0.
0,
0.
0,
0,
= 67,
= 33.
r
723
713
703
693
683
673
663
000
5 X
psi
10« psi
P
133,
97,
67,
44,
25,
12,
4,
cr
760
780
970
020
750
820
493
P y
14,
13,
11, 9,
7,
5,
4,
825
160
440
670
850
980
042
Case 2: T = 1600° F a = 32, 000 psi
E 23.1 X 10 ps i
c r
0, 160
0, 140
0. 120
0, 100
0,080
0,060
0,040
0, 723
0. 713
0.703
0. 693
0. 683
0. 673
0. 663
127,770
67,430
46,870
30,350
17,760
8,840
4,292
7082
6285
5460
4620
3750
2860
1931
CQNriDErJTIjM MJ^f>f2Gr50iF-2: • • • • • • " V * • •
3 3 , 7 5 0 p 15, OOOp
22,500 1 0 , 0 0 0 -
^-„. « -.
S-i
0) +* oi
cfl 4) W t ( H
o j ; : +.» a 0 P
w a
T3 I—1
a; >H 0
-(-> 0) ;H
3 CD
0) u ^
11,250
OL
€OPiir.i[i)ij:Uij"iii i •.=
0.040 0.060 0.080 0.100 0.120 Capsule Wall Thickness ( in.)
0. 140 0. 160
Fig. E-1. Pressure to Yield and Seawater Depth Versus Capsule Wal1 Th i ckness
]VfND"20S'0-F-2' • *• ••• • • " ..: : .•6jB'.. •.. :

The seawater depth capability is defined by
h = ^ P = 2 .25p
where p is pressure (psi) and h is the depth potential (ft).
To inject greater accuracy in predicting the pressure necessary to yield, the von Mises criterion is employed where
" y
where a.
=f a r e
Therefore ,
^1
^2
Substituti
" y
o r
P y
= °-e
^'^x
ng,
1
0
0.
.2 1
the
= P
=
3^9
- t y 866
^1 "2 + ^2
pr incipal s t r e s s e s
r t
p r 2t
2
r
^1 2
This pressure is also included in Fig. E -1 .
In consideration of the potential blast loading, a 100-psi side on overpressure, P , is assumed. The reflected pressure , P , may be obtained from the following equation (Ref, : "Structural Effects of Impact, " by M. Kornhauser),
P = 2 P r s
7 P + 4 P o s 7 P + P o s .
p^.2(ioo)[^V(-ii!;)Vr]-^^^p-^
CQMriDEMT-hM : : :• : * : :MND*-26io-iri-2: : ^\ :.• :.. •.• :.. : : ..• ..-g; : : :.. :.• /
The reflected shock waves during diffraction are the predominant cause of damage for a high frequency structure. Assuming a sinusoidal shock pulse, an amplification factor of 1, 8 could be realized. Thus the effective pressure may correspond to 1, 8 (495) or 891 psi. It should be noted that from experimental evidence the peak pressure on a cylindrical body is significantly lower than the theoretical results. However, for this investigation, this factor may be dismissed in favor of conservatism.
From Table E-1 illustrating the structural capability versus an external pressure , a reflected pressure , including amplification, of 891 psi should provide no concern for structural integrity.
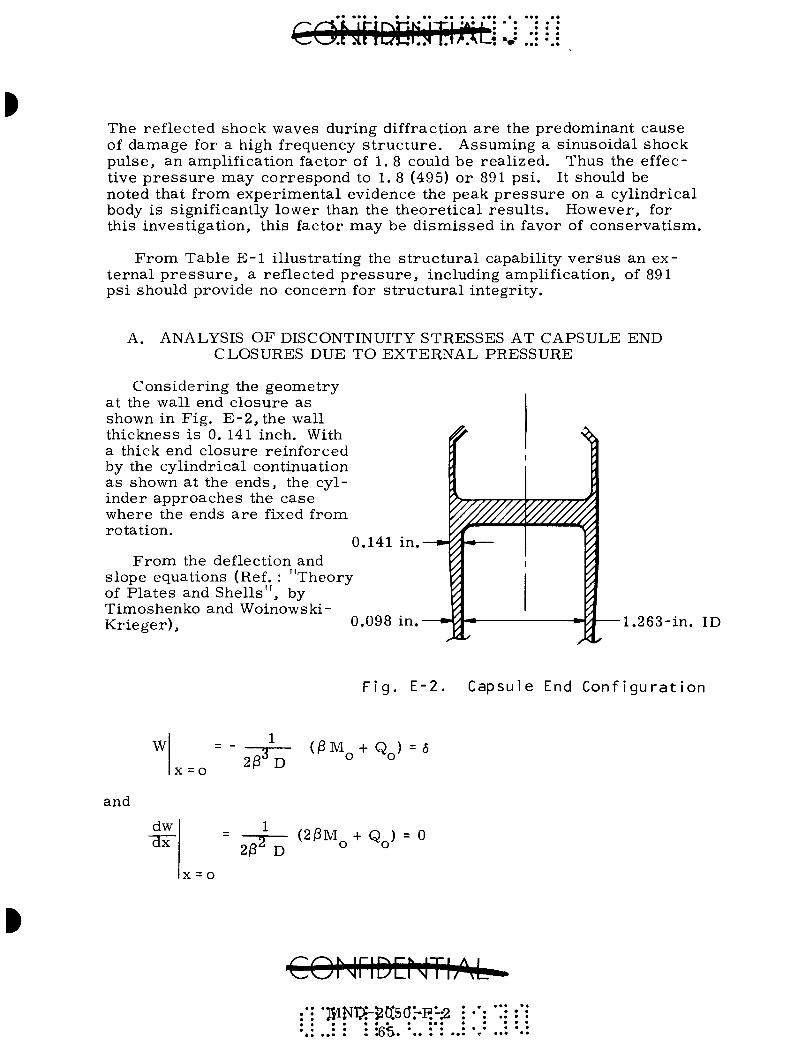
A, ANALYSIS OF DISCONTINUITY STRESSES AT CAPSULE END CLOSURES DUE TO EXTERNAL PRESSURE
Considering the geometry at the wall end closure as shown in Fig, E-2,the wall thickness is 0. 141 inch. With a thick end closure reinforced by the cylindrical continuation as shown at the ends, the cylinder approaches the case where the ends are fixed from rotation.
0.141 in. From the deflection and
slope equations (Ref. : "Theory of Plates and Shells", by Timoshenko and Woinowski-Krieger), 0.098 in. 1.263-in. ID
Fig. E-2. Capsule End Configuration
W
X = o
—gi— O M +Q)=5 2 ^ D o o
and
dw
"air — ^ (2^M^+ Q^) = 0 2^^ D o o
X = o
COMriDENTI;\<B^ •BiMH-?o:s(j;-P.-s
• • • • • • ••• • • • •fi*^ • • •
« • • • « •\J t > • • • • • *
w h e r e M and Q a r e the d i s c o n t i n u i t y mioment and s h e a r , r e s p e c t i v e l y . and
3 \ R ^ t V
1/4
P R E t
So lv ing for M and Q : o
•23M = Q ^ o o
2/3 ""D
M o
2i3^D
3 ( | 3 M ^ - 2 ^ M ^ )
^o = W- ^2^^°)
w h e r e
D Et^
i 2 ( i - r ^ )
L e t R = 1- 263 + 0 . 141 ^ ^^ ^ ^ g , t = 0. 1 4 1 , E = 3 3 . 5 x 10^ a t a m b i e n t
t e m p e r a t u r e , 7 = 0 . 3 and a s s u m e for an i l l u s t r a t i v e e x a m p l e tha t P = 4450 p s i which i s e q u i v a l e n t to a depth of 10, 000 fee t in s e a w a t e r .
1/4
^= I — ^ (0 . 702) '
10 c4uj .vcij .c111,
[0.91) j
) (0. i 4 i ) y 4 . 0 8 6
n _ 33 . 5 X 10^ (0 . 141)^ _ „„^„ ° ^ 1 2 ( 0 . 9 1 ) ^ ^ ° °
T h e r e f o r e ,
M o
4450 (0 . 702)^ (2) (4 . 086)^ (8600)
33 . 5 X 10^ (0 . 141)
COrjriDEMTIAL ;• :"-iviM'6)-2(«t)fE-3
• • • • • iRC • • • •

iOTI;^L^J J M
o = ^ o 4.086
133.3 in. - lb / in
-4450 = -1089.2 lb / in .
F r o m NASA TR-103, the mer id ional and c i rcumferent ia l s t r e s s e s at the shel l c losure interface a r e given a s
6 M _ _ " ' o ^ PR ^x - ^2 + 2t
PR ^ 2^^R %='t "- t
There fo re ,
_ 6(133.3) , '
+ «J M^ + 2 ^ °
1450(0.712) _ , , , , ,
(0 . 141)
and a = ^ ^ ^ 0 ( 0 . 702) ^ ^ " ° e 0 . 1 4 1
~2 "" 2 (0 .141) = 5 1 , 3 0 6 p s i (max)
2 ( 4 . 0 8 6 ) ^ ( 0 . 7 0 2 ) , 6 (0 .3 ) . . , , o
O - l ^ l - ( 0 . 1 4 1 ) 2 " ' ' - ' 'i 2(4. 086)(0. 702)(1089. 2)
0. 141
= -12 , 070 ps i (max).
Since the m a t e r i a l yield s t rength is in excess of 60, 000 ps i , the design is m o r e than adequate.
The major i ty of the magnitudes of the above s t r e s s e s a re of a d i s continuity in nature . Thus, yielding may take place and the resu l t is a red is t r ibu t ion of s t r e s s e s (dec rease of s t r e s s magnitude) which in no way should signify a ca tas t rophic fa i lure .
ri QhjriDDJTIAL.-•:MNBi?06tt-i;;2
• • • •fiv • • •

$
(2)
• ••>
..
.ill
^-
^
^Qi^ij^bdPm;^iii--'.:iU
APPENDIX F
FUEL CAPSULE IMPACT ANALYSIS
For impending rup tu re , the following express ion holds t rue ,
U, = U k a (F-1)
where
U,
U
U
U
w
w c
W^
g
V
= kinetic energy of the fuel capsule p r io r to impact (ft-lb)
2 g = energy absorbed by the capsule pr ior to rupture (ft-lb)
= K (U + U ) a a e p
= energy absorbed in e las t ic deformation of the encapsulant ma te r i a l (ft-lb). As an approximation.
W U J
12 p
a e y y
energy absorbed in plastic deformation of the encapsulant ma te r i a l (ft-lb). As an approximation.
U 1 c_ y u u 12 p
p c = total capsule weight (lb)
= W + W„ + W c f s
= encapsulant weight (lb)
= fuel weight (lb)
= l iner , s epa ra to r and space r weight (lb)
= acce le ra t ion due to gravity = 32. 2 f t / s ec '
= capsule velocity p r io r to impact (fps)
• • • » • • Q ^ • • • • '

:. (;^iiii:imifi)\L
K
Pc
a y
a u
^u
= absorpt ion efficiency factor (configuration-dependent) 3
= density of encapsulant m a t e r i a l ( lb/in. ) 2
= yield s t r e s s in tension (lb/in. ) 2
= ul t imate s t r e s s in tension ( lb/ in. )
= yield s t r a in (in. / in . )
= ul t imate elongation (in. / i n . ) Substituting into Eq (1),
1 W , , 2 ^ ^ c 2 g ^ "12 p ^
a e (a + CT ) e y y + -Jl u u 2 2
Rearranging,
W w = ITT c W
V 2g Ku^
(F-2)
where
w = encapsulant weight fraction (lb, encapsulant / lb total capsule) ^ (0 < w < 1) c
u = specific energy absorption (f t- lb/lb of encapsulant) 3.
CT e (CT + CT ) e y y + -^ ^ y.
12 P +
i^^NriDQilTIAL ,..^N;i>-,305O-:i?-'2
> • • • « ' : . . " ^ C l . : ;

APPENDIX G
RADIATOR STRUCTURAL ANALYSIS WITH RESPECT TO
BLAST OVERPRESSURE
Cr i t ica l ex ternal p r e s s u r e of a conical shell can be determined by a modification p resen ted in STL Report No, TR-59-0000-09959, "Semi" Annual Report on Development of Design C r i t e r i a for Elas t ic Stability of Thin Shell S t r u c t u r e s , " P . Seide, December 1959. The equation in th is re fe rence was reduced by 20% to include al l the tes t points shown in F ig . 8 of the r e fe rence . The resul t ing equation yields:
p _ 0 . 7 3 6 E t 2 ' ^
A P
where
E = Young' s modulus = 38. 2 x 10^ ps i at 550° F
t = skin th ickness
Ji - slant height
p = average slant r ad ius .
Considering the unsupported section at the wide end of the cone b e tween the abla tor mounting r ing and the heat source support s t ruc tu re , and conservat ively assuming the min imum thickness of 0.125 inch to apply over this en t i re section, the following dimensions a r e obtained:
t = 0.125 inch
/ = 8. 0 inches
_ 43 + 38.4 ^ 4 cos 18°
Substituting,
= 21.4 inches
T3 _ 0.736 X 38.2 x 10^(0.125) ' ^ _ , ^„
^^ 8 .0 (21 .4 )^ -^
CQMriDEMTIiAiL'. M N D ^ 2 0 5 0 T F : - 2 • • • « • • •••
• • • • • • \ X* * * * *

..2
.:Gr i.
•-3
KV
• •••
!•«
> !2;
• •••

APPENDIX H
THERMAL EFFICIENCY ANALYSIS
The heat losses in the sys tem occur through the module and the heat source support insulat ion. At end of life these losses a re given by:
. - ' ^ •^1 ^ e l e m e n t s J L' H " '•^cj.
1 '^i 370 watts
q 2 = i ^ ^ ^ | - C i : - ^ = 2 50 watts
where
q. = module insulation heat loss
q„ = insulation support heat loss
k, = average insulation conductivity of Min-K 2000 between 1450° and 550° F = 0.012 B tu / f t -h r - °F
_ 2 A.| = mean module a r e a = 7. 5 ft
2 A , , = total element c ro s s - s ec t i ona l a rea = 0.40 ft
e lements T „ = hot junction t e m p e r a t u r e = 1450° F T „ = cold junction t empe ra tu r e = 550° F
k = module insulation thickness = 0. 75 inch
kr, = average insulation conductivity of Min-K 2000 between 1700° and 500° F = 0.015 B tu / f t -h r - °F
2 Ag = end cap a r ea « 6 ft
^2 = heat source and insulation thickness = 3 inches
T„ = approximate hot side insulation t empera tu re at end of life = 1700° F
T„ = approximate cold side insulation t empera tu re at end of ^ life = 500° F
^OMriDEMTIAL.

With Dyna-Quartz in the module, the module heat loss would become 630 watts
( ^ : ^ D y n a - Q u a r t z " ' - ' ' 2 1 B t u / f t - h r - p )
The heat l o s se s for the two schemes a r e :
System 1 (watts)
Module insulation
Support insulation
Total
370 (Min-K 2000)
250
620
For System 1, the the rma l efficiency is
n t h e r m e lem
^tot
5040 5040 + 620
= 0.89
For System 2, the t h e r m a l efficiency is
5040 n t h e r m 5040 + 880 0.85
System 2 (watts)
630 (Dyna-Quartz)
250
880
: :•• .•.MND-2D50r-?F.-2 • • • « • • • '^A •
« • • • • • « • • •tA ^m•
APPENDIX I
THERMAL INSULATION CONDUCTIVITY DATA
The thermal conductivity data from Johns-Manville on Dyna-Quartz, Micro-Quartz and Min-K 2000 are presented in Figs. I- l through 1-7. The data should be considered preliminary since differences among the three sources on Dyna-Quartz data are apparent and since some of the Min-K 2000 data in vacuum were constructed from air data by correction factors.
CONriDCMThM- • • • • H5c • • • •

2.8r
2 . 6 -
2 . 4 -
2 . 2 -
2 . 0 -
1.8
1.6
1.4
1.2
1.0
0 . 8
0 . 6
0 . 4
0 . 2
0 0
Elevat ion (ft) P r e s s u r e (mm Hg)
A - - s e a level B- -50 ,000 C--100 ,000 D--150,000
E - -200 ,000
F - -250 ,0 00
760 87. 5
3 1.1
1.7 X 10"
1.6 X 10"
Data supplied by NAA, 1963
500 1000 1500 2000 Mean T emper a tu r e (°F)
F i g . I - l . M i c r o - Q u a r t z - - 6 p c f
2500 3000
COMriDENTJiM ;MSfDr2pK(l-:fi:-^':
• • • fyc* • • • • • • • •« ^D» • • • • • •

()
'--•*
0
7
* •>
o
^ D
QJ
tO
C
0) -
rt-
N 1 4r
\s\
"D
O
-h
D >
s ft) p
D H
fD B
TJ
CD
•1
P
C-+
11
(I)
.^
o
Th
erm
al C
ondu
ctiv
ity
/ B
tu-i
n.
Ift
-hr-
°F
o
N3
O
(1^
O
cn
o
CD
"T
" en
"T
-00
1
—
to
o
to

==:----' •feOrJnDDJThM
1.4
1.3
1.2
1. 1
1.0
0.9
0 .8
0.7
0.6
0. 5
0 .4
0 .3
0 .2
0. 1
0, 0
Tes ted and repor ted by General Dynamics AFML-TR 65-26, J anua ry 1965
_L 400 800 1200
Mean Temperature (°F) 1600
(mm H
760
10
10
10'
2000
Fig. 1-3. Dyna-Quartz--6.2 pcf
CONriDChJTIAL •r .:Mrjp-.:?er5pTF-2

2 . 2 p
2 . 0
1.8
1.6
1.4
1.2
1.0
0 . 8
0 . 6
0 . 4
0 . 2
0
jCOMPiBEtilrtiAJL i •}.:!
T e s t e d b y A . D . L i t t l e , I n c . , r a d i a l a p p a r a t u s R e p o r t e d : " I n v e s t i g a t i o n and D e v e l o p m e n t of H igh T e m p e r a t u r e I n s u l a t i o n S y s t e m s , " A F M L -T R 6 5 - 1 3 8 , J u n e 1965
- 5 1 X 10 m m H g
1 X 10 m m H g
0 500 1000 1500 2000 M e a n T e m p e r a t u r e (°F)
F i g . 1-4. D y n a - Q u a r t z - - 6 . 2 p c f
2500 3000
1.8
1.6
1.4
1.2
1.0
0 . 8 k
0 . 6
0 . 4
0 . 2
0 0
W P A F B d a t a A i r F o r c e M a t e r i a l s L a b o r a t o r y E . J . R o l i n s k i a n d L t . G. V. P u r r e l l R e c e i v e d 1 0 / 5 / 6 5
760 m m H g a i r
- 5 1 X 10 m m H g . v a c u u m
_L 500
_L J_ 2500 1000 1500 2000
M e a n T e m p e r a t u r e ( °F)
F i g . 1-5. D y n a - Q u a r t z - - 6 . 2 p c f i n A i r and Vacuum
M]V^J)-2Q&e^F*'2 •*. .* • • • • • « - ' * • t •

Th
erm
al C
ondu
ctiv
ity
[ —
g h
r-°F
c
—1
zr
n -\
3 0) —'
o o
D-
C n —
< r-f 0 -h 2 3 1 7^
M
O
O
O
§ fD
P3 3 H
(t> 3 •1
p c n
CD .
o 3
o
o
00
o
o
h-» o
o
o
tu
o
c c 3
h-*
M
o
o

2.2
2 . 0 .
1.
1.6
1.4.
1.2
• DjTia-Quartz, 6.2 pcf -Micro-Quar tz , 6 pcf -Dyna-Quartz , 4. 5 pcf
10 ^ mm Hg-
A. D. Li t t l e , Inc . AFML-TR 65-138
Genera l Dynamics ASD-TDR 63-596
WPAFB Received 10/65
Genera l Dynamics .AFML-TR-65-26
10 m m Hg
m m Hg
m m Hg
_L _L _L
mm Hg -4
10 m m Hg J_
F i g ,
500 1000 1500 2000 2500 Mean Temperature (°F)
1. Thermal Conductivity Versus Temperature
J 3000
M^Dr306:QrP.-2-. :8i:
• «• ••

• •••
•
• jz:
; ;o
••
•• h
r] I
^
dd
\**»
«
^•!
-

cdiiilibiiijtj;'!: ••= .:i
APPENDIX J
THERMOELECTRIC DATA AND INTEGRATED AVERAGES
In Figs. J-1 through J-6 the 1500-hour data, as supplied by RCA, on Seebeck coefficient, electrical resistivity, and thermal conductivity on both N-type and P-type SiGe are presented.
Figures J-7 through J-12 are integrated averages of these properties for cold junctions from 400° to 700° F and hot junctions from 1200° to 1700° F. Integrated averages are useful in hand calculations for various thermoelectric analyses.
In Figs. J-13 and J-14 the thermal resistivity and electrical r e sistivity data, respectively, on the silicon-molybdenum alloy used for the hot shoe are given.
•COhJriDDJTIA MND.-20 50L-Ji:,2...
» • •33

200,-
0 200 400 600 800 1000 1200 1400 1600 1800 Temperature (°F)
Fig. J-1. Absolute Seebeci< Coefficient for SiGe, N Element, Data Compiled 11/65
175r-
0 200 400 600 800 1000 1200 1400 1600 1800 Temperature (°F)
Fig. J-2. Seebeck Coefficient for SiGe, P Element. Data Compiled 11/65 ^
co^J lD:NTl;M= • •» • • . MNDr21)£iO-:fe-2 ••• •• ••
• • • *rk*A • *

€Qt4dDCUTl/C^ ^ 0 .:i
2400r
200 400 600 800 1000 1200 1400 1600 1800
Temperature (°F)
Fig. J-3. Electrical Resistivity for SiGe, N Element. Data Compiled 11/65
1600r
t 1200
-t->
•r-t > •H
m m 800 0)
1 — I
aj o
o I—)
400
J L J L 0 200 400 600 800 1000 1200 1400 1600 1800
Temperature (°F)
Fig. J-4. Electrical Resistivity for SiGe, P Element. Data Compiled 11/65
CONriDENTI M 5 « • • i - . i - * * * :
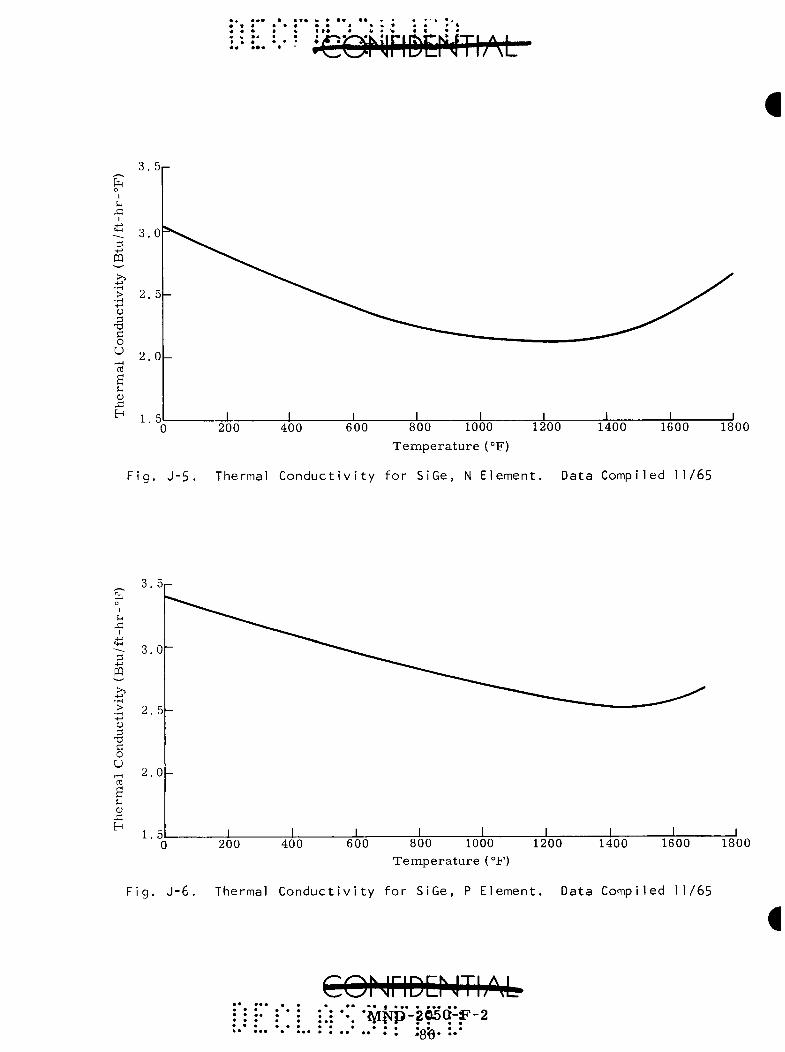
3. 5,-
3.0-
2. 5-
2.0-
1. 5L _l l_ 200 400
_L X _L J 600 800 1000 1200 1400 1600 1800
Temperature (°F)
Fig. J-5. Thermal Conductivity for SiGe, N Element. Data Compiled 11/65
3.5n
3.0-
2. 5
2.0
1.5 J_ _L _L J- _L J 200 400 600 800 1000 1200 1400 1600 1800
Temperature (°F)
Fig. J-6. Thermal Conductivity for SiGe, P Element. Data Compiled 11/65
• • • • *• •• t ••• • ••• ••
••. •iVI^fp-2Cli5Q-S'-2 • • • - •«•« * -
•86-•««• ••

( )
« •!
• « I
190
186
fa O
3.
^ 182 0)
(P o
U
o D
X! OJ
178
174 -
170 400
±
Tjj ( ° F )
1700
F i g . J - 7 .
500 600
Cold Junction T e m p e r a t u r e (°F)
I n t e g r a t e d Average Seebeck C o e f f i c i e n t f o r S iGe , N E l e m e n t . Da ta Comp i l ed 11/65
700
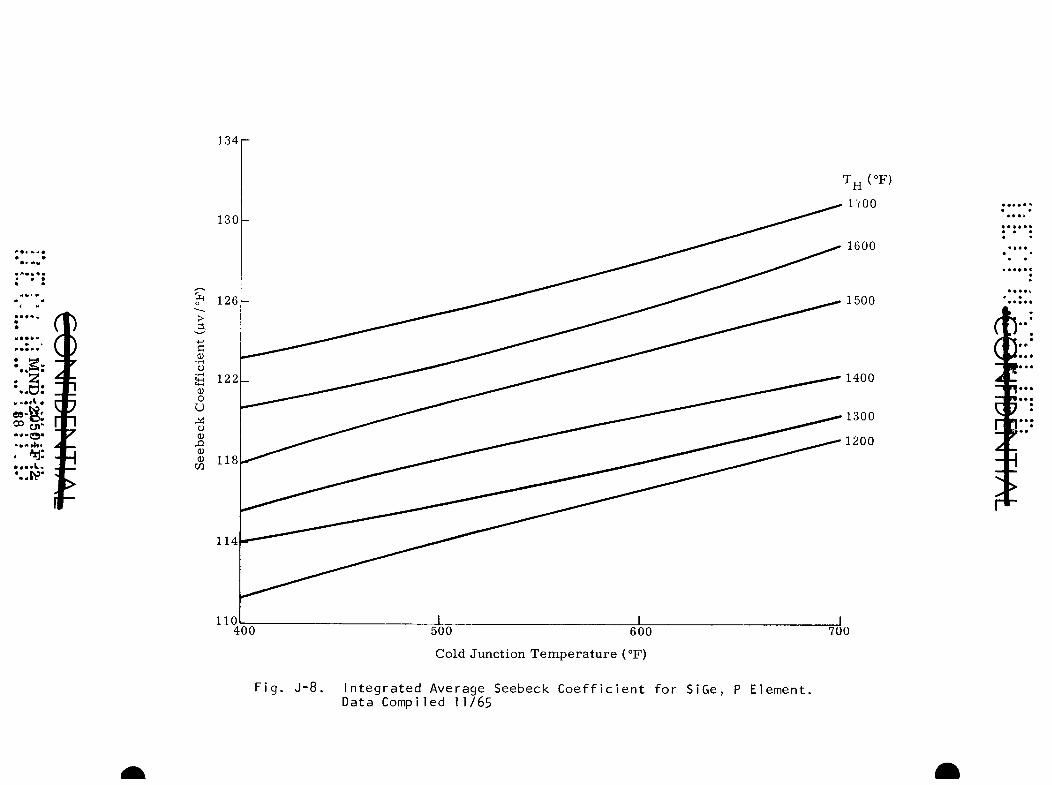
134
. ^ :
•..ft?"
fa o
3,
0)
D O
u o (U
X! (U <u OT
no 400 500 600
Cold Junction T e m p e r a t u r e (°F)
F i g . J - 8 . I n t e g r a t e d Average Seebeck C o e f f i c i e n t f o r S iGe , P E lemen t , Data Comp i led 11/65
Tj j ( °F )
1700
1600
700
• ••
( f c "
(}:: *" IP*
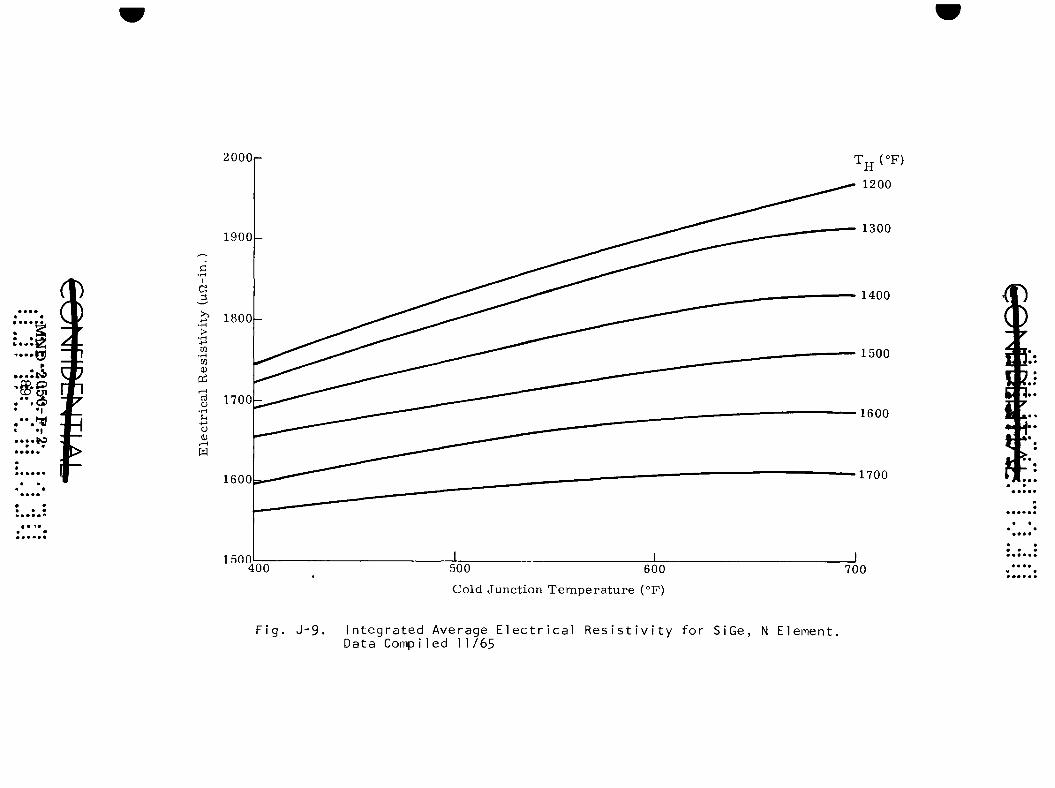
2000
• •
-....(rj)
• •! • - . ^ « •!
*
• • • *•• • « • • • • • 5 *
1900-
a
03 0!
• — I
oJ o
o
. — I
1800-
1700-
1600
1500 400 500 600
Cold Junction T e m p e r a t u r e (°F)
Tjj(°F)
1200
1300
1400
1500
1600
1700
700
( )
? -
Fig. J-9. Integrated Average Electrical Resistivity for SiGe, N Element. Data Compiled 11/65
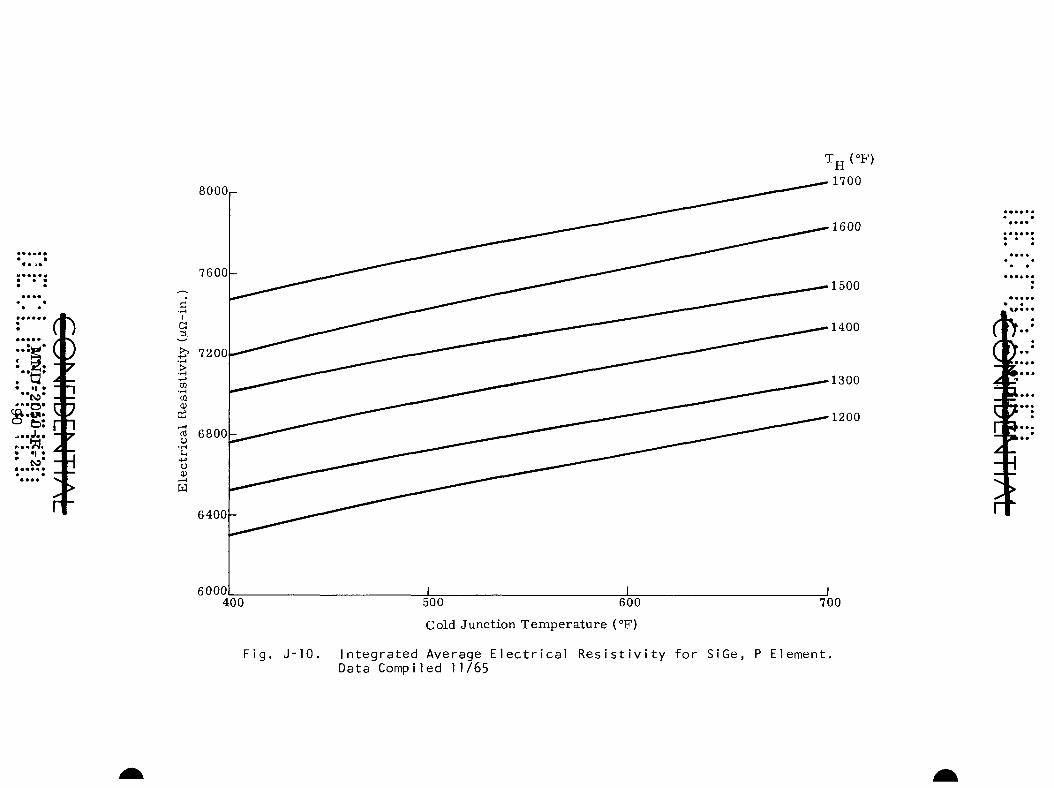
*>r^»
. t3
s « •! « ' to*
8000
7600
>
tn (U
D5
7200
g 6800
o 0) W
6400
6000 400 500 600
Cold Junction Temperature (°F)
Tjj (°F)
1700
1600
700
Fig. J-10, Integrated Average Electrical Resistivity for SiGe, P Element, Data Comp iled 11/65
r »
r^
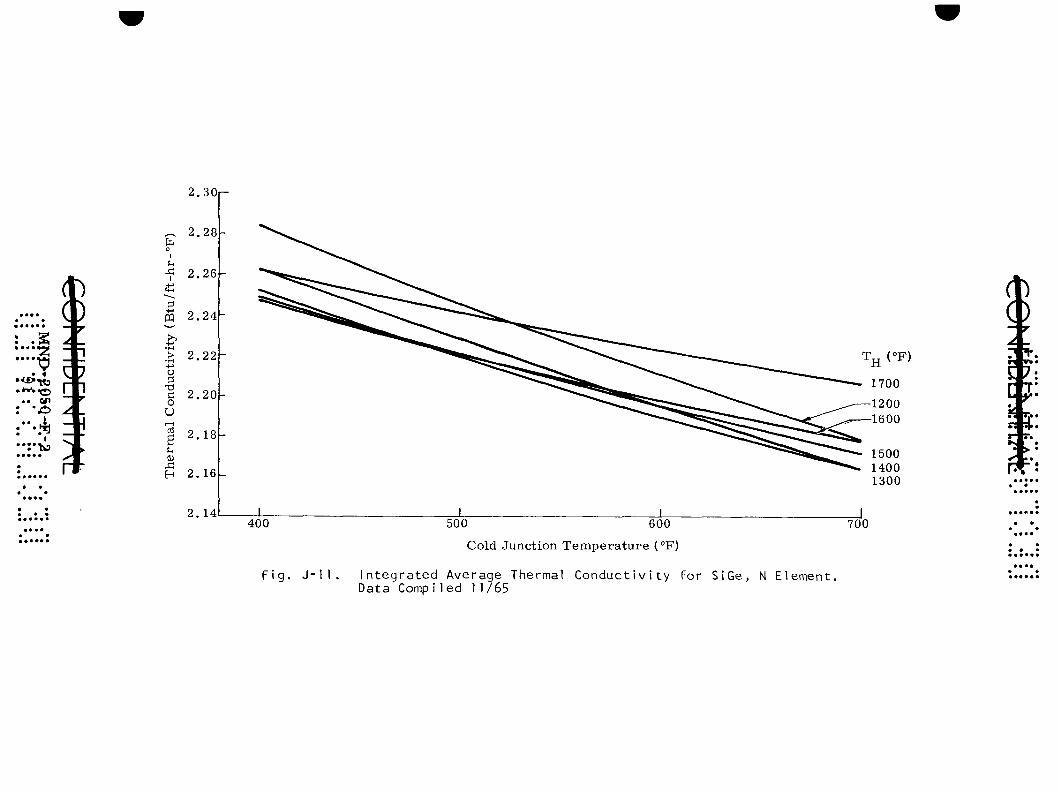
2.30r
^ 2,2e
* 4
; ' ^ " tin
: ' ^
Si I
:3
£
> -t-» o T3 C O U ,—I
a u D
H
2 . 2 6 h
2.24h
2 . 2 2 h
2 ,20h
2,18k
2.16
Tjj (°F)
1700
1200 1600
1500 1400 1300
O
2.14L 400
F i g . J -1 1
500 600
Cold Junction T e m p e r a t u r e (°F)
I n t e g r a t e d Average Thermal C o n d u c t i v i t y f o r S iGe , N E l e m e n t . Data Comp i l e d 11/65
700
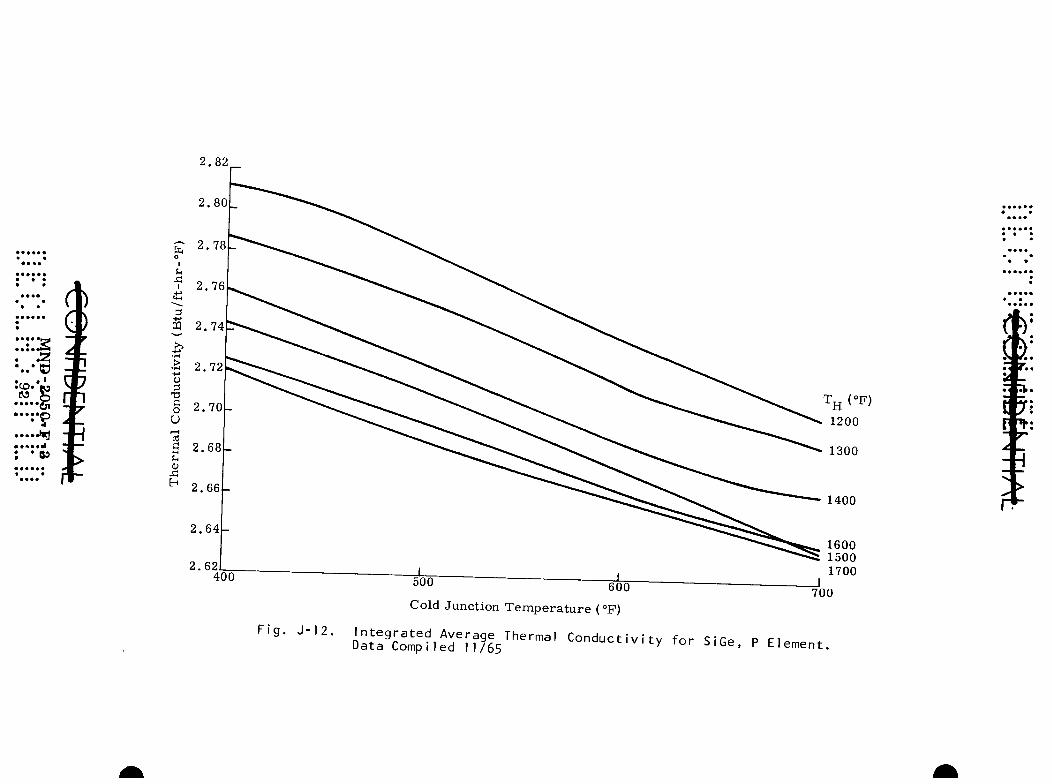
2.82
-»***JI
•:*f
2 , 8 0 L
fa 2.78
3
•H
o 3
C o O
u X!
2,74C:
2,72
2 .70L
2 , 6 8 L
2 .64U
2.62 400
600
J - 1 2 .
1600 1500 1700
Cold Junction Tempera tu re (°F)
I n t e g r a t e d Average Thermal C o n d u c t i v i t y f o r S iGe , P El Data Comp i led 11/65
700
ement .
• • • » • • • I •
• « •
* • I S
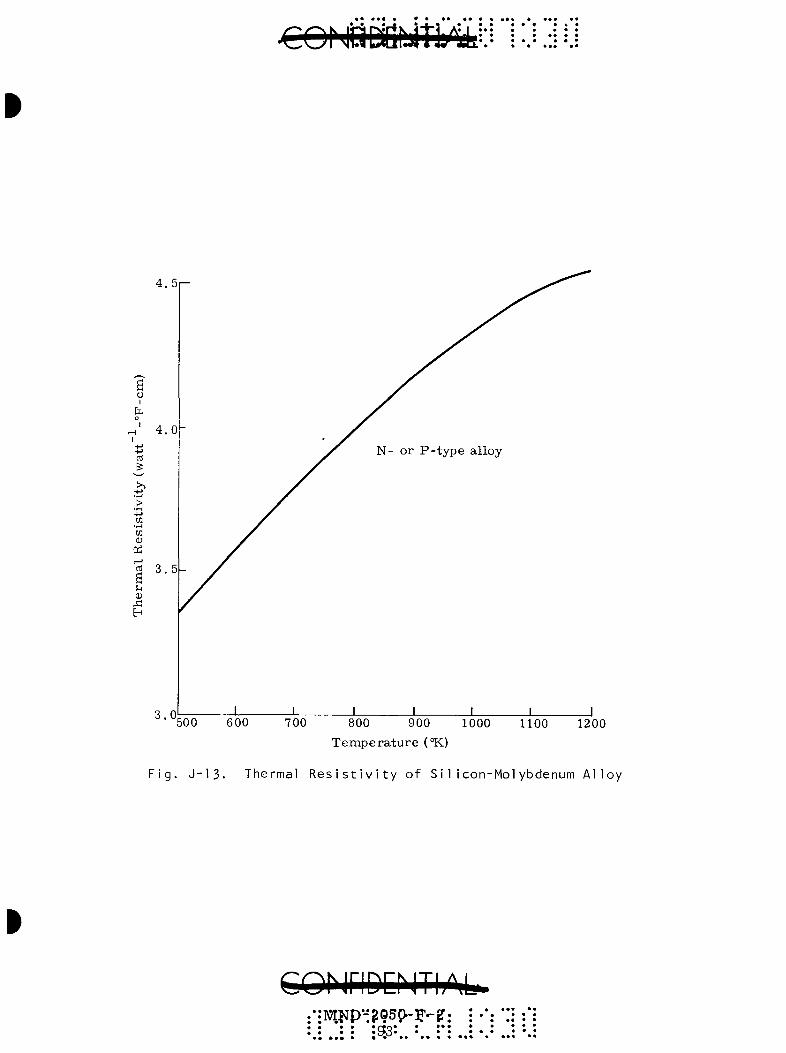
CONttiailiitL^
4 . 5 | -
a o I
fa ^ ' 4 . 0
as
>
to ID
Qi I — I
a ' • u <v si H
3.0 500 600 700 800 900 1000
T e m p e r a t u r e (°K) 1100 1200
F i g . J - 1 3 . Thermal R e s i s t i v i t y o f S i l i c o n - M o l y b d e n u m A l l o y
COhiriDDIThMa. • • •rfo* • ••
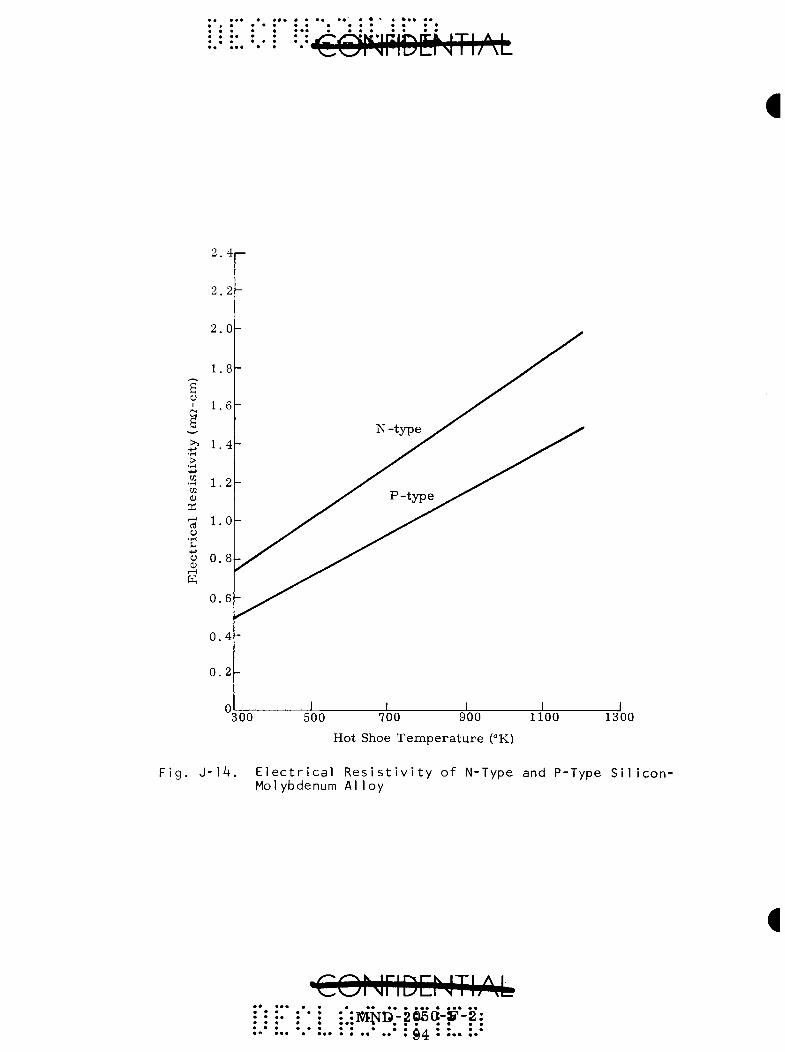
•= =:•=••= ••= CCirJFlbltf JThM
300 500 700 900 1100
Hot Shoe Temperature (°K)
1300
Fig. J-14. Electrical Resistivity of N-Type and P-Type Silicon-Molybdenum Alloy
COMriDD JTIAl-* • » • • • • • • * * * * *
• • •• • Q4 * *** **
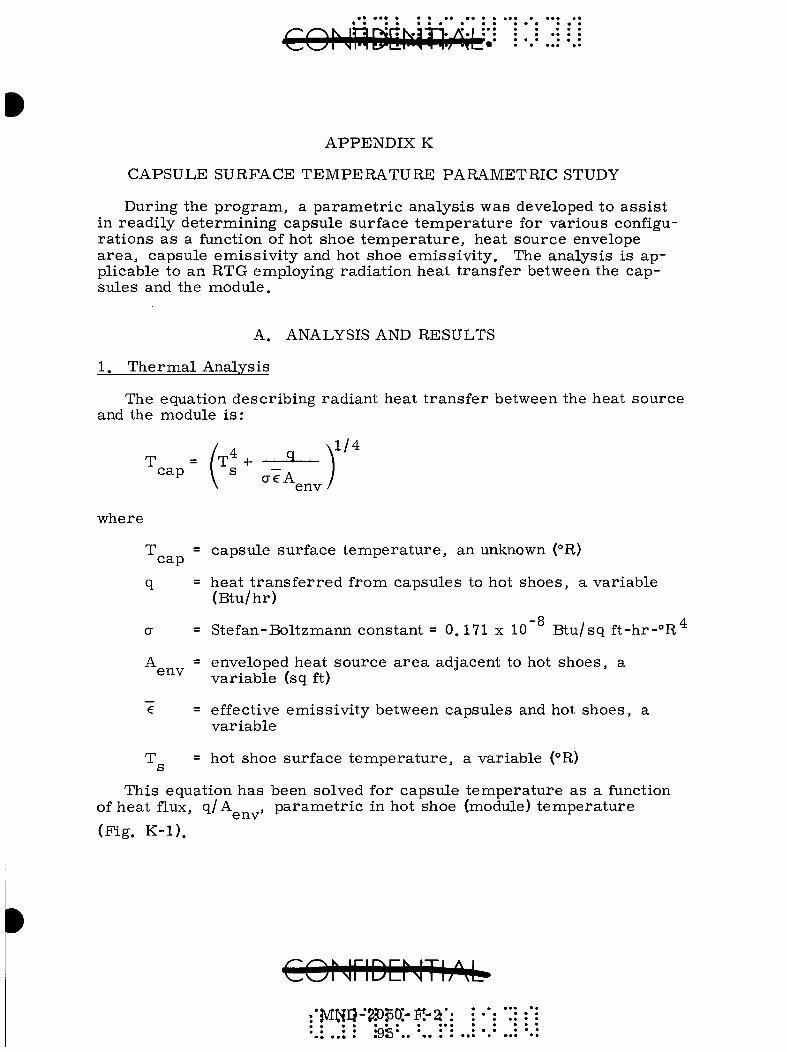
APPENDIX K
CAPSULE SURFACE TEMPERATURE PARAMETRIC STUDY
During the program, a parametric analysis was developed to assist in readily determining capsule surface tem.perature for various configurations as a function of hot shoe temperature, heat source envelope area, capsule emissivity and hot shoe emissivity. The analysis is applicable to an RTG employing radiation heat transfer between the capsules and the module.
A. ANALYSIS AND RESULTS
1. Thermal Analysis
The equation describing radiant heat transfer between the heat source and the module is :
x env /
where
T = capsule surface temperature, an unknown (°R)
q = heat transferred from capsules to hot shoes, a variable
(Btu/hr)
a = Stefan-Boltzmann constant = 0.171 X lO" Btu/sq ft-hr-°R'*
A = enveloped heat source area adjacent to hot shoes, a ^^^ variable (sq ft)
e = effective emissivity between capsules and hot shoes, a variable
T = hot shoe surface temperature, a variable (°R)
This equation has been solved for capsule temperature as a function I eat flux
(Fig. K-1). of heat flux, q/A , parametric in hot shoe (module) temperature
COMriDEMTIA^
• • • « •• • • • * •• « • • •
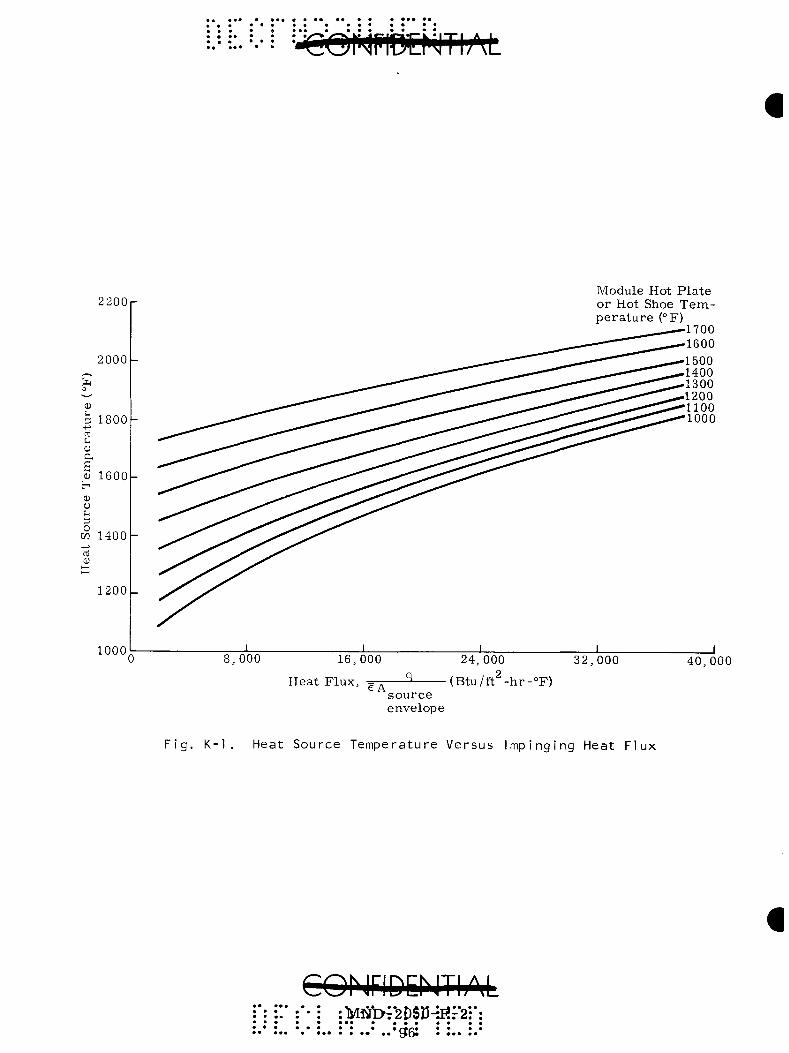
2200
2000
3 1800 -t->
oi
0) s 0) 1600 H D O t j 3
OT 1400 +-» oJ CD
1200
Module Hot P la te or Hot Shoe T e m p e r a t u r e (°F)
1700 1600 1500 1400 1300 1200 1100 1000
1000 X _L _L J 0 8,000 16,000
Heat Flux e A
24,000
(Btu / f t^ -hr -°F)
32,000
source envelope
40.000
Fig. K-1. Heat Source Temperature Versus Impinging Heat Flux
lvnJb;^ti$D-ifif2 *• • • • • • • • *• •• 3D* • •••

2. Emiss iv i ty Analysis
The effective emiss iv i ty , e , can be re la ted to individual ma te r i a l emis iv i t ies by the express ion
e =
e e cap
+ ^ - 1
where
e = capsule emiss iv i ty
e = hot shoe or module hot plate emiss ivi ty
This equation was solved pa r a me t r i c a l l y in e and e , and the
r e su l t s a r e presented in Fig. K-2,
A likely m a t e r i a l for the capsules will be Haynes-25, Variously measu red emiss iv i ty data a r e given in Fig, K-3 .
For the case of a SiGe genera tor , the SiMo hot shoes would be direct ly exposed to the fuel capsules . The emiss ivi ty of this ma te r i a l is presented in Fig, K-4 as a function of t empera tu re .
3. Envelope Area Analysis for Cyl indrical Heat Source
This is an analys is of the envelope a r e a of a cylindrical heat source consist ing of m bays of n capsules per bay. Defining the m x n ma t r ix in this way provides a p a r a m e t r i c tool for the analysis of several heat source configurations. The total number of capsules in the heat source is given by N = mn. A 12-capsule heat source having a 2 by 6 mat r ix (2 bays of 6 capsules pe r bay) has been i l lus t ra ted in Fig. K-5. Heat t ransfe r is assumed to occur radia l ly from the p e r i m e t e r of the bay, p , over the length of two bays (2 L ).
Envelope a r e a is therefore given by
A = mpL env ^ c
Calculation of the heat t r ans fe r a r e a depends on the type and quantity of fuel, number of capsu les , fuel capsule configuration, and heat source configuration or ma t r ix . Cons t ra in t s have been made on these p a r a m e t e r s to simplify the study and pe rmi t meaningful r esu l t s to be obtained. These const ra ints a r e further descr ibed in the following pa ragraphs .
CQMriDDITliM MjND":2p^07F-:^
• • * Q T * * *
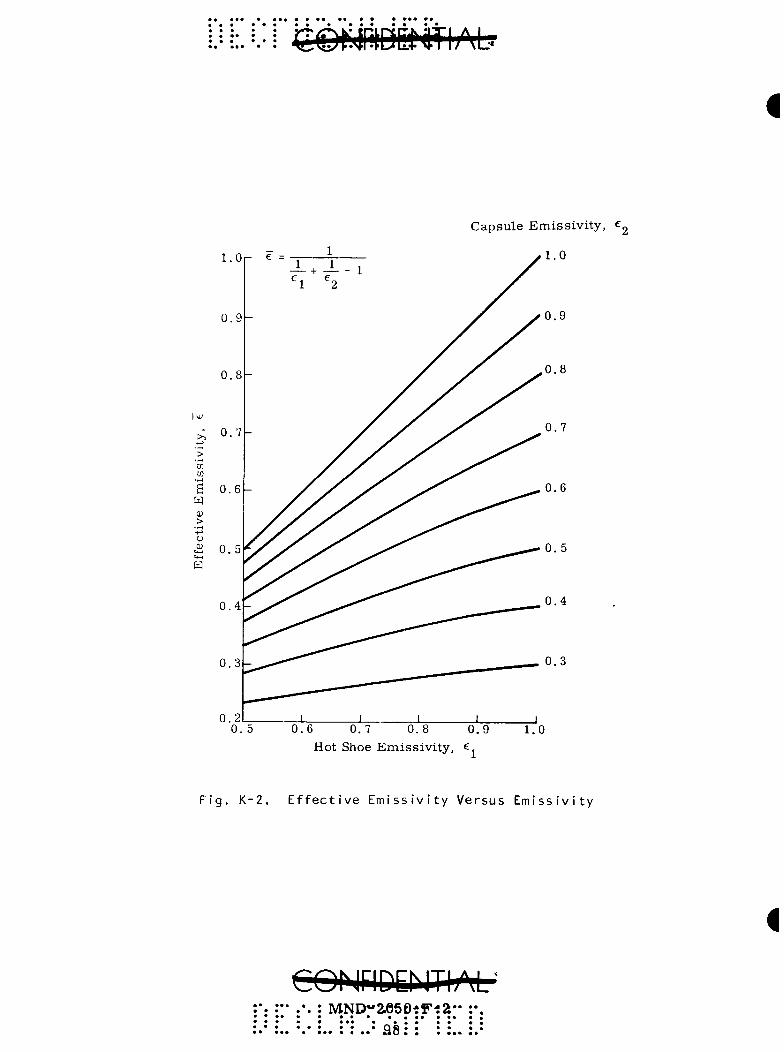
\}U-\ {^©mmi^M'
Capsule Emiss iv i ty , e^
1.0
0.9
0.8
0.7
0.6
0 .5
0.4
0.3
0. 5 0.6 0.7 0.8 0,9 1,0 Hot Shoe Emiss iv i ty , ^^
F i g . K - 2 , E f f e c t i v e E m i s s i v i t y Ve rsus E m i s s i v i t y
MND"2^60tF-:2" • • • • • • • • • • • •• • • • • • • • • • • * • •30 • • • • •
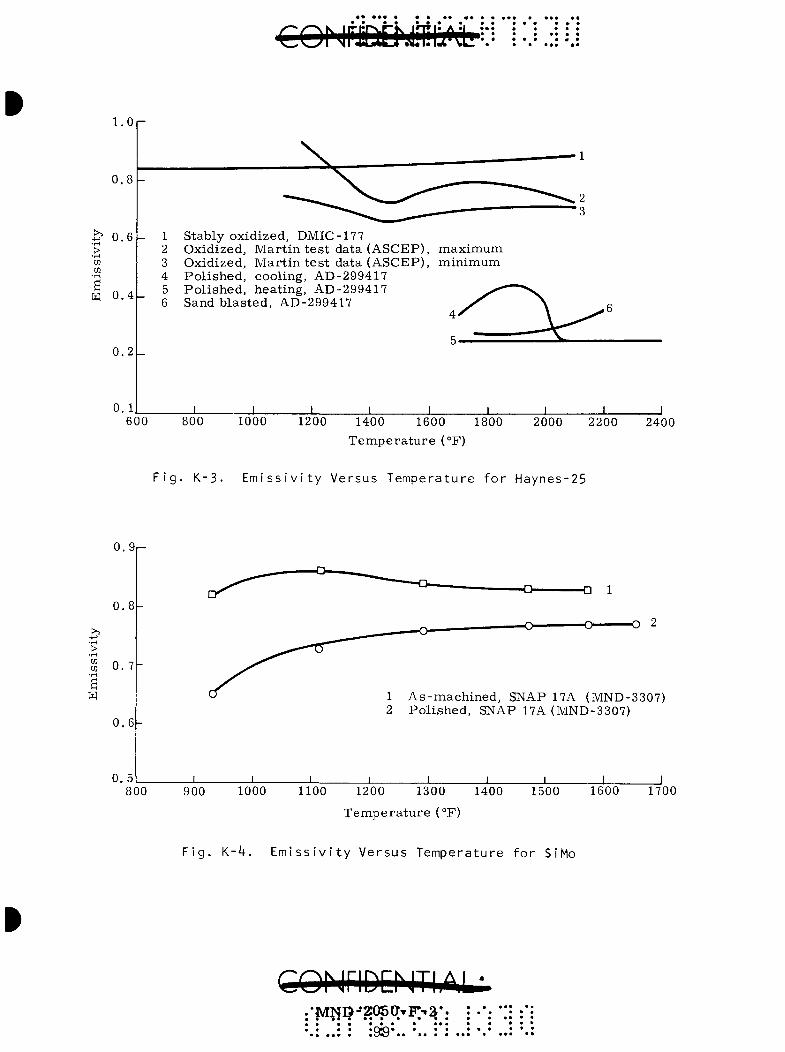
€0NFtOJ!ti:t^JiH i:.i.:i!j
1.0
0.8
0.6
0.4
0 . 2 -
0.1
Stably oxidized, DMIC-177 Oxidized, Mar t in t es t data (ASCEP), maximum Oxidized, Mar t in t e s t data (ASCEP), minimum Pol ished, cooling, AD-299417 Pol ished, heating, AD-299417 Sandb la s t ed , AD-299417
4
J_ _L J 600 800 1000 1200 1400 1600 1800 2000 2200
Temperature (°F)
2400
Fig. K-3. Emissivity Versus Temperature for Haynes-25
0.9
0.8
0. 7
0.6
0,5 _L J _
a 1
O 2
1 As-machined , SNAP 17A (MND-3307) 2 Pol ished, SNAP 17A (MND-3307)
_L _L J 800 900 1000 1100 1200 1300 1400
Temperature (°F)
1500 1600 1700
Fig. K-4, Emissivity Versus Temperature for SiMo
CQhiriDEhlTliA,U • • t * • • • • • »

1
T^ / X \ I
D^ltyp)-" L 1 c 1
• ^
Fig. K-5. Cylindrical Heat Source Having 2 x 6 Matrix
It was first assumed that the fuel capsule is a right circular cylinder having an internal fuel volume defined by the fuel length, L„, and diameter, D,, and external dimensions, L and D . Actually, capsule wall thickness and end cap dimensions will depend largely on its required impact resistance, which is the subject of another study. As a simplification, it was assumed that D = 1. 30 D„ and that L ' c f c Lj + 0. 75 Dj. This neglects minor area differences which arise from different impact requirements, and it gives all capsules under consideration nearly equal impact resistance.
In considering various heat source configurations, it will be assumed that the type of fuel and its required thermal output, q, at beginning of life are known. Two charts have been prepared to relate the number of capsules, N, the fuel volume, Vj,, per capsule, the ratio Lj,/D„, and the fuel diameter, D». These charts are shown as Figs. K-6 and K-7, and their use is self-explanatory. The selection of L~/D~, D- and N is somewhat discretionary at early stages of the heat source design and is based largely on past SNAP experience.
:filNp-'2e)50TF:r2

SrTiO,
100 200 300 400 500 600 700 800 900 1000
Capsule T h e r m a l Loading, q-o^j (per capsule) = — ^ - ^ (wat ts /capsule)
F i g . K - 6 . Fuel Volume V e r s u s Capsu le Thermal L o a d i n g
•MND-2:050 'TF- -2 . ' • « • • • • • * • • : : : ito-i: » • • • • V •

•o: 3] A. V l / ,M.. ® : r r
•.JM* q
u -H (U
B
Fuel Length-to-Diameter Ratio
10 20 30 40 50
IT.
l:
Fuel Volume (in. )
Fig, K-7. Fuel Diameter Versus Fuel Volume per Capsule
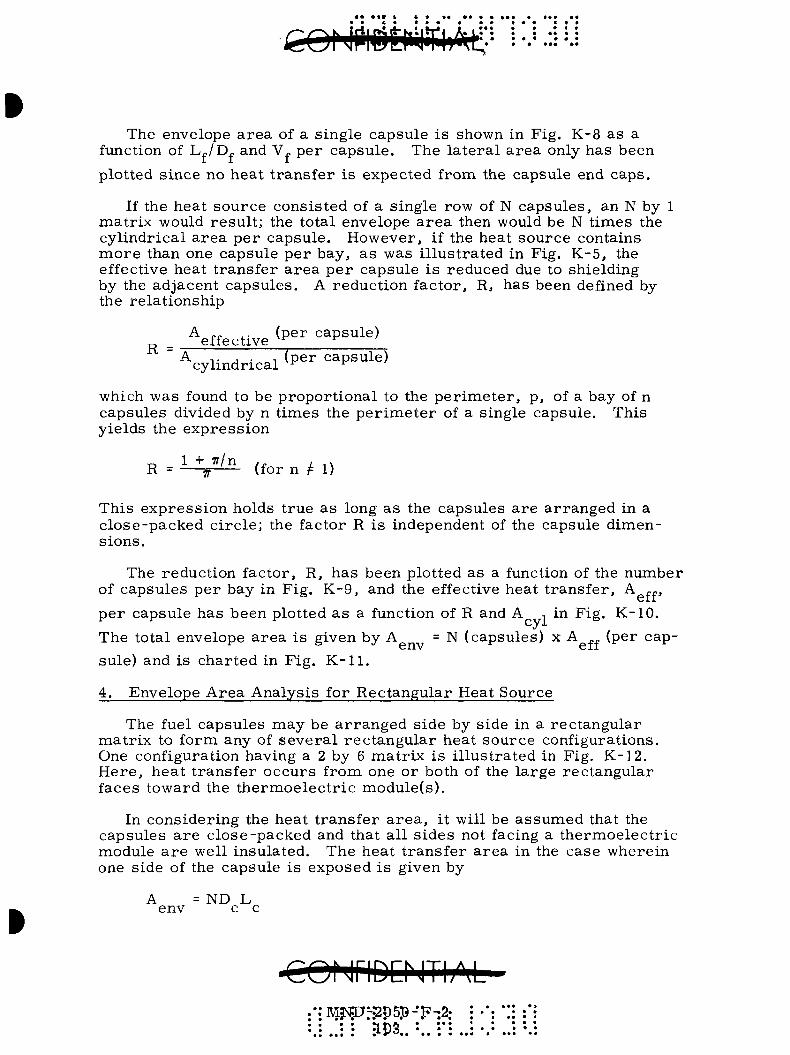
The envelope a r ea of a single capsule is shown in Fig. K-8 as a function of L~/Dj, and V„ per capsule . The l a t e ra l a rea only has been
plotted s ince no heat t r ans fe r is expected from the capsule end caps .
If the heat source consisted of a single row of N capsules , an N by 1 mat r ix would resu l t ; the total envelope a r e a then would be N t imes the cyl indrical a r ea pe r capsule. However, if the heat source contains m o r e than one capsule p e r bay, as was i l lus t ra ted in Fig. K-5 , the effective heat t ransfer a r ea p e r capsule i s reduced due to shielding by the adjacent capsules . A reduction factor , R, has been defined by the relat ionship
A „_ . (per capsule) „ effective ^ ^ ^cy l indr i ca l ^P^^ capsule)
which was found to be proport ional to the p e r i m e t e r , p , of a bay of n capsules divided by n t imes the p e r i m e t e r of a single capsule. This yields the express ion
„ 1 + 7r/n ,„ , .^ R = jf (for n /= 1)
This express ion holds t rue as long as the capsules a r e a r ranged in a c lose-packed c i rc le ; the factor R is independent of the capsule dimensions .
The reduction factor, R, has been plotted as a function of the niimber of capsules per bay in Fig. K-9 , and the effective heat t rans fe r , A r.^,
p e r capsule has been plotted a s a function of R and A -, in Fig. K-10.
The total envelope a rea is given by A = N (capsules) x A (per cap
sule) and is char ted in Fig. K-11 .
4. Envelope Area Analysis for Rectangular Heat Source
The fuel capsules may be a r ranged side by side in a rectangular ma t r ix to form any of s eve ra l r ec tangu la r heat source configurations. One configuration having a 2 by 6 ma t r ix is i l lus t ra ted in Fig. K-12. He re , heat t r ans fe r occurs from one or both of the large rec tangular faces toward the the rmoe lec t r i c module(s) .
In considering the heat t ransfe r a r e a , it will be assumed that the capsules a r e c lose-packed and that al l s ides not facing a the rmoelec t r i c module a r e well insulated. The heat t ransfe r a rea in the case wherein one side of the capsule is exposed is given by
A = ND L env c c
COMriDQJTbM
• • • • "IDS •.

140,-
120
100
^ 80 m Q.
U
OJ 60
40
2 0 -
L j / D j = 10
5 10 15 20 25 30 35 40 3
Vf pe r Capsule (in. )
F i g . K - 8 . Capsu le C y l i n d r i c a l Area Ve rsus Fuel Volume
45 50
1.0
cc u. 1
u o +->
^ 0.6 c o
I •3.4 ai a cu
<: 0 . 2 -
0
F o r rec tangle , 2 s ides exposed, R = 0.636 F o r rec tangle , 1 side exposed, R = 0.318
1 2 24 36 4 5 6 7 8 9 10 11 12 Capsules pe r Bay (No.)
F i g . K - 9 . A rea R e d u c t i o n F a c t o r f o r C y l i n d e r s V e r s u s Number o f Capsu les pe r Bay
ft • • » • • • • « •
.MNI>Ta(!50rJ>-2 : im
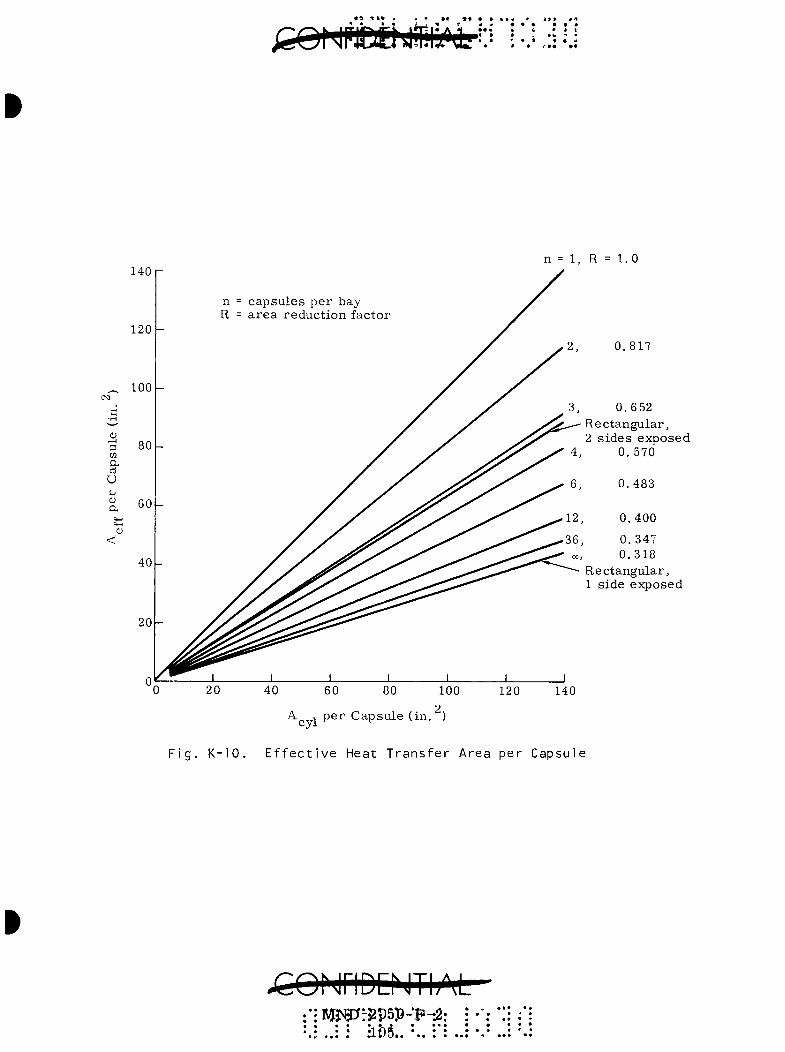
n = 1, R = 1.0 140
120
_ 100
3 m a O u a
<;
80
60
40
20
n = capsules pe r bay R = a r e a reduct ion factor
0.817
3, 0.652 Rectangular , 2 s ides exposed
4, 0.570
0.483
12
36 O O j
--- R 1
0
0 0
ectan side
400
347 318
gular . expose d
A , per Capsule (in. )
Fig. K-10. Effective Heat Transfer Area per Capsule
;CONriD:NTI;M KB«Jr!2p5P-'pT2

C C( ' k < *
Number of capsules, N = 72 60 48
A „„ per Capsule (in. ) 120 140
Fig. K-11. Heat Source Envelope Area
€ONriD:NTIAL . : MND-:2SQ5PTF-:2{
;i306 • »l*)n • • • •
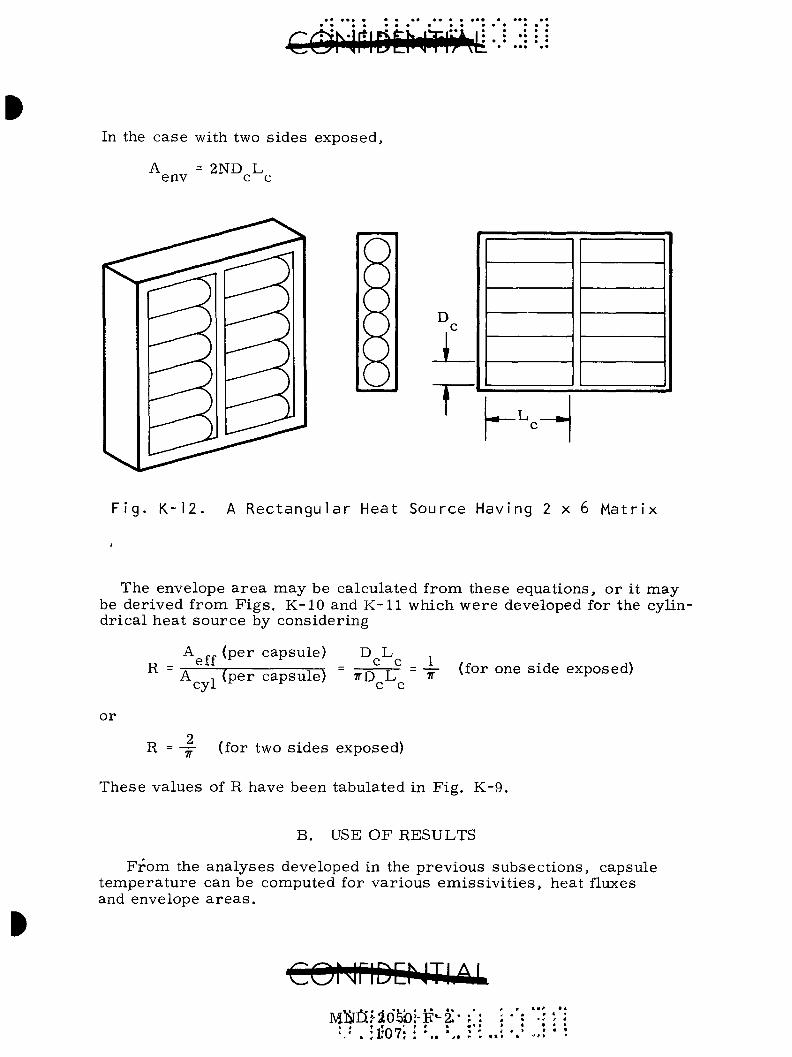
In the case with two sides exposed.
A = 2ND L env c c
D c
y
. _
h^H Fig. K-12. A Rectangular Heat Source Having 2 x 6 Matrix
The envelope a r e a may be calculated from these equations, or it may be derived from F igs . K-10 and K-11 which were developed for the cylindr ica l heat source by considering
R A -. (per capsule) D L
eff ^ A T (per capsule, _
cyl ^ ^ c c
o r * 1 1 = -T-) T = "JT ^^^^ ^"^^ side exposed)
or
R = IT (for two s ides exposed)
These values of R have been tabulated in Fig. K-9.
B. USE OF RESULTS
F r o m the analyses developed in the previous subsect ions , capsule t empera tu re can be computed for var ious emis s iv i t i e s , heat fluxes and envelope a r e a s .
" • ' I'D 7* * ^ • ^ " ' • * .
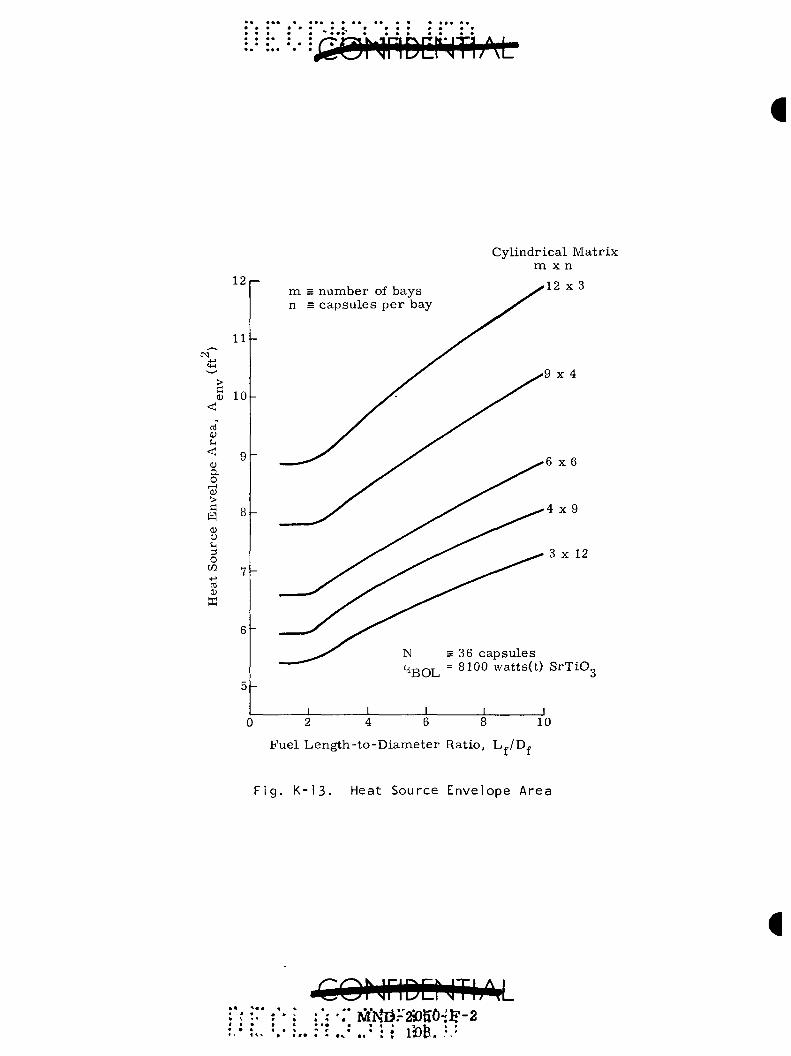
• • • » • •
• • • * • ;SG)NPID[ir^Ti;M-
1 2 , -
1 1 ^ I N
> S 10
(D
u < <u a, o
>
(1) o u 3 o en +-> oi 0)
6h
5h
m = number of bays n = capsu les p e r bay
Cyl indr ica l Mat r ix m X n
12 X 3
9 x 4
6 x 6
4 x 9
3 X 12
= 36 capsules •^BOL " ^^°° watts(t) SrTiOg
) 2 4 6 8 10
Fuel Leng th - to -Diamete r Ratio, L„/D„
F i g . K - 1 3 . Heat Source Enve lope A rea
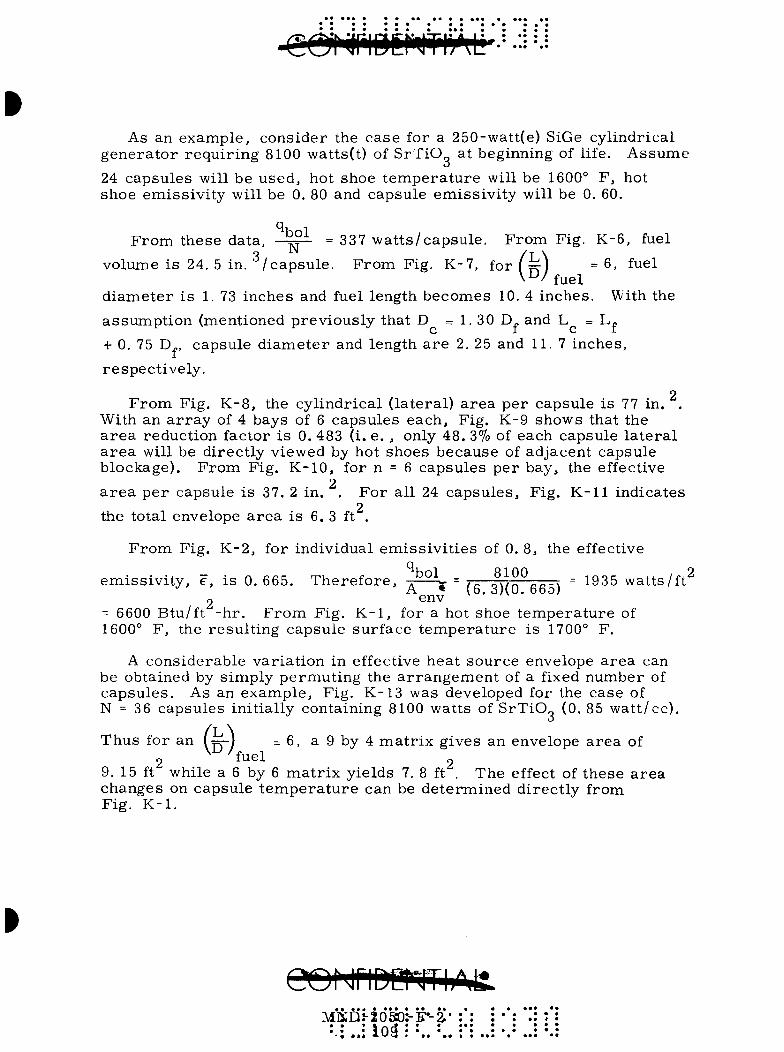
As an example, consider the case for a 250-watt(e) SiGe cylindrical genera tor requi r ing 8100 watts(t) of SrTiO at beginning of life. Assume
24 capsules will be used, hot shoe t empera tu re will be 1600° F , hot shoe emissivi ty will be 0. 80 and capsule emiss ivi ty will be 0. 60.
q, , F rom these data, -^^ = 337 wat t s / capsu le . F rom Fig. K-6, fuel
volume is 24. 5 in. / capsu le . F rom Fig. K-7, for ( ^ ) =6 , fuel V^^fuel
d iamete r is 1. 73 inches and fuel length becomes 10. 4 inches. With the
assiomption (mentioned previously that D = 1. 30 D. and L = Lf
+ 0. 75 D^, ca
respect ively .
+ 0. 75 D„, capsule d i ame te r and length a r e 2. 25 and 11.7 inches.
2 F r o m Fig. K-8 , the cyl indrical ( la teral) a r ea per capsule is 77 in. .
With an a r r a y of 4 bays of 6 capsules each. Fig. K-9 shows that the a r e a reduction factor is 0. 483 (i. e. , only 48. 3% of each capsule l a t e ra l a r e a will be direct ly viewed by hot shoes because of adjacent capsule blockage). F rom Fig. K-10, for n = 6 capsules per bay, the effective
2 a r e a pe r capsule is 37. 2 in. . For all 24 capsules . Fig. K-11 indicates
2 the total envelope a r ea is 6. 3 ft .
F r o m Fig. K-2, for individual emiss iv i t i es of 0. 8, the effective
emiss iv i ty , e, is 0. 665. There fo re , -j ^ = ,„ „>,. „ ^ ^ . = 1935 watts /f t ' 2 env ^ • '^ •
- 6600 Btu/ft -hr . F r o m Fig. K - 1 , for a hot shoe t empera tu re of 1600° F , the resul t ing capsule surface t empera tu re is 1700° F.
A considerable var ia t ion in effective heat source envelope a rea can be obtained by simply permut ing the a r rangement of a fixed number of capsules . As an example , Fig. K-13 was developed for the case of N = 36 capsules initially containing 8100 watts of SrTiO (0. 85 wat t /cc) .
Thus for an (pr-) = 6 , a 9 by 4 m a t r i x gives an envelope a rea of
2 ^ ^ ^ 1 2 9. 15 ft while a 6 by 6 m a t r i x yields 7. 8 ft . The effect of these a rea changes on capsule t e m p e r a t u r e can be determined direct ly from Fig. K - 1 .
MMnh20S0hF*-2.-

• ••
>•
• •
•
• •••
« •• ©
.,..g
•
**]
•••t
c
$ «?
r
« ••
• • •
•
^
^
^

• • « • • • •
• • • • • _• • • •• • • •
cg>rr'iDiiNTi-A[i--=-:
APPENDIX L
SiGe VERSUS PbTe RTG COMPARISON
A. ANALYSIS
1. SiGe System
By use of the the rmoe lec t r i c (T/E) analysis repor ted in Appendix Q and the hot junction t e m p e r a t u r e , cold junction t empera tu re , RCA r e ported contact r e s i s t iv i ty and element length chosen for this study (Table L-1) , the following T / E per formance figures hold for SiGe:
•^N 2 element ~ ^'^^^ ^^' ( s e r i e s -pa ra l l e l )
•^p 2 element ^ 0.056 in. ( se r i e s -pa ra l l e l ) .
The sys t em overa l l efficiency (see Table L-1) is
""ols. - " T / E " the rm V B ^ r e g ^ < - ° ^ ^ ' ' ' » • " ' " ' • ' ' ' ' " • ' " '
.0412 or 4. 12%
The end-of-life fuel inventory is
p _ o. net _ 250 watts _ cnon ++
" I E O L - i r ; 0.0412 - ^°^° ^ ^ "^ • o / a
The fuel volume (SrTiO„) is given by (5-yr life)
a e^^ XT - - ! E O L _ l _ 6080 (1.132) „,__ 3 .^^ • 3 Vfuel - ^ = 0785 = ^1°° '^^ = ^^^ ^^- •
The fuel weight is
^ f u e l ^ '^^fuel "" 3-^3 g m / c m ^ x 8100 cm^ = 31, 000 g r a m s =
68. 5 pounds of fuel.
*This value applies only to the cyl indr ical RTG and does not equal that of the selected re fe rence configuration presented e l sewhere .
•• ••• • ••• « •• « • MND:-2a3Q-F-2' • • • • • • • •
• ••
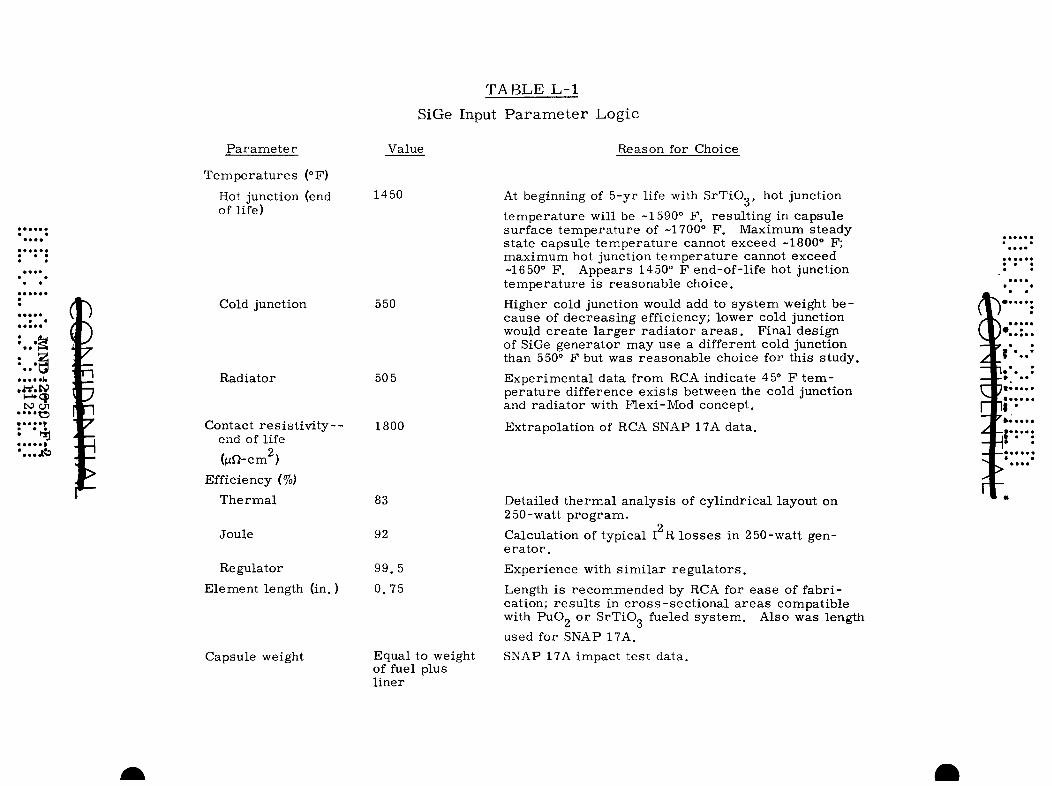
TABLE L-1
P a r a m e t e r
T e m p e r a t u r e s (°F)
Hot junction (end of life)
Cold junction
Radiator
Contact res i s t iv i ty -end of life
inQ-cra )
Efficiency (%)
Capsule weight
SiGe Input P a r a m e t e r Logic
Value Reason for Choice
1450
550
505
1800
T h e r m a l
Joule
Regulator
Element length (in.)
83
92
99 .5
0.75
Equal to weight of fuel plus l iner
At beginning of 5-yr life with SrTiO„, hot junction
t empera tu re will be -1590° F, resu l t ing in capsule surface t empera tu re of -1700° F . Maximum steady s ta te capsule t e m p e r a t u r e cannot exceed -1800° F; maximum hot junction t e m p e r a t u r e cannot exceed -16 50° F . Appears 1450° F end-of-life hot junction t empera tu re is reasonable choice.
Higher cold junction would add to sys t em weight b e cause of decreas ing efficiency; lower cold junction would c rea te l a r g e r r ad ia to r a r e a s . Final design of SiGe genera tor may use a different cold junction than 550° F but was reasonable choice for this s tudy.
Exper imenta l data from RCA indicate 45° F t e m pera ture difference exis ts between the cold junction and rad ia tor with FLexi-Mod concept.
Extrapolat ion of RCA SNAP 17A data.
Detailed t h e r m a l analysis of cyl indr ical layout on 250-watt p r o g r a m .
2 Calculation of typical I R l o s se s in 2 50-watt gene r a t o r .
Exper ience with s imi l a r r e g u l a t o r s .
Length is recommended by RCA for ease of f abr i cation; r e su l t s in c r o s s - s e c t i o n a l a r e a s compatible with PUO2 o r SrTiO„ fueled sy s t em. Also was length
used for SNAP 17A.
SNAP 17A impact tes t data .
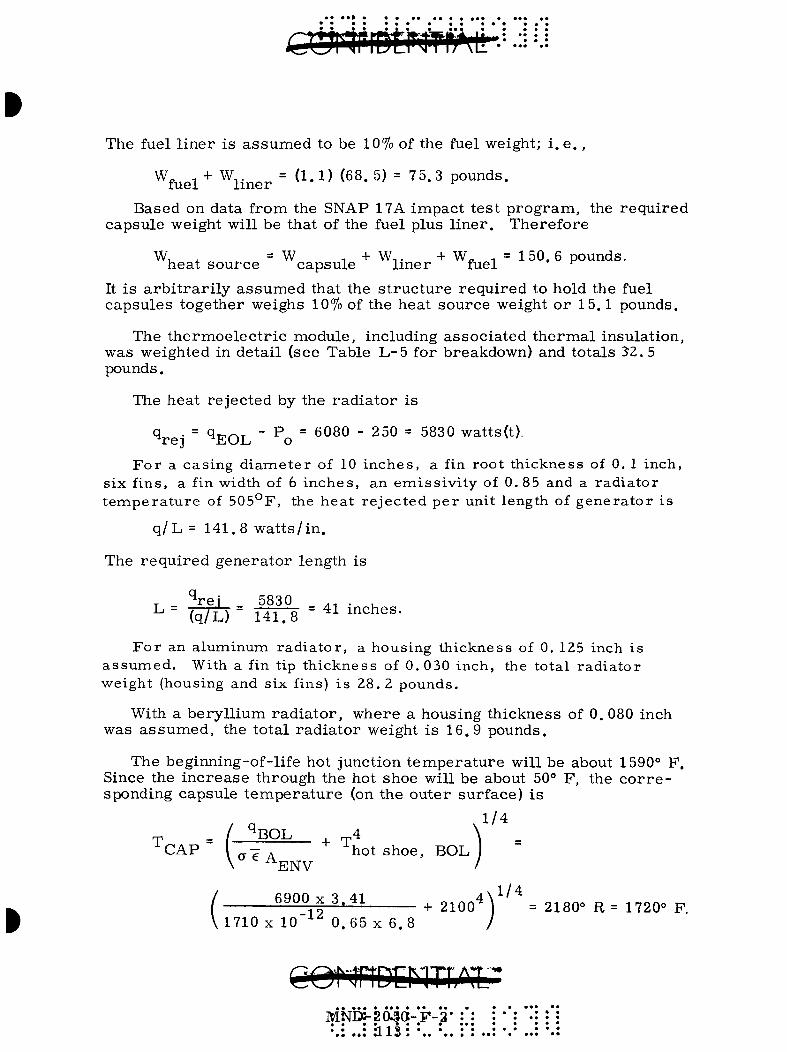
The fuel l iner is a s sumed to be 10% of the fuel weight; i . e . ,
^fuel"^ ^ l i n e r " ^^'^^ ^^^' ^^ ^ '^^'^ pounds.
Based on data from the SNAP 17A impact test p rogram, the requ i red capsule weight will be that of the fuel plus l ine r . Therefore
W, ^ = W T + W T + W „ T = 150.6 pounds, heat source capsule l ine r fuel ^
It i s a r b i t r a r i l y assumed that the s t ruc tu re requi red to hold the fuel capsules together weighs 10% of the heat source weight or 15.1 pounds.
The the rmoe lec t r i c module, including associated t he rma l insulation, was weighted in detai l (see Table L-5 for breakdown) and totals 52. 5 pounds.
The heat rejected by the r ad ia to r is
q . = q „ ^ ^ - P = 6080 - 250 = 5830 watts(t). ^re] ^ E O L O
F o r a casing d iameter of 10 inches , a fin root thickness of 0. 1 inch, six fins, a fin width of 6 inches , an emiss iv i ty of 0.85 and a radia tor t empera tu re of 505°F, the heat re jected pe r unit length of genera tor is
q / L = 141.8 wa t t s / i n .
The requ i red genera tor length is
T - ^ re i _ 5830 _ . , . ,
F o r an aluminum rad ia tor , a housing thickness of 0. 125 inch is assumed. With a fin tip thickness of 0.030 inch, the total radia tor weight (housing and six fins) i s 28. 2 pounds.
With a bery l l ium rad ia to r , where a housing thickness of 0. 080 inch was assumed, the total r ad ia to r weight is 16.9 pounds.
The beginning-of-life hot junction t empera tu re will be about 1590° F . Since the inc rease through the hot shoe will be about 50° F, the c o r r e sponding capsule t e m p e r a t u r e (on the outer surface) i s
T = / ^BOL ^ 4 ^CAP I CT7 A hot shoe, BOL
\ ^ENV
1/4
6900 X 3,41 + 2100^\ = 2180° R= 1720° F. 1710 X 10 ^^ 0 .65 X 6.8 /
iMTr.Ar •• ••• • ••• •
_ INEB-ZO^a- _ MND:-20^a-F-2'
- • • - -ais

2. PbTe System
The PbTe (2N-3P) analysis is s i m i l a r to the SiGe ana lys i s . A s u m m a r y discuss ion of the input p a r a m e t e r select ion is given in Table L - 2 . F igures L-1 through L-3 a r e plots of t he rmoe lec t r i c efficiency, e lement d i a m e t e r s , and number of couples as a function of hot and cold junction t e m p e r a t u r e s for 2N-3P type ma te r i a l .
As mentioned in Table L-2 , both a cold junction of 500° F and one of 400° F were investigated to de termine the tradeoffs in weight, efficiency and s i ze .
B. SUMMARY OF RESULTS
A per formance s u m m a r y of the SiGe and two PbTe sys t ems is given in Table L-3 and a weight s u m m a r y is given in Table L-4 . For the SiGe sys t em, a detailed weight breakdown of the module is given in Table L - 5 .
C. CONCLUSIONS
On a weight b a s i s , the SiGe genera tor at 239 pounds is ~100 pounds l ighter than the 400° F cold junction PbTe genera tor (System B) and ~150 pounds l ighter than the 500° F cold junction PbTe genera tor (System A).
On an overa l l efficiency b a s i s , the SiGe sys t em is essent ia l ly equal to System B and 1/2% bet ter (absolute) than System A.
On a s ize bas i s (all d iamete r s a r e the same) , the SiGe genera tor is super ior with i ts length of 41 inches as compared to lengths of 58 and 77 inches on PbTe Systems A and B, respec t ive ly .
D. NOMENCLATURE
Genera l Subscr ipts
A L
N
P
q
a r e a
genera to r length
number of couples
power
heat r a t e
BOL
ENV
EOL
i^R
N
beginning of life
envelope (of heat source)
end of life
joule
N element
i CONriDENTIAlL.
; : :* : . : :•: *: *: ii*4 : :* : :
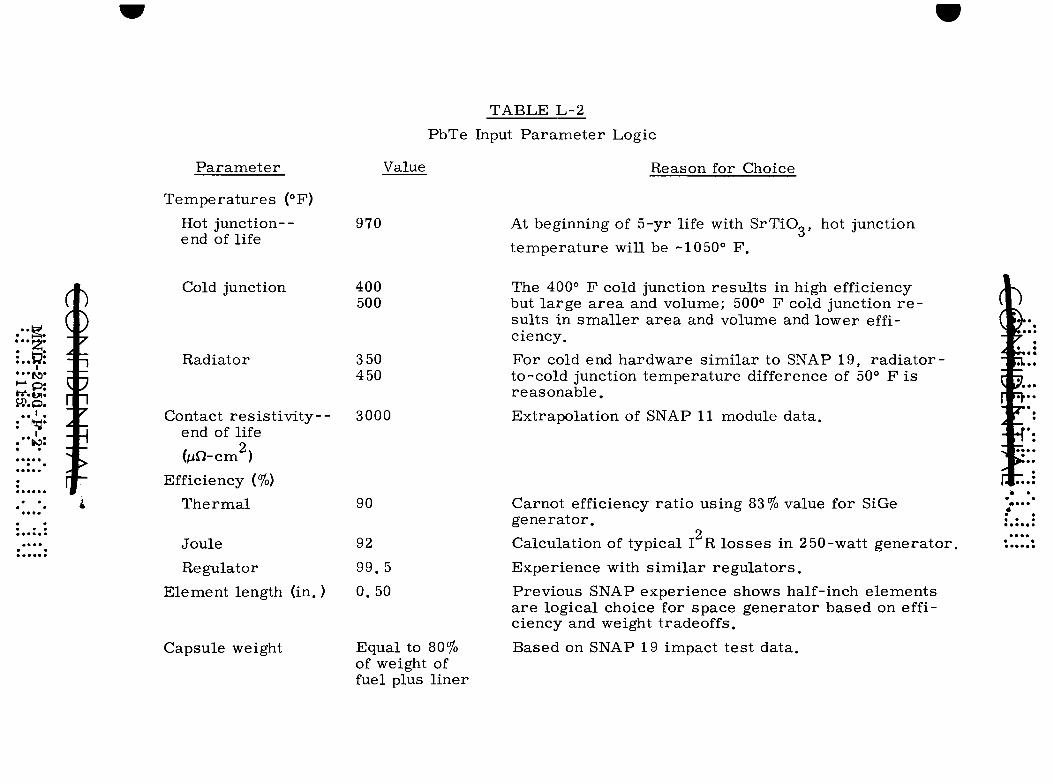
TABLE L-2
PbTe Input Parameter Logic
P a r a m e t e r
T e m p e r a t u r e s (°F)
Hot junct ion--end of life
Cold junction
Radiator
Contact r e s i s t i v i t y - -end of life
2 (/jS7-cm )
Eff i c i ency (%)
T h e r m a l
J o u l e
R e g u l a t o r
E l e m e n t l eng th ( i n . )
C a p s u l e weigh t
Value
970
400 500
3 50 450
3000
90
92
9 9 . 5
0 . 5 0
E q u a l to 80% of weigh t of fuel p lus l i n e r
Reason for Choice
At beginning of 5-yr life with SrTiO„, hot junction temperature will be -1050° F.
The 400° F cold junction results in high efficiency but large area and volume; 500° F cold junction r e sults in smaller area and volume and lower efficiency. For cold end hardware similar to SNAP 19, radiator-to-cold junction temperature difference of 50° F is reasonable. Extrapolation of SNAP 11 module data.
Carnot efficiency ratio using 83% value for SiGe generator.
2 Calculation of typical I R losses in 250-watt generator.
Experience with similar regulators. Previous SNAP experience shows half-inch elements are logical choice for space generator based on efficiency and weight tradeoffs.
Based on SNAP 19 impact test data.
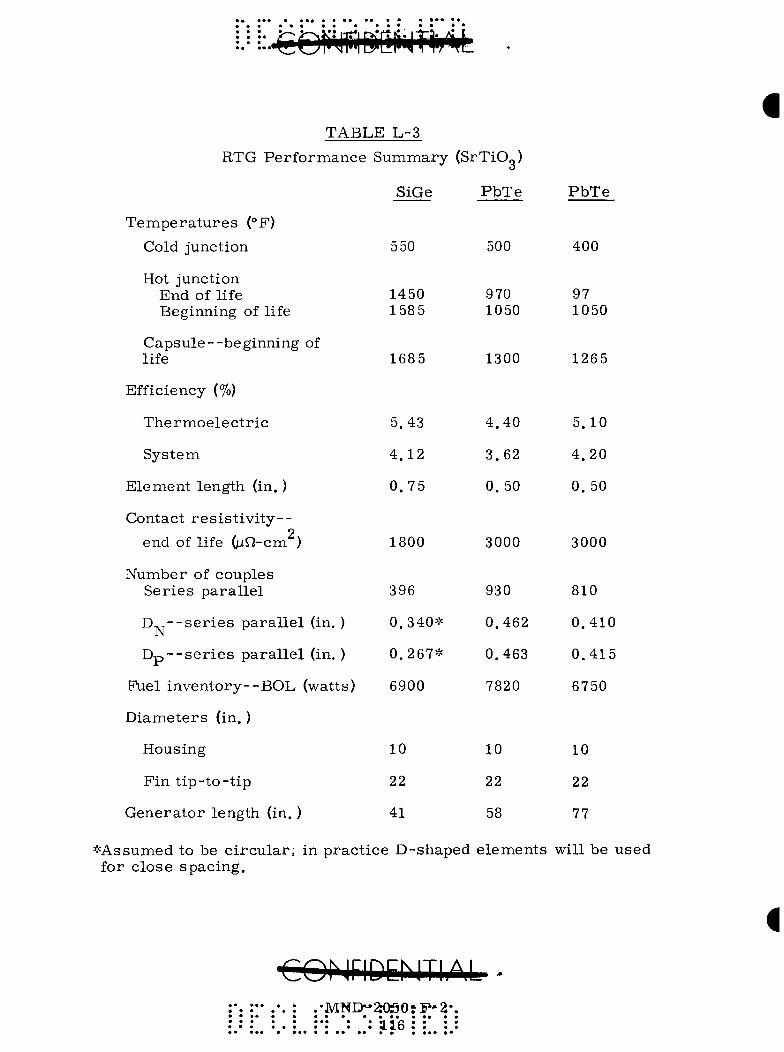
T A B L E L - 3
RTG P e r f o r m a n c e S u m m a r y (SrTiO^)
S iGe
3'
P b T e P b T e
T e m p e r a t u r e s (°F)
Cold j u n c t i o n 550 500 400
Hot j u n c t i o n End of l i fe 1450 970 97 Beg inn ing of l i fe 158 5 1050 1050
C a p s u l e - - b e g i n n i n g of
l ife 1685 1300 1265
Ef f i c iency (%)
T h e r m o e l e c t r i c 5 .43 4 . 4 0 5 .10
S y s t e m 4 . 1 2 3 .62 4 . 2 0
E l e m e n t l eng th (in. ) 0. 7 5 0. 50 0. 50
Con tac t r e s i s t i v i t y - -end of l i fe (lun-cm^) 1800 3000 3000
N u m b e r of c o u p l e s
S e r i e s p a r a l l e l 396 930 810
D - - s e r i e s p a r a l l e l (in. ) 0 . 3 4 0 * 0 .462 0 . 4 1 0
D p - - s e r i e s p a r a l l e l (in. ) 0 . 2 6 7 * 0 .463 0 . 4 1 5
F u e l i n v e n t o r y - - B O L (wat ts ) 6900 7820 6750
D i a m e t e r s ( in. )
H o u s i n g 10 10 10
F i n t i p - t o - t i p 22 22 22
G e n e r a t o r l eng th (in. ) 41 58 77
* A s s u m e d to be c i r c u l a r ; in p r a c t i c e D - s h a p e d e l e m e n t s wi l l be u s e d for c l o s e s p a c i n g .
€OMriDEMTIiM •MNI>*aOSO?F-2* • • • • • • • • • • •: : : l i e : : :

RTG We
Heat source
Heat source cage
Module
Inner housing sea l
Insulation (outside of modules)
Housing plus fins
Aluminum
Beryl l ium
Miscellaneous (4%)
Tota l - - rad ia to r
Aluminum
Beryl l ium
Specific power - - r ad i a to r (watts/ lb)
Aluminum
Beryl l ium
TABLE L-4
ight Summary (SrTiO„)
SiGe (lb)
150.6
15.1
32 .5
- -
3 . 0
28.2
16.9
9 . 6
239
228
1.04
1.1
System A*
157.4
15.7
122.1
35.0
2 . 0
39.1
23.0
15.7
387
371
0.65
0.67
PbTe (lb)
System B**
128.1
12.8
84.3
46.4
2 . 0
49.0
30.0
13.4
336
317
0.74
0.79
*System A--500° F cold junction. **System B--400° P cold junction.
CONriDENThM-MND-ZOSC-'P-Sr. : : : 11T : : :
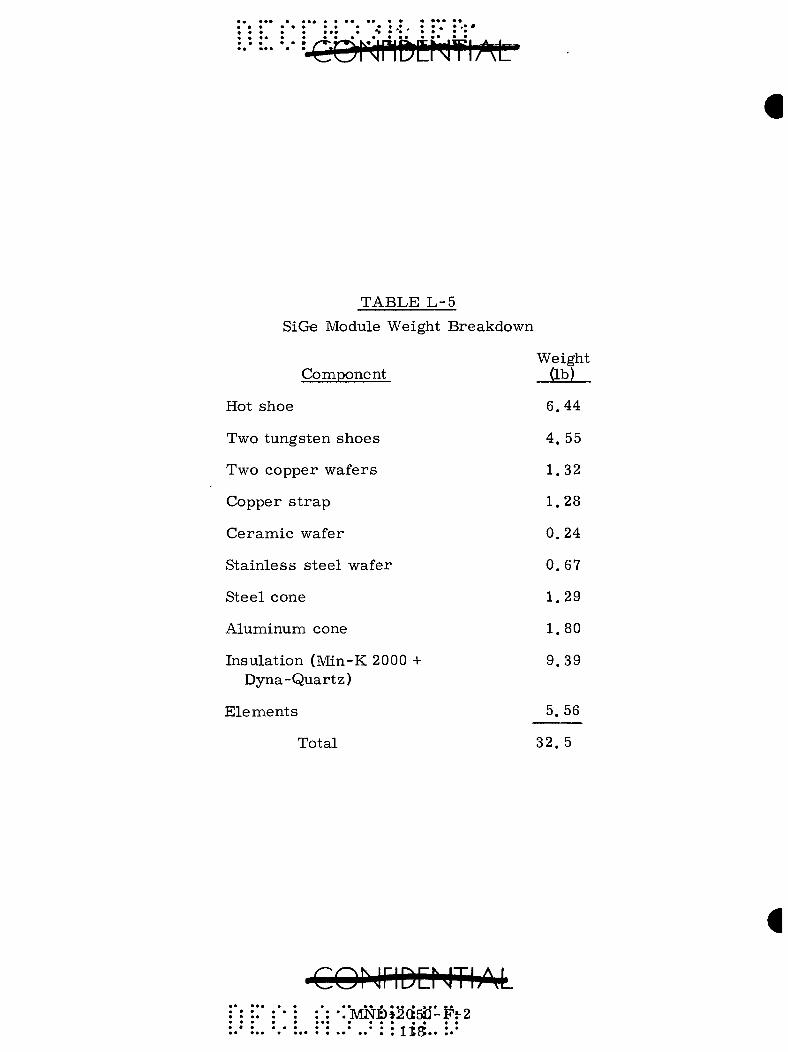
TABLE L-5
SiGe Module Weight Breakdown
Weight
Component (lb)
Hot shoe 6.44
Two tungsten shoes 4. 55
Two copper wafers 1. 32
Copper s t r a p 1.28
Ceramic wafer 0.24
Stainless s teel wafer 0.67
Steel cone 1.29
Aluminum cone 1.80 Insulation (Min-K 2000 + 9.39
Dyna-Quartz)
Elements 5. 56
• • • « * •.MNi)*2a50-F^2
Total 32. 5
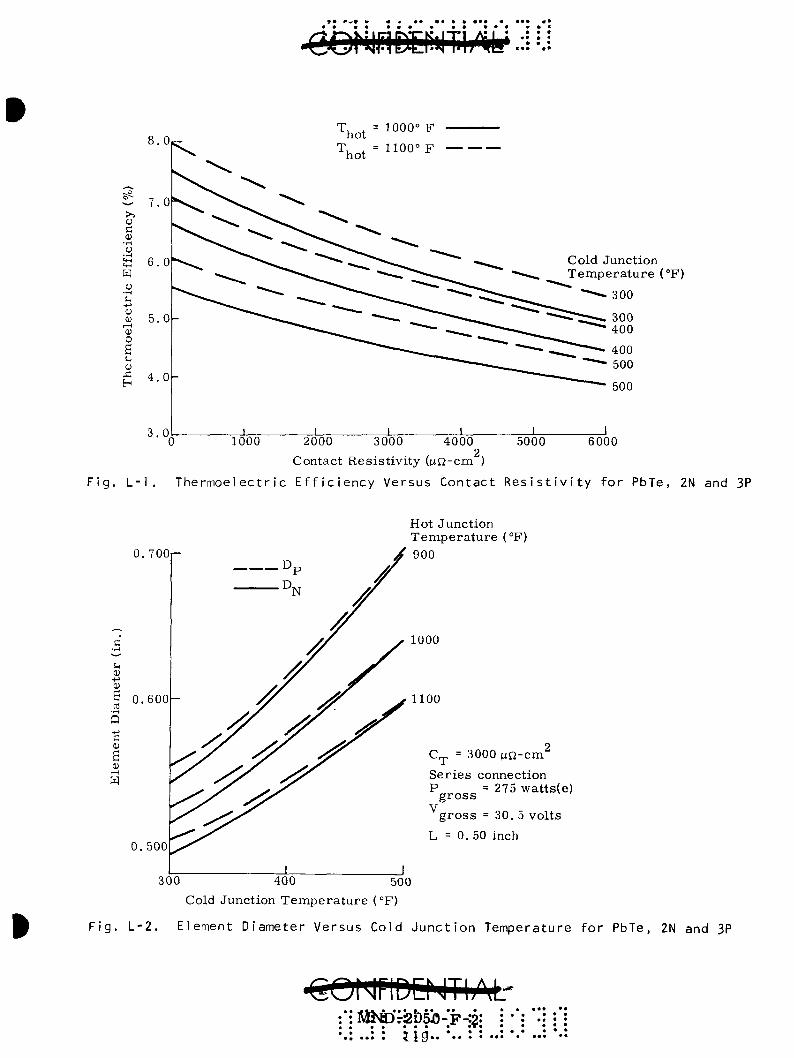
8 .0
3 .0
4QW^t£NtiAk'.:iU
T, , = 1000° F hot
T, . = 1100° F hot
Cold Junction T e m p e r a t u r e (°F)
1000 2000 3000 4000 5000 6000 2
Contact Resis t ivi ty (|LtQ-cm ) F i g . L - l . T h e r m o e l e c t r i c E f f i c i e n c y Ve rsus C o n t a c t R e s i s t i v i t y f o r PbTe, 2N and 3P
0.700
0)
s S c
s r — 1
0.600
0.500
Hot Junction T e m p e r a t u r e (°F) 900
1000
1100
C^ = 3000 un-cm Ser ies connection P = 275 watts(e)
g r o s s V
g r o s s = 30. 5 vol ts L = 0. 50 inch
300 400 500 Cold Junction T e m p e r a t u r e (°F)
F i g . L - 2 . E lement D iame te r Ve rsus Co ld J u n c t i o n Tempera tu re f o r PbTe, 2N and 3P
M5SED*r2i)5J0-F-:2: • • • • • • • • •
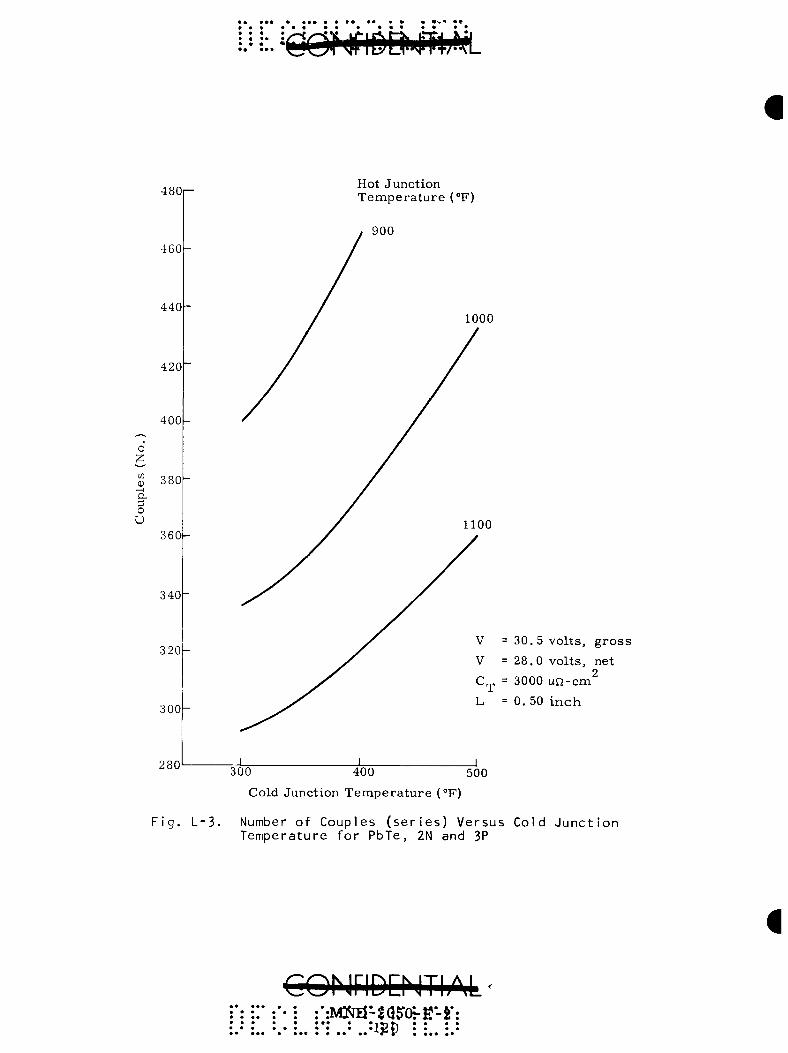
• • • • • ^WW^^^7^|—"\W I > ../ > 1.*A|. | . * ! * / * A I
O
a d o U
480
460
440
420
400
380
36Q-
340 -
3 2 0 -
3 0 0 -
280
Hot Junct ion T e m p e r a t u r e (°F)
900
LOOO
= 28.0 vol ts , net
= 3000 MQ-cm^
= 0. 50 i n c h
300 400 500 Cold Junction Temperature (°F)
Fig. L-3. Number of Couples (series) Versus Cold Junction Temperature for PbTe, 2N and 3P
COhjnDEhJTIAk-ivD^d-ScJSroi-fi-r: .-m • • • •
• ••• ••

Gener T
t
V
W
al
temperature
time
volume, voltage weight
Subscripts
O o/a
P
r e g
r e j
T/E
therm
output
overall P element regulator
reject thermoelectric
thermal
Greek
3 fuel power density e effective emissivity between capsule and hot shoe n efficiency p density X fuel decay constant a Stefan-Bolt zmann constant
COMriDCNTlAb-* • • • • • I
MBJDr?0^.-F-2'* • • • • • d.Z.C • •• • •

at
...iC
9
9 • •
• •
$ ^
(5):
>

APPENDIX M
SAMPLED PERTURBATION THEORY*
Exact solutions to the generalized heat transfer problem, are practically confined to linear problems on boundaries of various simple shapes. A great deal of attention has therefore been given to the development of numerical methods for the solution of the heat transfer problem, particularly with the advent of the analog and digital computers.
The method of sampled perturbations as applied to the generalized heat flow problem, including absorption factor theory for enclosed gray body surfaces, is a combination of sampled-data theory and perturbation theory. This combination is used to obtain a digital computer solution to the problem.
Sampled perturbation theory has definite advantages over the two popularly used techniques, the backward difference scheme and the forward difference scheme. The forward difference scheme allows the user to save computer time by solving the heat flow equations explicitly. Unfortunately, this method becomes unstable when the sampling time is too large. The backward difference scheme is inherently stable, but unfortunately all the equations must be solved simultaneously. For complex problenas, this means that the computing time will be a naaxi-mum, and very often the cost of the solution will become prohibitive.
The thermal model for sampled-perturbation theory is idealized with discrete thermal nodes. For each node a heat balance equation is constructed. Using perturbation theory, this equation is linearized. Once the differential equation is linearized, it can be easily operated on with LaPlace transforms thereby transforming the differential equation into an algebraic one. Application of the sampled-data theory to the equation for each node allows the user to derive a set of difference equations which are solved individually for each discrete time interval.
Until now naost work has been done under the assumption that only the first emission of radiating nodes is considered. With the addition of absorption factor theory to the problem, the solution is generalized to include infinite numbers of emissions to radiating gray body enclosures . This relaxation of constraints to the problem, has been found to be very important in doing transient analyses, especially when the view factors between various nodes are large.
* Rosenberg, Morton Jacob, "Sampled Perturbation Theory as Applied to Gray Body Enclosures for Numerical Solution of the Generalized Heat Transfer Problem," Presented at AIAA Unmanned Spacecraft Conference, March 1965.
C0NriDENTIA4 / i MND-: 0-50 "'F7-2 ; .-. **: .*? ! ; : ; i4^ ; :*: : . : : i -
A. RADIATION HEAT TRANSFER
Assume that N nodes are radiating with respect to each other. The following analysis will assume that all bodies are gray and that the total of N nodes makes up an enclosure. The latter assumption does not put a major restriction on the problem because space itself may be thought of as the all encompassing node. Therefore, in essence, an enclosure is always present in the problem.
A radiation thermal balance on the ith node gives:
Qnet = Qrad. " ^ r a d , <^-l> m out
The rate of heat loss (Q , ) will be equal to the amount of heat out
emission given by Node i.
The Stefan-Bolt zmann law for blackbody radiation is
E^ = aT^ (M-2)
If the radiant emission from a black surface were broken into its spectrum, it would be found that the emission is not equally distributed over all the wavelengths. Monochromatic emittance may be defined as the rate of energy emitted per unit area of em.itting surface at a particular wavelength, X ; then E, may be shown to be:
b = J"b,X E^ = \ E^ ^ dX (M-3) o
The monochromatic blackbody emittance, E, , is then some function of the wavelength X. The Stefan-Boltzmann law applies only to blackbodies.
For a particular wavelength, the ratio of the monochromatic emittance of a nonblackbody to that of a blackbody is known as the monochromatic emissivity of the nonblackbody.
'x-^x^%,x ^^-^> A gray body is a special type of nonblackbody and is defined as one
for which the monochromatic emissivity is independent of the wavelength of the emitted radiation. From this definition e. in Eq (M-4) is a constant value for the entire wavelength under consideration. To solve for
CQNriDDJTIAtL
. . ' . . - • a24 :.. •.•

E of the gray body substi tution of Eq (M-3) into Eq (M-4) yields:
E 'f\.7^'^- (M-5)
o
and from Eq (M-5) it is seen that
E = eE , = e a T ^ b
(M-6)
which is the emit tance of a g ray surface .
To calculate the ra te of heat loss from Node i, Eq (M-6) must be mult ipl ied by the radiat ing a r e a of Node i. This , therefore , gives:
Q , = a e . A . T ^ r a d . i l l out. 1
(M-7)
The heat enter ing Node i mus t now be considered. Heat t ransfe r r a t e s that consider f i rs t emiss ions only may induce la rge e r r o r s in t e m p e r a t u r e , pa r t i cu l a r ly if nodes in the sys tem a r e r a the r close to each other .
To solve the p rob lem, an absorpt ion factor, B . . , must be defined. J
The absorption factor i s the to ta l fraction of the emiss ion of the jth node which is absorbed by the ith node. The t h e r m a l balance equation for radiat ion then becomes:
N
Q , - CTY e. 4 4 A . B . . T - e . A . a T
3 Ji 3 1 1 1 (M-8)
It should be noted that this factor is only applicable to gray surfaces .
As derived in Appendix N,
N
" ^ i ' l K L ^ L Li Ki 1 (M-9)
je=i
Equation (M-9) now gives a total of n equations for K = l , 2, 3, 4, . . . , n. It should now be noted that these equations a r e l inear and that a de terminant may be set up to solve each B^, . . These equations take the
form:
:-mt>-:|(S^(5--F--2;
(F^^p^ - 1)B^.^ F^^p^B^.^ . . . ^ F^.e.- 0
(M-IO)
F , p , B , . + - - - + ( F p - 1 ) B . + F . e . = 0 n l ^ l l i nn^n ni ni i
This set of n l i nea r equations can now be solved for the n unknowns B.. . ,
^ 2 i ' B .. ni
Since an enclosure is a s sumed , al l enaission of a Node i must be absorbed by al l other nodes . There fore ,
N
I 3 = 1
B . . = 1 13
( M - U )
Putt ing this in a m o r e useful form:
N
(1 - B..) = y B . . 11 ZJ 13
3=1 3^i
It can also be shown that the following re la t ion naust hold:
^ j ^ K ^ K " ^ j K ^ i ^ K
(M-12)
(M-13)
Combining Eqs (M-12) and (M-13) with Eq (M-8) now allows the wri t ing of the radiat ion heat balance equation in a more convenient form:
N
Q , = q„ = a ) B. . e.A.T."* - a e . A . T . -net. ^R. Zv 31 J 3 3 1 1 1
4 4 + B . . e. A . T 11 1 1 1
( M - 1 4 )
3 = 1 3? i
Subs t i t u t ing E q (M-12) in to E q (M-13) g ives :
N / N ^
q „ = CTY B . , e . A . T . ^ - a e . A . T . ^ + e . A . T . ^ / l - V B . . ^ i Z / 31 3 3 3 1 1 1 ^ ^ ^ I LJ ^\
( M - 1 5 )
3=1 3^i
CQNriDDJTIAL • • • • • • • • • « • •
MBID-2j030:-:F:-&. ••• • • • « • •
• • • • • • i.4^ » • • • t

Equation (M-15) becomes:
N N
qo = a > B. .e .A.T. '* - CTyB..e.A.T.' Ri L J^ J 2 J / y 13 1 1 1
(M-16)
3 = 1 3^i
3 = 1
Combining the two t e r m s on the r ight side of the equation and applying Eq (M-13), it i s seen:
N
q^ = CTY e.A.B..(T.'^ - T.^) Ri Zy 1 1 13 3 1
3 = 1
(M-17)
Equation (M-17) now becomes the heat t r ans fe r by radiation t e r m to be considered in the following heat t r a n s f e r balance equations.
B. CONDUCTION HEAT TRANSFER
The theory of heat flow by conduction has been developed from the fundamental equation:
K A dT dri
(M-18)
When consider ing the numer ica l approximation nodal technique to a problem, the heat flow due to conduction between Nodes i and 3 becomes:
q = K. .A (T. - T.) c 13 c 3 r 13 •" 13 -
K.. 13 , L . . k . + L . . k .
±. I 11 3 2LJ^ K k .k .
c 1 3
(M-19)
(M-20)
where K is a contact coefficient and the k.k. a r e t he rma l conductivit ies, c 1 3
Equation (M-19) may now be summed over j to account for all nodes in the sys t em.
Substitution of Eq (M-20) into Eq (M-19) gives
A (T . - T.) C I 1
, = i j : ^ c . , L . . k . + L . . k .
13 _ L 13 3 11 1 K + k .k .
c 1 3
(M-21)
MWD-2050.-F-£r

Once again, to denote conduction of the ith node with m o r e than one other node, a summation over j is in o rde r on the right side of Eq (M-21).
C. COMBINED HEAT TRANSFER
Assume a node of cubical d imensions , and wri te the heat balance equation for this node,
q. - q 4,+ q . + = q . , ( M - 2 2 )
^in ^out ^mt ^s to red
The heat s tored t e r m may be wri t ten as:
dT. q = W . C ^ - r ^ (M-23) ^ s . 1 P . d r
1 1 Assuming that n nodes exist in the t h e r m a l model , the heat balance equation for the ith node rnay be writ ten:
n n
S A K . . ( T . - T . ) + y A h . . ( T . - T . )
3=1 ^ 3=1 ^
+ ay A^ B . . e . (T .^ - T.^) + q. = W . C T 3 -V-^ ( M - 2 4 ) / ^ R . . 13 i ' 3 1 ' ^1 1 P . d T 3 = 1 ^
the first t e r m being conduction, the second being convection, and the th i rd being radiat ion. Combining t e r m s in Eq {M-24) gives:
n n 4 4
e.(T. - Tp j=l
) (A K.. + A h..) (T . - T.) + a Y A„ B . . LJ C . 11 CO.. IT 1 1 / , R . . 13 j = i y 13 J J ^^ 13 -^
dT. + qi = W . C p - ^ (M-25)
Now consider smal l changes or per turba t ions in the heat balance, Eq (M-25). These s m a l l changes will appear in the heat balance equation a s an addition to each of the va r ious t e r m s of the equation cons idered a s v a r i a b l e s . Pe r tu rba t ions of a function g(X) that v a r i e s with X can be wr i t ten as:
CQMriDEMTlAi MNB:;atr5p^j'j3:
••* • • • • • • • • • •• L^o* • * ••

00
g ( X ) = ^ e ' " g ^ ( X ) (M-26)
n=0
It should further be noted that g.(X) is a sufficiently smooth quantity such that:
L im e^g.(X) = 0 (M-27)
In o rde r not to diverge from s tandard nomencla ture , the notation A will
be used instead of Ae . The following per turba t ions may now be in t ro duced into the heat ba lance , Eq (M-25). These per turba t ions may be considered a s quite sma l l and, therefore , the infinite s e r i e s of Eq (M-26) may be t runcated after the l inear ternas involved. Therefore , 1iie t e r m s to be added will appear as:
A K..I
A h. . CO.. 13
t . + At
= A K..I + AA K.. c,--i 13} c . . 13
ID 13
J »t. + At
= A h. . l + A A h. . CO.. 13 > CO.. 13
13 13 (M-28)
\{ = T . l + AT.
B..I = B..I + AB. . ^ J | t . + A t ^3>t. y
Putting the per turba t ions into Eq (M-25) gives the following resul ts :
n , \
/ \A ( K . . + A K . . ) + A (h. . + Ah..)> L \ c , . 13 13 CO.. 13 13 (
T . + AT. - T. - AT.) + CT ) <AD ( B . . + AB..) (e. + Ae.) 3 3 1 1 ^ 1 Rii 13 13 1 1
[(T. + AT.)^ - (T. + AT.)^1 > + q. + Aq. = W.C^^ -r-^ L 3 3 1 1 J j ^1 ^1 1 P . dT
(M-29)

=•= =-CQHnD[MTF> ([L
The magnitudes of T. will now be considered as constants and the change
in these values will come about by the change in AT. . There fore , a l
though T. is considered a constant, AT. i s not, and, therefore , T. will
take on new values a s a resu l t of AT.. The per tu rba t ions in the t h e r m a l
p rope r t i e s , namely, AK.., Ah. . , AB. . , Ae . and Aq. may now be cons id-«J W V
e red to be functions of the t empera tu re of the specific nodes, or , if it is appropr ia te , to be functions of t ime .
With th is fact in mind, Eq (M-29) may now be a lgebraical ly s imp l i fied:
dAT W . C
i P . dT uh < Y IA K.. + A h . . + 4 B -a-A e . T ^ l A T
| . ^ V ^ij J ^°i3 '^ J R . . ^ ' i ; ^ - ^ i |
A (K.. + AK..) (T. - T.) + A K . . A T . Cjj 13 13 3 1 Cy 13 3
(M-30) + A ^ (h. . + Ah..) (T. - T.) + A h . . A T .
cOy 13 13' 3 1' cOy 13 " 3
Allow:
a . = W . C p _
n \ ^ , = ) / A K.. + A h. . + 4 B . . a A „ ^ T.^j
QDNriDCMTlAM :M]irp-:2opo-^-? • • • • • • i w * / • » •
n f.(t) = y 1A (K.. + AK..
L] o ' 13 13 3=1 -
) ( T . - T . ) + A K . .AT . 3 1 Cy 13 3
+ A (h. . + Ah..) (T . - T.) + A h . . A T . CO.J 13 13 3 1 cOy 13 3
+ CTA^ ( B . . e . + B . .Ae . + e.AB..) (T.'^ - T.^) Rij 13 1 13 1 1 13 3 1
+ 4 C T A „ B . . e . T . ^ A T . f + q. + Aq. Rij 13 1 3 2\ 1 1
Then Eq (M-30) becomes :
d A T . a_ _ ^ _ i + Q. AT. = f.(t)
1 dT '^i 1 1
where it mus t be noted for the purposes of th is analysis that
a. = constant 1
^ i = constant
(M-31)
f. (t) = a function of t i m e .
By noting the form of Eq (M-31), it becomes quite obvious that Eq (M-31) is l inear in fo rm. Since it i s l inear , it can be t ransformed by means of the LaP lace t r ans fo rm.
( d A T . ) . ^
^ f i - d r ^ + ^ i ^ T . | = {f.(t)} (M-32)
Taking the LaP lac i an of the left side of Eq (M-32) gives:
I | - i - ^ + ^ i ^ T . j = ^ { a . S + .}/(AT.) ) 1 dt
There fore , Eq (M-32) becomes:
^\a.S+ ; 8 . | . (AT.) = ^ | f . ( t ) |
The L a P l a c e t ransformat ion of AT. is then seen to be:
(M-33)
(M-34)
•MN]D-'2a5t)^Fr2' : : : tStl

i(AT.) = f!{j(t)(.{^-sV^} (M-35)
Equation (M-35) is very important in the solution of the problem and may be represented pictorially from the standpoint of control system theory:
i" jfi(t); •
1 a.S + B.
1 ^ 1 — ^
F i g . M-1
In Fig. M-1, t ]f. (t)[ may be considered to be the input, q , o 1 '^i '^i
may be thought of as the transfer function, and i. j AT. [ is to be considered as the output of the control system. The quantities T. for i - 1, 2, . . . , n will change as a result of the perturbations AT. for i = 1, 2, . . . , n during transient conditions. This leads to the point where sampled data theory must be introduced.
Pictorially, the introduction of sarapling technique to the problem may be seen in Fig. M-2. In this figure, samplers are shown operating on the input ^ jf.(t)[ before it reaches the transfer function, and operating on the output, sf JAT. >. Note that the sampled properties are labeled with an asterisk, such as ^ j f.*(t)[ and ^ jAT.''*| •
Sampler
i\h^'^ ^ j f f ( t ) [
a.S + B. 1 ^ 1
^1^T.(
Sampler
^)ATn
F i g . M-2
COP jriDQ JThi\k : : : 133 : : :
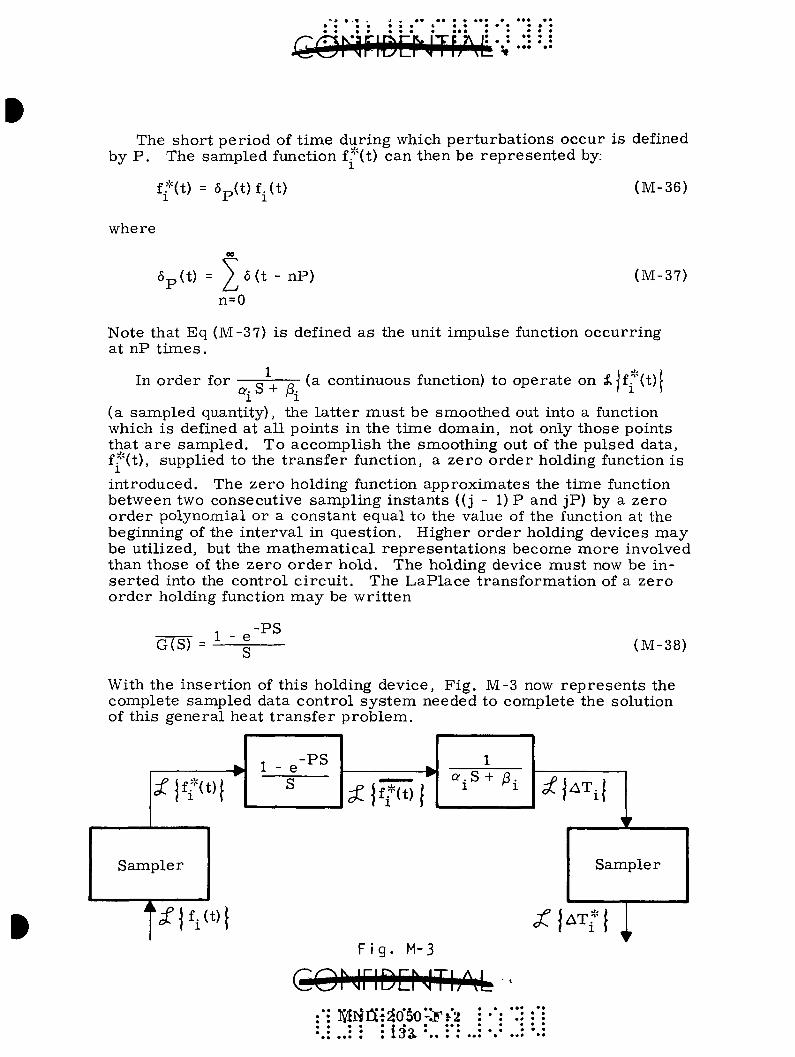
The short period of time during which perturbations occur is defined by P. The sampled function f."'(t) can then be represented by:
ff(t) 6p(t)f.(t) (M-36)
where
6p(t) = 2,^(t - nP) n=0
(M-37)
Note that Eq (M-37) is defined as the unit impulse function occurring at nP t imes.
In order for (a continuous function) to operate on ^jf.''~(t)[
(a sampled quantity), the latter must be smoothed out into a function which is defined at all points in the time domain, not only those points that are sampled. To accomplish the smoothing out of the pulsed data, f.*(t), supplied to the transfer function, a zero order holding function is
introduced. The zero holding function approximates the time function between two consecutive sampling instants ((j - 1) P and jP) by a zero order polynomial or a constant equal to the value of the function at the beginning of the interval in question. Higher order holding devices may be utilized, but the mathematical representations become more involved than those of the zero order hold. The holding device must now be inserted into the control circuit. The LaPlace transformation of a zero order holding function may be written
G(S) = 1 -PS
(M-38)
With the insertion of this holding device. Fig. M-3 now represents the complete sampled data control system needed to complete the solution of this general heat transfer problem.
^ j f * ( t ) [ a.S + B.
1 ^ 1
F i g . M-3
CONriDD JTIAfc :••: Mfl-^tf5o*f2 • « • • • • • • ••• • • • • • I " O • • •
• • • • • • • -i iJ«)» • • • •
/JAT^j
Sampler
^K!|
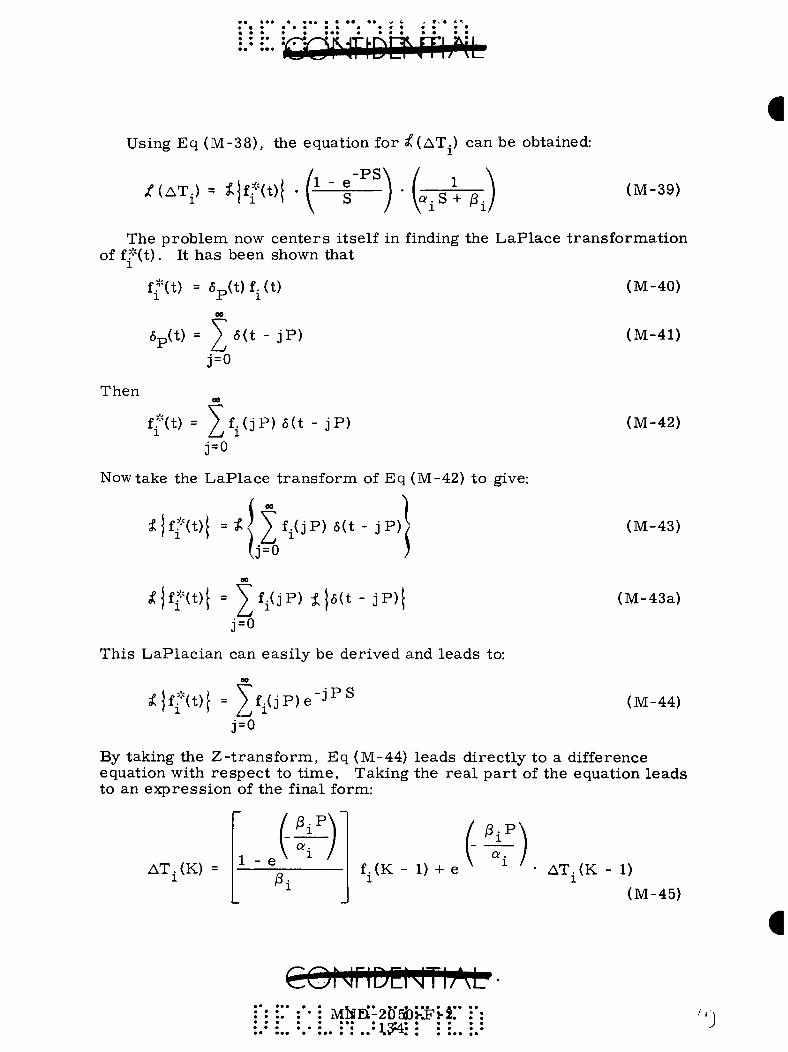
Using Eq (M-38), the equation for ^(AT.) can be obtained:
- P S \ / , \ /(AT.) = ^jff(t)j 1 - e
1-S+/3. (M-39)
The prob lem now cen te r s i tself in finding the LaP lace t rans format ion
(M-40)
of f.*(t). It has been shown that 1
f*(t) = 6p( t ) f . ( t )
6p(t) = ^ 6(t - j P )
3 = 0
(M-41)
Then
f*(t) = 2^1(3?) 5(t - 3 P) 3=0
Now take the LaP lace t r ans fo rm of Eq (M-42) to give:
i : jf*(t)[ = ; A | ^ f . ( 3 P ) 5 ( t - 3P)>
(3 = 0 )
^jff(t)( = f.(3P) iJ6(t-3P)} 3 = 0
This LaP lac ian can eas i ly be der ived and leads to:
(M-42)
(M-43)
(M-43a)
^jff(t)[ = yf.(3P)e"J - I P S
3 = 0
(M-44)
By taking the Z - t r a n s f o r m , Eq (M-44) leads d i rec t ly to a difference equation with r e spec t to t ime . Taking the r ea l p a r t of the equation leads to an express ion of the final form:
AT.(K) 1 - e
^ . P ^
a. 1
^ i
^ .P>
a. f.(K - 1) + e
1 AT.(K - 1)
(M-45)
eoNrim^TUM" MltEi-2b'5bi-S'!.i:'
: • ; : 1 0 : 4 : : : :

or
AT.(K) = AT.(K 1) f.(K - 1)
^ i
a. 1 +
f.(K 1
1)
iS: (M-46)
allowing
r .(K - 1) 1
_ 1 f,(K - 1)
^ i (M-47)
The final equation becomes:
AT.(K) AT.(K 1) ^^(K - 1)]
/SjP^ a.
+ r .(K - 1) (M-48)
Equation (M-48) now r e p r e s e n t s the change in t empera tu re for the second node in the t he rma l sys tem within the K t ime interval . Adding this calculated value to the t e m p e r a t u r e of the second node in the las t in te rva l yields the new t e m p e r a t u r e considerat ions for this node. As is seen, the calculation of t e m p e r a t u r e s becomes one of explicit solutions with la rge t ime savings over implici t solutions; fur thermore , this solution is inherent ly a s table one.
M$JP"2950.-F.-

en .t
o
(£)'
w 3
f

\^Zt\^_^ I "l*lT_,^llir •N't IV* \ IL. • • ••• ••
APPENDIX N
ABSORPTION FACTORS
View factor determination for solving the generalized radiation heat transfer problem is also necessary for the solution of space vehicle temperatures. Direct use of the view factors in the radiation heat transfer problem was sufficient for close approximations for the simple early types of spacecraft. However, as spacecraft design becomes more complex, the accurate solution of the radiation portion of the heat transfer equation becomes more and more dependent on reflections within the system. Use of view factors only in the equations yields only initial impingement and absorption from one node of the thermal system to another and disregards the energy which is reflected from the impinging node to other portions of the thermal system. For accurate solution, a method for determining the infinite reflections within the system becomes very important. This method is that of absorption factor determination and is directly applicable to the nodal radiation heat transfer equations in use today.
Assume a thermal system exists which consists of N nodes forming an enclosure. Each node in the system is to be considered at a constant temperature, although all nodes in the system are not at the same temperature, and the properties of all nodes are totally diffuse. The total emissive power of a Node i in the system is represented by the value E..
According to the conservation of energy law, all energy leaving this node must be absorbed by the other nodes in the system. (It should be remembered that the system is an enclosure, and all energy remains within the system. ) Therefore, B.. is defined as the percent of energy
J
emitted by i which is absorbed by the j node; this is known as the diffuse absorption factor. From this, it is seen that the sum of the emitted energy from the 1 node, taken over the entire system enclosure, must equal unity.
Therefore:
N
B.. = 1.0 (N-1) IN
y 3 = 1
The total energy emitted by the i node and absorbed by some other j ie may be written as E. B.. . The energy
j node is made up of two distinct quantities: node may be written as E. B.. . The energy emitted and absorbed by the
J
COMriDENTIAL • i * • f -f t

(1) That which goes direct ly to the j node and is absorbed
(2) That which is ref lected from other nodes in the sys tem and is eventually absorbed at the 3 node.
This may be wri t ten:
Energy emit ted Direct energy Reflected energy from i being = from i being + from i being (N-2) absorbed at 3 absorbed at 3 absorbed at 3
This equation simply s t a tes that the sum of the p a r t s i s equal to the total.
The d i rec t energy emit ted from, i and absorbed at j is s imply the percent of energy from i which impinges on 3 (shown, for the diffuse case , to be s imply a geomet r ic factor labeled the view factor, F . . ) ,
J
multiplied by the percent of energy that the 3 node absorbed (a--). The
absorpt ivi ty is constant with r e spec t to all nodes .
There fore :
a.. - a.. = a.^ - . . . = a.^^ = a. (N-3) 31 Dl 32 3N 3
and, as shown by Kirchhoff 's law:
e. = a. (N-4) 3 3
where e. is the emiss iv i ty of the 3 node. The d i rec t energy being J
absorbed at the 3 node may then be wri t ten:
Direc t energy from i being = E. F . . a. = E. F . . e. . (N-5) absorbed at 3 ^ ^ ^ ^
Assume that a port ion of the total energy emit ted from the i node a r r i v e s and is absorbed by the 3 node after ref lect ing from other nodes in the sys tem. Assume a genera l L node exis ts in the sys t em from which a port ion of the emit ted energy re f lec t s . The amount of energy from the i node which impinges on the L node i s :
E . , = E. F . , (N-6) iL 1 iL
where E.., is the amount of energy from the i node impinging on the L node.
1
* 4 Y
M
\ • *
i MND • • ^ • * « * «
T ^ C n
-.2059"
T!
•
rrr -.2
• t *
•Ttr
X
» • r • - «

The total amount of energy ref lected from the L surface i s :
or , s imply:
^ L = ^L ^ i ^ i L ^^-8)
A cer ta in percent of this energy will be absorbed by the j node, and by definition of the absorption factor, it is seen that this is equal to B , .,
An important point is that the ref lected energy from the L node may be t reated as an emitted energy since the ref lectance is constant in all direct ions (because it i s a diffuse node). There fore , the E , shown in
Eq (N-8) m a y be t r ea ted as an emit tance from Node L, and the amount of energy which is absorbed by the j node from this node is E., B., ..
Therefore :
Reflected energy from the i node which is reflected = E F o R (N-Q) from an L node and ab - i iL L Lj sorbed by j node
Since this L node was a general node in the sys tem, the total energy reflected which is absorbed by the j node from a s imple summation over the ent i re sys t em is as follows:
N Total ref lected energy ^ V m - i n \ absorbed by the j node / ^ i iL^L ^ L j ^ '
L = l
Substituting all values solved for into Eq (N-2):
N
E. B . . = E. F . . e. + ) E. F . , p. B . . (N-11)
L = l
Since the summation is over the L and not i , it may be divided through by E. , yielding:
^ N
B . . = F . .e. + ) F . . p, B . . (N-12)
L = l
COMriDQJTbU .j^iq:i)r2K^-:F-:2:-: : : : 139! : : '

Equation (N-12) may be solved using s tandard ma t r ix solutions and yields a closed form solution for the absorption factors within a sys tem. The solution of al l absorpt ion factors within the sys tem now allows the u s e r to wri te the genera l radiat ion heat t r ans fe r equation for radiat ion in the genera l Node i, a s :
dT. W P. i dT
1
N
q. + a 1
J = l
4 4 A.e .B . . (T -T )
1 1 13 3 1
Where :
C p = specific heat of Node i i
W. 1
T. 1
T
' i a A.
e. 1
13
= weight of Node i
= t empera tu re of Node i
= t ime
= in ternal heat of Node i
= Stefan-Boltzmann constant
= a r ea of radiat ion of Node i
= emiss iv i ty of Node i
= absorpt ion factor from Node i to Node j
(N-13)
*«.r^NPh2$50--FT-2 140" •-
A P P E N D I X O
D E S C R I P T I O N O F MARTIN T - C A P - I I I T H E R M O - C H E M I C A L A B L A T I O N P R O G R A M
The T - C A P - I I I d ig i t a l a n a l y s i s p r o g r a m c o n s i d e r s the a b l a t i v e l a y e r to c o n s i s t of a c h a r l a y e r , p y r o l y s i s z o n e , and v i r g i n a b l a t o r m a t e r i a l , e a c h of which i s c h a r a c t e r i z e d by a d e n s i t y p ro f i l e . W h e r e a p p l i c a b l e , a m e l t l a y e r i s s u p e r i m p o s e d on the c h a r . F o r g e n e r a l a p p l i c a t i o n , the c a p a b i l i t y of hand l ing an a r b i t r a r y c o m p o s i t e a r r a n g e m e n t of a b l a t o r , i n s u l a t o r and i n t e r n a l s t r u c t u r e i s i n c l u d e d . The s u r f a c e b o u n d a r y cond i t ions i nc lude a r b i t r a r y h e a t i n g func t ions v e r s u s t i m e b a s e d on convec t ion and r a d i a n t h e a t i n g h i s t o r i e s , h e a t input due to c h a r c o m b u s t i o n , h e a t b l o c k e d by m a s s add i t ion to the b o u n d a r y l a y e r , r a d i a t i v e coo l ing f r o m the hot c h a r s u r f a c e , and h e a t a b s o r b e d due to v a p o r i z a t ion in the m e l t l a y e r . A p r o g r a m opt ion i s a l s o a v a i l a b l e to d e s c r i b e the s u r f a c e b o u n d a r y condi t ion a s a t e m p e r a t u r e - t i m e h i s t o r y . S u r f a c e r e c e s s i o n r e s u l t i n g f r o m c h a r ox ida t ion o r m e l t l a y e r flow a n d / o r v a p o r i z a t i o n i s c o m p u t e d with a s p e c i a l op t ion a v a i l a b l e to r e a d in the s u r f a c e r e c e s s i o n r a t e a s a funct ion of h e a t input r a t e o r s u r f a c e t e m p e r a t u r e . T h e n o n a b l a t o r m a t e r i a l p r o p e r t i e s input da ta a r e c o n s i d e r e d e i t h e r in the equa t ion f o r m a s p o w e r s e r i e s funct ions of t e m p e r a t u r e o r in c u r v e f o r m a s a r b i t r a r y func t ions of t e m p e r a t u r e . The a b l a t o r t h e r m a l p r o p e r t i e s inpu t da t a a r e c o n s i d e r e d in c u r v e f o r m a s funct ions of both t e m p e r a t u r e and d e n s i t y . T h e r a t e of change of the a b l a t i v e l a y e r d e n s i t y p r o f i l e and the r e s u l t i n g p y r o l y s i s p r o d u c t s m a s s flow a r e c a l c u l a t e d u t i l i z i n g r e a c t i o n k i n e t i c s of the a b l a t o r with nth o r d e r r e a c t ion da ta b a s e d on t h e r m o g r a v i m e t r i c a n a l y s i s . A s u m m a r y of a p p l i c a b l e e q u a t i o n s and r e q u i r e d m a t e r i a l p r o p e r t y inpu t s i s con ta ined in T a b l e s O - l and 0 - 2 .
3 X 1
•
•
MND • • • • •
• • « • •
- 2 0 5 0 -••i4r-. • • • • • • • • • • « • ••
F -• • • • • • •
•M
2 •
• • •
^
• • •
»
• • • • • • •
• ••
«••
• • • •
• •

TABLE O- l
Summary of Ablation Equations in T-CAP III
Purpose Genei'al Equations
Surface heat balance Section 1 ' ^ f , = \ l < H s - V + ' i r - - i ^ v ^ < « S - « w ) * = ^ c P c ^ H r - < ^ ^ T ^ surface
Ablative layer heat balance Section 2
pC -ijr = TT [k •;— 1 - m (x, t) C r— + f L -—-' p 3t ax \ ax / V ' ' p ax p p a t
Ablator degradation Section 3
3X P-Pr . = - k X where , ._ t r p -p' r ' p c
p(x. t) X =X(x, t)(pp-p^) +p^
m (x, t) = - f \ ^rr dx where f = -2—— V p .) at p
k Ae , n = reaction order
Surface recession Section 4
Burning rate limited
fP C„ 1 n ^2/T
k. e where k.and k are burning rate constants ' c
Oxygen diffusion limited
h ^ L net e N, [ •w^/w
Flow
flow r i d ,
R) dy where u 0 0
T = aerodynamic shear stress M- = melt viscosity dp/dx = local pressure gradient R = body radius
Vaporization
h net vap p melt
<^
where M Molecular weight of air Molecular weight of vapor
= local ambient pressure = vapor pressure at ablating
surface
Internal structure and insulation heat balance Section 5
„ 3T _ 3 A 3T\ , 3 A aT \
PS ^ ' a? r a ^ j ^ ^ r 3yj
coh^^Dc^iTlJ^L MND-2050-F-2

TABLE 0 - 2
Mater ia l P r o p e r t i e s
Mater ia l
Ablator
P roper ty
Virgin ma te r i a l
Pyro lys i s zone
Char layer
Surface
Insulation and Structure
Density Specific heat T h e r m a l conductivity
Activation energy Rate constant Reaction order Mass fraction (total pyrolysis) Molecular weight of gas Enthalpy of gas Heat of pyrolysis
Density Specific heat T h e r m a l conductivity
Emiss iv i ty Combustion ra te constant Combustion activation energy Heat of combustion Heat of vaporization or sublimation Heat of melting Melt viscosi ty Molecular weight of vapor
Density Specific heat T h e r m a l conductivity Emiss iv i ty Coolant enthalpy
C0\ jriDD iTh\.U :^]5tPr2:(350"r-:2:* : : : : 143:: :

f
•:N
)
r w S
"
APPENDIX P
DISPERSION ANALYSIS
Chapter VII has discussed the importance of restricting dispersions to a tolerable level measured in plus or minus a few hundred miles. However, the burden of proof in actually achieving such restrictions can only be expressed in terms of the confidence level placed on the dispersion itself. To this end, statistical theory lends itself quite readily by actually assigning confidence levels to impact patterns. It is the purpose of this appendix to present an outline of the basic theory and analytic suppositions that have been used in the generation of dispersion contours.
A. THEORETICAL BACKGROUND
Assuming that linear theory holds, the covariance matrix of e r rors can be obtained at any time, t., provided that the covariance matrix at
J
some earlier time, t., is known. The equation relating these e r rors is
*(t , t ) CV^ cfj'r (t t.) = CV (P-1) 3 i J j
where 4" (t., t.) is the sensitivity or state transition matrix from time t. J
T to time t., 4" (t., t.) is the transpose of this matrix, and CV, is the J J T
covariance matrix at time t.. In Eq (P-1) and subsequent discussion it should be understood that the reference of time can be interchanged to a reference of constant altitude as well. The following discussion, however, will refer to the time reference.
The covariance matrix, CV , represents the state er ror at some 3
time t. that can be associated with a nominal trajectory.
A sightly different form of Eq (P-1) is obtained when tracking data are factored into the system. In this case a "best estimate" of the nominal trajectory can be obtained via weighted least squares methods by using these tracking data. Filtering techniques have been developed, where linear theory holds, to predict the covariance matrix that is associated with the predicted nominal trajectory. Thus, if tracking data are taken until some time t. there will exist a nominal trajectory
MND-2!0pt>-5^.-3. 145

and a tracking covariance matrix, TRCV, , based on these data. If no i further data are recorded and one is interested in knowing what the
covariance matrix of e r rors is tained by using (P-1) to obtain covariance matrix of e r rors is at some later time t., this can be ob-
J
<\>(t , t.) (TRCV ) ^^ (t , t.) = CV . (P-2) J i J j
If no other e r ro r s are introduced into the system, Eq (P-2) is sufficient to determine the e r ro r s at any time t. Unfortunately, when a velocity impulse is added to the velocity of the nominal trajectory at some time t , new e r ro r s are introduced into the system. Some of the
questions that naturally ar ise from such a stituation are :
(1) What type of e r ro r s are actually introduced into the system?
(2) What type of a covariance matrix representation would these e r rors have?
(3) What is the total e r ro r at time t ? (That is,how is this new
covariance matrix added to the tracking or state covariance matrix?)
(4) How is the total e r ror obtained at some later time?
The following analysis is designed to answer these questions.
B. ANALYTIC ANALYSIS
1. Shutoff Error
Due to the uncertainty in the burn time, there exists an e r ror in the magnitude of the velocity impulse vector. This e r ro r is in the same direction as the AV vector, and the magnitude of the e r ror can be r ep re sented by taking a percentage of the magnitude of the AV vector. Assume CA represents the appropriate percent.
The AV vector is defined as
AV = A X i + A y j + A z k (P-3)
where i, j , k are orthogonal unit vectors in the base or reference system. A x , Ay> and A ^ are the components of the AV vector in this reference system. Another orthogonal unit vector (called prime)is
•• ••• » • • • • • • • • » •
NriDEMTIAL MNCr-203Q"R-2' :•; : U 6 : : :
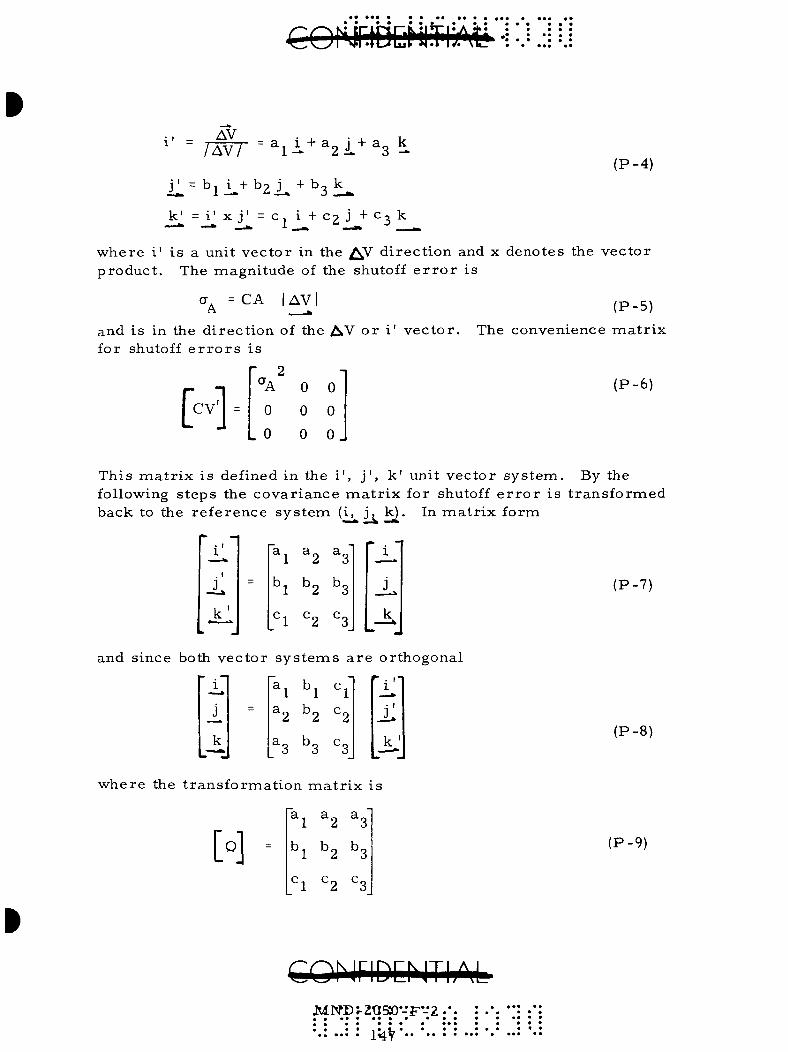
( P - 4 )
i l " ^ii.+ ^zL ^ ^3^.. k ' = i ' x j ' = c , i + C 2 J + c-j^k
w h e r e i ' i s a un i t v e c t o r in the / \V d i r e c t i o n and x d e n o t e s the v e c t o r p r o d u c t . The m a g n i t u d e of the shutoff e r r o r i s
^A = ^ ^ ' ^ ' ( P - 5 )
and i s in the d i r e c t i o n of the ^ V o r i ' v e c t o r . The c o n v e n i e n c e m a t r i x for shutoff e r r o r s i s
[cv] r 2
A 0 0
0 0 0
L 0 0 0 J
(P -6 )
T h i s m a t r i x i s def ined in the i ' , j ' , k ' un i t v e c t o r s y s t e m . By the following s t e p s the c o v a r i a n c e m a t r i x for shutoff e r r o r i s t r a n s f o r m e d b a c k to the r e f e r e n c e s y s t e m (i, j , k ) . In m a t r i x f o r m
^1 ^2 ^3
^1 ^ 2 ^3
^1 ^2 ^3 k
(P -7 )
and s ince both v e c t o r s y s t e m s a r e o r t h o g o n a l
i^
£ k^
=
a^ b^
^2 ^2
^3 ^3
^ l '
^2
^3
r • i'\ 1
£ k^
(P-8)
w h e r e the t r a n s f o r m a t i o n m a t r i x i s
[«] ^1 ^2 ^3
b^ b2 bg
^1 ^2 ^3
(P-9)
CQMriDChlThM J^WDr2aS0-F-2 .*. • • • • • • • » • • • « • • • • • • • • • • •
• • • • • • 1 *4-V ** • • • •

then
k'] =[o ] (P-IO)
-1 T where Q and Q a re the inverse and the t ranspose of the m a t r i x Q. Fo r an a r b i t r a r y vector , A, the following is true
A_ = Xi^+ Yj + Zk = X ' i ' + Y ' j ' + Z'k ' (P-11)
Therefore , the or igins of these two coordinates coincide. In m a t r i x form
R = X Y Z
[i i J
In ma t r i x form
r
14 X
Y
Z
X ' Y' Z '
r^'ii' ^] (P-12)
^ s "2 ^ "2
^ N "3
X'
Y'
Z '
Da L i l l
• "
^ ^1 ^1
^ 2 ^ 2 ' ^ 2
^ N 3
r* 1 X'
Y'
Z '
(P-13)
Then the covar iance vector in the i, j , k unit vector system is
[cv] k
t 1 [cv] i l = [o ] [cv] [a] J, k*
and in m a t r i x form
[cv] =[Q-][CV][Q] = . /
k
(P-14)
^1
( a j a2)
(a^ ag)
(aj a2)
^2^
(ag ag)
(a j ag)
(a^ ag)
2 ^3
(P-15)
• • • • • . • • • • • • • • • : . : :•: :14S: : : : : :

Note: The e lements of this covariance m a t r i x for shutoff e r r o r s depend completely on the components of the unit vector i ' .
2. Coning E r r o r
Another e r r o r that a r i s e s when injecting a AV irapulse into the s y s tem is the attitude control e r r o r , called the coning e r r o r . This e r r o r is dependent on the magnitude of the AV vector and the ability to control the direction of this thrus t vector a s is i l lus t ra ted in the diagram.
Velocity before thrus t 2Ae
AV vector
E r r o r el l ipse due to attitude control e r r o r
| A V | (AG)
The t rea tment of this e r r o r will depend on the following assumptions .
(1) For a sma l l angle AO, the base of the cone can be considered a c i rc le in a plane perpendicular to the AV vector .
(2) For sma l l AG, the rad ius of the cone is approximately I A V I (AG).
Define a new unit vector sys tem (called double pr ime) whose unit vec tors a re
AV "AV " 1 L + 2 i* + 3 ^
(P-16) . _ k " x k
-^ ^ griT? = ^li.+ ^2L
j " = ^ ^ 1 1 1 = ® l L . ^ ®2 • ^ ® 3 ^
where i, j , k a re the same reference unit vec tors in the shutoff e r r o r section. There is no component of the i" unit vector in the k direction since i" is perpendicular to i t . " ^
:4:9

The m a g n i t u d e of the con ing e r r o r i s
a^ = I AVI AG ( P - 1 7 )
The coning e r r o r w i l l be d e s c r i b e d only in the p i t ch and yaw p l a n e s and t h e r e f o r e , the c o v a r i a n c e m a t r i x for the coning e r r o r in the i " , j " , k " s y s t e m i s
0
CV'
2 n a^ 0
0 ( P - 1 8 ) 0 o \j r
.0 0 0
Aga in for an a r b i t r a r y v e c t o r . A, the fol lowing i s t r u e
A = X i + Y j + Z k = X " i " + Y" j " + Z " k " ( P - 1 9 )
Us ing the s a m e m a t r i x t e chn ique d e s c r i b e d in the shutoff e r r o r s e c t i o n , the c o v a r i a n c e m a t r i x for the coning e r r o r in the i , j , k s y s t e m i s
C V . = ^ 2 ^2 '2
0
0 0
d d 0 1 2
e e e 1 2 3
f f f 1 2 3
(P -20 )
o r
CV = CT
(d^ +e^h ^^lS^^1^2) ^1^3
< ^ ^ 2 ^ ^ ^ 2 ) <^2 ^^2') ^2 ^3
^ ^ 3 ^ 2 ^ 3 3 . T o t a l C o v a r i a n c e M a t r i x
( P - 2 1 )
S ince the shu tdown and con ing e r r o r s a r e i n d e p e n d e n t of e a c h o t h e r , t h e c o v a r i a n c e m a t r i c e s , CV^ and C V 2 , can be a d d e d in the n o r m a l
m a t r i x fash ion to y i e ld
C V 3 = C V ^ + C V 2 ( P - 2 2 )
T h i s c o v a r i a n c e m a t r i x , C V ^ , r e p r e s e n t s e r r o r s due to both shu tdown
and coning. It shou ld be no ted tha t CV„ i s a 3 by 3 m a t r i x and r e p r e
s e n t s an e r r o r in v e l o c i t y only . The fo l lowing 6 by 6 c o v a r i a n c e m a t r i x
i s c o m p l e t e l y r e p r e s e n t a t i v e of the m e n t i o n e d e r r o r s
CQfjriDD^ThM ,MND-.20aO.-^.-2
- - - •

cv. 0
0
0_
cv. (P-23)
The total e r r o r at t ime t mus t be a function of CV„, TRCV and /o r o o
CV and s ince the assoc ia ted e r r o r s a r e independent, the total e r r o r i
can again be obtained by no rma l ma t r ix addition. Thus ,
CV, , - TRCV + CV„ tot 3 (P-24)
and now that CV has been obtained,it i s just a ma t t e r of formality to
propagate this e r r o r from t ime t to t. by means of Eq (P-1) . Thus ,
CV(t,)=G(t . , V c v ^ o t ^ <V V (P-25)
where CV (t.) is the covariance ma t r i x at t ime t. in the i, j , k coordinate sys t em.
It is often des i rab le to obtain the covariance mat r ix in a downrange, c r o s s r a n g e , alt i tude coordinate sys t em and this can be obtained by cons ider ing the following t ransformat ion . Let i denote the downrange
direct ion, j the c ros s range di rect ion, and k the altitude direct ion. If R and V denote the position and velocity of a par t ic le in the nominal orbi t at t ime t. , then
It is often des i rab le to obtain the covar iance ma t r i x in a downrange, c r o s s r a n g e , altitude coordinate system and this can be obtained by considering the following t ransformat ion . Let i"J denote the downrange direct ion, jj_^ the c r o s s r a n g e direct ion, and k ^ ' the altitude direct ion. If ^ a n d y^denote the posit ion and veloticy of a par t ic le in the nominal orbi t at t ime t^, then
R
= j
R
R -*»
r 1 1
^
X V^
X V — *
X k '
Uj i + n2 j + n^ k
m i + m j + m., k
= 1 i + 1 j + 1 k 1— zi^ 3—'
(P-26)
MND---E93a-r.-2 • • • 151* • • •
• • • • • • • « •
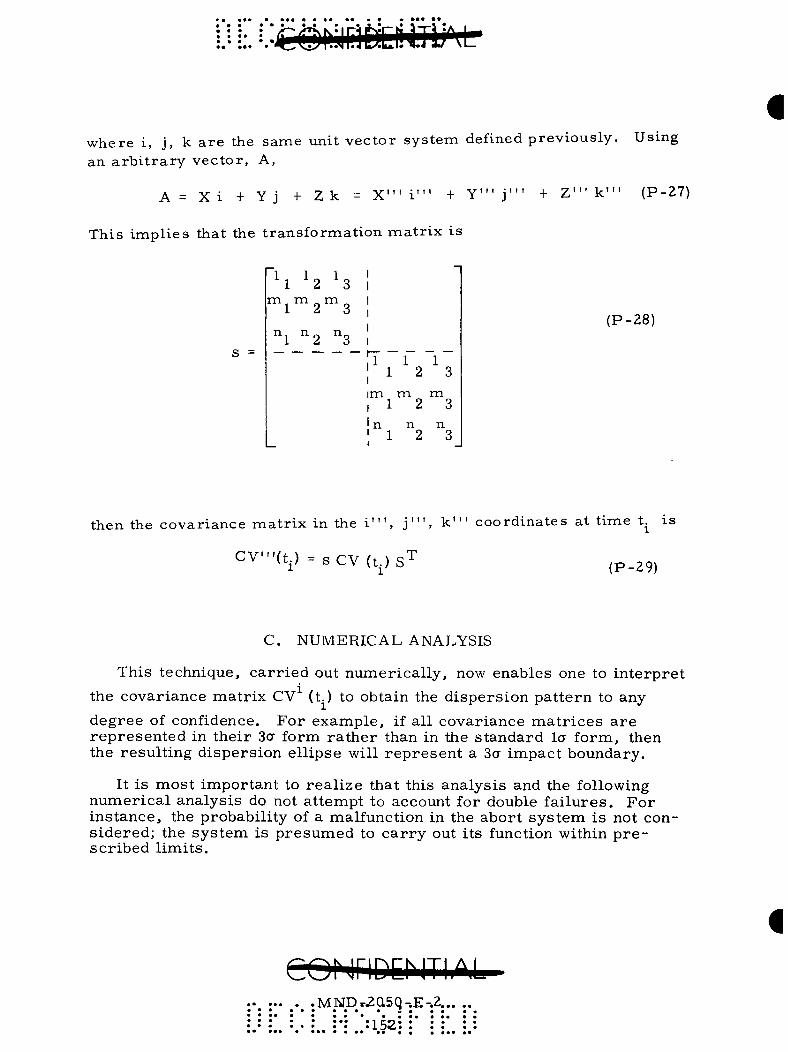
where i, j , k a r e the same unit vector system defined previous ly . Using an a r b i t r a r y vec tor , A,
A = X i + Y j + Z k = X ' " i ' " + Y " ' j " ' + Z ' " k ' " (P-27)
This impl ies that the t ransformat ion m a t r i x is
^1 '2 h m ^ m 2 m 3
n^ n^ Ug
I im m m I 1 2 3 I n n n I 1 2 3
(P-28)
then the covar iance m a t r i x in the i " ', j " ', k " ' coordinates at t ime t i s
C V - ( t . ) = s c v (t.) S ^ , p . 2 , )
C, NUMERICAL ANALYSIS
This technique, c a r r i ed out numer ica l ly , now enables one to in te rp re t
the covariance mat r ix CV (t.) to obtain the d ispers ion pa t te rn to any
degree of confidence. For example , if all covariance m a t r i c e s a r e r ep re sen t ed in the i r 3or form r a t h e r than in the s tandard ICT form, then the resul t ing d ispers ion el l ipse will r e p r e s e n t a 3CT impact boundary.
It is mos t important to r ea l i ze that this analys is and the following numer i ca l analysis do not a t tempt to account for double f a i lu res . F o r ins tance , the probabil i ty of a malfunction in the abor t sys t em is not cons idered ; the sys tem is p re sumed to c a r r y out its function within p r e scr ibed l imi t s .
C-OP iriDQ ITIiAiL . . .MNDr2a5q-.E-.2
152

1. Ascent Phase
During the boost or ascent phase it is assum.ed that the e r r o r in the launch vehic le ' s s ta te vector is se l f -genera ted; i. e. , no outside influence such as t racking can improve the veh ic le ' s s ta te . The state covariance mat r ix , CV , can be expressed thusly:
i
CV t.
iSaf O (3a.)
O X
(3„.)'
where
y
and
three sigma var ia t ion in position and velocity, respect ively , along the x - axis; three sigma var ia t ion in the position and velocity, respect ively, along the y - axis;
three sigma variat ion in the position and velocity, respect ively , along the z - ax is .
The va r i ances were obtained by means of s imulat ing the boost flight in the p re sence of propulsion and guidance sys tem e r r o r s . Fo r a r b i t r a r i ly se lected t imes during ascent , the following table is compiled
2 showing the nuntierical (3CT) used in the ana lys is .
TABLE P - 1 2
(3a) V a r i a n c e s - - E T R Launch Tra jec to ry for Titan IIIC
Time from Liftoff (sec)
160
260
360
460
660
Injection
i3af
(km,2)
129.25
1046. 78
4537.37
11459.7
49729
104976
(3a^)^
(km^)
17. 78
77.41
204.08
411. 81
561. 22
719. 37
(3a )2 (3a^)2 z -
(km ) (km / s e c
51.21 0.0146 32. 29
28.90
0. 60
0.28
0. 10
0. 1146
0. 1480
0.1884
0.0412
0. 00001
TFh ITI *
is./ ) (km / s e c
0.0016
0.0028
0.0032
0.0040
0.0040
0.0040
1
(3af
h (km^/sec^)
0.0005
0.0011
0.0024
0.0015
0.0003
1 X 10"^
« • • • • • • • • • • • • • • i J ^ • • • • • • • l ^ > • •
• • • • • • - ^ - A ^ * * • • •
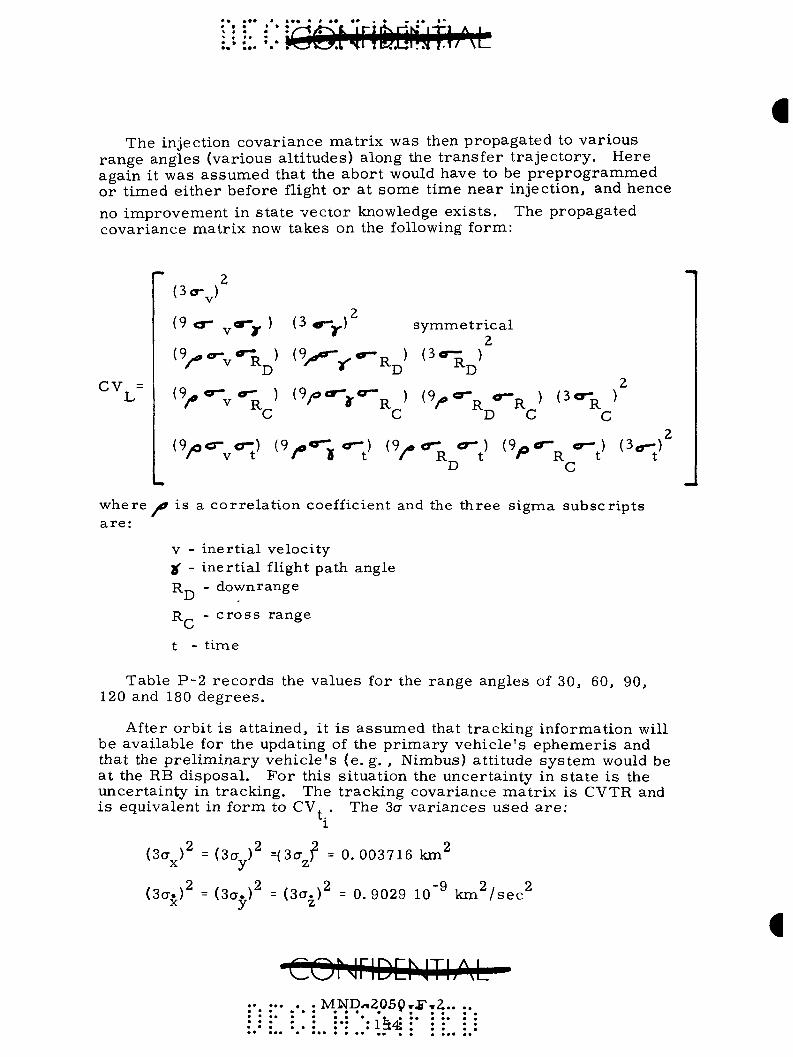
t (: mNrii)mffljM
The injection covariance ma t r ix was then propagated to var ious range angles (various al t i tudes) along the t rans fe r t ra jec tory . Here again it was assumed that the abor t would have to be p r e p r o g r a m m e d or t imed e i ther before flight o r at some t ime nea r injection, and hence
no improvement in s ta te vector knowledge ex i s t s . The propagated covariance mat r ix now takes on the following form:
V=
' 2»-v '^
< ' « » - v
IV^v
'Vv
'V-^v
• - r '
- - o '
- - c ' o- ) (S
(3 4r-y)^
(V--^<^ (Vor-yc^
/ -n ^t'
- D '
-c '
<v
symmetr ica l 2
'>'-o'^-c' c
where y^ is a cor re la t ion coefficient and the three sigma subscr ip ts a r e :
V - iner t ia l velocity jf - iner t ia l flight path angle R - down range
R - c r o s s range
t - t ime
Table P-2 r eco rds the values for the range angles of 30, 60, 90, 120 and 180 degrees .
After orbit is at tained, it i s assumed that t racking information will be available for the updating of the p r i m a r y vehic le ' s ephemer i s and that the p re l imina ry veh ic le ' s (e. g. , Nimbus) att i tude sys tem would be at the RB disposal . For this si tuation the uncertainty in s ta te i s the uncer ta inty in t racking. The t racking covariance mat r ix is CVTR and is equivalent in form to CV, . The 3a va r i ances used a r e :
i
(3a )^ = (3a )^ =(3a f = 0. 003716 km^ x y z
(3a . )^ = (3a . )^ = (3a . )^ - 0. 9029 lo"^ k m ^ / s e c ^ X y z
cor iriDD JThM MND«20SgT£',a
*:1^4
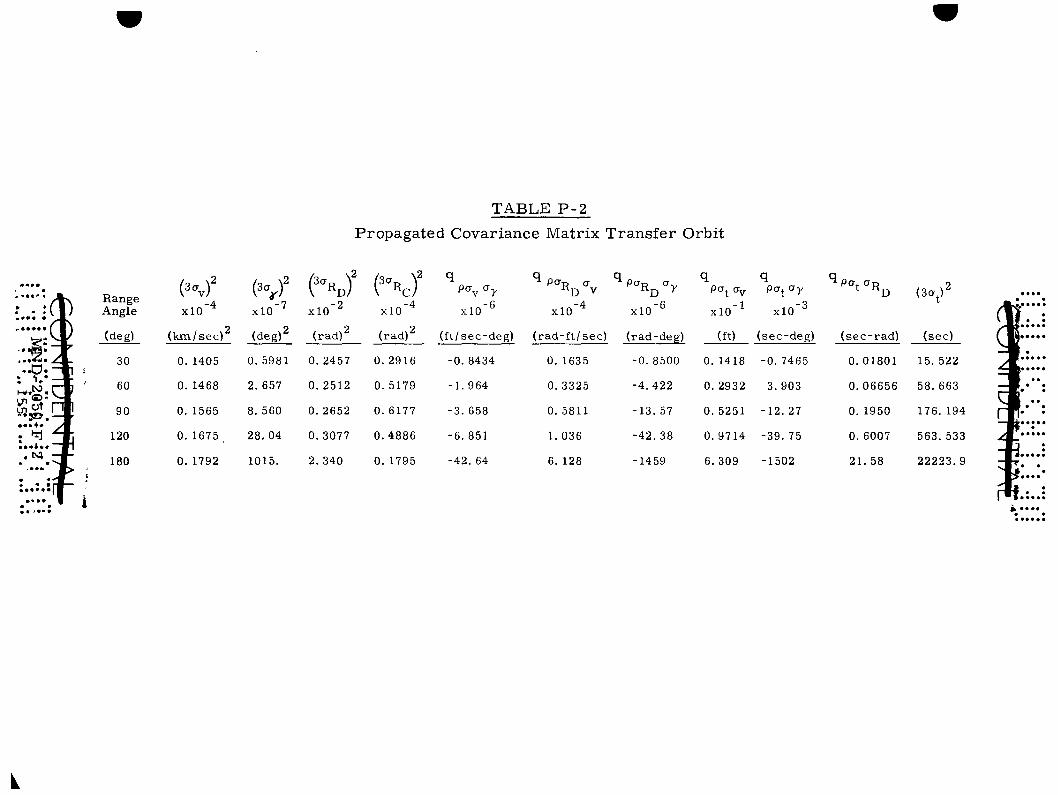
TABLE P-2
Propagated Covariance Matrix Transfer Orbit
( ' " / xlO"'
(deg)2
0.5981
2. 657
8. 560
28.04
1015.
e-nj xio"^
(rad)2
0. 2457
0.2512
0.2652
0.3077
2. 340
e-^cT -4
XlO
(rad)2
0.2916
0.5179
0.6177
0.4886
0.1795
q P<J^<Jy
xio"*
(ft/sec-deg)
-0.8434
-1.964
-3.658
-6,851
-42. 64
«D V -4
XlO
(rad-ft/sec)
0.1635
0.3325
0.5811
1.036
6. 128
" P'^RD ' r
xlO'^
(rad-deg)
-0.8500
-4.422
-13.57
-42.38
-1459
q
xio'^
(ft)
0. 1418
0.2932
0.5251
0.9714
6. 309
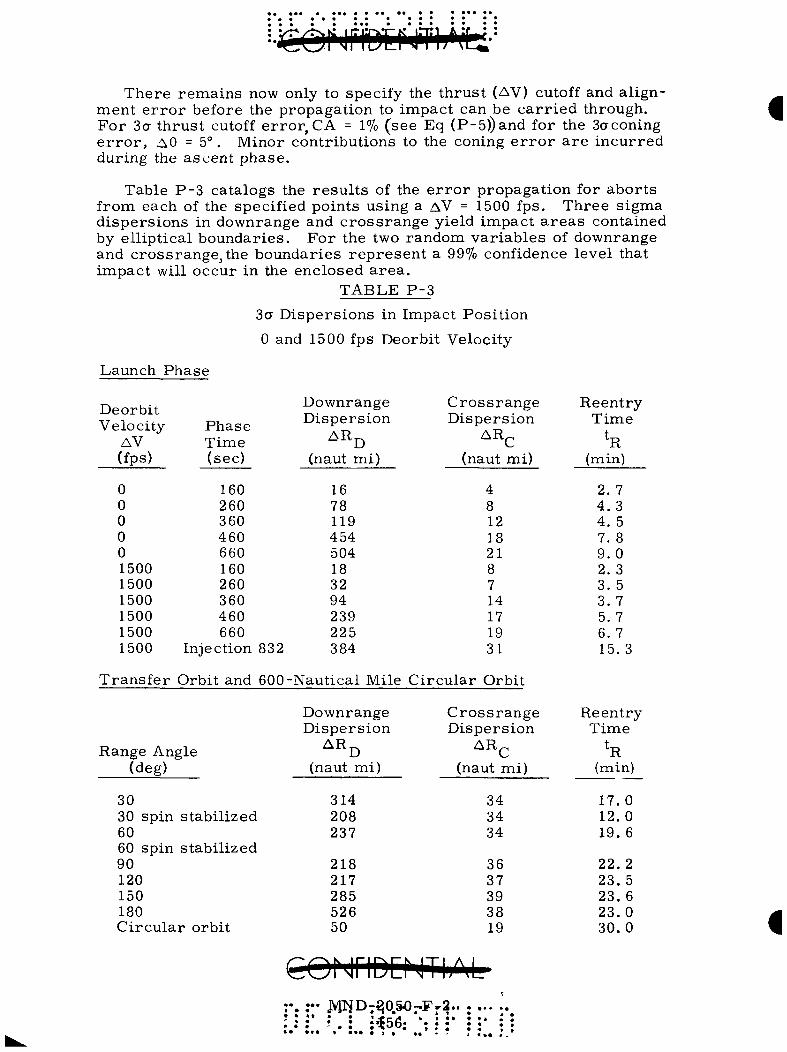
There remains now only to specify the thrust (AV) cutoff and alignment e r ror before the propagation to impact can be carried through. For 3a thrust cutoff error, CA = 1% (see Eq (P-5))and for the 3aconing e r ro r , AG = 5° . Minor contributions to the coning e r ro r are incurred during the ascent phase.
Table P-3 catalogs the results of the e r ror propagation for aborts from each of the specified points using a AV = 1500 fps. Three sigma dispersions in downrange and crossrange yield impact areas contained by elliptical boundaries. For the two random variables of downrange and crossrange, the boundaries represent a 99% confidence level that impact will occur in the enclosed area.
TABLE P-3
3a Dispersions in Impact Position
0 and 1500 fps Deorbit Velocity
Launch Phase
Deorbit Velocity
AV (fps)
0 0 0 0 0 1500 1500 1500 1500 1500 1500
Trans fe r
Range An (deg)
30 30 spin 60 60 spin 90 120 150 180
Phase Time (sec)
160 260 360 460 660 160 260 360 460 660
Downrange Dispers ion
ARj3 (naut mi)
16 78 119 454 504 18 32 94 239 225
Injection 832 384
Orbit and 600-Nautical Mile C
gle
stabil ized
stabil ized
C i r cu l a r orbit
Downrange Dispers ion
ARj^
(naut mi)
314 208 237
218 217 285 526 50
C ros s r a nge Dispers ion
AR^
(naut mi)
4 8 12 18 21 8 7 14 17 19 31
i r cu l a r Orbit
C r o s s r a n g e Dispers ion
AR^
(naut mi)
34 34 34
36 37 39 38 19
^ ^ ^ ^ ^
:•. :•• MlJD7^0.5O:.Fr2.. . . . . .'. : : : ' . : :^56: ; • J • J . 1
Reentry T ime
^R (min)
2. 7 4 . 3 4. 5 7. 8 9 . 0 2. 3 3. 5 3. 7 5. 7 6. 7 15. 3
Reentry Time
^R (min)
17.0 12.0 19. 6
22. 2 23.5 23. 6 23.0 30.0
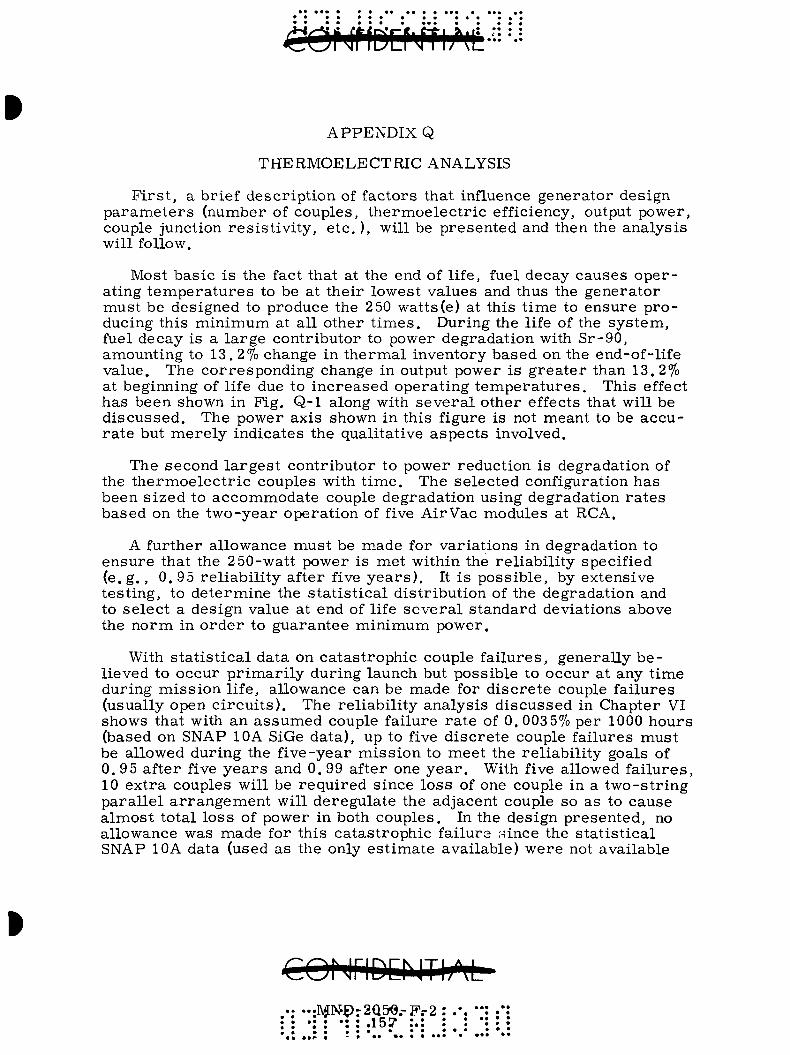
* • • • • • • • ••• • • • • •
APPENDIX Q
THERMOELECTRIC ANALYSIS
F i r s t , a brief descr ipt ion of factors that influence generator design p a r a m e t e r s (number of couples, the rmoe lec t r i c efficiency, output power, couple junction res i s t iv i ty , e t c . ) , will be presented and then the analysis will follow.
Most bas ic i s the fact that at the end of life, fuel decay causes ope r ating t empe ra tu r e s to be at their lowest values and thus the generator must be designed to produce the 2 50 watts(e) at this t ime to ensure p r o ducing this minimum at all other t i m e s . During the life of the sys tem, fuel decay is a la rge contributor to power degradation with Sr-90, amounting to 13, 2% change in t he rma l inventory based on the end-of-life value. The corresponding change in output power is g rea te r than 13.2% at beginning of life due to increased operat ing t e m p e r a t u r e s . This effect has been shown in Fig. Q-1 along with s eve ra l other effects that will be d iscussed . The power axis shown in this figure is not meant to be accur a t e but me re ly indicates the qualitative aspec ts involved.
The second l a rges t contributor to power reduction is degradation of the the rmoe lec t r i c couples with t ime . The selected configuration has been s ized to accommodate couple degradation using degradation r a t e s based on the two-year operat ion of five AirVac modules at RCA.
A further allowance must be made for variat ions in degradation to ensure that the 2 50-watt power is met within the rel iabi l i ty specified ( e . g . , 0 .95 re l iabi l i ty after five y e a r s ) . It is possible, by extensive tes t ing, to de termine the s ta t i s t ica l distr ibution of the degradation and to se lect a design value at end of life s eve ra l s tandard deviations above the norm in o rde r to guarantee minimum power.
With s ta t i s t i ca l data on catas t rophic couple fa i lures , generally b e lieved to occur p r ima r i l y during launch but possible to occur at any t ime during miss ion life, allowance can be made for d i sc re te couple failures (usually open c i rcu i t s ) . The rel iabi l i ty analysis d iscussed in Chapter VI shows that with an assumed couple failure r a t e of 0.0035% per 1000 hours (based on SNAP lOA SiGe data) , up to five d i sc re te couple failures must be allowed during the f ive-year miss ion to meet the rel iabi l i ty goals of 0 .95 after five y e a r s and 0. 99 after one y e a r . With five allowed fa i lures , 10 extra couples will be requi red since loss of one couple in a two-s t r ing para l le l a r rangement will deregulate the adjacent couple so as to cause a lmost total loss of power in both couples . In the design presented, no allowance was made for this ca tas t rophic failure wince the s ta t i s t i ca l SNAP lOA data (used as the only es t imate available) were not available
;MN^r2Q5r0.-F.-2 •: : .157 - -
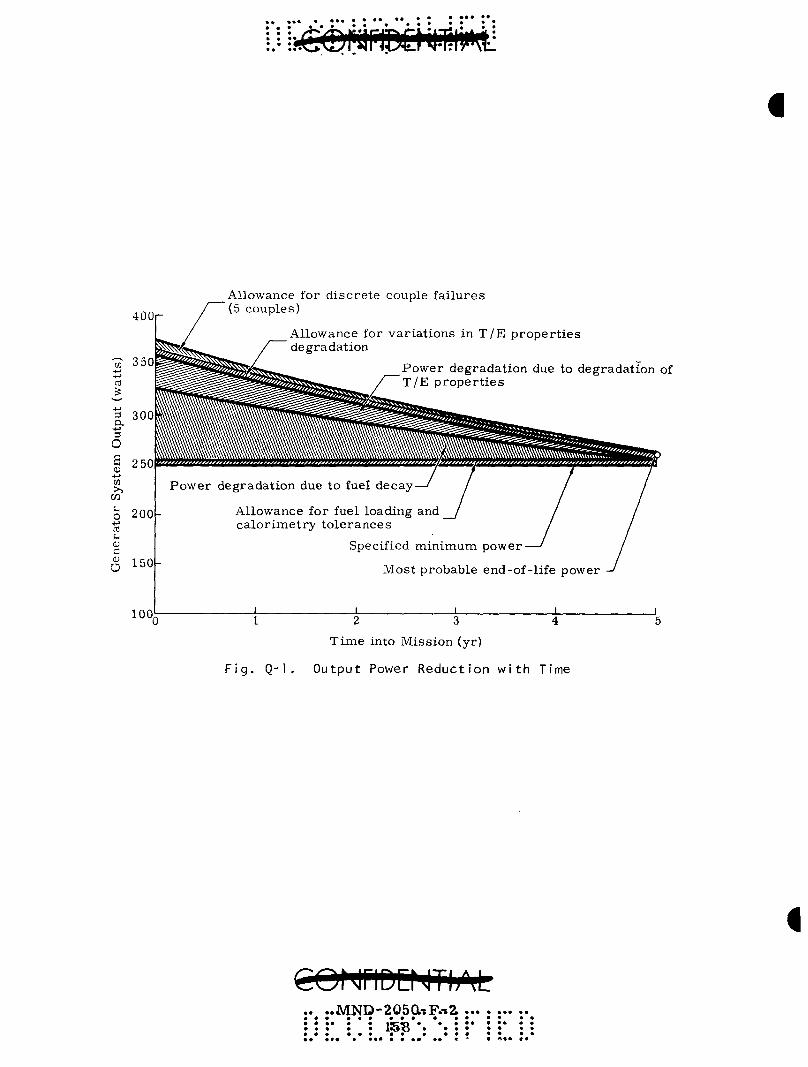
400
350
as
3 a 3 o a to
xn
o • ( - >
03 U 0! C a>
O
300
2 50
200
150
Allowance for d i sc re te couple fa i lures (5 couples)
Allowance for var ia t ions in T / E p rope r t i e s degradat ion
Power degradat ion due to degradation of T /E p rope r t i e s
Power degradat ion due to fuel decay
Allowance for fuel loading and ca lo r ime t ry to l e rances
Specified minimum power-
Most probable end-of-l ife power
lOOi
F i g . Q-1
2 3 4 T i m e into Mission (yr)
O u t p u t Power R e d u c t i o n w i t h Time
COf JriDD JTbM .MNp-2^05a-F.^2
lbs**. **.
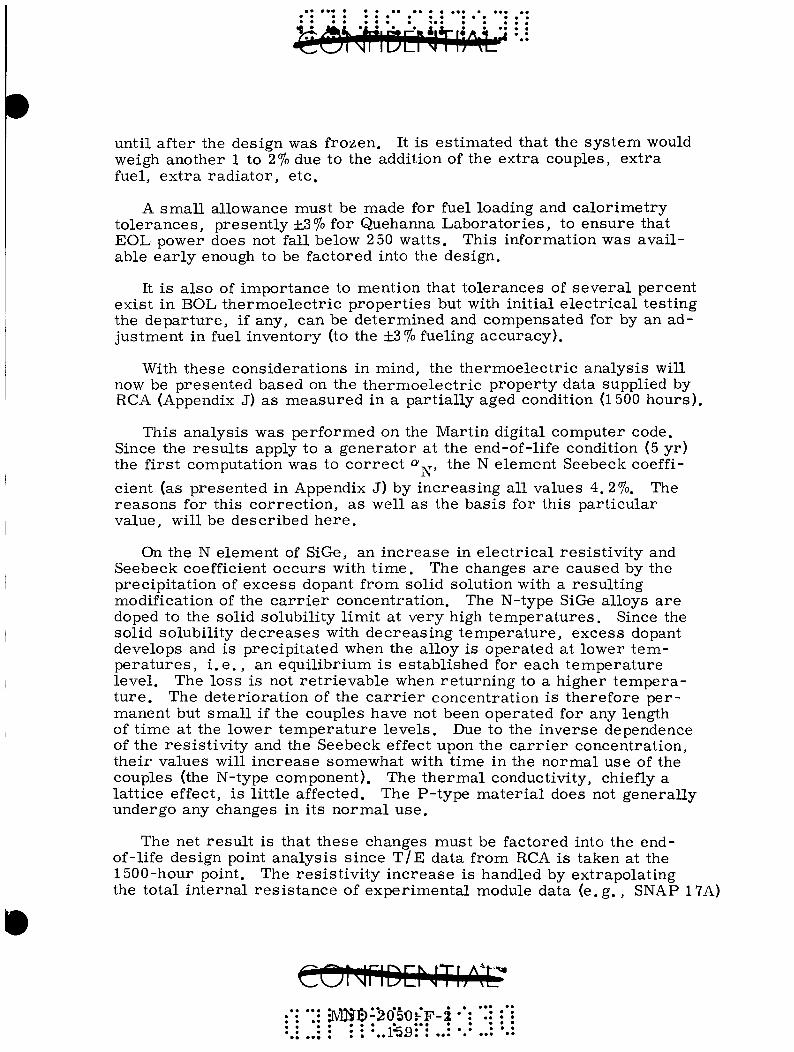
until after the design was frozen. It is es t imated that the sy s t em would weigh another 1 to 2% due to the addition of the ext ra couples, ex t ra fuel, ex t ra r ad ia to r , e tc .
A sma l l allowance must be made for fuel loading and ca lo r imet ry to l e rances , present ly ±.3% for Quehanna Labora to r i e s , to ensure that EOL power does not fall below 2 50 wa t t s . This information was ava i l able ea r ly enough to be factored into the design.
It is a lso of importance to mention that to lerances of severa l percent exis t in BOL the rmoe lec t r i c p roper t i es but with initial e l ec t r i ca l test ing the depa r tu re , if any, can be de termined and compensated for by an adjustment in fuel inventory (to the ±3% fueling accuracy) .
With these considerat ions in mind, the the rmoe lec t r i c analysis will now be presented based on the the rmoe lec t r i c proper ty data supplied by RCA (Appendix J) as measu red in a par t ia l ly aged condition (1500 hours ) .
This analysis was performed on the Martin digital computer code. Since the r e su l t s apply to a genera tor at the end-of-life condition (5 yr) the f i rs t computation was to c o r r e c t Q'„, the N element Seebeck coefficient (as presented in Appendix J) by increas ing all values 4. 2%. The r easons for this cor rec t ion , as well as the bas is for this par t icu lar value, will be descr ibed h e r e .
On the N element of SiGe, an inc rease in e lec t r i ca l res i s t iv i ty and Seebeck coefficient occurs with t i m e . The changes a r e caused by the precipi ta t ion of excess dopant from solid solution with a resul t ing modification of the c a r r i e r concentrat ion. The N-type SiGe alloys a r e doped to the solid solubility l imit at very high t e m p e r a t u r e s . Since the solid solubility dec rease s with decreas ing t empera tu re , excess dopant develops and is precipi ta ted when the alloy is operated at lower t e m p e r a t u r e s , i . e . , an equi l ibr ium is es tabl ished for each t empera tu re level . The loss is not r e t r i evab le when re turn ing to a higher t e m p e r a t u r e . The deter iora t ion of the c a r r i e r concentrat ion is therefore pe r manent but smal l if the couples have not been operated for any length of t ime at the lower t empera tu re l eve l s . Due to the inverse dependence of the res i s t iv i ty and the Seebeck effect upon the c a r r i e r concentration, the i r values will i nc rease somewhat with t ime in the normal use of the couples (the N-type component). The t he rma l conductivity, chiefly a la t t ice effect, is l i t t le affected. The P- type ma te r i a l does not general ly undergo any changes in its normal u s e .
The net r e su l t is that these changes must be factored into the end-of-life design point analysis s ince T / E data from RCA is taken at the 1500-hour point. The res i s t iv i ty inc rease is handled by extrapolat ing the total in ternal r e s i s t ance of exper imenta l module data (e .g . , SNAP 17A)
:••: ".: ilVIH]3)-*20'5OhF-2 '*: '": : ' ; I , r . . . » ••• . • ' \
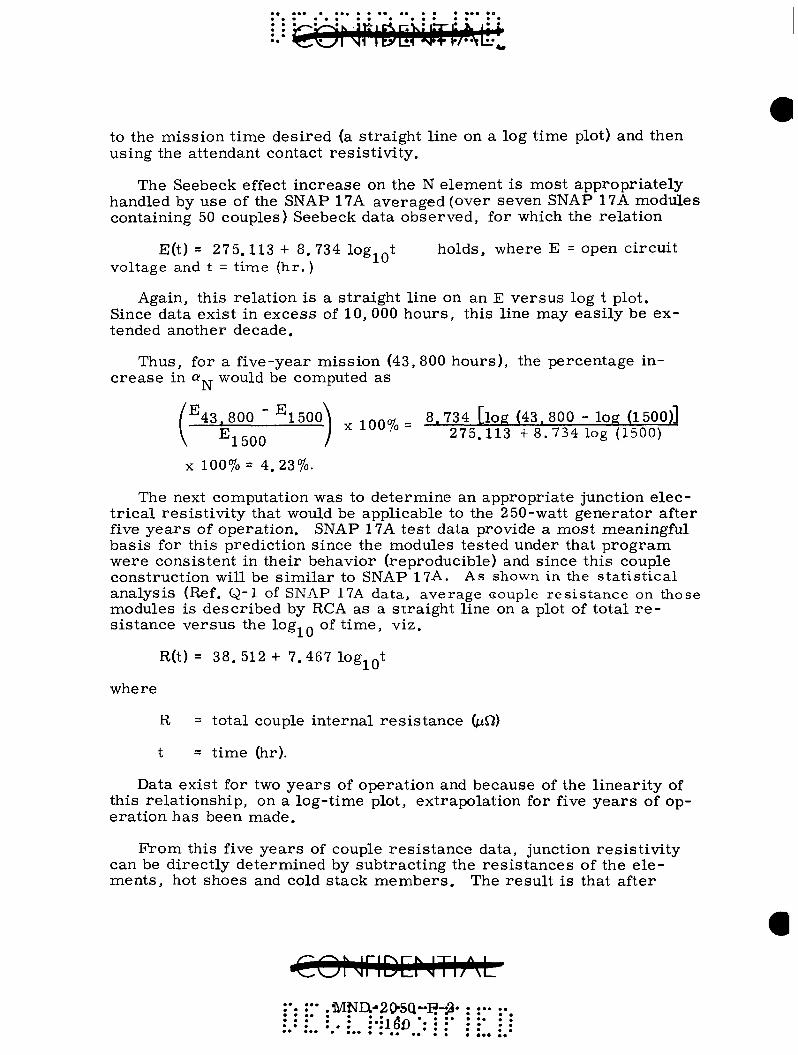
4a
to the mission time desired (a straight line on a log time plot) and then using the attendant contact resistivity.
The Seebeck effect increase on the N element is most appropriately handled by use of the SNAP 17A averaged (over seven SNAP 17A modules containing 50 couples) Seebeck data observed, for which the relation
E(t) = 275.113 + 8.734 log^^t holds, where E = open circuit voltage and t = t ime (hr. )
Again, this relation is a straight line on an E versus log t plot. Since data exist in excess of 10, 000 hours, this line may easily be extended another decade.
Thus, for a five-year mission (43,800 hours), the percentage increase in o would be computed as
/^43.800 " ^150o\ ^ inna/ = 8.734 [log (43. 800 - log (1500)] \ ^1500 ^ x i u u / o 275.113 +8.734 log (1500)
X 100%= 4.23%.
The next computation was to determine an appropriate junction electr ical resistivity that would be applicable to the 250-watt generator after five years of operation. SNAP 17A test data provide a most meaningful basis for this prediction since the modules tested under that program were consistent in their behavior (reproducible) and since this couple construction will be similar to SNAP 17A. As shown in the statistical analysis (Ref. Q-1 of SNAP 17A data, average couple r e s i s t ance on those modules is described by RCA as a straight line on a plot of total r e sistance versus the log., Q of time, viz.
R(t) = 38. 512 + 7. 467 log^gt
where
R = total couple internal resistance (ixQ)
t = time (hr).
Data exist for two years of operation and because of the linearity of this relationship, on a log-time plot, extrapolation for five years of operation has been made.
From this five years of couple resistance data, junction resistivity can be directly determined by subtracting the resistances of the elements, hot shoes and cold stack members . The result is that after
•COMriDQilThM .MNa-205a"ia-^-• • • • - * • : . : :-:l6o

five years , the junction (contact)resistivity per couple will be 1800 2
fi.Sl-cm , based on the RCA equation.
The equation used by RCA essentially presents an average value of resistance describing SNAP 17A modules. Rigorously, one should use the 3a value of resistance to assure that 99 % of the modules will produce at least the required power. This rigorous statistical approach was justifiably not used in Phase 0 since there was very little scatter in the data and the net result would not have been substantially different. In Phase I, provided additional life data are available, the 3a approach will be used.
The thermoelectric analysis itself was performed by a digital computer code developed by Martin several years ago. The technique used is described in detail in Ref. Q-2 and will not be repeated here.
The thermoelectric computer analysis was performed for junction resistivities of 1200, 1800 and 2400 ij,^-cm to determine the effect of a variation in this resistivity.
Hot junction temperatures of 1300°, 1400° and 1500° F were used in conjunction with cold junction temperatures of 400°, 500° and 600° F. All computations were performed for 3/4-inch length elements and a gross electrical power of 275 watts (net power of 250 watts).
The results are presented in Figs. Q-2 through Q-5.
The nominal operating point at end of life for the 250-watt RTG is 1450° F on the hot junction and 550° F on the cold junction. From Fig. Q-2, the thermoelectric efficiency is 5.43% for a resistivity of
2 1800 |un-cm . Figure Q-4 shows that for 28 volts net and a simple series connection, 198 couples are required. For a series parallel connection, 396 couples are necessary. From Fig. Q-5, for the series-paral lel connection, it can be determined that the required N-
2 and P-element cross-sectional areas are 0.091 and 0.056 in. , r e spectively.
REFERENCES
Q-1. "High Temperature Cascaded Thermoelectric Module Development Program and Module Testing, " NYO-3484-42 for the period April 1, 1965 to June 30, 1965, Second Quarterly Report, Power Level Analysis of SNAP 17A Developmental Modules as a Function of Operational Life. "
•CONriDCNTIAL . . . . . Jcfiy4Q-'2£)50-»E'-2: . ' . • " :*
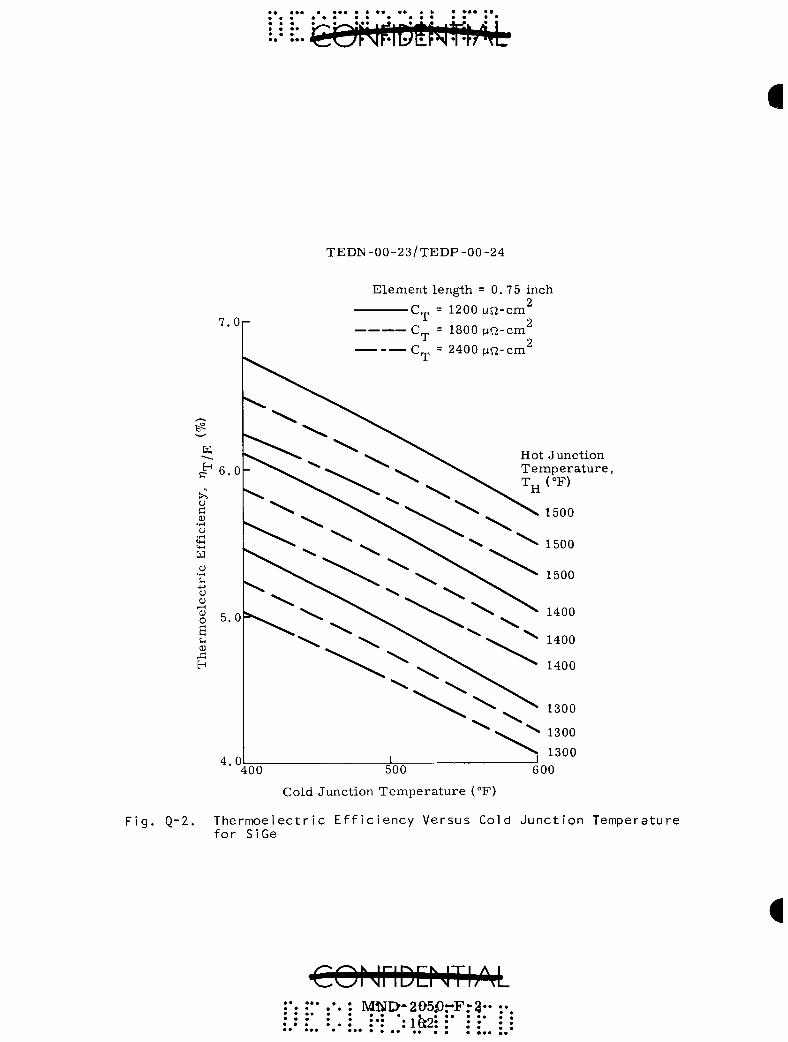
T E D N - 0 0 - 2 3 / T E D P - 0 0 - 2 4
7.Or
4.0
Element length = 0 . 7 5 inch
C „ = 1200 Mn-cm^
C = 1800 MQ-cm^
C ^ = 2400 ^Q-cm^
400 500
Cold Junction T e m p e r a t u r e (°F)
Hot Junct ion m p e r a t u r e ,
(°F)
600
Fig. Q-2. Thermoelectric Efficiency Versus Cold Junction Temperature for SiGe
CONriDENIhM MNI>'2O5-0rFr3" :•: : i a2 : :

7 . 0
F i g . Q - 3 .
o
t-l W o
•iH u -(-» o 4)
r—I (U O B u 0)
H
6 . 0
5 . 0
4 . 0 1000
TEDN-00-23 /TEDP-00-24
Cold Junction T e m p e r a t u r e , T^ (°F)
400
500
•600
Element length = 0.75 inch T
H 1450° F
_L 2000 3000
Contact Resis t ivi ty pe r Couple (ixQ-cm )
T h e r m o e l e c t r i c E f f i c i e n c y V e r s u s C o n t a c t R e s i s t i v i t y fo r SiGe
CONriDCNTIjM f » 9 • • • » ••
•MNJD-209J3-F-2: * • • • • - M a ^ n * * * * • • * • •
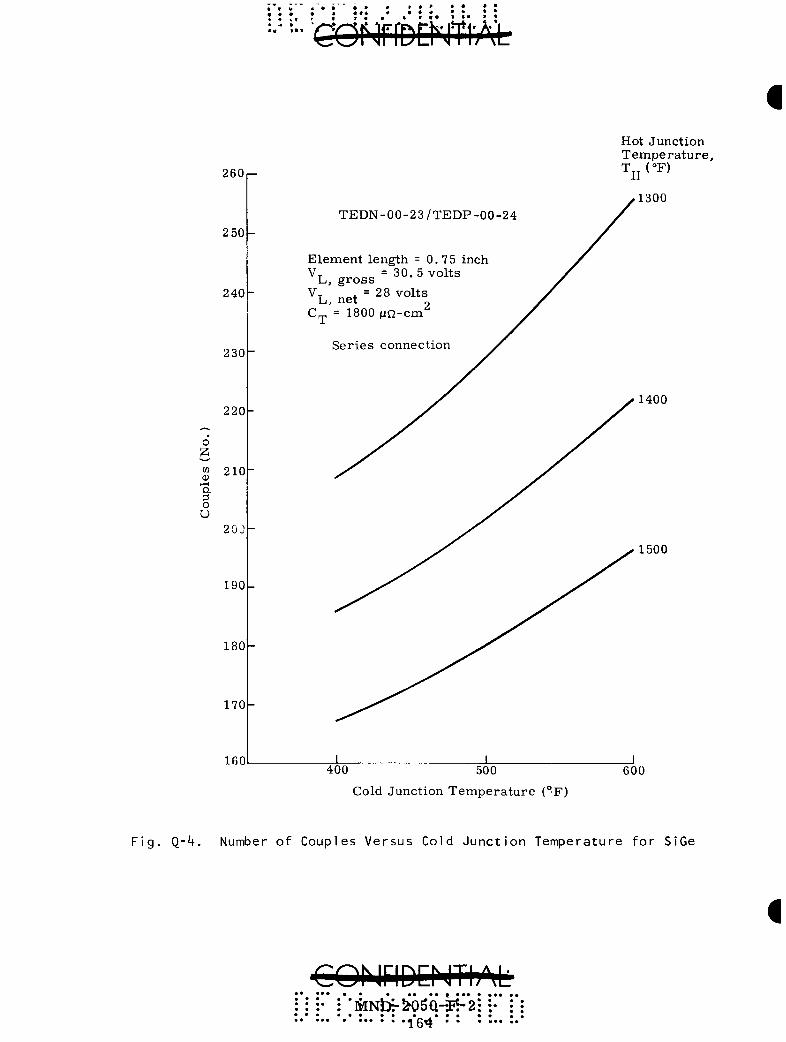
2 6 0 , -
2 5 0 -
TEDN-00-23/TEDP-00-24
Element length =0.75 inch V gross = 30. 5 volts
V L , net = 28 volts C^ = 1800 nn-cm
Series connection
J_ 400 500
Cold Junction Temperature (°F)
Hot Junction Temperature, Tj jCF)
1300
1400
1500
600
Number o f Couples Versus Cold Junc t ion Temperature f o r SiGe
CQNriDDITIjM :*']ilNb5-S?65a-ji"2
•164

IV
a
a 0)
I—(
w
0.6
- ' 0. 5 OH
Q
; 4
0 . 4 -
0.3
TEDN-00-23 /TEDP-00-24
Element Length = 0 .75 inch
C ^ = 1800 Mli-cm^
V g ros s
275 watts
= 30 .5 vol ts L, g ros s VT „^+ =» 28 vol ts L, net Se r i e s connection
Hot Junction T e m p e r a t u r e , T^ (°F)
1300
1400
1500
1300
1400
1500
• D. N D,
_L 400 500
Cold Junction T e m p e r a t u r e (°F)
600
Fig. Q-5. Element Diameter Versus Cold Junction Temperature for SiGe
COrriDEMTLM •MND-'2a50rP72-.

^•itbVr'ibt-MTiiM
Q-2. "Engineering Study Proposal - -Radioiso tope Thermoe lec t r i c Gene ra to r for Nimbus and OAO Satel l i tes , pany MND-5139, October 1965.
Appendix A, Martin Com-
CONriDDJTIAL v f * « •
.: •MND{-2O30'iF;-2
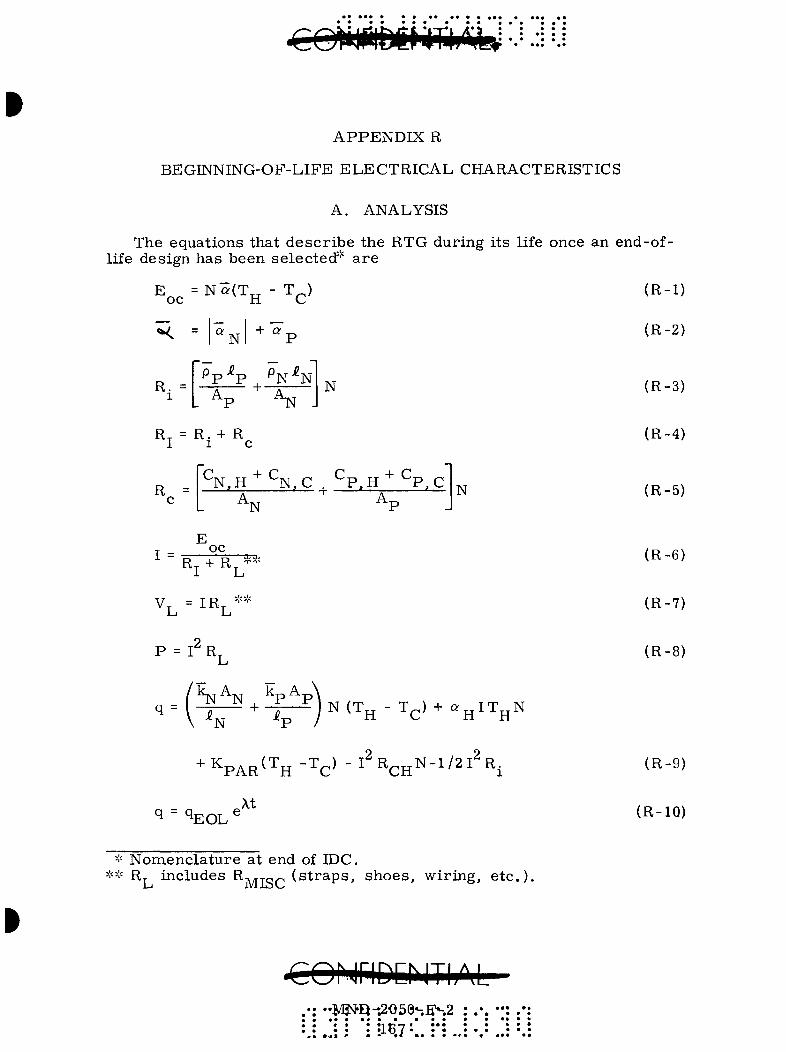
APPENDIX R
BEGENNING-OF-LIFE ELECTRICAL CHARACTERISTICS
A. ANALYSIS
The equations that desc r ibe the RTG during its life once an end-of-life design has been selected* a r e
^ o c = N - ( T j , - T ^ )
H
R.
a N + a
P p ^ P ^ P N - ^ N A, * N J
N
R^ = R. + R l i e
R C . , .T + C + C.
N . H ' "^N,C , "^P,H "^P,C A. N
N
E oc
Rj + R J^<
VL = IRL '^
P = I R L
q = k ^ A , . k ^ A
^ -1- ——? I N ( T - T ) + Q' I T N - N ^P / ^ ^C^ H^^H^
• ^ K p A R ^ T ^ - V - l ' ^ C H N - l / 2 1 ' R i
q = q ,At
EOL
(R- l )
(R-2)
(R-3)
(R-4)
(R-5)
(R-6)
(R-7)
(R-8)
(R-9)
(R-10)
* Nomencla ture at end of IDC. ** R, includes RiwrTor ( s t r a p s , shoes , wir ing, e t c . ) .
COMriDCnThM ••MJ*Q-'.205e-E»-.2 ••• • • • • • • : : : : i67" :•
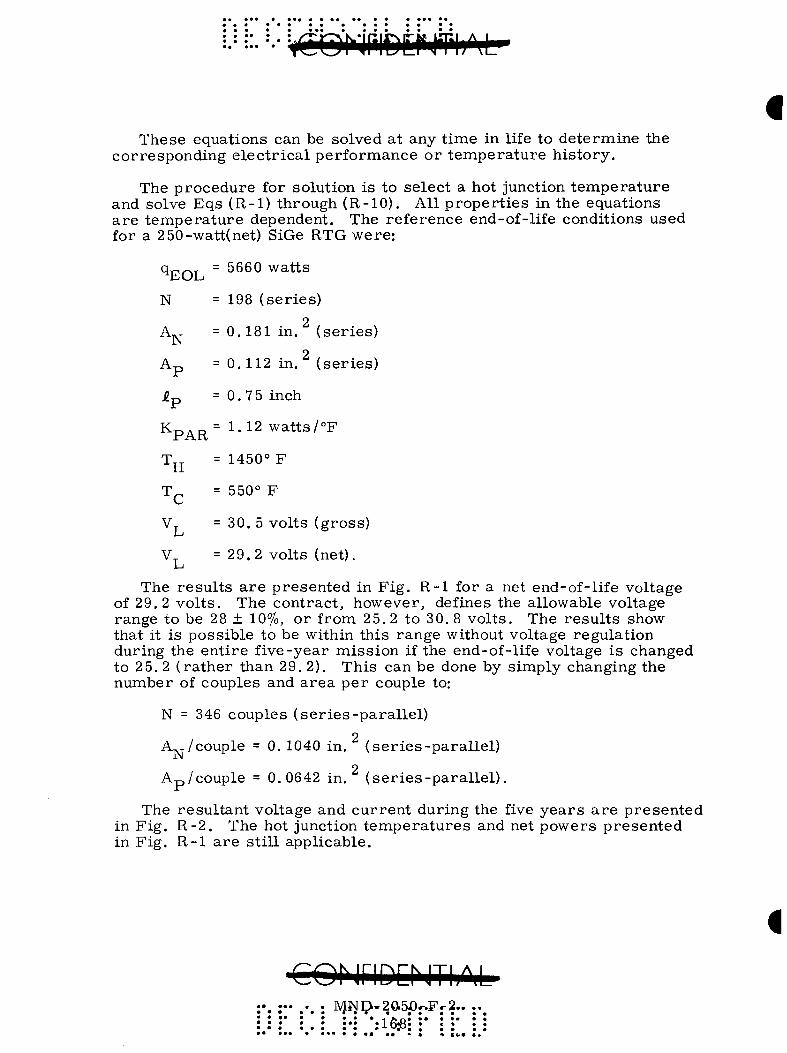
These equations can be solved at any time in life to determine the corresponding electrical performance or temperature history.
The procedure for solution is to select a hot junction temperature and solve Eqs (R-l) through (R-10). All properties in the equations are temperature dependent. The reference end-of-life conditions used for a 250-watt(net) SiGe RTG were:
q = 5660 watts
N = 198 (series) 2
A^ = 0.181 in. (series) 2
Ap =0.112 in. (series)
i p =0 .75 inch
^ P A R " • •• ^ watts/°F
T „ = 1450° F 11
T^ = 550° F
Vj = 30. 5 volts (gross) L-l
V^ = 2 9 . 2 volts (net). L
The results are presented in Fig. R-l for a net end-of-life voltage of 29.2 volts. The contract, however, defines the allowable voltage range to be 28 ± 10%, or from 25.2 to 30. 8 volts. The results show that it is possible to be within this range without voltage regulation during the entire five-year mission if the end-of-life voltage is changed to 2 5. 2 (rather than 29. 2). This can be done by simply changing the number of couples and area per couple to:
N = 346 couples (series-parallel) 2
A-j/couple = 0. 1040 in. (series-parallel) 2
Ap/couple = 0.0642 in. (series-paral lel) .
The resultant voltage and current during the five years are presented in Fig. R-2. The hot junction temperatures and net powers presented in Fig. R-l are still applicable.
COMriDCNThM MND-2O.5J0«Fr2..
•:16«:
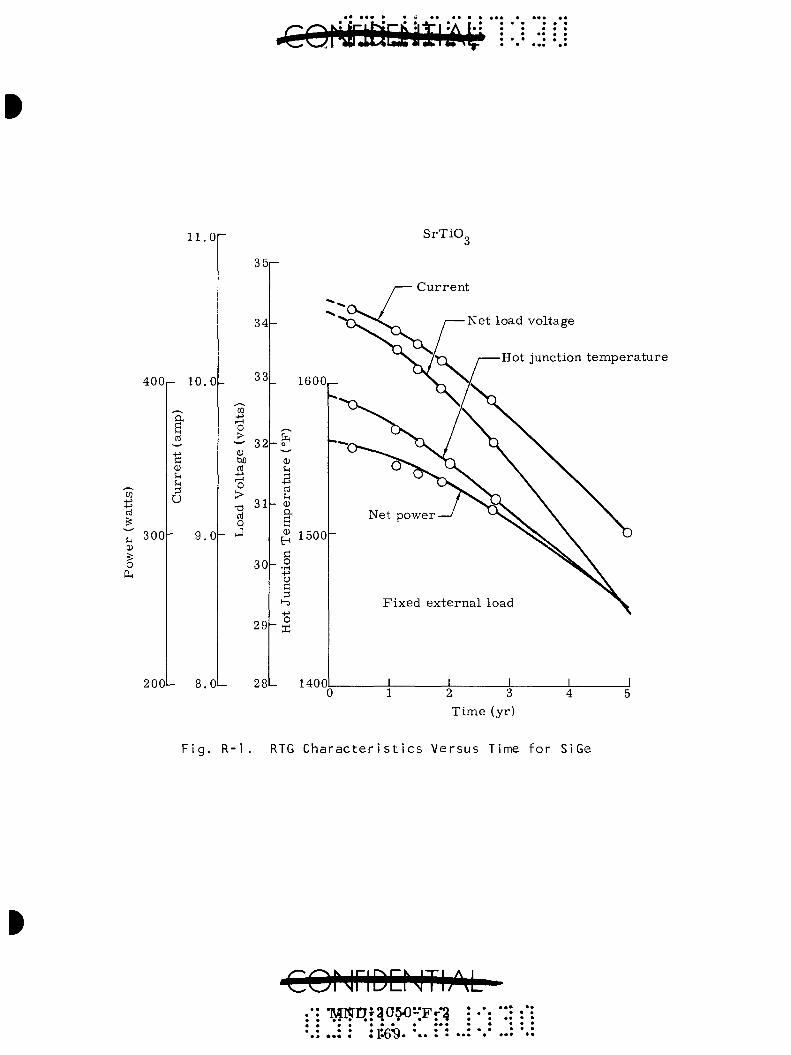
CO
o o
• ••
•«
.a
«3-.g
• 'J
jl •
*^
• • ••
••••
DO
()
^ 7
ID
—I
o o :T
Q)
-1
01
o
n
<.
3 CD
o 1 to
CO
1 o
•t-
Pow
er
(wat
ts)
CO
o o
o o
Cur
rent
(am
p)
tS3
CD
1
GO
O
1
CD
O 1 L
oad
Vol
tage
(vo
lts)
C
O
CA
3
(-'
to
1 1
o o 1 CO
00
1
OJ 1
h-* o 1
CO
en 1
Hot
Jun
ctio
n T
emp
erat
ure
(°F
)
w
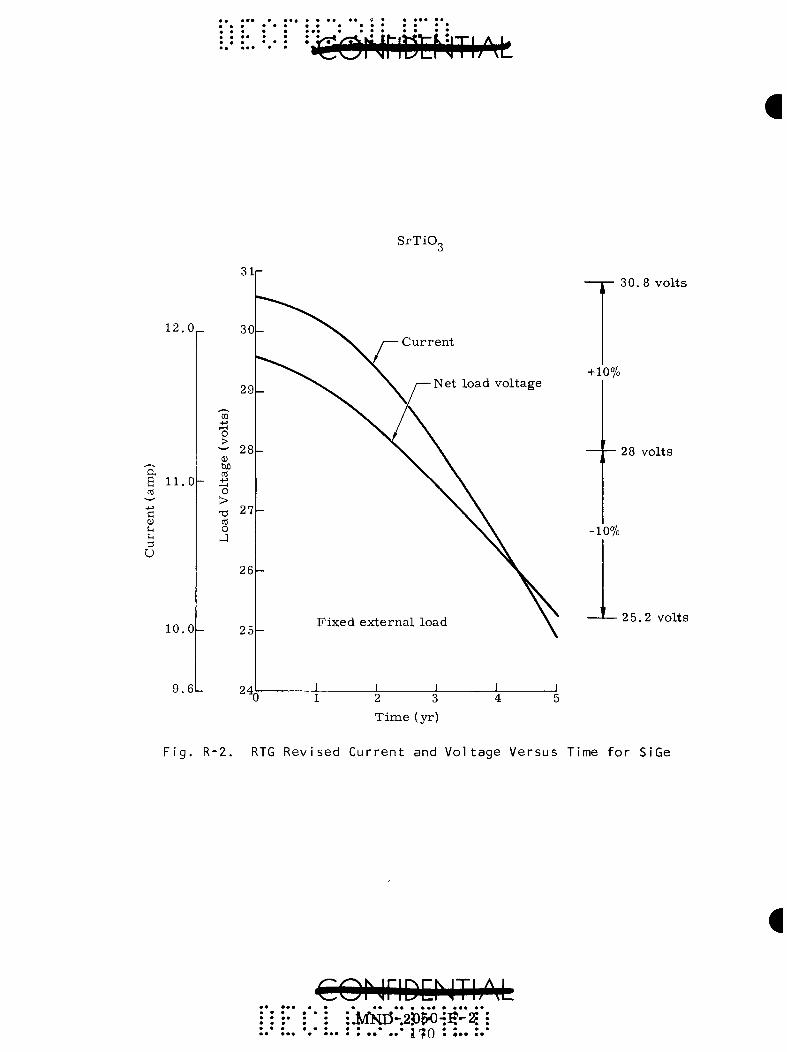
» • • • 9 * • • • • • •
•coNnnr jThMi
SrTiO^
12.0
10.0
9.6
S i r
3 0 -
2 9 -
^ - v
U H
a a
t <u u
U
1 1 . u
o > •'-' <u M ci
— -(-» o > 13 a! 0 J
28
27
26
25
24,
Curren t
Net load voltage
30.8 volts
+ 10%
28 volts
-10%
25.2 volts
F i g . R-2 . RTG R e v i s e d C u r r e n t and V o l t a g e V e r s u s Time f o r SiGe
COhJriDEMTliM .MNl3-.23a50-:S-^: :
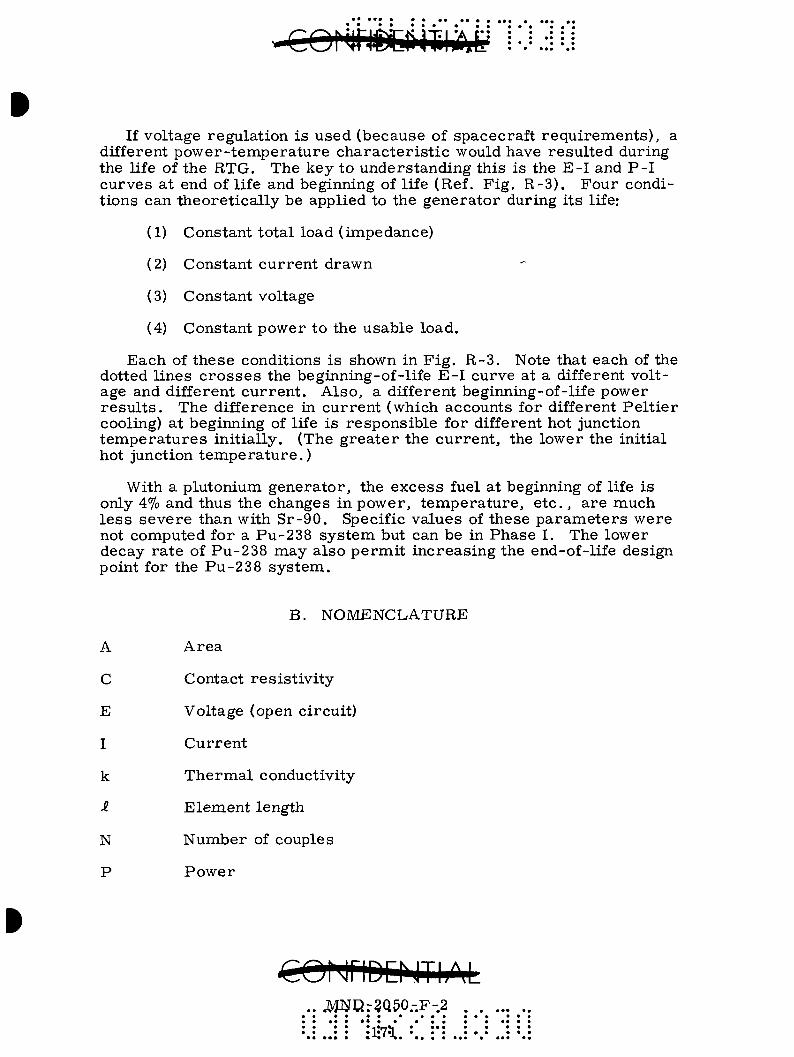
If voltage regulation is used (because of spacecraft requirements), a different power-temperature characteristic would have resulted during the life of the RTG. The key to understanding this is the E-I and P-I curves at end of life and beginning of life (Ref. Fig. R-3). Four conditions can theoretically be applied to the generator during its life:
(1) Constant total load (impedance)
(2) Constant current drawn
(3) Constant voltage
(4) Constant power to the usable load.
Each of these conditions is shown in Fig. R-3. Note that each of the dotted lines crosses the beginning-of-life E-I curve at a different voltage and different current. Also, a different beginning-of-life power results . The difference in current (which accounts for different Peltier cooling) at beginning of life is responsible for different hot junction temperatures initially. (The greater the current, the lower the initial hot junction temperature.)
With a Plutonium generator, the excess fuel at beginning of life is only 4% and thus the changes in power, temperature, e tc . , are much less severe than with Sr-90. Specific values of these parameters were not computed for a Pu-238 system but can be in Phase I. The lower decay rate of Pu-238 may also permit increasing the end-of-life design point for the Pu-238 system.
B. NOMENCLATURE
A
C
E
I
k
i
N
P
Area
Contact resistivity
Voltage (open circuit)
Current
Thermal conductivity
Element length
Number of couples
Power
.. ^l:?]P.73Q50.-.F-.2
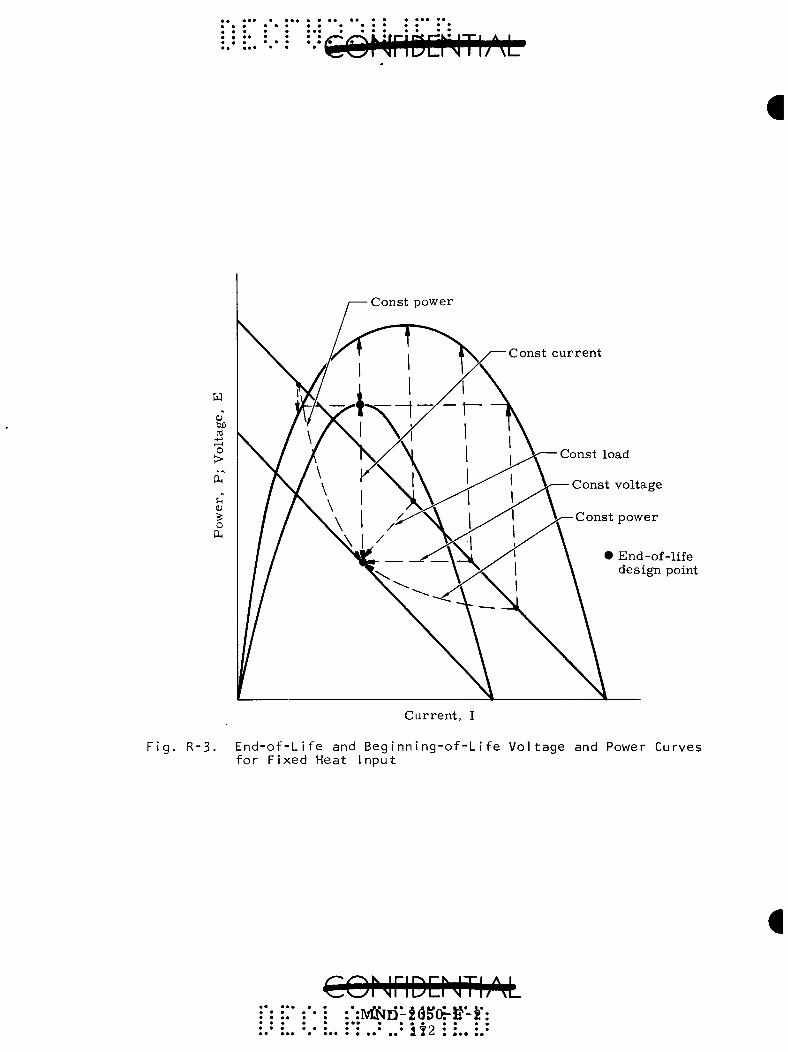
w <u cfl
+-» 1—I
O >
u
o
Const power
Const current
Const load
Const voltage
Const power
• End-of-life design point
F i g . R-3 . End f o r
Current, I
• o f - L i f e and B e g i n n i n g - o f - L i f e V o l t a g e and Power Curves F i x e d Heat I n p u t
CQNriDENTIAL • • • • • • • «
> • • • m. A ^ a • • • 9»
q
R
T
V
a
P
X
Heat rate
Electrical resistance
Temperature
Voltage (load)
Seebeck coefficient
Electrical resistivity
Isotope decay constant
Subscripts
C
C
H
I
i
K
L
i
N
oc
P
t
Contact resistance
Cold junction
Hot junction
(Total) internal (resistance)
(Element) internal (resistance)
Thermal conductance
Refers to load
Element length
Refers to N element
Open circuit
Refers to P element
Time
CONriDCNThM MNDt-2.040-.F-2
i : JlhEf' :' : i

a a
$
a a
• -O
*•
•• •
' __
_
• •!
*0
-
t3d r P
);•
^ a
I a
a
APPENDIX S
SEGMENTED THERMOELECTRIC SUBSYSTEM
The development of couples of higher efficiency than SiGe can be accomplished by the use of ni-V compound alloys in segmented s t ructures. RCA is currently under contract to the Atomic Energy Commission to investigate the III-V compound thermoelectric materials for use in advanced nuclear power systems (Contract AT(30-l)-3500).
This program was started in early 196 5 although basic research at RCA on the III-V compounds had been performed prior to this. Task I, covering the effort between March 1, 1965 and August 31, 1965, is r e ported in Ref. S-1. At the beginning of Task I, the reported status of the program was as follows:
(1) An N-type III-V alloy, InAs-GaAs, was developed with a Z (figure of merit) approximately 30% better than SiGe up to 550° C (1022° F). This temperature is the maximum practical limit of the material .
(2) Exploratory literature and laboratory investigation showed practical bonds to InAs-GaAs could be achieved with low thermal and electrical losses .
At the conclusion of Task I, the reported status of the development was as follows:
(1) A practical demonstration couple with a segmented N leg was developed using N-type InAs-GaAs segmented to N-SiGe.
(2) A SiGe-InAs-GaAs segment joint was developed using a tungsten-gold-molybdenum interface.
(3) The upper temperature limit on InAs-GaAs based on weight loss in sealed tubes and joint stability tests was defined as 500° (932° F) to 550° C (1022° F).
(4) Preliminary data indicated that the resistivity of InAs-GaAs was stable with life.
(5) Work was initiated on a backup segmenting joint using graphite.
(6) An experimental technique was developed that gives a direct comparison between a segmented couple and an all-SiGe couple under the same experimental conditions.
MNpr2<J5e.-F.-2;.-.

i.U:.'--Jcol>iriDa!4ti;M.
Task II, covering the effort between September 1, 1965 to February 28, 1966, is reported in Ref. S-2. At the conclusion of this task, the reported status was as follows:
(1) Segmented couples utilizing N-type InAs-GaAs and P-type SiGe were prepared for test and evaluation. Thermal dif-fusivity measurements (to determ.ine conductivity) confirmed the high figure of meri t of the InAs-GaAs.
(2) Development of the interface segmenting bond continued in order to develop a stable joint with respect to mechanical propert ies.
(3) Advanced technology efforts were initiated. These are aimed at the development of a P-ni -V compound alloy of better per formance than P-type SiGe, the development of an improved N-III-V compound alloy, consideration of other thermoelect r ic materials for segmenting such as tellurides, and the development of couple designs to increase segment interface temperatures.
A. APPLICATION TO 2 50-WATT PROGRAM
To date, RCA has not developed a P-type material that is better than SiGe. On the N leg, InAs-GaAs shows improvement over N-SiGe for use below 550° C (1022° F). Very recently, some thermoelectric property data have shown that N-type GaSb-InSb is even better than InAs-GaAs (Ref. Fig. S-1) although the work on this material is in its infancy.
RCA reports efficiency gains on the order of 14% and higher with the use of InAs-GaAs. However, these high increases are compared to SiGe operating at only 700° C (1292° F) on the hot junction. Furthermore, much of their data is generated at the maximum allowable interface temperature of 550° C. With a Sr-90 system designed for five-year operation where the isotope decays 13% in thermal inventory, the end-of-life allowable interface temperature would only be about 500° C. RCA reports one theoretical efficiency gain curve along with experimental data obtained with comparison modules at temperatures of
T, ^ = 800° C = 1472° F hot T. . = 500° C = 932° F mt T 1 , = 300° C = 572° F. cold
CQNriDENTIAL Ivp}D~^0-5Pr-Fr?.

»
1.2
1.1
1.0
0.9
0.8
' u 0.7 CO
2 0.6
0 .5
0.4
0.3
0.2
0.1
0 300 400 500 600 700 800 900
T e m p e r a t u r e (°K)
F i g . S - 1 . T e m p e r a t u r e Dependence o f F i g u r e o f M e r i t f o r N-Type GaSb- lnSb A l l o y s ( R e f . S-2)
CONriDENTh^L .•;MNI>205Q--F.-2. ; . ' . « • a * • • * a * a • • a a • • • • ' ^ W S . • • • • • • ^ 9 • • ' 1 ^ 7 * * * a a a
~
/
•A ^
1
CIS-23
y' ^ X GIS-22 y ^
x ^ ^^^x-"^"^"—N-type GeSi
1 1 1
y > ^ N-type
y^ InAs-GaAs
\
^ X
1 1

These temperature points are close to the SiGe system design point and thus give a very good estimate of the gain that can be realized from a segmented system. The data are presented in Fig. S-2. From this figure, it appears that an efficiency gain of about 4% is possible with InAs-GaAs.
Reference back to Fig. S-1 leads one to hypothesize that with GaSb-InSb on the N leg, an efficiency gain of about 7 to 8% over SiGe might be possible. At this point, however, it is not clear that the use of the material in a practical couple or device is possible. Further work will have to be done by RCA.
B. CONCLUSIONS
From the RCA work on segmented couples reported in Refs. S-1 and S-2, it appears that with suitable development (several years work), an efficiency gain of 4 to 8% over the present unsegmented couple can be realized by using N-type InAs-GaAs or N-type GaSb-InSb. Improvements beyond this will occur only if new inaproved P-type segments can be found (a development that has not yet come to fruition despite work in the area) or if the segment temperature on the N leg can be increased The gain from an increased segment temperature would probably not be very large.
From, these conclusions, it appears that only a nominal increase will be realized by segmenting in this design. Further breakthroughs are needed to make segmenting attractive for the CRONUS system.
REFERENCES
S-1. "Final Report for Prelinainary Investigation of III-V Compound Directed Toward Segmented Thermoelectric Materials Advanced Nuclear Power Systems," NYO 3500-8, for the period March 1, 196 5 to August 31, 1965.
S-2. "Topical Report for Preliminary Investigation III-V Com.pound Thernaoelectric Materials Directed Toward Segmented Silicon-Germanium ni-V Com.pound Advanced Nuclear Power Systems," NYO 3500-11, for the period September 1, 1965 to February 28, 1966.
i CQMriDD .11104
:•• :•• .-. : .-. MND-:2(y50*'Fi2 • * • • • • • • • • « • • • • • • •
• • • • • • • • • * * 1 ^ P * * * *
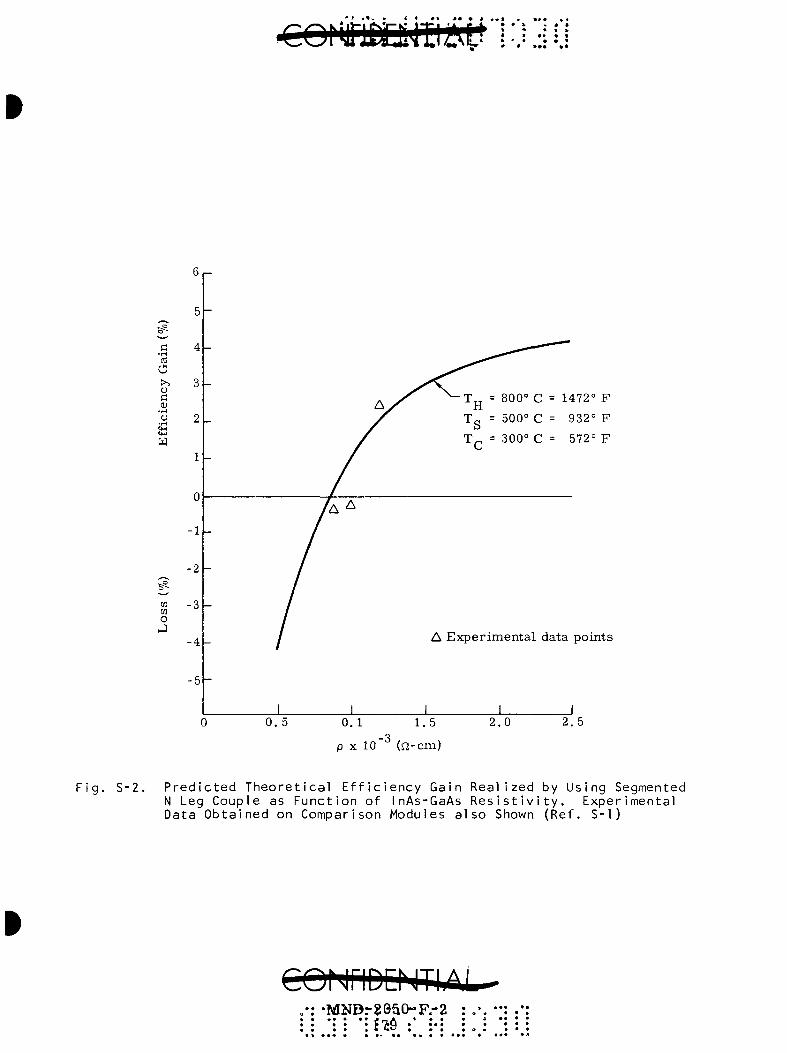
ci O
o c
W
CO to o J
4 -
0
-1
-2
-3 -
- 4 -
-5
• T „ = 800° C = 1472° F
Tg = 500° C = 932° F
300° C = 572° F
A Exper imenta l data points
0. 5 0 . 1 1.5 2.0 2. 5
p X 10 (f2-cm)
Fig. S-2. Predicted Theoretical Efficiency Gain Realized by Using Segmented N Leg Couple as Function of InAs-GaAs Resistivity. Experimental Data Obtained on Comparison Modules also Shown (Ref. S-1)
coririDD iTi/j, •MNDr2e50"F.-2

t3d
* >
^ >
••
• I
I- t>

APPENDIX T
INTERNAL CAPSULE PRESSURE BUILDUP ANALYSIS
A general expression for the liberation of helium, gas from, plutoniuna decay is illustrated in Fig. T -1 . The PV/MT parameter is plotted as a function of time based on a half life of 86.4 years for the plutonium.. Figure T-2 represents a typical capsule open circuit temperature profile as a function of time for the plutonium-fueled 2 50-watt generator system, (see Appendix X for derivation). These tenaperatures were used to reduce the pressure parameter to PV/M as shown in Table T - 1 .
TABLE T-1
Time (.yr)
5
10
15
20
25
P V / M T
2.75
5.50
8.20
10.80
13.30
T e m p e r a t u r e (°R)
2355
2305
2260
2215
2190
PV/M
6,470
12,650
18,500
23,950
29,100
Internal capsule pressures were then calculated parametric ally for various void volum.es as a function of time as shown in Fig. T-3 . The void volunae is defined with respect to the total internal capsule volume, Therefore, the fuel volume is 1 - void volunae. An effective plutonium
3 3 density of 0. 324 lb/in. (9. 7 gna/cm PuOp) was used to establish unit values of M/V as shown in Table T-2. The data displayed in Fig. T-3 are independent of capsule geometry, but not the temperature profile of Fig. T-2. Normal temperature for the 250-watt system is approximately 1800° F .
The power ratio of plutoniuna to strontium fuel is about 5.3 (4.51 3 3
watts/cm vs 0.85 watts/cm ). Therefore a void volume of 80% can theoretically be achieved for plutonium loaded in a capsule originally designed for strontium.. A liner would most likely be used to create a central void with the plutonium fuel filling an outer annulus. Fully packed plutonium fuel yields a void volume around 25%.

• • • • • • • • • ••'••ieDNmEHTf;M •
PV AIT
lOU
10
1 .0
0. 1
-
-
-
-
-
y/
/ l 1 1 1 ..1 II1.
/
/
/
/
1 1 1 1 I I I I I 1 1
^ —
/ ^ 8 6 . 4 y r half life
P - - p r e s s u r e (psi)
V--void volume (in. )
M--weight of Pu (lb)
T - - t e m p e r a t u r e (°R)
1 i 1 1 1 1 il 1 1 1 0.01 1.0 10
Time (yr)
100 1000
Fig. T-1. PIutonium-238 Pressure Buildup as Function of Time
COMnDErJTIAL 'il:"' ;'• \ :A4Kt)':^QE?0*-F>'2 :•. • I •• : . : : • : : ^ ^ 2 " : :* ; :
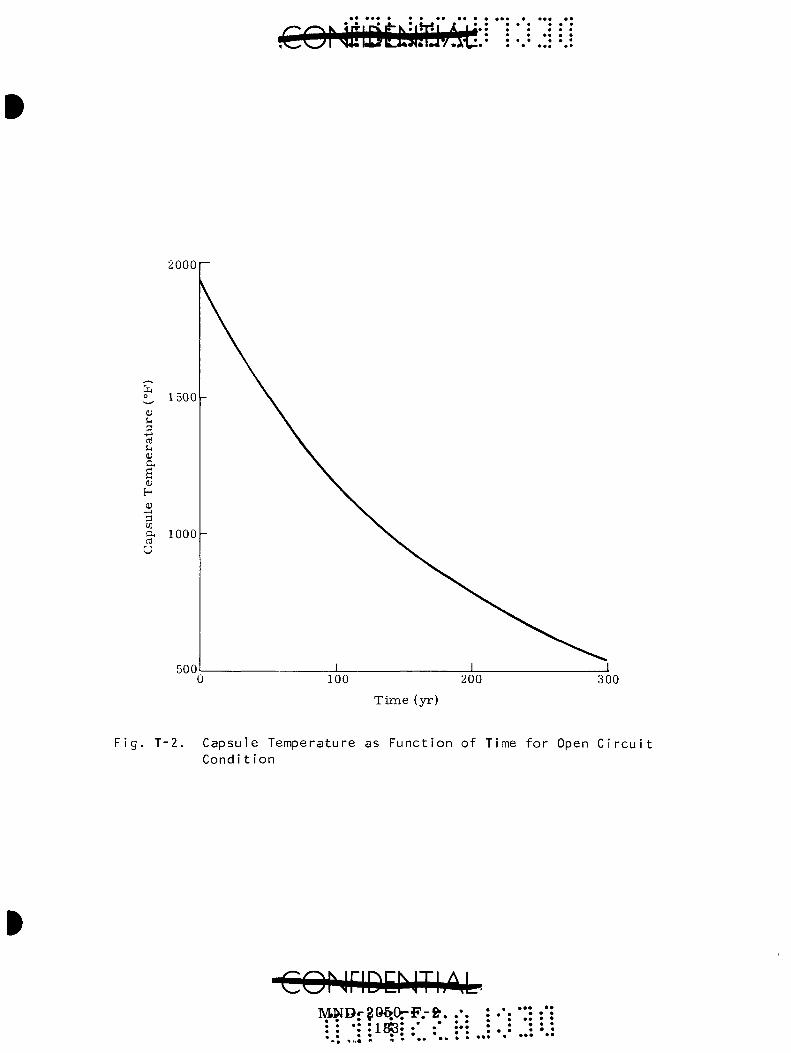
£0} mbMm
2ooor
fe
0)
u oi u
3 a ni
U
1500-
1000-
500 100 200 300
Time (yr)
F i g . T-2 . Capsule Temperature as Funct ion of Time f o r Open C i r c u i t Condi t ion
•coNriDcnThm.. M.NDr?o&.OrF.-&. ••
• • • •
-e@IHH»WAfc
40,000,-
10, 0 0 0 -
m 5,000 a u D CO CO (U %^
d CO
a oi U I—I
ni
£ 1,000 a;
500
100
25,25
F i g . T-3 . I n t e rna l Capsule Pressure as Funct ion o f Void Volume and Time
i: MNDt2Cr5pr:Fy-2 : ..* ..* : J84 :., ;.•

TABLE T-2
Void V o l u m e
( m . )
0 . 2 5
0 . 4 0
0 . 5 0
0 . 6 0
0 . 8 0
P l u t o n i u m
( l b / i n . ^)
0 . 2 4 3
0 . 1 9 4
0 . 1 6 2
0. 130
0 . 0 6 5
M / V
0 .970
0 . 4 8 5
0 . 3 2 4
0 .217
0 . 0 8 1
Although F ig . T-3 shows the in terna l capsule p r e s s u r e , i t does not indicate the in ternal s t r e s s which is a function of the capsule dinaen-s ions . The s t r e s s at the inside d iameter of a capsule is given by CT = PD, where a is the s t r e s s , P is the in ternal p r e s s u r e (Fig. T-3) and D is the dimension factor which is plotted in F ig . T-4 for radi i of from one to three inches , and capsule th ickness from 0. 1 to 0. 5 inch. Given a capsule s ize (r ight c i r cu l a r cyl inders only) F i g s . T-3 and T-4 can be used to es tab l i sh the in ternal s t r e s s for any des i red void volume at any per iod of t ime from 1 to 25 y e a r s .
F o r the 250-watt genera to r , the following calculation can be made to predic t the cha r ac t e r i s t i c s of a capsule designed to contain the p r e s sure for five y e a r s . Consider a 1. 5-inch ID cylinder (length is i m m a ter ia l ) with a 0. 2-inch wal l th ickness . Th is yields a dimension factor (D) of 4 . 6 . The in te rna l p r e s s u r e , P , at five y e a r s for an 80% void is about 500 p s i . There fore , the s t r e s s is Z300 ps i .
Rupture data for Haynes-25 b a r is p resen ted in F ig . T - 5 . F o r a s t r e s s of 2300 ps i and an average capsule open c i rcui t operating tenape ra tu re of 1800° F , the t ime for capsule rupture is in excess of five y e a r s .
F o r accuracy , a L a r s o n - M i l l e r constant is needed to identify the r e a l rupture t ime and th i s can be done in Phase I.
These p r e l im ina ry calculat ions show that a capsule can be designed to contain hel ium p r e s s u r e for a f ive-year per iod while the generator is in orbi t . However, it i s s t i l l reconamended that use of a porous plug for hel ium venting be pursued in the design of the PuO^ capsule
because of the weight savings incur red . (SNAP 19 personnel a r e cu r rent ly investigating these plugs for application in that genera tor . )
CQI..XiD:HTI;\L • .MNJ3-5p^0*-.P-2.-
• ^ K*— • • • • :l5S: : : "
i-n:.vi5bNritiD!fliM .
30r -3.0
CM _
<>J CM
2 0 -
Q
u o + j o CT)
c o •rH cn c 0)
s 10
0. 1
1.0
0. 5
Fig. T-4. Dimension Factor D as Function of Inside Radius and Encapsulation Thickness
•: • '^fic : :•

(0 C
O
LA
C
M
0)
O
H-<U
C
(D
Q.
• * •
•in r
^
l-l-J .4
....
.;g...
Ac
j •• •
$
(Tsd 0
00
1) ssaa^
s I^TW
^I aS
BjaA
y

Also by the Larson-Miller approach, without a porous plug, the effect of the capsule being spiked to open circuit conditions prior to descent (and higher during descent) wD.1 have to be exanained in Phase I. It naay not be practical to design for pressure containm.ent under these conditions. One possible alternative other than the porous plug is to incorporate a shorting device on the T/E module that does not allow open circuit conditions to occur at time of separation. This shorting plug would also reduce capsule temperatures during reentry.
COf jriDD JTI>\L •:MN0'-??)5a-:r-?:
188 • • • • • • • •• • •

APPENDIX U
CASCADED THERMOELECTRIC SYSTEM
The 2 50-watt r e fe rence concept employs SiGe thermoelec t r i cs operat ing between 1450° and 550° P at the end of life with the following approximate p a r a m e t e r s :
T / E
•n t h e r m a l
= 5.43%
89%
^2 T R
'^regulator
N
V
net power to regula tor g ross power
99. 5%
4 .4%
396 couples ( se r ies paral le l )
30. 5 volts (gross)
28 volts (net).
The purpose of this study was to de te rmine the a t t rac t iveness of a cascaded sys t em uti l izing a SiGe topper re ject ing heat to a PbTe (2N-3P) package. Fo r this study, the cold junction tenaperature for the PbTe module was se lec ted as 500° F . As with the SiGe noncascaded sys t em (where the cold junction was 550° P) , this cold junction t empera tu re is not neces sa r i l y opt imum. F u r t h e r m o r e , as shown in the analys is , these two cold junction t e m p e r a t u r e s permi t d i rect substitution of the cascaded for the noncascaded sys t em with l i t t le change in the r ad ia to r . This naay be an advantage once the re fe rence configuration is fully tested and proven although the 500° F cold junction may not be optimum for weight. (As with the SiGe module, cold junction optimizat ion on the sys tem will have to be done in Phase I.)
The incentive for considering a cascaded SiGe-PbTe sys t em is best understood by re fe rence to f igure-of -mer i t curves for SiGe and PbTe where
2 „ . „ r"t = (Seebeck coefficient)
^ (e lect r ical res i s t iv i ty) ( thermal conductivity)
These a r e presented in F igs . U-1 and U-2 as a function of t empera tu re for the N- and P- type m a t e r i a l s , respec t ive ly . Indirectly, the figure
• * » ^ -i « 4
• » f • « *• *- *
( )
§•§: rr I '
. '• Ni
fe
o I—I
1.0
0.8
0.6
0 .4
0.2
PbTe (2N)
I 200 400 600 800 1000 1200
T emper a tu r e (°F)
SiGe
A. 1400
_L 1600
J 1800
F i g . U - 1 . F i g u r e o f M e r i t f o r N M a t e r i a l s

0 . 8 ^
PbTe (3P)
CD a i ^ ^ • 1 • t
0 . 6 .
fe
0 .4 -
X!
0 .2 - It
_L -L _L I J_ J 200 400 600 800 1000
T e m p e r a t u r e (°F) 1200 1400 1600 1800
F i g . U-2. F igure o f Me r i t f o r P M a t e r i a l s

of mer i t can be re la ted to efficiency and thus an inc rease in efficiency is expected for a cascaded sys t em.
A. ANALYSIS
1. Cascaded Per fo rmance
With the Martin digital code for the rmoe lec t r i c (T/E) computat ions, T / E p a r a m e t e r s were determined for SiGe for hot junction t e m p e r a t u r e s of 1300°, 1400° and 1500° F, cold junction t e m p e r a t u r e s of 900°, 1000°
2 and 1100° F, a RCA reconamended contact r es i s t iv i ty of 1800 |Ltn-cm , an element length of 0. 75 inch and a gross voltage of 30. 5 vol t s . The r e su l t s a r e presented in F igs . U-3 , U-4 and U-5 . Similar ly , r e su l t s a r e presented for 2N and 3P type PbTe (Martin designation TEDN-0034/TEDP-0059) in F igs . U-6 , U-7 and U-8 for hot junction t e m p e r a t u r e s of 900°, 1000° and 1100° F, cold junction t e m p e r a t u r e s of 300°, 400° and 500° F, an exper imenta l ly extrapolated contact r e s i s t iv i ty of
2 3000 )Lin-cm , an element length of 0. 50 inch and a g r o s s voltage of 30. 5 vo l t s .
For the cascaded sys t em, it is assumed, by appropr ia te design, that a t empera tu re drop of 100° F can be held between the SiGe cold junction and the PbTe hot junction at end of life (the design point).
In Table U-1 the SiGe efficiencies (from Fig. U-3) for cold junction t e m p e r a t u r e s of 1000°, 1050° and 1100° F a re given. Also shown for l a t e r compar ison a re the noncascaded efficiencies for cold junctions of 3 50° to 600° F. In al l c a s e s , a hot junction t e m p e r a t u r e of 1450° F is used .
TABLE U-1
SiGe T / E Efficiency at End of Life for Hot Junction Tempera tu re of 1450° F
Cold J u n c t i o n T e m p e r a t u r e
(°P)
3 50 400 500 550 600
1000 1050 1100
f T / E (%)
6 . 4 4 6 . 1 8 5 .68 5 .43 5 .17 2 . 8 8 2 . 5 9 2 . 2 9
CQMriDQJThM : : :• : [ :MNp-'2(5'5(i-JF-^|- : :

TEDN-00-23 /TEDP-00-24
4 . 0 f -
3 . 5 -
3.0
a a
o
w o L.
+-> O
I—I 0) o
a u
Si
2 . 5
2.0
1.5
1.0
0 . 5
oL
C „ = 1800 ):iQ-cm
J_ 900 1000
Cold Junction T e m p e r a t u r e (°F)
Tj^(°F)
1500
1400
1300
1100
F i g . U-3. Thermoe lec t r i c E f f i c i e n c y Versus Cold Junc t ion Temperature
GO^j^lD[:hjTlAU" l^DH2305e-l?-:S:
: : :icfr> : : • :
o .400 r -
0.300
(U
< T—I
ni c o
• T H
+.» o tu I m w o L( U + j c a> fi (D ^^ H
0 . 2 0 0 -
0.100
P =122 watts (gross) L = 3/4 in.
C^ = 1800 nn-cm^
Cold Junct ion T e m p e r a t u r e (°F)
1100
1000
1100 900
•N e lement • P element
J_ 1300 1400
Hot Junction T e m p e r a t u r e (°F)
1500
F i g . U-k. S i n g l e E l e m e n t A r e a f o r S i G e S e r i e s - C o n n e c t e d
CQfJriDDJThM 3vfi^D-aoE5l)-4't2 • • • • •,*r\*A • • • • • • • • ^«>C)i4- * * * *
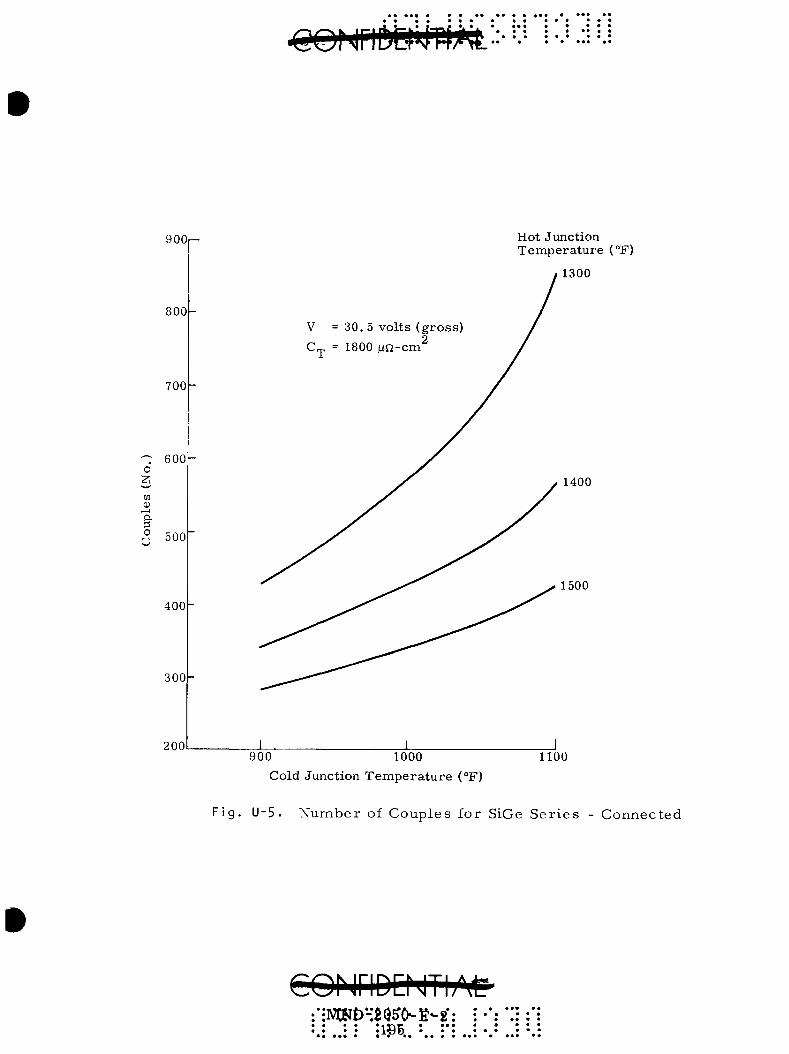
900
800
700
'^ o Z, m cu 0, 3 O U
600
500
400
300
200 ± 900 1000
Cold Junction T e m p e r a t u r e (°F)
Hot Junction Tempera tu re (°F)
1300
1400
1500
1100
F i g . U - 5 . N u m b e r of C o u p l e s f o r S i G e S e r i e s - C o n n e c t e d
corjriDENTiAt: : : :i5B : "

• • • • • • • « «
• • • • '-"CgNriBO JThM
7.0 C „ = 3000 (jn-cm
Hot Junction T e m p e r a t u r e (°F)
1100
1000
900
"300 400 500 Cold Junction T e m p e r a t u r e (°F)
F i g . U-6. Thermoe lec t r i c E f f i c i e n c y Versus Cold Junc t i on Temperature f o r PbTe, 2N and 3P
*MNb42&Si5-iF!r2 •• • • • • • • : ..* ..• I9t6 : :..

'CoiweMMj:' i-'M 1
F i g . U-7,
a 0) u < . - I
o •rH o 4)
CO I
m CD
O
U c 0)
fi 0)
r-4
w
0.200
0.100
N element P element
300 400 _ l 500
Cold Junction Temperature (°F)
Single E l e m e n t A r e a for P b T e , 2N and 3P S e r i e s - C o n n e c t e d
iS4Krfcc-'20gb-ji:-2
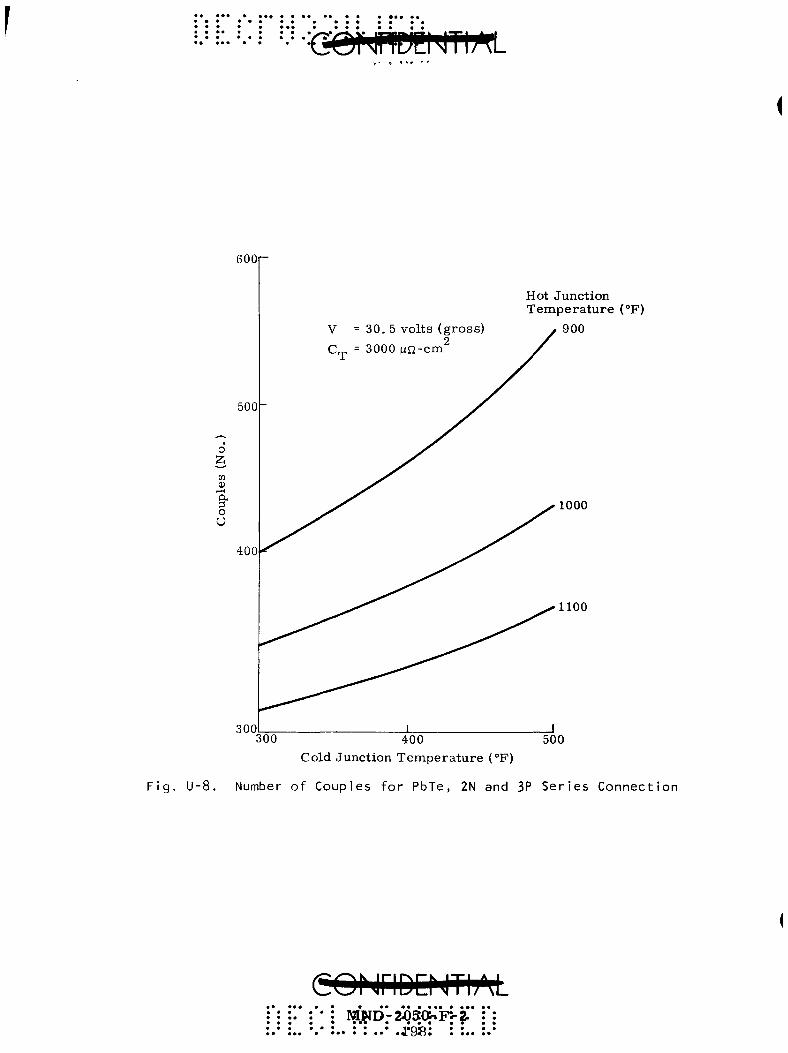
600
500
o Z M ll>
a 3 o O
400
300
V = 30. 5 volts (gross)
C „ = 3000 wn-cm
Hot Junction T e m p e r a t u r e (°F)
900
1000
1100
_L 300 400
Cold Junct ion T emper a tu r e (°F) 500
Fig. U-8. Number of Couples for PbTe, 2N and 3P Series Connection
(LONriDENIbM MND-2O50XF---2. • • • • • • • • •
• • • • • • J. y<5 • • • • •
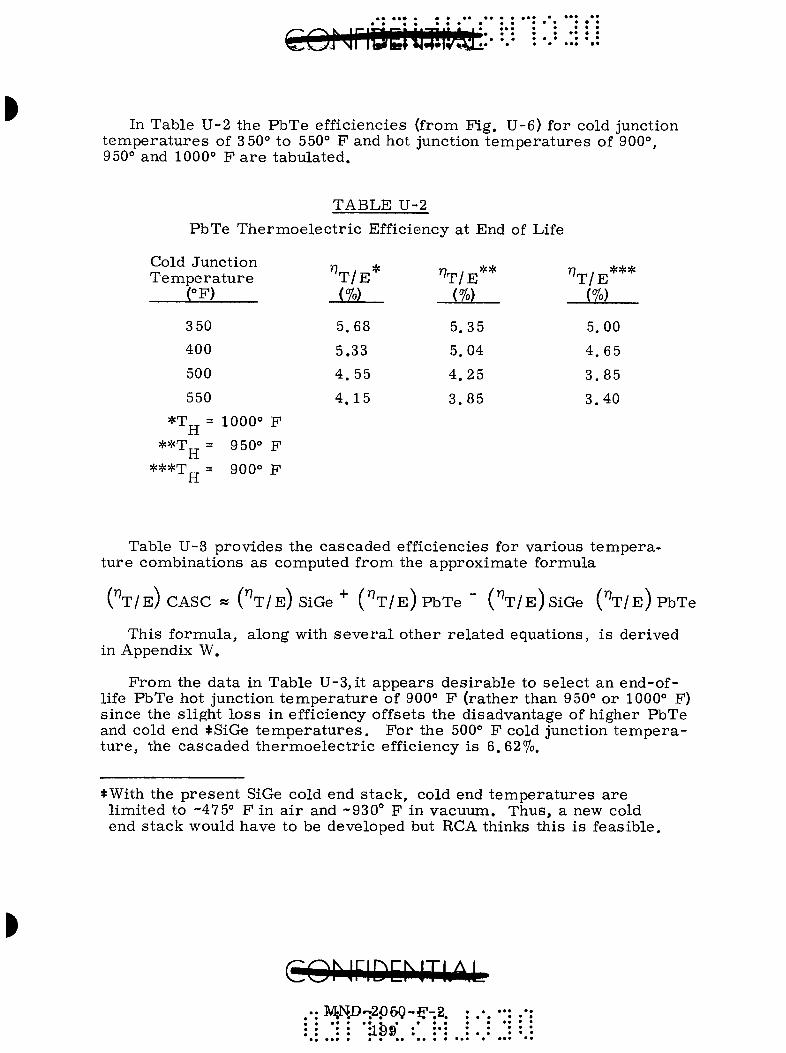
In Table U-2 the PbTe efficiencies (from Fig. U-6) for cold junction temperatures of 3 50° to 550° F and hot junction temperatures of 900°, 950° and 1000° F are tabulated.
P b T e T h e
Cold J u n c t i o n T e m p e r a t u r e
(°F)
3 50
400
500
550
* T j j = 1000°
* * T j j = 950°
* * * T „ = 900° H
T A B L E U-2
r m o e l e c t r i c E f f i c i ency at End of Life
F
F
F
^ T / E *
(%)
5 .68
5.33
4 . 5 5
4 . 1 5
^ T / E * * (%)
5 .35
5 .04
4 . 2 5
3 . 8 5
' ^ T / E * * * (%)
5 .00
4 . 6 5
3 . 8 5
3 . 4 0
Table U-3 provides the cascaded efficiencies for various temperature combinations as computed from the approximate formula
( ' ^ T / E ) C A S C K ( ^ T / E ) SiGe " ( '^T/E)pbTe " C^T/E)siGe ('^T/E)pbTe
This formula, along with several other related equations, is derived in Appendix W.
From the data in Table U-3, it appears desirable to select an end-of-life PbTe hot junction temperature of 900° F (rather than 950° or 1000° F) since the slight loss in efficiency offsets the disadvantage of higher PbTe and cold end +SiGe temperatures. For the 500° F cold junction temperature, the cascaded thermoelectric efficiency is 6.62%.
*With the present SiGe cold end stack, cold end temperatures are limited to -475° F in air and ~930° F in vacuum. Thus, a new cold end stack would have to be developed but RCA thinks this is feasible.
: : :1S9 : :•:
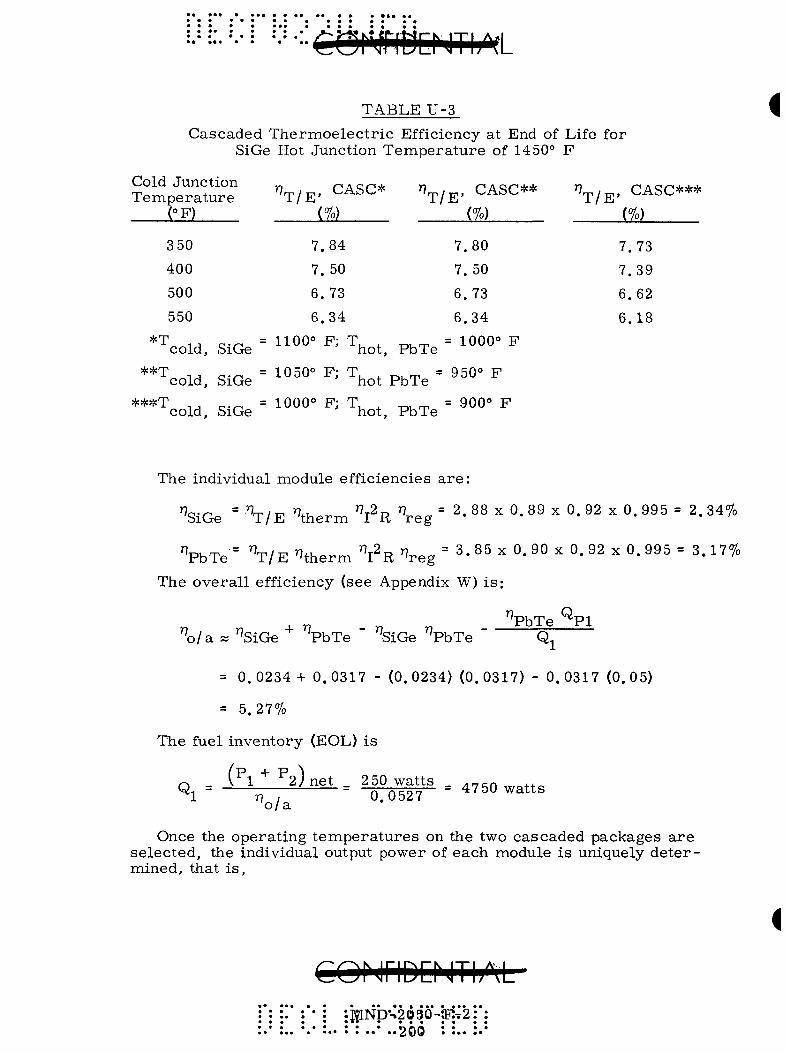
T A B L E U - 3
C a s c a d e d T h e r m o e l e c t r i c Eff ic iency at End of Life for SiGe Hot J u n c t i o n T e m p e r a t u r e of 1450° F
T e m p e r a t u r e (°F)
3 50
400
500
550
co ld . S i ( ^ '
ri^j^, CASC* n^j^, CASC**
(%) (%)
7 .84 7 .80
7. 50 7. 50
6 . 7 3 6 .73
6 , 3 4 6 . 3 4
= 1100° F ; T^^^^ p ^ ^ ^ = 1000° F
\ / E ,, CASC***
' (%)
7 . 7 3
7 . 3 9
6 .62
6 . 1 8
**T T , „ . „ = 1050° F; T, . „ , ^ = 950° F co ld , SiGe hot P b T e
***T T , „-r- = 1000° ^' T, , -•, ^ = 900° F co ld , SiGe ho t , P b T e
The ind iv idua l m o d u l e e f f i c i enc i e s a r e :
^SiGe - \ I E % e r m V R \eg= ^'^^ ^ 0. 89 x 0 . 9 2 x 0 . 9 9 5 = 2 . 3 4 %
'^PbTe= \ / E ^ t h e r m V R ' ^ r e g = 3 - « ^ - 0 - 9 ° ^ ° - ^ 2 x 0 . 9 9 5 = 3 . 1 7 %
T h e o v e r a l l e f f i c iency ( see Appendix W) i s :
'^PbTe ^ P l ^ola « '^SiGe "*" ^ P b T e " ^SiGe '^PbTe " Q^
= 0.0234-t- 0 . 0 3 1 7 - (0 .0234) (0 .0317 ) - 0 . 0 3 1 7 (0 .05)
= 5 . 2 7 %
T h e fuel i n v e n t o r y (EOL) i s
/ p 4- p \ r\ - \ 1 2 / n e t 2 50 w a t t s _ ^nc^n ^.^.^ S ^ — - ^ = 0 .0527 - ^ ^ ^ ° ^ ^ " ^
o / a Once the o p e r a t i n g t e m p e r a t u r e s on the two c a s c a d e d p a c k a g e s a r e
s e l e c t e d , the i nd iv idua l output p o w e r of e a c h m o d u l e i s un ique ly d e t e r m i n e d , t ha t i s .
CONriDENTIAL
* • « M N D % 2 0 3 0 - ? R T 2 •• • • • • • • * •« •• 200 • •••

^1 ^ ^ 1 ^SiGe " ^"^^^ (0.0234) = 111 watts (net)
P„ = P^ ^ - Pi = 250 - 111 = 139 watts (net) ^ tot 1
On a g ross b a s i s , the SiGe module will produce p
P , (gross) = % ~ V — = (0 .92H0 .995) = ^22 watts (gross) 1 j ^ j ^ r e g
while the PbTe module will produce
^2 ^2 ^g^oss) = Jf—fj
2. Modules Connected in Pa ra l l e l
139 (0.92) (0.995)= ^^2 watts (gross)
Figures U-4 and U-5 show that for the SiGe module (1450° F hot junction, 1000° F cold junction) to produce 30. 5 volts (gross) and 122 watts (gross) , the following couples and couple s izes a re needed:
Ser ies Ser ies para l le l
Number of couples 2
Area p e r couple (in. )
N e lement
P e lement
380
0.1630
0.1050
760
0.0815
0.0525
F igures U-7 and U-8 show that for the PbTe module (900° F hot junction, 500° F cold junction) to produce 30.5 volts (gross) and 152 watts (gross) , the following couples and couple s i zes a r e needed:
Number of couples 2
Area per couple (in. )
N element
P element
Se r i e s
547
0.2115
0.2125
Ser ies para l le l
1094
0.1058
0.1062
cor iriDD ITIAL ••• • ••• • •• •• • MNnf20SO^F^2
: : : : ^h-i : : • :

• • • • • • • € •• « « p v * * v I* V P f\_^ I I N I 1 / VL_
3, Modules Connected in Series
Consider the modules connected to one another in series (but each internally wired in ser ies parallel). Design to 10 amperes for each module. Then,
and
^SiGe,
^PbTe,
(^SiGe
On a gross
net
net ~
^SiGe. I
P SiGe.
I
•*" ^ P b T e ) net
. basis.
net _
net _
= 11.
I l l watts _ 10 amperes
139 watts _ 10 amperes
11 .
13.
1 + 13.9 = 25 volts
1 volts
9 volts
V = SiGe, gross ^ 122 watts = lo 2 voU^ ^ SiGe, gross I 10 amperes i^. avoirs
p V PbTe. gross _ 152 watts i c o n + VbTe , gross " I " 10 amperes " ^^-^ ^°^^^
and
V SiGe " ^PbTe) = 12. 2 + 15. 2 = 27. 4 volts ^ ' gross
The number of couples and element sizes may be determined by a direct ratioing of the values previously presented for the modules in parallel. Then for SiGte (series parallel)
Ng.Q = 3 0 4 couples
N/couple = 0. 2040 in. ^
P/couple = 0.1310 in.
while for PbTe (series parallel)
^PbTe ~ ^^^ couples
N/couple = 0.2120 in. ^
P/couple = 0.213 5 in. ^
• • • f^»\Jc» • • • • •
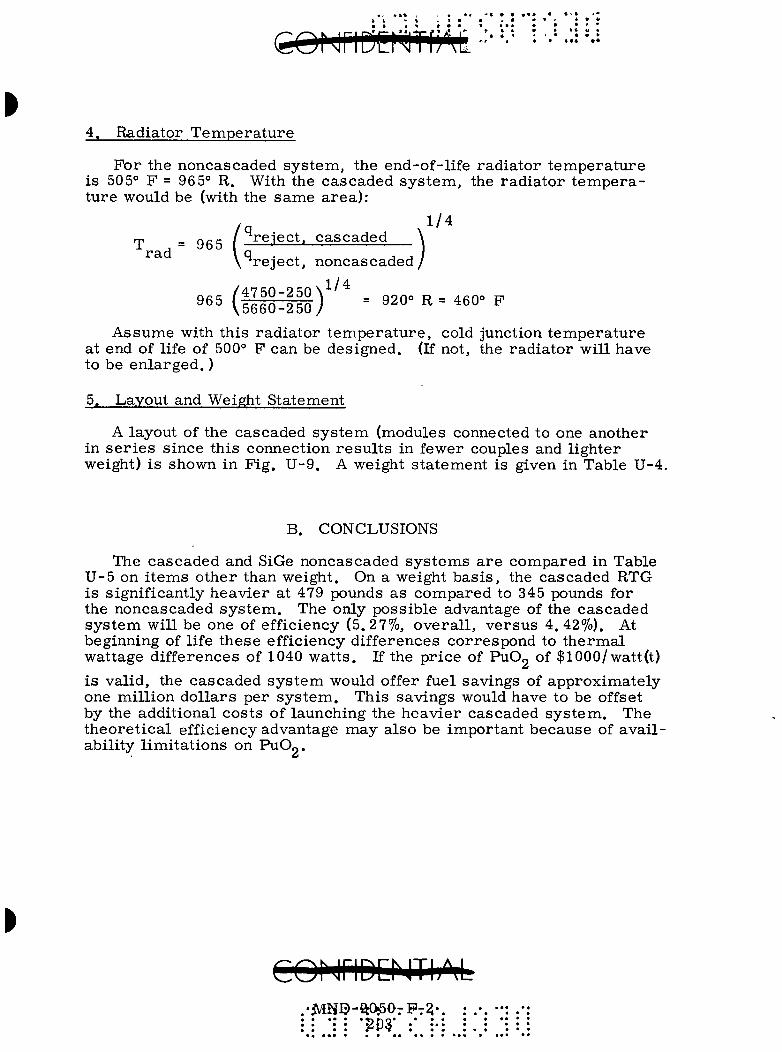
4. Radiator Temperature
For the noncascaded system, the end-of-life radiator temperature is 505° F = 96 5° R. With the cascaded system, the radiator temperature would be (with the same area):
/ q ^ /^ rp _ Q«r / r e j e c t , cascaded \
V^reject, noncascaded/
9 6 5 ( i i 5 | i ) ' ' = 9 2 0 ° R = 4 6 0 ° F
Assume with this radiator temperature, cold junction temperature at end of life of 500° F can be designed, (if not, the radiator will have to be enlarged.)
5. Layout and Weight Statement
A layout of the cascaded system (modules connected to one another in ser ies since this connection results in fewer couples and lighter weight) is shown in Fig. U-9. A weight statement is given in Table U-4.
B. CONCLUSIONS
The cascaded and SiGe noncascaded systems are compared in Table U-5 on items other than weight. On a weight basis, the cascaded RTG is significantly heavier at 479 pounds as compared to 345 pounds for the noncascaded system. The only possible advantage of the cascaded system will be one of efficiency (5.27%, overall, versus 4.42%). At beginning of life these efficiency differences correspond to thermal wattage differences of 1040 watts. If the price of PuOg of $1000/watt(t) is valid, the cascaded system would offer fuel savings of approximately one million dollars per system. This savings would have to be offset by the additional costs of launching the heavier cascaded system. The theoretical efficiency advantage may also be important because of availability limitations on PuOg.
C0NriDErm;M .•MN13-5t0550rPT^'. : .• : : : : '/V-i : :-: : .

PbTe module
SiGe module
Fig. U-9- Cascaded System Layout (Modules Wired Together in Series,
coMnnrMTi/M ^ « • • • • ••• ••
•3VIliD-Tgq50rF-3 : 204

.€orjr!t)DJ:Tiii.oi
TABLE U-_4
Cascaded Module Wei
Ge module
Hot shoes The rmoe lec t r i c e lements Cold shoes Flexi-Mod cold end h a r d
ware T h e r m a l insulation
)Te module and can i s t e r
Hot plate Hot shoes The rmoe lec t r i c e lements Cold end ha rdware
(lumped with t r ans fe r plate)
The rma l insulation Support membrane T rans fe r plate
ght
Weight per Cascaded Module
(lb)
0.76 1.35 1.11
1.60 0.79
3.70 0.92 4 .38
0.30 0.32 5.51
5.
15.
61
13
Weight per Eight Cascaded Modules
(lb)
6.1 10.8
8.9
12.8 6.3
29.6 7.4
35.0
2.4 2.6
44 .1
4 4 . 9 *
121.1
Total cascaded s y s t e m
Total se lec ted sy s t em (non-cascaded, SiGe based on using 33 12-couple modules) .
Net savings with se lec ted sys t em (lb)
20.74 166.0
(-) 32.0
134.0
*Note that the SiGe port ion of the cascaded sys tem weighs more than the en t i re se lected s y s t e m using SiGe only, even though it supplies l e s s than half the power output. This may be explained by the l a rge r e lements in the cascaded SiGe module s ince they operate over a much sma l l e r AT,
co r jriE)ENTI>A4^
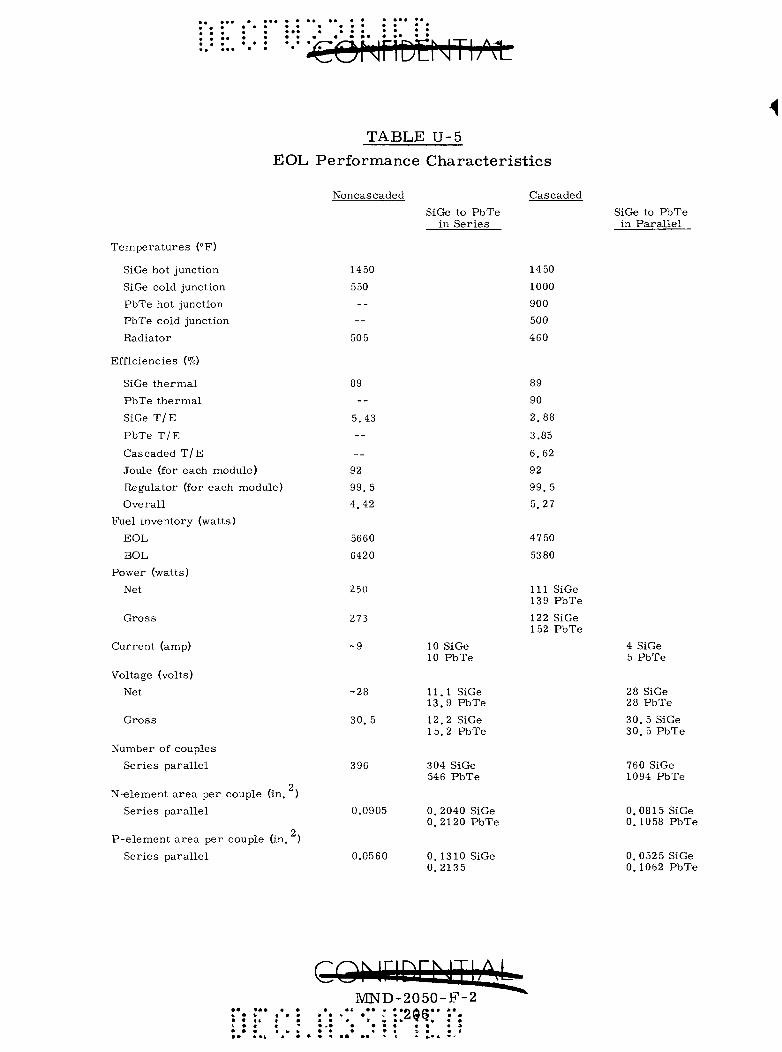
TABLE U-5
EOL Performance Characteristics
T e m p e r a t u r e s (°F)
SiGe hot junc t ion
SiGe cold junct ion
P b T e hot junct ion
P b T e cold junct ion
Rad ia to r
Ef f ic ienc ies (%)
SiGe t h e r m a l
P b T e t h e r m a l
SiGe T / E
PbTe T / E
Cascaded T / E
Joule (for each module)
Regula to r (for each
O ve r a i l
Fuel i nven to ry (wat ts)
E O L
BOL
Power (watts)
Net
G r o s s
C u r r e n t (amp)
Voltage (volts)
Net
G r o s s
Number of coup les
S e r i e s p a r a l l e l
module )
N-e lemen t a r e a p e r couple (in. )
S e r i e s p a r a l l e l
P - e l e m e n t a r e a p e r couple (in. )
S e r i e s p a r a l l e l
Noncascaded
1450
550
----
50 5
89
--5.43
----
92
99. 5
4 .42
5660
6420
250
273
- 9
- 2 8
30. 5
396
0.0905
0.0560
SiGe to P b T e in S e r i e s
10 10
11 13
12 15
SiGe P b T e
. 1 SiGe
. 9 P b T e
. 2 SiGe
. 2 P b T e
304 SiGe 546 P b T e
0. 0.
0. 0.
2040 SiGe 2120 P b T e
1310 SiGe 2135
C a s c a d e d
1450
1000
900
500
460
89
90
2 .88
3.85
6 .62
92
9 9 . 5
5.27
4750
5380
111 SiGe 139 P b T e
122 SiGe 152 P b T e
SiGe to P b T e in P a r a l l e l
4 SiGe 5 P b T e
28 SiGe 28 PbTe
30. 5 SiGe 3 0 . 5 P b T e
760 SiGe 1094 P b T e
0 .0815 SiGe 0 .1058 P b T e
0 .0525 SiGe 0 .1062 P b T e
MND-2050-F-2

eoNFiDtmi^;^-
APPENDIX V
POWER CONDITIONING FOR PEAK LOADS
Energy s torage is n e c e s s a r y when the power demanded by a space craft load exceeds the capability of the onboard genera tor . Since s torage devices general ly a re charged at potenials higher than their discharge potential, the voltage during peak load periods will be lower than during minimum load per iods . The depth of voltage suppress ion when peak loads a r e applied is dependent on the type of s torage device, the sever i ty of the d ischarge ra te re la t ive to its capacity, its s tate of charge, how it is connected to the sys tem, and whether supplementary power conditioning equipment is employed. Thus, given performance requ i rements may be met or exceeded by various sys tem configurations, each having its own advantageous fea tures . A s e r i e s of configurations will be developed in the succeeding paragraphs , performance cha rac te r i s t i c s and weight will be enumera ted and the re la t ive probabili ty of miss ion success of each will be indicated. The components of the configuration selected will be descr ibed .
A. REQUIREMENTS
General
Energy s torage and power conditioning equipment shall be considered as a sepa ra t e supplemental subsys tem to the RTG/CIR sys tem. An e s t i mate of the weight of such a subsys tem shal l be provided.
2. E lec t r i ca l
The energy s torage and power conditioning (ES/PC) subsys tem shall provide an output voltage of 28 volts dc ± 10% when subjected to the Nimbus B load profile for a period of five yea r s (24, 500 orbi t s ) . The load profile for each 107-minute orbi t , shown in Fig. V-1 , includes the following highlights:
Average load 23 5 watts
Minimum load 213 watts
Maximum load 390 watts , 30 seconds
Followed by 290 watts , 5 seconds
Secondary peak load 337 watts , 3 seconds
Although the impedance cha rac t e r i s t i c s of the Nimbus B loads a re not known, it has been conservat ively assumed that they a r e constant wattage loads . Since the minimum output from the RTG is 250 watts (at EOL) and the average load requ i rement is 23 5 wat ts , at least 15 watts average a re available for inefficiencies in ba t tery charging.
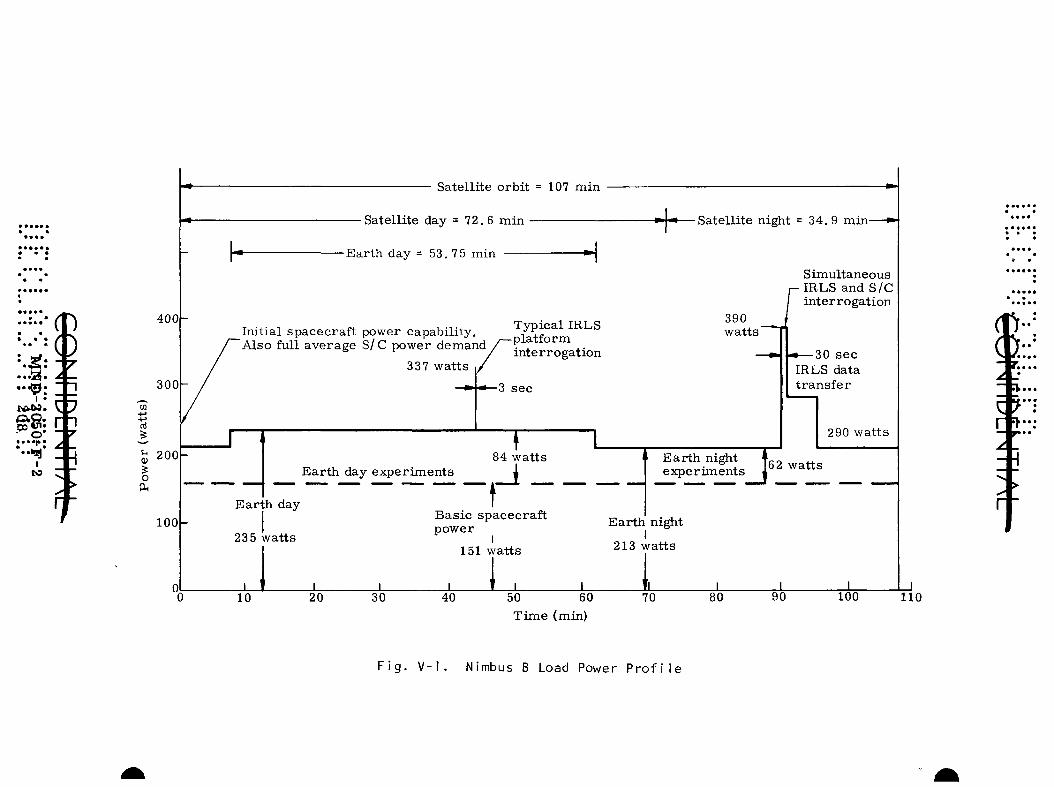
1 0 0 -
Satelli te orbi t = 107 min
Satellite day = 72. 6 min
-Earth day = 53. 7 5 min
Initial spacecraf t power capabili ty. Also full average S/C power demand
337 watts
Typical IRLS -platform in ter rogat ion
-3 sec
Ea r th day exper iments 84 wat ts
E a r t h day
235 wat ts
Bas ic spacecraf t power
151 watts
-L
- Satelli te night = 34,9 min-
r 390 watts"
Simultaneous IRLS and S/C in ter rogat ion
•—30 sec IRLS data t r a n s f e r
290 wat ts
E a r t h night C ^ a t t s exper iments I
Ear th night I
213 wat ts
J_ 10 20 30 40 50 60
T ime (min) 70 80 90 100 110
F i g . V - l . Nimbus B Load Power P r o f i l e

3. Environmental
The e lec t ronic equipment used in the E S / P C subsys tem shall operate over the t empera tu re ranges normal ly experienced by the other e lectronic equipment aboard the Nimbus B. Because of the orbi t shade period du ra tion variat ion and vehicle attitude changes, it is assumed that the bat t e r i e s used in the E S / P C subsys tem can be thermal ly located on the vehicle so as to exper ience a t empera tu re range of 40° to 90° F,
B. SYSTEM DESIGN
1. Design Approach
Evaluation of the load profile together with the RTG capacity from beginning to end of life will r evea l the continually changing bat tery d i s charge r e q u i r e m e n t s . Since the ba t te ry will experience upward of 24, 500 cycles of d i scharge , a shallow depth of discharge must be selected to provide the requ i red cycle life. The various types of ba t t e r ies available have differing cycle life capabi l i t ies , total stand life, space adaptabili ty, and space exper ience . F rom the aforementioned r e q u i r e ments , the most sui table type of ba t tery and the minimum requi red capacity will be se lec ted .
Analysis of cha rge -d i scha rge , vo l tage-cur ren t cha rac te r i s t i c s at both t empe ra tu r e e x t r e m e s , using a minimum of ba t tery capacity, should revea l the performance of the s imples t sys tem. FXirther study should revea l the opportunity to improve performance by increas ing instal led capacity and /o r the use of anci l lary regulat ion techniques. The analysis of the resul tan t a l ternat ive configurations should revea l the most a p propr ia te energy s to rage /power conditioning subsys tem,
2, Energy Storage Requirements and Type
Typical of t he rmoe lec t r i c e lements , the voltage for maximum power at the beginning of RTG life (BOL) is g r ea t e r than the voltage for maxi mum power at the end of RTG life (EOL). The 250-watt generator will be capable of supplying 360 watts at BOL; however , the 360 watts a r e available only at a voltage 20% higher than the EOL maximum power voltage. Thus , if power is taken at the BOL at the EOL voltage, l e s s than 360 watts will be avai lable . At the BOL only the 390-watt, 1/2-minute load exceeds the RTG capacity. Therefore , slightly more than 30 watts for 1/2 minute (0. 25 wat t -hr) will be supplied by the ba t te ry . At the EOL, the 390- , 290- and 337-watt loads (Section A, 2) exceed the 250-watt RTG capabil i ty. The ba t t e ry must supply the difference, which amounts to 275 wat t -minutes or 4. 6 wa t t -hours . In determining bat tery cycle life, it may be assumed that the average discharge over the five-yea r period is the average of the BOL and EOL d i scharges . Thus, du r ing 24, 500 orb i t s or d ischarge cycles , an average discharge will be
) 2 .4 wa t t -hour s .
MND--!20-50i-FT2*. ••• : ••• "i :* : : :?nq: : : : :*: : • • • • .1 . . i^uyj
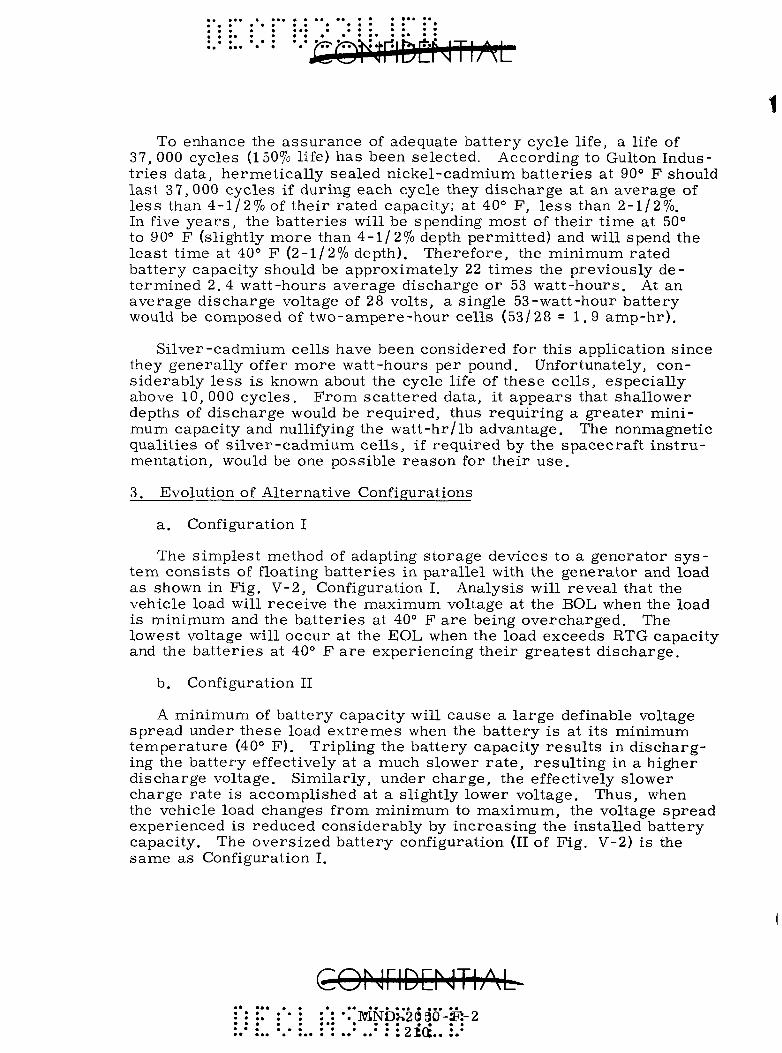
1 To enhance the assurance of adequate battery cycle life, a life of
37, 000 cycles (150% life) has been selected. According to Gulton Industries data, hermetically sealed nickel-cadmium batteries at 90° F should last 3 7, 000 cycles if during each cycle they discharge at an average of less than 4-1/2% of their rated capacity; at 40° F, less than 2-1/2%, In five years, the batteries will be spending most of their time at 50° to 90° F (slightly more than 4-1/2% depth permitted) and will spend the least time at 40° F (2-1/2% depth). Therefore, the minimum rated battery capacity should be approximately 22 times the previously determined 2.4 watt-hours average discharge or 53 watt-hours. At an average discharge voltage of 28 volts, a single 53-watt-hour battery would be composed of two-ampere-hour cells (53/28 = 1 , 9 amp-hr).
Silver-cadmium cells have been considered for this application since they generally offer more watt-hours per pound. Unfortunately, considerably less is known about the cycle life of these cells, especially above 10, 000 cycles. From scattered data, it appears that shallower depths of discharge would be required, thus requiring a greater minimum capacity and nullifying the watt-hr/lb advantage. The nonmagnetic qualities of silver-cadmium cells, if required by the spacecraft instrumentation, would be one possible reason for their use,
3, Evolution of Alternative Configurations
a. Configuration I
The simplest method of adapting storage devices to a generator system consists of floating batteries in parallel with the generator and load as shown in Fig, V-2, Configuration I. Analysis will reveal that the vehicle load will receive the maximum voltage at the BOL when the load is minimum and the batteries at 40° F are being overcharged. The lowest voltage will occur at the EOL when the load exceeds RTG capacity and the batteries at 40° F are experiencing their greatest discharge.
b. Configuration II
A minimum of battery capacity will cause a large definable voltage spread under these load extremes when the battery is at its minimum temperature (40° F), Tripling the battery capacity results in discharging the battery effectively at a much slower rate , resulting in a higher discharge voltage. Similarly, under charge, the effectively slower charge rate is accomplished at a slightly lower voltage. Thus, when the vehicle load changes from minimum to maximum, the voltage spread experienced is reduced considerably by increasing the installed battery capacity. The oversized battery configuration (II of Fig. V-2) is the same as Configuration I.
I
co^j^DE^jTlAu :*: •!*MNDH2(5 36'-JR-2
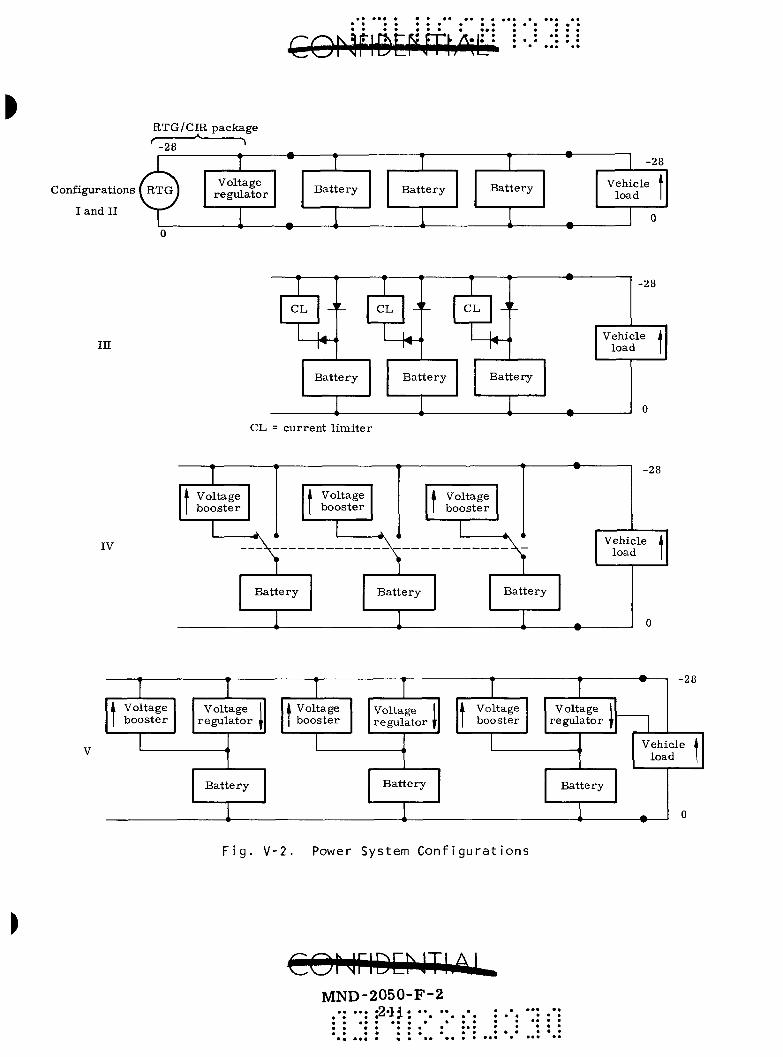
RTG/CIR package
Configurations ( RTG ]
I and II
0
L^'^-l Voltage
regiHator Bat tery Bat tery Battery
-28
Vehicle load
m
"1 CL J
^ . r" '
r_
Bat tery
CL 1
J
^ r
r_
Bat tery
11
CL J
^ P
'_
Battery
< ^^—^^
•
•
-28
Vehicle 1 load
0
CL = current l imi ter
IV
1
1 Voltage booster
A , "" \
Voltage booster
1 1 i, 1 \ _
1 Voltage 1 booster
1 * •
\ ^ \ ^ f
1 1 1 Battery
i
Battery Battery
— •
— • —
-28
Vehicle i load
0
V
1 Voltage 1 booster
Voltage regula tor \
Battery
i
1 Voltage 1 booster
Voltage regulator
Bat tery
1
1 Voltage booster
Voltage regulator
Battery
<
- • • -28
Vehicle \ load 1
- • •
0
F i g . V - 2 . Power System C o n f i g u r a t i o n s
MND-2050-F-2
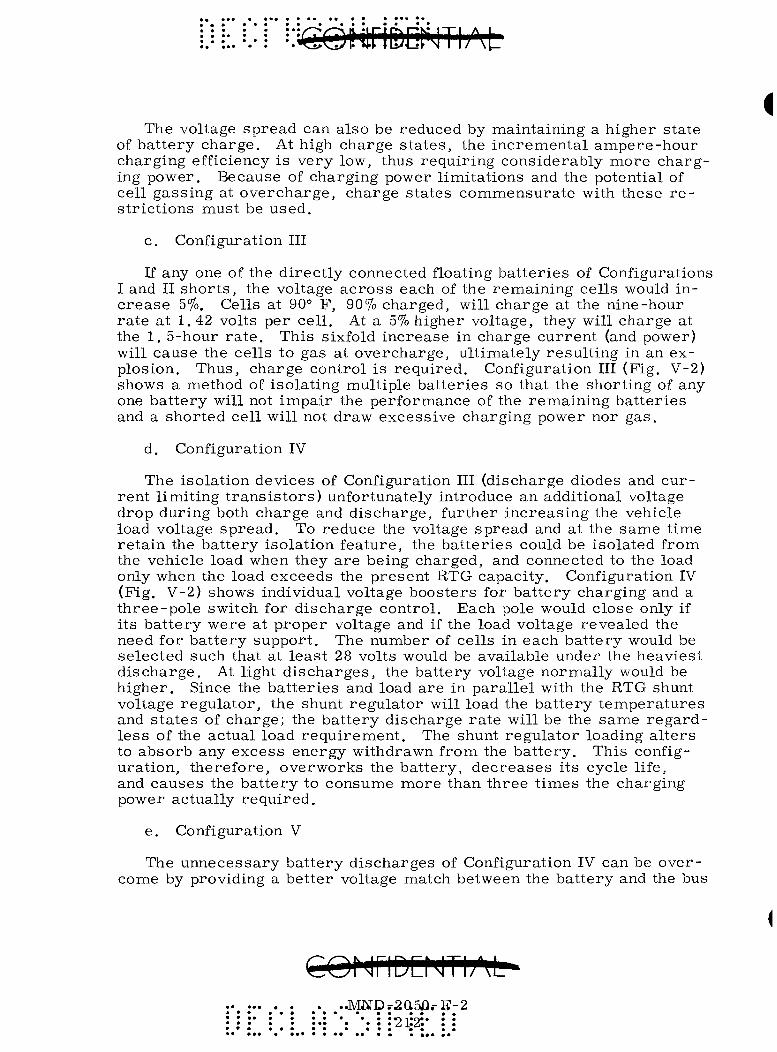
i The voltage spread can also be reduced by maintaining a higher s tate
of ba t te ry charge . At high charge s ta tes , the inc rementa l ampere -hour charging efficiency is very low, thus requir ing considerably more cha rg ing power. Because of charging power l imitat ions and the potential of cell gass ing at ove rcha rge , charge s tates commensura te with these r e s t r ic t ions must be used .
c. Configuration III
If any one of the d i rec t ly connected floating ba t t e r i e s of Configurations I and II s h o r t s , the voltage a c r o s s each of the remain ing cel ls would inc r e a s e 5%. Cells at 90° F, 90% charged, will charge at the nine-hour r a t e at 1,42 volts per cel l . At a 5% higher voltage, they will charge at the 1, 5-hour r a t e . This sixfold increase in charge cu r ren t (and power) will cause the cells to gas at overcharge , ul t imately resu l t ing in an explosion. Thus, charge control is requi red . Configuration III (Fig. V-2) shows a method of isolat ing multiple ba t te r ies so that the short ing of any one ba t te ry will not impai r the performance of the remain ing ba t te r ies and a shor ted cell will not draw excessive charging power nor gas .
d. Configuration IV
The isolation devices of Configuration III (discharge diodes and cu r rent l imit ing t r a n s i s t o r s ) unfortunately introduce an additional voltage drop during both charge and d ischarge , further inc reas ing the vehicle load voltage sp read . To reduce the voltage spread and at the same t ime re ta in the ba t te ry isolat ion feature , the ba t t e r i e s could be isolated from the vehicle load when they a r e being charged, and connected to the load only when the load exceeds the present RTG capacity. Configuration IV (Fig, V-2) shows individual voltage boos ters for ba t t e ry charging and a th ree -po le switch for d i scharge control . Each pole would close only if its ba t te ry were at p roper voltage and if the load voltage revealed the need for ba t te ry support . The number of cells in each ba t te ry would be selected such that at leas t 28 volts would be available under the heaviest d i scharge . At light d i scha rges , the bat tery voltage normal ly would be h igher . Since the ba t t e r i e s and load a re in para l le l with the RTG shunt voltage regula tor , the shunt regula tor will load the ba t te ry t empera tu re s and s t a t e s of charge; the ba t te ry discharge r a t e will be the same r e g a r d l e s s of the actual load r equ i r emen t . The shunt regula tor loading a l t e r s to absorb any excess energy withdrawn from the ba t te ry . This configurat ion, therefore , overworks the bat tery , d e c r e a s e s its cycle life, and causes the ba t te ry to consume more than th ree t imes the charging power actually requ i red ,
e. Configuration V
The unnecessa ry ba t te ry d ischarges of Configuration IV can be over come by providing a be t ter voltage match between the ba t te ry and the bus
.Mj:irDr2a5fl.-E-2

under the variable d ischarge conditions encountered. Configuration V includes a voltage regula tor in the discharge circuit of each bat tery . When the bus voltage is above 27,9 volts, each regulator will have an infinite s e r i e s r e s i s t a n c e . When the vehicle lowers toward 27, 7 volts, each bat tery s e r i e s regula tor will lower i ts r e s i s t ance to a minimum value. The shunt regula tor below 28 volts will be at an infinite shunt r e s i s t a n c e . Current flow from the bus to a bat tery is precluded by the design of the s e r i e s r egu la to r . The voltage boos te r s , in this configura t ion, would have to be cu r ren t - l imi t ed to preclude them from being overloaded when they a r e effectively shorted by the s e r i e s voltage r e gulator during low bus voltage conditions (27. 7 to 2 7, 9 volts),
4. Configuration Per fo rmance
In o rde r to evaluate these five configurations quantitatively, sys tem cha rac t e r i s t i c s for each have been determined. Figure V-3 presents the load vol tage-cur ren t cha rac t e r i s t i c s specifically for Configuration III and is somewhat r ep resen ta t ive of Configurations I and II. The resul tant sys t em cha rac t e r i s t i c is a composite of the cha rac te r i s t i c s of the RTG (at BOL and EOL), the ba t t e r i e s under discharge (at charge state and t empe ra tu r e ex t r emes ) , and the ba t te r ies under charge (at t empera ture ex t r emes ) as controlled by the charge l imi t e r .
On Fig, V-3, the space between the in tersect ion of the RTG line with the ba t te ry charge and discharge cha rac te r i s t i c s is caused pr imar i ly by the sum of the voltage drops a c r o s s the discharge diodes and the charge l im i t e r s when the la t te r a r e at minimum r e s i s t a n c e . Configuration II excludes this drop; consequently. Fig. V-3 r e p r e s e n t s Configuration II if the ba t tery charge and shunt regula tor cha rac te r i s t i c s a r e t ranslated downward 0, 8 volt and the discharge cha rac t e r i s t i c s s imi la r ly t ransla ted upward.
Configuration IV and V include a minimum capacity ba t tery , one- third the capacity used in Fig, V-3 . Consequently, the ba t tery discharge curves of Fig. V-4 a r e three t imes as s teep. Since Configurations IV and V furnish no less than 27. 7 vol ts , the d ischarge curves a r e located at h igher voltage levels on this f igure. On Configuration IV, at BOL and a ba t tery t empera tu re of 90° F, the application of the maximum load (390 watts) causes the RTG to supply 12, 6 amperes at 27, 7 volts and the ba t te ry to supply 17 a m p e r e s at 27, 7 volts, a total of 29. 6 amp e r e s . The load absorbs 14,2 a m p e r e s and the shunt regula tor absorbs the difference, 15,4 a m p e r e s . Actually, the bat tery only needed to supply 14.2 - 12.6 = 1, 6 a m p e r e s .
Configuration V overcomes this problem by supplying 1, 6 amperes f rom the bat tery at 3 5. 3 vol ts . The dotted line of Fig, V-4 shows the voltage a c r o s s the s e r i e s r egu la to r s to be 3 5,3 - 27. 85 = 7,45 vol ts . This voltage drop, although wasting 12 watts to supply 30, is bet ter than wasting (15.4) (27. 7) = 426 wat ts , as was done in Configuration IV.
M:^6D••20»0-:F•->2••. .*. : •'. "•• :": :: -S i s : : : ' :' M : . : : :.:

Constant Power Lines
33r
213 250 watts wat ts
360 390 watts wat ts
Ba t t e r i e s
31 . — p ^ , ( N o load on sys tem -^-C'i-^ ' , EOL
RTG shunt voltage regula tor cha rac t e r i s t i c
2 of 3 included only 40° F at min imum
state of charge (92,5%)
90° F at max imum sta te of charge (100%)
28-
a
25-
24L
NOTE:
Bat te ry voltages shown a r e p r i o r to charge l imi t e r and after d ischarge d iodes .
Design e x t r e m e s - - 3 0 . 8 to 25.2 volts (28 volts ± 10%)
Maximum efficiency EOL
90° F d ischarge
40° F d i scharge
10 15 20 Load Current (amp)
Fig. V-S. Electric Power System Characteristics for Configuration III
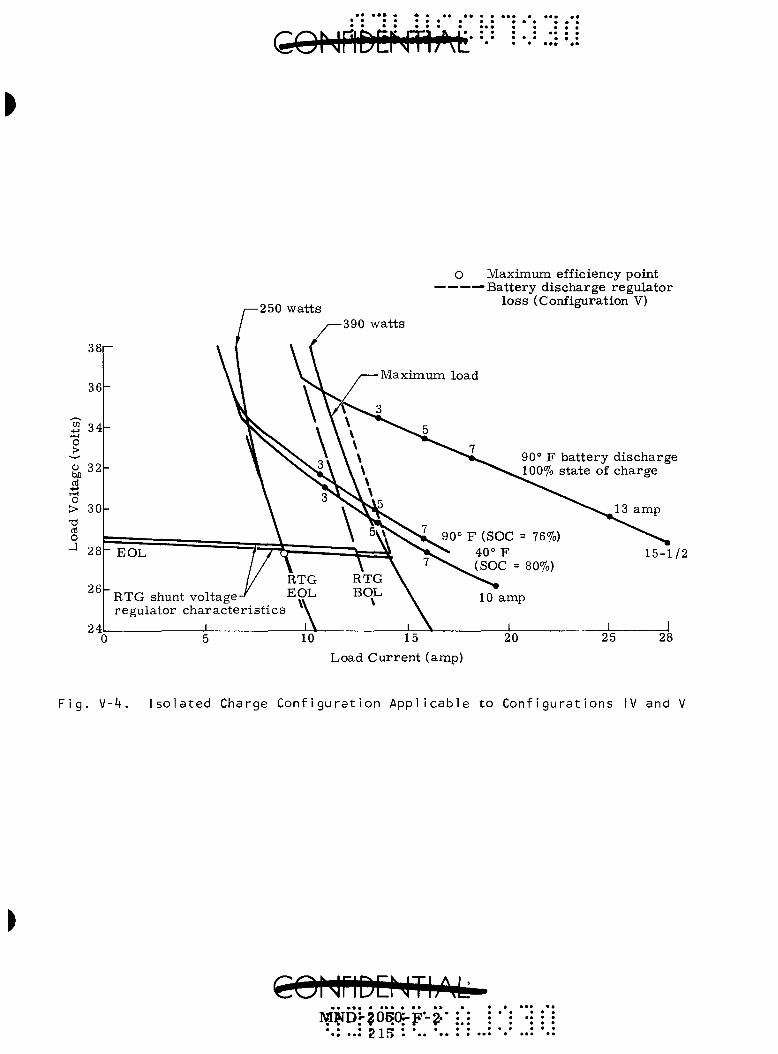
24
-250 watts
O Maximum efficiency point ———^Bat te ry d ischarge regula tor
loss (Configuration V)
-390 watts
Maximum load
90° F ba t te ry d ischarge 100% state of charge
RTG shunt vo l tage- ' EOL regula tor c h a r a c t e r i s t i c s
10 15 20 Load Cur ren t (amp)
25 28
Fig. V-4. Isolated Charge Configuration Applicable to Configurations IV and V
WDr?0?(^F-2-

{
5. Configuration Comparison
Characteristics and features of the five configurations previously discussed are summarized in Table V-l. The first five items describe the major constituents of each configuration. The next four items enumerate the respective features incorporated which have a direct bearing on the probability of mission success. Only Configurations III and V offer the greatest protection against various types of battery failure, excluding lack of capacity. A review of their respective voltage regulation qualities shows that all configurations except I meet the ± 10% requirement. Configurations IV and V far surpass this requirement, thus allowing the regulation to be eliminated locally at most vehicle loads. The different settings for the RTG shunt regulator for each configuration are caused by the differing battery discharge control methods and/or the top limits of the bus voltage tolerance of each of the configurations.
The efficiency of the energy storage and power conditioning subsystem is revealed by the charging losses (voltage booster), the charging power required and the extent of losses experienced during battery discharge. Since the batteries of Configurations I and II are charged directly at the RTG voltage, voltage boosters are not required and charging power is a minimum. The slight increase in charging power required by Configuration III reflects the loss through the charge limiter, a small cost for this advantageous feature. The disproportionately higher charging power required by Configuration IV is caused by the very inefficient discharge features of this configuration described in Section B, The voltage booster loss is therefore greater than for Configuration V, Quantitative examples of battery energy waste are shown for the 3 90-watt vehicle load condition. Configuration V, although a great improvement over IV, is considerably less efficient on discharge than III, This discharge inefficiency of Configuration V is not wholly reflected in the comparison of charge power required for III versus V since V is operated at a lower state of charge, thus having a higher incremental charge efficiency. Both Configurations III and V require considerably less charging power than the amount available from the RTG at EOL (15 watts).
The battery weights shown for the minimum battery capacity configurations (I, IV and V) differ since the batteries are composed of a differing quantity of cells in ser ies . Configuration IV battery weight must be much greater than 14 pounds (minimum capacity weight) since minimum capacity will not provide adequate five-year cycle life due to the excessive discharges experienced by this configuration. Tripling the battery capacity (28-1/2 lb) reduces the battery discharge from 17 to 11 amperes but still provides only 16,000 cycles of operation. Therefore, Configuration IV becomes the heaviest and most inefficient configuration.
I
^ Q f jriD:NTI;M!!-:': •:• -KlJJH-jaKOrF-a : : ..• ..• ; : 215. :.*

CQfiiriDtfJtiAJi'
TABLE V- l Power System Configuration Comparison
Battery charge--method --connection
Discharge through
Battery capacity, excluding redundancy --total/vehicle (a-h)
Protection against: Shorted battery Open cell Overcharge--al l cells good
--one cell shorted
Bus voltage tolerance (%) -90° P
-40° P
RTG shunt voltage regulator setting (volts)
Voltage booster power loss (watts)
Charging power at 40° P, EOL (watts)
390-watt system load, 90° P battery (watts) At BOL, should supply
Supplies At EOL, should supply
Supplies
Battery weight (including 50% redundancy) (lb)
ES/PC subsystem total weight (lb)
Mission success probability due to: Power conditioning equipment
RTG*--first 3 years --4th and 5th year
Battery shorts , overcharge Battery cycle life
I
Ploat Direct
Direct
Minimum 3
No Yes Yes No
±11-1/2
+ 14 -15.3
31.8 to 32.4
--
4 .
30 30 140 140
11
11
Out of tolerance Very good Poorest Poorest Good
II
Ploat Direct
Direct
Oversized 9
No Yes Yes No
±5
±7.2
29.8 to 30.4
--
4 .
30 30 140 140
26
26
Best
Very good Good Poorest Best
III
Float Current l imiters Diodes
Oversized 9
Yes Yes Yes Yes
+ 10 -5 .7 +10 -10
30. 6 to 31.2
--
6.4
30 31 140 144
26
26-1/2
Very good
Very good Fair Best Best
IV
Isolated boosters
Switch
Minimum 3
Yes Yes Yes No
+ 1.1 -1.0 ±1.0
27.75 to 28.3
2 .0
>34
30 426 140 225
Much greater than 14 Much greater than 1 5
Good
Best Best Best Failure
V
Isolated boosters Current limited
Voltage regulator switch
Minimum 3
Yes Yes Yes Yes
±1
±1
27. 75 to 28.3
0.41
7.
30 42 140 150
14
15
Good
Best Best Best Good
*Least thermal cycling (least Peltier current variation)
MND-2050-F-2 •2if • • ••
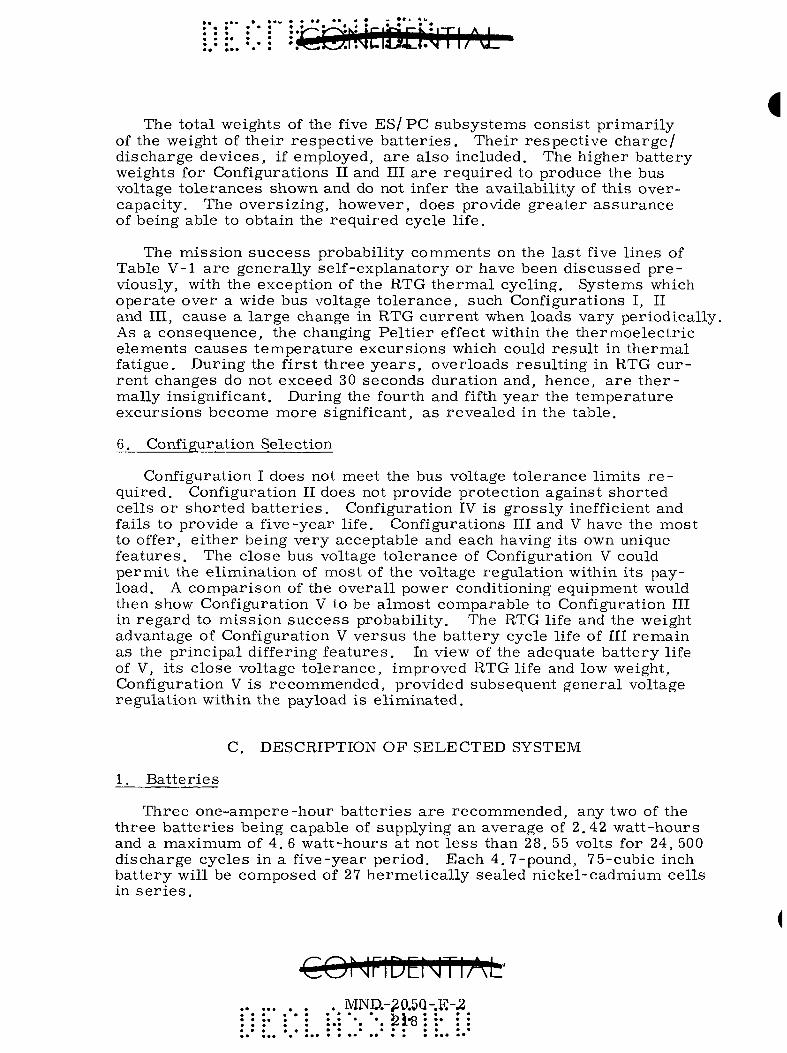
The total weights of the five ES/PC subsystems consist primarily of the weight of their respective batteries. Their respective charge/ discharge devices, if employed, are also included. The higher battery weights for Configurations II and III are required to produce the bus voltage tolerances shown and do not infer the availability of this overcapacity. The oversizing, however, does provide greater assurance of being able to obtain the required cycle life.
The mission success probability comments on the last five lines of Table V-l are generally self-explanatory or have been discussed previously, with the exception of the RTG thermal cycling. Systems which operate over a wide bus voltage tolerance, such Configurations I, II and III, cause a large change in RTG current when loads vary periodically. As a consequence, the changing Peltier effect within the thermoelectric elements causes temperature excursions which could result in thermal fatigue. During the first three years , overloads resulting in RTG current changes do not exceed 30 seconds duration and, hence, are thermally insignificant. During the fourth and fifth year the temperature excursions become more significant, as revealed in the table,
6, Configuration Selection
Configuration I does not meet the bus voltage tolerance limits r e quired. Configuration II does not provide protection against shorted cells or shorted batteries. Configuration IV is grossly inefficient and fails to provide a five-year life. Configurations III and V have the most to offer, either being very acceptable and each having its own unique features. The close bus voltage tolerance of Configuration V could permit the elimination of most of the voltage regulation within its pay-load, A comparison of the overall power conditioning equipment would then show Configuration V to be almost comparable to Configuration III in regard to mission success probability. The RTG life and the weight advantage of Configuration V versus the battery cycle life of III remain as the principal differing features. In view of the adequate battery life of V, its close voltage tolerance, improved RTG life and low weight, Configuration V is recommended, provided subsequent general voltage regulation within the pay load is eliminated,
C, DESCRIPTION OF SELECTED SYSTEM
1. Batteries
Three one-ampere-hour batteries are recommended, any two of the three batteries being capable of supplying an average of 2,42 watt-hours and a maximum of 4. 6 watt-hours at not less than 28, 55 volts for 24, 500 discharge cycles in a five-year period. Each 4, 7-pound, 75-cubic inch battery will be composed of 27 hermetically sealed nickel-cadmium cells in ser ies .
. . MND.-^0.5Q-.E-^ : :.: *. *. Sl-8 : :• : :

2. Voltage Boosters
Each ba t te ry will be charged individually by a cur ren t - l imi ted voltage boos te r . Each of the th ree boos te r s will produce 39 volts at 0. 05 ampere from a 28-volt input at a 95% overa l l efficiency (85% boost efficiency). At 0. 06 ampere the output will be 38 volts, and a maximum of 0.11 ampe re at 28 vol ts . The th ree boos te rs should weigh l e s s than one-half pound.
3. Discharge Voltage Regulators
Each ba t te ry will be discharged individually through a unidirectional s e r i e s r egu la to r . The r e s i s t ance cha rac t e r i s t i c s of the discharge route will be as follows:
Output--Bus Side (volts)
Route Resistance (ohms)
Input (volts)
> 2 7 . 9
27 ,7
>2,200
< 0 , 3 2
39,0
28, 5
When the voltage on the bus side of the regula tor at tempts to fall below 27, 9 volts , the route r e s i s t ance will adjust to produce between 27.7 and 27. 9 volts on the bus side of the regu la to r . These cha rac te r i s t i c s must be coordinated with the cur ren t l imit ing feature of the voltage boos te r s . The three d ischarge regu la to r s should weigh less than one-half pound.
3^NB-:2fO;5p^:FfS :* • • • •21B* • •

w
r W

APPENDIX W
DERIVATION OF CASCADED EFFICIENCY EXPRESSION
In the following derivation, the parameters for the SiGe module will be designated by the subscript 1 while those for the PbTe module will be designated by the subscript 2. The following schematic is a model of the energy balance on the system:
Qp i (lost parasitic heat)
Q^ (total input heat)
i_ GeSi = 1
I P j (net electrical power)
S - Q p i - ^ l
Qp2 (lost parasitic heat)
PbTe = 2 Pg (net electrical power)
Q reject
The overall efficiency of the SiGe module is given by
P , ^^ = 1 Q,
(W-1)
where
P^ = net electrical output power (i. e . , power already corrected for joule losses) from the SiGe module
Q = heat input to the SiGe module.
The overall efficiency of the PbTe module is given by
P„
' ^ 2 = Q i - P l - Q p i (W-2)
MND-2050-IE--2... 221- ' i i •!

where
P„ = net e l ec t r i ca l output power from the PbTe module
Q p i = pa ra s i t i c heat loss from the SiGe module that is not ava i l able for use in the PbTe module .
The overa l l efficiency of both modules is defined by
"O/A = ^ ^ (W-3)
Substituting Eqs (W-1) and (W-2) into Eq (W-3) for P^ and Pg, r e s p e c tively,
^0/A = 'll + ^2 - ' 1 ' 2 - - Q ^ - <^-^^
Now r). naay be wr i t ten as
P Q P j Pj^ grosSj^ ele^^ ^ 1 g r o s s . ^ e l e ^ 1
( V R ) , ("T/E), (%),
where 2
rj 2 - joule (s t rap) efficiency, to account for I R lo s ses in the
I R hot and cold shoes and wir ing
rj., = t h e r m a l efficiency
•nryf-c^ = t h e r m o e l e c t r i c efficiency.
Similar ly ,
Substituting Eqs (W-6) and (W-5) into Eq (W-4),
•CONriDDJTijM :•* JVENE)*-.2050-F-2 «• • < • • •
222 • i «.t-X ^ v
"O/A- ( V j ("T/E), W ^ ^ (VR) ("T/E), (%),
" (VR), (VR)^ (^T/ )I K/E)^ W i W ,
( ^ T / E ) 2 S I (%)2 ( V R ) .
Q. (W-7)
This equation is the rigorous expression for overall cascaded system efficiency.
The definition of rj^ ,« is
p p gross^ _ 1 2
' O/A " Q Q (W-8)
where
Q i = Q Qj \ ^ele^
1 ^ e l e , Q (W-9)
1 r'ele. 'th
Substituting Eqs (W-8) and (W-9) into Eq (W-7), and dividing both sides of the resulting equation by/r j ^ \ (\u) yields
V I R^j 1
' + P grosSj grosSg
Q ele. = ( % / E ) / ( ' . T / 4 ^ ^
- ( ' 'T/E)J ( ' 'T/E)^ ( V R ) , ("th), Ct
I \ _ Q P I _ U ^ R ) 2 M l
«• i| -iriDD jTI/ii,4p MND-205poFr2.
223: '.' : * • • • «
For the limiting case of zero thermal and electrical losses (i, e, ,
^2 ^ ^th " ^^^'^°' P l " °^' ^^ (W-IO) becomes I R
P -f P gross. grosSg
Q ele. K / E ) / ( T/E)2 " K/E)^ K/E)
o r
K / E ) = K / E ) + K / E ) - K / E ) . K / E ) . ^ ' case 1 <s 1 '
2
(W-11)
(W-12)
where the cascaded thermoelectric efficiency is defined as gross power per heat to the elements,
This equation is useful in that the cascaded thermoelectric efficiency can be expressed in terms of known quantities, viz,, output from the thermoelectric digital computer code described elsewhere, without recourse to thermal or joule efficiencies. Use of these latter terms would require information on a specific design.
The departure of the "ideal," Eq (W-12), from the "real," Eq (W-10), can be further investigated as follows: If
1 and Cth),
~ 1,
then
K / E ) ^ ^ ^ ^ ^ K / E ) J + K / E ) ^ - K / E ) ^ K / E ) 2 ( Y R )
Q
( V R ) . • ^ ^ ^ 2 ^ (W-13)
The last two terms in Eq (W-13) are negligible for any practical design since
K / E ) J * K / E ) , » ( ' ' T / E ) J K / E ) , (VR)^ ( V R ) ,
-I-V,''T/E;2 QI
(W-14)
cot jriDD ilTI AL • • • *• iMND.-2050-F-2
: :224
'• K / E ) _ _ « K / E ) / K/E)2 (W-15) case
Thus, subject to the constraint,
("I^R) , ("th), -7 r 1 and -7 ^ 1
("I^R), ^
Equation (W-12) is a conservative formulation. Actually, the difference in Eqs (W-12) and (W-15) is very small.
CQNriDCNTh>4 MND-2Q5Q.-F-2.
22:5: .: : .: • • • •

• • •
•
• •••
• •
• • ••'
• • • •
• •
«• 1
•
•
• •
• •
• • •
• •
•
•••1
•
« ••
•<
• •
• • ••
« ^
CO
05 • •
•
•
•
•
•
•
>•
• • 'S ;P
N3
O Ul
o i]
1
to
- y
^ 1
APPENDIX X
CAPSULE TEMPERATURE-TIME HISTORY FOR Pu-238
To design a capsule as a pressure vessel for the containment of helium, (resulting from decay of an alpha-emitter), a knowledge of the capsule temperature history over several half-lives is necessary. To assume the beginning-of-life temperature to hold for long periods of time (relative to the fuel half life) is an ultra conservative assumption that unnecessarily penalizes capsule weight.
The correct expression for the capsule temperature history is the one derived by developing and manipulating the various heat balance equations within the generator. This naethod was previously used in developing the definitive equation for SNAP 9A--a conduction-type generator . In that case, the capsule temperature, while the capsule is in the generator, was given by:*
T = ( T „ ) e"^*/^+ ( T - T p ) e-^t cap V R/ \ cap R/
It is emphasized that this equation applies only to the conduction-type RTG.
For a different model RTG (e, g. , a 250-watt SiGe generator or any other employing a major radiation gap internally), a different equation describes capsule temperature history. This latter equation is developed for three cases:
(1) Most general case where generator material properties are expressed as a function of temperature (and hence time), and generator is operating normally.
(2) Same as Item (1) but generator is open circuited.
(3) Case where beginning-of-life material properties may be used for the time period of interest. The result is a simpler expression for capsule temperature.
* Nomenclature is at the end of this appendix.
co^ iriDcr iTiii\L» MND-20^$-H-:2':i • "r '
22t.: ..: : : : •.. =

A. ANALYSIS AND RESULTS
1. Case I--General Equation
The approximate equation describing heat rejected by radiation from the generator to space is:
q = q e"^^ = a e A T ^ + ae(A . - A )T ^ r],. ^ ^o s r circ s r 'fin
by:
(X-1)
The cold junction temperature is related to the surface temperature
-Xt q e o
T = T H =— ^c -^r^ K (X-2) cold
The hot junction temperature is related to the cold junction temperature by a heat balance including thermoelenaent heat conduction, Peltier effect and parasitic losses, viz . ,
k A k A n n p p 1 1 n p
( T , - T ) N + o, IT, + K (T, - T ") (X-3) v h c/ h h par V h c/
E (T^ - T ^ N O oc _ \ h c/ Rj+Rj_^ Rj + R^
^1 = p 1 p 1 C c _e_p + i iLJi + ^ i +_p_
n n N + R
misc
(X-4)
(X-5)
The temperature drop by conduction through the hot shoe itself should be considered for the case of SiGe. Then, the maximum shoe temperature is related to the hot junction temperature by:
-Xt q e
T = T + - ^ •^shoe - h K
(X-6) shoe
The capsule surface temperature is related to the hot shoe temperature by the equation for radiation heat transfer.
cap
-Xt %^ 4 —= + T aeA shoe env
1/4
(X-7)
:• : • : :.: '•. '•. I :• :T?lNpc-2050-F-2 :.. •.• :.. : : ..• ..• ; : : :.. :.• 228
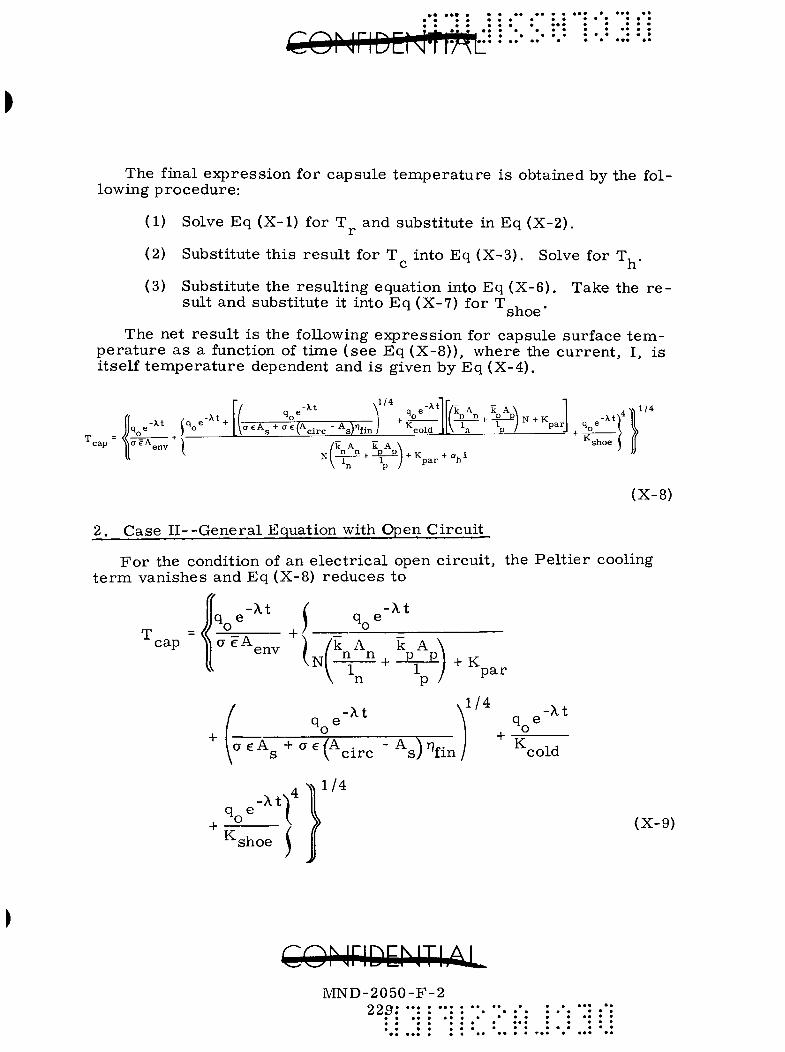
The final express ion for capsule t empe ra tu r e is obtained by the following procedure :
(1) Solve Eq (X-1) for T and subst i tute in Eq (X-2).
(2) Substitute th is resu l t for T into Eq (X-3). Solve for T, . »-' n
(3) Substitute the resu l t ing equation into Eq (X-6). Take the r e sult and substi tute it into Eq (X-7) for T ,
^ shoe The net r e su l t is the following express ion for capsule surface t e m
p e r a t u r e a s a function of t ime (see Eq (X-8)), where the cur ren t , I, is i tself t e m p e r a t u r e dependent and i s given by Eq (X-4).
\t q e \ o
-X.t
g eA^ + .7 c (A^.^^ - A^)r,j^^ J * K ^ „ ^
1/4 -Xt / k A k A \ 4
cap YiCTeA / k A k A \ + a, I
p a r h
1/4
shoe
(X-8)
2. Case I I - - G e n e r a l Equation with Open Circui t
F o r the condition of an e l ec t r i ca l open c i rcui t , the Pe l t i e r cooling t e r m vanishes and Eq (X-8) reduces to
cap f - ^ t ( „ -Xt
^ ^ ^ e n v ) / k A k A ^ + K
+ %^
n
•Xt
, CTeA + a e /A . - A \r)^. ' s V c i r c s ; 'fm
par
1/4
+ %^ -Xt
K cold
-Xt^^ q e / + 22 V
1/4
shoe (X-9)
ri OhiriDEMTI.f^L MND-2050-F-2
229 ••• • ••• • •• •• • • • ••• ••• *•• • • • • • • •••
mm • • • • • • • • • • •

3. Case III--Open Ci rcu i t - - In i t i a l P r o p e r t i e s
(
F o r the case where the p rope r t i e s a r e not s t rong functions of t e m p e r a t u r e or a l ternate ly where long- t ime per iods a r e not involved (hence, l a rge t e m p e r a t u r e changes do not occur) , init ial m a t e r i a l p rope r t i e s ( emiss iv i t i e s , conductivities) may be used.
Then, Eq (X-1) may be wr i t ten as:
q q e - ^ ^ = K , T ^ ^o '1 r
Evaluating K^ at t = 0,
q. ^ 1 =
o
r , o
Substitution into Eq (X-10) gives
-Xt /4 T = T e r r , o
Similar ly , it may be shown that Eq (X-2) becomes:
T = T ^ e c r , o -Xt/4
+ (T - T ) e c r^^
-Xt
F o r an open c i rcui t condition, Eq (X-3) m.ay be wr i t ten as:
q e"^^ = K„ ( T , - T ) + K ( T , - T ") ^o 2 \ h c/ p a r \ h c /
Evaluating K„ 4- K at t = 0 ^ 2 p a r
(X-10)
(X-11)
(X-12)
(X-13)
(X-14)
o ^2-Vr^^f—T;J (X-15)
Substitution into Eq (X-14) g ives , after solving for T, and further sub
sti tuting for T from Eq (X-13),
T ^ = ( T h c ; ^ -Xt/4
r , o + ( T T W c r ; ^
-Xt (X-16)
• ••• •
eONriDENTIAL •I^5JDr?050-F-2
: V J2^0

Equation (X-6) is treated similarly to Eq (X-2). Then:
T = T ^ shoe ^
h + ( T s h o e - T h ) ^ ^ " ^ ' (X-17)
Equation (X-7) may be written as:
cap \ K„ shoe (X-18)
Evaluation of Ko at t = 0 and substitution back into Eq (X-18) gives:
cap (T - T \ \ e \ cap shoe/ . . ^* + T^ cap shoe/ shoe
1/4 (X-19)
Final substitution of Eqs (X-16) and (X-17) into Eq (X-19) gives:
cap j f ^ 4 _^4 ^\ cap shoe
•Xt + (^h - Te)
-Xt
o
+ T e-^^/^+ ( T - T ) e"^*-f ( T ^ - T^ r , o \ c r / \ shoe h o
) e - » - 'I 1/4
(X-20)
where the subscript o indicates that particular temperature is the value at t = 0. It should be noted that T, , T , and T are not the
h ,o ' shoe, o cap, o initial normal operating temperatures, but rather are the initial open circuit temperatures which are typically 100° to 200° F above the normal operation values.
Also, note that because of the presence of radiation, all temperatures must be on the absolute scale.
B. CONCLUSIONS AND DISCUSSION
Capsule temperature as a function of time is most accurately described by Eqs (X-8) or (X-9), depending on whether a normally operating or open circuited generator is assumed.
Equation (X-20) (developed for open circuit generator) may be applied, however, with the assumption that the material properties (emissivities and conductivities) do not change as the temperatures change. This is a reasonable assumption and, in fact, conservative since thermoelement conductivity increases at lower temperature (increased conductivity will cause capsule temperature to be lower than predicted by use of beginning-of-life values).
As an example of the use of Eq (X-20), capsule temperature was computed as a function of time for the following initial conditions (open c i r cuit) for Pu-238 (t ^/2 = 86.4 years):
T cap, o
Th.o = T = shoe,o
T C O
T r , o
1950° F = 2410° R
1750° F = 2210° R
1765° F = 2225° R
550° F = 1010° R
520° F = 980° R
The resultant capsule temperature history is plotted in Fig. X - 1 . It is of interest to note that if the first equation cited was used (i. e. , the equation used for SNAP 9A), lower (and hence optimistic) temperatures would result. (At the 200-year point, the SNAP 9A equation would give 483° F; and at the 300-year point, 206° F as contrasted with the more accurate values of 800° and 540° F , respectively.)
For pressure buildup calculations, it is recommended that normal operating temperatures be used for the time period during which the generator is not likely to open circuit. This time period is dependent on generator reliability. After that period, it is recommended that open circuit temperatures be used.
Finally, note that since absolute temperatures are used in the ideal gas law, small e r ro r s in capsule temperature will produce small e r ro r s in pressure buildup. Capsule material properties (yield strength, ultimate tensile strength, etc.) are quite sensitive to the temperatures used, particularly in the range 1600° to 2000° F .
C. NOMENCLATURE
A Area
C Element contact resistivity
•:* : : : M U P : ^ 0 5 0 - F - 2 . = ; : : :.. :.S32

Open circuit Pu-238
T = |(T - T ^ ) e"^'' + cap / cap shoe'o < T h - V o ^ ' ' ' ^ T r , o ^ ' ' ' ^ ' ^ ( ' r c - V o ^
+ ( T 3 h o e - T h ) o ^ - \ t
1/4
2OOO1-
100 200
Tim.e (yr) 300
F i g . X - 1 . Capsule Temperature Versus Time
con lD:MTlJ^L^ MND-2Q50-tr.:-^
23-3: •••• '

E Voltage
I Cur ren t
K The rma l conductance
k T h e r m a l conductivity
k Integrated average t h e r m a l conductivity
1 Element length
N Number of couples
q Heat ra te
R E l ec t r i c a l r e s i s t ance
T T e m p e r a t u r e
t T ime
t^ /„ Isotope half-life
a Seebeck coefficient
e Emiss iv i ty of rad ia to r
e Effective emiss iv i ty between capsule and hot shoe
r]„. Radiator fin efficiency
X Isotope decay constant = 0. 693/t^ /„
p Thermoelement e l ec t r i ca l res i s t iv i ty
CT Stefan-Boltzmann constant
Subscripts
circ Circumscribed (refers to area envelope about the radiator
fins)
c Cold junction
cap Capsule
cold Refers to cold end hardware on thermoelements
!*MNti-2050-F-2 • • • • : :.. :.^34

env
h
I
L
misc
N
o
oc
P
p a r
S
Envelope (area of heat source)
Hot junction
Refers to total internal resistance
Load (resistance)
Miscellaneous
N element
initial value
Open circuit
P element
Parasit ic
Refers to area of shell (or casing) out fins)
shoe Thermocouple hot shoe
MND72a5Q-JF.-2.._ .., \ 23'§
» & » • •

« «
7^
N)
* «
• •
•
}):::
t?
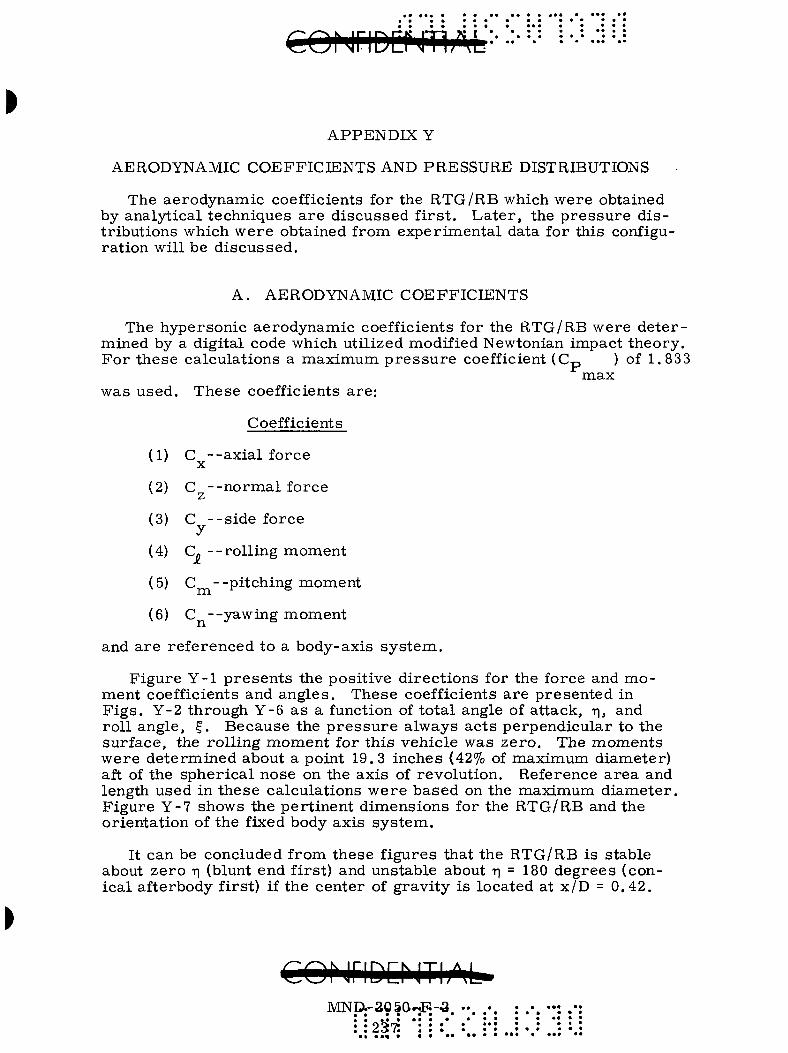
APPENDIX Y
AERODYNAMIC COEFFICIENTS AND PRESSURE DISTRIBUTIONS
The aerodynamic coefficients for the RTG/RB which were obtained by analytical techniques a r e d iscussed f i r s t . La t e r , the p r e s s u r e d i s tr ibutions which were obtained from exper imenta l data for this configuration will be d i scussed .
A. AERODYNAMIC COEFFICIENTS
The hypersonic aerodynamic coefficients for the RTG/RB were d e t e r mined by a digital code which util ized modified Newtonian impact theory . Fo r these calculat ions a maximum p r e s s u r e coefficient (Cp ) of 1.833
max was used. These coefficients a re :
Coefficients
(1) C - - ax i a l force X
(2) C - - n o r m a l force z
(3) C - - s i d e force y
(4) C- - - ro l l ing moment
(5) C --pi tching moment
(6) C --yawing moment
and a r e referenced to a body-axis sy s t em. F igure Y-1 p r e sen t s the posit ive di rect ions for the force and m o
ment coefficients and angles . These coefficients a re presented in F i g s . Y-2 through Y-6 a s a function of tota l angle of attack, r\, and rol l angle, f. Because the p r e s s u r e always ac ts perpendicular to the surface , the rol l ing naoment for th is vehicle was ze ro . The moments were de termined about a point 19.3 inches (42% of maximum diameter) aft of the spher ica l nose on the axis of revolution. Reference a rea and length used in these calculat ions were based on the maximum diameter . F igure Y-7 shows the per t inent d imensions for the RTG/RB and the orientat ion of the fixed body axis sys t em.
It can be concluded from these f igures that the RTG/RB is stable about ze ro T| (blunt end first) and unstable about -n = 180 degrees (conical afterbody first) if the center of gravi ty is located at x /D = 0 .42 .
CONriDCNTIAU MND.-a05a"F.
• • t • •
2275
-"3.
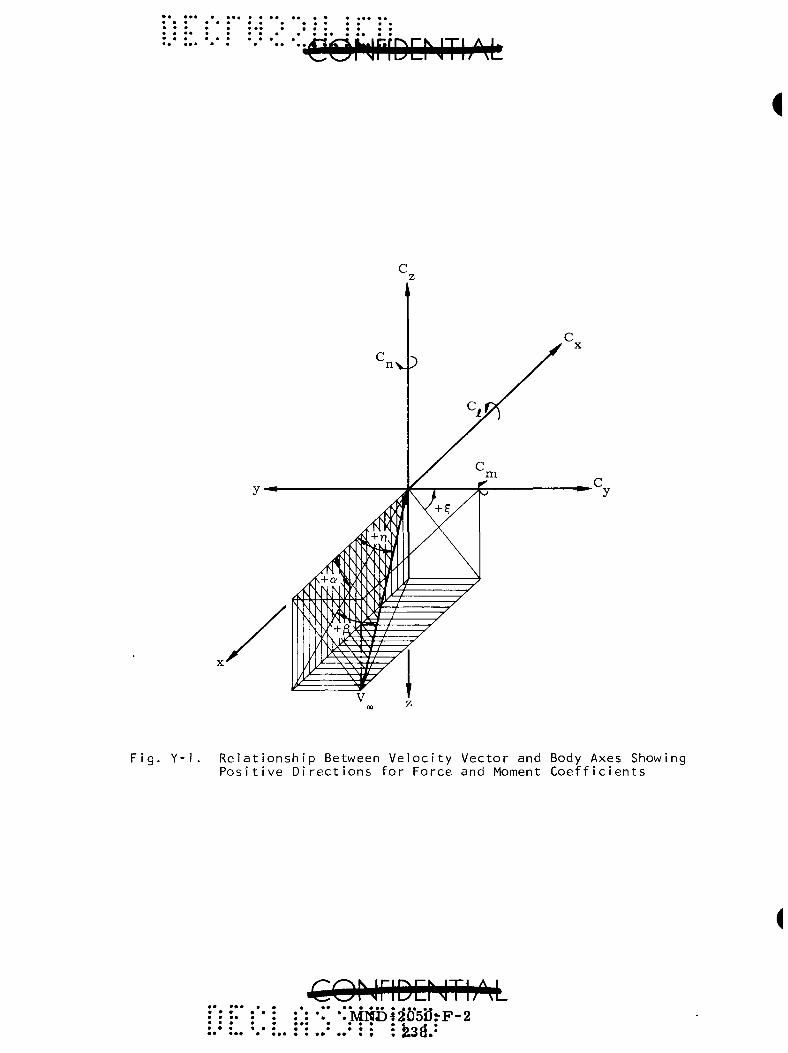
• • • • • « • • • • • •
••• •••OONr'IDDJTIjMi
i
F i g . Y - 1 . R e l a t i o n s h i p Between V e l o c i t y V e c t o r and Body Axes Showing P o s i t i v e D i r e c t i o n s f o r Fo rce and Moment C o e f f i c i e n t s
.MNDi2&5lJrF-2
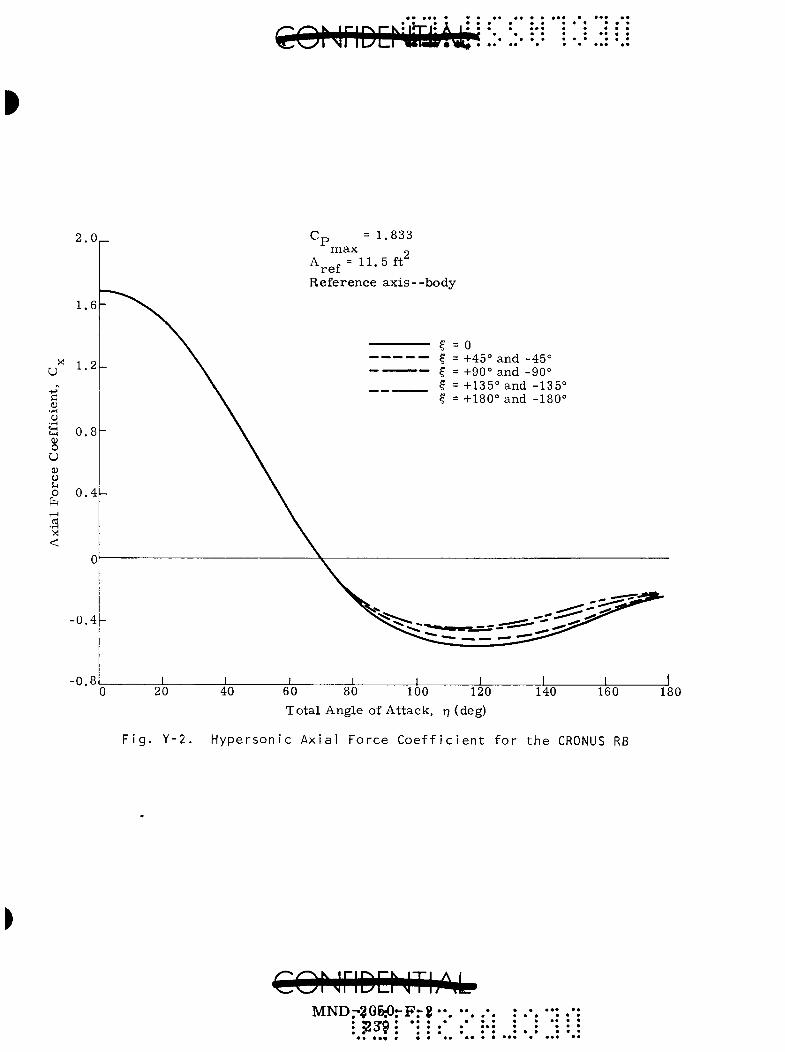
• • « • • • •
1.833
A „ = 11.5 ft^ ref Reference ax i s - -body
? I = -1-45° and -45° ? = -1-90° and -90° I = -1-135° and -135° ? = -1-180° and -180°
60 80 100 120
Total Angle of Attack, rj (deg)
Fig. Y-2. Hypersonic Axial Force Coefficient for the CRONUS RB
180
CONriDDJTh^ MNDr3O5:0rFr?-. ••
: ?3r$ : •: : :* f
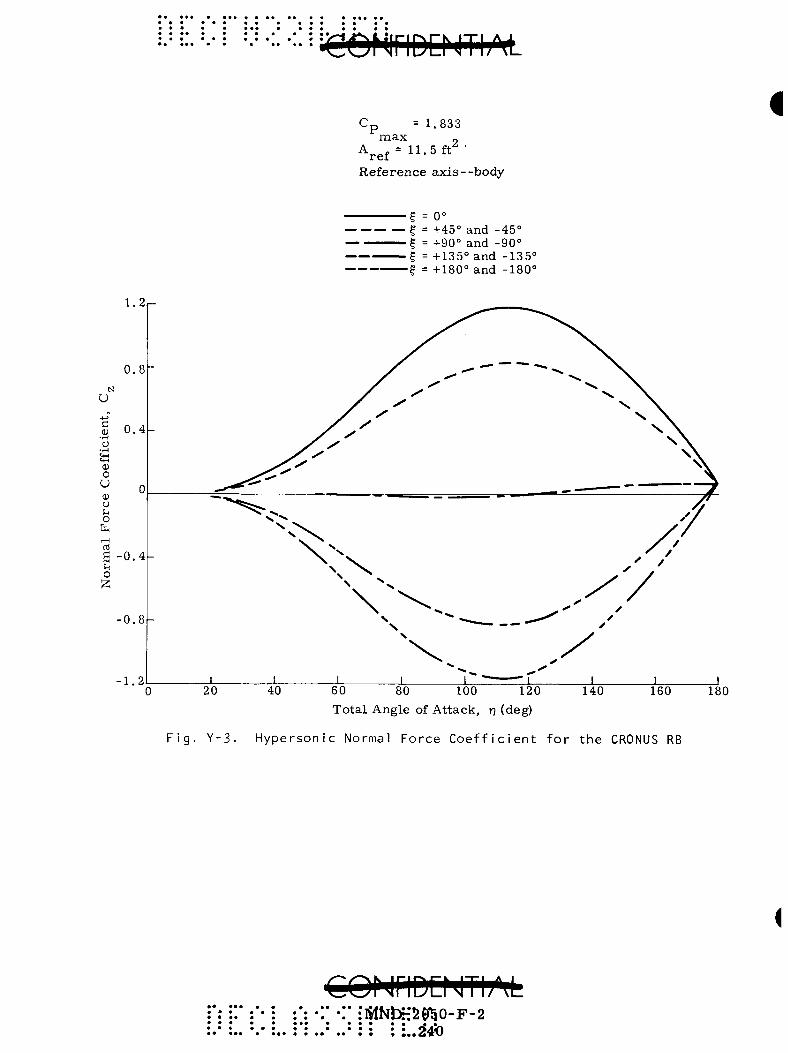
No
rma
l F
orc
e C
oef
fici
ent,
C
^
: .•:
<t}
^ i}
'"
xy f
;
• • •
•T«
I •
• I •
^
S- r
I
m
-\
1/1
o D
3 n O
o
m
-h
-h
O
fD
3 O o
73
CD
I I
(ATI
cm
t/v»
</r
{ <
/ri
II
II
II
II
n
+
+
+
+
O
(—»(—
» CD
Jii.
o
00 0
0 o
on
O
on
o
o
P
P
3
3 C
L C
L
t I
p
p
CL
a I
I C
D t
t^
h-»
I-*
o
on
00 0
0 o
o
o
on
33
(t)
Q
•1
0)
B
O
(D
P
l«!
CD
I cr
o <^
O
•Tj
II f"
X
t-
. II CO
00
o
o
5: 7
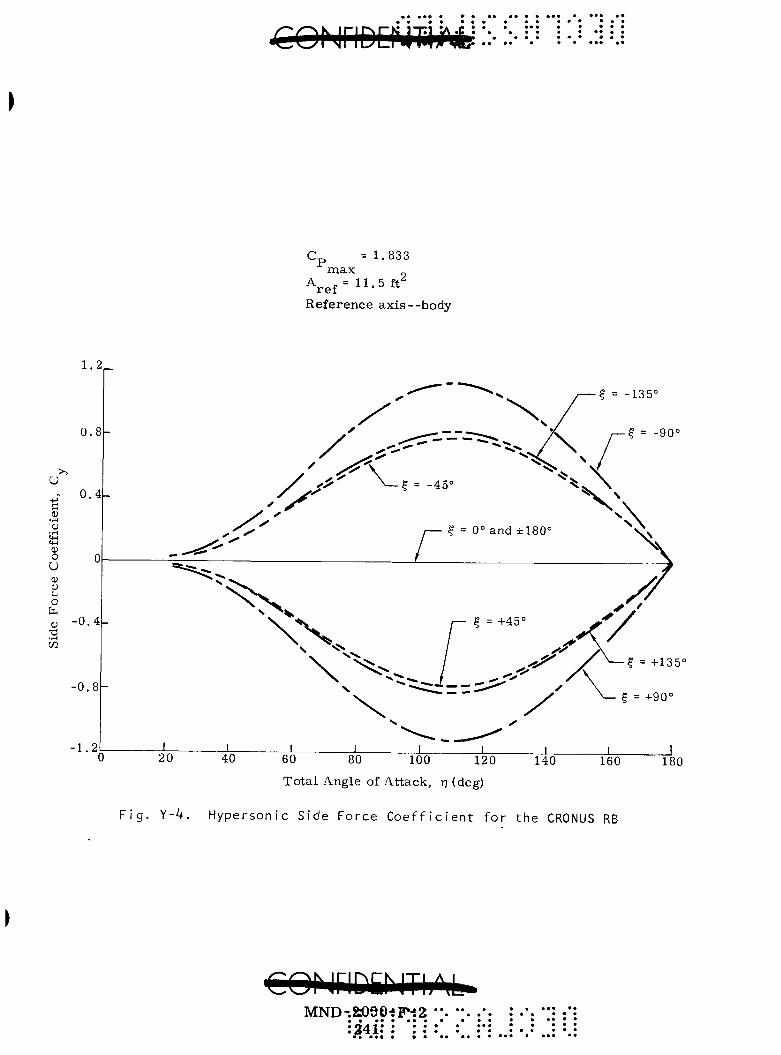
•• « • • • • • •
= 1.833
1.2_
max A^^^= 11.5 ft-
Reference ax i s - -body
20 40 60 80 100 120 140
Tota l Angle of Attack, -q (deg) 160 180
Fig. Y-4. Hypersonic Side Force Coefficient for the CRONUS RB
MND-.aOSO-sF'-SZ •*. •*. .* • • •• • :24i: :
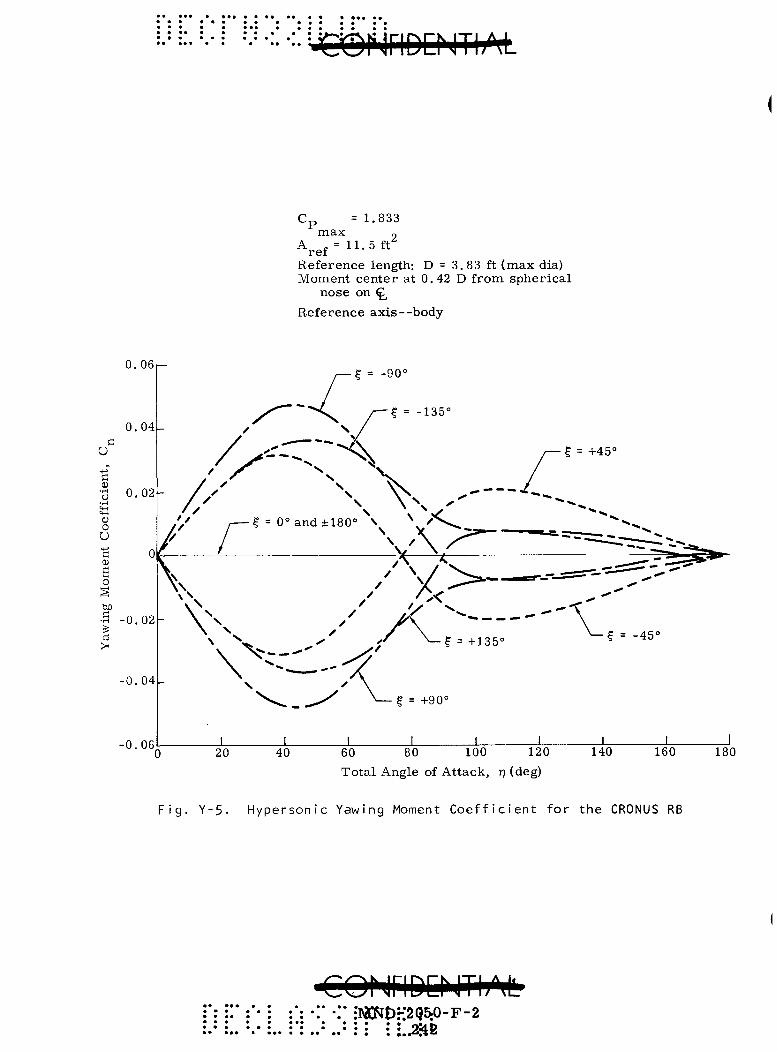
I
1.833 max
A „ = 11. 5 ft ref Reference length: D = 3. 83 ft (max dia) Moment cen te r at 0.42 D from spher ica l
nose on ^
Reference axis—body
0.06
-0.06 60 80 100 120 Total Angle of Attack, r] (deg)
180
Fig. Y-5. Hypersonic Yawing Moment Coefficient for the CRONUS RB
COMriDENTIjMl ]\2CfJt)r:2(J5tO-F-2

CONriDENtiiM •:••:•=:'
1.833 max
A^^ j= 11.5 ft-
Reference length: D = 3. 83 ft (max dia) Moment cen te r at 0.42 D from sphe r i ca l
nose on ^
Reference ax i s - -body
U
c
o U c
0.06
0.04-
0.02-
1 = 0° ? = +45° and -45° ? = -1-90° and -90° f = -1-135° and -135° I = +180° and -180°
-0.02
£ - 0 . 0 4 -
- 0 . 0 6 -
-0.08 60 80 100 120
Total Angle of Attack, n (deg)
F i g . Y - 6 . H y p e r s o n i c P i t c h i n g Moment C o e f f i c i e n t f o r t h e CRONUS RB
MND-:20S0tFf 2 •'. : l 4 S t :
• ••
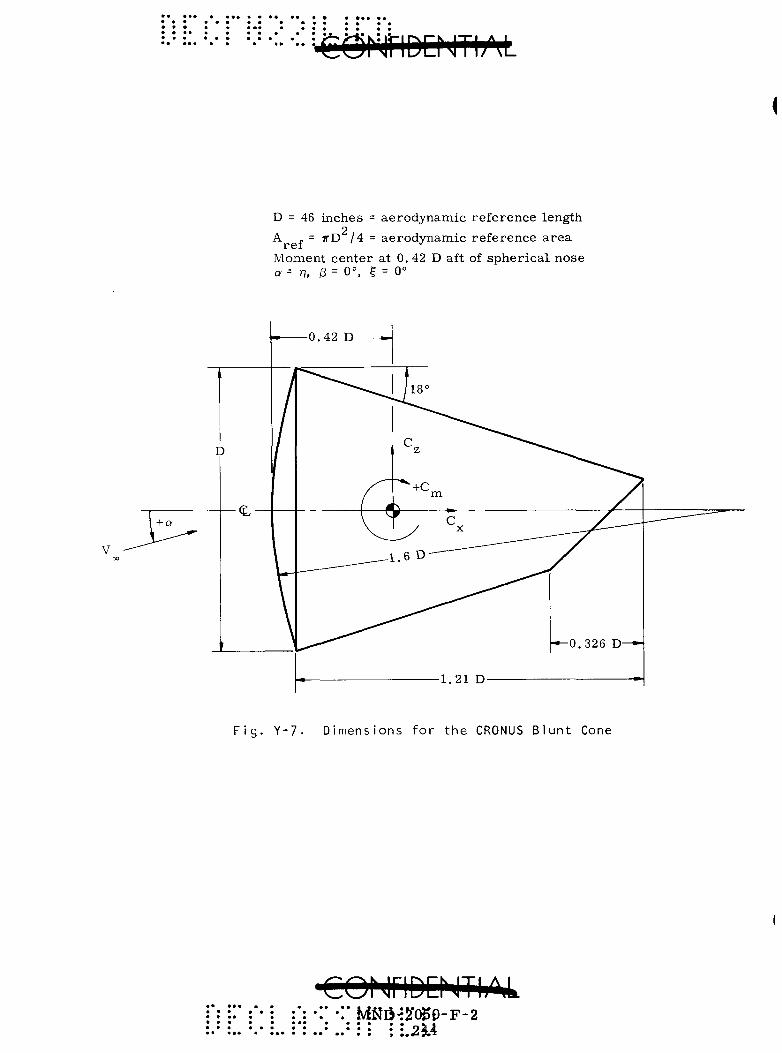
(
D = 46 inches = aerodynamic re fe rence length 2
A . = ITD /4 = aerodynamic re fe rence a r ea
Moment center at 0.42 D aft of sphe r i ca l nose a = r?, /3 = 0°, ? = 0°
F i g . Y - 7 . D imens ions f o r t h e CRONUS B l u n t Cone
': •:• •:• M«lS-:S'«P-F-2

These coefficients were used in an analog computer program to determine the dynamics of the RTG/RB for various initial angular rates and displacement along three different reentry trajectories. This will be discussed in Chapter VII.
B. PRESSURE DISTRIBUTION
The pressure distributions were approximated from the experimental data presented in Ref. Y-1 . Figure Y-8 presents the dimensions of the reference body, Gemini reentry vehicle, used in this reference as a function of maximum body diameter. From a comparison of Fig. Y-7 with Fig. Y-8, it can be seen that these two vehicles are geometrically similar over the blunt nose and the front portion of the conical afterbody. Figure Y-9 presents the pressure orifice locations as a function of meridian angle ((j)). 4" ~ 180° was defined as the windward meridian and (j) = 0° was the leeward meridian. The pressure distributions in terms of Cp for angles of attack from 0 to 40 degrees are presented in Figs.
Y-10 through Y-13 as a function of the nondimensional surface distance for 4> = 0, 90, 135 arid 180 degrees, respectively. This nondimensional surface distance ( s / s ' ) is defined in Fig. Y-9. In Fig. Y-10, the pressure coefficient (Cp = -0.05) over the conical afterbody at cj) = 0° was independent of angle of attack over the range tested. The same was approximately true for cf) = 90° meridian (Fig. Y-11). In Figs. Y-12 and Y-13 (4) = 135 and 180 degrees, respectively), the pressure coefficient is increasing over the aft portion of the conical afterbody. This was due to the cylindrical portion of the Gemini vehicle just aft of its conical afterbody. This phenomenon would not be present on the RTG/RB because of the absence of this cylindrical section. Therefore, the RTG/ RB Cp curve could be drawn ignoring these points.
REFERENCES
Y - 1 . Pr ice, E. A. , J r . , Stallings, R. L . , J r . and Howard, P . W., "Pressure and Heat-Transfer Distributions of 0.1 Scale Gemini Exit and Re-entry Models at Mach Numbers of 3. 51 and 4.44," NASA TM X-1149, September 1965. CONFIDENTIAL.
COMriDQITIjM MNps-2p90-;F5-2r. •;. .". : ••. *;: :*:
• • O^C^ • • • « • • • • • • • •
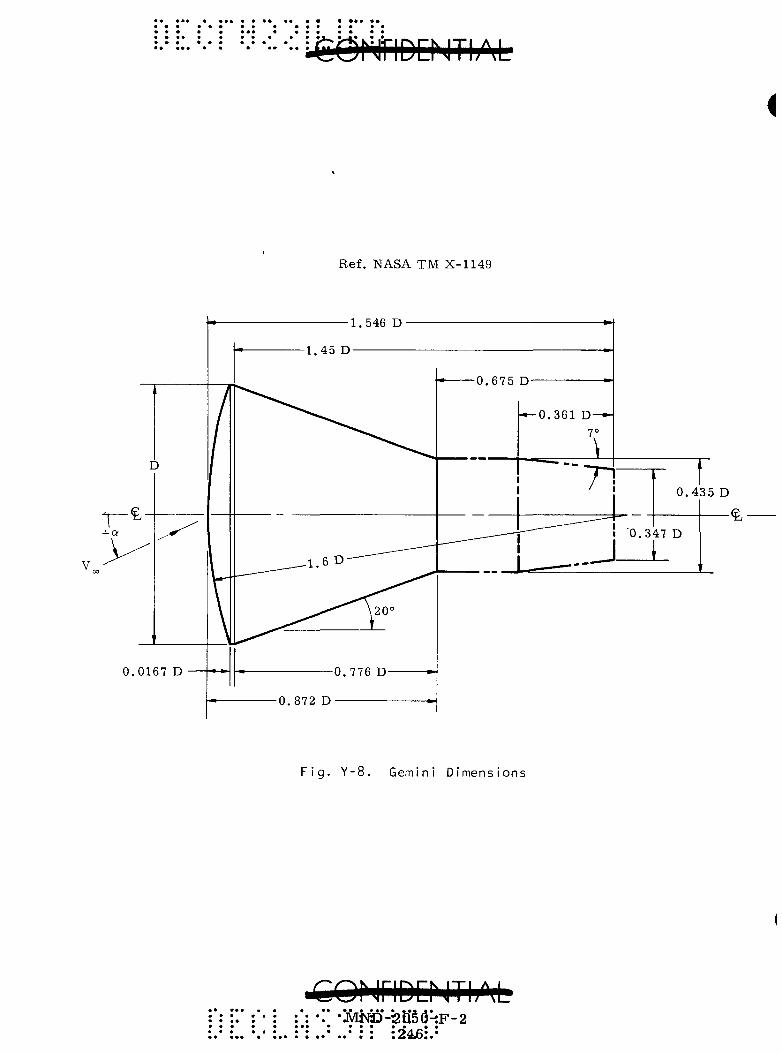
• ••• • ^Qh'jriDPJTbM
Ref. NASA TM X-1149
i
0.0167 D
Fig. Y-8. Gemini Dimensions
:QhjriDDilTIAL •. •JVINO-2tl5(3-:F-2
:24Jo:.'

• » •«« * • » ••
C0hJriDCN1i|l'<i.: ::• ::•
Ref. NASA TM X-1149
<\> = 0 °
— 90°J-'—90°
180 =
F i g . Y -9 . Pressure O r i f i c e Locat ions on Gemini Spacecraf t in Reentry O r i e n t a t i o n
MND-^p5<J-J^-2 • • • • • • • • • * • • • • • • • • • • • • • • • • • • * • • ••• • * • •
• « «a • • • • •» • • • • •
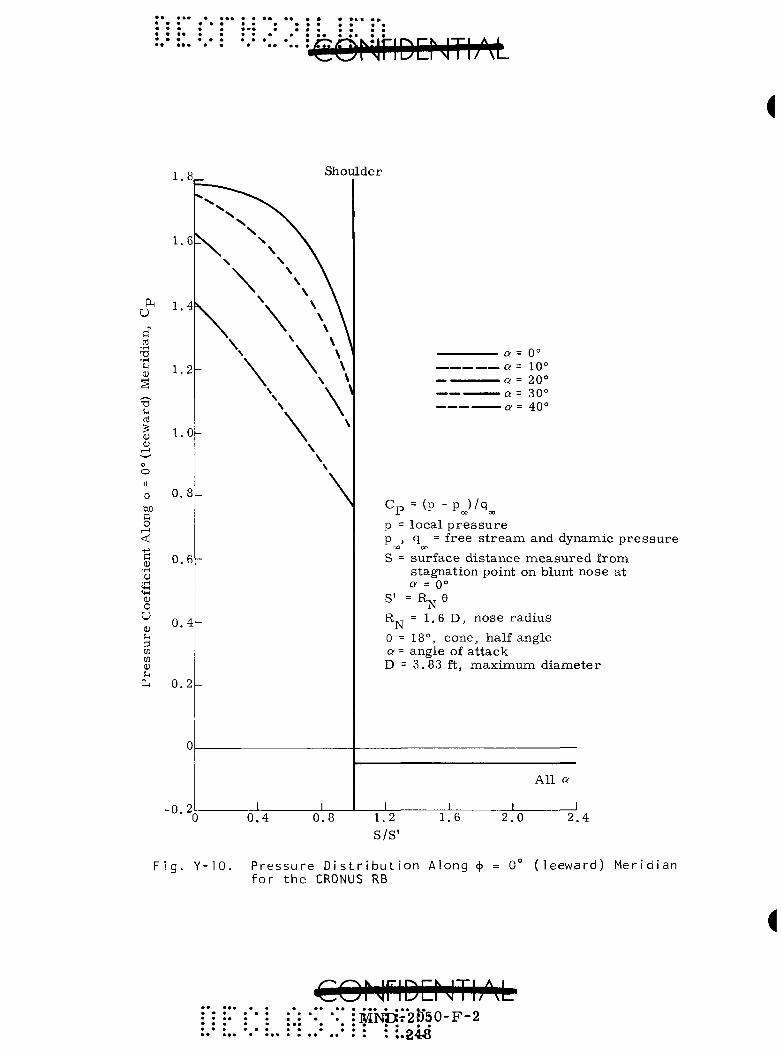
u
ai
U
0)
-e-c o
0) o u (D S-i
CD cn D ti
(In
Shoulder
0.2
-0 .2
a = 0° a = 10°
•a= 20° •a= 30° •0-= 40°
Cp = ( p - p J / q „
p = loca l p r e s s u r e p , q = free s t r e a m and dynamic p r e s s u r e
00 00
S = surface dis tance m e a s u r e d from stagnation point on blunt nose at 0 = 0°
s' = RN ® R. 'N 1.6 D, nose rad ius
e = 18°, cone, half angle a = angle of a t tack D = 3.83 ft, max imum d iame te r
All a
0.4 0.8 _L 1.2 S/S'
1.6 2.0 2.4
Fig. Y-10. Pressure Distribution Along for the CRONUS RB
<}) = 0° (leeward) Meridian
€ONriDDilTljM MNii7*2b"50-F-2 • • • • • : : :.24S
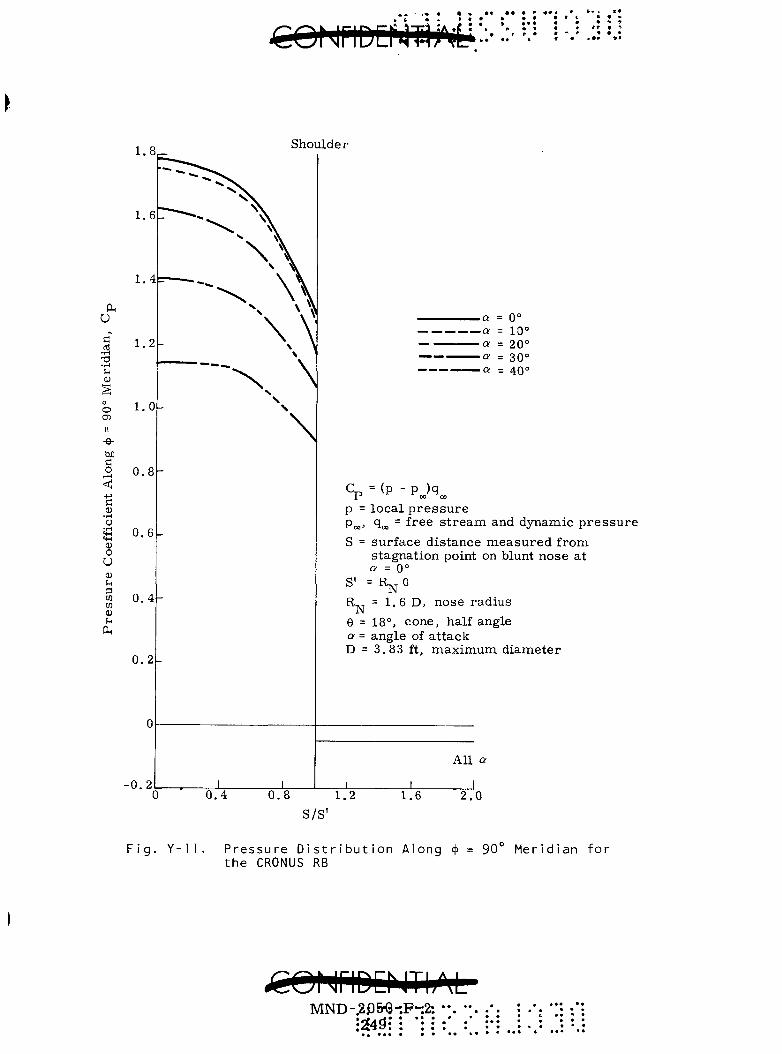
Shoulder
U
X)
0)
o CD
fl o
fl
1.6-
1.4
1.2
1.0
0 . 8
o S 0. 0) O
u 0)
CD CD 4)
OH
0 . 4
0 . 2
• 0 . 2
.a = 0°
.a = 10° •a - 20° •a = 30° •a = 40°
Cp = (p - p )q ir 00 CO
p = loca l p r e s s u r e Poo' 'loo " free s t r e a m and dynamic p r e s s u r e 5 = surface dis tance m e a s u r e d from
stagnation point on blunt nose at a = 0°
S' = R^ 9
R-j = 1.6 D, nose radius
6 = 18°, cone, half angle a = angle of a t tack D = 3.83 ft, max imum diameter
All a
0.4 0.8 1.2
S/S'
1.6 2.0
Fig. Y-11. Pressure Distribution Along 4" = 90° Meridian for the CRONUS RB
MND-.2p5rQ-:F-2;
* • • « • •
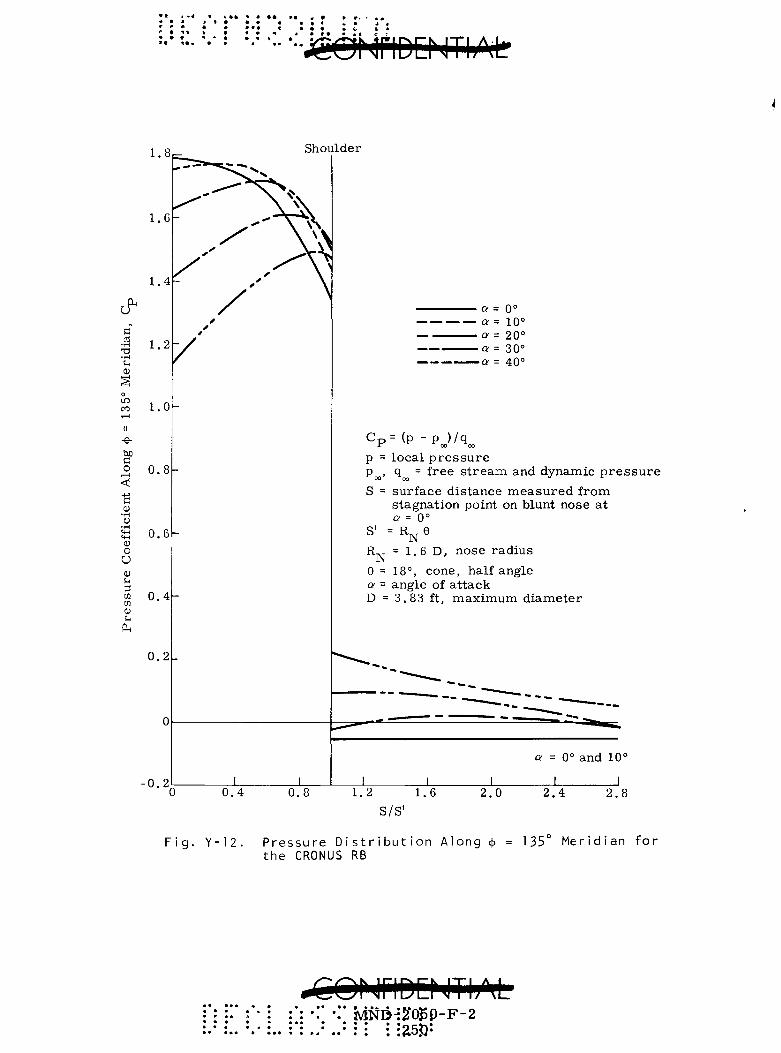
&
a
in CO . - ) II
-e-
fl o
0) o U cu 3 to m
S-i
0,
1.8c-
1.6
1.4
'V 1.0
0.8
0.6
0.4
0.2
Shoulder
- 0 . 2 0 0.4 0.8
a 0°
a = 20° a = 30° Q = 40°
C p = (p - p ) /q -IT 00 00
p = local p r e s s u r e p , q = free s t r e a m and dynamic p r e s s u r e
00 00 tf t.
S = surface dis tance m e a s u r e d from stagnation point on blunt nose at 0 = 0 °
S' = R-^Q R^ = 1.6 D, nose radius 9 = 18°, cone, half angle a = angle of a t tack D = 3.83 ft, max imum d iamete r
a = 0° and 10°
_L 1.2 1.6
S/S' 2.0 2.4 2.8
Fig. Y-12. Pressure Distribution Along <^ the CRONUS RB
135° Meridian for
ONriDENThM •:' iv!ND-:2'(^p-F-2
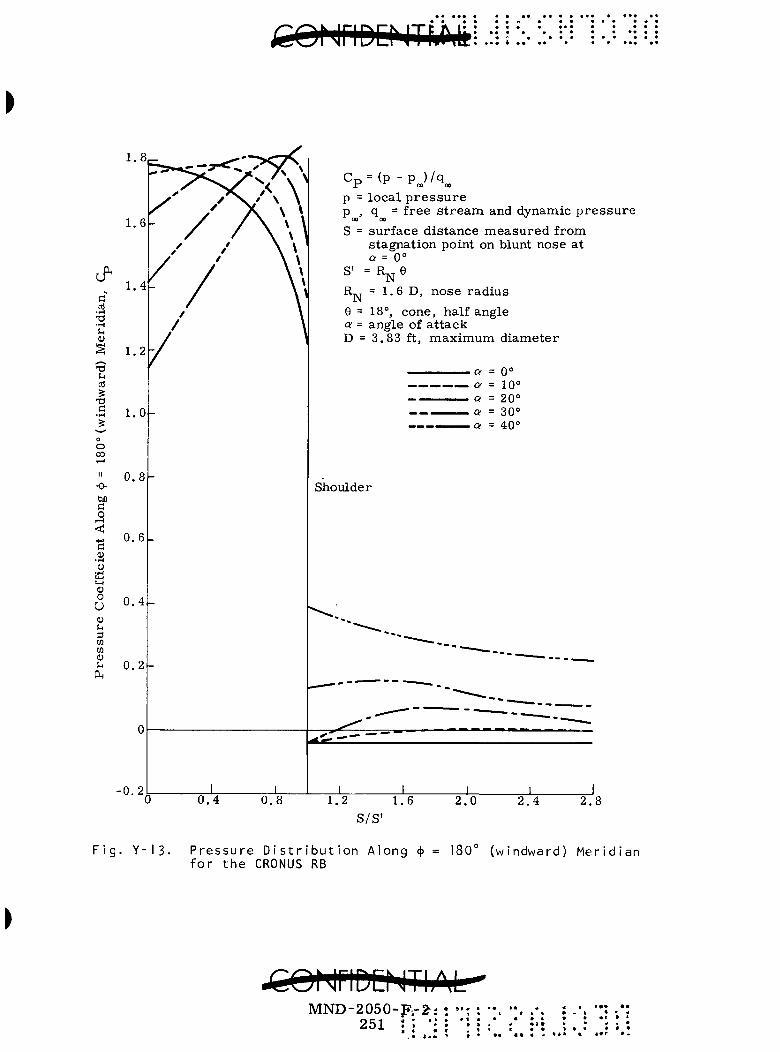
&
•v u a
I
o 00
rH
II
-9-a o
a
o U <p ; 4
3 m M 0)
1.8
1.6
1.4
§ 1.2
1.0
0.8-
0 . 6 -
0 . 4 -
0 . 2 -
•0.2 0 .4
C p = ( p - p J / q „ p =local pressure p , q = free stream and dynamic pressure
00 00
S = surface distance measured from stagnation point on blunt nose at 0 = 0°
S' = R ^ e R^ = 1.6 D, nose radius 9 = 18°, cone, half angle a = angle of attack D = 3.83 ft, maximum diameter
Shoulder
0.8 1.2 1.6 2.0 2 .4 2 .8
S/S'
F i g . Y - 1 3 . P r e s s u r e D i s t r i b u t i o n A l o n g <\> f o r t h e CRONUS RB
= 180° ( w i n d w a r d ) M e r i d i a n
MND-2050-P;-^: 251 J ; ":
• 3» .
• ' • a «
t • «
> • •
« 4
• •
« «) •
f • • • •

a o
i o
N3
cn
o
to
'r

APPENDIX Z
LAUNCH PAD FIREBALL DATA
A. FIREBALL GROWTH
During a fireball growth period, the propellants intermix rapidly as the fireball forms a hemispheric dome. After the fireball reaches its maximum diameter (nominally between two and three seconds after ignition), it s tarts to r ise in the typical mushroom shape pattern. Luminosity of the flames within the fireball lasts for about five or six seconds. Random vapor explosions have been known to occur in the wake of the rising fireball, creating additional luminous flames. Compared to a powder charge detonation, the deflagration phenomenon is relatively slow. Particle velocities (propellants, fragments or flame gases) can reach velocities up to 8 to 900 fps during the first 0.005 second of the explosion.
Figure Z-1 illustrates sequentially the growth of the half scale Titan II destruct test fireball which reached a maximum diameter of about 140 feet. Ground fires which are quite long in duration are less intense than the fireball and can be cooled rapidly by launch pad flood water systems. Figure Z-2 shows fireball diameter as a function of time from destruct for the Titan 11, Tests 1 and 2. The total propellant inventories for the two tests were 15, 800 and 32, 700 pounds, respectively.
Figures Z-3 and Z-4 (Ref. Z-1) present fireball duration and diameter as a function of total propellant weight for naany types of fuel used in launch vehicles. Approximately 6 5 to 70 data points have been obtained for each curve, either from designed tests or actual launch pad accidents. The results of the half scale Titan II tests have also been plotted on these curves and agree quite well.
The following empirical expressions can be used to predict the two fireball characteristics within the obvious band of e r ror .
D = 9.3W^^^ and (Z-1)
T = 0 .23W 1/3 (Z-2)
where D = diameter in feet, T = time in seconds, and W = total propellant weight in pounds.
Unfortunately, very little data are available for in-flight explosions other than photographic documentation, which in itself is not always of good quality. However, a few generalizations can be made based on the photographic analysis. The size of the in-flight fireball is smaller than
MND-2050-F-2 253 .'
• « • • • » •• > •
• • • • • • • • •
• • • • •
• • • • • • ••
I a
• • • • • < • <
• • • • • '

Time zero U-300 ft--]
142 ft—U—H
mm^^^^ ^ ^ I B
"0.15 second
1.75 seconds
0.75 second
2.75 seconds
^r'* ^«
(From Ref. Z-1)
F i g . Z - 1 . T i t a n I I H a l f - S c a l e Dest ruc t Test
HOUnDLHlliM MlffD-205G-F-2
: : 254 • . r * • .
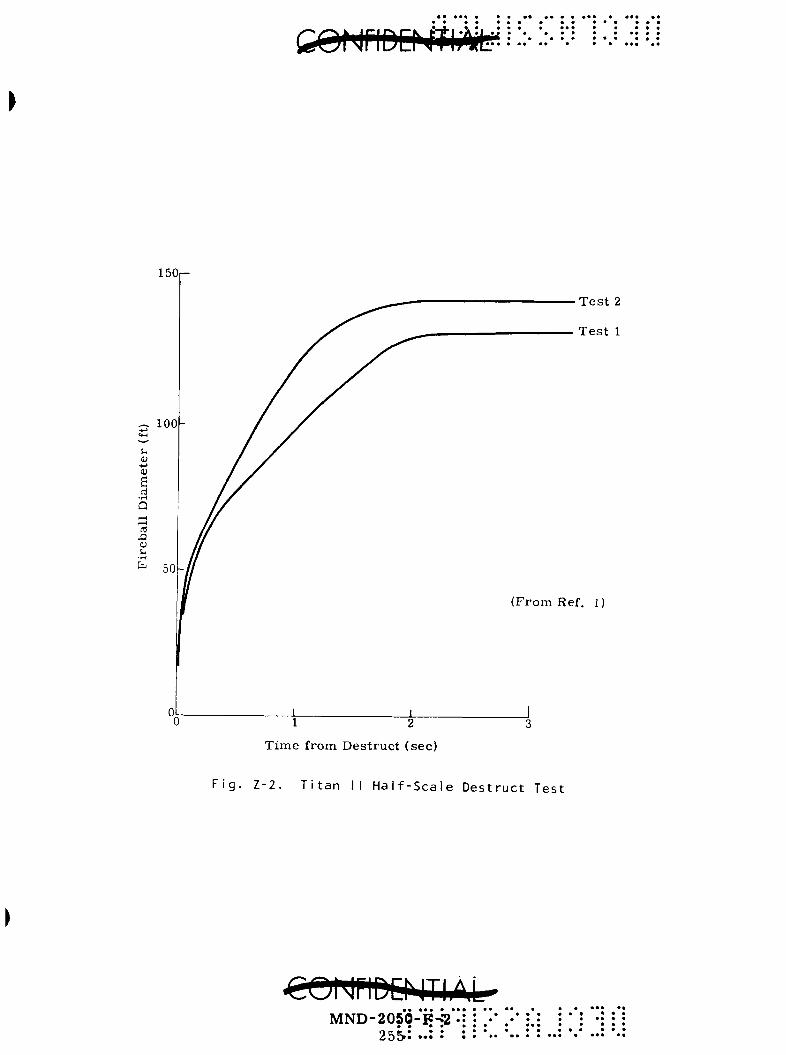
• •• • •
150
^ 100-
s
0!
(From Ref. 1)
1 2 Time from Destruct (sec)
F i g . Z - 2 . T i t a n I I H a l f - S c a l e D e s t r u c t Tes t
«e«ft%N*IAt-MND-2050-F-*"2 •
• • • • 25&* ••• •

(
o 0) tn
C
o •rH -M ni S-i
d Q
as
O
1 0 0 ^
1 0 -
1 -
fc 0. 1
0 .01
D 65 data points in total curve
R P - l / L o x LH2/L0X
R P - l / L H g / L o x
UDMH/NgH^/NgO^
LH, in a i r
Titan II hal f -scale tes t (approx!
Abs t rac ted from NASA-S-65-6724
TNT equivalence (real is t ic)
L o x / R P - 1 = 25 wt % TNT (Ref. Z-2) UDMH/NgH^/NgO^ = 10 wt % TNT (Ref. Z-2)
J_.
10 10 10 10 10'
Total Propel lant Weight (lb)
Fig. Z-3- Fireball Duration
T = 0.23 X w 1/3
10 10
• • • •
CONriDIINThM MND-2050-F-2
I 256
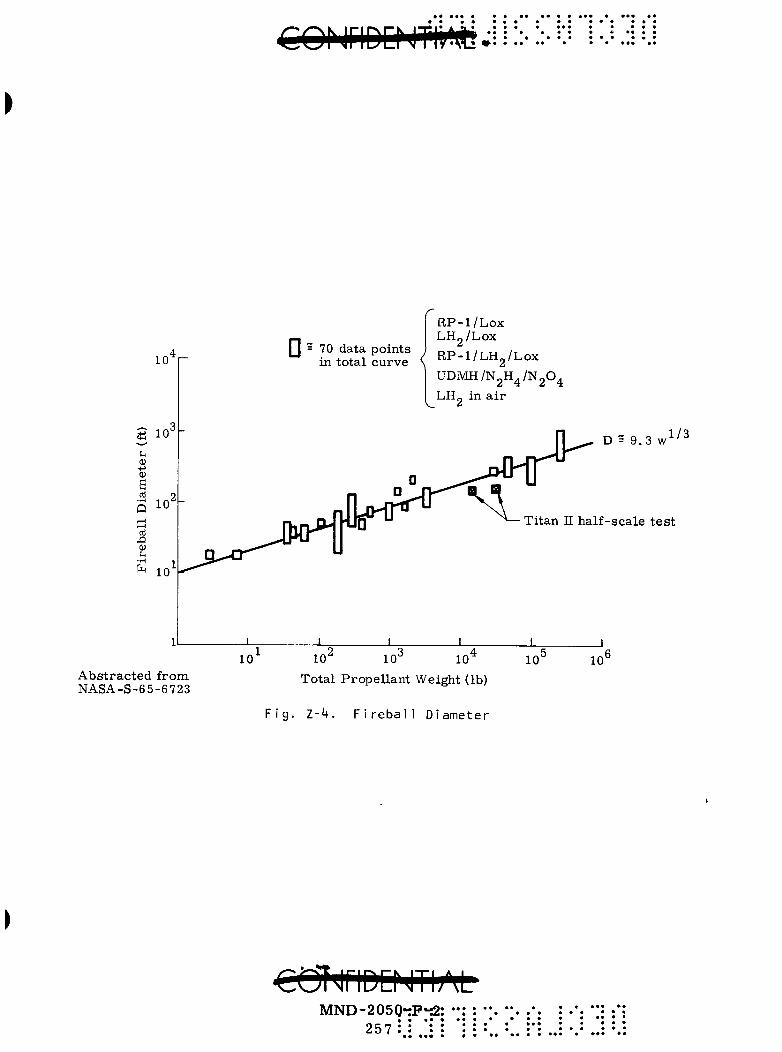
Abstracted from NASA-S-65-6723
IJ = 70 data points
RP-l /Lox LHg/Lox
10
i\j aata pomts ; „ „ i /T u /T in total curve < RP' l /LHg/Lox
UDMH/NgH^/NgO^ LH„ in air
D = 9.3 w 1/3
Titan 11 half-scale test
10 10 10 Total Propellant Weight (lb)
F i g . I-k. F i r e b a l l D i a m e t e r
10' 10
COljriDOJTbM MND-2050*;P'i2
257 : :
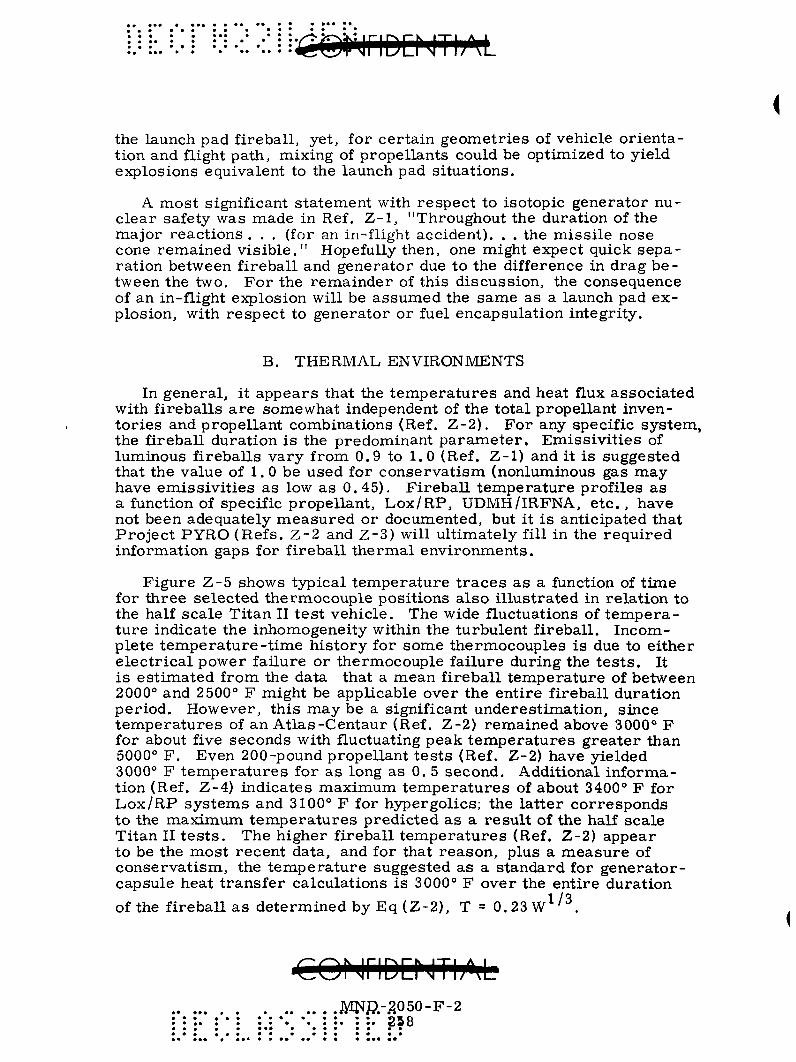
the launch pad fireball, yet, for certain geometries of vehicle orientation and flight path, mixing of propellants could be optimized to yield explosions equivalent to the launch pad situations.
A most significant statement with respect to isotopic generator nuclear safety was made in Ref. Z-1 , "Throughout the duration of the major reactions . . . (for an in-flight accident). . . the missile nose cone remained visible." Hopefully then, one might expect quick separation between fireball and generator due to the difference in drag between the two. For the remainder of this discussion, the consequence of an in-flight explosion will be assumed the same as a launch pad explosion, with respect to generator or fuel encapsulation integrity.
B. THERMAL ENVIRONMENTS
In general, it appears that the temperatures and heat flux associated with fireballs are somewhat independent of the total propellant inventories and propellant combinations (Ref. Z-2). For any specific system, the fireball duration is the predominant parameter. Emissivities of luminous fireballs vary from 0.9 to 1.0 (Ref. Z-1) and it is suggested that the value of 1. 0 be used for conservatism (nonluminous gas may have emissivities as low as 0.45). Fireball temperature profiles as a function of specific propellant, Lox/RP, UDMH/IRFNA, e tc . , have not been adequately measured or documented, but it is anticipated that Project PYRO (Refs. Z-2 and Z-3) will ultimately fill in the required information gaps for fireball thermal environments.
Figure Z-5 shows tj^pical tenaperature t races as a function of time for three selected thermocouple positions also illustrated in relation to the half scale Titan II test vehicle. The wide fluctuations of temperature indicate the inhomogeneity within the turbulent fireball. Incomplete temperature-time history for sonae thermocouples is due to either electrical power failure or thermocouple failure during the tes ts . It is estimated from the data that a mean fireball temperature of between 2000° and 2500° F might be applicable over the entire fireball duration period. However, this may be a significant underestimation, since temperatures of an Atlas-Centaur (Ref. Z-2) remained above 3000° F for about five seconds with fluctuating peak temperatures greater than 5000° F . Even 200-pound propellant tests (Ref. Z-2) have yielded 3000° F temperatures for as long as 0. 5 second. Additional information (Ref. Z-4) indicates maximum temperatures of about 3400° F for Lox/RP systems and 3100° F for hypergolics; the latter corresponds to the maximum temperatures predicted as a result of the half scale Titan II t es t s . The higher fireball temperatures (Ref. Z-2) appear to be the most recent data, and for that reason, plus a measure of conservatism, the temperature suggested as a standard for generator-capsule heat transfer calculations is 3000° F over the entire duration
of the fireball as determined by Eq (Z-2), T = 0.23W^'^.
CONriDEMTIAL M^fR-.?050-F-2
: •. •. : :. : :. 258
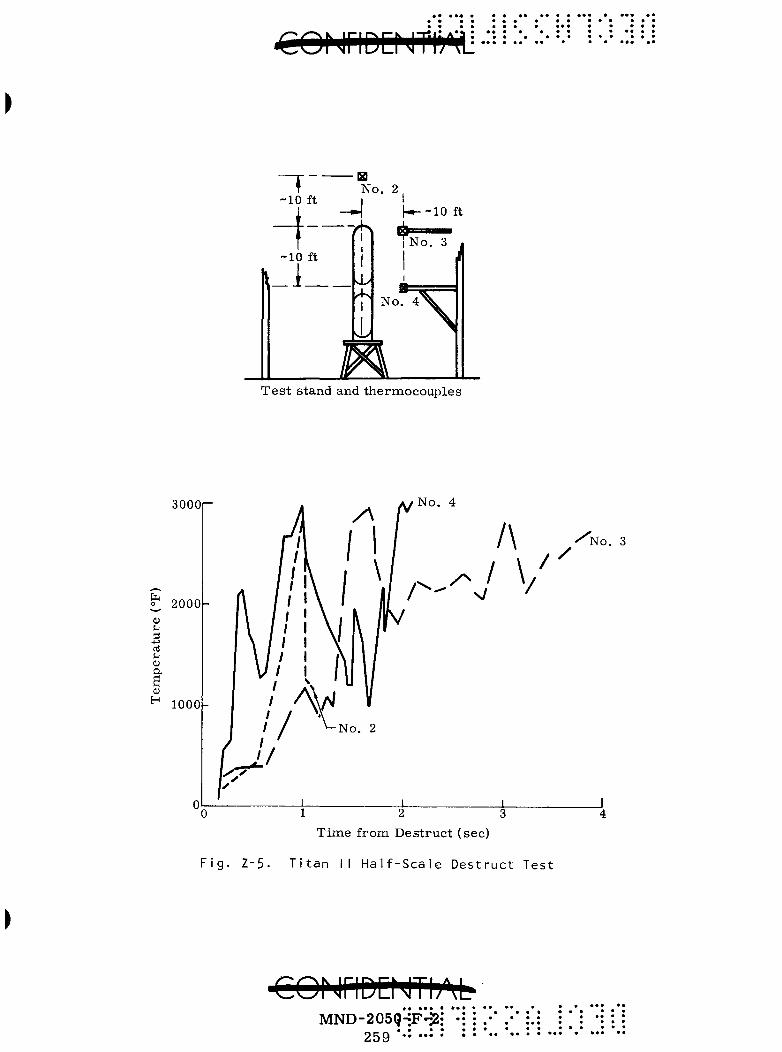
)
~ 1 ' -10 ft
El No. 2
—•-I [-i-~10 ft
I No. 3 •10 ft
_i_. il
No. 4
T e s t stand and thermocouples
SOOOt- No. 4
2000-
u +-» oi
« a
a 0)
H 1000
No. 3
1 2 3 T ime from Des t ruc t (sec)
F i g . Z-5. T i t a n I I H a l f - S c a l e Dest ruc t Test
MND-205(J-:F'J2 259 ''• •••
• • • • a * • • • • • • • • • • • • • • • • • « * • • • • • « • • • • • • • • • « • • • « • • * • « • • • • • • » • • • . • •« •• • • ••• • ••• •
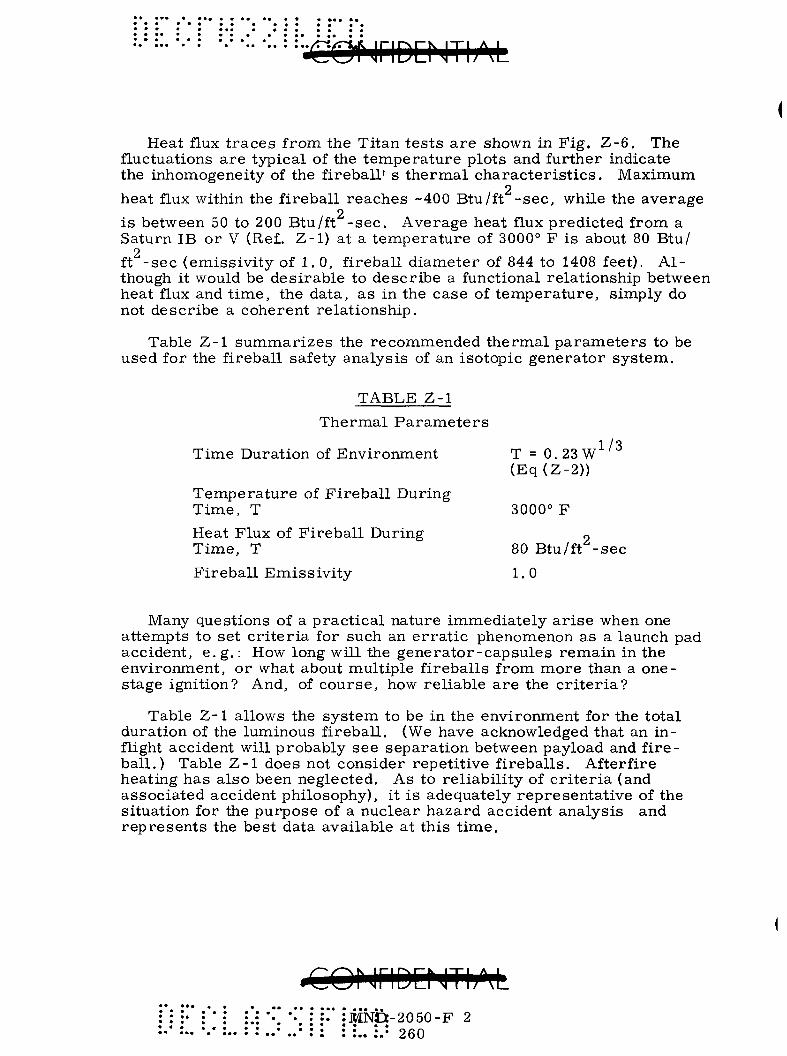
Heat flux t races from the Titan tests are shown in Fig. Z-6. The fluctuations are typical of the tenaperature plots and further indicate the inhomogeneity of the fireball' s thermal characterist ics. Maximum
2 heat flux within the fireball reaches -400 Btu/ft -sec, while the average
2 is between 50 to 200 Btu/ft -sec. Average heat flux predicted from a Saturn IB or V (Re£. Z-1) at a temperature of 3000° F is about 80 Btu/ ft -sec (emissivity of 1. 0, fireball diameter of 844 to 1408 feet). Although it would be desirable to describe a functional relationship between heat flux and time, the data, as in the case of temperature, simply do not describe a coherent relationship.
Table Z-1 sumraarizes the recommended thermal parameters to be used for the fireball safety analysis of an isotopic generator system.
TABLE Z-1
Thermal Parameters
Time Duration of Environment
Temperature of Fireball During Time, T Heat Flux of Fireball During Time, T
Fireball Emissivity
Many questions of a practical nature immediately arise when one attempts to set criteria for such an errat ic phenomenon as a launch pad accident, e .g. : How long will the generator-capsules remain in the environment, or what about multiple fireballs from more than a one-stage ignition? And, of course, how reliable are the cri teria?
Table Z- 1 allows the system to be in the environment for the total duration of the luminous fireball. (We have acknowledged that an inflight accident will probably see separation between payload and fireball.) Table Z-1 does not consider repetitive fireballs. Afterfire heating has also been neglected. As to reliability of cri teria (and associated accident philosophy), it is adequately representative of the situation for the purpose of a nuclear hazard accident analysis and represents the best data available at this time.
I
• COrjriDCNTIjM *.: '•! '•. : J" iMNCt-2050-F 2 : ..• ..• : : : :.. ;,• 260
1/3 T = 0.23W ' (Eq(Z-2))
3000° F
80 Btu/ft^-sec 1.0

To 380
2: O
I
to ^5
^ 01 o
* • • C M *
: M*.
300 | -
I • •••
• • • • • •
Time from Destruct (sec)
Z - 6 . T i t a n I I H a l f - S c a l e D e s t r u c t Tes t
i C. SHOCK OVERPRESSURE AND IMPACT
At p resen t , the re a r e insufficient data and analyses to adequately p r e dict o v e r p r e s s u r e s generated during a fuel explosion. F igure Z-7 r e p r e s e n t s some of the m o r e reasonable data (Ref. Z-5) obtained during var ious o v e r p r e s s u r e t e s t s . Although it appears that a major c o r r e l a tion between the o v e r p r e s s u r e and the fuel contact a r ea ex i s t s , fuel ignition delays , fuel tank geometry , fuel mixing and total fuel inventory can yield la rge differences in the o v e r p r e s s u r e s generated by any given vehic le . However, one conclusion is obvious; o v e r p r e s s u r e s of 100 ps i o r g r e a t e r have been measu red and can be expected, but inherent ly do not offer a se r ious r e s t r i c t ion to the design of an intact fuel encapsulation. Only when these o v e r p r e s s u r e s resu l t in high fragmentat ion velocit ies i s the integr i ty of the fuel encapsulation jeopardized.
Fragmenta t ion veloci t ies can init ial ly reach 800 fps, although it is apparent (Ref. Z-2) that veloci t ies in the region of 300 to 400 fps a r e m o r e rea l i s t i c for the pad accident as shown in Fig . Z - 8 . The max i mum recorded debr is t r a jec to ry t ime was measu red at 48. 6 seconds , with an average t ime of 0. 2 to 0. 25 second spent within the f i rebal l . In-flight fragment veloci t ies a re about the same with a poss ible max i mum of 500 fps. Contras t this to the expanded propellant vapor velocity of around 2000 fps.
F igure Z-9 (Ref. Z-2) i l l u s t r a t e s the radia l impact dis t r ibut ion as a function of s ize for an actual accident . The ex t remely la rge fragments at g rea t d is tances from the source a r e somewhat mis leading because equipment pods were located in the inamediate vicinity of the point of ignition. However, the figure does i l lus t ra te the potential for debr i s s c a t t e r . It is quite conceivable that 1- to 10-pound capsules could eas i ly be projected thousands of feet at initial velocit ies of 400+ fps, thus s e a r c h a r e a s for fuel capsules can be quite large because of the geometry between payload and point of ignition. The probabil i ty for such a situation is low.
REFERENCES
Z - 1 . High, R. W. and F le tche r , R. F . , "Es t imat ion of F i r eba l l from Saturn Vehicles Following Fa i lu re on Launch P a d , " NASA P r o gram,Apollo Working P a p e r No. 1181, Houston, Texas , August 1965.
Z - 2 . Le t t e r from V. E. Blake, Manager , Aerospace Nuclear Safety, Sandia, to A. W. Finel ly, NASA-Goddard; entitled "Launch Abort Haza rds A s s e s s m e n t for SNAP 19/Nimbus A s s e m b l y , " F e b r u a r y 1966.
•• . " .'• : :•• : MND-2050-F-2 : ..' ' '•' •• : : : 262
1 0 0 ^
a <u u
i 10 u a (1)
/
A A
O
A
10 feet from source
A
d / ^
O
/
o
/
/ °X
O O • A
O A
40 feet from source
O
/
O OA o
• /
/
O Hypergol ics A L o x / R P
O
o _L _L J 0 10 20 30 40 50 60
2 Fuel Contact A r e a (ft )
F i g . Z-7. Overpressures as a Funct ion of Fuel Contact Area
COMriDDJThM MND-205QHli'H2
263: : :
, , . • •• « • * • • ••• • « • • • • * « • • * * « • • • • • • • • • ? ! • • • • ••• • • * *
• • . . * •^ . • • • • • • • • • • • • • • •

• • • * • • • • • • • • • • • • « 94 a • • • • • • • • • • • • • • • » •
• • • • • • • • • • • • • • • T •.AAM^HX ••iSOrjriDDJTijM
25
20
15
c o . H
oj
M 10
d CI o u
Slope =300 ft/sec
p res su re pulse depressionplateau^
•833-ft/sec slope
0.01 0.02 Time from Destruct (sec)
0.03
F i g . Z - 8 . F r a g m e n t a t i o n V e l o c i t i e s
[a4]Sto-2050-F-2 :'.. :.• 264
I « « » • •
100 200 300 400 500 600 700 800
Dis tance from Cente r of Explosion (ft)
F i g . Z-9 . Lox/RP Booster Explos ion Fragmentat ion
^QMriDENTIjM MND-205Ct-F-2
• • • 265 *•• •••
• • : : " . • • . . - . : . - . " : •
• .• .• : . : : : •: ! • • • • • • « • •* I . • • • • • • • • • • • • • •

(
z - 3 . Cooke, C. R., "NASA/USAF Liquid Propellants Hazards Program (PYRO), " Bulletin of the 6th Liquid Propulsion Symposium, September 1964, Vol. 1, pp 601 to 626.
Z-4. "Blast and Fireball Comparison of Cryogenic and Hypergolic P r o pellants, " Final Report, Aerojet General Corporation, Downey Plant Report No. 0822-01(01)FP, June 1964, Contract 9-2055.
Z-5 . Final Report, "Blast and Fireball Comparison of Cryogenic and Hypergolic Propellants," Houston Research Institute, Contract No. NAS9-3506, August 1964 (also see Ref. Z-4).
i
^QNriDENTUM t • • •
• • • MND-2050-F-2 • • • • : : : 266

jCOMriDDltt^H^--
APPENDIX AA
ANALYTICAL ESTIMATES OF TUMBLING AND OSCILLATORY MOTIONS OF CRONUS REENTRY BODY
The design of a r een t ry body r e q u i r e s an evaluation of the dynamic behavior of the body during i t s descent through the a tmosphere . The mos t e lementary requ i rement of such a design is to provide s ta t ic s tabi l i ty by locating the center of gravi ty so that one obtains a negative value for the slope of the moment coefficient curve as a function of angle of at tack in the vicinity of the t r i m point. The provision of s tat ic stabil i ty i s , however, not sufficient to a s s u r e sat isfactory dynamic behavior of a r een t ry body. During ent ry it is possible for a body to have an angle-of-a t tack behavior which is osci l la tory but with an ampl i tude that is excessive during per iods of maximum heating and maximum loads.
Some of the sal ient features of the osc i l la tory motion of a r een t ry body were obtained by Allen (Ref. AA-1) whose analysis was based upon the formulation of F r i ed r i ch and Dore (Ref. AA-2). The analytical r e su l t s of Allen, while quite useful, a r e r e s t r i c t ed to the case of a r e en t ry body which en te r s the a tmosphere with no angular velocity and whose osci l la t ions a r e l imited to sma l l angles of attack. The effect of an init ial spin r a t e upon the angle of at tack convergence, a lso for smal l angles of at tack, was investigated by Leon (Ref. AA-3) who obtained a cor rec t ion to Al len 's r e s u l t s . Recently, two papers by Tobak and P e t e r s o n have considered the inherent ly nonlinear problems of tumbling bodies enter ing planetary a tmosphe res (Ref. AA-4) and of spinning bodies enter ing planetary a tmosphe res at l a rge initial angles of at tack (Ref. AA-5). In the p resen t note, the r e su l t s of Refs. AA-4 and AA-5 a r e applied to the case of the CRONUS r een t ry body to es t imate some of the dynamic cha rac t e r i s t i c s of this body.
A. DISCUSSION AND RESULTS
To reduce the problem to manageable propor t ions , severa l s impl i fying assumpt ions and approximat ions were made in Refs. AA-4 and AA-5. The significant assumpt ions and approximations a r e as follows: rotat ion of the planet and a tmosphere a r e neglected; aerodynamic damping t e r m s a r e neglected; the flight path angle, y, and velocity, V, r ema in constant at their ini t ial values y. and V.; the density, p, of the
atm.osphere va r i e s exponentially with al t i tude; the motions of the non-spinning cases a r e planar ; the var ia t ion of moment coefficient, C ,
with the magnitude of the angle of a t tack, rj, is sinusoidal and may be wri t ten in the form
C in) m m
s m Y] (AA-1) max
^Of'jriDrr IITH IL-» • ••• • » • MND-20501F.^2
267"
and for the spinning case , the body is ax i symmet r i c both iner t ia l ly and aerodynamical ly . It should be noted that in Refs. AA-4 and AA-5 sample calculations were made to a s s e s s the accuracy of the methods p resen ted with r e su l t s in which no approximations were made e i ther to the equations of motion or to the aerodynamic forces and moment s . For the tumbling motion (Ref. AA-4), it was found that the ag reemen t between the exact r e su l t s and the theory was within 10% throughout; for the spinning case (Ref. AA-5), sa t is factory agreement was also obtained (within approximately 15%). The cha rac t e r i s t i c s of the body and the a tmosphere used in the application of the methods of Refs. AA-' and AA-5 a r e summar ized in Table AA-1 . The value of the maximum moment coefficient, C , was evaluated so that the a r e a under a m max half-cycle of the approximating sine curve equaled the a r ea under a r epresen ta t ive pitching moment var ia t ion for the CRONUS r een t ry body. A comparison of the two curves is shown in Fig. AA-1 .
TABLE AA-1
P rope r t i e s of Vehicle and Atmosphere Used in Es t imat ing Dynamic Cha rac t e r i s t i c s
2 Moment of iner t ia in pitch, I 14 slug-ft
Ratio of pitch moment of iner t ia to 1.0 rol l moment of iner t ia , I / I
z 2
Reference a r ea , A 11. 5 ft Reference length, d 3. 83 ft
Flight velocity, V 25,690 fps
Maximum moment coefficient, C -0. 0498 m max
Bal l is t ic coefficient, W/C^A 25 Ib/ft^
Density p a r a m e t e r /3 for exponential (21, 138 ft)
a tmosphere (p = p^e~^^)
The var ia t ion of the envelope of the angle-of-a t tack osci l la t ions with dynamic p r e s s u r e is shown in Fig. AA-2 for an entry angle of -8 degrees and for s eve ra l values of ini t ial angle of a t tack and zero init ial angular velocity. These r e s u l t s show that the envelopes conve rge ve ry rapidly at low values of dynamic p r e s s u r e and r each a min imum at maximum dynamic p r e s s u r e . The same envelopes a r e a lso
••• • • • •• • • • * • « • • • • • • • • « , . * • • • • • • • • « • • • • • • ••• • • • « * • • • « • • • * • • * • • « • • • • • • • • «« a «
MNB.-2050-F-2 :' : :268
( \ Sinusoidal approximation
\ /
\
\
\ \
\ \
\ \
\ \
\
•Representat ive CRONUS / var ia t ion /
/ /
/ /
/ /
/ /
/ /
/
y /
/
LL _L 0 20 40 60 80 100 120
Angle of Attack, r\ (deg) 140 160 180
Fig. AA-1. Comparison of Moment Coefficient of CRONUS Vehicle with Sinusoidal Approximation Assumed in Analytical Methods
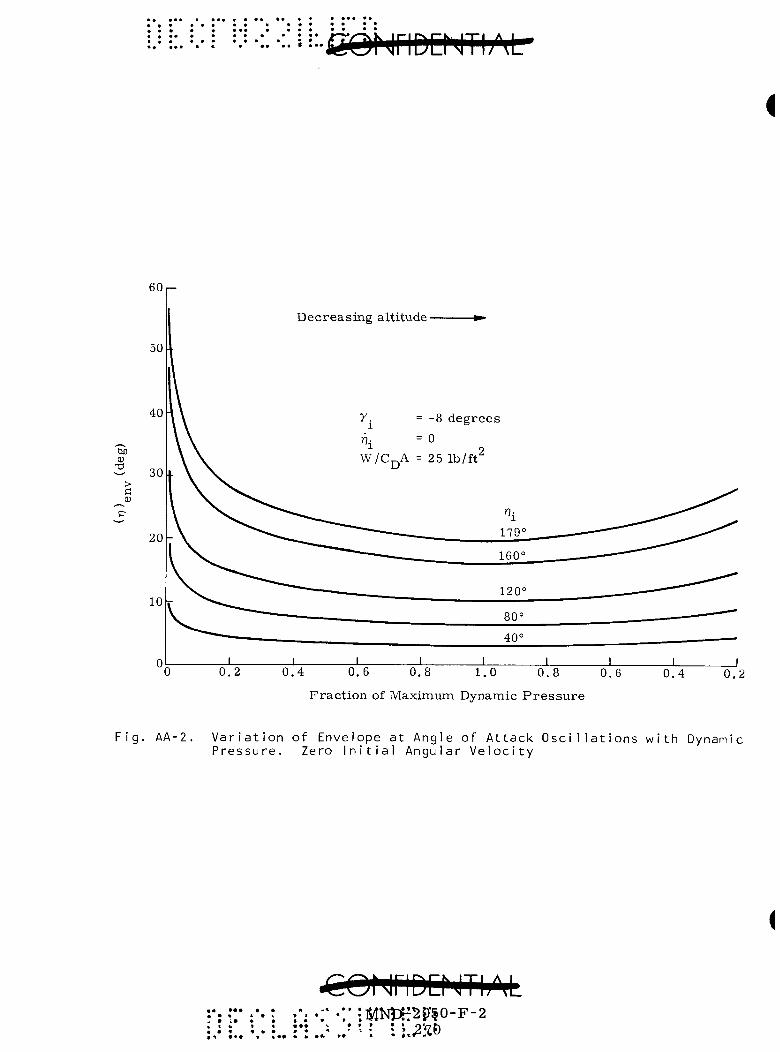
i
Decreas ing alti tude
0.2 0.4 0.6 0.8 1.0 0 .8 0.6
F rac t i on of Maximum Dynamic P r e s s u r e
0.4 0.2
g. AA-2. Variation of Envelope at Angle of Attack Oscillations with Dynamic Pressure. Zero Initial Angular Velocity

• ^ ••!* I* Kf * "*'• • •* * * * ***
shown as functions of the fraction of maximum stagnation point heating rate in Fig. AA-3. It will be noted that for the largest initial angle of attack considered (n. = 179 deg), the envelope converges to approximately 20 degrees at maximum dynamic pressure and at peak stagnation point heating, the angle of attack is less than 25 degrees. For smaller initial values, smaller minimum values are obtained. The effect of flight path angles upon the minimum value of the angle-of-attack envelope (at peak dynamic pressure) is shown in Fig. AA-4. Increasing the flight path angle results in an increase in the minimum value of the envelope. For entry angles less than 30 degrees, however, the envelopes converge to an angle of attack of less than 30 degrees even for the largest initial angle of attack (179 deg) considered here.
When a body enters the atmosphere, it will not, in general, do so with zero angular velocity. In most cases, the body will have some angular momentum and will enter the atmosphere with a tumbling rate about its center of gravity. As it enters the atmosphere, the aerodynamic moments will come into play and, if some measure of aerodynamic stability exists, the tumbling motion will generally be arrested and the body will undergo an oscillatory motion. This oscillatory motion will be of diminishing amplitude, at least during the period of increasing dynamic pressure , but may be of large amplitude. It is of interest, therefore, to estimate the dynamic pressure at which the tumbling motion ceases as well as the magnitude of the subsequent angle-of-attack envelopes.
In Fig. AA-5 the variations of dynamic pressure, q, at which the tumbling motion ceases as a function of initial tumbling rate, r)., for two values of entry angle, 7., are presented. The initial altitude for
these results was taken to be 400, 000 feet. The lowest curves on this figure show the minimum values of dynamic pressure at which tumbling can cease, i. e, , the initial tumbling motion will persist at least to these values of dynamic pressure . The uppermost curves on this figure represent the values of dynamic pressure whose probability of being exceeded is 0. 01 when tumbling ceases. Thus, tumbling will cease at dynamic pressures between the uppermost and the lowest curves for 99% of the tumbling reentr ies. The reason for using a probabilistic criterion for the upper curve is that, for a given initial tumbling rate, there exists one value of initial angle of attack (out of a total of 3 60 deg) at which the body will not oscillate, but will come to rest at the unstable trim point (il = 180 deg for the sinusoidal variation of moment coefficient with angle of attack). The probability of this occurrence is , however, negligible and the use of a finite probability criterion is more meaningful. It should be noted that in Ref. AA-4 it -was found that there exists a nonzero minimum value for the first peak of the variation of angle of attack during reentry. This minimum
« • ••• • ••• • •• • & •
MMD-20eO.^F-2 .' : • • • • a « * • • • •-: ..271 '• '- *.. • . . :
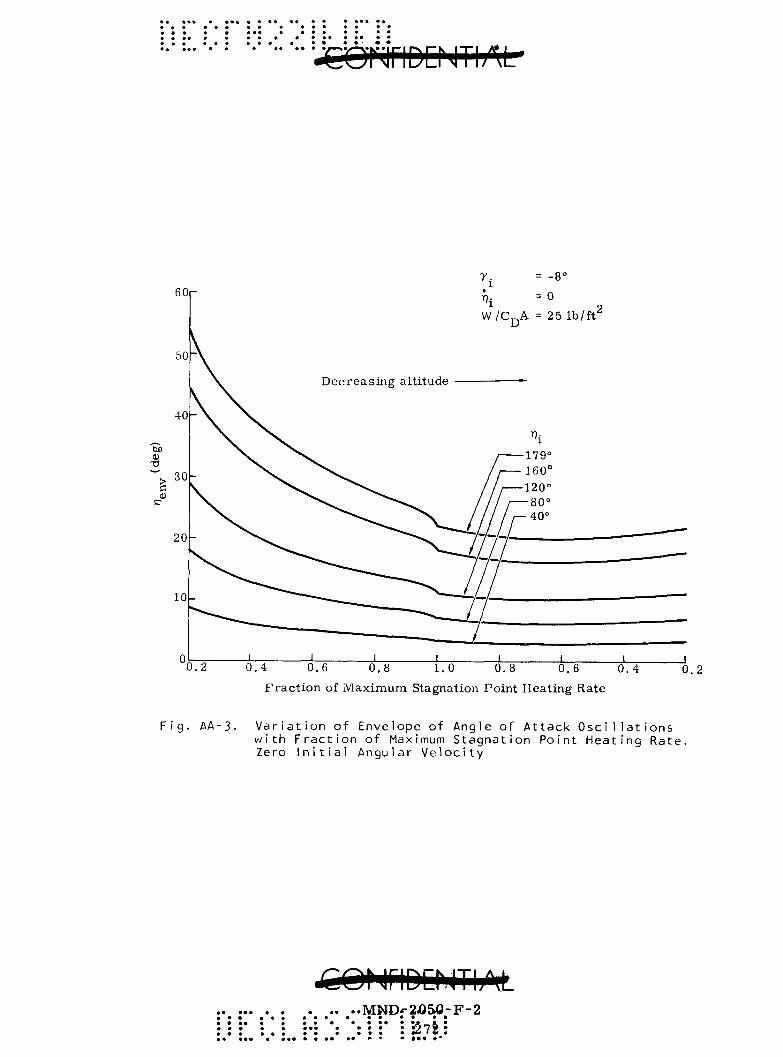
' i W/Cj^A 2 5 lb/ft
0.2 0,4 0.6 0.8 1.0 0.8 0.6 0.4 Fract ion of Maximum Stagnation Point Heating Rate
0.2
Fig. AA-3. Variation of Envelope of Angle of Attack Oscillations with Fraction of Maximum Stagnation Point Heating Rate. Zero Initial Angular Velocity
iCOf JriDD.JTbM M N D ' - 2 J O S O - F - 2
•: *: ': : :* : 'dit:
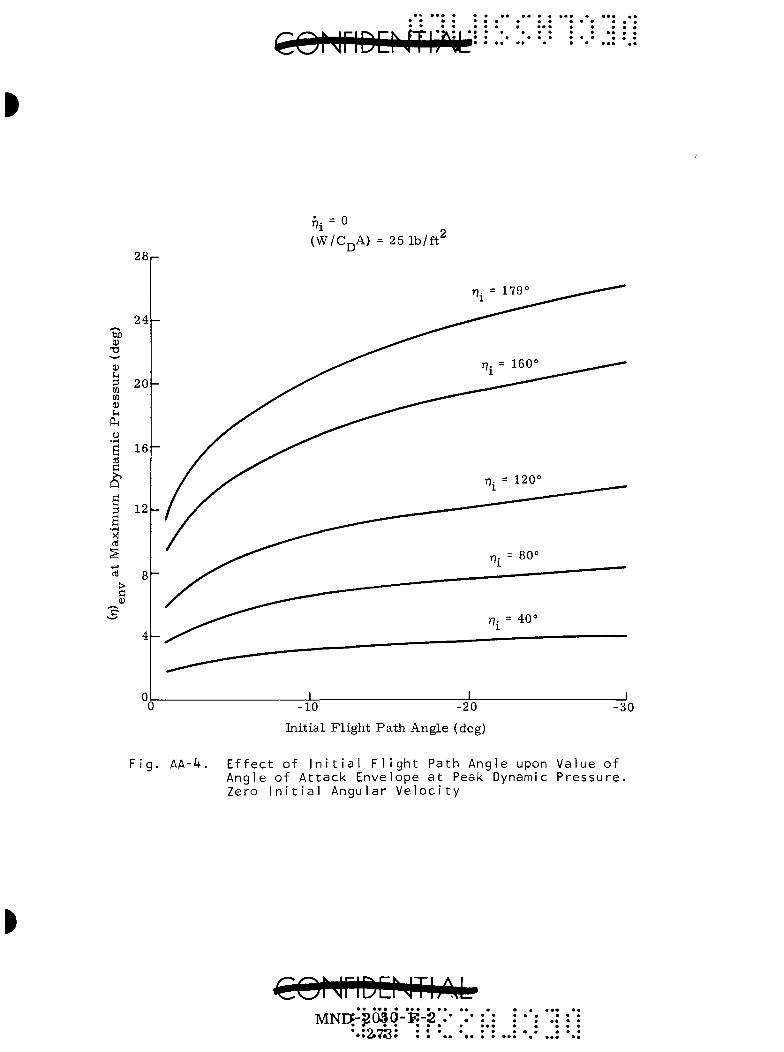
28r (W/C]-,A) 2 5 lb/ft^
tJJO D
X I
1)
w 03
a ni C
a a
• (H
X
> a
24-
20 '
16'
12
4 -
J_ _L -10 -20
Initial Flight Pa th Angle (deg) -30
Fig. AA-4. Effect of Initial Flight Path Angle upon Value of Angle of Attack Envelope at Peak Dynamic Pressure. Zero Initial Angular Velocity
MNq-?03q-s:-2.. •.;2i7S: : : *.
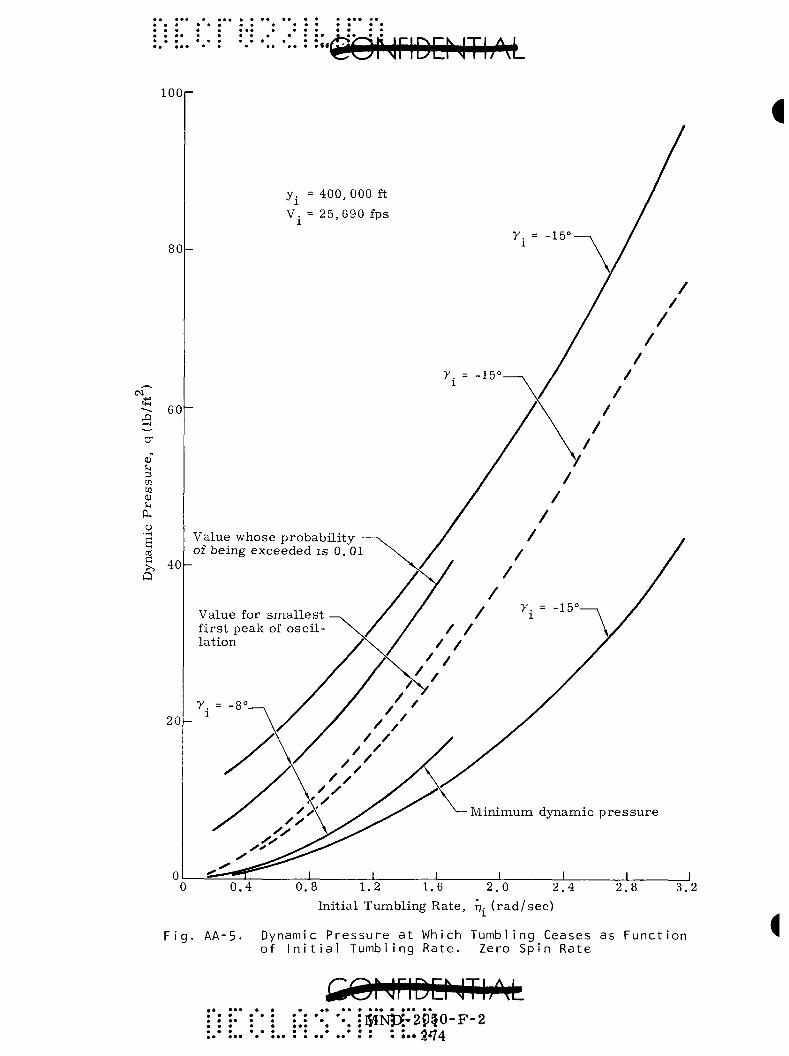
• • • • » •gQNriDCNThM 100
80
60
CO
CQ
CO 0) u
a a Q
40
20
y. = 400, 000 ft
V. = 25,690 fps 1 ' ^
y. = -15°-X
r . = -15°-1
Value whose probability of being exceeded is 0.01
Value for smallest first peak of oscillation
1
Minimum dynamic pressure
0 0.4 0.8 1.2 1.6 2.0 2.4 2.8 3.2
Initial Tumbling Rate, iq. (rad/sec)
Fig. AA-5. Dynamic Pressure at Which Tumbling Ceases as Function of Initial Tumbling Rate. Zero Spin Rate
• • : : :• : ' : :.: *•. *•. :]S5N3DP'2p§0-F-2 :.• :.. •.*:.. : : ..• ..• : : : :.. 2^4

value of the first peak of the angle of attack results in the minimum value of the angle of attack envelope at peak dynamic pressure. The values of the dynamic pressure at which this minimum value of the first peak of oscillation occurs are also shown in Fig. AA-5. The variation of the angle-of-attack envelopes with a fraction of maximum stagnation point heating rate is presented in Fig. AA-6 for a tumble rate of 0. 85 radian/sec. The lower curve in this figure corresponds to the envelope resulting from the minimum value of the first peak of oscillation, the upper curve is the envelope whose probability of being exceeded is 0. 01. Thus, 99% of the entries with an initial tumble rate of 0. 85 radian/sec will have angle-of-attack envelopes between these two curves. The effect of entry angle y. upon the minimum values of
angle-of-attack envelope, i. e. , at maximum dynamic pressure, is shown in Fig. AA-7 for an initial tumble rate of 0. 85 radian/sec. Again, the upper curve corresponds to the envelope whose probability of being exceeded is 0. 01 and the lower curve corresponds to the minimum value of the first peak of oscillation. It will be noted that both curves decrease with steepening entry angles.
To obtain a controlled reentry of an orbiting body, it is often desirable to spin stabilize the reentry body prior to the application of the deorbit retrorockets. In such cases, the reentry body will enter the atmosphere with an initial spin rate. Thus, it is desirable to estimate the effects of such an initial spin rate upon the angle-of-attack envelopes of a reentry body. The methods developed in Ref. AA-5 provide a means for estimating the effects of such an initial spin rate for a body which enters the atmosphere with a given initial angle of attack and zero initial pitch (or yaw) rate. For the case of an initially spinning body, the motion is no longer planar as was obtained for the bodies that enter the atmosphere with an initial angle of attack and zero pitch rate as well as for the body that enters the atmosphere with an initial tumbling rate. As soon as a spinning body enters the atmosphere at a non-zero angle of attack, the aerodynamic pitching moment will generate a pitching rate which then couples with the gyroscopic moments of the spinning body to induce a yawing rate and the motion is , in general, nonplanar. Qualitatively, this nonplanar motion of a spinning body may be described as a precessional motion of the body axis about the velocity vector upon which is superposed a nutational oscillation. Such a motion generally is bounded between two envelopes corresponding to the maximum and minimum values of the magnitude of the angle of attack. This type of motion differs from the planar case in which the minimum value of the magnitude of the attack is equal to zero.
For a spinning reentry body, the variation of the maximum and minimum envelopes with dynamic pressure and with heating rate is similar to those shown in Figs. AA-2 and AA-3 for the nonspinning body. The minimum value of these envelopes, which occurs at peak dynamic
COMriDQIThM MN]>:30i5P"F:2.. " .
• • 9 ^J*R* • • • • • • • ^ iwj* • • • • • • •

i
lOOr-
90 -
80
70
tuO 0)
> 60 c 0)
50
4 0 -
3 0 -
20
V . 1
y. 1
W/Cj^A
= 25,690 fps
= -8 degrees
25 Ib/ft^
Envelope whose probabi l i ty of being exceeded is 0 .01
Minimum envelope
Decreas ing altitude
_L J_ J_ _L 0.2 0 .4 0.6 0 .8 1.0 0 .8 0.6 0 .4
F rac t ion of Maximum Stagnation Point Heating Rate 0.2
Fig. AA-6. Variation of Envelope of Angle of Attack Oscillations with Fraction of Maximum Stagnation Point Heating Rate. Initial Tumbling Rate f). = 0.85 rad/sec. Zero Initial Spin Rate
i
^ONriDENThM •:i«OT5T3P^rF-2

;£ONriDDitTi
48r
44
ao 4) •a -- 40|-0) u to w <u
£ 361-
Q
03
32-
2 8 -
9 24
20
16
\
" \
-
-
V. = 25,690 fps W/CpA = 25 Ib/ft^
^ ^ ^ _ ^ Envelope whose probability ^*"*'*.«..,., ^ of being exceeded is 0.01
^ ^ ^ Minimum ^ s ^ envelope
1 1 1 -10 -20
Initial Flight Path Angle (deg) -30
Fig. AA-7. Effect of Initial Flight Path Angle upon Value of Angle of Attack Envelope at Peak Dynamic Pressure. Initial Tumbling Rate n- = 0.85 rad/sec. Zero Initial Spin Rate
•-: 377 : : •-. '.. :" ••: ••• ..: *.

p r e s s u r e , does change with spin r a t e . The effect of spin r a t e upon the value of the two envelopes at peak dynamic p r e s s u r e is p resen ted in Fig. AA-8 for an entry angle of -8 degrees and two values of init ial angle of attack. It will be noted that the envelope values at peak dynamic p r e s s u r e inc rease with inc reas ing spin r a t e . In addition, as the spin r a t e i n c r e a s e s , the difference between the maximum envelope and the min imum envelope d e c r e a s e s , i. e. , the nutational osci l la t ions become s m a l l e r and the p reces s ion of the body axis about the velocity vec tor i n c r e a s e s and becomes the dominant par t of the motion.
B. CONCLUDING REMARKS
The p resen t study indicates that a significant amount of information concerning the dynamic behavior of r een t ry bodies can be obtained from exist ing analyt ical methods. Fo r the range of conditions covered in this investigation, it appears that the re is a r a the r low probabil i ty that the angle of at tack at maximum dynamic p r e s s u r e will exceed 50 degrees . Inasmuch as the r e su l t s obtained he re depend upon s eve ra l simplifying approximat ions , they should be used as a guide to the expected behavior of such a body in the p re l imina ry design s tages . For the evaluation of the dynamic behavior of a final design, it would be des i rab le to obtain the solution of the exact equations and aerodynamic forces and moments util izing modern computing machines .
REFERENCES
AA-1 . Allen, H. Jul ian, "Motion of a Bal l i s t ic Missi le Angularly Misaligned with the Flight Path Upon Enter ing the Atmosphere and Its Effect Upon Aerodynaraic Heating, Aerodynamic Loads, and Miss Distance. NACA TN 4048, October, 1957.
AA-2. F r i ed r i ch , Hans R. and Dore, Frank J, , "The Dynamic Motion of a Missi le Descending Through the Atmosphere . " Jour . Aero. Sci. , Vol. 22, No. 9, September , 1955, pp 628 to 632; 638.
AA-3 . Leon, Herman I. , "Angle of Attack Convergence of a Spinning Miss i le Descending Through the Atmosphere . " Jour . A e r o / Space Sci, , Vol. 25, No. 8, August, 1958, pp 480 to 484.
AA-4. Tobak, Murray and Pe t e r son , Victor L. , "Theory of Tumbling Bodies Enter ing P lane ta ry Atmospheres with Application to Probe Vehicles and the Aust ra l ia Tekt i tes . " NASA TR R-203, July, 1964.
AA-5. Tobak, Mur ray and Pe t e r son , Victor L. , "Angle of Attack Convergence of Spinning Bodies Enter ing P lane ta ry Atmospheres at Large Inclinations to the Flight Path. NASA TR R-210, October, 1964.
iSQNriDENTIjM • • •• •MlSrf)-2Q50-F-2

50 r
40
Xi
<D
M
O H
Q
a 3
30
20
o
10
ieONriD:NiiiJ^»iU::-::-=:
^i V.
1 W / C Q A
= -8°
= 2 5,690 fps
= 25 Ib/ft^ r). = 160°
Maximum -envelope
Minimum envelope
Range of angle of at tack oscil lat ion at peak dynamic p r e s s u r e
n. = 40°
/
/
/
/ ^ "-— Maximum envelope
Minimum envelope
J I J_ _L 8 12 16 20
Initial Spin Rate (rpm) 24 28 32
Fig. AA-8. Effect of Initial Spin Rate upon Values of Angle of Attack Envelopes at Peak Dynamic Pressure. Zero Initial Tumbling Rate
MNPr2:05Or-:FT2r. •;. :'; : .': •;: :•: * * '^'T'Q * • • • ••* * • • • •

• » o I
r ^ i>
APPENDIX BB
GUIDANCE/CONTROL CHARACTERISTICS
The RTG/RB is designed to abort under controlled orientation conditions and to maintain this orientation by spin stabilization. Therefore, the CIR-RTG/RB must be separated from the spacecraft, and subsequently deorbited, whenever there is an indication that a disastrous malfunction is developing or if loss of spacecraft (or launch vehicle) orientation beyond relatively narrow limits is imminent. These precautions could have the following effects:
(1) A mission could be unnecessarily voided.
(2) Intentional reentry and retrieval of the RTG/RB from the planned spacecraft orbit would be dependent upon the ability to ground command the spacecraft to the proper attitude for RTG/RB separation.
(3) Achievement of partial or secondary missions would be prevented if a satisfactory long-life circular orbit cannot be attained.
Incorporation of an attitude control system in the CIR could alleviate these conditions. However, the advantages to be gained do not appear to overcome the disadvantages of increased complexity and weight. Let us examine the realities of the potential advantages.
The first effect, voiding a mission unnecessarily, does not appear significant since automatic MDS functions cannot be overridden, and aborts based on telemetry and/or tracking data, which indicate deviations in the boost trajectory, excessive angular ra tes , etc. , are subject to ground command. In the case of this latter point, the decision to separate the RTG/RB is no more critical than the decision to abort (destruct) the launch vehicle by ground command. Thus the only way in which a normally successful mission could be voided unnecessarily would be for Ground Control to receive a false signal from the injection stage after injection into the elliptical orbit, indicating that a nondestructive malfunction is about to occur which will prevent proper orientation of the RTG/RB for deorbit.
The second effect relates only to the planned return of a fueled power supply which has been placed in its planned circular orbit.
The third effect simplifies to the probability that a malfunction occurs which prevents the injection stage from injecting the spacecraft into the planned circular orbit yet permits attainment of a satisfactory elliptical orbit (100/600 naut mi) from which secondary or partial
MND.-SO-SQ^R-S". " . . '. : .*. •" •* • «- i / -»- • • • • • • • • • • • • • • . 5 ^ ^ * « • • • • • .
• • • • • • * • » • • • • • » • • • ••• •

mission objectives can be achieved; the planned use of a spacecraft with a nuclear power supply in a short duration elliptical orbit is not considered.
Since no mission objectives that can be accomplished in a short duration elliptical orbit can be identified at this time and the probability of a desirable elliptical orbit after failure to achieve the desired circular orbit appears low, there seems to be no way of justifying the added cost, complexity and weight of an attitude control system for added mission success possibilities. Consequently, the only real basis for providing an attitude control system in RTG/RB is to assure return of a fueled RTG/RB from the planned circular orbit if the spacecraft attitude control system malfunctions. On this basis, the RTG/RB attitude control system would simply act as a redundant system to the spacecraft ACS.
Incorporation of an attitude control for the latter purpose will eliminate the need for spinning the RTG/RB if it can be shown that the probability of a deorbit rocket motor-out condition is so remote that it does not impose a design requirement. Chapter VI shows that a motor-out condition is not sufficiently probable to serve as a design condition. The spin-despin system must be retained in any event, since the attitude control system has no reference during the boost ascent phase of the mission (unless a completely independent inertial platform is also included). Since there would be insufficient time after abort during boost flight to search for a reference and orient the deorbit rocket thrust vector, the capability for spin stability must be retained.
An RTG/RB attitude control system for intentional recovery from the planned orbit or from the 100/600 naut mi elliptical orbit will:
(1) Recover from a tumbling condition introduced by a gyrating spacecraft at separation of the RTG/RB
(2) Provide guidance reference point (sun) search and orientation for deorbit under limit cycle conditions
(3) Overcome the effects of small misalignments in the deorbit rocket thrust vectors.
Since the total impulse requirements are low (1000 to 4000 lb-sec), a nitrogen cold gas system has been compared with a monopropellant hydrazine system. While the bipropellant (hydrazine, nitrogen tetroxide) system is competitive with the monopropellant at this impulse level, only the monopropellant system with its inherently higher reliability was evaluated against the nitrogen system. The nitrogen system offers high inherent reliability and an extensive background of experience and application. However, the low specific impulse of the cold gas system results in heavy propellant and inert weight penalties which must ultimately be traded against reliability.
I
;": =:" : ' • : :': C •"l«SDr?P50:-F-2 • • • * • • • • • • • • • 9 Q (> *

The thrus t level for the attitude control sys tem and the bulk of the propellant weight a r e dependent upon the requirenaent to overcome tumbling of the RTG/RB immediate ly after separa t ion from the space craft. For this r eason , sys t em weight has been plotted as a function of tumbling ra t e (Fig, BB-1). The graph shows that if the RTG/RB can be separa ted from the spacecraf t before a tumbling ra t e in excess of one revolution pe r second is imposed on the RTG/RB, the cold gas sys tem weight disadvantage may be acceptable in o rde r to reap the benefits of s implici ty and rel iabi l i ty . Selection of the type of attitude control sys t em will depend upon the cha rac t e r i s t i c s of the spacecraft and the magnitude of the r a t e s it can impose on the RTG/RB p r io r to separat ion.
Assumptions and design requ i rements for analysis of the ACS s y s tems follow,
1, Bas is for Analysis
This analysis provides a s y s t e m ' s definition for independent operation of the p resen t re fe rence configuration. The analysis is l imited to the cost in t e r m s of equipment weight, volume and power requ i rements for finding a re la t ive orientat ion with r e spec t to sun and ear th , communicating this or ientat ion to a cent ra l com.mand facility, determining attitude and time for deorbit execution, communicating these p a r a m e t e r s to the RTG/RB and executing controlled deorbi t and r een t ry . The weight penalty, excluding those functions common to the spin-stabi l ized vers ion , is found to be 91.7 pounds,
2, Assumptions
The RTG/RB will consis t of the RTG, s t ruc tu re and associa ted operat ional components shown in Fig. BB-2 . A vehicle m a s s table is given (Table BB-1), and the iner t ia ma t r ix computed from this data in the s ix -degree -of - f reedom stabil i ty p r o g r a m is given in Table BB-2.
The equipment complement requi red for independent orientation i s :
(1) Four wide-angle sun s e n s o r s placed about per iphery of equipment module
(2) Two horizon s enso r s placed at opposite s ides of equipment module
(3) Rate-swi tch controlled react ion je t sys tem with six nozzles and assoc ia ted fuel tanks
(4) One s ing le -degree-of - f reedom ra t e integrat ing gyro with assoc ia ted e lec t ronics for gyro compassing to orbi tal angular momentum vector during the da rk - s ide portion of orbit; this will maintain vehicle azimuth re fe rence
MN5Jf2n5jO-p^2-. " . .*. : .-. ••: .•
• • *• • •
* %«« • <
jSbNriDCNThM
240r
200U
•r-(
to
o
c o U 0) -a 3
160
120k
3 4 5
Tumbling Rate (rps)
F i g . B B - 1 . System We igh t as a F u n c t i o n o f T u m b l i n g Rate
'CO! JriDD ^TI;\L •:• :•• I ;•: •:' -:MNPi2Sp5F-:F-2 • • • • •« • • • • •*yQ/i • •
gQNriDENy^iij ;;:•::•':=
stabilization reaction jets
Reference coordinate origin
Wide angle sun sensor (4)
Retrorockets (4)
Spin rockets (2)
Horizon scanner (2)
F i g . BB -2 . R e e n t r y Body, C o n f i g u r a t i o n "D '
MND-aO50tPt2 ••. •'. / . • .', ;^85: : *
• • •
. • • k t

TABLE BB-1
Vehicle Masses
Item P a r t Description
1 RTG thermoelec t r i cs 2 RTG thermoelec t r i cs 3 RTG thermoelec t r i cs 4 RTG thermoelec t r i cs 5 RTG fuel block 6 RTG fuel block 7 RTG fuel block 8 RTG fuel block 9 RTG rad ia tor shell
10 RTG rad ia tor shell 11 RTG radia tor shell 12 RTG radia tor shell 13 Ret rorockets 14 Ret rorockets 15 Ret rorockets 16 Ret rorockets 17 Spin rockets 18 Spin rockets 19 Heat shield 20 Heat shield 21 Heat shield 22 Heat shield 23 Tracking beacon sys tem 24 Aft sk i r t 25 Subsystems e lect ronics and power 26 Subsystems e lect ronics and power 27 Subsystems e lec t ronics and power 28 Subsystems electronics and power 29 Subsystems housing and mounting 30 Subsystems housing and mounting 31 Subsystems housing and m.ounting 32 Subsystems housing and mounting
Location of Center of Gravity of Incrementa l Weights
Y Z Weight (lb)
12 12 12 12 49 49 49 49 27 27 27 27 8.6-34 8.6-34 8. 6-34 8.6-34 3,8-15 3.8-15 12. 5 12. 5 12. 5 12. 5 15 4 15. 5 15. 5 15. 5 15.5 7.5 7.5 7.5 7.5
X
-21 -21 -21 -21 -21 -21 -21 -21 -21 -21 -21 -21 6 6 6 6 6 6 -3 -3 -3 -3 -48 -49 10 10 10 10 6 6 6 6
12 12 12 12 -6 -6 6 6 11 11 11 11 0 25 0 25 21 21 11 11 11 11 0 0 -8 -8 8 8 -9 9 9 9
12 -12 -12 12 6 -6 -6 6 11 -11 -11 11 25 0
-25 0 8 -8 11 -11 -11 11 -5 -1 8 -8 -8 8 9 -9 -9 9
T A B L E B B - 2
V e h i c l e P h y s i c a l C h a r a c t e r i s t i c s
I n e r t i a M a t r i x wi th R e s p e c t to C e n t e r of G r a v i t y
38. 7056 0. 1994
0. 1994 63 .6072
- 1 . 5 7 0 4 1.8532
C e n t e r of G r a v i t y L o c a t i o n wi th R e s p e c t to R e f e r e n c e C o o r d i n a t e s (ft)
X 0. 12224
Y - 0 . 0 7 7 3 1
Z 0 . 0 2 9 4 5
T o t a l M a s s
2 1 . 10397 s l u g s
XX ^XY X Z
YX ^YY ^YZ
ZX ^ZY ^ZZ
(5) Programmer, beacon and communications electronics
(6) Independent battery power supply system capable of operation for up to five orbits after separation.
The RTG/RB is assumed attached to Nimbus or another satellite which may have lost its attitude reference and be tumbling. The vehicle is in a determined orbit,and power and command communications are available within the RTG/RB system. Ground command has made limited functional verification of RTG/RB systems. Therefore, the sequence of events is:
(1) The RTG/RB is separated from the Nimbus on ground command as a result of decision to recover or dispose of the RTG. The spin rockets are not used for this case.
(2) Tip-off rates are reduced to zero as a result of reaction jet system operation under rate switch sensing.
(3) The RTG/RB begins to search about its roll axis for sun line.
(4) Upon acquisition with any one sensor, the RTG/RB searches about the cross axis (either Y ^ or Z^.) for the horizon.
(5) Upon acquisition and orientation, the RTG/RB searches about its roll axis (X_) to establish a minimum (null) rate
B upon the gyro oriented along '^^-c,'> this axis is then established in the orbital plane and parallel to the velocity vector. The vehicle is stabilized to the horizontal and pitching about Y ^ at the orbital rate.
(6) The RTG/RB communicates its locked-on condition to ground.
(7) Ground facilities will have determined orbit and predicted position and azimuth of sun as a function of time. Time for deorbit is determined, if required, and an incremental roll command is computed. The pitch command required will be a function of desired deorbit AV application angle.
(8) The RTG/RB is given a deorbit program consisting of:
(a) Time to commence orientation for deorbit
(b) Incremental roll command to place Y axis perpendicular to orbital plane, if required
(c) Incremental pitch command to position rockets for deorbit AV

(d) Update of RTG/RB clock.
(9) The RTG/RB executes reorientation on time and in position for reentry to the desired target impact area.
(10) At this point, two options are available;
(a) Programmer ignites the deorbit rockets which apply deorbit thrust. The reaction control system counteracts the disturbing torques resulting from deorbit rocket thrust vector misalignment and from variations in thrust level between rockets.
(b) Programmer ignites spin rockets for spin stabilization. The programmer then ignites the deorbit rockets. The reaction control system counteracts tumbling rates produced by deorbit rocket misalignments. The programmer initiates reduction of spin rate utilizing the reaction control system, after the deorbit impulse delivery is completed,
(11) The time available to complete either of these options is 26, 58 minutes, based on an initial altitude of 600 naut mi, an application angle of -135 and a nominal AV of 1500 fps. It is assumed for this analysis that each function--tumble correction and despin--will require 90 seconds to achieve.
(12) The RTG/RB is then separated from auxiliary systems by release of the retention band and permitted to reenter in its aerodynamic configuration with arbitrary attitude and residual tumbling rates from the last separation.
(13) Upon atmospheric reentry, the RTG/RB is stabilized rapidly to normal reentry aspect through aerodynamic moments caused by the asymmetric aft body.
The choice of Option (10b) is only pertinent if the possibility of a single-deorbit-rocket-out condition is used as the design criterion. It can be shown that the propellant expended to overcome anticipated thrust mis alignments for a system in which all deorbit rockets are functioning is quite small. On the other hand, a single rocket-out condition would
2 generate angular accelerations on the order of 30 rad/sec . At this angular acceleration, the vehicle would be set tumbling, and deorbit would fail. Any practical increase in reaction jet thrust would fail to account for this situation, hence spin stabilization. However, even spin stabilization will not completely prevent the vehicle from tumbling in the rocket-out condition. Rather, it will tend to distribute the angular momentum between two axes, providing a longer period of time in which the thrust vector application is near nominal.
MND-2iO^O:-:H^-2 2j3a.;: i
In view of the extremely low probability of encountering a single-deorbit-rocket-out condition and because spin stabilization is not a guaranteed solution to the motor-out condition, this approach has not been used. Evaluation of reaction control system requirements and comparison of reaction jet propulsion systems are made on the basis of Option (10a).
3. Reaction Control Propulsion System
A reaction jet system incorporated in the deorbit system associated with the reference vehicle must provide sufficient thrust and total impulse to enable the RTG/RB to recover from a tumbling condition at separation from the spacecraft, accomplish a sun reference seeking maneuver and compromise any pitch, yaw and roll torques generated by misalignment of the deorbit rocket thrust vectors.
The ACS thrustors are located radially two feet from the reference vehicle centerline, approximately six inches aft of the center of gravity. The time for rate stabilization should be within possible communications contact time; a time of 90 seconds is assumed. Since:
9 = 0 (At)
where
9 = tumbling rate
0 = angular acceleration required to null the tumbling rate
in 90 seconds
and
9 = 9/90
also
FR = I 9
where
F = thrust level for one axis
R = thrust moment-arm (2. 0 ft) 2
1 = moment of inertia of vehicle in axis of interest: 66 slug-ft in pitch and 39 slugs in roll
•:-:'-:*J^i3Slt|T2t)5*Q-F-2
Thus, the thrust level r equ i red in the pitch and yaw axes is
FpY = 33 (0/90) = 0. 367 (6) pitch and yaw
Fj^ = 19. 5 (9/90) = 0. 217 (0) ro l l
Although the high level of thrus t r equ i red for correc t ion of tumbling is not efficient for fuel economy during the l imit cycle operation r e quired to accomplish sun r e fe rence , a pulsed sys tem of var iable repet i t ion ra t e can be used to minimize the impulse bit. It is possible to opera te in a control mode such that "on" pulses a r e so rapid that the valve never c loses . Thus , constant operat ion can be achieved while the capability to r e tu rn to a min imum impulse bit l imit cycle is re ta ined. Reaction je ts of the s ize requ i red (5 to 15 pounds of thrust) can have "on" t imes of 0. 020 second and repet i t ion r a t e s of 50 pulses pe r second. Propel lant consumption during the l imit cycle is derived as follows:
f - pulsing frequency
A0 - angular velocity change due to torque impulse of applied thrus t
J = polar moment of iner t ia
r = radius a r m of th rus t motor
I, = impulse bit (Fot)
J A O = rl^
AG = -^t
J Assume the angular velocity of the vehicle between
t„ < t < t- i s 9
, . _ -2A9 _ 2Ae
This is shown in F i g . B B - 3 .
If, at t = t^ a velocity change, A O , is given to the vehic le .
92 = -9 + AG
where .
9 = 92, t^^t<_t2
cor iriDD ITIirU^ •• ••• • ••• • •• •• MND*305prFr3 .•
-.29^

•" •" C(D)iiriDDITI)M
f
-Ae i
+Ae
Fig. BB-3. Reaction Jet Limit Cycle
«COf JriDENThM 54NjDr2p50-F-2

r^riDEPiiyJoii ::•::•=:=
we find.
t - t = - ^ M _ ^ 1 A9 - 9i
Then, for T = per iod, f = —
T - t 2 - t o = ( t 2 - t ^ ) + ( t j - V
T= 2A0 / A9 \ ypi (A9 - 9x)/
• • 9 (A9 - 9 ) . . f = —=— !—! where 0 < 9, < A9
2 Ae A9 — 1 —
Then, a t ime averaged frequency over an initial r a t e spec t rum (0 - Ae) is
1 f e,(Ae-e,> ave Ae J 2 Ae Ae
0
AG 12 AG
and since the react ion je t is pulsed twice per cycle,
f' = 2f = ^ ave 6 A 9
where f' is the average frequency of the pu lses . Let I be the t ime
r a t e of impulse expendi ture .
A9 t •'ave "t 6A9 i = L f' = I
I = I (r I^) r i ;
t 6JA9 6J A 9
CQMriDENTh^^L MND-.2»30*F
• • •• -293 :
2 * • ••
If W = weight flow r a t e , p ^ *
W = P I s p
where I = specific impulse , sp ^ ^ >
we have.
r l , W p 6JI AG ^ sp
(BB-1)
The minimum impulse bit is the average thrust over the pulse width. We define here an impulse bit which is the product of the peak thrus t and an effective pulse width (At^). Thus
If = F-p-v (At) = 0. 367 9 (At^) = 0. 00724 G lb - s ec
where
At^ = 0.02 second
and the propellant flow r a t e for one axis from Eq (BB-1) is
W, 0.366 X 10 PY
_lb_ I I sec sp .
where
AG = 0. 1 rad
I = specific impulse of the propellant used in the attitude ^ control sys t em
If we assume that a maxinaum of five orbi ts is requ i red to a s s u r e acquisit ion of the sun re fe rence and attainment of p roper RTG/RB orientat ion, the total propel lant expended for the pitch or yaw axis during this period is
W p = 9. 88 Ij^^] lb •^PY Vsp. \ s p /
CONriDENTIAL MlU]D:-30t5O-F-2 i : : . . S54
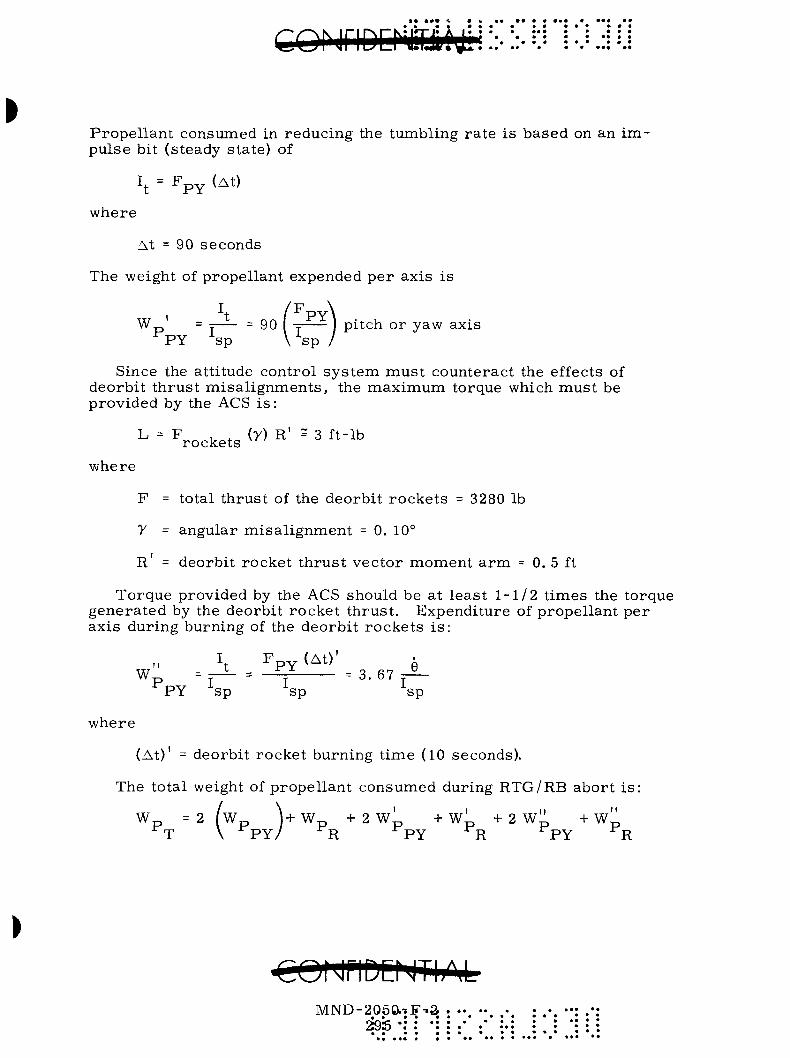
conriDcr'idJ^d:: ::•::•=:=
Propel lan t consumed in reducing the tumbling ra t e is based on an i m pulse bit (steady state) of
^t " -^PY ^^^^
where
At = 90 seconds
The weight of propel lant expended p e r axis is
W t / ^ P Y \ p, = I = 90 I j: I pitch or yaw axis
PY sp V^sp / Since the attitude control sys t em mus t counteract the effects of
deorbit thrus t misa l ignments , the maximum torque which must be provided by the ACS i s :
^ - ^ rocke t s <>') R' ' 3 ft-lb
where
F = total thrust of the deorbi t rocke ts = 3280 lb
y = angular misa l ignment = 0. 10°
R = deorbit rocket th rus t vector moment a r m = 0. 5 ft
Torque provided by the ACS should be at least 1-1/2 t imes the torque generated by the deorbit rocket thrus t . Expenditure of propellant per axis during burning of the deorbi t rockets i s :
L W
P I •^PY ^sp
^e^i^'=3.S7 ^ I
sp sp
where
(At)' = deorbit rocket burning t ime (10 seconds).
The total weight of propel lant consumed during RTG/RB abort i s :
Wp =2 (W^ V W^ + 2 w!^ + W^ + 2 W^ +w" PY R P Y R P Y R
MND-2Q6ft' 29S •
F-a
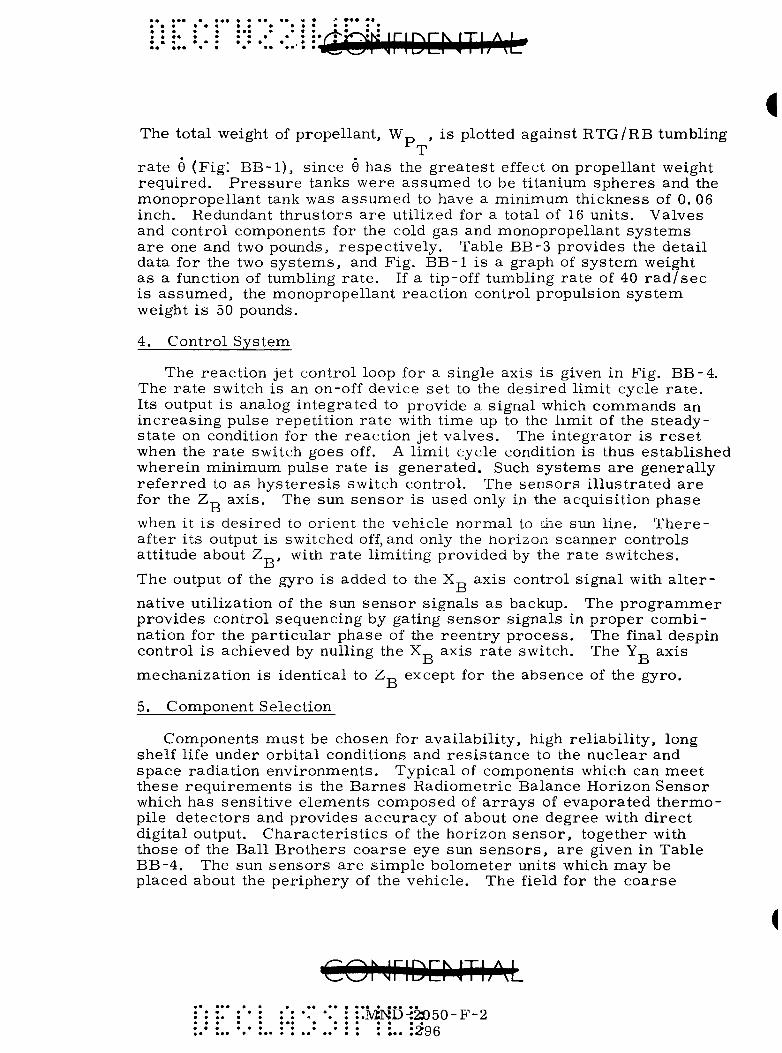
i The total weight of propellant, Wp , is plotted against RTG/RB tumbling
T rate 9 (Fig! BB-1), since 9 has the greatest effect on propellant weight required. Pressure tanks were assumed to be titanium spheres and the monopropellant tank was assumed to have a minimum thickness of 0. 06 inch. Redundant thrustors are utilized for a total of 16 units. Valves and control components for the cold gas and monopropellant systems are one and two pounds, respectively. Table BB-3 provides the detail data for the two systems, and Fig. BB-1 is a graph of system weight as a function of tumbling rate. If a tip-off tumbling rate of 40 rad /sec is assumed, the monopropellant reaction control propulsion system weight is 50 pounds.
4. Control System
The reaction jet control loop for a single axis is given in Fig. BB-4. The rate switch is an on-off device set to the desired limit cycle rate. Its output is analog integrated to provide a signal which commands an increasing pulse repetition rate with time up to the limit of the steady-state on condition for the reaction jet valves. The integrator is reset when the rate switch goes off. A limit cycle condition is thus established wherein minimum pulse rate is generated. Such systems are generally referred to as hysteresis switch control. The sensors illustrated are for the Z_ axis. The sun sensor is used only in the acquisition phase
when it is desired to orient the vehicle normal to the sun line. Thereafter its output is switched off, and only the liorizon scanner controls attitude about Z , with rate limiting provided by the rate switches.
The output of the gyro is added to the X axis control signal with al ternative utilization of the sun sensor signals as backup. The programmer provides control sequencing by gating sensor signals in proper combination for the particular phase of the reentry process. The final despin control is achieved by nulling the X axis rate switch. The Y^. axis
mechanization is identical to Z„ except for the absence of the gyro.
5. Component Selection
Components must be chosen for availability, high reliability, long shelf life under orbital conditions and resistance to the nuclear and space radiation environments. Typical of components which can meet these requirements is the Barnes Radiometric Balance Horizon Sensor which has sensitive elements composed of arrays of evaporated thermopile detectors and provides accuracy of about one degree with direct digital output. Characteristics of the horizon sensor, together with those of the Ball Brothers coarse eye sun sensors, are given in Table BB-4. The sun sensors are simple bolometer units which may be placed about the periphery of the vehicle. The field for the coarse
COMriDENTh^L :*: :*.* : ' • : :*: <* •'.' : : !MND-:2305O-F-2
:296
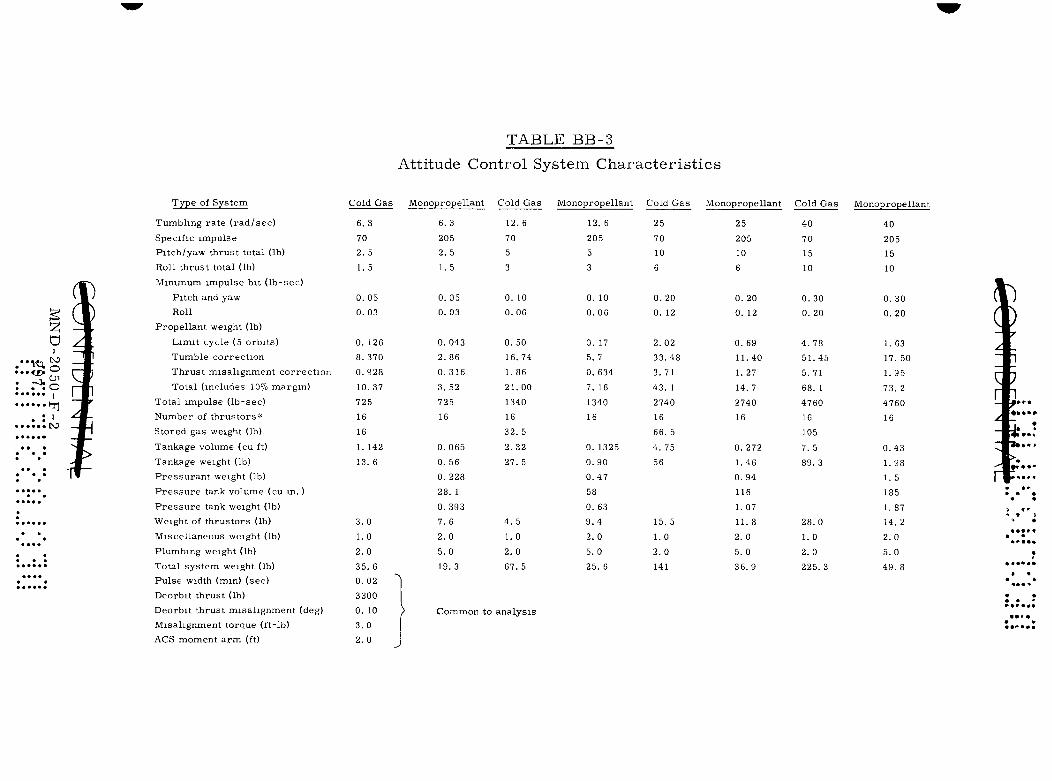
TABLE BB-3
Attitude Control System Characteristics
Type of System
Tumbling rate (rad/sec) Specific impulse Pitch/yaw thrust total (lb) Roll thrust total (lb) Minimum impulse bit (lb-sec)
Pitch and yaw Roll
Propellant weight (lb)
Limit cycle (5 orbits) Tumble correction
Thrust misalignment correction Total (includes 10% margin)
Total impulse (lb-sec) Number of thrustors* Stored gas weight (lb) Tankage volume (cu ft) Tankage weight (lb) Pressurant weight (lb) Pressure tank volume (cu in. ) Pressure tank weight (lb) Weight of thrustors (lb) Miscellaneous weight (lb) Plumbing weight (lb) Total system weight (lb) Pulse width (min) (sec) Deorbit thrust (lb) Deorbit thrust misalignment (deg) Misalignment torque (ft-lb) ACS moment arm (ft)
Cold Gas
6.3
70
2. 5
1.5
0.05 0.03
0. 126 8. 370
0.928
10. 37
725
16
16
1. 142
13. 6
3 .0
1.0
2 . 0
35. 6
Monopropellant
6. 3
205
2 . 5
1.5
0.05 0.03
0.043 2.86
0.316
3. 52
725
16
0.065 0. 56
0.228
28. 1
0.393 7 .6
2 . 0
5 .0
19.3
Cold Gas
12. 6
70
5
3
0. 10 0.06
0. 50 16.74
1.86
21.00
1340 16
32. 5
2. 32
27.5
4. 5
1.0
2 .0
67. 5
Monopropellant
12.6
205
5
3
0. 10 0.06
0. 17 5.7
0.634
7. 16
1340 16
0. 1325
0.90 0.47
58
0.63 9 .4
2 . 0
5 .0
25. 6
Cold Gas
25
70
10
6
0. 20 0. 12
2.02 33.48
3. 71
43. 1
2740 16
66. 5
4.75 56
15. 5
1.0
2 . 0
141
Monopropellant
25
205
10
6
0.20 0. 12
0. 69 11.40 1. 27
14. 7
2740 16
0. 272
1.46 0.94
116
1.07
11.8 2 .0
5 .0
36.9
Cold Gas
40
70
15
10
0.30 0. 20
4. 78 51.45
5.71
68. 1 4760 16
105
7. 5
89.3
28.0 1.0
2 .0
225.3
Monopropellant
40
205
15
10
0. 30 0.20
1. 63 17. 50
1.95
73.2
4760 16
0.43
1.98 1. 5
185
1.87 14.2
2 .0
5 .0
49. 8
0.02 3300 0. 10 3.0 2.0
<: 7
>.
Common to analysis

Sun' s radiation
Orbital angular momentum —J 1 momentum
Earth 1 radiation
Single degree of freedom
gyro
PRC
Horizon scanner
PRC
-(2H zz
Rate switch - f
h —
^ .
Programmer
r e -t
Ground command
To X„ control
PRC
J r
- %
F,
PRC
F i g . B B - 4 . Zn A x i s C o n t r o l System
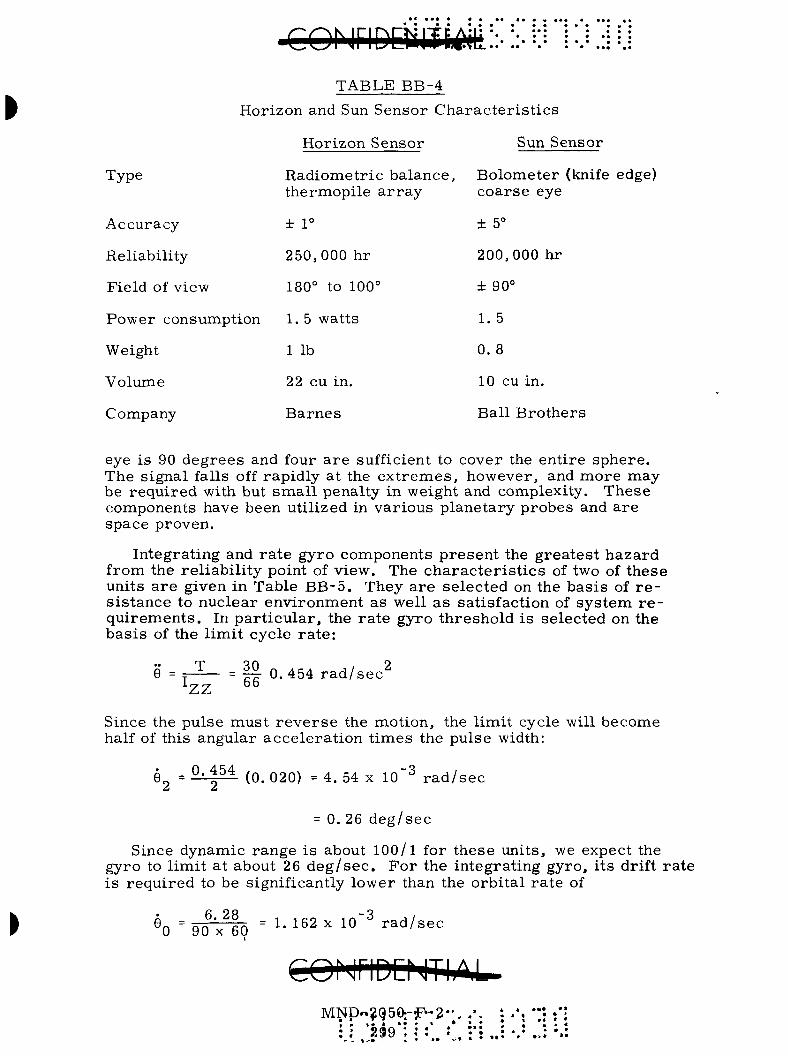
Type
TABLE BB-4
Horizon and Sun Sensor Characteristics
Horizon Sensor Sun Sensor
Radiometric balance. Bolometer (knife edge) thermopile array coarse eye
Accuracy
Reliability
Field of view
Power consumption
Weight
Volume
Company
± 1°
250,000 hr
180° to 100°
1. 5 watts
1 lb
22 cu in.
Barnes
± 5°
200,000 hr
± 90°
1. 5
0. 8
10 cu in.
Ball Bro the r s
eye is 90 degrees and four are sufficient to cover the entire sphere. The signal falls off rapidly at the extremes, however, and more may be required with but small penalty in weight and complexity. These components have been utilized in various planetary probes and are space proven.
Integrating and rate gyro components present the greatest hazard from the reliability point of view. The characteristics of two of these units are given in Table BB-5. They are selected on the basis of r e sistance to nuclear environment as well as satisfaction of system re quirements. In particular, the rate gyro threshold is selected on the basis of the limit cycle rate:
9 = :r-3_ = l l 0. 454 rad/sec^ ' Z Z
Since the pulse must reverse the motion, the limit cycle will become half of this angular acceleration times the pulse width:
®2 " ^'2^^ (0. 020) - 4. 54 X lO"^ rad/sec
= 0.26 deg/sec
Since dynamic range is about 100/1 for these units, we expect the gyro to limit at about 26 deg/sec. For the integrating gyro, its drift rate is required to be significantly lower than the orbital rate of
^ O ^ g l i r l o = 1 . 1 6 2 x 1 0 - 3 rad/sec
MND«?g50:-p-2-. ,' 9aQ • : ; : :* 299 ; ; : ;

• • • « ^(•jeNriDErmAL
Design Goal
a. Kearfott Gas Bear ing
Weight
Angular momentum at 24,000 r p m
Gyro gain
Trans fe r function
Pickoff output per degree of float t rend (9-volt , 19 .2-kc excitation)
TABLE BB-5
Per formance Specification Values
King II Gyro (C70 2590)
Units
lb
gm-sq c m / s e c
mv/deg input
mv/deg output
Proposed Specification
1 (maximum)
0.350 X 10^ X 4%
12 X 20%
2500 ± 25%
620 ± 10%
Charac t e r i s t i c t ime
Output axis freedom
Operating t empera tu re
Torquer sca le factor
Maximum torquing ra te
Torquer l inear i ty to 25° /h r
Motor excitation
Start ing power
Start ing cur ren t
Running power
Running cur rent
Synchronization t ime
Vibrat ion Shock
Operat ing life
Stops and s t a r t s
Warmup hea te r
Maintenance hea te r
T e m p e r a t u r e senso r
Mass unbalance
second
degrees o p
d e g / h r / m s
deg /h r
%
3 phase
watts
mil l isecond
watts
mil l isecond
second
hours
watts
watts
ohms
d e g / h r / g
Not yet determined
±2 ± 25%
154° F nominal
40 ± 5%
12,000
0.01
800 cps , 26 V
15 (maximum)
600 (naaximum)
8 (maximum)
450 (maximum)
25 (maximum)
Not yet determined Not yet determined
40, 000 (minimum)
500 (minimum)
80 nominal
25 nominal
780
0. 15 (maximum each axis) Fixed torque (maximum) deg /h r 1.0
CO^ iriDQ ITI.M . - .•MND-.20'5O7F-2

TABLE BB-5 (continued)
Mass unbalance shift (maximum) spread (based on 5 six position run with CD)
Fixed torque spread (maximum) Random drift vertical (10 hr) Random drift azimuth (10 hr)
Units
deg/hr /g
deg/hr
deg/hr
deg/hr
Maximum anisoelasticity deg/hr /g ' under vibration Cross axis compliance deg/hr /g '
Proposed Specification
0. 15 spread 0.05^
0. 10 spread 0.03i O.OOli
O.OOU
0. 02 maximum to 500 cps 0. 01 maximum to 500 cps
b. Nortronics SMT-1 Body Rate Characteristics Outside dimensions
Weight
Input range
Sensitivity, ftill scale
Over temperature range Voltage supply variation
0. 936 ± 0. 001-in. dia by 2. 015 in. long max 4. 5 oz
>+40' 400 - 0 '
/sec
Excitation frequency variation
Angular momentum (spin motor)
Gimbal moment of inertia
Gimbal displacement
8 volts (20 mv/deg/sec) Add + tolerance Voltage supply variations result in equivalent sensitivity variations; linearity is affected accordingly when voltage varies during test run. (See "Linearity under normal conditions .")
Sensitivity will vary in direct proportion to excitation frequency variation due to wheel speed change. Effect on pickoff will be negligible if voltage remains constant with choke excitation.
2 13,500 gm-cm /sec i n 2 19 gm-cm 1.46 typical
CONriDENTI/4 MND-2050-F-2
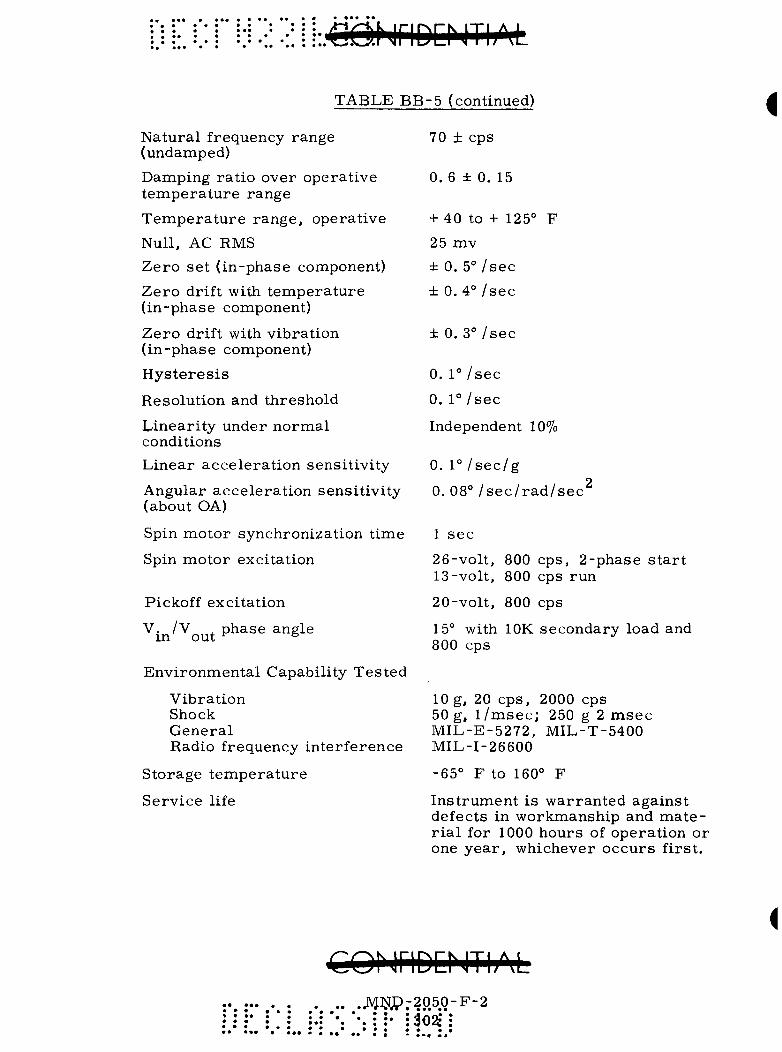
TABLE BB-5 (continued)
Natura l frequency range (undamped)
Damping ra t io over operat ive t empera tu re range
T e m p e r a t u r e range , operat ive
Null, AC RMS
Z e r o set ( in-phase component)
Ze ro drift with t empera tu re ( in-phase component)
Ze ro drift with vibrat ion ( in-phase component)
Hys t e r e s i s
Resolution and threshold
Linear i ty under normal conditions
Linear acce lera t ion sensit ivi ty 0. 1° / s e c / g
70 ± cps
0. 6 ± 0. 15
+ 40 to + 125° F
25 mv
± 0. 5° /sec
± 0.4° /sec
± 0. 3° /sec
0. 1° / s e c
0. l ° / s e c
Independent 10%
Angular acce lera t ion sensi t ivi ty (about OA)
Spin motor synchronization t ime
Spin motor excitation
Pickoff excitation
V. /V , phase angle in out ^ ^
Environmenta l Capability Tes ted
Vibrat ion Shock Genera l Radio frequency in ter ference
Storage t empera tu re
Service life
0 . 0 8 ° / s e c / r a d / s e c '
1 sec
26-volt, 800 cps, 2-phase start 13-volt, 800 cps run
20-volt, 800 cps
15° with lOK secondary load and 800 cps
10 g, 20 cps , 2000 cps 50 g, l / m s e c ; 250 g 2 m s e c MIL-E-5272, MIL-T-5400 MIL-I-26600
-65° F to 160° F
Ins t rument is war ran ted against defects in workmanship and m a t e r i a l for 1000 hours of operat ion or one yea r , whichever occurs f i rs t .
cohjriDChmAL .. .jyf]^p.-2050-F-2
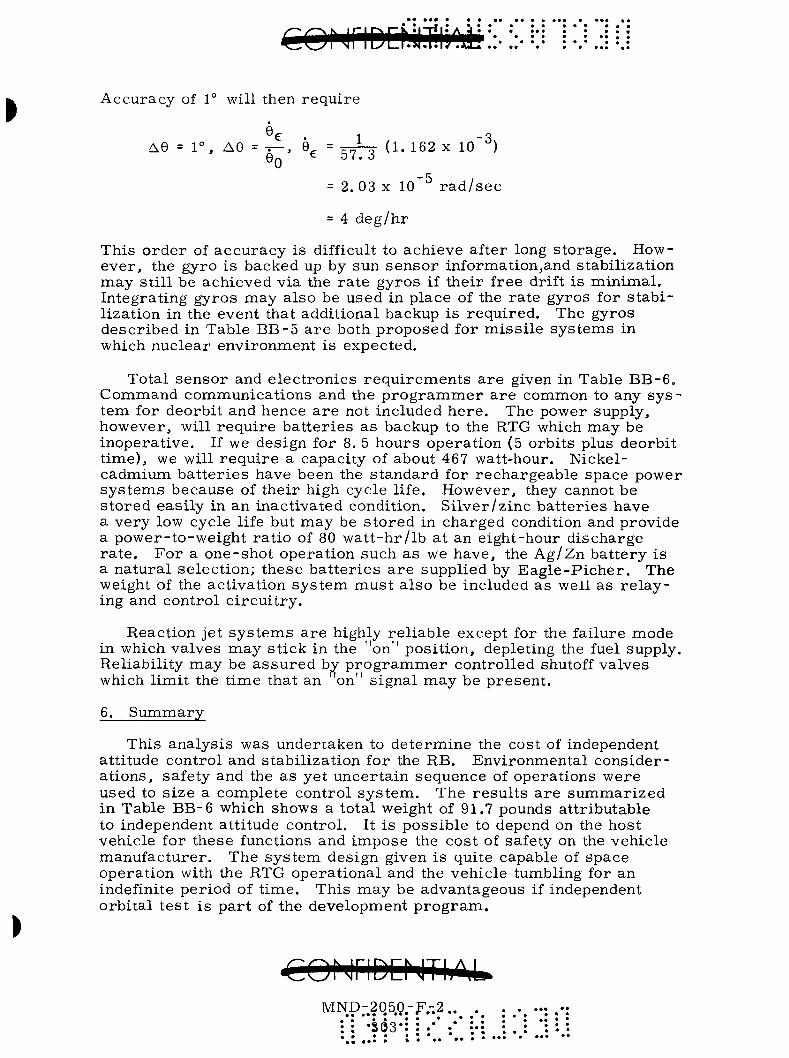
Accuracy of 1° will then require
AG = 1°, AG = v^ , e^ = ~-^ (1. 162 X 10~^) GQ ^ 5'• 3
= 2.03 X 10 rad/sec
= 4 deg/hr
This order of accuracy is difficult to achieve after long storage. However, the gyro is backed up by sun sensor informationjand stabilization may still be achieved via the rate gyros if their free drift is minimal. Integrating gyros may also be used in place of the rate gyros for stabilization in the event that additional backup is required. The gyros described in Table BB-5 are both proposed for missile systems in which nuclear environment is expected.
Total sensor and electronics requirements are given in Table BB-6. Command communications and the programmer are common to any system for deorbit and hence are not included here. The power supply, however, will require batteries as backup to the RTG which may be inoperative. If we design for 8. 5 hours operation (5 orbits plus deorbit time), we will require a capacity of about 467 watt-hour. Nickel-cadmium batteries have been the standard for rechargeable space power systems because of their high cycle life. However, they cannot be stored easily in an inactivated condition. Silver/zinc batteries have a very low cycle life but may be stored in charged condition and provide a power-to-weight ratio of 80 watt-hr/lb at an eight-hour discharge rate. For a one-shot operation such as we have, the Ag/Zn battery is a natural selection; these batteries are supplied by Eagle-Picher. The weight of the activation system naust also be included as well as relaying and control circuitry.
Reaction jet systems are highly reliable except for the failure mode in which valves may stick in the "on" position, depleting the fuel supply. Reliability may be assured by programmer controlled shutoff valves which limit the time that an 'on" signal may be present.
6. Summary
This analysis was undertaken to determine the cost of independent attitude control and stabilization for the RB. Environnaental considerations, safety and the as yet uncertain sequence of operations were used to size a complete control system. The results are summarized in Table BB-6 which shows a total weight of 91.7 pounds attributable to independent attitude control. It is possible to depend on the host vehicle for these functions and impose the cost of safety on the vehicle manufacturer. The system design given is quite capable of space operation with the RTG operational and the vehicle tumbling for an indefinite period of time. This may be advantageous if independent orbital test is part of the development program.
coMriDDm)^^ P.-.2Q5Q: : •se3-: • • • *
-F.-.2.. • • • • « * • • • • « • ••
• • • •
• ••
• • • • • • •
• ••
• ••
• •
• • • •

TABLE BB-6 Attitude Stabilization and Control System Characteristics
Weight Each Power Reliability Weight Item
Sun sensor
Horizon sensor
Rate gyro
Integrating gyro
Control electronics
Propellant, tankage, valves, nozzles
Power supply
(55 watts at 90% 91.7 3. 21 cu ft for 8. 5 hours)
Quantity
4
2
3
1
2
1
1
(lb)
0 . 8
1.0
0. 5
3 . 0
10.0
(watts
1.
1.
12
10
20
10
55
, avg)
5
5
-
( M T B F i n h r )
200,000
250,000
10,000
10,000
20,000
20,000
(lb
3 .
2.
1.
3 .
10.
50.
69.
22.
)
2
0
5
0
0
0
7
0
Volume
10 cu in.
22. 0 cu in
10. 0 cu in
23 cu in.
300 cu in.
2. 0 cu ft
2. 21 cu ft
1.0 cu ft

APPENDIX CC
SIX-DEGREE-OF-FREEDOM STABILITY PROGRAM
The Six-Degree-of-Freedom Stability Program is designed for the investigation of detailed motion of spinning and thrusting bodies with variable masses and inertias. The bodies may be acted upon by aerodynamic forces, and control forces may be added if required. The program is written for the IBM 1130 computer in FORTRAN IV programming language. Requirement for the capability of handling high spin rates has led to the use of integrating algorithms rather than simply the standard Runge-Kutta or other integration schemes for the inertial matrix. Therefore, some loss in accuracy is to be expected, but capability for obtaining amplitude and frequency of spin and precessional motion at reasonable computation times has been achieved.
Presented in the following sections are the program philosophy, problems for which it is intended, and a summary of the derivations of the equations mechanized with more detailed sources referenced. The program has been applied to the determination of separation and spin dynamics of the Controlled Intact Reentry (CIR) system under various trajectory conditions representative of Titan III launch trajectories.
A. PROGRAM PHILOSOPHY
Most six-degree-of-freedom programs are complex systems with many options and differing input formats. We have attempted here to write a simple program with matrix operations, such that those functions not required may simply be removed from execution by modification of the executive program. The program was mechanized for the IBM 1130 primarily because machine time for a larger computer was not available and because of its experimental nature.
Programming philosophy with regard to mechanization of the equations of motion is that force magnitudes will change less rapidly than their resolution into body axes of a spinning or tumbling vehicle. Hence, external forces (gravity, aerodynamic) are transformed into body axes once per computation cycle. Thrust forces are similarly evaluated once per cycle and the summation of forces is integrated in body axes. The body axes to inertial space transformation matrix is updated by a DDA-type algorithm eight times per cycle, however, and inertial velocities are transformed from body axes to inertial space via this matrix. This technique permits small angular steps and, actually, the number of times per cycle of matrix updating may be varied to ensure validity of the small angle approximation. The integration interval must be only small enough to prevent rapid change in the forces.
COMriDQIThM M]MP.-.205a-F.T2.. .
: i -^^S.: : . ' . • i.i

Mass and inertia properties are calculated once per cycle and their rate effects are included in the equations of motion. Provision is also made for inclusion of jet damping (the damping moment generated within a rocket chamber under constant angular rate). These effects become appreciable in deorbit of small vehicles having as much as 50% of their mass in expendable fuel.
The program includes both an atmosphere and calculation of arguments for the usual aerodynamic forces. This process is made difficult in that all angles may go through 0 to 27r and because no unique inverse of the standard Euler angle transformation is possible unless the quadrant of at least one angle is known. For this purpose, we establish the roll angle about the body axes with respect to the horizontal and compute angle-of-attack and sideslip angle as a function of relative velocities in body axes and the roll. Though ambiguities remain (i .e. , o- = 180°), they are transient and, in any case, do not affect the essential integration.
Finally, the program is pointed to design analysis of separation, spin stabilization and deorbit. For this reason, we calculate relative t r a jectory parameters as well as inertial quantities useful for impact dispersion studies with point mass trajectory programs. The origin of the inertial coordinates is placed at the initial vehicle position so that roundoff due to large numbers will not affect separation time histories.
B. PROBLEMS FOR APPLICATION
The reference configuration for the present problem (Fig. CC-1) includes a blunted cone with an equipment module attached including four solid deorbit rockets about the periphery. The vehicle is attached to a spin bearing which rides in a track. Separation is effected by a separation motor while the vehicle is simultaneously spun up by peripherally m.ounted spin rockets. The problem to be solved is the spin rate necessary to stabilize the deorbit thrust vector and determination of the motion after burnout. This motion will represent inertial conditions for atmospheric reentry. At this point the vehicle is required to aero-dynamically stabilize itself to present its ablative shield to the air s tream. Aerodynamic moments generated by the clipped section of the cone must be sufficiently large for this purpose and we would like to determine a feasible design. Thus, we would expect to produce requirements for spin rockets, deorbit propulsion alignment and aerodynamic design.
Other problems to which the program may be applied are:
(1) Short te rm stability of aircraft and lifting body vehicles.
COMriDENThM :•. "• .*. : .-. •• •MJ^D-2J350.-F-2 • : •• : . : :•; : *• - -' 3&6 : : . . • : : t : . . • •

(2) Evaluation of kinematic effects on iner t ia l guidance sys tems of the s t rapped down configuration.
(3) Separat ion p r o b l e m s , including those of ejection sea ts such as the P6M.
C. SUMMARY OF EQUATIONS OF MOTION COORDINATE SYSTEMS AND TRANSFORMATIONS
1. Ea r th Centered Iner t ia l
Xj, Yj, Z j — • E C I
^ E ' ^ E ' ^E • ea r th fixed at vehicle, EVR
B = X + w t V e
YT \ = vehicle longitude I V ^
w = ear th ra te e
t = elapsed t ime
<|> = geocentr ic latitude
TEI = Trans format ion from Ear th Fixed to Iner t ia l
TEI
-Sct CB -SB -C4)CB
-S4)SB CB -C<t>SB
C4> 0 -S4>
X
I
Y E
E
M]i^D.-.2j0507F.-2. •367*:
• • « • «
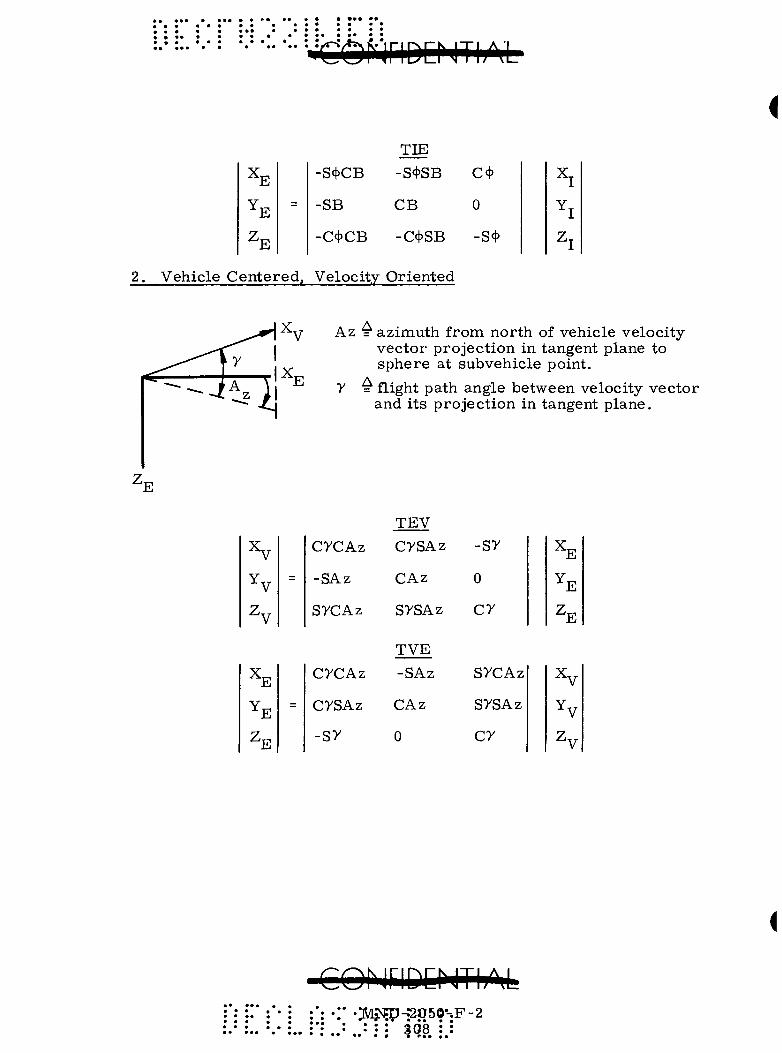
TIE
X E
E
'E
S<|3CB
SB
C<t>CB
-S4>SB
CB
-C4>SB
C<t>
0
-s<\>
X,
2. Vehicle Centered, Velocity Oriented
"E
Az
y A
azimuth from north of vehicle velocity vector project ion in tangent plane to sphere at sub vehicle point.
flight path angle between velocity vector and i ts project ion in tangent plane.
TEV
^
^v ^v
=
c y c A z
-SAz
sycAz
cySAz
CAz
sysAz
TVE
- sy
0
c y
^ E
Y E
^E
X E
E
"E
CyCAz
cysAz
-sy
-SAz
CAz
0
s y c A z
sysAz
c y
^v Yy
^v
COhiriDChlThM •:• .:MJS3P-.:205O--.F-2
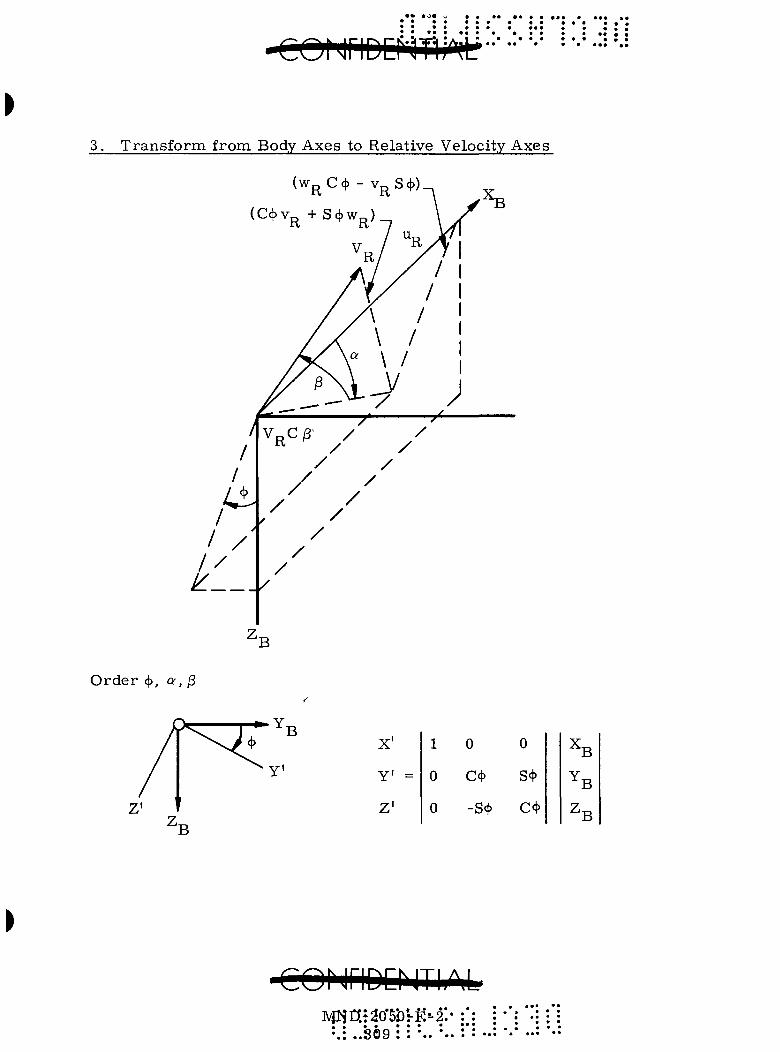
3. Transform from Body Axes to Relative Velocity Axes
(Wj^Ccf) - Vj^Scj)).
(Cct)Vp + S(f)Wj^)
Orde r 4>, a , j3
X'
Y' =
Z'
1 0 0
0 C4> Sct>
0 -s<^ c<\>
Mlia:30*5iD--iP>2:- : , I . . <!flQ • ' •.. • . : S09 : : •..
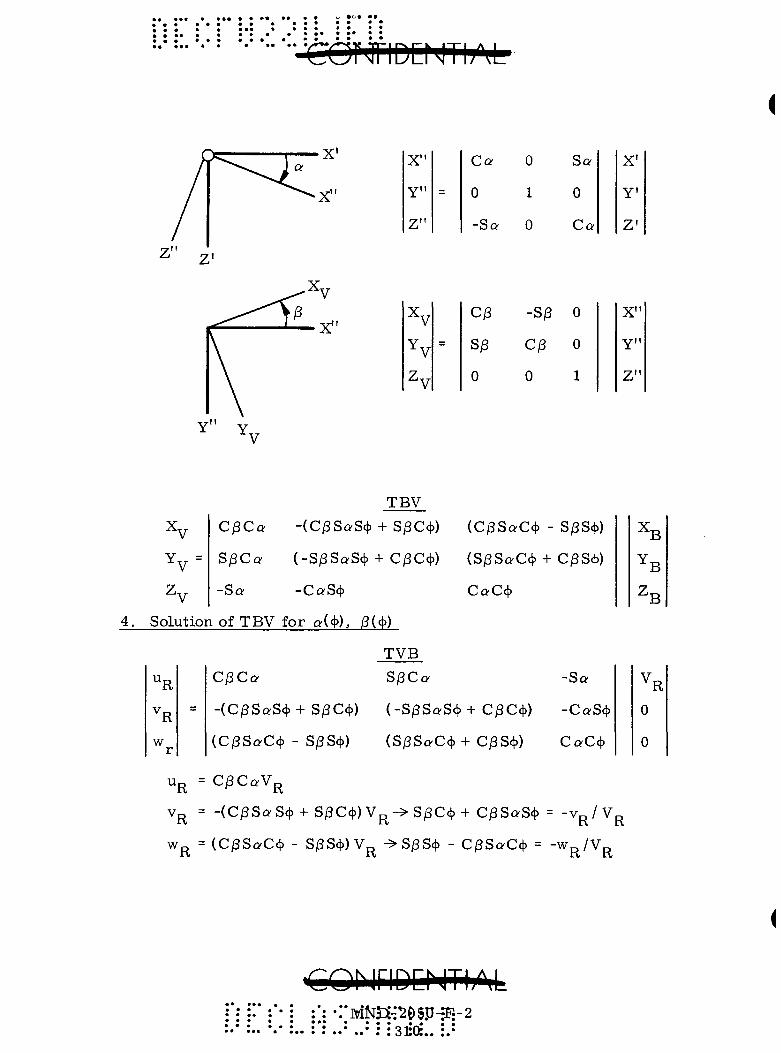
4^
1
(
• • •
«*•
. ^
».w
r
"I
: 'a
-
^ )
II II
O
•CD
C
O
o
-e-
XD
C
fl
-e-
O
•Co
C
fl o
-e- I
?o
O
to
CO
CO
?o
-e
- + CO
•C
O
O
<
^
si'
CO
•C
O
CO
-e-
33
CO
•C
O
O
-e- + n
xo
CO
p
C
O
•e- II
po
PD
•
pa
o
to
C)
p <
0
n
•CO
CO
p
o
-e- 1 CO
•C
D
CO
-e-
1 ()
xo
CO
p + CO
•C
D
o
CO
•C
O
CO
p O
-&
• + O
XD
C
O
-e-
O
p o
-e-
I CO
•C
O
CO
p
CO
-e- + O
•CD
o
-e- O
p
CO
-e-
fo o
XD
o
p
CO
CD
O
p
H
<
W
I CO
p
CO
p
CO
^ ts
K
O
II 3 o tx)
<:
^ .
^ o
5.
^
^^
^
XO
O
P O
-e-
^
CO
CD
o
p 1 CO
CO
CO
p
CO
-y
- + O
•CO
n
o
•CD
o
p 1 o
•CD
CO
p
CO
-e
- + CO
•CD
n
H
UJ
<!
-©-
-e-
co
xo
CO
p O
-&- +
, O
C
O
XD
"C
D
CO
C
O
-e-
-e-O
Xo
C
O
p o
-0-
33
IN
K5
X
W
tJd
M
O
•CO
CO
ts
<
o
< II
CO
•C
O
X
<; o XD
ts
Ui
^ II
o
X
o p
()::
::;
- a
• :
z ..
....
n
•••
•
O
I-*
t-» t^
o "<
XQ
O X
O
P IS
o ^
CO
p
X

The las t two equations give
Sa Wj^Ccj) - Vj Scj)
Vj^C^
or , from the d iagram.
Sa Wj^Ccj) - Vj S4>
UT3 + (WoC4) - v^Sct)) J 172
^R ' R ' 'R^
u Ca R
l u ^ + (WQCCJ) - v^Scj) ,172
R • v-R--^ "R-^ J
U s i n g t h e f i r s t two e q u a t i o n s of TBV
Vj^ - C^Cau^ -(Ci3S£^S4) + SjSCcjj) v^ + (C^SaC4> - SjSS^') w^
0 = S/3CaUj^ + (-S/3SaS(t>+C^Cct>) Vj^ + (SjSSoC^) + C/3S<p) Wj^
M u l t i p l y i n g t h e s e e q u a t i o n s by S^ and C^, and s u b t r a c t i n g .
S^ - (C<t>Vj + SfJ Wj )
V R T h e n ,
C^ UpjCa
V. R
T h e s e e q u a t i o n s g ive s i n e s and c o s i n e s of the a n g l e s u n a m b i g u o u s l y and, h e n c e , p e r m i t def in i t ion of t h e p r o p e r q u a d r a n t . T h e y a r e u sed in d e t e r m i n a t i o n of the a e r o d y n a m i c f o r c e s wi th an a r b i t r a r i l y defined r o l l a n g l e .
5. I n i t i a l i z a t i on
P r e s e n t i n i t i a l i z a t i o n i s b a s e d on the fo l lowing input v a r i a b l e s ,
h = a l t i t ude
V R
y
= r e l a t i v e v e l o c i t y
= r e l a t i v e f l ight p a t h ang le
OMriDCNTI,0.;i M N D . - 2 J 0 5 0 - . F - - 3 -
• • • • S l l
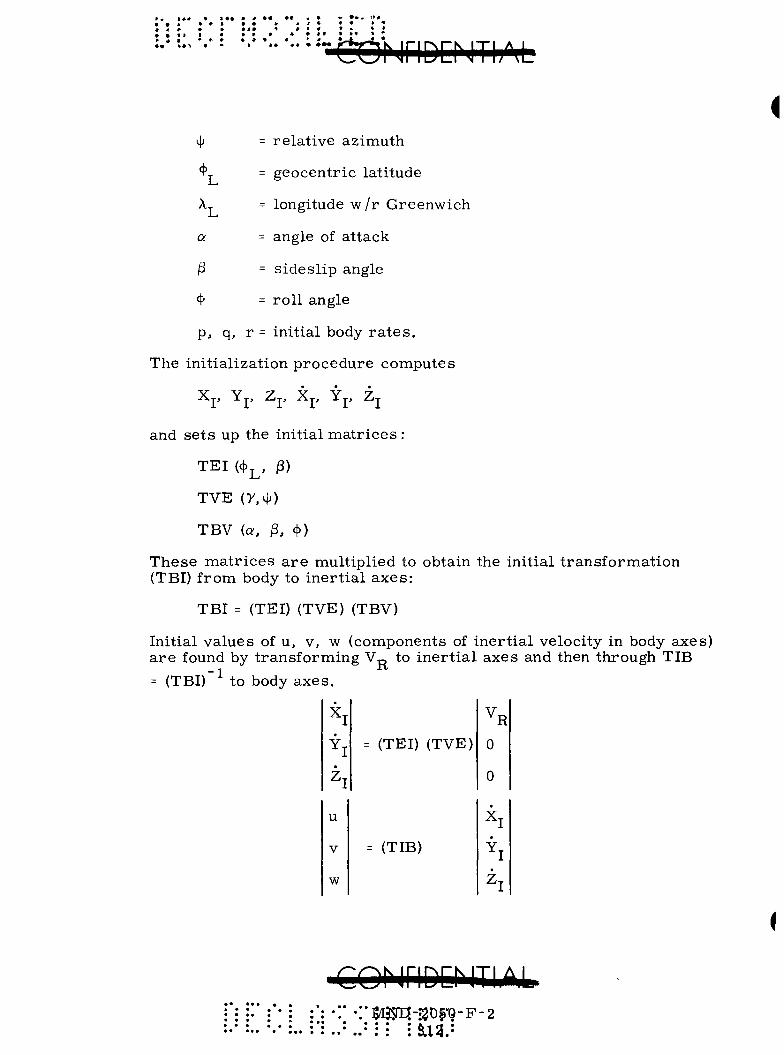
4J = relative azimuth
'T - geocentric latitude
\^ = longitude w/r Greenwich
a - angle of attack
^ = sideslip angle
4" = roll angle
p, q, r = initial body rates.
The initialization procedure computes
Xj, Yy, Zj, Xj, Yj, ZT
and sets up the initial matrices :
TEI (4) , ^)
TVE (y,ij;)
TBV (a, i3, 4))
These matrices are multiplied to obtain the initial transformation (TBI) from body to inertial axes:
TBI = (TEI) (TVE) (TBV)
Initial values of u, v, w (components of inertial velocity in body axes) are found by transforming V„ to inertial axes and then through TIB
(TBI) to body axes .
^ I
Yl
^ I
u
V
w
= (TEI) (TVE)
= (TIB)
VR
0
0
^ I •
^ I
^ I
r^ OhiriDChlTI.A.L •:']^3$rq-:3D|'o-F-2
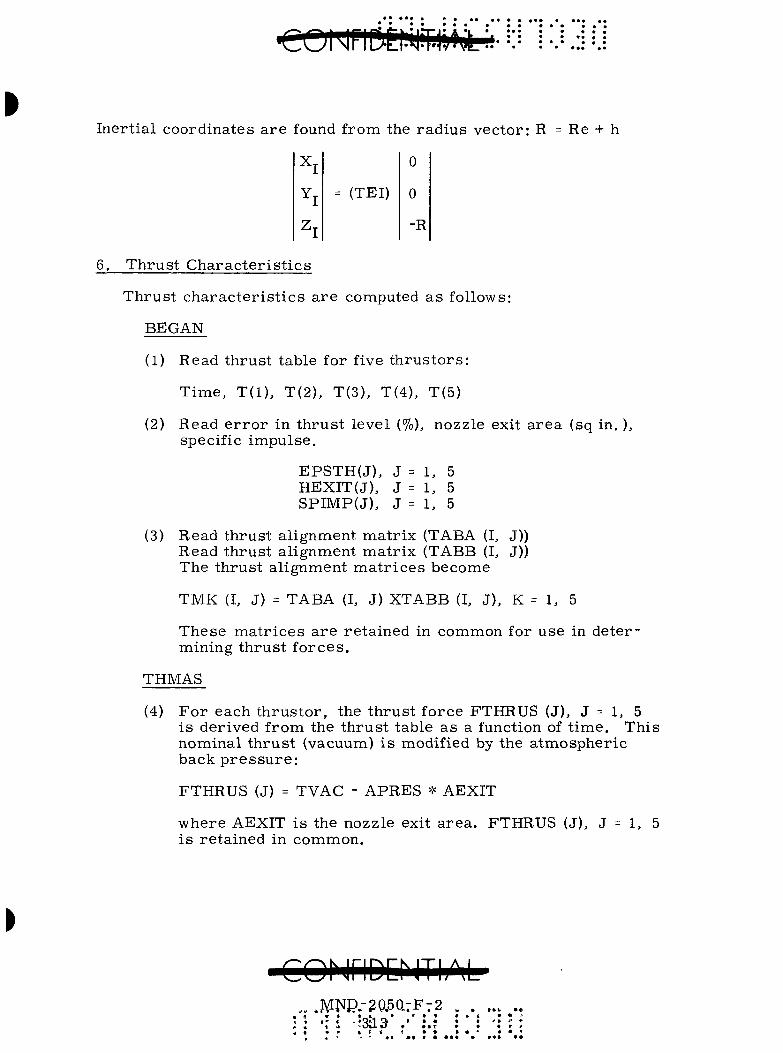
Iner t ia l coordinates a r e found from the rad ius vector : R = Re + h
X,
= (TEI)
0
0
-R
6. Thrus t Cha rac t e r i s t i c s
Thrus t cha r ac t e r i s t i c s a r e computed a s follows:
BEGAN
(1) Read thrus t table for five t h r u s t o r s :
T ime , T( l ) , T(2), T(3), T(4), T(5)
(2) Read e r r o r in th rus t level (%), nozzle exit a r ea (sq in. ), specific impulse .
EPSTH(J) , J = 1, 5 HEXIT(J), J = 1, 5 SPIMP(J) , J = 1, 5
(3) Read thrus t al ignment ma t r ix (TABA (I, J)) Read thrus t al ignment ma t r ix (TABB (I, J)) The thrus t al ignment m a t r i c e s become
TMK (I, J) = TABA (I, J) XTABB (I, J) , K = 1, 5
These m a t r i c e s a r e re ta ined in common for use in de te r mining th rus t f o r ce s .
THMAS
(4) F o r each th rus to r , the thrus t force FTHRUS (J), J = 1, 5 i s derived from the th rus t table as a function of t ime . This nominal th rus t (vacuum) i s modified by the a tmospher ic back p r e s s u r e :
FTHRUS (J) = TVAC - APRES * AEXIT
where AEXIT is the nozzle exit a rea . FTHRUS (J), J = 1, 5 i s re ta ined in common.
co^j^lDDlTlJ^L ,. .MW?.-295aTFT2
• • • ' * f ^ ' -
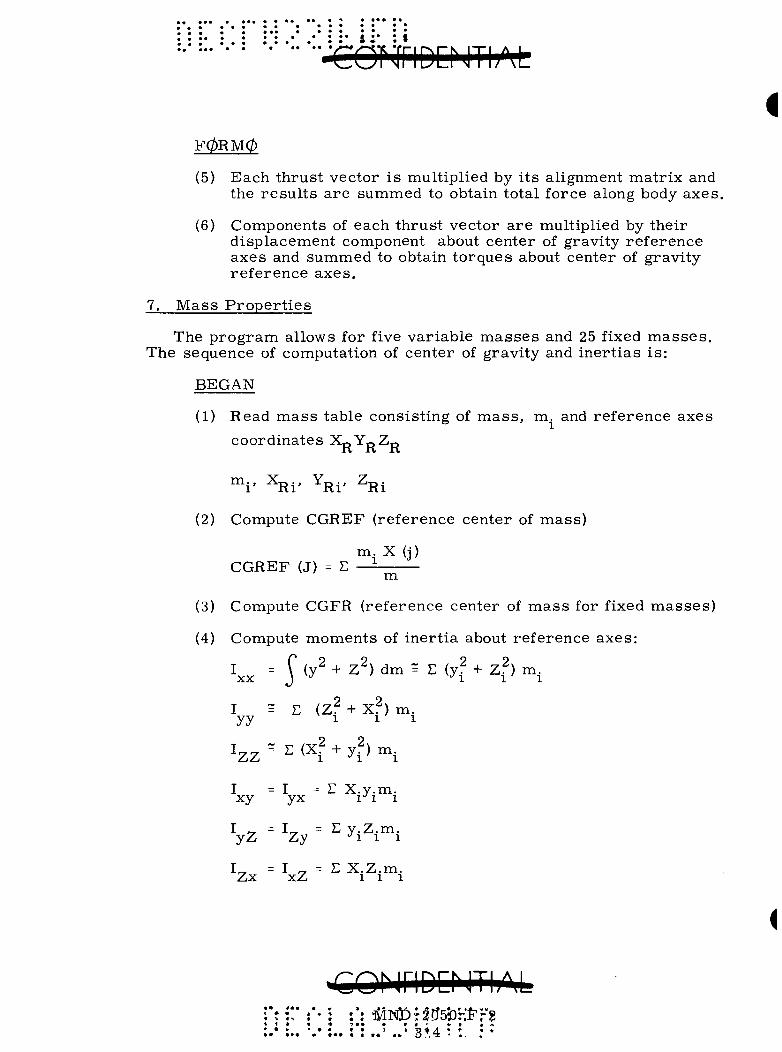
FORM0
(5) Each thrus t vector i s multiplied by i t s alignment ma t r ix and the r e s u l t s a r e summed to obtain total force along body axes .
(6) Components of each thrus t vector a r e multiplied by their d isplacement component about center of gravity re fe rence axes and summed to obtain to rques about center of gravity r e fe rence axes .
7. M a s s P r o p e r t i e s
The p r o g r a m allows for five var iable m a s s e s and 25 fixed m a s s e s . The sequence of computation of center of gravity and ine r t i a s i s :
BEGAN
(1) Read m a s s table consist ing of m a s s , m. and re fe rence axes
coordinates X ^ Y ^ Z p
" " i ' ^ R i ' ^ R i ' ^R i
(2) Compute CGREF (reference center of mass )
m. X ( j ) CGREF (J) - E
m
(3) Compute CGFR (reference center of m a s s for fixed m a s s e s )
(4) Compute moments of iner t ia about reference axes :
- y (y^ + Z^) dm ~ E (y ^ + 7}) m. X X
yy E {7.\ + X^2) m .
zz ^ ^ ^A + y?> - i
xy
yz
Zx
I = E X.y.m. v x I"' 1 1
= I zy = E y .Z.m.
' ' i 1 1
I „ - E X.Z.m. x Z 1 1 1
cor iriDD ITIJM
. ' ..' 3'.4 •• » • A

(5) Compute moments of iner t ia about reference axes for fixed m a s s e s only (as in (4)).
THMAS
(6) We have the sum of fixed m a s s e s and the fixed m a s s m o ments of iner t ia . The th rus t and m a s s flow a re computed as a function of t ime for the var iab le m a s s e s . Compute the center of gravity of var iab le m a s s as in (3).
(7) Compute var iable iner t ia about re fe rence axes as in (4).
(8) Sum fixed and var iable ine r t i a s about reference axes .
(9) T rans fo rm total iner t ia to center of gravity reference using pa ra l l e l axes theorem:
I 1 = 1 1 XXI - ^ ( ^ ^ G ^ ^ ^ G ^ - i ref
At th is point we have XIN (i, j ) , a 3 x 3 iner t ia mat r ix r e p r e s e n t ing the t ime varying iner t ia as a function of thrus t t ime his tory . We compute the r a t e of change of XIN (i, j) by saving back values, subt rac t ing from the cur ren t value and dividing by the t ime in terval .
8. Equations of Motion
a. F o r c e equations
F = (mV)
P ( x , y, z)
M
r
R
w
s® xX
Bu ^ y^Bu - ^ ^Bu
T + YYT + Z Z T lu lu lu
w X „ + w Y „ + w Z X Bu y Bu z
where u -^ unit vector
•MNDr2ea0"F.-2

The total velocity of P i s given by:
p = R + r = XXT + YY, + Z Z T ^ lu lu lu
+ (X-p, - y-nW + Z-nW ) X-o P ' 'P z P y Bu
+ (y-o + XT^W - Z-QW ) YT-, "^P P z P X Bu
+ (z-r-, - XT-,VJ + yT-,w ) ZT-,
p P y -^P X Bu Writ ing R = V in body coordinates ,
R = XX, + YYT + Z Z , - i ^ X „ + y_Y„ + y ^ Z „ lu lu lu 0 Bu ' 0 Bu " 0 Bu
where x„, y„, z„ r e p r e s e n t velocity of the origin,
p ^ ( i . + i p - y p W ^ + Z p W y ) X g ^
+ (yo + y p + X p W z " ^ p V ^ B u
+ (z„ + ZT-, - X„W + y W ) Z „ 0 P P y " P X Bu
Differentiating,
p = (x„ " yr.w + z„w ) XT-, ^ 0 " 0 z 0 y Bu
+ (y„ + x„w - z„w ) YT-, ' '0 0 z 0 X Bu
+ ( *0 " ^O^y + y0^x> ^Bu
+ [ x p - 2 y p + 2 z p - X p ( w | + w2) + yp (w^Wy-w^+Zp(Wy + w^w^) ]Xg^
+ y-o"^ 2XT-,W - 2ZT- ,W - y _ ( W + W ) + Z T - , ( W W - W ) + Z T ^ ( W + W W ) Y , - , L''P P z P X ' 'P X z P x y z P y X z J Bu
+ z* +2x-r-,w + 2z„w - z^ (w +w ) + x „ ( w „ w - w ) + y „ ( w +w w ) Z -, L P P y P x P y X P Z x y "^P x y z J Bu
Then, if P (Xp, y p , Zp) i s the center of gravity, a s sume
X p = Z p = 0, y p " Z p = y p = Z p = 0
JVII^:3»5PfFf.§ • • • • • • • • •
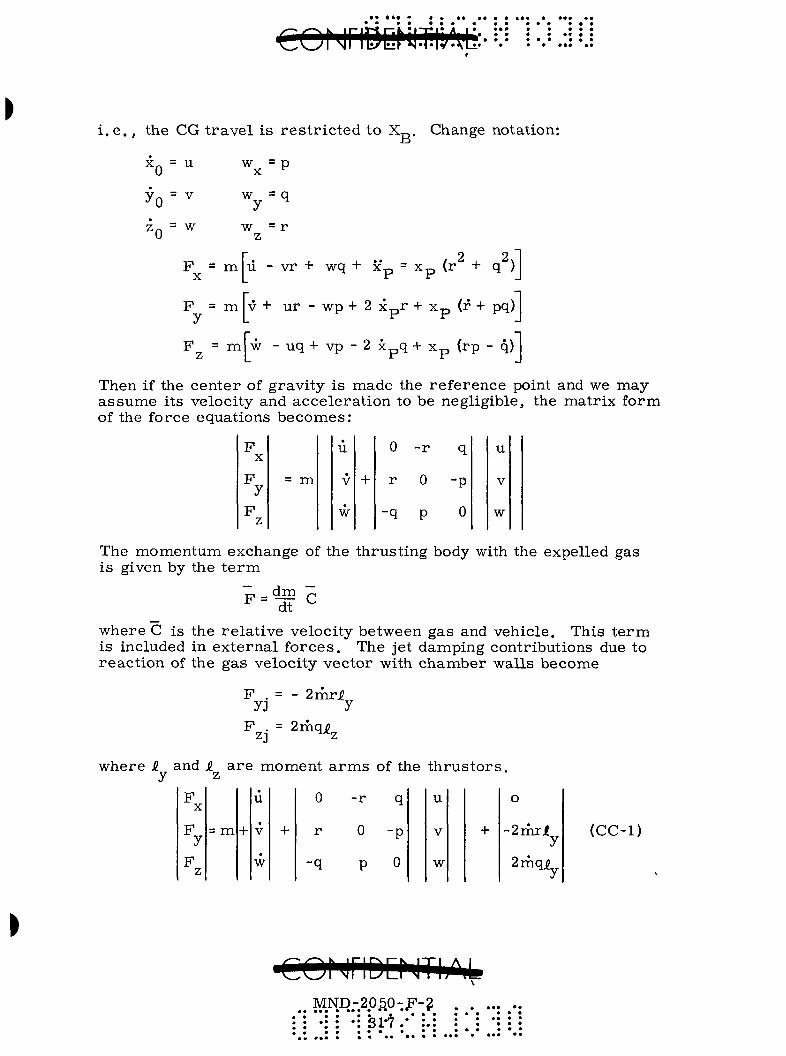
CQNriDENTPiiC:- M
i . e . , the CG t r ave l is r e s t r i c t e d to X^,. Change notation: XD
X Q = U
yo = v
ZQ = w
w = p x '^ w = q y
w = r z
F X m
F = m y
u - vr •- wq + Xp = Xp (r + q )J
V + ur - wp + 2 Xpr + Xp (r + pq)
(rp - q)J F = m w - u q + v p - 2 Xpq + Xp
Then if the center of gravity is made the re fe rence point and we may assume its velocity and accelera t ion to be negligible, the matr ix form of the force equations becomes :
F X
F y
F z
= m
• u
V
w
+
0
r
q
-r
0
P
q
-p
0
u
V
w
The momentum exchange of the thrus t ing body with the expelled gas is given by the t e r m
F = ^ C dt
where C is the re la t ive velocity between gas and vehicle. This t e r m is included in ex terna l fo rces . The jet damping contributions due to reac t ion of the gas velocity vector with chamber walls become
F . = yj
2mr i
F . = 2mqjg Z] z
where A and i a r e moment a r m s of the t h r u s t o r s . y z
F X
F y
^z
= m +
u
V
w
+
0
r
•q
-r
0
p
q
p
0
u
V
w
+
o
-2Ar iy
2rnqiy
(CC-l )
COf jriDD JTh'i^ MND-2050-^-2
'31-7 .•" '
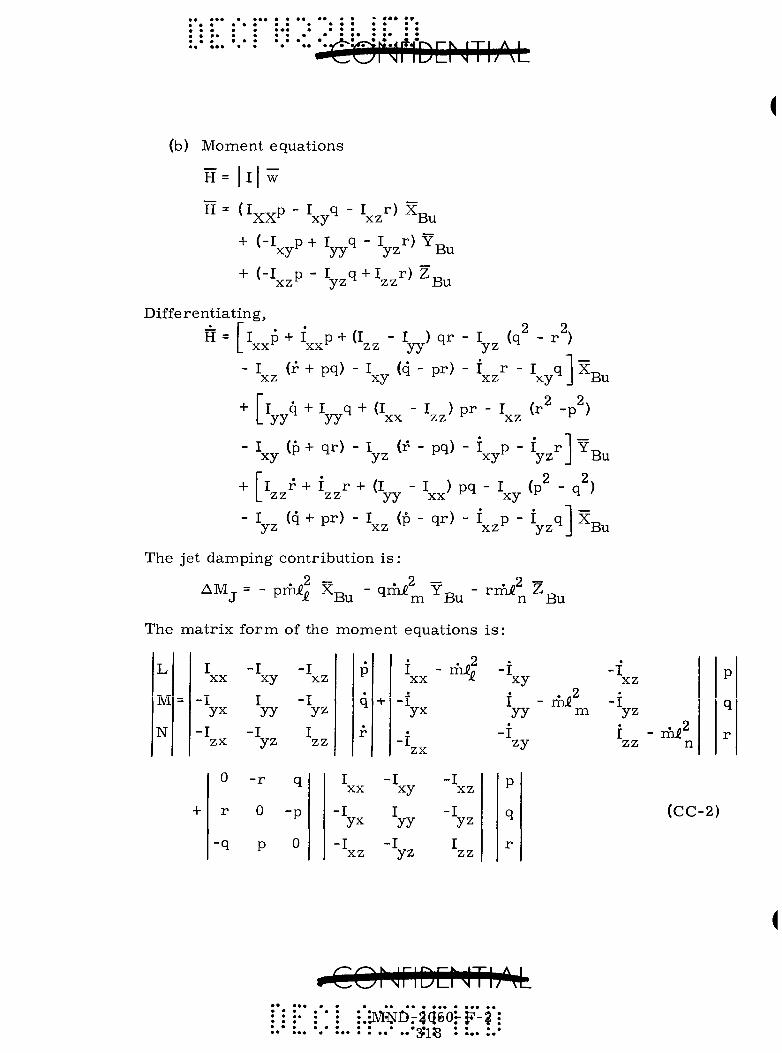
(b) Moment equations
H = I l l w
I q xy^ H x ( I ^ p
+ (-1 p + I q xy^ yy
I r ) x „ XZ Bu
I r) Y „ yz Bu
+ (-1 P xz'^ I q + I r ) Z yz zz ^Bu
Differentiating,
H = f l p + f p + (I |_ xx^ XX zz
I ) qr yy
T / 2 2, I (q - r ) yz I (r + pq) - I (q - pr) - I r
XZ '^ xy ^ '^ XZ I qlx„ xy^ J Bu
+ [ l q + I q + (I - I ) pr - I (r^ -p^) L yy yy xx zz ^ xz ' ^ '
- I (p + qr) - I (r - pq) - i p - I r l Y „ xy yz ^ xy^ yz J Bu
+ Tl r + i r + (I - I ) pq - I (p^ - q^) L zz zz yy xx "^ xy ^ ^
- I (q + pr) - I (p - qr) - i p - I q l X^ yz ^ ^ XZ ^ ^ xz^ yz J Bu yz ' XZ
The jet damping contribution is
AM. .2 - . 2 ^ . . 2 77 prhi. XT3,, - qrhi Y-^ - rmi'^ Z ^ • -K Bu ^ m Bu n Bu
The mat r ix form of the moment equations is:
L
M
N
=
] xx
-I yx
-I zx
+
0
r
-q
-I xy I yy
-I yz
-r
0
P
-I XZ
-I yz I zz
q
-p
0
• p
q
• r
+
i XX •
-I yx •
-I zx
I -I XX xy
-I I yx yy
-I :z -I yz
- mJlf -w • I -yy
-i zy
-I XZ
-V. I zz
p
q
r
. .2 mje
r
>iCONriD:MTIjM ••• • ••• r.-M^D.-SqsOrJ?-?:
: : ..• ..-3:18 • • • •
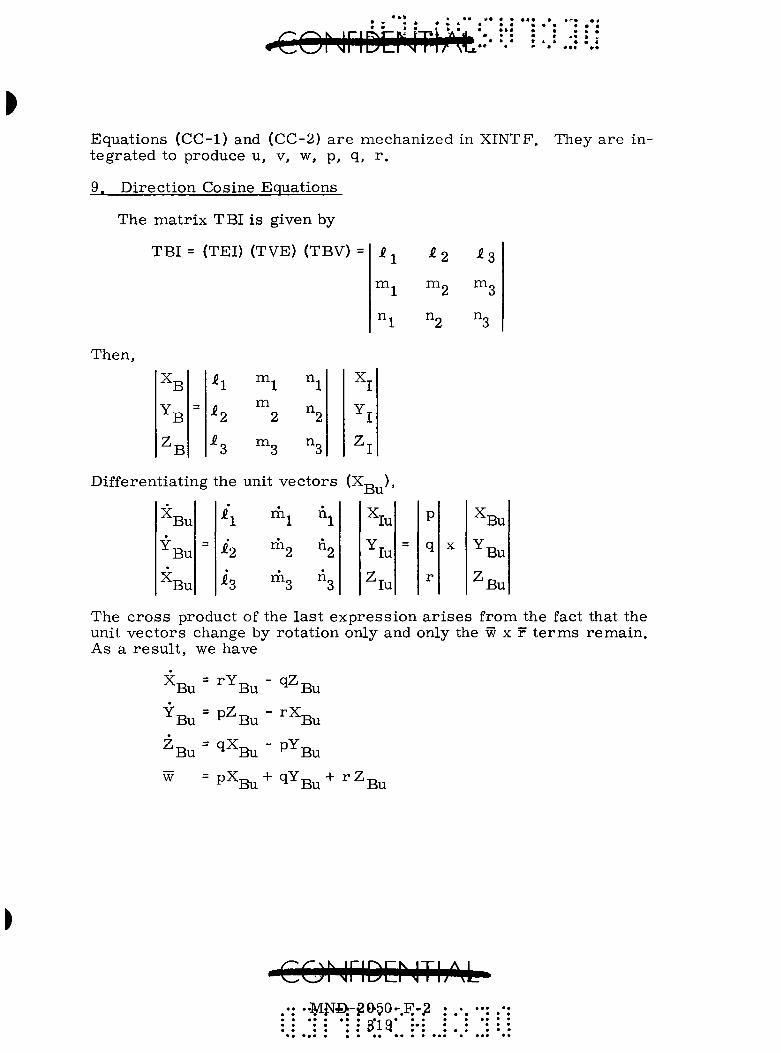
Equations (CC-1) and (CC-2) a r e mechanized in XINTF. They a r e integra ted to produce u, v, w, p, q, r .
9. Direct ion Cosine Equations
The mat r ix TBI is given by
TBI = (TEI) (TVE) (TBV) = ^ 1
^ 1
^1
^ 2
^ 2
^2
^ 3
mg
^3
Then,
X. B
Y B
B
m^
m
m.-
n^
n.
n..
X ,
Differentiating the unit vec tors (X^ ), Bu'
X Bu
Bu
X. Bu
^1
4
m.
m.
m.
n.
n^
n^
^ u
^ l u
Zlu
=
p
q
r
x
^Bu
^Bu
2 B U
The c ro s s product of the las t express ion a r i s e s from the fact that the unit vec tors change by rotat ion only and only the w x r t e r m s remain . As a r e su l t , we have
X Bu
rY^-, - q Z „ Bu ^ Bu
YT3 = p Z „ - r X „ Bu ^ Bu Bu
Z „ = qX„ - pY^ Bu ^ Bu ^ Bu
w = P X B U + qY T3 + I " Z T - ,
Bu Bu
•T? • • • • • • • • • • • • • : : • : ; S : i 9 *
• • • • « • •• •
^ ^ ^ ^
• • • • • • • • • • • • • • • •
* ! *
• • • • • • * •
?*
• •• • •
• ••
• • • • • • • • • • • •

Then,
X Bu i, X, + m, Y, + m Z , lu 1 lu 1 lu
= r je„ X, + m„ Y-. + n„ ZT 2 lu 2 lu 2 lu.
i^ X, + mo YT + n^ Z Tu lu 3 lu
Equating components along each axis ,
^ \ = r i 2 - q ^ 3
m ^ = rmg - qnig
n^ = rn2 - qng
Applying this p rocess to Y-p. and Z _ , we obtain nine differential
equations for the t ime ra t e of change of the direct ion cosines (elements of TBI):
m .
m^
m .
n .
nr
--^2
= p i 3
= q i l -
= rm2
= pm3
= qm^
= rn2 -
= pn3 -
- q ^ 3
- r i ^
•P^2
- q m 3
- rm-
- pm2
• q n g
- r n ^
n.. qn ^ - png
and fully wri t ten out.
TBI =
r^2 - q^3
rm2 - qm^
rn2 - qn3
P^3 - ^-^1
p m ,
pn3 - rn^
q i i
r m . qm.
qn,
m. p m .
pn .
CONriDCNTIjM
• • • • •*J^vJm • •••

The off-diagonal t e r m s of this set depend on both off-diagonal cosines and diagonal cosines while diagonal t e r m s depend only on off-diagonal cos ines . The integrat ion procedure is as follows:
Assume the off-diagonal t e r m s will change more slowly than the diagonal and they a r e updated f i r s t . This enables cur ren t updating of diagonal e lements d i rec t ly without repet i t ive i terat ion. Thus,
('^^2'n '
'^'A -} ^h^n - 1 - ^ ^^l^n - X
q U,)^ _ 1 - P U^)^ _ 1
At
At
(Am^) = [ r (mj)^ . j - q (mg)^ , J A *
<^3>n= [ l <">!*« - 1 - P < ™ 2 > n - l ] ^
^ I ' n '
< ^ 2 ' n '
/<^2>n - 1 - q ( 3>n - 1
.P^^3^n-1 - ^ < ^ l ^ n - 1.
At
At
update the off-diagonal elements
< V n = ^ > n - l ^ < ^ V n ' i = 2 , 3
K > n = K > n - 1-^ ^^ i>n ' '=''^
(n.)^ = (n i ) n - l + ^ V n ' i = l ' 2
It is now possible to compute the changes in diagonal e lements with updated off-diagonal t e r m s :
<^^l>n = ^ <^2>n - ^ <^3>n
(Am2)^ = p (m3)^ - r (m^)^
^^3^n='l<^l)n-PS^n
The diagonal t e r m s a re then updated as for the off-diagonals and the updated mat r ix is complete . This p rocess has demonstra ted an e r r o r of 0. 03% after nine seconds when subjected to sinusoids at one radian per second with integrat ion in terval not permit ted to exceed smal l angle i nc remen t s , i . e . , (AG/interval) 5.5°. The matr ix is updated eight t imes per integrat ion in terval of the main program, each t ime being orthogonalized as follows.
:OMriDD ITIi iU MNa-^05Q.-F-.2 „ .
i : 8 2-1 •• • .•* .•*:.:

Let the updated matrix be given by:
n.
^ C =
•^ic "^IC
^2C "^2C
' 3C "^3C
I C
n 2C
n, 3C
Let the true matrix of direction cosines be given by:
A
m.
m.
m.
n^
n^
n^
Now, A is orthogonal, its determinant is one and each element is equal to its cofactor. Assume a constant error , a, is introduced at each time step:
A^ = (1 +a)A
The inverse of Ap is then
-1 ' A T 1 +Cf
T -1 where T indicates the transpose (A = A ) F o r Q ' « l , the Maclawin expansion
i = n _ ^ \ J. «2 ^3 1+a ^^ « , . ^
converges rapidly and we retain only the terms in parentheses.
Substituting, A^"-" = (1 -a) A^
-IvT The average of corresponding terms in (Ap ) and Ap eliminates the
assumed e r ror for
i [ ( A , - ) - . A j = A [ L ^ . ^ ] = A
c »» •. *M^'-*2S56'-iF-2 • *3k2 U'

•GOMmENiriM i -.=.-.i
The orthogonalization is mechanized in XINTF by the following equations :
(1) Determinant of A c
A = i^ m2 n3 + £3 m^ n2 + H^ m^ n^
- i 3 m 2 n ^ - ig ^ 1 ^3 " ^ "^3'^2
(2) The e lements of the t r anspose of the inverse (A )
^1 = ^ 2 ^ 3 " " 2 ^ 3
I sT
4 = n^mg - m ^ n g
i ^ = m^ n2 - n^ m2
m ; = n 2 i 3 - SL^n^
m- = ^1 Hg - n^ ^g
"^3 = ^1 ^2 " ^2 ^1
n' = ^2 "^3 " "^2 - 3
"2 = "^1 ^3 " h "^3
^3 = - 1 "^2 " "^1 h
and to r e tu rn to the original notation, the updated matr ix becomes :
(TBI) n ' 2 ( ^ c ) +A.
J n
10. Gravitat ional Accelera t ions
Expansion of the gravitat ional potential in t e r m s of Legendre func tions of geocentr ic lati tude, P^ {^)
4 n
U = ^ ^ R - f ( ^ ) -2-f (f) P3-i(f) 4
CQMriDEMTh^U MNDt-j20.50r.FF3. . . • ••
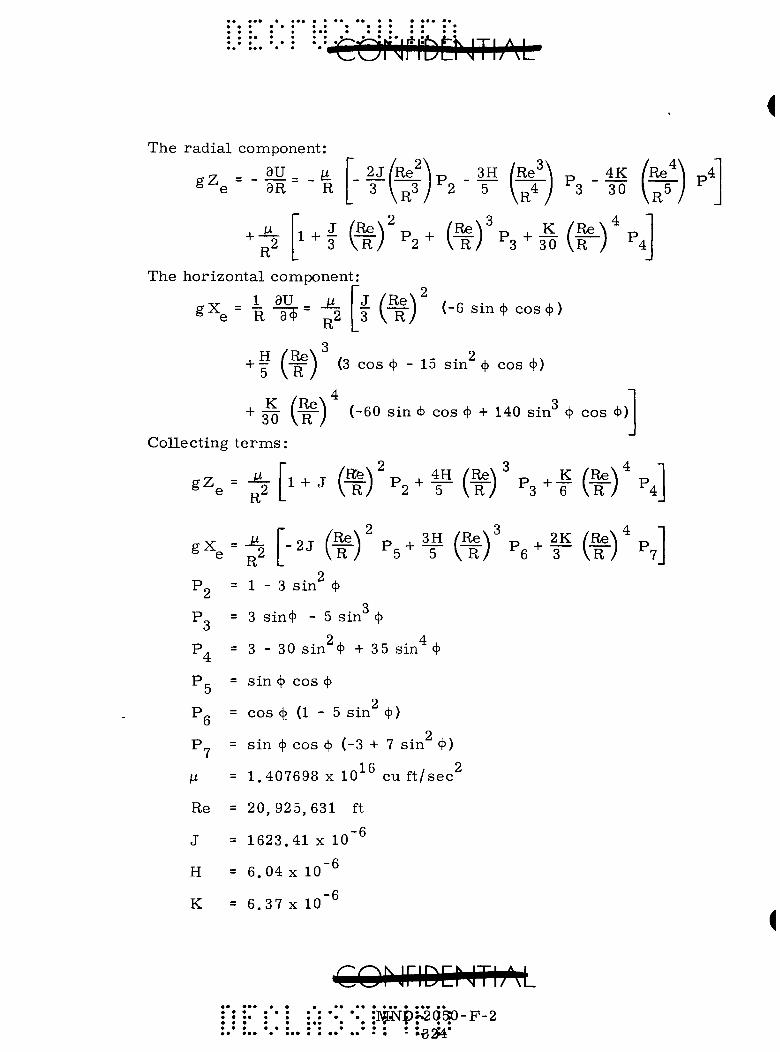
• • • • • • • • •, •• ••• • • • •Cdl'"i|flt)t:hTI;M
The rad ia l component:
^ e 8R R 2 j / R e ^ ^ p 3H / R e i \ p 4K (B^ 3 \ R V 2" 5 U J ^ 3 - 30 U5^
R2
The hor izontal component:
S e R T ^ j^2 •o ( " R ' ) ^"6 sin 4) cos 4 )
+ — f-p- j (3 cos 4^ -15 sin 4) cos 4>)
-t- ^ ( ^ ) (-60 sin 4> cos 4' -1- 140 sin^ 4 cos <^)
Collecting t e r m s :
«^==^[ - j ( t ) ' - 2 - f ( f )^3 - f ( f ) ' - . R
g x = - ^ ^ R2 [-(f)'p5^f (t)^6^F(f)'p7;
P2 = 1 - 3 sin 4> 3
P„ = 3 sin4' - 5 sin 4'
P^ = 3 - 3 0 sin^4> -1- 35 sin^ 4>
Pi- = sin ^ cos 4" 2
P„ = cos 4? (1 " 5 sin 4>) 2
P_ = s in 45 cos 4" (-3 + 7 sin <\>)
H = 1.407698 X 10^^ cu f t / sec^
Re = 20,925,631 ft
J = 1623.41 X 10"^
H = 6.04 X 10"^
K = 6.37 X 10"^
:MJ^D^2030-F-2 • • • • - ••e2?4'
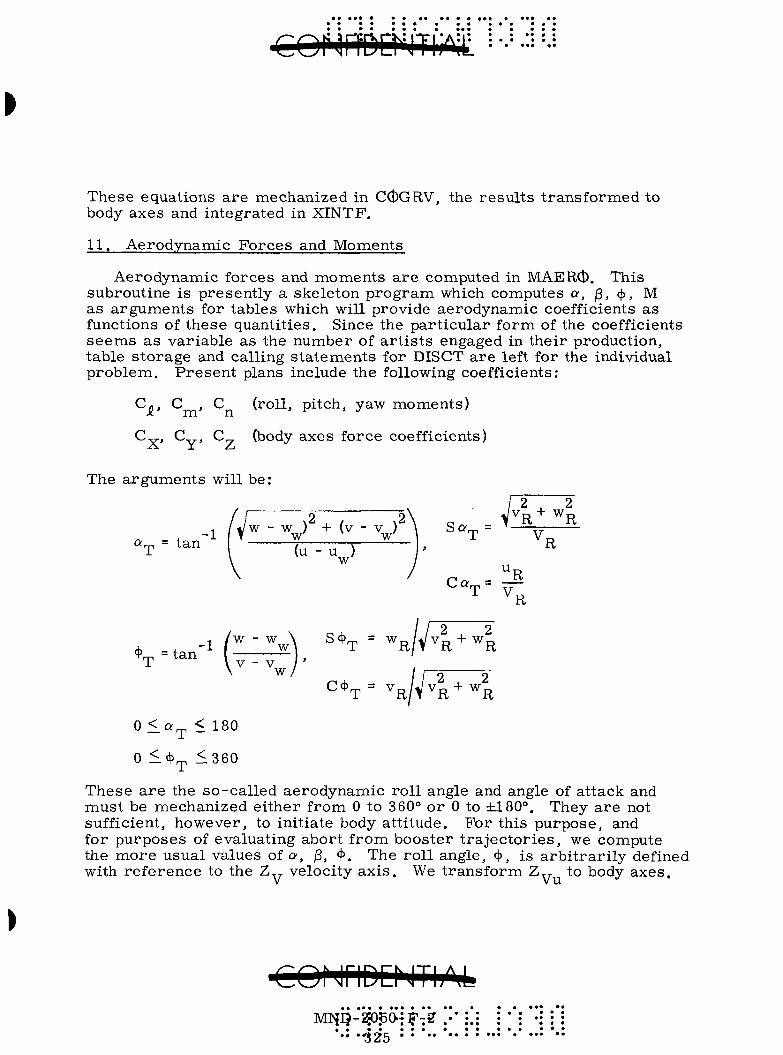
I
These equations are mechanized in CCDGRV, the results transformed to body axes and integrated in XINTF.
11. Aerodynamic Forces and Moments
Aerodynamic forces and moments are computed in MAERd). This subroutine is presently a skeleton program which computes a, j3, 4'» ^ as arguments for tables which will provide aerodynamic coefficients as functions of these quantities. Since the particular form of the coefficients seems as variable as the number of art ists engaged in their production, table storage and calling statements for DISCT are left for the individual problem. Present plans include the following coefficients:
Cg, C , C (roll, pitch, yaw moments)
C„ , C^, C (body axes force coefficients)
The arguments will be:
1 / t / w - W ) -(- (v - V ) \ S« rn = - I T W W I T
• . /
2 ^ 2 ^ R + ^ R
C - T = ^ R
4> = tan-^ /!LlZw\ '*'T = ^ R / V 4 + 4 \ w
^'^T= MV4+^R 0 < « ^ < 180
0 < 4^^ <360
These are the so-called aerodynamic roll angle and angle of attack and must be mechanized either from 0 to 360° or 0 to ±.180°. They are not sufficient, however, to initiate body attitude. For this purpose, and for purposes of evaluating abort from booster trajectories, we compute the more usual values of a, /3, 4>. The roll angle, <\>, is arbitrarily defined with reference to the Z „ velocity axis. We transform Z „ to body axes.
>
CQMriDENTh'^4. MIiI?-2J0^OT5^-2 .•• :•.:
•• "325
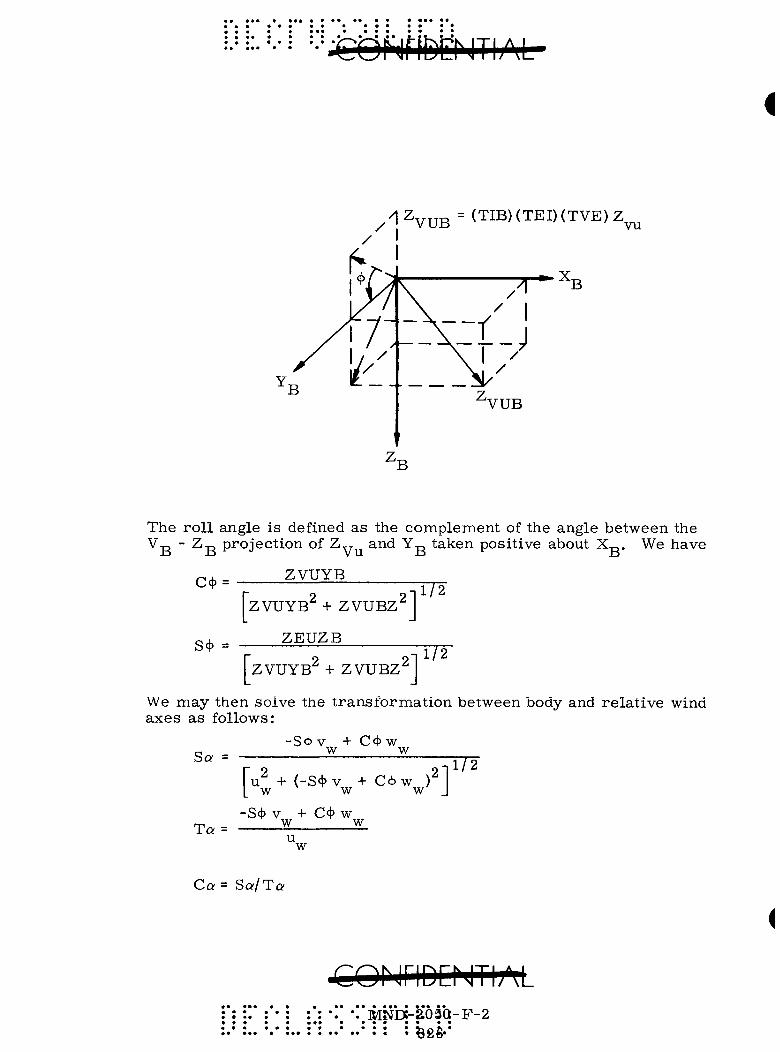
i
/ ^ ^ V U B = ( T I B ) ( T E I ) ( T V E ) Z ^
T p ^ ^ B
VUB
'B
The ro l l angle is defined as the complement of the angle between the V-p. " Z „ projection of Z ^ and Y-p. taken positive about Xp.. We have
C4.= ZVUYB
ZVUYB^ + ZVUBZ^ T72
S<^ = ZEUZB
ZVUYB^ + ZVUBZ^ T72-
We may then solve the t ransformat ion between body and re la t ive wind axes as follows:
Sa
Ta =
-Sct^v + C4>w w w
Tu^ + (-S<t>v + Cc|)w )^1 L w w w J
172
•S* V + C4' w w w_ u w
Ca= Sa/Ta
iCOrjriDCMTIAL ' . •• MNDC-a03Q-F-2
• • • • • • • •
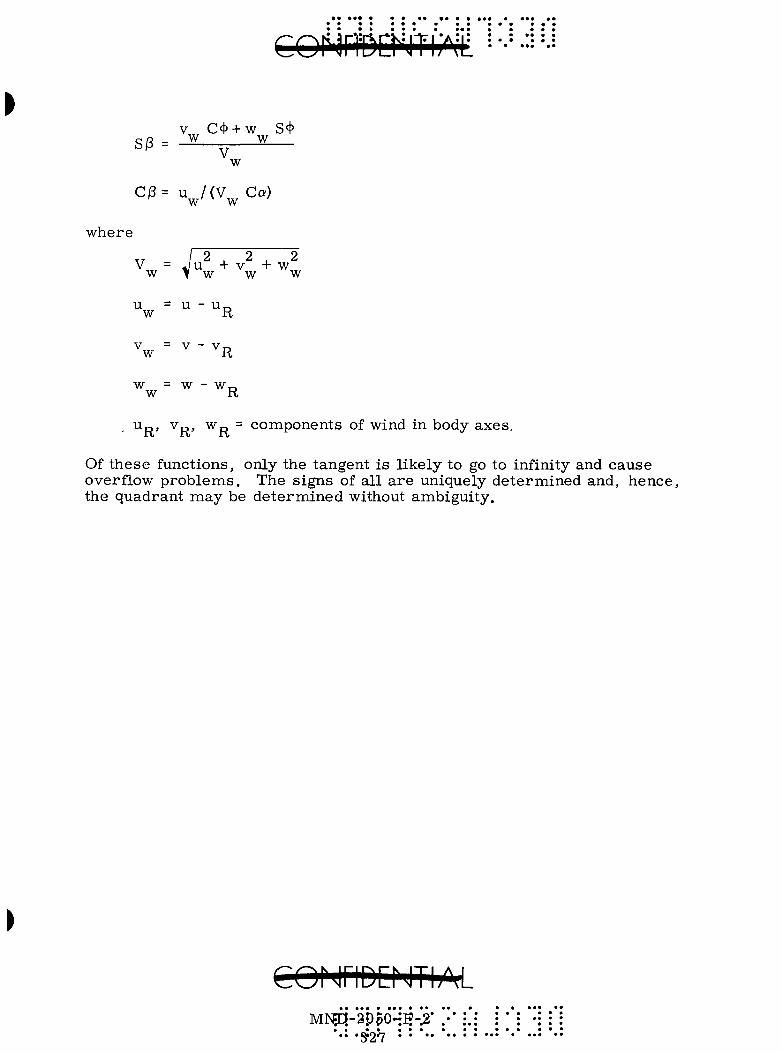
v C4' + w S9 S|3 = JK w
V w
C/3= u /(V Ca) W W
where
, , - 2 _ 2 , 2 V = J u + v + w w > w w w
U = U - U r ,
w R
V = V - Vx-,
w R w = w - Wn w R
Up, Vp, Wp = components of wind in body axes. 'R' ' R ' R
Of these functions, only the tangent is l ikely to go to infinity and cause overflow p rob lems . The signs of all a r e uniquely determined and, hence, the quadrant may be de termined without ambiguity.
CONriDCNTIAL M]S5q-ap5o~i?-2' .•
•S'27
REFERENCES
C C - 1 . "S ix -Degree -o f -Freedom Fl ight-Path Study, General ized Computer P r o g r a m , Pa r t I, P rob lem Formula t ion , " AF FDL TDR-6 4 - 1 , P a r t I, Volume I.
CC-2 . Byrne, B. , Murphy, W. and Lanzkron, R. W. , "Gimballess Iner t ia l Reference System, " IRE Convention Record, 1963.
C C - 3 . "System/360 Scientific Subroutine Package (360A-CM-03X), P r o g r a m m e r ' s Manual, " IBM Publication H20-0Z05-0.
CC-4 . Ried, R. C. J r . and Mayo, E . E. , "Equations for the Newtonian Static and Dynamic Aerodynamic Coefficients for a Body of Revolution with an Offset Center of Gravity Location, " NASA TND-1085.
CONriDQJTIjM •]bltfl>&05Q-F-2
H28 : • • • %,

APPENDIX DD
PROPULSION ANALYSIS
The reference configuration requires propulsion for spin-up, separation of the CIR-RTG/RB from the launch vehicle, deorbit and despin prior to initial reentry. In all cases, performance requirements were compared with existing rocket motors to minimize the necessity for new rocket programs.
A. SEPARATION
The particular mode of operation selected for separation of the CIR-RTG/RB from the launch vehicle makes it desirable, if not mandatory, that the ejection velocity be achieved by the time the CIR-RTG/RB leaves the launch rails which are 2. 31 feet in length. To achieve this ejection velocity without excessive accelerations (hence extremely short burning durations), an ejection velocity of 20 fps was assumed. On this basis , a rocket burning duration of about 0. 23 second i s r e quired. The average mass to be accelerated in 0. 231 second is approximately 23.9 slugs (770 pounds); therefore, the thrust required is 2070 pounds.
In summary, the separation rocket motor must provide:
(1) Thrust 2070 pounds
(2) Duration 0.231 second
(3) Total Impulse 478 lb-sec
An existing rocket motor, the MARC 17D1 manufactured by Atlantic Research, meets the burning time requirements with a 0. 2317-second duration, but generates approximately 2. 5 times the required thrust level. The proven design concept, which utilizes a number of propellant "sticks" with circular perforations, is recommended for the reference vehicle separation motor. A new motor has been designed which is a scaled version of the MARC 17D1. The number of propellant sticks has been reduced to 10 and the length of the sticks has been reduced proportionately to yield the desired performance. The design details are presented later in this appendix. Table DD-1 lists the major parameters for the new unit. The configuration is shown on the inboard profile (Fig. III-l).
€ O I JriDD vlTI/' rfc MIjip-'4of50J-f r2 !•• :.':
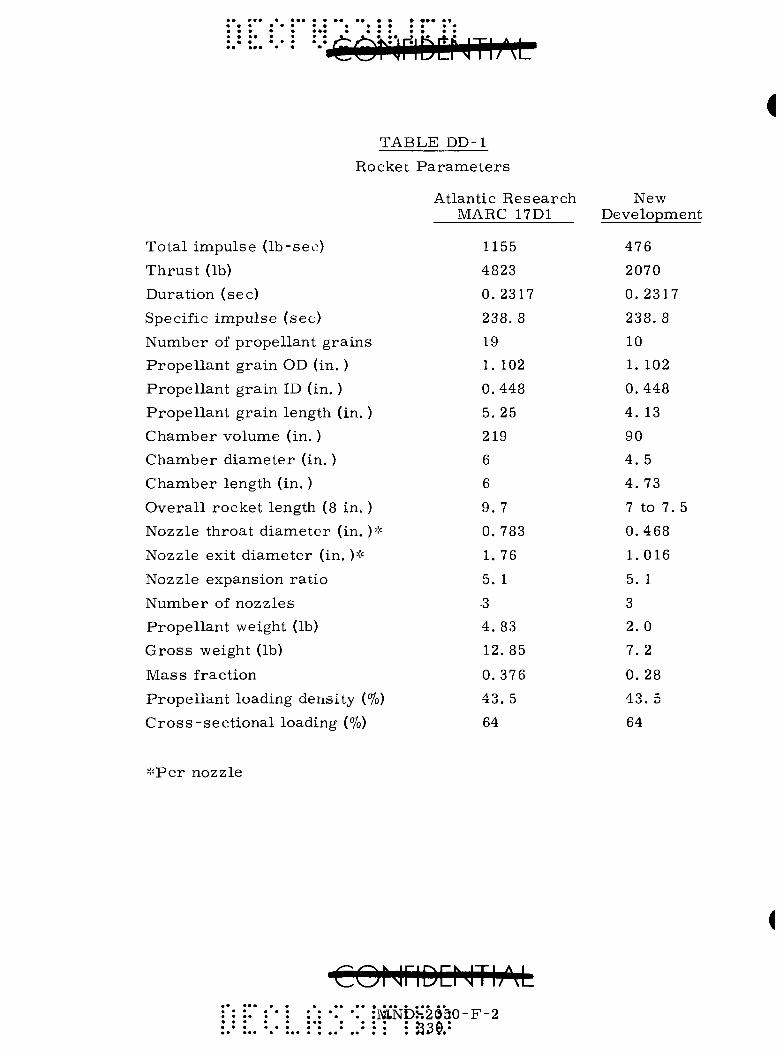
TABLE DD-1
Rocket Param.eters
Total impulse (lb-sec) Thrust (lb) Duration (sec) Specific impulse (sec) Number of propellant grains Propellant grain OD (in. ) Propellant grain ID (in, ) Propellant grain length (in. ) Chamber volume (in. ) Chamber diameter (in. ) Chamber length (in.) Overall rocket length (8 in. ) Nozzle throat diameter (in. )-•' Nozzle exit diameter (in. )* Nozzle expansion ratio Number of nozzles Propellant weight (lb) Gross weight (lb) Mass fraction
Propellant loading density (%) Cross-sectional loading (%)
A t l a n t i c R e s e a r c h MARC 17D1
1155
4823
0, 2317
2 3 8 . 8
19
1. 102
0 . 4 4 8
5 .25
219
6
6
9. 7
0 .783
1, 76
5. 1
3
4 . 8 3
12 ,85
0 . 3 7 6
4 3 . 5
64
New D e v e l o p m e n t
476
2070
0 , 2 3 1 7
2 3 8 . 8
10
1, 102
0 , 4 4 8
4, 13
90
4 . 5
4 . 73
7 to 7. 5
0 , 4 6 8
1,016
5, 1
3
2 , 0
7 , 2
0. 28
4 3 , 5
64
*Per nozzle
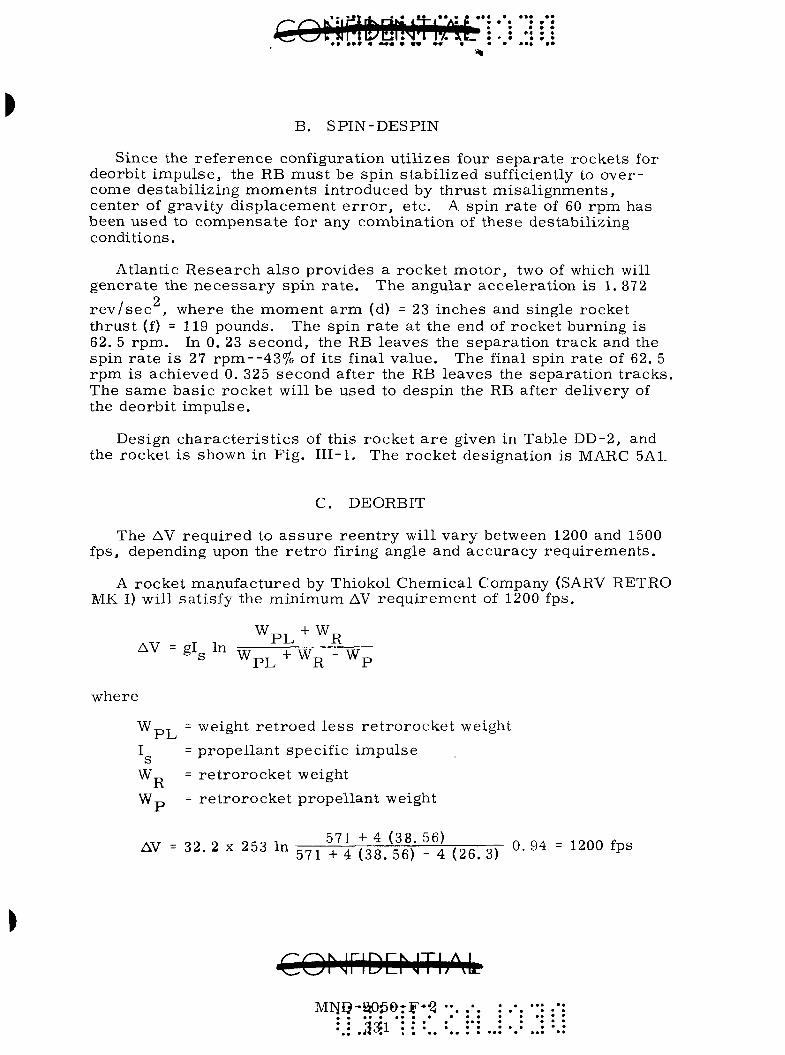
5 *
B, SPIN-DESPIN
Since the r e fe rence configuration ut i l izes four separa te rockets for deorbit impulse , the RB mus t be spin s tabi l ized sufficiently to over come destabi l iz ing moments introduced by thrus t misa l ignments , center of gravity d isplacement e r r o r , e tc , A spin r a t e of 60 rpm has been used to compensate for any combination of these destabilizing conditions.
Atlantic R e s e a r c h a lso provides a rocket motor , two of which will genera te the n e c e s s a r y spin r a t e . The angular accelera t ion is 1, 872
9 r e v / s e c , w h e r e the m o m e n t a r m (d) = 23 i n c h e s and s i n g l e r o c k e t t h r u s t (f) = 119 p o u n d s . T h e sp in r a t e a t t he end of r o c k e t b u r n i n g i s 62, 5 r p m . In 0. 23 s e c o n d , the RB l e a v e s the s e p a r a t i o n t r a c k and the sp in r a t e i s 27 r p m - - 4 3 % of i t s f ina l v a l u e . T h e final sp in r a t e of 62, 5 r p m i s a c h i e v e d 0, 325 s e c o n d a f t e r the RB l e a v e s the s e p a r a t i o n t r a c k s . T h e s a m e b a s i c r o c k e t wi l l be u s e d to d e s p i n the RB a f t e r d e l i v e r y of the d e o r b i t i m p u l s e .
D e s i g n c h a r a c t e r i s t i c s of th i s r o c k e t a r e g iven in T a b l e D D - 2 , and the r o c k e t i s shown in F i g . I I I - l . T h e r o c k e t d e s i g n a t i o n i s MARC 5A1.
C. D E O R B I T
T h e AV r e q u i r e d to a s s u r e r e e n t r y w i l l v a r y be tween 1200 and 1500 fps , depend ing upon the r e t r o f i r ing ang le and a c c u r a c y r e q u i r e m e n t s .
A r o c k e t m a n u f a c t u r e d by T h i o k o l C h e m i c a l C o m p a n y (SARV R E T R O MK I) w i l l s a t i s f y the m i n i m u m AV r e q u i r e m e n t of 1200 fps .
AV = gl In W + W
P L R W P L + W R - W ]
w h e r e
W p j = we igh t r e t r o e d l e s s r e t r o r o c k e t we igh t
I = p r o p e l l a n t s p e c i f i c i m p u l s e
W,, = r e t r o r o c k e t we igh t
W-o - r e t r o r o c k e t p r o p e l l a n t we igh t
AV = 32, 2 x 253 In 571 + 4 (38. 56)
571 + 4 (38 . 56) - 4 (26, 3) 0. 94 - 1200 fps
•CONriDENTIAL
• • ••• • • • • * : : 33:1 : : : :
• • • • *

TABLE DD-2
Rocket Motor Design Charac t e r i s t i c s
Function
Rocket designation
Manufacturer
Performance requirement Average thrust (vac) (lb)
Duration (sec)
Total impulse (vac) (lb-sec) Specific impulse (vac) (sec)
Chamber pressure (psi)
Loaded weight (lb)
Weight expended (lb) Mass fraction Loading density (%) Throat diameter (m. ) Exit cone diameter (in. ) Expansion ratio Number of nozzles Motor diameter (in.) Motor length (m.)
Temperature limits ("F)
Number required
Status
Remarks
Separation
Atlantic Research
20 fps
2070 0.231 476
238.8
2380
7.2
5.2
0. 28 0.23 0.468 1.016 5. 1 3
4 . 5
7 .5
+20 to 125
1
Requirement for CRONUS Recommended for reference configuration (scale version of ARC'S MARC 17D1)
Spin-Despin
MARC 5A1 Atlantic Research
60 rpm
119
0. 556 66
238
1150
1.45
1. 15 0. 190 84. 5 0. 30 1.70 32.0 1
2
8.3
-35 to +160
4
Production
Selected for reference configuration
--60 rpm
275
0. 23 66
238
1150
1.60
1.30 0. 175 84. 5 0.455 2.58 32
1
2. 6 (est) 5. 5 (est) -35 to 160
4
Requirement for CRONUS
Deorbit
SARV MKI Thiokol
1200 fps
755
9
6660
253
1175
38.56
12.09 0.676 84.8 0. 716
3. 29 21. 2 1
10
12
40 to 110
4
PFRT
Selected for reference configuration
--1500 fps 3300
10
33,000 260
1000
153 (est)
36 (est)
0.83 85
1. 10 6.0
30
2
16.5 Sphere 40 to 110
1
Requirement for CRONUS
Alternative approach to MK I
SARV MK IV Thiokol
1500 fps
820
10.9
8900 255
700
55.2
20.7 0. 636 80
0.97 4.40 20. 6
1
12
12. 76 40 to n o
4
Production
Must be modified
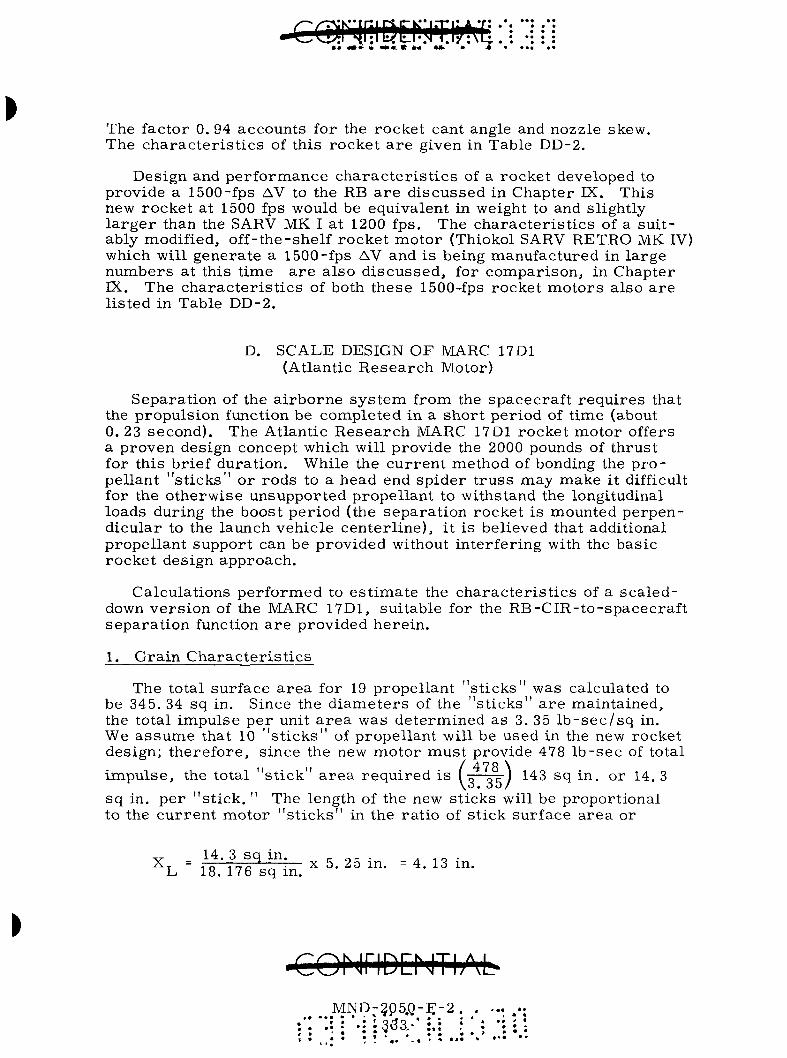
The factor 0, 94 accounts for the rocket cant angle and nozzle skew. The cha rac t e r i s t i c s of this rocket a r e given in Table DD-2,
Design and pe r fo rmance c h a r a c t e r i s t i c s of a rocket developed to provide a 1500-fps AV to the RB a r e d iscussed in Chapter IX. This new rocket at 1500 fps would be equivalent in weight to and slightly l a r g e r than the SARV MK I at 1200 fps. The cha rac t e r i s t i c s of a sui t ably modified, off-the-shelf rocke t motor (Thiokol SARV RETRO MK IV) which will genera te a 1500-fps AV and is being manufactured in la rge numbers at this t ime a r e a lso d i scussed , for compar ison, in Chapter IX. The cha rac t e r i s t i c s of both these 1500-fps rocket moto r s also a r e l i s ted in Table DD-2.
D. SCALE DESIGN OF MARC 17D1 (Atlantic R e s e a r c h Motor)
Separat ion of the a i rborne sy s t em from the spacecraf t r equ i re s that the propuls ion function be completed in a shor t per iod of t ime (about 0. 23 second). The Atlantic R e s e a r c h MARC 17D1 rocket motor offers a proven design concept which will provide the 2000 pounds of thrust for this brief durat ion. While the cu r ren t method of bonding the p r o pel lant " s t i cks" or rods to a head end sp ider t russ may make it difficult for the o therwise unsupported propel lant to withstand the longitudinal loads during the boost per iod (the separa t ion rocket is mounted perpendicular to the launch vehicle center l ine) , it is believed that additional propel lant support can be provided without interfer ing with the basic rocket design approach.
Calculat ions pe r fo rmed to es t imate the cha rac t e r i s t i c s of a sca led-down ve r s ion of the MARC 17D1, suitable for the RB-CIR- to-spacecraf t separa t ion function a r e provided here in .
1. Gra in C h a r a c t e r i s t i c s
The total surface a r ea for 19 propel lant " s t i cks" was calculated to be 345, 34 sq in. Since the d i a m e t e r s of the " s t i cks" a r e maintained, the total impulse pe r unit a r e a was determined as 3, 35 I b - s e c / s q in. We a s s u m e that 10 " s t i ck s " of propel lant will be used in the new rocket design; there fore , s ince the new motor mus t provide 478 l b - s ec of total
( 478 \ o oc: ) 143 sq in . or 14, 3
sq in. pe r "s t ick. " The length of the new st icks will be proport ional to the cu r r en t motor " s t i c k s " in the ra t io of st ick surface a r ea or
^ 14 , 3 s q i n , r oir • /i i o • X . = 1 o ^^c „ •— X 5, 25 m . = 4, 13 m, L 18, 176 sq m .
•COhJriDEMTIAL M N D - ? p 5 . Q , - i r - 2 , . . ; , .
: . . . . . . . ^vsA- : . ; ; . . ; . » , . ; • : ; . . -. . . .*
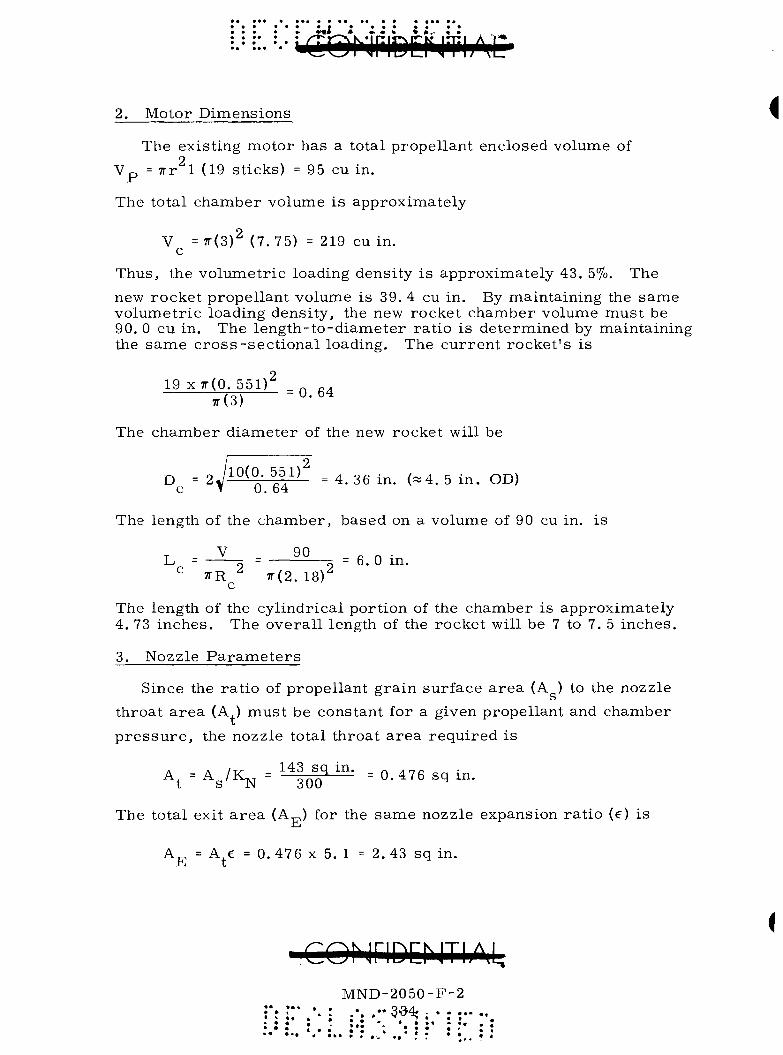
2. Motor Dimensions
The existing motor has a total propel lant enclosed volume of 2
V p = 7rr 1 (19 st icks) = 95 cu in.
The total chamber volume is approximately
V =5r(3)^ (7,75) = 219 cu in, c
Thus, the vo lumet r ic loading density is approximately 43, 5%. The
new rocket propel lant volume is 39, 4 cu in. By maintaining the same volumetr ic loading densi ty, the new rocket chamber volume mus t be 90, 0 cu in. The l eng th- to -d iamete r ra t io is determined by maintaining the s a m e c r o s s - s e c t i o n a l loading. The cu r r en t rocke t ' s is
19 x7r(0, 551)^ „ „. ^(3) ° -6^
The chamber d iamete r of the new rocket will be
D = 2^^°^"- y / ^ = 4. 36 in. («4. 5 in . OD) c T 0. 64
The length of the chamber , based on a volume of 90 cu in. is
T V 90 „ „ . L = ^ = 7) = 6,0 m,
^ TR ^ 7r(2. 18)" c
The length of the cyl indrical port ion of the chamber is approximately 4, 73 inches . The overa l l length of the rocket will be 7 to 7, 5 inches , 3, Nozzle P a r a m e t e r s
Since the ra t io of propel lant gra in surface a r ea (A ) to the nozzle
throat a r e a (A ) mus t be constant for a given propellant and chamber
p r e s s u r e , the nozzle total throat a r e a requ i red is
^ = s / ^ N ^ ' - ^ 1 ^ ^ = 0 , 4 7 6 s q i n .
The total exit a r e a (A^-,) for the s ame nozzle expansion ra t io (e) is
A „ = A^e = 0, 476 x 5. 1 = 2. 43 sq in. HI t
T"
* •
T ZTT^T^
MND-• • •• • • • .
I t * • • • »
^^^^^F
•2050-304^;
• • • • t •
*^
F -
« • • •
1 ^
-2
* r t
• • • • • « «
T h e t h r e e - n o z z l e s y s t e m i s r e t a i n e d to m i n i m i z e n o z z l e l eng th . E a c h n o z z l e wi l l h a v e t h r o a t and ex i t d i a m e t e r s of 0. 468 inch and 1, 016 i n c h e s , r e s p e c t i v e l y ,
4, M o t o r Weigh t E s t i m a t e
T h e c h a m b e r i s by f a r the h e a v i e s t i n e r t componen t of the r o c k e t . T h e c h a m b e r we igh t h a s b e e n s c a l e d wi th r e s p e c t to s u r f a c e a r e a and c h a m b e r r a d i u s . Us ing a c y l i n d r i c a l c a s e and 2:1 e l l i p t i c a l end d o m e s , the t o t a l s u r f a c e a r e a of e a c h r o c k e t w a s c a l c u l a t e d to be
.2 .
) . = TTDL -I-e x i s t i n g m o t o r
2 TTR ^ + —£ In f i - ^ c e 1 - e
= 176. 5 s q in .
'A = 7r(4. 5)(4. 73) + |27r(2. 25)^ + n l i i - l ^ L in
new m o t o r
1+ e \ 1 - e ;
= 100, 0 s q in.
The w a l l t h i c k n e s s wi l l b e r e d u c e d by 20% b a s e d on the c l o s e s t h i g h e r s t a n d a r d s h e e t t h i c k n e s s of s t e e l to the c a l c u l a t e d t h i c k n e s s r e q u i r e d .
T h e s u r f a c e a r e a r a t i o i s then , ' ^ x 0. 8 = 0, 453 and the c h a m b e r 1 (b . o
we igh t for the new m o t o r wi l l b e a p p r o x i m a t e l y 2, 35 lb ( 0 . 4 5 3 x 5. 18 lb) .
T h e p r o p e l l a n t we igh t i s
N L W.
new r o c k e t
new X new N •^, X L . , e x i s t e x i s t
( W ] e x i s t ,
^ 10 X 4. 13 19 X 5, 25
= 2. 0 lb
(4.83)
w h e r e N i s the n u m b e r of p r o p e l l a n t " s t i c k s " and L i s the l eng th of the p r o p e l l a n t " s t i c k . " The e s t i m a t e d g r o s s we igh t i s :
C h a m b e r
N o z z l e i n s e r t s
H e a d c l o s u r e and i g n i t e r
N o z z l e c l o s u r e
P r o p e l l a n t
- 2 . 3 5
- 0 . 3 0
- 1 . 9 5
- 0 , 4 0
- 2 . 0 7. 00 lb
T h e m a s s f r a c t i o n i s 0, 28 .
MND-• ••• • ••• < • • • * • •• • •I m * * "
-2050-• • ••
• •
F -• • «
• 2 .
>••
• • • • •
• «
• ••
• • • • • • • *

$
. .0
3 to
m
n
o
1 ^3
>
is. j^\ iriDD ITI?iL
APPENDIX EE
MICROMETEOROID PENETRATION PROBABILITY
A quick computation has been performed to est imate the probability that a portion of CRONUS will be penetrated by a micrometeoroid. As usual in this type of analysis , it is assumed that the probability of penet ra t ion is a function of the type of meteoroid bumper and the product of exposed area t imes t ime . This implies that we can express :
tg = f (P , AT)
where
t = effective thickness of aluminum (inches)
P = probabili ty of no penetration
= 1 - probability of at leas t one penetration
A = exposed surface area (sq ft)
T = t ime in orbi t (days).
This function is i l lus t ra ted in Fig. E E - 1 , Pert inent assumptions made in generating Fig . E E - 1 a re :
(1) Meteoroid flux. The flux model as supplied by NASA Headquar te rs for Contract NASw-1053 was used. In par t icular , the flux equations, in the vicinity of the ear th , are:
Cometa ry- - log jQN„ = -1 .34 log . „M - 10.27
As te ro ida l - - log jQN^ = -1 .0 log^Q M^ - 10.3
where
N „ , N . = flux of cometary, as teroidal par t ic les (no. / sq ft day)
M p , M. = m a s s of cometary, as tero ida l par t ic les (gm)
No earth shielding is assumed.
(2) Penetra t ion equation. The Langley penetration model was used, the equation of which is:
t =K(MV)^ /^
CQ^ iriDCr ITIAL MND-2050-F-2
• • • • • • •
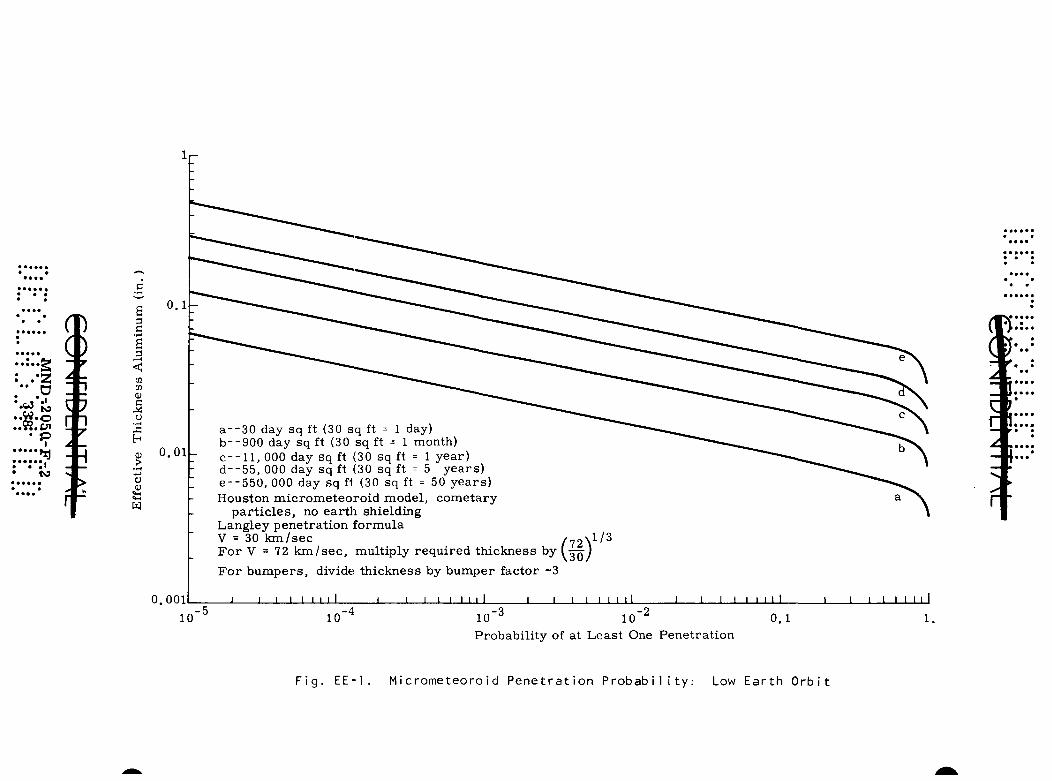
I r -
a- -30 day sq ft (30 sq ft = 1 day) b--900 day sq ft (30 sq ft = 1 month) C--11, 000 day sq ft (30 sq ft = 1 year) d - -55 , 000 day sq ft (30 sq ft = 5 years) e--550, 000 day sq fl (30 sq ft = 50 years) Houston micrometeoroid model, cometary
pa r t i c l e s , no earth shielding Langley penetrat ion formula V = 30 k m / s e c / ^ 2 \ l / 3 F o r V = 72 k m / s e c , multiply required thickness by ( 07:)
For bumpers , divide thickness by bumper factor -3
I I 1 I I I I I I I I I I J_ J I I I I I 11 I I I I I I J I I I I
10 10 10 '^ 10"^ Probabili ty of at Least One Penetrat ion
0,1
Fig. EE-1. Micrometeoroid Penetration Probability: Low Earth Orbit
where
t = thickness of thin sheet that will just be penetrated (inches)
V = particle velocity (km/sec)
M = particle mass (gm)
K = target material constant.
For aluminum single skin construction, K = 0. 154.
(3) Particle velocity. A velocity of 30 km/sec is used in Fig, E E - 1 . Part icles may travel as fast as 72 km/sec in the near vicinity of the earth. For this velocity or any other velocity,
/ v \ i / 3 the required thickness can be scaled by I-on)
It is important to mention that there is considerable uncertainty in the actual meteoroidal flux. There is even more uncertainty in the actual effects of meteoroids on thin, metal skins. Consequently, penetration probability estimates can easily vary by one order of magnitude, depending upon the explicit assumptions.
Using these equations, it can be shown that, for short recall periods, no micrometeoroid protection is needed for any component, since the presently provided structure is sufficient. For long term missions (five years), the retro motors must be provided with some shielding, since a puncture of the motor may cause an explosion at ignition. The heat shield, if it is an ablator, would also have to be protected if reentry after five years is desired. Provided the beryllium coating survives the continuous bombardment by very fine particles, no protection seems needed for the power generation subsystems, since the probability of a sizable particle impacting the RTG/RB is rather low.
CQNriDCNThU MND-2050-F-2
.•: ••: : *•;'-3?^'.- :*: : •': ".

• •••
8 ...
.. g
•.
.•
: a
o ai
rl
n ..
....
. o
^
r ^ f^

APPENDIX F F
SGLS DESCRIPTION
The SGLS configuration selected for the CIR is shown in Fig. F F - 1 . Its functions include range and range r a t e t racking, angle t racking, ground- to-vehic le command, and PCM and F M / F M te l eme t ry . P e r formance curves for both the spacecraf t - to-ground and ground- to-spacecraf t l inks a r e shown in F igs . F F - 2 and F F - 3 , on which threshold signal power r equ i r ed is plotted as a function of communications range . The hor izonta l l ines indicate s ignal power requ i red for the combination of s e rv i ce s des i red and their in tersec t ion with the threshold signal power gives the maximum functional range avai lable. Therefore , the two-watt t r a n s m i t t e r will provide 64Kbi t PCM, 20-kc t e lemet ry , r a n g ing, range r a t e and IK baud command to synchronous a l t i tudes .
The vehicle flight unit for the functional configuration selected is shown in Fig. F F - 4 . Its physical c h a r a c t e r i s t i c s a re given in Table F F - 1 . A sma l l p r o g r a m m e r has been added to this unit to effect the t ime p r o g r a m . SGLS vehicle equipment uses a coherent phase- lock r ece ive r with a 205/8 r e c e i v e r - t o - t r a n s m i t t e r drive r a t i o . The r e ceiver is capable of receiving any fixed frequency signal in the 1762-to 1842-range through select ion of the VCO frequency. This receiving band covers the en t i r e al location by t rans la t ion into a 2200- to 2300-mc t ransmi t t ing band. The signal conditioner provides the recons t ruc ted , t e rna ry bit s t r e a m and bit synchronizat ion signals to be fed to the v e hicle command decoder and p r o g r a m m e r . Squelch information is ava i l able when the s igna l - to -no ise ra t io drops to a level where sync and command data cannot be maintained at a low e r r o r r a t e . The squelch signal is used to r e s e t the digital p roces s after signal dropout. The decoder to be used for SGLS demonst ra t ion can accept signals from one of four different types of inputs (Fig. F F - 5 ) . The data l ines consist of s e r i a l bit s t r e a m s which the decoder t r ans fo rms into 39 d i sc re te commands . It is planned that this decoder interface direct ly with the p r o g r a m m e r for t ime sequencing of the operat ion during ascent . The de coder authent icates the data by performing the following checks:
(1) Address confirmation
(2) Pa r i ty verif ication
(3) Message length check.
This p roces s provides some degree of communications secur i ty against random noise o r t amper ing , but will not prevent interference with the sys tem through repet i t ion of r eco rded m e s s a g e s .
MND-2050-F-2 . • : • • : : • • : 341. •;. :*: i-"r

V Low-power transmitter
Transmitter converter
T Vehicle primary power
Medium-power transmitter
Vehicle antenna
Multiplexer Receiver
Coherent/transmitter drive
Range code modulation PCM modulation Telemetry PAM or FM/FM Telemetry voice/analog
Baseband assembly
unit
Signal conditioner
Range code modulation
Tl
C ommunic ations converter
PAM telemetry or FM/FM telemetry Voice/analog
T Vehicle primary power
Digital telemetry
unit
T Digital
telemetry unit
converter
T Vehicle primary power
Fig. FF-1, SGLS Vehicle Equipment Configuration
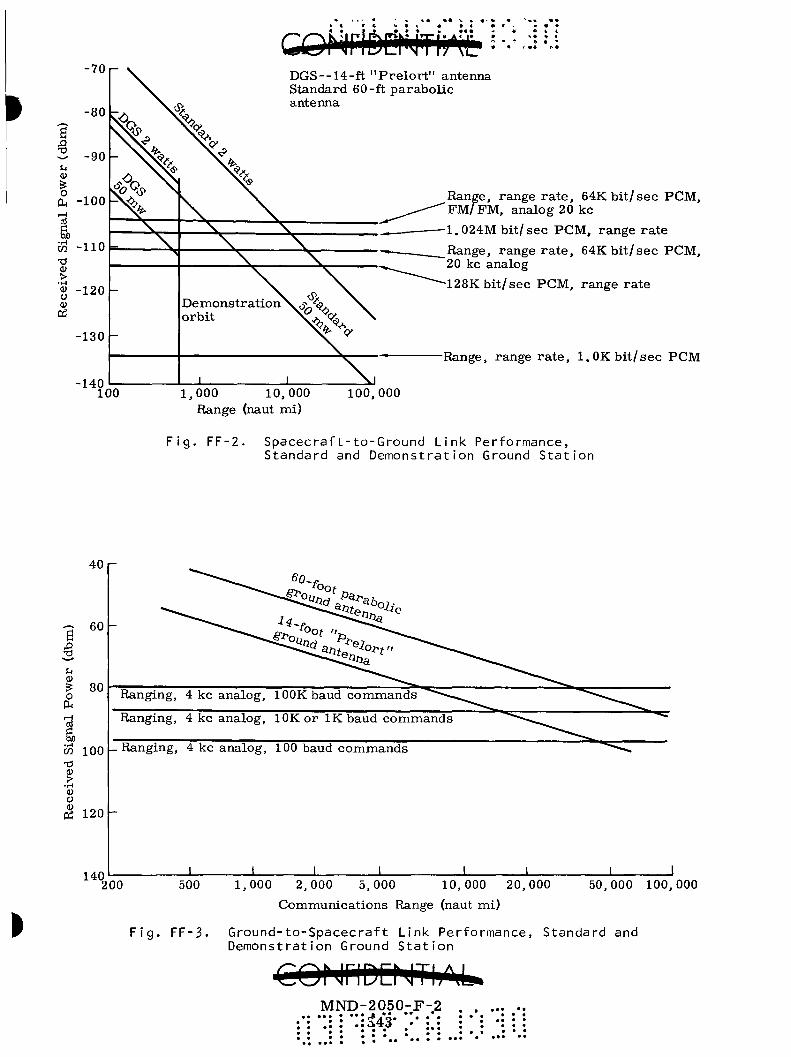
GoNri6df^iJTb€ ^ '••• •• DGS--14-ft "Prelor t" antenna Standard 60-ft parabolic antenna
-140 100 1,000 10,000
Range (naut mi) 100,000
Range, range rate , 64K bit/sec PCM, FM/FM, analog 20 kc
1.024M bit/sec PCM, range rate
Range, range rate , 64K bit/sec PCM, 20 kc analog
128Kbit/sec PCM, range rate
Range, range ra te , 1. OK bit/sec PCM
F i g , FF-2. Spacecra f t - to -Ground L ink Performance, Standard and Demonstrat ion Ground S t a t i o n
40 r
60
80 o
a
w 100 XI (Si >
u
P3
Ranging, 4 kc analog, lOOKbaud commands
Ranging, 4 kc analog, l O K o r IK baud commands
Ranging, 4 kc analog, 100 baud commands
120
140_ _L '200 500 1,000 2,000 5,000 10,000 20,000
Communicat ions Range (naut mi)
50,000 100,000
F i g . FF-3. Ground- to-Spacecra f t L ink Performance, Standard and Demonstrat ion Ground S t a t i o n
COf JriDD JTI/nb. MND-2050-F-2
.:^43- .. ' • • •
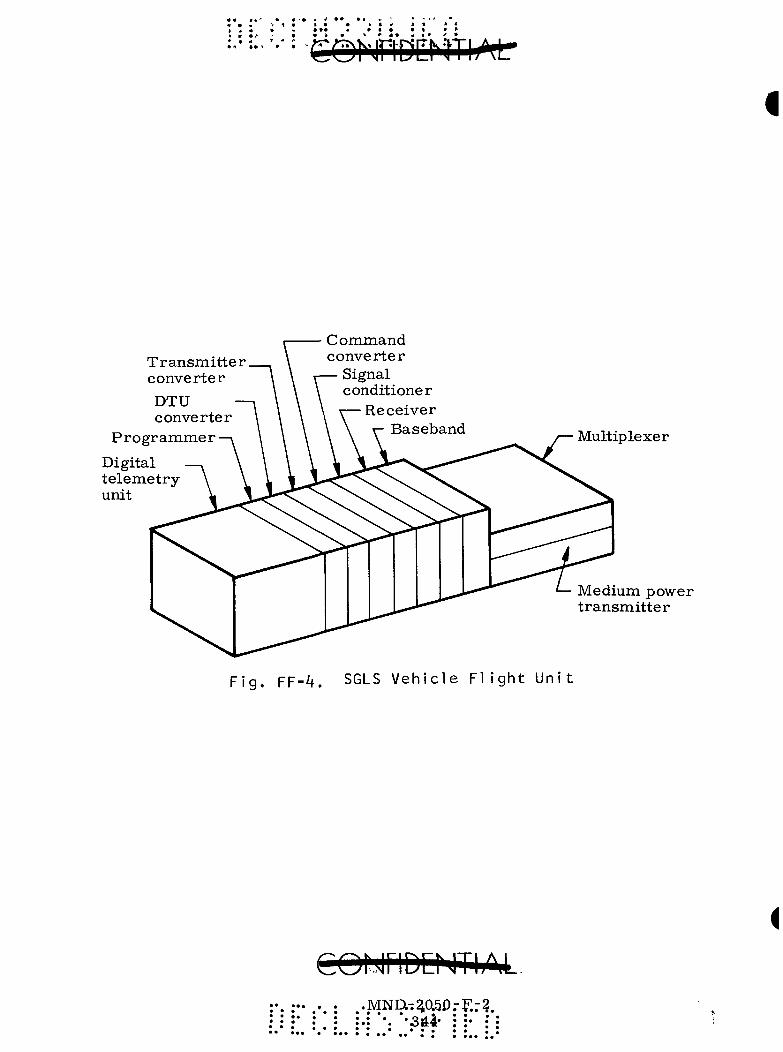
Transm.itter converter DTU converter
Programmer
Digital telemetry unit
Command converter
Signal conditioner
Receiver Baseband Multiplexer
Medium power transmitter
P i g , FF-4. SGLS Veh ic le F l i g h t Un i t
COUriDD JTIi .L. MNa^^0.5P.-F.r?
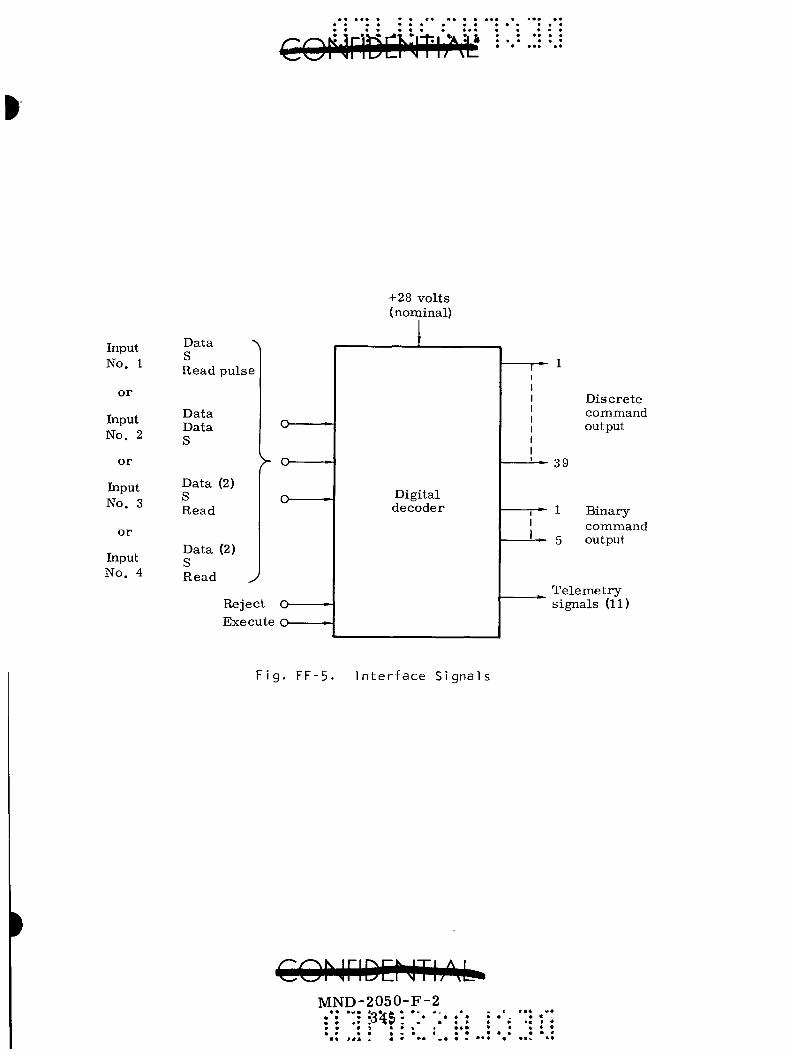
Input No. 1
o r
Input No, 2
o r
Input No. 3
o r
Input No. 4
Data S Read pulse
Data Data S
Data (2) S Read
Data (2) S Read ^
Reject O Execute o
+ 28 vol ts (nominal)
Disc re te command output
Binary command
5 output
^ Te l eme t ry signals (11)
Fig. FF-5. Interface Signals
MND-2050-F-2
* « b • •
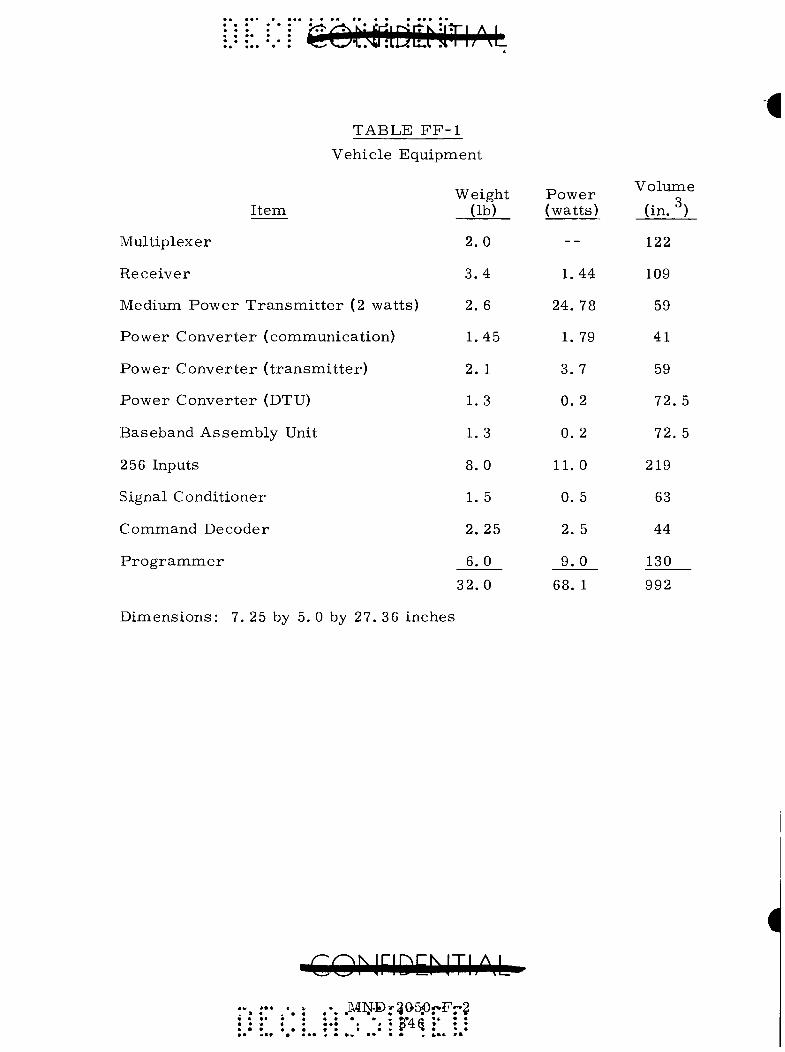
TABLE FF-1
Vehicle Equipment
iir • Ui T-> Volume Weight Power „
Item (lb) (watts) (in. )
Multiplexer 2.0 - - 122
Receiver 3.4 1.44 109
Medium Power Transmitter (2 watts) 2. 6 24. 78 59
Power Converter (communication) 1.45 1, 79 41
Power Converter (transmitter) 2. 1 3. 7 59
Power Converter (DTU) 1, 3 0, 2 72, 5
Baseband Assembly Unit 1, 3 0, 2 72. 5
256 Inputs 8. 0 11, 0 219
Signal Conditioner 1,5 0, 5 63
Command Decoder 2, 25 2, 5 44
Programmer 6, 0 9, 0 130 32,0 68, 1 992
Dimensions: 7. 25 by 5, 0 by 27. 36 inches
r^r\ MriDChlTliM .MlNT-D^gOSPpFr?
The vehicle t r a n s m i t t e r selected for the CTR will be the two-watt, medium power, vers ion . The t r a n s m i t t e r is p rese t to work on any one of 10 channels in the 2200- to 2300-mc range , and is capable of being dr iven from ei ther a coherent source provided by the rece ive r or an in terna l c rys t a l osc i l la tor in accordance with a signal present logic voltage generated in the r e c e i v e r . The coherent drive provides the range range r a t e t rack ing link.
The mult iplexer is a four - te rmina l pair network with te rmina ls for the antenna, r e ce ive r and two t r a n s m i t t e r s . The unit consis ts of two bandpass filter networks , a low-pass f i l ter , a four-par t fe r r i te port c i rcu la to r , a th ree -dec ibe l hybrid network and associa ted re s i s t ive ne tworks . The hybrid network pe rmi t s combining two t r ansmi t t e r s to a single input to the antennas , with isolation between the antennas. The fe r r i t e c i rcu la tor provides r e c e i v e r - t r a n s m i t t e r isolation, while the bandpass fi l ter gives a na r row 30-mc pass band centered at the t r a n s m i t t e r frequency, which is tunable over the frequency range of 2200 to 2300 m c . The r e c e i v e r channel contains a bandpass filter with a 20-mc pass band tunable over a frequency range of 1750 to 1850 mc .
The digital t e l eme t ry unit p roces se s analog, digital or d i sc re te input signals into a t ime multiplexed PCM format . Analog signals a re quantized to e i ther four or eight b i t s , depending upon r equ i r emen t s . Digital words and d i sc re t e s bypass analog-to-digi ta l conversion, and a r e direct ly combined with i t s output together with synchronization and identification words . The digital words a r e in tegral multiples of four b i t s . The format consis ts of a 1024-bit main f rame, with 256 words avai lable . A p r o g r a m m e r and clock provide t ime sequencing and synchronization which a r e available to other units of vehicle equipment. The baseband assembly unit genera tes the down-link s u b c a r r i e r s , which a r e modulated with the i r respec t ive t e l eme t ry s ignals . These modulated s u b c a r r i e r s a r e summed with the ranging signal to form the baseband s t ruc tu re applied to the modulator of the t r a n s m i t t e r s .
Three power conver te r s a r e used for the SGLS sys tem:
(1) T r a n s m i t t e r conver te r
(2) Communications conver te r
(3) Digital t e l eme t ry unit (DTU) conver te r .
The conver te r s a r e separa ted into functional units because of differences in to le rances r equ i r ed . Pulse width-controlled switching regula tors a r e used with high-power handling t r a n s i s t o r s and diodes mounted on separ a t e heat s inks . Environmenta l specifications for SGLS a re given in Table F F - 2 .
MK£J-^tl5(3-P-2-• • • * • • • •

• *
••
3
CO
O
l
••••
o
I '.
...•
tsi

Shock:
Vibration:
Sine wave:
Random:
Acceleration:
Temperature:
Humidity:
Pressure :
RF interference
TABLE FF-2 SGLS Environmental Specifications
100 g nonoperating, 30 g operating
5 g from 5 to 2000 cps
0.16 g /cps from 300 to 1200 cps
25 g
-30° to 16 5° F
90%
10""^ torr
MIL-I-26600
Radiation resistance integrated dose:
Reliability:
10 rad gamma 14 10 -1 Mev electrons/sq cm
Minimum acceptance MTBF = 6750 hr (9 mo) Goal =18 mo
•:wr5:D42K5j)-:F-:2 • • • • ^4Q • •

or <
p .9
..g
•J
.IS
3
I r
^.

APPENDIX GG
HYDROSTATIC GAS BEARING ANALYSIS
A. OPERATION
In operation the hydrostatic gas bearing surfaces are separated by a film of gas; there is no metal-to-metal contact between bearing surfaces. When the operating supply pressure is discontinued, the bearing surfaces come into contact in accordance with the direction of the applied load. A balanced spring system is incorporated to cause the compliance mechanism to automatically center when pneumatic operating pressure is supplied to the bearings, and there is no external force acting on the system other than gravity.
Figures GG-1 and GG-2 show typical hydrostatic bearing configurations. The succeeding calculations specify the physical dimensions for each of the bearings used in the system. The operating gas supply is fed to the system through a flexible line leading from the launch site facilities to the bearing internal manifolds shown in Pigs. GG-1 and GG-2. Routing of the gas to each bearing is handled by external, flexible lines.
In a typical hydrostatic bearing, the gas is admitted under pressure to the bearing clearance space, and control of admission is a critical design parameter. The flow control device, or restr ictor (usually an orifice) and the transition space or recess are the most important items in this control. The transition space is used to introduce the gas to the clearance with a minimum of shock and pressure drop. Pigure GG-3 shows a schematic of a typical bearing feeder section. System pres -surization gas is introduced into the supply manifold, flows through the restr ic tor (orifice) and into the transition space (recess). i'Vom. this point it flows through the bearing film to the exit region of ambient pressure . When eccentric bearing loading occurs, or the load value changes, the bearing clearance tends to close down in the direction of the applied load. This causes the restriction of gas flow to vary across the bearing in a direction which will resis t the load displacement or change. The bearing is thus self-compensating.
B. FEASIBILITY ANALYSIS (REP. GG-1)*
1. Pr imary Cylindrical Bearings
Assume: Maximum suspended load on bearing system is 500 pounds Maximum eccentricity loading due to three-inch excursion Maximum load on single bearing
*Ref. GG-1. Rieger, N. F. and Peterson, M. B . . "Hydrostatic Gas Bearings, " Machine Design, March 31, 1966, pp 106 to 115,
coM lDENTh^^^ .•:r^p--:295J>-T-?: :* •*: V: :'\ • • • • rj»f- • ! • • • • • • • • • • » • • • /5»r)*L • • • • • • • • • •
« • • • • • • • " • • • • « • « • • • • • • • •
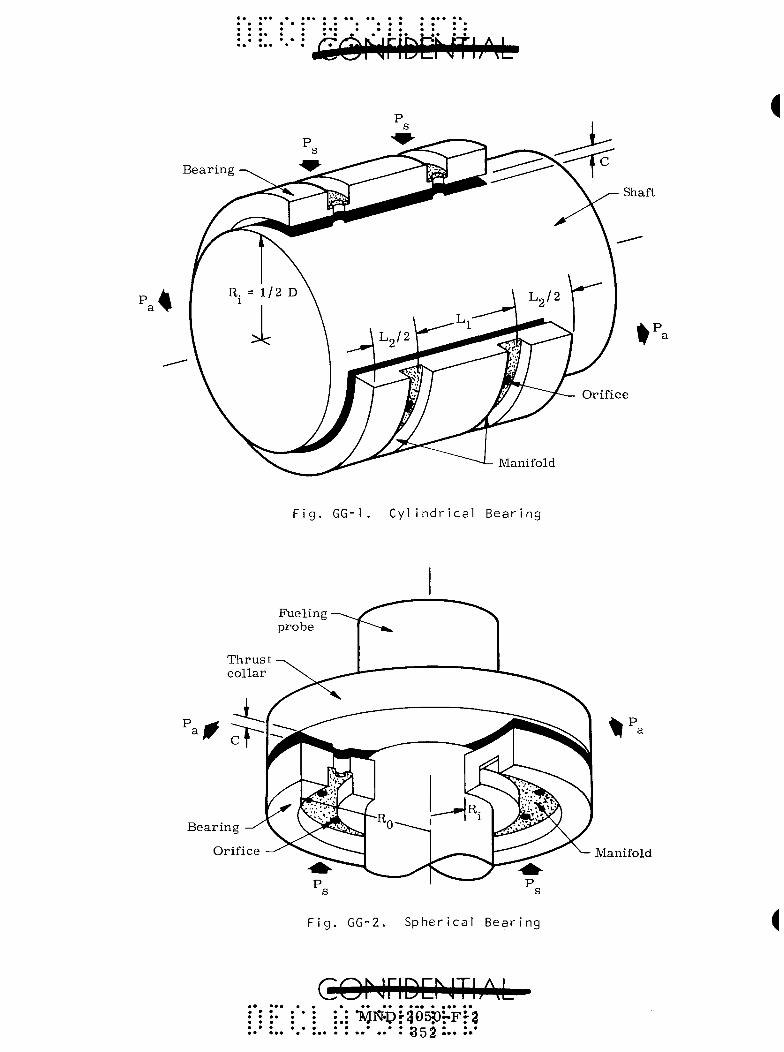
Bearing
Shaft
Orifice
Manifold
F i g . GG-1 . C y l i n d r i c a l B e a r i n g
Flieling probe
Thrust collar
Bearing
Orifice Manifold
F i g . GG-2. S p h e r i c a l B e a r i n g
COhJriDENThM. •MN-i?r3O550rFr3 • •• ••• •• 852 " • " •

R, R.
•18 in.
H 3 in.
-12 in.-
W = 500 lb
Gas flow Circumferent ia l manifold
Flow
J Journal
Fig. GG-3. Geometry of Feeder Nozzle

i
LM^ = 0 = 12 X 500 - 18 Rg )
^ .^ r^r. / Ref- Fig- GG-3 R^ = 1 2 _ 2 | ^ ._ 333 lb ^
Assume that one-half the total p r e s s u r e drop occurs a c r o s s the r e s t r i c t o r and one-half a c r o s s the bear ing, and that the average p r e s s u r e in the bear ing is one-half the t rans i t ion p r e s s u r e
P = P + ^ s a A
where
P = supply p r e s s u r e (psi) s
P = ambient p r e s s u r e « 14.7 psi
W = bear ing load = 333 lb
A = projected bear ing a r e a normal to load = L x D
= 7 x 2 . 5 (from layouts)
^ s = 1 4 . 7 + y ^ l ^ = 1 4 . 7 + 76, 1«.91 psi
This indicates that the supply p r e s s u r e requ i red (<100 psig) is cons is tent with available s tandard equipment, components and technology.
Assume r e s t r i c t o r coefficient A = 0.42 (median value in Fig. 11 of
Ref. GG-
L D
^ 2 D
^ s P
1)
= 2 ' 5 = 2 . 8
= 3 ' ^ = 1 4 2 . 5 ^ - ^
- 9 1 - R 9 - 1 4 . 7 - ^ - 2 a
Q' = d imensionless flow
F r o m Fig. 11a of Ref. GG-1 ,
Q' = 0.32
CONriDENTI
..* ..* ! g 54 i.» 5«*

Q = gas flow through bear ing
TTP 2 C^
6n RT
using a i r at 120° F
where
6(2
TTX
7r(91)2
. 8 X 10
8 2 . 8 1
(1 X
-')2
X 10^
-3 3 LO ^)
472 X
X 1 0 "
0. 32
10^ (580)
^ X 0 . 3 2
C = film thickness (bearing c learance) = 0.001 in.
-9 iu = gas viscosi ty = 2 .8 x 10 I b - s e c / s q in.
R = gas constant = 2.472 x 10^ Ib^ / sec^ °R
T = gas t e m p e r a t u r e = 580° R
RT = 1.434 X 10^ Ib^ / sec^
Q
16.8 X 10"9 X 1.434 X 10^
= 3.46 X 10"^ I b - s e c / i n .
(3. 46 X lO"^) 386 in. / s e c ^ = 1337 x lO"^
Q = 0.001337 l b / s e c
For double plane admiss ion
Q^^^ = 2 X 0.001337 = 0.002674 l b / s e c / b e a r i n g
Total gas flow for p r i m a r y bear ing
2 X 0.002674 = 0.005348 l b / s e c
2. Secondary Cylindrical Bear ings
Assume : Maximum load = 400 pounds No eccen t r ic loading .'. W = 200 pounds/bear ing
CQNriDQJTIAb>
• • • • • • ^ *-*^ •• •• •

4W P = P + ^ s a A
A = LD = 4 X 2. 5 = 10 sq in.
P = 14. 7 + M ^ ^ ^ = 14. 7 + 80 = 94. 7 psi
Assume:
Pg = 91 psi
^ 4W ^ 4(200) . 10 5 sq in ^ p _ p 91 - 1 4 7 • ^ •
s a
This indicates an inc rease to 4. 2-inch calculated bear ing length is r e quired, which is within r ea son .
Assume:
A = 0 . 4 2 (the median value in Fig. 11 of Ref. GG-1)
Q' = 0.32
TTP 2 C^ Since Q = —7—prp Q' and a l l p a r a m e t e r s may be made equal between
bear ings by the s iz ing and the number of or if ices between the supply manifold and the t rans i t ion space , the flow through each journal bear ing may be made essent ia l ly equal . There fore , the total Q through secondary journal bear ings is 0.005348 l b / s e c . By sizing the s y s t e m for equal flows, the line s i ze s may be held constant .
3. Spherical Bearing; Thrus t Type (Fig. GG-2)
Assume: Bear ing load =300 pounds
F r o m design layouts
R. = 2 .2 5 inch 1
RQ = 3 .375 inch
A = 7rfe2 _ ^2\ ^(3.3752 _ 2.25^)
= 19 .85 sq in.
eONriDENTIAL
: : : | 5 6 : :.:

P = P + -T- (applies for th rus t - type bearing)
= 14. 7 + j f ^ = 14. 7 + 60. 5 = 75. 2 psi
Assume P = 9 1 psi s '^
A = 4W
P - P s a
4(300) , ^ _ 91 - 1 4 . 7 = 15.7 s q m .
R. is fixed to provide c learance with the fuel block attachment mechanism
to achieve minimum a r e a ,
R Q = ( f + R i ) = ( ^ + 5 . 0 6 ) = ( 5 . 0 + 5 . 0 6 ) 1 / 2
= 317 inches
This indicates leeway in design to p a r a m e t e r s to achieve optimum size and per formance consider ing the proposed configuration.
R. 2 .25 ^ - ^
1
W' = dimensionless bear ing load
W ^ c <Ps - Pa>
where
A = calculated bear ing a r e a c °
W' 300 15.7 (91 - 14.7) = 0 .25
_ s 91 P a " 1 4 - ^ '
6.2
A„ = r e s t r i c t o r coefficient = 1.8 (from Fig. 7 of Ref. GG-1).
Q' = 1.2
]i4KS-2flL5Q-P-2-• • • • • • u <-'• I • • • * •

Assume:
C = bear ing c learance = 0.001
O = ^ O' ^ 6M RT ^
3 ^ 7r(9.1 x 10)2 ^ ^ ^Q-3^ ^^^
6(2.8 x 10"9) 1.434 x 10^
7r82.81 X 10^ X 1 X lO"^ x 1.2
16.8 X10~9 x 1.434 X 10^
= ^ ^ 2 . 8 1 x 1 2 ^ ^2. 94 X l O ' ^ I b - s e c / i n . 24 .1 X lO''
12. 94 X 10"^ X 386 = 0. 00500 l b / s e c
Total a i r flow for sys t em
Q ^ = 0 .00535+ 0.00535 + 0.00500 = 0.0157 l b / s e c
This shows that the flow requi red i s within the capability of the existing facility and with smal l adjustment to these f igures, due to the difference in gas viscosi ty and gas constant, may be made to apply to ni trogen. Both a i r and ni trogen a r e available at the launch pad and a r e suitable for use .
CQMriDCriTliM .*: ^r^D-:2e5i)rPt3
• -358
4
APPENDIX HH
REENTRY TRAJECTORIES
In evolving a rational design, reentry environment is probably the strongest factor involved since overall weight and shape are decidedly influenced. Environmental factors under consideration include the highest g load, peak aerodynamic heating rate and total heat absorbed. It is well known that steep and fast entries result in maximum loads and heating rates while shallow entries at high speed produce long heating pulses.
This section extricates those entry conditions that result in design trajectories for the RB.
1. Ascent Trajectory Implications
In the booster family under study (Titan IIIA, IIIB and IIIC), it becomes necessary to exanaine the relative importance as to their contribution to the design. The object is to logically reduce, if possible, the number of launch vehicles to be studied. To begin with, it is pointed out in Chapter IV that the Titan IIIC configuration exhibits the longest liftoff-to-injection range of the three vehicles. This fact alone must be heavily weighed since, in essence, it has dictated the abort impulse requirement of 1500 fps. However, in Pig. HH-1 it is observed that altitude differences between ascent profiles are quite large. Part of the difference can be directly attributed to the fact that Titan IIIA and Titan IIIB, as presented here, do not have the same uprated core as the Titan IIIC. It is expected that, with the same core element, these differences would be reduced, but trajectories with the uprated core were not available during this study. Even though it is anticipated that the inputs that generated the results of Fig. HH-1 will be improved,it will be shown subsequently that the Titan IIIA and Titan IIIB ascent profiles, as shown here, do not significantly alter the design inputs.
This is demonstrated in Fig. HH-2 which takes the Titan IIIA and compares the entry conditions as influenced by the abort application angle,6 , with Titan IIIC, The major difference in entry occurs below a velocity of 22, 000 fps when 6 = 180°. Once the vehicle is injected into the transfer orbit, launch vehicle dependency no longer exists. Note that for the entire spectrum of 5 (90°^5<180°) as applied at perigee, y of the transfer trajectory, and at the apogee point of
transfer, the case of 6 = 180° at the apogee point is by far the most critical steep entry. It is further noted that regardless of the application angle during the Titan IIIA trajectory, the aforementioned critical point remains as such. The maximum g load indicated for this design point is on the order of 25 g, which signifies that the maxinaum heating rate will also be experienced for this entry.
(5€)f riDD ITI;M jdN'D:-2Q50--F---2 .*. : . ' . ••: •*: : : : : 3:58: : :*: : • : *• ',•

GQNriDCNTIAL
<
800r
7 0 0 -
6 0 0 -
^ 5 0 0 -crs
O
-a 3
4 0 0 -
3 0 0 -
2 0 0 -
1 0 0 -
F i g . HH-1
Ine r t i a l Veloc i ty (fps x 10 )
Launch V e h i c l e T r a j e c t o r y Compar ison
cohjriDChJTh^j^ ;•: l«fNP-:-2335$-:F-:2:
: : :3:6o: : • ••• ••

AV
28r
2 7 -
2 6 -
2 5 -
2 4 -
2 3 -
2 2 -
21 -
2 0 -
1 9 -
1 8 -
1 7 -
1 6 -
6 =
7 g
Titan IIIC (165° < 6 < 180°)
6 = 180°
25 g
15 g (max)
W/CjjA = 22 I b / s q ft
L /D = 0
151 _L -4 -6 -8 -10
En t ry Flight Pa th Angle, y (deg) -12 14
Fig. HH-2. Comparison of Entry Design Criteria
COf JriDQWh^Tfe" MND-?206p-F-2r
361 *•• *•• • • • • • • • • • • • •• • •• •
• • •
« • • • • • • • » • • • • • • « » w<»^ w v
• • • • ••• • • • • • * * *
i The criterion establishing this abort case rests on the design
philosophy that call-down capability will exist at any point in the profile. For this case, apogee call-down can be initiated, with subsequent impact being in the Pacific and Arctic Oceans, respectively.
Thus far, no mention has been made of the difference in the local pitch attitude of the launch vehicles and the significance that this might make with regard to range control. Figure HH-3 has been prepared to specifically illustrate this consideration. This figure, first of all, shows that the local flight path angles for all launch vehicles are within 5° of each other above a flight speed of 10, 000 fps. Secondly, the offset angle (a) measured between the velocity vector and booster center-line is within three degrees for speeds up to 15, 000 fps. For speeds above 15,000 fps, up to 13° difference is noticeable. However, range control is not a problem for speeds less than 24, 000 fps (Ref. Appendix LL) and, consequently, the differences that do exist up to this speed are of no concern. More important is the variation of a as injection is approached. Observe that 5 = 180° as Titan IIIC approaches injection, but that 6 = 173° for Titan IIIB and 16 5° for Titan IIIA at injection. Prom Fig. HH-2 it was shown that 5s less than 180° at injection provide a somewhat greater range control and, therefore, the remainder of this discussion will concentrate on aborts from the Titan IIIC vehicle as a satisfactory origin for design cr i ter ia .
2, Ballistic Entry Trajectory Summary
Using the Titan IIIC ascent trajectory, aborts were performed which directed their thrust along the launch vehicle' s centerline in the aft direction (165°< 6^180°), The abort pulse magnitude is 1500 fps and the RB aerodynamic characterist ics are:
L/D= 0
W/Cj^A = 22 Ib/sq ft Nose radius = 6. 1 ft.
Pigure HH-4 presents a summary chart that shows the maximum load factor, g, encountered for an abort along the boost and transfer orbit as a function of time into the flight phase. All trajectories are point-mass and do not include dynamic effects. The figure also indicates the case of AV = 0, which is nothing more than a separation from the launch vehicle. This case is shown up to a speed of 25, 000 fps since impact points are acceptable up to this point, and A V application does not become necessary.
Actually, the design philosophy chooses to abort with A V = 1500 fps at all t imes because of the inherent simplicity in mechanizing the sequence of events. However, all physically realizable conditions are covered in the environmental criteria.
-CONriDEMTI/aL • I :•^4tID:-•?)50;?:-S•:

Lo
cal
Pat
h A
ng
le,
>'
Off
set
Ang
le
Bet
wee
n V
eloc
ity
Vec
tor
and
Bo
ost
er
Cen
terl
ine,
a
(deg
)
.—•.
(T)
'.t to
1 c m
D
0) n o
01
O
n
I/) c n < fD
3-
1/1
I*
*
• ••
* >
•
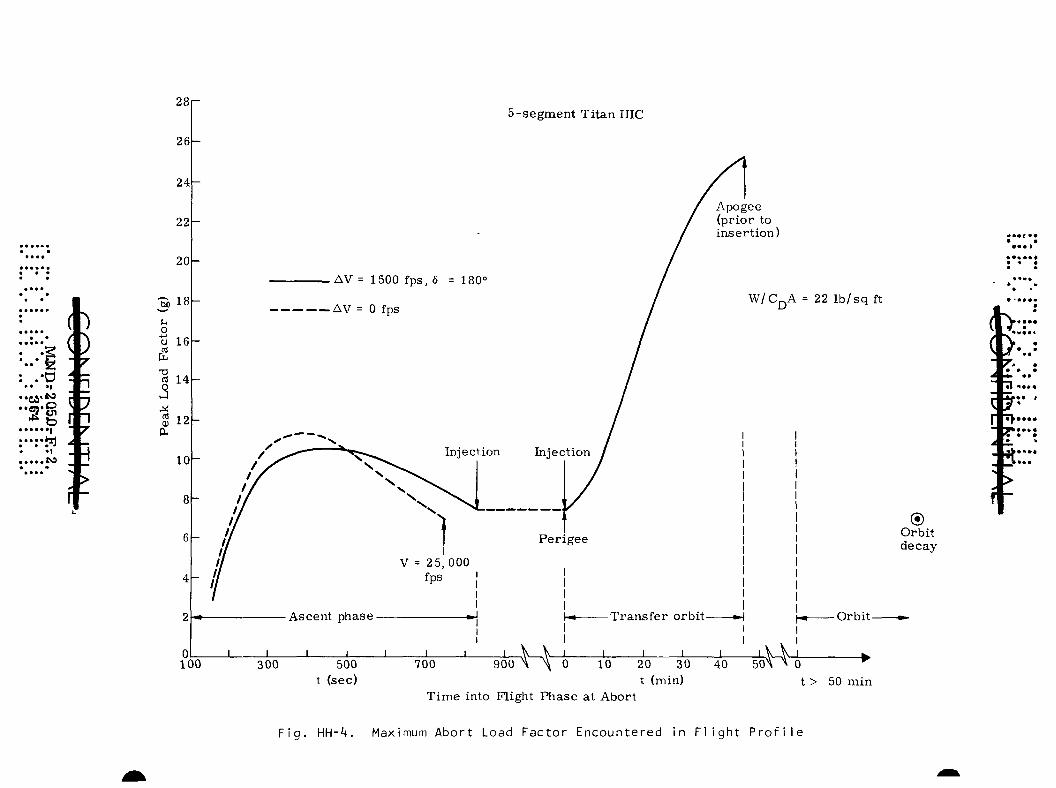
AV = 1500 fps, 6 = 180°
•AV = 0 fps
5-segment Titan IIIC
Injection Injection
Perigee
Apogee (prior to insert ion)
W/Cj^A = 22 Ib /sq ft
-Transfer orbit-
J - -L _L _L -L 0 10 20 30 40
t (min) Time into Flight Phase at Abort
^ ^
® Orbit decay
- Orbit-
t > 50 min
F i g . HH-'t. Maximum A b o r t Load Fac to r Encoun te red in F l i g h t P r o f i l e
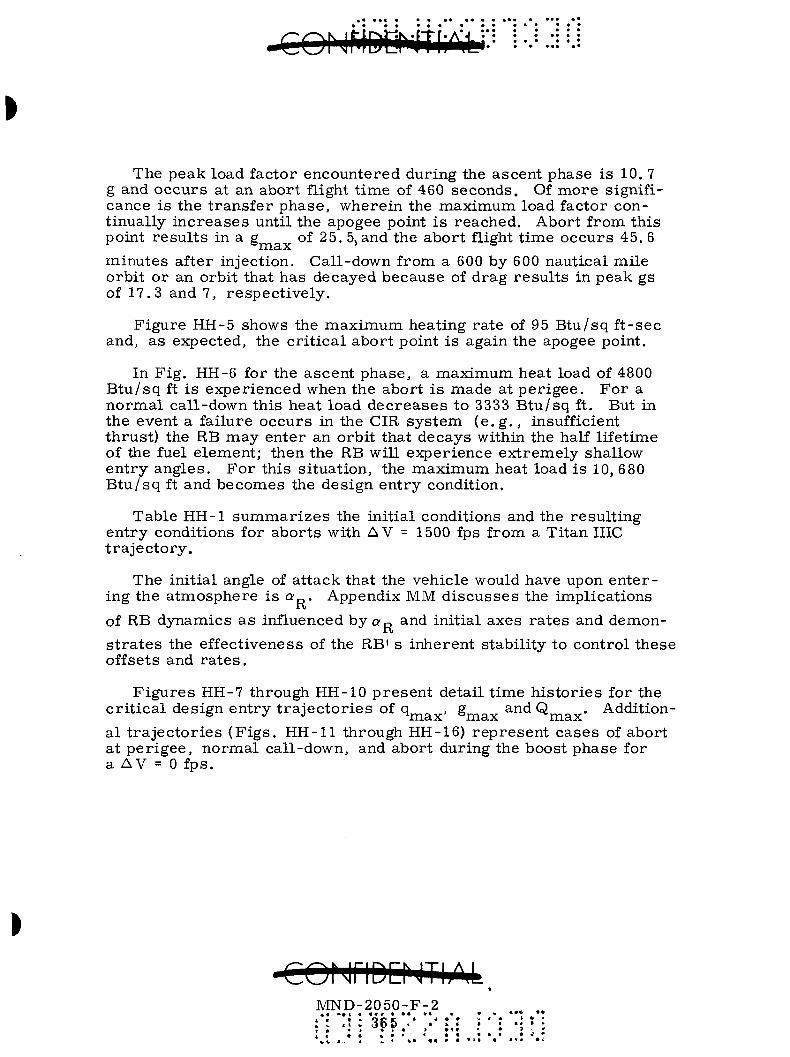
The peak load factor encountered during the ascent phase is 10.7 g and occurs at an abort flight t ime of 460 seconds . Of more significance is the t r ans fe r phase , wherein the maximum load factor continually i nc r ea se s until the apogee point i s reached. Abort from this point r e su l t s in a g of 25. 5, and the abor t flight t ime occurs 45, 6
minutes after injection. Call-down from a 600 by 600 nautical mile orbi t or an orbit that has decayed because of drag r e su l t s in peak gs of 17.3 and 7, respect ive ly .
P igure HH-5 shows the maximum heating ra te of 95 Btu / sq f t -sec and, as expected, the c r i t i ca l abor t point is again the apogee point.
In P ig , HH-6 for the ascent phase , a maximum heat load of 4800 B t u / s q ft i s experienced when the abort i s made at pe r igee . Fo r a no rma l call-down this heat load d e c r e a s e s to 3333 B tu / sq ft. But in the event a failure occurs in the CIR sys tem ( e , g , , insufficient thrus t ) the RB may enter an orbit that decays within the half lifetime of the fuel element; then the RB will exper ience ext remely shallow ent ry angles . F o r this si tuation, the maximum heat load is 10, 680 B t u / s q ft and becomes the design en t ry condition.
Table HH-1 s u m m a r i z e s the init ial conditions and the resul t ing en t ry conditions for abor t s with A V = 1500 fps from a Titan IIIC t r a j ec to ry .
The init ial angle of at tack that the vehicle would have upon en t e r ing the a tmosphere is a^. Appendix MM d i scusses the implications
of RB dynamics as influenced by a p and init ial axes r a t e s and demons t r a t e s the effectiveness of the RB' s inherent stabili ty to control these offsets and r a t e s .
F i g u r e s HH-7 through HH-10 p re sen t detail t ime h i s to r i e s for the c r i t i ca l design en t ry t r a j ec to r i e s of q^_^, S-^^^ and Q . Addition-
al t r a j ec to r i e s ( F i g s , HH-11 through HH-16) r ep re sen t cases of abort at pe r igee , no rmal call-down, and abort during the boost phase for a AV = 0 fps.
MND-* • « A 4 *
TtW -2050
« * « • • : 36 5 I » 1 ''
N -p •
»•
•W--2 lr« k
• » < • « • • • • «
«# « « ^

lOOr 5-segment Ti tan IIIC
o <u to
+->
ffl
C
(U
9 0 -
80-
TO
GO-
50-
40-
3 0 -
tfl 20h
1 0 -
0L_ 100
-AV = 1500 fps, 6 = 180°
• AV = 0 fps
Nose rad ius = 6,1 ft
W/Cj-jA = 22 Ib / sq ft
Injection
Per igee V = 2 5,000 fps
I
Ascent phase-
Apogee
•Transfer orbit-
300 500
t (sec)
700 _L
900 H- J L J I I L 0 10 20 30 40 50
t (min)
Time into Flight Phase at Abort
H
® Orbit decay
• O r b i t -
t > 50 min
F i g . HH-5. Maximum A b o r t Heat Rate E n c o u n t e r e d i n F l i g h t P r o f i l e
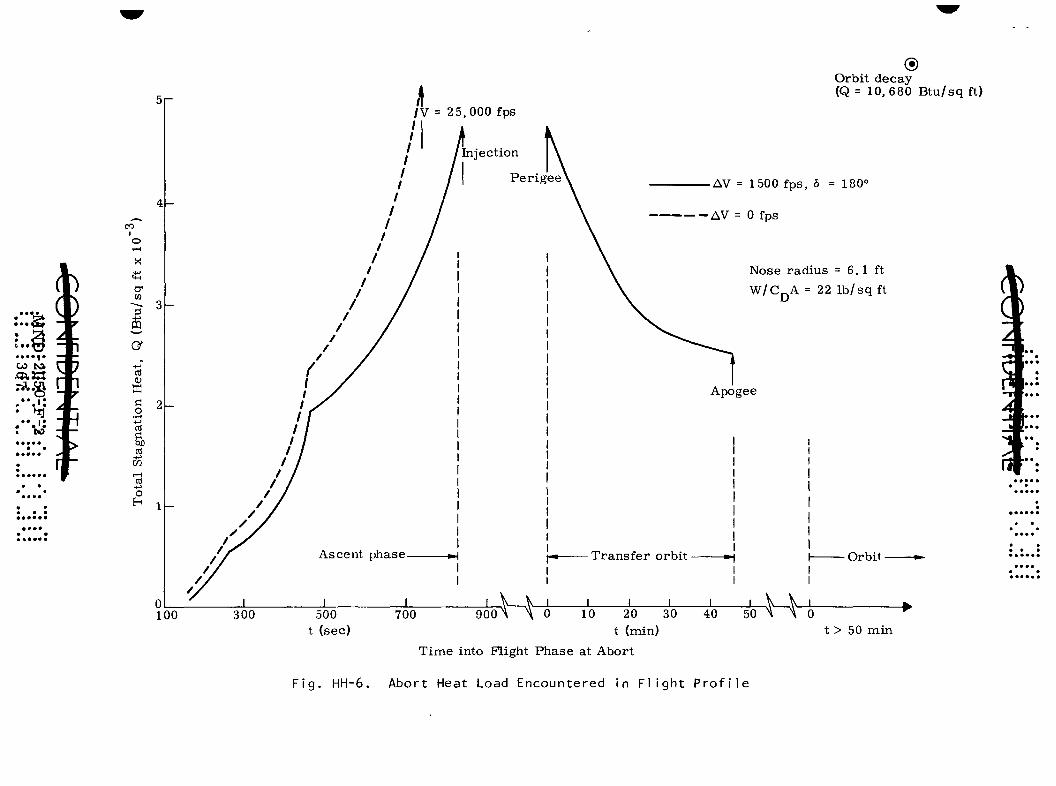
5 r
4 -
^ IV = 2 5,000 fps
Ascent phase-
100 300 500 t (sec)
700
Injection
I Perigee^
900 H
® Orbit decay (Q = 10,680 Btu / sq ft)
• AV = 1500 fps, 6 = 180°
AV = 0 fps
Nose radius = 6,1 ft
W/Cj-jA = 2 2 Ib / sq ft
Apogee
Trans fe r orbit- Orbit-
X _L 10 20 30 40 50
t (min)
Time into Flight Phase at Abort
^
t > 50 min
Fig. HH-6. Abort Heat Load Encountered in Flight Profile
• • • ••'(CCTJnDtNTbM
The curves for g (accelerat ion) and q (dynamic p r e s s u r e ) a r e nea r ly identical except at the peaks.
26r-
24
22
20
18
3 16 bJO
o
2 12
1 10 o <
130
O
CO
o -' 5 X
a-CO
cr - ^ 4 to pq
t( =i CO CO
OJ
u
6
4
2 -
0.
a
Q
§3
CIS 0)
^ 1
Peak q
Peak Q
.Qn
100 200 300 Time from Reentry (sec)
400
Fig. HH-7. Acceleration, Pressure, Stagnation Heat and Heating Rate Time Histories: Deorbit from Apogee = 600 Nautical Miles; AV = 1500 fps
co^j^lD:NTlAL .:- .:- : 56$ •„ :.:
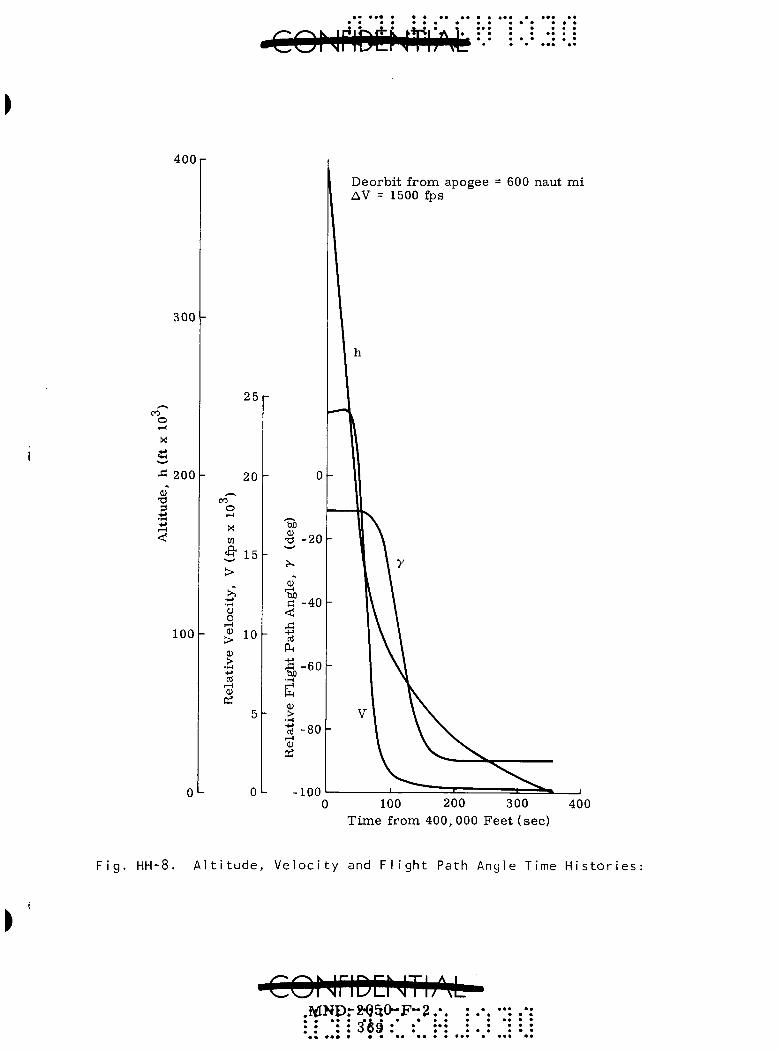
4 0 0 r
3 0 0
CO
o
•^ 200 0) T3 3
100 -
25
20
CO
o X m
S 15 >
o o .—< >
>
OJ
03
10
Qi-
Deorbit from apogee AV = 1500 fps
600 naut mi
-100 100 200 300
T ime from 400, 000 Fee t (sec) 400
Fig. HH-8. Altitude, Velocity and Flight Path Angle Time Histories:
CONriDEMThM-.MND.-2^50-F-2.-. : .*. •*; • • • • • _ • • • • • • • • • •• : : : : 3 6 9 : : :•: : . : :
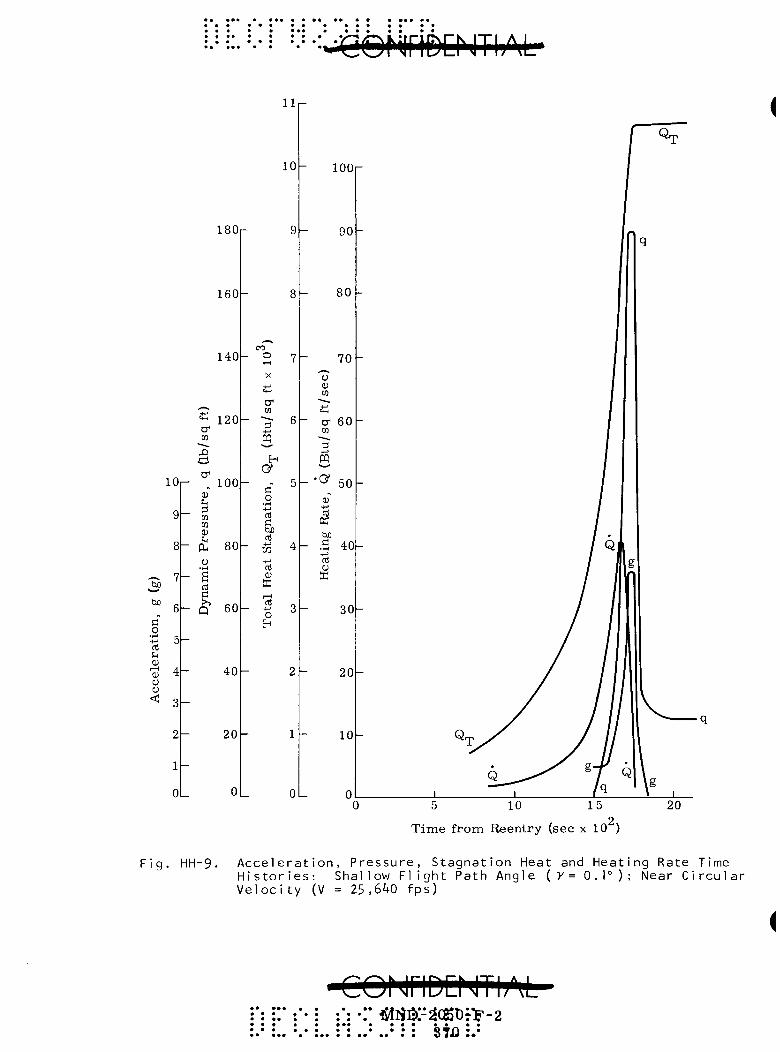
Acc
eler
atio
n,
g (g
)
X I
1 I
I 1
I I
Dyn
amic
Pre
ssu
re,
q (I
b/sq
ft)
: r
•T:
I
<
I >
n>
— o
—
c/i
n
O
rt
(B
no
—
—1
(1
) rt
—
-1
-<
(D
QJ
c/l
rt
CO
o
o
OJ o
CO
o
o
o
o
(4
^ O
II
O
nr
N>
QJ
"O
un
—
-1
- —
(D
O
S O
(/I
-P
-S
i/i
o
c -n
-1
-h
—
(B
"O
ui t
o ^
'D-
CO
rt
rt
QJ
-a I
D
QJ
3 rt
Q
J :T
rt
>o
3
3 C£
3 —
X
m (D
01
^Q
J II
D
Q-
O
— C
D
°QJ D
fD
QJ
73
-i Q
J rt
O
(D
n —
c
3 —
m
Qj
T
Tot
al H
eat
Sta
gnat
ion,
Q
„ (B
tu/s
q ft
x 10
^)
en
o C
O
o
Hea
ting
Rat
e,
Q (
Btu
/sq
ft/s
ec)
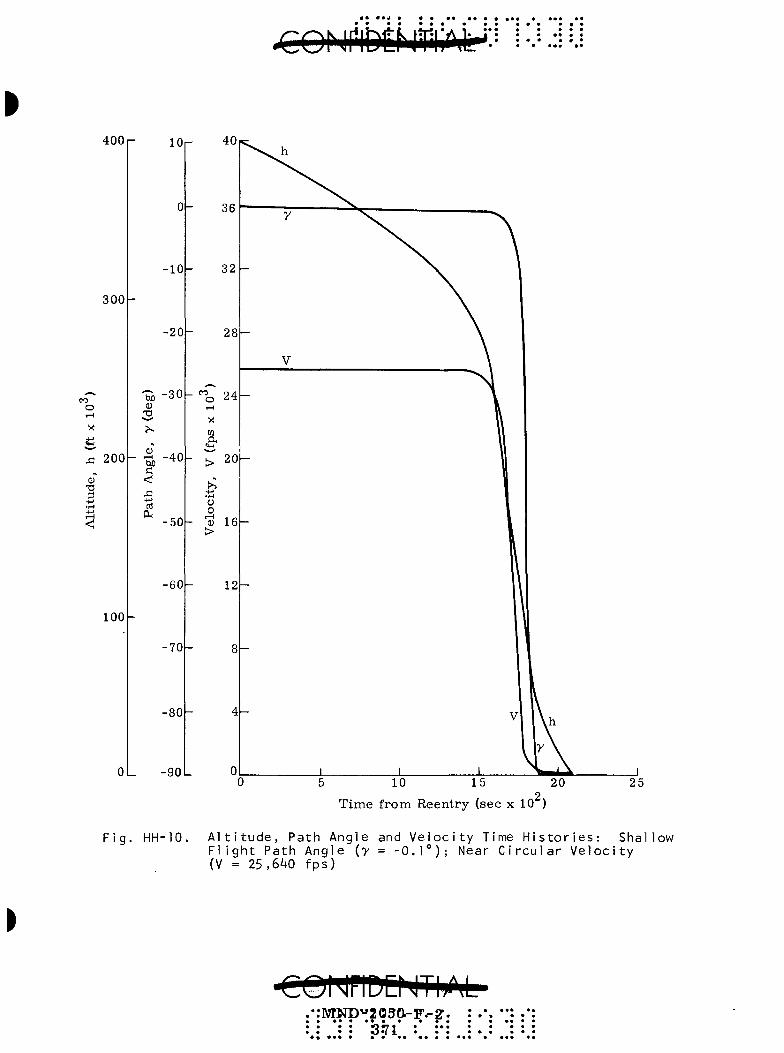
.coh mn mb^- • ••
4 0 0 r l O r
3 0 0 -
O t-H
X
&
XI
T3 ;3
•10
-20
M -30 0) •a
200 tuo a
rt
-40
•50
-60
•70
-80
OL - 9 0 L
1 0 0 -
Time from Reentry (sec x 10 )
F i g . HH-10. A l t i t u d e , Pa th A n g l e and V e l o c i t y Time H i s t o r i e s : S h a l l o w F l i g h t Pa th A n g l e ( y = - 0 . 1 ° ) ; Near C i r c u l a r V e l o c i t y (V = 25 ,640 f p s )
MNp«205ft-F^2r. *: : 'ski :' :*:
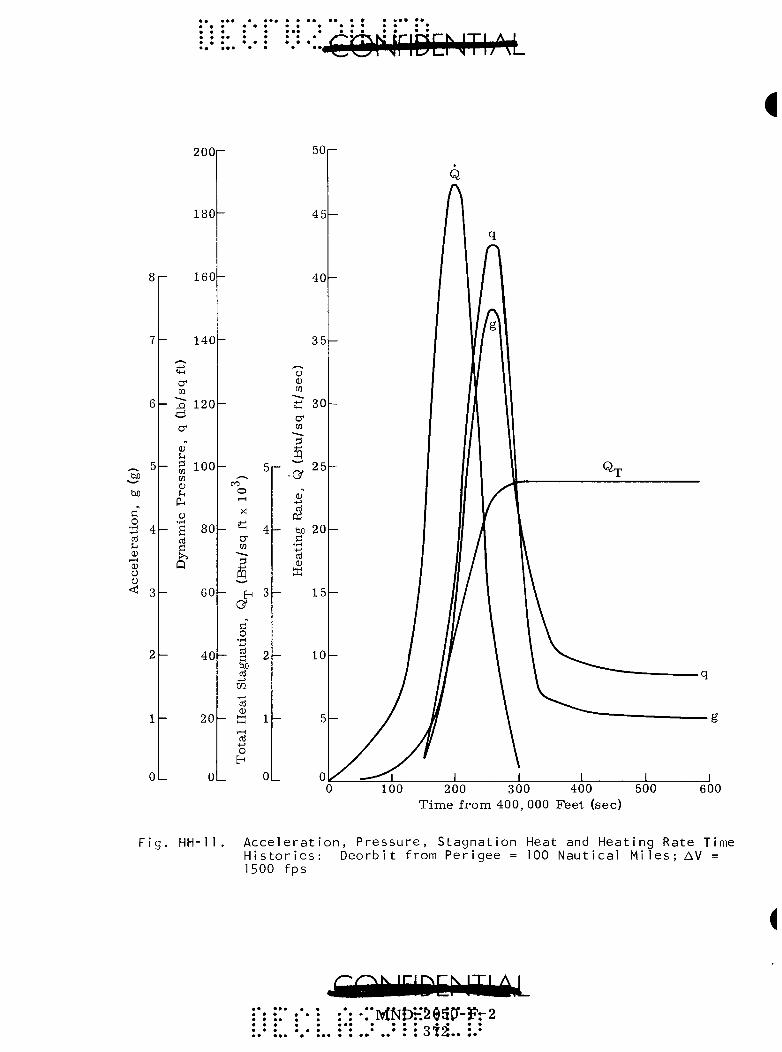
••a
••;t
: C
O
ISJ»
: ^
U2 X
Acc
eler
atio
n,
g (g
) 0
5 h
f^
ai
1 1
1 T
D
ynam
ic P
ress
ure
, q
(Ib/
sq f
t)
[O
o
4^ o
o
CO
o
o o
to
o
o
05
o
CD
o
IS2 o
o
n
—
x>
un -
. o
o
UI
n
O
rt
(!)
O
—
-h
-!
(D
X)
1 (/
) (D
Q
) l/
i r
t
0 D
a-
m
o
-0
-I
-i
cr n
> —
• W
r
t t/
i c -h
-1
-1
CD
O
-
3 C
O
"O
rt
CD Q
J -1
U
3 —
D
in
Q
J (D
r
t (D
—
O
II
3
—
X
O
(D
O
Qj
rt
-z.
QJ
QJ
C
D
rt
CL
n
X
QJ
(D
—
QJ rt
3:
—
—
3
fD
cn :
o
-•
QJ
.
rt
t> fD
<
—1
II —
3 (D
H R
CD
11
O 3 rf^
o
o
o o
o "A
CD
r-
t
CD
O
O
t-* o
o
to
o
o
00 o
<J>
o
o
o
o
en
o
o
Tot
al H
eat
Sta
gnat
ion,
Q
^ (B
tu/s
q ft
x 10
)
Hea
ting
Rat
e,
Q (
Btu
/sq
ft/s
ec)
3:
^
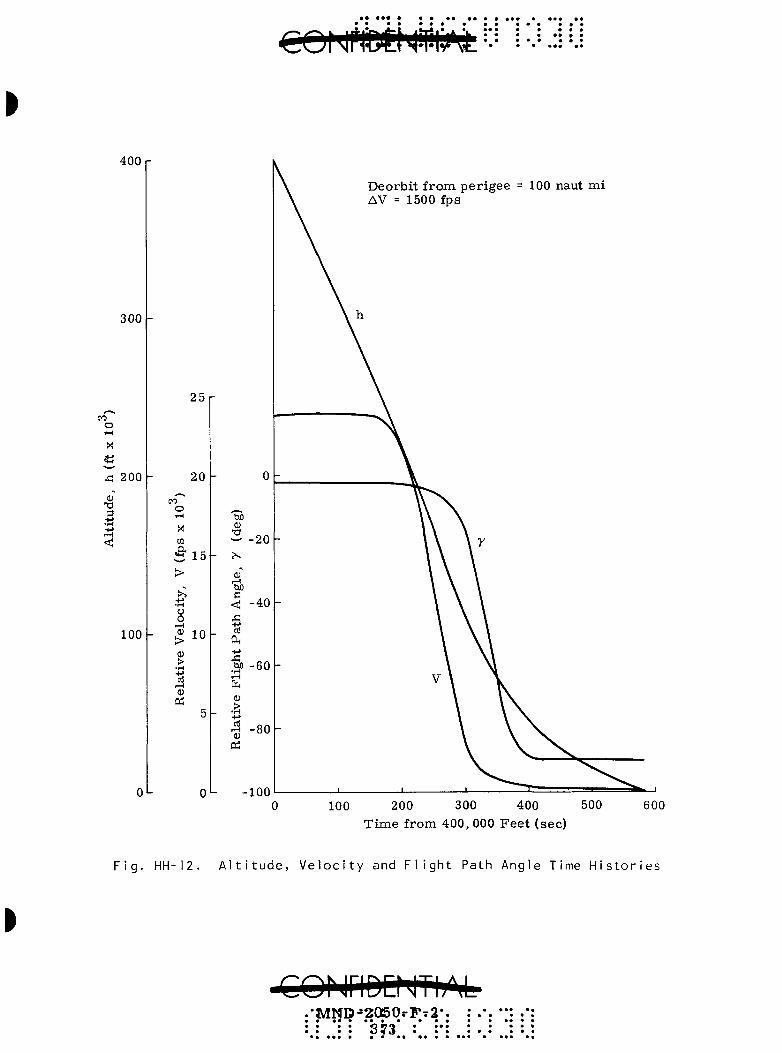
ejNi^btigffi'i':^
400
300
en o
B 'Z 200
3
100
25
20
CO
o
to
S 15
o o
r-l
>
10
03
0"- •100
Deorbit from, per igee AV = 1500 fps
100 naut mi
100 200 300 400 500 T ime from 400, 000 Fee t (sec)
600
I
Fig. HH-12. Altitude, Velocity and Flight Path Angle Time Histories
•MND-'20SOrFT2*. ; .'. "] .':
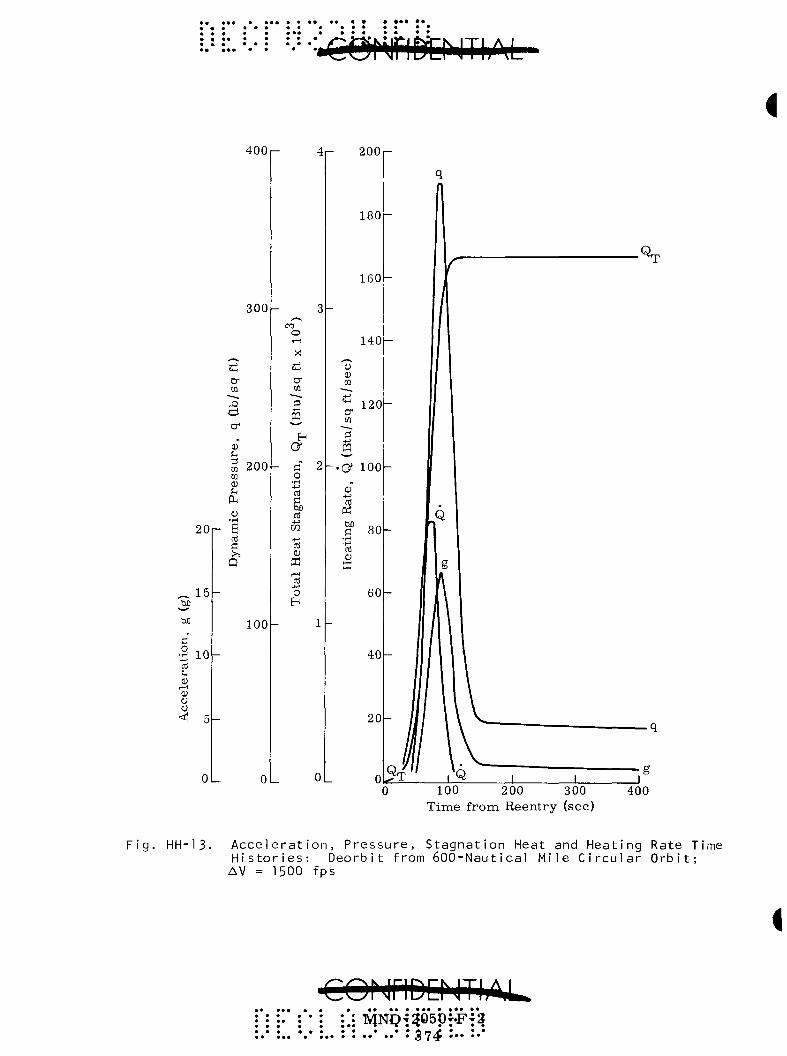
t>x
> <
— o
u)
n
II rt
ft)
o
—
—-1
fD
u
n 1
O
fD Q
J O
(/I
rt
Acc
eler
atio
n,
g (g
)
o
to
o
Dy
nam
ic
Pre
ssu
re,
q (I
b/s
q ft
)
o
o
to
o
o
03
o o
o
o
"1
To
tal
Hea
t S
tag
nat
ion
, Q
^ (B
tu/s
q ft
x 1
0'^)
(t)
'.M'
T)
^
fD
O
-O
•1
-1
O-
fD
—
1/1
rt
(/)
C
-h
-i
-1
fD
O -
3 0
0 O
Srt
O
Q
J O
iO
I D
Z
QJ
QJ
rt
C
—
rt
O
— D
O
QJ
X
—
fD
Q
J
—
QJ
fD
3 Q.
O
—
X
T
fD
n Q
J C
rt
QJ
3 -1
U3
07
3 -1
QJ
O-r
t —
fD
Hea
tin
g R
ate,
Q
(B
tu/s
q ft
/sec
)
3 fD
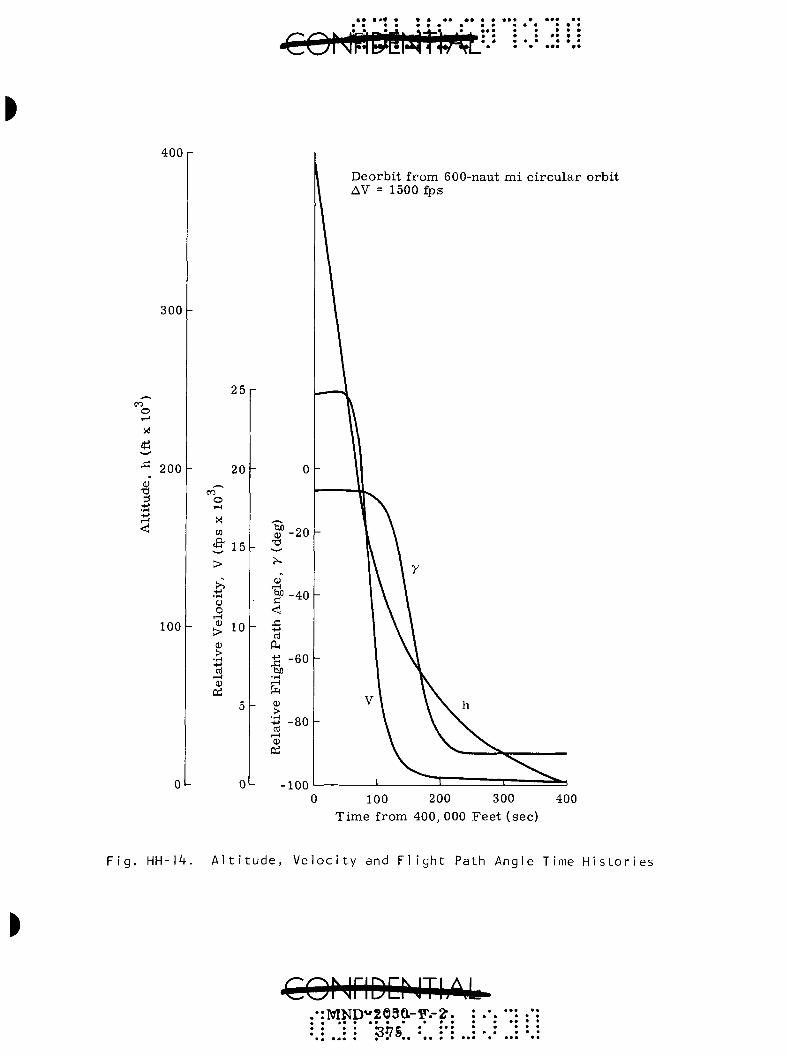
I 400
300
CO
o X
200
X) 3
100
01-
25
20
CO o T~i
X to
a->
>i s o o f—( 0)
> 0) >
rt (—t 4) DS
15
10
5
^^ be
3 N
(U I — 1
tiB CI <;
_ J3 -t->
rt CLH
S bfl
• i - ( 1—1
fa
> •r-(
03
Deorbit from 600-naut mi circular orbit AV = 1500 fps
•100 100 200 300 400
Time from 400, 000 Feet (sec)
Fig. HH-14. Altitude, Velocity and Flight Path Angle Time Histories
I
MND"2e9a-F.-?
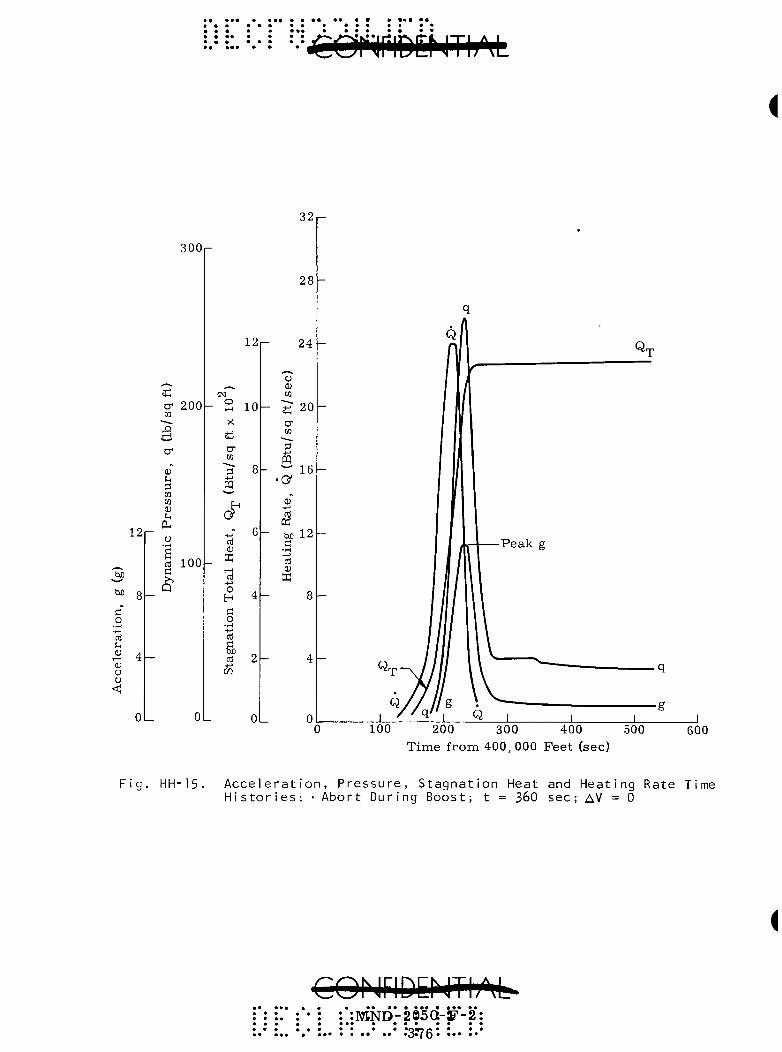
Acc
eler
atio
n,
g (g
)
T
en :*•»
:
nz
> —
• w
rt
0 -1
—.
CD
tn > cr
0 -1
rt
C
C -\ —•
3 in cc
O
O
n
ft) —'
(D
-1
QJ rt
O
D
X -o
-1
fD
l/l
W
C
-I
m
>•
00
rt
(1)
O
ID
1/1
rt
-•
ri ll
D
Qj
rt
O
D
3-
VW (
D
ON
Q)
O
1/1
fD
n
I> rt
(1)
D
Q.
fD
<t
D
II rt
—•
3 O
UD
:n
Qj
1 D
yn
amic
P
ress
ure
, q
(Ib
/sq
ft)
o
o
to
o
o
00
o
o
• «
stag
nat
ion
To
tal
Hea
t,
Q^
(Btu
/sq
ft x
10
) t-
*
M
»f^
O^
CO
o
I I
1 1
1
Hea
tin
g R
ate,
Q
(B
tu/s
q ft
/sec
) I-
' I-
" to
00
[O
(X
o
[O
to
C
O
3 fD
00
to
O.::
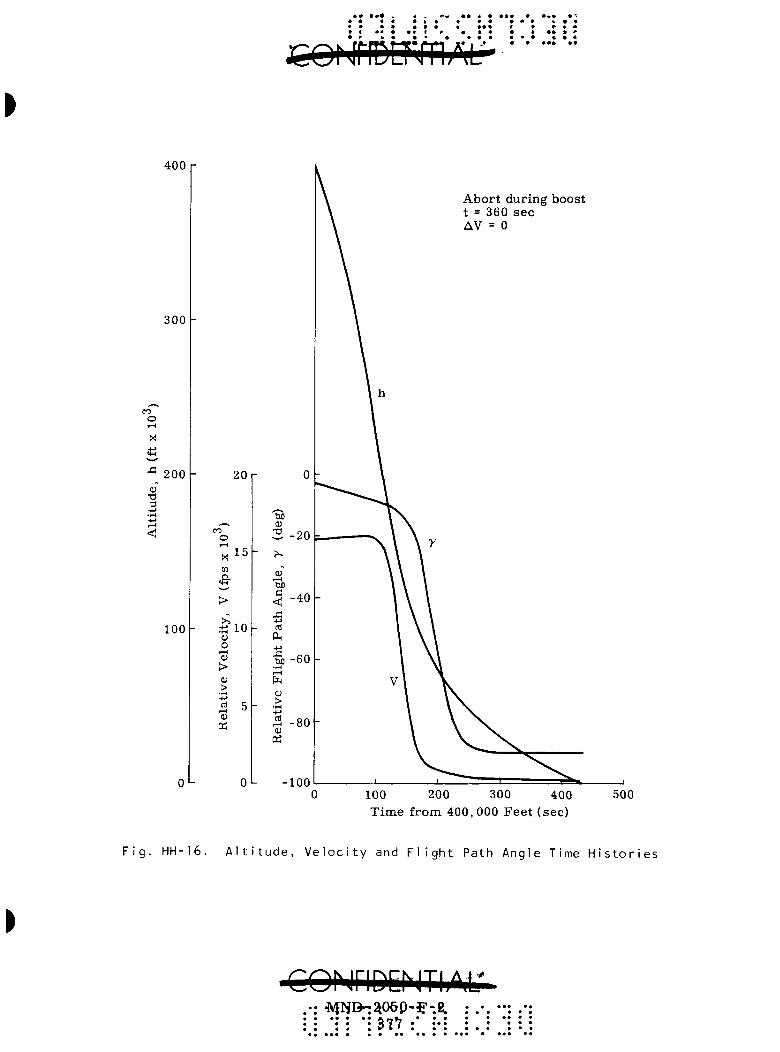
400
300
CO
o
X
s O
TS 3
200
100
20
> < 1 5
CM
>
.-^10 o o 4)
> >
• iH +.* ^ 5
OL
tuO 4)
13
-
d
<
rt
•g) -60 ( — 1
>
4! 03
•100
Abort during boost t = 360 sec AV = 0
100 200 300 400 500 Time from 400,000 Feet (sec)
F i g . HH-16. A l t i t u d e , V e l o c i t y and F l i g h t Path Ang le Time H i s t o r i e s
COMriDCMTliM^ • * 3lV :*

TABLE HH-1
Abort Conditions
D e s i g n Cond i t ion
Y e s
Y e s
Y e s
B O
^ { S T
T R A N S \ F E R
Time into P h a s e
/-• 160 s e c 260 360 460 560 760
^832
' ' 7 . 6 m i n 1 5 . 2 2 2 . 8 3 0 . 4 38
L45.6
O r b i t
1 2 2 3 3
3
AV = T i t a n I I IC, 5
^0 (ft)
191 ,099 3 1 3 , 8 1 1 4 2 4 , 6 0 5 5 0 1 , 6 1 5 607 ,887 6 1 3 , 1 7 8 6 1 4 , 4 5 9
7 8 7 , 4 4 8 2 9 4 , 4 4 4 0 2 6 , 5 4 0 8 0 8 , 5 2 1 4 1 5 , 6 1 3 6 4 5 , 6 6 5
6 4 5 , 6 6 5
^ 0 (fps)
7 , 5 6 1 1 4 , 2 7 0 17 ,126 2 1 , 5 5 3 2 3 , 7 0 9 25 , 171 2 6 , 3 8 8
2 6 , 1 9 0 2 5 , 6 1 9 2 4 , 8 1 8 2 3 , 9 9 0 2 3 , 3 6 5 2 3 , 132
2 3 , 9 5 2
1500 fps - S e g m e n t A
^0 (deg)_
9 . 7 4 6 . 3 8 2 , 6 1 2 . 7 8 0 . 4 2 2 0 . 0 1 8 0 . 0 9 7
1 .785 3 . 1 6 2 3 .77 3 . 3 8 2 . 0 0 0
- -
s c e n t
h r
(ft)
191 ,099 3 1 3 , 8 1 1 4 0 0 , 0 0 0 4 0 0 , 0 0 0 4 0 0 , 0 0 0 4 0 0 , 0 0 0 4 0 0 , 0 0 0
4 0 0 , 0 0 0 4 0 0 , 0 0 0 4 0 0 , 0 0 0 4 0 0 , 0 0 0 4 0 0 , 0 0 0 4 0 0 , 0 0 0
4 0 0 , 0 0 0
^ R (fps)_
6 , 1 2 7 1 2 , 8 3 3 1 5 , 7 5 3 2 0 , 2 7 3 2 2 , 5 0 4 2 3 , 9 4 5 2 5 , 1 5 1
2 5 , 1 6 3 2 5 , 1 9 7 2 5 , 2 4 4 2 5 , 2 9 3 2 5 , 3 3 0 2 5 , 3 4 4
2 6 , 0 4 7
^ R (deg)
+ 6 . 0 2 + 4 . 5 6 - 3 . 6 7 - 4 . 6 5 - 4 . 4 7 - 3 . 2 2 - 1 . 8
- 3 . 0 7 - 5 . 2 4 - 7 . 2 5 7 - 8 . 9 4
- 1 0 . 0 4 8 - 1 0 . 4 4
- 6 . 7 1
% (deg)
- 1 6 4 -164 - 2 1 4 - 2 2 . 3 - 1 8 . 5 - 1 8 . 3 - 2 8 . 7
-72 - 8 7 . 8 - 8 5 . 7 -79 -70 - 6 0 . 5
- 8 9 . 3
• •
• •
m
^ j * • (ti": A K"' ^ ' . . ' • ^
Ai I-W" Wi 1 Y"'i
fi
•t J-

APPENDIX II
ABORT AND IMPACT AREA CONTROL
COMMUNICATION FACILITIES AND OPERATIONS
The launch vehicle assumed is Titan IIIC and two typical missions, one of 32° inclination launched from ETR and one with polar inclination launched from WTR, are described. The inclination of 32, 2° was used for the ETR analysis since that was the only inclination for which Titan IIIC trajectory data were available. However, the impact points shown in the following sections use the 30° orbit inclination. The results for that orbit were extrapolated from the presented data. Range facilities utilized include tracking, telemetry and command from both ships and ground stations. The transtage of the Titan IIIC will contain a Malfunction Detection System mechanized such that it can effect the separation and spin stabilization of the CIR at any time after fairing separation. Application of the AV impulse will, however, occur only upon ground command via the S-band command system. The orbits assumed are both 600 naut mi circular orbits with injection directly into a transfer orbit of 100 naut mi altitude perigee. The critical phases of each ascent trajectory correspond to engine burning times. These periods are indicated in the sequence of events given in Table II-1 (timing is approximate).
Continuous range safety determination of the trajectory is required during this time such that quick reaction to failure may be obtained. During coast periods after injection into the transfer orbit the MDS may initiate abort but the CIR will not require continuous coverage and, in fact, controlled delay in deorbit becomes desirable to avoid impact on the various land masses over which the vehicle may be passing. A deorbit impulse from the transfer orbit is, however, mandatory since with perigee at 100 naut mi its lifetime is about one week and the descent trajectory difficult to predict.
The transtage will contain C-band tracking, UHF command and either VHF or S-band telemetry while CIR will contaia a C-band beacon and S-band telemetry and command. The C-band system aboard the RB will be activated only at separation while the S-band system operates from launch. It is planned to pulse code modulate the RB C-band beacon signal to enable tracking facilities to immediately determine whether an abort separation has occurred. Range facilities required will include tracking and communications in the frequency bands mentioned and maximum utilization will be made of present or planned systems on the ranges, the Apollo Net and the Satellite Control Facility Net. The single exception is removal of the CIR command frequency from the range UHF net. This was
•MNl5-2'050^F-'2' • : " ; ,' ' '

TABLE II- 1 Nominal Sequence of Events (ETR Launch,
600-Naut Mi Circular Oribit)
Time (sec)
0
60
106. 5
3832
3900
4100
Altitude (ft)
22. 35
39,252
109,848
Event
109,02 114,229
119.168 131,816
210.0 249,016
259,125 312,431
461.11 502,769
474.11 515,580
832 612,436
3 , 6 4 5 , 6 0 0
3 , 6 4 5 , 6 0 0
3 , 6 4 5 , 6 0 0
Lift-off
'max 875 Ib/ft^
Begin decay of solids (Stage O cutoff)
Stage I ignition
Separate solids
Jet t ison fairing (q = 3.23) Ib/ft^
Stage I burnout and separat ion Stage II ignition
Stage II burnout and separat ion
Stage III ignition (Transtage)
Cutoff t r ans t age . Injection into 100/600-naut mi t r ans fe r orbi t . Begin coast from pe r igee .
Apogee of t r ans fe r orbi t , Trans tage ignition. C i rcu la r i ze orbit to 600 naut mi ,
Ci rcular iza t ion complete . Begin attitude maneuver to separa te payload.
Separate payload. Mission complete .
•COMriDQJThM * ; : " . ' • ; :':MND-i2f).6d-'F-'2? ' ^ '..'•.' ". : ' . ' . ' • 3"80' ' '
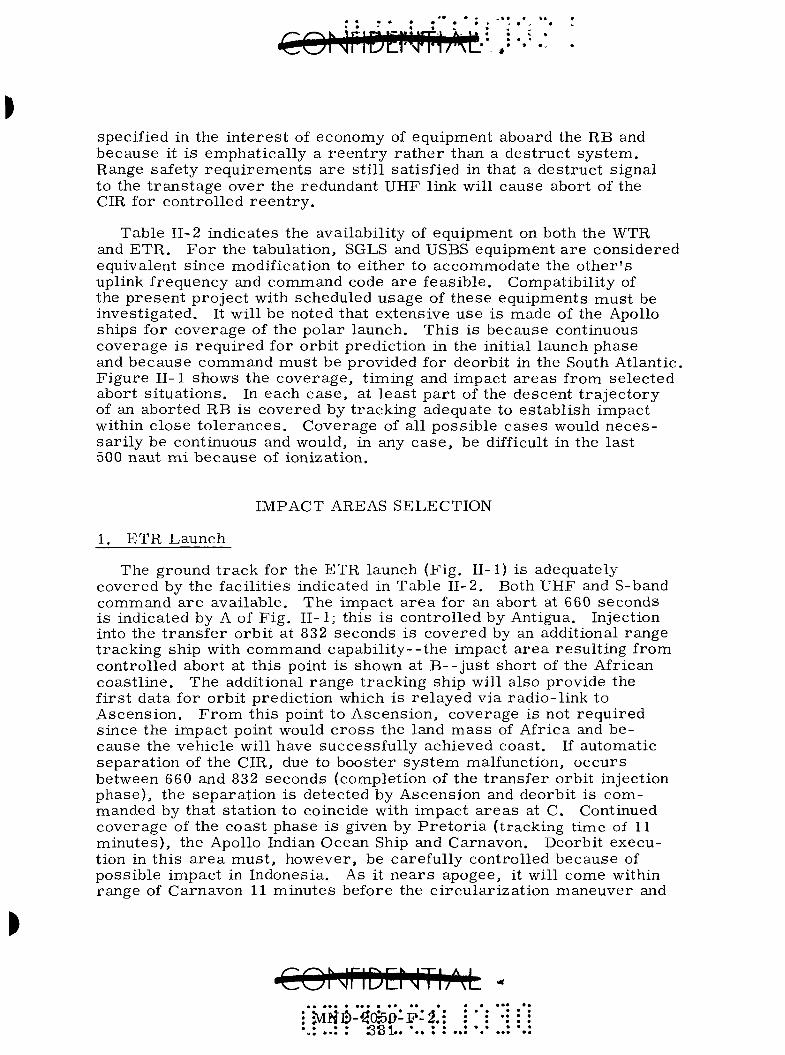
specified in the in te res t of economy of equipment aboard the RB and because it is emphatical ly a r een t ry r a t h e r than a des t ruct sys tem. Range safety r equ i r emen t s a re s t i l l satisfied in that a des t ruct signal to the t r ans tage over the redundant UHF link will cause abort of the CIR for controlled r een t ry .
Table II-2 indicates the availabili ty of equipment on both the WTR and ETR, F o r the tabulation, SGLS and USBS equipment a r e considered equivalent s ince modification to e i ther to accommodate the o the r ' s uplink frequency and command code a re feasible . Compatibili ty of the p resen t project with scheduled usage of these equipments must be invest igated. It will be noted that extensive use is made of the Apollo ships for coverage of the polar launch. This is because continuous coverage is r equ i red for orbi t predict ion in the initial launch phase and because command must be provided for deorbit in the South Atlantic, F igure II-1 shows the coverage , t iming and impact a r e a s from selected abort s i tua t ions . In each ca se , at l eas t pa r t of the descent t r a jec to ry of an aborted RB is covered by t racking adequate to es tabl ish impact within close t o l e r ances . Coverage of all possible cases would n e c e s sa r i ly be continuous and would, in any c a s e , be difficult in the last 500 naut m i because of ionization.
IMPACT AREAS SELECTION
1. ETR Launch
The ground t r ack for the ETR launch (Fig, II-1) is adequately covered by the facil i t ies indicated in Table II-2, Both UHF and S-band command a r e avai lable . The impact a r e a for an abort at 660 seconds is indicated by A of Fig , II- l; this i s control led by Antigua, Injection into the t r ans fe r orbit at 832 seconds is covered by an additional range t racking ship with command capabi l i ty- - the impact a r ea resul t ing from controlled abort at this point is shown at B- - jus t short of the African coast l ine . The additional range t racking ship will also provide the f i rs t data for orbit predict ion which is re layed via radio- l ink to Ascension, F r o m this point to Ascension, coverage is not requi red since the impact point would c r o s s the land m a s s of Africa and because the vehicle will have successfully achieved coast . If automatic separa t ion of the CIR, due to booster sys tem malfunction, occurs between 660 and 832 seconds (completion of the t r ans fe r orbit injection phase) , the separa t ion is detected by Ascension and deorbit is commanded by that s tat ion to coincide with impact a r e a s at C, Continued coverage of the coast phase is given by P r e t o r i a (tracking time of 11 minutes) , the Apollo Indian Ocean Ship and Carnavon, Deorbit execution in th is a r e a must , however, be carefully controlled because of possible impact in Indonesia, As it n e a r s apogee, it will come within range of Carnavon 11 minutes before the c i rcu lar iza t ion maneuver and
-CONriDLMTIAL -
•.: ..: ; S8l . . *.. : : ..: *.• ..

TABLE II-2
Station
Equipment Availability S-band
C-band S-band UHF Command Tracking Tracking Command USBS or SGLS
ETR (32° inclination)
1. Cape Kennedy
2. Grand Bahama
3. Bermuda
4, Grand Turk
5. Antigua
6. USNS Twin Fa l l s (TAGM 11)
7. Ascension
8. P r e t o r i a
9. Apollo Indian Ocean Ship
10. Carnavon
11. Guam (USBS)
12. Kwajalein
13. Hawaii
14, P t , Arguello (Vandenberg)
WTR (Polar Inclination)
1. Point Arguello
2, Point Mugu
3, San Nicholas
4, Range T r a c k e r (WTR Ship)
5, Watertown (Apollo Ship 4)
6. Huntsville (Apollo Ship 5)
7, Johnstown (Apollo Ship 2)
8. Mahe
9. Anchorage
10, Hawaii
X = availability; L =
• • • • • • • •
X
X
X
X
X
X
X
X
X
X
X
X
X
X
X
X
X
X
X
X
X
X
X
X
L
X
L
X
X
X
X
X
X
X
X
X
X
X
X
X
X
X
X
X
X X
l imi ted avai labi l i ty
• ^ • •• • • • • • • • • • • • • • •• •
^ 1 Nl l U L I M 1 1/
• • • • •• • •
X
X
X
X
X
X
X
X
X
X
X
X
X
X
X
X
X
X
X
X
X
^ ^ ^ 'u^T • • •• • • • • • • « • •
X
X
L
X
X
X
X
X
X
X
X
X
X
X
X
X
X
X
X
X
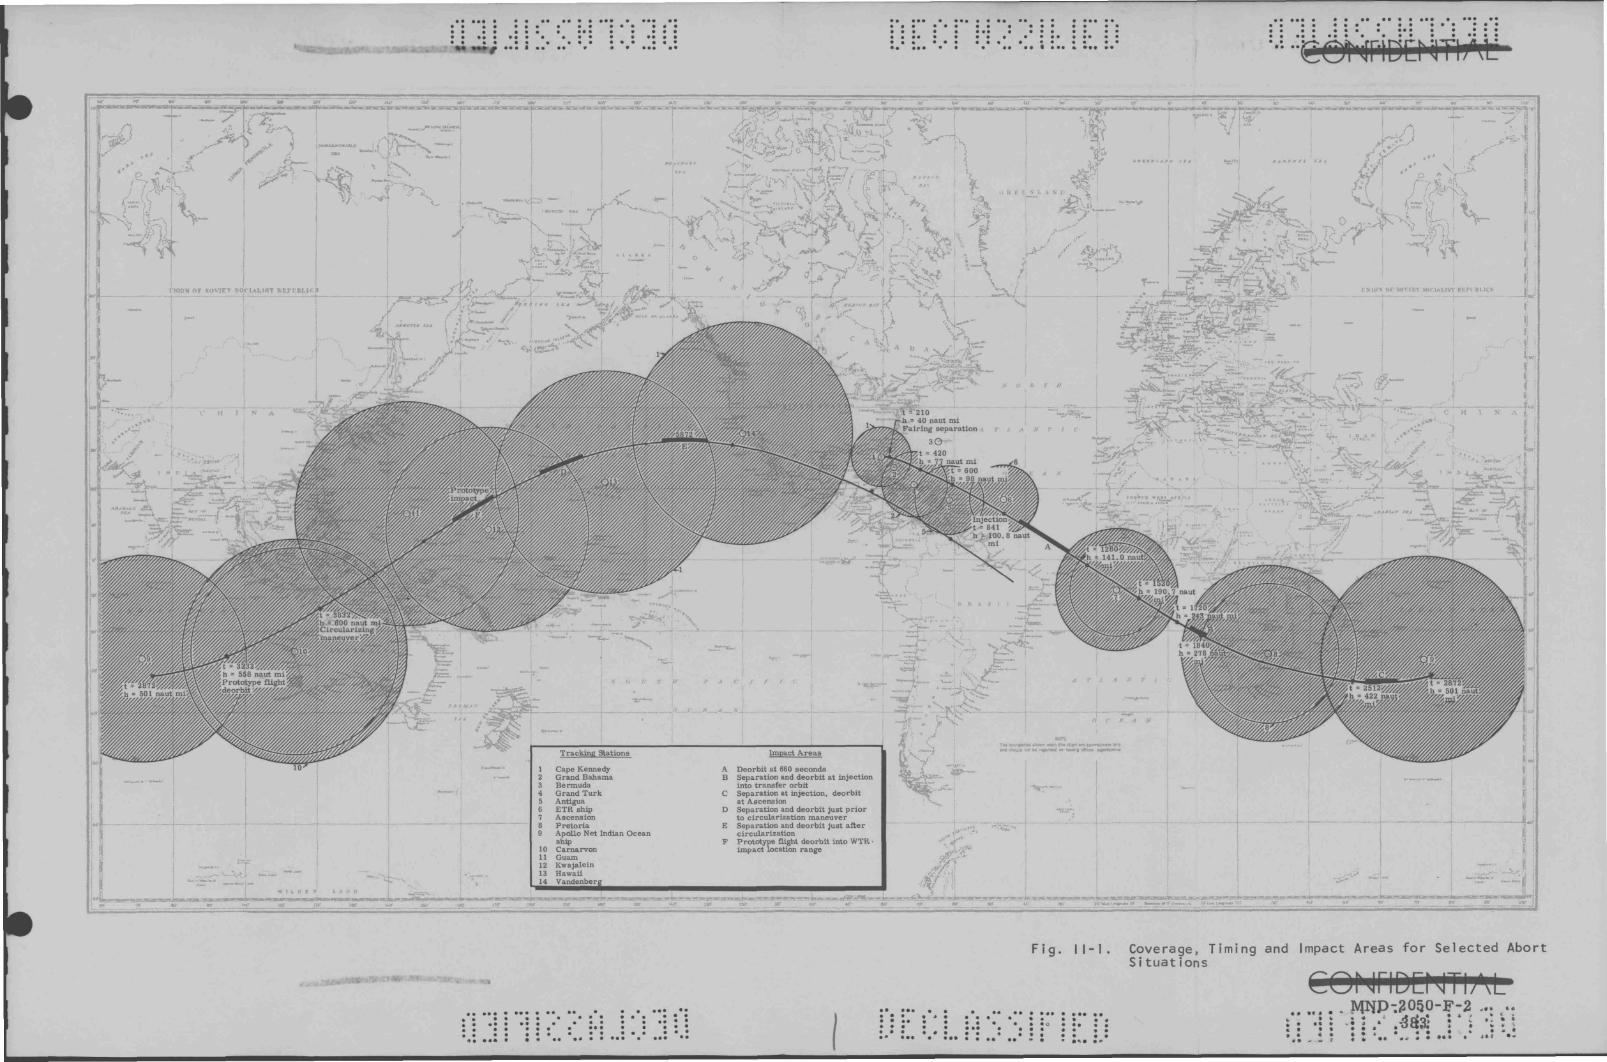
ii*»Mllll»*»feK»«P'iWK4B««iWlB l.-wi nm
Fig. I 1-1. Coverage, Timing and Impact Areas for Selected Abort Situations
CONriDENTU'lL
• • «^ 4 • « k » i t t
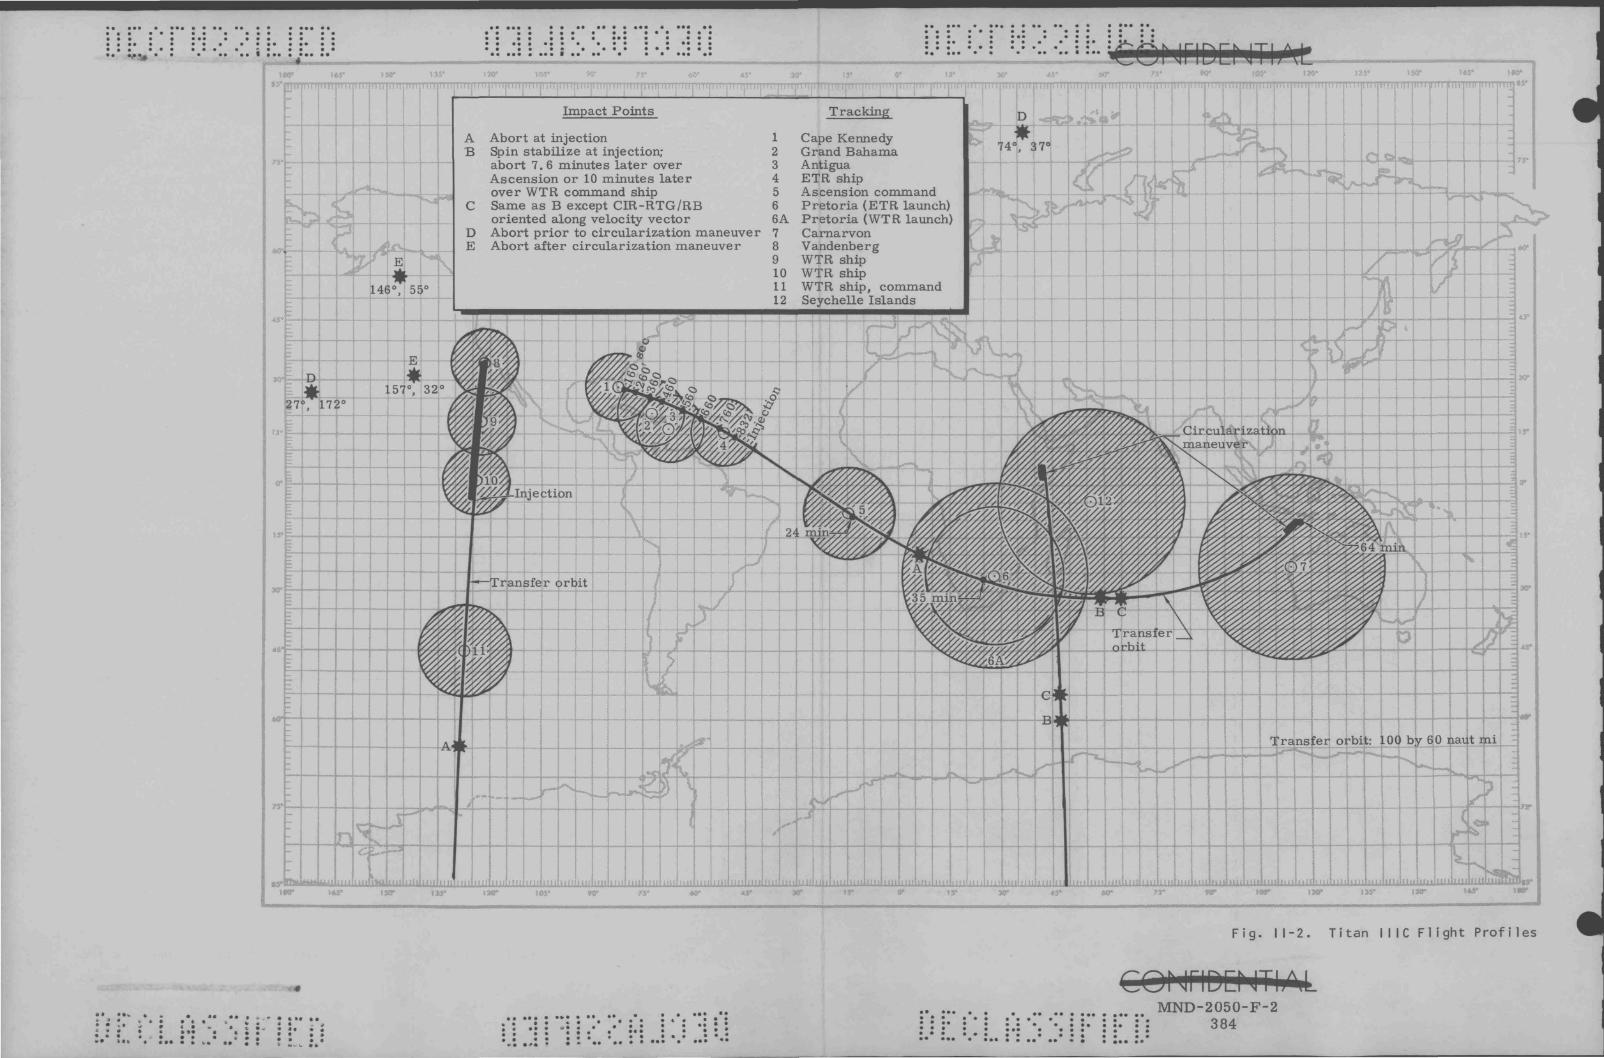
F i g . 11-2. T i t a n IMC F l i g h t P r o f i l e s
f *
• •• • « •* • •'*
• •» • • «•
» •• • •
* « •
*• • • •
• • « •
• • •
• • • • • •
• • '
• •
• • • • • • • *
• *
: :* : • : . • • • • • • • • • • • z *
MND-2050-F-2 384
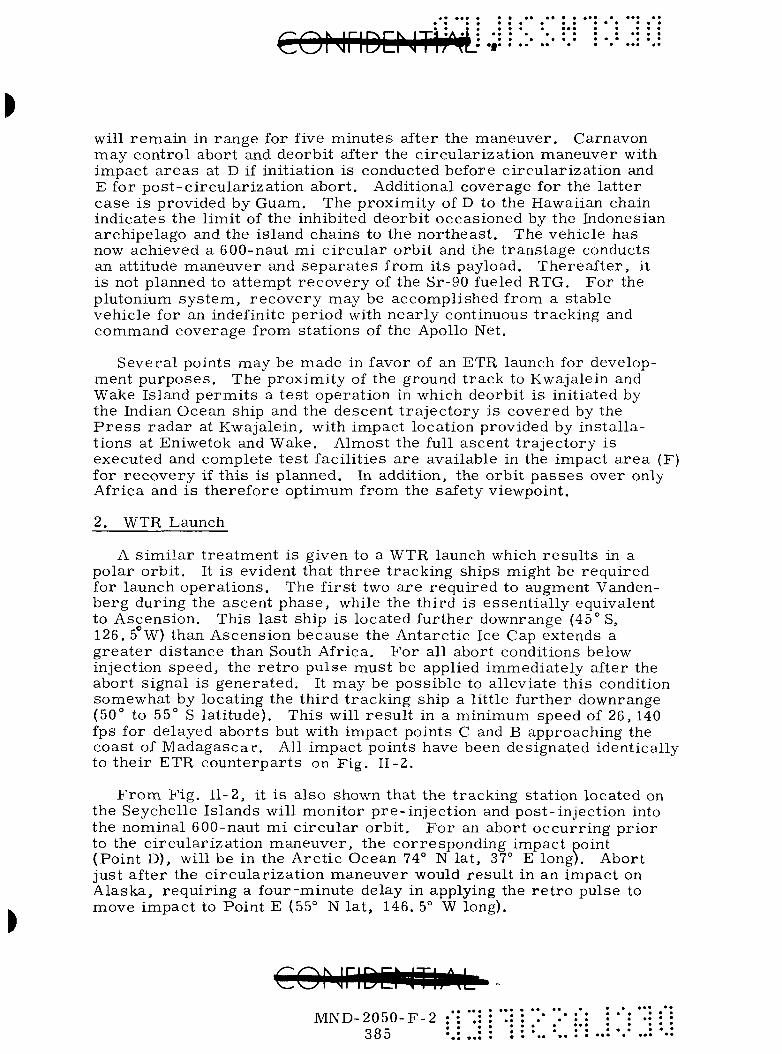
will remain in range for five minutes after the maneuver. Carnavon may control abort and deorbit after the circularization maneuver with impact areas at D if initiation is conducted before circularization and E for post-circularization abort. Additional coverage for the latter case is provided by Guam. The proximity of D to the Hawaiian chain indicates the limit of the inhibited deorbit occasioned by the Indonesian archipelago and the island chains to the northeast. The vehicle has now achieved a 600-naut mi circular orbit and the transtage conducts an attitude maneuver and separates from its payload. Thereafter, it is not planned to attempt recovery of the Sr-90 fueled RTG. For the plutonium system, recovery may be accomplished from a stable vehicle for an indefinite period with nearly continuous tracking and command coverage from stations of the Apollo Net.
Several points may be made in favor of an ETR launch for development purposes. The proximity of the ground track to Kwajalein and Wake Island permits a test operation in which deorbit is initiated by the Indian Ocean ship and the descent trajectory is covered by the P re s s radar at Kwajalein, with impact location provided by installations at Eniwetok and Wake. Almost the full ascent trajectory is executed and complete test facilities are available in the impact area (F) for recovery if this is planned. In addition, the orbit passes over only Africa and is therefore optimum from the safety viewpoint.
2. WTR Launch
A similar treatment is given to a WTR launch which results in a polar orbit. It is evident that three tracking ships might be required for launch operations. The first two are required to augment Vandenberg during the ascent phase, while the third is essentially equivalent to Ascension, This last ship is located further downrange (45° S, 126. 5 W) than Ascension because the Antarctic Ice Cap extends a greater distance than South Africa. For all abort conditions below injection speed, the retro pulse must be applied immediately after the abort signal is generated. It may be possible to alleviate this condition somewhat by locating the third tracking ship a little further downrange (50° to 55° S latitude). This will result in a minimum speed of 26, 140 fps for delayed aborts but with impact points C and B approaching the coast of Madagascar, All impact points have been designated identically to their ETR counterparts on Fig. II-2.
From Fig. II-2, it is also shown that the tracking station located on the Seychelle Islands will monitor pre-injection and post-injection into the nominal 600-naut mi circular orbit. For an abort occurring prior to the circularization maneuver, the corresponding impact point (Point D), will be in the Arctic Ocean 74° N lat, 37° E long). Abort just after the circularization maneuver would result in an impact on Alaska, requiring a four-minute delay in applying the retro pulse to move impact to Point E (55° N lat, 146. 5° W long).
MND-2050-F-2 385

IMPACT AREA DISPERSION CONTOURS
Abort pulse requirements for this analysis were assumed sufficient to produce a 1500-fps velocity differential; hence, controlled intact reentry of the RTG/RB. Appendix P presents the analysis techniques used to generate impact dispersions and their corresponding probabilities. Results of the dispersion analysis are summarized in this section. Dispersion patterns presented herein only represent a proper functioning of the CIR/RB within its tolerances and in no way reflect malfunctions in the abort system (e .g . , failure of the deorbit retrorockets to operate).
Dispersion contours have been determined for each of the aforementioned impact points (A, B, C, D and E) by the analytic techniques reported in Appendix P, Additional contours have been computed for the various boost time points noted in Fig. II-2, for aborts from the transfer trajectory and, finally, for a normal call-down situation from the 600-naut mi circular oribit.
State vector covariance matrices and tracking covariance matrices associated with these points are given in Appendix P and are not repeated here. The SCTA V cutoff er ror is 1% of AV magnitude. A 3a coning er ror of five degrees was assumed. These e r r o r s , taken with the state e r ro r s , were used to produce impact confidence ellipses by statistically propagating the e r r o r s .
1. Boost Phase
Figures II-3 through II-8 present the impact dispersions for aborts occurring at 160, 260, 360, 460, 660 and 832 seconds (injection). Each figure, except Fig, II-8, shows comparative impact zones with the application of AV= 1500 fps and with AV = 0 fps. The impact zone is bounded by an ellipse which denotes that the probability that impact will occur within the zone is 99%. Observe that the crossrange er ror is one to two orders of magnitude less than the downrange dispersion. An interesting observation is the increase in downrange dispersion from ± 40 maut mi at 160 seconds to ± 400 naut mi at 460 or 660 seconds, decreasing to ± 300 naut mi at injection. This expansion and contraction is attributed to the 3a dispersion of the launch vehicle during ascent, and reflects the influence of the guidance system to reduce accrued e r ro r s prior to injection. All crossrange e r ro r s are on the order of ± 20 naut mi.
Noteworthy is Fig. II-8, which depicts the impact zone for an abort at the injection point. As predicted in Appendix LL, the maximum downrange dispersion is limited to ± 330 naut mi but to a greater confidence level (99% rather than 95%), Impact occurs before the western extremity of Africa, with sufficient allowance for dispersions; thus confirming the abort pulse requirement of 1500 fps.*
*1500 fps is sufficiently high, A lower AV might also suffice,
CQNriDEMTIjM !*: :•* '' '- '•': '' '.' : ':',' : ::TtIFD-2050-F-2 : • :.. '-,' :.. : " ..'- .:':': : ;.. ;.: 386

40 n
2 0 -
4) n.
a u S 20H o u U
ETR Lati tude = 27.55° N Longitude = 76.97° W
ETR
- - / ^—I—I- in-# C')\
C r o s s r a n g e
Lati tude = 27. 19°N Longitude = 75. 77° W
Downrange
Confidence level 99%
4 0 - L ^ 100 150 200 250 300
F i g . M - 3 . Impact D i s p e r s i o n B o u n d a r i e s (3a): F i ve -Segmen t T i t a n I M C ; Launcin A z i m u t h 1 0 6 ° ; A b o r t Time = 160 Seconds
40-1
3 ni
ni
S 20-1 o u
" " 4 0 - 1 ^
ETR
Lat i tude = 23 .87°N Longitude = 66.50° W
ETR C r o s s r a n g e
Lat i tude = 24.88° N Longitude = 69.09° W
Downrange
A V = 1500fps, 6 =180°
500 600 700 800 900 1000
Fig. 11-4. Impact Dispersion Boundaries (3a): Five-Segment Titan IMC; Launch Azimuth 106°; Abort Time = 260 Seconds
40 n
^ 20 ni
1) 0 tuo c ni S 20 o u U
40
ETR
Lat i tude = 22.45° N Longitude = 63 . 13° W
-]/' iQ-'^
H
ETR
Lati tude = 2 1 . 1°N Longitude = 60.1° W
1 4..#. t •••liMiMI i i 4" m'^Afd-'i I :fs^ I I
Confidence level 99%
900 1000 1—
1100 — I — 1200
Crossrange
1
Downrange
1300 1400
Fig. li-5. Impact Dispersion Boundaries (3a): Five-Segment Titan IMC; Launch Azimuth 106°; Abort Time = 360 Seconds
.CQNriDCNTIjM MND-2050-F-2 .
387 : • • « • ••• • •• •• • • • ••• ' • * • • • • • • • • • • « • • • • • • • • • • • • • • • « » • » • • ••• • • • • » • • • • • • • • • • • • • • a • • • • • • • • • • • • • • • • •

40-
2 0 -
<U n.
a a
S 20H o
" 4 0 ^
ETR
Lat i tude = 15 .90°N Longitude = 50.10° W
ETR Lat i tude = 11.48° N Longitude = 42.25° W
- - ^ ^ \'-V- 'i' H
C r o s s r a n g e
-1
pj.u"UY--i^'" ••' •• .i'J-''•'7'"
i I fe;^v"f ;W^"i i •"'•* "l^^t rl:' I •"%
„.,i>,..'. ,. -i.. „...,.;.....„ ' • : • . -i...
Downrange
Confidence level 99%
1600 1800 2000 2200 1
2400 2600 2800
F i g . 1 1 - 6 . impac t D i s p e r s i o n B o u n d a r i e s (3a): F i v e - S e g m e n t T i t a n I M C ; Launch A z i m u t h 1 0 6 ° ; A b o r t T ime = 460 Seconds
40-1
-g 20-1 a
i °-V ni
S 2 0 H o u U
40
ETR
Lat i tude = 6.82° N Longitude = 35.3 5° W
H 2000
ETR
Lat i tude = 0. 55° S Longitude = 24. 50° W
-h-h-\—I ft' •im-h )
2500 I
3000
C r o s s r a n g e ,1
Downrange
3500 4000 4500
F i g . 1 1 - 7 . Impact D i s p e r s i o n B o u n d a r i e s (3a): F i ve -Segmen t T i t a n I M C ; Launch A z i m u t h 106° ; A b o r t T ime = 66O Seconds
40 n
Confidence level 95% Confidence level 99% ] ETR
Lat i tude = 19.8° S Longitude = 6.92° E
5500 6000 6500 7000 7500
F i g . 1 1 - 8 . Impact D i s p e r s i o n B o u n d a r i e s (3or ) : F i v e - S e g m e n t I i t a n I M C ; Launch A z i m u t h 106° ; A b o r t T ime = P e r i g e e - T r a n s f e r O r b i t
: ;• : • * * • • • • • • • • • • •
• « • • • • • • • • • • • • • • a . . «
MND-2050-F-2 388
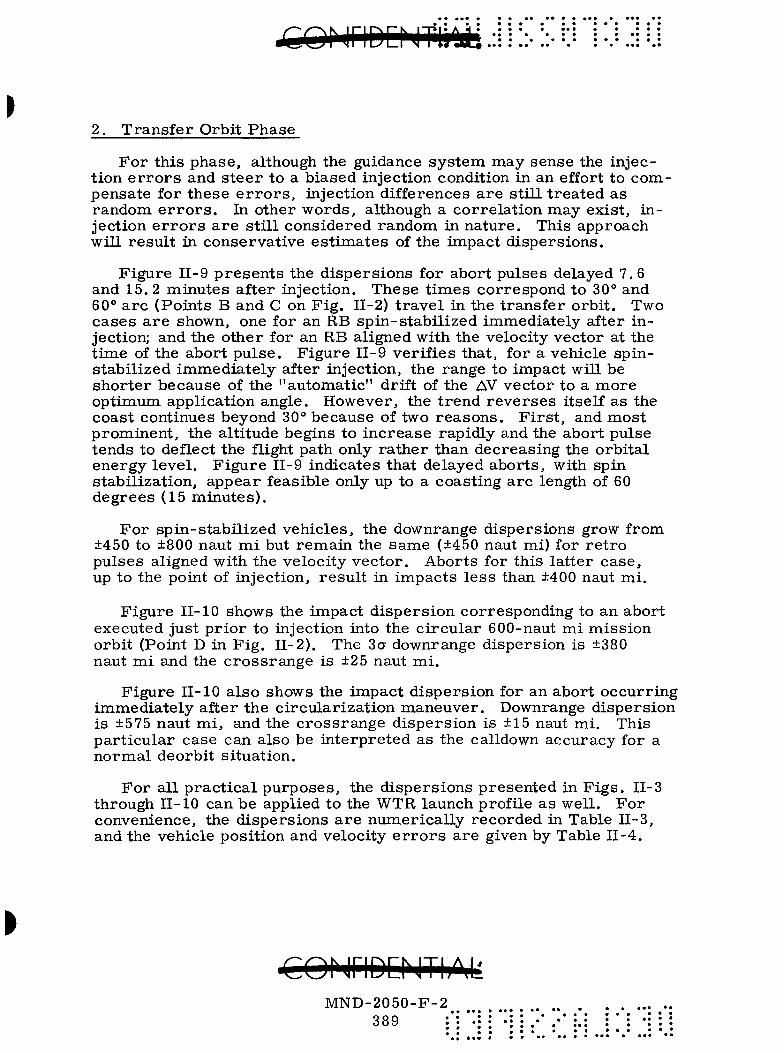
£Qr iriDD iTiiOii; .:= i ::•
2. Transfer Orbit Phase
For this phase, although the guidance system may sense the injection e r ro r s and steer to a biased injection condition in an effort to compensate for these e r r o r s , injection differences are still treated as random e r r o r s . In other words, although a correlation may exist, injection e r ro r s a re still considered random in nature. This approach will result in conservative estimates of the impact dispersions.
Figure II-9 presents the dispersions for abort pulses delayed 7.6 and 15. 2 minutes after injection. These times correspond to 30° and 60" arc (Points B and C on Fig. II-2) travel in the transfer orbit. Two cases are shown, one for an RB spin-stabilized immediately after injection; and the other for an RB aligned with the velocity vector at the time of the abort pulse. Figure II-9 verifies that, for a vehicle spin-stabilized immediately after injection, the range to impact will be shorter because of the "automatic" drift of the AV vector to a more optimtun application angle. However, the trend reverses itself as the coast continues beyond 30° because of two reasons. Firs t , and most prominent, the altitude begins to increase rapidly and the abort pulse tends to deflect the flight path only rather than decreasing the orbital energy level. Figure II-9 indicates that delayed aborts, with spin stabilization, appear feasible only up to a coasting arc length of 60 degrees (15 miinutes).
For spin-stabilized vehicles, the downrange dispersions grow from ±450 to ±800 naut mi but remain the same (±450 naut mi) for retro pulses aligned with the velocity vector. Aborts for this latter case, up to the point of injection, result in impacts less than ±400 naut mi.
Figure 11-10 shows the impact dispersion corresponding to an abort executed just prior to injection into the circular 600-naut mi mission orbit (Point D in Fig. II-2). The 3a downrange dispersion is ±380 naut mi and the crossrange is ±25 naut mi.
Figure 11-10 also shows the impact dispersion for an abort occurring imnaediately after the circularization maneuver. Downrange dispersion is ±575 naut mi, and the crossrange dispersion is ±15 naut mi. This particular case can also be interpreted as the calldown accuracy for a normal deorbit situation.
For all practical purposes, the dispersions presented in Figs. II-3 through 11-10 can be applied to the WTR launch profile as well. For convenience, the dispersions are ntonerically recorded in Table II-3, and the vehicle position and velocity e r ro r s are given by Table II-4.
CQhJriDCNTIAL MND-2050-F-2
389 :': " |
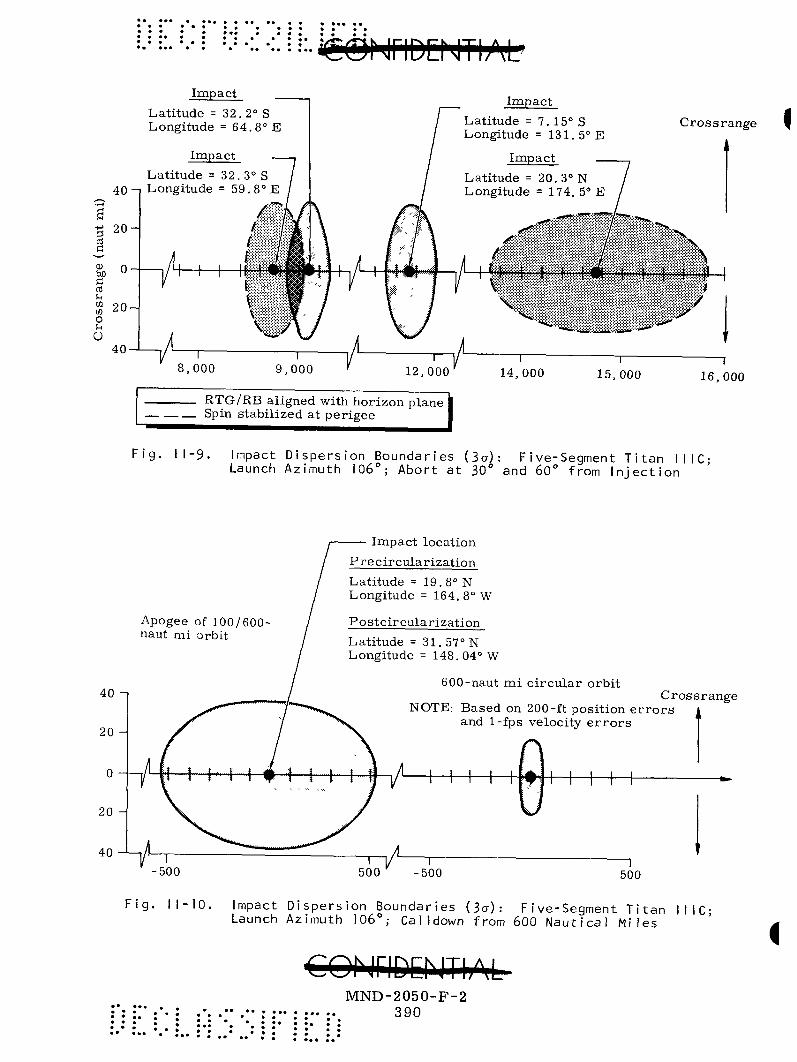
Impact _ Latitude = 32.2° S Longitude = 64.8° E
Impact — Latitude = 32. 3° S
40 - | Longitude = 59. 8° E
20-
0) n . tuo " c: nJ u
o u U 40-
t
\
8,000
\ . /
9,000
Impact Latitude = 7. 15° S Longitude = 131. 5° E
Impact Latitude = 20.3° N Longitude = 174. 5° E
Crossrange
• % >
V|-.-...| \ ji (..j|^ ^•.•in,|. .| 1 ,|i I
V • ^ . ^
/
12,000' 14,000 I
15,000 1
16,000
RTG/RB aligned with horizon plane Spin stabilized at perigee
F i g , 1 1 - 9 , Impact D i s p e r s i o n B o u n d a r i e s (3a)\ F i v e - S e g m e n t T i t a n I I I C ; Launch A z i m u t h 1 0 6 ° ; A b o r t a t 30° and 60° f r o m I n j e c t i o n
Apogee of 100/600 naut mi orbit
40 -I
20 -
20 -
40 H -500
F i g , 11 -10 .
— Impact location Precircularization Latitude = 19.8° N Longitude = 164,8° W
Postcircularization Latitude = 31. 57° N Longitude = 148. 04° W
600-naut mi circular orbit Crossrange
NOTE: Based on 200-ft position e r ro r s and 1-fps velocity e r ro r s
/ •
500 •500 500
Impact Dispersion Boundaries (3a): Five-Segment Titan IIIC-Launch Azimuth 106°; Calldown from 600 Nautical Miles
••• '• ' "' ••• : : : : . .
COh iriDQ IThM MND-2050-F-2
390

TABLE II-3
Th ree Sigma Dispers ions in Impact Posi t ion ( 0 - and 1500-fps deorbit velocity)
Deorbit Velocity
AV (fps)
0 0 0 0 0
1500 1500 1500 1500 1500
1500
R A
J
-
Trans
ange ngle
(deg)
30 30 (spin 60 6 0 ( s p i n 90 120 150 180 Ci rcu l a r
Phase Time (sec)
160 260 360 460 660 160 260 360 460 660
Injection 832
Launch Phase
Downrange Dispers ion,
AR ^ ^ D (naut mi)
16 78
119 454 504
18 32 94
239 225
384
Cross range Dispers ion,
AR ^"c (naut mi)
4 8
12 18 21
8 7
14 17 19
31
fer Orbit and 600-Nautical Mile Ci rcu la r Orbit
stabilized)
stabilized)
orbit
Downrange Dispers ion ,
ARj3
(naut mi)
314 208 237
1060 218 217 285 526
50
Cross range Dispersion,
AR^
(naut mi)
34 34 34 31 36 37 39 38 19
Reentry T ime,
+ ^R
(min)
2 . 7 4 . 3 4 , 5 7 . 8 9 . 0 2 , 3 3 . 5 3 .7 5 .7 6 . 7
15.3
Reentry T ime,
(min)
17.0 12.0 18.6 20.6 22.2 23 .5 23.6 23.0 30.0
A s s u m e s essent ia l ly no init ial posi t ion o r velocity e r r o r .
CONriDCNTh^ MND-2050-F-2: '
391 :,
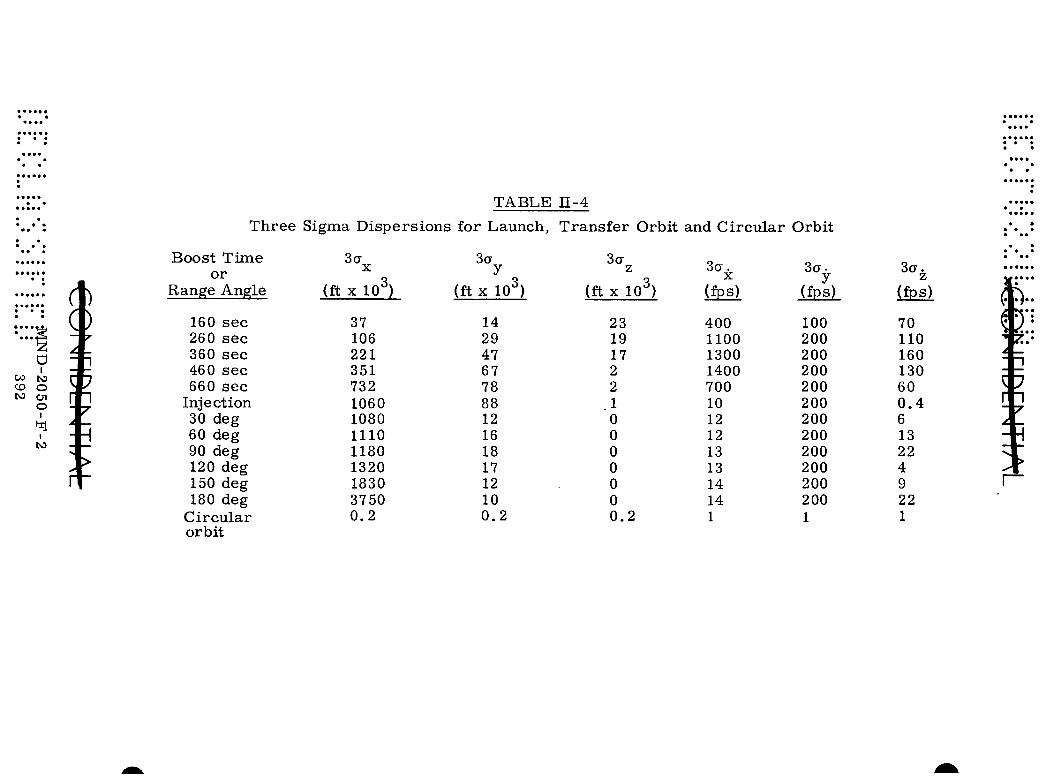
TABLE n-4 Three Sigma Dispersions for Launch, Transfer Orbit and Circular Orbit
Boost Time or
Range Angle
160 sec 260 sec 360 sec 460 sec 660 sec Injection 30 deg 60 deg 90 deg 120 deg 150 deg 180 deg Circular orbit
3a X
(ft X 10^)
37 106 221 351 732 1060 1080 1110 1180 1320 1830 3750 0.2
3a y
(ft X 10^)
14 29 47 67 78 88 12 16 18 17 12 10 0.2
Z
(ft X 10^)
23 19 17 2 2 1 0 0 0 0 0 0 0.2
3a.
(fps)
400 1100 1300 1400 700 10 12 12 13 13 14 14 1
3a. y
(fps) 100 200 200 200 200 200 200 200 200 200 200 200 1
3a.
(fps)
70 110 160 130 60 0.4 6 13 22 4 9 22 1
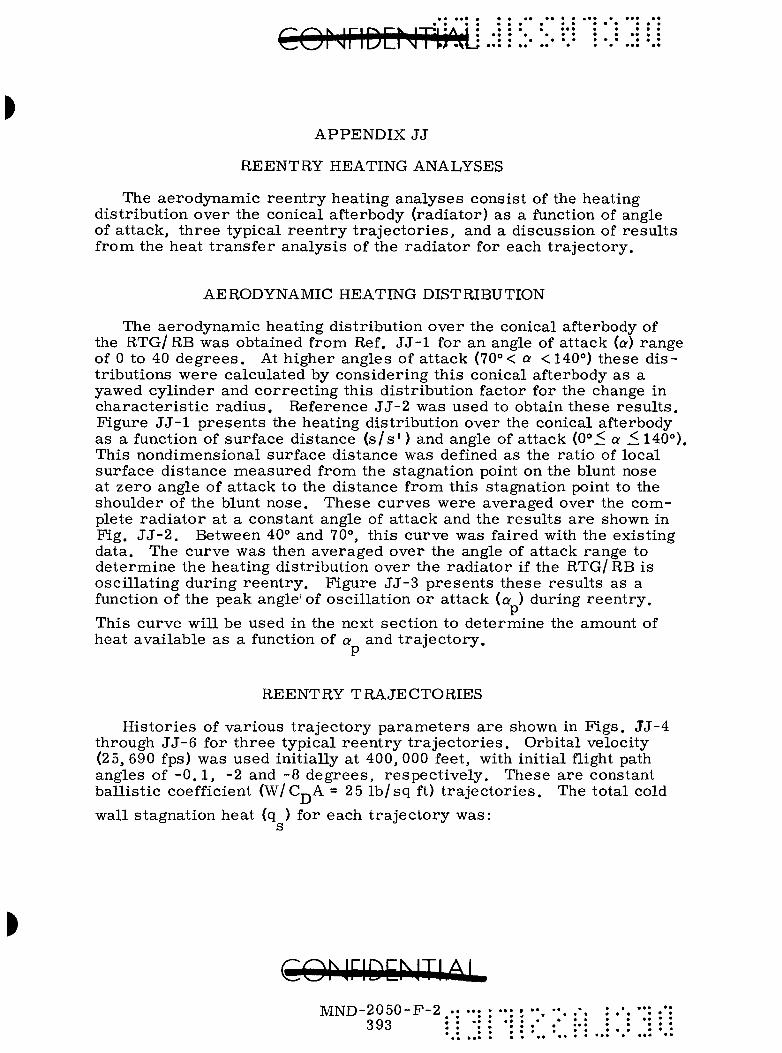
APPENDIX JJ
REENTRY HEATING ANALYSES
The aerodynamic reentry heating analyses consist of the heating distribution over the conical afterbody (radiator) as a function of angle of attack, three typical reentry trajectories, and a discussion of results from the heat transfer analysis of the radiator for each trajectory.
AERODYNAMIC HEATING DISTRIBUTION
The aerodynamic heating distribution over the conical afterbody of the RTG/RB was obtained from Ref. JJ-1 for an angle of attack (a) range of 0 to 40 degrees. At higher angles of attack (70°< a < 140°) these distributions were calculated by considering this conical afterbody as a yawed cylinder and correcting this distribution factor for the change in characteristic radius. Reference JJ-2 was used to obtain these results . Figure JJ -1 presents the heating distribution over the conical afterbody as a function of surface distance ( s / s ' ) and angle of attack (0°< a ^140°). This nondimensional surface distance was defined as the ratio of local surface distance measured from the stagnation point on the blunt nose at zero angle of attack to the distance from this stagnation point to the shoulder of the blunt nose. These curves were averaged over the complete radiator at a constant angle of attack and the results are shown in Fig. J J -2 . Between 40° and 70°, this curve was faired with the existing data. The curve was then averaged over the angle of attack range to determine the heating distribution over the radiator if the RTG/ RB is oscillating during reentry. Figure JJ-3 presents these results as a function of the peak angle' of oscillation or attack (a ) during reentry.
This curve will be used in the next section to determine the amount of heat available as a function of a and trajectory.
REENTRY TRAJECTORIES
Histories of various trajectory parameters are shown in Figs. JJ-4 through JJ-6 for three typical reentry trajectories. Orbital velocity (25, 690 fps) was used initially at 400, 000 feet, with initial flight path angles of - 0 . 1 , -2 and -8 degrees, respectively. These are constant ballistic coefficient (W/C - A = 25 Ib/sq ft) trajectories. The total cold
wall stagnation heat (q ) for each trajectory was: s
cohinnEhiTi^ii. MND-2050-F-2
393
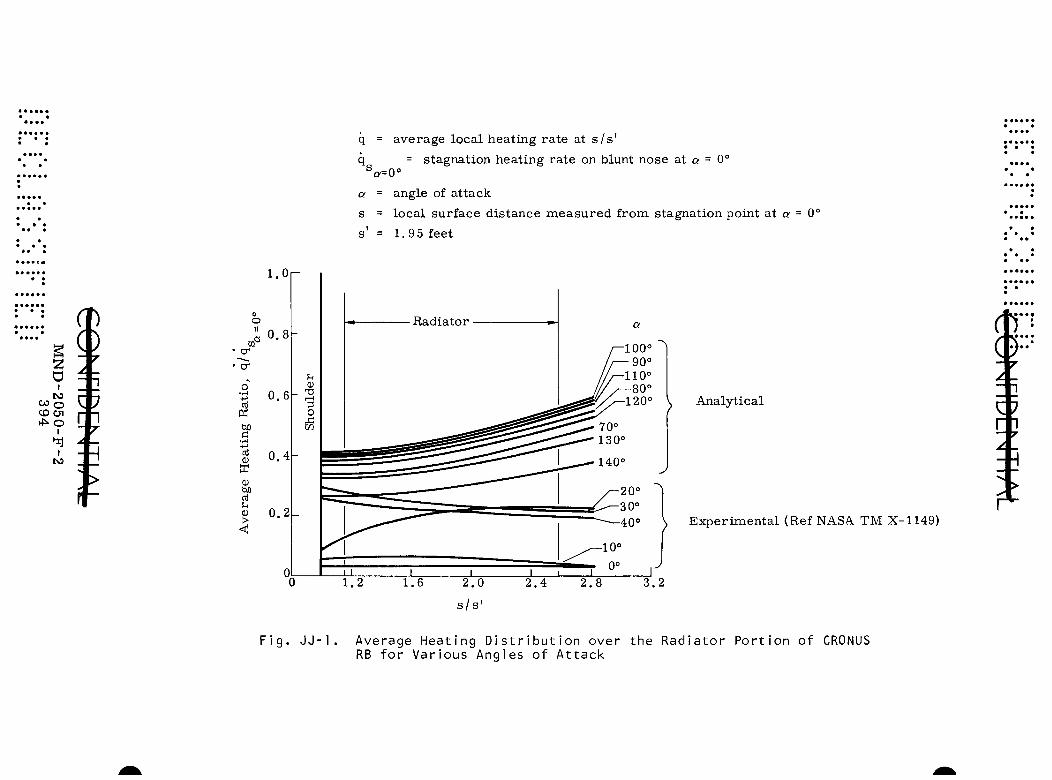
q = average local heating rate at s / s ' q = stagnation heating rate on blunt nose at o = 0°
^0=0° a = angle of attack s = local surface distance measured from stagnation point at a = 0° s' = 1.95 feet
1.0
o II
n!
a +-> n! (U
0)
>
Analytical
\ Experimental (Ref NASA TM X-1149)
F i g . J J - 1 . Average Heat ing D i s t r i b u t i o n over the Radia tor Po r t i on o f CRONUS RB f o r Var ious Angles o f A t t ack

i.or
o II 0.8-
"a*
tuo c
tlO nJ U (U
>
0.6
13 0.4^
0.2-
q = average local heating ra te over complete rad ia tor
q = stagnation heat ing ra te on blunt nose at o = 0° S _r\n
20 40 60 80 100
Angle of Attack, a (deg) 120 140
Fig. JJ-2. Average Heating Distribution over the Complete Radiator of CRONUS RB at Constant Angles of Attack
cor iriDE iTii . MND-2050-F-2.
395 :

iiCONriDCNTIAL
i
tuo % 0 .8
•cr
•cr
tuo
a
0) tuO cU $ >
0 . 6 -
0.4
0.2
q = ave rage local heat ing over complete rad ia tor at a ^
q = stagnation heat ing r a t e on blunt nose at o = 0° ^a = 0°
a = angle of a t tack
20 40 60 80 100 120 P e a k Angle of Osci l la t ion o r Attack, Op (deg)
140
Fig. JJ-3. Average Heating Distribution over the Complete Radiator of CRONUS RB as a Function of Peak Angle of Attack or Oscillation
i
!
CO^ jriDQ JThM. MND-2050-F-2
396
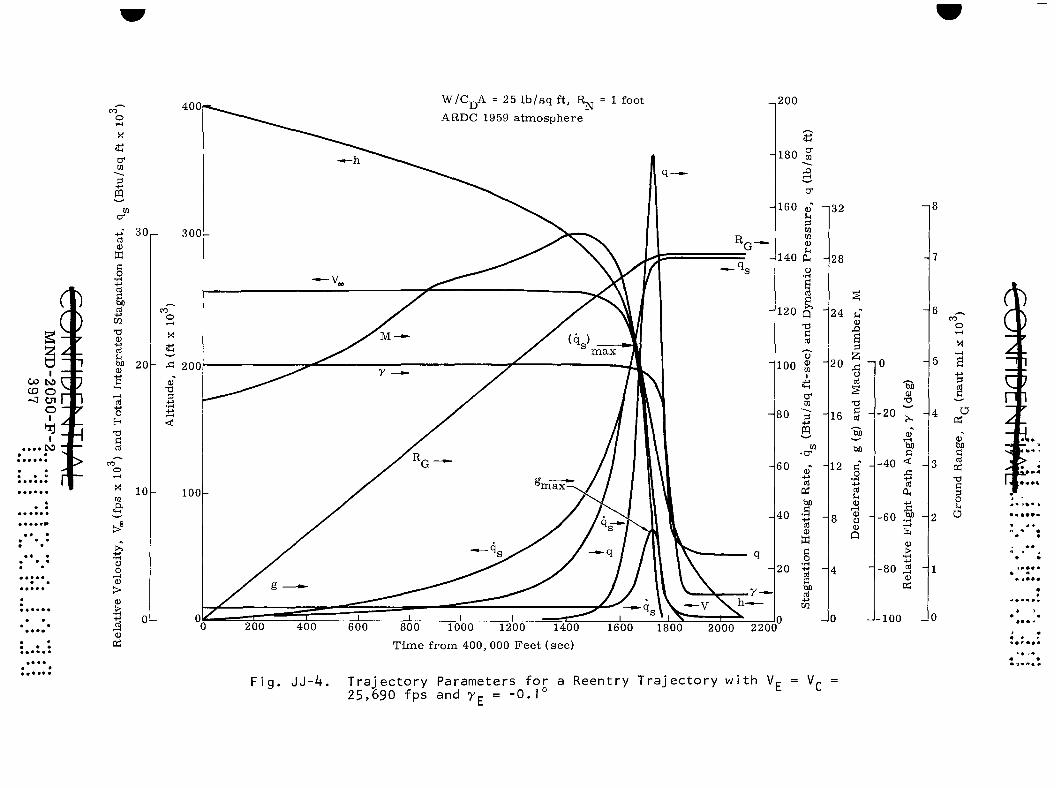
400 W/CjjA = 25 I b / s q ft, R^ = 1 foot
ARDC 1959 a tmosphere
(
D -00 ^ r CD O P
o -
1
)
) r
-\
7 1 7
H . . . . l \3 - f -;....: J y%
:..:.: rt~ !!!.!. • • •
• *• • • • • • • •
• • • • •
• • • ••• • •
• • • • • •• • •
Cf m S +-» PQ
CO
a-
oi 0) K fl o
+ j
g) w T3 0) -M ni
QJ
I—1
t i H T3
d
CO
o i H
X m
^ >> •tj o o
.—1 I)
>
t ;
a
30
20
10
0
o
- ^
+; <fl
_
-
300
200
100-
600 800 1000 1200 1400 T ime from 400, 000 Fee t (sec)
200
180 m
cr
160 cu" 0 to CD
140 £ o
ni
1 2 0 ^
a
100 i
-132
- 2 8
80
60
40
20
cr en
+*
CD
ni 0) ffl C o d 60 d
1600 1800 2000 2200 0
24 ; : Si
20 I?
o d
X)
16 S
12 d o d U <u
1—1 (U o CD
Q
F i g . J J - 4 . T r a j e c t o r y Parameters f o r a Reentry T r a j e c t o r y w i t h Vn = Vp = 25,690 fps and y^ = - 0 . 1 °
-20
-80
- 6
bo XI
bo a
-40 < d 0, S
-60 .S) -1—4
fa (1)
l>
11)
100
o »-(
•H
s
I o <u
bjo fl d oj •o
g u O
C)
r 1
• ««*
•» •* •*

86£
2->
a:-o
so2-
aNiA
[ .
. .
•* .
..
. ..
• ..
. •
• .
. •
...
to I
<
-H
m
-I
01
II >—
ft)
<
n O
r+
o
II
-i
•<
VJ1
-
a -
Qj
VD
CU
0
3 (D
-h
rt
•D C
D
in
-i
Irt
01
3 -h
D
-O
-I
-
m
Q)
II 3
3 (D
I
(D
K>
3 O
ri-
-i
~< -\
0)
I—
.
fD n rt
O -\
WII
ND
QU
NO
D
Rel
ativ
e V
eloc
ity,
V
(f
ps
x 10
)
and
Mac
h N
um
ber
, M
Alt
itu
de,
h
(ft
X 1
0'^)
Sta
gnat
ion
Hea
tin
g R
ate,
q
(Btu
/sq
ft-s
ec)
and
Dy
nam
ic
Pre
ssu
re,
q (I
b/s
q ft
) I
I I
I I
I I
I 1
d tC
t^
O
i C
O
^ t-
^ h
-H
-O
l>
o h
^ 0
1
Dec
eler
atio
n,
g (g
) an
d T
ota
l In
teg
rate
d S
tagn
atio
n H
eat,
q
(Btu
/sq
ft x
10
)
I I
I I
I I
Rel
ativ
e F
ligh
t P
ath
Ang
le,
y (d
eg)
O
D
Gro
und
Ran
ge,
R„
(n
aut
mi
x 10
)

t *
» A
0^
HI
(D
O <
O
66£
Z-d
-OS
OZ
-QN
IM
Rel
ativ
e V
elo
city
, V
(f
ps
x lO
")
oo
"T"
Alt
itu
de,
h
(ft
x 10
'^)
K>
-l
VJ1
-1
.. Q
) o\
<—
VD
fD
on
rt
-hO
13
-i
in
^
tu
-0
3 0)
C
L-t
O
J >e
3
•n
CD
ri
ll m
T
1
(/)
CO
o
-h
O
01
73
(D
(T)
3
H
^ n> !?
o R
o
o
o
o *^
n>
(t
—'
M
O (-*
o
NT
O
O
t\3
O
To
tal
Inte
gra
ted
Sta
gn
atio
n H
eat,
q
(Btu
/sq
ft x
10
)
o
o
o
o
o
OI o
o
o
o
stag
nat
ion
Hea
ting
R
ate,
q
(Btu
/sq
ft-s
ec)
and
Dy
nam
ic
Pre
ssu
re,
q (I
b/s
q ft
) I
I I
I I
I I
I I
Oi
fc
CO
H
'l
-'
[S
St
Ot
OC
O
to
O^
O
4^
CO
C
O
Dec
eler
atio
n,
g (g
) an
d M
ach
Nu
mb
er,
M
o
Rel
ativ
e F
ligh
t P
ath
An
gle
, Y
(d
eg)
Gro
und
Ran
ge,
R-,
(nau
t m
i x
10
)

3.6 E •0.1° qg = 28,100 Y5 = 10, 680 Btu/sq ft •N
7 ^ = -2.0«
E -8°
q = 5860 Btu /sq ft s
q = 3310 Btu /sq ft
Based on ) W/Cj^A= 22 lb/ft
Rj^ = 6 ft
J
These th ree quanti t ies a r e now used in conjunction with the curve in PLg. J J - 3 to genera te the th ree curves in Pig. J J - 7 . The la t t e r figure presen ts the total heat available to the complete rad ia to r as a function of peak angle of osci l lat ion for each of these th ree t r a j e c t o r i e s . This figure will be used to de te rmine if the heating factors used in the heat t r ans fe r analys is were r easonab le .
The heat ing dis tr ibut ion for the rad ia to r in the heat t r ans fe r analysis (Appendix C) was averaged over the t r a jec to ry heating t ime for each node. Figure J J - 8 p re sen t s the r e su l t s of this calculation. These curves were then in tegrated to de te rmine the average heating factors used in the heat t r ans fe r analysis of the r ad ia to r for the three t r a j e c t o r i e s . The factors were :
r^=-0.1°, (q/q^^^ Javg=0.2
V ^a= 0°/
\ ^a= 0°)
53
y = -2° ' E
y =
avg= 0.234
avg= 0.217
Multiplying the factors by the total cold wall s tagnation heat (calculated previously), the total heat seen by the rad ia to r (q ,) during the t r a j e c to r i es of the RTG/ RB was : ^
y^ = -0 .1° , q ^ = 10, 680 X 0.2 53 = 2700 Btu /sq ft
>E = -2 '
' E
^ r a d " ^^"^^ Btu/sq ft
q ^ = 718 Btu /sq ft
Using these quantit ies and Fig. J J - 7 , the peak angles of osci l lat ion were :
a = 87° for y = -0 .1° p E
COMriDEMTliM •MND-2050-F-2 ; 400
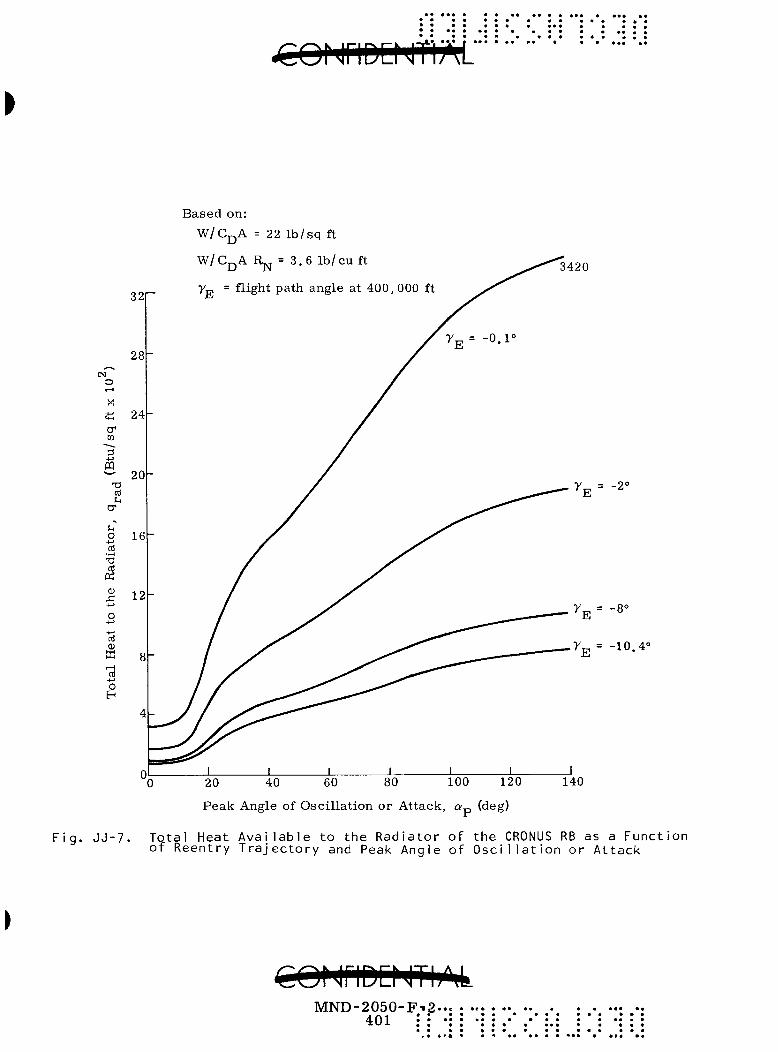
Based on:
W/Cj-jA = 22 Ib / sq ft
W / C „ A R „ = 3.6 lb /
Peak Angle of Oscillation or Attack, a— (deg)
Total Heat Available to the Radiator of the CRONUS RB as a Function of Reentry Trajectory and Peak Angle of Oscillation or Attack
€0NriD:NT|j^4 MND-2050-F-.2
401 • ^ • • e • • » • • • • • » • * • • • •
• • • • • • • « • • • • • • • » • • • « « • • • • • * •

= average heating ratio around radiator at s / s ' avg
q = local heating rate
q = stagnation heating rate on a = 0° blunt nose at a = 0°
a = angle of attack
s = local surface distance measured from stagnation point at a = 0°
s' = 1.95 feet
^E = flight path angle at 400, 000 ft
o.sor
0.25
too > rt
o II
.Si
C .iH
a
(P
tuo rt u
0.20-
0.15.
0.10-
0 .05-
0.4
-0.1°
- 2 . 0 °
- 8 . 0 °
- Radiator
0.8 1.2 1.6 2 .0 2 .4 2 .8
s / s '
F i g . J J - Average Heating Distribution over the Radiator for Three Reentry Trajectories used in Heat Transfer Analysis
CQNriDENTIAL MND-2050-F-2 • 402
/
a = 79° for y„ = -2° p hi
a = 72° for y„ = -8° p Hi
The results state that for the heating distribution used in the heat t ransfer analysis of the radiator, the RTG/ RB can have these average angles of oscillation without damaging the integrity of the radiator.
Using the information in Appendix MM in conjunction with the results from the heat transfer analysis presented in Fig. J J -7 , the radiator will not be damaged under all normal reentry trajectories, orbital decay and abort. The word normal is used here without respect to the angular rates that the RTG/RB could experience during the ascent trajectory and operation in space. For these reentry conditions, we have a safety factor of nine for decaying orbits, and a safety factor of about 14 for normal (-2°) entry angles insofar as the radiator heat absorption is concerned.
It can be concluded, from the results in this appendix. Appendix MM and Appendix C (heat transfer analysis), that the RTG/RB' s radiator will not be damaged for all normal and most abnormal reentry conditions.
REFERENCES
J J - 1 . Pr ice, E. A. J r . , Stallings, R. L. J r . , and Howard, P. W., "Pressure and Heat Transfer Distribution of 0.1-Scale CJemini Exit and Re-entry Models at Mach Numbers of 3. 51 and 4. 44, " NASA TM X-1140, September 1965, CONFIDENTIAL.
J J - 2 . Hagis, W., ' S N A P Programs - Upper Atmosphere Experimental Re-entry Study Final Summary Report, " MND-P-2953, Martin Company, April 1963.
MND-2050-F-2 403

• • ••
•
• •
• •
• • •
•
• •
•
• •
•
o
I Is
I to
S

APPENDIX KK
SEPARATION AND DEORBIT STABILIZATION
The reference RB must be capable of separation from its booster or space vehicle car r ie r and deorbit under controlled conditions. To achieve this capability most simply and reliably, spin stabilization to an attitude reference provided by the car r ie r is utilized. The CIR-RTG/RB is propelled down a track by the separation rocket and simultaneously spun up to 30 rpm by the spin rockets. At this point (~0. 24 second) separation is achieved but the spin rockets continue to burn to about 0. 5 second to bring the spin velocity up to 60 rpm or higher for stabilization of the deorbit thrust vector. Deorbit thrust may be applied at this point or within a reasonable number of orbits thereafter in accordance with a time program established by ground command. To establish specifications for the various components required in this sequence of events, the problem is separated into three phases:
(1) Specification of spin velocity required to stabilize the deorbit thrust vector
(2) Specification of separation parameters (tip-off rates and linear velocity required to assure vehicle separation)
(3) Mechanical specification of track device required to provide constraints during initial spin.
The first two of these problems have been solved utilizing the six-degree-of-freedom stability program (Appendix CC) to define the t rajectories resulting from thrust misalignments and asymmetry. The third problem is primarily mechanical and is pertinent to the motion only in its contribution to tip-off ra tes .
Constraints imposed on the configuration by spin stabilization are far reaching. Careful balance of the moments of inertia is necessary and, in particular, the roll moment of inertia should be maximum consistent with the aerodynamic requirements. This is achieved in part by peripheral location of the thrustors . In addition, the most effective minimization of the thrust misalignment effects will be at the largest possible spin rates (maximum number of revolutions during the thrust application). The full six-degree-of-freedom equations of motion are developed in Appendix CC. However, a glance at the simplified form of the moment equations may aid in understanding the motion to be expected.
L = I p - I rq + I qr xx^ yy zz
COMriDEMTliM MND-2050-F-2
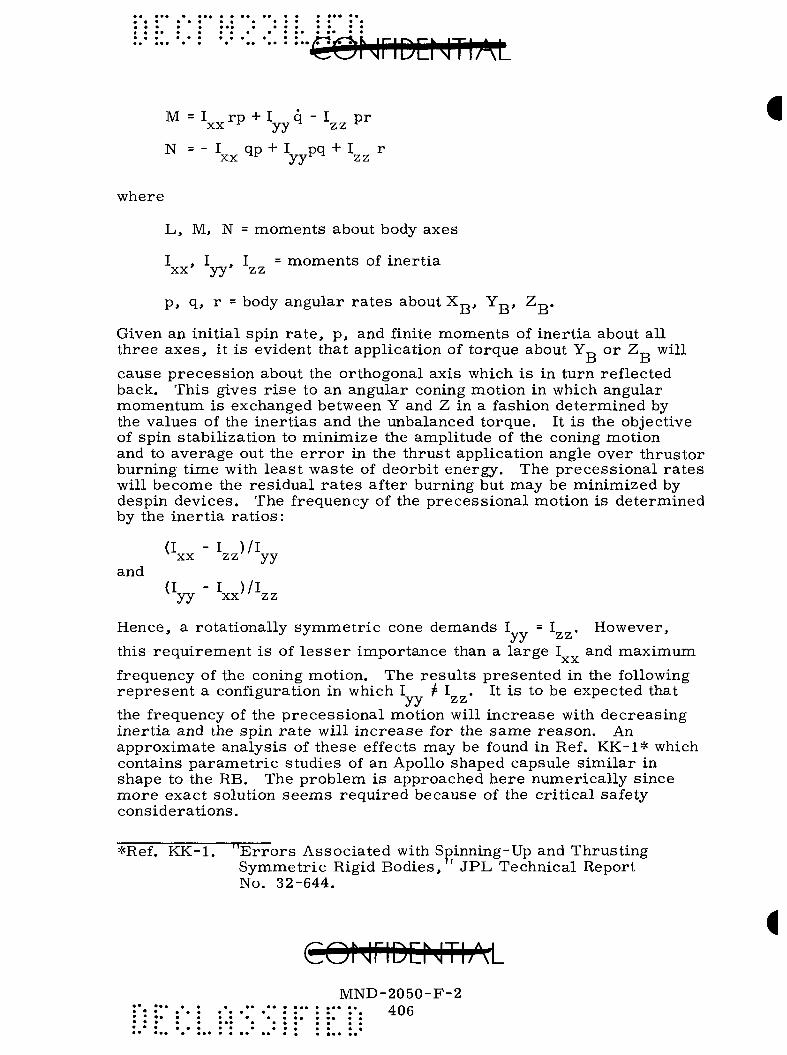
M = I rp + I q - I pr XX * y y z z ^
N = - I qp + I pq + I r XX ^ yy zz
where
L, M, N = moments about body axes
1 , 1 , 1 = moments of inertia XX yy' zz
p, q, r = body angular rates about X„ , Y„ , Z_ .
Given an initial spin rate , p , and finite moments of inertia about all three axes, it is evident that application of torque about YT, or Z,^ will
ID ID
cause precession about the orthogonal axis which is in turn reflected back. This gives r ise to an angular coning motion in which angular momentum is exchanged between Y and Z in a fashion determined by the values of the inertias and the unbalanced torque. It is the objective of spin stabilization to minimize the amplitude of the coning motion and to average out the e r ror in the thrust application angle over thrustor burning time with least waste of deorbit energy. The precessional rates will become the residual rates after burning but may be minimized by despin devices. The frequency of the precessional motion is determined by the inertia ratios:
(I - I )/l XX zz yy
and (I - I )/l yy XX zz
Hence, a rotationally symmetric cone demands I = I , However, this requirement is of lesser importance than a large I and maximum
frequency of the coning motion. The results presented in the following represent a configuration in which I ^ I . It is to be expected that the frequency of the precessional motion will increase with decreasing inertia and the spin rate will increase for the same reason. An approximate analysis of these effects may be found in Ref. KK-1* which contains parametric studies of an Apollo shaped capsule similar in shape to the RB. The problem is approached here numerically since more exact solution seems required because of the critical safety considerations.
*Ref. KK-1. "Errors Associated with Spinning-Up and Thrusting Symmetric Rigid Bodies, ' JPL Technical Report No. 32-644.
• ••• • • • •• •• • ••• • *•• * * • • • • • • • • • « • • • • • • • • • • • • • • • • * • • • ••• • • • • • • * • • • • • • • • • » • • * • • • • • • • • • • • • • • • • * • •
CONriDCNThM MND-2050-F-2
406
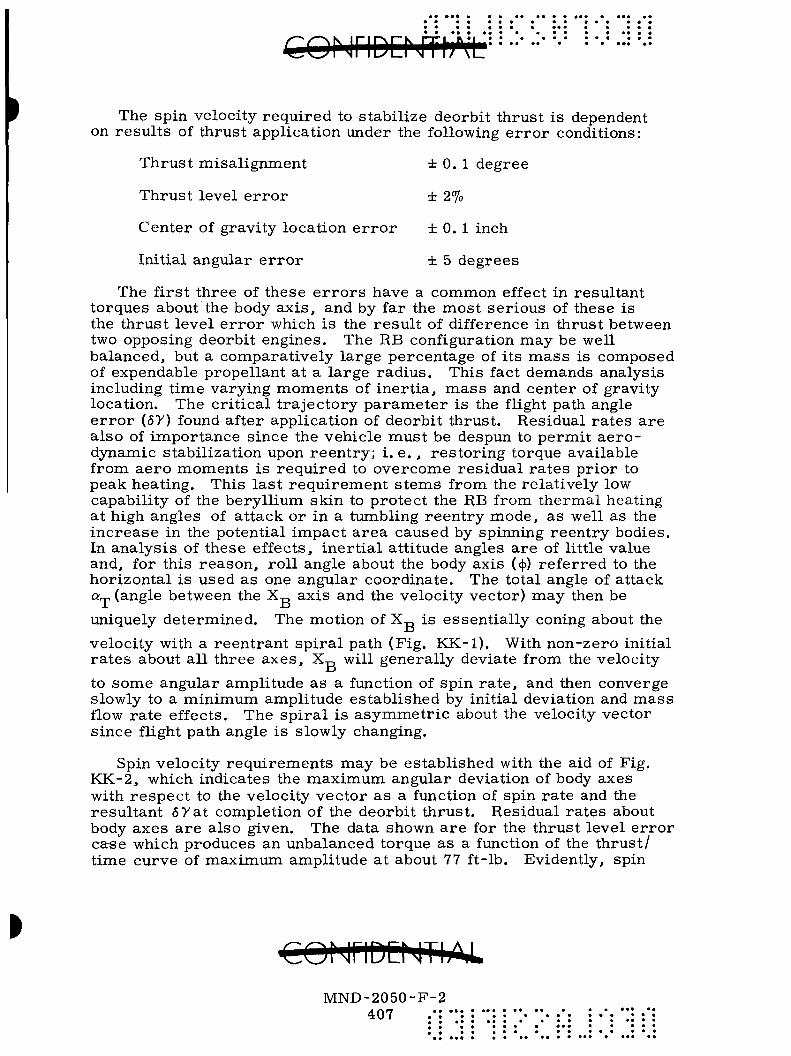
The spin velocity required to stabilize deorbit thrust is dependent on results of thrust application under the following er ror conditions:
Thrust misalignment ± 0. 1 degree
Thrust level e r ror ± 2%
Center of gravity location e r ro r ± 0. 1 inch
Initial angular e r ro r ± 5 degrees
The first three of these e r ro r s have a common effect in resultant torques about the body axis, and by far the most serious of these is the thrust level e r ror which is the result of difference in thrust between two opposing deorbit engines. The RB configuration may be well balanced, but a comparatively large percentage of its mass is composed of expendable propellant at a large radius. This fact demands analysis including time varying moments of inertia, mass and center of gravity location. The critical trajectory parameter is the flight path angle e r ror (57) found after application of deorbit thrust. Residual rates are also of importance since the vehicle must be despun to permit aerodynamic stabilization upon reentry; i. e. , restoring torque available from aero moments is required to overcome residual rates prior to peak heating. This last requirement stems from the relatively low capability of the beryllium skin to protect the RB from thermal heating at high angles of attack or in a tumbling reentry mode, as well as the increase in the potential impact area caused by spinning reentry bodies. In analysis of these effects, inertial attitude angles are of little value and, for this reason, roll angle about the body axis {^) referred to the horizontal is used as one angular coordinate. The total angle of attack Q-rp (angle between the X.^ axis and the velocity vector) may then be uniquely determined. The motion of X„ is essentially coning about the velocity with a reentrant spiral path (Fig. KK-1). With non-zero initial rates about all three axes, X^. will generally deviate from the velocity
to some angular amplitude as a function of spin rate , and then converge slowly to a minimum amplitude established by initial deviation and mass flow rate effects. The spiral is asymmetric about the velocity vector since flight path angle is slowly changing.
Spin velocity requirements may be established with the aid of Fig. KK-2, which indicates the maximum angular deviation of body axes with respect to the velocity vector as a function of spin rate and the resultant 6yat completion of the deorbit thrust. Residual rates about body axes are also given. The data shown are for the thrust level error cetse which produces an unbalanced torque as a function of the thrust/ time curve of maximum amplitude at about 77 ft-lb. Evidently, spin
MND-2050-F-2 407

• • • • • • •• « • • ••• • « > •• •
180
•^ONriDENTIAL
0 t 4'<deg) » A ' 10.0
270
Fig. KK-1 . Spin Stab i 1 i ty--e.^ = ±1% , <i> = 12.56 rad/sec
i
* • • • • • • • • • • a • • • • • • • • • • • • • • • • • • • • • • • • • • • • • • • • • • • • • • • • • • • , • • • • • * • • • • • • • • • • • •
* • • • • • • • • • • • • • • • • • • •
MND-2050-F-2 408

0,- 4 0 , -
- 30
bo
h ^ 2 0 n!
10
OL 0
T 6y
spin rate total angle of attack
flight path angle deviation at burnout
Scj = maximum amplitude of cross axis rate
_L 10 20
P(rad/sec)
30
Fig. KK-2. Spin Stabilization Parameters
COf JriDD JTLi\U MND-2050-F.T2.
409
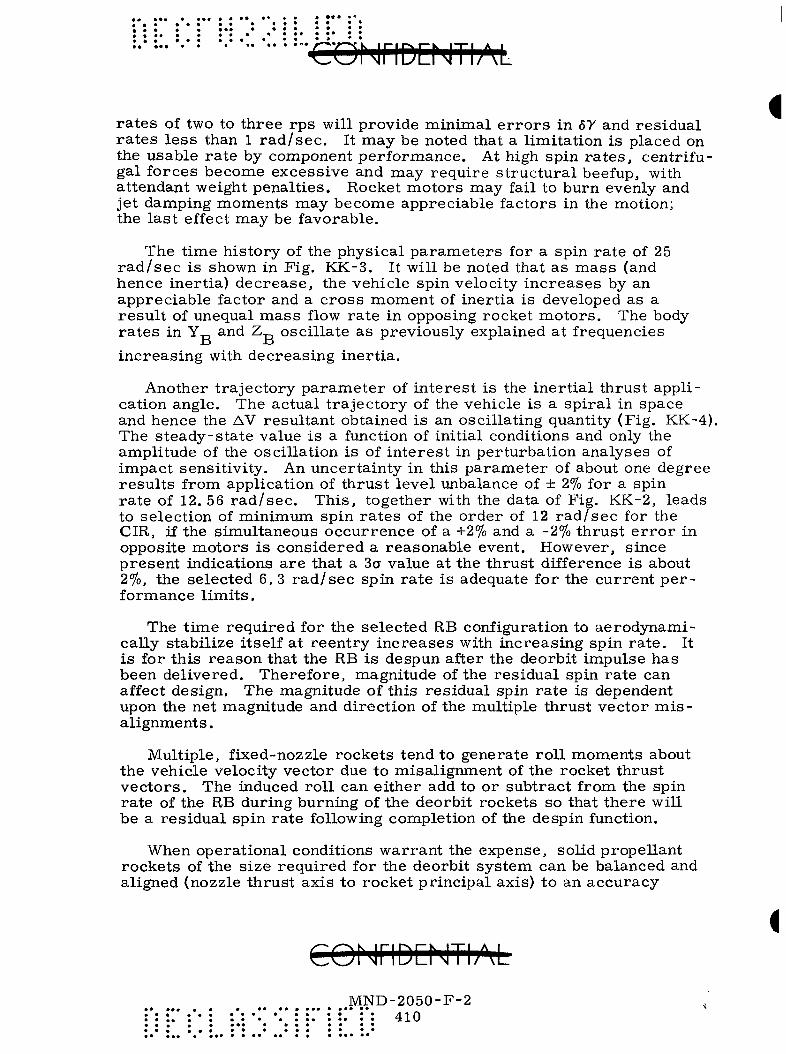
rates of two to three rps will provide minimal e r ro r s in 67 and residual ra tes less than 1 rad /sec . It may be noted that a limitation is placed on the usable rate by component performance. At high spin ra tes , centrifugal forces become excessive and may require structural beefup, with attendant weight penalties. Rocket motors m.ay fail to burn evenly and jet damping moments may become appreciable factors in the motion; the last effect m.ay be favorable.
The time history of the physical parameters for a spin rate of 25 rad / sec is shown in Fig. KK-3. It will be noted that as mass (and hence inertia) decrease, the vehicle spin velocity increases by an appreciable factor and a cross naoment of inertia is developed as a result of unequal mass flow rate in opposing rocket motors. The body rates in ¥ „ and Z oscillate as previously explained at frequencies
increasing with decreasing inertia.
Another trajectory parameter of interest is the inertial thrust application angle. The actual trajectory of the vehicle is a spiral in space and hence the AV resultant obtained is an oscillating quantity (Fig. KK-4). The steady-state value is a function of initial conditions and only the amplitude of the oscillation is of interest in perturbation analyses of impact sensitivity. An uncertainty in this parameter of about one degree results from application of thrust level unbalance of ± 2% for a spin rate of 12. 56 rad/sec . This, together with the data of Fig. KK-2, leads to selection of minimum spin rates of the order of 12 rad /sec for the CIR, if the simultaneous occurrence of a +2% and a -2% thrust e r ro r in opposite motors is considered a reasonable event. However, since present indications are that a 3CT value at the thrust difference is about 2%, the selected 6. 3 rad /sec spin rate is adequate for the current per formance l imits.
The time required for the selected RB configuration to aerodynami-cally stabilize itself at reentry increases with increasing spin rate . It is for this reason that the RB is despun after the deorbit impulse has been delivered. Therefore, magnitude of the residual spin rate can affect design. The magnitude of this residual spin rate is dependent upon the net magnitude and direction of the multiple thrust vector m.is-alignments.
Multiple, fixed-nozzle rockets tend to generate roll moments about the vehicle velocity vector due to misalignment of the rocket thrust vectors . The induced roll can either add to or subtract from the spin rate of the RB during burning of the deorbit rockets so that there will be a residual spin rate following completion of the despin function.
When operational conditions warrant the expense, solid propellant rockets of the size required for the deorbit system can be balanced and aligned (nozzle thrust axis to rocket principal axis) to an accuracy
CONriDENTIAL MND-2050-F-2
': 410 •• •• • ••• • •••
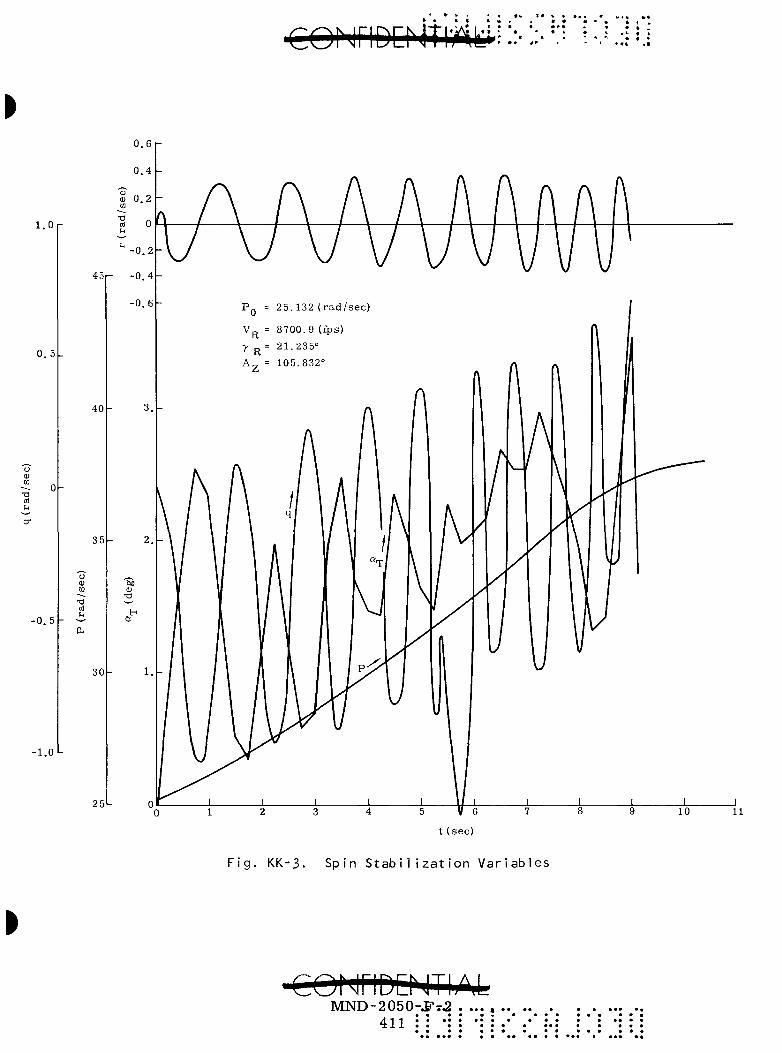
^ * t t 4 *
CQMriDCHTrAfci:' ::•::
0 .6
0 . 4
<u 0 . 2
i 0 - 0 . 2
- 0 . 4
- 0 . 6 25. 132 (rad/sec)
V^ = 8700.9 (fps) 21.235° 105.832
t (sec)
Fig. KK-3. Spin Stabilization Variables
MND-2050-^T.2 411
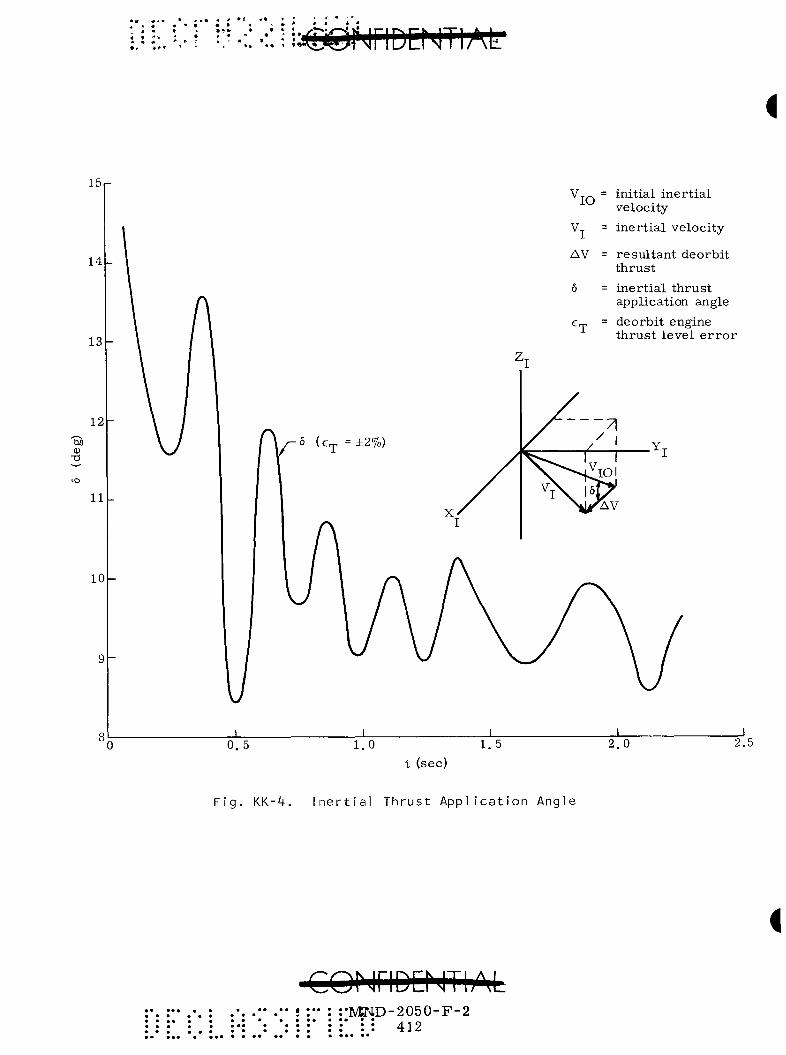
• 9 * * • «
«ft •• t
t a i *
•jZi& riDD TI/\L
15,-V
14
13
12
11
10
lO
AV
initial inertial velocity inertial velocity
resultant deorbit thrust inertial thrust application angle
deorbit engine thrust level e r ror
_L _L 0.5 1.0 1.5
t (sec) 2.0 2.5
Fig. KK-^. Inertial Thrust Application Angle
NriDCNTIAL •Mf4D-2050-F-2 ' : : 412

•• ••• • • • • • • •
c»sp jrfDCr'iTf.AiL- •:
of 0. 003 radian or be t te r . The thi rd s tage of Vanguard was so balanced. Data on eight Scout vehicle flights (Ref. KK-1) show third stage m i s al ignments on the average of about 0. 001 radian (0. 06°) with only one of the no rma l flight r e c o r d s exceeding 0. 002 radian (0. 10°). These Scout misa l ignments include the rocket itself, installation inaccurac ies , vehicle center of m a s s va r i a t ions , vehicle bending, etc . Recent data on the Surveyor indicate ins ta l led misal ignment of the Surveyor descent decelera t ion solid motor as 0. 0002 radian (0. 015°) before firing and 0. 0006 rad ian (0. 045°) after f ir ing. P r e l i m i n a r y analys is of t e lemete red data on Surveyor I tends to substant ia te these smal l misa l ignments . In the face of this evidence, an effective misalignmient of any one deorbit rocket i s a s sumed to be l e s s than 0. 10 degrees (3a). On this bas i s , the max imum res idua l ro l l r a t e generated by the total effect of all four deorbit rocket misa l ignments should be l e s s than
AW = ff^Re^ (At)
'M Roll
3280 lb X 2 ft X 0. 1 deg x 10 sec x 60 sec .
35 slugs ft X 57. 3 deg / r ad x 2 Trmin rpm
where:
AW = res idua l spin r a t e
Frp = total deorbit rocke t thrus t
R = moment a r m (roll)
6^ = misa l ignment e r r o r (all e r r o r s produce a ro l l ra te in the same direct ion for this example)
At
I M
deorbi t rocket burning t ime
average ro l l moment of iner t i a of RB during deorbit rocket burn per iod
The probabil i ty that al l four rocke ts will be at their 3 a value and aligned additively in e i ther the posit ive or negative ro l l direct ion is ex t remely r emo te . Design conditions should account for l ess than 10 r p m res idua l ro l l r a t e .
MND-2050-F-2 '.' *•• : •4:13•• •- .

• •• * • •••C6Hjnb[!NTI;M
BLANK
i COMriDEMTIAL
MND-2050-F-2
• • • • • • • • • • • • • • • • • • • • • •
• • • • • • • • ••• • • • •
t APPENDIX LL
VELOCITY IMPULSE REQUIREMENTS
To arrive at a selection of velocity impulse (AV) for the RTG/RB, the three phases of flight (ascent, transfer orbit and orbit) must be investigated with the following objectives in mind. First, the range from deorbit to atmospheric entry and impact should be such that small e r ro r s in AV will not produce drastic changes in impact range. Secondly, the magnitude of AV should be sufficiently large for adequate impact range control in an ascent abort situation. Finally, the selected AV pulse must not be oversized because of design economics. A velocity impulse of 1500 fps was selected because it satisfies these considerations and because it can be suitably obtained by existing, proven rocket engines.
This velocity increment is conservative in that a lower velocity increment (e. g. , 1200 fps) would also satisfy the basic mission requirements. The optimum AV selection, which would balance the excess velocity increment against the added safety, smaller depressions and greater operational flexibilities, will be conducted in the subsequent phase of study. The reason for the final choice of 1500 fps is that the worst cases of entry conditions, misalignment, weight, etc. , will have been examined in the feasibility portions of the study.
The approach used to arr ive at this AV choice first investigates the deorbit or calldown case with the perigee-apogee conditions of the elliptical transfer orbit. Since these flight conditions represent the extreme energy levels encountered, it can be reasoned that, during the transfer itself, quite acceptable entry control will be available. Next, the ascent abort case is studied and the respective requirements compared.
DE-ORBIT AV REQUIREMENTS
After an overspeed injection at 100 nautical miles, the vehicle will coast to an altitude of 6 00 nautical miles where a circularization maneuver is performed. Once in this circular orbit an option exists to either leave the RB in orbit or retrieve the power unit. In the latter case, the design must concern itself with providing positive entry after the AV is applied. To ensure this absolute entry without oversizing the AV magnitude, consideration must be given to such items as skip-out conditions, AV application angle, AV magnitude, impact range sensitivity and severe entry conditions.
CONriDENTI;^ MND-2050-F-2
.•; ••: : 415 •*. **. .*. : « • • • • • • • • • • • •
A skipout boundary is defined as that combination of velocity (V), flight path angle ( y ) , lift-to-drag ratio (L/D) and ballistic coefficient (W/C-p)A) which just allows a vehicle to reenter the earth' s atmosphere and impact in a single pass. In Ref. LL-1* Chapman shows skipout boundaries for various entry velocities with L/D versus a perigee parameter F . This parameter is a function of entry altitude, ballistic
coefficient and entry path angle. These data have been interpreted for this design mission where it is anticipated that entry velocities will be between 24, 000 and 27, 000 fps, entry path angles will be between -2° and -12° and, ballistic coefficients wiU be on the order of 10 to 50 lb/ sq ft. The results are shown in Fig. LL-1 for an L/D of zero, which represents the aerodynamics of the selected ballistic shape. More specifically, for a 600 by 600 nautical mile orbit calldown, it is expected that the entry velocity will be between 26, 000 and 26, 500 fps. Figure LL-1 indicates that the minimum acceptable y must be greater than (negative sense) -0, 75° to - 1 . 3° if impact is to be certain within one pass. Although Fig. LL-1 is based on Chapman' s analytic analysis, the results are quite valid for preliminary design purposes.
The skipout boundary just naentioned is reflected in Fig. LL-2 which shows the 600 by 600 nautical mile deorbit requirements. It is immediately apparent that the minimum AV requirement is 1000 fps. However, the manner in which it is applied (i. e. , the application angle and AV magnitude) can produce serious impact dispersions. Figure LL-2 shows the impulse requirement and resulting impact range for two deorbit techniques, the first of which applies the AV at the optimtun application angle that minimizes the magnitude of the pulse. The second technique, of interest to the present design, applies the pulse opposite to the velocity direction. Ordy small differences exist between the two methods in the 1000 to 1500 fps AV regime. Included in the subject figure are sensitivity coefficients of range-to-impulse e r ro r and range-to-application angle e r ro r (8R/aAV, dR/d 6 ) . To arrive at a practical AV requirement, a preliminary goal in the restriction of dispersions must be assumed. Before setting the goal for this design, it should be mentioned first that downrange dispersions are normally an order of magnitude greater than crossrange dispersions. This fact allows consideration of one random variable (downrange error) , rather than two, as the criterion for establishing the dispersion restriction. To this end, it is highly desirable and very reasonable to request a down-range dispersion control of ±300 nautical miles with a 95% confidence of achieving this control. This confidence level is tantamount to a 2a dispersion for one random variable.
*Ref. LL-1 . Chapman, D, R. , "Analysis of the Corridor and Guidance Requirements for Supercircular Reentry into Planetary Atmospheres, " NASA TR-55, 1959
^C0N^ID:NTIA^!• MND-2050-F-2

COrflttntlAU
-4r
T3
a
L / D = 0
— Selected design (W/Cj^A = 22 I b / s q ft)
Skipout
Calldown from 600-naut m i orbit
E n t r y Velocity (fps x 10 )
F i g . L L - 1 . Skipout Boundaries
W/Cj^A
50 Ib / sq ft 30
10
28
CONriDENTIAL" MND-2050-F-2
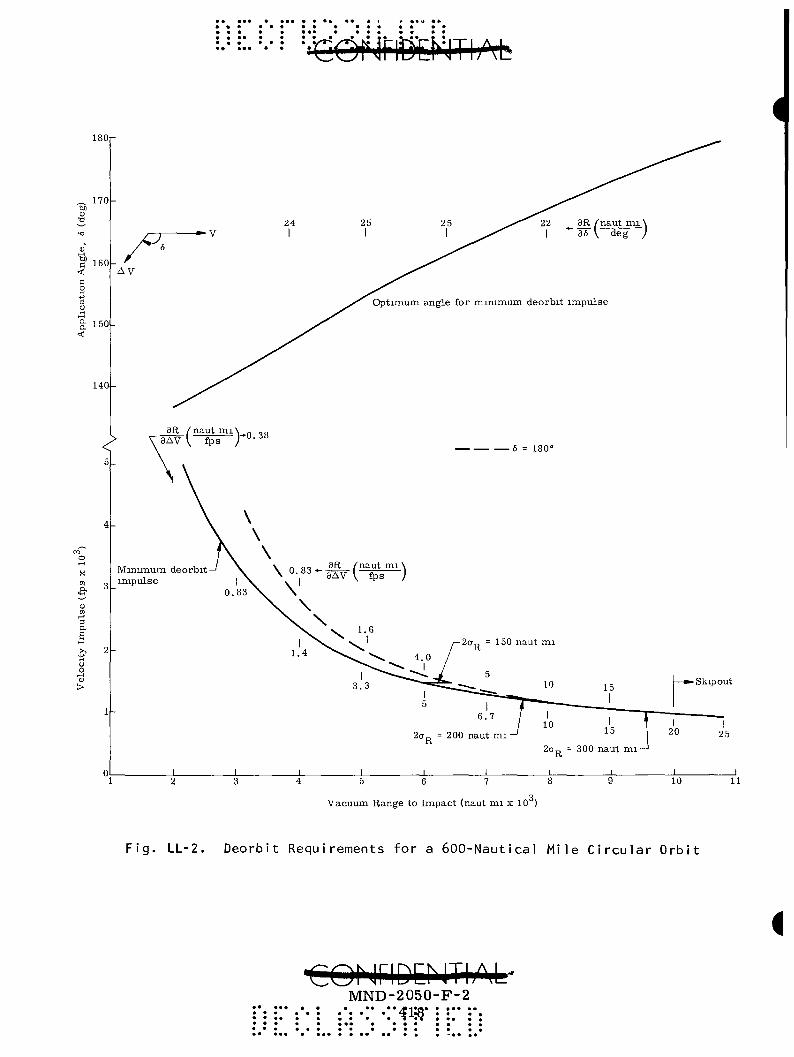
180r
170
150
140
24 I
25 I
25 I
22 8R /naut m i \ I ^ 85 , deg ;
A V
Optimum angle for minimum deorbit impulse
8R /nau t m i \ ^ > V aAV I, fps P^-38
>v 2
•6 = 180°
Minimum deorbit impulse
1 -
2CTp =200 naut m i -2CTO = 300 naut m i -
Skipout
Vacuum Range to Impact (naut mi x 10 )
10 11
Fig. LL-2. Deorbit Requirements for a 600-Nautical Mile Circular Orbit
CQMriDCMTliM-MND-2050-F-2

The effect of this dispersion goal on deorbit requirements depends on the expected system, and state vector uncertainties. For the com-templated design, it is estimated that the 2a variance in AV application will be 10 fps. The 2a variance in application angle, 6, is 3.4°. Additional e r ro r s will be realized because of the uncertainty in the vehicle state vector as deduced from tracking data and are computed to be 2 fps in velocity and 0. 6° in attitude. This can be summarized as:
2a*-y = 12 fps and 2a. = 4=
Although it is improbable that these maximum er ro rs will be experienced simultaneously, the following analysis assumes tne additive (conservative) approach rather than RMS approach. With the data given in Fig. LL-2, the dispersion restriction requirement can now be computed and is so indicated in the figure. A minimum AV of 1100 fps must be selected to realize the 95% confidence in limiting impact dispersions to ± 300 nautical miles.
TRANSFER ORBIT REQUIREMENTS
The minimum. AV of 1100 fps required for the calldown or normal deorbit situation must now be compared to the minimum transfer orbit requirement. Because of the speed and sensitivity of 6 upon impact points, the perigee of the transfer orbit becomes the crucial point of study. Figure LL-3 depicts the variation of range control with 5 for various AV's. Note the high sensitivity of impact range to e r rors in
3R thrust application angle (-QT) and how the AV = 1000 fps level is automatically eliminated except for 5 < 130°.
Figure LL-4 presents the same data except in a different fashion in order to show the sensitivity of range-to-thrust magnitude er rors (8R/9AV). Table LL-1 has been prepared to provide an insight to the minimum acceptable AV and uses the injection variances of 2a.-rT = 20 fps
and 2ag =4° again in an additive manner.
It is obvious that if a thrust application angle of 130° is used, the minimum requirement would be a little greater than 1000 fps. However, in considering some of the design problems associated at this point in flight (injection)--namely the mounting of the CIR-RTG/RB, catapult and spinup mechanisms--and the desire to maintain absolute simplicity, a pulse application angle of 180° would both simplify the design and remove launch vehicle roll induced e r r o r s . With this tactic, an abort impulse of approximately 1500 fps is necessary. The need to examine the apogee case can be eliminated since this particular flight point would require less than 1000 fps in light of the 600 by 600 nautical miles deorbit requirements.
CONriDCNTI;M> J^JifP.-3D&Q.-li.-2. .
: : .: : 418 .' .* : : : • • • • • • • • • • • • • • • • • • • • • • • *• ••• • • • •• •• • • • • «
• ••• •• • • • • • • •• * • • • • • • • • • • • ••• ••
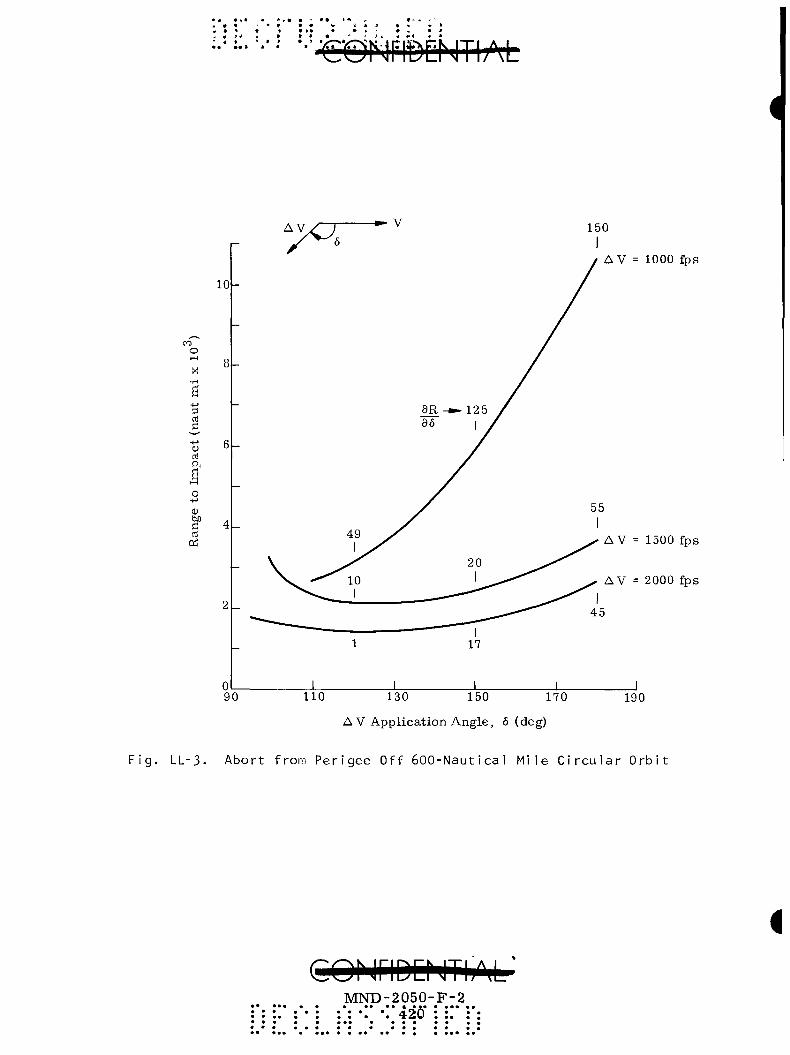
- V
10
CO
o
3
o
fl 4 a!
90
AV = 1500 fps
AV = 2000 fps
_L 110 130 150 170
A V Application Angle, 6 (deg)
190
Fig. LL-3. Abort from Perigee Off 600-Nautical Mile Circular Orbit
COrjriDCMThM MND-2050-F-2
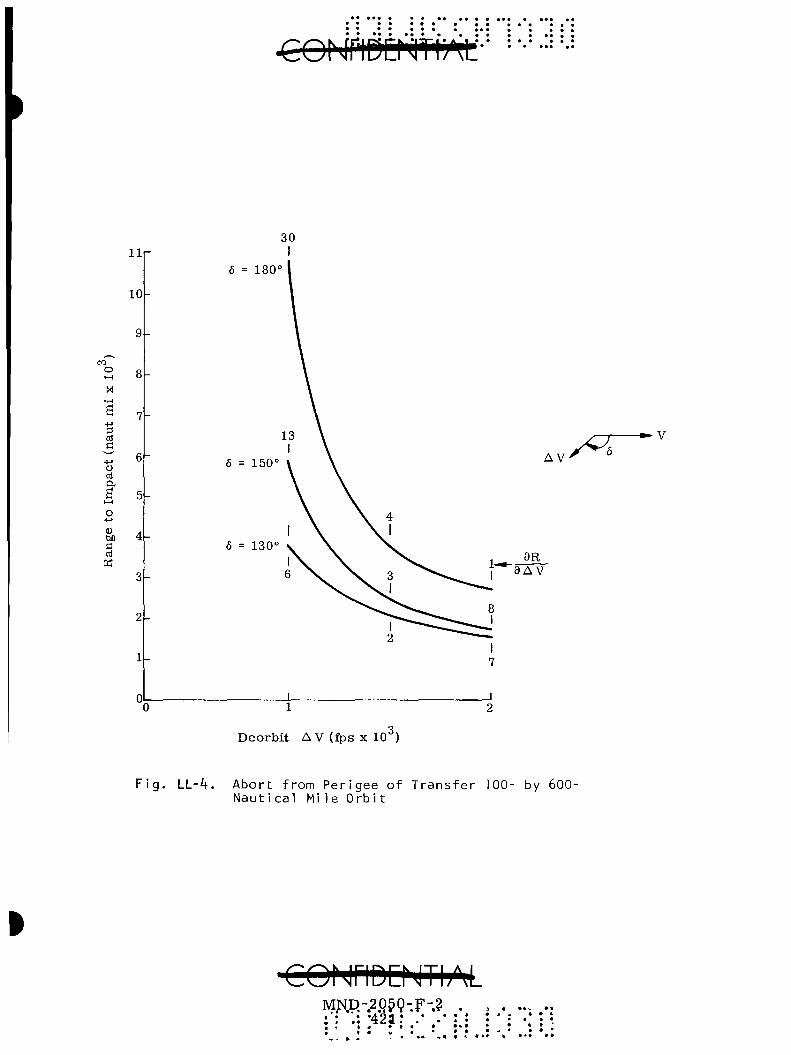
• • • • • •
•COr riDCNTDM"-
i l r
10
9 -
co o
o n! a B
D tUO
3|-
6 = 180°
5 = 150°
6 = 130°
V
Deorbi t AV (fps x 10 )
F i g . LL-4 . Abor t from Perigee o f T rans fer 100- by 600-Nau t i ca l M i l e O r b i t
CONriDENThM MNpr.2.Q5Q-F-? ,
•421.* .• .* • • * • fc
> i • •
» • • • •

e®Hjf1&[iHTI;M
Dispersions:
AV (fps)
1000
1500
2000
TABLE LL-1
Perigee Abort (100 by
6 (deg)
180
150
130
180
150
130
180
150
130
600 nautical m]
2^AR (naut mi)
1200
760
340
298
140
80
200
84
42
ASCENT ABORT REQUIREMENTS
Thus far it has been shown that an impulse level of 1500 fps would adequately allow a successful abort or deorbit from the injection point and any other point in subsequent flight. Furthermore, downrange impact dispersions can be limited to ±300 nautical miles to a high probability. However, the impulse derived thus far must be checked as to the overall range control requirements. This requirement actually stems from the ascent or boost phase of flight since the locus of instantaneous impact points will intersect land masses before injection. For example, an ETR launch will fly over the southern tip of Africa and a polar launch from WTR will fly over Antarctica. It is extremely desirable to have a design that is capable of limiting the impact point to location offshore from these land masses . The most stringent range control requirement will be realized for that launch vehicle whose boost trajectory exhibits the longest downrange-to-injection trait. For the launch vehicles considered, the Titan IIIC configuration has the longest range, approximately 2000 nautical miles from liftoff to injection (Fig. LL-5).
On examining the Eastern and Western Test Ranges it is noticed that the same downrange arc angle to the first land encounter exists for both ranges. This is depicted in Fig. LL-6 which shows the instantaneous impact points for a Titan IIIC launch. The figure also indicates that it is unnecessary to apply an abort pulse for ascent speeds less than 25, 000 fps. Therefore, the most critical phase of boost is
CQMriDEhlTliM MND-2050-F-2

COMdlJliMjUilj^ia
20r-
Iner t ia l Velocity (fps x 10 )
F i g . L L - 5 . A s c e n t Ground Range Compar ison
Titan IIIC
Ti tan IIIA
Ti tan IHB
CQfjriDQJTI;\L MJ^P"g§50.-F.-p
• > • •• •
• •• • «

Injection (100 by 600 naut mi) /
/
• Maximum es t imated d i spers ion
A V = 0 fps
AV = 1500 fps, 6 = 180°
Pacif ic WTR Ocean Atlantic ETR
"Ocean
Antarctica^
Madag a s c a r
Indian Ocean , Bay
Asia , Arc t i c , USA- -Pacific-
• J A f r i c a L Indian UAus t r a l i aU . Pacif ic-^ r Ocean ^ ~
USA, South America_
_L
%
rr
100 200 300
Iner t ia l Ascent A r c (deg)
400 500
Fig. LL-6. Instantaneous Impact Points for a Titan IIIC Launch
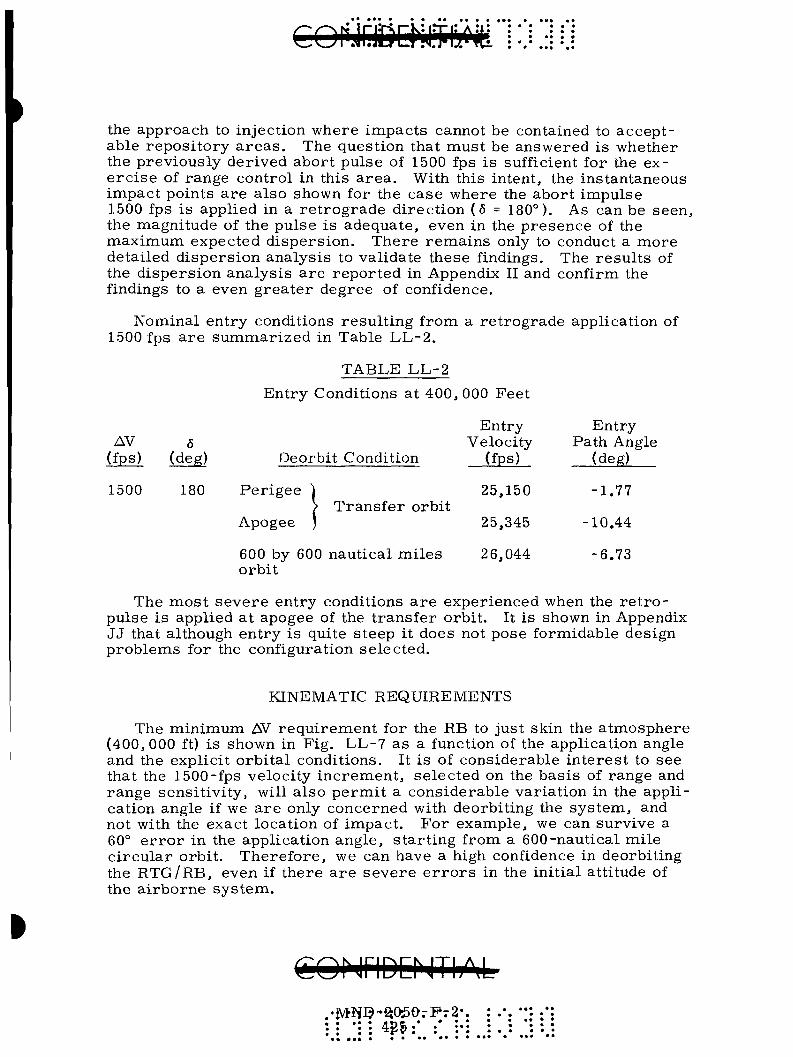
cortjaDcrjCiiil^ti
the approach to injection where impacts cannot be contained to accept able repos i to ry a r e a s . The question that mus t be answered is whether the previously der ived abor t pulse of 1500 fps i s sufficient for the exe r c i s e of range control in this a r e a . With this intent, the instantaneous impact points a r e a lso shown for the case where the abor t impulse 1500 fps is applied in a r e t r o g r a d e di rect ion (5 = 180°). As can be seen, the magnitude of the pulse is adequate, even in the presence of the maximum expected dispers ion. There r e m a i n s only to conduct a more detailed d ispers ion analysis to validate these findings. The r e su l t s of the d ispers ion analys is a r e repor ted in Appendix II and confirm the findings to a even g rea t e r degree of confidence.
Nominal entry conditions resu l t ing from a re t rograde application of 1500 fps a r e summar i zed in Table L L - 2 .
TABLE L L - 2
Ent ry Conditions at 400,000 Feet
Ent ry Ent ry AV 6 Velocity Path Angle
(fps) (deg) Deorbit Condition (fps) (deg)
1500 180 Pe r igee ) 25,150 -1.77 Trans fe r orbi t
25,345 -10.44
600 by 600 nautical mi le s 26,044 -6.73 orbi t
The mos t s e v e r e entry conditions a r e experienced when the r e t r o -pulse is applied a t apogee of the t r ans fe r orbi t . It is shown in Appendix J J that although ent ry is quite s teep it does not pose formidable design problems for the configuration se lected.
KINEMATIC REQUIREMENTS
The minimum AV requ i r emen t for the RB to just skin the a tmosphere (400,000 ft) is shown in Fig. LL-7 as a function of the application angle and the explicit o rb i ta l conditions. It is of considerable in te res t to see that the 1500-fps velocity inc rement , se lec ted on the bas i s of range and range sensi t ivi ty , will a lso pe rmi t a considerable var ia t ion in the application angle if we a r e only concerned with deorbiting the sys tem, and not with the exact location of impact . For example, we can survive a 60° e r r o r in the application angle , s t a r t ing from a 600-nautical mi le c i r cu la r orbi t . There fo re , we can have a high confidence in deorbiting the RTG/RB, even if there a r e s eve re e r r o r s in the init ial attitude of the a i rborne sys t em.
CQNriDENTIAL •MfiI?-^05OrP7 2-.
• * ••• «
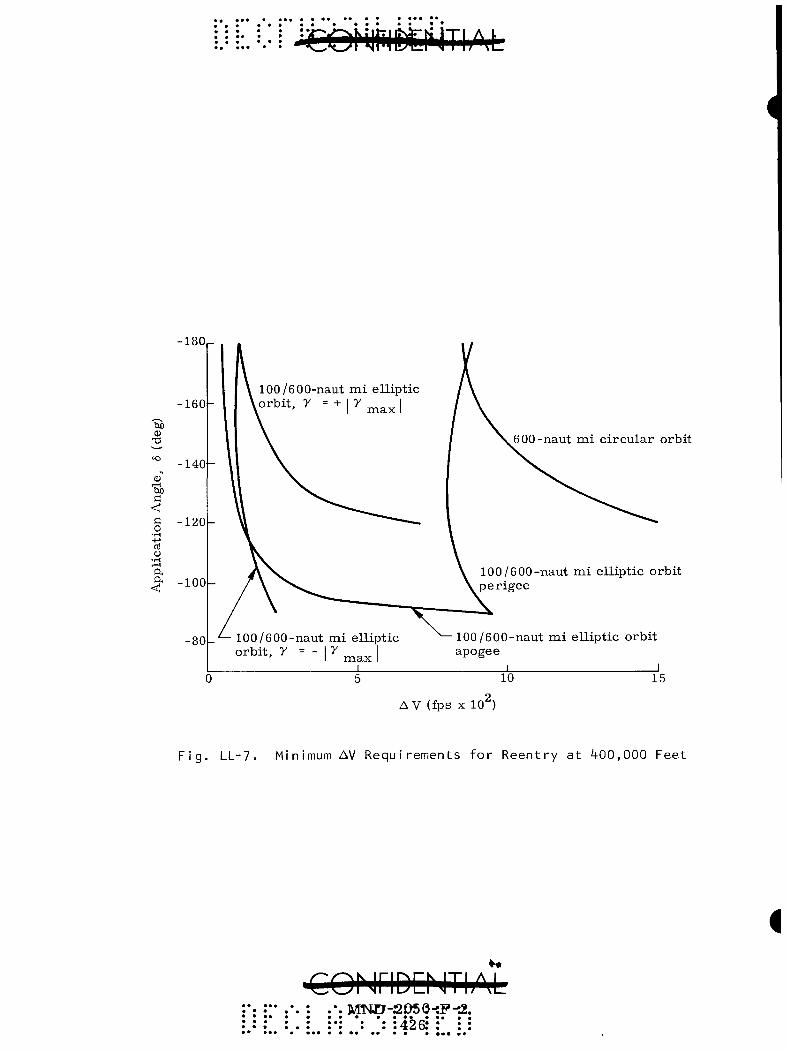
T3
bo
<
o
a
-180
•160
•140
- 1 2 0
^ - 1 0 0
-80 1 0 0 / 6 0 0 - n a u t m i e l l i p t i c o r b i t , r = - \y
I m a x I
600-naut m i c i r cu l a r orbit
100/600-naut m i el l ipt ic orbi t pe r igee
100/600-naut m i el l ipt ic orbi t apogee
10 15
AV (fps X 10 )
Fig. LL-7. Minimum AV Requirements for Reentry at 400,000 Feet
CQNriDCNTbM •. MT*cr-2O50-:P-.2.
• • • • • • • •
: : :426: ;

APPENDIX MM
DYNAMIC REENTRY ANALYSIS
An analog simulation was conducted to determine the dynamic, six-degree-of-freedom, reentry characteristics of the RTG/RB. This study was conducted in order to: (1) assess some of the (minor) differences between the standard, ballistic trajectories analysis and the real world; (2) investigate the aerodynamic stability of the configuration; and (3) determine the rate at which the configuration turns toward the stable attitude, as a function of the initial roll and pitch rates , and initial attitude.
Although ballistic trajectories have been acceptable for safety analysis (which, after all, is the main motivation of these reentry trajectories), we were interested in this type of trajectory simulation in order to gain an understanding of malfunctioning reentr ies .
These investigations were conducted for orbital entry conditions. Pr imary emphasis was placed upon malfunction conditions such as entry at very shallow entry angles ( i . e . , a decaying orbit). This orbital entry condition results in the lowest maximum dynamic pressures . Consequently, if a vehicle can survive a set of initial conditions for shallow entry, it will stabilize quicker for steeper entry angles. This theoretical result (Ref. MM-1*) has been verified in this study.
The aerodynamic characteristics of the referenced vehicle used in this analysis are presented in Appendix Y. The vehicle center of grav-ity was assumed to be at -pr = 0.42 (19. 3 inches aft of the heat shield).
X The actual center of gravity location is at-7r= 0.39 (18 inches aft).
This center of gravity location increases the stability of the system. To conserve running time and increase accuracy, the atmospheric entry conditions for the analog were assumed to be at 300, 000 feet (as compared to 400, 000 feet for the digital programs). The velocity and flight path angle correspond to the digital results , based upon -0. 1°, -2°, and -8° entry angles. A total of 41 different reentry trajectories were run. Of course, not all results are exposed in the report. Only a few of the trajectories and some parametric cross plots are presented.
*Ref. MM-1. Tobak and Peterson, "Theory of Tumbling Bodies Entering Planetary Atmospheres with Application to Probe Vehicles and the Australian Tektites, ' NASA TR R-203, 1964,
CONriD:MTI;\^ • :Ul1SH-^b5():-l':-2:': : •': "I:" • • • • • • • • ••• • • • • • • • • A'yn* • • • • • • • • •

The reen t ry t ra jectory for a no rma l (-2°) entry condition is shown in Fig. M M - 1 . The init ial pitch and ro l l r a t e s were 6° / s e c , and the init ial attitude was ve r t i ca l with a 90° initial angle of attack. To c lear ly p resen t the r e s u l t s , the envelopes of the maximum and minimum angles of at tack a r e presented r a t h e r than the highly osc i l la tory r) v e r s u s t h i s tory .
The reen t ry t ra jec tory for a s teep (-8°) r een t ry is shown in Fig. MM-2 for the same init ial conditions as above, and a shallow entry (-0. 1°) is shown in Fig. MM-3. These r e su l t s a r e quite in te res t ing , as they show that the init ial ro l l r a t e causes the r een t ry body to cone. This causes the minimum angle of a t tack to remain at about 10° . The maximum excursion, however , is c lear ly damped by the action of the increas ing dynamic p r e s s u r e acting on C,^,.
It is in teres t ing to see that the dynamic effects in the shallow entry had the tendency to i nc rease the maximum dynamic p r e s s u r e above the same value for the bal l i s t ic (il^O) t ra jec tory . It is suspected that this effect is due to the lower drag coefficient at angles of at tack than at a - 0, as well as to the osc i l la tory in the t ra jec tory a r i s ing from an effective (but a lmost random) L / D ra t io due to a finite r). This la t te r condition is most likely a contr ibutor , since there was some sca t t e r in the r e su l t s of t ra jec tory with a lmos t identical ini t ial conditions.
It i s c lear from these t r a j ec to r i e s that a s teep entry i n c r e a s e s the effective damping of the ini t ial r a t e s . A p a r a m e t r i c study was conducted for the shallow entry angle to de termine the effect of init ial pitch r a t e on the maximum angle of a t tack in the high aerodynamic heating region. The resu l t s of this a r e shown in Fig, MM-4. The contour is a function of the initial or ientat ion. However, this dependency is quickly el iminated as the initial r a t e s become l a rge . The maximum pitch ra t e at which the reen t ry body will stop tumbling is approximately 600 deg/ sec (Fig. MM-4). When the center of gravity of the vehicle is moved to the actual location (as compared to re ference aerodynamic coefficients) , the maximum allowable init ial pitch ra te is calculated to be about 1200 deg / s ec . For s t eeper entry angles , higher maximum pitch r a t e s can be tolerated,
A s i m i l a r p a r a m e t r i c study was made to de te rmine the effect of init ial ro l l r a t e on the maximum angle of at tack in the high heating reg ime (Fig. M M ; - 5 ) , One r a the r s t range feature of these r een t ry t r a j ec to r i e s was the tendency of the r een t ry body to act like a lifting body at high (600 deg/sec) spin r a t e s . The net effect of the osc i l la tory motion is to inc rease downrange at impact , to dec rea se the max i mum dynamic p r e s s u r e and, apparent ly , to dec rea se the maximum angle of at tack. It is not as yet known whether the r e s u l t s at high spin r a t e s a r e the r e su l t of pecu l ia r i t i e s in the analog equipment. In any case , these r e su l t s confirm the decision to despin the RTG/RB p r io r to r e en t ry .
' : •"• .*. : M:ND-2t)59--F-J2" :•. .: : : . : :*: : 428 : : : :

••••o . }
•RJ.O
• i
I 2 0 r
1 0 0 -
tiO 0!
73
o
80
•" 60 0 0)
I—(
tiO fl <J rt 40
-t->
o H
- 3 M
0) t< CM o
- a oi ^ Q
2 0 -
OL
to
cr
bOU
500
400
300
200
100
0
-A - \
- 1 -
Li
1 .
VQ = 25,780 fps
-2°
•• 90°
Pi tch ra te = 0 .1 r a d / s e c Roll ra te = 0 .1 r a d / s e c
Osci l la tory frequency between these two r)' s was w = 0.6 cps
80 100 120 140 Time from 300,000 Fee t (sec)
200 220
Fig. MM-1. Dynamic Trajectory for CRONUS RTG/RB
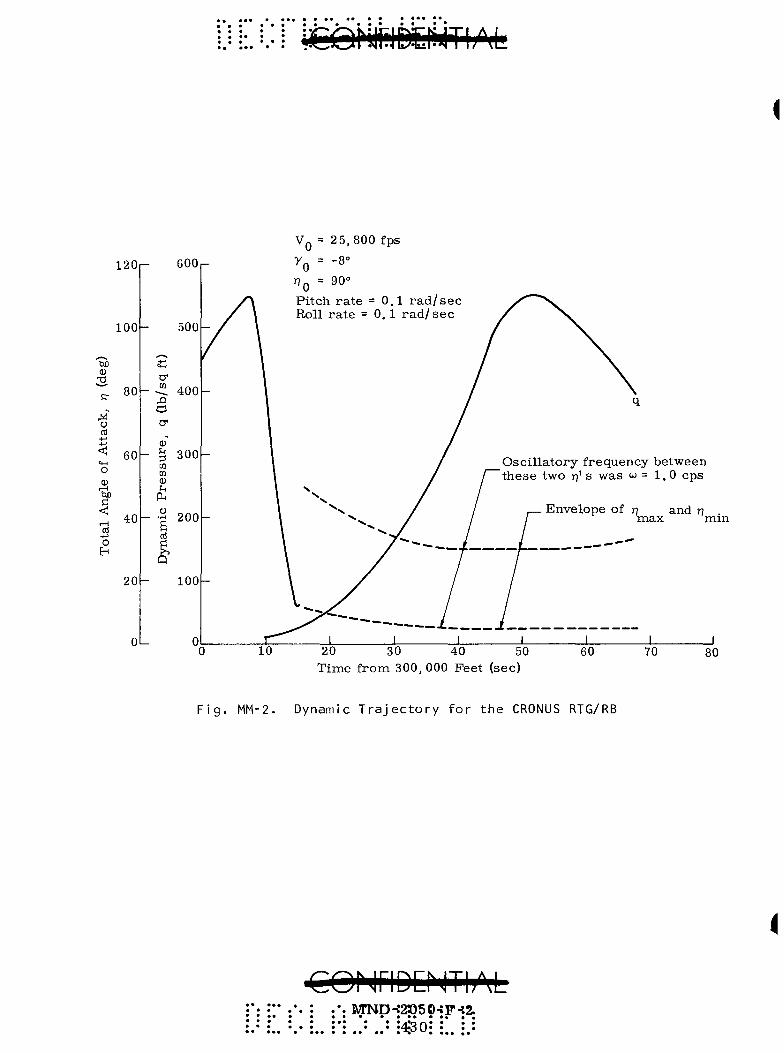
VQ = 2 5,800 fps
120
100
, - 600
500
- - ^ 400
M
fl) T)
y U rt 4-> -H < o <u r H
<r1 ';;l + j
o H
80
60
40
iti cr
_ " T — 1
o*
(U
3 01 tn (D SH
Cu o a ni C
^
20
3 0 0 -
- -3 200
100
Osc i l la tory frequency between these two rj' s was w = 1. 0 cps
Envelope of rj and n max min
20 30 40 50 Time f rom 300, 000 Feet (sec)
F i g . MM-2. Dynamic T r a j e c t o r y f o r t h e CRONUS RTG/RB
4
CONriDENTI;M MND-:2»50-!F
• • • • • • • * : : -.4^0: :
• • • • « -V^ ^ • • • •

() -.... -
:--kC
* * I —
• * « « a ^
F: f
120
100
•a
cr 80
o
o a) BO
o
60
4 0 -
600
500
0)
m tn
400
300
200 a
2 0 - 100
OL
VQ = 25, 550 fps
TQ = -0.34°
riQ = 90°
Pitch r a t e = 0 .1 r a d / s e c Roll r a t e = 0 . 1 r a d / s e c
Envelope of r) and n . m a x m m
Osci l la tory frequency between these two rf s was u = 0. 5 cps
200 300 Time from 300,000 Feet (sec)
500
$
• ••• >
Fig. MM-3. Dynamic Trajectory for CRONUS RTG/RB
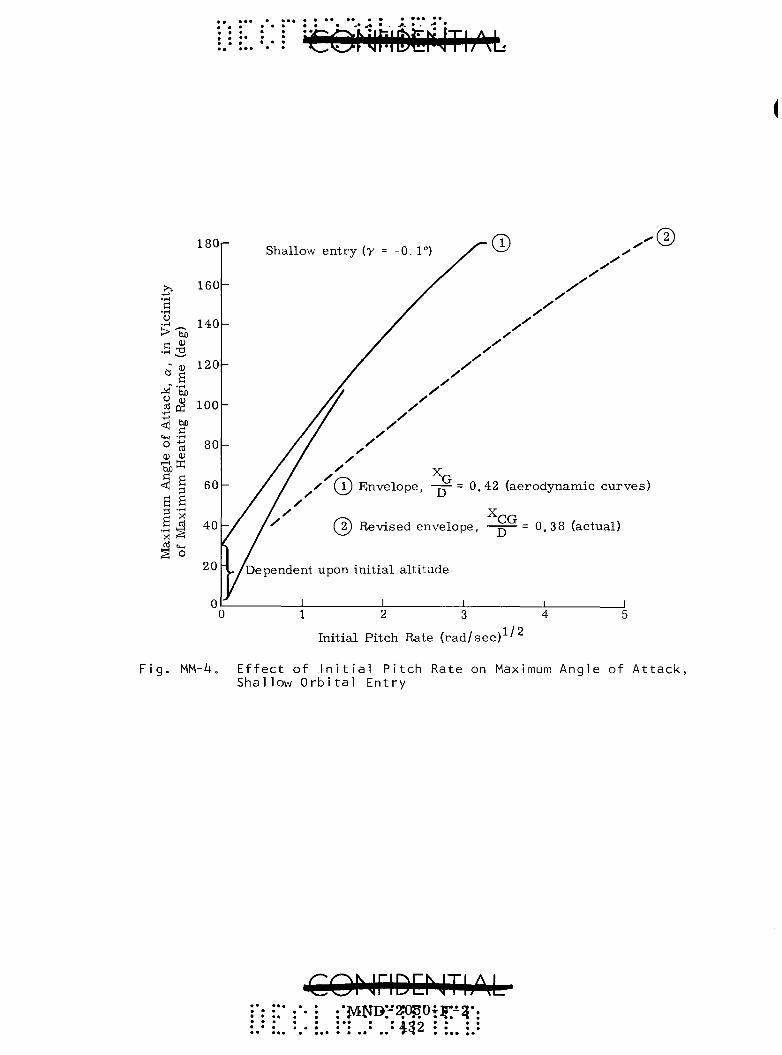
180
>^ + J
c • I - f
o • iH
J^ <u
" a vl "5n O m
+ J
< § t w -rH
o "S QJ (1)
UK ^ S a a
.£3 ^'-t § O
160
140
120
100
80
60
40
20
Shallow entry (y = -0.1°)
/
• @
,y y'
/
, / y . /
X
y {V) Envelope, -pj-= 0.42 (aerodynamic curves)
CG 2) Revised envelope, ^ = 0 ,38 (actual)
»/Dependent upon ini t ia l altitude
0 1 2 3 4 5
Initial Pitch Rate ( r a d / s e c ) ^ ' ^
Fig. MM-4o Effect of Initial Pitch Rate on Maximum Angle of Attack, Shallow Orbital Entry
COhJriDChJTIAL •iVlIJD:-2(^0T^^^-.
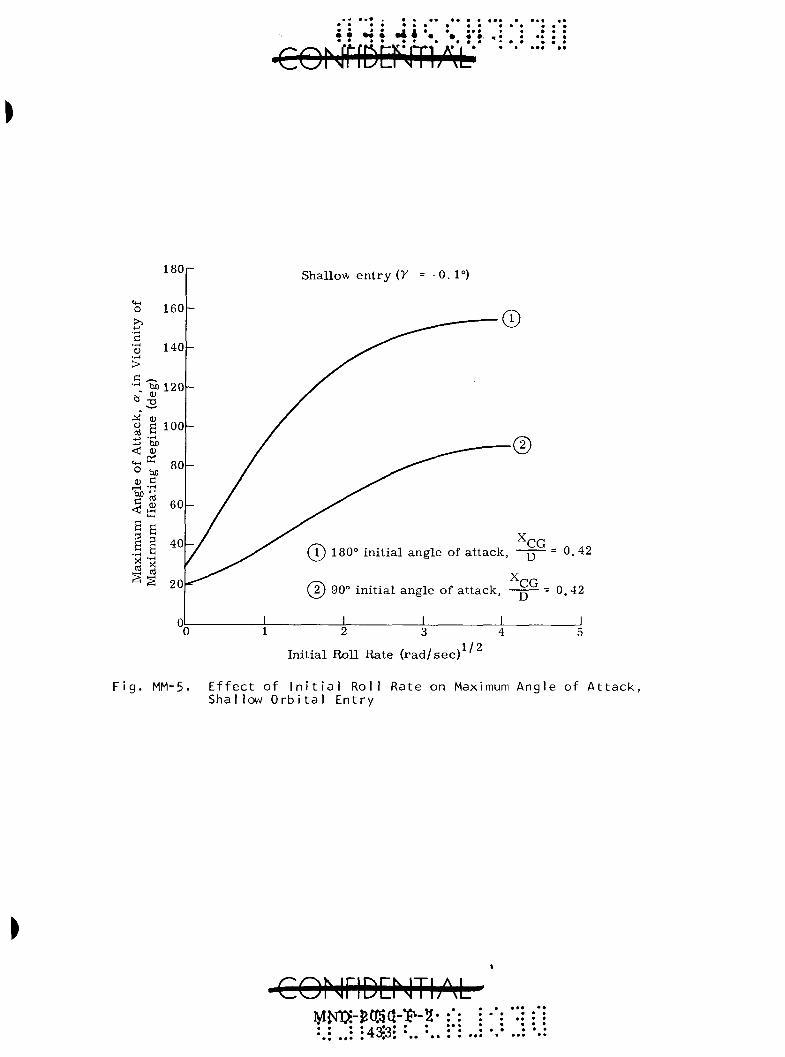
180 Shallow ent ry (y = -0.1°)
initial CG
(2) 90° initial angle of attack.
D
^CG
= 0.42
0.42
Initial Roll Rate ( r ad / sec ) 1/2
Fig. MM-5. Effect of Initial Roll Rate on Maximum Angle of Attack, Shallow Orbital Entry
CONriDCNTIAL iyiw«-»(Ka-i?-2-• • • • 43'3' • •
APPENDIX NN
TERMINAL VELOCITIES
Te rmina l velocit ies at sea level for the s eve ra l RB's poss ible a r e presen ted in this section. Bodies considered were :
(1) The rmoe lec t r i c genera to r r een t ry body without the deorbit package (RTG/RB).
(2) The rmoe lec t r i c genera tor r een t ry body with the deorbi t package (CIR-RTG/RB).
(3) Heat source , including 36 fuel capsules
(4) Fuel capsule.
Te rmina l veloci t ies were de termined for the no rma l sea level a t m o s -_ o
pher ic conditions (the a i r densi ty, p , = 2. 38 x 10 s l u g s / c u ft) with the var ious bodies in different at t i tudes (end-on, s ide-on and tumbling). Since some of the r een t ry shapes (numbers two, three and four) have never been tested (in free flight and tunnels), it was n e c e s s a r y to e s t i mate the drag coefficients by comparing the r een t ry bodies to conventional (or tested) shapes .
Te rmina l velocity is the condition when the weight and the drag a r e equal in magnitude but opposite in direct ion. Therefore , the following express ion was used:
2
or
W = D = C j ^ - | A^^^V^ ' ' (NN-1)
y 2 2 W T p C Q A
Inser t ing the a i r density at sea level and taking the square root of both s ides of Eq (NN-1), the t e rmina l velocity at sea level i s :
(V^) - 2 9 ( W / C ^ A )^/2 (NN-2)
s i
where
W - weight of body at impact (lb)
D = drag force (lb)
• • • • a • • • • • •• • • • • • • • •
CQNriDD Tl/d; •MNI>2iO^OrF-3'. • • • • • • • ••• • •
•; : •A'3& : : : :
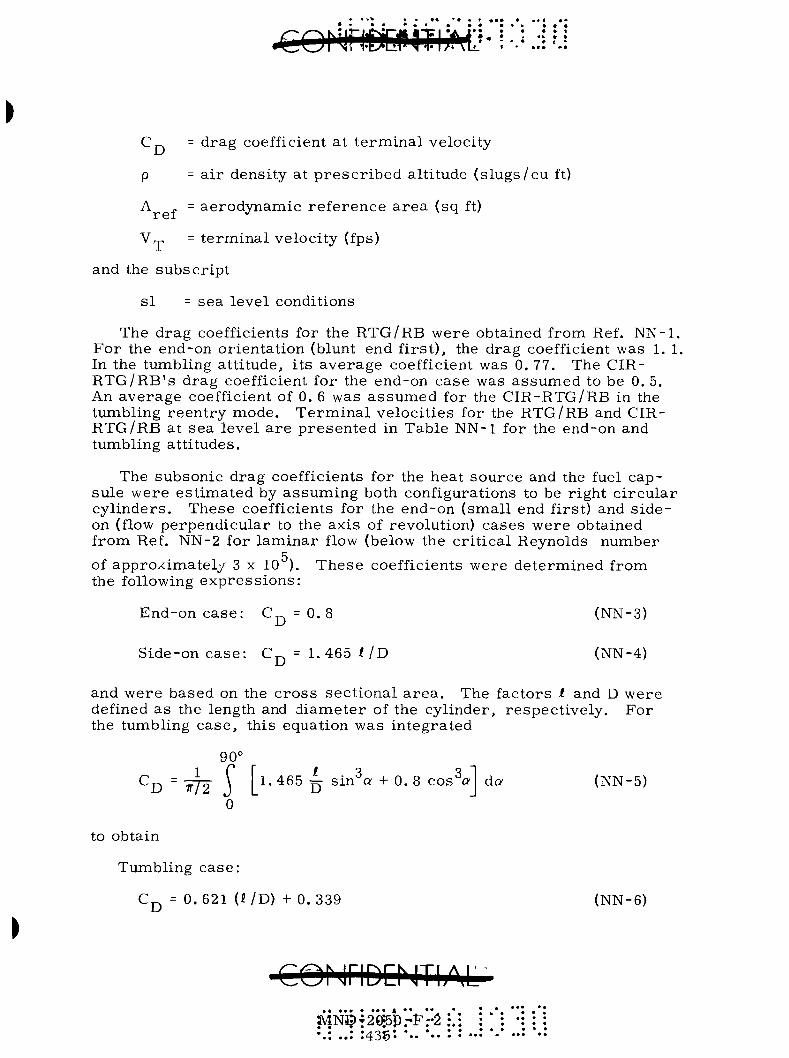
Cp. - d rag coefficient at t e rmina l velocity
p = a i r density at p r e s c r i b e d alti tude ( s lugs /cu ft)
A „ = aerodynamic r e fe rence a r e a (sq ft)
Vrp = t e rmina l velocity (fps)
and the subscr ip t
s i - sea level conditions
The drag coefficients for the RTG/RB were obtained from Ref. NN-1 . For the end-on orientat ion (blunt end f i rs t ) , the drag coefficient was 1. 1 In the tumbling at t i tude, i ts average coefficient was 0. 77. The CIR-R T G / R B ' s drag coefficient for the end-on case was assumed to be 0. 5. An average coefficient of 0. 6 was a s sumed for the CIR-RTG/RB in the tumbling r een t ry mode. T e r m i n a l veloci t ies for the RTG/RB and CIR-RTG/RB at sea level a r e p resen ted in Table NN-1 for the end-on and tumbling at t i tudes.
The subsonic drag coefficients for the heat source and the fuel capsule were es t imated by assuming both configurations to be r ight c i r cu la r cy l inders . These coefficients for the end-on (small end first) and s i de -on (flow perpendicular to the axis of revolution) cases were obtained from Ref. NN-2 for l aminar flow (below the cr i t ica l Reynolds number
5 of approximately 3 x 10 ). These coefficients were determined from the following express ions :
End-on case : C^^ = 0. 8 (NN-3)
Side-on c a s e : Cj^ = 1.465 i / D (NN-4)
and were based on the c ro s s sect ional a r e a . The factors I and D were defined as the length and d iameter of the cylinder, respect ively . For the tumbling case , this equation was integrated
90°
*^D " ¥72' ) [ l - 4 6 5 ^ sin"^a + 0 .8 c o s ^ da (NN-5)
0
to obtain
Tumbling case :
Cj^ = 0.621 (^/D) + 0.339 (NN-6)
CQMriDCNThM-
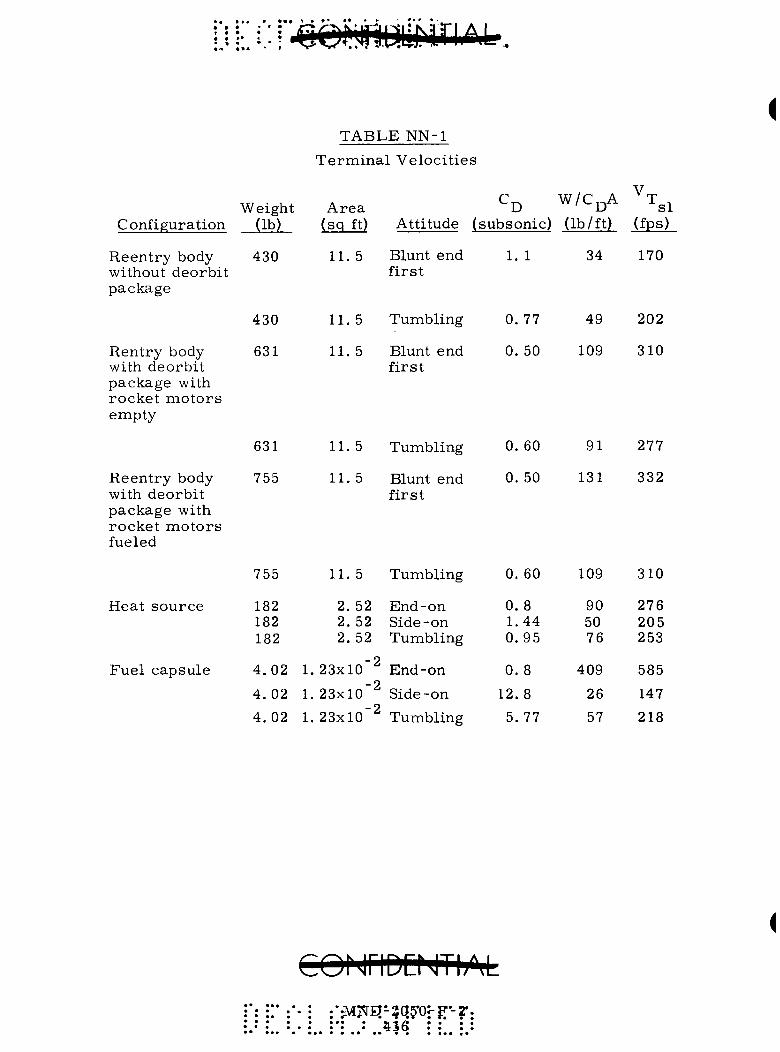
TABLE NN-1
Te rmina l Veloci t ies
Configuration
Reentry body without deorbit package
Rentry body with deorbit package with rocket mo to r s empty
Reentry body with deorbit package with rocket moto r s fueled
Heat source
Fuel capsule
Weight (lb)
430
430
631
631
755
755
182 182 182
4.02 1.
4 .02 1.
4 .02 1.
Area (sq ft)
11. 5
11. 5
11. 5
11.5
11.5
11. 5
2. 52 2. 52 2.52
23x10"^
2 3 x l 0 ' ^
23xl0"^
Attitude
Blunt end f i rs t
Tumbling
Blunt end f i rs t
Tumbling
Blunt end f i rs t
Tumbling
End-on Side-on Tumbling
End-on
Side-on
Tumbling
(subsonic)
1. 1
0.77
0. 50
0. 60
0. 50
0. 60
0.8 1.44 0.95
0 . 8
12. 8
5. 77
W / C Q A
(lb/ft)
34
49
109
91
131
109
90 50 76
409
26
57
T s i (fps)
170
202
310
277
332
310
276 205 253
585
147
218
CONriDENTIM •:M:5li?^?q5*Orr-2': •: : 436 : : : :
The angle a was defined as the angle of attack. This coefficient was also based on the cylinder's cross sectional area. Terminal velocities for the heat source and fuel capsule are presented in Table NN-1 for the different orientations. The heat source will probably be tumbling at impact, while the capsule will be oscillating about the side-on attitude at impact.
REFERENCES
NN-1. Bradley, E. P . , "Aerodynamic Information Note No. 20-Gemini Mission Aerodynamics, " McDonnell Aircraft Corporation, December 27, 1962.
NN-2. Hoerner, S. F. , "Fluid-Dynamic Drag, " 1965.
CQNriDENTI/r^ :iHNJPr2a5p-:F-:2;': •.{ .! •43j7! :.. :. ""
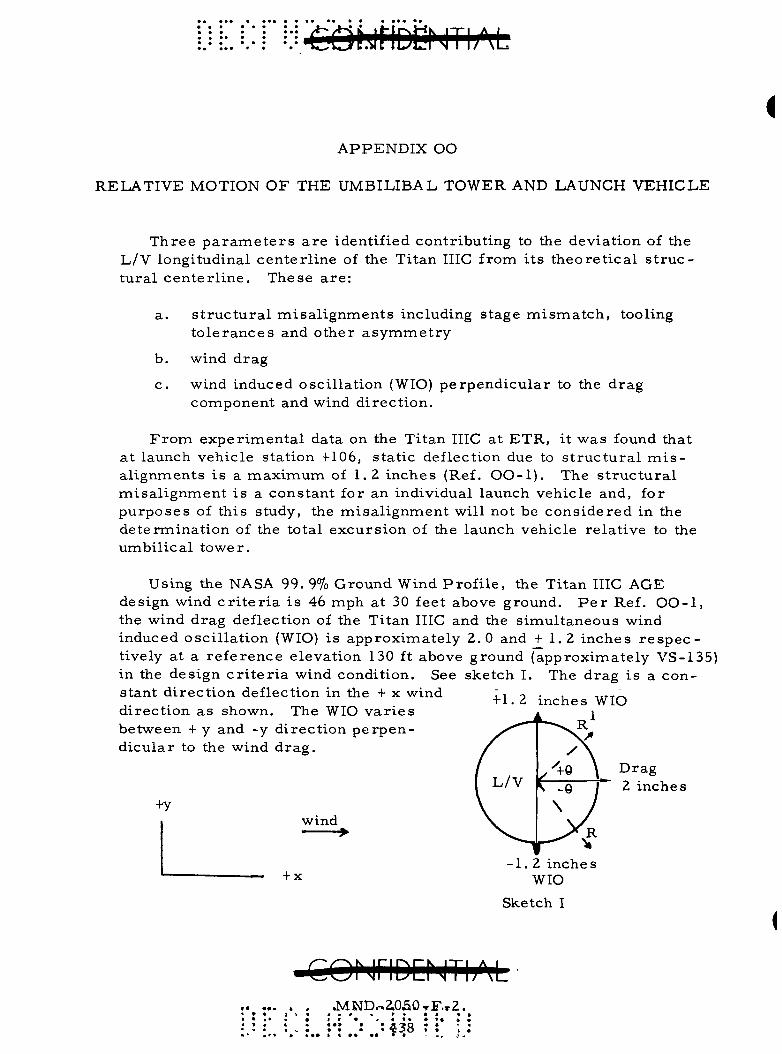
APPENDIX OO
RELATIVE MOTION OF THE UMBILIBAL TOWER AND LAUNCH VEHICLE
Three p a r a m e t e r s a r e identified contributing to the deviation of the L/V longitudinal center l ine of the Titan IIIC from i ts theore t ica l s t r u c tural cen te r l ine . These a r e :
a. s t ruc tu ra l misa l ignments including stage mi sma tch , tooling to le rances and other a symmet ry
b . wind drag
c. wind induced oscil lat ion (WIO) perpendicular to the drag component and wind di rect ion.
F rom exper imenta l data on the Titan IIIC at ETR, it was found that a t launch vehicle station +106, static deflection due to s t ruc tu ra l nnis-al ignments is a maximum of 1.2 inches (Ref. O O - l ) . The s t ruc tu ra l misa l ignment is a constant for an individual launch vehicle and, for purposes of this study, the misa l ignment will not be cons idered in the determinat ion of the total excursion of the launch vehicle relat ive to the umbil ical tower.
Using the NASA 99. 9% Ground Wind Prof i l e , the Titan IIIC AGE design wind c r i t e r i a is 46 mph at 30 feet above ground. P e r Ref. O O - l , the wind drag deflection of the Titan IIIC and the simultaneous wind induced osci l lat ion (WIO) is approximately 2.0 and + 1.2 inches r e s p e c tively at a reference elevation 130 ft above ground (approximately VS-135) in the design c r i t e r i a wind condition. See sketch I. The drag is a constant di rect ion deflection in the + x wind direct ion as shown. The WIO va r i e s between + y and -y direct ion perpendicular to the wind drag .
+1. 2 inches WIO 1
+y wind
Drag 2 inches
+ x -1 .2 inches
WIO Sketch I
ONriDENTIAL « • •«•> M N D « 2 . 0 £ 0 T F . T 2 .
: 4 3 8 : :
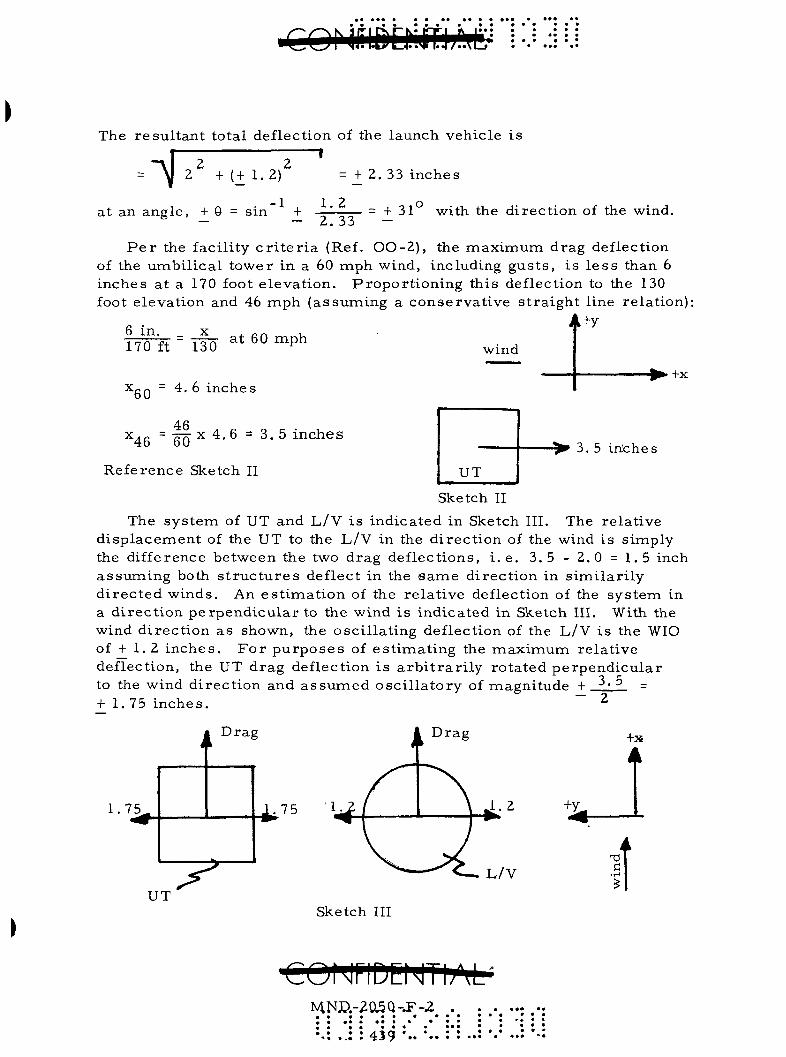
The resul tant total deflection of the launch vehicle is
= + 2. 33 inches i 2 2 2 + (+ 1.2)
1 1 O
at an angle, + 0 = sin + —'- = + 31 with the direct ion of the wind. ^ - - 2. 33 -
P e r the facility c r i t e r i a (Ref. 0 0 - 2 ) , the maximum drag deflection of the umbil ical tower in a 60 mph wind, including gus t s , i s l e s s than 6 inches at a 170 foot elevation. Propor t ioning this deflection to the 130 foot elevation and 46 nnph (assuming a conservat ive s t ra ight line relation);
6 in b m . X .en t, _ _ _ = _ _ at 60 mph
A+y
wind
X 60 4, 6 inches
46 X 4, 6 = 3 .5 inches
+x
"46 60
Reference Sketch II
3. 5 irtches
Sketch II The system of UT and L/V is indicated in Sketch III. The relative
displacement of the UT to the L/V in the direct ion of the wind is simply the difference between the two drag deflections, i . e . 3.5 - 2.0 = 1.5 inch assuming both s t ruc tu re s deflect in the Same direct ion in s imilar i ly d i rec ted winds. An estinaation of the relat ive deflection of the system in a direct ion perpendicular to the wind is indicated in Sketch III. With the wind direct ion as shown, the oscil lating deflection of the L/V is the WIO of + 1. 2 inches . F o r purposes of est imating the maximum relative deflection, the UT drag deflection is a rb i t r a r i l y rotated perpendicular to the wind direct ion and assumed osci l la tory of magnitude + ->' ^ = + 1. 75 inches . ~ ^
Drag
1.75
4 Drag
.75 1 1. 2
L/V
+y-
+x
1 UT
if Sketch III
CONriDD^TI/r^ MNX).- 0^ 0-^^-2
« • • • • • * •
439 *.. '••
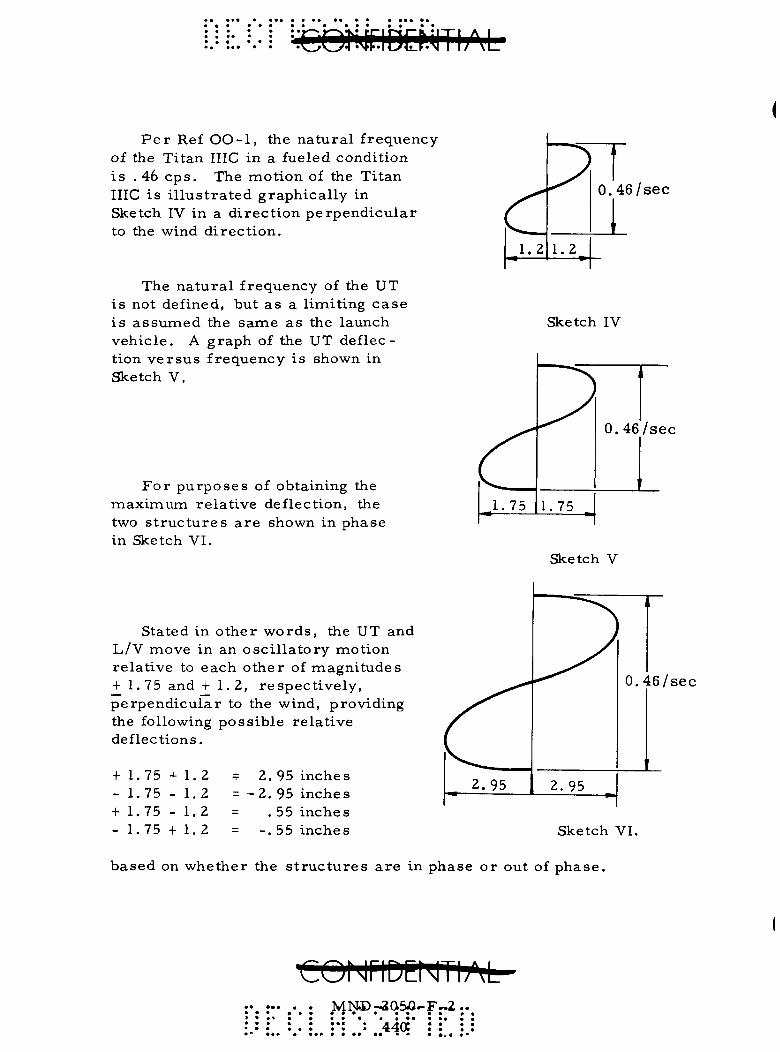
• • • • • • • *\^ ^v^ ^* l '^r I * • I 4 f^<• p• A| 1 1 / \
P e r Ref O O - l , the natura l frequency of the Titan IIIC in a fueled condition is .46 cps . The motion of the Titan IIIC is i l lus t ra ted graphical ly in Sketch IV in a direct ion perpendicular to the wind di rect ion.
The na tura l frequency of the UT is not defined, but as a limiting case is assumed the same as the launch vehicle . A graph of the UT deflection ve r sus frequency is shown in Sketch V.
For purposes of obtaining the maximum relat ive deflection, the two s t ruc tu res a r e shown in phase in Sketch VI.
0.46/sec
Sketch IV
Sketch V
Stated in other words , the UT and L / V move in an osc i l la tory motion relat ive to each other of magni tudes + 1.75 and + 1.2, respect ively , perpendicular to the wind, providing the following possible relat ive deflections.
+ 1.75 + 1 . 2 - 1.75 - 1.2 + 1 . 7 5 - 1 . 2 - 1 . 7 5 + 1 . 2
= 2. 95 inches = - 2 .95 inches = .55 inches = - . 5 5 inches
6/sec
Sketch VI.
based on whether the s t ruc tu res a re in phase or out of phase .
CO! viriDD -JTI;^^^ .. ; MN.D.-2q5J0-Fp2..^
• • • • • • • • • • • • • . : :•: : 44a : : : :

Therefore , the maximum relat ive motion between the launch vehicle and umbilical tower is approximately 6 inches (+ 2. 95 inches) at .5 cps (. 46 cps) .
To determine the influence of the FHM on the launch vehicle under the frequencies and ampli tudes ci ted, a diagram of the system is shown in the following sketch w^here the umbil ical tower is assunned static and all motion of the system is allowed in the launch vehicle . Therefore the launch vehicle osc i l la tes at . 46 cps and a 5. 90 inch excurs ion. The FHM on a fr ic t ionless support and rigidly connected to the launch vehicle follows, in phase , the veh ic le ' s motion. It i s assumed that this motion i s approximated by a sinusoidal function:
and
X = A sin cot
dx » , X = —rr = wA cos cot
X = w A sin cot
W .. F = - X
g
FHM
Umbil ical tower
- W 2
--r • F is max when sin cot = 1
500 lb
F = -^Jco-'A sin cot
Titan III
y//////////////y
F = - ^ C O 2 A
w = 27rf
= 27r X 0.46
CO = 0.92 7r r ad i an / s ec ,
500 32.2
F = - 63.8 lb.
(0.92 »^2/5.90^
CONriDENTh^ MN©-i^e50--Fi-2
• • • « • • 44i;

• • • • • * * • VL? » VJ*^^ I* * ^ I* 1 * ^ ^ r * 1 ^ 1 1 / \ \^
The above indicates that the resultant load in the launch vehicle due to relative motion of the um.bilical tower and launch vehicle and a zero friction suspension of the FHM is approximately 64 pounds.
REFERENCES
OO-l. Analytical data based on wind tunnel tests with 7. 5% model, Telecon with Robert Morra M/D x 2131 per M. Krietz.
0 0 - 2 . CR-62-1000, Er ra tas , "Criteria and Concepts, SLV(5) ITL System (Titan III), Technical Launch Facil i t ies," CCMTA.
COhiriDEMTliM . ..MND-2a50-F.-2.^ • • • • • • • • • • • • • '... :": .:• ..-442 : :.. :.:

APPENDIX P P
IDEALIZED GHE CONCEPTS
A. FIXED TOWER,FOLDING BOOM,FUEL BLOCK LOADING
This concept is a modification of the SNAP 29 fueling concept in the following a reas :
(1) The loading device uses a l ighter weight cask than the ICC cask in which the fuel block is shipped.
(2) A hea te r block compar tment is located beside the t r ans fe r cask.
(3) A sepa ra t e r a m rod is used for the fuel block and the heater block. The r a m rods have a g r ipper mechanism on the end to engage a knob on the fuel and hea te r b locks .
(4) A guide tunnel or duct with r o l l e r s in the bottom is used to t r ans fe r the fuel and hea te r blocks to the RTG.
This proposed concept differs from the SNAP 29 fuel loading device in the following manner :
(1) The length of the tunnel or duct connecting the RTG to the loading cask is approximately 20 feet compared to a few feet for SNAP 29.
(2) The r a m rods a r e proport ional ly inc reased in length.
(3) The cask is mounted on a fixed platform ra the r than the t h r e e -way c a r r i a g e of SNAP 29.
(4) The t r a n s f e r tunnel is connected to the space vehicle manually under a cold environment r a the r than remote ly connected. It will r emain connected to the space vehicle up to liftoff.
(5) The loading device is mounted on the umbil ical tower r a the r than the MST.
(6) The r a m rods a r e mo to r -d r iven and remotely controlled r a the r than manually controlled by an opera tor located at the loading device.
1. Equipment L i s t
The equipment l i s t that is requ i red for fuel block loading on the fixed tower folding boom is a s follows:
• • • • « c ^ ^ O • • • •

(1) Transportation cask (ICC regulations)
(2) Transfer cask (for use in loading device)
(3) Fuel block loading device
(a) Cask support structure
(b) Folding tunnel boom with actuator and support structure
(c) Fuel block ram rod with gripper, latch release and support structure
(d) Heater block container and ram rod
(e) Pneumatic system
(f) Hydraulic system
(g) Cooling air system
(4) ICC cask skid
(5) Transfer device to transfer fuel block from ICC cask to transfer cask
(6) Transfer cask dolly or t rai ler
(7) Slings and special tools.
2. Launch Complex Modifications
Modifications to the launch complex will be minor. Point Arguello Launch Complex 2 (PALC 2) Pad 3, a Titan IIIB Agena complex, is shown in the loading configuration drawing but other Titan III complexes would be similarly adaptable to this loading configuration (Fig. PP-1) .
The loading device will be installed on top of the existing umbilical tower and modifications to the tower will be nainimal. Preliminary analysis shows that the tower will support the 5000-pound transfer cask without tower reinforcement. A support stand will be added to the umbilical tower to support the transfer cask and heater container. The transfer tunnel boom will also be supported from the stand. Attachment of the boom actuator and ram rod support structure will be made to the top platform. (Elevation: 130-1/2 ft)
A modification to the MST curtain door will have to be made to allow tunnel boom penetration. Modifications or additions to existing hydraulic.
COhiriDEMTIAL •• : :*M.I5rD:-2JDgO-: :-2;*: . : :•: : :4^4 ' ' : :

o on o oc o o o* CQhjr-i^^i' ^i'h^ff!
Li-tLTHKAL eABuE REEL
(OLt^T-OtM OUSC-t R6ei_ Co o
P/tl^C -2. PAD 3 V/TR.
Fig. PP-1. Fixed Tower Folding Boom
CO 'iflDC^ ITI.M MND-2050-F-2
445
pneumatic and a i r conditioning sys t ems will be requ i red for RTG GSE r e q u i r e m e n t s .
3 . Descr ipt ion and Operation
a. Fuel block shipment
The fuel block will be shipped to the launch site in a cask designed to ICC regulat ions . The cask will be mounted on a skid which will d is t r ibute the load to pe rmi t a i r , r a i l or t ruck t ranspor ta t ion . P r o visions will be made on the cask for a t tachment to the t r ans fe r cask and a push rod t r ans f e r sys t em will be provided.
b . RTG shipment
The RTG will not be fueled when shipped to the launch s i t e . Shipping will be in a norm.al shipping manner .
c . Launch s i te p repara t ions
Nonradiat ion environment condition. The RTG will be instal led in the space vehicle on the ground. The space vehicle will then be e rec ted and instal led on the Titan III in the normal manner . The tunnel boom will be e r ec t ed to a hor izontal posit ion by the ac tuator . The outer s e c tion of the boom, which was not connected to the inner boom, will be inse r t ed manual ly into the space vehicle, then connected to the inner boom. The support cable will be attached and adjusted with a t u rn -buckle. The hea te r block will be instal led in the t rans fe r container on the umbil ical tower and the t r ans fe r r a m rod connected. E lec t r i ca l contact i s made through the r a m rod. The fuel block t r ans fe r rod is posit ioned on the tower support r o l l e r s in read iness for the t r ans fe r cask instal lat ion.
Radiation environment condition. The ICC shipping cask will be connected to the t r ans fe r cask and the fuel block will be pushed into the t r ans f e r cask with a push rod. The t r ans fe r cask will be t r a n s por ted to the launch pad on a flat-bed t r a i l e r and positioned under the MST 10-ton c r ane . The c rane hook will be connected to the cask sl ing and will lift the cask to the fuel t ransfe r device located on top of the umbi l ica l tower . Guide ways will a s s i s t in positioning the cask in the loading device. The cask will be posit ioned on the umbil ical tower on R-1 day. Loading the fuel block into the RTG will occur late in the countdown on launch day. After propel lant loading has been completed, the hea te r block will be remote ly inse r t ed into the RTG by actuating the r a m rod. The RTG t e m p e r a t u r e will be gradually brought up to the opera t ing range . As soon as the t empera tu re s tabi l izes , the hea te r block will be withdrawn by the r a m rod which r emains connected to the hea te r block at al l t i m e s . The fuel block r a m rod will be actuated and will inse r t the fuel block, with the RTG plug attached, into the RTG.
co^^rlD[:^jTb^L MND-2050-P-2
446

A torque-limiting clutch will maintain a maximum predetermined ram force on the RTG even under differential motion of the space vehicle and loading device. Door latch mechanisms on the RTG or fuel block plug will lock the fuel block in place. The ram rod retractor motor will be actuated and it will be determined if the fuel block is securely locked in the RTG as the ram rod will not retract . If the fuel block is determined to be secured in the RTG, then the grippers on the end of the ram rod will be disengaged and the ram rod fully retracted. The tunnel boom connecting the cask to the space vehicle will remain connected through liftoff. Liftoff switches, located on the Titan thrust mount, will send a signal to the tunnel boom actuator to retract. The outer section of the boom is hinged so that the first motion of the spacecraft will cause the boom to fold upward and this motion can be used for redundant switches to signal actuator motion. Redundancy will also be built into the actuator and hydraulic valving system. The L/V hatch will be spring-loaded closed as the boom is withdrawn from the loading hatch.
In the event liftoff does not occur after engine start, the boom and fuel block retracting devices will be ready so the fuel block can be re moved immediately. The ram rod will travel through the boom tunnel guided by a runner on the end of the boom which rolls on rollers in the bottom of the tunnel boom. Engagement is made as soon as the gripper contacts the knob on the fuel block plug. Trip fingers in the gripper mechanism release the latch, allowing the fuel block to be retracted into the cask.
B. TOWER-MOUNTED, CABLE TRANSFER, BLOCK LOADING
This concept is similar to Concept A in the following respects:
(1) The loading device uses a lighter weight cask than the ICC cask in which the fuel block is shipped.
(2) The loading device is mounted on the fixed umbilical tower,
(3) The fuel block transfer systena is connected to the RTG manually under a radiation cold environment.
(4) The fuel block transfer is conducted remotely from the block house.
(5) The transfer system remains connected to the RTG until liftoff.
cof \ma JThMs. :tJlN3Dc-^SSo"'F"2:': i •*: ".': :' • • • • . f-J • • • • • • • • • • • • • 4 4 ? • • • • • • • • • • • • • • • ~ T •• • • • • • • • • • • • • • •

< « * « « • « # * I- • > • « » • » • ;;i^,^i4ri|iDir.NTbM
The major differences between this concept and Concept A are as follows:
(1) No internal provisions in the fuel loading device are made for a heater block to preheat the RTG, although, a heater block system could be provided.
(2) A cable is used to guide the fuel block rather than a tunnel boom.
(3) A motor-driven cable is used instead of ram rods,
(4) Remotely operated cable cutters or cable release devices are used to disengage the fuel block rather than grippers on a ram rod.
1. Equipment List
The equipment list for this concept is:
(1) Transportation cask (ICC regulation)
(2) Transfer cask for use in loading device
(3) Fuel block loading device
(a) Cask support structure
(b) Cable transfer system with motor or winches and r e motely operated cable cutters or cable release devices
(c) Cable slack takeup device
(4) ICC cask skid
(5) Cooling air system
(6) Transfer device to transfer fuel block from ICC cask to t ransfer cask
(7) Transfer cask dolly or t rai ler
(8) Slings and special tools.
2, Launch Complex Modifications
Modifications to the launch complex will be nainor. Titan III, Complex 40 at ETR is shown in the loading configuration drawing but other
• • • ••MNcr-ao-so-^F-s. • • • • • • - -.• ..• 148 :

GQMriDCMTt-/rk
Titan III complexes would be s imi la r ly adaptable to this loading configura t ion (Fig . P P - 2 ) .
The loading device will be located between P la t fo rms 10 and 11 on the exist ing umbil ical tower . Modifications to the tower will be min imal . P r e l i m i n a r y analys is shows that the tower will support the 5000-pound t r ans f e r cask without tower re inforcement . A s t ruc tu re will be added above P la t fo rm 10 to support the cask and t r ans f e r device . The s t r u c tu re will be t ied d i rec t ly into four ver t i ca l H b e a m s .
3 . Descr ipt ion and Operation
a. Fue l block shipment
The fuel block will be shipped to the launch si te in a cask designed to ICC regula t ions . The cask will be mounted on a skid which will d i s t r i b ute the load to pe rmi t a i r , r a i l or t ruck t ranspor ta t ion . P rov i s ions will be made on the ICC cask for at tachment to the t r ans fe r cask and a push rod t r ans f e r sys t em will be provided.
b . RTG shipment
The RTG will not be fueled when it i s shipped to the launch s i t e . Shipping will be in a no rma l shipping manne r .
c . Launch s i te p repara t ion
Nonradiat ion environment condition. The RTG will be instal led in the space vehicle on the ground. The space vehicle will then be e rec ted and insta l led on the Titan III in the normal manne r . The t r ans f e r cable will be instal led through the RTG and the free ends coiled in p repara t ion for the t r ans fe r cask instal lat ion on the umbil ical tower . Instal lat ion will be made on the cask support p la t form of the cask takeup device which is used to maintain cable tension during wind sway of the launch vehic le . The t r ans fe r drive motor or winch will a lso be instal led on the t r a n s f e r cask p la t form.
Radiation environment condition. The ICC shipping cask will be connected to the t r ans f e r cask and the fuel block will be pushed into the t r a n s f e r cask with a push rod. The t r ans f e r cask will be t r anspor t ed to the launch pad on a f lat-bed t r a i l e r and posit ioned under the MST c r a n e . The c rane hook will be connected to the cask sl ing and the cask will be lifted up the umbil ical tower and posit ioned into the fuel t r a n s f e r device with the aid of tag l ines . The t r ans fe r cable, with quick r e l ea se fittings on each end, will be inser ted through each end of the t r ans fe r cask and connected to the fuel block plug. The closed loop cable will be connected to the spr ing- loaded takeup mechan ism and the t r a n s f e r dr ive
COrjnDCNTIAL MND-2050-F-2
449
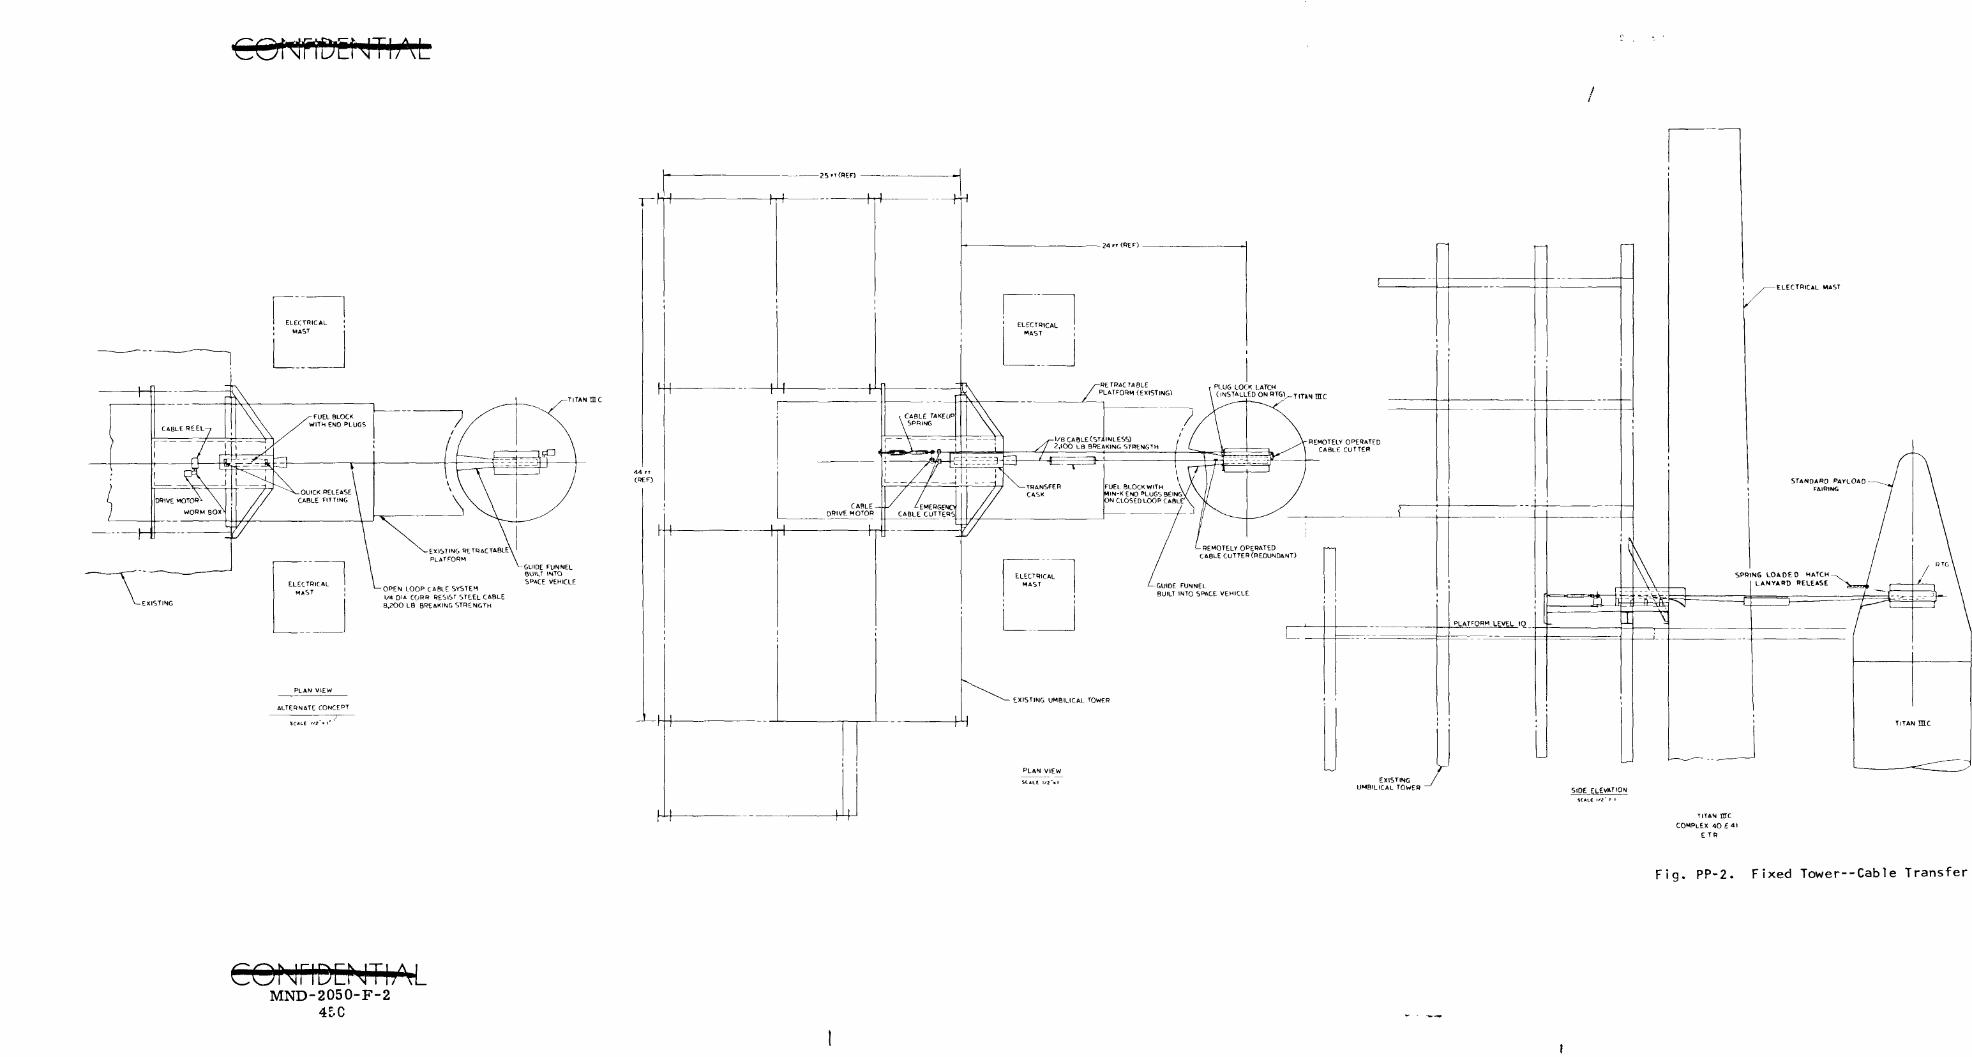
/
OPEN LOOP CABLE SYSTEM 1/4 DIA CORR RESIST STEEL CABLE 8,200 LB BREAKING STRENGTH
GUIDE FUNNEL BUILT INTO SPACE VEHICLE
ALTERNATE CONCEPT
TITAN IIIC COMPLEX 4 0 £ 41
ETR
Fig. PP-2. Fixed Tower--Cable Transfer
CONriDCNThM MND-2050-F-2
410
motor will be hooked to the cable. Transfer of the fuel block from the cask will be conducted remotely late in the countdown on launch day.
The transfer operation begins with opening the cask plug and actuating the transfer motor. With the closed loop cable system the cable acts as guide, support and means of transfer. The transfer is accomplished by driving the cable with an electric motor. With the open loop cable system, a cable winch is located behind the RTG in the launch vehicle and another is located on the other end of the cable on the umbilical tower. Transfer of the fuel block is accomplished by actuating the cable winch on the RTG. The winch on the umbilical tower will be braked to maintain tension in the cable. A funnel-shaped duct in the launch vehicle will assis t in guiding the fuel block into the RTG and will prevent loss of air conditioned air in the space vehicle. The winch will continue to pull the fuel block into the RTG until a specified preload has been achieved, at which point wedge-shaped latches will be released to maintain preload. The winch will be designed to stall when the preload value is reached. The cable to the uinbilical tower winch will remain connected until liftoff has been achieved, at which time a mechanically actuated cable release will disconnect the cable from the fuel block plug in the RTG, The cable will be reeled in as the launch vehicle r i s e s . The launch vehicle hatch, which is spring-loaded closed, will be remotely latched. In the event liftoff does not occur after engine start , the fuel block can be immediately removed as the guide cable remains attached. Removal would consist of retracting the fuel block latches in the RTG and actuating the umbilical tower cable winch. The winch on the RTG will act as a drag brake to maintain tension in the cable. The fuel block will be retracted into the cask and the cask plug remotely closed.
d. Heater block installation
The heater block will not be an integral part of the fuel block loading device and the need for a fuel block is questionable at this time. If a heater block is required, it will be installed from a UT retractable platform which will be retracted before the fuel block is transferred.
C. GUIDE RAILS AND TROLLEY, FUEL BLOCK LOADING
This concept proposes a guide rail and remotely operated trolley to transfer the fuel block from the transport cask, located at ground level, to the RTG which is installed on the launch vehicle. This system will permit fueling late in the countdown and will remain intact until liftoff in event that defueling of the RTG is required before launch (Fig, PP-3),
1, Equipment List
The following equipment will be furnished for the complete system:
SONriDQJTIAL MND-2050-F-f. ... . ..
451 : : •: : •: : .'
• «
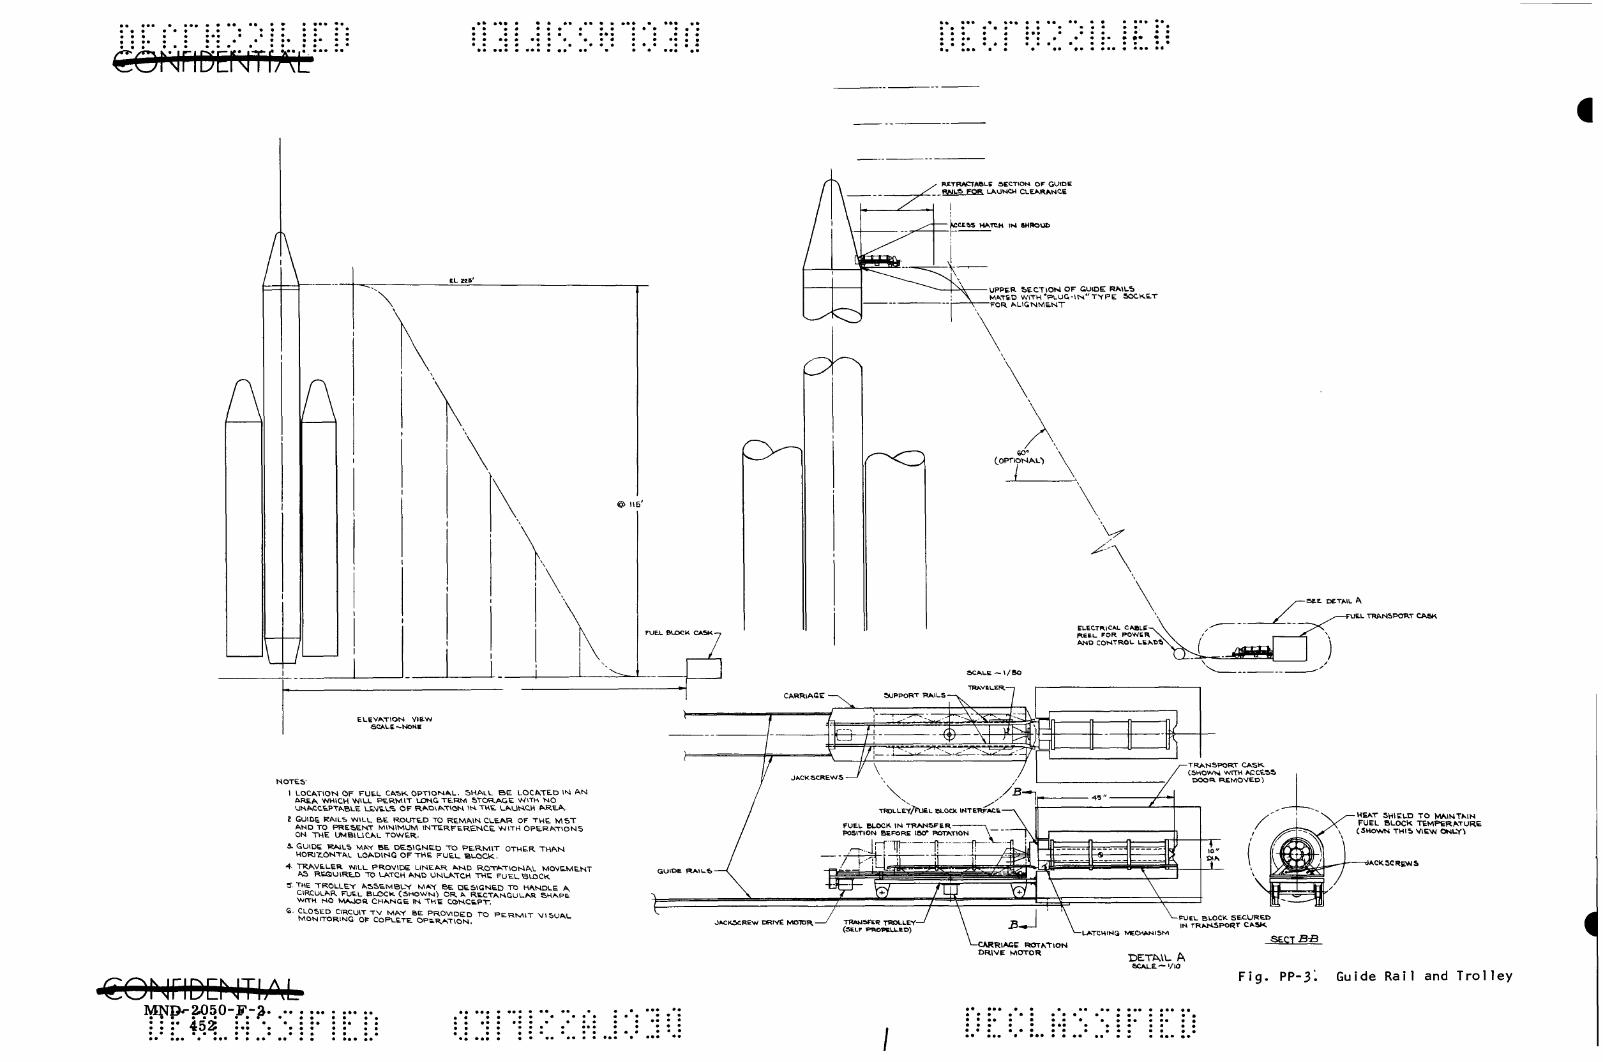
R E T R A C T A B L S aCCTIOH OF GUIDB RMLa FOR LAUNCH CLEARANCE
CLSS HATCH IN SHBOOt>
UPPER S E C T I O N O F G U I D E R A I L I , MATED W 1 T H * P L U G - 1 N " T V P E S O C K E T FOR A L I G N M E N T
ELECTRICAL CABLE REEL FOR POWER AND CONTROL LtAtiST
SCALE ~ l / S O
TRAVtLER-
SE.E. DETAIL A
lEL TRANSPORT CASK
N O T E S '
1 L O C A T I O N O F F U E L CASK O P T I O N A L . S H A L L B E L O C A T E D I N A N A R E A W H I C H WILL P E R M I T LONG T E R M S T O R A G E W I T H N O UMACCEPTABLE LEVEL'S O F R A D I A T I O N I N T H E L A U N C H A R E A .
2 GUIDE RAILS W I L L B E R O U T E D TO R E M A I N C L E A R OF T H E M S T A N D TO P R E S E N T M I N I M U M I N T E R F E R E N C E . W I T H O P E . B A T I O N S ON T H E U M B I U C A L T O W E R .
i . GUIDE R A I L S MAT B E D E S I G N E D T O P E R M I T O T H E R T H A N HORl 'Z .DNTAL L O A D I N G O F T H E F U E L B L O C K .
•4. T R A V E L E R WILL P R O V I D E L I N E A R A N D R O T A T I O N A L M O V t M E N T AS R E f f l U l R t D "TO LATCH A N D U N L A T C H T H E F U E L B L O C K
5. THE T R O L L E Y A 5 S E M B L V M A Y B E D E S I G N E D T13 H A N D L E A CIRCULAR FUEL BLOCK. CSHOWM^ O R A R t C T A M G U L A R S H A P E WITH N O M A J O R C H A N G E I N T H E C O N C E P T ,
S. CLOSED CIRCUIT T V M A Y BE P R O V I D E D T O P E R M I T V I S U A L M O N I T O R I N G OF COPLETE. O P t R A T I O N .
GUIDE R A I L S
T R A N S P O R T C A S K (SHOWN WITH ACCESS
DOOR F IEMOVED)
FUEL BLOCK I N T R A N S F E R POSITION B E F O R E ISO" R O T A T I O N
-« -^^^ ; 31
HEAT S H I E L D T O M A I N T A I N FUEL B L O C K T E M P E R A T U R E
\ ( S H O W N T H I S V I E W ONUY^
lACK SCREWS
LATCHING MECHANISM
FUEL BLOCK S E C U R E D IN TRANSPORT C A S K
IRIACE R O T A T I O N D R I V E M O T O R DETWL A
SCALE—1/10
gOMriDENThM WP-2.Q50-F-^.
:• 452
SE.CTB:B
Fig. PP-3". Guide Rail and Trolley
• • •
(1) Transportation cask (ICC regulations)
(2) Cask cooling system
(3) Guide rail assembly
(4) Cask support structure at launch site
(5) Hoist to remove cask cover
(6) Trolley assembly
(7) Power and control cable reel assembly
(8) Closed circuit TV installation
(9) Retract mechanism for upper section of rails
(10) Remote control panel and instriunentation,
2. Launch Complex Modifications
The following additions or modifications to the launch complex will be required to accommodate this concept:
(1) Installation of a pad and structure to support the fuel block transport cask for long-term storage. Location will be in an area which will not interfere with normal launch preparations.
(2) Installation of a rail system leading from the cask support structure to the RTG in its position on the launch vehicle. The upper section of the rail will be movable to provide vehicle clearance at launch. The rails will be routed to remain clear of the MST. The upper end of the rails will be supported by the umbilical tower where a flexible section will be employed to accomplish compliance with the RTG.
(3) A retract mechanism will be installed on either the umbilical mast or the umbilical tower. The mechanism will be tr iggered immediately prior to ignition of Stage 0 to cause the section of rail adjacent to the payload to be retracted,
(4) A control and instrumentation console will be added to the launch control center for remote operation and monitoring of the system. The system will be interconnected by land-line.
MND-2050-F-2 453 ••• • *•• • •• •• • • • ••• _•
« a • « • • • » • • • * * • • • • • « • • « • • • • • • * • • • • « • • » • • » * » • • • • • • • • • • • • • • • • • » •• « • • • • • • • ••* •
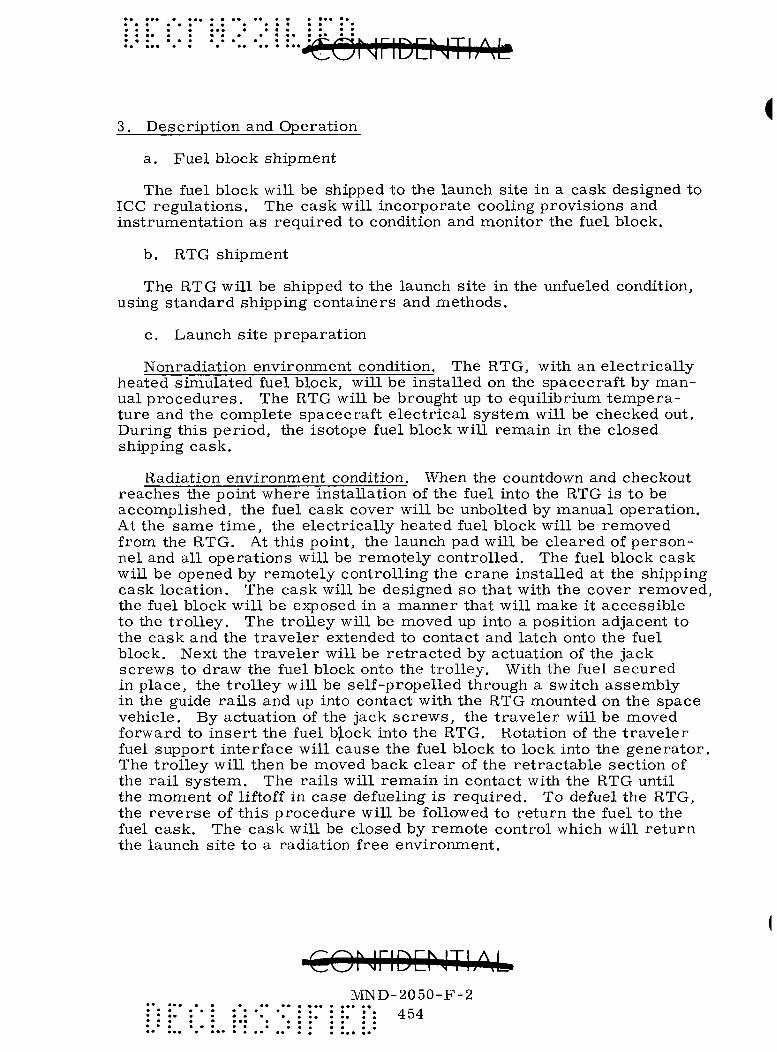
3, Description and Operation
a. Fuel block shipment
The fuel block will be shipped to the launch site in a cask designed to ICC regulations. The cask will incorporate cooling provisions and instrumentation as required to condition and monitor the fuel block.
b. RTG shipment
The RTG will be shipped to the launch site in the unfueled condition, using standard shipping containers and methods,
c. Launch site preparation
Nonradiation environment condition. The RTG, with an electrically heated simulated fuel block, will be installed on the spacecraft by manual procedures. The RTG will be brought up to equilibrium, temperature and the complete spacecraft electrical system will be checked out. During this period, the isotope fuel block will remain in the closed shipping cask.
Radiation environment condition. When the countdown and checkout reaches the point where installation of the fuel into the RTG is to be accomplished, the fuel cask cover will be unbolted by manual operation. At the same time, the electrically heated fuel block will be removed from the RTG. At this point, the launch pad will be cleared of personnel and all operations will be remotely controlled. The fuel block cask will be opened by remotely controlling the crane installed at the shipping cask location. The cask will be designed so that with the cover removed, the fuel block will be exposed in a manner that will make it accessible to the trolley. The trolley will be moved up into a position adjacent to the cask and the traveler extended to contact and latch onto the fuel block. Next the traveler will be retracted by actuation of the jack screws to draw the fuel block onto the trolley. With the fuel secured in place, the trolley will be self-propelled through a switch assembly in the guide rails and up into contact with the RTG mounted on the space vehicle. By actuation of the jack screws, the traveler will be moved forward to insert the fuel b|.ock into the RTG, Rotation of the traveler fuel support interface will cause the fuel block to lock into the generator. The trolley will then be moved back clear of the retractable section of the rail system. The rails will remain in contact with the RTG until the moment of liftoff in case defueling is required. To defuel the RTG, the reverse of this procedure will be followed to return the fuel to the fuel cask. The cask will be closed by remote control which will return the launch site to a radiation free environment.
COMriDCnTIOiL. MND-2050-F-2
:. : :. : : 454

d. Heater block installation
At any time after initial heatup at the launch site, the RTG will r e main at temperature by means of electrical heaters when the fuel block is not installed. The electrical heaters will be manually installed and removed as required.
D. ERECTABLE TOWER, SITE INDEPENDENT, FUEL BLOCK LOADING
This concept utilizes a transportable tower with the fuel block t ransfer device mounted on top. The tower which includes an elevator and erecting winches was adapted from, the Bucyrus-Erie Mark 1-50 tower crane (Fig. PP-4) .
1, Equipment List
The following is the equipment list required for this concept:
(1) Movable tower
(2) Shipping cask
(3) Fuel block loading device
(4) Cooling air system
(5) Cask dolly
(6) Slings and special tools.
2, Launch Complex Modifications
No modifications are required at the launch complex assuming that sufficient access is available on the launch pad to accommodate the erectable tower,
3, Description and Operation
a. Fuel block shipment
The fuel block will be shipped to the launch site in a cask which has a removable top plug. The cask will be designed for ICC regulations and will also serve as the transfer cask in the loading device.
CQhiriDEhlThAl MND-2050-F-2
455

» •• • • :-ei(J)HriD:MTI;M.
Fig, PP-4. Erectable Towei—Site Independent
CONriDCNTIAL' MND-2050-F-2
456

b. RTG shipment
The RTG will be shipped to the launch site in a normal shipping manner,
c. Launch site preparation and operation
The fuel loading preparation will begin with rolling the tower up to the launch pad and erecting it to a vertical position using its built-in winch system. The cask will be installed on the tower platform at the base of the tower. The transfer boom will be erected with the actuator and manually aligned with the space vehicle. Positioning fingers will be inserted into the space vehicle opening and will serve to maintain alignment between the space vehicle and the loading boom. An inverted cradle is mounted on the transfer boom and guide cables pass from the cradle to the cask. The cables pass through guide blocks on the cask lid, A hoist cable is attached to the cask lid which raises the lid and fuel block up the guide cables and into the inverted cradle at the end of the transfer boom, A track-mounted carriage with a mandrel attached to the forward end is positioned behind the fuel block cradle. The ca r r i age moves the mandrel into the fuel block, picks it up and carr ies it to the RTG. A door latch mechanism locks the fuel block into the RTG by applying pressure until the door-type latches on the RTG lock in place. The carriage is retracted to the stowed position. The positioning fingers at the end of the boom are remotely retracted and the boom folded to a down position.
Fuel unloading can be accomplished in the event of an aborted launch. The boom is erected to a horizontal position by the actuator. The positioning fingers are inserted remotely into the space vehicle to align the boom with the RTG. The carriage is moved along the track until the mandrel is inserted into the fuel block. Fingers on the mandrel lock onto the fuel block while other fingers on the mandrel unlatch the fuel block. The carriage is reversed and moves the fuel block back to the cask lid. The fuel block is unlatched from the mandrel and the carriage continues back to a stowed position, A hoist lowers the cask lid with the fuel block along the guide cables to the cask at the base of the tower.
During launch the only nuclear ground handling equipment attached to the space vehicle might be a lanyard attached to the loading hatch. The hatch will be spring loaded and will be closed by the liftoff motion, pulling a pin which holds the hatch open. Another method which would eliminate the lanyard would be an over center spring which would rely on wind load during liftoff to close the hatch. This method is similar to that used to close the air conditioning hatch on the Gemini launch vehicle during liftoff.
I
COhjriDEMThA.L MND-2050-:^-2£ ; *:.•
457 : : : : :
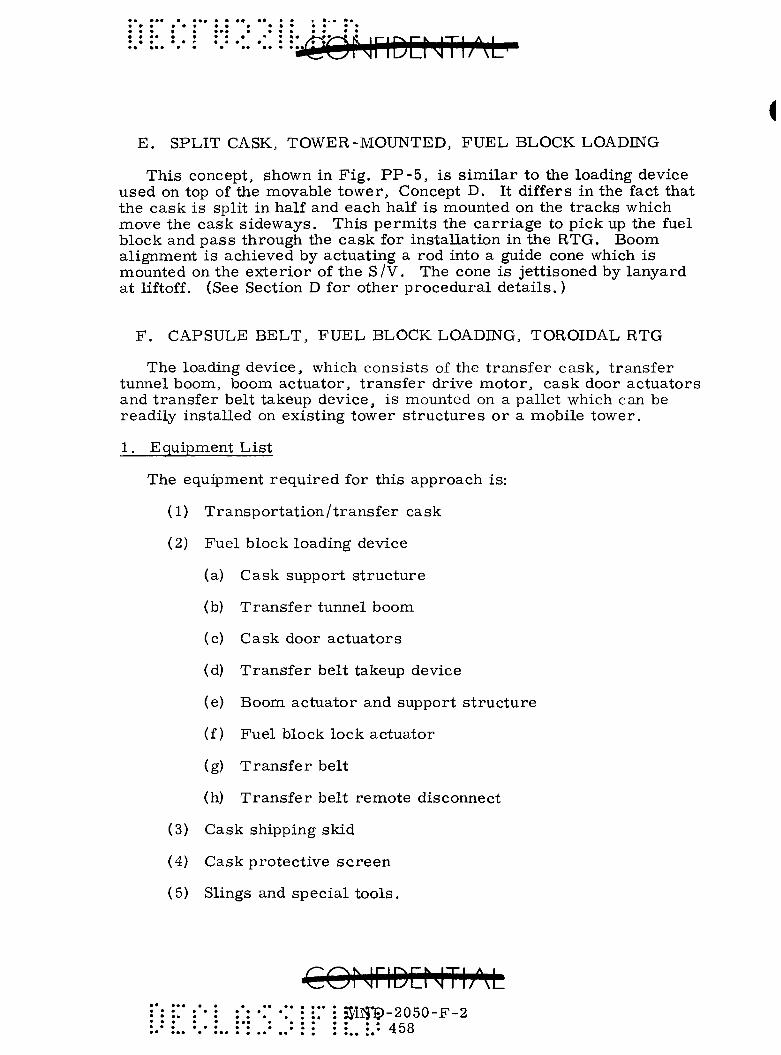
E, SPLIT CASK, TOWER-MOUNTED, FUEL BLOCK LOADING
This concept, shown in Fig. P P - 5 , is similar to the loading device used on top of the movable tower. Concept D, It differs in the fact that the cask is split in half and each half is mounted on the tracks which move the cask sideways. This permits the carriage to pick up the fuel block and pass through the cask for installation in the RTG, Boom alignment is achieved by actuating a rod into a guide cone which is mounted on the exterior of the S/V, The cone is jettisoned by lanyard at liftoff, (See Section D for other procedural details,)
F, CAPSULE BELT, FUEL BLOCK LOADING, TOROIDAL RTG
The loading device, which consists of the transfer cask, transfer tunnel boom, boom actuator, transfer drive motor, cask door actuators and transfer belt takeup device, is mounted on a pallet which can be readily installed on existing tower structures or a mobile tower.
1. Equipment List
The equipment required for this approach is:
(1) Transportation/transfer cask
(2) Fuel block loading device
(a) Cask support structure
(b) Transfer tunnel boom
(c) Cask door actuators
(d) Transfer belt takeup device
(e) Boom actuator and support structure
(f) Fuel block lock actuator
(g) Transfer belt
(h) Transfer belt renaote disconnect
(3) Cask shipping skid
(4) Cask protective screen
(5) Slings and special tools.
•CONnDEMThM 3JIirp-2050-F-2 :.. i:- 458

UMBIUCAL TOWER
2 o I
oi o CD ^
O
g
:f
« .
TITAN nr C STD. FAIRING
$
^ 7
«
Fig. PP-5. Tower Mounted Split Cask
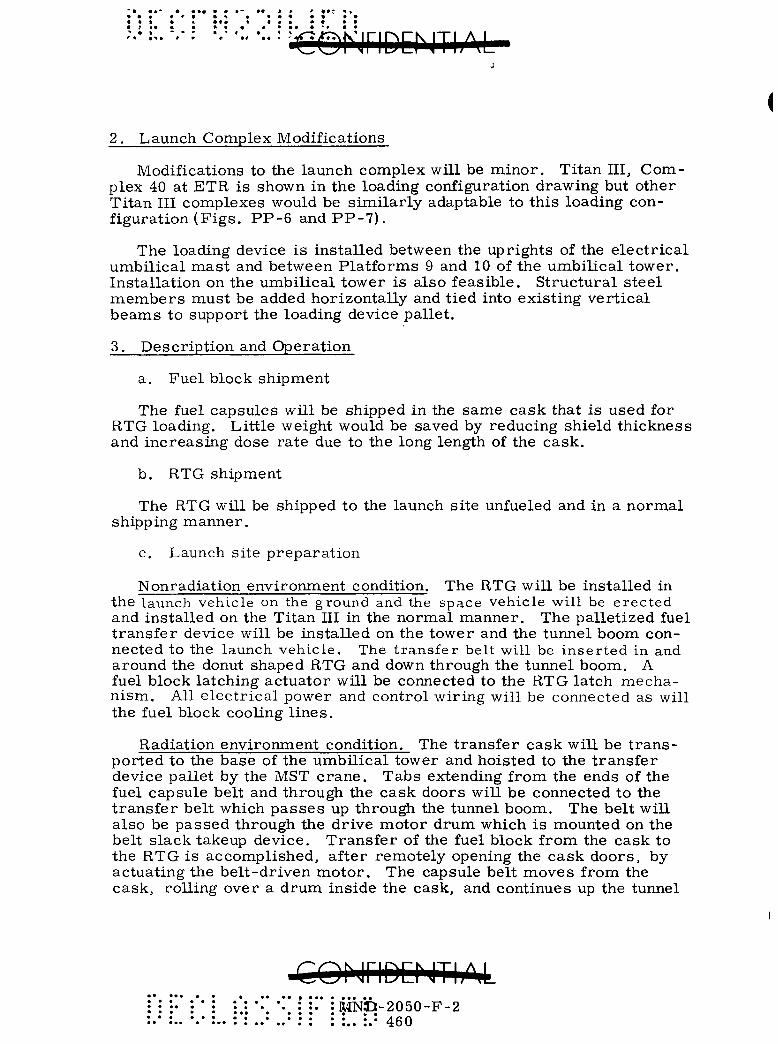
2. Launch Complex Modifications
(
Modifications to the launch complex will be minor. Titan III, Complex 40 at ETR is shown in the loading configuration drawing but other Titan HI complexes would be similarly adaptable to this loading configuration (Figs. PP-6 andPP-7) .
The loading device is installed between the uprights of the electrical umbilical mast and between Platforms 9 and 10 of the umbilical tower. Installation on the umbilical tower is also feasible. Structural steel members must be added horizontally and tied into existing vertical beams to support the loading device pallet,
3, Description and Operation
a. Fuel block shipment
The fuel capsules will be shipped in the same cask that is used for RTG loading. Little weight would be saved by reducing shield thickness and increasing dose rate due to the long length of the cask,
b. RTG shipment
The RTG will be shipped to the launch site unfueled and in a normal shipping manner,
c. Launch site preparation
Nonradiation environment condition. The RTG will be installed in the launch vehicle on the ground and the space vehicle will be erected and installed on the Titan III in the normal manner. The palletized fuel transfer device will be installed on the tower and the tunnel boom connected to the launch vehicle. The transfer belt will be inserted in and around the donut shaped RTG and down through the tunnel boom. A fuel block latching actuator will be connected to the RTG latch mechanism. All electrical power and control wiring will be connected as will the fuel block cooling lines.
Radiation environment condition. The transfer cask will be t ransported to the base of the umbilical tower and hoisted to the transfer device pallet by the MST crane. Tabs extending from the ends of the fuel capsule belt and through the cask doors will be connected to the transfer belt which passes up through the tunnel boom. The belt will also be passed through the drive motor drum which is mounted on the belt slack takeup device. Transfer of the fuel block from the cask to the RTG is accomplished, after remotely opening the cask doors, by actuating the belt-driven motor. The capsule belt moves from the cask, rolling over a drum inside the cask, and continues up the tunnel
[ \ I" : M N O - 2 0 5 0 - F - 2 • : : : :.. :.*• 460

1—
a:
O
O
0)
CO
3 Q.
(0 O
vO
a. OI
csi
_ in
CD
•
Q
'
a;
• •••
• ••• •
• • •
* • •••
• • •
• •
• • «
• • •
......
• • •
• •••
• •• •
« •
• • •
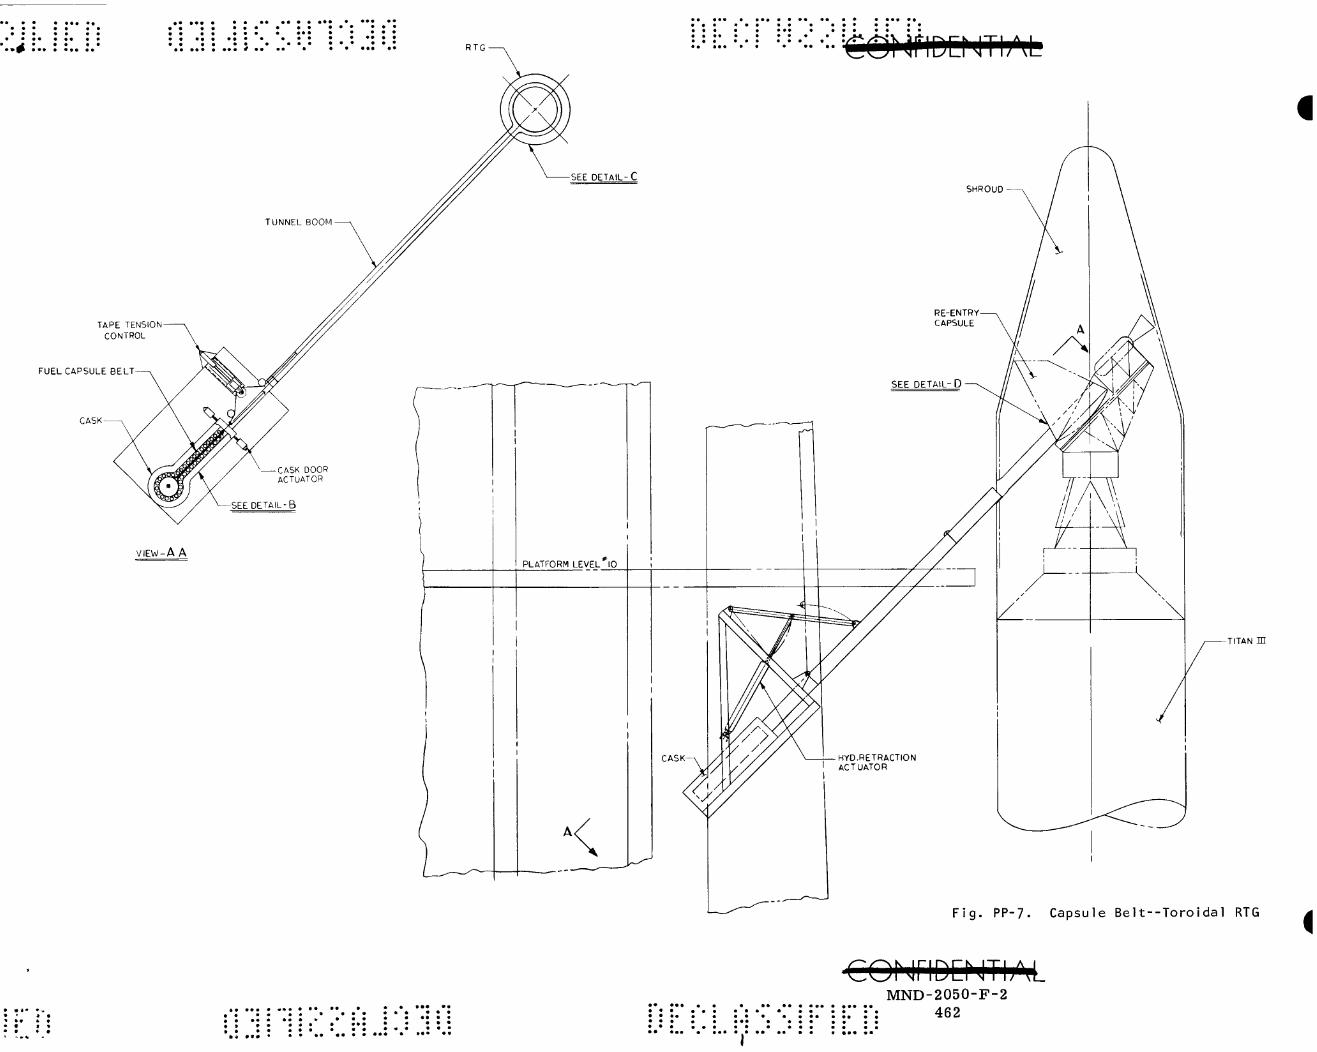
TAPE TENSION CONTROL
FUEL CAPSULE BELT
CASK
• • • • •
CaiWDEMThM
TITAN HI
F i g . PP-7. Capsule Be1 t - -To ro ida l RTG i
CONriDCNTIAL MND-2050-F-2
• • • • ••• • • • •• •• • ••• • ••• • • • • • • • • • • • • • • • • • • • • « • • • • • • • • • • • ••• • • • • • • • • • • • • • • • • • • • • ••• • ••• • • • • • • • • • •••
462
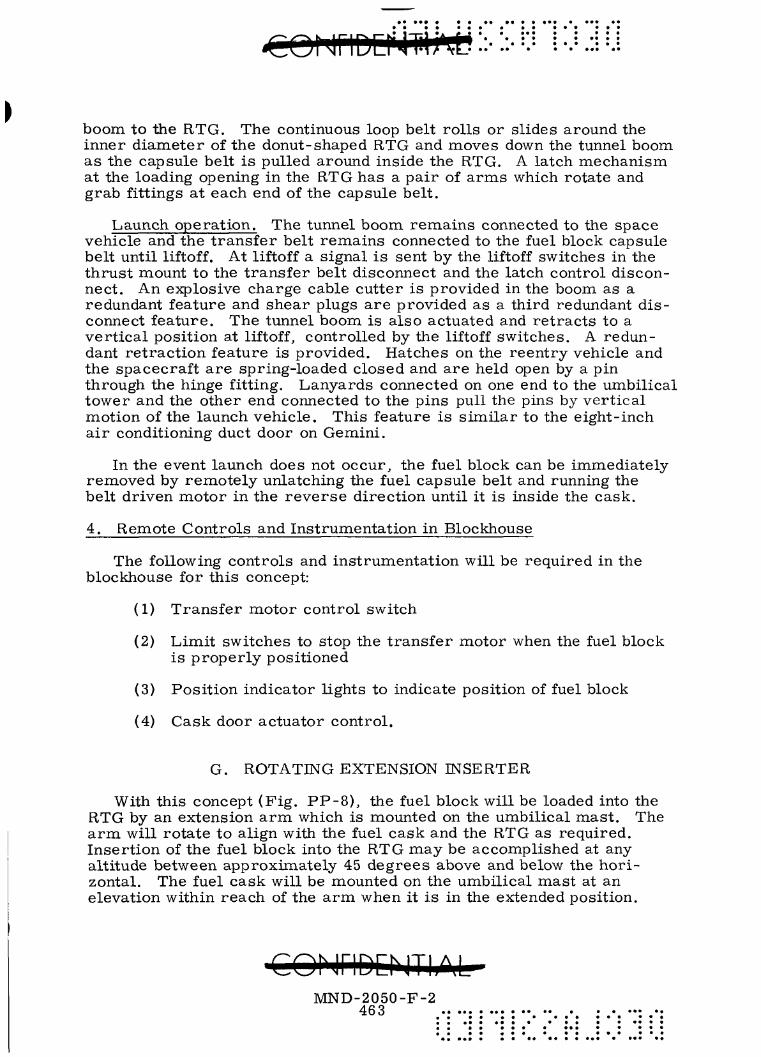
^ONnDCNli|>
boom to the RTG. The continuous loop belt rolls or slides around the inner diam.eter of the donut-shaped RTG and moves down the tunnel boom as the capsule belt is pulled around inside the RTG. A latch mechanism at the loading opening in the RTG has a pair of arms which rotate and grab fittings at each end of the capsule belt.
Launch operation. The tunnel boom remains connected to the space vehicle and the transfer belt remains connected to the fuel block capsule belt until liftoff. At liftoff a signal is sent by the liftoff switches in the thrust mount to the transfer belt disconnect and the latch control disconnect. An explosive charge cable cutter is provided in the boom as a redundant feature and shear plugs are provided as a third redundant disconnect feature. The tunnel boom is also actuated and retracts to a vertical position at liftoff, controlled by the liftoff switches. A redundant retraction feature is provided. Hatches on the reentry vehicle and the spacecraft are spring-loaded closed and are held open by a pin through the hinge fitting. Lanyards connected on one end to the umbilical tower and the other end connected to the pins pull the pins by vertical motion of the launch vehicle. This feature is similar to the eight-inch air conditioning duct door on Gemini.
In the event launch does not occur, the fuel block can be immediately removed by remotely unlatching the fuel capsule belt and running the belt driven motor in the reverse direction until it is inside the cask.
4. Remote Controls and Instrumentation in Blockhouse
The following controls and instrumentation will be required in the blockhouse for this concept:
(1) Transfer motor control switch
(2) Limit switches to stop the transfer motor when the fuel block is properly positioned
(3) Position indicator lights to indicate position of fuel block
(4) Cask door actuator control.
G. ROTATING EXTENSION INSERTER
With this concept (Fig. PP-8), the fuel block will be loaded into the RTG by an extension a rm which is mounted on the umbilical mast. The arm will rotate to align with the fuel cask and the RTG as required. Insertion of the fuel block into the RTG may be accomplished at any altitude between approximately 45 degrees above and below the horizontal. The fuel cask will be mounted on the umbilical mast at an elevation within reach of the arm when it is in the extended position.
COMriDCMTIAL MND-2050-F-2
463
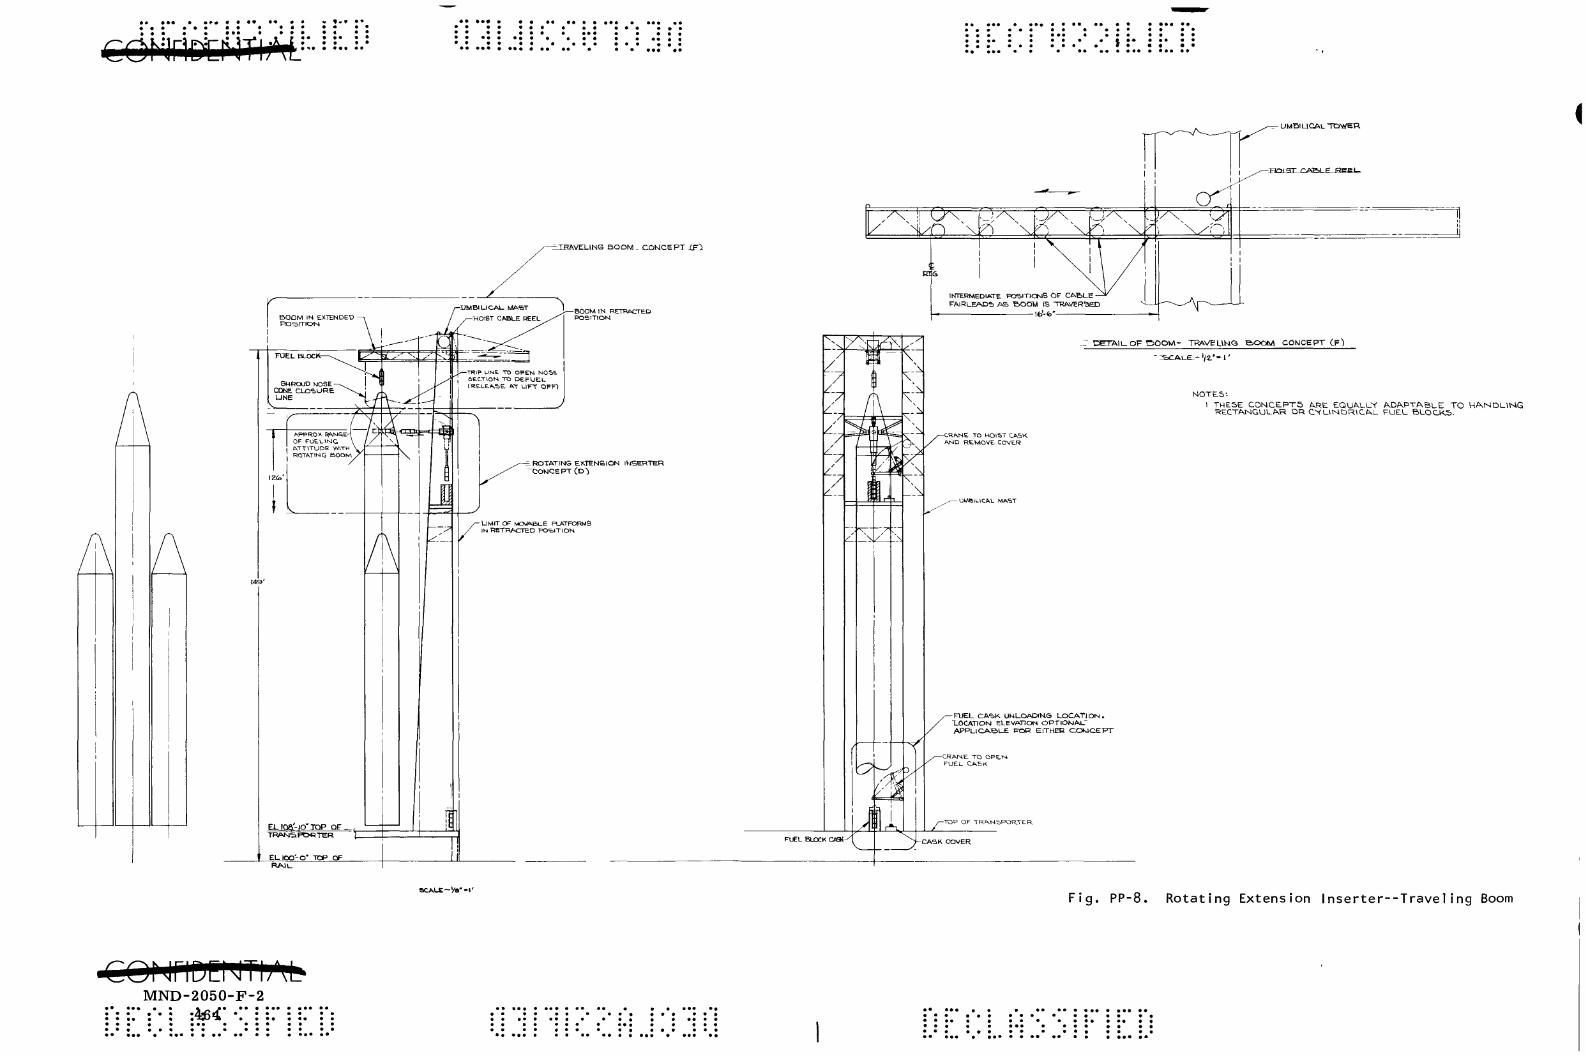
• • • COfinPtNTLM. • • ••
fJIRAVELIKG BOOM_ CONCEPT XFi
e_ ROTATING EXTENSION IMSERTER
aCA,LE~Vs"-l'
MND-2050-F-2 t » • •
:^<' •;•
- UMW LICAL "TDY/ER
^'jAp y\^ \ in \)C' '^t \7
INTCRMEDIATE POSITIOJS OF CAE>L_E FAIRLEADS AS BOOM \S TR/VVERaED
4t— l«^i
FUEL BUXK C*a«-
y
DgTA. l l -QF P Q O M - TRAVELJMO e>OQM CONCEPT CF")
-CR^NE TO HOIST CASK. WslD REMOVE COVLR
-UMBILICAL MiN-iT
-FUEL CA'oK UNLOAOIHG LOCATION. "LOCATION ELEVATION OPTIOMAU APPLICABLE POR EITHER CIOKICEFT
-CRWNIE: TO OPE.M FUEL CA,SK
1 THESE CONCEPTS ^RE EQUALLY ADAPTABLE TO H/\NDL\NG RECTAMGUL/\R OR CVHMDR\C^U FUEL BLOCKS-
-TOP OF TRfW^SPORJER
-CASK COVER
Fig. PP-8. Rotating Extension Insertei—Traveling Boom

1. Equipment List
Included in the equipment that will be needed for this concept are:
Transportation cask (ICC regulations)
Cask support structure installed on the urabilical mast
Cask cover removal crane
Rotating extension inserter
Shroud access door opening mechanism
Fuel cask handling sling
Rotating extension inserter support structure
Control and instrumentation console
Closed circuit TV installation
Fuel block shipping cask cooling system.
2. Launch Complex Modification
A support structure for the fuel block shipping cask will be installed between the uprights of the electrical umbilical mast. The structure will be at an elevation which will place the fuel block within reach of the inserter arm.
A remotely operated cask cover removal crane will be installed on the umbilical mast. Also, a suitable cover storage support will be installed as required.
A fuel block inserter arm, drive mechanism and support structure will be installed between the umbilical mast uprights at an elevation suitable to permit alignment of the fuel block with the RTG.
A control console and instrumentation will be installed in the launch control center for remote operation of the fueling concept equipment. Connecting power and instrumentation lines shall be installed between the control console and remote equipments of the system.
(1)
(2)
(3)
(4)
(5)
(6)
(7)
(8)
(9)
(10)
COrjriDDJThM MND-2050-F-2
465 * • • • • • « • • • « • • . • « • • • • • « • • • • • » « • • • •
• • • • • • ••• • • • *
3. Descript ion and Operation (
a. Fue l block shipment and s torage
The fuel block will be shipped to the launch complex in i ts shipping cask, using commerc i a l t ranspor ta t ion methods . The required conditioning and monitoring equipment will be designed as an integral pa r t of the cask assembly . The cask will also be used to s tore the fuel at the launch s i t e .
b . RTG shipment
The RTG, in the unfueled condition, will be shipped to the launch si te using commerc i a l t ranspor ta t ion methods .
c . Launch si te prepara t ion
Nonradiation environment. The RTG will be installed on the space craft and erec ted on the launch vehicle. All sys tems will be checked out using power from the e lect r ica l ly heated RTG. The fuel block and cask will be hoisted to the support s t ruc tu re on the umbilical mas t at any convenient t ime in the countdown. The cask shall be designed to maintain the radiation level to within to lerable l imits in the inhabited regions of the launch pad so that r e s t r i c t i ons on exposure t ime will not be requ i red . When launch prepara t ions reach the point where fueling of the RTG is to be accomplished, the e lec t r i ca l hea t e r s will be r e moved from the RTG, the fuel cask cover manually unfastened from the cask, and the pad evacuated.
Radiation environment. The cover of the cask will be removed and set as ide by use of the remotely operated crane installed on the umbil ical m a s t . The i n se r t e r a r m will be rotated to align with the fuel block and then extended to contact and latch onto the fuel block. Both l inear and rotat ional motion may be t ransmi t ted by the attaching mechanism to ensure a posit ive lock with the fuel. The in se r t e r will be r e t r ac ted to withdraw the fuel block from the cask and then rotated to align the fuel with the RTG. A universa l - type joint and actuator, combined with the extension and rotation of the i n s e r t e r , will provide the compliance r e quired between the fuel block and RTG during loading. The fuel will be inse r ted into the RTG and locked in place by the fuel handling mechanism. The inse r t e r will r emain in contact with the fuel block until the raoment of ignition when a signal will be t ransmi t ted to r e t r a c t . A lanyard will be used to close and latch the shroud access opening which in turn is linked to the RTG access opening which will cause it to c lose . The lanyard will fall away after completing i ts operation.
Defueling operat ion. In the event defueling is required, the fuel handling mechanism on the i n se r t e r , which is st i l l in contact with the fuel block, will be actuated to lock onto the fuel block and cause it to
MND-2050-F-2 I :• : i 466

^^Hm^mmt'•••••••'••
release from the RTG. The inserter arm will be retracted to withdraw the fuel block clear of the shroud, rotated to align with the fuel cask and extended to insert the fuel in the cask and latch it in place. Then, with the inserter retracted and rotated aside, the cask cover will be repositioned on the cask by the remotely operated crane, returning the launch site to a radiation-free condition.
H. TRAVELING BOOM, VERTICAL FUEL BLOCK LOADING
This concept proposes a traveling boom and hoist assembly to accomplish vertical loading of the fuel block through the nose section of the shroud. The fuel will remain in its shipping cask located on the transporter at the base of the umbilical mast until fueling operations begin. A remotely operated crane will be used to remove the shipping cask cover. The traversing boom will be retracted to align the hoist cable with the fuel block in the cask. A latching mechanism will be lowered into the cask to attach to the fuel block. The fuel will be hoisted to the boom elevation, and the boom will be extended to align the fuel block with the RTG. The fuel will be lowered into the RTG and the latching m.echanism triggered to lock the fuel block in place. The boom will be retracted to provide clearance for launch.
1. Equipnaent List
The following equipment will be furnished for the complete system:
(1) Transportation cask (ICC regulations)
(2) Cask cooling system
(3) Remotely operated crane to remove cask cover
(4) Traversing boom assembly
(5) Electrically driven cable hoist
(6) Closed circuit TV installation mounted on boom for visual monitoring
(7) Remote control panel and instrumentation
(8) Umbilical cable to close shroud after fueling the RTG
(9) Umbilical cable to release shroud nose access opening by r e mote operation in event defueling is required.
CONriDEhJThM MND-2050-F-2

2. Launch Complex Modifications (
The following additions or modifications to the launch complex will be requi red to accommodate this concept.
(1) Installation of a boom and t r ave r s ing drive at the upper end of the umbil ical naast. The installat ion will include adjustable support cables and driven r ee l s to maintain the boom attitude as it moves .
(2) A remote ly controlled hoist will be installed within the upper c ross m e m b e r s t ruc tu re of the umbil ical mas t to r a i se and lower the fuel block.
(3) A support interface will be installed on the t r anspo r t e r to mount the fuel shipping cask and associa ted equipment.
(4) A control and instrumentat ion console will be added in the launch control center for remote operation and monitoring.
3. Descript ion and Operation
a. Fue l block shipment
The fuel block will be shipped to the launch site in a shielded cask designed to ICC regula t ions . The cask will incorporate cooling p rov i sions and instrumentat ion as required to condition and monitor the fuel block.
b . RTG shipment
The RTG will be shipped to the launch site in the unfueled condition, using s tandard shipping containers and methods.
c. Launch si te prepara t ion
Nonradiation environment condition. The RTG, with an e lect r ica l ly heated simulated fuel block, will be instal led on the spacecraft . The RTG will be brought up to equil ibrium t empera tu re and the complete spacecraft e lec t r i ca l sys tem checked out using RTG-supplied power. The isotope fuel block will r emain closed in i ts shipping cask. The cask will be designed to lim.it the radiation field to within the tolerance acceptable for personnel to work in the a rea for unlimited per iods of t ime .
Radiation environment condition. When the countdown and checkout reaches the point where instal lat ion of the fuel into the RTG is to be accomplished, the fuel cask cover will be unbolted by manual operation and the e lec t r ica l ly heated fuel block will be removed from the RTG. The pad will be c l ea red of a l l personnel and al l operat ions will be con-
CONriDDJTIAL'. .. *.. . . . ,. .. ..-MN.D«-2050-F-2 k > » . » ) . . » i a « 0 * • » ( • t t. mt > • » « m « • « • • • « * *A C O • • > • • • ! • > » « J» * • < " T T D O
• • • • • • • • • • • • • • • • • • • « • •
t rol led from the launch center from this point on. The fuel block cask cover will be removed by the remote ly controlled crane mounted on the ve r t i ca l support of the umbil ical m a s t . With the t ravel ing boom in the r e t r ac ted position, the hoist cable will be in line with the fuel block. A mechanism which interfaces with the fuel block latching device will be attached to the end of the cable. By lowering the cable, the mechanism will lock onto the fuel block and at the same t ime cause it to r e lease from the fuel cask. The fuel block will be hoisted to the requ i red elevation to allow the boom to be extended to a position where the fuel block is in line with the RTG. By paying out the cable, the fuel will be lowered into the RTG where it will be latched into p lace . A cable attached to the shroud nose section will be used to pull the nose section to the closed position. A mechanical link between the shroud and the reen t ry body nose cap will cause the r een t ry body to be closed and latched by the same cable movement.
Defueling operation. To defuel the RTG, the shroud and r e e n t r y body are opened for access by actuation of a lanyard connected to an unlatching device on the shroud. This will also r e l ea se a spring which will cause movement to the open position. The boom will be t r a v e r s e d to the extend position and the fuel block handling mechanism lowered into the RTG and attached to the fuel block. The fuel will be hoisted c lear of the shroud, the boom re t r ac t ed and the fuel lowered into the fuel cask. The cask cover will be replaced by remote operat ion.
I. SILO LAUNCH CONCEPT
Under this concept, e i ther the fuel block may be loaded into the RTG or the fueled RTG may be loaded into the launch vehicle. It is also possible to accomplish horizontal or ver t i ca l loading, A hot cell which connects direct ly into the silo will be constructed under the crane hards tand. Alongside the hot cell , a control room will be constructed. Manipulat o r s , instrumentat ion and monitoring equipment will be connected b e tween the control room and hot cel l . The hot cell will incorporate moving mechanisms to extend into the s i lo to accomplish the loading. The concept is shown in F ig . P P - 9 .
1. Equipment Lis t
The equipment necessa ry to this type of operation is as follows:
(1) Transpor ta t ion cask (ICC regulations)
(2) Fuel block conditioning equipment
(3) Overhead travel ing crane
COhiriDChJTIAL .J,
MND-2050:-F'-2 ••' : . * . " : : : * : . : : :
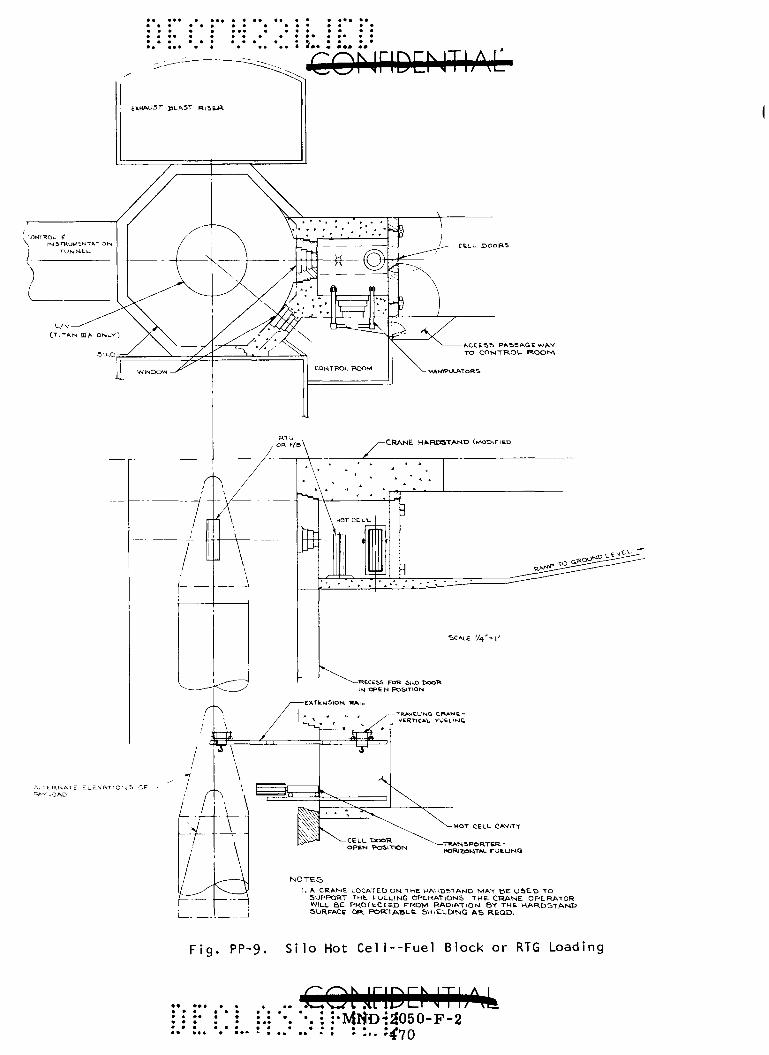
••• « ••»
COhiriDChlTIAL
MOT CELL CAVITY
TRANSPORTER " HORaZDhiT L FOtUNQ
I. K CRAME LOCATED ON THE HAV^DST^ND MAT BE OSE-D TO SUPPORT THE rOElLlNG OPERATIONS THE CRANE OPERATOR WILL BE PROTECTED FROM RADlATiOM BT THE HARDSTANP SURFACE OR P O R T A B L E : S H I E L D I N G A S REQD.
F i g . PP"9. S i l o Hot C e l l - - F u e l Block or RTG Loading
•• • • • ^ •• •
•CQLiriDCNTIj ^ :.: '•. *•. : ••MliD-:2050-F-2 • • " ' ••* • ' ' '"• '410

(4) Remotely operated manipulators
(5) Control console
(6) RTG checkout instrumentation
(7) Special handling fixtures and tools.
2. Launch Complex Modifications
Construction of a complete isotope handling hot cell adjacent to the silo which will include entrance doors on the roadway access side and a door entering into the silo will be required. An overhead traveling crane and/or vertical loading trolley and track at floor level, manipulators and other required accessories will be installed as a part of the hot cell.
Construction of a control room adjacent to the hot cell with visual access to the hot cell and the silo will have to be conapleted. Control console, instrunaentation, checkout panel, environmental control equipment, and required safety features will be included in the control room installation.
An access road into the hot cell and access passageway to the control room will be provided.
Hardline connections between hot cell, control room, silo and the launch control center will be installed as required to monitor the complete fuel handling concept,
3. Description and Operation
a. Fuel block shipment
The fuel block will be shipped to the hot cell in its transportation cask. The design of the cask will perm.it use of commercial handling methods for shipment. The cask will also be suitable for storage of the fuel block outside of the hot cell at the launch site if this will aid in launch preparations,
b, RTG shipment
The unfueled RTG will be shipped using standard commercial containers and transportation methods necessary for this type of equipment.
eorjriDENTLM MND-2050-F-2
471.- ••• • ••• • •• •• • • • • • « • • • • • • • • • • • • • • • •
« • • • • • ••• • • • •
I c. Launch site preparation
(1) Fuel block loading
Nonradiation environment. The RTG will be installed on the spacecraft and the entire system checked out using electrical heaters to simulate the fuel loading. When the checkout is complete, the electric heaters will be removed from the RTG; the fuel cask will be delivered to the hot cell; the cover unfastened manually; the hot cell access door closed and the site prepared for remote operation.
Radiation environment. The fuel cask will be opened by use of the manipulators and overhead crane to expose the fuel block. Again, by use of manipulators and crane in conjunction with a fuel handling mechanism, the fuel block will be attached to the mechanism and removed from the cask. If vertical fuel loading is required, the crane will be moved on tracks that may be extended into the silo to position the fuel over the RTG. Next the fuel will be lowered into the RTG and locked in place. Alignment problems between the units will be at a minimvim with this concept. For horizontal fueling, the fuel block will be t r ans ported by a trolley which will t ravel on tracks that are located across the hot cell floor and will extend into the silo to contact the RTG. Upon completion of fueling, all protrusions into the silo related to the RTG fueling operation will be retracted into the hot cell. The access openings in the RTG reentry body and the shroud will be closed by means of a lanyard that will fall away upon completing its function. The hot cell door connecting to the silo will be closed in preparation for liftoff,
RTG defueling. To defuel the RTG, the access openings in the shroud and reentry body will be opened by a lanyard action which remains attached to the launch vehicle until actual liftoff. The tracks used for travel by the fueling device, crane or trolley will be extended into the silo and aligned with the RTG. Due to the lack of uneven heating of the lavinch vehicle or windage, the alignment problera is at a minimum and the close proximity of the operator in the control room with visual contact with the operations makes remote manipulation of the alignment operation feasible. With the tracks extended and aligned, the fueling device will be moved into position to contact the fuel block lock and cause it to release from the RTG. The fuel will be returned to the hot cell, all extensions into the silo from the hot cell retracted and the cell door closed.
(2) Fueled RTG loading
Nonradiation environment. All checkout of the space vehicle will be completed using external power supplied by the site and matched to the RTG power output which is being monitored in the hot cell. The RTG will have been fueled in the hot cell and brought up to tenaperature without
.COririDPJTIAL' _.. . ...MND.-.2050-F-2 "•. : :• : :* '4V2
creating a radiation hazard in the silo area. The external power will remain connected until the RTG is installed and connected in parallel to avoid power interruption to the spacecraft which may cause an unnecessary repeat of system checkouts. When the RTG is coupled in, the external power will be removed.
Radiation environment. When the spacecraft systems have been checked out on external power, the hot cell door to the silo will be opened and the appropriate tracks extended into the silo for overhead or side loading. The RTG will be picked up in the hot cell and t ransported to the spacecraft where it wHl be installed in the reentry body. Electrical connection between the RTG/RB will be accomplished by r e mote action, and instrumentation will be provided to check and ensure a zero resistance contact. The RTG/RB will be secured to the spacecraft by remote closing of the same system that will be used to release the reentry body in space. The shroud will be closed by lanyard action, remotely controlled, and all extension into the silo from the hot cell will be retracted and the cell door closed.
Defueling procedure. To remove the RTG/RB from the spacecraft, the access through the shroud will be reopened by action of a lanyard and spring system that remains intact until liftoff occurs. The hot cell door will be opened and the equipment used to install the RTG/RB will be repositioned and attached. The mechanism used to release the r e entry body in space will be triggered; also a cable cutter to separate the power and instrumentation leads. The reentry body will be re moved from the spacecraft, returned to the hot cell, the handling mechanisms retracted and the cell door closed to return the silo to a radiation-free condition. A certain amount of refurbishing of those systems actuated to release the reentry body will have to be accomplished to return the system to the configuration required to reinstall the RB.
J . PALLETIZED RETRACTABLE TOWER BOOM WITH FHM MOUNTED ON AIR BEARING DEVICE
Concept J is as shown in Fig. PP-10 for overall configuration and Fig. PP-11 for the details of a typical attachment method between the fuel block and the fuel handling machine.
1. Manufacturing Checks
The fuel block is loaded and verified, as applicable, in hot lab facility.
The RTG, after manufacture, is subjected to the necessary checks to verify conformity with the engineering drawings.
COI JriDEhJTIAL MND-2050-F-2
• • ••• • •• • • •• •* « • • ••• • 4 7S: . : : . : : . • • • : : : • : . : :
«« • • • • • • ••• • • • • '
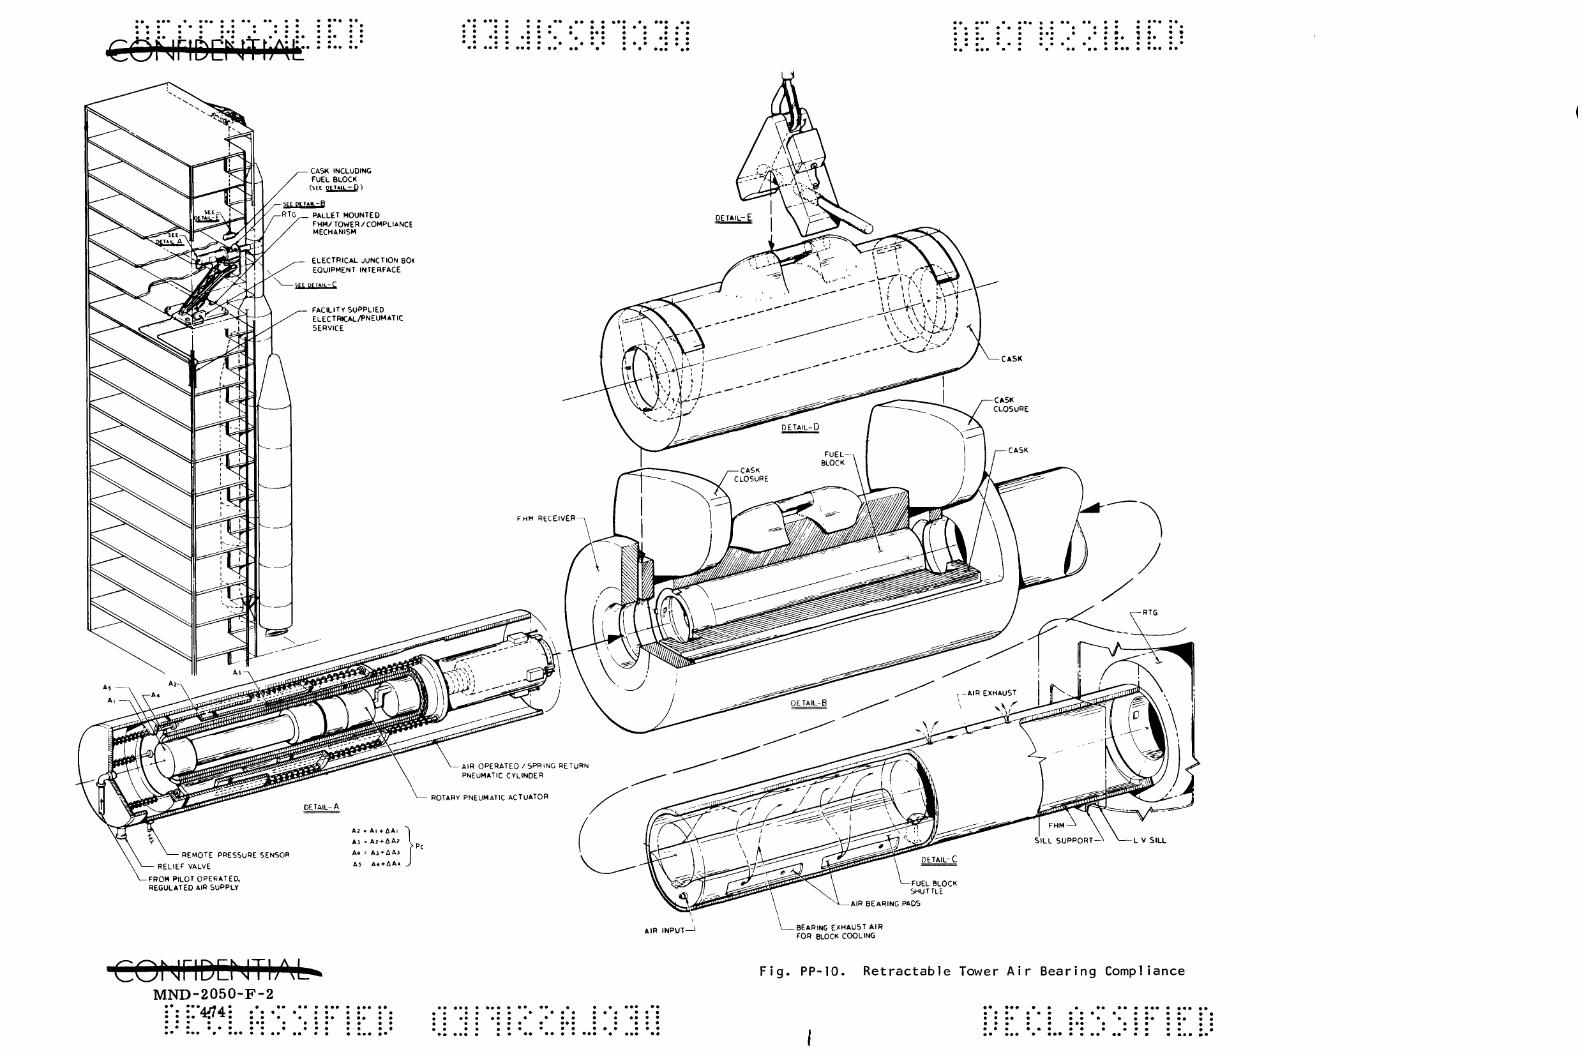
• •• •
C0hh6c>jf[Aij • • • • • • • • • • • • • •• • • • • • • • • • • • • • • • •
-FROM PILOT OPERATED, REGULATED AlR SUPPLY
CQNriDENTbM-MND-2050-F-2
::'4f74 • • • • • • • • • • • • • • • • • • • • • • • • ••• • • • • • • • •
L V SILL
AIR INPUT—^ -BEARING EXHAUST AIR FOR BLOCK COOLING
Fig. PP-10. Retractable Tower Air Bearing Compliance
* •• • •

• « • • • • • • • • •
• • • • ••• • • • • •
LINK ACTUATOR-BALL RETRACTED
MICRO SWITCH (•ED/UNLOCK)
(•"Ut)
FUEL BLOCK(REAR)
FIGURE-I
f H M / F U E L BLOCK LOCK MECHANISM
— FUEL BLOCK PRE-ENGAGE POSITION
MICRO SWITCH GREEN LIGHT ACTUATED
CBLOCK LOCKtO
LOCKING OF FUEL BLOCK IN RTG
FUEL BLOCK LOCKING PAWL -SEEoCTAiu a g e ( ' " - "
FIGURE-2
FHM/FUEL BLOCK LOCK MECHANISM
— FUEL BLOCK INSERT POSITION
REAR OF FUEL BLOCK
UNLOCK OF FUEL SLOCK PREPARATORY TO WITHDRAWAL
ATCH DETENT CRTG)
Fig. PP-11. Retractable Tower Air Bearing Compliance
CONriDlINTIAL MND-2050-F-2
: . '475 • « • • m
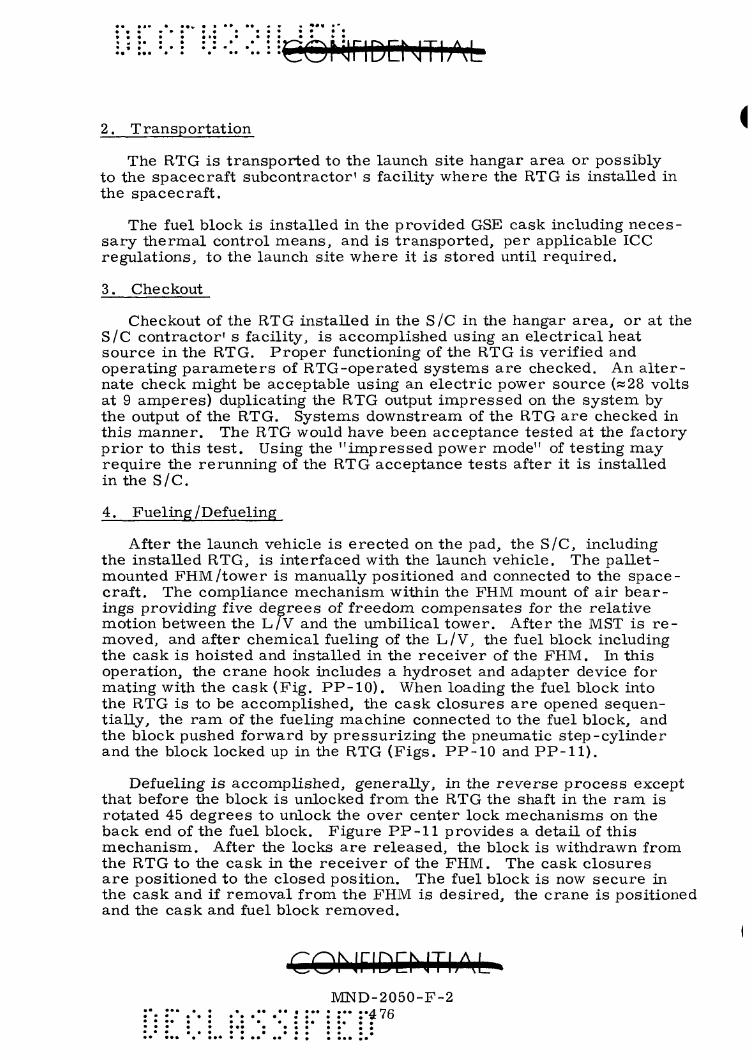
2. Transportation
The RTG is transported to the launch site hangar area or possibly to the spacecraft subcontractor' s facility where the RTG is installed in the spacecraft.
The fuel block is installed in the provided GSE cask including necessary thermal control means, and is transported, per applicable ICC regulations, to the launch site where it is stored until required.
3. Checkout
Checkout of the RTG installed in the S/C in the hangar area, or at the S/C contractor' s facility, is accomplished using an electrical heat source in the RTG. Proper functioning of the RTG is verified and operating parameters of RTG-operated systems are checked. An alternate check might be acceptable using an electric power source («28 volts at 9 amperes) duplicating the RTG output impressed on the system by the output of the RTG. Systems downstream of the RTG are checked in this manner. The RTG would have been acceptance tested at the factory prior to this test . Using the "impressed power mode" of testing may require the rerunning of the RTG acceptance tests after it is installed in the S/C.
4. Fueling/Defueling
After the launch vehicle is erected on the pad, the S/C, including the installed RTG, is interfaced with the launch vehicle. The pallet-mounted FHM/tower is manually positioned and connected to the spacecraft. The compliance mechanism within the FHM mount of air bearings providing five degrees of freedora compensates for the relative motion between the L/V and the umbilical tower. After the MST is r e moved, and after chemical fueling of the L/V, the fuel block including the cask is hoisted and installed in the receiver of the FHM. In this operation, the crane hook includes a hydroset and adapter device for mating with the cask (Fig. PP-10). When loading the fuel block into the RTG is to be accomplished, the cask closures are opened sequentially, the ram of the fueling machine connected to the fuel block, and the block pushed forward by pressurizing the pneumatic step-cylinder and the block locked up in the RTG (Figs. PP-10 and PP-11).
Defueling is accomplished, generally, in the reverse process except that before the block is unlocked from the RTG the shaft in the ram. is rotated 45 degrees to unlock the over center lock mechanisms on the back end of the fuel block. Figure PP-11 provides a detail of this mechanism. After the locks are released, the block is withdrawn from the RTG to the cask in the receiver of the FHM. The cask closures are positioned to the closed position. The fuel block is now secure in the cask and if removal from the FHM is desired, the crane is positioned and the cask and fuel block removed.
I
COhiriDChlTIAL MND-2050-F-2
:•. :•• .". : ••. .•• .*• ; :•• : :•• •.•476 • * • « • • • • • « • • • • • • • • * * • • • ••• • • • • • • « « * * • • * • • • • • • • « . • « • * • • • • • • • • • • • * • • • • • • • a *
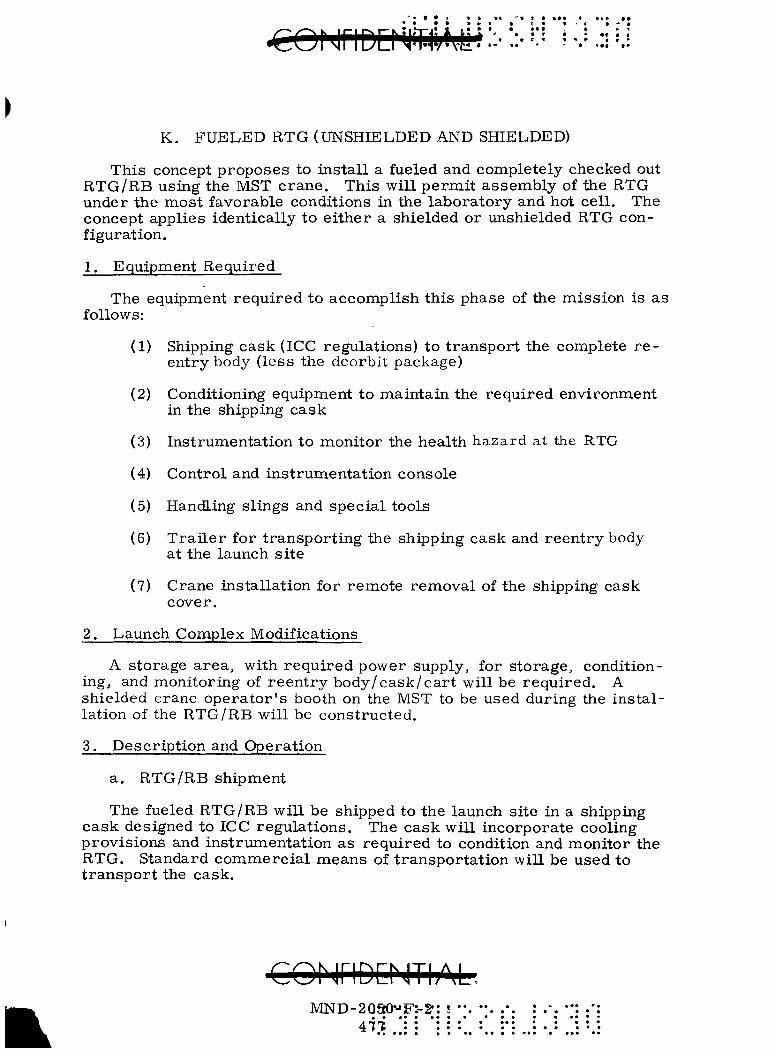
K. FUELED RTG (UNSHIELDED AND SHIELDED)
This concept proposes to install a fueled and completely checked out RTG/RB using the MST crane. This will permit assembly of the RTG under the most favorable conditions in the laboratory and hot cell. The concept applies identically to either a shielded or unshielded RTG configuration.
1. Equipment Required
The equipment required to accomplish this phase of the mission is as follows:
(1) Shipping cask (ICC regulations) to transport the complete r e entry body (less the deorbit package)
(2) Conditioning equipment to maintain the required environment in the shipping cask
(3) Instrumentation to monitor the health hazard at the RTG
(4) Control and instrumentation console
(5) Handling slings and special tools
(6) Trailer for transporting the shipping cask and reentry body at the launch site
(7) Crane installation for remote removal of the shipping cask cover.
2. Launch Complex Modifications
A storage area, with required power supply, for storage, conditioning, and monitoring of reentry body/cask/cart will be required. A shielded crane operator 's booth on the MST to be used during the installation of the RTG/RB will be constructed.
3. Description and Operation
a. RTG/RB shipment
The fueled RTG/RB will be shipped to the launch site in a shipping cask designed to ICC regulations. The cask will incorporate cooling provisions and instrtimentation as required to condition and monitor the RTG. Standard commercial means of transportation will be used to transport the cask.
CQ^J^lD:^jTlAL. MND-2Qa0^-*F:-2': ! *'. " . .*
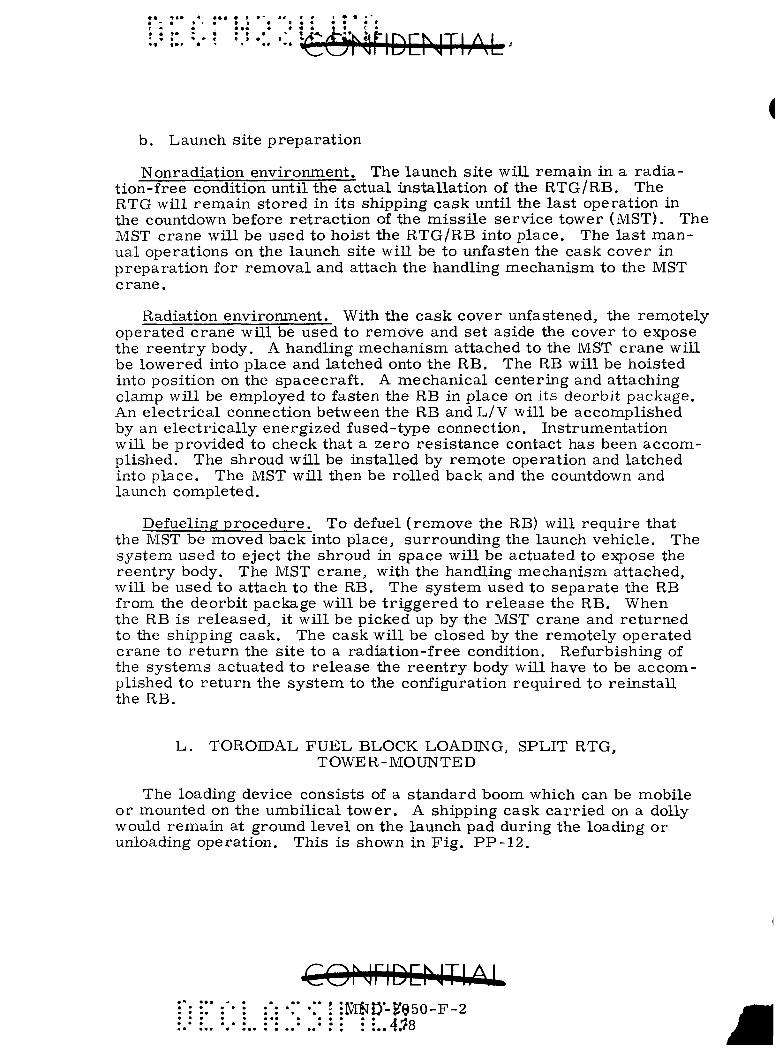
b. Launch site preparation
Nonradiation environment. The launch site will remain in a radiation-free condition until the actual installation of the RTG/RB. The RTG will remain stored in its shipping cask until the last operation in the countdown before retraction of the missile service tower (MST). The MST crane will be used to hoist the RTG/RB into place. The last manual operations on the launch site will be to unfasten the cask cover in preparation for removal and attach the handling mechanism to the MST crane.
Radiation environment. With the cask cover unfastened, the remotely operated crane will be used to remove and set aside the cover to expose the reentry body. A handling mechanism attached to the MST crane will be lowered into place and latched onto the RB. The RB will be hoisted into position on the spacecraft. A mechanical centering and attaching clamp will be employed to fasten the RB in place on its deorbit package. An electrical connection between the RB and L/V will be accomplished by an electrically energized fused-type connection. Instrumentation will be provided to check that a zero resistance contact has been accomplished. The shroud will be installed by remote operation and latched into place. The MST will then be rolled back and the countdown and launch completed.
Defueling procedure. To defuel (remove the RB) will require that the MST be moved back into place, surrounding the launch vehicle. The system used to eject the shroud in space will be actuated to expose the reentry body. The MST crane, with the handling mechanism attached, will be used to attach to the RB. The system used to separate the RB from the deorbit package will be triggered to release the RB. When the RB is released, it will be picked up by the MST crane and returned to the shipping cask. The cask will be closed by the renaotely operated crane to return the site to a radiation-free condition. Refurbishing of the systems actuated to release the reentry body will have to be accomplished to return the system to the configuration required to reinstall the RB.
L. TOROIDAL FUEL BLOCK LOADING, SPLIT RTG, TOWER-MOUNTED
The loading device consists of a standard boom which can be mobile or mounted on the umbilical tower. A shipping cask carried on a dolly would remain at ground level on the launch pad during the loading or unloading operation. This is shown in Fig. PP-12.
coMriDcnTLa^ ': •;• •:* :• :ia5JD-?950-F-2 "..'.A: I ::..4:?8

CRANE BOOM
RE-ENTRY VEHICLE/hlG
DETAIL-B SC*L£ l / t TRIMETRIC
DETAIL-A
SCALE 1/8 TRIMETRIC
^^'•••-•^6Nfii3:NTi;^
ALIGNMENTS' GRIPPER BUCKET
FUEL BLOCK
FUEL BLOCK GUIDE
THERMO/ELECTRIC MODULE
RE-ENTRY VEHICLE/RTG
ALIGNMENT £ HOISTING PROBE
NOSE CONE
CRANE BOOM
SEE D E T A I L - A
$ ALTERNATE DETAIL-B
ALIGNMENT g GRIPPER BUCKET
FUEL BLOCK
RE-ENTRY VEHICLE / R T G
TITAN m C
Fig. PP-12. Tower-Mounted Loading Boom--Split RTG
CO^J IDENTbU• MND-2050-F-2
• • • • • « « • f • • I -''.n?:':
* • •••

• •• « . • « • • • A
• • • • 4
"••tOV'jhbCNTbM
1. Equipment List
The equipment required for this operation is:
(1) Transportation cask
(2) Standard boom crane
(3) Crane hook centering and gripper device
(4) Cask dolly with cask door actuators.
2. Launch Complex Modifications
No modifications would be required if a mobile crane is used.
Minor modifications would be required if a boom crane is mounted on the umbilical tower. Remote controls in the blockhouse and wiring on the umbilical tower will have to be installed.
3. Description and Operation
a. Fuel block shipment
The fuel block will be shipped in a cask to the launch site in a toroidal shape completely assembled with the inner structure of the generator and with Min-K insulation. The cask will have a remotely actuated lid remover and four manually reraovable plugs. The plugs will be removed to insert studs for attaching the nose cone.
b. RTG shipment
The RTG, which will be an integral part of the reentry body, will be shipped, unfueled, in a normal shipping manner,
c. Launch site preparation
Nonradiation environment condition. The lower section of the r e entry body which includes the thermoelectric elements of the RTG will be installed on top of the payload with the cone pointing up, similar to the Gemini installation. AIL wiring will be connected and the RTG checked out with an electric element. The upper portion of the cone will not be installed at this t ime.
Radiation environment RTG loading. The four shield plugs in the lid of the cask will be removed manually and four studs will be screwed into fittings in the fuel block support structure inside of the cask. The upper cone section of the RTG/RB will be placed on top of the four studs
QONriDEMTIjM MND-2050-F-2
:4a 0

•• ••• • * • •• •• • • ••• • ••• • • • • • • • • • • • • • • • •
and attached with nuts. The crane gripper bucket will be positioned and attached to the probe on the top of the RTG/RB cone. All workmen with the exception of the crane operator who is a minimum of 100 feet away from the cask will leave the area. The loading operation will begin by remotely sliding the segmented lid of the cask open. The crane operator will operate the winch and lift the nose cone with the fuel block attached out of the cask and raise it to the top of the space vehicle. With the aid of a TV camera mounted on the crane boom., the fuel block package will be positioned over the lower half of the RTG/RB, It will be lowered onto a guide cone which will compensate for relative motion sway and the two halves of the RTG/RB will be joined. Latches in the lower section will be actuated and will lock the upper section in place. The gripper bucket latches will be released from the probe and the crane swung to the side.
Radiation environment, RTG unloading. In the event of an aborted launch, provisions are made to unload the RTG. The crane with the gripper bucket attached is swung over the space vehicle and, aided by TV, is aligned with the probe on the top of the RTG/RB. The gripper bucket is lowered onto the probe and the internal cone centers the bucket. The grippers are actuated as soon as the probe presses the switch at the apex of the cone or the grippers can be controlled manually. Latch fingers in the RTG are released by solenoids. In the event the solenoids fail, the system would be designed so that shear pins would shear in the latches when the upper RTG/RB section is hoisted by the crane.
Radiation environment, cask loading. The crane operator swings the boom with the fuel block package over the cask which is located at ground level. Vertical guides attached to the cask assist the crane operator to lower the fuel block into the cask. The grippers are r e leased and the remotely actuated cask lid is closed. The nose cone remains attached to the fuel block while the block is in the cask. Workmen return to the cask area and remove the nose cone and studs and replace the cask plugs.
M. SPLIT RTG, TOP LOADING SLIDING BOOM
The loading device (Fig. PP-13) consists of a pallet-mounted sliding boom which is installed on the umbiLical tower. Alignment and fuel block pickup actuators are mounted at the end of the boom. A fuel block cask is moimted on the fueling machine pallet.
1. Equipment List
The equipment required for this operation is as follows:
(1) Transportation cask
MND-2050-F-2 4oi* ••• • ••• • ••
• • * • • • •
•. ••
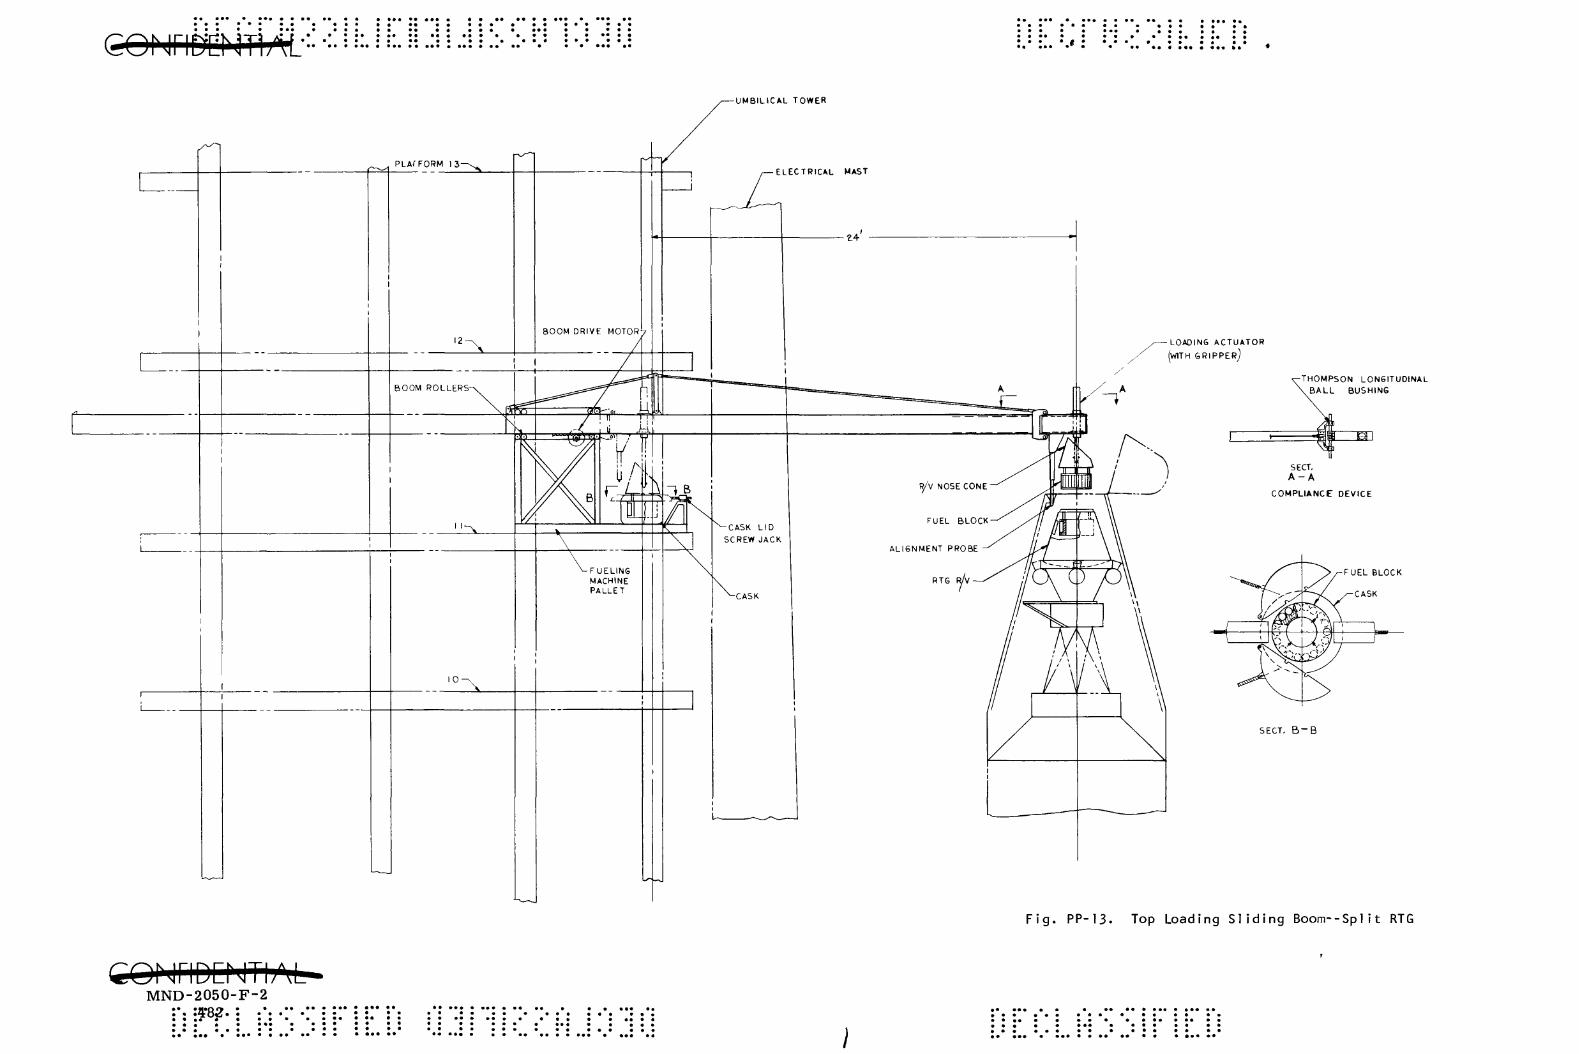
• • . . . » • coNriPcrmAi-" •" • . * . . • • • • • « • • • • • • • • • • • • • • • • • •• • • • • • • • • • • • • • • • . • • • • • • • • • • • • • • • • •• •• •• • •• • • • • • • • • « • • • • • • • • • • • • • * » • • • • • • • • • . • • • • • • • • • • • •• • • • ••• •
UMBILICAL TOWER
LOADING ACTUATOR
(WITH GRIPPER)
THOMPSON LONGITUDINAL B A L L BUSHING
COMPLIANCE DEVICE
UEL BLOCK
CASK
SECT. B - B
Fig. PP-13. Top Loading Sliding Boom--Split RTG
MND-2050-F-2 A'82. • ••
• • • • * • • ••• • • • •• •• • *•• • ••• • • • • • • • • • • • • • • •• • • • • • • • •• » •• • • • • ••• • • • • • « • • • • • • • • • • • • • • ••• • • • • • • • • •• • • • • • •
(2) Palletized loading boom
(3) Cask sling
(4) Cask skid
(5) Loading device sling
(6) Remote control console
(7) TV camera, monitor and controls.
2. Launch Complex Modifications
Minor modifications will be required to install the system at a Titan III launch complex. Tiedowns for the loading device pallet will be r e quired on the umbilical tower. Power, control and cooling lines will be installed on the umbilical tower. A control panel and TV monitors will be installed in the blockhouse or coiild be installed in a portable van.
3. Description and Operation
a. Fuel block assembly
The fuel block, consisting of a series of cylindrical capsules a r ranged in a toroidal shape, will be assembled in a laboratory hot cell. The capsules will be installed securely into a spool structure with a Min-K insulation liner. Preload will be applied at this time. The entire assembly, which forms the inner portion of the RTG, will be installed vertically into the shipping cask. Four threaded bosses in the spool structure will be oriented with four holes in the shipping cask lid. The threaded bosses will be used later for RB nose cone installation. Shield plugs will be installed into the four open holes in the cask lid after the segmented cask lid has been closed. The cask will be shipped to the launch site on a skid.
b. RTG shipment
The RTG, an integral part of the reentry body, will be shipped to the launch site unfueled in a normal shipping manner.
c. Launch site preparation
Nonradiation environment condition. The lower section of the r e entry body which includes the thermoelectric elements of the RTG will be installed on top of the payload with the cone pointing up, similar to the Gemini installation. All wiring will be connected and the RTG will be checked out with an electric heater element. The upper portion of the RB cone will not be installed at this time.
co jrlD: JTl ^L MND-2050-F-2
The fuel loading device will be instal led on the umbil ical tower and the shipping cask positioned in the loading device.
Radiation environment, RTG loading. The four shield plugs in the lid of the cask will be removed manually and four studs will be screwed into the fuel block support s t ruc tu re inside the cask. The upper cone section of the RTG/RB will be placed on top of the studs and attached with nuts . The fuel loading boom, loading actuator will be aligned with the nose cone coupling and positioning stops on the loading boom manually adjusted to suit . All personnel will c lear the launch stand a rea in p repara t ion for the remote port ion of the loading operation. The loading operat ion will begin by remotely opening the cask lid. The fuel block with the nose cone attached is lifted from the cask by ra is ing the loading ac tua tor . The boom drive motor i s operated to extend the boom until the fuel block is approximately positioned over the RTG. Limit switches stop the drive motor . An alignnaent probe actuator is lowered from the boom and contacts a socket on the payload fairing. A lead- in cone p r o vides for a t rans i t ion between the coarse and fine al ignments . A compliance device on the end of the boom pe rmi t s a 10-inch l a t e r a l motion while the boom,mounted on ro l le rs , provides ample motion in the d i r ec tion of the umbil ical tower . A close to lerance can be held between the cen te r s of the loading actuator and the alignment actuator . Likewise, a close to lerance can be maintained between the centerl ine of the RTG and the alignment funnel in the fair ing. P rec i s ion and controlled i n s e r tion of the fuel block into the RTG can be accomplished even during the differential motion of 10 inches between the launch vehicle and the umbil ical tower . The loading actuator is extended until the fuel block latch in the base of the RTG springs closed and locks the fuel block in p lace . The loading actuator gr ipper is r e leased and the actuator withdrawn from the nose cone. The alignment probe is withdrawn and the boom re t r ac t ed to the stowed position inside the umbil ical tower .
Radiation environment, RTG unloading. In the event of an aborted launch, provis ions a re made to unload the RTG. The boom is extended over the launch vehicle and is stopped by the action of a l imit switch in a course alignment position. The alignment probe is extended and engages the funnel alignment socket in the payload fairing. The loading actuator is now aligned with the lifting socket in the nose cone. Alignment will be maintained even with differential motion between the launch vehicle and umbil ical tower as the l a t e ra l compliance device and the sliding boom provide two axes of motion freedom. The lifting probe actuator is extended into the nose cone and is latched. An inner extension of the probe is extended and r e l e a s e s the fuel block la tch. The fuel block with nose cone attached is r a i sed and re turned to the cask.
COririDENTLM MND-2050-F-2
.. ,.. . ... . ...48,4
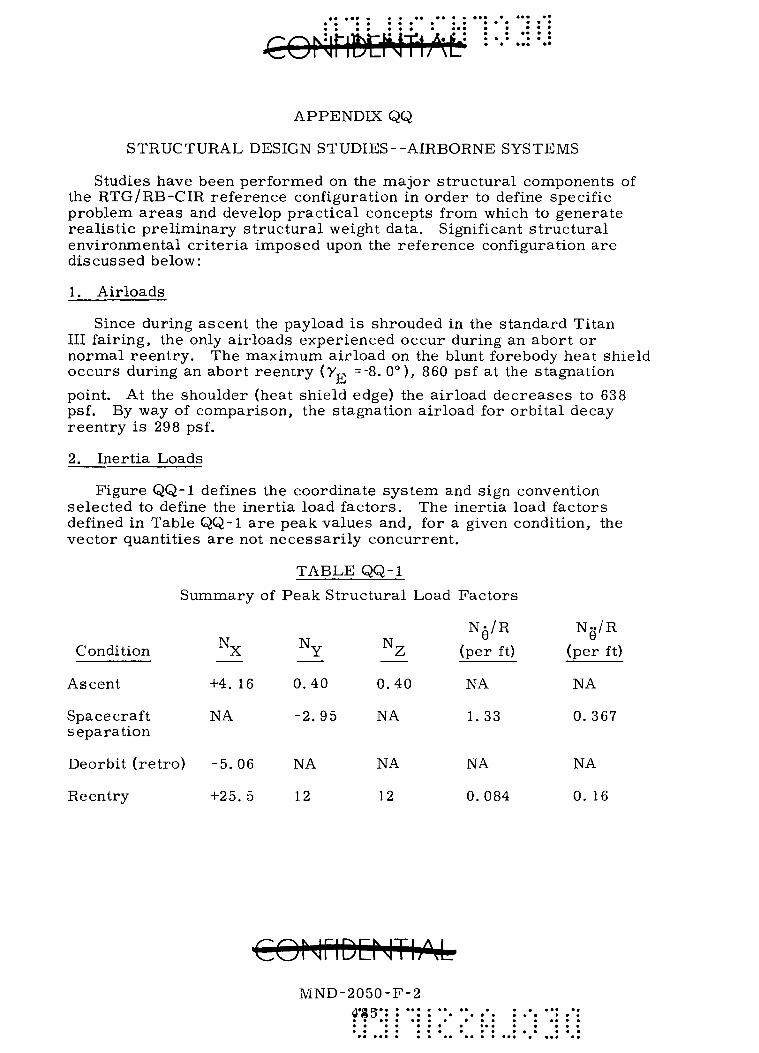
€Or-jfl!)tNtlAti-
APPENDIX QQ
STRUCTURAL DESIGN STUDIES--AIRBORNE SYSTEMS
Studies have been performed on the major s t ruc tu ra l components of the R T G / R B - C I R reference configuration in o rder to define specific problem a r e a s and develop p rac t i ca l concepts from which to generate rea l i s t i c p re l iminary s t ruc tu ra l weight data. Significant s t ruc tu ra l environmental c r i t e r i a imposed upon the re ference configuration a re discussed below:
1. Air loads
Since during ascent the payload is shrouded in the s tandard Titan III fairing, the only a i r loads experienced occur during an abort or normal r een t ry . The maximum air load on the blunt forebody heat shield occurs during an abort r een t ry (Vp = -8, 0°), 860 psf at the stagnation
point. At the shoulder (heat shield edge) the air load dec reases to 638 psf. By way of comparison, the stagnation air load for orbi ta l decay reen t ry is 298 psf,
2. Inert ia Loads
Figure QQ-1 defines the coordinate sys tem and sign convention selected to define the iner t ia load fac tors . The inert ia load factors defined in Table QQ-1 a r e peak values and, for a given condition, the vector quantit ies a r e not necessa r i ly concurrent ,
TABLE QQ-1
Condition
Ascent
Spacecraft separa t ion
Deorbit ( re
Reentry
Summary
tro)
^ X
+4. 16
NA
-5 ,06
+25.5
of Peak Struc
N Y
0.40
-2 ,95
NA
12
; tural Load Fac to r s
^ Z
0,40
NA
NA
12
N^/R
(per ft)
NA
1,33
NA
0.084
Ng/R
(per ft)
NA
0.367
NA
0. 16
CONriDDJTI/i<J? MND-2050-F-2
4'S5*: : ••: • • ••

• • • • •• • • • • • :u@Hi:la:fi'JTi;M
Separation bottle
Fig. QQ-1. Load Factor Sign Convention
co i ' iriDcr iTi.i' 4. M-NQ-'2i350-F-2
:* : :* 4^6
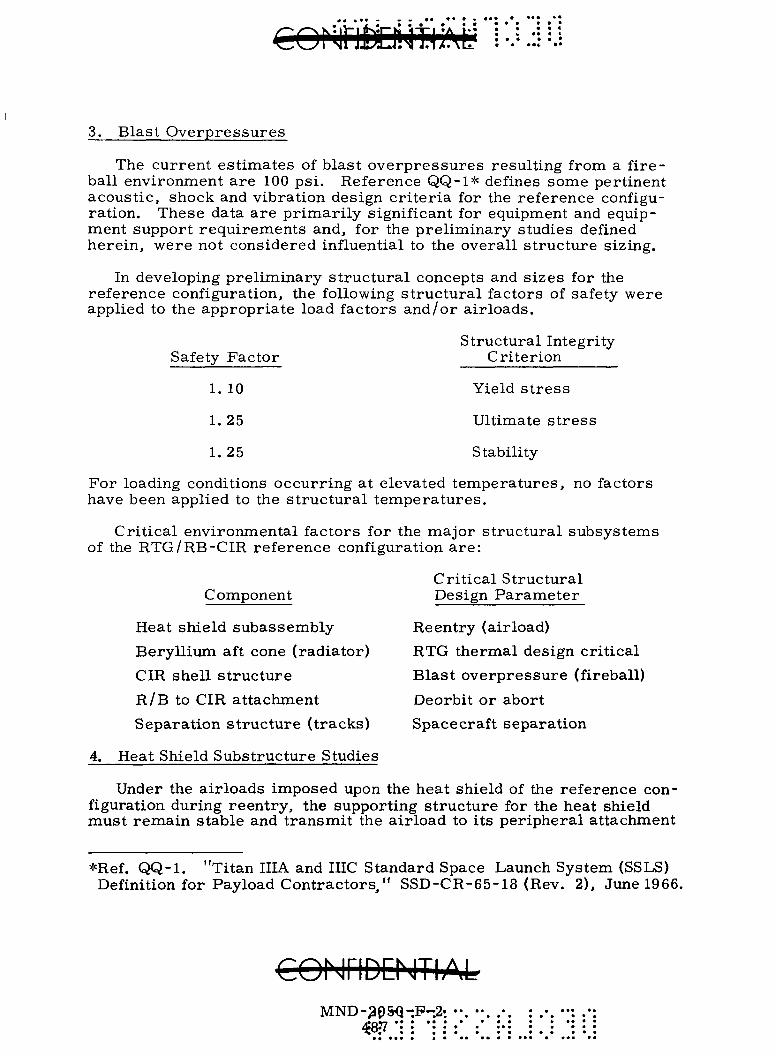
3. Blast Overpressures
The current estimates of blast overpressures resulting from a fireball environment are 100 psi. Reference QQ-1* defines some pertinent acoustic, shock and vibration design criteria for the reference configuration. These data are primarily significant for equipment and equip-naent support requirements and, for the preliminary studies defined herein, were not considered influential to the overall structure sizing.
In developing preliminary structural concepts and sizes for the reference configuration, the following structural factors of safety were applied to the appropriate load factors and/or airloads.
Safety Factor
1. 10
1. 25
1. 25
Structural Integrity Criterion
Yield s t ress
Ultimate s tress
Stability
For loading conditions occurring at elevated temperatures, no factors have been applied to the structural temperatures.
Critical environmental factors for the major structural subsystems of the R T G / R B - C I R reference configuration are :
Component
Heat shield subassembly Beryllivim aft cone (radiator) CIR shell structure R / B to CIR attachment Separation structure (tracks)
4. Heat Shield Substructure Studies
Critical Structural Design Parameter
Reentry (airload) RTG thernaal design critical Blast overpressure (fireball) Deorbit or abort Spacecraft separation
Under the airloads imposed upon the heat shield of the reference configuration during reentry, the supporting structure for the heat shield must remain stable and transm.it the airload to its peripheral attachment
*Ref. QQ-1. "Titan IIIA and IIIC Standard Space Launch System (SSLS) Definition for Payload Contractors," SSD-CR-65-18 (Rev. 2), June 1966.
coMnDcrjTh^^ MND-^pSiJ-F^Z
^8:7-
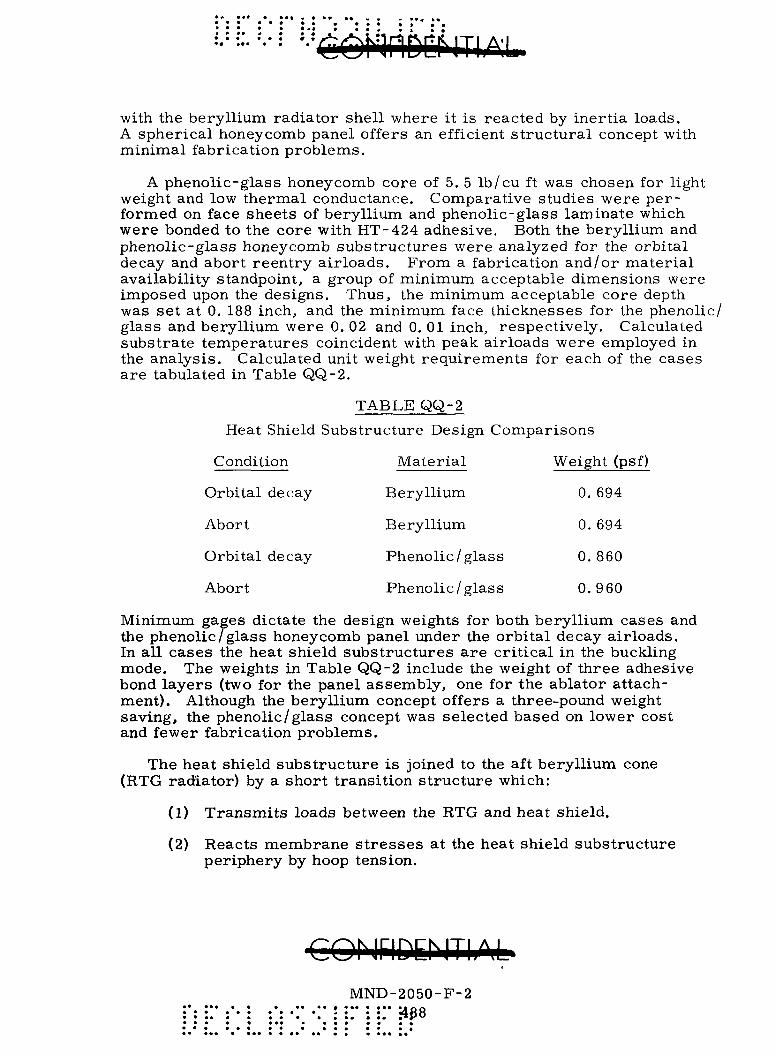
with the beryllium radiator shell where it is reacted by inertia loads. A spherical honeycomb panel offers an efficient structural concept with minimal fabrication problems.
A phenolic-glass honeycomb core of 5. 5 Ib/cu ft was chosen for light weight and low thermal conductance. Comparative studies were performed on face sheets of beryllium and phenolic-glass laminate which were bonded to the core with HT-424 adhesive. Both the beryllium and phenolic-glass honeycomb substructures were analyzed for the orbital decay and abort reentry airloads. From a fabrication and/or material availability standpoint, a group of minimum acceptable dimensions were imposed upon the designs. Thus, the minimum acceptable core depth was set at 0. 188 inch, and the minimum face thicknesses for the phenolic/ glass and beryllium were 0. 02 and 0. 01 inch, respectively. Calculated substrate temperatures coincident with peak airloads were employed in the analysis. Calculated unit weight requirements for each of the cases are tabulated in Table QQ-2.
TABLE QQ-2
Heat Shield Substructure Design Comparisons
Condition Material Weight (psf)
Orbital decay
Abort
Orbi ta l decay
Abort
Beryl l ium
Beryl l ium
Phenol ic /g lass
Phenol ic /g lass
0. 694
0. 694
0.860
0.960
Minimum gages dictate the design weights for both beryllium cases and the phenolic/glass honeycomb panel under the orbital decay airloads. In all cases the heat shield substructures are critical in the buckling mode. The weights in Table QQ-2 include the weight of three adhesive bond layers (two for the panel assembly, one for the ablator attachment). Although the beryllium concept offers a three-pound weight saving, the phenolic/glass concept was selected based on lower cost and fewer fabrication problems.
The heat shield substructure is joined to the aft beryllium cone (RTG radiator) by a short transition structure which:
(1) Transmits loads between the RTG and heat shield.
(2) Reacts membrane s t resses at the heat shield substructure periphery by hoop tension.
CQMRIDEhlTIAL MND-2050-F-2
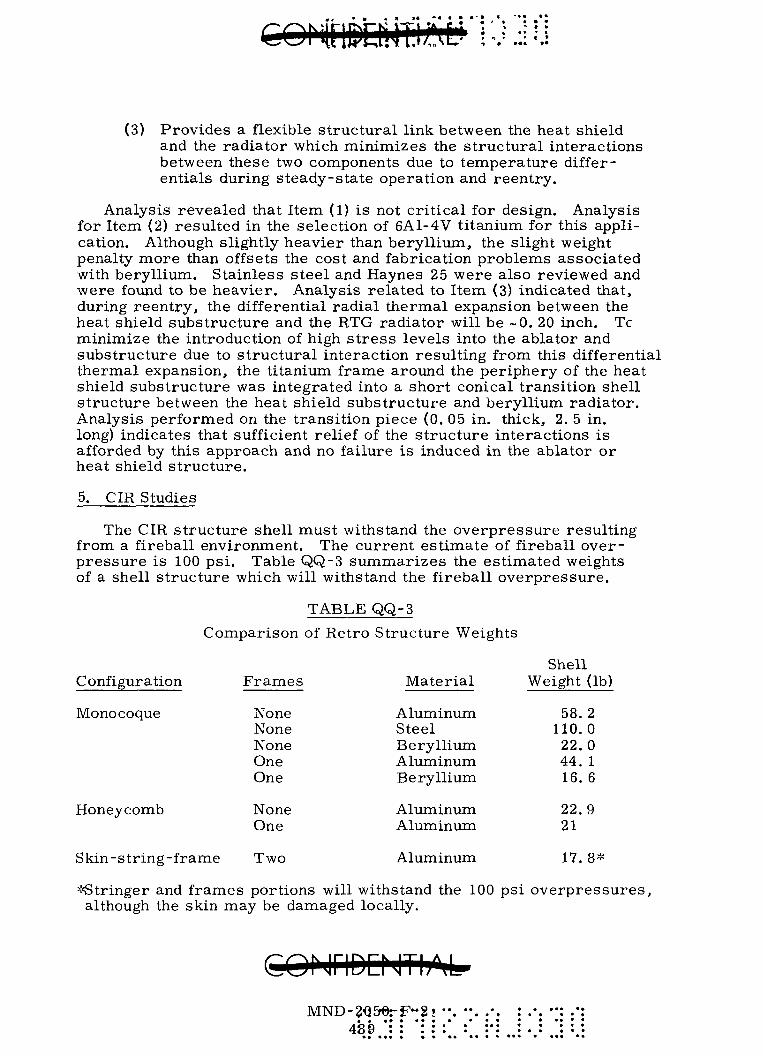
(3) Provides a flexible structural link between the heat shield and the radiator which minimizes the structural interactions between these two components due to temperature differentials during steady-state operation and reentry.
Analysis revealed that Item (1) is not critical for design. Analysis for Item (2) resulted in the selection of 6A1-4V titanium for this application. Although slightly heavier than beryllium, the slight weight penalty more than offsets the cost and fabrication problems associated with beryllium. Stainless steel and Haynes 25 were also reviewed and were found to be heavier. Analysis related to Item (3) indicated that, during reentry, the differential radial thermal expansion between the heat shield substructure and the RTG radiator will be ~0. 20 inch. Tc m.inimize the introduction of high s t ress levels into the ablator and substructure due to structural interaction resulting from this differential thermal expansion, the titanium frame around the periphery of the heat shield substructure was integrated into a short conical transition shell structure between the heat shield substructure and beryllium radiator. Analysis performed on the transition piece (0. 05 in. thick, 2. 5 in. long) indicates that sufficient relief of the structure interactions is afforded by this approach and no failure is induced in the ablator or heat shield structure.
5. CIR Studies
The CIR structure shell must withstand the overpressure resulting from a fireball environment. The current estimate of fireball overpressure is 100 psi. Table QQ-3 summarizes the estimated weights of a shell structure which will withstand the fireball overpressure.
TABLE QQ-3 Comparison of Retro Structure Weights
Configuration
Monocoque
Honeycomb
Frames
None None None One One
None One
Mater ia l
Aluminum Steel Beryl l ium Aluminum Beryl l ium
Aluminum Aluminum
Aluminum
Shell Weight (lb)
58.2 110.0 22.0 44. 1 16. 6
22.9 21
17. 8* Skin-string-frame Two
^Stringer and frames portions will withstand the 100 psi overpressures, although the skin may be damaged locally.
GONriDCNTIj"it-MND-3<}5r0rF**8! '*. " . •'. : .*. ••: .*: * « •• • •• • • * « • • • • • • •
A€)£k • • • • • • • • • • • • • •

• • - A t f l * ff * a
'fflli^fc
Table QQ-3 indicates that, in order to withstand the fireball overpressure, the lightest practical configuration would be an aluminum honeycomb shell. The beryllium monocoque shell offers a five-pound weight reduction but the inherent fabrication problems and material costs discourage its use. Similarly, use of beryllium honeycomb has been dropped from consideration. The need for an access door and load distribution members for the propulsion units suggests that use of a honeycomb shell is undesirable. In fact, a conventional skin-stringer-frame construction would be a m.ore practical concept if the fireball overpressure criteria were not critical. Since the overpressure criteria are only estimates and are subject to further verification, it has been elected to utilize a skin-stringer-frame concept for the CIR structure shell. This design will not withstand the 100 psi overpressure but does provide a more efficient solution to the other structural requirements (component support, access doors). Should review of the fireball overpressure reveal that it remains the dominant design criterion, the honeycomb concept can be adopted for the shell configuration. For an overpressure critical shell structure, the honeycomb concept will result in the lightest weight, but will require a more complex design to satisfy secondary requirements.
UNCLASSIFIED!
Related Documents