CREATING BETTER EXPERIENCES 2020 ANNUAL REPORT WOOLWORTHS GROUP LIMITED ABN 88 000 014 675

Welcome message from author
This document is posted to help you gain knowledge. Please leave a comment to let me know what you think about it! Share it to your friends and learn new things together.
Transcript
CREATING BETTEREXPERIENCES
2 0 2 0 A N N U A L R E P O R T
WO O LWO RT H S G RO U P L I M IT EDA B N 8 8 0 0 0 0 14 675
CONTENTS SECTION 1
Performance highlightsOur impact 2Living our purpose and operating COVIDSafe 4
Our key priorities 6
Sustainability highlights 10
Chairman's Report 12
CEO’s Report 14
How we create value 16
Group Financial Performance 18
SECTION 2
Business reviewAustralian Food 24
New Zealand Food 28
BIG W 30
Endeavour Group 32Task Force on Climate-related Financial Disclosures 36
Our material risks 37
We create better experiences together
for a better tomorrow.
SECTION 3
Directors’ ReportGovernance 42
Board skills and experience 43
Board of Directors 44Group Executive Committee 46
Directors’ Statutory Report 50
Remuneration Report 52
SECTION 4
Financial ReportAuditor's Independence Declaration 74
Financial Report 75
Directors’ Declaration 143
Independent Auditor’s Report 144
SECTION 5
Other informationShareholder information 149Corporate Governance Statement 150
Glossary 151
Company directory Inside Back Cover
Five year summary Inside Back Cover
& WORKING TOGETHERCOVIDSafe
Woolworths Group is led by its purpose, to create better experiences together for a better tomorrow. Guided by our Agile Ways-of-Working and Core Values, we want our actions to have
a positive impact every day and to define what makes Woolworths Group different. Customer demands are changing rapidly and
the retail environment is evolving, and in this environment we will continue to transform the Group to better meet our
customers’ needs and work together to be COVIDSafe.
This is an interactive PDF designed to enhance your experience. The best way to view this report is with Adobe Reader. Click on the links on the contents pages or use the
home button in the footer to navigate the report.
CONTENTS SECTION 1
Performance highlightsOur impact 2Living our purpose and operating COVIDSafe 4
Our key priorities 6
Sustainability highlights 10
Chairman's Report 12
CEO’s Report 14
How we create value 16
Group Financial Performance 18
SECTION 2
Business reviewAustralian Food 24
New Zealand Food 28
BIG W 30
Endeavour Group 32Task Force on Climate-related Financial Disclosures 36
Our material risks 37
We create better experiences together
for a better tomorrow.
SECTION 3
Directors’ ReportGovernance 42
Board skills and experience 43
Board of Directors 44Group Executive Committee 46
Directors’ Statutory Report 50
Remuneration Report 52
SECTION 4
Financial ReportAuditor's Independence Declaration 74
Financial Report 75
Directors’ Declaration 143
Independent Auditor’s Report 144
SECTION 5
Other informationShareholder information 149Corporate Governance Statement 150
Glossary 151
Company directory Inside Back Cover
Five year summary Inside Back Cover
& WORKING TOGETHERCOVIDSafe
Woolworths Group is led by its purpose, to create better experiences together for a better tomorrow. Guided by our Agile Ways-of-Working and Core Values, we want our actions to have
a positive impact every day and to define what makes Woolworths Group different. Customer demands are changing rapidly and
the retail environment is evolving, and in this environment we will continue to transform the Group to better meet our
customers’ needs and work together to be COVIDSafe.
2
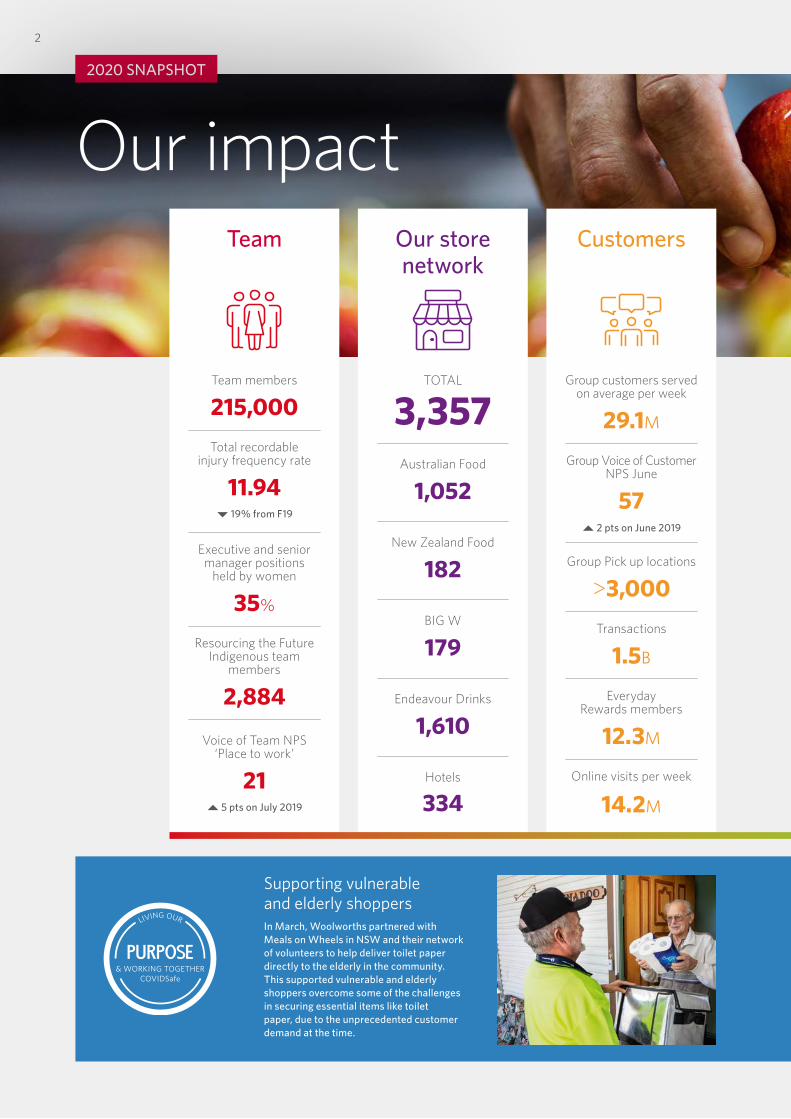
Supporting vulnerable and elderly shoppersIn March, Woolworths partnered with Meals on Wheels in NSW and their network of volunteers to help deliver toilet paper directly to the elderly in the community. This supported vulnerable and elderly shoppers overcome some of the challenges in securing essential items like toilet paper, due to the unprecedented customer demand at the time.
2020 SNAPSHOT
Our impactTeam
Team members
215,000Total recordable
injury frequency rate
11.94� 19% from F19
Executive and senior manager positions
held by women
35%
Resourcing the Future Indigenous team
members
2,884
Voice of Team NPS ‘Place to work’
21~ 5 pts on July 2019
Our store network
TOTAL
3,357Australian Food
1,052
New Zealand Food
182
BIG W
179
Endeavour Drinks
1,610
Hotels
334
Customers
Group customers served on average per week
29.1M
Group Voice of Customer NPS June
57 ~ 2 pts on June 2019
Group Pick up locations
>3,000Transactions
1.5B
Everyday Rewards members
12.3M
Online visits per week
14.2M
& WORKING TOGETHERCOVIDSafe
OTH
ER IN
FORM
ATION
5
FINA
NC
IAL
REPORT
4
3
DIREC
TORS'
REPORT
BUSIN
ESS REV
IEW
2
1
PERFORM
AN
CE
HIG
HLIG
HTS
WO
OLW
ORTH
S GRO
UP
AN
NU
AL REPO
RT 2020
3
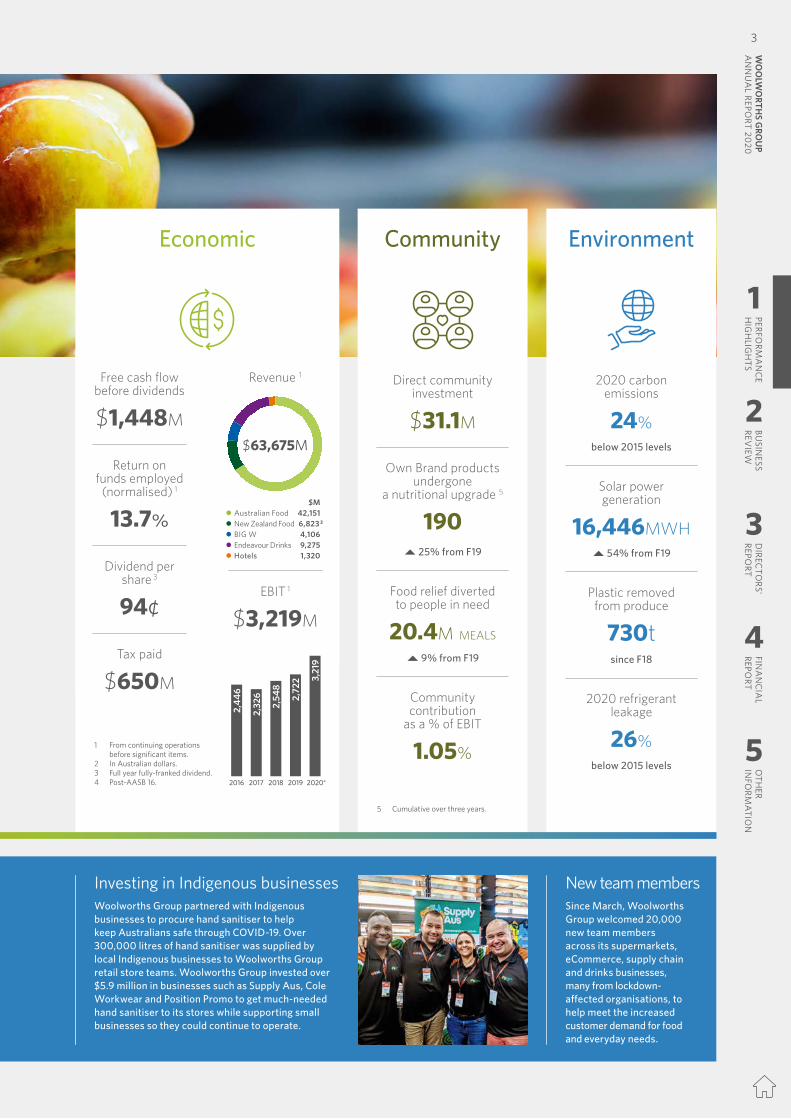
New team members Since March, Woolworths Group welcomed 20,000 new team members across its supermarkets, eCommerce, supply chain and drinks businesses, many from lockdown-affected organisations, to help meet the increased customer demand for food and everyday needs.
Investing in Indigenous businessesWoolworths Group partnered with Indigenous businesses to procure hand sanitiser to help keep Australians safe through COVID-19. Over 300,000 litres of hand sanitiser was supplied by local Indigenous businesses to Woolworths Group retail store teams. Woolworths Group invested over $5.9 million in businesses such as Supply Aus, Cole Workwear and Position Promo to get much-needed hand sanitiser to its stores while supporting small businesses so they could continue to operate.
Community
Direct community investment
$31.1M
Own Brand products undergone
a nutritional upgrade 5
190~ 25% from F19
Food relief diverted to people in need
20.4M MEALS
~ 9% from F19
Community contribution
as a % of EBIT
1.05%
Environment
2020 carbon emissions
24%below 2015 levels
Solar power generation
16,446MWH~ 54% from F19
Plastic removed from produce
730tsince F18
2020 refrigerant leakage
26%below 2015 levels
Economic
1 From continuing operations before significant items.
2 In Australian dollars.3 Full year fully-franked dividend.4 Post-AASB 16.
Free cash flow before dividends
$1,448M
Return on funds employed
(normalised) 1
13.7%
Dividend per share 3
94¢
Tax paid
$650M
Revenue 1
Hotels
Endeavour Drinks
BIG W
New Zealand Food
Australian Food
$MAustralian Food 42,151New Zealand Food 6,823 2
BIG W 4,106Endeavour Drinks 9,275Hotels 1,320
EBIT 1
$3,219M
$63,675M
20202019201820172016
2,44
6
2,32
6
2,54
8
2,72
2 3,21
9
4
5 Cumulative over three years.
2
Supporting vulnerable and elderly shoppersIn March, Woolworths partnered with Meals on Wheels in NSW and their network of volunteers to help deliver toilet paper directly to the elderly in the community. This supported vulnerable and elderly shoppers overcome some of the challenges in securing essential items like toilet paper, due to the unprecedented customer demand at the time.
2020 SNAPSHOT
Our impactTeam
Team members
215,000Total recordable
injury frequency rate
11.94� 19% from F19
Executive and senior manager positions
held by women
35%
Resourcing the Future Indigenous team
members
2,884
Voice of Team NPS ‘Place to work’
21~ 5 pts on July 2019
Our store network
TOTAL
3,357Australian Food
1,052
New Zealand Food
182
BIG W
179
Endeavour Drinks
1,610
Hotels
334
Customers
Group customers served on average per week
29.1M
Group Voice of Customer NPS June
57 ~ 2 pts on June 2019
Group Pick up locations
>3,000Transactions
1.5B
Everyday Rewards members
12.3M
Online visits per week
14.2M
& WORKING TOGETHERCOVIDSafe
OTH
ER IN
FORM
ATION
5
FINA
NC
IAL
REPORT
4
3
DIREC
TORS'
REPORT
BUSIN
ESS REV
IEW
2
1
PERFORM
AN
CE
HIG
HLIG
HTS
WO
OLW
ORTH
S GRO
UP
AN
NU
AL REPO
RT 20203
New team members Since March, Woolworths Group welcomed 20,000 new team members across its supermarkets, eCommerce, supply chain and drinks businesses, many from lockdown-affected organisations, to help meet the increased customer demand for food and everyday needs.
Investing in Indigenous businessesWoolworths Group partnered with Indigenous businesses to procure hand sanitiser to help keep Australians safe through COVID-19. Over 300,000 litres of hand sanitiser was supplied by local Indigenous businesses to Woolworths Group retail store teams. Woolworths Group invested over $5.9 million in businesses such as Supply Aus, Cole Workwear and Position Promo to get much-needed hand sanitiser to its stores while supporting small businesses so they could continue to operate.
Community
Direct community investment
$31.1M
Own Brand products undergone
a nutritional upgrade 5
190~ 25% from F19
Food relief diverted to people in need
20.4M MEALS
~ 9% from F19
Community contribution
as a % of EBIT
1.05%
Environment
2020 carbon emissions
24%below 2015 levels
Solar power generation
16,446MWH~ 54% from F19
Plastic removed from produce
730tsince F18
2020 refrigerant leakage
26%below 2015 levels
Economic
1 From continuing operations before significant items.
2 In Australian dollars.3 Full year fully-franked dividend.4 Post-AASB 16.
Free cash flow before dividends
$1,448M
Return on funds employed
(normalised) 1
13.7%
Dividend per share 3
94¢
Tax paid
$650M
Revenue 1
Hotels
Endeavour Drinks
BIG W
New Zealand Food
Australian Food
$MAustralian Food 42,151New Zealand Food 6,823 2
BIG W 4,106Endeavour Drinks 9,275Hotels 1,320
EBIT 1
$3,219M
$63,675M
20202019201820172016
2,44
6
2,32
6
2,54
8
2,72
2 3,21
9
4
5 Cumulative over three years.
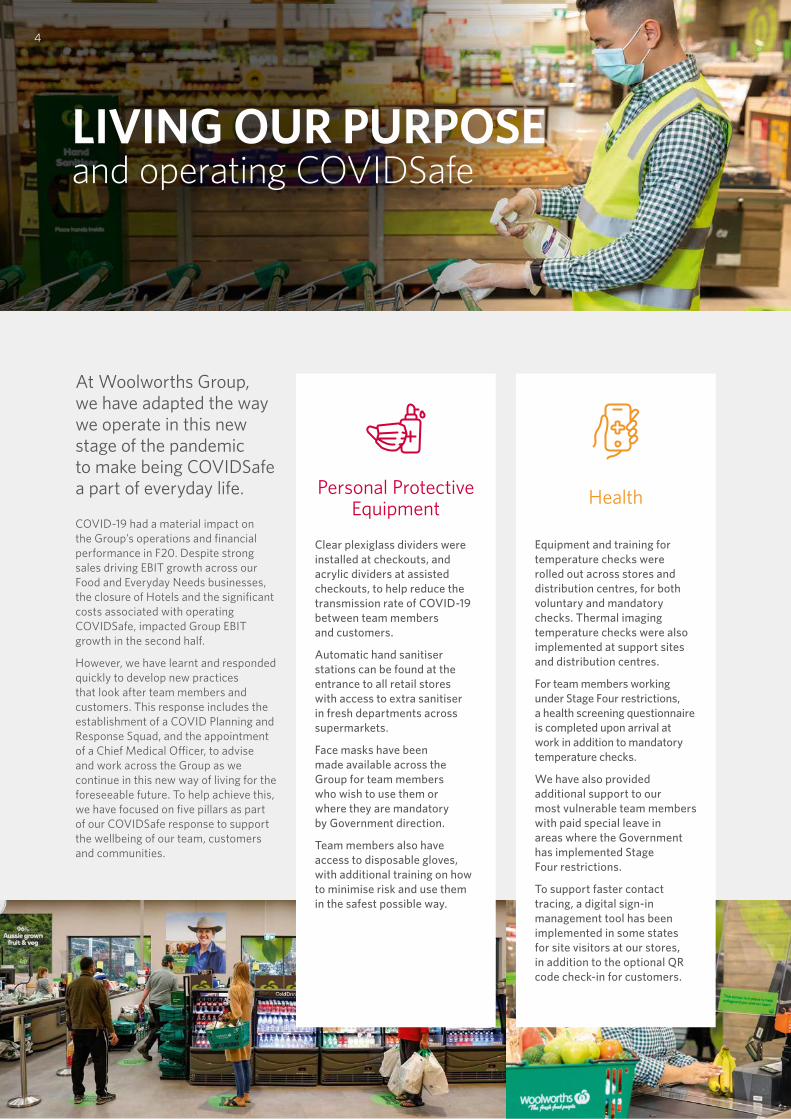
At Woolworths Group, we have adapted the way we operate in this new stage of the pandemic to make being COVIDSafe a part of everyday life.
COVID-19 had a material impact on the Group’s operations and financial performance in F20. Despite strong sales driving EBIT growth across our Food and Everyday Needs businesses, the closure of Hotels and the significant costs associated with operating COVIDSafe, impacted Group EBIT growth in the second half.
However, we have learnt and responded quickly to develop new practices that look after team members and customers. This response includes the establishment of a COVID Planning and Response Squad, and the appointment of a Chief Medical Officer, to advise and work across the Group as we continue in this new way of living for the foreseeable future. To help achieve this, we have focused on five pillars as part of our COVIDSafe response to support the wellbeing of our team, customers and communities.
LIVING OUR PURPOSEand operating COVIDSafe
Personal Protective Equipment
Clear plexiglass dividers were installed at checkouts, and acrylic dividers at assisted checkouts, to help reduce the transmission rate of COVID-19 between team members and customers.
Automatic hand sanitiser stations can be found at the entrance to all retail stores with access to extra sanitiser in fresh departments across supermarkets.
Face masks have been made available across the Group for team members who wish to use them or where they are mandatory by Government direction.
Team members also have access to disposable gloves, with additional training on how to minimise risk and use them in the safest possible way.
Health
Equipment and training for temperature checks were rolled out across stores and distribution centres, for both voluntary and mandatory checks. Thermal imaging temperature checks were also implemented at support sites and distribution centres.
For team members working under Stage Four restrictions, a health screening questionnaire is completed upon arrival at work in addition to mandatory temperature checks.
We have also provided additional support to our most vulnerable team members with paid special leave in areas where the Government has implemented Stage Four restrictions.
To support faster contact tracing, a digital sign-in management tool has been implemented in some states for site visitors at our stores, in addition to the optional QR code check-in for customers.
4
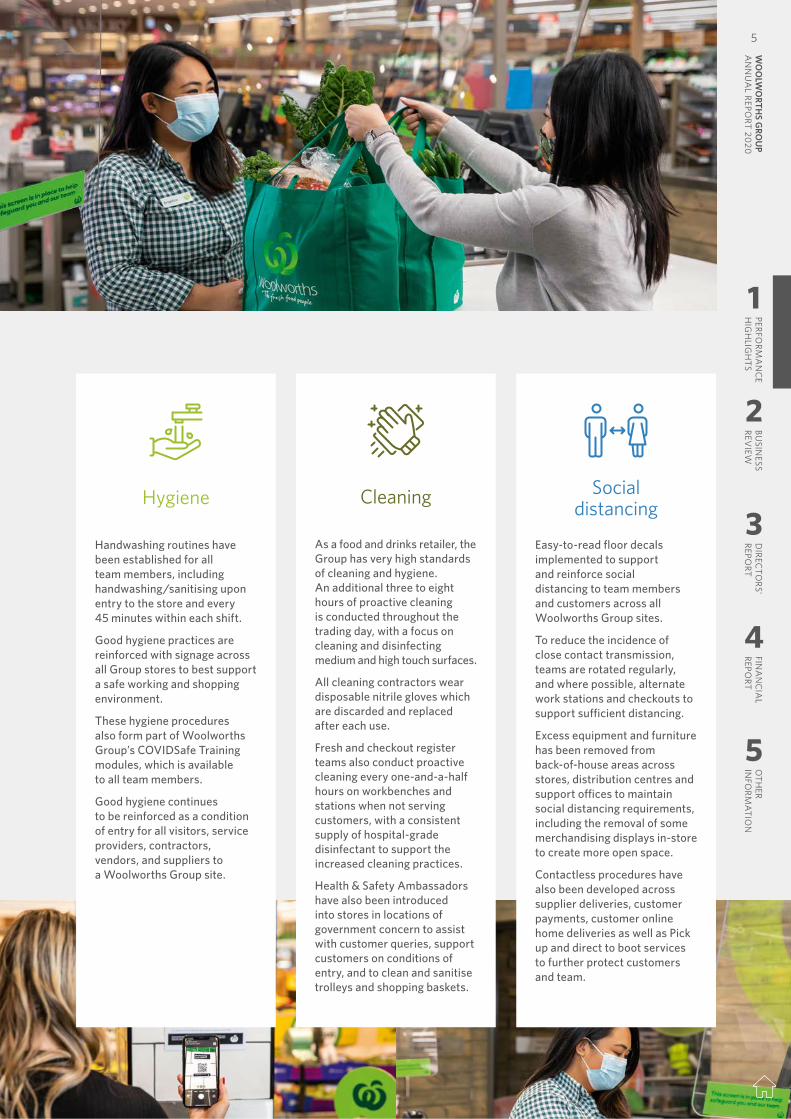
Hygiene
Handwashing routines have been established for all team members, including handwashing/sanitising upon entry to the store and every 45 minutes within each shift.
Good hygiene practices are reinforced with signage across all Group stores to best support a safe working and shopping environment.
These hygiene procedures also form part of Woolworths Group’s COVIDSafe Training modules, which is available to all team members.
Good hygiene continues to be reinforced as a condition of entry for all visitors, service providers, contractors, vendors, and suppliers to a Woolworths Group site.
Cleaning
As a food and drinks retailer, the Group has very high standards of cleaning and hygiene. An additional three to eight hours of proactive cleaning is conducted throughout the trading day, with a focus on cleaning and disinfecting medium and high touch surfaces.
All cleaning contractors wear disposable nitrile gloves which are discarded and replaced after each use.
Fresh and checkout register teams also conduct proactive cleaning every one-and-a-half hours on workbenches and stations when not serving customers, with a consistent supply of hospital-grade disinfectant to support the increased cleaning practices.
Health & Safety Ambassadors have also been introduced into stores in locations of government concern to assist with customer queries, support customers on conditions of entry, and to clean and sanitise trolleys and shopping baskets.
Social distancing
Easy-to-read floor decals implemented to support and reinforce social distancing to team members and customers across all Woolworths Group sites.
To reduce the incidence of close contact transmission, teams are rotated regularly, and where possible, alternate work stations and checkouts to support sufficient distancing.
Excess equipment and furniture has been removed from back-of-house areas across stores, distribution centres and support offices to maintain social distancing requirements, including the removal of some merchandising displays in-store to create more open space.
Contactless procedures have also been developed across supplier deliveries, customer payments, customer online home deliveries as well as Pick up and direct to boot services to further protect customers and team.
1
2
3
4
5
PERFORM
AN
CE
HIG
HLIG
HTS
BUSIN
ESS REV
IEWD
IRECTO
RS' REPO
RTFIN
AN
CIA
L REPO
RTO
THER
INFO
RMATIO
N
5
WO
OLW
ORTH
S GRO
UP
AN
NU
AL REPO
RT 2020
At Woolworths Group, we have adapted the way we operate in this new stage of the pandemic to make being COVIDSafe a part of everyday life.
COVID-19 had a material impact on the Group’s operations and financial performance in F20. Despite strong sales driving EBIT growth across our Food and Everyday Needs businesses, the closure of Hotels and the significant costs associated with operating COVIDSafe, impacted Group EBIT growth in the second half.
However, we have learnt and responded quickly to develop new practices that look after team members and customers. This response includes the establishment of a COVID Planning and Response Squad, and the appointment of a Chief Medical Officer, to advise and work across the Group as we continue in this new way of living for the foreseeable future. To help achieve this, we have focused on five pillars as part of our COVIDSafe response to support the wellbeing of our team, customers and communities.
LIVING OUR PURPOSEand operating COVIDSafe
Personal Protective Equipment
Clear plexiglass dividers were installed at checkouts, and acrylic dividers at assisted checkouts, to help reduce the transmission rate of COVID-19 between team members and customers.
Automatic hand sanitiser stations can be found at the entrance to all retail stores with access to extra sanitiser in fresh departments across supermarkets.
Face masks have been made available across the Group for team members who wish to use them or where they are mandatory by Government direction.
Team members also have access to disposable gloves, with additional training on how to minimise risk and use them in the safest possible way.
Health
Equipment and training for temperature checks were rolled out across stores and distribution centres, for both voluntary and mandatory checks. Thermal imaging temperature checks were also implemented at support sites and distribution centres.
For team members working under Stage Four restrictions, a health screening questionnaire is completed upon arrival at work in addition to mandatory temperature checks.
We have also provided additional support to our most vulnerable team members with paid special leave in areas where the Government has implemented Stage Four restrictions.
To support faster contact tracing, a digital sign-in management tool has been implemented in some states for site visitors at our stores, in addition to the optional QR code check-in for customers.
4
Hygiene
Handwashing routines have been established for all team members, including handwashing/sanitising upon entry to the store and every 45 minutes within each shift.
Good hygiene practices are reinforced with signage across all Group stores to best support a safe working and shopping environment.
These hygiene procedures also form part of Woolworths Group’s COVIDSafe Training modules, which is available to all team members.
Good hygiene continues to be reinforced as a condition of entry for all visitors, service providers, contractors, vendors, and suppliers to a Woolworths Group site.
Cleaning
As a food and drinks retailer, the Group has very high standards of cleaning and hygiene. An additional three to eight hours of proactive cleaning is conducted throughout the trading day, with a focus on cleaning and disinfecting medium and high touch surfaces.
All cleaning contractors wear disposable nitrile gloves which are discarded and replaced after each use.
Fresh and checkout register teams also conduct proactive cleaning every one-and-a-half hours on workbenches and stations when not serving customers, with a consistent supply of hospital-grade disinfectant to support the increased cleaning practices.
Health & Safety Ambassadors have also been introduced into stores in locations of government concern to assist with customer queries, support customers on conditions of entry, and to clean and sanitise trolleys and shopping baskets.
Social distancing
Easy-to-read floor decals implemented to support and reinforce social distancing to team members and customers across all Woolworths Group sites.
To reduce the incidence of close contact transmission, teams are rotated regularly, and where possible, alternate work stations and checkouts to support sufficient distancing.
Excess equipment and furniture has been removed from back-of-house areas across stores, distribution centres and support offices to maintain social distancing requirements, including the removal of some merchandising displays in-store to create more open space.
Contactless procedures have also been developed across supplier deliveries, customer payments, customer online home deliveries as well as Pick up and direct to boot services to further protect customers and team.
1
2
3
4
5
PERFORM
AN
CE
HIG
HLIG
HTS
BUSIN
ESS REV
IEWD
IRECTO
RS' REPO
RTFIN
AN
CIA
L REPO
RTO
THER
INFO
RMATIO
N5
WO
OLW
ORTH
S GRO
UP
AN
NU
AL REPO
RT 2020
OUR KEY PRIORITIES
An ongoing transformation
Customer satisfaction in F20VOC NPS remains a key measure of customer satisfaction for Woolworths Group. The material increase in demand for food and everyday items following the initial onset of COVID-19 in March and April impacted stock availability and aspects of the customer in-store experience. This was most pronounced for the Australian and New Zealand food businesses as well as BIG W for everyday needs. Pleasingly, the decline in Group VOC NPS was temporary and it ended the year strongly at 57, up two points on June 2019. Brand metrics also improved over this period as customers recognised the efforts of the team to provide an essential service in a safe environment. This was reaffirmed by Roy Morgan Risk Monitor which named Woolworths as Australia’s second most-trusted brand during COVID-19.
Record online participationGroup online sales in F20 was $3.5 billion, achieving an online penetration rate of 5.5%. The strong online results demonstrate customers’ continued demand for convenient shopping solutions, which was amplified as the COVID-19 crisis escalated and delivery services became essential. During March, when pantry-loading hit peak levels, Woolworths Supermarkets’ online services picked from store were temporarily suspended following a material spike in demand for both Home Delivery and Pick up. Priority Assistance was established to ensure those most vulnerable in the community still had access to food and everyday needs. This was quickly followed up by Community Pick up, to enable relatives and carers to pick up
Famous for FreshAs customers spent more time at home, healthy and fresh meal inspiration became increasingly important. As part of the priority to be Famous for Fresh, 131 new Fresh Made Easy products were launched in F20, including the ‘& Veg’, ‘3 Serves’ and ‘COOK’ ranges. The commitment to fresh also resonated with customers with fresh perception metrics increasing by four points on the prior year. To drive further differentiation, localised ranging remains key to evolving the customer proposition. During F20, ethnic ranges were launched in 54 stores, providing customers with even greater personalisation and choice for their grocery needs.
1. Live our Purpose and Build a Customer 1st Brand, Team & CultureThe team consistently put customers first and lived the Group purpose of creating better experiences together, every day through a year of unprecedented challenges.
2. Create Connected, Convenient and Safe Ways to ShopF20 was a transformative year for the Group’s online businesses, as capacity was doubled following the onset of COVID-19 to keep up with demand from customers seeking safe and convenient ways to meet their shopping needs.
3. Differentiate our Food Customer PropositionsDespite the unique challenges throughout F20, the Food businesses remained focused on evolving the customer offer to create even more engaging and easy experiences.
6
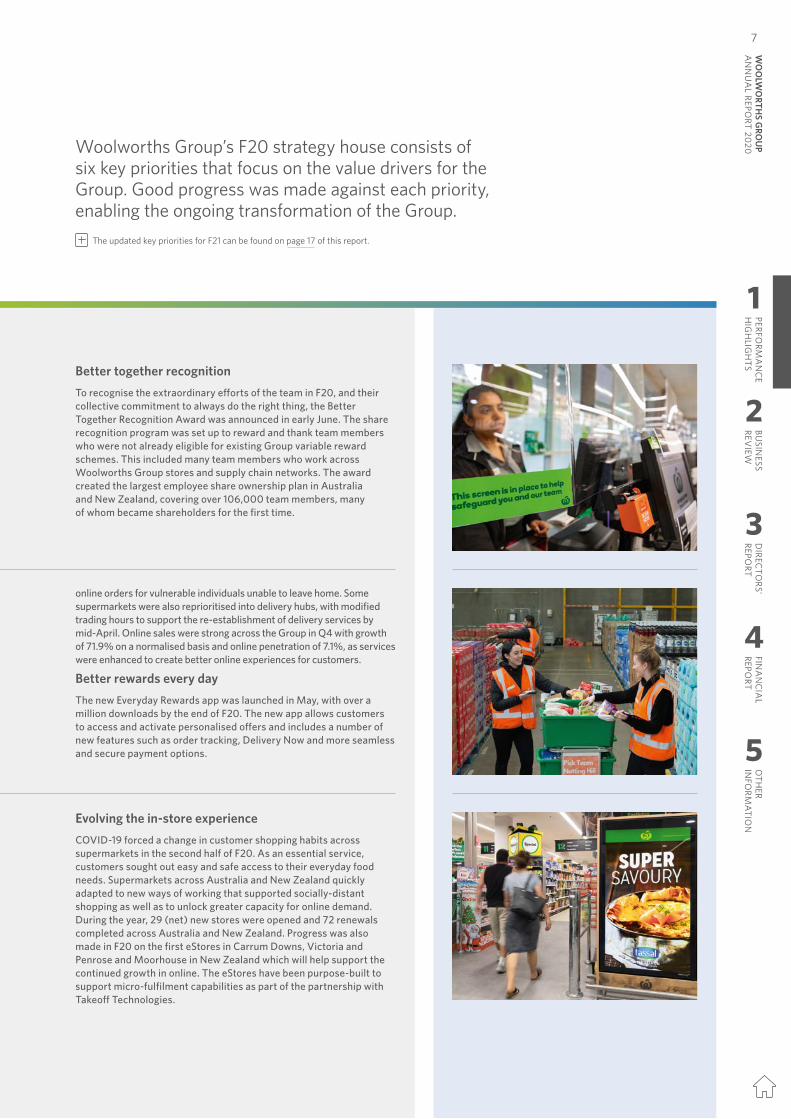
Better together recognition To recognise the extraordinary efforts of the team in F20, and their collective commitment to always do the right thing, the Better Together Recognition Award was announced in early June. The share recognition program was set up to reward and thank team members who were not already eligible for existing Group variable reward schemes. This included many team members who work across Woolworths Group stores and supply chain networks. The award created the largest employee share ownership plan in Australia and New Zealand, covering over 106,000 team members, many of whom became shareholders for the first time.
online orders for vulnerable individuals unable to leave home. Some supermarkets were also reprioritised into delivery hubs, with modified trading hours to support the re-establishment of delivery services by mid-April. Online sales were strong across the Group in Q4 with growth of 71.9% on a normalised basis and online penetration of 7.1%, as services were enhanced to create better online experiences for customers.
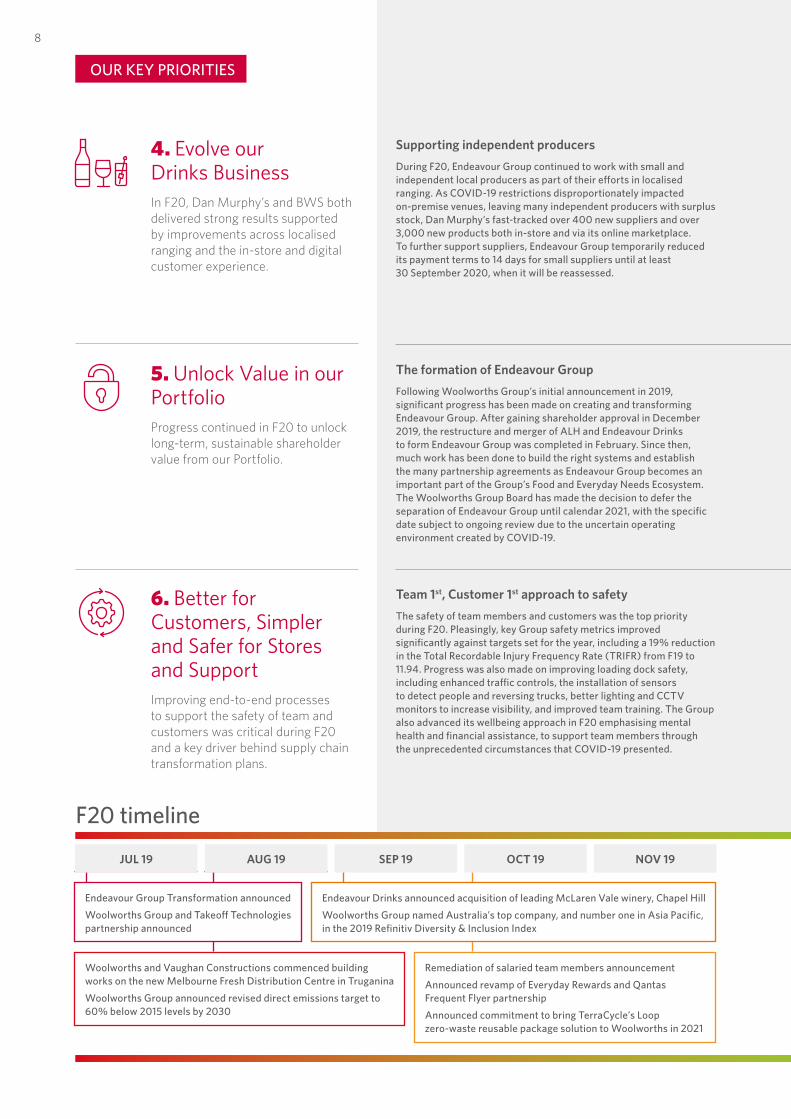
Better rewards every day The new Everyday Rewards app was launched in May, with over a million downloads by the end of F20. The new app allows customers to access and activate personalised offers and includes a number of new features such as order tracking, Delivery Now and more seamless and secure payment options.
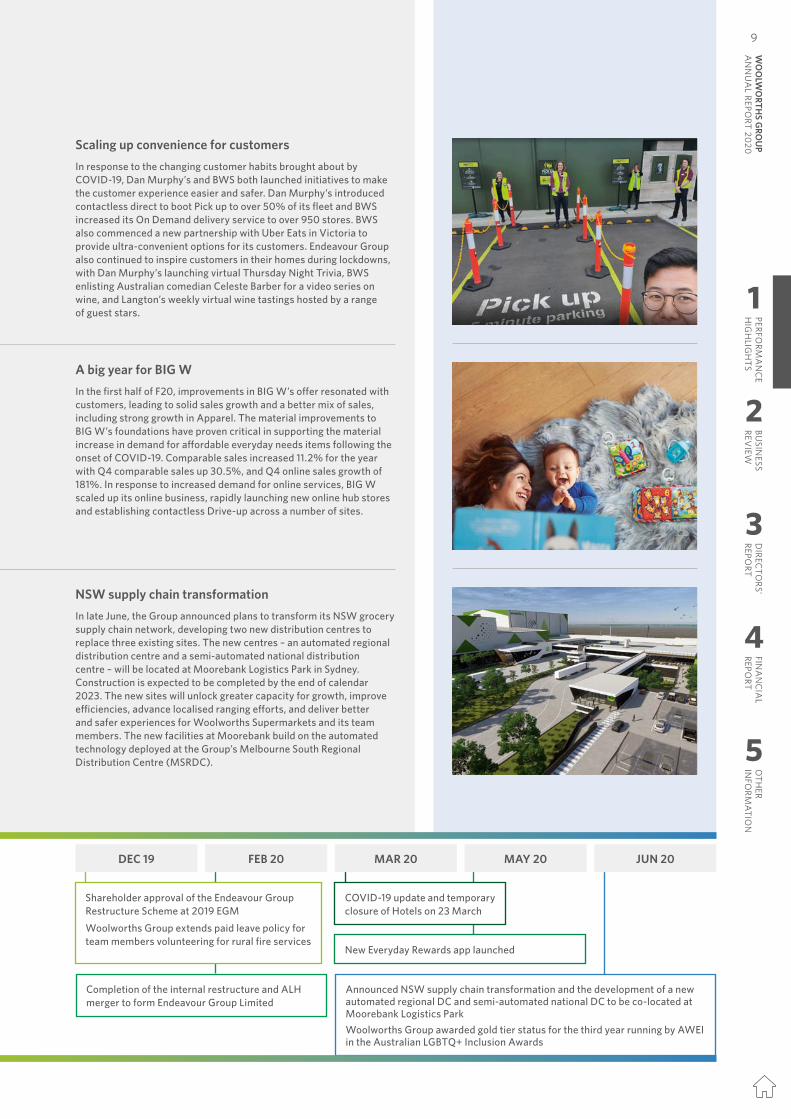
Evolving the in-store experienceCOVID-19 forced a change in customer shopping habits across supermarkets in the second half of F20. As an essential service, customers sought out easy and safe access to their everyday food needs. Supermarkets across Australia and New Zealand quickly adapted to new ways of working that supported socially-distant shopping as well as to unlock greater capacity for online demand. During the year, 29 (net) new stores were opened and 72 renewals completed across Australia and New Zealand. Progress was also made in F20 on the first eStores in Carrum Downs, Victoria and Penrose and Moorhouse in New Zealand which will help support the continued growth in online. The eStores have been purpose-built to support micro-fulfilment capabilities as part of the partnership with Takeoff Technologies.
Woolworths Group’s F20 strategy house consists of six key priorities that focus on the value drivers for the Group. Good progress was made against each priority, enabling the ongoing transformation of the Group.
The updated key priorities for F21 can be found on page 17 of this report.
1
2
3
4
5
PERFORM
AN
CE
HIG
HLIG
HTS
BUSIN
ESS REV
IEWD
IRECTO
RS' REPO
RTFIN
AN
CIA
L REPO
RTO
THER
INFO
RMATIO
N
7
WO
OLW
ORTH
S GRO
UP
AN
NU
AL REPO
RT 2020
OUR KEY PRIORITIES
An ongoing transformation
Customer satisfaction in F20VOC NPS remains a key measure of customer satisfaction for Woolworths Group. The material increase in demand for food and everyday items following the initial onset of COVID-19 in March and April impacted stock availability and aspects of the customer in-store experience. This was most pronounced for the Australian and New Zealand food businesses as well as BIG W for everyday needs. Pleasingly, the decline in Group VOC NPS was temporary and it ended the year strongly at 57, up two points on June 2019. Brand metrics also improved over this period as customers recognised the efforts of the team to provide an essential service in a safe environment. This was reaffirmed by Roy Morgan Risk Monitor which named Woolworths as Australia’s second most-trusted brand during COVID-19.
Record online participationGroup online sales in F20 was $3.5 billion, achieving an online penetration rate of 5.5%. The strong online results demonstrate customers’ continued demand for convenient shopping solutions, which was amplified as the COVID-19 crisis escalated and delivery services became essential. During March, when pantry-loading hit peak levels, Woolworths Supermarkets’ online services picked from store were temporarily suspended following a material spike in demand for both Home Delivery and Pick up. Priority Assistance was established to ensure those most vulnerable in the community still had access to food and everyday needs. This was quickly followed up by Community Pick up, to enable relatives and carers to pick up
Famous for FreshAs customers spent more time at home, healthy and fresh meal inspiration became increasingly important. As part of the priority to be Famous for Fresh, 131 new Fresh Made Easy products were launched in F20, including the ‘& Veg’, ‘3 Serves’ and ‘COOK’ ranges. The commitment to fresh also resonated with customers with fresh perception metrics increasing by four points on the prior year. To drive further differentiation, localised ranging remains key to evolving the customer proposition. During F20, ethnic ranges were launched in 54 stores, providing customers with even greater personalisation and choice for their grocery needs.
1. Live our Purpose and Build a Customer 1st Brand, Team & CultureThe team consistently put customers first and lived the Group purpose of creating better experiences together, every day through a year of unprecedented challenges.
2. Create Connected, Convenient and Safe Ways to ShopF20 was a transformative year for the Group’s online businesses, as capacity was doubled following the onset of COVID-19 to keep up with demand from customers seeking safe and convenient ways to meet their shopping needs.
3. Differentiate our Food Customer PropositionsDespite the unique challenges throughout F20, the Food businesses remained focused on evolving the customer offer to create even more engaging and easy experiences.
6
Better together recognition To recognise the extraordinary efforts of the team in F20, and their collective commitment to always do the right thing, the Better Together Recognition Award was announced in early June. The share recognition program was set up to reward and thank team members who were not already eligible for existing Group variable reward schemes. This included many team members who work across Woolworths Group stores and supply chain networks. The award created the largest employee share ownership plan in Australia and New Zealand, covering over 106,000 team members, many of whom became shareholders for the first time.
online orders for vulnerable individuals unable to leave home. Some supermarkets were also reprioritised into delivery hubs, with modified trading hours to support the re-establishment of delivery services by mid-April. Online sales were strong across the Group in Q4 with growth of 71.9% on a normalised basis and online penetration of 7.1%, as services were enhanced to create better online experiences for customers.
Better rewards every day The new Everyday Rewards app was launched in May, with over a million downloads by the end of F20. The new app allows customers to access and activate personalised offers and includes a number of new features such as order tracking, Delivery Now and more seamless and secure payment options.
Evolving the in-store experienceCOVID-19 forced a change in customer shopping habits across supermarkets in the second half of F20. As an essential service, customers sought out easy and safe access to their everyday food needs. Supermarkets across Australia and New Zealand quickly adapted to new ways of working that supported socially-distant shopping as well as to unlock greater capacity for online demand. During the year, 29 (net) new stores were opened and 72 renewals completed across Australia and New Zealand. Progress was also made in F20 on the first eStores in Carrum Downs, Victoria and Penrose and Moorhouse in New Zealand which will help support the continued growth in online. The eStores have been purpose-built to support micro-fulfilment capabilities as part of the partnership with Takeoff Technologies.
Woolworths Group’s F20 strategy house consists of six key priorities that focus on the value drivers for the Group. Good progress was made against each priority, enabling the ongoing transformation of the Group.
The updated key priorities for F21 can be found on page 17 of this report.
1
2
3
4
5
PERFORM
AN
CE
HIG
HLIG
HTS
BUSIN
ESS REV
IEWD
IRECTO
RS' REPO
RTFIN
AN
CIA
L REPO
RTO
THER
INFO
RMATIO
N7
WO
OLW
ORTH
S GRO
UP
AN
NU
AL REPO
RT 2020
Woolworths and Vaughan Constructions commenced building works on the new Melbourne Fresh Distribution Centre in TruganinaWoolworths Group announced revised direct emissions target to 60% below 2015 levels by 2030
Remediation of salaried team members announcementAnnounced revamp of Everyday Rewards and Qantas Frequent Flyer partnership Announced commitment to bring TerraCycle’s Loop zero-waste reusable package solution to Woolworths in 2021
OUR KEY PRIORITIES
Supporting independent producersDuring F20, Endeavour Group continued to work with small and independent local producers as part of their efforts in localised ranging. As COVID-19 restrictions disproportionately impacted on-premise venues, leaving many independent producers with surplus stock, Dan Murphy’s fast-tracked over 400 new suppliers and over 3,000 new products both in-store and via its online marketplace. To further support suppliers, Endeavour Group temporarily reduced its payment terms to 14 days for small suppliers until at least 30 September 2020, when it will be reassessed.
The formation of Endeavour GroupFollowing Woolworths Group’s initial announcement in 2019, significant progress has been made on creating and transforming Endeavour Group. After gaining shareholder approval in December 2019, the restructure and merger of ALH and Endeavour Drinks to form Endeavour Group was completed in February. Since then, much work has been done to build the right systems and establish the many partnership agreements as Endeavour Group becomes an important part of the Group’s Food and Everyday Needs Ecosystem. The Woolworths Group Board has made the decision to defer the separation of Endeavour Group until calendar 2021, with the specific date subject to ongoing review due to the uncertain operating environment created by COVID-19.
Team 1st, Customer 1st approach to safetyThe safety of team members and customers was the top priority during F20. Pleasingly, key Group safety metrics improved significantly against targets set for the year, including a 19% reduction in the Total Recordable Injury Frequency Rate (TRIFR) from F19 to 11.94. Progress was also made on improving loading dock safety, including enhanced traffic controls, the installation of sensors to detect people and reversing trucks, better lighting and CCTV monitors to increase visibility, and improved team training. The Group also advanced its wellbeing approach in F20 emphasising mental health and financial assistance, to support team members through the unprecedented circumstances that COVID-19 presented.
4. Evolve our Drinks BusinessIn F20, Dan Murphy’s and BWS both delivered strong results supported by improvements across localised ranging and the in-store and digital customer experience.
5. Unlock Value in our PortfolioProgress continued in F20 to unlock long-term, sustainable shareholder value from our Portfolio.
6. Better for Customers, Simpler and Safer for Stores and SupportImproving end-to-end processes to support the safety of team and customers was critical during F20 and a key driver behind supply chain transformation plans.
Endeavour Group Transformation announcedWoolworths Group and Takeoff Technologies partnership announced
F20 timeline
OCT 19 NOV 19SEP 19JUL 19 AUG 19
Endeavour Drinks announced acquisition of leading McLaren Vale winery, Chapel HillWoolworths Group named Australia’s top company, and number one in Asia Pacific, in the 2019 Refinitiv Diversity & Inclusion Index
8
Scaling up convenience for customersIn response to the changing customer habits brought about by COVID-19, Dan Murphy’s and BWS both launched initiatives to make the customer experience easier and safer. Dan Murphy’s introduced contactless direct to boot Pick up to over 50% of its fleet and BWS increased its On Demand delivery service to over 950 stores. BWS also commenced a new partnership with Uber Eats in Victoria to provide ultra-convenient options for its customers. Endeavour Group also continued to inspire customers in their homes during lockdowns, with Dan Murphy’s launching virtual Thursday Night Trivia, BWS enlisting Australian comedian Celeste Barber for a video series on wine, and Langton’s weekly virtual wine tastings hosted by a range of guest stars.
A big year for BIG WIn the first half of F20, improvements in BIG W’s offer resonated with customers, leading to solid sales growth and a better mix of sales, including strong growth in Apparel. The material improvements to BIG W’s foundations have proven critical in supporting the material increase in demand for affordable everyday needs items following the onset of COVID-19. Comparable sales increased 11.2% for the year with Q4 comparable sales up 30.5%, and Q4 online sales growth of 181%. In response to increased demand for online services, BIG W scaled up its online business, rapidly launching new online hub stores and establishing contactless Drive-up across a number of sites.
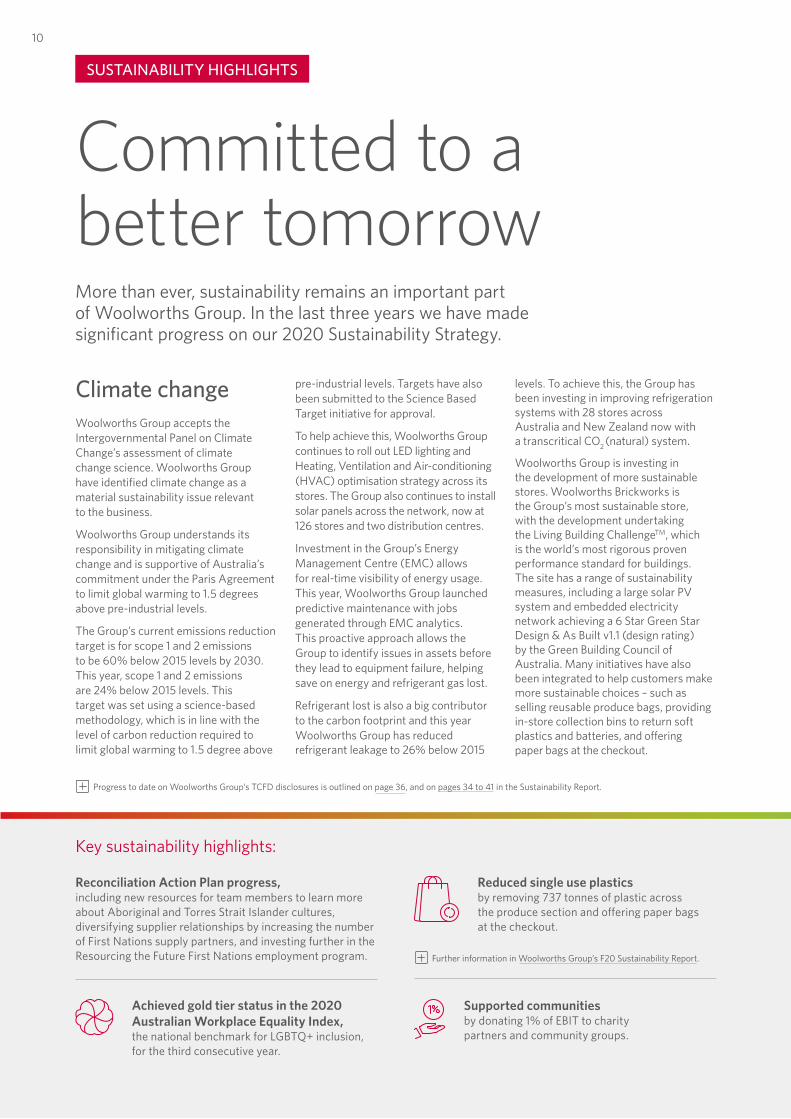
NSW supply chain transformationIn late June, the Group announced plans to transform its NSW grocery supply chain network, developing two new distribution centres to replace three existing sites. The new centres – an automated regional distribution centre and a semi-automated national distribution centre – will be located at Moorebank Logistics Park in Sydney. Construction is expected to be completed by the end of calendar 2023. The new sites will unlock greater capacity for growth, improve efficiencies, advance localised ranging efforts, and deliver better and safer experiences for Woolworths Supermarkets and its team members. The new facilities at Moorebank build on the automated technology deployed at the Group’s Melbourne South Regional Distribution Centre (MSRDC).
Completion of the internal restructure and ALH merger to form Endeavour Group Limited
Announced NSW supply chain transformation and the development of a new automated regional DC and semi-automated national DC to be co-located at Moorebank Logistics ParkWoolworths Group awarded gold tier status for the third year running by AWEI in the Australian LGBTQ+ Inclusion Awards
DEC 19 FEB 20 MAR 20
Shareholder approval of the Endeavour Group Restructure Scheme at 2019 EGMWoolworths Group extends paid leave policy for team members volunteering for rural fire services
COVID-19 update and temporary closure of Hotels on 23 March
MAY 20
New Everyday Rewards app launched
JUN 20
1
2
3
4
5
PERFORM
AN
CE
HIG
HLIG
HTS
BUSIN
ESS REV
IEWD
IRECTO
RS' REPO
RTFIN
AN
CIA
L REPO
RTO
THER
INFO
RMATIO
N
9
WO
OLW
ORTH
S GRO
UP
AN
NU
AL REPO
RT 2020
Woolworths and Vaughan Constructions commenced building works on the new Melbourne Fresh Distribution Centre in TruganinaWoolworths Group announced revised direct emissions target to 60% below 2015 levels by 2030
Remediation of salaried team members announcementAnnounced revamp of Everyday Rewards and Qantas Frequent Flyer partnership Announced commitment to bring TerraCycle’s Loop zero-waste reusable package solution to Woolworths in 2021
OUR KEY PRIORITIES
Supporting independent producersDuring F20, Endeavour Group continued to work with small and independent local producers as part of their efforts in localised ranging. As COVID-19 restrictions disproportionately impacted on-premise venues, leaving many independent producers with surplus stock, Dan Murphy’s fast-tracked over 400 new suppliers and over 3,000 new products both in-store and via its online marketplace. To further support suppliers, Endeavour Group temporarily reduced its payment terms to 14 days for small suppliers until at least 30 September 2020, when it will be reassessed.
The formation of Endeavour GroupFollowing Woolworths Group’s initial announcement in 2019, significant progress has been made on creating and transforming Endeavour Group. After gaining shareholder approval in December 2019, the restructure and merger of ALH and Endeavour Drinks to form Endeavour Group was completed in February. Since then, much work has been done to build the right systems and establish the many partnership agreements as Endeavour Group becomes an important part of the Group’s Food and Everyday Needs Ecosystem. The Woolworths Group Board has made the decision to defer the separation of Endeavour Group until calendar 2021, with the specific date subject to ongoing review due to the uncertain operating environment created by COVID-19.
Team 1st, Customer 1st approach to safetyThe safety of team members and customers was the top priority during F20. Pleasingly, key Group safety metrics improved significantly against targets set for the year, including a 19% reduction in the Total Recordable Injury Frequency Rate (TRIFR) from F19 to 11.94. Progress was also made on improving loading dock safety, including enhanced traffic controls, the installation of sensors to detect people and reversing trucks, better lighting and CCTV monitors to increase visibility, and improved team training. The Group also advanced its wellbeing approach in F20 emphasising mental health and financial assistance, to support team members through the unprecedented circumstances that COVID-19 presented.
4. Evolve our Drinks BusinessIn F20, Dan Murphy’s and BWS both delivered strong results supported by improvements across localised ranging and the in-store and digital customer experience.
5. Unlock Value in our PortfolioProgress continued in F20 to unlock long-term, sustainable shareholder value from our Portfolio.
6. Better for Customers, Simpler and Safer for Stores and SupportImproving end-to-end processes to support the safety of team and customers was critical during F20 and a key driver behind supply chain transformation plans.
Endeavour Group Transformation announcedWoolworths Group and Takeoff Technologies partnership announced
F20 timeline
OCT 19 NOV 19SEP 19JUL 19 AUG 19
Endeavour Drinks announced acquisition of leading McLaren Vale winery, Chapel HillWoolworths Group named Australia’s top company, and number one in Asia Pacific, in the 2019 Refinitiv Diversity & Inclusion Index
8
Scaling up convenience for customersIn response to the changing customer habits brought about by COVID-19, Dan Murphy’s and BWS both launched initiatives to make the customer experience easier and safer. Dan Murphy’s introduced contactless direct to boot Pick up to over 50% of its fleet and BWS increased its On Demand delivery service to over 950 stores. BWS also commenced a new partnership with Uber Eats in Victoria to provide ultra-convenient options for its customers. Endeavour Group also continued to inspire customers in their homes during lockdowns, with Dan Murphy’s launching virtual Thursday Night Trivia, BWS enlisting Australian comedian Celeste Barber for a video series on wine, and Langton’s weekly virtual wine tastings hosted by a range of guest stars.
A big year for BIG WIn the first half of F20, improvements in BIG W’s offer resonated with customers, leading to solid sales growth and a better mix of sales, including strong growth in Apparel. The material improvements to BIG W’s foundations have proven critical in supporting the material increase in demand for affordable everyday needs items following the onset of COVID-19. Comparable sales increased 11.2% for the year with Q4 comparable sales up 30.5%, and Q4 online sales growth of 181%. In response to increased demand for online services, BIG W scaled up its online business, rapidly launching new online hub stores and establishing contactless Drive-up across a number of sites.
NSW supply chain transformationIn late June, the Group announced plans to transform its NSW grocery supply chain network, developing two new distribution centres to replace three existing sites. The new centres – an automated regional distribution centre and a semi-automated national distribution centre – will be located at Moorebank Logistics Park in Sydney. Construction is expected to be completed by the end of calendar 2023. The new sites will unlock greater capacity for growth, improve efficiencies, advance localised ranging efforts, and deliver better and safer experiences for Woolworths Supermarkets and its team members. The new facilities at Moorebank build on the automated technology deployed at the Group’s Melbourne South Regional Distribution Centre (MSRDC).
Completion of the internal restructure and ALH merger to form Endeavour Group Limited
Announced NSW supply chain transformation and the development of a new automated regional DC and semi-automated national DC to be co-located at Moorebank Logistics ParkWoolworths Group awarded gold tier status for the third year running by AWEI in the Australian LGBTQ+ Inclusion Awards
DEC 19 FEB 20 MAR 20
Shareholder approval of the Endeavour Group Restructure Scheme at 2019 EGMWoolworths Group extends paid leave policy for team members volunteering for rural fire services
COVID-19 update and temporary closure of Hotels on 23 March
MAY 20
New Everyday Rewards app launched
JUN 20
1
2
3
4
5
PERFORM
AN
CE
HIG
HLIG
HTS
BUSIN
ESS REV
IEWD
IRECTO
RS' REPO
RTFIN
AN
CIA
L REPO
RTO
THER
INFO
RMATIO
N9
WO
OLW
ORTH
S GRO
UP
AN
NU
AL REPO
RT 2020
Climate changeWoolworths Group accepts the Intergovernmental Panel on Climate Change’s assessment of climate change science. Woolworths Group have identified climate change as a material sustainability issue relevant to the business.
Woolworths Group understands its responsibility in mitigating climate change and is supportive of Australia’s commitment under the Paris Agreement to limit global warming to 1.5 degrees above pre-industrial levels.
The Group’s current emissions reduction target is for scope 1 and 2 emissions to be 60% below 2015 levels by 2030. This year, scope 1 and 2 emissions are 24% below 2015 levels. This target was set using a science-based methodology, which is in line with the level of carbon reduction required to limit global warming to 1.5 degree above
pre-industrial levels. Targets have also been submitted to the Science Based Target initiative for approval.
To help achieve this, Woolworths Group continues to roll out LED lighting and Heating, Ventilation and Air-conditioning (HVAC) optimisation strategy across its stores. The Group also continues to install solar panels across the network, now at 126 stores and two distribution centres.
Investment in the Group’s Energy Management Centre (EMC) allows for real-time visibility of energy usage. This year, Woolworths Group launched predictive maintenance with jobs generated through EMC analytics. This proactive approach allows the Group to identify issues in assets before they lead to equipment failure, helping save on energy and refrigerant gas lost.
Refrigerant lost is also a big contributor to the carbon footprint and this year Woolworths Group has reduced refrigerant leakage to 26% below 2015
levels. To achieve this, the Group has been investing in improving refrigeration systems with 28 stores across Australia and New Zealand now with a transcritical CO2 (natural) system.
Woolworths Group is investing in the development of more sustainable stores. Woolworths Brickworks is the Group’s most sustainable store, with the development undertaking the Living Building ChallengeTM, which is the world’s most rigorous proven performance standard for buildings. The site has a range of sustainability measures, including a large solar PV system and embedded electricity network achieving a 6 Star Green Star Design & As Built v1.1 (design rating) by the Green Building Council of Australia. Many initiatives have also been integrated to help customers make more sustainable choices – such as selling reusable produce bags, providing in-store collection bins to return soft plastics and batteries, and offering paper bags at the checkout.
SUSTAINABILITY HIGHLIGHTS
Key sustainability highlights:
Reconciliation Action Plan progress, including new resources for team members to learn more about Aboriginal and Torres Strait Islander cultures, diversifying supplier relationships by increasing the number of First Nations supply partners, and investing further in the Resourcing the Future First Nations employment program.
Achieved gold tier status in the 2020 Australian Workplace Equality Index, the national benchmark for LGBTQ+ inclusion, for the third consecutive year.
Reduced single use plastics by removing 737 tonnes of plastic across the produce section and offering paper bags at the checkout.
Supported communities by donating 1% of EBIT to charity partners and community groups.
Progress to date on Woolworths Group’s TCFD disclosures is outlined on page 36, and on pages 34 to 41 in the Sustainability Report.
Further information in Woolworths Group’s F20 Sustainability Report.
Committed to a better tomorrowMore than ever, sustainability remains an important part of Woolworths Group. In the last three years we have made significant progress on our 2020 Sustainability Strategy.
10
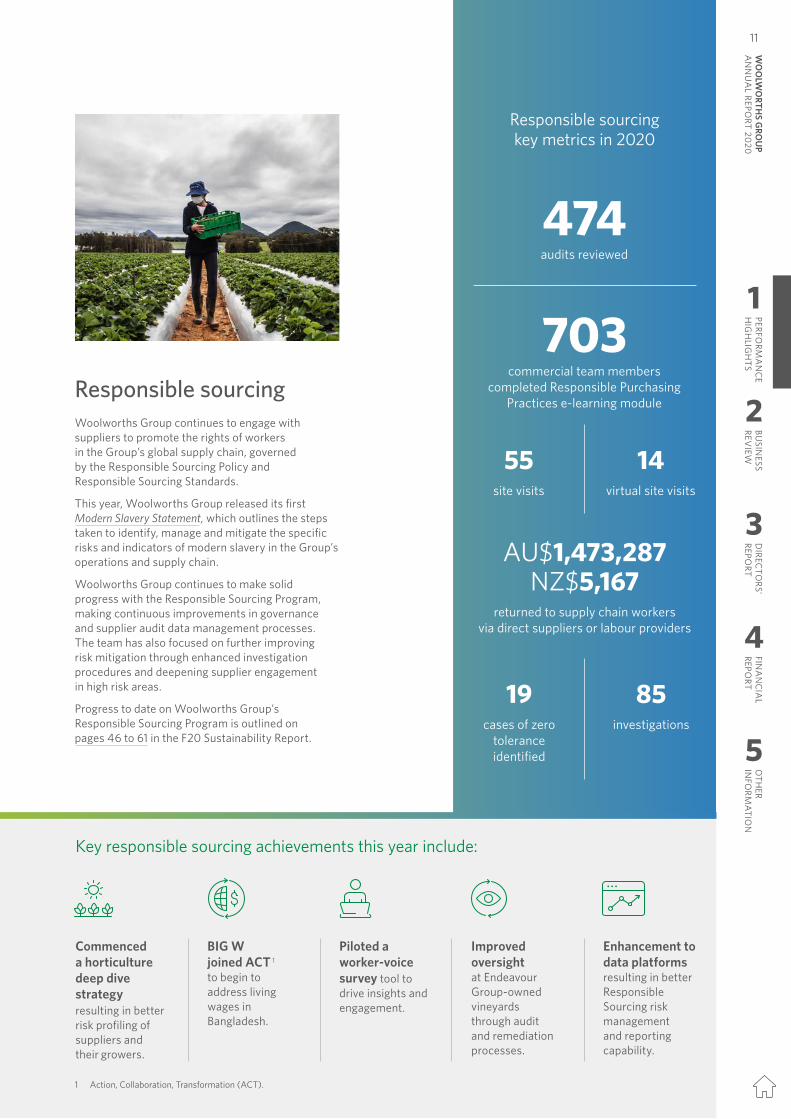
Responsible sourcingkey metrics in 2020
Responsible sourcingWoolworths Group continues to engage with suppliers to promote the rights of workers in the Group’s global supply chain, governed by the Responsible Sourcing Policy and Responsible Sourcing Standards.
This year, Woolworths Group released its first Modern Slavery Statement, which outlines the steps taken to identify, manage and mitigate the specific risks and indicators of modern slavery in the Group’s operations and supply chain.
Woolworths Group continues to make solid progress with the Responsible Sourcing Program, making continuous improvements in governance and supplier audit data management processes. The team has also focused on further improving risk mitigation through enhanced investigation procedures and deepening supplier engagement in high risk areas.
Progress to date on Woolworths Group’s Responsible Sourcing Program is outlined on pages 46 to 61 in the F20 Sustainability Report.
AU$1,473,287NZ$5,167
returned to supply chain workers via direct suppliers or labour providers
Key responsible sourcing achievements this year include:
Commenced a horticulture deep dive strategy resulting in better risk profiling of suppliers and their growers.
BIG W joined ACT 1 to begin to address living wages in Bangladesh.
Piloted a worker-voice survey tool to drive insights and engagement.
Improved oversight at Endeavour Group-owned vineyards through audit and remediation processes.
Enhancement to data platforms resulting in better Responsible Sourcing risk management and reporting capability.
474audits reviewed
703commercial team members
completed Responsible Purchasing Practices e-learning module
14virtual site visits
55site visits
85investigations
19cases of zero
tolerance identified
1 Action, Collaboration, Transformation (ACT).
1
2
3
4
5
PERFORM
AN
CE
HIG
HLIG
HTS
BUSIN
ESS REV
IEWD
IRECTO
RS' REPO
RTFIN
AN
CIA
L REPO
RTO
THER
INFO
RMATIO
N
11
WO
OLW
ORTH
S GRO
UP
AN
NU
AL REPO
RT 2020
Climate changeWoolworths Group accepts the Intergovernmental Panel on Climate Change’s assessment of climate change science. Woolworths Group have identified climate change as a material sustainability issue relevant to the business.
Woolworths Group understands its responsibility in mitigating climate change and is supportive of Australia’s commitment under the Paris Agreement to limit global warming to 1.5 degrees above pre-industrial levels.
The Group’s current emissions reduction target is for scope 1 and 2 emissions to be 60% below 2015 levels by 2030. This year, scope 1 and 2 emissions are 24% below 2015 levels. This target was set using a science-based methodology, which is in line with the level of carbon reduction required to limit global warming to 1.5 degree above
pre-industrial levels. Targets have also been submitted to the Science Based Target initiative for approval.
To help achieve this, Woolworths Group continues to roll out LED lighting and Heating, Ventilation and Air-conditioning (HVAC) optimisation strategy across its stores. The Group also continues to install solar panels across the network, now at 126 stores and two distribution centres.
Investment in the Group’s Energy Management Centre (EMC) allows for real-time visibility of energy usage. This year, Woolworths Group launched predictive maintenance with jobs generated through EMC analytics. This proactive approach allows the Group to identify issues in assets before they lead to equipment failure, helping save on energy and refrigerant gas lost.
Refrigerant lost is also a big contributor to the carbon footprint and this year Woolworths Group has reduced refrigerant leakage to 26% below 2015
levels. To achieve this, the Group has been investing in improving refrigeration systems with 28 stores across Australia and New Zealand now with a transcritical CO2 (natural) system.
Woolworths Group is investing in the development of more sustainable stores. Woolworths Brickworks is the Group’s most sustainable store, with the development undertaking the Living Building ChallengeTM, which is the world’s most rigorous proven performance standard for buildings. The site has a range of sustainability measures, including a large solar PV system and embedded electricity network achieving a 6 Star Green Star Design & As Built v1.1 (design rating) by the Green Building Council of Australia. Many initiatives have also been integrated to help customers make more sustainable choices – such as selling reusable produce bags, providing in-store collection bins to return soft plastics and batteries, and offering paper bags at the checkout.
SUSTAINABILITY HIGHLIGHTS
Key sustainability highlights:
Reconciliation Action Plan progress, including new resources for team members to learn more about Aboriginal and Torres Strait Islander cultures, diversifying supplier relationships by increasing the number of First Nations supply partners, and investing further in the Resourcing the Future First Nations employment program.
Achieved gold tier status in the 2020 Australian Workplace Equality Index, the national benchmark for LGBTQ+ inclusion, for the third consecutive year.
Reduced single use plastics by removing 737 tonnes of plastic across the produce section and offering paper bags at the checkout.
Supported communities by donating 1% of EBIT to charity partners and community groups.
Progress to date on Woolworths Group’s TCFD disclosures is outlined on page 36, and on pages 34 to 41 in the Sustainability Report.
Further information in Woolworths Group’s F20 Sustainability Report.
Committed to a better tomorrowMore than ever, sustainability remains an important part of Woolworths Group. In the last three years we have made significant progress on our 2020 Sustainability Strategy.
10
Responsible sourcingkey metrics in 2020
Responsible sourcingWoolworths Group continues to engage with suppliers to promote the rights of workers in the Group’s global supply chain, governed by the Responsible Sourcing Policy and Responsible Sourcing Standards.
This year, Woolworths Group released its first Modern Slavery Statement, which outlines the steps taken to identify, manage and mitigate the specific risks and indicators of modern slavery in the Group’s operations and supply chain.
Woolworths Group continues to make solid progress with the Responsible Sourcing Program, making continuous improvements in governance and supplier audit data management processes. The team has also focused on further improving risk mitigation through enhanced investigation procedures and deepening supplier engagement in high risk areas.
Progress to date on Woolworths Group’s Responsible Sourcing Program is outlined on pages 46 to 61 in the F20 Sustainability Report.
AU$1,473,287NZ$5,167
returned to supply chain workers via direct suppliers or labour providers
Key responsible sourcing achievements this year include:
Commenced a horticulture deep dive strategy resulting in better risk profiling of suppliers and their growers.
BIG W joined ACT 1 to begin to address living wages in Bangladesh.
Piloted a worker-voice survey tool to drive insights and engagement.
Improved oversight at Endeavour Group-owned vineyards through audit and remediation processes.
Enhancement to data platforms resulting in better Responsible Sourcing risk management and reporting capability.
474audits reviewed
703commercial team members
completed Responsible Purchasing Practices e-learning module
14virtual site visits
55site visits
85investigations
19cases of zero
tolerance identified
1 Action, Collaboration, Transformation (ACT).
1
2
3
4
5
PERFORM
AN
CE
HIG
HLIG
HTS
BUSIN
ESS REV
IEWD
IRECTO
RS' REPO
RTFIN
AN
CIA
L REPO
RTO
THER
INFO
RMATIO
N11
WO
OLW
ORTH
S GRO
UP
AN
NU
AL REPO
RT 2020
12
CHAIRMAN’S REPORT
Net profit after tax attributable to Woolworths Group shareholders 1
$1,602M� 1.2% from F19
(normalised)
F20 shareholder returns 2
$1.3B
Voice of Team engagement score
80%
How do we create a better tomorrow?In this year’s Chairman’s Report, I thought I would reflect on the experience of the last 12 months, as well as the learning, and the opportunity to fulfil our noble purpose, for a better tomorrow.
1 From continuing operations before significant items.
2 Includes F19 final and F20 interim dividend.
OTH
ER IN
FORM
ATION
5
4
FINA
NC
IAL
REPORT
3
DIREC
TORS'
REPORT
1
2
PERFORM
AN
CE
HIG
HLIG
HTS
BUSIN
ESS REV
IEWW
OO
LWO
RTHS G
ROU
P A
NN
UA
L REPORT 2020
13
This year, I wanted to focus on six key areas:
1 Safety and securityDuring this pandemic, our first priority has been the safety and security of our team and customers, at whatever cost. For our team this has meant concern for both their physical and mental wellbeing.
During this time, I have been both humbled and uplifted by the dedication of our team, and their absolute concern to do what is right. It would be remiss of me not to call out the outstanding leadership role that Brad has played both externally and internally in this. Thank you to everyone.
Unfortunately, it appears that major crises are occurring more frequently, and we must enshrine the learning and be prepared. In this way we create a safer tomorrow.
2 Customer obsessiveness
The customer of today wants and expects to be able to shop with us in a multitude of ways: in-store, home delivery, pick up, at a convenience store or Metro Food Store, and at a time that suits them.
The customer of tomorrow will expect all of the above at a continuously improving standard. Whether that be website speed, perfect order to the home, in-store service and experience, more localisation of range, improved value, healthier eating options, and community involvement.
We create a better tomorrow for our customers by embracing this challenge.
3 New ways of workingThe COVID-19 pandemic has vividly demonstrated to us our ability to get things done quickly and efficiently. We must not lose the insights from this agility.
We pushed decision-making down to nearest the customer or the problem, relying on enough information, not perfect information. We got more right than wrong, but with the latter, we did not obsess but moved quickly to change. This is the ‘freedom within a framework’ we have been working on.
But this will not be enough for the tomorrow. We need to address the institutional frameworks that inhibit teamwork or flexibility. We need to work with our partners in the unions to address the rigidities in enterprise agreements, to create more jobs, as shopping patterns change. With goodwill on both sides, this can create a better tomorrow for our team.
4 SustainabilityWe separately, in our Sustainability Report, outline our extensive programs in this area. I would like to call out three in particular where I am most passionate. The first is carbon reduction, arguably the greatest global challenge of my lifetime. Not only are we committing to measure our scope 1 and 2 emissions, with target reductions, but ambitiously and appropriately, to be carbon neutral by 2050. We cannot wait for regulation to lead here. We, in industry, must provide that leadership.
My second passion in this area is the elimination of plastic from our supply chain. Only 9% of all plastic ever made has been recycled. We are fast running out of landfill, and we must stop polluting our oceans, where more than eight million tonnes of plastic waste flows every year. We are making good progress here, but it is a complex problem, with our customers also demanding the highest standards of hygiene.
And my third concern is we must use our powerful position as the largest private-sector employer in corporate Australia to argue publicly for an enabling voice for Indigenous people, and constitutional recognition.
All of the above will ensure a more just and sustainable future.
5 Counter-cyclical investment
Whilst some companies may choose to contract during COVID-19, and reduce capex, we believe that the right strategy is to invest. Thus, we announced plans to invest over $700 million in our NSW
supply chain over the next four years, and will continue with our new store and existing store Renewal program, and our investment in eCommerce. Also announced in August of this year, was our strategic investment in PFD Food Services. This is predicated on a strong balance sheet, sound capital management with investment grade rating and consistent distributions to shareholders. We also have a healthy return on funds employed of 14%, well above our cost of capital.
By choosing to invest we will emerge from this pandemic in a stronger position, than those who choose to contract.
This should ensure a better tomorrow for shareholders.
6 Leadership development
It has been self-evident during this crisis the importance of leadership at all levels of the organisation. Every day they have demonstrated our Core Values in action. But we are at the early days of formally developing this leadership program and making it a true differentiator. We made a good start in F20 by appointing a Director of Executive Talent, and focusing on the senior team.
By making this one of our pillars, we can create a better tomorrow for all.
On the subject of leaders, I wanted to take this opportunity to acknowledge the contribution of Jillian Broadbent. I thank Jillian for her service to Woolworths Group and contribution over the last nine years. The Board and management team have benefited greatly from her wisdom and insight. The Board intends to announce Jillian’s replacement shortly.
In conclusion, despite the fact that we are in the midst of a global pandemic, and the worst economic downturn since the Great Depression, we have embraced the challenge to create a better tomorrow. I can think of no better noble purpose.
Gordon Cairns CHAIRMAN
14
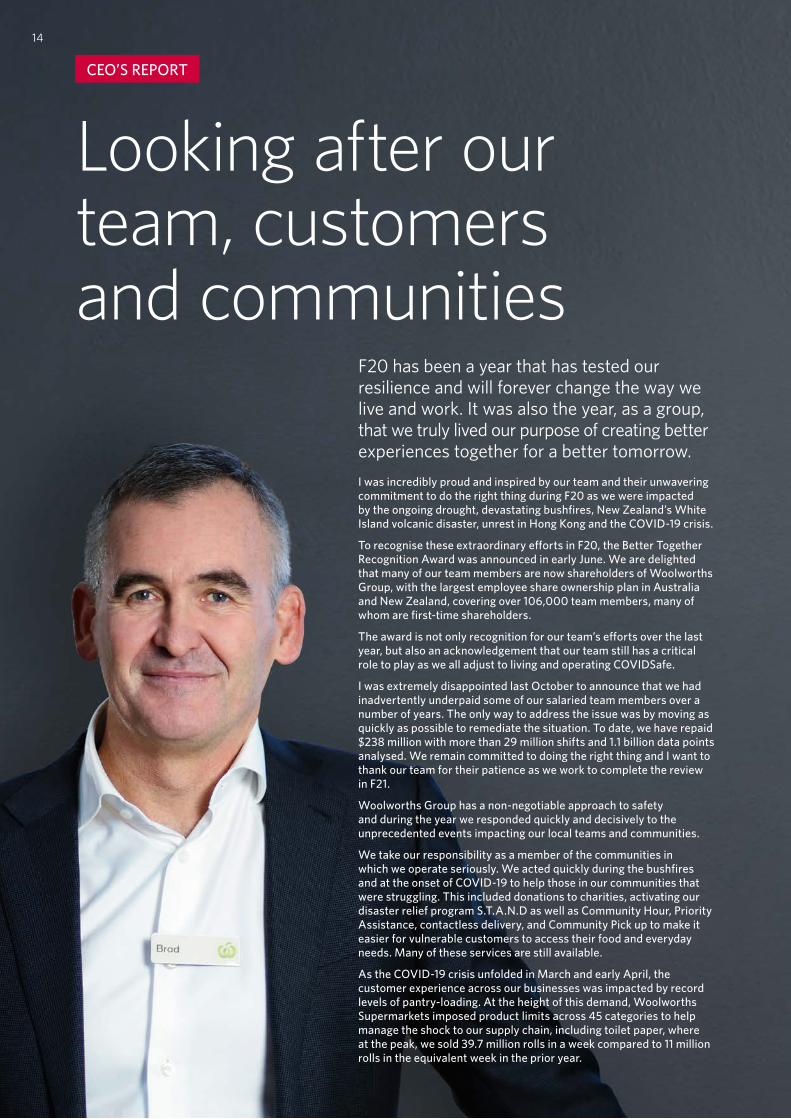
CEO’S REPORT
Looking after our team, customers and communities
F20 has been a year that has tested our resilience and will forever change the way we live and work. It was also the year, as a group, that we truly lived our purpose of creating better experiences together for a better tomorrow. I was incredibly proud and inspired by our team and their unwavering commitment to do the right thing during F20 as we were impacted by the ongoing drought, devastating bushfires, New Zealand’s White Island volcanic disaster, unrest in Hong Kong and the COVID-19 crisis.
To recognise these extraordinary efforts in F20, the Better Together Recognition Award was announced in early June. We are delighted that many of our team members are now shareholders of Woolworths Group, with the largest employee share ownership plan in Australia and New Zealand, covering over 106,000 team members, many of whom are first-time shareholders.
The award is not only recognition for our team’s efforts over the last year, but also an acknowledgement that our team still has a critical role to play as we all adjust to living and operating COVIDSafe.
I was extremely disappointed last October to announce that we had inadvertently underpaid some of our salaried team members over a number of years. The only way to address the issue was by moving as quickly as possible to remediate the situation. To date, we have repaid $238 million with more than 29 million shifts and 1.1 billion data points analysed. We remain committed to doing the right thing and I want to thank our team for their patience as we work to complete the review in F21.
Woolworths Group has a non-negotiable approach to safety and during the year we responded quickly and decisively to the unprecedented events impacting our local teams and communities.
We take our responsibility as a member of the communities in which we operate seriously. We acted quickly during the bushfires and at the onset of COVID-19 to help those in our communities that were struggling. This included donations to charities, activating our disaster relief program S.T.A.N.D as well as Community Hour, Priority Assistance, contactless delivery, and Community Pick up to make it easier for vulnerable customers to access their food and everyday needs. Many of these services are still available.
As the COVID-19 crisis unfolded in March and early April, the customer experience across our businesses was impacted by record levels of pantry-loading. At the height of this demand, Woolworths Supermarkets imposed product limits across 45 categories to help manage the shock to our supply chain, including toilet paper, where at the peak, we sold 39.7 million rolls in a week compared to 11 million rolls in the equivalent week in the prior year.
OTH
ER IN
FORM
ATION
5
FINA
NC
IAL
REPORT
4
DIREC
TORS'
REPORT
3
2
BUSIN
ESS REV
IEW
1
PERFORM
AN
CE
HIG
HLIG
HTS
WO
OLW
ORTH
S GRO
UP
AN
NU
AL REPO
RT 2020
15
After some weakness in March, customer scores quickly recovered in April as availability issues were resolved, with Group VOC NPS ending the year at 57, up two points on June 2019. Woolworths’ brand reputation metrics also improved over this period, up nearly five points from Q3 to Q4 as customers recognised the efforts of our team as well as the industry’s response to COVID-19.
F20 performance – a tale of four quarters We started the year with momentum and ended the year the same way, but the real story is what happened in between, with many ups and downs.
F20 started strongly with two successful collectibles programs in Australian Food, the launch of BIG W’s ‘Every day is a big day’ brand campaign, and the revamp of Dan Murphy’s (My Dan’s) loyalty program.
Trading in the second quarter was more challenging, impacted by a full change agenda, including a new customer operating model in Woolworths Supermarkets, the salaried team members pay review, the effects of the severe drought and the early stages of the bushfires. Despite this, we closed the first half with good momentum, with all businesses delivering positive sales and earnings growth with H1 Group EBIT from continuing operations before significant items of 11.4%1.
The start of Q3 was dominated by the impact of bushfires with subdued sales in January and February, especially in our stores located in resort destinations, which were disproportionately impacted by the fires. Fortunately, good rainfall in February and the tireless work of firefighters allowed the bushfires to be brought under control. However, the good news was short-lived with COVID-19 escalating rapidly from late February.
Australian and New Zealand Food sales increased materially during March as customers pantry-loaded ahead of expectations of lockdowns, with weekly growth reaching over 40% and 50% at its peak.
For Drinks, sales surged later in Q3 as on-premise venues, including the Group’s Hotels business, were closed under government-mandated restrictions on 23 March.
In Q4, Food sales slowed from the peak levels but remained elevated as customers consumed more at home. Drinks sales continued to benefit from the closure of on-premise venues. While already trading strongly, BIG W’s sales grew rapidly from the end of April, ending the year with strong comparable sales growth and a material improvement in EBIT.
It was another transformative year for the Group’s digital and eCommerce businesses. Already growing strongly, there was a step-change in demand in Q3 following the onset of COVID-19. After some disruption to services in Q3, the businesses rapidly added capacity as customers increasingly looked to online for safe and easy solutions to their everyday needs. Some highlights were BIG W’s online sales increasing by 181% in Q4 and New Zealand Food’s online penetration in Q4 reaching 11.9%. Group online penetration in F20 reached 5.5% of sales.
Despite the increase in sales in all businesses other than Hotels, COVID-19 had a broader impact on the Group’s financial performance in F20. The closure of Hotels for much of the last four months of the financial year led to a material decline in its H2 EBIT compared to the prior year. However, this was partially offset by EBIT growth across other businesses due to higher sales growth despite materially higher
costs of customer and team safety in H2. F20 EBIT from continuing operations before significant items was $3,219 million, down 0.4% 1 on F19.
Working together to be COVIDSafe in this new normal environment The recent increase in positive cases, as well as the tighter restrictions in Victoria, is an unfortunate reminder that we will likely have to live with COVID-19 for the foreseeable future.
As a Group, we want to lead in role-modelling COVIDSafe behaviours across our team and in the communities in which we operate and make them a normal part of how we live for now. This involves recalibrating how we operate and applying a COVIDSafe lens to all our decision-making.
We have developed a set of COVIDSafe standards for each operating environment and have focused on five key areas as part of our response, which includes health, hygiene, personal protective equipment, cleaning and social distancing. We have also established a COVID Planning and Response Squad and appointed a Chief Medical Officer. Keeping our business COVIDSafe has also been incorporated into the Group’s strategic key priorities for F21.
Looking ahead
Our F21 priorities continue to reflect Woolworths Group’s transformation into a Food and Everyday Needs Ecosystem, looking to adjacencies for growth and partnerships that extend our range and services. We look forward to further unlocking these opportunities to deliver sustainable returns for all our stakeholders.
I want to thank our customers, our team, and the communities within which we operate for their continued support during F20. We are all in this together, and it’s only by continuing to be better together that we can succeed in this uniquely challenging and uncertain environment.
Brad Banducci CHIEF EXECUTIVE OFFICER
1 Normalised for 53rd week and AASB 16.
14
CEO’S REPORT
Looking after our team, customers and communities
F20 has been a year that has tested our resilience and will forever change the way we live and work. It was also the year, as a group, that we truly lived our purpose of creating better experiences together for a better tomorrow. I was incredibly proud and inspired by our team and their unwavering commitment to do the right thing during F20 as we were impacted by the ongoing drought, devastating bushfires, New Zealand’s White Island volcanic disaster, unrest in Hong Kong and the COVID-19 crisis.
To recognise these extraordinary efforts in F20, the Better Together Recognition Award was announced in early June. We are delighted that many of our team members are now shareholders of Woolworths Group, with the largest employee share ownership plan in Australia and New Zealand, covering over 106,000 team members, many of whom are first-time shareholders.
The award is not only recognition for our team’s efforts over the last year, but also an acknowledgement that our team still has a critical role to play as we all adjust to living and operating COVIDSafe.
I was extremely disappointed last October to announce that we had inadvertently underpaid some of our salaried team members over a number of years. The only way to address the issue was by moving as quickly as possible to remediate the situation. To date, we have repaid $238 million with more than 29 million shifts and 1.1 billion data points analysed. We remain committed to doing the right thing and I want to thank our team for their patience as we work to complete the review in F21.
Woolworths Group has a non-negotiable approach to safety and during the year we responded quickly and decisively to the unprecedented events impacting our local teams and communities.
We take our responsibility as a member of the communities in which we operate seriously. We acted quickly during the bushfires and at the onset of COVID-19 to help those in our communities that were struggling. This included donations to charities, activating our disaster relief program S.T.A.N.D as well as Community Hour, Priority Assistance, contactless delivery, and Community Pick up to make it easier for vulnerable customers to access their food and everyday needs. Many of these services are still available.
As the COVID-19 crisis unfolded in March and early April, the customer experience across our businesses was impacted by record levels of pantry-loading. At the height of this demand, Woolworths Supermarkets imposed product limits across 45 categories to help manage the shock to our supply chain, including toilet paper, where at the peak, we sold 39.7 million rolls in a week compared to 11 million rolls in the equivalent week in the prior year.
OTH
ER IN
FORM
ATION
5
FINA
NC
IAL
REPORT
4
DIREC
TORS'
REPORT
3
2
BUSIN
ESS REV
IEW
1
PERFORM
AN
CE
HIG
HLIG
HTS
WO
OLW
ORTH
S GRO
UP
AN
NU
AL REPO
RT 202015
After some weakness in March, customer scores quickly recovered in April as availability issues were resolved, with Group VOC NPS ending the year at 57, up two points on June 2019. Woolworths’ brand reputation metrics also improved over this period, up nearly five points from Q3 to Q4 as customers recognised the efforts of our team as well as the industry’s response to COVID-19.
F20 performance – a tale of four quarters We started the year with momentum and ended the year the same way, but the real story is what happened in between, with many ups and downs.
F20 started strongly with two successful collectibles programs in Australian Food, the launch of BIG W’s ‘Every day is a big day’ brand campaign, and the revamp of Dan Murphy’s (My Dan’s) loyalty program.
Trading in the second quarter was more challenging, impacted by a full change agenda, including a new customer operating model in Woolworths Supermarkets, the salaried team members pay review, the effects of the severe drought and the early stages of the bushfires. Despite this, we closed the first half with good momentum, with all businesses delivering positive sales and earnings growth with H1 Group EBIT from continuing operations before significant items of 11.4%1.
The start of Q3 was dominated by the impact of bushfires with subdued sales in January and February, especially in our stores located in resort destinations, which were disproportionately impacted by the fires. Fortunately, good rainfall in February and the tireless work of firefighters allowed the bushfires to be brought under control. However, the good news was short-lived with COVID-19 escalating rapidly from late February.
Australian and New Zealand Food sales increased materially during March as customers pantry-loaded ahead of expectations of lockdowns, with weekly growth reaching over 40% and 50% at its peak.
For Drinks, sales surged later in Q3 as on-premise venues, including the Group’s Hotels business, were closed under government-mandated restrictions on 23 March.
In Q4, Food sales slowed from the peak levels but remained elevated as customers consumed more at home. Drinks sales continued to benefit from the closure of on-premise venues. While already trading strongly, BIG W’s sales grew rapidly from the end of April, ending the year with strong comparable sales growth and a material improvement in EBIT.
It was another transformative year for the Group’s digital and eCommerce businesses. Already growing strongly, there was a step-change in demand in Q3 following the onset of COVID-19. After some disruption to services in Q3, the businesses rapidly added capacity as customers increasingly looked to online for safe and easy solutions to their everyday needs. Some highlights were BIG W’s online sales increasing by 181% in Q4 and New Zealand Food’s online penetration in Q4 reaching 11.9%. Group online penetration in F20 reached 5.5% of sales.
Despite the increase in sales in all businesses other than Hotels, COVID-19 had a broader impact on the Group’s financial performance in F20. The closure of Hotels for much of the last four months of the financial year led to a material decline in its H2 EBIT compared to the prior year. However, this was partially offset by EBIT growth across other businesses due to higher sales growth despite materially higher
costs of customer and team safety in H2. F20 EBIT from continuing operations before significant items was $3,219 million, down 0.4% 1 on F19.
Working together to be COVIDSafe in this new normal environment The recent increase in positive cases, as well as the tighter restrictions in Victoria, is an unfortunate reminder that we will likely have to live with COVID-19 for the foreseeable future.
As a Group, we want to lead in role-modelling COVIDSafe behaviours across our team and in the communities in which we operate and make them a normal part of how we live for now. This involves recalibrating how we operate and applying a COVIDSafe lens to all our decision-making.
We have developed a set of COVIDSafe standards for each operating environment and have focused on five key areas as part of our response, which includes health, hygiene, personal protective equipment, cleaning and social distancing. We have also established a COVID Planning and Response Squad and appointed a Chief Medical Officer. Keeping our business COVIDSafe has also been incorporated into the Group’s strategic key priorities for F21.
Looking ahead
Our F21 priorities continue to reflect Woolworths Group’s transformation into a Food and Everyday Needs Ecosystem, looking to adjacencies for growth and partnerships that extend our range and services. We look forward to further unlocking these opportunities to deliver sustainable returns for all our stakeholders.
I want to thank our customers, our team, and the communities within which we operate for their continued support during F20. We are all in this together, and it’s only by continuing to be better together that we can succeed in this uniquely challenging and uncertain environment.
Brad Banducci CHIEF EXECUTIVE OFFICER
1 Normalised for 53rd week and AASB 16.
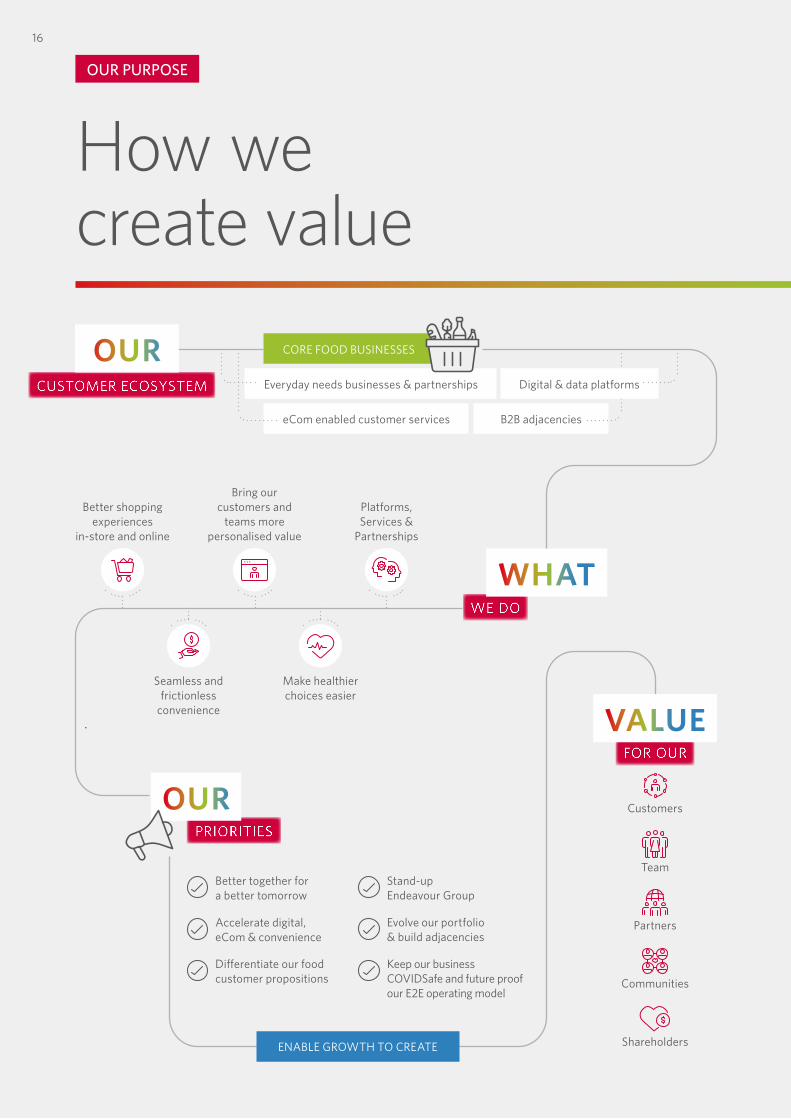
16
OUR PURPOSE
How we create value
WE DO
WHAT
Stand-up Endeavour Group
Evolve our portfolio & build adjacencies
Better together for a better tomorrow
Accelerate digital, eCom & convenience
Differentiate our food customer propositions
Keep our business COVIDSafe and future proof our E2E operating model
Communities
Customers
Team
Partners
Shareholders
CORE FOOD BUSINESSES
Everyday needs businesses & partnerships
eCom enabled customer services B2B adjacencies
Better shopping experiences
in-store and online
Seamless and frictionless
convenience
Bring our customers and
teams more personalised value
Make healthier choices easier
Platforms, Services &
Partnerships
Digital & data platforms
PRIORITIES
OUR
ENABLE GROWTH TO CREATE
FOR OUR
VALUE
CUSTOMER ECOSYSTEM
OUR
We create better experiences together for a better tomorrow.The Group purpose is our collective “why” and is the foundation and enabler for each of our brand’s individual purpose.
To make a real difference to families.
To connect everyone with a drinks experience they’ll love.
Purpose, Ways-of-Working and F21 Strategic PrioritiesAs the transformation continues, Woolworths Group’s strategy house and priorities focus on the key value drivers for the Group. Since the start of the Group’s turnaround in F17, the key priorities have remained broadly consistent, evolving only to meet the changing needs of customers. In F21, the six key priorities reflect the Group’s transformation into a Food and Everyday Needs Ecosystem, with complementary adjacencies for growth and partnerships that extend the Group’s range and services. Our purpose, to create better experiences together for a better tomorrow, brings our Food and Everyday Needs Ecosystem together, and our customer and team-first culture is at the core of any decision making. Team member performance measures continue to include Agile Ways-of-Working to align with the Group’s Core Values and the commitment to being a purpose-led organisation.
Keep our business COVIDSafe and future proof our E2E operating model
Stand-up Endeavour
Group
Evolve our Portfolio and build
adjacencies
Expand our food customer propositions
Accelerate Digital, eCom and convenience for our connected customers
Better Together for a Better Tomorrow
5
1
432Deliver store and eStore propositions that meet changing customer needs
Maintain trust with our customers, team and communities
Future proof our E2E operating model
Core values
Care deeply
Always do the right thing
Listen and learn
6
We’re here to make Kiwis’ lives a little better every day.
We bring a little good to everyone, every day.
Enjoy a little more everyday.
1
2
3
4
5
PERFORM
AN
CE
HIG
HLIG
HTS
BUSIN
ESS REV
IEWD
IRECTO
RS' REPO
RTFIN
AN
CIA
L REPO
RTO
THER
INFO
RMATIO
N
17
WO
OLW
ORTH
S GRO
UP
AN
NU
AL REPO
RT 2020
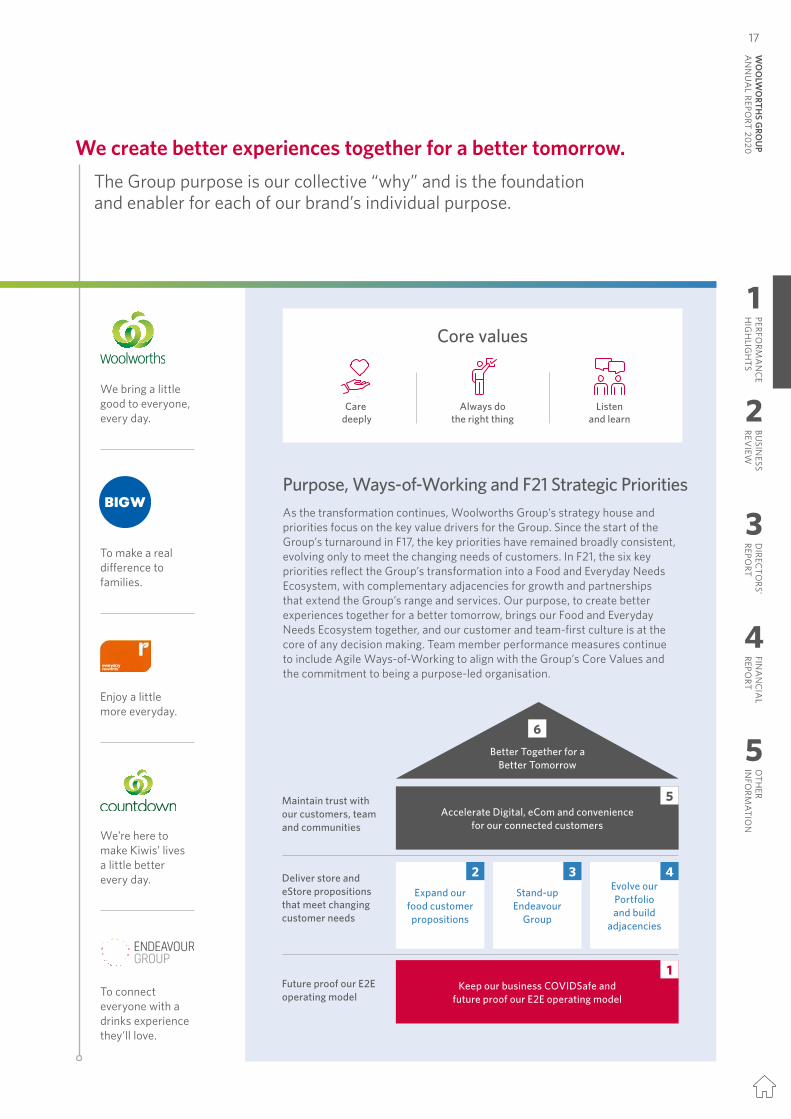
16
OUR PURPOSE
How we create value
WE DO
WHAT
Stand-up Endeavour Group
Evolve our portfolio & build adjacencies
Better together for a better tomorrow
Accelerate digital, eCom & convenience
Differentiate our food customer propositions
Keep our business COVIDSafe and future proof our E2E operating model
Communities
Customers
Team
Partners
Shareholders
CORE FOOD BUSINESSES
Everyday needs businesses & partnerships
eCom enabled customer services B2B adjacencies
Better shopping experiences
in-store and online
Seamless and frictionless
convenience
Bring our customers and
teams more personalised value
Make healthier choices easier
Platforms, Services &
Partnerships
Digital & data platforms
PRIORITIES
OUR
ENABLE GROWTH TO CREATE
FOR OUR
VALUE
CUSTOMER ECOSYSTEM
OUR
We create better experiences together for a better tomorrow.The Group purpose is our collective “why” and is the foundation and enabler for each of our brand’s individual purpose.
To make a real difference to families.
To connect everyone with a drinks experience they’ll love.
Purpose, Ways-of-Working and F21 Strategic PrioritiesAs the transformation continues, Woolworths Group’s strategy house and priorities focus on the key value drivers for the Group. Since the start of the Group’s turnaround in F17, the key priorities have remained broadly consistent, evolving only to meet the changing needs of customers. In F21, the six key priorities reflect the Group’s transformation into a Food and Everyday Needs Ecosystem, with complementary adjacencies for growth and partnerships that extend the Group’s range and services. Our purpose, to create better experiences together for a better tomorrow, brings our Food and Everyday Needs Ecosystem together, and our customer and team-first culture is at the core of any decision making. Team member performance measures continue to include Agile Ways-of-Working to align with the Group’s Core Values and the commitment to being a purpose-led organisation.
Keep our business COVIDSafe and future proof our E2E operating model
Stand-up Endeavour
Group
Evolve our Portfolio and build
adjacencies
Expand our food customer propositions
Accelerate Digital, eCom and convenience for our connected customers
Better Together for a Better Tomorrow
5
1
432Deliver store and eStore propositions that meet changing customer needs
Maintain trust with our customers, team and communities
Future proof our E2E operating model
Core values
Care deeply
Always do the right thing
Listen and learn
6
We’re here to make Kiwis’ lives a little better every day.
We bring a little good to everyone, every day.
Enjoy a little more everyday.
1
2
3
4
5
PERFORM
AN
CE
HIG
HLIG
HTS
BUSIN
ESS REV
IEWD
IRECTO
RS' REPO
RTFIN
AN
CIA
L REPO
RTO
THER
INFO
RMATIO
N17
WO
OLW
ORTH
S GRO
UP
AN
NU
AL REPO
RT 2020
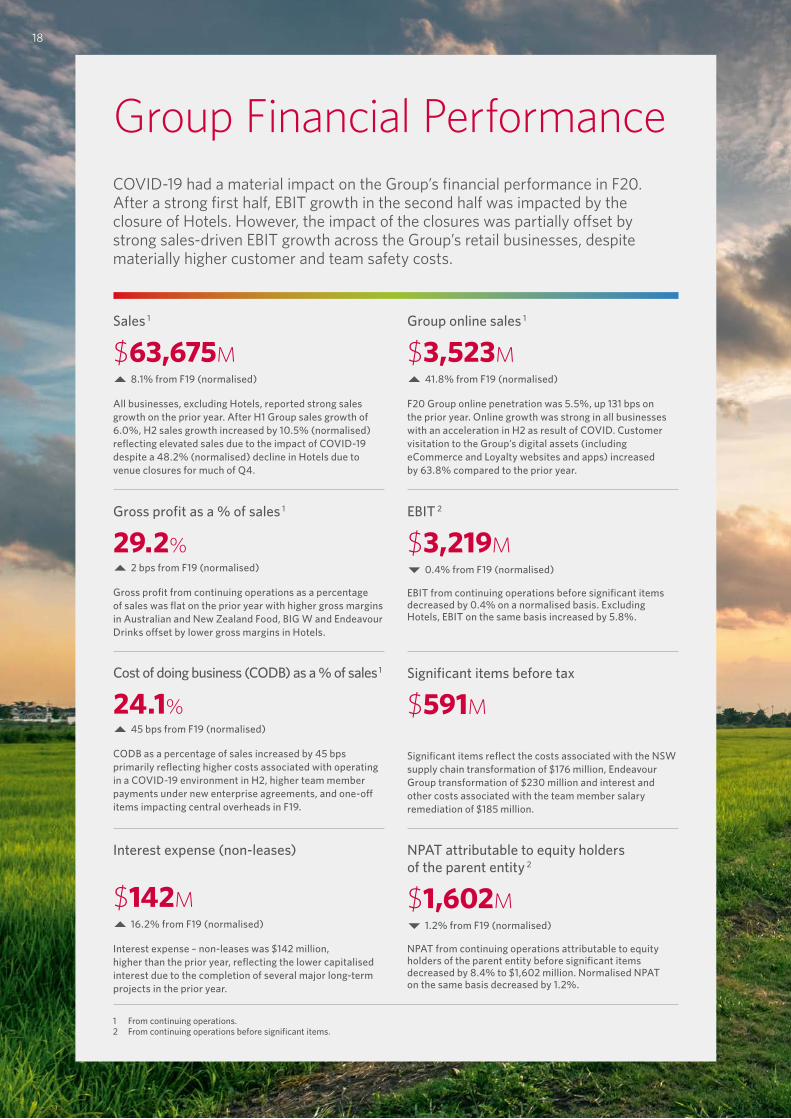
Group Financial PerformanceCOVID-19 had a material impact on the Group’s financial performance in F20. After a strong first half, EBIT growth in the second half was impacted by the closure of Hotels. However, the impact of the closures was partially offset by strong sales-driven EBIT growth across the Group’s retail businesses, despite materially higher customer and team safety costs.
Sales 1
$63,675M 8.1% from F19 (normalised)
All businesses, excluding Hotels, reported strong sales growth on the prior year. After H1 Group sales growth of 6.0%, H2 sales growth increased by 10.5% (normalised) reflecting elevated sales due to the impact of COVID-19 despite a 48.2% (normalised) decline in Hotels due to venue closures for much of Q4.
Group online sales 1
$3,523M 41.8% from F19 (normalised)
F20 Group online penetration was 5.5%, up 131 bps on the prior year. Online growth was strong in all businesses with an acceleration in H2 as result of COVID. Customer visitation to the Group’s digital assets (including eCommerce and Loyalty websites and apps) increased by 63.8% compared to the prior year.
Gross profit as a % of sales 1
29.2% 2 bps from F19 (normalised)
Gross profit from continuing operations as a percentage of sales was flat on the prior year with higher gross margins in Australian and New Zealand Food, BIG W and Endeavour Drinks offset by lower gross margins in Hotels.
Significant items before tax
$591M
Significant items reflect the costs associated with the NSW supply chain transformation of $176 million, Endeavour Group transformation of $230 million and interest and other costs associated with the team member salary remediation of $185 million.
Interest expense (non-leases)
$142M 16.2% from F19 (normalised)
Interest expense – non-leases was $142 million, higher than the prior year, reflecting the lower capitalised interest due to the completion of several major long-term projects in the prior year.
NPAT attributable to equity holders of the parent entity 2
$1,602M 1.2% from F19 (normalised)
NPAT from continuing operations attributable to equity holders of the parent entity before significant items decreased by 8.4% to $1,602 million. Normalised NPAT on the same basis decreased by 1.2%.
1 From continuing operations.2 From continuing operations before significant items.
Cost of doing business (CODB) as a % of sales 1
24.1% 45 bps from F19 (normalised)
CODB as a percentage of sales increased by 45 bps primarily reflecting higher costs associated with operating in a COVID-19 environment in H2, higher team member payments under new enterprise agreements, and one-off items impacting central overheads in F19.
EBIT 2
$3,219M 0.4% from F19 (normalised)
EBIT from continuing operations before significant items decreased by 0.4% on a normalised basis. Excluding Hotels, EBIT on the same basis increased by 5.8%.
18
Sales summary – F20 ($ MILLION)
REPORTED F20
(52 WEEKS)
REPORTED 1
F19(53 WEEKS) CHANGE
NORMALISED CHANGE
(52 WEEKS)
Continuing operations Australian Food 42,151 39,635 6.3% 8.3%New Zealand Food 6,823 6,291 8.5% 10.5%
New Zealand Food (NZD) 7,192 6,712 7.2% 9.1%BIG W 4,106 3,797 8.2% 10.5%Endeavour Drinks 9,275 8,590 8.0% 9.9%Hotels 1,320 1,671 (21.0)% (19.5)%Sales from continuing operations 63,675 59,984 6.2% 8.1%Discontinued operationsPetrol 2 – 3,696 n.m. n.m.Sales from discontinued operations – 3,696 n.m. n.m.
Group sales continuing and discontinued operations (including online) 63,675 63,680 n.m. n.m.
Group online sales 3 3,523 2,534 39.1% 41.8%Online sales penetration (%) 5.5% 4.2% 131bpsAverage weekly traffic to Group digital assets (million) 14.2 8.7 63.8%
Earnings/(loss) before interest and tax (EBIT/(LBIT)) ($ MILLION)
REPORTED F20
(52 WEEKS)
REPORTED 1
F19(53 WEEKS) CHANGE
NORMALISED 4 F19
(52 WEEKS)NORMALISED 4
CHANGE
Continuing operations before significant itemsAustralian Food 2,232 1,827 22.2% 2,099 6.3%New Zealand Food 358 277 29.3% 320 12.0%
New Zealand Food (NZD) 378 296 27.7% 342 10.7%BIG W 39 (85) n.m. (31) n.m.Endeavour Drinks 569 504 12.9% 538 5.7%Hotels 172 261 (34.3)% 351 (51.0)%Central overheads (151) (62) 141.1% (45) 229.8%EBIT from continuing operations before significant items 3,219 2,722 18.3% 3,232 (0.4)%Significant items from continuing operations (591) (371) n.m.EBIT from continuing operations after significant items 2,628 2,351 11.8%Discontinued operationsPetrol 2 – 112 n.m.EBIT from discontinued operations before significant items – 112 n.m.Significant items from discontinued operations – 1,088 n.m.EBIT from discontinued operations after significant items – 1,200 n.m.Group EBIT continuing and discontinued operations 2,628 3,551 (26.0)%
1 Certain comparatives have been re-presented to conform with the current period’s presentation to better reflect the nature of the financial position and performance of the Group. The impact of the costs to remediate salaried team members has been corrected by the restatement of each of the affected financial statements line items for prior periods in accordance with the requirements for the correction of an error under AASB 108. The impact of the restatement is disclosed in Note 1.4 of the Financial Report.
2 Petrol sales and EBIT are for the nine months until sale on 1 April 2019.3 Group online sales and penetration are from continuing operations.4 Normalised results and growth reflect adjustments in F19 to remove the impact of the 53rd week in F19 and if AASB 16 had been in place in F19.
1
2
3
4
5
PERFORM
AN
CE
HIG
HLIG
HTS
BUSIN
ESS REV
IEWD
IRECTO
RS' REPO
RTFIN
AN
CIA
L REPO
RTO
THER
INFO
RMATIO
N
19
WO
OLW
ORTH
S GRO
UP
AN
NU
AL REPO
RT 2020
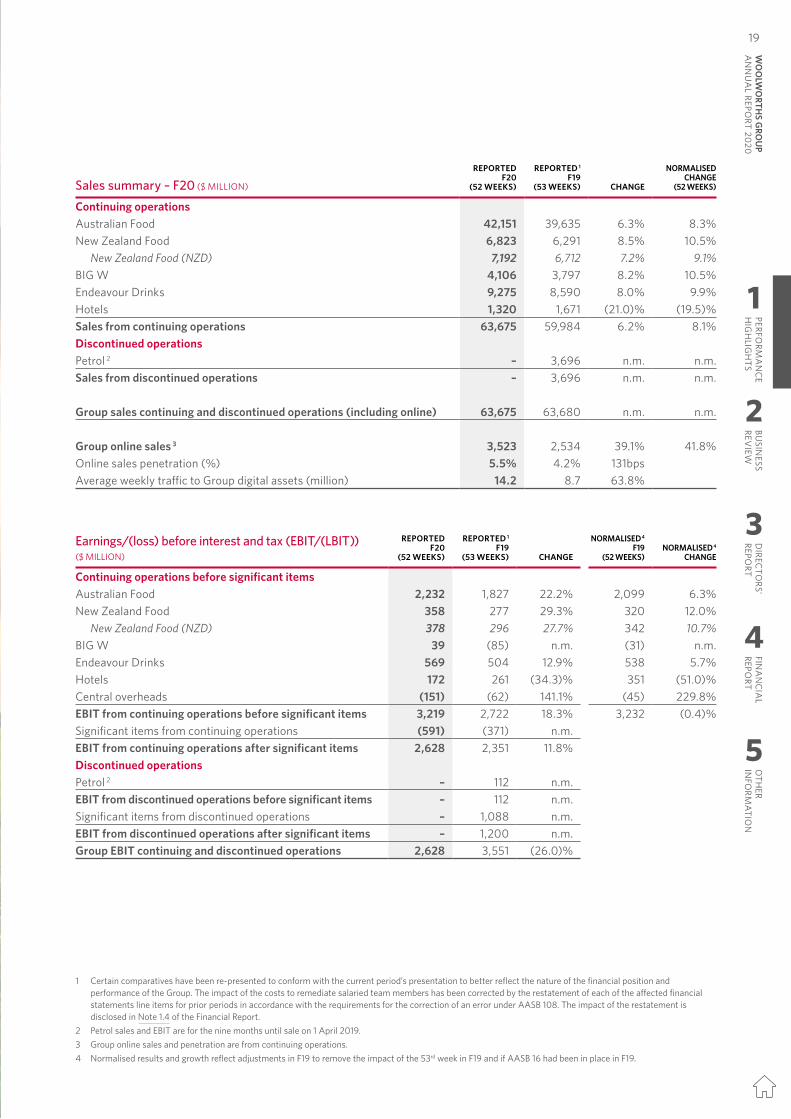
Group Financial PerformanceCOVID-19 had a material impact on the Group’s financial performance in F20. After a strong first half, EBIT growth in the second half was impacted by the closure of Hotels. However, the impact of the closures was partially offset by strong sales-driven EBIT growth across the Group’s retail businesses, despite materially higher customer and team safety costs.
Sales 1
$63,675M 8.1% from F19 (normalised)
All businesses, excluding Hotels, reported strong sales growth on the prior year. After H1 Group sales growth of 6.0%, H2 sales growth increased by 10.5% (normalised) reflecting elevated sales due to the impact of COVID-19 despite a 48.2% (normalised) decline in Hotels due to venue closures for much of Q4.
Group online sales 1
$3,523M 41.8% from F19 (normalised)
F20 Group online penetration was 5.5%, up 131 bps on the prior year. Online growth was strong in all businesses with an acceleration in H2 as result of COVID. Customer visitation to the Group’s digital assets (including eCommerce and Loyalty websites and apps) increased by 63.8% compared to the prior year.
Gross profit as a % of sales 1
29.2% 2 bps from F19 (normalised)
Gross profit from continuing operations as a percentage of sales was flat on the prior year with higher gross margins in Australian and New Zealand Food, BIG W and Endeavour Drinks offset by lower gross margins in Hotels.
Significant items before tax
$591M
Significant items reflect the costs associated with the NSW supply chain transformation of $176 million, Endeavour Group transformation of $230 million and interest and other costs associated with the team member salary remediation of $185 million.
Interest expense (non-leases)
$142M 16.2% from F19 (normalised)
Interest expense – non-leases was $142 million, higher than the prior year, reflecting the lower capitalised interest due to the completion of several major long-term projects in the prior year.
NPAT attributable to equity holders of the parent entity 2
$1,602M 1.2% from F19 (normalised)
NPAT from continuing operations attributable to equity holders of the parent entity before significant items decreased by 8.4% to $1,602 million. Normalised NPAT on the same basis decreased by 1.2%.
1 From continuing operations.2 From continuing operations before significant items.
Cost of doing business (CODB) as a % of sales 1
24.1% 45 bps from F19 (normalised)
CODB as a percentage of sales increased by 45 bps primarily reflecting higher costs associated with operating in a COVID-19 environment in H2, higher team member payments under new enterprise agreements, and one-off items impacting central overheads in F19.
EBIT 2
$3,219M 0.4% from F19 (normalised)
EBIT from continuing operations before significant items decreased by 0.4% on a normalised basis. Excluding Hotels, EBIT on the same basis increased by 5.8%.
18
Sales summary – F20 ($ MILLION)
REPORTED F20
(52 WEEKS)
REPORTED 1
F19(53 WEEKS) CHANGE
NORMALISED CHANGE
(52 WEEKS)
Continuing operations Australian Food 42,151 39,635 6.3% 8.3%New Zealand Food 6,823 6,291 8.5% 10.5%
New Zealand Food (NZD) 7,192 6,712 7.2% 9.1%BIG W 4,106 3,797 8.2% 10.5%Endeavour Drinks 9,275 8,590 8.0% 9.9%Hotels 1,320 1,671 (21.0)% (19.5)%Sales from continuing operations 63,675 59,984 6.2% 8.1%Discontinued operationsPetrol 2 – 3,696 n.m. n.m.Sales from discontinued operations – 3,696 n.m. n.m.
Group sales continuing and discontinued operations (including online) 63,675 63,680 n.m. n.m.
Group online sales 3 3,523 2,534 39.1% 41.8%Online sales penetration (%) 5.5% 4.2% 131bpsAverage weekly traffic to Group digital assets (million) 14.2 8.7 63.8%
Earnings/(loss) before interest and tax (EBIT/(LBIT)) ($ MILLION)
REPORTED F20
(52 WEEKS)
REPORTED 1
F19(53 WEEKS) CHANGE
NORMALISED 4 F19
(52 WEEKS)NORMALISED 4
CHANGE
Continuing operations before significant itemsAustralian Food 2,232 1,827 22.2% 2,099 6.3%New Zealand Food 358 277 29.3% 320 12.0%
New Zealand Food (NZD) 378 296 27.7% 342 10.7%BIG W 39 (85) n.m. (31) n.m.Endeavour Drinks 569 504 12.9% 538 5.7%Hotels 172 261 (34.3)% 351 (51.0)%Central overheads (151) (62) 141.1% (45) 229.8%EBIT from continuing operations before significant items 3,219 2,722 18.3% 3,232 (0.4)%Significant items from continuing operations (591) (371) n.m.EBIT from continuing operations after significant items 2,628 2,351 11.8%Discontinued operationsPetrol 2 – 112 n.m.EBIT from discontinued operations before significant items – 112 n.m.Significant items from discontinued operations – 1,088 n.m.EBIT from discontinued operations after significant items – 1,200 n.m.Group EBIT continuing and discontinued operations 2,628 3,551 (26.0)%
1 Certain comparatives have been re-presented to conform with the current period’s presentation to better reflect the nature of the financial position and performance of the Group. The impact of the costs to remediate salaried team members has been corrected by the restatement of each of the affected financial statements line items for prior periods in accordance with the requirements for the correction of an error under AASB 108. The impact of the restatement is disclosed in Note 1.4 of the Financial Report.
2 Petrol sales and EBIT are for the nine months until sale on 1 April 2019.3 Group online sales and penetration are from continuing operations.4 Normalised results and growth reflect adjustments in F19 to remove the impact of the 53rd week in F19 and if AASB 16 had been in place in F19.
1
2
3
4
5
PERFORM
AN
CE
HIG
HLIG
HTS
BUSIN
ESS REV
IEWD
IRECTO
RS' REPO
RTFIN
AN
CIA
L REPO
RTO
THER
INFO
RMATIO
N19
WO
OLW
ORTH
S GRO
UP
AN
NU
AL REPO
RT 2020
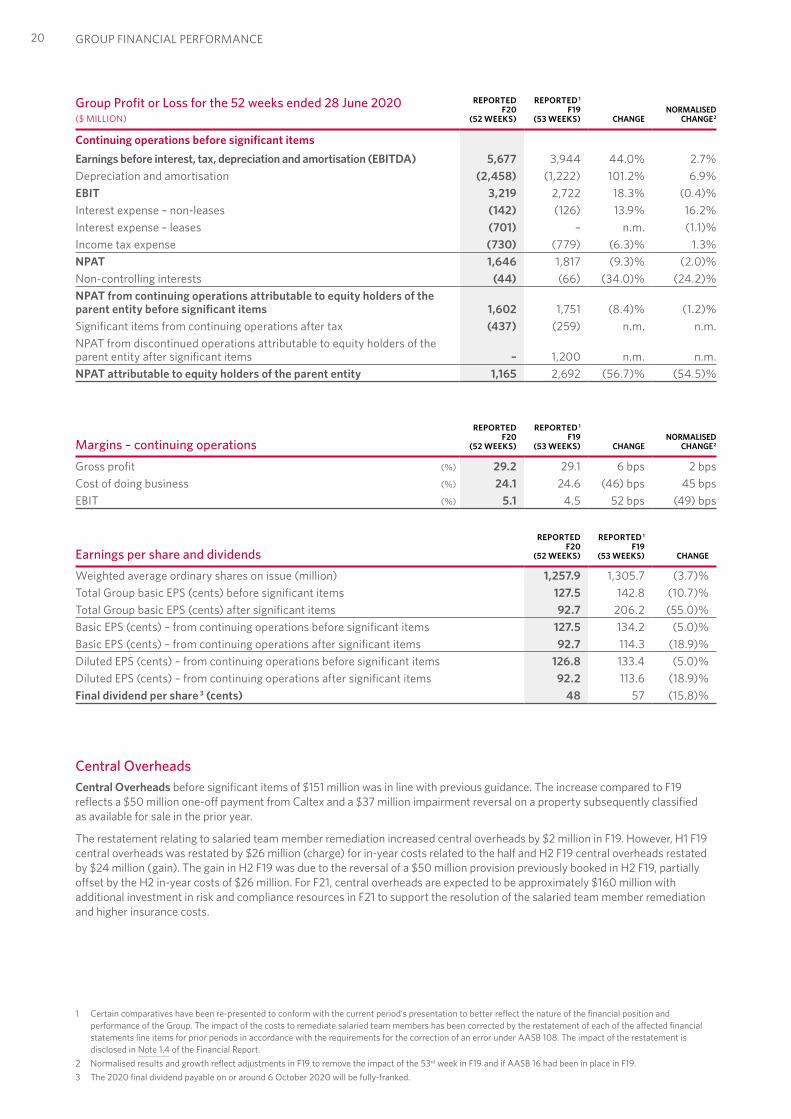
GROUP FINANCIAL PERFORMANCE
Margins – continuing operations REPORTED
F20(52 WEEKS)
REPORTED 1
F19(53 WEEKS) CHANGE
NORMALISED CHANGE 2
Gross profit (%) 29.2 29.1 6 bps 2 bpsCost of doing business (%) 24.1 24.6 (46) bps 45 bpsEBIT (%) 5.1 4.5 52 bps (49) bps
Earnings per share and dividends REPORTED
F20(52 WEEKS)
REPORTED 1
F19(53 WEEKS) CHANGE
Weighted average ordinary shares on issue (million) 1,257.9 1,305.7 (3.7)%Total Group basic EPS (cents) before significant items 127.5 142.8 (10.7)%Total Group basic EPS (cents) after significant items 92.7 206.2 (55.0)%Basic EPS (cents) – from continuing operations before significant items 127.5 134.2 (5.0)%Basic EPS (cents) – from continuing operations after significant items 92.7 114.3 (18.9)%Diluted EPS (cents) – from continuing operations before significant items 126.8 133.4 (5.0)%Diluted EPS (cents) – from continuing operations after significant items 92.2 113.6 (18.9)%Final dividend per share 3 (cents) 48 57 (15.8)%
Central OverheadsCentral Overheads before significant items of $151 million was in line with previous guidance. The increase compared to F19 reflects a $50 million one-off payment from Caltex and a $37 million impairment reversal on a property subsequently classified as available for sale in the prior year.
The restatement relating to salaried team member remediation increased central overheads by $2 million in F19. However, H1 F19 central overheads was restated by $26 million (charge) for in-year costs related to the half and H2 F19 central overheads restated by $24 million (gain). The gain in H2 F19 was due to the reversal of a $50 million provision previously booked in H2 F19, partially offset by the H2 in-year costs of $26 million. For F21, central overheads are expected to be approximately $160 million with additional investment in risk and compliance resources in F21 to support the resolution of the salaried team member remediation and higher insurance costs.
Group Profit or Loss for the 52 weeks ended 28 June 2020 ($ MILLION)
REPORTEDF20
(52 WEEKS)
REPORTED 1
F19(53 WEEKS) CHANGE
NORMALISED CHANGE 2
Continuing operations before significant itemsEarnings before interest, tax, depreciation and amortisation (EBITDA) 5,677 3,944 44.0% 2.7%Depreciation and amortisation (2,458) (1,222) 101.2% 6.9%EBIT 3,219 2,722 18.3% (0.4)%Interest expense – non-leases (142) (126) 13.9% 16.2%Interest expense – leases (701) – n.m. (1.1)%Income tax expense (730) (779) (6.3)% 1.3%NPAT 1,646 1,817 (9.3)% (2.0)%Non-controlling interests (44) (66) (34.0)% (24.2)%NPAT from continuing operations attributable to equity holders of the parent entity before significant items 1,602 1,751 (8.4)% (1.2)%Significant items from continuing operations after tax (437) (259) n.m. n.m.NPAT from discontinued operations attributable to equity holders of the parent entity after significant items – 1,200 n.m. n.m.NPAT attributable to equity holders of the parent entity 1,165 2,692 (56.7)% (54.5)%
1 Certain comparatives have been re-presented to conform with the current period’s presentation to better reflect the nature of the financial position and performance of the Group. The impact of the costs to remediate salaried team members has been corrected by the restatement of each of the affected financial statements line items for prior periods in accordance with the requirements for the correction of an error under AASB 108. The impact of the restatement is disclosed in Note 1.4 of the Financial Report.
2 Normalised results and growth reflect adjustments in F19 to remove the impact of the 53rd week in F19 and if AASB 16 had been in place in F19.3 The 2020 final dividend payable on or around 6 October 2020 will be fully-franked.
20
Group balance sheet as at 28 June 2020
($ MILLION)REPORTED
28 JUNE 2020REPORTED 1
30 JUNE 2019 CHANGE
Inventory 4,434 4,280 154Trade payables (5,843) (5,219) (624)Net investment in inventory (1,409) (939) (470)Trade and other receivables 894 827 67Other creditors, provisions and other liabilities (4,516) (4,573) 57Fixed assets, investments, loans provided to related parties and convertible notes 8,953 8,443 510Net assets held for sale 333 225 108Intangible assets 7,717 7,793 (76)Lease assets 12,062 – 12,062Other assets 136 – 136Total funds employed 24,170 11,776 12,394Net tax balances 992 307 685Net assets employed 25,162 12,083 13,079Cash and borrowings (1,863) (2,063) 200Other financial assets and liabilities 461 464 (3)Net debt (excluding lease liabilities) (1,402) (1,599) 197Lease liabilities (14,728) – (14,728)Total net debt (16,130) (1,599) (14,531)Net assets 9,032 10,484 (1,452)Non-controlling interests 290 383 (93)Shareholders' equity 8,742 10,101 (1,359)Total equity 9,032 10,484 (1,452)
Key ratios – continuing operations before significant itemsClosing inventory days (based on cost of sales) 36.0 37.6 (1.6)Closing trade payable days (based on cost of sales) (47.4) (46.0) (1.4)Normalised ROFE 13.7% 14.1% (49) bps
Closing inventory of $4,434 million increased by $154 million primarily due to an increase in grocery and freezer inventory at year end in Australian Food to support COVID-19 related demand. This was partially offset by lower BIG W inventory across all categories due to higher sales. Closing inventory declined by 1.6 days with average inventory days from continuing operations declining by 2.5 days.
Trade payables of $5,843 million increased by $624 million compared to F19 primarily due to the timing of end of month payments after year end in F20 compared to before year end in F19, and higher purchases in Australian and New Zealand Food and Endeavour Drinks to support increased trading conditions.
Other creditors, provisions and other liabilities of $4,516 million were broadly in line with F19. An increase in provisions for salaried team remediation, Endeavour Group transformation costs and the NSW
supply chain transformation costs was offset by a reduction in onerous contract provisions related to leases, which were de-recognised on adoption of AASB 16.
Fixed assets, investments, loans provided to related parties and convertible notes of $8,953 million increased by $510 million. Additions of $2,229 million during the year mainly related to investment in new stores, refurbishments of existing stores, IT infrastructure and property development were partially offset by depreciation of $1,300 million and transfers to net assets held for sale of $332 million.
Lease assets of $12,062 million reflected $12,239 million on the adoption of AASB 16, $1,182 million of new leases and remeasurements during the period, partially offset by lease depreciation of $1,158 million.
Total funds employed increased by $12,394 million largely due to the
recognition of lease assets on the adoption of AASB 16.
Net tax balances of $992 million increased $685 million from F19 mainly due to the recognition of net deferred tax assets associated with the lease assets and lease liabilities on adoption of AASB 16.
Total net debt (excluding lease liabilities) of $1,402 million was $197 million below F19 due to net cash generated during the year.
The increase in total net debt reflects the recognition of lease liabilities upon the adoption of AASB 16.
Total equity declined by $1,452 million, largely due to the initial application of AASB 16 of $1,329 million.
Normalised ROFE 2 from continuing operations before significant items was 13.7% a decrease of 49 bps on the prior year. ROFE increased for all businesses, except for Hotels, due to venue closures during COVID-19.
1 Certain comparatives have been re-presented to conform with the current period’s presentation to better reflect the nature of the financial position and performance of the Group. The impact of the costs to remediate salaried team members has been corrected by the restatement of each of the affected financial statements line items for prior periods in accordance with the requirements for the correction of an error under AASB 108. The impact of the restatement is disclosed in Note 1.4 of the Financial Report.
2 F19 AASB 16 analysis has been prepared for the purposes of ROFE. The F20 calculation includes the actual values for all three points whereas F19 includes an estimate for two of the three points for funds employed.
1
2
3
4
5
PERFORM
AN
CE
HIG
HLIG
HTS
BUSIN
ESS REV
IEWD
IRECTO
RS' REPO
RTFIN
AN
CIA
L REPO
RTO
THER
INFO
RMATIO
N
21
WO
OLW
ORTH
S GRO
UP
AN
NU
AL REPO
RT 2020
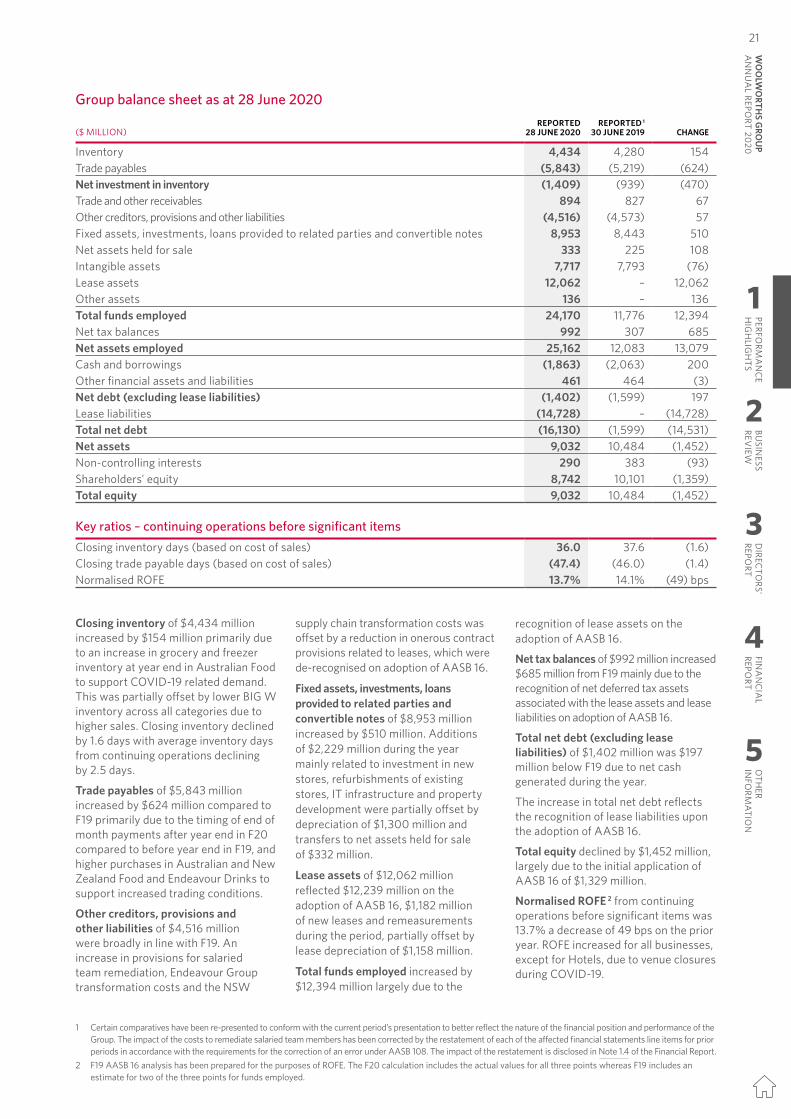
GROUP FINANCIAL PERFORMANCE
Margins – continuing operations REPORTED
F20(52 WEEKS)
REPORTED 1
F19(53 WEEKS) CHANGE
NORMALISED CHANGE 2
Gross profit (%) 29.2 29.1 6 bps 2 bpsCost of doing business (%) 24.1 24.6 (46) bps 45 bpsEBIT (%) 5.1 4.5 52 bps (49) bps
Earnings per share and dividends REPORTED
F20(52 WEEKS)
REPORTED 1
F19(53 WEEKS) CHANGE
Weighted average ordinary shares on issue (million) 1,257.9 1,305.7 (3.7)%Total Group basic EPS (cents) before significant items 127.5 142.8 (10.7)%Total Group basic EPS (cents) after significant items 92.7 206.2 (55.0)%Basic EPS (cents) – from continuing operations before significant items 127.5 134.2 (5.0)%Basic EPS (cents) – from continuing operations after significant items 92.7 114.3 (18.9)%Diluted EPS (cents) – from continuing operations before significant items 126.8 133.4 (5.0)%Diluted EPS (cents) – from continuing operations after significant items 92.2 113.6 (18.9)%Final dividend per share 3 (cents) 48 57 (15.8)%
Central OverheadsCentral Overheads before significant items of $151 million was in line with previous guidance. The increase compared to F19 reflects a $50 million one-off payment from Caltex and a $37 million impairment reversal on a property subsequently classified as available for sale in the prior year.
The restatement relating to salaried team member remediation increased central overheads by $2 million in F19. However, H1 F19 central overheads was restated by $26 million (charge) for in-year costs related to the half and H2 F19 central overheads restated by $24 million (gain). The gain in H2 F19 was due to the reversal of a $50 million provision previously booked in H2 F19, partially offset by the H2 in-year costs of $26 million. For F21, central overheads are expected to be approximately $160 million with additional investment in risk and compliance resources in F21 to support the resolution of the salaried team member remediation and higher insurance costs.
Group Profit or Loss for the 52 weeks ended 28 June 2020 ($ MILLION)
REPORTEDF20
(52 WEEKS)
REPORTED 1
F19(53 WEEKS) CHANGE
NORMALISED CHANGE 2
Continuing operations before significant itemsEarnings before interest, tax, depreciation and amortisation (EBITDA) 5,677 3,944 44.0% 2.7%Depreciation and amortisation (2,458) (1,222) 101.2% 6.9%EBIT 3,219 2,722 18.3% (0.4)%Interest expense – non-leases (142) (126) 13.9% 16.2%Interest expense – leases (701) – n.m. (1.1)%Income tax expense (730) (779) (6.3)% 1.3%NPAT 1,646 1,817 (9.3)% (2.0)%Non-controlling interests (44) (66) (34.0)% (24.2)%NPAT from continuing operations attributable to equity holders of the parent entity before significant items 1,602 1,751 (8.4)% (1.2)%Significant items from continuing operations after tax (437) (259) n.m. n.m.NPAT from discontinued operations attributable to equity holders of the parent entity after significant items – 1,200 n.m. n.m.NPAT attributable to equity holders of the parent entity 1,165 2,692 (56.7)% (54.5)%
1 Certain comparatives have been re-presented to conform with the current period’s presentation to better reflect the nature of the financial position and performance of the Group. The impact of the costs to remediate salaried team members has been corrected by the restatement of each of the affected financial statements line items for prior periods in accordance with the requirements for the correction of an error under AASB 108. The impact of the restatement is disclosed in Note 1.4 of the Financial Report.
2 Normalised results and growth reflect adjustments in F19 to remove the impact of the 53rd week in F19 and if AASB 16 had been in place in F19.3 The 2020 final dividend payable on or around 6 October 2020 will be fully-franked.
20
Group balance sheet as at 28 June 2020
($ MILLION)REPORTED
28 JUNE 2020REPORTED 1
30 JUNE 2019 CHANGE
Inventory 4,434 4,280 154Trade payables (5,843) (5,219) (624)Net investment in inventory (1,409) (939) (470)Trade and other receivables 894 827 67Other creditors, provisions and other liabilities (4,516) (4,573) 57Fixed assets, investments, loans provided to related parties and convertible notes 8,953 8,443 510Net assets held for sale 333 225 108Intangible assets 7,717 7,793 (76)Lease assets 12,062 – 12,062Other assets 136 – 136Total funds employed 24,170 11,776 12,394Net tax balances 992 307 685Net assets employed 25,162 12,083 13,079Cash and borrowings (1,863) (2,063) 200Other financial assets and liabilities 461 464 (3)Net debt (excluding lease liabilities) (1,402) (1,599) 197Lease liabilities (14,728) – (14,728)Total net debt (16,130) (1,599) (14,531)Net assets 9,032 10,484 (1,452)Non-controlling interests 290 383 (93)Shareholders' equity 8,742 10,101 (1,359)Total equity 9,032 10,484 (1,452)
Key ratios – continuing operations before significant itemsClosing inventory days (based on cost of sales) 36.0 37.6 (1.6)Closing trade payable days (based on cost of sales) (47.4) (46.0) (1.4)Normalised ROFE 13.7% 14.1% (49) bps
Closing inventory of $4,434 million increased by $154 million primarily due to an increase in grocery and freezer inventory at year end in Australian Food to support COVID-19 related demand. This was partially offset by lower BIG W inventory across all categories due to higher sales. Closing inventory declined by 1.6 days with average inventory days from continuing operations declining by 2.5 days.
Trade payables of $5,843 million increased by $624 million compared to F19 primarily due to the timing of end of month payments after year end in F20 compared to before year end in F19, and higher purchases in Australian and New Zealand Food and Endeavour Drinks to support increased trading conditions.
Other creditors, provisions and other liabilities of $4,516 million were broadly in line with F19. An increase in provisions for salaried team remediation, Endeavour Group transformation costs and the NSW
supply chain transformation costs was offset by a reduction in onerous contract provisions related to leases, which were de-recognised on adoption of AASB 16.
Fixed assets, investments, loans provided to related parties and convertible notes of $8,953 million increased by $510 million. Additions of $2,229 million during the year mainly related to investment in new stores, refurbishments of existing stores, IT infrastructure and property development were partially offset by depreciation of $1,300 million and transfers to net assets held for sale of $332 million.
Lease assets of $12,062 million reflected $12,239 million on the adoption of AASB 16, $1,182 million of new leases and remeasurements during the period, partially offset by lease depreciation of $1,158 million.
Total funds employed increased by $12,394 million largely due to the
recognition of lease assets on the adoption of AASB 16.
Net tax balances of $992 million increased $685 million from F19 mainly due to the recognition of net deferred tax assets associated with the lease assets and lease liabilities on adoption of AASB 16.
Total net debt (excluding lease liabilities) of $1,402 million was $197 million below F19 due to net cash generated during the year.
The increase in total net debt reflects the recognition of lease liabilities upon the adoption of AASB 16.
Total equity declined by $1,452 million, largely due to the initial application of AASB 16 of $1,329 million.
Normalised ROFE 2 from continuing operations before significant items was 13.7% a decrease of 49 bps on the prior year. ROFE increased for all businesses, except for Hotels, due to venue closures during COVID-19.
1 Certain comparatives have been re-presented to conform with the current period’s presentation to better reflect the nature of the financial position and performance of the Group. The impact of the costs to remediate salaried team members has been corrected by the restatement of each of the affected financial statements line items for prior periods in accordance with the requirements for the correction of an error under AASB 108. The impact of the restatement is disclosed in Note 1.4 of the Financial Report.
2 F19 AASB 16 analysis has been prepared for the purposes of ROFE. The F20 calculation includes the actual values for all three points whereas F19 includes an estimate for two of the three points for funds employed.
1
2
3
4
5
PERFORM
AN
CE
HIG
HLIG
HTS
BUSIN
ESS REV
IEWD
IRECTO
RS' REPO
RTFIN
AN
CIA
L REPO
RTO
THER
INFO
RMATIO
N21
WO
OLW
ORTH
S GRO
UP
AN
NU
AL REPO
RT 2020
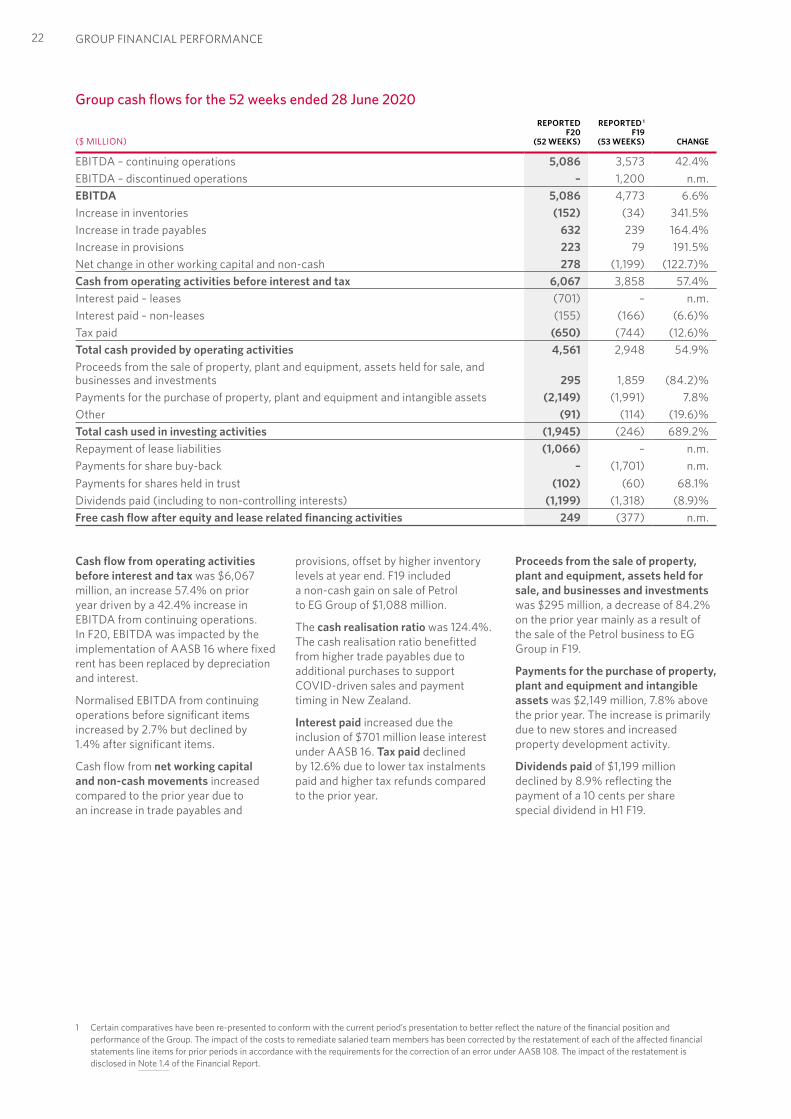
1 Certain comparatives have been re-presented to conform with the current period’s presentation to better reflect the nature of the financial position and performance of the Group. The impact of the costs to remediate salaried team members has been corrected by the restatement of each of the affected financial statements line items for prior periods in accordance with the requirements for the correction of an error under AASB 108. The impact of the restatement is disclosed in Note 1.4 of the Financial Report.
Group cash flows for the 52 weeks ended 28 June 2020
($ MILLION)
REPORTEDF20
(52 WEEKS)
REPORTED 1
F19(53 WEEKS) CHANGE
EBITDA – continuing operations 5,086 3,573 42.4%EBITDA – discontinued operations – 1,200 n.m.EBITDA 5,086 4,773 6.6%Increase in inventories (152) (34) 341.5%Increase in trade payables 632 239 164.4%Increase in provisions 223 79 191.5%Net change in other working capital and non-cash 278 (1,199) (122.7)%Cash from operating activities before interest and tax 6,067 3,858 57.4%Interest paid – leases (701) – n.m.Interest paid – non-leases (155) (166) (6.6)%Tax paid (650) (744) (12.6)%Total cash provided by operating activities 4,561 2,948 54.9%Proceeds from the sale of property, plant and equipment, assets held for sale, and businesses and investments 295 1,859 (84.2)%Payments for the purchase of property, plant and equipment and intangible assets (2,149) (1,991) 7.8%Other (91) (114) (19.6)%Total cash used in investing activities (1,945) (246) 689.2%Repayment of lease liabilities (1,066) – n.m.Payments for share buy-back – (1,701) n.m.Payments for shares held in trust (102) (60) 68.1%Dividends paid (including to non-controlling interests) (1,199) (1,318) (8.9)%Free cash flow after equity and lease related financing activities 249 (377) n.m.
Cash flow from operating activities before interest and tax was $6,067 million, an increase 57.4% on prior year driven by a 42.4% increase in EBITDA from continuing operations. In F20, EBITDA was impacted by the implementation of AASB 16 where fixed rent has been replaced by depreciation and interest.
Normalised EBITDA from continuing operations before significant items increased by 2.7% but declined by 1.4% after significant items.
Cash flow from net working capital and non-cash movements increased compared to the prior year due to an increase in trade payables and
provisions, offset by higher inventory levels at year end. F19 included a non-cash gain on sale of Petrol to EG Group of $1,088 million.
The cash realisation ratio was 124.4%. The cash realisation ratio benefitted from higher trade payables due to additional purchases to support COVID-driven sales and payment timing in New Zealand.
Interest paid increased due the inclusion of $701 million lease interest under AASB 16. Tax paid declined by 12.6% due to lower tax instalments paid and higher tax refunds compared to the prior year.
Proceeds from the sale of property, plant and equipment, assets held for sale, and businesses and investments was $295 million, a decrease of 84.2% on the prior year mainly as a result of the sale of the Petrol business to EG Group in F19.
Payments for the purchase of property, plant and equipment and intangible assets was $2,149 million, 7.8% above the prior year. The increase is primarily due to new stores and increased property development activity.
Dividends paid of $1,199 million declined by 8.9% reflecting the payment of a 10 cents per share special dividend in H1 F19.
GROUP FINANCIAL PERFORMANCE22
Non-IFRS Financial Information The 2020 Annual Report for the 52 weeks ended 28 June 2020 contains certain non-IFRS financial measures of historical financial performance, balance sheet or cash flows. Non-IFRS financial measures are financial measures other than those defined or specified under all relevant accounting standards and may not be directly comparable with other companies’ measures but are common practice in the industry in which Woolworths Group operates. Non-IFRS financial information should be considered in addition to, and is not intended to be a substitute for, or more important than, IFRS measures. The presentation of non-IFRS measures
is in line with Regulatory Guide 230 issued by the Australian Security and Investments Commission in December 2011 to promote full and clear disclosure for investors and other users of financial information and minimise the possibility of being misled by such information.
These measures are used by management and the directors as the primary measures of assessing the financial performance of the Group and individual segments. The directors also believe that these non-IFRS measures assist in providing additional meaningful information on the underlying drivers of the business,
performance and trends, as well as the financial position of the Woolworths Group. Non-IFRS financial measures are also used to enhance the comparability of information between reporting periods (such as comparable sales), by adjusting for non-recurring or uncontrollable factors which affect IFRS measures, to aid the user in understanding the Woolworths Group’s performance. Consequently, non-IFRS measures are used by the directors and management for performance analysis, planning, reporting and incentive setting purposes and have remained consistent with the prior year. Non-IFRS measures are not subject to audit or review.
Capital managementWoolworths Group has a capital management framework which allocates capital to sustain and grow its businesses and maximise shareholder returns. This is underpinned by strategies to provide the Group with continued access to capital markets, and to maintain solid investment grade credit ratings. The Group’s credit ratings 1 are BBB (stable outlook) according to S&P and Baa2 (stable outlook) according to Moody’s.
Financing transactions during F20 In May 2020, the Group issued $1.0 billion of Australian Medium Term Notes consisting of a $400 million tranche maturing in May 2025 and a $600 million tranche maturing in May 2030. The Medium Term Notes have been issued to refinance the Group’s US Senior Notes maturing in September 2020 and European Medium Term Notes maturing in November 2020. This continues the Group’s focus on lowering effective interest rates and lengthening the weighted average maturity.
Upcoming maturities In September 2020, the US$617 million US Senior Notes are due to mature and in November 2020 the JPY20 billion European Medium Term Notes are also due to mature. The Group has refinanced all of these upcoming maturities with the Australian Medium Term Notes issued in May 2020.
In April 2021, the US$438 million US Senior Notes are due to mature. The Group intends to refinance this maturity.
In November 2020, the Group’s $500 million bank guarantee facility is due to mature. The purpose of this facility is to support the Group’s WorkCover obligations as a ‘self-insurer’, where bank guarantees are issued in favour of Australian WorkCover authorities and is underpinned by the international surety market. The Group intends to refinance this maturity, with the final facility limit depending on the amount of the Group’s obligations which varies over time.
Events after financial year-endOn 19 August 2020, Woolworths Group announced its intention to extend its strategic partnership with PFD Food Services by acquiring a 65% equity interest in the business as well as acquiring 26 freehold properties for a purchase consideration of $552 million. The transaction is subject to ACCC approval and the satisfaction of customary closing conditions with completion expected by the end of calendar year 2020.
1 These credit ratings have been issued by a credit rating agency which holds an Australian Financial Services Licence with an authorisation to issue credit ratings to wholesale clients only and are for the benefit of Woolworths Group’s debt providers.
1
2
3
4
5
PERFORM
AN
CE
HIG
HLIG
HTS
BUSIN
ESS REV
IEWD
IRECTO
RS' REPO
RTFIN
AN
CIA
L REPO
RTO
THER
INFO
RMATIO
N
23
WO
OLW
ORTH
S GRO
UP
AN
NU
AL REPO
RT 2020
1 Certain comparatives have been re-presented to conform with the current period’s presentation to better reflect the nature of the financial position and performance of the Group. The impact of the costs to remediate salaried team members has been corrected by the restatement of each of the affected financial statements line items for prior periods in accordance with the requirements for the correction of an error under AASB 108. The impact of the restatement is disclosed in Note 1.4 of the Financial Report.
Group cash flows for the 52 weeks ended 28 June 2020
($ MILLION)
REPORTEDF20
(52 WEEKS)
REPORTED 1
F19(53 WEEKS) CHANGE
EBITDA – continuing operations 5,086 3,573 42.4%EBITDA – discontinued operations – 1,200 n.m.EBITDA 5,086 4,773 6.6%Increase in inventories (152) (34) 341.5%Increase in trade payables 632 239 164.4%Increase in provisions 223 79 191.5%Net change in other working capital and non-cash 278 (1,199) (122.7)%Cash from operating activities before interest and tax 6,067 3,858 57.4%Interest paid – leases (701) – n.m.Interest paid – non-leases (155) (166) (6.6)%Tax paid (650) (744) (12.6)%Total cash provided by operating activities 4,561 2,948 54.9%Proceeds from the sale of property, plant and equipment, assets held for sale, and businesses and investments 295 1,859 (84.2)%Payments for the purchase of property, plant and equipment and intangible assets (2,149) (1,991) 7.8%Other (91) (114) (19.6)%Total cash used in investing activities (1,945) (246) 689.2%Repayment of lease liabilities (1,066) – n.m.Payments for share buy-back – (1,701) n.m.Payments for shares held in trust (102) (60) 68.1%Dividends paid (including to non-controlling interests) (1,199) (1,318) (8.9)%Free cash flow after equity and lease related financing activities 249 (377) n.m.
Cash flow from operating activities before interest and tax was $6,067 million, an increase 57.4% on prior year driven by a 42.4% increase in EBITDA from continuing operations. In F20, EBITDA was impacted by the implementation of AASB 16 where fixed rent has been replaced by depreciation and interest.
Normalised EBITDA from continuing operations before significant items increased by 2.7% but declined by 1.4% after significant items.
Cash flow from net working capital and non-cash movements increased compared to the prior year due to an increase in trade payables and
provisions, offset by higher inventory levels at year end. F19 included a non-cash gain on sale of Petrol to EG Group of $1,088 million.
The cash realisation ratio was 124.4%. The cash realisation ratio benefitted from higher trade payables due to additional purchases to support COVID-driven sales and payment timing in New Zealand.
Interest paid increased due the inclusion of $701 million lease interest under AASB 16. Tax paid declined by 12.6% due to lower tax instalments paid and higher tax refunds compared to the prior year.
Proceeds from the sale of property, plant and equipment, assets held for sale, and businesses and investments was $295 million, a decrease of 84.2% on the prior year mainly as a result of the sale of the Petrol business to EG Group in F19.
Payments for the purchase of property, plant and equipment and intangible assets was $2,149 million, 7.8% above the prior year. The increase is primarily due to new stores and increased property development activity.
Dividends paid of $1,199 million declined by 8.9% reflecting the payment of a 10 cents per share special dividend in H1 F19.
GROUP FINANCIAL PERFORMANCE22
Non-IFRS Financial Information The 2020 Annual Report for the 52 weeks ended 28 June 2020 contains certain non-IFRS financial measures of historical financial performance, balance sheet or cash flows. Non-IFRS financial measures are financial measures other than those defined or specified under all relevant accounting standards and may not be directly comparable with other companies’ measures but are common practice in the industry in which Woolworths Group operates. Non-IFRS financial information should be considered in addition to, and is not intended to be a substitute for, or more important than, IFRS measures. The presentation of non-IFRS measures
is in line with Regulatory Guide 230 issued by the Australian Security and Investments Commission in December 2011 to promote full and clear disclosure for investors and other users of financial information and minimise the possibility of being misled by such information.
These measures are used by management and the directors as the primary measures of assessing the financial performance of the Group and individual segments. The directors also believe that these non-IFRS measures assist in providing additional meaningful information on the underlying drivers of the business,
performance and trends, as well as the financial position of the Woolworths Group. Non-IFRS financial measures are also used to enhance the comparability of information between reporting periods (such as comparable sales), by adjusting for non-recurring or uncontrollable factors which affect IFRS measures, to aid the user in understanding the Woolworths Group’s performance. Consequently, non-IFRS measures are used by the directors and management for performance analysis, planning, reporting and incentive setting purposes and have remained consistent with the prior year. Non-IFRS measures are not subject to audit or review.
Capital managementWoolworths Group has a capital management framework which allocates capital to sustain and grow its businesses and maximise shareholder returns. This is underpinned by strategies to provide the Group with continued access to capital markets, and to maintain solid investment grade credit ratings. The Group’s credit ratings 1 are BBB (stable outlook) according to S&P and Baa2 (stable outlook) according to Moody’s.
Financing transactions during F20 In May 2020, the Group issued $1.0 billion of Australian Medium Term Notes consisting of a $400 million tranche maturing in May 2025 and a $600 million tranche maturing in May 2030. The Medium Term Notes have been issued to refinance the Group’s US Senior Notes maturing in September 2020 and European Medium Term Notes maturing in November 2020. This continues the Group’s focus on lowering effective interest rates and lengthening the weighted average maturity.
Upcoming maturities In September 2020, the US$617 million US Senior Notes are due to mature and in November 2020 the JPY20 billion European Medium Term Notes are also due to mature. The Group has refinanced all of these upcoming maturities with the Australian Medium Term Notes issued in May 2020.
In April 2021, the US$438 million US Senior Notes are due to mature. The Group intends to refinance this maturity.
In November 2020, the Group’s $500 million bank guarantee facility is due to mature. The purpose of this facility is to support the Group’s WorkCover obligations as a ‘self-insurer’, where bank guarantees are issued in favour of Australian WorkCover authorities and is underpinned by the international surety market. The Group intends to refinance this maturity, with the final facility limit depending on the amount of the Group’s obligations which varies over time.
Events after financial year-endOn 19 August 2020, Woolworths Group announced its intention to extend its strategic partnership with PFD Food Services by acquiring a 65% equity interest in the business as well as acquiring 26 freehold properties for a purchase consideration of $552 million. The transaction is subject to ACCC approval and the satisfaction of customary closing conditions with completion expected by the end of calendar year 2020.
1 These credit ratings have been issued by a credit rating agency which holds an Australian Financial Services Licence with an authorisation to issue credit ratings to wholesale clients only and are for the benefit of Woolworths Group’s debt providers.
1
2
3
4
5
PERFORM
AN
CE
HIG
HLIG
HTS
BUSIN
ESS REV
IEWD
IRECTO
RS' REPO
RTFIN
AN
CIA
L REPO
RTO
THER
INFO
RMATIO
N23
WO
OLW
ORTH
S GRO
UP
AN
NU
AL REPO
RT 2020
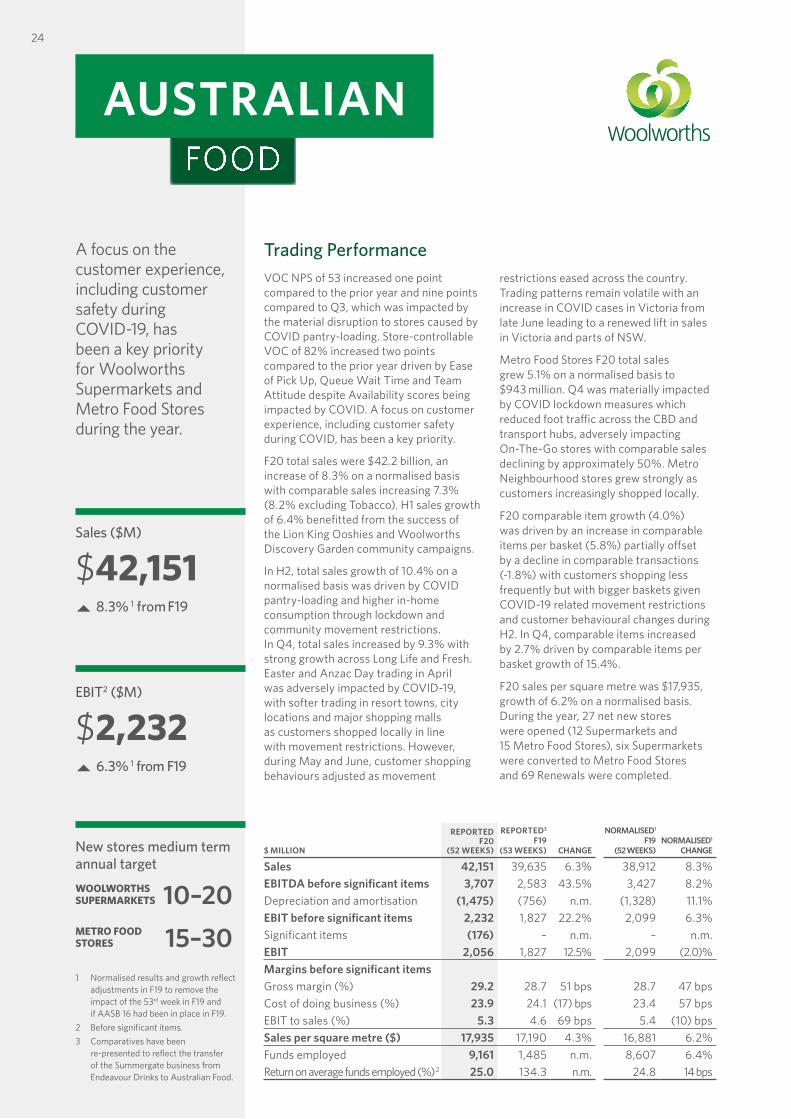
24
A focus on the customer experience, including customer safety during COVID-19, has been a key priority for Woolworths Supermarkets and Metro Food Stores during the year.
1 Normalised results and growth reflect adjustments in F19 to remove the impact of the 53rd week in F19 and if AASB 16 had been in place in F19.
2 Before significant items.3 Comparatives have been
re-presented to reflect the transfer of the Summergate business from Endeavour Drinks to Australian Food.
FOOD
Trading PerformanceVOC NPS of 53 increased one point compared to the prior year and nine points compared to Q3, which was impacted by the material disruption to stores caused by COVID pantry-loading. Store-controllable VOC of 82% increased two points compared to the prior year driven by Ease of Pick Up, Queue Wait Time and Team Attitude despite Availability scores being impacted by COVID. A focus on customer experience, including customer safety during COVID, has been a key priority.
F20 total sales were $42.2 billion, an increase of 8.3% on a normalised basis with comparable sales increasing 7.3% (8.2% excluding Tobacco). H1 sales growth of 6.4% benefitted from the success of the Lion King Ooshies and Woolworths Discovery Garden community campaigns.
In H2, total sales growth of 10.4% on a normalised basis was driven by COVID pantry-loading and higher in-home consumption through lockdown and community movement restrictions. In Q4, total sales increased by 9.3% with strong growth across Long Life and Fresh. Easter and Anzac Day trading in April was adversely impacted by COVID-19, with softer trading in resort towns, city locations and major shopping malls as customers shopped locally in line with movement restrictions. However, during May and June, customer shopping behaviours adjusted as movement
restrictions eased across the country. Trading patterns remain volatile with an increase in COVID cases in Victoria from late June leading to a renewed lift in sales in Victoria and parts of NSW.
Metro Food Stores F20 total sales grew 5.1% on a normalised basis to $943 million. Q4 was materially impacted by COVID lockdown measures which reduced foot traffic across the CBD and transport hubs, adversely impacting On-The-Go stores with comparable sales declining by approximately 50%. Metro Neighbourhood stores grew strongly as customers increasingly shopped locally.
F20 comparable item growth (4.0%) was driven by an increase in comparable items per basket (5.8%) partially offset by a decline in comparable transactions (-1.8%) with customers shopping less frequently but with bigger baskets given COVID-19 related movement restrictions and customer behavioural changes during H2. In Q4, comparable items increased by 2.7% driven by comparable items per basket growth of 15.4%.
F20 sales per square metre was $17,935, growth of 6.2% on a normalised basis. During the year, 27 net new stores were opened (12 Supermarkets and 15 Metro Food Stores), six Supermarkets were converted to Metro Food Stores and 69 Renewals were completed.
AUSTRALIAN
EBIT2 ($M)
$2,232 6.3% 1 from F19
New stores medium term annual targetWOOLWORTHS SUPERMARKETS
METRO FOOD STORES
10–2015–30
Sales ($M)
$42,151 8.3% 1 from F19
$ MILLION
REPORTED F20
(52 WEEKS)
REPORTED3
F19(53 WEEKS) CHANGE
NORMALISED1
F19(52 WEEKS)
NORMALISED1
CHANGE
Sales 42,151 39,635 6.3% 38,912 8.3%EBITDA before significant items 3,707 2,583 43.5% 3,427 8.2%Depreciation and amortisation (1,475) (756) n.m. (1,328) 11.1%EBIT before significant items 2,232 1,827 22.2% 2,099 6.3%Significant items (176) – n.m. – n.m.EBIT 2,056 1,827 12.5% 2,099 (2.0)%Margins before significant itemsGross margin (%) 29.2 28.7 51 bps 28.7 47 bpsCost of doing business (%) 23.9 24.1 (17) bps 23.4 57 bpsEBIT to sales (%) 5.3 4.6 69 bps 5.4 (10) bpsSales per square metre ($) 17,935 17,190 4.3% 16,881 6.2%Funds employed 9,161 1,485 n.m. 8,607 6.4%Return on average funds employed (%) 2 25.0 134.3 n.m. 24.8 14 bps
At year-end, there were 987 Woolworths Supermarkets and 64 Metro Food Stores with a total fleet of 1,051 stores.
Average prices increased 1.4% across F20, with growth of 2.4% in Q4 with increases in Grocery and Fresh categories including Vegetables and Meat driven by unfavourable growing conditions and livestock cost increases. Q4 inflation was also impacted by lower promotional activity at the beginning of the quarter to prioritise the supply of essential products to stores.
Gross margin increased 47 bps (normalised) to 29.2% driven by COVID-19 related product mix changes, improved stock loss and an ongoing focus on improving promotional effectiveness. In H2, gross margin increased by 56 bps (normalised) also driven by improved stock loss due to strong sell-through, product mix and lower promotional activity. Meat cost inflation continued to materially exceed selling price inflation in H2.
CODB as a percentage of sales was 23.9%, increasing 57 bps (normalised and excluding significant items). This was impacted by $290 million of incremental costs in H2 related to COVID-19. Included within these costs was the temporary employment of over 17,500 team members to support safety and social distancing, additional warehouse capacity and other supply chain costs, scaling-up online (particularly the expansion of Home Delivery), security, cleaning and personal protective equipment costs and a net cost of approximately $30 million related to the Better Together Recognition Award for non-STI eligible team
members. The award was partially funded by a reduction for STI eligible team members.
CODB also included the annualisation of costs associated with the new enterprise agreement, higher supply chain costs driven by the ramp up and dual running costs at MSRDC, a higher eCommerce penetration and costs associated with new businesses such as Cartology, partially offset by productivity benefits.
Depreciation and amortisation increased 11.1% (normalised) driven by the new store and Renewal program, strategic investments including shorter-life technology and digital assets and the commencement of depreciation of MSRDC.
EBIT before significant items increased by 6.3% (normalised) to $2,232 million with a 10 bps reduction in EBIT margin to 5.3% on the same basis. Normalised EBIT in H1 increased by 8.0% and increased by 4.6% in H2. F20 also includes incremental fuel discount costs of $23 million following the sale of the Petrol business on 1 April 2019.
Funds employed (normalised) increased $554 million to $9,161 million from F19, impacted by investment in Renewals, new stores, supply chain and higher working capital. Higher inventory levels were required to support sales volumes and ensure availability and accelerated payments to support small vendors adversely impacted by COVID-19. Despite higher average funds employed, normalised ROFE increased 14 bps.
Looking after our...
Over
20,000plexiscreens in supermarkets
Permanent team members
75,000Better Together
Recognition Awards
Additional
600delivery vehicles increasing eCom network capacity
More than
1.5MPriority Assistance customers served via Home Delivery
43,000Woolworths Basic Boxes distributed
$8.26Mdonated to food relief
charity partners
BasicsBox
& WORKING TOGETHERCOVIDSafe
TEAM
CUSTOMERS
COMMUNITY
1
2
3
4
5
PERFORM
AN
CE
HIG
HLIG
HTS
BUSIN
ESS REV
IEWD
IRECTO
RS' REPO
RTFIN
AN
CIA
L REPO
RTO
THER
INFO
RMATIO
N
25
WO
OLW
ORTH
S GRO
UP
AN
NU
AL REPO
RT 2020
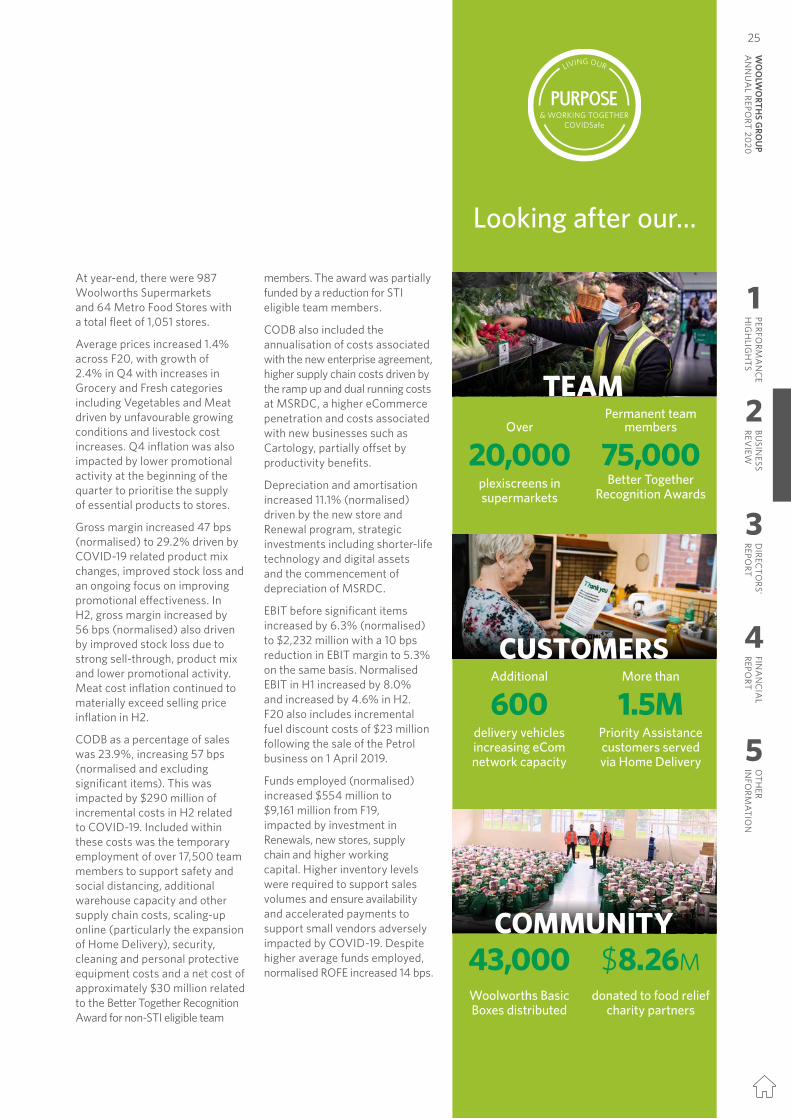
24
A focus on the customer experience, including customer safety during COVID-19, has been a key priority for Woolworths Supermarkets and Metro Food Stores during the year.
1 Normalised results and growth reflect adjustments in F19 to remove the impact of the 53rd week in F19 and if AASB 16 had been in place in F19.
2 Before significant items.3 Comparatives have been
re-presented to reflect the transfer of the Summergate business from Endeavour Drinks to Australian Food.
FOOD
Trading PerformanceVOC NPS of 53 increased one point compared to the prior year and nine points compared to Q3, which was impacted by the material disruption to stores caused by COVID pantry-loading. Store-controllable VOC of 82% increased two points compared to the prior year driven by Ease of Pick Up, Queue Wait Time and Team Attitude despite Availability scores being impacted by COVID. A focus on customer experience, including customer safety during COVID, has been a key priority.
F20 total sales were $42.2 billion, an increase of 8.3% on a normalised basis with comparable sales increasing 7.3% (8.2% excluding Tobacco). H1 sales growth of 6.4% benefitted from the success of the Lion King Ooshies and Woolworths Discovery Garden community campaigns.
In H2, total sales growth of 10.4% on a normalised basis was driven by COVID pantry-loading and higher in-home consumption through lockdown and community movement restrictions. In Q4, total sales increased by 9.3% with strong growth across Long Life and Fresh. Easter and Anzac Day trading in April was adversely impacted by COVID-19, with softer trading in resort towns, city locations and major shopping malls as customers shopped locally in line with movement restrictions. However, during May and June, customer shopping behaviours adjusted as movement
restrictions eased across the country. Trading patterns remain volatile with an increase in COVID cases in Victoria from late June leading to a renewed lift in sales in Victoria and parts of NSW.
Metro Food Stores F20 total sales grew 5.1% on a normalised basis to $943 million. Q4 was materially impacted by COVID lockdown measures which reduced foot traffic across the CBD and transport hubs, adversely impacting On-The-Go stores with comparable sales declining by approximately 50%. Metro Neighbourhood stores grew strongly as customers increasingly shopped locally.
F20 comparable item growth (4.0%) was driven by an increase in comparable items per basket (5.8%) partially offset by a decline in comparable transactions (-1.8%) with customers shopping less frequently but with bigger baskets given COVID-19 related movement restrictions and customer behavioural changes during H2. In Q4, comparable items increased by 2.7% driven by comparable items per basket growth of 15.4%.
F20 sales per square metre was $17,935, growth of 6.2% on a normalised basis. During the year, 27 net new stores were opened (12 Supermarkets and 15 Metro Food Stores), six Supermarkets were converted to Metro Food Stores and 69 Renewals were completed.
AUSTRALIAN
EBIT2 ($M)
$2,232 6.3% 1 from F19
New stores medium term annual targetWOOLWORTHS SUPERMARKETS
METRO FOOD STORES
10–2015–30
Sales ($M)
$42,151 8.3% 1 from F19
$ MILLION
REPORTED F20
(52 WEEKS)
REPORTED3
F19(53 WEEKS) CHANGE
NORMALISED1
F19(52 WEEKS)
NORMALISED1
CHANGE
Sales 42,151 39,635 6.3% 38,912 8.3%EBITDA before significant items 3,707 2,583 43.5% 3,427 8.2%Depreciation and amortisation (1,475) (756) n.m. (1,328) 11.1%EBIT before significant items 2,232 1,827 22.2% 2,099 6.3%Significant items (176) – n.m. – n.m.EBIT 2,056 1,827 12.5% 2,099 (2.0)%Margins before significant itemsGross margin (%) 29.2 28.7 51 bps 28.7 47 bpsCost of doing business (%) 23.9 24.1 (17) bps 23.4 57 bpsEBIT to sales (%) 5.3 4.6 69 bps 5.4 (10) bpsSales per square metre ($) 17,935 17,190 4.3% 16,881 6.2%Funds employed 9,161 1,485 n.m. 8,607 6.4%Return on average funds employed (%) 2 25.0 134.3 n.m. 24.8 14 bps
At year-end, there were 987 Woolworths Supermarkets and 64 Metro Food Stores with a total fleet of 1,051 stores.
Average prices increased 1.4% across F20, with growth of 2.4% in Q4 with increases in Grocery and Fresh categories including Vegetables and Meat driven by unfavourable growing conditions and livestock cost increases. Q4 inflation was also impacted by lower promotional activity at the beginning of the quarter to prioritise the supply of essential products to stores.
Gross margin increased 47 bps (normalised) to 29.2% driven by COVID-19 related product mix changes, improved stock loss and an ongoing focus on improving promotional effectiveness. In H2, gross margin increased by 56 bps (normalised) also driven by improved stock loss due to strong sell-through, product mix and lower promotional activity. Meat cost inflation continued to materially exceed selling price inflation in H2.
CODB as a percentage of sales was 23.9%, increasing 57 bps (normalised and excluding significant items). This was impacted by $290 million of incremental costs in H2 related to COVID-19. Included within these costs was the temporary employment of over 17,500 team members to support safety and social distancing, additional warehouse capacity and other supply chain costs, scaling-up online (particularly the expansion of Home Delivery), security, cleaning and personal protective equipment costs and a net cost of approximately $30 million related to the Better Together Recognition Award for non-STI eligible team
members. The award was partially funded by a reduction for STI eligible team members.
CODB also included the annualisation of costs associated with the new enterprise agreement, higher supply chain costs driven by the ramp up and dual running costs at MSRDC, a higher eCommerce penetration and costs associated with new businesses such as Cartology, partially offset by productivity benefits.
Depreciation and amortisation increased 11.1% (normalised) driven by the new store and Renewal program, strategic investments including shorter-life technology and digital assets and the commencement of depreciation of MSRDC.
EBIT before significant items increased by 6.3% (normalised) to $2,232 million with a 10 bps reduction in EBIT margin to 5.3% on the same basis. Normalised EBIT in H1 increased by 8.0% and increased by 4.6% in H2. F20 also includes incremental fuel discount costs of $23 million following the sale of the Petrol business on 1 April 2019.
Funds employed (normalised) increased $554 million to $9,161 million from F19, impacted by investment in Renewals, new stores, supply chain and higher working capital. Higher inventory levels were required to support sales volumes and ensure availability and accelerated payments to support small vendors adversely impacted by COVID-19. Despite higher average funds employed, normalised ROFE increased 14 bps.
Looking after our...
Over
20,000plexiscreens in supermarkets
Permanent team members
75,000Better Together
Recognition Awards
Additional
600delivery vehicles increasing eCom network capacity
More than
1.5MPriority Assistance customers served via Home Delivery
43,000Woolworths Basic Boxes distributed
$8.26Mdonated to food relief
charity partners
BasicsBox
& WORKING TOGETHERCOVIDSafe
TEAM
CUSTOMERS
COMMUNITY
1
2
3
4
5
PERFORM
AN
CE
HIG
HLIG
HTS
BUSIN
ESS REV
IEWD
IRECTO
RS' REPO
RTFIN
AN
CIA
L REPO
RTO
THER
INFO
RMATIO
N25
WO
OLW
ORTH
S GRO
UP
AN
NU
AL REPO
RT 2020
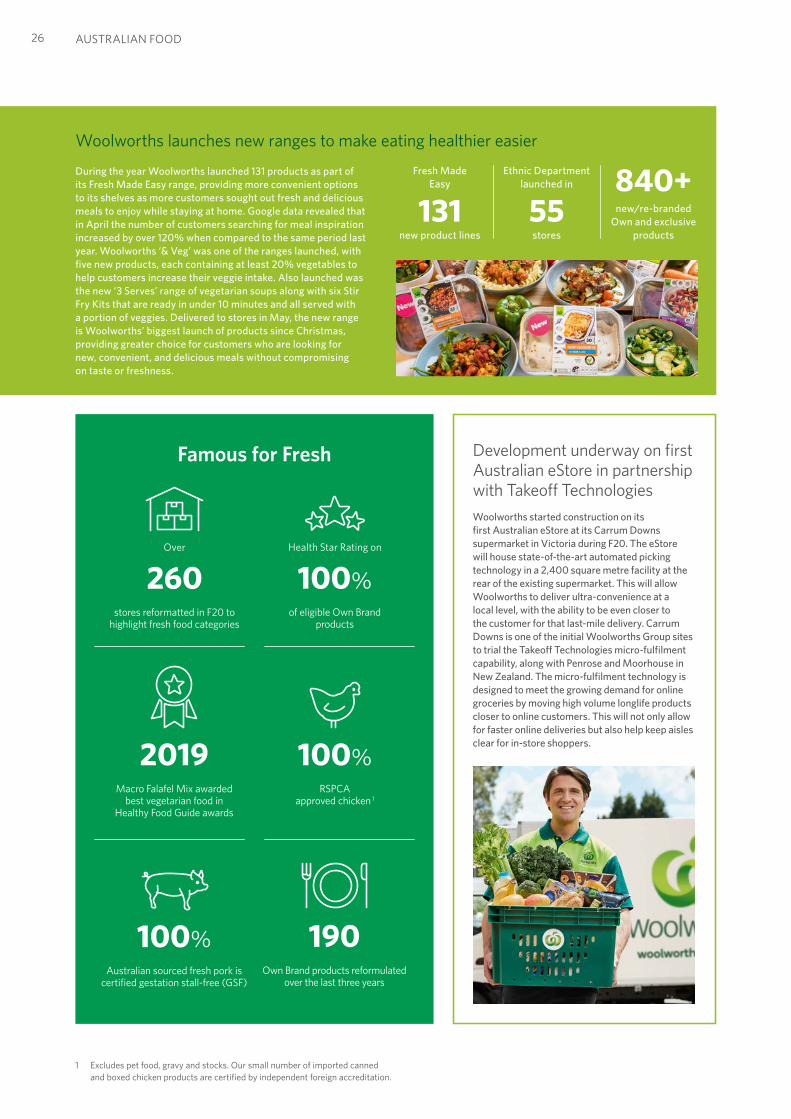
Development underway on first Australian eStore in partnership with Takeoff TechnologiesWoolworths started construction on its first Australian eStore at its Carrum Downs supermarket in Victoria during F20. The eStore will house state-of-the-art automated picking technology in a 2,400 square metre facility at the rear of the existing supermarket. This will allow Woolworths to deliver ultra-convenience at a local level, with the ability to be even closer to the customer for that last-mile delivery. Carrum Downs is one of the initial Woolworths Group sites to trial the Takeoff Technologies micro-fulfilment capability, along with Penrose and Moorhouse in New Zealand. The micro-fulfilment technology is designed to meet the growing demand for online groceries by moving high volume longlife products closer to online customers. This will not only allow for faster online deliveries but also help keep aisles clear for in-store shoppers.
26 AUSTRALIAN FOOD
Woolworths launches new ranges to make eating healthier easier
During the year Woolworths launched 131 products as part of its Fresh Made Easy range, providing more convenient options to its shelves as more customers sought out fresh and delicious meals to enjoy while staying at home. Google data revealed that in April the number of customers searching for meal inspiration increased by over 120% when compared to the same period last year. Woolworths ‘& Veg’ was one of the ranges launched, with five new products, each containing at least 20% vegetables to help customers increase their veggie intake. Also launched was the new ‘3 Serves’ range of vegetarian soups along with six Stir Fry Kits that are ready in under 10 minutes and all served with a portion of veggies. Delivered to stores in May, the new range is Woolworths’ biggest launch of products since Christmas, providing greater choice for customers who are looking for new, convenient, and delicious meals without compromising on taste or freshness.
Famous for Fresh
Over
260stores reformatted in F20 to
highlight fresh food categories
Health Star Rating on
100%of eligible Own Brand
products
2019Macro Falafel Mix awarded
best vegetarian food in Healthy Food Guide awards
100%RSPCA
approved chicken 1
1 Excludes pet food, gravy and stocks. Our small number of imported canned and boxed chicken products are certified by independent foreign accreditation.
100%Australian sourced fresh pork is
certified gestation stall-free (GSF)
190Own Brand products reformulated
over the last three years
Fresh Made Easy
131new product lines
Ethnic Department launched in
55 stores
840+new/re-branded
Own and exclusive products
F20 was another transformative year for WooliesX as it was reorganised into three platforms, being Digital & Media, eCom & Fulfilment and Loyalty & FinTech.
Online sales ($M)
$2,017 43.1% 1 from F19
Trading PerformanceDigital & Media includes demand generation, digital experience and Cartology. eCom & Fulfilment includes eCommerce sales and services and order fulfilment services (home delivery, crowd-sourced delivery and pick-up) and Loyalty & FinTech includes Everyday Rewards and the Group’s payments, gift card and insurance businesses.
Digital and eCommerce growth was already very strong but experienced a step-change in Q3 due to the onset of COVID-19. The surge in demand for eCommerce services initially impacted sales and the customer experience but the business rapidly adapted and added capacity in Q4 to resume all normal services and provide additional capacity and convenience to customers.
Average weekly traffic to Woolworths’ websites and apps also increased materially with 8.4 million weekly visits in Q3 (+66.9%) and 10.1 million weekly visits in Q4 (+79.2%). Increasingly, customers used the Group’s digital platforms to access curated content including the latest catalogue and specials, research store opening hours and trading status, access delivery slots and look for meal inspiration.
During the year, the Digital & Media platform also delivered more personalised and relevant customer experiences such as smart shopping lists and personalised search. Cartology continued to connect supplier partner brands with customers across its Group digital properties. By the end of the year, Cartology digital advertising screens had been rolled out to 957 stores.
In eCom & Fulfilment, the COVID disruption in Q3 impacted Online VOC NPS which dropped to 56 as our focus shifted to supporting vulnerable customers. However, it recovered strongly to 64 in Q4, up three points on the prior year as customers recognised the convenience being provided to them and as additional capacity was added, and normal services were restored.
To rapidly respond to the surge in demand in Q3, the team doubled eCommerce capacity, scaled-up crowd-sourced delivery, opened 78 new home delivery stores and accelerated the rollout of contactless Pick up to 86 locations. With increased capacity, eCommerce sales accelerated again in Q4 growing by 69.0% on a normalised basis with a record online penetration of 6.3%.
For F20, eCommerce sales grew by 43.1% on a normalised basis to $2.0 billion with online penetration for the year at 4.8%.
Pick up as a proportion of online sales declined in Q3 and Q4 due to the temporary suspension of the service and as some customers preferred to have their groceries delivered given the COVID-19 restrictions in place.
ECom & Fulfilment profit further increased in F20 due to benefits from increased scale and efficiency improvements across stores, customer fulfilment centres and route optimisation.
Despite the challenges faced by the business in F20, WooliesX continues to be recognised as an industry leader winning all seven categories in Mozo’s Online Awards.
In Loyalty & FinTech, Everyday Rewards members grew by 5.5% to 12.3 million members by the end of June. In-store scan rates at Woolworths Supermarkets increased to 49.6% reflecting stronger member engagement.
In collaboration with the banks, WooliesX successfully negotiated with AusPayNet to increase the pin limit on tap-and-go transactions to $200 to reduce customers’ need to touch the payment terminal. Cashless payment transactions in H2 were up 7.8% on the prior year. Scan & Go also continues to grow and was expanded to 10 Woolworths Supermarkets and seven Metro Food Stores.
1 Normalised for 53rd week.
Average weekly traffic (million)
8.0 73.6% on F19
DIGITAL & MEDIA
eCOM & FULFILMENT
LOYALTY & FINTECH
Everyday Rewards members
12.3M 0.6M from F19
Everyday RewardsLaunched in May, the new app makes it easier for members to activate bonus point offers, discover personalised specials and check their points balance on the go. The new app also offers e-receipts for purchases and a digital card for convenient scanning.
1
2
3
4
5
PERFORM
AN
CE
HIG
HLIG
HTS
BUSIN
ESS REV
IEWD
IRECTO
RS' REPO
RTFIN
AN
CIA
L REPO
RTO
THER
INFO
RMATIO
N
27
WO
OLW
ORTH
S GRO
UP
AN
NU
AL REPO
RT 2020
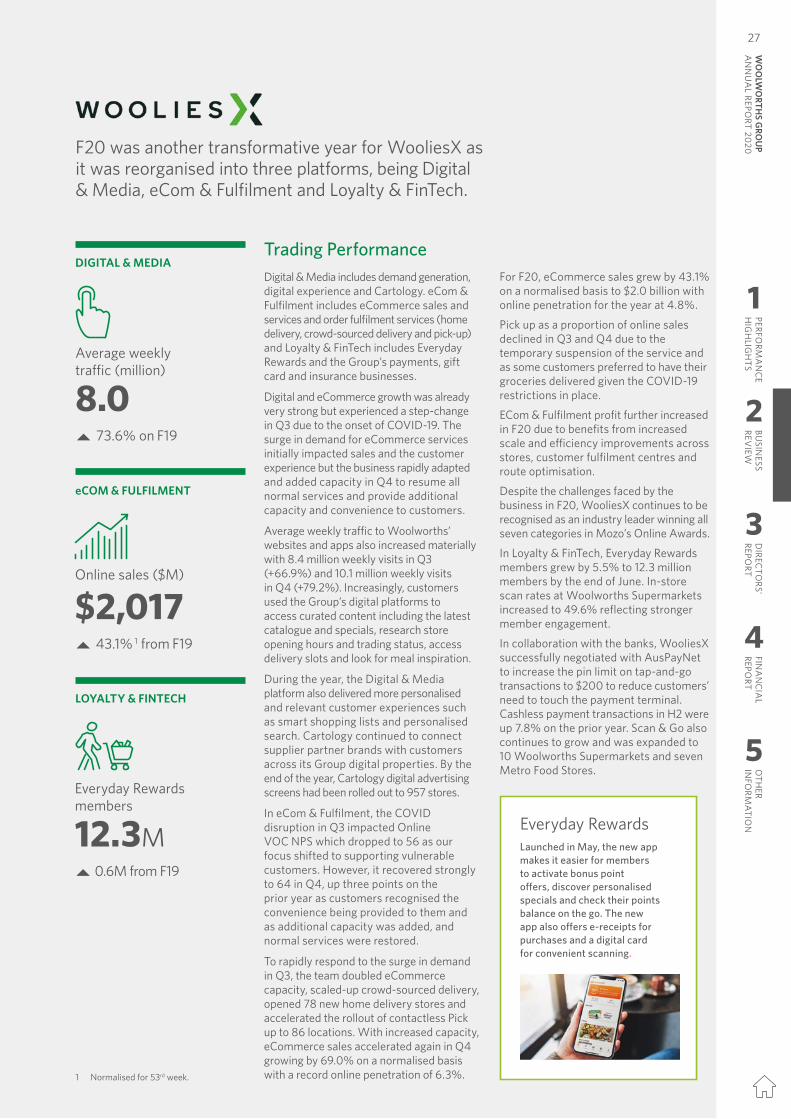
Development underway on first Australian eStore in partnership with Takeoff TechnologiesWoolworths started construction on its first Australian eStore at its Carrum Downs supermarket in Victoria during F20. The eStore will house state-of-the-art automated picking technology in a 2,400 square metre facility at the rear of the existing supermarket. This will allow Woolworths to deliver ultra-convenience at a local level, with the ability to be even closer to the customer for that last-mile delivery. Carrum Downs is one of the initial Woolworths Group sites to trial the Takeoff Technologies micro-fulfilment capability, along with Penrose and Moorhouse in New Zealand. The micro-fulfilment technology is designed to meet the growing demand for online groceries by moving high volume longlife products closer to online customers. This will not only allow for faster online deliveries but also help keep aisles clear for in-store shoppers.
26 AUSTRALIAN FOOD
Woolworths launches new ranges to make eating healthier easier
During the year Woolworths launched 131 products as part of its Fresh Made Easy range, providing more convenient options to its shelves as more customers sought out fresh and delicious meals to enjoy while staying at home. Google data revealed that in April the number of customers searching for meal inspiration increased by over 120% when compared to the same period last year. Woolworths ‘& Veg’ was one of the ranges launched, with five new products, each containing at least 20% vegetables to help customers increase their veggie intake. Also launched was the new ‘3 Serves’ range of vegetarian soups along with six Stir Fry Kits that are ready in under 10 minutes and all served with a portion of veggies. Delivered to stores in May, the new range is Woolworths’ biggest launch of products since Christmas, providing greater choice for customers who are looking for new, convenient, and delicious meals without compromising on taste or freshness.
Famous for Fresh
Over
260stores reformatted in F20 to
highlight fresh food categories
Health Star Rating on
100%of eligible Own Brand
products
2019Macro Falafel Mix awarded
best vegetarian food in Healthy Food Guide awards
100%RSPCA
approved chicken 1
1 Excludes pet food, gravy and stocks. Our small number of imported canned and boxed chicken products are certified by independent foreign accreditation.
100%Australian sourced fresh pork is
certified gestation stall-free (GSF)
190Own Brand products reformulated
over the last three years
Fresh Made Easy
131new product lines
Ethnic Department launched in
55 stores
840+new/re-branded
Own and exclusive products
F20 was another transformative year for WooliesX as it was reorganised into three platforms, being Digital & Media, eCom & Fulfilment and Loyalty & FinTech.
Online sales ($M)
$2,017 43.1% 1 from F19
Trading PerformanceDigital & Media includes demand generation, digital experience and Cartology. eCom & Fulfilment includes eCommerce sales and services and order fulfilment services (home delivery, crowd-sourced delivery and pick-up) and Loyalty & FinTech includes Everyday Rewards and the Group’s payments, gift card and insurance businesses.
Digital and eCommerce growth was already very strong but experienced a step-change in Q3 due to the onset of COVID-19. The surge in demand for eCommerce services initially impacted sales and the customer experience but the business rapidly adapted and added capacity in Q4 to resume all normal services and provide additional capacity and convenience to customers.
Average weekly traffic to Woolworths’ websites and apps also increased materially with 8.4 million weekly visits in Q3 (+66.9%) and 10.1 million weekly visits in Q4 (+79.2%). Increasingly, customers used the Group’s digital platforms to access curated content including the latest catalogue and specials, research store opening hours and trading status, access delivery slots and look for meal inspiration.
During the year, the Digital & Media platform also delivered more personalised and relevant customer experiences such as smart shopping lists and personalised search. Cartology continued to connect supplier partner brands with customers across its Group digital properties. By the end of the year, Cartology digital advertising screens had been rolled out to 957 stores.
In eCom & Fulfilment, the COVID disruption in Q3 impacted Online VOC NPS which dropped to 56 as our focus shifted to supporting vulnerable customers. However, it recovered strongly to 64 in Q4, up three points on the prior year as customers recognised the convenience being provided to them and as additional capacity was added, and normal services were restored.
To rapidly respond to the surge in demand in Q3, the team doubled eCommerce capacity, scaled-up crowd-sourced delivery, opened 78 new home delivery stores and accelerated the rollout of contactless Pick up to 86 locations. With increased capacity, eCommerce sales accelerated again in Q4 growing by 69.0% on a normalised basis with a record online penetration of 6.3%.
For F20, eCommerce sales grew by 43.1% on a normalised basis to $2.0 billion with online penetration for the year at 4.8%.
Pick up as a proportion of online sales declined in Q3 and Q4 due to the temporary suspension of the service and as some customers preferred to have their groceries delivered given the COVID-19 restrictions in place.
ECom & Fulfilment profit further increased in F20 due to benefits from increased scale and efficiency improvements across stores, customer fulfilment centres and route optimisation.
Despite the challenges faced by the business in F20, WooliesX continues to be recognised as an industry leader winning all seven categories in Mozo’s Online Awards.
In Loyalty & FinTech, Everyday Rewards members grew by 5.5% to 12.3 million members by the end of June. In-store scan rates at Woolworths Supermarkets increased to 49.6% reflecting stronger member engagement.
In collaboration with the banks, WooliesX successfully negotiated with AusPayNet to increase the pin limit on tap-and-go transactions to $200 to reduce customers’ need to touch the payment terminal. Cashless payment transactions in H2 were up 7.8% on the prior year. Scan & Go also continues to grow and was expanded to 10 Woolworths Supermarkets and seven Metro Food Stores.
1 Normalised for 53rd week.
Average weekly traffic (million)
8.0 73.6% on F19
DIGITAL & MEDIA
eCOM & FULFILMENT
LOYALTY & FINTECH
Everyday Rewards members
12.3M 0.6M from F19
Everyday RewardsLaunched in May, the new app makes it easier for members to activate bonus point offers, discover personalised specials and check their points balance on the go. The new app also offers e-receipts for purchases and a digital card for convenient scanning.
1
2
3
4
5
PERFORM
AN
CE
HIG
HLIG
HTS
BUSIN
ESS REV
IEWD
IRECTO
RS' REPO
RTFIN
AN
CIA
L REPO
RTO
THER
INFO
RMATIO
N27
WO
OLW
ORTH
S GRO
UP
AN
NU
AL REPO
RT 2020
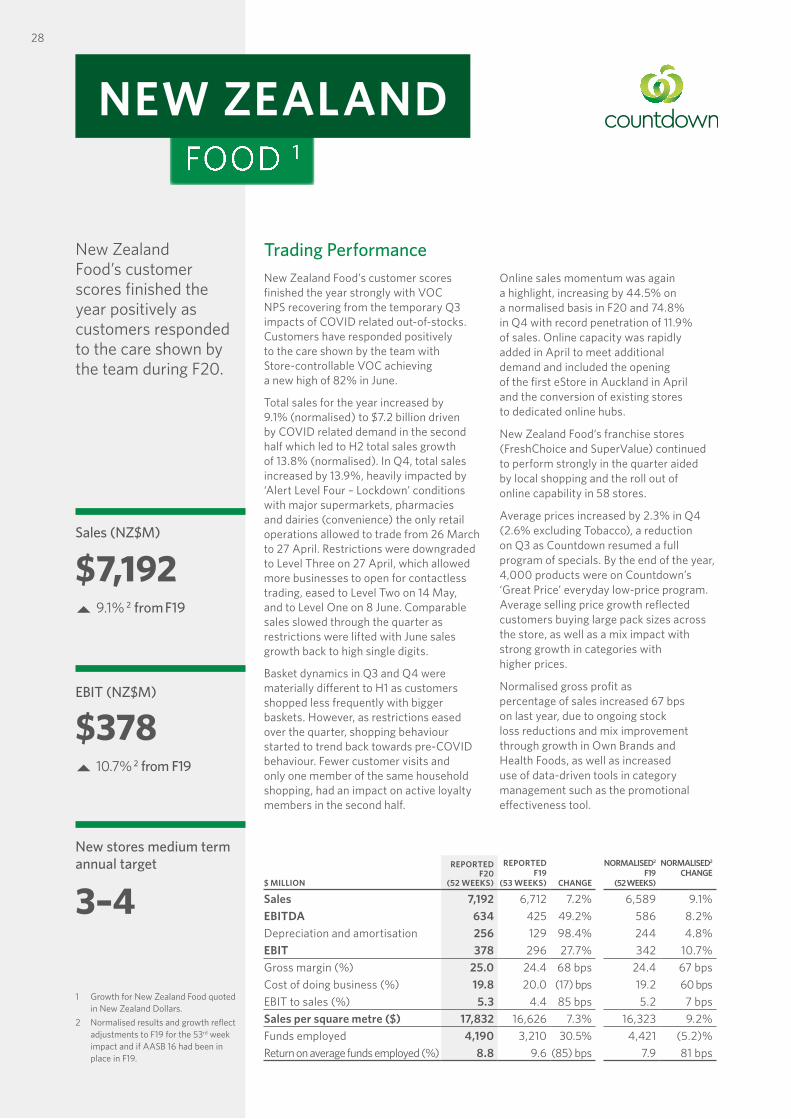
28
New Zealand Food’s customer scores finished the year positively as customers responded to the care shown by the team during F20.
1 Growth for New Zealand Food quoted in New Zealand Dollars.
2 Normalised results and growth reflect adjustments to F19 for the 53rd week impact and if AASB 16 had been in place in F19.
FOOD 1
NEW ZEALAND
EBIT (NZ$M)
$378 10.7% 2 from F19
New stores medium term annual target
3–4
Sales (NZ$M)
$7,192 9.1% 2 from F19
Trading PerformanceNew Zealand Food’s customer scores finished the year strongly with VOC NPS recovering from the temporary Q3 impacts of COVID related out-of-stocks. Customers have responded positively to the care shown by the team with Store-controllable VOC achieving a new high of 82% in June.
Total sales for the year increased by 9.1% (normalised) to $7.2 billion driven by COVID related demand in the second half which led to H2 total sales growth of 13.8% (normalised). In Q4, total sales increased by 13.9%, heavily impacted by ‘Alert Level Four – Lockdown’ conditions with major supermarkets, pharmacies and dairies (convenience) the only retail operations allowed to trade from 26 March to 27 April. Restrictions were downgraded to Level Three on 27 April, which allowed more businesses to open for contactless trading, eased to Level Two on 14 May, and to Level One on 8 June. Comparable sales slowed through the quarter as restrictions were lifted with June sales growth back to high single digits.
Basket dynamics in Q3 and Q4 were materially different to H1 as customers shopped less frequently with bigger baskets. However, as restrictions eased over the quarter, shopping behaviour started to trend back towards pre-COVID behaviour. Fewer customer visits and only one member of the same household shopping, had an impact on active loyalty members in the second half.
Online sales momentum was again a highlight, increasing by 44.5% on a normalised basis in F20 and 74.8% in Q4 with record penetration of 11.9% of sales. Online capacity was rapidly added in April to meet additional demand and included the opening of the first eStore in Auckland in April and the conversion of existing stores to dedicated online hubs.
New Zealand Food’s franchise stores (FreshChoice and SuperValue) continued to perform strongly in the quarter aided by local shopping and the roll out of online capability in 58 stores.
Average prices increased by 2.3% in Q4 (2.6% excluding Tobacco), a reduction on Q3 as Countdown resumed a full program of specials. By the end of the year, 4,000 products were on Countdown’s ‘Great Price’ everyday low-price program. Average selling price growth reflected customers buying large pack sizes across the store, as well as a mix impact with strong growth in categories with higher prices.
Normalised gross profit as percentage of sales increased 67 bps on last year, due to ongoing stock loss reductions and mix improvement through growth in Own Brands and Health Foods, as well as increased use of data-driven tools in category management such as the promotional effectiveness tool.
$ MILLION
REPORTEDF20
(52 WEEKS)
REPORTED F19
(53 WEEKS) CHANGE
NORMALISED2
F19(52 WEEKS)
NORMALISED2
CHANGE
Sales 7,192 6,712 7.2% 6,589 9.1%EBITDA 634 425 49.2% 586 8.2%Depreciation and amortisation 256 129 98.4% 244 4.8%EBIT 378 296 27.7% 342 10.7%Gross margin (%) 25.0 24.4 68 bps 24.4 67 bpsCost of doing business (%) 19.8 20.0 (17) bps 19.2 60 bpsEBIT to sales (%) 5.3 4.4 85 bps 5.2 7 bpsSales per square metre ($) 17,832 16,626 7.3% 16,323 9.2%Funds employed 4,190 3,210 30.5% 4,421 (5.2)%Return on average funds employed (%) 8.8 9.6 (85) bps 7.9 81 bps
Online sales momentum was again a highlight in F20 reaching new highs in online penetration. Online capacity was rapidly added in April to meet the additional demand and create a better experience for Kiwi customers.
F20 Online sales growth
44.5%F20 Online VOC NPS
64F20 Online penetration
9.0%
Onecard members
1.7MOlive chatbot sessions
750,000Ease of Pick up VOC
90%
Normalised CODB as a percentage of sales increased by 60 bps for the year which was primarily driven by additional costs during COVID-19 (including personal protective equipment, cleaning, security and additional team costs) of $65 million and higher team member wages with the implementation of a new enterprise agreement in H1 F20. Team costs will increase faster than inflation over the three-year term of the agreement.
Normalised EBIT increased by 10.7% with the normalised EBIT margin increasing by 7 bps compared to the prior year. Normalised H2 EBIT increased by 15.1%.
Funds employed declined by 5.2% on a normalised basis due to higher trade payables due to the timing of month end payments compared to last year. ROFE increased by 81 bps (normalised) to 8.8% due to EBIT growth and lower average funds employed.
During the quarter, one store was opened ending the year at 182 Countdown stores and one new eStore opened in Penrose. All but one of the stores temporarily closed and converted into dedicated online hubs have reopened, along with one store temporarily closed given its CBD location. Due to the resumption of Level Three restrictions in Auckland in the last few weeks, one Metro CBD store has temporarily closed in Q1 F21.
In June, the Food for Good foundation was established, with an immediate $1 million donation to food welfare and food rescue charities across New Zealand.
Through the Better Together Recognition Award, over 13,000 New Zealand team members are now shareholders in Woolworths Group.
Countdown has launched a new Food for Good foundation as we continue to expand our existing support of New Zealand communities.
The Foundation kicked off in June with an immediate NZD $1 million donation to food welfare and food rescue charities around the country, and a further $500,000 in financial support for Countdown’s food rescue partners. This funding helped ensure New Zealanders could continue to put food on the table for their families in the wake of COVID-19.
The Foundation has since held a very successful Winter Appeal, raising over NZD $280,000 in customer donations for The Salvation Army to help feed New Zealanders who are struggling this winter, with other appeals planned for the coming year.
New Zealand’s first eStore On 16 April 2020, Countdown opened New Zealand’s first ever purpose-built and permanent eStore. The 8,800 square metre store in Auckland’s Penrose has a team of 200 personal shoppers to run the eStore and complete online orders for customers from 10 of Countdown’s busiest Auckland supermarkets.
The eStore operates 24 hours a day, seven days a week and currently has the capacity to fulfil more than 7,500 online orders each week due to a data-based layout that increases picking efficiency. Countdown has also partnered with Boston-based eGrocery startup Takeoff Technologies to introduce a partially-automated micro fulfilment solution at the eStore. Installation of the technology is planned for later this year and will pick and move the most popular grocery items to the personal shoppers on a conveyor belt, meaning they can fulfil even more orders with ease.
& WORKING TOGETHERCOVIDSafe
1
2
3
4
5
PERFORM
AN
CE
HIG
HLIG
HTS
BUSIN
ESS REV
IEWD
IRECTO
RS' REPO
RTFIN
AN
CIA
L REPO
RTO
THER
INFO
RMATIO
N
29
WO
OLW
ORTH
S GRO
UP
AN
NU
AL REPO
RT 2020
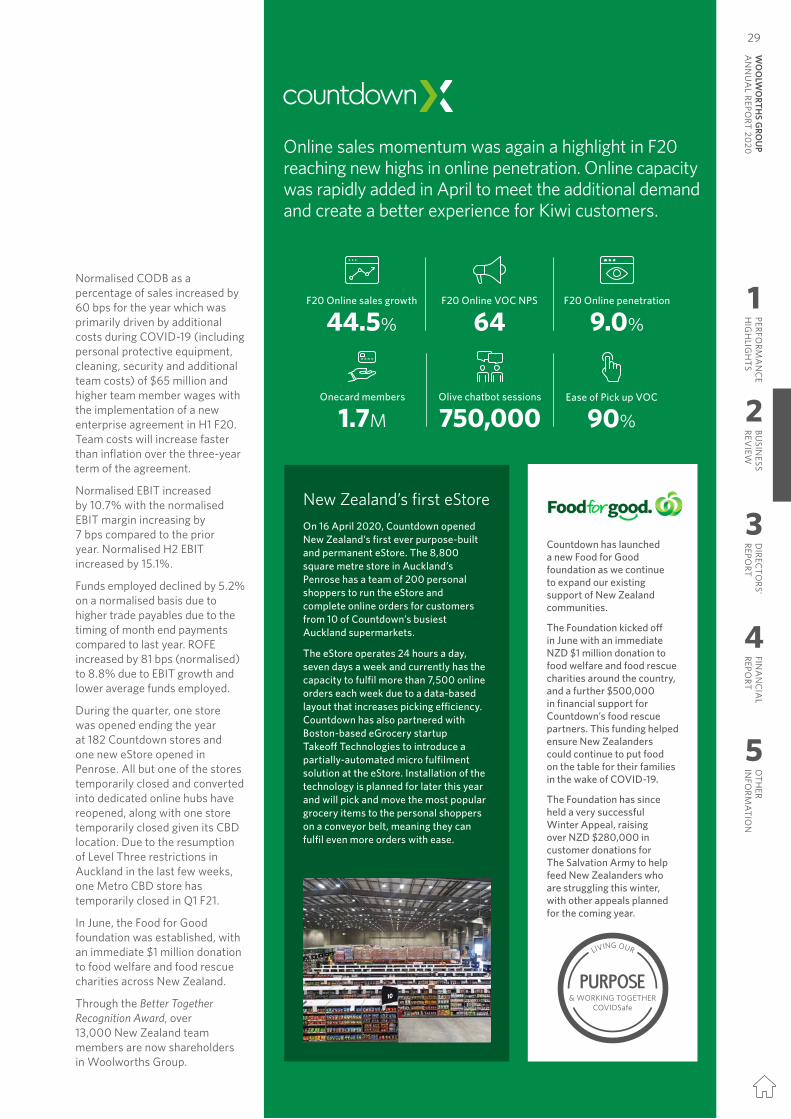
28
New Zealand Food’s customer scores finished the year positively as customers responded to the care shown by the team during F20.
1 Growth for New Zealand Food quoted in New Zealand Dollars.
2 Normalised results and growth reflect adjustments to F19 for the 53rd week impact and if AASB 16 had been in place in F19.
FOOD 1
NEW ZEALAND
EBIT (NZ$M)
$378 10.7% 2 from F19
New stores medium term annual target
3–4
Sales (NZ$M)
$7,192 9.1% 2 from F19
Trading PerformanceNew Zealand Food’s customer scores finished the year strongly with VOC NPS recovering from the temporary Q3 impacts of COVID related out-of-stocks. Customers have responded positively to the care shown by the team with Store-controllable VOC achieving a new high of 82% in June.
Total sales for the year increased by 9.1% (normalised) to $7.2 billion driven by COVID related demand in the second half which led to H2 total sales growth of 13.8% (normalised). In Q4, total sales increased by 13.9%, heavily impacted by ‘Alert Level Four – Lockdown’ conditions with major supermarkets, pharmacies and dairies (convenience) the only retail operations allowed to trade from 26 March to 27 April. Restrictions were downgraded to Level Three on 27 April, which allowed more businesses to open for contactless trading, eased to Level Two on 14 May, and to Level One on 8 June. Comparable sales slowed through the quarter as restrictions were lifted with June sales growth back to high single digits.
Basket dynamics in Q3 and Q4 were materially different to H1 as customers shopped less frequently with bigger baskets. However, as restrictions eased over the quarter, shopping behaviour started to trend back towards pre-COVID behaviour. Fewer customer visits and only one member of the same household shopping, had an impact on active loyalty members in the second half.
Online sales momentum was again a highlight, increasing by 44.5% on a normalised basis in F20 and 74.8% in Q4 with record penetration of 11.9% of sales. Online capacity was rapidly added in April to meet additional demand and included the opening of the first eStore in Auckland in April and the conversion of existing stores to dedicated online hubs.
New Zealand Food’s franchise stores (FreshChoice and SuperValue) continued to perform strongly in the quarter aided by local shopping and the roll out of online capability in 58 stores.
Average prices increased by 2.3% in Q4 (2.6% excluding Tobacco), a reduction on Q3 as Countdown resumed a full program of specials. By the end of the year, 4,000 products were on Countdown’s ‘Great Price’ everyday low-price program. Average selling price growth reflected customers buying large pack sizes across the store, as well as a mix impact with strong growth in categories with higher prices.
Normalised gross profit as percentage of sales increased 67 bps on last year, due to ongoing stock loss reductions and mix improvement through growth in Own Brands and Health Foods, as well as increased use of data-driven tools in category management such as the promotional effectiveness tool.
$ MILLION
REPORTEDF20
(52 WEEKS)
REPORTED F19
(53 WEEKS) CHANGE
NORMALISED2
F19(52 WEEKS)
NORMALISED2
CHANGE
Sales 7,192 6,712 7.2% 6,589 9.1%EBITDA 634 425 49.2% 586 8.2%Depreciation and amortisation 256 129 98.4% 244 4.8%EBIT 378 296 27.7% 342 10.7%Gross margin (%) 25.0 24.4 68 bps 24.4 67 bpsCost of doing business (%) 19.8 20.0 (17) bps 19.2 60 bpsEBIT to sales (%) 5.3 4.4 85 bps 5.2 7 bpsSales per square metre ($) 17,832 16,626 7.3% 16,323 9.2%Funds employed 4,190 3,210 30.5% 4,421 (5.2)%Return on average funds employed (%) 8.8 9.6 (85) bps 7.9 81 bps
Online sales momentum was again a highlight in F20 reaching new highs in online penetration. Online capacity was rapidly added in April to meet the additional demand and create a better experience for Kiwi customers.
F20 Online sales growth
44.5%F20 Online VOC NPS
64F20 Online penetration
9.0%
Onecard members
1.7MOlive chatbot sessions
750,000Ease of Pick up VOC
90%
Normalised CODB as a percentage of sales increased by 60 bps for the year which was primarily driven by additional costs during COVID-19 (including personal protective equipment, cleaning, security and additional team costs) of $65 million and higher team member wages with the implementation of a new enterprise agreement in H1 F20. Team costs will increase faster than inflation over the three-year term of the agreement.
Normalised EBIT increased by 10.7% with the normalised EBIT margin increasing by 7 bps compared to the prior year. Normalised H2 EBIT increased by 15.1%.
Funds employed declined by 5.2% on a normalised basis due to higher trade payables due to the timing of month end payments compared to last year. ROFE increased by 81 bps (normalised) to 8.8% due to EBIT growth and lower average funds employed.
During the quarter, one store was opened ending the year at 182 Countdown stores and one new eStore opened in Penrose. All but one of the stores temporarily closed and converted into dedicated online hubs have reopened, along with one store temporarily closed given its CBD location. Due to the resumption of Level Three restrictions in Auckland in the last few weeks, one Metro CBD store has temporarily closed in Q1 F21.
In June, the Food for Good foundation was established, with an immediate $1 million donation to food welfare and food rescue charities across New Zealand.
Through the Better Together Recognition Award, over 13,000 New Zealand team members are now shareholders in Woolworths Group.
Countdown has launched a new Food for Good foundation as we continue to expand our existing support of New Zealand communities.
The Foundation kicked off in June with an immediate NZD $1 million donation to food welfare and food rescue charities around the country, and a further $500,000 in financial support for Countdown’s food rescue partners. This funding helped ensure New Zealanders could continue to put food on the table for their families in the wake of COVID-19.
The Foundation has since held a very successful Winter Appeal, raising over NZD $280,000 in customer donations for The Salvation Army to help feed New Zealanders who are struggling this winter, with other appeals planned for the coming year.
New Zealand’s first eStore On 16 April 2020, Countdown opened New Zealand’s first ever purpose-built and permanent eStore. The 8,800 square metre store in Auckland’s Penrose has a team of 200 personal shoppers to run the eStore and complete online orders for customers from 10 of Countdown’s busiest Auckland supermarkets.
The eStore operates 24 hours a day, seven days a week and currently has the capacity to fulfil more than 7,500 online orders each week due to a data-based layout that increases picking efficiency. Countdown has also partnered with Boston-based eGrocery startup Takeoff Technologies to introduce a partially-automated micro fulfilment solution at the eStore. Installation of the technology is planned for later this year and will pick and move the most popular grocery items to the personal shoppers on a conveyor belt, meaning they can fulfil even more orders with ease.
& WORKING TOGETHERCOVIDSafe
1
2
3
4
5
PERFORM
AN
CE
HIG
HLIG
HTS
BUSIN
ESS REV
IEWD
IRECTO
RS' REPO
RTFIN
AN
CIA
L REPO
RTO
THER
INFO
RMATIO
N29
WO
OLW
ORTH
S GRO
UP
AN
NU
AL REPO
RT 2020
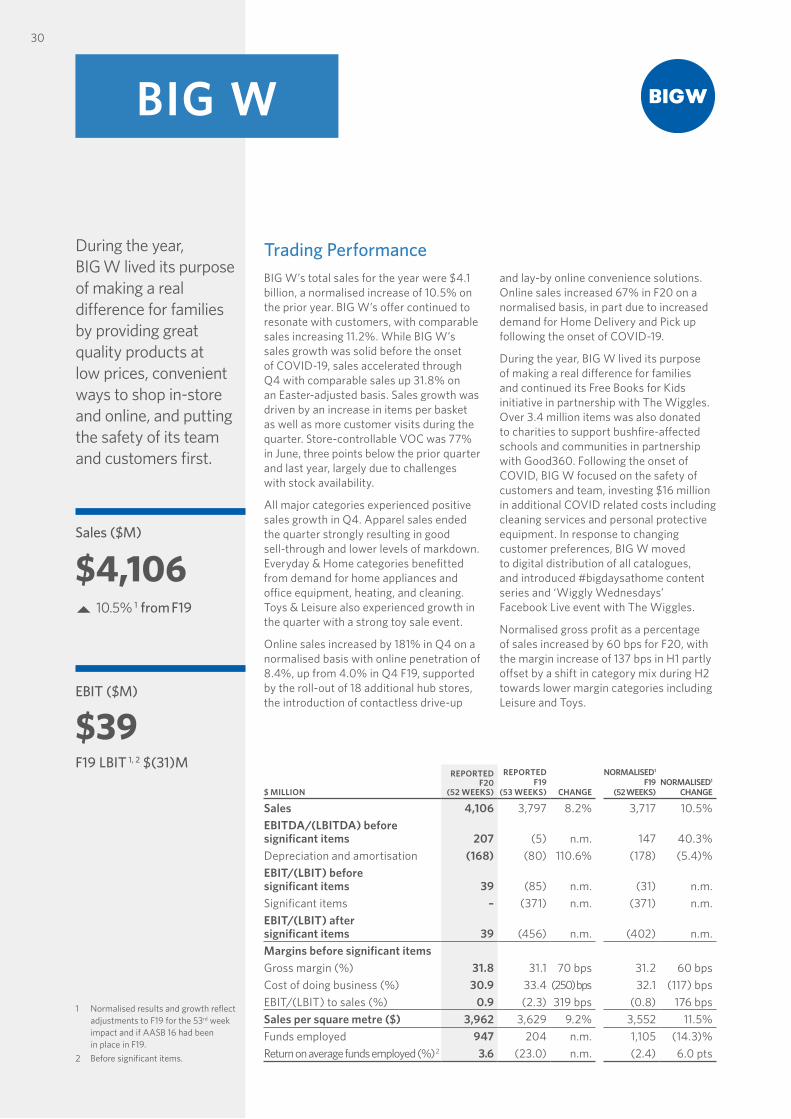
30
During the year, BIG W lived its purpose of making a real difference for families by providing great quality products at low prices, convenient ways to shop in-store and online, and putting the safety of its team and customers first.
1 Normalised results and growth reflect adjustments to F19 for the 53rd week impact and if AASB 16 had been in place in F19.
2 Before significant items.
BIG W
EBIT ($M)
$39
Sales ($M)
$4,106 10.5% 1 from F19
Trading PerformanceBIG W’s total sales for the year were $4.1 billion, a normalised increase of 10.5% on the prior year. BIG W’s offer continued to resonate with customers, with comparable sales increasing 11.2%. While BIG W’s sales growth was solid before the onset of COVID-19, sales accelerated through Q4 with comparable sales up 31.8% on an Easter-adjusted basis. Sales growth was driven by an increase in items per basket as well as more customer visits during the quarter. Store-controllable VOC was 77% in June, three points below the prior quarter and last year, largely due to challenges with stock availability.
All major categories experienced positive sales growth in Q4. Apparel sales ended the quarter strongly resulting in good sell-through and lower levels of markdown. Everyday & Home categories benefitted from demand for home appliances and office equipment, heating, and cleaning. Toys & Leisure also experienced growth in the quarter with a strong toy sale event.
Online sales increased by 181% in Q4 on a normalised basis with online penetration of 8.4%, up from 4.0% in Q4 F19, supported by the roll-out of 18 additional hub stores, the introduction of contactless drive-up
and lay-by online convenience solutions. Online sales increased 67% in F20 on a normalised basis, in part due to increased demand for Home Delivery and Pick up following the onset of COVID-19.
During the year, BIG W lived its purpose of making a real difference for families and continued its Free Books for Kids initiative in partnership with The Wiggles. Over 3.4 million items was also donated to charities to support bushfire-affected schools and communities in partnership with Good360. Following the onset of COVID, BIG W focused on the safety of customers and team, investing $16 million in additional COVID related costs including cleaning services and personal protective equipment. In response to changing customer preferences, BIG W moved to digital distribution of all catalogues, and introduced #bigdaysathome content series and ‘Wiggly Wednesdays’ Facebook Live event with The Wiggles.
Normalised gross profit as a percentage of sales increased by 60 bps for F20, with the margin increase of 137 bps in H1 partly offset by a shift in category mix during H2 towards lower margin categories including Leisure and Toys.
F19 LBIT 1, 2 $(31)M
$ MILLION
REPORTEDF20
(52 WEEKS)
REPORTED F19
(53 WEEKS) CHANGE
NORMALISED1
F19(52 WEEKS)
NORMALISED1
CHANGE
Sales 4,106 3,797 8.2% 3,717 10.5%EBITDA/(LBITDA) before significant items 207 (5) n.m. 147 40.3%Depreciation and amortisation (168) (80) 110.6% (178) (5.4)%EBIT/(LBIT) before significant items 39 (85) n.m. (31) n.m.Significant items – (371) n.m. (371) n.m.EBIT/(LBIT) after significant items 39 (456) n.m. (402) n.m.Margins before significant itemsGross margin (%) 31.8 31.1 70 bps 31.2 60 bpsCost of doing business (%) 30.9 33.4 (250) bps 32.1 (117) bpsEBIT/(LBIT) to sales (%) 0.9 (2.3) 319 bps (0.8) 176 bpsSales per square metre ($) 3,962 3,629 9.2% 3,552 11.5%Funds employed 947 204 n.m. 1,105 (14.3)%Return on average funds employed (%) 2 3.6 (23.0) n.m. (2.4) 6.0 pts
Making a Real Difference for FamiliesTo continue making a real difference for families, BIG W supported bushfire affected communities with essential items for fire and volunteer services. BIG W also helped families rebuild with donations of kitchen and home items, bathroom necessities, school essential items and everyday needs. Through a partnership with Good360, 665 charities benefitted from such donations.
Also during this time, together with Woolworths, $200,000 in gift vouchers were donated to provide support to local families and communities impacted by bushfires as kids returned for the new school year. BIG W also partnered with Good360 to donate surplus stock to families who needed a helping hand. Over 3.4 million items were donated to 240 member charities as well as eligible schools.
To help build healthy minds and bright futures for Australian children, BIG W gave away 2.6 million books nationally, as part of the popular Free Books For Kids program. An additional 40,000 books were donated to regional and rural schools across Australia, ensuring access to books for families who don’t live near a BIG W store. Another 48,000 books created in partnership with The Wiggles were also donated to charities and schools Australia-wide.
This takes the total number of books given away in the Free Books for Kids program to over nine million since its launch in February 2019.
National Aboriginal and Torres Strait Islander Corp picking up essential items donated by Good360.
BIG W supported kids in bushfire affected areas with back to school supplies as they returned for the new year.
Scaling up the digital customer experience
F20 Online sales growth
66.8%F20 Online VOC NPS
57F20 Online penetration
6.3%
Pick up locations
179Drive up locations
78
Average weekly digital traffic
3.3M
F20 Online business Pick up
55%Home Delivery
45%
Normalised CODB as a percentage of sales reduced by 117 bps, resulting from strong cost management and sales growth fractionalising fixed costs during H2, offsetting investment in safety and the impact of the new enterprise agreement in Q1.
BIG W’s turnaround remains on track, reporting full-year EBIT of $39 million, a normalised increase of $70 million on F19. Normalised EBITDA increased by 40.3%.
At the end of June, inventory levels were below typical levels due to increased sales, with average inventory days reducing by 15.4 days compared to the prior year. Inventory levels will be rebuilt over the course of F21. As a result, funds employed declined by 14.3% (normalised). ROFE increased to 3.6% due to the improvement in EBIT and lower funds employed.
BIG W closed four stores during the year as part of the ongoing network review, with total store numbers now at 179. As previously announced, Monarto DC will close in F21 and BIG W recently announced that a further three stores will close at the end of January 2021.
BIG W will continue to focus on creating a distinctive customer value proposition, by providing great quality products at low prices, convenient ways to shop in-store and online, and delivering solutions in key destination categories as well putting the safety of its team and customers first.
& WORKING TOGETHERCOVIDSafe
1
2
3
4
5
PERFORM
AN
CE
HIG
HLIG
HTS
BUSIN
ESS REV
IEWD
IRECTO
RS' REPO
RTFIN
AN
CIA
L REPO
RTO
THER
INFO
RMATIO
N
31
WO
OLW
ORTH
S GRO
UP
AN
NU
AL REPO
RT 2020
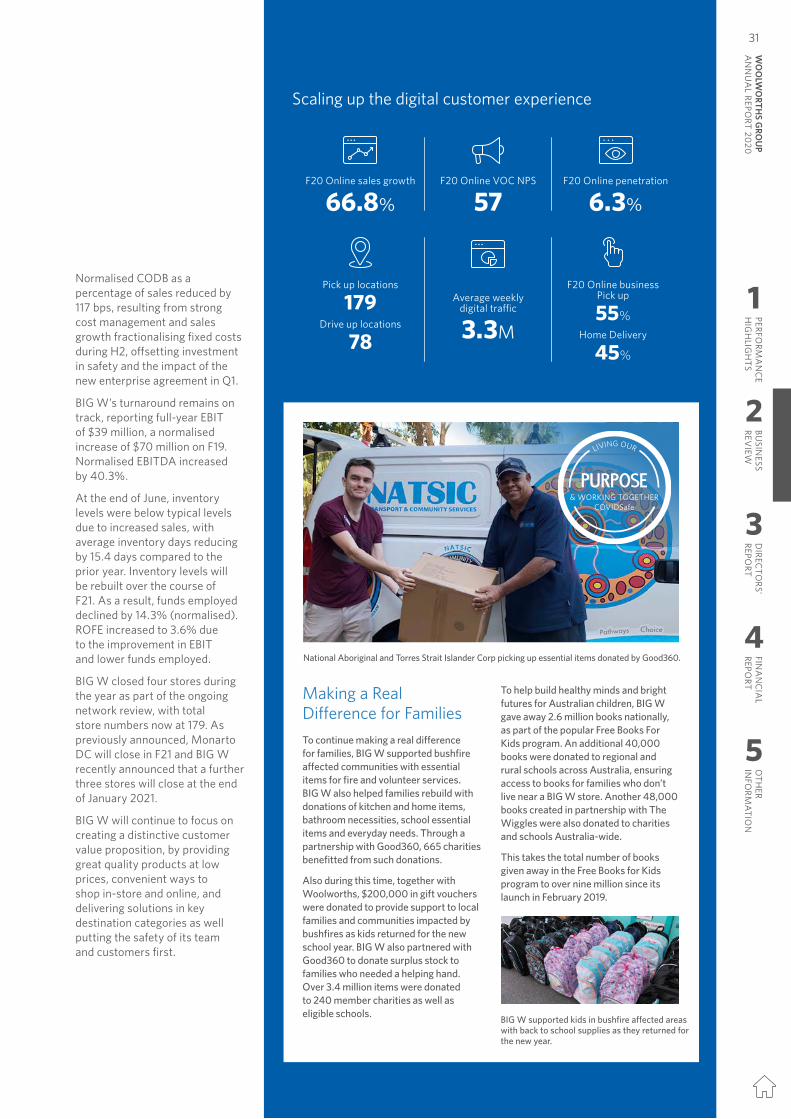
30
During the year, BIG W lived its purpose of making a real difference for families by providing great quality products at low prices, convenient ways to shop in-store and online, and putting the safety of its team and customers first.
1 Normalised results and growth reflect adjustments to F19 for the 53rd week impact and if AASB 16 had been in place in F19.
2 Before significant items.
BIG W
EBIT ($M)
$39
Sales ($M)
$4,106 10.5% 1 from F19
Trading PerformanceBIG W’s total sales for the year were $4.1 billion, a normalised increase of 10.5% on the prior year. BIG W’s offer continued to resonate with customers, with comparable sales increasing 11.2%. While BIG W’s sales growth was solid before the onset of COVID-19, sales accelerated through Q4 with comparable sales up 31.8% on an Easter-adjusted basis. Sales growth was driven by an increase in items per basket as well as more customer visits during the quarter. Store-controllable VOC was 77% in June, three points below the prior quarter and last year, largely due to challenges with stock availability.
All major categories experienced positive sales growth in Q4. Apparel sales ended the quarter strongly resulting in good sell-through and lower levels of markdown. Everyday & Home categories benefitted from demand for home appliances and office equipment, heating, and cleaning. Toys & Leisure also experienced growth in the quarter with a strong toy sale event.
Online sales increased by 181% in Q4 on a normalised basis with online penetration of 8.4%, up from 4.0% in Q4 F19, supported by the roll-out of 18 additional hub stores, the introduction of contactless drive-up
and lay-by online convenience solutions. Online sales increased 67% in F20 on a normalised basis, in part due to increased demand for Home Delivery and Pick up following the onset of COVID-19.
During the year, BIG W lived its purpose of making a real difference for families and continued its Free Books for Kids initiative in partnership with The Wiggles. Over 3.4 million items was also donated to charities to support bushfire-affected schools and communities in partnership with Good360. Following the onset of COVID, BIG W focused on the safety of customers and team, investing $16 million in additional COVID related costs including cleaning services and personal protective equipment. In response to changing customer preferences, BIG W moved to digital distribution of all catalogues, and introduced #bigdaysathome content series and ‘Wiggly Wednesdays’ Facebook Live event with The Wiggles.
Normalised gross profit as a percentage of sales increased by 60 bps for F20, with the margin increase of 137 bps in H1 partly offset by a shift in category mix during H2 towards lower margin categories including Leisure and Toys.
F19 LBIT 1, 2 $(31)M
$ MILLION
REPORTEDF20
(52 WEEKS)
REPORTED F19
(53 WEEKS) CHANGE
NORMALISED1
F19(52 WEEKS)
NORMALISED1
CHANGE
Sales 4,106 3,797 8.2% 3,717 10.5%EBITDA/(LBITDA) before significant items 207 (5) n.m. 147 40.3%Depreciation and amortisation (168) (80) 110.6% (178) (5.4)%EBIT/(LBIT) before significant items 39 (85) n.m. (31) n.m.Significant items – (371) n.m. (371) n.m.EBIT/(LBIT) after significant items 39 (456) n.m. (402) n.m.Margins before significant itemsGross margin (%) 31.8 31.1 70 bps 31.2 60 bpsCost of doing business (%) 30.9 33.4 (250) bps 32.1 (117) bpsEBIT/(LBIT) to sales (%) 0.9 (2.3) 319 bps (0.8) 176 bpsSales per square metre ($) 3,962 3,629 9.2% 3,552 11.5%Funds employed 947 204 n.m. 1,105 (14.3)%Return on average funds employed (%) 2 3.6 (23.0) n.m. (2.4) 6.0 pts
Making a Real Difference for FamiliesTo continue making a real difference for families, BIG W supported bushfire affected communities with essential items for fire and volunteer services. BIG W also helped families rebuild with donations of kitchen and home items, bathroom necessities, school essential items and everyday needs. Through a partnership with Good360, 665 charities benefitted from such donations.
Also during this time, together with Woolworths, $200,000 in gift vouchers were donated to provide support to local families and communities impacted by bushfires as kids returned for the new school year. BIG W also partnered with Good360 to donate surplus stock to families who needed a helping hand. Over 3.4 million items were donated to 240 member charities as well as eligible schools.
To help build healthy minds and bright futures for Australian children, BIG W gave away 2.6 million books nationally, as part of the popular Free Books For Kids program. An additional 40,000 books were donated to regional and rural schools across Australia, ensuring access to books for families who don’t live near a BIG W store. Another 48,000 books created in partnership with The Wiggles were also donated to charities and schools Australia-wide.
This takes the total number of books given away in the Free Books for Kids program to over nine million since its launch in February 2019.
National Aboriginal and Torres Strait Islander Corp picking up essential items donated by Good360.
BIG W supported kids in bushfire affected areas with back to school supplies as they returned for the new year.
Scaling up the digital customer experience
F20 Online sales growth
66.8%F20 Online VOC NPS
57F20 Online penetration
6.3%
Pick up locations
179Drive up locations
78
Average weekly digital traffic
3.3M
F20 Online business Pick up
55%Home Delivery
45%
Normalised CODB as a percentage of sales reduced by 117 bps, resulting from strong cost management and sales growth fractionalising fixed costs during H2, offsetting investment in safety and the impact of the new enterprise agreement in Q1.
BIG W’s turnaround remains on track, reporting full-year EBIT of $39 million, a normalised increase of $70 million on F19. Normalised EBITDA increased by 40.3%.
At the end of June, inventory levels were below typical levels due to increased sales, with average inventory days reducing by 15.4 days compared to the prior year. Inventory levels will be rebuilt over the course of F21. As a result, funds employed declined by 14.3% (normalised). ROFE increased to 3.6% due to the improvement in EBIT and lower funds employed.
BIG W closed four stores during the year as part of the ongoing network review, with total store numbers now at 179. As previously announced, Monarto DC will close in F21 and BIG W recently announced that a further three stores will close at the end of January 2021.
BIG W will continue to focus on creating a distinctive customer value proposition, by providing great quality products at low prices, convenient ways to shop in-store and online, and delivering solutions in key destination categories as well putting the safety of its team and customers first.
& WORKING TOGETHERCOVIDSafe
1
2
3
4
5
PERFORM
AN
CE
HIG
HLIG
HTS
BUSIN
ESS REV
IEWD
IRECTO
RS' REPO
RTFIN
AN
CIA
L REPO
RTO
THER
INFO
RMATIO
N31
WO
OLW
ORTH
S GRO
UP
AN
NU
AL REPO
RT 2020
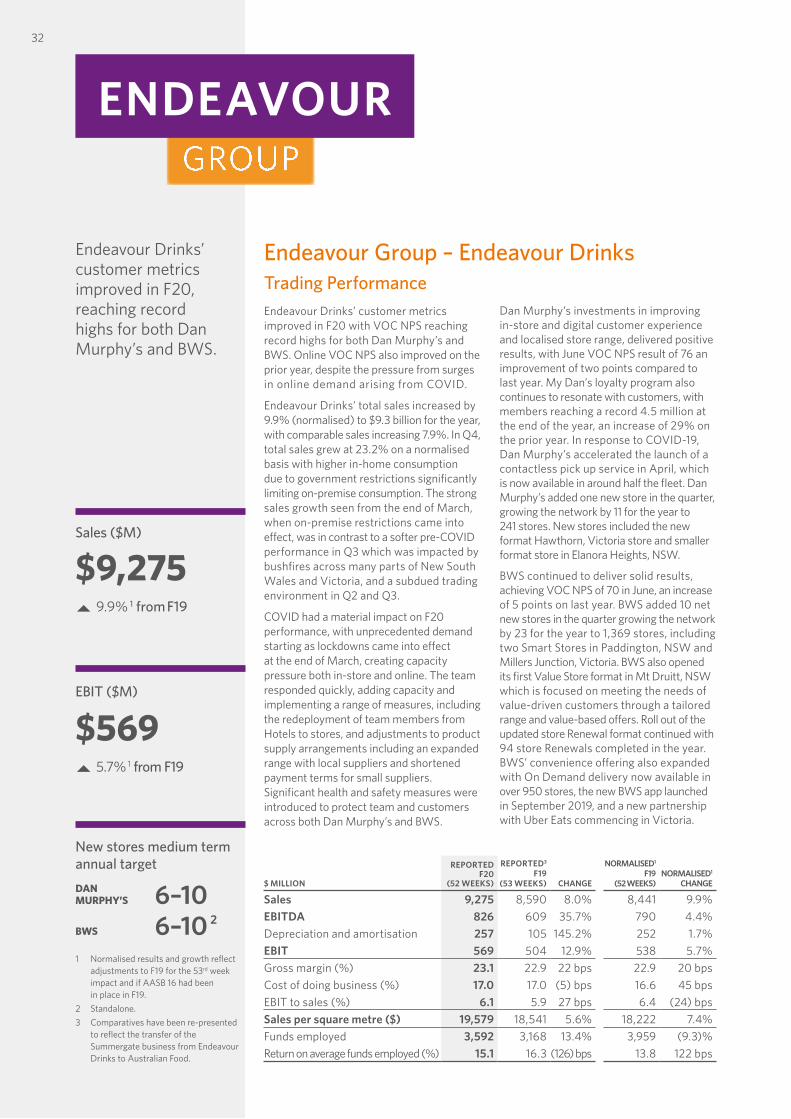
32
Endeavour Drinks’ customer metrics improved in F20, reaching record highs for both Dan Murphy’s and BWS.
1 Normalised results and growth reflect adjustments to F19 for the 53rd week impact and if AASB 16 had been in place in F19.
2 Standalone.3 Comparatives have been re-presented
to reflect the transfer of the Summergate business from Endeavour Drinks to Australian Food.
GROUPENDEAVOUR
EBIT ($M)
$569 5.7% 1 from F19
New stores medium term annual targetDAN MURPHY’S
BWS
6–106–10 2
Sales ($M)
$9,275 9.9% 1 from F19
Endeavour Group – Endeavour DrinksTrading PerformanceEndeavour Drinks’ customer metrics improved in F20 with VOC NPS reaching record highs for both Dan Murphy’s and BWS. Online VOC NPS also improved on the prior year, despite the pressure from surges in online demand arising from COVID.
Endeavour Drinks’ total sales increased by 9.9% (normalised) to $9.3 billion for the year, with comparable sales increasing 7.9%. In Q4, total sales grew at 23.2% on a normalised basis with higher in-home consumption due to government restrictions significantly limiting on-premise consumption. The strong sales growth seen from the end of March, when on-premise restrictions came into effect, was in contrast to a softer pre-COVID performance in Q3 which was impacted by bushfires across many parts of New South Wales and Victoria, and a subdued trading environment in Q2 and Q3.
COVID had a material impact on F20 performance, with unprecedented demand starting as lockdowns came into effect at the end of March, creating capacity pressure both in-store and online. The team responded quickly, adding capacity and implementing a range of measures, including the redeployment of team members from Hotels to stores, and adjustments to product supply arrangements including an expanded range with local suppliers and shortened payment terms for small suppliers. Significant health and safety measures were introduced to protect team and customers across both Dan Murphy’s and BWS.
Dan Murphy’s investments in improving in-store and digital customer experience and localised store range, delivered positive results, with June VOC NPS result of 76 an improvement of two points compared to last year. My Dan’s loyalty program also continues to resonate with customers, with members reaching a record 4.5 million at the end of the year, an increase of 29% on the prior year. In response to COVID-19, Dan Murphy’s accelerated the launch of a contactless pick up service in April, which is now available in around half the fleet. Dan Murphy’s added one new store in the quarter, growing the network by 11 for the year to 241 stores. New stores included the new format Hawthorn, Victoria store and smaller format store in Elanora Heights, NSW.
BWS continued to deliver solid results, achieving VOC NPS of 70 in June, an increase of 5 points on last year. BWS added 10 net new stores in the quarter growing the network by 23 for the year to 1,369 stores, including two Smart Stores in Paddington, NSW and Millers Junction, Victoria. BWS also opened its first Value Store format in Mt Druitt, NSW which is focused on meeting the needs of value-driven customers through a tailored range and value-based offers. Roll out of the updated store Renewal format continued with 94 store Renewals completed in the year. BWS’ convenience offering also expanded with On Demand delivery now available in over 950 stores, the new BWS app launched in September 2019, and a new partnership with Uber Eats commencing in Victoria.
$ MILLION
REPORTED F20
(52 WEEKS)
REPORTED3
F19(53 WEEKS) CHANGE
NORMALISED1
F19(52 WEEKS)
NORMALISED1
CHANGE
Sales 9,275 8,590 8.0% 8,441 9.9%EBITDA 826 609 35.7% 790 4.4%Depreciation and amortisation 257 105 145.2% 252 1.7%EBIT 569 504 12.9% 538 5.7%Gross margin (%) 23.1 22.9 22 bps 22.9 20 bpsCost of doing business (%) 17.0 17.0 (5) bps 16.6 45 bpsEBIT to sales (%) 6.1 5.9 27 bps 6.4 (24) bpsSales per square metre ($) 19,579 18,541 5.6% 18,222 7.4%Funds employed 3,592 3,168 13.4% 3,959 (9.3)%Return on average funds employed (%) 15.1 16.3 (126) bps 13.8 122 bps
Safety for teams and customers
• Protective plexiglass screens and sanitation stations were installed at the checkouts of over 1,500 Dan Murphy’s and BWS stores.
• Additional day cleans and weekly deep cleans were implemented, and extra security was added to support team members and product limits where relevant.
• Signage, including floor decals, were added to stores to help customers socially distance, and for customers preferring to order online, contactless delivery and Pick up was available.
• Dan Murphy’s also rolled out its contactless direct-to-boot service to 149 stores, which means customers can order online, drive to their local store, and stay in the car while a team member puts the order in the boot. The service has been so popular that Dan Murphy’s has vowed to keep it permanently.
Investment in digital and increased fulfilment capabilities delivered positive online sales growth momentum in F20.
EndeavourX
F20 Online sales growth
28.6%
F20 Online penetration
6.9%
Pick up growth
61.0%
My Dan’s Members
4.5M
F20 On Demand Delivery growth
161%
F20 BWS and Dan Murphy’s app downloads
>900,000
EndeavourX’s investment in digital and fulfilment capabilities delivered normalised online sales growth of 28.6% to $637 million in F20, with online penetration increasing to 6.9%. In Q4, online sales growth accelerated due to COVID-19, increasing by 47.8% on a normalised basis compared to the prior year, achieving penetration of 7.1%. Both BWS and Dan Murphy’s delivered strong sales growth with BWS online sales doubling in H2, albeit from a lower base. Other initiatives included an extension of Endeavour Marketplace’s (Direct from Supplier) service and local ranging programs to assist small producers with a route to market. Approximately 400 new suppliers have been added, offering over 4,000 new products online and in stores.
Endeavour Drinks sales per square metre increased by 7.4% on a normalised basis with rolling 12-month sales growth exceeding net average space growth of 2.3%.
Gross margin was up 20 bps on a normalised basis at 23.1% for the full year. Margin growth was lower in Q4 due to COVID-19 impacts, including a mix shift to value products and larger pack sizes, as well as the increase in online sales at a higher cost to fulfil.
Normalised CODB as a percentage of sales increased by 45 bps, impacted by $13 million in COVID-19 related costs, higher team wages under new enterprise agreements for store teams, higher salaried team increases, targeted investments in digital, online and in-store customer experience and the write-off of IT legacy assets no longer in use in H2. COVID-19 related costs included investment in team and customer safety such as personal protective equipment, cleaning and security.
Normalised EBIT increased by 5.7% in F20 with the EBIT margin declining by 24 bps. Normalised H2 EBIT increased by 4.2% with H2 EBIT margin declining by 58 bps due to the higher costs in H2 described above.
Normalised ROFE increased by 122 bps on the prior year reflecting the EBIT improvement. Normalised funds employed was lower due to increased trade and other payables.
& WORKING TOGETHERCOVIDSafe
1
2
3
4
5
PERFORM
AN
CE
HIG
HLIG
HTS
BUSIN
ESS REV
IEWD
IRECTO
RS' REPO
RTFIN
AN
CIA
L REPO
RTO
THER
INFO
RMATIO
N
33
WO
OLW
ORTH
S GRO
UP
AN
NU
AL REPO
RT 2020
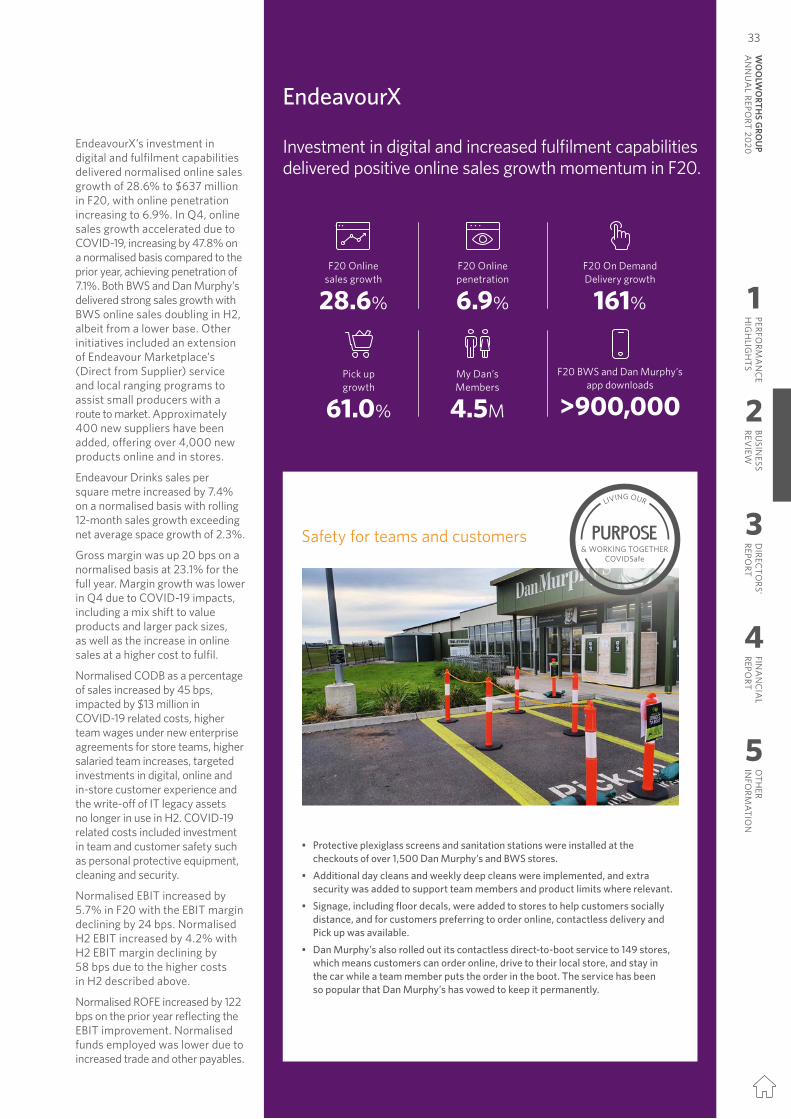
32
Endeavour Drinks’ customer metrics improved in F20, reaching record highs for both Dan Murphy’s and BWS.
1 Normalised results and growth reflect adjustments to F19 for the 53rd week impact and if AASB 16 had been in place in F19.
2 Standalone.3 Comparatives have been re-presented
to reflect the transfer of the Summergate business from Endeavour Drinks to Australian Food.
GROUPENDEAVOUR
EBIT ($M)
$569 5.7% 1 from F19
New stores medium term annual targetDAN MURPHY’S
BWS
6–106–10 2
Sales ($M)
$9,275 9.9% 1 from F19
Endeavour Group – Endeavour DrinksTrading PerformanceEndeavour Drinks’ customer metrics improved in F20 with VOC NPS reaching record highs for both Dan Murphy’s and BWS. Online VOC NPS also improved on the prior year, despite the pressure from surges in online demand arising from COVID.
Endeavour Drinks’ total sales increased by 9.9% (normalised) to $9.3 billion for the year, with comparable sales increasing 7.9%. In Q4, total sales grew at 23.2% on a normalised basis with higher in-home consumption due to government restrictions significantly limiting on-premise consumption. The strong sales growth seen from the end of March, when on-premise restrictions came into effect, was in contrast to a softer pre-COVID performance in Q3 which was impacted by bushfires across many parts of New South Wales and Victoria, and a subdued trading environment in Q2 and Q3.
COVID had a material impact on F20 performance, with unprecedented demand starting as lockdowns came into effect at the end of March, creating capacity pressure both in-store and online. The team responded quickly, adding capacity and implementing a range of measures, including the redeployment of team members from Hotels to stores, and adjustments to product supply arrangements including an expanded range with local suppliers and shortened payment terms for small suppliers. Significant health and safety measures were introduced to protect team and customers across both Dan Murphy’s and BWS.
Dan Murphy’s investments in improving in-store and digital customer experience and localised store range, delivered positive results, with June VOC NPS result of 76 an improvement of two points compared to last year. My Dan’s loyalty program also continues to resonate with customers, with members reaching a record 4.5 million at the end of the year, an increase of 29% on the prior year. In response to COVID-19, Dan Murphy’s accelerated the launch of a contactless pick up service in April, which is now available in around half the fleet. Dan Murphy’s added one new store in the quarter, growing the network by 11 for the year to 241 stores. New stores included the new format Hawthorn, Victoria store and smaller format store in Elanora Heights, NSW.
BWS continued to deliver solid results, achieving VOC NPS of 70 in June, an increase of 5 points on last year. BWS added 10 net new stores in the quarter growing the network by 23 for the year to 1,369 stores, including two Smart Stores in Paddington, NSW and Millers Junction, Victoria. BWS also opened its first Value Store format in Mt Druitt, NSW which is focused on meeting the needs of value-driven customers through a tailored range and value-based offers. Roll out of the updated store Renewal format continued with 94 store Renewals completed in the year. BWS’ convenience offering also expanded with On Demand delivery now available in over 950 stores, the new BWS app launched in September 2019, and a new partnership with Uber Eats commencing in Victoria.
$ MILLION
REPORTED F20
(52 WEEKS)
REPORTED3
F19(53 WEEKS) CHANGE
NORMALISED1
F19(52 WEEKS)
NORMALISED1
CHANGE
Sales 9,275 8,590 8.0% 8,441 9.9%EBITDA 826 609 35.7% 790 4.4%Depreciation and amortisation 257 105 145.2% 252 1.7%EBIT 569 504 12.9% 538 5.7%Gross margin (%) 23.1 22.9 22 bps 22.9 20 bpsCost of doing business (%) 17.0 17.0 (5) bps 16.6 45 bpsEBIT to sales (%) 6.1 5.9 27 bps 6.4 (24) bpsSales per square metre ($) 19,579 18,541 5.6% 18,222 7.4%Funds employed 3,592 3,168 13.4% 3,959 (9.3)%Return on average funds employed (%) 15.1 16.3 (126) bps 13.8 122 bps
Safety for teams and customers
• Protective plexiglass screens and sanitation stations were installed at the checkouts of over 1,500 Dan Murphy’s and BWS stores.
• Additional day cleans and weekly deep cleans were implemented, and extra security was added to support team members and product limits where relevant.
• Signage, including floor decals, were added to stores to help customers socially distance, and for customers preferring to order online, contactless delivery and Pick up was available.
• Dan Murphy’s also rolled out its contactless direct-to-boot service to 149 stores, which means customers can order online, drive to their local store, and stay in the car while a team member puts the order in the boot. The service has been so popular that Dan Murphy’s has vowed to keep it permanently.
Investment in digital and increased fulfilment capabilities delivered positive online sales growth momentum in F20.
EndeavourX
F20 Online sales growth
28.6%
F20 Online penetration
6.9%
Pick up growth
61.0%
My Dan’s Members
4.5M
F20 On Demand Delivery growth
161%
F20 BWS and Dan Murphy’s app downloads
>900,000
EndeavourX’s investment in digital and fulfilment capabilities delivered normalised online sales growth of 28.6% to $637 million in F20, with online penetration increasing to 6.9%. In Q4, online sales growth accelerated due to COVID-19, increasing by 47.8% on a normalised basis compared to the prior year, achieving penetration of 7.1%. Both BWS and Dan Murphy’s delivered strong sales growth with BWS online sales doubling in H2, albeit from a lower base. Other initiatives included an extension of Endeavour Marketplace’s (Direct from Supplier) service and local ranging programs to assist small producers with a route to market. Approximately 400 new suppliers have been added, offering over 4,000 new products online and in stores.
Endeavour Drinks sales per square metre increased by 7.4% on a normalised basis with rolling 12-month sales growth exceeding net average space growth of 2.3%.
Gross margin was up 20 bps on a normalised basis at 23.1% for the full year. Margin growth was lower in Q4 due to COVID-19 impacts, including a mix shift to value products and larger pack sizes, as well as the increase in online sales at a higher cost to fulfil.
Normalised CODB as a percentage of sales increased by 45 bps, impacted by $13 million in COVID-19 related costs, higher team wages under new enterprise agreements for store teams, higher salaried team increases, targeted investments in digital, online and in-store customer experience and the write-off of IT legacy assets no longer in use in H2. COVID-19 related costs included investment in team and customer safety such as personal protective equipment, cleaning and security.
Normalised EBIT increased by 5.7% in F20 with the EBIT margin declining by 24 bps. Normalised H2 EBIT increased by 4.2% with H2 EBIT margin declining by 58 bps due to the higher costs in H2 described above.
Normalised ROFE increased by 122 bps on the prior year reflecting the EBIT improvement. Normalised funds employed was lower due to increased trade and other payables.
& WORKING TOGETHERCOVIDSafe
1
2
3
4
5
PERFORM
AN
CE
HIG
HLIG
HTS
BUSIN
ESS REV
IEWD
IRECTO
RS' REPO
RTFIN
AN
CIA
L REPO
RTO
THER
INFO
RMATIO
N33
WO
OLW
ORTH
S GRO
UP
AN
NU
AL REPO
RT 2020
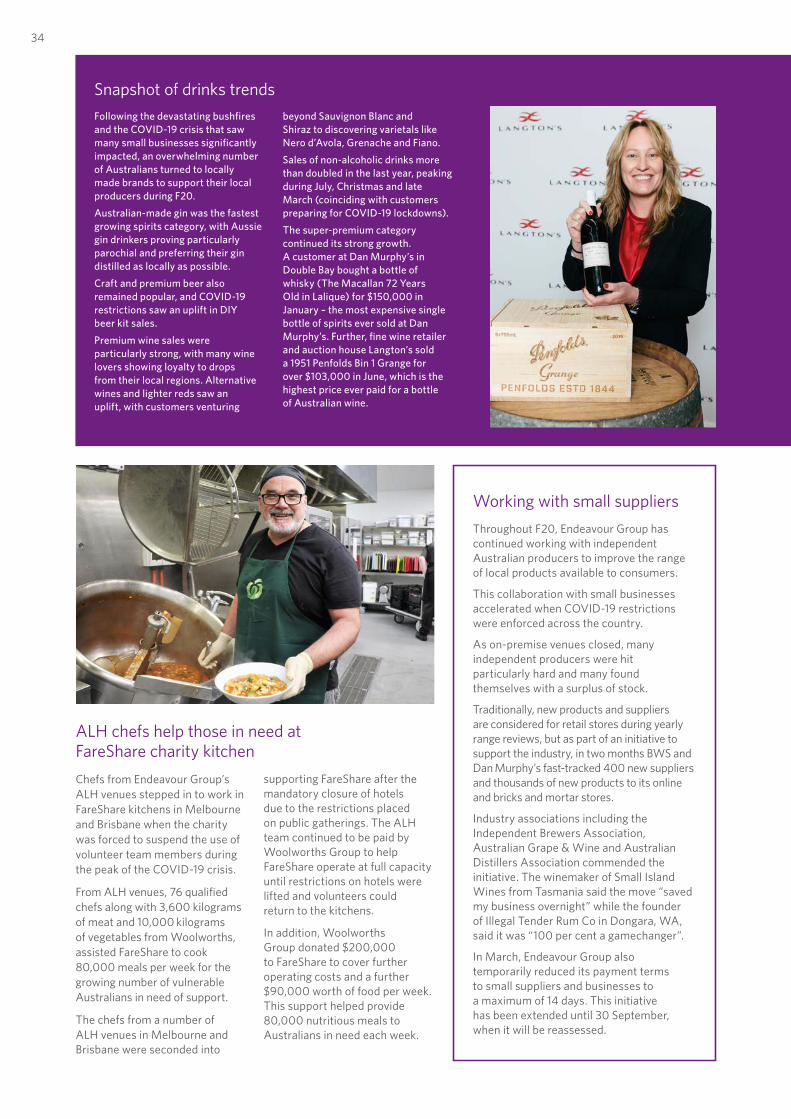
Working with small suppliersThroughout F20, Endeavour Group has continued working with independent Australian producers to improve the range of local products available to consumers.
This collaboration with small businesses accelerated when COVID-19 restrictions were enforced across the country.
As on-premise venues closed, many independent producers were hit particularly hard and many found themselves with a surplus of stock.
Traditionally, new products and suppliers are considered for retail stores during yearly range reviews, but as part of an initiative to support the industry, in two months BWS and Dan Murphy’s fast-tracked 400 new suppliers and thousands of new products to its online and bricks and mortar stores.
Industry associations including the Independent Brewers Association, Australian Grape & Wine and Australian Distillers Association commended the initiative. The winemaker of Small Island Wines from Tasmania said the move “saved my business overnight” while the founder of Illegal Tender Rum Co in Dongara, WA, said it was “100 per cent a gamechanger”.
In March, Endeavour Group also temporarily reduced its payment terms to small suppliers and businesses to a maximum of 14 days. This initiative has been extended until 30 September, when it will be reassessed.
Snapshot of drinks trendsFollowing the devastating bushfires and the COVID-19 crisis that saw many small businesses significantly impacted, an overwhelming number of Australians turned to locally made brands to support their local producers during F20.Australian-made gin was the fastest growing spirits category, with Aussie gin drinkers proving particularly parochial and preferring their gin distilled as locally as possible. Craft and premium beer also remained popular, and COVID-19 restrictions saw an uplift in DIY beer kit sales. Premium wine sales were particularly strong, with many wine lovers showing loyalty to drops from their local regions. Alternative wines and lighter reds saw an uplift, with customers venturing
beyond Sauvignon Blanc and Shiraz to discovering varietals like Nero d’Avola, Grenache and Fiano. Sales of non-alcoholic drinks more than doubled in the last year, peaking during July, Christmas and late March (coinciding with customers preparing for COVID-19 lockdowns). The super-premium category continued its strong growth. A customer at Dan Murphy’s in Double Bay bought a bottle of whisky (The Macallan 72 Years Old in Lalique) for $150,000 in January – the most expensive single bottle of spirits ever sold at Dan Murphy’s. Further, fine wine retailer and auction house Langton’s sold a 1951 Penfolds Bin 1 Grange for over $103,000 in June, which is the highest price ever paid for a bottle of Australian wine.
ALH chefs help those in need at FareShare charity kitchenChefs from Endeavour Group’s ALH venues stepped in to work in FareShare kitchens in Melbourne and Brisbane when the charity was forced to suspend the use of volunteer team members during the peak of the COVID-19 crisis.
From ALH venues, 76 qualified chefs along with 3,600 kilograms of meat and 10,000 kilograms of vegetables from Woolworths, assisted FareShare to cook 80,000 meals per week for the growing number of vulnerable Australians in need of support.
The chefs from a number of ALH venues in Melbourne and Brisbane were seconded into
supporting FareShare after the mandatory closure of hotels due to the restrictions placed on public gatherings. The ALH team continued to be paid by Woolworths Group to help FareShare operate at full capacity until restrictions on hotels were lifted and volunteers could return to the kitchens.
In addition, Woolworths Group donated $200,000 to FareShare to cover further operating costs and a further $90,000 worth of food per week. This support helped provide 80,000 nutritious meals to Australians in need each week.
34
1 Normalised results and growth reflect adjustments to F19 for the 53rd week impact in F19 and if AASB 16 had been in place in F19.
EBIT ($M)
$172 51.0% 1 from F19
New venues medium term annual target
As appropriate opportunities arise
Sales ($M)
$1,320 19.5% 1 from F19
Hotels sales in the second half of F20 were materially impacted by the closure of venues from 23 March due to government-mandated COVID-19 restrictions.
Endeavour Group – Hotels
Hotels outlookIn F21 the Hotels business will continue to adapt to the uncertain operating environment in order to provide the best possible experience for customers and certainty for our teams. As of 27 August, 80 hotels and five managed clubs remain closed
in Victoria while other venues continue to operate under their applicable state conditions. Hotels’ performance for F21 is highly dependent on the level of restrictions in place and the ability to operate by state.
Trading PerformanceHotels’ total sales declined by 19.5% (normalised) compared to the prior year to $1.3 billion. Hotels’ sales in H1 increased by 6.2% but in H2, sales were materially impacted by the closure of venues from 23 March due to government-mandated restrictions. Sales in Q3, where venues were closed for two weeks in the quarter, declined 12.9%. In Q4, venues were closed for most of the quarter, with sales declining by 86.3% on a normalised basis. Venues began to reopen from the end of May but with different operating conditions by state.
Normalised gross margin as a percentage of sales declined by 67 bps due to changes in business mix.
Hotels CODB as a percentage of sales increased materially due to unavoidable costs incurred following the onset of
COVID with little or no revenue due to venues being shut or operating materially below capacity. Despite strong cost control, Hotels continued to incur costs primarily related to occupancy, team costs and depreciation. Hotels has not received any JobKeeper payments.
EBIT of $172 million was 51.0% below the prior year on a normalised basis with an EBIT margin of 13.0%. In H2, Hotels reported a loss before interest and tax of $52 million, reflecting losses incurred due to COVID-driven trading restrictions.
Hotels normalised funds employed was broadly in line with the prior year with normalised ROFE declining due to lower EBIT.
Six venues were added during the year bringing the fleet to 334 venues including five managed clubs.
$ MILLION
REPORTED F20
(52 WEEKS)
REPORTEDF19
(53 WEEKS) CHANGE
NORMALISED1
F19(52 WEEKS)
NORMALISED1
CHANGE
Sales 1,320 1,671 (21.0)% 1,639 (19.5)%EBITDA 405 372 8.8% 593 (31.4)%Depreciation and amortisation 233 111 109.2% 242 (3.0)%EBIT 172 261 (34.3)% 351 (51.0)%Gross margin (%) 83.0 83.6 (65) bps 83.6 (67) bpsCost of doing business (%) 70.0 68.0 197 bps 62.2 771 bpsEBIT to sales (%) 13.0 15.6 (262) bps 21.4 (8.4) ptsFunds employed 4,065 2,068 96.6% 4,042 0.6%Return on average funds employed (%) 4.2 12.9 (8.7) pts 8.7 (4.4) pts
1
2
3
4
5
PERFORM
AN
CE
HIG
HLIG
HTS
BUSIN
ESS REV
IEWD
IRECTO
RS' REPO
RTFIN
AN
CIA
L REPO
RTO
THER
INFO
RMATIO
N
35
WO
OLW
ORTH
S GRO
UP
AN
NU
AL REPO
RT 2020
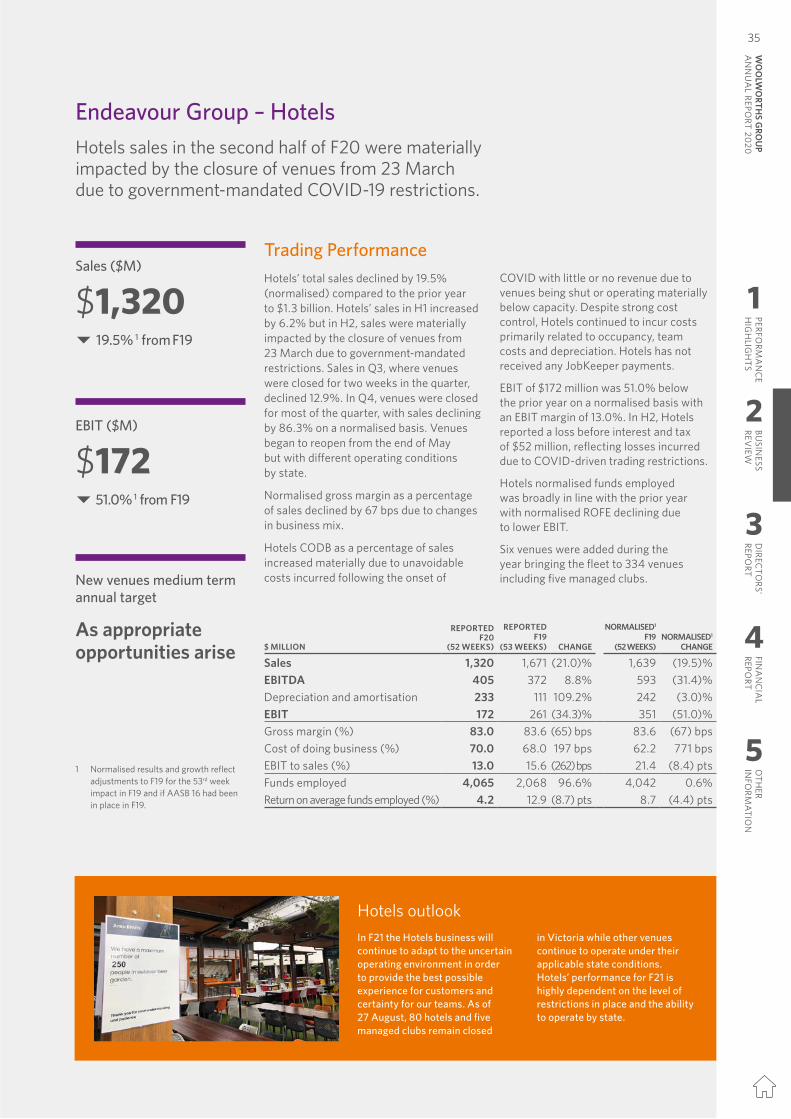
Working with small suppliersThroughout F20, Endeavour Group has continued working with independent Australian producers to improve the range of local products available to consumers.
This collaboration with small businesses accelerated when COVID-19 restrictions were enforced across the country.
As on-premise venues closed, many independent producers were hit particularly hard and many found themselves with a surplus of stock.
Traditionally, new products and suppliers are considered for retail stores during yearly range reviews, but as part of an initiative to support the industry, in two months BWS and Dan Murphy’s fast-tracked 400 new suppliers and thousands of new products to its online and bricks and mortar stores.
Industry associations including the Independent Brewers Association, Australian Grape & Wine and Australian Distillers Association commended the initiative. The winemaker of Small Island Wines from Tasmania said the move “saved my business overnight” while the founder of Illegal Tender Rum Co in Dongara, WA, said it was “100 per cent a gamechanger”.
In March, Endeavour Group also temporarily reduced its payment terms to small suppliers and businesses to a maximum of 14 days. This initiative has been extended until 30 September, when it will be reassessed.
Snapshot of drinks trendsFollowing the devastating bushfires and the COVID-19 crisis that saw many small businesses significantly impacted, an overwhelming number of Australians turned to locally made brands to support their local producers during F20.Australian-made gin was the fastest growing spirits category, with Aussie gin drinkers proving particularly parochial and preferring their gin distilled as locally as possible. Craft and premium beer also remained popular, and COVID-19 restrictions saw an uplift in DIY beer kit sales. Premium wine sales were particularly strong, with many wine lovers showing loyalty to drops from their local regions. Alternative wines and lighter reds saw an uplift, with customers venturing
beyond Sauvignon Blanc and Shiraz to discovering varietals like Nero d’Avola, Grenache and Fiano. Sales of non-alcoholic drinks more than doubled in the last year, peaking during July, Christmas and late March (coinciding with customers preparing for COVID-19 lockdowns). The super-premium category continued its strong growth. A customer at Dan Murphy’s in Double Bay bought a bottle of whisky (The Macallan 72 Years Old in Lalique) for $150,000 in January – the most expensive single bottle of spirits ever sold at Dan Murphy’s. Further, fine wine retailer and auction house Langton’s sold a 1951 Penfolds Bin 1 Grange for over $103,000 in June, which is the highest price ever paid for a bottle of Australian wine.
ALH chefs help those in need at FareShare charity kitchenChefs from Endeavour Group’s ALH venues stepped in to work in FareShare kitchens in Melbourne and Brisbane when the charity was forced to suspend the use of volunteer team members during the peak of the COVID-19 crisis.
From ALH venues, 76 qualified chefs along with 3,600 kilograms of meat and 10,000 kilograms of vegetables from Woolworths, assisted FareShare to cook 80,000 meals per week for the growing number of vulnerable Australians in need of support.
The chefs from a number of ALH venues in Melbourne and Brisbane were seconded into
supporting FareShare after the mandatory closure of hotels due to the restrictions placed on public gatherings. The ALH team continued to be paid by Woolworths Group to help FareShare operate at full capacity until restrictions on hotels were lifted and volunteers could return to the kitchens.
In addition, Woolworths Group donated $200,000 to FareShare to cover further operating costs and a further $90,000 worth of food per week. This support helped provide 80,000 nutritious meals to Australians in need each week.
34
1 Normalised results and growth reflect adjustments to F19 for the 53rd week impact in F19 and if AASB 16 had been in place in F19.
EBIT ($M)
$172 51.0% 1 from F19
New venues medium term annual target
As appropriate opportunities arise
Sales ($M)
$1,320 19.5% 1 from F19
Hotels sales in the second half of F20 were materially impacted by the closure of venues from 23 March due to government-mandated COVID-19 restrictions.
Endeavour Group – Hotels
Hotels outlookIn F21 the Hotels business will continue to adapt to the uncertain operating environment in order to provide the best possible experience for customers and certainty for our teams. As of 27 August, 80 hotels and five managed clubs remain closed
in Victoria while other venues continue to operate under their applicable state conditions. Hotels’ performance for F21 is highly dependent on the level of restrictions in place and the ability to operate by state.
Trading PerformanceHotels’ total sales declined by 19.5% (normalised) compared to the prior year to $1.3 billion. Hotels’ sales in H1 increased by 6.2% but in H2, sales were materially impacted by the closure of venues from 23 March due to government-mandated restrictions. Sales in Q3, where venues were closed for two weeks in the quarter, declined 12.9%. In Q4, venues were closed for most of the quarter, with sales declining by 86.3% on a normalised basis. Venues began to reopen from the end of May but with different operating conditions by state.
Normalised gross margin as a percentage of sales declined by 67 bps due to changes in business mix.
Hotels CODB as a percentage of sales increased materially due to unavoidable costs incurred following the onset of
COVID with little or no revenue due to venues being shut or operating materially below capacity. Despite strong cost control, Hotels continued to incur costs primarily related to occupancy, team costs and depreciation. Hotels has not received any JobKeeper payments.
EBIT of $172 million was 51.0% below the prior year on a normalised basis with an EBIT margin of 13.0%. In H2, Hotels reported a loss before interest and tax of $52 million, reflecting losses incurred due to COVID-driven trading restrictions.
Hotels normalised funds employed was broadly in line with the prior year with normalised ROFE declining due to lower EBIT.
Six venues were added during the year bringing the fleet to 334 venues including five managed clubs.
$ MILLION
REPORTED F20
(52 WEEKS)
REPORTEDF19
(53 WEEKS) CHANGE
NORMALISED1
F19(52 WEEKS)
NORMALISED1
CHANGE
Sales 1,320 1,671 (21.0)% 1,639 (19.5)%EBITDA 405 372 8.8% 593 (31.4)%Depreciation and amortisation 233 111 109.2% 242 (3.0)%EBIT 172 261 (34.3)% 351 (51.0)%Gross margin (%) 83.0 83.6 (65) bps 83.6 (67) bpsCost of doing business (%) 70.0 68.0 197 bps 62.2 771 bpsEBIT to sales (%) 13.0 15.6 (262) bps 21.4 (8.4) ptsFunds employed 4,065 2,068 96.6% 4,042 0.6%Return on average funds employed (%) 4.2 12.9 (8.7) pts 8.7 (4.4) pts
1
2
3
4
5
PERFORM
AN
CE
HIG
HLIG
HTS
BUSIN
ESS REV
IEWD
IRECTO
RS' REPO
RTFIN
AN
CIA
L REPO
RTO
THER
INFO
RMATIO
N35
WO
OLW
ORTH
S GRO
UP
AN
NU
AL REPO
RT 2020
36
Woolworths Group supports the recommendations of the Task Force on Climate-related Financial Disclosures (TCFD) and is committed to providing stakeholders with information on how the Group is identifying and managing climate change risks.
GovernanceWoolworths Group considers climate change to be a critical board-level strategic issue.
The Board Sustainability Committee (SusCo) oversees the Group-level response to climate change risks and opportunities. SusCo comprises five directors and an independent chair and reports directly to the Board.
Risk ManagementWoolworths Group identifies climate-related risks and opportunities as part of the Group risk management process in line with the Enterprise Risk Management (ERM) framework. The ERM framework comprehensively sets out the requirement for consistent identification, assessment, escalation, management and monitoring of risks across the company through the major risk categories: strategic, operational, financial and compliance risks. As a material business risk, climate change is identified, assessed and monitored in line with the Group Risk Management Policy.
The Audit, Risk Management and Compliance Committee (ARMCC) is the primary Board committee that has oversight of the ERM framework and the Group Risk Register. Governance is supported by the Woolworths Group Executive Committee and relevant committees and forums across the Group. Specific oversight of climate risk is managed by SusCo.
StrategyWoolworths is committed to reducing our carbon emissions. We are conscious of the threat of climate change to our communities and our businesses. We have therefore undertaken scenario analysis, as recommended by the TCFD, to understand and enhance the climate change resilience of our businesses and strategy.
We have used the scenarios to understand how, over the longer term, climate change risks may impact the Australian Food business, its supply chains and the needs of its customers.
Our analysis indicates that all forms of significant global warming pose challenges for our businesses and supporting infrastructure. To address these challenges, we are reviewing our end-to-end operations and our supply chains to identify ways in which to improve their resilience to significant global warming.
Metrics and TargetsIn F19, the Group’s carbon emissions targets were revised. Woolworths Group’s current targets are a 60% reduction in scope 1 and 2 emissions below 2015 levels by 2030 and refrigerant leakages to be 15% below 2015 levels by 2020. This year, emissions are 24% below 2015 levels and refrigerant leakages 26% below 2015 levels. Woolworths Group has also submitted the targets to the Science Based Target Initiative for approval.
ON CLIMATE-RELATED FINANCIAL DISCLOSURES
TASK FORCE
More detailed disclosure of this can be found in the F20 Sustainability Report on pages 34 to 41.
1
2
3
4
5
PERFORM
AN
CE
HIG
HLIG
HTS
BUSIN
ESS REV
IEWD
IRECTO
RS' REPO
RTFIN
AN
CIA
L REPO
RTO
THER
INFO
RMATIO
N
37
WO
OLW
ORTH
S GRO
UP
AN
NU
AL REPO
RT 2020
Woolworths Group is exposed to a range of strategic, operational, compliance and financial related risks associated with operating in an increasingly complex digital retail environment. We have an enterprise risk management framework which, together with corporate governance, provides a sound basis for managing our material risks.
The material risks that could adversely affect the Group’s performance and reputation are outlined below (in no particular order). Our performance could also be affected by other risks that apply to most Australian and New Zealand businesses and households (e.g. changes to household disposable income, pandemic outbreaks, climate change) which are beyond our immediate control. During F20, we faced unprecedented operating conditions with heightened uncertainty and complexity in light of the COVID-19 pandemic. The breadth of broader impacts as a result of COVID-19 for both global and domestic economies and businesses continues to unfold and increases the risk landscape. We have been adapting our response and taking an agile approach in the way we work and the decisions we make. Throughout the COVID-19 pandemic we have been purpose-led and focused on doing the right thing and prioritising both customer and team safety, which has been broadly recognised by our key stakeholders, including customers, team, suppliers and Government.
We continue to remain vigilant when considering our responses and the impact on team members, customers, suppliers, regulatory requirements and the communities we serve.
The content of the risk profiles is considered and discussed and, where appropriate, adjusted through regular meetings with senior management. Our material risks contained in risk profiles are also reviewed by the Board. We continue to evaluate our risk profile
in line with changes to our environment and may also identify additional material risks that could adversely affect the Group. Further information in relation to risk management can be found throughout the Annual Report and in the Corporate Governance Statement which is available on the Woolworths Group website. The material risks faced by the Group that may impact on our ability to achieve our key strategic priorities are outlined on pages 39 to 41.
The impact of our operationsWe operate in a dynamic and evolving environment. Our businesses, both domestic and international, continue to present both opportunities and risks that could materially impact our operations.
OUR MATERIAL RISKS
Non
-Fin
anci
al
Risks
Strategic
Fina
ncia
l
Operational
Com
plia
nce
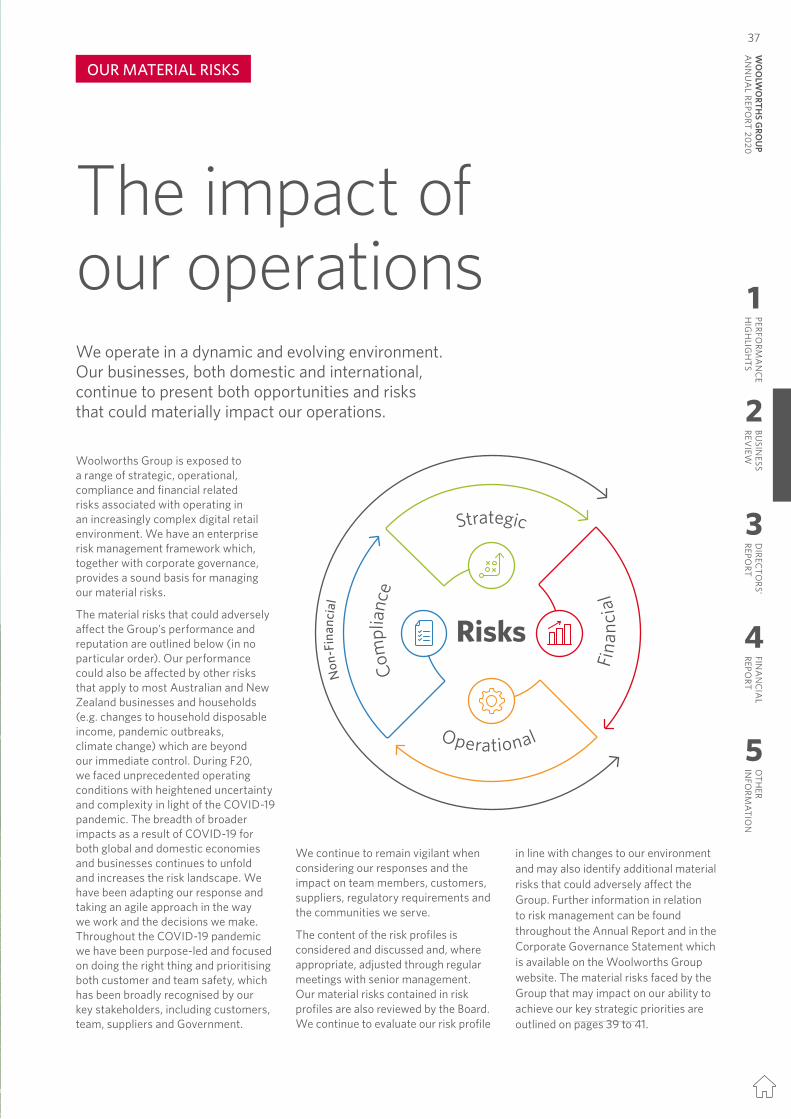
36
Woolworths Group supports the recommendations of the Task Force on Climate-related Financial Disclosures (TCFD) and is committed to providing stakeholders with information on how the Group is identifying and managing climate change risks.
GovernanceWoolworths Group considers climate change to be a critical board-level strategic issue.
The Board Sustainability Committee (SusCo) oversees the Group-level response to climate change risks and opportunities. SusCo comprises five directors and an independent chair and reports directly to the Board.
Risk ManagementWoolworths Group identifies climate-related risks and opportunities as part of the Group risk management process in line with the Enterprise Risk Management (ERM) framework. The ERM framework comprehensively sets out the requirement for consistent identification, assessment, escalation, management and monitoring of risks across the company through the major risk categories: strategic, operational, financial and compliance risks. As a material business risk, climate change is identified, assessed and monitored in line with the Group Risk Management Policy.
The Audit, Risk Management and Compliance Committee (ARMCC) is the primary Board committee that has oversight of the ERM framework and the Group Risk Register. Governance is supported by the Woolworths Group Executive Committee and relevant committees and forums across the Group. Specific oversight of climate risk is managed by SusCo.
StrategyWoolworths is committed to reducing our carbon emissions. We are conscious of the threat of climate change to our communities and our businesses. We have therefore undertaken scenario analysis, as recommended by the TCFD, to understand and enhance the climate change resilience of our businesses and strategy.
We have used the scenarios to understand how, over the longer term, climate change risks may impact the Australian Food business, its supply chains and the needs of its customers.
Our analysis indicates that all forms of significant global warming pose challenges for our businesses and supporting infrastructure. To address these challenges, we are reviewing our end-to-end operations and our supply chains to identify ways in which to improve their resilience to significant global warming.
Metrics and TargetsIn F19, the Group’s carbon emissions targets were revised. Woolworths Group’s current targets are a 60% reduction in scope 1 and 2 emissions below 2015 levels by 2030 and refrigerant leakages to be 15% below 2015 levels by 2020. This year, emissions are 24% below 2015 levels and refrigerant leakages 26% below 2015 levels. Woolworths Group has also submitted the targets to the Science Based Target Initiative for approval.
ON CLIMATE-RELATED FINANCIAL DISCLOSURES
TASK FORCE
More detailed disclosure of this can be found in the F20 Sustainability Report on pages 34 to 41.
1
2
3
4
5
PERFORM
AN
CE
HIG
HLIG
HTS
BUSIN
ESS REV
IEWD
IRECTO
RS' REPO
RTFIN
AN
CIA
L REPO
RTO
THER
INFO
RMATIO
N37
WO
OLW
ORTH
S GRO
UP
AN
NU
AL REPO
RT 2020
Woolworths Group is exposed to a range of strategic, operational, compliance and financial related risks associated with operating in an increasingly complex digital retail environment. We have an enterprise risk management framework which, together with corporate governance, provides a sound basis for managing our material risks.
The material risks that could adversely affect the Group’s performance and reputation are outlined below (in no particular order). Our performance could also be affected by other risks that apply to most Australian and New Zealand businesses and households (e.g. changes to household disposable income, pandemic outbreaks, climate change) which are beyond our immediate control. During F20, we faced unprecedented operating conditions with heightened uncertainty and complexity in light of the COVID-19 pandemic. The breadth of broader impacts as a result of COVID-19 for both global and domestic economies and businesses continues to unfold and increases the risk landscape. We have been adapting our response and taking an agile approach in the way we work and the decisions we make. Throughout the COVID-19 pandemic we have been purpose-led and focused on doing the right thing and prioritising both customer and team safety, which has been broadly recognised by our key stakeholders, including customers, team, suppliers and Government.
We continue to remain vigilant when considering our responses and the impact on team members, customers, suppliers, regulatory requirements and the communities we serve.
The content of the risk profiles is considered and discussed and, where appropriate, adjusted through regular meetings with senior management. Our material risks contained in risk profiles are also reviewed by the Board. We continue to evaluate our risk profile
in line with changes to our environment and may also identify additional material risks that could adversely affect the Group. Further information in relation to risk management can be found throughout the Annual Report and in the Corporate Governance Statement which is available on the Woolworths Group website. The material risks faced by the Group that may impact on our ability to achieve our key strategic priorities are outlined on pages 39 to 41.
The impact of our operationsWe operate in a dynamic and evolving environment. Our businesses, both domestic and international, continue to present both opportunities and risks that could materially impact our operations.
OUR MATERIAL RISKS
Non
-Fin
anci
al
Risks
Strategic
Fina
ncia
l
Operational
Com
plia
nce
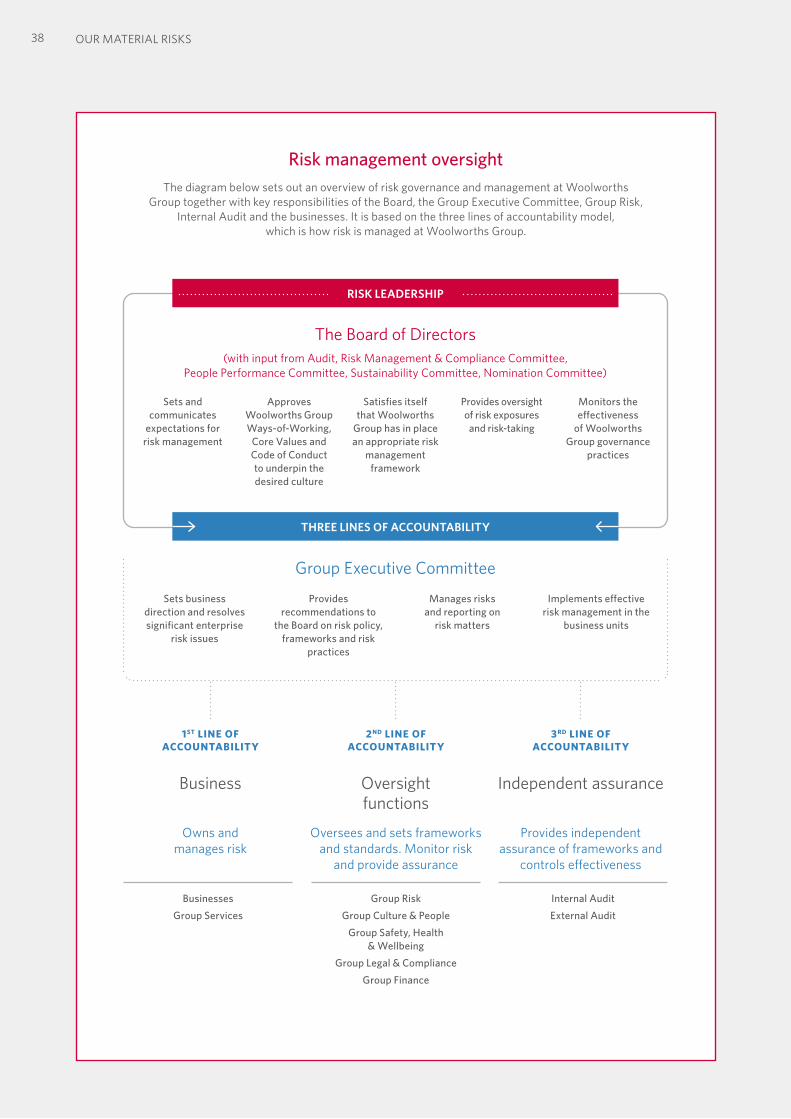
3838 OUR MATERIAL RISKS
Risk management oversightThe diagram below sets out an overview of risk governance and management at Woolworths
Group together with key responsibilities of the Board, the Group Executive Committee, Group Risk, Internal Audit and the businesses. It is based on the three lines of accountability model,
which is how risk is managed at Woolworths Group.
The Board of Directors(with input from Audit, Risk Management & Compliance Committee,
People Performance Committee, Sustainability Committee, Nomination Committee)
Sets and communicates
expectations for risk management
Approves Woolworths Group Ways-of-Working,
Core Values and Code of Conduct to underpin the desired culture
Satisfies itself that Woolworths
Group has in place an appropriate risk
management framework
Provides oversight of risk exposures and risk-taking
Monitors the effectiveness
of Woolworths Group governance
practices
Group Executive Committee
Sets business direction and resolves significant enterprise
risk issues
Provides recommendations to
the Board on risk policy, frameworks and risk
practices
Manages risks and reporting on
risk matters
Implements effective risk management in the
business units
RISK LEADERSHIP
THREE LINES OF ACCOUNTABILITY
1ST LINE OF ACCOUNTABILITY
Business
Owns and manages risk
BusinessesGroup Services
2ND LINE OF ACCOUNTABILITY
Oversight functions
Oversees and sets frameworks and standards. Monitor risk
and provide assurance
Group RiskGroup Culture & People
Group Safety, Health & Wellbeing
Group Legal & ComplianceGroup Finance
3RD LINE OF ACCOUNTABILITY
Independent assurance
Provides independent assurance of frameworks and
controls effectiveness
Internal AuditExternal Audit
1
2
3
4
5
PERFORM
AN
CE
HIG
HLIG
HTS
BUSIN
ESS REV
IEWD
IRECTO
RS' REPO
RTFIN
AN
CIA
L REPO
RTO
THER
INFO
RMATIO
N
39
WO
OLW
ORTH
S GRO
UP
AN
NU
AL REPO
RT 2020
Key material risks
RISK MITIGATING ACTIVITIES
PandemicFailure to respond to pandemic events (large-scale outbreaks of infectious diseases) which can greatly impact health and wellbeing over a wide geographic area. Such events can cause significant economic, operational and social disruption which can adversely affect our businesses.
• The Group activates our group wide Medium-Term Management Team, Crisis Management Team, and/or Emergency Management Teams (individual businesses) to manage the response to crises, including pandemic, our recent bushfires in Australia or other emergencies.
• Our suite of Business Resilience policies, frameworks and standards, along with Emergency Management, Crisis Management and Business Continuity Plans, continue to be updated to help assist in managing the response to events such as pandemics.
• We actively monitor and are guided by Government directives, Department of Health advice and trusted sources. A range of responses including a focus on the health, safety and wellbeing with social distancing, procurement and management of personal protective equipment and initiatives for our vulnerable teams, customers and communities. Focus on managing business continuity including, demand and supply management, supply chain, scaling our capacity to support the growth of e-commerce including last mile delivery, contingent workforce management and supporting our teams to work remotely from home, as well as regular communications, are some of the measures we have focused on and applied through COVID-19.
Strategy and competitionThe retail environment remains competitive from both existing and new competitors. This environment creates both opportunities and risks that may impact business performance and market share and it is vital that we respond to these changes.
• The Board reviews and approves our strategies, receives regular updates on progress and provides guidance on the strategic direction of our business in light of the evolving environment that we operate in. Governance forums, including our Delivery Office, provide oversight of the delivery of our strategy and key initiatives, which allow the Group to monitor and adjust priorities as required.
• The Group Executive Committee (ExCo) and management regularly review key customer, team and supplier metrics, current market trends, the competitive landscape, price points across competitors, sales propositions, promotion and marketing activity.
• Short and long-term incentives are aligned to successfully execute our strategy.
Customer and marketplace Customers expect connected, personalised and convenient shopping experiences which require our business model to continually evolve to meet these needs. The ongoing change in customer behaviour has been reshaping the retail sector. Growth across our businesses is anticipated to remain volatile in F21 with increasing demand for online services and convenience.
• Group-wide customer insights are provided to our Group ExCo to help inform our approach to building customer propositions and improve the customer experience to meet their evolving needs and behaviours, particularly in the high growth area of online deliveries.
• We regularly monitor customer satisfaction through Voice of Customer surveys at both Group and individual business level, as well as feedback via our stores, contact hub and online channels, which includes qualitative and quantitative customer research. One of our core values is to ‘listen and learn’. Our CEO and Board receive regular customer complaints analysis and we consistently look at ways to improve.
Business transformation As we continue to transform our businesses, the successful delivery of our business transformation programmes is critical. Pace, agility and working end to end are key to our successful transformation.
• Governance forums, including our Delivery Office, provide oversight of the transformation delivery, monitor progress against plan, key resourcing, capability and critical dependencies.
• We have dedicated change management capabilities that assist with evaluating the impact of change on our operations and help implement change management strategies.
Safety, health and wellbeingWe care about the physical and psychological safety and health of our customers, team members and business partners. We are committed to creating a safe work environment for our teams and where people feel safe to shop.
• We have a Group Safety and Health Governance Framework, safety and health policies, and safety and health standards. Each business has engineering controls, procedures, training, personal protective equipment and maintenance requirements to manage health and safety risks.
• The Board Sustainability Committee is provided with quarterly updates to monitor the effectiveness of the implementation of the safety and health policies, standards, plans, risk programs, processes, resources, compliance and assurance.
• We continue to invest to improve safety governance, address risks and develop a culture of care across our business as a key focus for our management team.
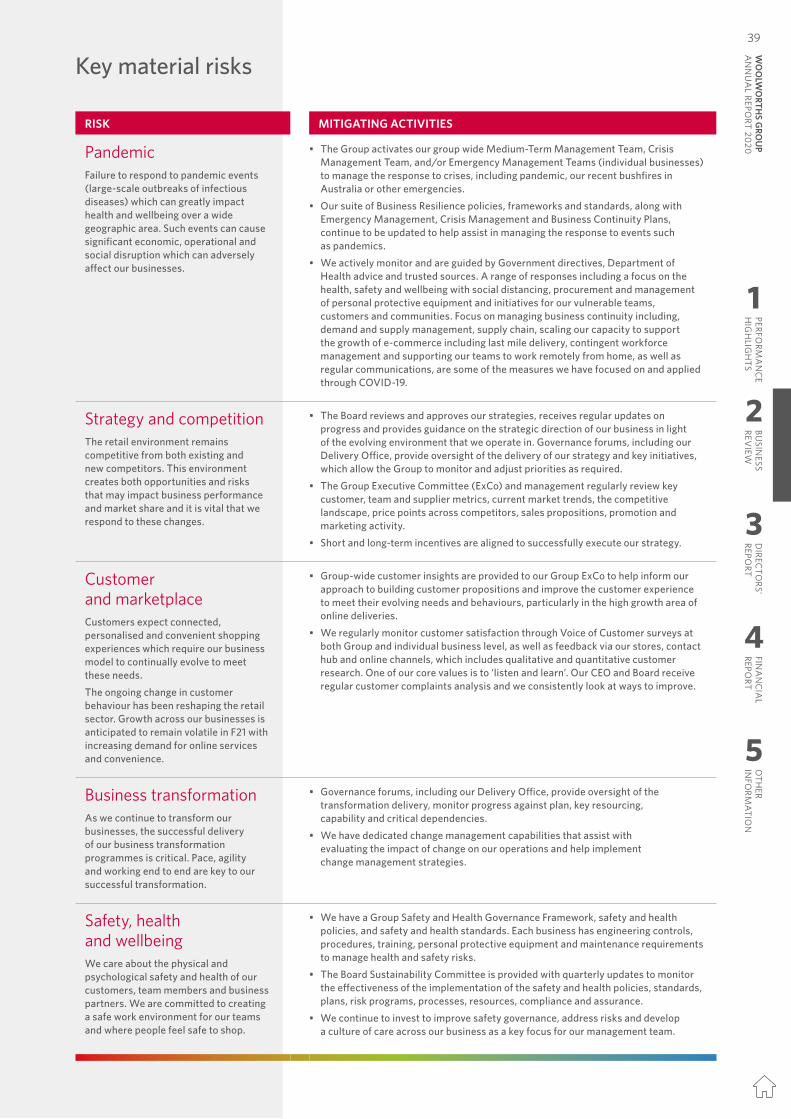
3838 OUR MATERIAL RISKS
Risk management oversightThe diagram below sets out an overview of risk governance and management at Woolworths
Group together with key responsibilities of the Board, the Group Executive Committee, Group Risk, Internal Audit and the businesses. It is based on the three lines of accountability model,
which is how risk is managed at Woolworths Group.
The Board of Directors(with input from Audit, Risk Management & Compliance Committee,
People Performance Committee, Sustainability Committee, Nomination Committee)
Sets and communicates
expectations for risk management
Approves Woolworths Group Ways-of-Working,
Core Values and Code of Conduct to underpin the desired culture
Satisfies itself that Woolworths
Group has in place an appropriate risk
management framework
Provides oversight of risk exposures and risk-taking
Monitors the effectiveness
of Woolworths Group governance
practices
Group Executive Committee
Sets business direction and resolves significant enterprise
risk issues
Provides recommendations to
the Board on risk policy, frameworks and risk
practices
Manages risks and reporting on
risk matters
Implements effective risk management in the
business units
RISK LEADERSHIP
THREE LINES OF ACCOUNTABILITY
1ST LINE OF ACCOUNTABILITY
Business
Owns and manages risk
BusinessesGroup Services
2ND LINE OF ACCOUNTABILITY
Oversight functions
Oversees and sets frameworks and standards. Monitor risk
and provide assurance
Group RiskGroup Culture & People
Group Safety, Health & Wellbeing
Group Legal & ComplianceGroup Finance
3RD LINE OF ACCOUNTABILITY
Independent assurance
Provides independent assurance of frameworks and
controls effectiveness
Internal AuditExternal Audit
1
2
3
4
5
PERFORM
AN
CE
HIG
HLIG
HTS
BUSIN
ESS REV
IEWD
IRECTO
RS' REPO
RTFIN
AN
CIA
L REPO
RTO
THER
INFO
RMATIO
N39
WO
OLW
ORTH
S GRO
UP
AN
NU
AL REPO
RT 2020
Key material risks
RISK MITIGATING ACTIVITIES
PandemicFailure to respond to pandemic events (large-scale outbreaks of infectious diseases) which can greatly impact health and wellbeing over a wide geographic area. Such events can cause significant economic, operational and social disruption which can adversely affect our businesses.
• The Group activates our group wide Medium-Term Management Team, Crisis Management Team, and/or Emergency Management Teams (individual businesses) to manage the response to crises, including pandemic, our recent bushfires in Australia or other emergencies.
• Our suite of Business Resilience policies, frameworks and standards, along with Emergency Management, Crisis Management and Business Continuity Plans, continue to be updated to help assist in managing the response to events such as pandemics.
• We actively monitor and are guided by Government directives, Department of Health advice and trusted sources. A range of responses including a focus on the health, safety and wellbeing with social distancing, procurement and management of personal protective equipment and initiatives for our vulnerable teams, customers and communities. Focus on managing business continuity including, demand and supply management, supply chain, scaling our capacity to support the growth of e-commerce including last mile delivery, contingent workforce management and supporting our teams to work remotely from home, as well as regular communications, are some of the measures we have focused on and applied through COVID-19.
Strategy and competitionThe retail environment remains competitive from both existing and new competitors. This environment creates both opportunities and risks that may impact business performance and market share and it is vital that we respond to these changes.
• The Board reviews and approves our strategies, receives regular updates on progress and provides guidance on the strategic direction of our business in light of the evolving environment that we operate in. Governance forums, including our Delivery Office, provide oversight of the delivery of our strategy and key initiatives, which allow the Group to monitor and adjust priorities as required.
• The Group Executive Committee (ExCo) and management regularly review key customer, team and supplier metrics, current market trends, the competitive landscape, price points across competitors, sales propositions, promotion and marketing activity.
• Short and long-term incentives are aligned to successfully execute our strategy.
Customer and marketplace Customers expect connected, personalised and convenient shopping experiences which require our business model to continually evolve to meet these needs. The ongoing change in customer behaviour has been reshaping the retail sector. Growth across our businesses is anticipated to remain volatile in F21 with increasing demand for online services and convenience.
• Group-wide customer insights are provided to our Group ExCo to help inform our approach to building customer propositions and improve the customer experience to meet their evolving needs and behaviours, particularly in the high growth area of online deliveries.
• We regularly monitor customer satisfaction through Voice of Customer surveys at both Group and individual business level, as well as feedback via our stores, contact hub and online channels, which includes qualitative and quantitative customer research. One of our core values is to ‘listen and learn’. Our CEO and Board receive regular customer complaints analysis and we consistently look at ways to improve.
Business transformation As we continue to transform our businesses, the successful delivery of our business transformation programmes is critical. Pace, agility and working end to end are key to our successful transformation.
• Governance forums, including our Delivery Office, provide oversight of the transformation delivery, monitor progress against plan, key resourcing, capability and critical dependencies.
• We have dedicated change management capabilities that assist with evaluating the impact of change on our operations and help implement change management strategies.
Safety, health and wellbeingWe care about the physical and psychological safety and health of our customers, team members and business partners. We are committed to creating a safe work environment for our teams and where people feel safe to shop.
• We have a Group Safety and Health Governance Framework, safety and health policies, and safety and health standards. Each business has engineering controls, procedures, training, personal protective equipment and maintenance requirements to manage health and safety risks.
• The Board Sustainability Committee is provided with quarterly updates to monitor the effectiveness of the implementation of the safety and health policies, standards, plans, risk programs, processes, resources, compliance and assurance.
• We continue to invest to improve safety governance, address risks and develop a culture of care across our business as a key focus for our management team.
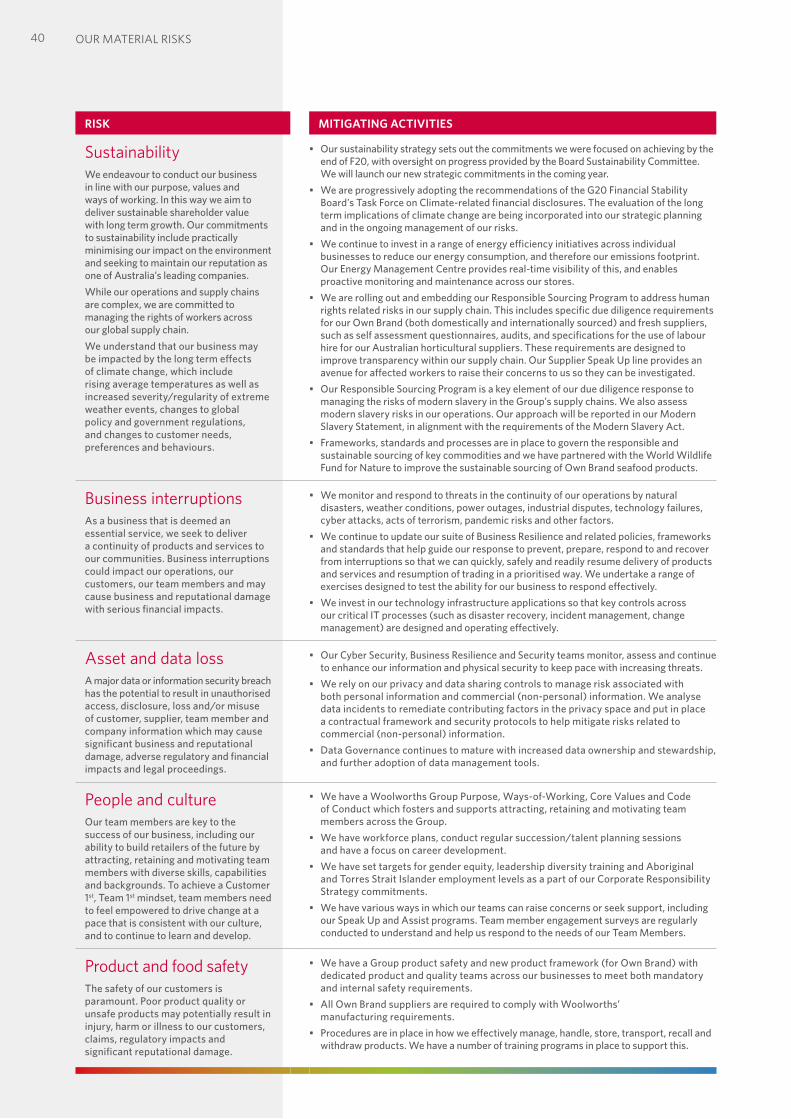
4040
RISK MITIGATING ACTIVITIES
Sustainability We endeavour to conduct our business in line with our purpose, values and ways of working. In this way we aim to deliver sustainable shareholder value with long term growth. Our commitments to sustainability include practically minimising our impact on the environment and seeking to maintain our reputation as one of Australia’s leading companies.While our operations and supply chains are complex, we are committed to managing the rights of workers across our global supply chain.We understand that our business may be impacted by the long term effects of climate change, which include rising average temperatures as well as increased severity/regularity of extreme weather events, changes to global policy and government regulations, and changes to customer needs, preferences and behaviours.
• Our sustainability strategy sets out the commitments we were focused on achieving by the end of F20, with oversight on progress provided by the Board Sustainability Committee. We will launch our new strategic commitments in the coming year.
• We are progressively adopting the recommendations of the G20 Financial Stability Board’s Task Force on Climate-related financial disclosures. The evaluation of the long term implications of climate change are being incorporated into our strategic planning and in the ongoing management of our risks.
• We continue to invest in a range of energy efficiency initiatives across individual businesses to reduce our energy consumption, and therefore our emissions footprint. Our Energy Management Centre provides real-time visibility of this, and enables proactive monitoring and maintenance across our stores.
• We are rolling out and embedding our Responsible Sourcing Program to address human rights related risks in our supply chain. This includes specific due diligence requirements for our Own Brand (both domestically and internationally sourced) and fresh suppliers, such as self assessment questionnaires, audits, and specifications for the use of labour hire for our Australian horticultural suppliers. These requirements are designed to improve transparency within our supply chain. Our Supplier Speak Up line provides an avenue for affected workers to raise their concerns to us so they can be investigated.
• Our Responsible Sourcing Program is a key element of our due diligence response to managing the risks of modern slavery in the Group’s supply chains. We also assess modern slavery risks in our operations. Our approach will be reported in our Modern Slavery Statement, in alignment with the requirements of the Modern Slavery Act.
• Frameworks, standards and processes are in place to govern the responsible and sustainable sourcing of key commodities and we have partnered with the World Wildlife Fund for Nature to improve the sustainable sourcing of Own Brand seafood products.
Business interruptions As a business that is deemed an essential service, we seek to deliver a continuity of products and services to our communities. Business interruptions could impact our operations, our customers, our team members and may cause business and reputational damage with serious financial impacts.
• We monitor and respond to threats in the continuity of our operations by natural disasters, weather conditions, power outages, industrial disputes, technology failures, cyber attacks, acts of terrorism, pandemic risks and other factors.
• We continue to update our suite of Business Resilience and related policies, frameworks and standards that help guide our response to prevent, prepare, respond to and recover from interruptions so that we can quickly, safely and readily resume delivery of products and services and resumption of trading in a prioritised way. We undertake a range of exercises designed to test the ability for our business to respond effectively.
• We invest in our technology infrastructure applications so that key controls across our critical IT processes (such as disaster recovery, incident management, change management) are designed and operating effectively.
Asset and data loss A major data or information security breach has the potential to result in unauthorised access, disclosure, loss and/or misuse of customer, supplier, team member and company information which may cause significant business and reputational damage, adverse regulatory and financial impacts and legal proceedings.
• Our Cyber Security, Business Resilience and Security teams monitor, assess and continue to enhance our information and physical security to keep pace with increasing threats.
• We rely on our privacy and data sharing controls to manage risk associated with both personal information and commercial (non-personal) information. We analyse data incidents to remediate contributing factors in the privacy space and put in place a contractual framework and security protocols to help mitigate risks related to commercial (non-personal) information.
• Data Governance continues to mature with increased data ownership and stewardship, and further adoption of data management tools.
People and cultureOur team members are key to the success of our business, including our ability to build retailers of the future by attracting, retaining and motivating team members with diverse skills, capabilities and backgrounds. To achieve a Customer 1st, Team 1st mindset, team members need to feel empowered to drive change at a pace that is consistent with our culture, and to continue to learn and develop.
• We have a Woolworths Group Purpose, Ways-of-Working, Core Values and Code of Conduct which fosters and supports attracting, retaining and motivating team members across the Group.
• We have workforce plans, conduct regular succession/talent planning sessions and have a focus on career development.
• We have set targets for gender equity, leadership diversity training and Aboriginal and Torres Strait Islander employment levels as a part of our Corporate Responsibility Strategy commitments.
• We have various ways in which our teams can raise concerns or seek support, including our Speak Up and Assist programs. Team member engagement surveys are regularly conducted to understand and help us respond to the needs of our Team Members.
Product and food safetyThe safety of our customers is paramount. Poor product quality or unsafe products may potentially result in injury, harm or illness to our customers, claims, regulatory impacts and significant reputational damage.
• We have a Group product safety and new product framework (for Own Brand) with dedicated product and quality teams across our businesses to meet both mandatory and internal safety requirements.
• All Own Brand suppliers are required to comply with Woolworths’ manufacturing requirements.
• Procedures are in place in how we effectively manage, handle, store, transport, recall and withdraw products. We have a number of training programs in place to support this.
OUR MATERIAL RISKS
1
2
3
4
5
PERFORM
AN
CE
HIG
HLIG
HTS
BUSIN
ESS REV
IEWD
IRECTO
RS' REPO
RTFIN
AN
CIA
L REPO
RTO
THER
INFO
RMATIO
N
41
WO
OLW
ORTH
S GRO
UP
AN
NU
AL REPO
RT 2020
RISK MITIGATING ACTIVITIES
Logistics and Supply Chain Disruptions to transport and warehouse management processes can impact the continuity of supplies to stores, resulting in lost sales and/or customers.
• We regularly evaluate our supply chain networks and develop appropriate strategies that are reviewed and approved by our Board.
• We continue to review and seek to optimise our supply chain and logistics networks which includes our distribution centre networks, customer fulfilment centres, and last-mile deliveries in order to respond to our customer demands and growth profile.
• Distribution centre capacities and capabilities (against current and anticipated operational requirements) are analysed, evaluated and reviewed by our Supply Chain strategy team and senior management to facilitate proactive network and capacity management across both Australia and New Zealand.
• We continue to monitor delivery in full, on time and error free performance. • We continue to promote adherence with our suite of Supply Chain Framework, Policies
and Procedures, and are focused on enhancing our internal processes (across safety, transport, inventory management) and practices.
Supplier management We sell products which are sourced from a wide range of domestic and international suppliers. Effective supplier management is important in delivering the right product proposition to our customers.
• We work with our suppliers and seek to engage fairly and effectively with them through both internal ways of working and our compliance with regulatory codes such as the Food and Grocery Code of Conduct.
• Our Voice of Supplier surveys and Supplier Speak Up Program provide mechanisms for our suppliers to respond openly and anonymously with feedback and processes for escalation. Our policy covers both our suppliers and workers in their supply chain.
• We expect our suppliers to comply with applicable regulatory requirements, including responsible sourcing and quality standards.
Legal, regulatory and governance Our operations are subject to a range of laws and regulatory requirements regarding matters such as competition, employment, health and safety, chain of responsibility (heavy vehicle regulation), product safety and consumer protection, privacy and data, anti-bribery and corruption, anti-money laundering, liquor, gaming, and the environment. Our compliance with the wide and diverse range of regulatory requirements applicable to our businesses is recognised as important to maintaining our ability to operate sustainably and successfully.From time to time we may be the focus of, or a party to, regulatory investigation, legal claims or litigation which may adversely affect our business, reputation and/or have financial impacts.
• Our Group Compliance Framework, along with a range of policies, procedures and business operational compliance plans ,help us manage our legal and regulatory compliance.
• Our Code of Conduct provides a clear statement of our Core Values including ‘doing the right thing’. We have a new starter and compliance training program and other tools such as our ‘Speak Up’ whistleblower hotline.
• We have a dedicated in-house legal team aligned to businesses and specialist key functional legal areas across the Group.
• Our Government Relations team, along with members of the legal team and other teams, monitor and engage with government and regulatory bodies on proposed changes to the policy and regulatory environment.
• We evaluate any litigation claims and legal proceedings to assess our risks on a principled basis and endeavour to manage our exposure to such litigation or other legal proceedings effectively. This may include defending claims or seeking to settle them as appropriate in the circumstances.
• The Board, Audit, Risk Management and Compliance Committee, and Sustainability Committee receive a range of updates and reporting on legal, regulatory and compliance matters.
• The risk of non-compliance with industrial instruments (enterprise agreements and modern awards) has had heightened focus during F20 and leading into F21, as the Group continues to remediate underpaid salaried team members (as against relevant modern awards) and put in place more robust compliance and process controls going forward.
Financial, treasury and insurance The management of liquidity to make payments to team members and suppliers in particular, and the management of capital and availability of funding, are important requirements to support our business operations and growth. In addition, we are exposed to adverse fluctuations in foreign exchange rates and interest rates, which could impact profitability. Accidents, natural disasters and other events can occur which affect our customers, team members and businesses. Insurance can be used to protect against losses from such incidents.
• We have a number of processes in place in relation to the review and audit of financial records, controls and the production of financial statements that are reported to the Board and Audit, Risk Management and Compliance Committee.
• We set financial targets that are regularly reviewed to measure our progress. This enables the business to pursue opportunities and help mitigate risks as appropriate.
• We have a Board approved Treasury Policy which governs the management of our treasury risks, including liquidity, funding, interest rates, foreign currency, the use of derivatives and counterparty risk. These risks are managed day to day by our Group Treasury function.
• The Group purchases insurance where we determine this is prudent. In some cases, we choose to self-insure risks. This means that in the event of an incident, we cannot make a claim against a third party insurer but we will pay or absorb the losses ourselves. We monitor our self-insured risks and have active programs to help us pre-empt and mitigate losses.
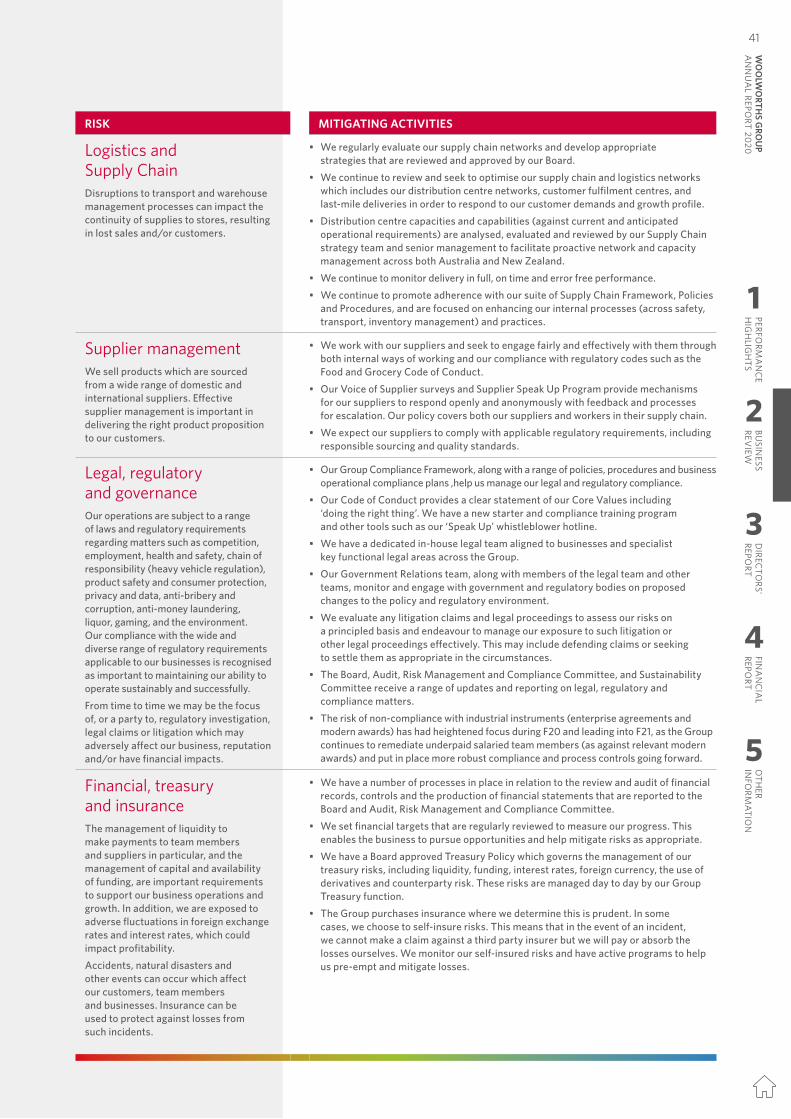
4040
RISK MITIGATING ACTIVITIES
Sustainability We endeavour to conduct our business in line with our purpose, values and ways of working. In this way we aim to deliver sustainable shareholder value with long term growth. Our commitments to sustainability include practically minimising our impact on the environment and seeking to maintain our reputation as one of Australia’s leading companies.While our operations and supply chains are complex, we are committed to managing the rights of workers across our global supply chain.We understand that our business may be impacted by the long term effects of climate change, which include rising average temperatures as well as increased severity/regularity of extreme weather events, changes to global policy and government regulations, and changes to customer needs, preferences and behaviours.
• Our sustainability strategy sets out the commitments we were focused on achieving by the end of F20, with oversight on progress provided by the Board Sustainability Committee. We will launch our new strategic commitments in the coming year.
• We are progressively adopting the recommendations of the G20 Financial Stability Board’s Task Force on Climate-related financial disclosures. The evaluation of the long term implications of climate change are being incorporated into our strategic planning and in the ongoing management of our risks.
• We continue to invest in a range of energy efficiency initiatives across individual businesses to reduce our energy consumption, and therefore our emissions footprint. Our Energy Management Centre provides real-time visibility of this, and enables proactive monitoring and maintenance across our stores.
• We are rolling out and embedding our Responsible Sourcing Program to address human rights related risks in our supply chain. This includes specific due diligence requirements for our Own Brand (both domestically and internationally sourced) and fresh suppliers, such as self assessment questionnaires, audits, and specifications for the use of labour hire for our Australian horticultural suppliers. These requirements are designed to improve transparency within our supply chain. Our Supplier Speak Up line provides an avenue for affected workers to raise their concerns to us so they can be investigated.
• Our Responsible Sourcing Program is a key element of our due diligence response to managing the risks of modern slavery in the Group’s supply chains. We also assess modern slavery risks in our operations. Our approach will be reported in our Modern Slavery Statement, in alignment with the requirements of the Modern Slavery Act.
• Frameworks, standards and processes are in place to govern the responsible and sustainable sourcing of key commodities and we have partnered with the World Wildlife Fund for Nature to improve the sustainable sourcing of Own Brand seafood products.
Business interruptions As a business that is deemed an essential service, we seek to deliver a continuity of products and services to our communities. Business interruptions could impact our operations, our customers, our team members and may cause business and reputational damage with serious financial impacts.
• We monitor and respond to threats in the continuity of our operations by natural disasters, weather conditions, power outages, industrial disputes, technology failures, cyber attacks, acts of terrorism, pandemic risks and other factors.
• We continue to update our suite of Business Resilience and related policies, frameworks and standards that help guide our response to prevent, prepare, respond to and recover from interruptions so that we can quickly, safely and readily resume delivery of products and services and resumption of trading in a prioritised way. We undertake a range of exercises designed to test the ability for our business to respond effectively.
• We invest in our technology infrastructure applications so that key controls across our critical IT processes (such as disaster recovery, incident management, change management) are designed and operating effectively.
Asset and data loss A major data or information security breach has the potential to result in unauthorised access, disclosure, loss and/or misuse of customer, supplier, team member and company information which may cause significant business and reputational damage, adverse regulatory and financial impacts and legal proceedings.
• Our Cyber Security, Business Resilience and Security teams monitor, assess and continue to enhance our information and physical security to keep pace with increasing threats.
• We rely on our privacy and data sharing controls to manage risk associated with both personal information and commercial (non-personal) information. We analyse data incidents to remediate contributing factors in the privacy space and put in place a contractual framework and security protocols to help mitigate risks related to commercial (non-personal) information.
• Data Governance continues to mature with increased data ownership and stewardship, and further adoption of data management tools.
People and cultureOur team members are key to the success of our business, including our ability to build retailers of the future by attracting, retaining and motivating team members with diverse skills, capabilities and backgrounds. To achieve a Customer 1st, Team 1st mindset, team members need to feel empowered to drive change at a pace that is consistent with our culture, and to continue to learn and develop.
• We have a Woolworths Group Purpose, Ways-of-Working, Core Values and Code of Conduct which fosters and supports attracting, retaining and motivating team members across the Group.
• We have workforce plans, conduct regular succession/talent planning sessions and have a focus on career development.
• We have set targets for gender equity, leadership diversity training and Aboriginal and Torres Strait Islander employment levels as a part of our Corporate Responsibility Strategy commitments.
• We have various ways in which our teams can raise concerns or seek support, including our Speak Up and Assist programs. Team member engagement surveys are regularly conducted to understand and help us respond to the needs of our Team Members.
Product and food safetyThe safety of our customers is paramount. Poor product quality or unsafe products may potentially result in injury, harm or illness to our customers, claims, regulatory impacts and significant reputational damage.
• We have a Group product safety and new product framework (for Own Brand) with dedicated product and quality teams across our businesses to meet both mandatory and internal safety requirements.
• All Own Brand suppliers are required to comply with Woolworths’ manufacturing requirements.
• Procedures are in place in how we effectively manage, handle, store, transport, recall and withdraw products. We have a number of training programs in place to support this.
OUR MATERIAL RISKS
1
2
3
4
5
PERFORM
AN
CE
HIG
HLIG
HTS
BUSIN
ESS REV
IEWD
IRECTO
RS' REPO
RTFIN
AN
CIA
L REPO
RTO
THER
INFO
RMATIO
N41
WO
OLW
ORTH
S GRO
UP
AN
NU
AL REPO
RT 2020
RISK MITIGATING ACTIVITIES
Logistics and Supply Chain Disruptions to transport and warehouse management processes can impact the continuity of supplies to stores, resulting in lost sales and/or customers.
• We regularly evaluate our supply chain networks and develop appropriate strategies that are reviewed and approved by our Board.
• We continue to review and seek to optimise our supply chain and logistics networks which includes our distribution centre networks, customer fulfilment centres, and last-mile deliveries in order to respond to our customer demands and growth profile.
• Distribution centre capacities and capabilities (against current and anticipated operational requirements) are analysed, evaluated and reviewed by our Supply Chain strategy team and senior management to facilitate proactive network and capacity management across both Australia and New Zealand.
• We continue to monitor delivery in full, on time and error free performance. • We continue to promote adherence with our suite of Supply Chain Framework, Policies
and Procedures, and are focused on enhancing our internal processes (across safety, transport, inventory management) and practices.
Supplier management We sell products which are sourced from a wide range of domestic and international suppliers. Effective supplier management is important in delivering the right product proposition to our customers.
• We work with our suppliers and seek to engage fairly and effectively with them through both internal ways of working and our compliance with regulatory codes such as the Food and Grocery Code of Conduct.
• Our Voice of Supplier surveys and Supplier Speak Up Program provide mechanisms for our suppliers to respond openly and anonymously with feedback and processes for escalation. Our policy covers both our suppliers and workers in their supply chain.
• We expect our suppliers to comply with applicable regulatory requirements, including responsible sourcing and quality standards.
Legal, regulatory and governance Our operations are subject to a range of laws and regulatory requirements regarding matters such as competition, employment, health and safety, chain of responsibility (heavy vehicle regulation), product safety and consumer protection, privacy and data, anti-bribery and corruption, anti-money laundering, liquor, gaming, and the environment. Our compliance with the wide and diverse range of regulatory requirements applicable to our businesses is recognised as important to maintaining our ability to operate sustainably and successfully.From time to time we may be the focus of, or a party to, regulatory investigation, legal claims or litigation which may adversely affect our business, reputation and/or have financial impacts.
• Our Group Compliance Framework, along with a range of policies, procedures and business operational compliance plans ,help us manage our legal and regulatory compliance.
• Our Code of Conduct provides a clear statement of our Core Values including ‘doing the right thing’. We have a new starter and compliance training program and other tools such as our ‘Speak Up’ whistleblower hotline.
• We have a dedicated in-house legal team aligned to businesses and specialist key functional legal areas across the Group.
• Our Government Relations team, along with members of the legal team and other teams, monitor and engage with government and regulatory bodies on proposed changes to the policy and regulatory environment.
• We evaluate any litigation claims and legal proceedings to assess our risks on a principled basis and endeavour to manage our exposure to such litigation or other legal proceedings effectively. This may include defending claims or seeking to settle them as appropriate in the circumstances.
• The Board, Audit, Risk Management and Compliance Committee, and Sustainability Committee receive a range of updates and reporting on legal, regulatory and compliance matters.
• The risk of non-compliance with industrial instruments (enterprise agreements and modern awards) has had heightened focus during F20 and leading into F21, as the Group continues to remediate underpaid salaried team members (as against relevant modern awards) and put in place more robust compliance and process controls going forward.
Financial, treasury and insurance The management of liquidity to make payments to team members and suppliers in particular, and the management of capital and availability of funding, are important requirements to support our business operations and growth. In addition, we are exposed to adverse fluctuations in foreign exchange rates and interest rates, which could impact profitability. Accidents, natural disasters and other events can occur which affect our customers, team members and businesses. Insurance can be used to protect against losses from such incidents.
• We have a number of processes in place in relation to the review and audit of financial records, controls and the production of financial statements that are reported to the Board and Audit, Risk Management and Compliance Committee.
• We set financial targets that are regularly reviewed to measure our progress. This enables the business to pursue opportunities and help mitigate risks as appropriate.
• We have a Board approved Treasury Policy which governs the management of our treasury risks, including liquidity, funding, interest rates, foreign currency, the use of derivatives and counterparty risk. These risks are managed day to day by our Group Treasury function.
• The Group purchases insurance where we determine this is prudent. In some cases, we choose to self-insure risks. This means that in the event of an incident, we cannot make a claim against a third party insurer but we will pay or absorb the losses ourselves. We monitor our self-insured risks and have active programs to help us pre-empt and mitigate losses.
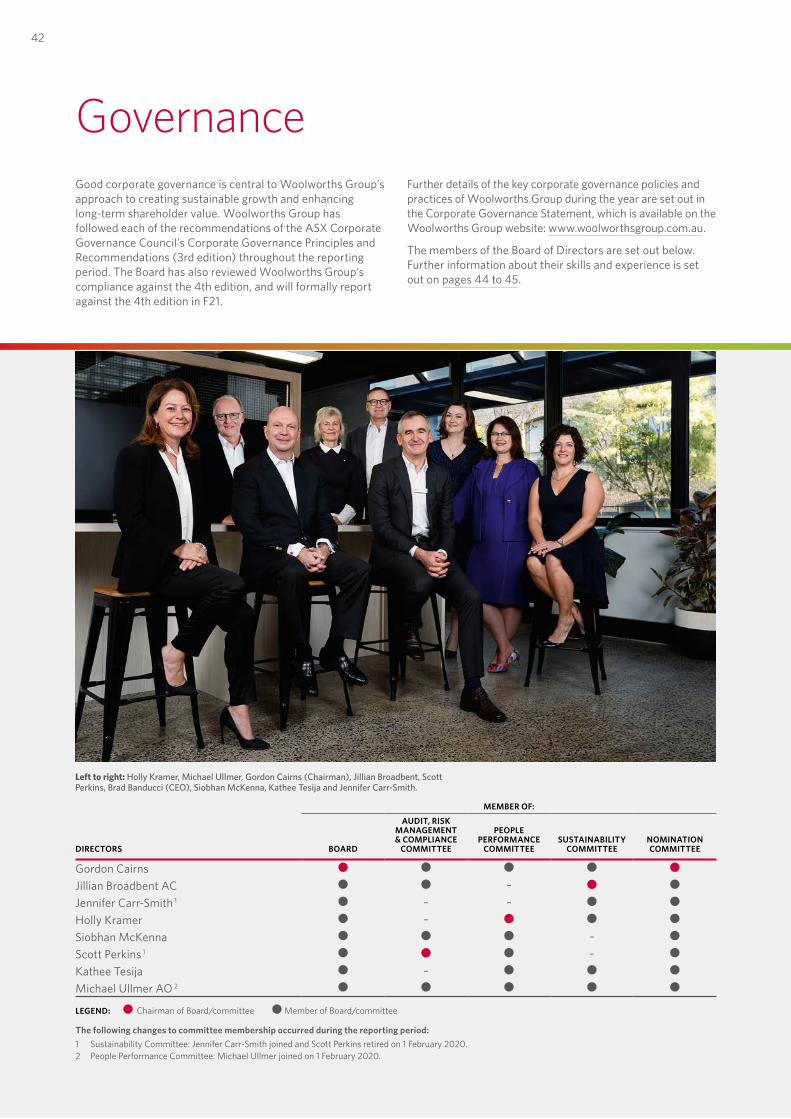
42
DIRECTORS
MEMBER OF:
BOARD
AUDIT, RISK MANAGEMENT & COMPLIANCE
COMMITTEE
PEOPLE PERFORMANCE
COMMITTEESUSTAINABILITY
COMMITTEENOMINATION COMMITTEE
Gordon CairnsJillian Broadbent AC –Jennifer Carr-Smith 1 – –
Holly Kramer –Siobhan McKenna –Scott Perkins 1 –
Kathee Tesija –Michael Ullmer AO 2
LEGEND: Chairman of Board/committee Member of Board/committee
The following changes to committee membership occurred during the reporting period: 1 Sustainability Committee: Jennifer Carr-Smith joined and Scott Perkins retired on 1 February 2020. 2 People Performance Committee: Michael Ullmer joined on 1 February 2020.
GovernanceGood corporate governance is central to Woolworths Group’s approach to creating sustainable growth and enhancing long-term shareholder value. Woolworths Group has followed each of the recommendations of the ASX Corporate Governance Council’s Corporate Governance Principles and Recommendations (3rd edition) throughout the reporting period. The Board has also reviewed Woolworths Group’s compliance against the 4th edition, and will formally report against the 4th edition in F21.
Further details of the key corporate governance policies and practices of Woolworths Group during the year are set out in the Corporate Governance Statement, which is available on the Woolworths Group website: www.woolworthsgroup.com.au.
The members of the Board of Directors are set out below. Further information about their skills and experience is set out on pages 44 to 45.
Left to right: Holly Kramer, Michael Ullmer, Gordon Cairns (Chairman), Jillian Broadbent, Scott Perkins, Brad Banducci (CEO), Siobhan McKenna, Kathee Tesija and Jennifer Carr-Smith.
1
2
3
4
5
PERFORM
AN
CE
HIG
HLIG
HTS
BUSIN
ESS REV
IEWD
IRECTO
RS' REPO
RTFIN
AN
CIA
L REPO
RTO
THER
INFO
RMATIO
N
43
WO
OLW
ORTH
S GRO
UP
AN
NU
AL REPO
RT 2020
The Woolworths Group Board comprises directors with a diverse range of skills, experience and backgrounds to support the effective governance and robust decision-making of the Group, with a particular focus on the key desired areas listed below. An assessment of the optimum mix of these skills and experience takes place regularly.
Retail Markets
Retail knowledge and experience of customer-led transformation in the food, drinks or general merchandise sectors.
8/9
Governance Experience and a commitment to exceptional corporate governance standards. 8/9
StrategyExperience defining strategic objectives, assessing business plans and driving execution in large, complex organisations.
9/9
Social Responsibility
Commitment to and experience monitoring programs for social responsibility, carbon emissions reduction, proactive management of workplace safety, mental health and physical wellbeing, and responsible sourcing.
8/9
Digital, Data and Technology
Expertise and experience in adopting new digital technologies or implementing technology projects, and digital disruption, leveraging digital technologies or understanding the use of data and data analytics.
8/9
Financial Acumen
Understand financial drivers of the business and experience implementing or overseeing financial accounting, reporting and internal controls.
9/9
People and Culture
Experience monitoring a company’s culture, overseeing the operation of consequence management frameworks, overseeing people management and succession planning, and setting remuneration frameworks.
9/9
Regulatory and Public Policy
Expertise identifying and managing legal, regulatory, public policy and corporate affairs issues. 7/9
Risk Management
Experience anticipating and identifying risks and monitoring the effectiveness of both financial and non-financial risk management frameworks and controls.
9/9
SKILL/ EXPERIENCE SUMMARY
DIRECTORS WITH SKILL/EXPERIENCE
Board skills and experience
Board Global Experience
International business experience and exposure
to different political, cultural, regulatory and business environments
78%
Board Diversity
Female 56%Male 44%
Board Tenure
0–3 years 11.1%3–6 years 66.7%6–10 years 22.2%
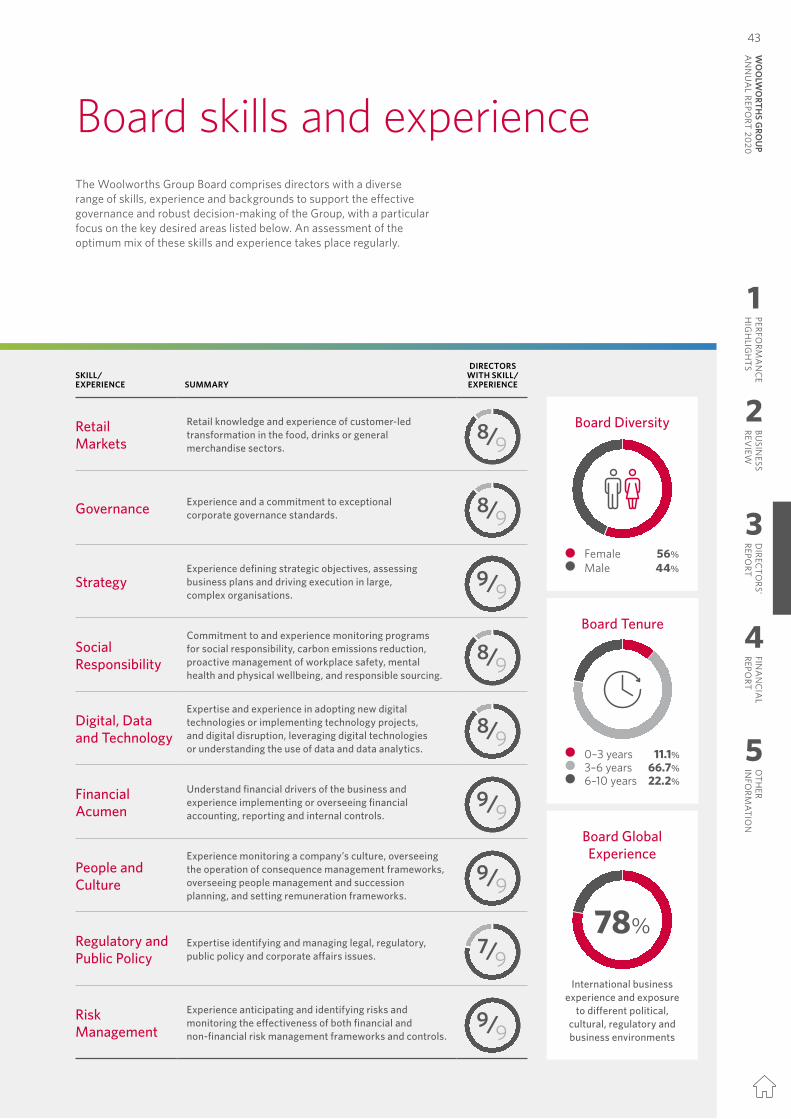
42
DIRECTORS
MEMBER OF:
BOARD
AUDIT, RISK MANAGEMENT & COMPLIANCE
COMMITTEE
PEOPLE PERFORMANCE
COMMITTEESUSTAINABILITY
COMMITTEENOMINATION COMMITTEE
Gordon CairnsJillian Broadbent AC –Jennifer Carr-Smith 1 – –
Holly Kramer –Siobhan McKenna –Scott Perkins 1 –
Kathee Tesija –Michael Ullmer AO 2
LEGEND: Chairman of Board/committee Member of Board/committee
The following changes to committee membership occurred during the reporting period: 1 Sustainability Committee: Jennifer Carr-Smith joined and Scott Perkins retired on 1 February 2020. 2 People Performance Committee: Michael Ullmer joined on 1 February 2020.
GovernanceGood corporate governance is central to Woolworths Group’s approach to creating sustainable growth and enhancing long-term shareholder value. Woolworths Group has followed each of the recommendations of the ASX Corporate Governance Council’s Corporate Governance Principles and Recommendations (3rd edition) throughout the reporting period. The Board has also reviewed Woolworths Group’s compliance against the 4th edition, and will formally report against the 4th edition in F21.
Further details of the key corporate governance policies and practices of Woolworths Group during the year are set out in the Corporate Governance Statement, which is available on the Woolworths Group website: www.woolworthsgroup.com.au.
The members of the Board of Directors are set out below. Further information about their skills and experience is set out on pages 44 to 45.
Left to right: Holly Kramer, Michael Ullmer, Gordon Cairns (Chairman), Jillian Broadbent, Scott Perkins, Brad Banducci (CEO), Siobhan McKenna, Kathee Tesija and Jennifer Carr-Smith.
1
2
3
4
5
PERFORM
AN
CE
HIG
HLIG
HTS
BUSIN
ESS REV
IEWD
IRECTO
RS' REPO
RTFIN
AN
CIA
L REPO
RTO
THER
INFO
RMATIO
N43
WO
OLW
ORTH
S GRO
UP
AN
NU
AL REPO
RT 2020
The Woolworths Group Board comprises directors with a diverse range of skills, experience and backgrounds to support the effective governance and robust decision-making of the Group, with a particular focus on the key desired areas listed below. An assessment of the optimum mix of these skills and experience takes place regularly.
Retail Markets
Retail knowledge and experience of customer-led transformation in the food, drinks or general merchandise sectors.
8/9
Governance Experience and a commitment to exceptional corporate governance standards. 8/9
StrategyExperience defining strategic objectives, assessing business plans and driving execution in large, complex organisations.
9/9
Social Responsibility
Commitment to and experience monitoring programs for social responsibility, carbon emissions reduction, proactive management of workplace safety, mental health and physical wellbeing, and responsible sourcing.
8/9
Digital, Data and Technology
Expertise and experience in adopting new digital technologies or implementing technology projects, and digital disruption, leveraging digital technologies or understanding the use of data and data analytics.
8/9
Financial Acumen
Understand financial drivers of the business and experience implementing or overseeing financial accounting, reporting and internal controls.
9/9
People and Culture
Experience monitoring a company’s culture, overseeing the operation of consequence management frameworks, overseeing people management and succession planning, and setting remuneration frameworks.
9/9
Regulatory and Public Policy
Expertise identifying and managing legal, regulatory, public policy and corporate affairs issues. 7/9
Risk Management
Experience anticipating and identifying risks and monitoring the effectiveness of both financial and non-financial risk management frameworks and controls.
9/9
SKILL/ EXPERIENCE SUMMARY
DIRECTORS WITH SKILL/EXPERIENCE
Board skills and experience
Board Global Experience
International business experience and exposure
to different political, cultural, regulatory and business environments
78%
Board Diversity
Female 56%Male 44%
Board Tenure
0–3 years 11.1%3–6 years 66.7%6–10 years 22.2%

44
BA Economics, MBA
INDEPENDENT NON-EXECUTIVE DIRECTOR
Appointed: 17 May 2019
BA (Maths & Economics)
INDEPENDENT NON-EXECUTIVE DIRECTOR
Appointed: 28 January 2011 Retiring 2020 AGM
Background and experience:Gordon has extensive Australian and international experience as a Chairman, director and senior executive. He has over 30 years of consumer goods and retail experience, including his time as Chief Executive Officer of Lion Nathan, and as a senior manager in marketing, operations and finance roles with PepsiCo, Cadbury and Nestle.
Other roles:Chairman of Origin Energy (Chairman since October 2013, Director since 2007) and a director of Macquarie Group and Macquarie Bank (since November 2014) and Good Return (since November 2007). Previously Chairman of David Jones and Rebel Group, and a director of Westpac Banking Corporation and a senior adviser to McKinsey & Company.
Background and experience:Brad was appointed Managing Director of Woolworths Food Group in March 2015 followed by Chief Executive Officer of the Group in February 2016. Prior to his appointment, he was Director of the Group’s Drinks business between 2012 and March 2015. Brad joined the Group in 2011 after the acquisition of the Cellarmasters Group. He was Chief Executive Officer of Cellarmasters from 2007 to 2011. Prior to this, he was the Chief Financial Officer and Director at Tyro Payments and a Vice President and Director with The Boston Consulting Group, where he was a core member of their retail practice for 15 years.
Background and experience:Jillian has extensive experience in corporate banking and finance in both Australia and internationally, primarily with Bankers Trust Australia.
Other roles:Director of Macquarie Group and Macquarie Bank (since November 2018) and Chancellor of the University of Wollongong. Previously Chair of the Board of Swiss Re Life & Health Australia, inaugural Chair of Clean Energy Finance Corporation, and a member of the Board of the Reserve Bank of Australia.
Background and experience:Jennifer is a seasoned board director and online retail executive with experience across organisations undergoing rapid growth and transformation in a number of sectors, including consumer packaged goods, apparel and grocery. Jennifer has over 25 years of digital experience within diverse organisations from start-ups to large global companies. She has previously held roles as Chairman of Swap.com, the largest online consignment and thrift store in the US, Senior Vice President, General Manager of North America Local at Groupon, and President and CEO of Peapod, an online grocery delivery service.
Other roles:Director of Full Harvest (since January 2020) and Director at Perdue Farms (since 2019).
Board of Directors
MA (Hons) University of Edinburgh
INDEPENDENT CHAIRMAN
Appointed: 1 September 2015
MBA, LLB, BComm (Acc)
CHIEF EXECUTIVE OFFICER
Appointed: 26 February 2016
GORDON CAIRNS
BRAD BANDUCCI
JILLIAN BROADBENT AC
JENNIFER CARR-SMITH
1
2
3
4
5
PERFORM
AN
CE
HIG
HLIG
HTS
BUSIN
ESS REV
IEWD
IRECTO
RS' REPO
RTFIN
AN
CIA
L REPO
RTO
THER
INFO
RMATIO
N
45
WO
OLW
ORTH
S GRO
UP
AN
NU
AL REPO
RT 2020
Background and experience:Holly is a former Chief Executive Officer of Best & Less. She has more than 20 years’ experience in general management, marketing and sales, including roles at the Ford Motor Company (in the US and Australia), Pacific Brands and Telstra.
Other roles:Director of Fonterra Co-operative Group Limited (since May 2020) and a Director of Abacus Property Group (since December 2018). Previously a Director of AMP (October 2015 to May 2018) and Deputy Chair of Australia Post (to June 2020).
Background and experience:Siobhan has a significant international background in strategy and policy in the public and private sectors. As an executive, she has led consumer-facing businesses in the media and digital sectors. She was a Commissioner of the Australian Productivity Commission and a Partner of McKinsey & Company. Siobhan is currently Group Director Broadcasting, News Corp.
Other roles:Chairman of Foxtel, Fox Sports and Australian News Channel, a Director of AMCIL (since March 2016) and a Director of Nova Entertainment.
Background and experience:Scott has extensive Australian and international experience as a leading corporate adviser on strategy, mergers and acquisitions and capital markets matters. He held senior executive leadership positions at Deutsche Bank from 1999 to 2013. These included Managing Director and Head of Corporate Finance for Australia and New Zealand, membership of the Asia Pacific Corporate and Investment Bank Management Committee and Chief Executive Officer of Deutsche Bank New Zealand.
Other roles:Director of Origin Energy (since September 2015) and Brambles (since June 2015).
Background and experience:Kathee has extensive retail experience in the US market, particularly in merchandising and supply chain management. During a 30-year executive career with Target Corporation in the US, she served as Chief Merchandising and Supply Chain Officer and Executive Vice President. Kathee continued her involvement in Target as a Strategic Advisor until 2016. Kathee was a Director of Verizon Communications, Inc. (from 2012 to May 2020).Other roles:Director of the Clorox Company (since May 2020), and a senior advisor and consultant for Simpactful, a retail consulting agency in the US.
Background and experience:Michael has extensive strategic, financial and management expertise. He was Deputy Chief Executive at National Australia Bank (NAB) from October 2007 until he stepped down from the bank in August 2011. He joined NAB in 2004 as Finance Director. Prior to NAB, Michael was Chief Financial Officer and then Group Executive for Institutional and Business Banking at Commonwealth Bank of Australia. Before that, he was a Partner at KPMG and Coopers & Lybrand.
Other roles:Chairman of Lendlease (since November 2018, Director since December 2011) and Chairman of Melbourne Symphony Orchestra.
BA (Hons), MBA
INDEPENDENT NON-EXECUTIVE DIRECTOR
Appointed: 8 February 2016
B.Ec (Hons), MPhil
INDEPENDENT NON-EXECUTIVE DIRECTOR
Appointed: 8 February 2016
BSRMM (Fashion Merchandising)
INDEPENDENT NON-EXECUTIVE DIRECTOR
Appointed: 9 May 2016
BCom, LLB (Hons)
INDEPENDENT NON-EXECUTIVE DIRECTOR
Appointed: 1 September 2014 Term expires 2020 AGM
BSc (Maths) (Hons), FCA, SF Fin
INDEPENDENT NON-EXECUTIVE DIRECTOR
Appointed: 30 January 2012
HOLLY KRAMER
SIOBHAN MCKENNA
KATHRYN (KATHEE) TESIJA
SCOTT PERKINS
MICHAEL ULLMER AO
44
BA Economics, MBA
INDEPENDENT NON-EXECUTIVE DIRECTOR
Appointed: 17 May 2019
BA (Maths & Economics)
INDEPENDENT NON-EXECUTIVE DIRECTOR
Appointed: 28 January 2011 Retiring 2020 AGM
Background and experience:Gordon has extensive Australian and international experience as a Chairman, director and senior executive. He has over 30 years of consumer goods and retail experience, including his time as Chief Executive Officer of Lion Nathan, and as a senior manager in marketing, operations and finance roles with PepsiCo, Cadbury and Nestle.
Other roles:Chairman of Origin Energy (Chairman since October 2013, Director since 2007) and a director of Macquarie Group and Macquarie Bank (since November 2014) and Good Return (since November 2007). Previously Chairman of David Jones and Rebel Group, and a director of Westpac Banking Corporation and a senior adviser to McKinsey & Company.
Background and experience:Brad was appointed Managing Director of Woolworths Food Group in March 2015 followed by Chief Executive Officer of the Group in February 2016. Prior to his appointment, he was Director of the Group’s Drinks business between 2012 and March 2015. Brad joined the Group in 2011 after the acquisition of the Cellarmasters Group. He was Chief Executive Officer of Cellarmasters from 2007 to 2011. Prior to this, he was the Chief Financial Officer and Director at Tyro Payments and a Vice President and Director with The Boston Consulting Group, where he was a core member of their retail practice for 15 years.
Background and experience:Jillian has extensive experience in corporate banking and finance in both Australia and internationally, primarily with Bankers Trust Australia.
Other roles:Director of Macquarie Group and Macquarie Bank (since November 2018) and Chancellor of the University of Wollongong. Previously Chair of the Board of Swiss Re Life & Health Australia, inaugural Chair of Clean Energy Finance Corporation, and a member of the Board of the Reserve Bank of Australia.
Background and experience:Jennifer is a seasoned board director and online retail executive with experience across organisations undergoing rapid growth and transformation in a number of sectors, including consumer packaged goods, apparel and grocery. Jennifer has over 25 years of digital experience within diverse organisations from start-ups to large global companies. She has previously held roles as Chairman of Swap.com, the largest online consignment and thrift store in the US, Senior Vice President, General Manager of North America Local at Groupon, and President and CEO of Peapod, an online grocery delivery service.
Other roles:Director of Full Harvest (since January 2020) and Director at Perdue Farms (since 2019).
Board of Directors
MA (Hons) University of Edinburgh
INDEPENDENT CHAIRMAN
Appointed: 1 September 2015
MBA, LLB, BComm (Acc)
CHIEF EXECUTIVE OFFICER
Appointed: 26 February 2016
GORDON CAIRNS
BRAD BANDUCCI
JILLIAN BROADBENT AC
JENNIFER CARR-SMITH
1
2
3
4
5
PERFORM
AN
CE
HIG
HLIG
HTS
BUSIN
ESS REV
IEWD
IRECTO
RS' REPO
RTFIN
AN
CIA
L REPO
RTO
THER
INFO
RMATIO
N45
WO
OLW
ORTH
S GRO
UP
AN
NU
AL REPO
RT 2020
Background and experience:Holly is a former Chief Executive Officer of Best & Less. She has more than 20 years’ experience in general management, marketing and sales, including roles at the Ford Motor Company (in the US and Australia), Pacific Brands and Telstra.
Other roles:Director of Fonterra Co-operative Group Limited (since May 2020) and a Director of Abacus Property Group (since December 2018). Previously a Director of AMP (October 2015 to May 2018) and Deputy Chair of Australia Post (to June 2020).
Background and experience:Siobhan has a significant international background in strategy and policy in the public and private sectors. As an executive, she has led consumer-facing businesses in the media and digital sectors. She was a Commissioner of the Australian Productivity Commission and a Partner of McKinsey & Company. Siobhan is currently Group Director Broadcasting, News Corp.
Other roles:Chairman of Foxtel, Fox Sports and Australian News Channel, a Director of AMCIL (since March 2016) and a Director of Nova Entertainment.
Background and experience:Scott has extensive Australian and international experience as a leading corporate adviser on strategy, mergers and acquisitions and capital markets matters. He held senior executive leadership positions at Deutsche Bank from 1999 to 2013. These included Managing Director and Head of Corporate Finance for Australia and New Zealand, membership of the Asia Pacific Corporate and Investment Bank Management Committee and Chief Executive Officer of Deutsche Bank New Zealand.
Other roles:Director of Origin Energy (since September 2015) and Brambles (since June 2015).
Background and experience:Kathee has extensive retail experience in the US market, particularly in merchandising and supply chain management. During a 30-year executive career with Target Corporation in the US, she served as Chief Merchandising and Supply Chain Officer and Executive Vice President. Kathee continued her involvement in Target as a Strategic Advisor until 2016. Kathee was a Director of Verizon Communications, Inc. (from 2012 to May 2020).Other roles:Director of the Clorox Company (since May 2020), and a senior advisor and consultant for Simpactful, a retail consulting agency in the US.
Background and experience:Michael has extensive strategic, financial and management expertise. He was Deputy Chief Executive at National Australia Bank (NAB) from October 2007 until he stepped down from the bank in August 2011. He joined NAB in 2004 as Finance Director. Prior to NAB, Michael was Chief Financial Officer and then Group Executive for Institutional and Business Banking at Commonwealth Bank of Australia. Before that, he was a Partner at KPMG and Coopers & Lybrand.
Other roles:Chairman of Lendlease (since November 2018, Director since December 2011) and Chairman of Melbourne Symphony Orchestra.
BA (Hons), MBA
INDEPENDENT NON-EXECUTIVE DIRECTOR
Appointed: 8 February 2016
B.Ec (Hons), MPhil
INDEPENDENT NON-EXECUTIVE DIRECTOR
Appointed: 8 February 2016
BSRMM (Fashion Merchandising)
INDEPENDENT NON-EXECUTIVE DIRECTOR
Appointed: 9 May 2016
BCom, LLB (Hons)
INDEPENDENT NON-EXECUTIVE DIRECTOR
Appointed: 1 September 2014 Term expires 2020 AGM
BSc (Maths) (Hons), FCA, SF Fin
INDEPENDENT NON-EXECUTIVE DIRECTOR
Appointed: 30 January 2012
HOLLY KRAMER
SIOBHAN MCKENNA
KATHRYN (KATHEE) TESIJA
SCOTT PERKINS
MICHAEL ULLMER AO
46
Brad Banducci CHIEF EXECUTIVE OFFICER
Biography available in Board of Directors, refer to page 44.
Amanda Bardwell MANAGING DIRECTOR WOOLIESX
WooliesX includes three businesses; Digital & Media, eCom & Fulfilment and Loyalty & FinTech. Amanda joined Woolworths Group in 2001 and during her time has worked across both the Supermarkets and Drinks businesses. Amanda has held positions in general management and specialist senior executive roles across omni-channel retailing, eCommerce, marketing, buying, private label, and business development. Amanda has an MBA from University of New South Wales and a Bachelor of Business from the University of Technology Queensland and is also a member of Chief Executive Women.
Christian Bennett HEAD OF GOVERNMENT RELATIONS & INDUSTRY AFFAIRS
Prior to joining Woolworths Group in November 2017, Christian led government relations efforts for General Electric Inc across South East Asia, Australia and New Zealand for BHP Billiton Ltd and was Group Executive Public Affairs, Santos Ltd. In government, Christian spent 14 years in Australia’s diplomatic service, including postings in southern Africa, Asia and the United States and secondments to the Office of the Foreign Minister and Department of Prime Minister & Cabinet. Christian holds B.LLB (Hons), B.Comm and MBA degrees from the University of Melbourne.
Guy Brent MANAGING DIRECTOR, FOODCO AND METRO
Guy was appointed Managing Director, FoodCo and Metro in August 2019. Prior to this, Guy was the Director of BWS since August 2014, and before that, was the General Manager of Pinnacle Drinks, which he was responsible for setting up in July 2012. Guy joined Woolworths Group in April 2011 after the acquisition of the Cellarmasters Group, where he was Chief Financial Officer from 2007 to 2011. Before that, Guy was a Commercial Director at Optus for two years after emigrating from the UK to Australia in 2005. Guy is a qualified Chartered Accountant and has a BSC from the University of Bristol in the UK.
Group Executive Committee
1
2
3
4
5
PERFORM
AN
CE
HIG
HLIG
HTS
BUSIN
ESS REV
IEWD
IRECTO
RS' REPO
RTFIN
AN
CIA
L REPO
RTO
THER
INFO
RMATIO
N
47
WO
OLW
ORTH
S GRO
UP
AN
NU
AL REPO
RT 2020
Natalie Davis MANAGING DIRECTOR WOOLWORTHS NEW ZEALAND
Natalie was appointed Managing Director, Woolworths New Zealand in July 2018. Prior to this, Natalie was Chief Customer Transformation Officer, Woolworths Group, leading the development of Customer 1st strategies, transformation and culture. Natalie joined the Group in July 2015 as Director of Customer Transformation, Food Group. Before Woolworths, Natalie was a Partner at McKinsey & Company, where she worked in the UK and Australia for 15 years advising on strategy and commercial transformation. Natalie holds an MBA from INSEAD France, Bachelor of Commerce and Law degrees with Honours from the University of Sydney, and is also a member of Chief Executive Women.
Steve Donohue 1 MANAGING DIRECTOR ENDEAVOUR GROUP
Steve has over 25 years’ experience in the retail industry and brings a deep appreciation for core retail principles and a strong focus on the customer experience. Steve Donohue was appointed Managing Director, Endeavour Drinks in January 2018. Steve has held a broad range of roles within the Drinks business, starting as a store manager in Dan Murphy’s when he was 19, before progressing into senior buying, merchandising and marketing roles. In 2013 Steve moved to New Zealand to work for Countdown before returning to Australia in 2015 to take up the role of Director, Buying and Merchandising, Woolworths Supermarkets.
Paul Graham CHIEF SUPPLY CHAIN OFFICER
Before joining the Woolworths Group in 2016, Paul was Global COO and CEO for Europe, Middle East and Africa, DHL Supply Chain. Paul has also been a board member of one of Australia’s largest wholesale and grower produce companies, Executive Chairman of a large multi-billion dollar global marketing and digital services business headquartered in the UK and has served on various government and university advisory boards. Paul is also Chairman of the Healthy Heads Foundation, a logistics industry foundation for mental health. He was awarded the Public Service Medal by the government of Singapore for services to the logistics industry in 2014.
Steve Greentree MANAGING DIRECTOR, NEW BUSINESSES
Steve has had an extensive retail career of nearly 40 years with the Woolworths Group. During his time Steve has held a number of senior roles within Woolworths Group, including Director, Business Development; Chief Operations Officer, Australian Supermarkets and Petrol; Director, Woolworths Liquor Group; general manager of Marketing and state management roles for Australian Supermarkets.
Stephen Harrison CHIEF FINANCIAL OFFICER
Stephen Harrison was appointed Chief Financial Officer for Woolworths Group in August 2019. Prior to his appointment, Stephen held the role of Finance Director for Australian Food from July 2015, and before that, was Finance Director for Endeavour Drinks from July 2013. Before joining the Group in 2013, Stephen worked for a number of leading FMCG businesses in Australia and New Zealand, including as Finance Director for Valspar ANZ (formerly Wattyl Paints) and Finance Director for Bluebird Foods in New Zealand, a subsidiary of PepsiCo. Stephen also spent time working for PepsiCo in Australia, and prior to that, worked for Foster’s for four years. Stephen spent over a decade with KPMG, following his graduation from Macquarie University, and is a member of Chartered Accountants Australia and New Zealand.
1 Steve Donohue was appointed Chief Executive Officer – Endeavour Group Limited effective 1 July 2020.
46
Brad Banducci CHIEF EXECUTIVE OFFICER
Biography available in Board of Directors, refer to page 44.
Amanda Bardwell MANAGING DIRECTOR WOOLIESX
WooliesX includes three businesses; Digital & Media, eCom & Fulfilment and Loyalty & FinTech. Amanda joined Woolworths Group in 2001 and during her time has worked across both the Supermarkets and Drinks businesses. Amanda has held positions in general management and specialist senior executive roles across omni-channel retailing, eCommerce, marketing, buying, private label, and business development. Amanda has an MBA from University of New South Wales and a Bachelor of Business from the University of Technology Queensland and is also a member of Chief Executive Women.
Christian Bennett HEAD OF GOVERNMENT RELATIONS & INDUSTRY AFFAIRS
Prior to joining Woolworths Group in November 2017, Christian led government relations efforts for General Electric Inc across South East Asia, Australia and New Zealand for BHP Billiton Ltd and was Group Executive Public Affairs, Santos Ltd. In government, Christian spent 14 years in Australia’s diplomatic service, including postings in southern Africa, Asia and the United States and secondments to the Office of the Foreign Minister and Department of Prime Minister & Cabinet. Christian holds B.LLB (Hons), B.Comm and MBA degrees from the University of Melbourne.
Guy Brent MANAGING DIRECTOR, FOODCO AND METRO
Guy was appointed Managing Director, FoodCo and Metro in August 2019. Prior to this, Guy was the Director of BWS since August 2014, and before that, was the General Manager of Pinnacle Drinks, which he was responsible for setting up in July 2012. Guy joined Woolworths Group in April 2011 after the acquisition of the Cellarmasters Group, where he was Chief Financial Officer from 2007 to 2011. Before that, Guy was a Commercial Director at Optus for two years after emigrating from the UK to Australia in 2005. Guy is a qualified Chartered Accountant and has a BSC from the University of Bristol in the UK.
Group Executive Committee
1
2
3
4
5
PERFORM
AN
CE
HIG
HLIG
HTS
BUSIN
ESS REV
IEWD
IRECTO
RS' REPO
RTFIN
AN
CIA
L REPO
RTO
THER
INFO
RMATIO
N47
WO
OLW
ORTH
S GRO
UP
AN
NU
AL REPO
RT 2020
Natalie Davis MANAGING DIRECTOR WOOLWORTHS NEW ZEALAND
Natalie was appointed Managing Director, Woolworths New Zealand in July 2018. Prior to this, Natalie was Chief Customer Transformation Officer, Woolworths Group, leading the development of Customer 1st strategies, transformation and culture. Natalie joined the Group in July 2015 as Director of Customer Transformation, Food Group. Before Woolworths, Natalie was a Partner at McKinsey & Company, where she worked in the UK and Australia for 15 years advising on strategy and commercial transformation. Natalie holds an MBA from INSEAD France, Bachelor of Commerce and Law degrees with Honours from the University of Sydney, and is also a member of Chief Executive Women.
Steve Donohue 1 MANAGING DIRECTOR ENDEAVOUR GROUP
Steve has over 25 years’ experience in the retail industry and brings a deep appreciation for core retail principles and a strong focus on the customer experience. Steve Donohue was appointed Managing Director, Endeavour Drinks in January 2018. Steve has held a broad range of roles within the Drinks business, starting as a store manager in Dan Murphy’s when he was 19, before progressing into senior buying, merchandising and marketing roles. In 2013 Steve moved to New Zealand to work for Countdown before returning to Australia in 2015 to take up the role of Director, Buying and Merchandising, Woolworths Supermarkets.
Paul Graham CHIEF SUPPLY CHAIN OFFICER
Before joining the Woolworths Group in 2016, Paul was Global COO and CEO for Europe, Middle East and Africa, DHL Supply Chain. Paul has also been a board member of one of Australia’s largest wholesale and grower produce companies, Executive Chairman of a large multi-billion dollar global marketing and digital services business headquartered in the UK and has served on various government and university advisory boards. Paul is also Chairman of the Healthy Heads Foundation, a logistics industry foundation for mental health. He was awarded the Public Service Medal by the government of Singapore for services to the logistics industry in 2014.
Steve Greentree MANAGING DIRECTOR, NEW BUSINESSES
Steve has had an extensive retail career of nearly 40 years with the Woolworths Group. During his time Steve has held a number of senior roles within Woolworths Group, including Director, Business Development; Chief Operations Officer, Australian Supermarkets and Petrol; Director, Woolworths Liquor Group; general manager of Marketing and state management roles for Australian Supermarkets.
Stephen Harrison CHIEF FINANCIAL OFFICER
Stephen Harrison was appointed Chief Financial Officer for Woolworths Group in August 2019. Prior to his appointment, Stephen held the role of Finance Director for Australian Food from July 2015, and before that, was Finance Director for Endeavour Drinks from July 2013. Before joining the Group in 2013, Stephen worked for a number of leading FMCG businesses in Australia and New Zealand, including as Finance Director for Valspar ANZ (formerly Wattyl Paints) and Finance Director for Bluebird Foods in New Zealand, a subsidiary of PepsiCo. Stephen also spent time working for PepsiCo in Australia, and prior to that, worked for Foster’s for four years. Stephen spent over a decade with KPMG, following his graduation from Macquarie University, and is a member of Chartered Accountants Australia and New Zealand.
1 Steve Donohue was appointed Chief Executive Officer – Endeavour Group Limited effective 1 July 2020.
48
Andrew Hicks CHIEF MARKETING OFFICER
Andrew Hicks was appointed Chief Marketing Officer in June 2019 and Director of Marketing, Woolworths Food Group and Supermarkets in November 2015. During this time, Woolworths has been named Australia’s most valuable brand (2020), second most trusted brand during COVID-19, B&T Marketing Team of the Year (2017) and Ad News Brand Of The Year (2017). Prior to this Andrew was General Manager, Marketing, Woolworths Liquor Group, leading the transformation of the BWS brand and extending Dan Murphy’s lead as Australia’s most iconic drinks retail brand. From South Africa, Andrew was National Marketing Executive for Musica and began his career working in the advertising and publishing industry. Andrew has a Bachelor of Social Science and Marketing Honours degrees from the University of KwaZulu-Natal as well as a Diploma in Advertising (Copywriting) from The Red & Yellow School.
John Hunt CHIEF INFORMATION OFFICER
John joined Woolworths Group in February 2017, having spent 27 years at Woolworths Holdings Limited in South Africa where he held a range of senior IT, large program management and core retail leadership roles, including CIO and Senior Executive, Food Planning and Value Chain. A graduate from the Cape Peninsula University of Technology in Cape Town, John is a retailer through and through and is passionate about how information technology and technology innovation is being optimally used in enabling the business to support both the front line team members as well as ensuring our customers have the best shopping experience.
Von Ingram CHIEF CUSTOMER TRANSFORMATION OFFICER
Von Ingram joined Woolworths as Chief Customer Transformation Officer in July 2018, leading transformation and customer-first strategy for Woolworths Group. Prior to this, Von was managing director and partner at The Boston Consulting Group (BCG), working in Australia and US retail for 10 years, leading strategy, customer insight and retail transformation roles across a range of retail players in food and general merchandise. Von holds an MBA from Melbourne Business School and has also completed a Bachelor of Commerce, with First Class Honours from the University of Western Australia.
Caryn Katsikogianis CHIEF PEOPLE OFFICER
Caryn has over 20 years’ experience in HR roles. Caryn joined Woolworths Group in 2004 and has held a number of senior HR roles across Woolworths Group, including BIG W, Supply Chain, Supermarkets, Corporate Support and Food Group. Caryn also held the role of General Manager Business Transformation during this time. Originally from South Africa, Caryn holds a Bachelor of Commerce degree from the University of South Africa. Caryn is also a member of Chief Executive Women.
GROUP EXECUTIVE COMMITTEE
1
2
3
4
5
PERFORM
AN
CE
HIG
HLIG
HTS
BUSIN
ESS REV
IEWD
IRECTO
RS' REPO
RTFIN
AN
CIA
L REPO
RTO
THER
INFO
RMATIO
N
49
WO
OLW
ORTH
S GRO
UP
AN
NU
AL REPO
RT 2020
David Marr CHIEF OPERATING OFFICER
David joined Woolworths Group in 2011 as General Manager of Finance, Woolworths Supermarkets. He became Deputy CFO in November 2013, then was CFO from February 2014 to August 2019, at which time he commenced in the new role of Chief Operating Officer, Woolworths Group. Prior to joining the Group, David spent three years with Tesco plc in the UK, initially as UK Commercial Finance Director and then as Supply Chain Director – Non Food. David has held a number of senior roles within leading Australian companies, including Finance Director then Sales Director at Southcorp Limited and Foster’s and CFO at Australian Pharmaceutical Industries. David completed a Bachelor of Financial Administration at the University of New England and is a Chartered Accountant.
Claire Peters MANAGING DIRECTOR WOOLWORTHS SUPERMARKETS
Claire is an experienced retailer with over 24 years of experience. Claire started her retail career in the UK working for grocery retailer, Tesco plc. During this time she held a variety of senior roles, including regional retail director; Managing Director, Large Stores; and Commercial Director, Healthcare & Baby, Beauty and Toiletries. In March 2014 Claire moved to Thailand to take up COO responsibilities for Tesco Thailand. Claire holds a BSC Hons in Economics & Sociology from the University of Loughborough, UK. Claire joined the Woolworths Group in June 2017 and has also been a member of Chief Executive Women since 2017.
Bill Reid CHIEF LEGAL OFFICER
Bill joined Woolworths Group as Chief Legal Officer in October 2019. Prior to his appointment, Bill was a senior partner at Ashurst for many years, leading the firm’s Competition team, and in various management positions across Australia and Asia. Bill has long experience in responding to regulatory issues, litigation and corporate transactions. Bill holds an MBA from Melbourne Business School and a Bachelor of Laws from the University of Adelaide.
Colin Storrie MANAGING DIRECTOR GROUP PORTFOLIO
Colin Storrie has over 20 years’ experience in senior finance roles in listed companies, investment banking and government. Prior to Colin’s most recent appointment, he joined as Deputy Chief Financial Officer, Woolworths Group in 2015. Colin has also held group treasurer, deputy chief financial officer and chief financial officer positions at both Qantas Airways Ltd and AMP Ltd.
Other Group Executive Committee appointments:Rob McCartney was appointed Director of Format Development effective 1 July 2020.
48
Andrew Hicks CHIEF MARKETING OFFICER
Andrew Hicks was appointed Chief Marketing Officer in June 2019 and Director of Marketing, Woolworths Food Group and Supermarkets in November 2015. During this time, Woolworths has been named Australia’s most valuable brand (2020), second most trusted brand during COVID-19, B&T Marketing Team of the Year (2017) and Ad News Brand Of The Year (2017). Prior to this Andrew was General Manager, Marketing, Woolworths Liquor Group, leading the transformation of the BWS brand and extending Dan Murphy’s lead as Australia’s most iconic drinks retail brand. From South Africa, Andrew was National Marketing Executive for Musica and began his career working in the advertising and publishing industry. Andrew has a Bachelor of Social Science and Marketing Honours degrees from the University of KwaZulu-Natal as well as a Diploma in Advertising (Copywriting) from The Red & Yellow School.
John Hunt CHIEF INFORMATION OFFICER
John joined Woolworths Group in February 2017, having spent 27 years at Woolworths Holdings Limited in South Africa where he held a range of senior IT, large program management and core retail leadership roles, including CIO and Senior Executive, Food Planning and Value Chain. A graduate from the Cape Peninsula University of Technology in Cape Town, John is a retailer through and through and is passionate about how information technology and technology innovation is being optimally used in enabling the business to support both the front line team members as well as ensuring our customers have the best shopping experience.
Von Ingram CHIEF CUSTOMER TRANSFORMATION OFFICER
Von Ingram joined Woolworths as Chief Customer Transformation Officer in July 2018, leading transformation and customer-first strategy for Woolworths Group. Prior to this, Von was managing director and partner at The Boston Consulting Group (BCG), working in Australia and US retail for 10 years, leading strategy, customer insight and retail transformation roles across a range of retail players in food and general merchandise. Von holds an MBA from Melbourne Business School and has also completed a Bachelor of Commerce, with First Class Honours from the University of Western Australia.
Caryn Katsikogianis CHIEF PEOPLE OFFICER
Caryn has over 20 years’ experience in HR roles. Caryn joined Woolworths Group in 2004 and has held a number of senior HR roles across Woolworths Group, including BIG W, Supply Chain, Supermarkets, Corporate Support and Food Group. Caryn also held the role of General Manager Business Transformation during this time. Originally from South Africa, Caryn holds a Bachelor of Commerce degree from the University of South Africa. Caryn is also a member of Chief Executive Women.
GROUP EXECUTIVE COMMITTEE
1
2
3
4
5
PERFORM
AN
CE
HIG
HLIG
HTS
BUSIN
ESS REV
IEWD
IRECTO
RS' REPO
RTFIN
AN
CIA
L REPO
RTO
THER
INFO
RMATIO
N49
WO
OLW
ORTH
S GRO
UP
AN
NU
AL REPO
RT 2020
David Marr CHIEF OPERATING OFFICER
David joined Woolworths Group in 2011 as General Manager of Finance, Woolworths Supermarkets. He became Deputy CFO in November 2013, then was CFO from February 2014 to August 2019, at which time he commenced in the new role of Chief Operating Officer, Woolworths Group. Prior to joining the Group, David spent three years with Tesco plc in the UK, initially as UK Commercial Finance Director and then as Supply Chain Director – Non Food. David has held a number of senior roles within leading Australian companies, including Finance Director then Sales Director at Southcorp Limited and Foster’s and CFO at Australian Pharmaceutical Industries. David completed a Bachelor of Financial Administration at the University of New England and is a Chartered Accountant.
Claire Peters MANAGING DIRECTOR WOOLWORTHS SUPERMARKETS
Claire is an experienced retailer with over 24 years of experience. Claire started her retail career in the UK working for grocery retailer, Tesco plc. During this time she held a variety of senior roles, including regional retail director; Managing Director, Large Stores; and Commercial Director, Healthcare & Baby, Beauty and Toiletries. In March 2014 Claire moved to Thailand to take up COO responsibilities for Tesco Thailand. Claire holds a BSC Hons in Economics & Sociology from the University of Loughborough, UK. Claire joined the Woolworths Group in June 2017 and has also been a member of Chief Executive Women since 2017.
Bill Reid CHIEF LEGAL OFFICER
Bill joined Woolworths Group as Chief Legal Officer in October 2019. Prior to his appointment, Bill was a senior partner at Ashurst for many years, leading the firm’s Competition team, and in various management positions across Australia and Asia. Bill has long experience in responding to regulatory issues, litigation and corporate transactions. Bill holds an MBA from Melbourne Business School and a Bachelor of Laws from the University of Adelaide.
Colin Storrie MANAGING DIRECTOR GROUP PORTFOLIO
Colin Storrie has over 20 years’ experience in senior finance roles in listed companies, investment banking and government. Prior to Colin’s most recent appointment, he joined as Deputy Chief Financial Officer, Woolworths Group in 2015. Colin has also held group treasurer, deputy chief financial officer and chief financial officer positions at both Qantas Airways Ltd and AMP Ltd.
Other Group Executive Committee appointments:Rob McCartney was appointed Director of Format Development effective 1 July 2020.
This is the report of the directors of Woolworths Group Limited (the Company) in respect of the Company and the entities it controlled at the end of, or during, the financial period ended 28 June 2020 (together referred to as the Group).
PRINCIPAL ACTIVITIESThe Group operates primarily in Australia and New Zealand, with 3,357 stores and approximately 215,000 employees at year‑end. The principal activities of the Group during the year were retail operations across:• Australian Food: operating 1,052 Woolworths Supermarkets and Metro Food Stores.
• New Zealand Food: operating 182 Countdown Supermarkets as well as a wholesale operation which supplies a further 70 stores.
• BIG W: operating 179 BIG W stores.• The Group also has online operations for its primary trading divisions.
On 2 February 2020, Woolworths’ Drinks business was restructured to create Endeavour Group. On 4 February 2020 Endeavour Group merged with ALH Group. Woolworths Group owns 85.4% of Endeavour Group. The principal activities of Endeavour Group during the year were: • Endeavour Drinks: operating 1,610 stores under Dan Murphy’s and BWS brands. The Group also operates Cellarmasters
and Langtons online platforms.• ALH Hotels: operating 334 hotels, including bars, dining, gaming, accommodation and venue hire operations.
THE DIRECTORS AND MEETINGS OF DIRECTORSThe table below sets out the directors of the Company and their attendance at board and committee meetings during the financial period ended 28 June 2020.
BOARD MEETINGS
AUDIT, RISK MANAGEMENT&
COMPLIANCE COMMITTEE
PEOPLE PERFORMANCE
COMMITTEESUSTAINABILITY
COMMITTEENOMINATION COMMITTEE
DIRECTOR (A) (B) (A) (B) (A) (B) (A) (B) (A) (B)
Non-executive DirectorsG M Cairns 16 16 4 4 7 7 4 4 2 2J R Broadbent AC 16 16 4 4 – – 4 4 2 2J C Carr‑Smith 14 14 – – – – 4 4 2 2H S Kramer 16 16 – – 7 7 4 4 2 2S L McKenna 16 16 4 4 7 7 – – 2 2S R Perkins 16 16 4 4 7 7 2 2 2 2K A Tesija 16 16 – – 7 7 4 4 2 2M J Ullmer AO 16 16 4 4 3 3 4 4 2 2Executive Director B L Banducci 16 16 – – – – – – – –
(A) Number of meetings eligible to attend (excluding formal Leave of Absence).(B) Number of physical meetings attended.
Directors also attend meetings of committees of which they are not a member. This is not reflected in the table above.
In addition to these formal meetings of the Board and its Committees, 10 further unscheduled or special purpose Board Sub‑Committee meetings were held during the financial period ended 28 June 2020.
Details of director experience, qualifications and other listed company directorships are set out on page 44 and 45.
COMPANY SECRETARYMarcin Firek was appointed Company Secretary in January 2017.
He has held executive, HR, company secretarial and legal roles across a number of ASX50 companies. He is a Fellow of the Governance Institute of Australia and co‑author of its guide to managing continuous disclosure.
Marcin holds a BEc LLB from Macquarie University.
Directors’ Statutory Report50
ENVIRONMENTAL REGULATIONThe Group’s operations are subject to a range of environmental regulations under the law of the Commonwealth of Australia and its states and territories. The Group is also subject to various state and local government food licensing requirements, and may be subject to environmental and town planning regulations incidental to the development of shopping centre sites. The Group has not incurred any significant liabilities under any environmental legislation.
DIRECTORS’ AND OFFICERS’ INDEMNITY/INSURANCE(i) The Constitution of the Company provides that the Company will indemnify to the maximum extent permitted by law, any
current or former director, secretary or other officer of the Company or a wholly owned subsidiary of the Company against:(a) any liability incurred by the person in that capacity; (b) legal costs incurred in defending, or otherwise in connection
with proceedings, whether civil, criminal or of an administrative or investigatory nature in which the person becomes involved because of that capacity; and (c) legal costs incurred in good faith in obtaining legal advice on issues relevant to the performance of their functions and discharge of their duties.
(ii) Each director and officer has entered into a Deed of Indemnity, Access and Insurance that provides for indemnity against liability as a director or officer, except to the extent of indemnity under an insurance policy or where prohibited by statute. The Deed also entitles the director or officer to access company documents and records, subject to undertakings as to confidentiality, and to receive directors’ and officers’ insurance cover paid for by the Company.
(iii) During or since the end of the financial period, the Company has paid or agreed to pay a premium in respect of a contract of insurance insuring directors and officers, and any persons who will insure these in the future, and employees of the Company and its subsidiaries, against certain liabilities incurred in that capacity. Disclosure of the total amount of the premiums and the nature of the liabilities in respect of such insurance is prohibited by the contract of insurance.
NON-AUDIT SERVICESDuring the period, Deloitte Touche Tohmatsu Australia, the Company’s auditor, have performed certain other services in addition to their statutory duties. The board is satisfied that the provision of those non‑audit services during the period by the auditor is compatible with, and did not compromise, the auditor independence requirements of the Corporations Act 2001 (Cth) or as set out in Code of Conduct APES 110 Code of Ethics for Professional Accountants issued by the Accounting Professional & Ethical Standards Board, as they did not involve reviewing or auditing the auditor’s own work, acting in a management or decision making capacity for the Company, acting as an advocate for the Company or jointly sharing risks or rewards.
Details of amounts paid or payable to the auditor for non‑audit services provided during the year by the auditor are outlined in Note 6.3 to the financial statements.
OTHER INFORMATIONThe following information, contained in other sections of this Annual Report, forms part of this Directors’ Report:• Operating and Financial Review details on pages 2 to 41 inclusive in the Annual Report.• Details of dividends, including the Dividend Reinvestment Plan (DRP) and shares issued as a result of the DRP,
as outlined in Note 4.2 and Note 4.3 to the financial statements.• Matters subsequent to the end of the financial period as outlined in Note 6.4 to the financial statements.• Directors’ interests in shares and performance rights as set out in Sections 5.2 and 5.3 of the Remuneration Report.
These remain unchanged as at 1 August 2020.• Performance rights granted during the financial period and subsequent to year end as outlined in Note 6.2 to the
financial statements.• Remuneration Report from pages 52 to 73.• Auditor’s Independence Declaration on page 74.
This Report is made in accordance with a Resolution of the Directors of the Company and is dated 27 August 2020.
Gordon Cairns Chairman
Brad Banducci Chief Executive Officer
Directors’ Statutory Report
1
2
3
4
5
PERFORM
AN
CE
HIG
HLIG
HTS
BUSIN
ESS REV
IEWD
IRECTORS'
REPORT
FINA
NC
IAL
REPORT
OTH
ER IN
FORM
ATION
51
WO
OLW
ORTH
S GRO
UP
AN
NU
AL REPO
RT 2020
This is the report of the directors of Woolworths Group Limited (the Company) in respect of the Company and the entities it controlled at the end of, or during, the financial period ended 28 June 2020 (together referred to as the Group).
PRINCIPAL ACTIVITIESThe Group operates primarily in Australia and New Zealand, with 3,357 stores and approximately 215,000 employees at year‑end. The principal activities of the Group during the year were retail operations across:• Australian Food: operating 1,052 Woolworths Supermarkets and Metro Food Stores.
• New Zealand Food: operating 182 Countdown Supermarkets as well as a wholesale operation which supplies a further 70 stores.
• BIG W: operating 179 BIG W stores.• The Group also has online operations for its primary trading divisions.
On 2 February 2020, Woolworths’ Drinks business was restructured to create Endeavour Group. On 4 February 2020 Endeavour Group merged with ALH Group. Woolworths Group owns 85.4% of Endeavour Group. The principal activities of Endeavour Group during the year were: • Endeavour Drinks: operating 1,610 stores under Dan Murphy’s and BWS brands. The Group also operates Cellarmasters
and Langtons online platforms.• ALH Hotels: operating 334 hotels, including bars, dining, gaming, accommodation and venue hire operations.
THE DIRECTORS AND MEETINGS OF DIRECTORSThe table below sets out the directors of the Company and their attendance at board and committee meetings during the financial period ended 28 June 2020.
BOARD MEETINGS
AUDIT, RISK MANAGEMENT&
COMPLIANCE COMMITTEE
PEOPLE PERFORMANCE
COMMITTEESUSTAINABILITY
COMMITTEENOMINATION COMMITTEE
DIRECTOR (A) (B) (A) (B) (A) (B) (A) (B) (A) (B)
Non-executive DirectorsG M Cairns 16 16 4 4 7 7 4 4 2 2J R Broadbent AC 16 16 4 4 – – 4 4 2 2J C Carr‑Smith 14 14 – – – – 4 4 2 2H S Kramer 16 16 – – 7 7 4 4 2 2S L McKenna 16 16 4 4 7 7 – – 2 2S R Perkins 16 16 4 4 7 7 2 2 2 2K A Tesija 16 16 – – 7 7 4 4 2 2M J Ullmer AO 16 16 4 4 3 3 4 4 2 2Executive Director B L Banducci 16 16 – – – – – – – –
(A) Number of meetings eligible to attend (excluding formal Leave of Absence).(B) Number of physical meetings attended.
Directors also attend meetings of committees of which they are not a member. This is not reflected in the table above.
In addition to these formal meetings of the Board and its Committees, 10 further unscheduled or special purpose Board Sub‑Committee meetings were held during the financial period ended 28 June 2020.
Details of director experience, qualifications and other listed company directorships are set out on page 44 and 45.
COMPANY SECRETARYMarcin Firek was appointed Company Secretary in January 2017.
He has held executive, HR, company secretarial and legal roles across a number of ASX50 companies. He is a Fellow of the Governance Institute of Australia and co‑author of its guide to managing continuous disclosure.
Marcin holds a BEc LLB from Macquarie University.
Directors’ Statutory Report50
ENVIRONMENTAL REGULATIONThe Group’s operations are subject to a range of environmental regulations under the law of the Commonwealth of Australia and its states and territories. The Group is also subject to various state and local government food licensing requirements, and may be subject to environmental and town planning regulations incidental to the development of shopping centre sites. The Group has not incurred any significant liabilities under any environmental legislation.
DIRECTORS’ AND OFFICERS’ INDEMNITY/INSURANCE(i) The Constitution of the Company provides that the Company will indemnify to the maximum extent permitted by law, any
current or former director, secretary or other officer of the Company or a wholly owned subsidiary of the Company against:(a) any liability incurred by the person in that capacity; (b) legal costs incurred in defending, or otherwise in connection
with proceedings, whether civil, criminal or of an administrative or investigatory nature in which the person becomes involved because of that capacity; and (c) legal costs incurred in good faith in obtaining legal advice on issues relevant to the performance of their functions and discharge of their duties.
(ii) Each director and officer has entered into a Deed of Indemnity, Access and Insurance that provides for indemnity against liability as a director or officer, except to the extent of indemnity under an insurance policy or where prohibited by statute. The Deed also entitles the director or officer to access company documents and records, subject to undertakings as to confidentiality, and to receive directors’ and officers’ insurance cover paid for by the Company.
(iii) During or since the end of the financial period, the Company has paid or agreed to pay a premium in respect of a contract of insurance insuring directors and officers, and any persons who will insure these in the future, and employees of the Company and its subsidiaries, against certain liabilities incurred in that capacity. Disclosure of the total amount of the premiums and the nature of the liabilities in respect of such insurance is prohibited by the contract of insurance.
NON-AUDIT SERVICESDuring the period, Deloitte Touche Tohmatsu Australia, the Company’s auditor, have performed certain other services in addition to their statutory duties. The board is satisfied that the provision of those non‑audit services during the period by the auditor is compatible with, and did not compromise, the auditor independence requirements of the Corporations Act 2001 (Cth) or as set out in Code of Conduct APES 110 Code of Ethics for Professional Accountants issued by the Accounting Professional & Ethical Standards Board, as they did not involve reviewing or auditing the auditor’s own work, acting in a management or decision making capacity for the Company, acting as an advocate for the Company or jointly sharing risks or rewards.
Details of amounts paid or payable to the auditor for non‑audit services provided during the year by the auditor are outlined in Note 6.3 to the financial statements.
OTHER INFORMATIONThe following information, contained in other sections of this Annual Report, forms part of this Directors’ Report:• Operating and Financial Review details on pages 2 to 41 inclusive in the Annual Report.• Details of dividends, including the Dividend Reinvestment Plan (DRP) and shares issued as a result of the DRP,
as outlined in Note 4.2 and Note 4.3 to the financial statements.• Matters subsequent to the end of the financial period as outlined in Note 6.4 to the financial statements.• Directors’ interests in shares and performance rights as set out in Sections 5.2 and 5.3 of the Remuneration Report.
These remain unchanged as at 1 August 2020.• Performance rights granted during the financial period and subsequent to year end as outlined in Note 6.2 to the
financial statements.• Remuneration Report from pages 52 to 73.• Auditor’s Independence Declaration on page 74.
This Report is made in accordance with a Resolution of the Directors of the Company and is dated 27 August 2020.
Gordon Cairns Chairman
Brad Banducci Chief Executive Officer
Directors’ Statutory Report
1
2
3
4
5
PERFORM
AN
CE
HIG
HLIG
HTS
BUSIN
ESS REV
IEWD
IRECTORS'
REPORT
FINA
NC
IAL
REPORT
OTH
ER IN
FORM
ATION
51W
OO
LWO
RTHS G
ROU
P A
NN
UA
L REPORT 2020
Dear Shareholder,
F20 has been a year like no other in recent memory. Woolworths Group team members have been, like many of you, at the front line of droughts and bushfires in Australia, the devastating volcanic eruption in New Zealand, protests in cities across the globe, and as I write today, the global COVID-19 pandemic. In the face of these challenges, the efforts of our team have been extraordinary.
In June we announced our Better Together Recognition Award to thank and reward those of our team not eligible for existing variable reward schemes. In doing so, we created the largest employee share ownership plan in Australia and New Zealand, covering more than 106,000 team members, many of whom became shareholders for the first time. We believe this demonstrates an aligned remuneration outcome in its truest form: recognition for outstanding contributions that reflect the interests of our team and shareholders alike.
F20 Reward outcomes: Short Term Incentive (STI) and COVID-19 responseThe pandemic, in particular, created significant volatility across our business. Supermarket sales rose, offset by substantial investments in store safety and supply chain, and the temporary closure of the ALH venues adversely affected Group sales and profitability. These events had the potential to deliver STI outcomes that were more a reflection of uncontrollable circumstances than business and management performance.
Given the extraordinary impact of these events, the Board decided to award all Australian team members who participate in the STI plan the same scorecard result of 80% across all business and functional areas. The actual scorecard outcome incorporating all COVID-19 impacts was 104%, with the gap between the two amounts used to help fund the Better Together Recognition Award. The leaders in our business recommended this approach to express thanks to the front-line team members for their efforts this year. These special awards granted non-STI eligible permanent team members up to $750 of Woolworths Group shares and a $250 gift card to be spent in any Woolworths Group store. We also gave a $100 gift card to over 53,000 of our casual team.
F20 Reward outcomes: Underpayment of salaried team membersAs announced in October 2019, it was identified that Woolworths had inadvertently underpaid some of our salaried team members over a number of years. The Chairman and Chief Executive Officer (CEO) took accountability for this disappointing situation. The Chair reduced his fees by 20% for F20 and the CEO voluntarily forfeited his full STI for F20. The Chief People Officer (CPO) also voluntarily forfeited her full STI for F20. The Board conducted an investigation which revealed that the underpayments were the result of multiple points of failure across the organisation over a period of many years. As a result, the Group Executive Committee will collectively receive a 10 percentage point reduction in the STI result to 70% for F20. Further, the in-year remediation costs were applied against the ROFE measure in the F18-20 Transformation Incentive Plan (TIP) which did not meet entry performance for vesting.
F20 Reward outcomes: Transformation Incentive PlanThe second of the two three-year awards made under the TIP was assessed for vesting in July 2020. As a result of sustained progress on the Group’s transformation over this period, 64.3% of performance rights have vested with an aggregate outcome of between target and stretch. The Board is especially pleased with the significant value that the team has delivered to our shareholders over this period, with Total Shareholder Return (TSR) of 59.4%, including share price appreciation of 43.2% since July 2018, ranking Woolworths Group at the 86th percentile of our comparator group.
In summaryReflecting on F20, the Board feels immense pride at the unity, compassion and commitment demonstrated by our team members in serving our customers and communities. From a remuneration perspective, we have tailored our approach to fit the times and to deliver outcomes that reflect not only performance but also fairness and recognition of a truly collective team effort. At all times, and in all our actions, we have aimed to live up to the high standards expected of our team. I hope you will agree that we have struck the right balance in what has been a complex and memorable year.
Holly Kramer Chair – People Performance Committee
Remuneration Report
The report has been prepared and audited against the disclosure requirements of the Corporations Act 2001 (Cth).
52
1 2020 REMUNERATION AT A GLANCE
1.1 Our strategic priorities 541.2 F20 Executive KMP remuneration mix 551.3 How we performed and remuneration received 56
2 EXECUTIVE KMP REMUNERATION
2.1 Short Term Incentive 572.2 Long Term Incentive 592.3 What we paid Executive KMP in F20 and progress on Minimum Shareholding Requirements 612.4 Terms of Executive KMP Service Agreements 642.5 F21 outlook 64
3 GOVERNANCE
3.1 Role of the Board 653.2 Role of the People Performance Committee (PPC) 653.3 Treatment of Unvested Equity Awards upon exit 663.4 Other governance requirements 66
4 NON–EXECUTIVE DIRECTORS’ ARRANGEMENTS
4.1 Non-executive Directors’ Remuneration Policy and Structure 674.2 Non-executive Directors’ Minimum Shareholding Requirement 674.3 Non-executive Directors’ Equity Plan 67
5 KMP STATUTORY DISCLOSURES
5.1 KMP Remuneration 685.2 KMP Share right movements 705.3 KMP Share movements 715.4 Share rights outstanding for Executive KMP 72
Who is covered by this Report?The Remuneration Report outlines Woolworths Group’s remuneration framework and the outcomes for the year ended 28 June 2020 for our Key Management Personnel (KMP). KMP have the authority and responsibility for planning, directing and controlling the activities of Woolworths Group. F20 KMP are:
NAME POSITION APPOINTED 1
PEOPLE PERFORMANCE
COMMITTEE
Non
-exe
cutiv
e K
MP
Boar
d
Gordon Cairns Chairman 1 September 2015Jillian Broadbent AC Non-executive Director 28 January 2011 –Jennifer Carr-Smith Non-executive Director 17 May 2019 –Holly Kramer Non-executive Director 8 February 2016 ChairSiobhan McKenna Non-executive Director 8 February 2016Scott Perkins Non-executive Director 1 September 2014Kathryn Tesija Non-executive Director 9 May 2016Michael Ullmer AO Non-executive Director 30 January 2012
Exec
utiv
e K
MP Brad Banducci Chief Executive Officer 26 February 2016
Stephen Donohue Managing Director, Endeavour Drinks 1 April 2018Stephen Harrison Chief Financial Officer 1 August 2019
David Marr Chief Financial Officer 1 February 2014 to 31 July 2019
Claire Peters Managing Director, Woolworths Supermarkets 13 June 2017
1 Mr Marr was CFO until 31 July 2019, after which he ceased to be a KMP when he transitioned to the COO role overseeing the separation of Endeavour Group Limited (EGL). Mr Harrison became a KMP on 1 August 2019 when he was appointed CFO. Colin Storrie, Managing Director, Group Portfolio, ceased to be a KMP at the start of F20 as a result of the Group’s disposal of its Petrol business in F19 and his focus on the EGL separation.
Remuneration Report 2020 Table of Contents
1
2
3
4
5
PERFORM
AN
CEH
IGH
LIGH
TSBU
SINESS
REVIEW
DIRECTO
RS' REPO
RTFIN
AN
CIAL
REPORT
OTH
ER IN
FORM
ATION
53
WO
OLW
ORTH
S GRO
UP
AN
NU
AL REPO
RT 2020
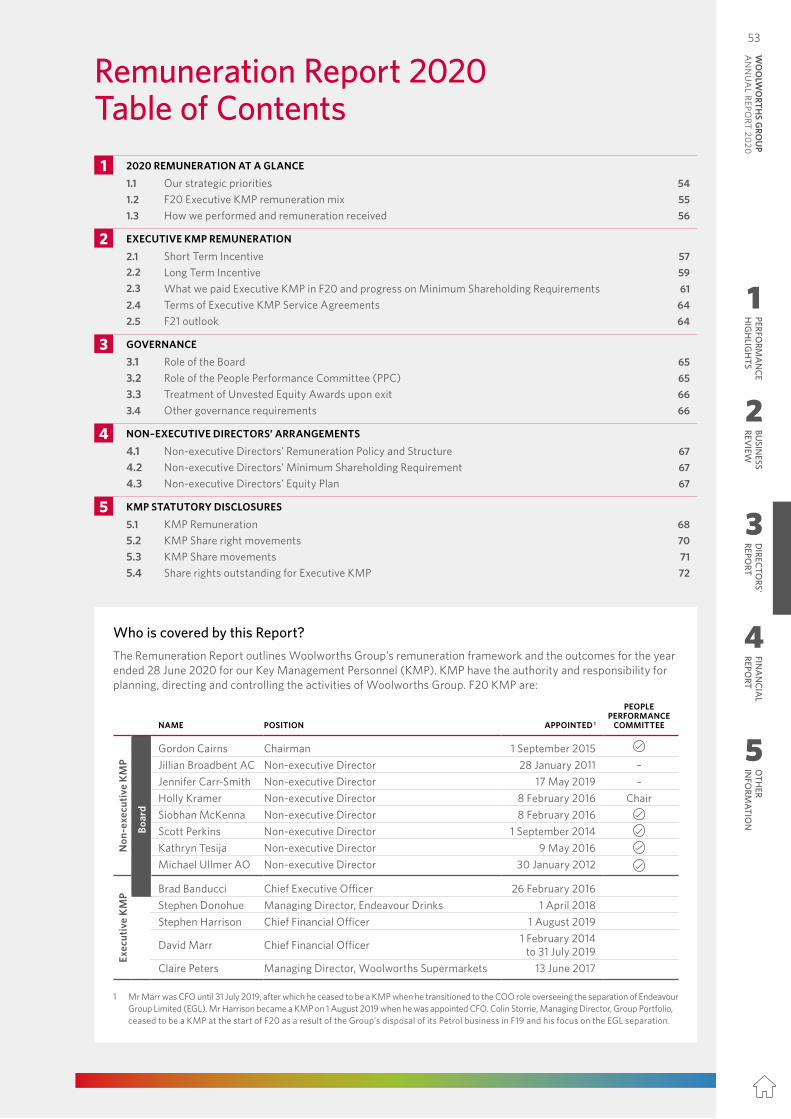
Dear Shareholder,
F20 has been a year like no other in recent memory. Woolworths Group team members have been, like many of you, at the front line of droughts and bushfires in Australia, the devastating volcanic eruption in New Zealand, protests in cities across the globe, and as I write today, the global COVID-19 pandemic. In the face of these challenges, the efforts of our team have been extraordinary.
In June we announced our Better Together Recognition Award to thank and reward those of our team not eligible for existing variable reward schemes. In doing so, we created the largest employee share ownership plan in Australia and New Zealand, covering more than 106,000 team members, many of whom became shareholders for the first time. We believe this demonstrates an aligned remuneration outcome in its truest form: recognition for outstanding contributions that reflect the interests of our team and shareholders alike.
F20 Reward outcomes: Short Term Incentive (STI) and COVID-19 responseThe pandemic, in particular, created significant volatility across our business. Supermarket sales rose, offset by substantial investments in store safety and supply chain, and the temporary closure of the ALH venues adversely affected Group sales and profitability. These events had the potential to deliver STI outcomes that were more a reflection of uncontrollable circumstances than business and management performance.
Given the extraordinary impact of these events, the Board decided to award all Australian team members who participate in the STI plan the same scorecard result of 80% across all business and functional areas. The actual scorecard outcome incorporating all COVID-19 impacts was 104%, with the gap between the two amounts used to help fund the Better Together Recognition Award. The leaders in our business recommended this approach to express thanks to the front-line team members for their efforts this year. These special awards granted non-STI eligible permanent team members up to $750 of Woolworths Group shares and a $250 gift card to be spent in any Woolworths Group store. We also gave a $100 gift card to over 53,000 of our casual team.
F20 Reward outcomes: Underpayment of salaried team membersAs announced in October 2019, it was identified that Woolworths had inadvertently underpaid some of our salaried team members over a number of years. The Chairman and Chief Executive Officer (CEO) took accountability for this disappointing situation. The Chair reduced his fees by 20% for F20 and the CEO voluntarily forfeited his full STI for F20. The Chief People Officer (CPO) also voluntarily forfeited her full STI for F20. The Board conducted an investigation which revealed that the underpayments were the result of multiple points of failure across the organisation over a period of many years. As a result, the Group Executive Committee will collectively receive a 10 percentage point reduction in the STI result to 70% for F20. Further, the in-year remediation costs were applied against the ROFE measure in the F18-20 Transformation Incentive Plan (TIP) which did not meet entry performance for vesting.
F20 Reward outcomes: Transformation Incentive PlanThe second of the two three-year awards made under the TIP was assessed for vesting in July 2020. As a result of sustained progress on the Group’s transformation over this period, 64.3% of performance rights have vested with an aggregate outcome of between target and stretch. The Board is especially pleased with the significant value that the team has delivered to our shareholders over this period, with Total Shareholder Return (TSR) of 59.4%, including share price appreciation of 43.2% since July 2018, ranking Woolworths Group at the 86th percentile of our comparator group.
In summaryReflecting on F20, the Board feels immense pride at the unity, compassion and commitment demonstrated by our team members in serving our customers and communities. From a remuneration perspective, we have tailored our approach to fit the times and to deliver outcomes that reflect not only performance but also fairness and recognition of a truly collective team effort. At all times, and in all our actions, we have aimed to live up to the high standards expected of our team. I hope you will agree that we have struck the right balance in what has been a complex and memorable year.
Holly Kramer Chair – People Performance Committee
Remuneration Report
The report has been prepared and audited against the disclosure requirements of the Corporations Act 2001 (Cth).
52
1 2020 REMUNERATION AT A GLANCE
1.1 Our strategic priorities 541.2 F20 Executive KMP remuneration mix 551.3 How we performed and remuneration received 56
2 EXECUTIVE KMP REMUNERATION
2.1 Short Term Incentive 572.2 Long Term Incentive 592.3 What we paid Executive KMP in F20 and progress on Minimum Shareholding Requirements 612.4 Terms of Executive KMP Service Agreements 642.5 F21 outlook 64
3 GOVERNANCE
3.1 Role of the Board 653.2 Role of the People Performance Committee (PPC) 653.3 Treatment of Unvested Equity Awards upon exit 663.4 Other governance requirements 66
4 NON–EXECUTIVE DIRECTORS’ ARRANGEMENTS
4.1 Non-executive Directors’ Remuneration Policy and Structure 674.2 Non-executive Directors’ Minimum Shareholding Requirement 674.3 Non-executive Directors’ Equity Plan 67
5 KMP STATUTORY DISCLOSURES
5.1 KMP Remuneration 685.2 KMP Share right movements 705.3 KMP Share movements 715.4 Share rights outstanding for Executive KMP 72
Who is covered by this Report?The Remuneration Report outlines Woolworths Group’s remuneration framework and the outcomes for the year ended 28 June 2020 for our Key Management Personnel (KMP). KMP have the authority and responsibility for planning, directing and controlling the activities of Woolworths Group. F20 KMP are:
NAME POSITION APPOINTED 1
PEOPLE PERFORMANCE
COMMITTEE
Non
-exe
cutiv
e K
MP
Boar
d
Gordon Cairns Chairman 1 September 2015Jillian Broadbent AC Non-executive Director 28 January 2011 –Jennifer Carr-Smith Non-executive Director 17 May 2019 –Holly Kramer Non-executive Director 8 February 2016 ChairSiobhan McKenna Non-executive Director 8 February 2016Scott Perkins Non-executive Director 1 September 2014Kathryn Tesija Non-executive Director 9 May 2016Michael Ullmer AO Non-executive Director 30 January 2012
Exec
utiv
e K
MP Brad Banducci Chief Executive Officer 26 February 2016
Stephen Donohue Managing Director, Endeavour Drinks 1 April 2018Stephen Harrison Chief Financial Officer 1 August 2019
David Marr Chief Financial Officer 1 February 2014 to 31 July 2019
Claire Peters Managing Director, Woolworths Supermarkets 13 June 2017
1 Mr Marr was CFO until 31 July 2019, after which he ceased to be a KMP when he transitioned to the COO role overseeing the separation of Endeavour Group Limited (EGL). Mr Harrison became a KMP on 1 August 2019 when he was appointed CFO. Colin Storrie, Managing Director, Group Portfolio, ceased to be a KMP at the start of F20 as a result of the Group’s disposal of its Petrol business in F19 and his focus on the EGL separation.
Remuneration Report 2020 Table of Contents
1
2
3
4
5
PERFORM
AN
CEH
IGH
LIGH
TSBU
SINESS
REVIEW
DIRECTO
RS' REPO
RTFIN
AN
CIAL
REPORT
OTH
ER IN
FORM
ATION
53W
OO
LWO
RTHS G
ROU
P A
NN
UA
L REPORT 2020
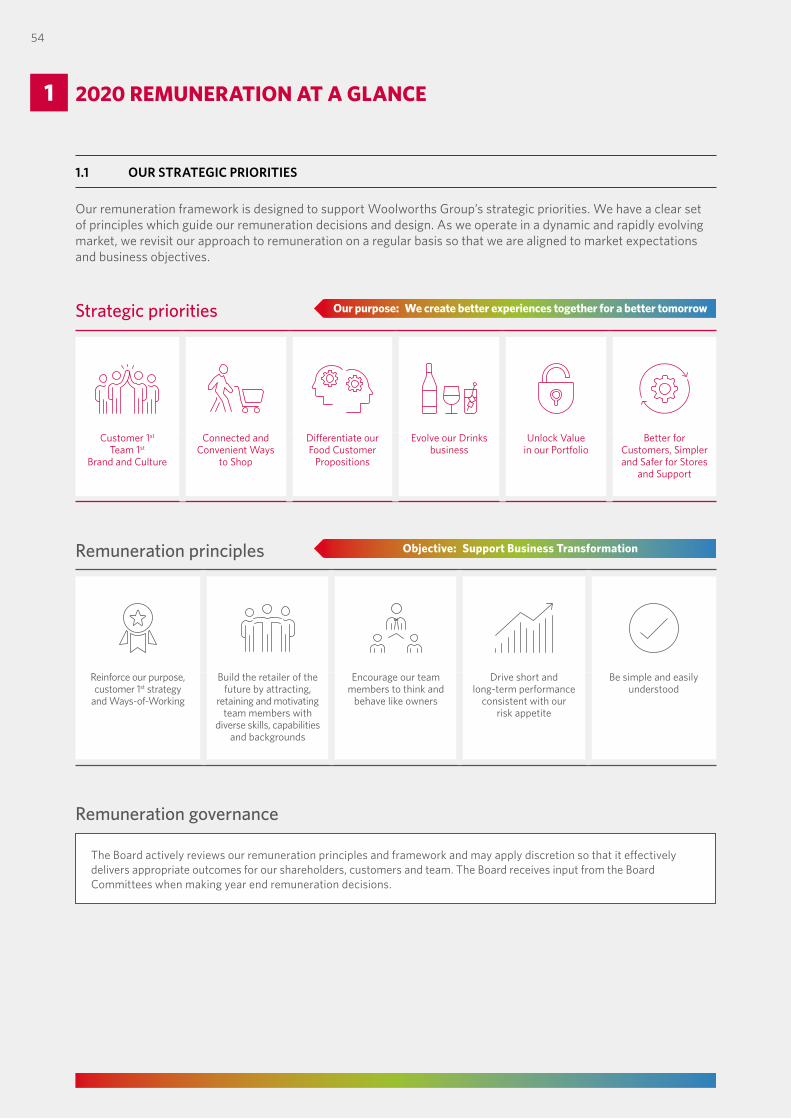
1 2020 REMUNERATION AT A GLANCE
Strategic priorities
Remuneration governance
Remuneration principles
Our purpose: We create better experiences together for a better tomorrow
Objective: Support Business Transformation
The Board actively reviews our remuneration principles and framework and may apply discretion so that it effectively delivers appropriate outcomes for our shareholders, customers and team. The Board receives input from the Board Committees when making year end remuneration decisions.
Our remuneration framework is designed to support Woolworths Group’s strategic priorities. We have a clear set of principles which guide our remuneration decisions and design. As we operate in a dynamic and rapidly evolving market, we revisit our approach to remuneration on a regular basis so that we are aligned to market expectations and business objectives.
Customer 1st Team 1st
Brand and Culture
Connected and Convenient Ways
to Shop
Differentiate our Food Customer
Propositions
Evolve our Drinks business
Unlock Value in our Portfolio
Better for Customers, Simpler and Safer for Stores
and Support
Reinforce our purpose, customer 1st strategy
and Ways-of-Working
Build the retailer of the future by attracting,
retaining and motivating team members with
diverse skills, capabilities and backgrounds
Encourage our team members to think and
behave like owners
Drive short and long-term performance
consistent with our risk appetite
Be simple and easily understood
1.1 OUR STRATEGIC PRIORITIES
54
Remuneration framework Our Remuneration Framework Supports the Group Strategy
Total Fixed Remuneration (TFR)TFR consists of Base Salary, Superannuation and Car Allowance
TFR is set in relation to the external market and considers:• Strategic value of the role.• Size and complexity of the role.• Individual responsibilities.• Experience and skills.
TFR is positioned so that Total Target Remuneration (TTR) is around median of our Comparator Group, which includes the ASX25 plus additional reference as required to major national and international retailers. Generally, executives who are new to role will start on a TTR package below median, and move up to median as they develop skills and experience in the role.
Short Term Incentive (STI)50% of the STI is delivered in cash and the remaining 50% is deferred in share rights for two years
Business performance is measured through a STI balanced scorecard, with 60% weighted on financial objectives and 40% on non-financial objectives: • Sales (20%). • Earnings Before Interest and Tax
(EBIT) (20%).• Average Inventory Days (20%).• Customer Satisfaction (20%).• Safety (20%).
Individual performance includes assessment against business, strategic and Ways-of-Working goals.
Long Term Incentive (LTI)Performance rights vesting after three years
The LTI aligns executives to overall company performance through three equally weighted measures focused on strategic business drivers and long term shareholder return:• Relative Total Shareholder
Return (rTSR). • Sales Per Square Metre
(Sales/SQM).• Return on Funds Employed
(ROFE).
1.2 F20 EXECUTIVE KMP REMUNERATION MIX
What is the remuneration mix for Executive KMP?
The remuneration mix for Executive KMP is weighted towards variable remuneration. In the Total Target Mix, 67% of the remuneration is performance-based pay, and 50% of total remuneration is delivered as deferred equity for on-target performance.
TOTAL TARGET MIX Performance based
Total Fixed Remuneration 33.4% Target STI 33.3% (100% of TFR) Target LTI 33.3% (100% of TFR)
Cash 16.65%
Deferred16.65%
Relative TSR with 11.1%
Sales per square metre
11.1%ROFE 11.1%
TOTAL MAXIMUM MIX Performance based
Total Fixed Remuneration 23.8% Maximum STI 35.7% (150% of TFR) Maximum LTI 40.5% (170% of TFR)
Cash 17.86%
Deferred17.86%
Relative TSR with
13.5%Sales per square
metre 13.5%ROFE 13.5%
1.1 OUR STRATEGIC PRIORITIES
2020 REMUNERATION AT A GLANCE 1
1
2
3
4
5
PERFORM
AN
CEH
IGH
LIGH
TSBU
SINESS
REVIEW
DIRECTO
RS' REPO
RTFIN
AN
CIAL
REPORT
OTH
ER IN
FORM
ATION
55
WO
OLW
ORTH
S GRO
UP
AN
NU
AL REPO
RT 2020
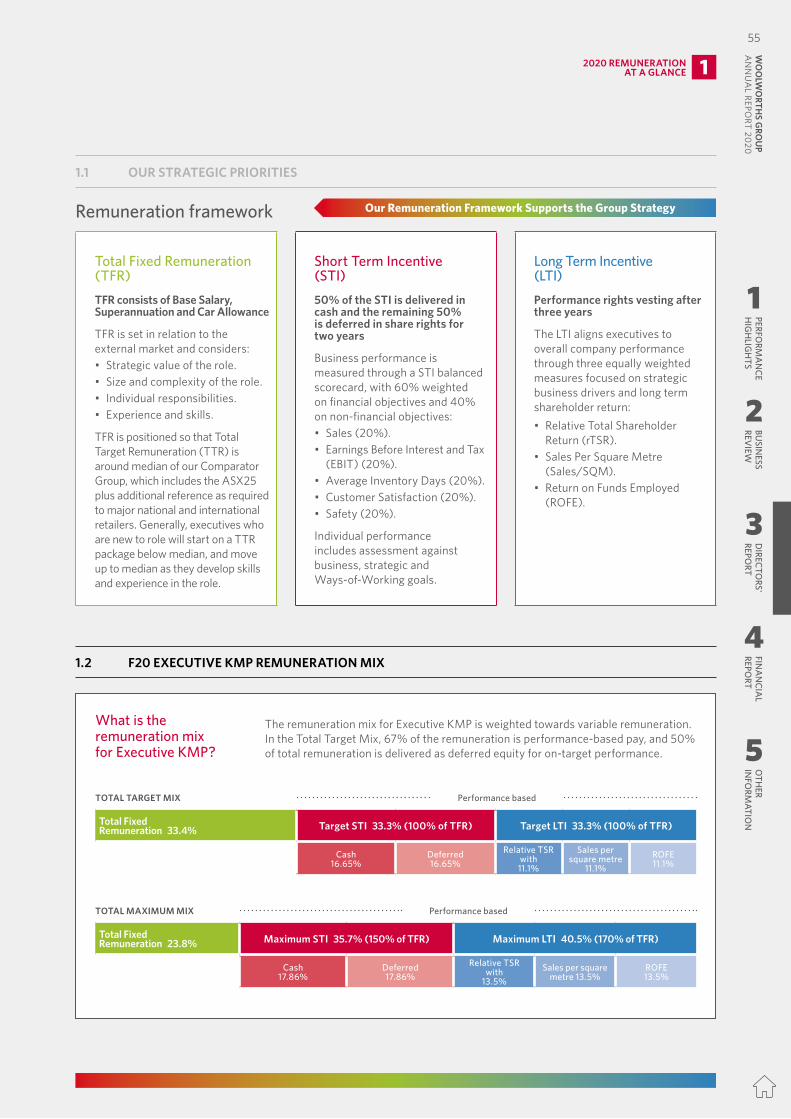
1 2020 REMUNERATION AT A GLANCE
Strategic priorities
Remuneration governance
Remuneration principles
Our purpose: We create better experiences together for a better tomorrow
Objective: Support Business Transformation
The Board actively reviews our remuneration principles and framework and may apply discretion so that it effectively delivers appropriate outcomes for our shareholders, customers and team. The Board receives input from the Board Committees when making year end remuneration decisions.
Our remuneration framework is designed to support Woolworths Group’s strategic priorities. We have a clear set of principles which guide our remuneration decisions and design. As we operate in a dynamic and rapidly evolving market, we revisit our approach to remuneration on a regular basis so that we are aligned to market expectations and business objectives.
Customer 1st Team 1st
Brand and Culture
Connected and Convenient Ways
to Shop
Differentiate our Food Customer
Propositions
Evolve our Drinks business
Unlock Value in our Portfolio
Better for Customers, Simpler and Safer for Stores
and Support
Reinforce our purpose, customer 1st strategy
and Ways-of-Working
Build the retailer of the future by attracting,
retaining and motivating team members with
diverse skills, capabilities and backgrounds
Encourage our team members to think and
behave like owners
Drive short and long-term performance
consistent with our risk appetite
Be simple and easily understood
1.1 OUR STRATEGIC PRIORITIES
54
Remuneration framework Our Remuneration Framework Supports the Group Strategy
Total Fixed Remuneration (TFR)TFR consists of Base Salary, Superannuation and Car Allowance
TFR is set in relation to the external market and considers:• Strategic value of the role.• Size and complexity of the role.• Individual responsibilities.• Experience and skills.
TFR is positioned so that Total Target Remuneration (TTR) is around median of our Comparator Group, which includes the ASX25 plus additional reference as required to major national and international retailers. Generally, executives who are new to role will start on a TTR package below median, and move up to median as they develop skills and experience in the role.
Short Term Incentive (STI)50% of the STI is delivered in cash and the remaining 50% is deferred in share rights for two years
Business performance is measured through a STI balanced scorecard, with 60% weighted on financial objectives and 40% on non-financial objectives: • Sales (20%). • Earnings Before Interest and Tax
(EBIT) (20%).• Average Inventory Days (20%).• Customer Satisfaction (20%).• Safety (20%).
Individual performance includes assessment against business, strategic and Ways-of-Working goals.
Long Term Incentive (LTI)Performance rights vesting after three years
The LTI aligns executives to overall company performance through three equally weighted measures focused on strategic business drivers and long term shareholder return:• Relative Total Shareholder
Return (rTSR). • Sales Per Square Metre
(Sales/SQM).• Return on Funds Employed
(ROFE).
1.2 F20 EXECUTIVE KMP REMUNERATION MIX
What is the remuneration mix for Executive KMP?
The remuneration mix for Executive KMP is weighted towards variable remuneration. In the Total Target Mix, 67% of the remuneration is performance-based pay, and 50% of total remuneration is delivered as deferred equity for on-target performance.
TOTAL TARGET MIX Performance based
Total Fixed Remuneration 33.4% Target STI 33.3% (100% of TFR) Target LTI 33.3% (100% of TFR)
Cash 16.65%
Deferred16.65%
Relative TSR with 11.1%
Sales per square metre
11.1%ROFE 11.1%
TOTAL MAXIMUM MIX Performance based
Total Fixed Remuneration 23.8% Maximum STI 35.7% (150% of TFR) Maximum LTI 40.5% (170% of TFR)
Cash 17.86%
Deferred17.86%
Relative TSR with
13.5%Sales per square
metre 13.5%ROFE 13.5%
1.1 OUR STRATEGIC PRIORITIES
2020 REMUNERATION AT A GLANCE 1
1
2
3
4
5
PERFORM
AN
CEH
IGH
LIGH
TSBU
SINESS
REVIEW
DIRECTO
RS' REPO
RTFIN
AN
CIAL
REPORT
OTH
ER IN
FORM
ATION
55W
OO
LWO
RTHS G
ROU
P A
NN
UA
L REPORT 2020
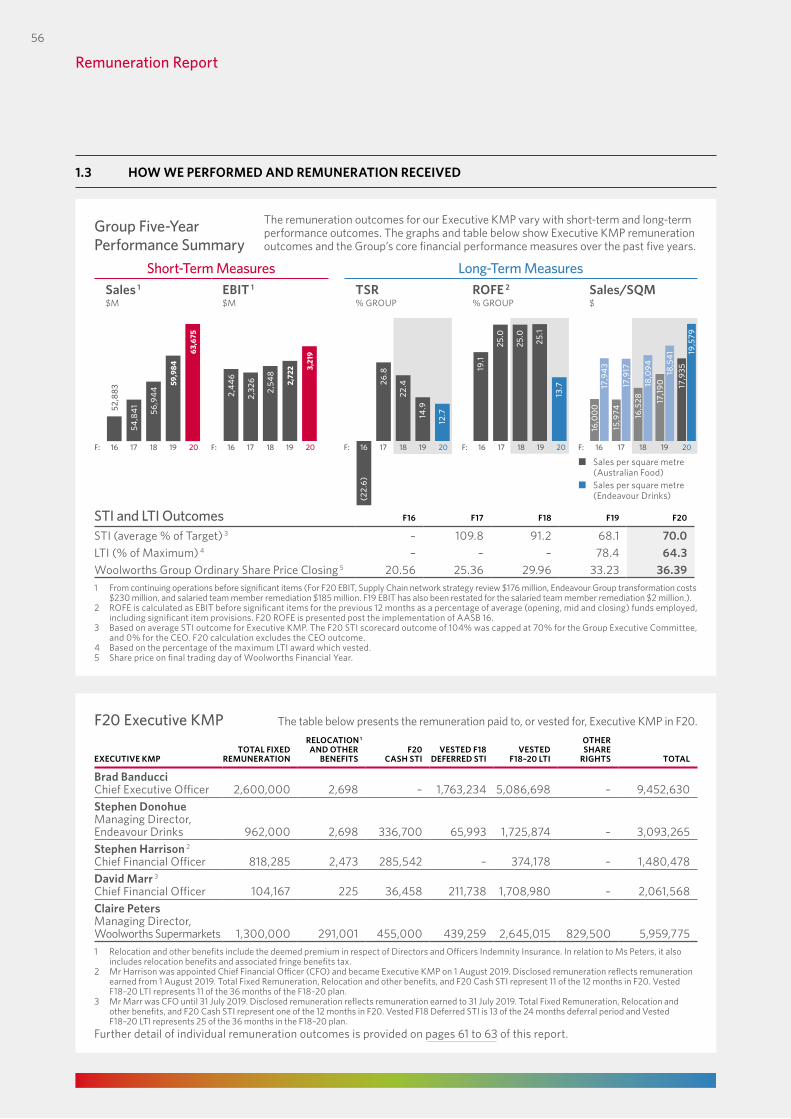
1.3 HOW WE PERFORMED AND REMUNERATION RECEIVED
Group Five-Year Performance Summary
The remuneration outcomes for our Executive KMP vary with short-term and long-term performance outcomes. The graphs and table below show Executive KMP remuneration outcomes and the Group’s core financial performance measures over the past five years.
Short-Term Measures Long-Term MeasuresSales 1 $M
EBIT 1 $M
TSR % GROUP
ROFE 2 % GROUP
Sales/SQM $
3,97
32,
446
2,32
6
2,54
8
3,21
9
2,72
2
52,8
83
56,9
44
63,6
75
59,9
84
54,8
41
(22.
6)
26.8
22.4
12.714
.9
16,0
0017
,943
15,9
7417
,917
16,5
2818
,094
17,9
3519
,579
17,19
018
,541
13.7
25.1
25.0
19.1
25.0
2019181716F: 2019181716F: 2019181716F: 2019181716F: 2019181716F:
3,97
32,
446
2,32
6
2,54
8
3,21
9
2,72
2
52,8
83
56,9
44
63,6
75
59,9
84
54,8
41
(22.
6)
26.8
22.4
12.714
.9
16,0
0017
,943
15,9
7417
,917
16,5
2818
,094
17,9
3519
,579
17,19
018
,541
13.7
25.1
25.0
19.1
25.0
2019181716F: 2019181716F: 2019181716F: 2019181716F: 2019181716F:
3,97
32,
446
2,32
6
2,54
8
3,21
9
2,72
2
52,8
83
56,9
44
63,6
75
59,9
84
54,8
41
(22.
6)
26.8
22.4
12.714
.9
16,0
0017
,943
15,9
7417
,917
16,5
2818
,094
17,9
3519
,579
17,19
018
,541
13.7
25.1
25.0
19.1
25.0
2019181716F: 2019181716F: 2019181716F: 2019181716F: 2019181716F:
3,97
32,
446
2,32
6
2,54
8
3,21
9
2,72
2
52,8
83
56,9
44
63,6
75
59,9
84
54,8
41
(22.
6)
26.8
22.4
12.714
.9
16,0
0017
,943
15,9
7417
,917
16,5
2818
,094
17,9
3519
,579
17,19
018
,541
13.7
25.1
25.0
19.1
25.0
2019181716F: 2019181716F: 2019181716F: 2019181716F: 2019181716F:
3,97
32,
446
2,32
6
2,54
8
3,21
9
2,72
2
52,8
83
56,9
44
63,6
75
59,9
84
54,8
41
(22.
6)
26.8
22.4
12.714
.9
16,0
0017
,943
15,9
7417
,917
16,5
2818
,094
17,9
3519
,579
17,19
018
,541
13.7
25.1
25.0
19.1
25.0
2019181716F: 2019181716F: 2019181716F: 2019181716F: 2019181716F: ¢ Sales per square metre
(Australian Food) ¢ Sales per square metre
(Endeavour Drinks)
STI and LTI Outcomes F16 F17 F18 F19 F20
STI (average % of Target) 3 – 109.8 91.2 68.1 70.0LTI (% of Maximum) 4 – – – 78.4 64.3Woolworths Group Ordinary Share Price Closing 5 20.56 25.36 29.96 33.23 36.391 From continuing operations before significant items (For F20 EBIT, Supply Chain network strategy review $176 million, Endeavour Group transformation costs
$230 million, and salaried team member remediation $185 million. F19 EBIT has also been restated for the salaried team member remediation $2 million.). 2 ROFE is calculated as EBIT before significant items for the previous 12 months as a percentage of average (opening, mid and closing) funds employed,
including significant item provisions. F20 ROFE is presented post the implementation of AASB 16.3 Based on average STI outcome for Executive KMP. The F20 STI scorecard outcome of 104% was capped at 70% for the Group Executive Committee,
and 0% for the CEO. F20 calculation excludes the CEO outcome.4 Based on the percentage of the maximum LTI award which vested.5 Share price on final trading day of Woolworths Financial Year.
F20 Executive KMP The table below presents the remuneration paid to, or vested for, Executive KMP in F20.
EXECUTIVE KMPTOTAL FIXED
REMUNERATION
RELOCATION 1
AND OTHER BENEFITS
F20 CASH STI
VESTED F18 DEFERRED STI
VESTED F18–20 LTI
OTHER SHARE
RIGHTS TOTAL
Brad BanducciChief Executive Officer 2,600,000 2,698 – 1,763,234 5,086,698 – 9,452,630 Stephen Donohue Managing Director, Endeavour Drinks 962,000 2,698 336,700 65,993 1,725,874 – 3,093,265 Stephen Harrison 2 Chief Financial Officer 818,285 2,473 285,542 – 374,178 – 1,480,478 David Marr 3
Chief Financial Officer 104,167 225 36,458 211,738 1,708,980 – 2,061,568 Claire Peters Managing Director, Woolworths Supermarkets 1,300,000 291,001 455,000 439,259 2,645,015 829,500 5,959,775 1 Relocation and other benefits include the deemed premium in respect of Directors and Officers Indemnity Insurance. In relation to Ms Peters, it also
includes relocation benefits and associated fringe benefits tax.2 Mr Harrison was appointed Chief Financial Officer (CFO) and became Executive KMP on 1 August 2019. Disclosed remuneration reflects remuneration
earned from 1 August 2019. Total Fixed Remuneration, Relocation and other benefits, and F20 Cash STI represent 11 of the 12 months in F20. Vested F18–20 LTI represents 11 of the 36 months of the F18–20 plan.
3 Mr Marr was CFO until 31 July 2019. Disclosed remuneration reflects remuneration earned to 31 July 2019. Total Fixed Remuneration, Relocation and other benefits, and F20 Cash STI represent one of the 12 months in F20. Vested F18 Deferred STI is 13 of the 24 months deferral period and Vested F18–20 LTI represents 25 of the 36 months in the F18–20 plan.
Further detail of individual remuneration outcomes is provided on pages 61 to 63 of this report.
Remuneration Report
56
2 EXECUTIVE KMP REMUNERATION
2.1 SHORT TERM INCENTIVE
Our approach and rationale: Short Term Incentive
We believe that alignment of our STI arrangements from the CEO through to our store teams is a key symbol of our Customer 1st Team 1st Brand and Culture approach to transforming our business. Individual STI outcomes reflect business performance against the STI scorecard and individual contribution to these results, including our Ways-of-Working. The Board also reviews executive behaviour and any Malus policy considerations when determining STI outcomes for executive KMP. All measures and targets are reviewed annually so that STI drives the right outcomes each year.
Assessing business performance:The STI balanced scorecard includes a mix of metrics, with 60% weighting on financial metrics and 40% weighting on non-financial metrics. Five equally weighted business scorecard measures drive outcomes for shareholders, customers and our team:
¢ Sales ¢ EBIT
¢ Average Inventory Days ¢ Customer Satisfaction ¢ Safety plus individual performance
Customer Satisfaction with 30% weighting to OnlineOur strategy is underpinned by great customer experiences and success is dependent on us delivering convenient ways to shop and competitive prices for our customers so they continue to choose us over our competitors. Our online platforms are key to delivering new and improved ways customers can shop with us. Customer feedback measures include Net Promoter Score (NPS) to better measure progress against our ambition to deliver ‘consistently good’ shopping experiences. We use Voice of Customer (VOC) and NPS methodology weighted 30% to our online customers and 70% to our in-store customers to measure overall customer satisfaction.
Safety We are a people business and the safety of our team and customers is of great importance. Safety performance is measured using three equally weighted measures, which includes improvement in: (i) customer claims; (ii) total recordable (team member) injuries; and (iii) hours lost. We measure the number of injuries as opposed to frequency rates so that our measures are easier to understand and communicate. Hours lost is included in the overall safety performance to help us understand both the frequency and severity of injuries.
Sales, EBIT and Average Inventory DaysIt is critical for the success of our business to constantly work towards improving not only the efficiency of our team, but the productivity of store selling space and inventory management. Sales, EBIT and Average Inventory Days performance combine to support strong financial performance for our shareholders.
Assessing individual performance:Three equally weighted categories of goals are used to review performance:• Business strategy goals capture how individuals
contribute to the initiatives that will transform our business for the future.
• Ways-of-Working and people goals capture how business and strategic goals have been delivered, and how leaders set their teams up for success.
• Business performance goals capture how individuals contribute to the performance of the business within the year.
The Board also has discretion to adjust the vesting of Deferred STI (DSTI) for individuals, which may be reduced (including to zero) if there have been cases of behaviour inconsistent with our Core Values or Ways-of-Working (see Malus policy on page 66). These would be the most serious of cases that would not have been adequately dealt with through normal performance management or consequence frameworks.
Delivering STI outcomes:Depending on business and individual performance:• Zero for below entry performance.• 50% of STI target for entry performance.• 100% of STI target for target performance.• 150% of STI target for stretch performance.This gives the Board sufficient opportunity to vary STI outcomes so they reflect differing levels of performance. The Board also has discretion to vary STI awards due to factors that are beyond these performance measures so that rewards appropriately reflect complete performance.Group Executive STI awards are delivered:• 50% as cash.• 50% deferred in share rights for two years.The 50% deferred component supports increased share ownership and is a risk management lever to facilitate Malus policy application during the deferral period.
EXECUTIVE KMP REMUNERATION 2
1
2
3
4
5
PERFORM
AN
CEH
IGH
LIGH
TSBU
SINESS
REVIEW
DIRECTO
RS' REPO
RTFIN
AN
CIAL
REPORT
OTH
ER IN
FORM
ATION
57
WO
OLW
ORTH
S GRO
UP
AN
NU
AL REPO
RT 2020
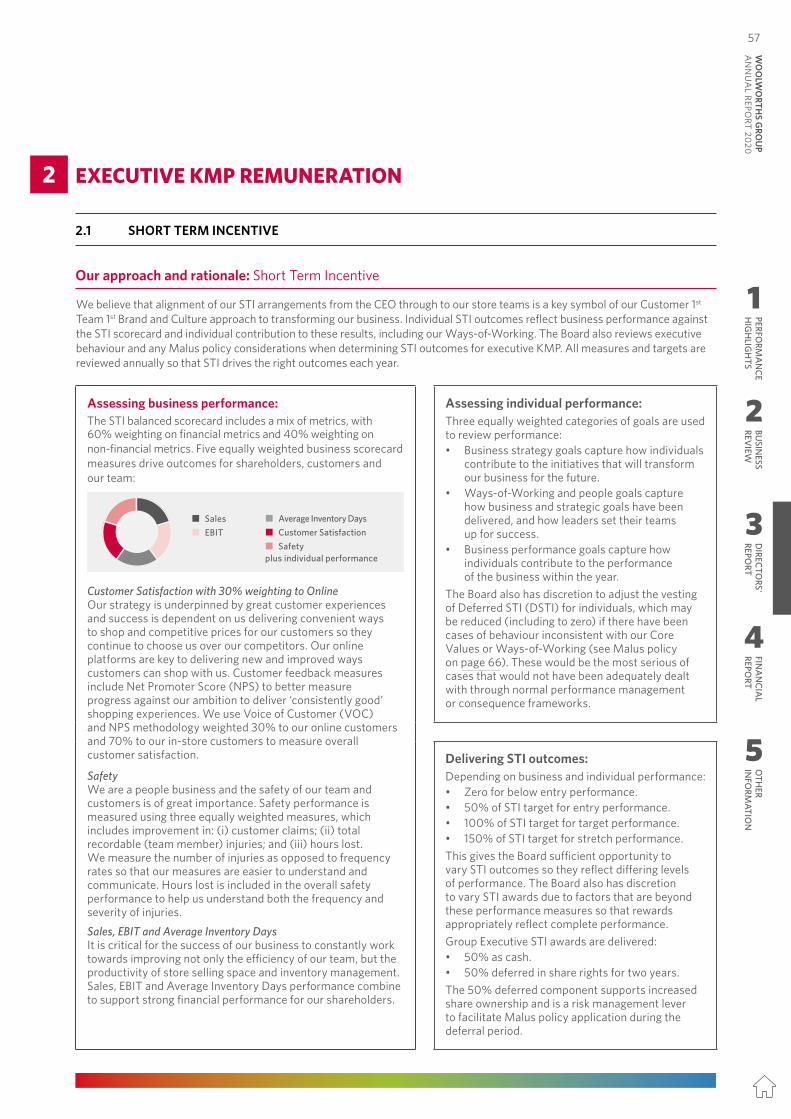
1.3 HOW WE PERFORMED AND REMUNERATION RECEIVED
Group Five-Year Performance Summary
The remuneration outcomes for our Executive KMP vary with short-term and long-term performance outcomes. The graphs and table below show Executive KMP remuneration outcomes and the Group’s core financial performance measures over the past five years.
Short-Term Measures Long-Term MeasuresSales 1 $M
EBIT 1 $M
TSR % GROUP
ROFE 2 % GROUP
Sales/SQM $
3,97
32,
446
2,32
6
2,54
8
3,21
9
2,72
2
52,8
83
56,9
44
63,6
75
59,9
84
54,8
41
(22.
6)
26.8
22.4
12.714
.9
16,0
0017
,943
15,9
7417
,917
16,5
2818
,094
17,9
3519
,579
17,19
018
,541
13.7
25.1
25.0
19.1
25.0
2019181716F: 2019181716F: 2019181716F: 2019181716F: 2019181716F:
3,97
32,
446
2,32
6
2,54
8
3,21
9
2,72
2
52,8
83
56,9
44
63,6
75
59,9
84
54,8
41
(22.
6)
26.8
22.4
12.714
.9
16,0
0017
,943
15,9
7417
,917
16,5
2818
,094
17,9
3519
,579
17,19
018
,541
13.7
25.1
25.0
19.1
25.0
2019181716F: 2019181716F: 2019181716F: 2019181716F: 2019181716F:
3,97
32,
446
2,32
6
2,54
8
3,21
9
2,72
2
52,8
83
56,9
44
63,6
75
59,9
84
54,8
41
(22.
6)
26.8
22.4
12.714
.9
16,0
0017
,943
15,9
7417
,917
16,5
2818
,094
17,9
3519
,579
17,19
018
,541
13.7
25.1
25.0
19.1
25.0
2019181716F: 2019181716F: 2019181716F: 2019181716F: 2019181716F:
3,97
32,
446
2,32
6
2,54
8
3,21
9
2,72
2
52,8
83
56,9
44
63,6
75
59,9
84
54,8
41
(22.
6)
26.8
22.4
12.714
.9
16,0
0017
,943
15,9
7417
,917
16,5
2818
,094
17,9
3519
,579
17,19
018
,541
13.7
25.1
25.0
19.1
25.0
2019181716F: 2019181716F: 2019181716F: 2019181716F: 2019181716F:
3,97
32,
446
2,32
6
2,54
8
3,21
9
2,72
2
52,8
83
56,9
44
63,6
75
59,9
84
54,8
41
(22.
6)
26.8
22.4
12.714
.9
16,0
0017
,943
15,9
7417
,917
16,5
2818
,094
17,9
3519
,579
17,19
018
,541
13.7
25.1
25.0
19.1
25.0
2019181716F: 2019181716F: 2019181716F: 2019181716F: 2019181716F: ¢ Sales per square metre
(Australian Food) ¢ Sales per square metre
(Endeavour Drinks)
STI and LTI Outcomes F16 F17 F18 F19 F20
STI (average % of Target) 3 – 109.8 91.2 68.1 70.0LTI (% of Maximum) 4 – – – 78.4 64.3Woolworths Group Ordinary Share Price Closing 5 20.56 25.36 29.96 33.23 36.391 From continuing operations before significant items (For F20 EBIT, Supply Chain network strategy review $176 million, Endeavour Group transformation costs
$230 million, and salaried team member remediation $185 million. F19 EBIT has also been restated for the salaried team member remediation $2 million.). 2 ROFE is calculated as EBIT before significant items for the previous 12 months as a percentage of average (opening, mid and closing) funds employed,
including significant item provisions. F20 ROFE is presented post the implementation of AASB 16.3 Based on average STI outcome for Executive KMP. The F20 STI scorecard outcome of 104% was capped at 70% for the Group Executive Committee,
and 0% for the CEO. F20 calculation excludes the CEO outcome.4 Based on the percentage of the maximum LTI award which vested.5 Share price on final trading day of Woolworths Financial Year.
F20 Executive KMP The table below presents the remuneration paid to, or vested for, Executive KMP in F20.
EXECUTIVE KMPTOTAL FIXED
REMUNERATION
RELOCATION 1
AND OTHER BENEFITS
F20 CASH STI
VESTED F18 DEFERRED STI
VESTED F18–20 LTI
OTHER SHARE
RIGHTS TOTAL
Brad BanducciChief Executive Officer 2,600,000 2,698 – 1,763,234 5,086,698 – 9,452,630 Stephen Donohue Managing Director, Endeavour Drinks 962,000 2,698 336,700 65,993 1,725,874 – 3,093,265 Stephen Harrison 2 Chief Financial Officer 818,285 2,473 285,542 – 374,178 – 1,480,478 David Marr 3
Chief Financial Officer 104,167 225 36,458 211,738 1,708,980 – 2,061,568 Claire Peters Managing Director, Woolworths Supermarkets 1,300,000 291,001 455,000 439,259 2,645,015 829,500 5,959,775 1 Relocation and other benefits include the deemed premium in respect of Directors and Officers Indemnity Insurance. In relation to Ms Peters, it also
includes relocation benefits and associated fringe benefits tax.2 Mr Harrison was appointed Chief Financial Officer (CFO) and became Executive KMP on 1 August 2019. Disclosed remuneration reflects remuneration
earned from 1 August 2019. Total Fixed Remuneration, Relocation and other benefits, and F20 Cash STI represent 11 of the 12 months in F20. Vested F18–20 LTI represents 11 of the 36 months of the F18–20 plan.
3 Mr Marr was CFO until 31 July 2019. Disclosed remuneration reflects remuneration earned to 31 July 2019. Total Fixed Remuneration, Relocation and other benefits, and F20 Cash STI represent one of the 12 months in F20. Vested F18 Deferred STI is 13 of the 24 months deferral period and Vested F18–20 LTI represents 25 of the 36 months in the F18–20 plan.
Further detail of individual remuneration outcomes is provided on pages 61 to 63 of this report.
Remuneration Report
56
2 EXECUTIVE KMP REMUNERATION
2.1 SHORT TERM INCENTIVE
Our approach and rationale: Short Term Incentive
We believe that alignment of our STI arrangements from the CEO through to our store teams is a key symbol of our Customer 1st Team 1st Brand and Culture approach to transforming our business. Individual STI outcomes reflect business performance against the STI scorecard and individual contribution to these results, including our Ways-of-Working. The Board also reviews executive behaviour and any Malus policy considerations when determining STI outcomes for executive KMP. All measures and targets are reviewed annually so that STI drives the right outcomes each year.
Assessing business performance:The STI balanced scorecard includes a mix of metrics, with 60% weighting on financial metrics and 40% weighting on non-financial metrics. Five equally weighted business scorecard measures drive outcomes for shareholders, customers and our team:
¢ Sales ¢ EBIT
¢ Average Inventory Days ¢ Customer Satisfaction ¢ Safety plus individual performance
Customer Satisfaction with 30% weighting to OnlineOur strategy is underpinned by great customer experiences and success is dependent on us delivering convenient ways to shop and competitive prices for our customers so they continue to choose us over our competitors. Our online platforms are key to delivering new and improved ways customers can shop with us. Customer feedback measures include Net Promoter Score (NPS) to better measure progress against our ambition to deliver ‘consistently good’ shopping experiences. We use Voice of Customer (VOC) and NPS methodology weighted 30% to our online customers and 70% to our in-store customers to measure overall customer satisfaction.
Safety We are a people business and the safety of our team and customers is of great importance. Safety performance is measured using three equally weighted measures, which includes improvement in: (i) customer claims; (ii) total recordable (team member) injuries; and (iii) hours lost. We measure the number of injuries as opposed to frequency rates so that our measures are easier to understand and communicate. Hours lost is included in the overall safety performance to help us understand both the frequency and severity of injuries.
Sales, EBIT and Average Inventory DaysIt is critical for the success of our business to constantly work towards improving not only the efficiency of our team, but the productivity of store selling space and inventory management. Sales, EBIT and Average Inventory Days performance combine to support strong financial performance for our shareholders.
Assessing individual performance:Three equally weighted categories of goals are used to review performance:• Business strategy goals capture how individuals
contribute to the initiatives that will transform our business for the future.
• Ways-of-Working and people goals capture how business and strategic goals have been delivered, and how leaders set their teams up for success.
• Business performance goals capture how individuals contribute to the performance of the business within the year.
The Board also has discretion to adjust the vesting of Deferred STI (DSTI) for individuals, which may be reduced (including to zero) if there have been cases of behaviour inconsistent with our Core Values or Ways-of-Working (see Malus policy on page 66). These would be the most serious of cases that would not have been adequately dealt with through normal performance management or consequence frameworks.
Delivering STI outcomes:Depending on business and individual performance:• Zero for below entry performance.• 50% of STI target for entry performance.• 100% of STI target for target performance.• 150% of STI target for stretch performance.This gives the Board sufficient opportunity to vary STI outcomes so they reflect differing levels of performance. The Board also has discretion to vary STI awards due to factors that are beyond these performance measures so that rewards appropriately reflect complete performance.Group Executive STI awards are delivered:• 50% as cash.• 50% deferred in share rights for two years.The 50% deferred component supports increased share ownership and is a risk management lever to facilitate Malus policy application during the deferral period.
EXECUTIVE KMP REMUNERATION 2
1
2
3
4
5
PERFORM
AN
CEH
IGH
LIGH
TSBU
SINESS
REVIEW
DIRECTO
RS' REPO
RTFIN
AN
CIAL
REPORT
OTH
ER IN
FORM
ATION
57W
OO
LWO
RTHS G
ROU
P A
NN
UA
L REPORT 2020
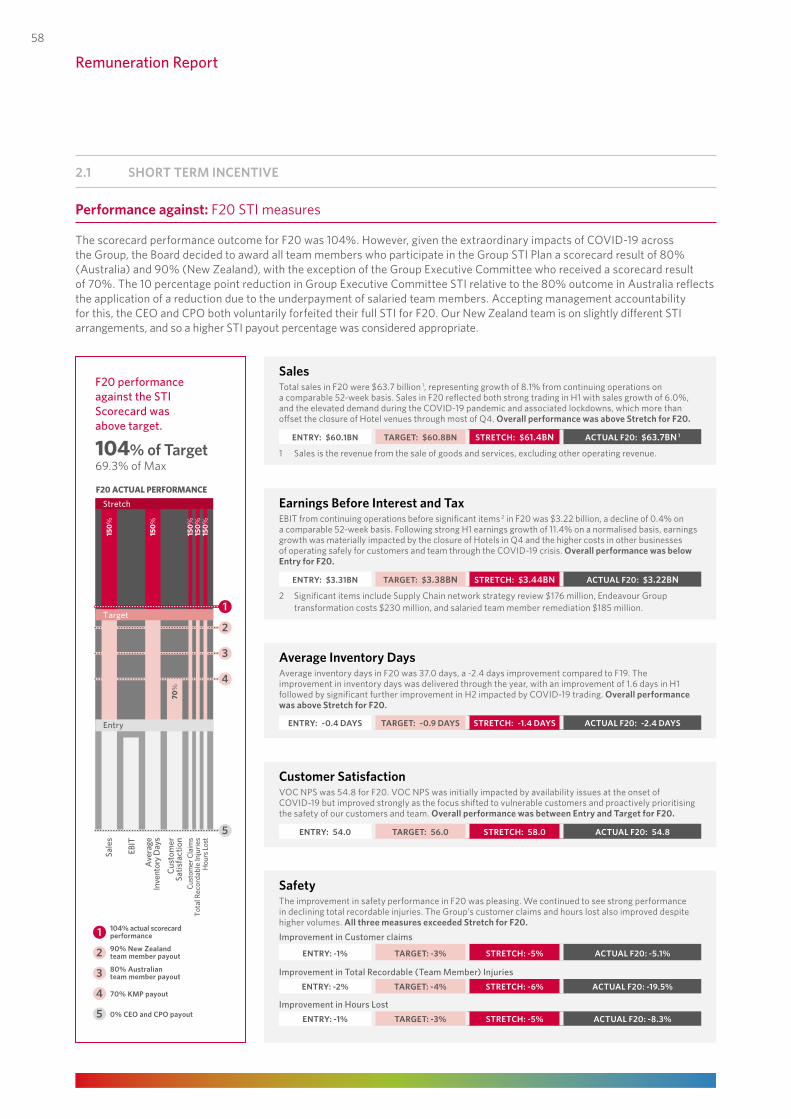
2.1 SHORT TERM INCENTIVE
F20 performance against the STI Scorecard was above target.
104% of Target 69.3% of Max
Average Inventory Days Average inventory days in F20 was 37.0 days, a -2.4 days improvement compared to F19. The improvement in inventory days was delivered through the year, with an improvement of 1.6 days in H1 followed by significant further improvement in H2 impacted by COVID-19 trading. Overall performance was above Stretch for F20.
ENTRY: -0.4 DAYS TARGET: -0.9 DAYS STRETCH: -1.4 DAYS ACTUAL F20: -2.4 DAYS
Earnings Before Interest and TaxEBIT from continuing operations before significant items 2 in F20 was $3.22 billion, a decline of 0.4% on a comparable 52-week basis. Following strong H1 earnings growth of 11.4% on a normalised basis, earnings growth was materially impacted by the closure of Hotels in Q4 and the higher costs in other businesses of operating safely for customers and team through the COVID-19 crisis. Overall performance was below Entry for F20.
ENTRY: $3.31BN TARGET: $3.38BN STRETCH: $3.44BN ACTUAL F20: $3.22BN
2 Significant items include Supply Chain network strategy review $176 million, Endeavour Group transformation costs $230 million, and salaried team member remediation $185 million.
SalesTotal sales in F20 were $63.7 billion 1, representing growth of 8.1% from continuing operations on a comparable 52-week basis. Sales in F20 reflected both strong trading in H1 with sales growth of 6.0%, and the elevated demand during the COVID-19 pandemic and associated lockdowns, which more than offset the closure of Hotel venues through most of Q4. Overall performance was above Stretch for F20.
ENTRY: $60.1BN TARGET: $60.8BN STRETCH: $61.4BN ACTUAL F20: $63.7BN 1
1 Sales is the revenue from the sale of goods and services, excluding other operating revenue.
SafetyThe improvement in safety performance in F20 was pleasing. We continued to see strong performance in declining total recordable injuries. The Group’s customer claims and hours lost also improved despite higher volumes. All three measures exceeded Stretch for F20.Improvement in Customer claims
ENTRY: -1% TARGET: -3% STRETCH: -5% ACTUAL F20: -5.1%
Improvement in Total Recordable (Team Member) InjuriesENTRY: -2% TARGET: -4% STRETCH: -6% ACTUAL F20: -19.5%
Improvement in Hours LostENTRY: -1% TARGET: -3% STRETCH: -5% ACTUAL F20: -8.3%
Customer SatisfactionVOC NPS was 54.8 for F20. VOC NPS was initially impacted by availability issues at the onset of COVID-19 but improved strongly as the focus shifted to vulnerable customers and proactively prioritising the safety of our customers and team. Overall performance was between Entry and Target for F20.
ENTRY: 54.0 TARGET: 56.0 STRETCH: 58.0 ACTUAL F20: 54.8
Performance against: F20 STI measures
The scorecard performance outcome for F20 was 104%. However, given the extraordinary impacts of COVID-19 across the Group, the Board decided to award all team members who participate in the Group STI Plan a scorecard result of 80% (Australia) and 90% (New Zealand), with the exception of the Group Executive Committee who received a scorecard result of 70%. The 10 percentage point reduction in Group Executive Committee STI relative to the 80% outcome in Australia reflects the application of a reduction due to the underpayment of salaried team members. Accepting management accountability for this, the CEO and CPO both voluntarily forfeited their full STI for F20. Our New Zealand team is on slightly different STI arrangements, and so a higher STI payout percentage was considered appropriate.
4
Ave
rage
Inve
ntor
y D
ays
EBIT
2
3
F20 ACTUAL PERFORMANCE
Stretch
Sale
s
70%
Cust
omer
Satis
fact
ion
104% actual scorecardperformance
Cust
omer
Cla
ims
Hou
rs Lo
stTo
tal R
ecor
dabl
e In
jurie
s15
0%15
0%15
0%
150%
150%
1
190% New Zealand team member payout280% Australianteam member payout3
70% KMP payout4
0% CEO and CPO payout5
5
Entry
Target
Remuneration Report
58
Our approach and rationale: Long Term Incentive
The Group’s current Long Term Incentive (LTI) Plan is called the Woolworths Incentive Share Plan (WISP). The Group’s former LTI Plan (awarded in F17 and F18) was called the Transformation Incentive Plan (TIP).
Assessing business performance:The LTI rewards executives subject to performance against three equally weighted measures over a three-year performance period:
¢ Relative TSR ¢ Sales per square metre ¢ Return on Funds Employed
Relative TSR (rTSR) Relative TSR is used as a measure in our LTI plan to align executive outcomes and long-term shareholder value creation. The peer group is the ASX30, excluding metals and mining companies. 100% vesting is achieved when our peer group ranking is at the 75th percentile or higher. 50% vesting is achieved ranking at the median. Between the 75th and median, pro-rata vesting is achieved from 50% to 100%. Peer group ranking below the median results in zero vesting.
Sales per square metre (Sales/SQM) Sales/SQM measures sales productivity improvements across the Food and Drinks businesses. Efficient use of our physical network for in-store and online sales is core to our success.
Return on Funds Employed (ROFE)ROFE is an important measure to drive behaviours consistent with the delivery of long term shareholder value. ROFE improvements can be delivered through earnings growth as well as the disciplined allocation of capital, management of assets, and working capital which is important for a business that is building capabilities for the future. ROFE is calculated as EBIT before significant items for the previous 12 months as a percentage of average (opening, mid and closing) funds employed, including significant item provisions.
The vesting schedule for these measures, which are each one third of the total award, is:
rTSR SALES/SQM ROFE
Entry 16.66% 6.66% 6.66%Target n/a 20.00% 20.00%Stretch 33.34% 33.33% 33.33%
The Sales/SQM and ROFE targets are published following the end of the performance period given the commercial sensitivity of this information.
Assessing individual performance:The Board has discretion to adjust the vesting outcome for individuals, which may be reduced (including to zero) if there have been cases of behaviour inconsistent with our Core Values and Ways-of-Working (see Malus policy on page 66). These would be the most serious of cases that would not have been adequately dealt with through normal performance management or consequence frameworks.
Delivering LTI Outcomes:Executive KMP are awarded a maximum value of 170% of TFR as at the beginning of the performance period. Awards of performance rights are made at face value based on the five-day Volume Weighted Average Price (VWAP) up to and including 1 July at the beginning of the performance period. Dividends that would have been earned over the performance period vest in the form of additional shares subject to the performance conditions. The deferred nature of LTI arrangements also provides a risk management lever to facilitate Malus policy application during the performance period.
2.2 LONG TERM INCENTIVE
EXECUTIVE KMP REMUNERATION 2
1
2
3
4
5
PERFORM
AN
CEH
IGH
LIGH
TSBU
SINESS
REVIEW
DIRECTO
RS' REPO
RTFIN
AN
CIAL
REPORT
OTH
ER IN
FORM
ATION
59
WO
OLW
ORTH
S GRO
UP
AN
NU
AL REPO
RT 2020
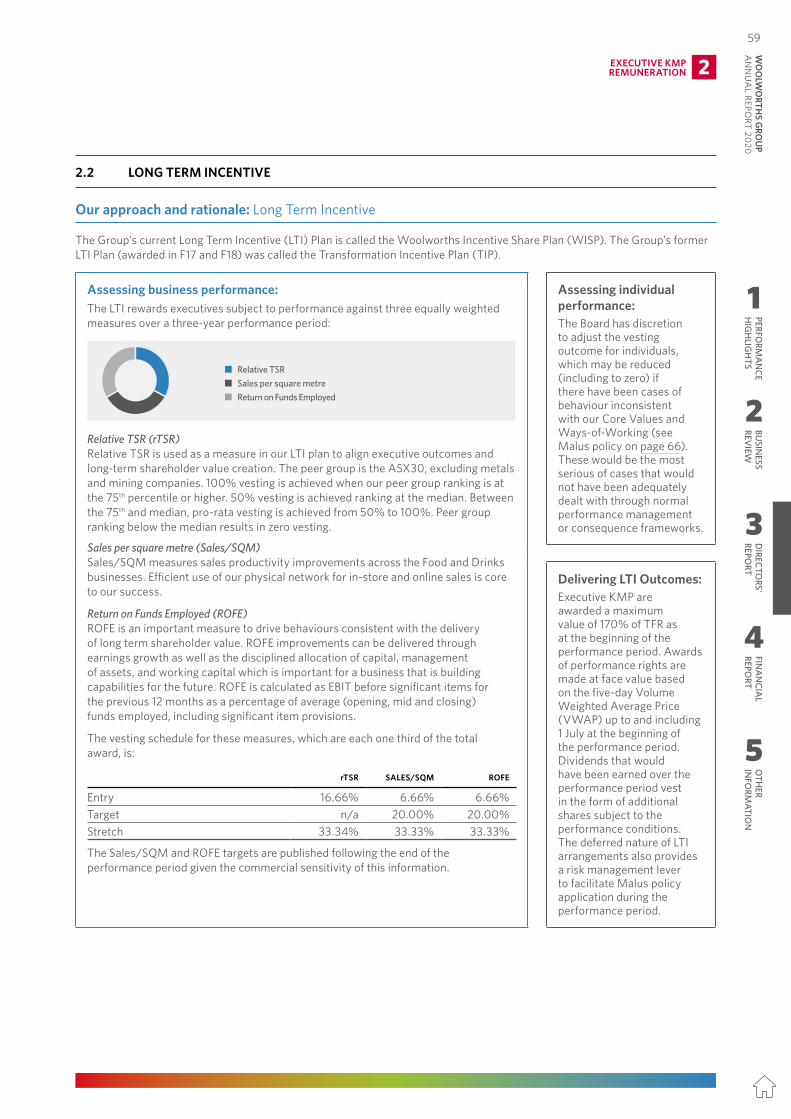
2.1 SHORT TERM INCENTIVE
F20 performance against the STI Scorecard was above target.
104% of Target 69.3% of Max
Average Inventory Days Average inventory days in F20 was 37.0 days, a -2.4 days improvement compared to F19. The improvement in inventory days was delivered through the year, with an improvement of 1.6 days in H1 followed by significant further improvement in H2 impacted by COVID-19 trading. Overall performance was above Stretch for F20.
ENTRY: -0.4 DAYS TARGET: -0.9 DAYS STRETCH: -1.4 DAYS ACTUAL F20: -2.4 DAYS
Earnings Before Interest and TaxEBIT from continuing operations before significant items 2 in F20 was $3.22 billion, a decline of 0.4% on a comparable 52-week basis. Following strong H1 earnings growth of 11.4% on a normalised basis, earnings growth was materially impacted by the closure of Hotels in Q4 and the higher costs in other businesses of operating safely for customers and team through the COVID-19 crisis. Overall performance was below Entry for F20.
ENTRY: $3.31BN TARGET: $3.38BN STRETCH: $3.44BN ACTUAL F20: $3.22BN
2 Significant items include Supply Chain network strategy review $176 million, Endeavour Group transformation costs $230 million, and salaried team member remediation $185 million.
SalesTotal sales in F20 were $63.7 billion 1, representing growth of 8.1% from continuing operations on a comparable 52-week basis. Sales in F20 reflected both strong trading in H1 with sales growth of 6.0%, and the elevated demand during the COVID-19 pandemic and associated lockdowns, which more than offset the closure of Hotel venues through most of Q4. Overall performance was above Stretch for F20.
ENTRY: $60.1BN TARGET: $60.8BN STRETCH: $61.4BN ACTUAL F20: $63.7BN 1
1 Sales is the revenue from the sale of goods and services, excluding other operating revenue.
SafetyThe improvement in safety performance in F20 was pleasing. We continued to see strong performance in declining total recordable injuries. The Group’s customer claims and hours lost also improved despite higher volumes. All three measures exceeded Stretch for F20.Improvement in Customer claims
ENTRY: -1% TARGET: -3% STRETCH: -5% ACTUAL F20: -5.1%
Improvement in Total Recordable (Team Member) InjuriesENTRY: -2% TARGET: -4% STRETCH: -6% ACTUAL F20: -19.5%
Improvement in Hours LostENTRY: -1% TARGET: -3% STRETCH: -5% ACTUAL F20: -8.3%
Customer SatisfactionVOC NPS was 54.8 for F20. VOC NPS was initially impacted by availability issues at the onset of COVID-19 but improved strongly as the focus shifted to vulnerable customers and proactively prioritising the safety of our customers and team. Overall performance was between Entry and Target for F20.
ENTRY: 54.0 TARGET: 56.0 STRETCH: 58.0 ACTUAL F20: 54.8
Performance against: F20 STI measures
The scorecard performance outcome for F20 was 104%. However, given the extraordinary impacts of COVID-19 across the Group, the Board decided to award all team members who participate in the Group STI Plan a scorecard result of 80% (Australia) and 90% (New Zealand), with the exception of the Group Executive Committee who received a scorecard result of 70%. The 10 percentage point reduction in Group Executive Committee STI relative to the 80% outcome in Australia reflects the application of a reduction due to the underpayment of salaried team members. Accepting management accountability for this, the CEO and CPO both voluntarily forfeited their full STI for F20. Our New Zealand team is on slightly different STI arrangements, and so a higher STI payout percentage was considered appropriate.
4
Ave
rage
Inve
ntor
y D
ays
EBIT
2
3
F20 ACTUAL PERFORMANCE
Stretch
Sale
s
70%
Cust
omer
Satis
fact
ion
104% actual scorecardperformance
Cust
omer
Cla
ims
Hou
rs Lo
stTo
tal R
ecor
dabl
e In
jurie
s15
0%15
0%15
0%
150%
150%
1
190% New Zealand team member payout280% Australianteam member payout3
70% KMP payout4
0% CEO and CPO payout5
5
Entry
Target
Remuneration Report
58
Our approach and rationale: Long Term Incentive
The Group’s current Long Term Incentive (LTI) Plan is called the Woolworths Incentive Share Plan (WISP). The Group’s former LTI Plan (awarded in F17 and F18) was called the Transformation Incentive Plan (TIP).
Assessing business performance:The LTI rewards executives subject to performance against three equally weighted measures over a three-year performance period:
¢ Relative TSR ¢ Sales per square metre ¢ Return on Funds Employed
Relative TSR (rTSR) Relative TSR is used as a measure in our LTI plan to align executive outcomes and long-term shareholder value creation. The peer group is the ASX30, excluding metals and mining companies. 100% vesting is achieved when our peer group ranking is at the 75th percentile or higher. 50% vesting is achieved ranking at the median. Between the 75th and median, pro-rata vesting is achieved from 50% to 100%. Peer group ranking below the median results in zero vesting.
Sales per square metre (Sales/SQM) Sales/SQM measures sales productivity improvements across the Food and Drinks businesses. Efficient use of our physical network for in-store and online sales is core to our success.
Return on Funds Employed (ROFE)ROFE is an important measure to drive behaviours consistent with the delivery of long term shareholder value. ROFE improvements can be delivered through earnings growth as well as the disciplined allocation of capital, management of assets, and working capital which is important for a business that is building capabilities for the future. ROFE is calculated as EBIT before significant items for the previous 12 months as a percentage of average (opening, mid and closing) funds employed, including significant item provisions.
The vesting schedule for these measures, which are each one third of the total award, is:
rTSR SALES/SQM ROFE
Entry 16.66% 6.66% 6.66%Target n/a 20.00% 20.00%Stretch 33.34% 33.33% 33.33%
The Sales/SQM and ROFE targets are published following the end of the performance period given the commercial sensitivity of this information.
Assessing individual performance:The Board has discretion to adjust the vesting outcome for individuals, which may be reduced (including to zero) if there have been cases of behaviour inconsistent with our Core Values and Ways-of-Working (see Malus policy on page 66). These would be the most serious of cases that would not have been adequately dealt with through normal performance management or consequence frameworks.
Delivering LTI Outcomes:Executive KMP are awarded a maximum value of 170% of TFR as at the beginning of the performance period. Awards of performance rights are made at face value based on the five-day Volume Weighted Average Price (VWAP) up to and including 1 July at the beginning of the performance period. Dividends that would have been earned over the performance period vest in the form of additional shares subject to the performance conditions. The deferred nature of LTI arrangements also provides a risk management lever to facilitate Malus policy application during the performance period.
2.2 LONG TERM INCENTIVE
EXECUTIVE KMP REMUNERATION 2
1
2
3
4
5
PERFORM
AN
CEH
IGH
LIGH
TSBU
SINESS
REVIEW
DIRECTO
RS' REPO
RTFIN
AN
CIAL
REPORT
OTH
ER IN
FORM
ATION
59W
OO
LWO
RTHS G
ROU
P A
NN
UA
L REPORT 2020
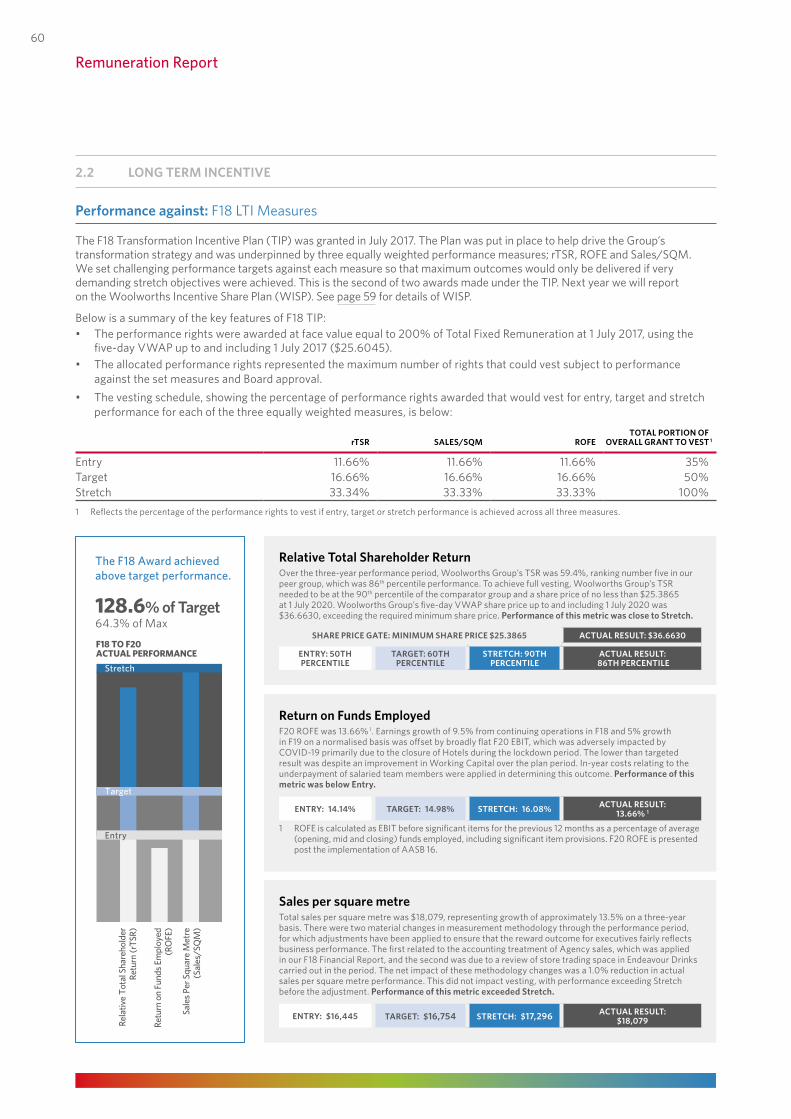
2.2 LONG TERM INCENTIVE
The F18 Award achieved above target performance.
128.6% of Target 64.3% of Max
Sales per square metreTotal sales per square metre was $18,079, representing growth of approximately 13.5% on a three-year basis. There were two material changes in measurement methodology through the performance period, for which adjustments have been applied to ensure that the reward outcome for executives fairly reflects business performance. The first related to the accounting treatment of Agency sales, which was applied in our F18 Financial Report, and the second was due to a review of store trading space in Endeavour Drinks carried out in the period. The net impact of these methodology changes was a 1.0% reduction in actual sales per square metre performance. This did not impact vesting, with performance exceeding Stretch before the adjustment. Performance of this metric exceeded Stretch.
ENTRY: $16,445 TARGET: $16,754 STRETCH: $17,296 ACTUAL RESULT:$18,079
Return on Funds EmployedF20 ROFE was 13.66% 1. Earnings growth of 9.5% from continuing operations in F18 and 5% growth in F19 on a normalised basis was offset by broadly flat F20 EBIT, which was adversely impacted by COVID-19 primarily due to the closure of Hotels during the lockdown period. The lower than targeted result was despite an improvement in Working Capital over the plan period. In-year costs relating to the underpayment of salaried team members were applied in determining this outcome. Performance of this metric was below Entry.
ENTRY: 14.14% TARGET: 14.98% STRETCH: 16.08% ACTUAL RESULT:13.66% 1
1 ROFE is calculated as EBIT before significant items for the previous 12 months as a percentage of average (opening, mid and closing) funds employed, including significant item provisions. F20 ROFE is presented post the implementation of AASB 16.
Relative Total Shareholder ReturnOver the three-year performance period, Woolworths Group’s TSR was 59.4%, ranking number five in our peer group, which was 86th percentile performance. To achieve full vesting, Woolworths Group’s TSR needed to be at the 90th percentile of the comparator group and a share price of no less than $25.3865 at 1 July 2020. Woolworths Group’s five-day VWAP share price up to and including 1 July 2020 was $36.6630, exceeding the required minimum share price. Performance of this metric was close to Stretch.
SHARE PRICE GATE: MINIMUM SHARE PRICE $25.3865 ACTUAL RESULT: $36.6630
ENTRY: 50TH PERCENTILE
TARGET: 60TH PERCENTILE
STRETCH: 90TH PERCENTILE
ACTUAL RESULT: 86TH PERCENTILE
Performance against: F18 LTI Measures
The F18 Transformation Incentive Plan (TIP) was granted in July 2017. The Plan was put in place to help drive the Group’s transformation strategy and was underpinned by three equally weighted performance measures; rTSR, ROFE and Sales/SQM. We set challenging performance targets against each measure so that maximum outcomes would only be delivered if very demanding stretch objectives were achieved. This is the second of two awards made under the TIP. Next year we will report on the Woolworths Incentive Share Plan (WISP). See page 59 for details of WISP.
Below is a summary of the key features of F18 TIP:• The performance rights were awarded at face value equal to 200% of Total Fixed Remuneration at 1 July 2017, using the
five-day VWAP up to and including 1 July 2017 ($25.6045).• The allocated performance rights represented the maximum number of rights that could vest subject to performance
against the set measures and Board approval. • The vesting schedule, showing the percentage of performance rights awarded that would vest for entry, target and stretch
performance for each of the three equally weighted measures, is below:
rTSR SALES/SQM ROFETOTAL PORTION OF
OVERALL GRANT TO VEST 1
Entry 11.66% 11.66% 11.66% 35%Target 16.66% 16.66% 16.66% 50%Stretch 33.34% 33.33% 33.33% 100%1 Reflects the percentage of the performance rights to vest if entry, target or stretch performance is achieved across all three measures.
ROFE
(lea
se-a
djus
ted)
F17
TO F
19 A
CTU
AL
PERF
ORM
AN
CE
Rela
tive
Tota
l Sha
reho
lder
Retu
rn (T
SR)
Sale
s Pe
r Squ
are
Met
re
Target
Entry
Stretch
Retu
rn o
n Fu
nds E
mpl
oyed
(RO
FE)
F18 TO F20 ACTUAL PERFORMANCE
Rela
tive
Tota
l Sha
reho
lder
Retu
rn (r
TSR)
Sale
s Per
Squ
are
Met
re(S
ales
/SQ
M)
Target
Entry
Stretch
Remuneration Report
60
2.3 WHAT WE PAID EXECUTIVE KMP IN F20 AND PROGRESS ON MINIMUM SHAREHOLDING REQUIREMENTS
The following pages compare target, maximum and actual remuneration received during F20 for the Executive KMP. Amounts include: • Total fixed remuneration received (including base salary, superannuation, car allowance).• Relocation and other benefits received, includes the deemed premium in respect of Director’s and Officer’s indemnity
insurance ($2,698).• Cash STI received for business and individual performance in F20. • Equity that vested during the year at face value (versus the maximum initial award face value) for each plan. • Equity granted in F20 and all unvested equity awards (Share Rights for DSTI and Performance Rights for LTI).
In F20 the F18 DSTI plan vested on 1 July 2020 for our Executive KMP, being the portion of the F18 STI award that was deferred as share rights. For the CEO this represented 50% of the F18 STI award and for other Executive KMP this was 25% of their STI award. The vested face value of the F18 DSTI award uses the Woolworths Group five-day VWAP up to and including 1 July 2020 ($36.6630). The 20% increase in share price from the grant date and the dividends (that would have been earned in the form of additional shares at vesting) is the reason for the greater actual DSTI vested value in comparison to the target DSTI shown below.
The LTI award which vested in F20 was the F18 TIP award. Details of the vesting outcome of this award is provided on page 60. The Executive KMP summaries show the vested face value of the F18 TIP award at grant using the Woolworths Group five-day VWAP up to and including 1 July 2017 ($25.6045) and the comparable figure at vesting ($36.6630). The 43% uplift in share price and the accumulated dividends (that would have been earned in the form of additional shares at vesting) are the contributing factors of the greater actual LTI vested value in comparison to maximum LTI shown in the summaries below.
In addition, the individual tables below show the progress against the Minimum Shareholding Requirements (MSR). This includes the aggregate value of current shareholdings and unvested DSTI awards for Executive KMP. Calculations have been made using Woolworths Group five-day VWAP up to and including 1 July 2020 of $36.6630. Further detail on the MSR requirements are included in Section 3.4.
Brad Banducci CHIEF EXECUTIVE OFFICER Term as KMP: Full Year
Actual remuneration received for F20 v Target and Maximum ($000)
Brad (3=75)
David Marr (3=30)
Stephen Donohue (3=31) Stephen Harrison (2=20)
Target Remuneration
Maximum Remuneration
Actual Remuneration 1 9,453
7,803
10,923
2,600 1,300 2,6001,300
2,600 1,950 1,950 4,420
2,600 1,763 3,552 1,535
Target Remuneration
Maximum Remuneration
Actual Remuneration 3,094
2,889
4,044
962 481 962481
962 722 722 1,635
962 3376633
3
3
3
3
1,205 521
Target Remuneration 3
Maximum Remuneration 3
Actual Remuneration 2 1,480
2,703
3,783
900 450 900450
900 675 675 1,530
818 286 2612
113
3
3
Target Remuneration 3
Maximum Remuneration 3
Actual Remuneration 2 2,061
3,753
5,254
1,250 625 625 1,250
938 2,125938
1,194 515212104 36
3
1,2503
Claire Peters
Target Remuneration
Maximum Remuneration
Actual Remuneration 5,960
4,191
5,751
1,300 650 1,300650
1,300 975 975 2,210
1,300 291 455 830439 798
291
291
1,847
Colin Storrie (3=25)
Target Remuneration
Maximum Remuneration
Actual Remuneration 3,209
2,703
3,963
900 450 900450
900 765 765 1,530
891 274315 826 9003
3
3
Progress on Minimum Shareholding Requirement (MSR) as at 1 July 2020 ($000)
ACTUAL
TARGET
ACTUAL
TARGET
ACTUAL
TARGET TARGET
ACTUAL
TARGET
ACTUAL
Brad David Claire Stephen Harrison Stephen Donohue
$15,133
$5,200 $1,250
$7,545
$1,300
$4,393
$900
$2,126 $3,082
$962
ACTUAL
TARGET
Colin Storrier
$3,637
$900
Compliance by 1 July 2022
Equity granted ($000)
F20 DSTI $0F20 LTI $4,878Total value $4,878
Unvested LTI and STI Awards ($000)
F19 DSTI $1,075F19 LTI $5,140F20 DSTI $0F20 LTI $4,878Total value $11,093
Vested LTI and STI Awards ($000)
F18 DSTI $1,763F18 LTI $5,087Total value $6,850
1 Mr Banducci voluntarily forfeited his full F20 STI in acknowledgement of his accountability as CEO for the inadvertent underpayment of some of our salaried team members.
LEGEND ¢ TFR ¢ Relocation and other benefits ¢ Cash
STI ¢ Vested DSTI ¢ Vested LTI
(grant share price) ¢ Vested LTI (vested share price) ¢ Other share
rights vested
EXECUTIVE KMP REMUNERATION 2
1
2
3
4
5
PERFORM
AN
CEH
IGH
LIGH
TSBU
SINESS
REVIEW
DIRECTO
RS' REPO
RTFIN
AN
CIAL
REPORT
OTH
ER IN
FORM
ATION
61
WO
OLW
ORTH
S GRO
UP
AN
NU
AL REPO
RT 2020
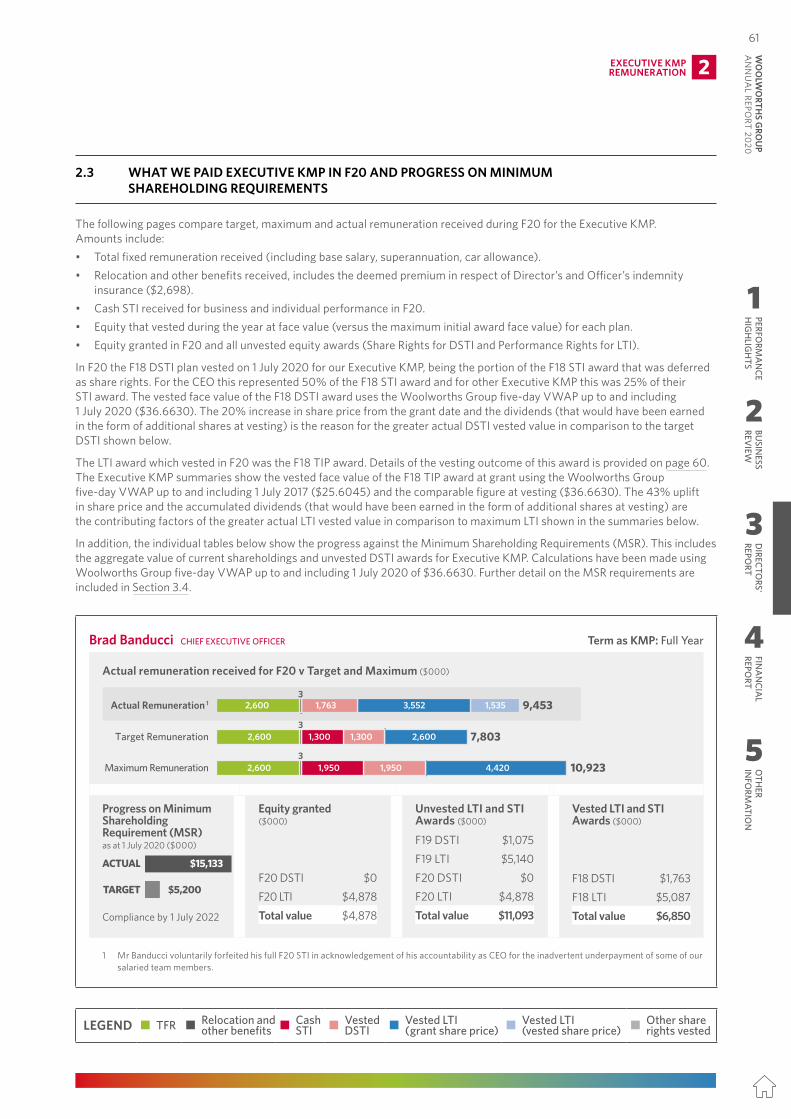
2.2 LONG TERM INCENTIVE
The F18 Award achieved above target performance.
128.6% of Target 64.3% of Max
Sales per square metreTotal sales per square metre was $18,079, representing growth of approximately 13.5% on a three-year basis. There were two material changes in measurement methodology through the performance period, for which adjustments have been applied to ensure that the reward outcome for executives fairly reflects business performance. The first related to the accounting treatment of Agency sales, which was applied in our F18 Financial Report, and the second was due to a review of store trading space in Endeavour Drinks carried out in the period. The net impact of these methodology changes was a 1.0% reduction in actual sales per square metre performance. This did not impact vesting, with performance exceeding Stretch before the adjustment. Performance of this metric exceeded Stretch.
ENTRY: $16,445 TARGET: $16,754 STRETCH: $17,296 ACTUAL RESULT:$18,079
Return on Funds EmployedF20 ROFE was 13.66% 1. Earnings growth of 9.5% from continuing operations in F18 and 5% growth in F19 on a normalised basis was offset by broadly flat F20 EBIT, which was adversely impacted by COVID-19 primarily due to the closure of Hotels during the lockdown period. The lower than targeted result was despite an improvement in Working Capital over the plan period. In-year costs relating to the underpayment of salaried team members were applied in determining this outcome. Performance of this metric was below Entry.
ENTRY: 14.14% TARGET: 14.98% STRETCH: 16.08% ACTUAL RESULT:13.66% 1
1 ROFE is calculated as EBIT before significant items for the previous 12 months as a percentage of average (opening, mid and closing) funds employed, including significant item provisions. F20 ROFE is presented post the implementation of AASB 16.
Relative Total Shareholder ReturnOver the three-year performance period, Woolworths Group’s TSR was 59.4%, ranking number five in our peer group, which was 86th percentile performance. To achieve full vesting, Woolworths Group’s TSR needed to be at the 90th percentile of the comparator group and a share price of no less than $25.3865 at 1 July 2020. Woolworths Group’s five-day VWAP share price up to and including 1 July 2020 was $36.6630, exceeding the required minimum share price. Performance of this metric was close to Stretch.
SHARE PRICE GATE: MINIMUM SHARE PRICE $25.3865 ACTUAL RESULT: $36.6630
ENTRY: 50TH PERCENTILE
TARGET: 60TH PERCENTILE
STRETCH: 90TH PERCENTILE
ACTUAL RESULT: 86TH PERCENTILE
Performance against: F18 LTI Measures
The F18 Transformation Incentive Plan (TIP) was granted in July 2017. The Plan was put in place to help drive the Group’s transformation strategy and was underpinned by three equally weighted performance measures; rTSR, ROFE and Sales/SQM. We set challenging performance targets against each measure so that maximum outcomes would only be delivered if very demanding stretch objectives were achieved. This is the second of two awards made under the TIP. Next year we will report on the Woolworths Incentive Share Plan (WISP). See page 59 for details of WISP.
Below is a summary of the key features of F18 TIP:• The performance rights were awarded at face value equal to 200% of Total Fixed Remuneration at 1 July 2017, using the
five-day VWAP up to and including 1 July 2017 ($25.6045).• The allocated performance rights represented the maximum number of rights that could vest subject to performance
against the set measures and Board approval. • The vesting schedule, showing the percentage of performance rights awarded that would vest for entry, target and stretch
performance for each of the three equally weighted measures, is below:
rTSR SALES/SQM ROFETOTAL PORTION OF
OVERALL GRANT TO VEST 1
Entry 11.66% 11.66% 11.66% 35%Target 16.66% 16.66% 16.66% 50%Stretch 33.34% 33.33% 33.33% 100%1 Reflects the percentage of the performance rights to vest if entry, target or stretch performance is achieved across all three measures.
ROFE
(lea
se-a
djus
ted)
F17
TO F
19 A
CTU
AL
PERF
ORM
AN
CE
Rela
tive
Tota
l Sha
reho
lder
Retu
rn (T
SR)
Sale
s Pe
r Squ
are
Met
re
Target
Entry
Stretch
Retu
rn o
n Fu
nds E
mpl
oyed
(RO
FE)
F18 TO F20 ACTUAL PERFORMANCE
Rela
tive
Tota
l Sha
reho
lder
Retu
rn (r
TSR)
Sale
s Per
Squ
are
Met
re(S
ales
/SQ
M)
Target
Entry
Stretch
Remuneration Report
60
2.3 WHAT WE PAID EXECUTIVE KMP IN F20 AND PROGRESS ON MINIMUM SHAREHOLDING REQUIREMENTS
The following pages compare target, maximum and actual remuneration received during F20 for the Executive KMP. Amounts include: • Total fixed remuneration received (including base salary, superannuation, car allowance).• Relocation and other benefits received, includes the deemed premium in respect of Director’s and Officer’s indemnity
insurance ($2,698).• Cash STI received for business and individual performance in F20. • Equity that vested during the year at face value (versus the maximum initial award face value) for each plan. • Equity granted in F20 and all unvested equity awards (Share Rights for DSTI and Performance Rights for LTI).
In F20 the F18 DSTI plan vested on 1 July 2020 for our Executive KMP, being the portion of the F18 STI award that was deferred as share rights. For the CEO this represented 50% of the F18 STI award and for other Executive KMP this was 25% of their STI award. The vested face value of the F18 DSTI award uses the Woolworths Group five-day VWAP up to and including 1 July 2020 ($36.6630). The 20% increase in share price from the grant date and the dividends (that would have been earned in the form of additional shares at vesting) is the reason for the greater actual DSTI vested value in comparison to the target DSTI shown below.
The LTI award which vested in F20 was the F18 TIP award. Details of the vesting outcome of this award is provided on page 60. The Executive KMP summaries show the vested face value of the F18 TIP award at grant using the Woolworths Group five-day VWAP up to and including 1 July 2017 ($25.6045) and the comparable figure at vesting ($36.6630). The 43% uplift in share price and the accumulated dividends (that would have been earned in the form of additional shares at vesting) are the contributing factors of the greater actual LTI vested value in comparison to maximum LTI shown in the summaries below.
In addition, the individual tables below show the progress against the Minimum Shareholding Requirements (MSR). This includes the aggregate value of current shareholdings and unvested DSTI awards for Executive KMP. Calculations have been made using Woolworths Group five-day VWAP up to and including 1 July 2020 of $36.6630. Further detail on the MSR requirements are included in Section 3.4.
Brad Banducci CHIEF EXECUTIVE OFFICER Term as KMP: Full Year
Actual remuneration received for F20 v Target and Maximum ($000)
Brad (3=75)
David Marr (3=30)
Stephen Donohue (3=31) Stephen Harrison (2=20)
Target Remuneration
Maximum Remuneration
Actual Remuneration 1 9,453
7,803
10,923
2,600 1,300 2,6001,300
2,600 1,950 1,950 4,420
2,600 1,763 3,552 1,535
Target Remuneration
Maximum Remuneration
Actual Remuneration 3,094
2,889
4,044
962 481 962481
962 722 722 1,635
962 3376633
3
3
3
3
1,205 521
Target Remuneration 3
Maximum Remuneration 3
Actual Remuneration 2 1,480
2,703
3,783
900 450 900450
900 675 675 1,530
818 286 2612
113
3
3
Target Remuneration 3
Maximum Remuneration 3
Actual Remuneration 2 2,061
3,753
5,254
1,250 625 625 1,250
938 2,125938
1,194 515212104 36
3
1,2503
Claire Peters
Target Remuneration
Maximum Remuneration
Actual Remuneration 5,960
4,191
5,751
1,300 650 1,300650
1,300 975 975 2,210
1,300 291 455 830439 798
291
291
1,847
Colin Storrie (3=25)
Target Remuneration
Maximum Remuneration
Actual Remuneration 3,209
2,703
3,963
900 450 900450
900 765 765 1,530
891 274315 826 9003
3
3
Progress on Minimum Shareholding Requirement (MSR) as at 1 July 2020 ($000)
ACTUAL
TARGET
ACTUAL
TARGET
ACTUAL
TARGET TARGET
ACTUAL
TARGET
ACTUAL
Brad David Claire Stephen Harrison Stephen Donohue
$15,133
$5,200 $1,250
$7,545
$1,300
$4,393
$900
$2,126 $3,082
$962
ACTUAL
TARGET
Colin Storrier
$3,637
$900
Compliance by 1 July 2022
Equity granted ($000)
F20 DSTI $0F20 LTI $4,878Total value $4,878
Unvested LTI and STI Awards ($000)
F19 DSTI $1,075F19 LTI $5,140F20 DSTI $0F20 LTI $4,878Total value $11,093
Vested LTI and STI Awards ($000)
F18 DSTI $1,763F18 LTI $5,087Total value $6,850
1 Mr Banducci voluntarily forfeited his full F20 STI in acknowledgement of his accountability as CEO for the inadvertent underpayment of some of our salaried team members.
LEGEND ¢ TFR ¢ Relocation and other benefits ¢ Cash
STI ¢ Vested DSTI ¢ Vested LTI
(grant share price) ¢ Vested LTI (vested share price) ¢ Other share
rights vested
EXECUTIVE KMP REMUNERATION 2
1
2
3
4
5
PERFORM
AN
CEH
IGH
LIGH
TSBU
SINESS
REVIEW
DIRECTO
RS' REPO
RTFIN
AN
CIAL
REPORT
OTH
ER IN
FORM
ATION
61W
OO
LWO
RTHS G
ROU
P A
NN
UA
L REPORT 2020
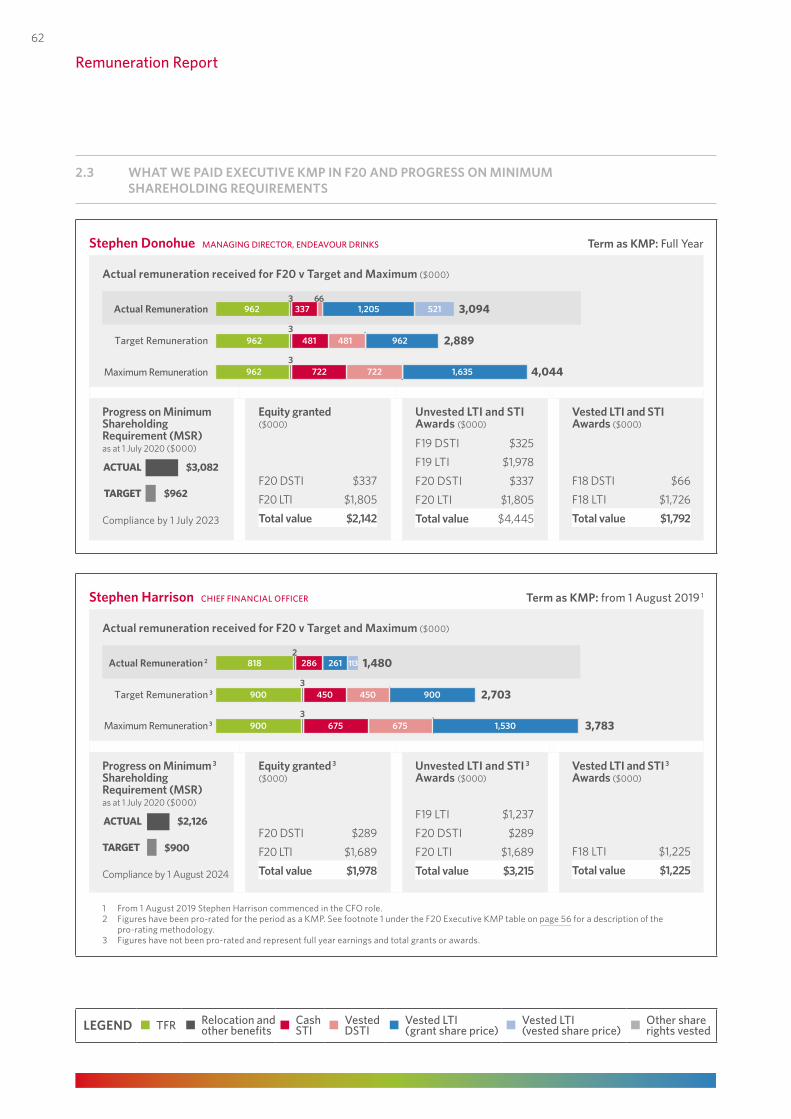
Stephen Donohue MANAGING DIRECTOR, ENDEAVOUR DRINKS Term as KMP: Full Year
Actual remuneration received for F20 v Target and Maximum ($000)
Brad (3=75)
David Marr (3=30)
Stephen Donohue (3=31) Stephen Harrison (2=20)
Target Remuneration
Maximum Remuneration
Actual Remuneration 1 9,453
7,803
10,923
2,600 1,300 2,6001,300
2,600 1,950 1,950 4,420
2,600 1,763 3,552 1,535
Target Remuneration
Maximum Remuneration
Actual Remuneration 3,094
2,889
4,044
962 481 962481
962 722 722 1,635
962 3376633
3
3
3
3
1,205 521
Target Remuneration 3
Maximum Remuneration 3
Actual Remuneration 2 1,480
2,703
3,783
900 450 900450
900 675 675 1,530
818 286 2612
113
3
3
Target Remuneration 3
Maximum Remuneration 3
Actual Remuneration 2 2,061
3,753
5,254
1,250 625 625 1,250
938 2,125938
1,194 515212104 36
3
1,2503
Claire Peters
Target Remuneration
Maximum Remuneration
Actual Remuneration 5,960
4,191
5,751
1,300 650 1,300650
1,300 975 975 2,210
1,300 291 455 830439 798
291
291
1,847
Colin Storrie (3=25)
Target Remuneration
Maximum Remuneration
Actual Remuneration 3,209
2,703
3,963
900 450 900450
900 765 765 1,530
891 274315 826 9003
3
3
Progress on Minimum Shareholding Requirement (MSR) as at 1 July 2020 ($000)
ACTUAL
TARGET
ACTUAL
TARGET
ACTUAL
TARGET TARGET
ACTUAL
TARGET
ACTUAL
Brad David Claire Stephen Harrison Stephen Donohue
$15,133
$5,200 $1,250
$7,545
$1,300
$4,393
$900
$2,126 $3,082
$962
ACTUAL
TARGET
Colin Storrier
$3,637
$900
Compliance by 1 July 2023
Equity granted ($000)
F20 DSTI $337F20 LTI $1,805Total value $2,142
Unvested LTI and STI Awards ($000)
F19 DSTI $325F19 LTI $1,978F20 DSTI $337F20 LTI $1,805Total value $4,445
Vested LTI and STI Awards ($000)
F18 DSTI $66F18 LTI $1,726Total value $1,792
Stephen Harrison CHIEF FINANCIAL OFFICER Term as KMP: from 1 August 2019 1
Actual remuneration received for F20 v Target and Maximum ($000)
Brad (3=75)
David Marr (3=30)
Stephen Donohue (3=31) Stephen Harrison (2=20)
Target Remuneration
Maximum Remuneration
Actual Remuneration 1 9,453
7,803
10,923
2,600 1,300 2,6001,300
2,600 1,950 1,950 4,420
2,600 1,763 3,552 1,535
Target Remuneration
Maximum Remuneration
Actual Remuneration 3,094
2,889
4,044
962 481 962481
962 722 722 1,635
962 3376633
3
3
3
3
1,205 521
Target Remuneration 3
Maximum Remuneration 3
Actual Remuneration 2 1,480
2,703
3,783
900 450 900450
900 675 675 1,530
818 286 2612
113
3
3
Target Remuneration 3
Maximum Remuneration 3
Actual Remuneration 2 2,061
3,753
5,254
1,250 625 625 1,250
938 2,125938
1,194 515212104 36
3
1,2503
Claire Peters
Target Remuneration
Maximum Remuneration
Actual Remuneration 5,960
4,191
5,751
1,300 650 1,300650
1,300 975 975 2,210
1,300 291 455 830439 798
291
291
1,847
Colin Storrie (3=25)
Target Remuneration
Maximum Remuneration
Actual Remuneration 3,209
2,703
3,963
900 450 900450
900 765 765 1,530
891 274315 826 9003
3
3
Progress on Minimum 3 Shareholding Requirement (MSR) as at 1 July 2020 ($000)
ACTUAL
TARGET
ACTUAL
TARGET
ACTUAL
TARGET TARGET
ACTUAL
TARGET
ACTUAL
Brad David Claire Stephen Harrison Stephen Donohue
$15,133
$5,200 $1,250
$7,545
$1,300
$4,393
$900
$2,126 $3,082
$962
ACTUAL
TARGET
Colin Storrier
$3,637
$900
Compliance by 1 August 2024
Equity granted 3 ($000)
F20 DSTI $289F20 LTI $1,689Total value $1,978
Unvested LTI and STI 3 Awards ($000)
F19 LTI $1,237F20 DSTI $289F20 LTI $1,689Total value $3,215
Vested LTI and STI 3 Awards ($000)
F18 LTI $1,225Total value $1,225
1 From 1 August 2019 Stephen Harrison commenced in the CFO role.2 Figures have been pro-rated for the period as a KMP. See footnote 1 under the F20 Executive KMP table on page 56 for a description of the
pro-rating methodology.3 Figures have not been pro-rated and represent full year earnings and total grants or awards.
2.3 WHAT WE PAID EXECUTIVE KMP IN F20 AND PROGRESS ON MINIMUM SHAREHOLDING REQUIREMENTS
LEGEND ¢ TFR ¢ Relocation and other benefits ¢ Cash
STI ¢ Vested DSTI ¢ Vested LTI
(grant share price) ¢ Vested LTI (vested share price) ¢ Other share
rights vested
Remuneration Report
62
David Marr CHIEF FINANCIAL OFFICER Term as KMP: to 31 July 2019 1
Actual remuneration received for F20 v Target and Maximum ($000)
Brad (3=75)
David Marr (3=30)
Stephen Donohue (3=31) Stephen Harrison (2=20)
Target Remuneration
Maximum Remuneration
Actual Remuneration 1 9,453
7,803
10,923
2,600 1,300 2,6001,300
2,600 1,950 1,950 4,420
2,600 1,763 3,552 1,535
Target Remuneration
Maximum Remuneration
Actual Remuneration 3,094
2,889
4,044
962 481 962481
962 722 722 1,635
962 3376633
3
3
3
3
1,205 521
Target Remuneration 3
Maximum Remuneration 3
Actual Remuneration 2 1,480
2,703
3,783
900 450 900450
900 675 675 1,530
818 286 2612
113
3
3
Target Remuneration 3
Maximum Remuneration 3
Actual Remuneration 2 2,061
3,753
5,254
1,250 625 625 1,250
938 2,125938
1,194 515212104 36
3
1,2503
Claire Peters
Target Remuneration
Maximum Remuneration
Actual Remuneration 5,960
4,191
5,751
1,300 650 1,300650
1,300 975 975 2,210
1,300 291 455 830439 798
291
291
1,847
Colin Storrie (3=25)
Target Remuneration
Maximum Remuneration
Actual Remuneration 3,209
2,703
3,963
900 450 900450
900 765 765 1,530
891 274315 826 9003
3
3
Progress on Minimum 3 Shareholding Requirement (MSR) as at 1 July 2020 ($000)
ACTUAL
TARGET
ACTUAL
TARGET
ACTUAL
TARGET TARGET
ACTUAL
TARGET
ACTUAL
Brad David Claire Stephen Harrison Stephen Donohue
$15,133
$5,200 $1,250
$7,545
$1,300
$4,393
$900
$2,126 $3,082
$962
ACTUAL
TARGET
Colin Storrier
$3,637
$900
Compliance by 1 July 2023
Equity granted 3 ($000)
F20 DSTI $438F20 LTI $2,345Total value $2,783
Unvested LTI and STI 3 Awards ($000)
F19 DSTI $493F19 LTI $2,487F20 DSTI $438F20 LTI $2,345Total value $5,763
Vested LTI and STI 3 Awards ($000)
F18 DSTI $391F18 LTI $2,461Total value $2,852
1 From 1 August 2019 David commenced in the Chief Operating Officer role with primary responsibility for overseeing the merger and separation of Endeavour Group.2 Figures in this section have been pro-rated for the period as a KMP. See footnote 2 under the F20 Executive KMP table on page 56 for a description
of the pro-rating methodology.3 Figures have not been pro-rated and represent full year earnings and total grants or awards.
Claire Peters MANAGING DIRECTOR, WOOLWORTHS SUPERMARKETS Term as KMP: Full Year
Actual remuneration received for F20 v Target and Maximum ($000)
Brad (3=75)
David Marr (3=30)
Stephen Donohue (3=31) Stephen Harrison (2=20)
Target Remuneration
Maximum Remuneration
Actual Remuneration 1 9,453
7,803
10,923
2,600 1,300 2,6001,300
2,600 1,950 1,950 4,420
2,600 1,763 3,552 1,535
Target Remuneration
Maximum Remuneration
Actual Remuneration 3,094
2,889
4,044
962 481 962481
962 722 722 1,635
962 3376633
3
3
3
3
1,205 521
Target Remuneration 3
Maximum Remuneration 3
Actual Remuneration 2 1,480
2,703
3,783
900 450 900450
900 675 675 1,530
818 286 2612
113
3
3
Target Remuneration 3
Maximum Remuneration 3
Actual Remuneration 2 2,061
3,753
5,254
1,250 625 625 1,250
938 2,125938
1,194 515212104 36
3
1,2503
Claire Peters
Target Remuneration
Maximum Remuneration
Actual Remuneration 5,960
4,191
5,751
1,300 650 1,300650
1,300 975 975 2,210
1,300 291 455 830439 798
291
291
1,847
Colin Storrie (3=25)
Target Remuneration
Maximum Remuneration
Actual Remuneration 3,209
2,703
3,963
900 450 900450
900 765 765 1,530
891 274315 826 9003
3
3
Progress on Minimum Shareholding Requirement (MSR) as at 1 July 2020 ($000)
ACTUAL
TARGET
ACTUAL
TARGET
ACTUAL
TARGET TARGET
ACTUAL
TARGET
ACTUAL
Brad David Claire Stephen Harrison Stephen Donohue
$15,133
$5,200 $1,250
$7,545
$1,300
$4,393
$900
$2,126 $3,082
$962
ACTUAL
TARGET
Colin Storrier
$3,637
$900
Compliance by 1 July 2023
Equity granted ($000)
F20 DSTI $455F20 LTI $2,439Total value $2,894
Unvested LTI and STI Awards ($000)
F19 DSTI $488F19 LTI $2,673F20 DSTI $455F20 LTI $2,439Total value $6,055
Vested LTI, STI and Other Awards ($000)
F18 DSTI $43918 LTI $2,645Other $830Total value $3,914
Total relocation support and other benefits (including FBT) was $291,001 in F20. Ms Peters also had 22,625 sign on share rights which vested during F20, with a face value of $829,500 as shown above under “Vested Other Awards”.
2.3 WHAT WE PAID EXECUTIVE KMP IN F20 AND PROGRESS ON MINIMUM SHAREHOLDING REQUIREMENTS
LEGEND ¢ TFR ¢ Relocation and other benefits ¢ Cash
STI ¢ Vested DSTI ¢ Vested LTI
(grant share price) ¢ Vested LTI (vested share price) ¢ Other share
rights vested
EXECUTIVE KMP REMUNERATION 2
1
2
3
4
5
PERFORM
AN
CEH
IGH
LIGH
TSBU
SINESS
REVIEW
DIRECTO
RS' REPO
RTFIN
AN
CIAL
REPORT
OTH
ER IN
FORM
ATION
63
WO
OLW
ORTH
S GRO
UP
AN
NU
AL REPO
RT 2020
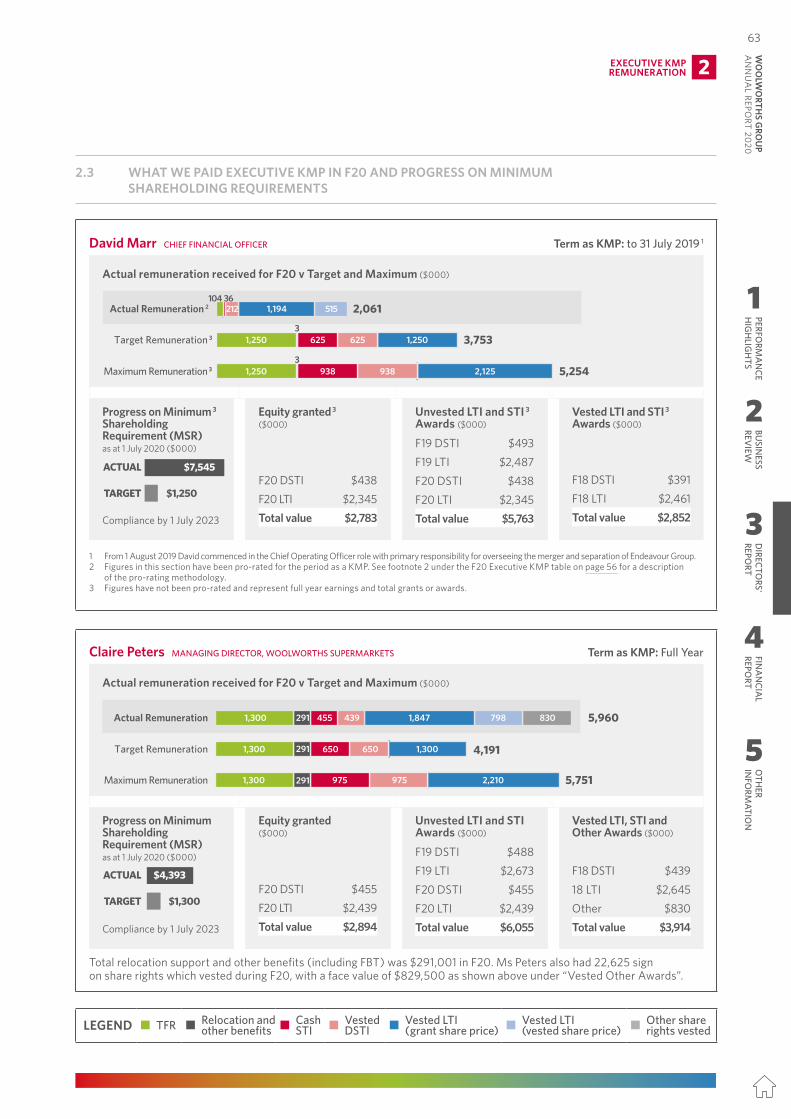
Stephen Donohue MANAGING DIRECTOR, ENDEAVOUR DRINKS Term as KMP: Full Year
Actual remuneration received for F20 v Target and Maximum ($000)
Brad (3=75)
David Marr (3=30)
Stephen Donohue (3=31) Stephen Harrison (2=20)
Target Remuneration
Maximum Remuneration
Actual Remuneration 1 9,453
7,803
10,923
2,600 1,300 2,6001,300
2,600 1,950 1,950 4,420
2,600 1,763 3,552 1,535
Target Remuneration
Maximum Remuneration
Actual Remuneration 3,094
2,889
4,044
962 481 962481
962 722 722 1,635
962 3376633
3
3
3
3
1,205 521
Target Remuneration 3
Maximum Remuneration 3
Actual Remuneration 2 1,480
2,703
3,783
900 450 900450
900 675 675 1,530
818 286 2612
113
3
3
Target Remuneration 3
Maximum Remuneration 3
Actual Remuneration 2 2,061
3,753
5,254
1,250 625 625 1,250
938 2,125938
1,194 515212104 36
3
1,2503
Claire Peters
Target Remuneration
Maximum Remuneration
Actual Remuneration 5,960
4,191
5,751
1,300 650 1,300650
1,300 975 975 2,210
1,300 291 455 830439 798
291
291
1,847
Colin Storrie (3=25)
Target Remuneration
Maximum Remuneration
Actual Remuneration 3,209
2,703
3,963
900 450 900450
900 765 765 1,530
891 274315 826 9003
3
3
Progress on Minimum Shareholding Requirement (MSR) as at 1 July 2020 ($000)
ACTUAL
TARGET
ACTUAL
TARGET
ACTUAL
TARGET TARGET
ACTUAL
TARGET
ACTUAL
Brad David Claire Stephen Harrison Stephen Donohue
$15,133
$5,200 $1,250
$7,545
$1,300
$4,393
$900
$2,126 $3,082
$962
ACTUAL
TARGET
Colin Storrier
$3,637
$900
Compliance by 1 July 2023
Equity granted ($000)
F20 DSTI $337F20 LTI $1,805Total value $2,142
Unvested LTI and STI Awards ($000)
F19 DSTI $325F19 LTI $1,978F20 DSTI $337F20 LTI $1,805Total value $4,445
Vested LTI and STI Awards ($000)
F18 DSTI $66F18 LTI $1,726Total value $1,792
Stephen Harrison CHIEF FINANCIAL OFFICER Term as KMP: from 1 August 2019 1
Actual remuneration received for F20 v Target and Maximum ($000)
Brad (3=75)
David Marr (3=30)
Stephen Donohue (3=31) Stephen Harrison (2=20)
Target Remuneration
Maximum Remuneration
Actual Remuneration 1 9,453
7,803
10,923
2,600 1,300 2,6001,300
2,600 1,950 1,950 4,420
2,600 1,763 3,552 1,535
Target Remuneration
Maximum Remuneration
Actual Remuneration 3,094
2,889
4,044
962 481 962481
962 722 722 1,635
962 3376633
3
3
3
3
1,205 521
Target Remuneration 3
Maximum Remuneration 3
Actual Remuneration 2 1,480
2,703
3,783
900 450 900450
900 675 675 1,530
818 286 2612
113
3
3
Target Remuneration 3
Maximum Remuneration 3
Actual Remuneration 2 2,061
3,753
5,254
1,250 625 625 1,250
938 2,125938
1,194 515212104 36
3
1,2503
Claire Peters
Target Remuneration
Maximum Remuneration
Actual Remuneration 5,960
4,191
5,751
1,300 650 1,300650
1,300 975 975 2,210
1,300 291 455 830439 798
291
291
1,847
Colin Storrie (3=25)
Target Remuneration
Maximum Remuneration
Actual Remuneration 3,209
2,703
3,963
900 450 900450
900 765 765 1,530
891 274315 826 9003
3
3
Progress on Minimum 3 Shareholding Requirement (MSR) as at 1 July 2020 ($000)
ACTUAL
TARGET
ACTUAL
TARGET
ACTUAL
TARGET TARGET
ACTUAL
TARGET
ACTUAL
Brad David Claire Stephen Harrison Stephen Donohue
$15,133
$5,200 $1,250
$7,545
$1,300
$4,393
$900
$2,126 $3,082
$962
ACTUAL
TARGET
Colin Storrier
$3,637
$900
Compliance by 1 August 2024
Equity granted 3 ($000)
F20 DSTI $289F20 LTI $1,689Total value $1,978
Unvested LTI and STI 3 Awards ($000)
F19 LTI $1,237F20 DSTI $289F20 LTI $1,689Total value $3,215
Vested LTI and STI 3 Awards ($000)
F18 LTI $1,225Total value $1,225
1 From 1 August 2019 Stephen Harrison commenced in the CFO role.2 Figures have been pro-rated for the period as a KMP. See footnote 1 under the F20 Executive KMP table on page 56 for a description of the
pro-rating methodology.3 Figures have not been pro-rated and represent full year earnings and total grants or awards.
2.3 WHAT WE PAID EXECUTIVE KMP IN F20 AND PROGRESS ON MINIMUM SHAREHOLDING REQUIREMENTS
LEGEND ¢ TFR ¢ Relocation and other benefits ¢ Cash
STI ¢ Vested DSTI ¢ Vested LTI
(grant share price) ¢ Vested LTI (vested share price) ¢ Other share
rights vested
Remuneration Report
62
David Marr CHIEF FINANCIAL OFFICER Term as KMP: to 31 July 2019 1
Actual remuneration received for F20 v Target and Maximum ($000)
Brad (3=75)
David Marr (3=30)
Stephen Donohue (3=31) Stephen Harrison (2=20)
Target Remuneration
Maximum Remuneration
Actual Remuneration 1 9,453
7,803
10,923
2,600 1,300 2,6001,300
2,600 1,950 1,950 4,420
2,600 1,763 3,552 1,535
Target Remuneration
Maximum Remuneration
Actual Remuneration 3,094
2,889
4,044
962 481 962481
962 722 722 1,635
962 3376633
3
3
3
3
1,205 521
Target Remuneration 3
Maximum Remuneration 3
Actual Remuneration 2 1,480
2,703
3,783
900 450 900450
900 675 675 1,530
818 286 2612
113
3
3
Target Remuneration 3
Maximum Remuneration 3
Actual Remuneration 2 2,061
3,753
5,254
1,250 625 625 1,250
938 2,125938
1,194 515212104 36
3
1,2503
Claire Peters
Target Remuneration
Maximum Remuneration
Actual Remuneration 5,960
4,191
5,751
1,300 650 1,300650
1,300 975 975 2,210
1,300 291 455 830439 798
291
291
1,847
Colin Storrie (3=25)
Target Remuneration
Maximum Remuneration
Actual Remuneration 3,209
2,703
3,963
900 450 900450
900 765 765 1,530
891 274315 826 9003
3
3
Progress on Minimum 3 Shareholding Requirement (MSR) as at 1 July 2020 ($000)
ACTUAL
TARGET
ACTUAL
TARGET
ACTUAL
TARGET TARGET
ACTUAL
TARGET
ACTUAL
Brad David Claire Stephen Harrison Stephen Donohue
$15,133
$5,200 $1,250
$7,545
$1,300
$4,393
$900
$2,126 $3,082
$962
ACTUAL
TARGET
Colin Storrier
$3,637
$900
Compliance by 1 July 2023
Equity granted 3 ($000)
F20 DSTI $438F20 LTI $2,345Total value $2,783
Unvested LTI and STI 3 Awards ($000)
F19 DSTI $493F19 LTI $2,487F20 DSTI $438F20 LTI $2,345Total value $5,763
Vested LTI and STI 3 Awards ($000)
F18 DSTI $391F18 LTI $2,461Total value $2,852
1 From 1 August 2019 David commenced in the Chief Operating Officer role with primary responsibility for overseeing the merger and separation of Endeavour Group.2 Figures in this section have been pro-rated for the period as a KMP. See footnote 2 under the F20 Executive KMP table on page 56 for a description
of the pro-rating methodology.3 Figures have not been pro-rated and represent full year earnings and total grants or awards.
Claire Peters MANAGING DIRECTOR, WOOLWORTHS SUPERMARKETS Term as KMP: Full Year
Actual remuneration received for F20 v Target and Maximum ($000)
Brad (3=75)
David Marr (3=30)
Stephen Donohue (3=31) Stephen Harrison (2=20)
Target Remuneration
Maximum Remuneration
Actual Remuneration 1 9,453
7,803
10,923
2,600 1,300 2,6001,300
2,600 1,950 1,950 4,420
2,600 1,763 3,552 1,535
Target Remuneration
Maximum Remuneration
Actual Remuneration 3,094
2,889
4,044
962 481 962481
962 722 722 1,635
962 3376633
3
3
3
3
1,205 521
Target Remuneration 3
Maximum Remuneration 3
Actual Remuneration 2 1,480
2,703
3,783
900 450 900450
900 675 675 1,530
818 286 2612
113
3
3
Target Remuneration 3
Maximum Remuneration 3
Actual Remuneration 2 2,061
3,753
5,254
1,250 625 625 1,250
938 2,125938
1,194 515212104 36
3
1,2503
Claire Peters
Target Remuneration
Maximum Remuneration
Actual Remuneration 5,960
4,191
5,751
1,300 650 1,300650
1,300 975 975 2,210
1,300 291 455 830439 798
291
291
1,847
Colin Storrie (3=25)
Target Remuneration
Maximum Remuneration
Actual Remuneration 3,209
2,703
3,963
900 450 900450
900 765 765 1,530
891 274315 826 9003
3
3
Progress on Minimum Shareholding Requirement (MSR) as at 1 July 2020 ($000)
ACTUAL
TARGET
ACTUAL
TARGET
ACTUAL
TARGET TARGET
ACTUAL
TARGET
ACTUAL
Brad David Claire Stephen Harrison Stephen Donohue
$15,133
$5,200 $1,250
$7,545
$1,300
$4,393
$900
$2,126 $3,082
$962
ACTUAL
TARGET
Colin Storrier
$3,637
$900
Compliance by 1 July 2023
Equity granted ($000)
F20 DSTI $455F20 LTI $2,439Total value $2,894
Unvested LTI and STI Awards ($000)
F19 DSTI $488F19 LTI $2,673F20 DSTI $455F20 LTI $2,439Total value $6,055
Vested LTI, STI and Other Awards ($000)
F18 DSTI $43918 LTI $2,645Other $830Total value $3,914
Total relocation support and other benefits (including FBT) was $291,001 in F20. Ms Peters also had 22,625 sign on share rights which vested during F20, with a face value of $829,500 as shown above under “Vested Other Awards”.
2.3 WHAT WE PAID EXECUTIVE KMP IN F20 AND PROGRESS ON MINIMUM SHAREHOLDING REQUIREMENTS
LEGEND ¢ TFR ¢ Relocation and other benefits ¢ Cash
STI ¢ Vested DSTI ¢ Vested LTI
(grant share price) ¢ Vested LTI (vested share price) ¢ Other share
rights vested
EXECUTIVE KMP REMUNERATION 2
1
2
3
4
5
PERFORM
AN
CEH
IGH
LIGH
TSBU
SINESS
REVIEW
DIRECTO
RS' REPO
RTFIN
AN
CIAL
REPORT
OTH
ER IN
FORM
ATION
63W
OO
LWO
RTHS G
ROU
P A
NN
UA
L REPORT 2020
2.4 TERMS OF EXECUTIVE KMP SERVICE AGREEMENTS
All Executive KMP are employed on service agreements that detail the components of remuneration paid but do not prescribe how remuneration levels are to be modified from year to year. The agreements do not provide for a fixed term, although the service agreements may be terminated on specified notice. The notice period is 12 months for the CEO and six months for all other Executive KMP. Below is a summary of the termination provisions for Executive KMP.
Termination by Company Termination by Executive KMP
Where the notice period is worked:• Total fixed remuneration is paid in respect of and for
the duration of the notice period.
Where the notice period is paid in lieu:• Total fixed remuneration in respect of the notice period
(and, if appropriate, a reasonable estimate of STI) is paid as a lump sum.
In both circumstances:• The extent to which STI, DSTI and LTI arrangements
remain in place will be treated in accordance with the relevant rules for the award and at the discretion of the Board.
If termination is for cause:• Only accrued leave and unpaid total fixed remuneration
for days worked is paid.• STI, DSTI and LTI are forfeited.
Where the notice period is worked:• Total fixed remuneration is paid in respect of and for
the duration of the notice period.
Where the notice period is paid in lieu:• Total fixed remuneration in respect of the notice period
is paid as a lump sum.
In both circumstances:• The extent to which STI is payable will be treated
in accordance with the relevant rules for the award and at the discretion of the Board.
• Unvested DSTI and LTI are treated in accordance with the relevant rules for the award and at the discretion of the Board. Refer to Section 3.3 for further detail.
In addition, and upon further payment (where required), the Company may invoke a restraint period of up to 12 months following separation, preventing Executive KMP from engaging in any business activity with competitors.
2.5 F21 OUTLOOK
Each year the Board reviews the measures that are used in our STI and LTI plans to ensure they remain relevant and aligned to our strategic objectives.
STIFrom F21 we will revert from average inventory days to a more holistic trade working capital days scorecard measure. In F20 the focus on average inventory days delivered a 2.4 days reduction on F19 to 37.0 days. The move to a broader measure in F21 reflects the increasing weight of non-retail businesses in the Woolworths Group, and will ensure all components of working capital are well managed, while remaining mindful that we continue to meet our payment commitments to our suppliers.
LTIWe are not intending to make any changes to our LTI plan in F21.
Setting incentive targets and monitoring performanceMacro-economic challengesWoolworths Group continues to operate in an environment with high levels of uncertainty and economic challenges. Headwinds driven by the COVID-19 pandemic, cost pressure and the mix of impacts from eCommerce have led us to set material productivity targets and establish strong cost management settings for F21. Given the continuing uncertainty of the COVID-19 pandemic, the Board will closely monitor performance and may apply discretion to outcomes should there be a significant divergence from the macro assumptions underlying our plan.
Separation of Endeavour Group Limited (EGL)As announced on 24 March 2020, the intended separation of EGL from Woolworths Group has been deferred, with the specific date subject to ongoing review. This change may impact our remuneration framework, including unvested awards under our employee share plans. The Board will review the impact of the separation so that STI, DSTI and LTI participants are no better or worse off following the transaction. This may include a review of our performance measures to account for the change in our business.
Remuneration Report
64
3 GOVERNANCE
3.1 ROLE OF THE BOARD
The Board reviews, challenges, applies judgement and, as appropriate, approves the PPC’s recommendations. It approves the remuneration of Executive KMP and of Non-executive Directors and the policies and frameworks that govern both.
When reviewing performance and determining incentive outcomes, the Board starts from the presumption that performance outcomes that determine incentive awards should align with market-reported outcomes, management activity and shareholder outcomes. To achieve this alignment, the Board retains discretion over final performance and incentive outcomes, and recognises that there are cases where adjustments should be made. The Group holds a joint meeting of all Board Committees to consider the consequences of risk-related matters including whether malus should be applied, as an input into the PPC’s recommendations to the Board on appropriate reward outcomes for executives of the Group. In determining reward outcomes, the Board will pay specific attention to items that are:• Outside of the control of management.• The result of portfolio/strategy changes implemented but not envisaged in the original performance targets.• Due to significant change in asset valuations outside the normal course of business.
3.2 ROLE OF THE PEOPLE PERFORMANCE COMMITTEE (PPC)
The PPC operates under its own Charter and reports to the Board. The role of the PPC is to provide advice and assistance to the Board in relation to people management and remuneration policies, so that remuneration outcomes for senior executives are appropriate and aligned to company performance and shareholder expectations.
As discussed above, the PPC receives input from the Audit, Risk Management and Compliance Committee (ARMCC) and Sustainability Committee (SUSCO) through the joint meeting of these committees to help inform its recommendations to the Board on the consequence of risk-related matters on variable remuneration of the CEO and his direct reports, and overall Group STI and LTI outcomes.
The PPC Charter, which the Board reviews annually, was updated in August 2019 to better reflect the PPC’s objectives in relation to:• Supporting our Customer 1st Team 1st Brand and Culture, Ways-of-Working and Core Values. • Building an ethical corporate culture where Woolworths Group is known as a place where people come to work to do the
right thing.• Approving key people policies and practices that have a material impact on the delivery of our strategy and drive a strong culture.
A copy of the PPC Charter is available on the company’s website: www.woolworthsgroup.com.au
The Chair of the Board and the Chair of the PPC regularly engage with external stakeholders on remuneration arrangements.
Independent Remuneration Advisors Where appropriate, the Board and the PPC consult external remuneration advisors. When such external remuneration advisors are selected, the Board considers potential conflicts of interest. Advisors’ terms of engagement regulate their access to, and (where required) set out their independence from, members of Woolworths Group management.
The requirement for external remuneration advisor services is assessed annually in the context of matters the PPC needs to address. External advice is used as a guide, and does not serve as a substitute for Directors’ thorough consideration of the relevant matters.
The Board and PPC engaged PwC as its independent Remuneration Advisor. While Woolworths seeks regular input from PwC, no remuneration recommendations, as defined by the Corporations Act 2001 (Cth), were made by our remuneration advisors.
GOVERNANCE 3
1
2
3
4
5
PERFORM
AN
CEH
IGH
LIGH
TSBU
SINESS
REVIEW
DIRECTO
RS' REPO
RTFIN
AN
CIAL
REPORT
OTH
ER IN
FORM
ATION
65
WO
OLW
ORTH
S GRO
UP
AN
NU
AL REPO
RT 2020
2.4 TERMS OF EXECUTIVE KMP SERVICE AGREEMENTS
All Executive KMP are employed on service agreements that detail the components of remuneration paid but do not prescribe how remuneration levels are to be modified from year to year. The agreements do not provide for a fixed term, although the service agreements may be terminated on specified notice. The notice period is 12 months for the CEO and six months for all other Executive KMP. Below is a summary of the termination provisions for Executive KMP.
Termination by Company Termination by Executive KMP
Where the notice period is worked:• Total fixed remuneration is paid in respect of and for
the duration of the notice period.
Where the notice period is paid in lieu:• Total fixed remuneration in respect of the notice period
(and, if appropriate, a reasonable estimate of STI) is paid as a lump sum.
In both circumstances:• The extent to which STI, DSTI and LTI arrangements
remain in place will be treated in accordance with the relevant rules for the award and at the discretion of the Board.
If termination is for cause:• Only accrued leave and unpaid total fixed remuneration
for days worked is paid.• STI, DSTI and LTI are forfeited.
Where the notice period is worked:• Total fixed remuneration is paid in respect of and for
the duration of the notice period.
Where the notice period is paid in lieu:• Total fixed remuneration in respect of the notice period
is paid as a lump sum.
In both circumstances:• The extent to which STI is payable will be treated
in accordance with the relevant rules for the award and at the discretion of the Board.
• Unvested DSTI and LTI are treated in accordance with the relevant rules for the award and at the discretion of the Board. Refer to Section 3.3 for further detail.
In addition, and upon further payment (where required), the Company may invoke a restraint period of up to 12 months following separation, preventing Executive KMP from engaging in any business activity with competitors.
2.5 F21 OUTLOOK
Each year the Board reviews the measures that are used in our STI and LTI plans to ensure they remain relevant and aligned to our strategic objectives.
STIFrom F21 we will revert from average inventory days to a more holistic trade working capital days scorecard measure. In F20 the focus on average inventory days delivered a 2.4 days reduction on F19 to 37.0 days. The move to a broader measure in F21 reflects the increasing weight of non-retail businesses in the Woolworths Group, and will ensure all components of working capital are well managed, while remaining mindful that we continue to meet our payment commitments to our suppliers.
LTIWe are not intending to make any changes to our LTI plan in F21.
Setting incentive targets and monitoring performanceMacro-economic challengesWoolworths Group continues to operate in an environment with high levels of uncertainty and economic challenges. Headwinds driven by the COVID-19 pandemic, cost pressure and the mix of impacts from eCommerce have led us to set material productivity targets and establish strong cost management settings for F21. Given the continuing uncertainty of the COVID-19 pandemic, the Board will closely monitor performance and may apply discretion to outcomes should there be a significant divergence from the macro assumptions underlying our plan.
Separation of Endeavour Group Limited (EGL)As announced on 24 March 2020, the intended separation of EGL from Woolworths Group has been deferred, with the specific date subject to ongoing review. This change may impact our remuneration framework, including unvested awards under our employee share plans. The Board will review the impact of the separation so that STI, DSTI and LTI participants are no better or worse off following the transaction. This may include a review of our performance measures to account for the change in our business.
Remuneration Report
64
3 GOVERNANCE
3.1 ROLE OF THE BOARD
The Board reviews, challenges, applies judgement and, as appropriate, approves the PPC’s recommendations. It approves the remuneration of Executive KMP and of Non-executive Directors and the policies and frameworks that govern both.
When reviewing performance and determining incentive outcomes, the Board starts from the presumption that performance outcomes that determine incentive awards should align with market-reported outcomes, management activity and shareholder outcomes. To achieve this alignment, the Board retains discretion over final performance and incentive outcomes, and recognises that there are cases where adjustments should be made. The Group holds a joint meeting of all Board Committees to consider the consequences of risk-related matters including whether malus should be applied, as an input into the PPC’s recommendations to the Board on appropriate reward outcomes for executives of the Group. In determining reward outcomes, the Board will pay specific attention to items that are:• Outside of the control of management.• The result of portfolio/strategy changes implemented but not envisaged in the original performance targets.• Due to significant change in asset valuations outside the normal course of business.
3.2 ROLE OF THE PEOPLE PERFORMANCE COMMITTEE (PPC)
The PPC operates under its own Charter and reports to the Board. The role of the PPC is to provide advice and assistance to the Board in relation to people management and remuneration policies, so that remuneration outcomes for senior executives are appropriate and aligned to company performance and shareholder expectations.
As discussed above, the PPC receives input from the Audit, Risk Management and Compliance Committee (ARMCC) and Sustainability Committee (SUSCO) through the joint meeting of these committees to help inform its recommendations to the Board on the consequence of risk-related matters on variable remuneration of the CEO and his direct reports, and overall Group STI and LTI outcomes.
The PPC Charter, which the Board reviews annually, was updated in August 2019 to better reflect the PPC’s objectives in relation to:• Supporting our Customer 1st Team 1st Brand and Culture, Ways-of-Working and Core Values. • Building an ethical corporate culture where Woolworths Group is known as a place where people come to work to do the
right thing.• Approving key people policies and practices that have a material impact on the delivery of our strategy and drive a strong culture.
A copy of the PPC Charter is available on the company’s website: www.woolworthsgroup.com.au
The Chair of the Board and the Chair of the PPC regularly engage with external stakeholders on remuneration arrangements.
Independent Remuneration Advisors Where appropriate, the Board and the PPC consult external remuneration advisors. When such external remuneration advisors are selected, the Board considers potential conflicts of interest. Advisors’ terms of engagement regulate their access to, and (where required) set out their independence from, members of Woolworths Group management.
The requirement for external remuneration advisor services is assessed annually in the context of matters the PPC needs to address. External advice is used as a guide, and does not serve as a substitute for Directors’ thorough consideration of the relevant matters.
The Board and PPC engaged PwC as its independent Remuneration Advisor. While Woolworths seeks regular input from PwC, no remuneration recommendations, as defined by the Corporations Act 2001 (Cth), were made by our remuneration advisors.
GOVERNANCE 3
1
2
3
4
5
PERFORM
AN
CEH
IGH
LIGH
TSBU
SINESS
REVIEW
DIRECTO
RS' REPO
RTFIN
AN
CIAL
REPORT
OTH
ER IN
FORM
ATION
65W
OO
LWO
RTHS G
ROU
P A
NN
UA
L REPORT 2020
3.3 TREATMENT OF UNVESTED EQUITY AWARDS UPON EXIT
For the DSTI and LTI plans the Board has overriding discretion over the treatment of awards when an executive ceases employment. At the 2017 AGM, shareholders approved the approach that the Board proposes to take when exercising this discretion to determine how unvested share rights awards will be treated when an executive ceases employment with us. We will seek shareholder approval to continue these arrangements at the 2020 AGM.
REASON FOR LEAVING DEFERRED STI UNVESTED LTI
Genuine retirementRemain on foot until the end of the deferral period and vest at that time
Award pro-rated for portion of the performance period participant has worked and remains ‘on foot’ until the end of the performance periodDeath, illness and incapacity
Termination for cause/gross misconduct/poor performance Award forfeited Award forfeited
Resignation Award forfeited Award forfeited
Mutual separation, redundancy, or other reasons as determined by Board
The Board will determine the appropriate treatment in the circumstances on a case by case basis
In cases of resignation, the Board will consider the circumstances surrounding each case to allow for the appropriate treatment. For instance, where the executive is not resigning to join a direct competitor and all reasonable steps have been taken to continue to support the success of the business through to their final date of employment, the Board may consider it appropriate to allow some incentive awards to remain on foot. The Board will continue to monitor the executive post employment and if they do not meet their post-employment obligations, the Board may lapse any remaining awards. For clarity, in cases where the executive resigns to join a competitor organisation, or in the Board’s opinion, the executive does not support the business to their final day of employment, any unvested DSTI and LTI will generally lapse.
3.4 OTHER GOVERNANCE REQUIREMENTS
Hedging policy
Under the Securities Trading Policy, senior executives may not enter into any derivative (including hedging) transaction that will protect the value of either unvested securities or vested securities that are subject to a disposal restriction, issued as part of our share plans. Compliance with the policy is a condition of participation in the plans.
Malus policy
The Executive KMP STI and LTI arrangements are subject to malus provisions that enable the Board to adjust unpaid and/or unvested awards (including to reduce to zero) where it is appropriate to do so. The Board may determine that any unpaid cash STI or unvested DSTI or LTI awards will be forfeited in the event of wilful misconduct, dishonesty or severe breach of our Code of Conduct by the executive. The Board may also adjust these awards in cases of unexpected or unforeseen events impacting performance outcomes, performance with regard to non-financial risk, an outcome which would cause significant reputational damage to the Woolworths Group brand, or a broader assessment of performance indicating there should be an adjustment.
Minimum shareholding requirements
• CEO: Equal to 200% of TFR.• Other Executive KMP: Equal to 100% of TFR.• Compliance is required within four years of appointment for the CEO and within five years for other
Executive KMP.
Dividends Shares equivalent to the value of dividends that would have been earned over the performance period are provided at the time of vesting. No dividend equivalent shares will be provided on awards (or portions thereof) that do not vest.
Remuneration Report
66
4 NON-EXECUTIVE DIRECTORS’ ARRANGEMENTS
4.1 NON-EXECUTIVE DIRECTORS’ REMUNERATION POLICY AND STRUCTURE
Non-executive Director fees are paid from an aggregate annual fee pool of $4,000,000, as approved by shareholders at the AGM on 18 November 2010. Total Board and Committee fees paid during F20 were $3,032,491 (refer to Section 5.1 for individual details).
Non-executive Directors do not receive variable pay and no Directors’ fees are paid to Executive Directors.
The table below provides a summary of F20 Board and Committee fees:
CHAIR MEMBER
BOARD AND COMMITTEE FEES ($)F20 FEE
INCL. SUPERF20 FEE
INCL. SUPER
Board $790,531 $254,990Audit, Risk Management & Compliance Committee $65,000 $32,500People Performance Committee $65,000 $32,500Sustainability Committee $65,000 $32,500Nomination Committee Nil Nil
4.2 NON-EXECUTIVE DIRECTORS’ MINIMUM SHAREHOLDING REQUIREMENT
Non-executive Directors are required to hold a minimum number of shares for alignment with other shareholders. The minimum shareholding requirement is:• Chair – 200% of the annual Chair fee by 1 July 2022.• Other Non-executive Directors – 100% of the annual base fee within three years of appointment.
The shares or share instruments may be held personally, by a close family member, within a self-managed superannuation fund, or by a family trust or private company.
As of the financial year end, all Non-executive Directors hold, or are on track to achieve, the minimum shareholding requirement. Details of the current shareholdings for Non-executive Directors as at 28 June 2020 are provided in Section 5.3.
4.3 NON-EXECUTIVE DIRECTORS’ EQUITY PLAN
The Non-executive Director equity plan (the plan) was introduced in F18 to further encourage and facilitate share ownership for Board members. The plan provides an automated mechanism for participants to acquire shares, recognising that Non-executive Directors can often be limited in their ability to purchase shares because of Australian insider trading laws. Non-executive Director share rights are allocated quarterly at the same time as the underlying shares are issued to the plan’s trustee, and the rights convert into ordinary shares each half year, subject to compliance with the Company’s Securities Trading Policy.
The plan supports the minimum shareholding requirement for Board members as it allows Non-executive Directors to reach the minimum shareholding requirements more quickly, as shares are acquired on a pre-tax basis. Details of the share rights allocated to Non-executive Directors are set out in Section 5.2.
In F20, shareholders approved the extension of this plan to US-based Directors, with changes to reflect the dual requirements of US and Australian laws. The US Non-executive Director share rights remain on foot and convert into shares at the end of the Director’s tenure or other prescribed events. Shares equivalent to the dividends that would have been earned on those rights will vest at the same time.
NON-EXECUTIVE DIRECTORS’ ARRANGEMENTS 4
1
2
3
4
5
PERFORM
AN
CEH
IGH
LIGH
TSBU
SINESS
REVIEW
DIRECTO
RS' REPO
RTFIN
AN
CIAL
REPORT
OTH
ER IN
FORM
ATION
67
WO
OLW
ORTH
S GRO
UP
AN
NU
AL REPO
RT 2020
3.3 TREATMENT OF UNVESTED EQUITY AWARDS UPON EXIT
For the DSTI and LTI plans the Board has overriding discretion over the treatment of awards when an executive ceases employment. At the 2017 AGM, shareholders approved the approach that the Board proposes to take when exercising this discretion to determine how unvested share rights awards will be treated when an executive ceases employment with us. We will seek shareholder approval to continue these arrangements at the 2020 AGM.
REASON FOR LEAVING DEFERRED STI UNVESTED LTI
Genuine retirementRemain on foot until the end of the deferral period and vest at that time
Award pro-rated for portion of the performance period participant has worked and remains ‘on foot’ until the end of the performance periodDeath, illness and incapacity
Termination for cause/gross misconduct/poor performance Award forfeited Award forfeited
Resignation Award forfeited Award forfeited
Mutual separation, redundancy, or other reasons as determined by Board
The Board will determine the appropriate treatment in the circumstances on a case by case basis
In cases of resignation, the Board will consider the circumstances surrounding each case to allow for the appropriate treatment. For instance, where the executive is not resigning to join a direct competitor and all reasonable steps have been taken to continue to support the success of the business through to their final date of employment, the Board may consider it appropriate to allow some incentive awards to remain on foot. The Board will continue to monitor the executive post employment and if they do not meet their post-employment obligations, the Board may lapse any remaining awards. For clarity, in cases where the executive resigns to join a competitor organisation, or in the Board’s opinion, the executive does not support the business to their final day of employment, any unvested DSTI and LTI will generally lapse.
3.4 OTHER GOVERNANCE REQUIREMENTS
Hedging policy
Under the Securities Trading Policy, senior executives may not enter into any derivative (including hedging) transaction that will protect the value of either unvested securities or vested securities that are subject to a disposal restriction, issued as part of our share plans. Compliance with the policy is a condition of participation in the plans.
Malus policy
The Executive KMP STI and LTI arrangements are subject to malus provisions that enable the Board to adjust unpaid and/or unvested awards (including to reduce to zero) where it is appropriate to do so. The Board may determine that any unpaid cash STI or unvested DSTI or LTI awards will be forfeited in the event of wilful misconduct, dishonesty or severe breach of our Code of Conduct by the executive. The Board may also adjust these awards in cases of unexpected or unforeseen events impacting performance outcomes, performance with regard to non-financial risk, an outcome which would cause significant reputational damage to the Woolworths Group brand, or a broader assessment of performance indicating there should be an adjustment.
Minimum shareholding requirements
• CEO: Equal to 200% of TFR.• Other Executive KMP: Equal to 100% of TFR.• Compliance is required within four years of appointment for the CEO and within five years for other
Executive KMP.
Dividends Shares equivalent to the value of dividends that would have been earned over the performance period are provided at the time of vesting. No dividend equivalent shares will be provided on awards (or portions thereof) that do not vest.
Remuneration Report
66
4 NON-EXECUTIVE DIRECTORS’ ARRANGEMENTS
4.1 NON-EXECUTIVE DIRECTORS’ REMUNERATION POLICY AND STRUCTURE
Non-executive Director fees are paid from an aggregate annual fee pool of $4,000,000, as approved by shareholders at the AGM on 18 November 2010. Total Board and Committee fees paid during F20 were $3,032,491 (refer to Section 5.1 for individual details).
Non-executive Directors do not receive variable pay and no Directors’ fees are paid to Executive Directors.
The table below provides a summary of F20 Board and Committee fees:
CHAIR MEMBER
BOARD AND COMMITTEE FEES ($)F20 FEE
INCL. SUPERF20 FEE
INCL. SUPER
Board $790,531 $254,990Audit, Risk Management & Compliance Committee $65,000 $32,500People Performance Committee $65,000 $32,500Sustainability Committee $65,000 $32,500Nomination Committee Nil Nil
4.2 NON-EXECUTIVE DIRECTORS’ MINIMUM SHAREHOLDING REQUIREMENT
Non-executive Directors are required to hold a minimum number of shares for alignment with other shareholders. The minimum shareholding requirement is:• Chair – 200% of the annual Chair fee by 1 July 2022.• Other Non-executive Directors – 100% of the annual base fee within three years of appointment.
The shares or share instruments may be held personally, by a close family member, within a self-managed superannuation fund, or by a family trust or private company.
As of the financial year end, all Non-executive Directors hold, or are on track to achieve, the minimum shareholding requirement. Details of the current shareholdings for Non-executive Directors as at 28 June 2020 are provided in Section 5.3.
4.3 NON-EXECUTIVE DIRECTORS’ EQUITY PLAN
The Non-executive Director equity plan (the plan) was introduced in F18 to further encourage and facilitate share ownership for Board members. The plan provides an automated mechanism for participants to acquire shares, recognising that Non-executive Directors can often be limited in their ability to purchase shares because of Australian insider trading laws. Non-executive Director share rights are allocated quarterly at the same time as the underlying shares are issued to the plan’s trustee, and the rights convert into ordinary shares each half year, subject to compliance with the Company’s Securities Trading Policy.
The plan supports the minimum shareholding requirement for Board members as it allows Non-executive Directors to reach the minimum shareholding requirements more quickly, as shares are acquired on a pre-tax basis. Details of the share rights allocated to Non-executive Directors are set out in Section 5.2.
In F20, shareholders approved the extension of this plan to US-based Directors, with changes to reflect the dual requirements of US and Australian laws. The US Non-executive Director share rights remain on foot and convert into shares at the end of the Director’s tenure or other prescribed events. Shares equivalent to the dividends that would have been earned on those rights will vest at the same time.
NON-EXECUTIVE DIRECTORS’ ARRANGEMENTS 4
1
2
3
4
5
PERFORM
AN
CEH
IGH
LIGH
TSBU
SINESS
REVIEW
DIRECTO
RS' REPO
RTFIN
AN
CIAL
REPORT
OTH
ER IN
FORM
ATION
67W
OO
LWO
RTHS G
ROU
P A
NN
UA
L REPORT 2020
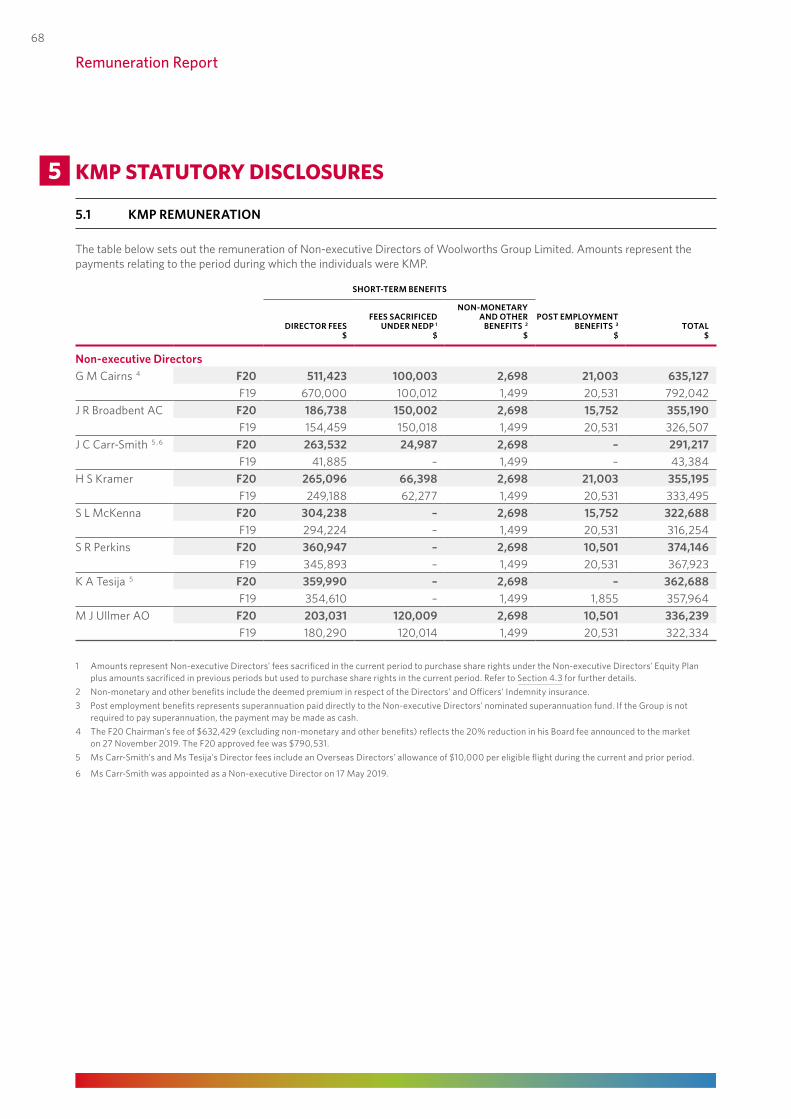
Remuneration Report
5 KMP STATUTORY DISCLOSURES
5.1 KMP REMUNERATION
The table below sets out the remuneration of Non-executive Directors of Woolworths Group Limited. Amounts represent the payments relating to the period during which the individuals were KMP.
SHORT-TERM BENEFITS
DIRECTOR FEES $
FEES SACRIFICED UNDER NEDP 1
$
NON-MONETARY AND OTHER
BENEFITS 2 $
POST EMPLOYMENT BENEFITS 3
$ TOTAL
$
Non-executive DirectorsG M Cairns 4 F20 511,423 100,003 2,698 21,003 635,127
F19 670,000 100,012 1,499 20,531 792,042 J R Broadbent AC F20 186,738 150,002 2,698 15,752 355,190
F19 154,459 150,018 1,499 20,531 326,507 J C Carr-Smith 5 , 6 F20 263,532 24,987 2,698 – 291,217
F19 41,885 – 1,499 – 43,384 H S Kramer F20 265,096 66,398 2,698 21,003 355,195
F19 249,188 62,277 1,499 20,531 333,495 S L McKenna F20 304,238 – 2,698 15,752 322,688
F19 294,224 – 1,499 20,531 316,254 S R Perkins F20 360,947 – 2,698 10,501 374,146
F19 345,893 – 1,499 20,531 367,923 K A Tesija 5 F20 359,990 – 2,698 – 362,688
F19 354,610 – 1,499 1,855 357,964 M J Ullmer AO F20 203,031 120,009 2,698 10,501 336,239
F19 180,290 120,014 1,499 20,531 322,334
1 Amounts represent Non-executive Directors' fees sacrificed in the current period to purchase share rights under the Non-executive Directors' Equity Plan plus amounts sacrificed in previous periods but used to purchase share rights in the current period. Refer to Section 4.3 for further details.
2 Non-monetary and other benefits include the deemed premium in respect of the Directors’ and Officers’ Indemnity insurance.3 Post employment benefits represents superannuation paid directly to the Non-executive Directors' nominated superannuation fund. If the Group is not
required to pay superannuation, the payment may be made as cash.4 The F20 Chairman's fee of $632,429 (excluding non-monetary and other benefits) reflects the 20% reduction in his Board fee announced to the market
on 27 November 2019. The F20 approved fee was $790,531.5 Ms Carr-Smith's and Ms Tesija's Director fees include an Overseas Directors' allowance of $10,000 per eligible flight during the current and prior period.
6 Ms Carr-Smith was appointed as a Non-executive Director on 17 May 2019.
68
5KMP STATUTORY DISCLOSURES
The table below sets out the remuneration of Executive KMP of Woolworths Group Limited. Amounts represent the payments relating to the period during which the individuals were KMP.
SHORT-TERM BENEFITS SHARE-BASED PAYMENTS6
SALARY 1 $
CASH INCENTIVE 2
$
NON-MONETARY AND OTHER
BENEFITS 3 $
POST EMPLOYMENT
BENEFITS 4 $
OTHER LONG-TERM
BENEFITS 5 $
EQUITY GRANTS
AT RISK 7 $
OTHER EQUITY
GRANTS 8 $
TOTAL $
Executive KMPB L Banducci F20 2,633,994 – 2,698 25,000 39,239 2,247,457 1,160,049 6,108,437
F19 2,666,748 973,830 1,499 25,000 54,832 2,612,049 1,372,325 7,706,283 S J Donohue F20 946,943 336,700 2,698 25,000 14,266 753,728 186,725 2,266,060
F19 892,126 294,805 1,499 76,442 52,509 879,367 23,182 2,219,930 S Harrison 9 F20 823,231 285,542 2,473 22,917 35,232 526,398 – 1,695,793 D P Marr 9 F20 109,348 36,458 225 2,083 1,574 82,953 32,113 264,754
F19 1,230,129 446,906 1,499 25,000 22,647 1,289,061 319,471 3,334,714 C E Peters F20 1,325,733 455,000 291,001 – 19,030 1,056,467 430,808 3,578,039
F19 1,298,775 442,650 112,357 – 19,096 1,029,571 469,691 3,372,140
1 Salary includes the net change in accrued annual leave within the period and a car allowance.2 Represents the cash component of the F20 STI which was 50% of the total STI award. The remaining 50% is deferred in share rights for two years.3 Non-monetary and other benefits include the deemed premium in respect of the Directors’ and Officers’ Indemnity insurance and, where applicable,
relocation benefits and associated fringe benefits tax.4 Post employment benefits represents superannuation paid directly to the Executive KMP's nominated superannuation fund. If the Group is not required
to pay superannuation, the payment may be made as cash.5 Other long-term benefits represents the net change in accrued long service leave within the period.6 Represents the portion of the grant date fair value of share rights expected to vest and is recognised as an expense over the vesting period. The amount
recognised is adjusted to reflect the expected number of instruments that will vest for non-market based performance conditions including ROFE and sales per square metre. No adjustment for non-vesting is made for failure to achieve the relative TSR performance hurdle, as this is taken into account in the fair value at grant date.
7 The fair value of share rights with the relative TSR performance measure is calculated at the date of grant using a Monte Carlo simulation model, whilst the fair value of other share rights is calculated using a Black-Scholes option pricing model.
8 Other equity grants are grants which are not subject to any further performance conditions except continuous employment, subject to the operation of the Group's malus policy.
9 Mr Harrison became an Executive KMP on 1 August 2019, after commencing as Chief Financial Officer. Mr Marr ceased to be an Executive KMP as of 1 August 2019 when he transitioned from the CFO role to the COO role overseeing the separation of Endeavour Group. Amounts represent the payments relating to the period during which the individuals were KMP.
5.1 KMP REMUNERATION
1
2
3
4
5
PERFORM
AN
CE
HIG
HLIG
HTS
BUSIN
ESS REV
IEWD
IRECTORS'
REPORT
FINA
NC
IAL
REPORT
OTH
ER IN
FORM
ATION
69
WO
OLW
ORTH
S GRO
UP
AN
NU
AL REPO
RT 2020
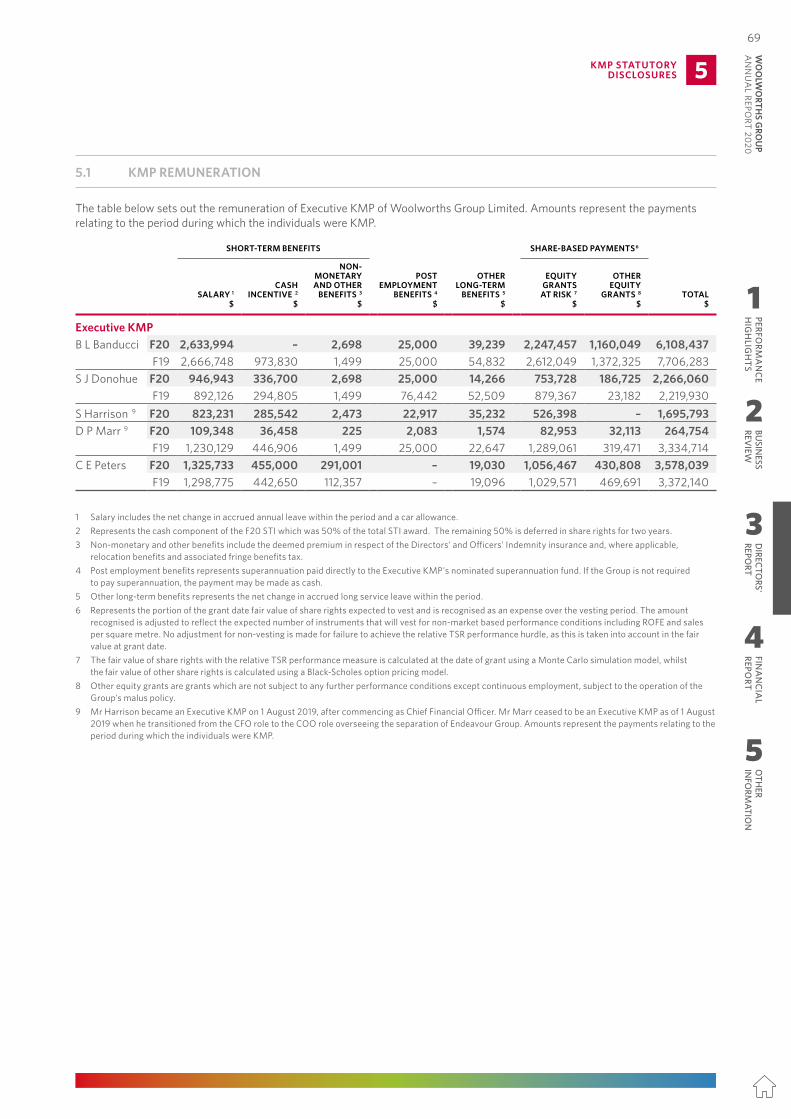
Remuneration Report
5 KMP STATUTORY DISCLOSURES
5.1 KMP REMUNERATION
The table below sets out the remuneration of Non-executive Directors of Woolworths Group Limited. Amounts represent the payments relating to the period during which the individuals were KMP.
SHORT-TERM BENEFITS
DIRECTOR FEES $
FEES SACRIFICED UNDER NEDP 1
$
NON-MONETARY AND OTHER
BENEFITS 2 $
POST EMPLOYMENT BENEFITS 3
$ TOTAL
$
Non-executive DirectorsG M Cairns 4 F20 511,423 100,003 2,698 21,003 635,127
F19 670,000 100,012 1,499 20,531 792,042 J R Broadbent AC F20 186,738 150,002 2,698 15,752 355,190
F19 154,459 150,018 1,499 20,531 326,507 J C Carr-Smith 5 , 6 F20 263,532 24,987 2,698 – 291,217
F19 41,885 – 1,499 – 43,384 H S Kramer F20 265,096 66,398 2,698 21,003 355,195
F19 249,188 62,277 1,499 20,531 333,495 S L McKenna F20 304,238 – 2,698 15,752 322,688
F19 294,224 – 1,499 20,531 316,254 S R Perkins F20 360,947 – 2,698 10,501 374,146
F19 345,893 – 1,499 20,531 367,923 K A Tesija 5 F20 359,990 – 2,698 – 362,688
F19 354,610 – 1,499 1,855 357,964 M J Ullmer AO F20 203,031 120,009 2,698 10,501 336,239
F19 180,290 120,014 1,499 20,531 322,334
1 Amounts represent Non-executive Directors' fees sacrificed in the current period to purchase share rights under the Non-executive Directors' Equity Plan plus amounts sacrificed in previous periods but used to purchase share rights in the current period. Refer to Section 4.3 for further details.
2 Non-monetary and other benefits include the deemed premium in respect of the Directors’ and Officers’ Indemnity insurance.3 Post employment benefits represents superannuation paid directly to the Non-executive Directors' nominated superannuation fund. If the Group is not
required to pay superannuation, the payment may be made as cash.4 The F20 Chairman's fee of $632,429 (excluding non-monetary and other benefits) reflects the 20% reduction in his Board fee announced to the market
on 27 November 2019. The F20 approved fee was $790,531.5 Ms Carr-Smith's and Ms Tesija's Director fees include an Overseas Directors' allowance of $10,000 per eligible flight during the current and prior period.
6 Ms Carr-Smith was appointed as a Non-executive Director on 17 May 2019.
68
5KMP STATUTORY DISCLOSURES
The table below sets out the remuneration of Executive KMP of Woolworths Group Limited. Amounts represent the payments relating to the period during which the individuals were KMP.
SHORT-TERM BENEFITS SHARE-BASED PAYMENTS6
SALARY 1 $
CASH INCENTIVE 2
$
NON-MONETARY AND OTHER
BENEFITS 3 $
POST EMPLOYMENT
BENEFITS 4 $
OTHER LONG-TERM
BENEFITS 5 $
EQUITY GRANTS
AT RISK 7 $
OTHER EQUITY
GRANTS 8 $
TOTAL $
Executive KMPB L Banducci F20 2,633,994 – 2,698 25,000 39,239 2,247,457 1,160,049 6,108,437
F19 2,666,748 973,830 1,499 25,000 54,832 2,612,049 1,372,325 7,706,283 S J Donohue F20 946,943 336,700 2,698 25,000 14,266 753,728 186,725 2,266,060
F19 892,126 294,805 1,499 76,442 52,509 879,367 23,182 2,219,930 S Harrison 9 F20 823,231 285,542 2,473 22,917 35,232 526,398 – 1,695,793 D P Marr 9 F20 109,348 36,458 225 2,083 1,574 82,953 32,113 264,754
F19 1,230,129 446,906 1,499 25,000 22,647 1,289,061 319,471 3,334,714 C E Peters F20 1,325,733 455,000 291,001 – 19,030 1,056,467 430,808 3,578,039
F19 1,298,775 442,650 112,357 – 19,096 1,029,571 469,691 3,372,140
1 Salary includes the net change in accrued annual leave within the period and a car allowance.2 Represents the cash component of the F20 STI which was 50% of the total STI award. The remaining 50% is deferred in share rights for two years.3 Non-monetary and other benefits include the deemed premium in respect of the Directors’ and Officers’ Indemnity insurance and, where applicable,
relocation benefits and associated fringe benefits tax.4 Post employment benefits represents superannuation paid directly to the Executive KMP's nominated superannuation fund. If the Group is not required
to pay superannuation, the payment may be made as cash.5 Other long-term benefits represents the net change in accrued long service leave within the period.6 Represents the portion of the grant date fair value of share rights expected to vest and is recognised as an expense over the vesting period. The amount
recognised is adjusted to reflect the expected number of instruments that will vest for non-market based performance conditions including ROFE and sales per square metre. No adjustment for non-vesting is made for failure to achieve the relative TSR performance hurdle, as this is taken into account in the fair value at grant date.
7 The fair value of share rights with the relative TSR performance measure is calculated at the date of grant using a Monte Carlo simulation model, whilst the fair value of other share rights is calculated using a Black-Scholes option pricing model.
8 Other equity grants are grants which are not subject to any further performance conditions except continuous employment, subject to the operation of the Group's malus policy.
9 Mr Harrison became an Executive KMP on 1 August 2019, after commencing as Chief Financial Officer. Mr Marr ceased to be an Executive KMP as of 1 August 2019 when he transitioned from the CFO role to the COO role overseeing the separation of Endeavour Group. Amounts represent the payments relating to the period during which the individuals were KMP.
5.1 KMP REMUNERATION
1
2
3
4
5
PERFORM
AN
CE
HIG
HLIG
HTS
BUSIN
ESS REV
IEWD
IRECTORS'
REPORT
FINA
NC
IAL
REPORT
OTH
ER IN
FORM
ATION
69W
OO
LWO
RTHS G
ROU
P A
NN
UA
L REPORT 2020
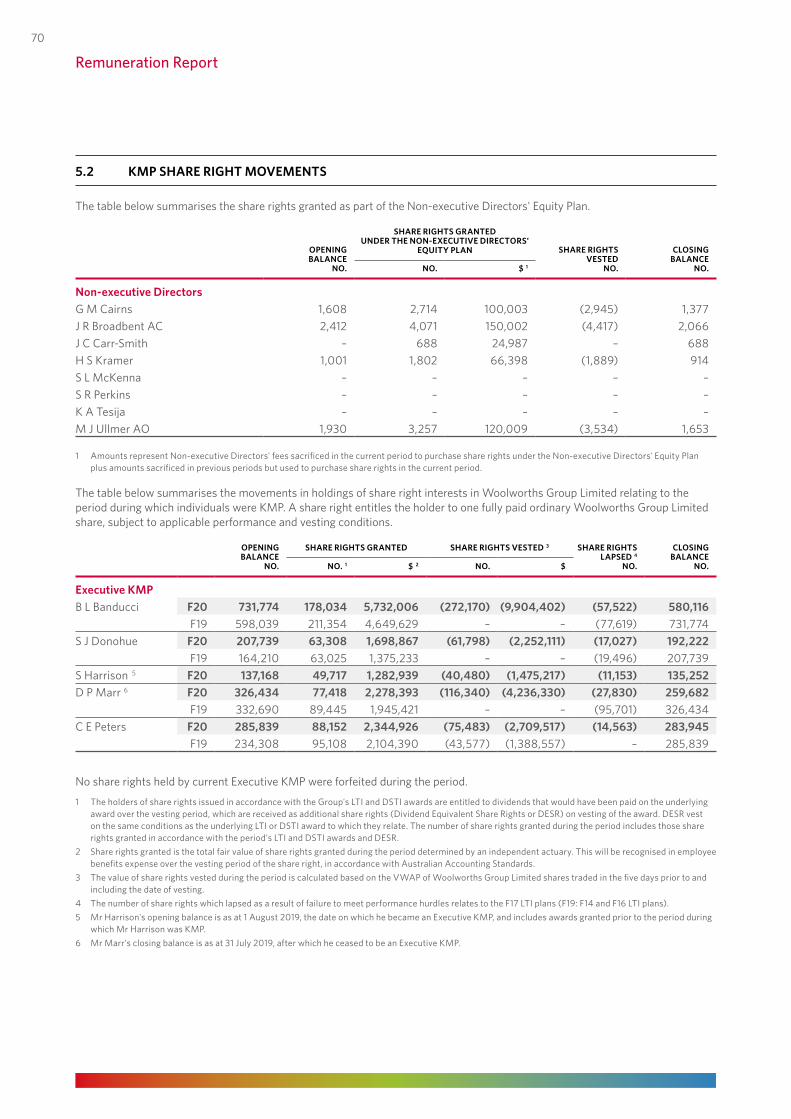
Remuneration Report
5.2 KMP SHARE RIGHT MOVEMENTS
The table below summarises the share rights granted as part of the Non-executive Directors' Equity Plan.
OPENING BALANCE
NO.
SHARE RIGHTS GRANTED UNDER THE NON-EXECUTIVE DIRECTORS'
EQUITY PLAN SHARE RIGHTS VESTED
NO.
CLOSING BALANCE
NO.NO. $ 1
Non-executive DirectorsG M Cairns 1,608 2,714 100,003 (2,945) 1,377 J R Broadbent AC 2,412 4,071 150,002 (4,417) 2,066 J C Carr-Smith – 688 24,987 – 688 H S Kramer 1,001 1,802 66,398 (1,889) 914 S L McKenna – – – – – S R Perkins – – – – – K A Tesija – – – – – M J Ullmer AO 1,930 3,257 120,009 (3,534) 1,653
1 Amounts represent Non-executive Directors' fees sacrificed in the current period to purchase share rights under the Non-executive Directors' Equity Plan plus amounts sacrificed in previous periods but used to purchase share rights in the current period.
The table below summarises the movements in holdings of share right interests in Woolworths Group Limited relating to the period during which individuals were KMP. A share right entitles the holder to one fully paid ordinary Woolworths Group Limited share, subject to applicable performance and vesting conditions.
OPENING BALANCE
NO.
SHARE RIGHTS GRANTED SHARE RIGHTS VESTED 3 SHARE RIGHTS LAPSED 4
NO.
CLOSING BALANCE
NO.NO. 1 $ 2 NO. $
Executive KMPB L Banducci F20 731,774 178,034 5,732,006 (272,170) (9,904,402) (57,522) 580,116
F19 598,039 211,354 4,649,629 – – (77,619) 731,774 S J Donohue F20 207,739 63,308 1,698,867 (61,798) (2,252,111) (17,027) 192,222
F19 164,210 63,025 1,375,233 – – (19,496) 207,739 S Harrison 5 F20 137,168 49,717 1,282,939 (40,480) (1,475,217) (11,153) 135,252 D P Marr 6 F20 326,434 77,418 2,278,393 (116,340) (4,236,330) (27,830) 259,682
F19 332,690 89,445 1,945,421 – – (95,701) 326,434 C E Peters F20 285,839 88,152 2,344,926 (75,483) (2,709,517) (14,563) 283,945
F19 234,308 95,108 2,104,390 (43,577) (1,388,557) – 285,839
No share rights held by current Executive KMP were forfeited during the period.
1 The holders of share rights issued in accordance with the Group's LTI and DSTI awards are entitled to dividends that would have been paid on the underlying award over the vesting period, which are received as additional share rights (Dividend Equivalent Share Rights or DESR) on vesting of the award. DESR vest on the same conditions as the underlying LTI or DSTI award to which they relate. The number of share rights granted during the period includes those share rights granted in accordance with the period's LTI and DSTI awards and DESR.
2 Share rights granted is the total fair value of share rights granted during the period determined by an independent actuary. This will be recognised in employee benefits expense over the vesting period of the share right, in accordance with Australian Accounting Standards.
3 The value of share rights vested during the period is calculated based on the VWAP of Woolworths Group Limited shares traded in the five days prior to and including the date of vesting.
4 The number of share rights which lapsed as a result of failure to meet performance hurdles relates to the F17 LTI plans (F19: F14 and F16 LTI plans).5 Mr Harrison's opening balance is as at 1 August 2019, the date on which he became an Executive KMP, and includes awards granted prior to the period during
which Mr Harrison was KMP.6 Mr Marr's closing balance is as at 31 July 2019, after which he ceased to be an Executive KMP.
70
5KMP STATUTORY DISCLOSURES
5.3 KMP SHARE MOVEMENTS
The table below summarises the movements in F20 of interests in shares of Woolworths Group Limited relating to the period during which individuals were KMP.
OPENING BALANCE
NO.
SHARES ISSUED UNDER DRP
NO.
SHARES RECEIVED ON VESTING OF SHARE RIGHTS
NO.
SHARES PURCHASED/
(DISPOSED) NO.
CLOSING BALANCE
NO.
Non-executive DirectorsG M Cairns 31,621 782 2,945 – 35,348 J R Broadbent AC 69,057 – 4,417 – 73,474 J C Carr-Smith – – – – – H S Kramer 9,599 – 1,889 – 11,488 S L McKenna 10,644 86 – – 10,730 S R Perkins 17,473 – – – 17,473 K A Tesija 8,980 – – – 8,980 M J Ullmer AO 24,275 – 3,534 – 27,809
Executive KMPB L Banducci 53,638 – 272,170 (130,000) 195,808 S J Donohue 20,257 – 61,798 (55,978) 26,077 S Harrison 1 4,435 – 40,480 (19,915) 25,000 D P Marr 2 55,990 – 116,340 – 172,330 C E Peters 23,600 – 75,483 (76,458) 22,625
1 Mr Harrison's opening balance is as at 1 August 2019, the date on which he became an Executive KMP, and includes awards granted prior to the period during which Mr Harrison was KMP.
2 Mr Marr's closing balance is as at 31 July 2019, after which he ceased to be an Executive KMP.
1
2
3
4
5
PERFORM
AN
CE
HIG
HLIG
HTS
BUSIN
ESS REV
IEWD
IRECTORS'
REPORT
FINA
NC
IAL
REPORT
OTH
ER IN
FORM
ATION
71
WO
OLW
ORTH
S GRO
UP
AN
NU
AL REPO
RT 2020
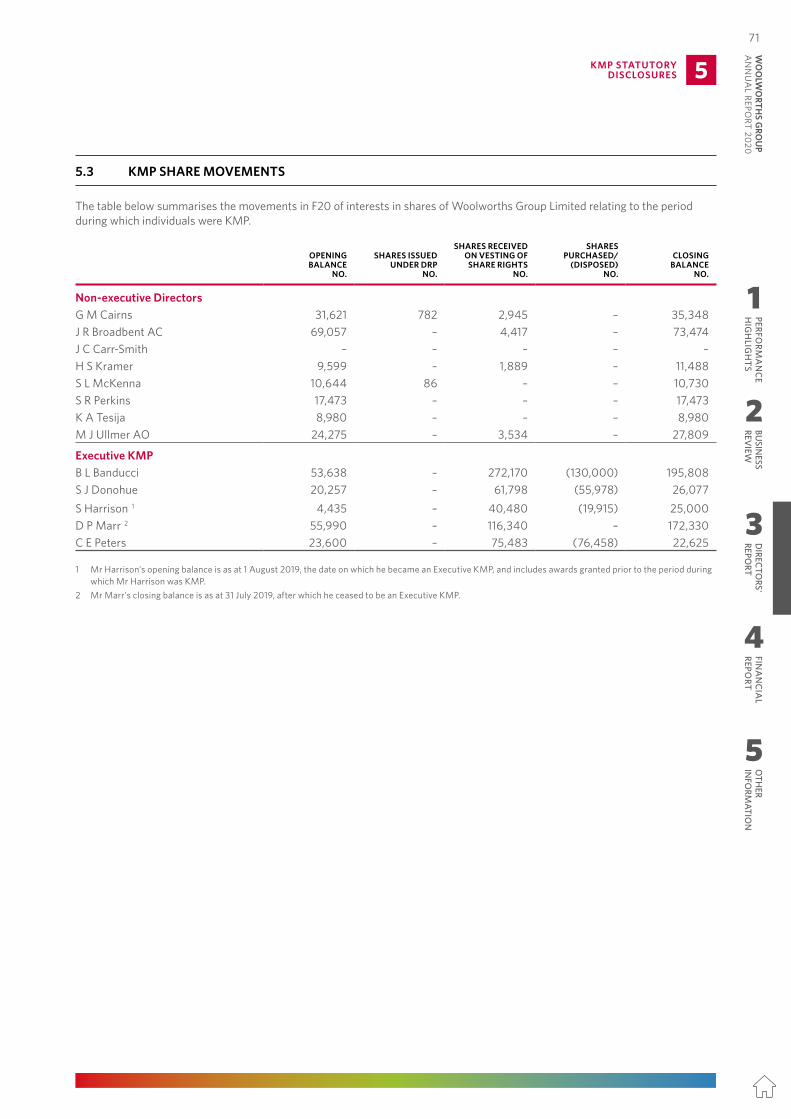
Remuneration Report
5.2 KMP SHARE RIGHT MOVEMENTS
The table below summarises the share rights granted as part of the Non-executive Directors' Equity Plan.
OPENING BALANCE
NO.
SHARE RIGHTS GRANTED UNDER THE NON-EXECUTIVE DIRECTORS'
EQUITY PLAN SHARE RIGHTS VESTED
NO.
CLOSING BALANCE
NO.NO. $ 1
Non-executive DirectorsG M Cairns 1,608 2,714 100,003 (2,945) 1,377 J R Broadbent AC 2,412 4,071 150,002 (4,417) 2,066 J C Carr-Smith – 688 24,987 – 688 H S Kramer 1,001 1,802 66,398 (1,889) 914 S L McKenna – – – – – S R Perkins – – – – – K A Tesija – – – – – M J Ullmer AO 1,930 3,257 120,009 (3,534) 1,653
1 Amounts represent Non-executive Directors' fees sacrificed in the current period to purchase share rights under the Non-executive Directors' Equity Plan plus amounts sacrificed in previous periods but used to purchase share rights in the current period.
The table below summarises the movements in holdings of share right interests in Woolworths Group Limited relating to the period during which individuals were KMP. A share right entitles the holder to one fully paid ordinary Woolworths Group Limited share, subject to applicable performance and vesting conditions.
OPENING BALANCE
NO.
SHARE RIGHTS GRANTED SHARE RIGHTS VESTED 3 SHARE RIGHTS LAPSED 4
NO.
CLOSING BALANCE
NO.NO. 1 $ 2 NO. $
Executive KMPB L Banducci F20 731,774 178,034 5,732,006 (272,170) (9,904,402) (57,522) 580,116
F19 598,039 211,354 4,649,629 – – (77,619) 731,774 S J Donohue F20 207,739 63,308 1,698,867 (61,798) (2,252,111) (17,027) 192,222
F19 164,210 63,025 1,375,233 – – (19,496) 207,739 S Harrison 5 F20 137,168 49,717 1,282,939 (40,480) (1,475,217) (11,153) 135,252 D P Marr 6 F20 326,434 77,418 2,278,393 (116,340) (4,236,330) (27,830) 259,682
F19 332,690 89,445 1,945,421 – – (95,701) 326,434 C E Peters F20 285,839 88,152 2,344,926 (75,483) (2,709,517) (14,563) 283,945
F19 234,308 95,108 2,104,390 (43,577) (1,388,557) – 285,839
No share rights held by current Executive KMP were forfeited during the period.
1 The holders of share rights issued in accordance with the Group's LTI and DSTI awards are entitled to dividends that would have been paid on the underlying award over the vesting period, which are received as additional share rights (Dividend Equivalent Share Rights or DESR) on vesting of the award. DESR vest on the same conditions as the underlying LTI or DSTI award to which they relate. The number of share rights granted during the period includes those share rights granted in accordance with the period's LTI and DSTI awards and DESR.
2 Share rights granted is the total fair value of share rights granted during the period determined by an independent actuary. This will be recognised in employee benefits expense over the vesting period of the share right, in accordance with Australian Accounting Standards.
3 The value of share rights vested during the period is calculated based on the VWAP of Woolworths Group Limited shares traded in the five days prior to and including the date of vesting.
4 The number of share rights which lapsed as a result of failure to meet performance hurdles relates to the F17 LTI plans (F19: F14 and F16 LTI plans).5 Mr Harrison's opening balance is as at 1 August 2019, the date on which he became an Executive KMP, and includes awards granted prior to the period during
which Mr Harrison was KMP.6 Mr Marr's closing balance is as at 31 July 2019, after which he ceased to be an Executive KMP.
70
5KMP STATUTORY DISCLOSURES
5.3 KMP SHARE MOVEMENTS
The table below summarises the movements in F20 of interests in shares of Woolworths Group Limited relating to the period during which individuals were KMP.
OPENING BALANCE
NO.
SHARES ISSUED UNDER DRP
NO.
SHARES RECEIVED ON VESTING OF SHARE RIGHTS
NO.
SHARES PURCHASED/
(DISPOSED) NO.
CLOSING BALANCE
NO.
Non-executive DirectorsG M Cairns 31,621 782 2,945 – 35,348 J R Broadbent AC 69,057 – 4,417 – 73,474 J C Carr-Smith – – – – – H S Kramer 9,599 – 1,889 – 11,488 S L McKenna 10,644 86 – – 10,730 S R Perkins 17,473 – – – 17,473 K A Tesija 8,980 – – – 8,980 M J Ullmer AO 24,275 – 3,534 – 27,809
Executive KMPB L Banducci 53,638 – 272,170 (130,000) 195,808 S J Donohue 20,257 – 61,798 (55,978) 26,077 S Harrison 1 4,435 – 40,480 (19,915) 25,000 D P Marr 2 55,990 – 116,340 – 172,330 C E Peters 23,600 – 75,483 (76,458) 22,625
1 Mr Harrison's opening balance is as at 1 August 2019, the date on which he became an Executive KMP, and includes awards granted prior to the period during which Mr Harrison was KMP.
2 Mr Marr's closing balance is as at 31 July 2019, after which he ceased to be an Executive KMP.
1
2
3
4
5
PERFORM
AN
CE
HIG
HLIG
HTS
BUSIN
ESS REV
IEWD
IRECTORS'
REPORT
FINA
NC
IAL
REPORT
OTH
ER IN
FORM
ATION
71W
OO
LWO
RTHS G
ROU
P A
NN
UA
L REPORT 2020
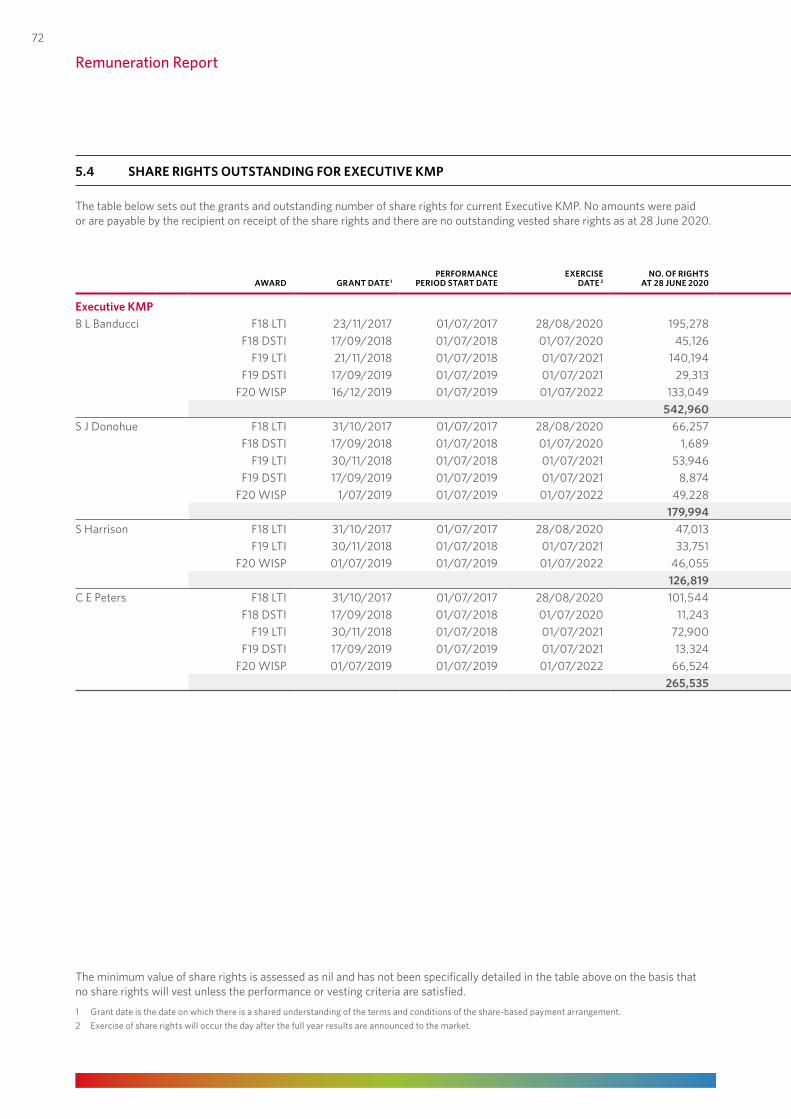
Remuneration Report
5.4 SHARE RIGHTS OUTSTANDING FOR EXECUTIVE KMP
The table below sets out the grants and outstanding number of share rights for current Executive KMP. No amounts were paid or are payable by the recipient on receipt of the share rights and there are no outstanding vested share rights as at 28 June 2020.
GRANT DATE FAIR VALUE OF PERFORMANCE SHARE RIGHT3
AWARD GRANT DATE 1PERFORMANCE
PERIOD START DATEEXERCISE
DATE 2 NO. OF RIGHTS
AT 28 JUNE 2020
DIVIDEND EQUIVALENT SHARE RIGHTS
AT 28 JUNE 2020 TSR SALES PER
TRADING SQM ROFE SIGN-ON AND DSTI
MAXIMUM VALUE OF AWARD TO VEST
($)4
Executive KMPB L Banducci F18 LTI 23/11/2017 01/07/2017 28/08/2020 195,278 20,496 $7.19 $26.87 $26.87 – 3,966,096
F18 DSTI 17/09/2018 01/07/2018 01/07/2020 45,126 2,967 – – – $27.45 1,238,709 F19 LTI 21/11/2018 01/07/2018 01/07/2021 140,194 9,171 $13.65 $29.67 $29.67 – 3,410,920
F19 DSTI 17/09/2019 01/07/2019 01/07/2021 29,313 816 – – – $36.91 1,081,943 F20 WISP 16/12/2019 01/07/2019 01/07/2022 133,049 3,706 $28.11 $38.37 $38.37 – 4,650,063
542,960 37,156 14,347,731 S J Donohue F18 LTI 31/10/2017 01/07/2017 28/08/2020 66,257 6,954 $7.59 $26.55 $26.55 – 1,340,379
F18 DSTI 17/09/2018 01/07/2018 01/07/2020 1,689 111 – – – $27.45 46,363 F19 LTI 30/11/2018 01/07/2018 01/07/2021 53,946 3,547 $14.46 $29.72 $29.72 – 1,328,870
F19 DSTI 17/09/2019 01/07/2019 01/07/2021 8,874 246 – – – $36.91 327,539 F20 WISP 1/07/2019 01/07/2019 01/07/2022 49,228 1,370 $17.53 $33.02 $33.02 – 1,371,328
179,994 12,228 4,414,479 S Harrison F18 LTI 31/10/2017 01/07/2017 28/08/2020 47,013 4,933 $7.59 $26.55 $26.55 – 951,073
F19 LTI 30/11/2018 01/07/2018 01/07/2021 33,751 2,218 $14.46 $29.72 $29.72 – 831,400 F20 WISP 01/07/2019 01/07/2019 01/07/2022 46,055 1,282 $17.53 $33.02 $33.02 – 1,282,939
126,819 8,433 3,065,412 C E Peters F18 LTI 31/10/2017 01/07/2017 28/08/2020 101,544 10,656 $7.59 $26.55 $26.55 – 2,054,235
F18 DSTI 17/09/2018 01/07/2018 01/07/2020 11,243 738 – – – $27.45 308,620 F19 LTI 30/11/2018 01/07/2018 01/07/2021 72,900 4,794 $14.46 $29.72 $29.72 – 1,795,770
F19 DSTI 17/09/2019 01/07/2019 01/07/2021 13,324 370 – – – $36.91 491,789 F20 WISP 01/07/2019 01/07/2019 01/07/2022 66,524 1,852 $17.53 $33.02 $33.02 – 1,853,137
265,535 18,410 6,503,551
The minimum value of share rights is assessed as nil and has not been specifically detailed in the table above on the basis that no share rights will vest unless the performance or vesting criteria are satisfied.
1 Grant date is the date on which there is a shared understanding of the terms and conditions of the share-based payment arrangement.2 Exercise of share rights will occur the day after the full year results are announced to the market.
72
5KMP STATUTORY DISCLOSURES
5.4 SHARE RIGHTS OUTSTANDING FOR EXECUTIVE KMP
The table below sets out the grants and outstanding number of share rights for current Executive KMP. No amounts were paid or are payable by the recipient on receipt of the share rights and there are no outstanding vested share rights as at 28 June 2020.
GRANT DATE FAIR VALUE OF PERFORMANCE SHARE RIGHT3
AWARD GRANT DATE 1PERFORMANCE
PERIOD START DATEEXERCISE
DATE 2 NO. OF RIGHTS
AT 28 JUNE 2020
DIVIDEND EQUIVALENT SHARE RIGHTS
AT 28 JUNE 2020 TSR SALES PER
TRADING SQM ROFE SIGN-ON AND DSTI
MAXIMUM VALUE OF AWARD TO VEST
($)4
Executive KMPB L Banducci F18 LTI 23/11/2017 01/07/2017 28/08/2020 195,278 20,496 $7.19 $26.87 $26.87 – 3,966,096
F18 DSTI 17/09/2018 01/07/2018 01/07/2020 45,126 2,967 – – – $27.45 1,238,709 F19 LTI 21/11/2018 01/07/2018 01/07/2021 140,194 9,171 $13.65 $29.67 $29.67 – 3,410,920
F19 DSTI 17/09/2019 01/07/2019 01/07/2021 29,313 816 – – – $36.91 1,081,943 F20 WISP 16/12/2019 01/07/2019 01/07/2022 133,049 3,706 $28.11 $38.37 $38.37 – 4,650,063
542,960 37,156 14,347,731 S J Donohue F18 LTI 31/10/2017 01/07/2017 28/08/2020 66,257 6,954 $7.59 $26.55 $26.55 – 1,340,379
F18 DSTI 17/09/2018 01/07/2018 01/07/2020 1,689 111 – – – $27.45 46,363 F19 LTI 30/11/2018 01/07/2018 01/07/2021 53,946 3,547 $14.46 $29.72 $29.72 – 1,328,870
F19 DSTI 17/09/2019 01/07/2019 01/07/2021 8,874 246 – – – $36.91 327,539 F20 WISP 1/07/2019 01/07/2019 01/07/2022 49,228 1,370 $17.53 $33.02 $33.02 – 1,371,328
179,994 12,228 4,414,479 S Harrison F18 LTI 31/10/2017 01/07/2017 28/08/2020 47,013 4,933 $7.59 $26.55 $26.55 – 951,073
F19 LTI 30/11/2018 01/07/2018 01/07/2021 33,751 2,218 $14.46 $29.72 $29.72 – 831,400 F20 WISP 01/07/2019 01/07/2019 01/07/2022 46,055 1,282 $17.53 $33.02 $33.02 – 1,282,939
126,819 8,433 3,065,412 C E Peters F18 LTI 31/10/2017 01/07/2017 28/08/2020 101,544 10,656 $7.59 $26.55 $26.55 – 2,054,235
F18 DSTI 17/09/2018 01/07/2018 01/07/2020 11,243 738 – – – $27.45 308,620 F19 LTI 30/11/2018 01/07/2018 01/07/2021 72,900 4,794 $14.46 $29.72 $29.72 – 1,795,770
F19 DSTI 17/09/2019 01/07/2019 01/07/2021 13,324 370 – – – $36.91 491,789 F20 WISP 01/07/2019 01/07/2019 01/07/2022 66,524 1,852 $17.53 $33.02 $33.02 – 1,853,137
265,535 18,410 6,503,551
3 The fair value of share rights with the relative TSR performance measure is calculated at the date of grant using a Monte Carlo simulation model, taking into account the impact of the relative TSR condition whilst the fair value of other share rights are calculated using a Black-Scholes option pricing model. The value disclosed is an input to the calculation of the grant date fair value of the share rights recognised as an expense in each reporting period. No performance conditions, other than ongoing employment, are attached to Deferred STI share rights awards, subject to the operation of the Group's malus policy.
4 The maximum value of award to vest represents the total maximum value of employee benefits expense, as based on the value at grant date that would be recorded if all share rights which remain outstanding at 28 June 2020 satisfied all relevant vesting conditions.
1
2
3
4
5
PERFORM
AN
CE
HIG
HLIG
HTS
BUSIN
ESS REV
IEWD
IRECTORS'
REPORT
FINA
NC
IAL
REPORT
OTH
ER IN
FORM
ATION
73
WO
OLW
ORTH
S GRO
UP
AN
NU
AL REPO
RT 2020
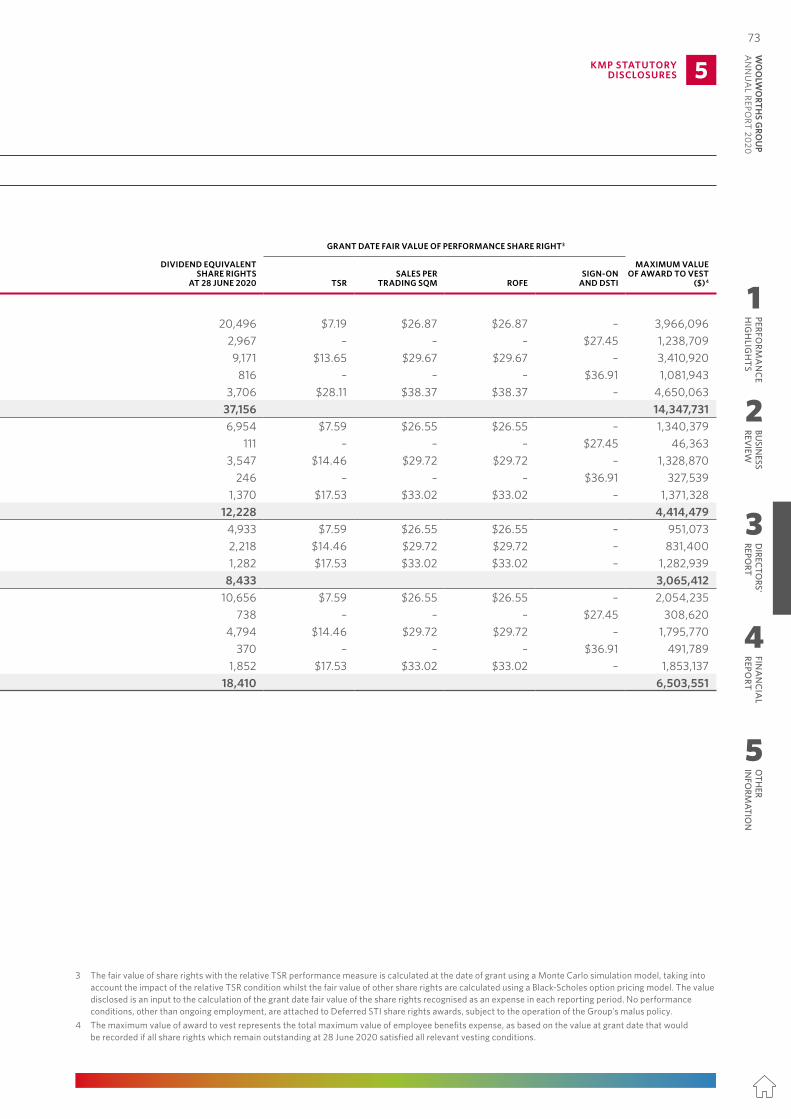
Remuneration Report
5.4 SHARE RIGHTS OUTSTANDING FOR EXECUTIVE KMP
The table below sets out the grants and outstanding number of share rights for current Executive KMP. No amounts were paid or are payable by the recipient on receipt of the share rights and there are no outstanding vested share rights as at 28 June 2020.
GRANT DATE FAIR VALUE OF PERFORMANCE SHARE RIGHT3
AWARD GRANT DATE 1PERFORMANCE
PERIOD START DATEEXERCISE
DATE 2 NO. OF RIGHTS
AT 28 JUNE 2020
DIVIDEND EQUIVALENT SHARE RIGHTS
AT 28 JUNE 2020 TSR SALES PER
TRADING SQM ROFE SIGN-ON AND DSTI
MAXIMUM VALUE OF AWARD TO VEST
($)4
Executive KMPB L Banducci F18 LTI 23/11/2017 01/07/2017 28/08/2020 195,278 20,496 $7.19 $26.87 $26.87 – 3,966,096
F18 DSTI 17/09/2018 01/07/2018 01/07/2020 45,126 2,967 – – – $27.45 1,238,709 F19 LTI 21/11/2018 01/07/2018 01/07/2021 140,194 9,171 $13.65 $29.67 $29.67 – 3,410,920
F19 DSTI 17/09/2019 01/07/2019 01/07/2021 29,313 816 – – – $36.91 1,081,943 F20 WISP 16/12/2019 01/07/2019 01/07/2022 133,049 3,706 $28.11 $38.37 $38.37 – 4,650,063
542,960 37,156 14,347,731 S J Donohue F18 LTI 31/10/2017 01/07/2017 28/08/2020 66,257 6,954 $7.59 $26.55 $26.55 – 1,340,379
F18 DSTI 17/09/2018 01/07/2018 01/07/2020 1,689 111 – – – $27.45 46,363 F19 LTI 30/11/2018 01/07/2018 01/07/2021 53,946 3,547 $14.46 $29.72 $29.72 – 1,328,870
F19 DSTI 17/09/2019 01/07/2019 01/07/2021 8,874 246 – – – $36.91 327,539 F20 WISP 1/07/2019 01/07/2019 01/07/2022 49,228 1,370 $17.53 $33.02 $33.02 – 1,371,328
179,994 12,228 4,414,479 S Harrison F18 LTI 31/10/2017 01/07/2017 28/08/2020 47,013 4,933 $7.59 $26.55 $26.55 – 951,073
F19 LTI 30/11/2018 01/07/2018 01/07/2021 33,751 2,218 $14.46 $29.72 $29.72 – 831,400 F20 WISP 01/07/2019 01/07/2019 01/07/2022 46,055 1,282 $17.53 $33.02 $33.02 – 1,282,939
126,819 8,433 3,065,412 C E Peters F18 LTI 31/10/2017 01/07/2017 28/08/2020 101,544 10,656 $7.59 $26.55 $26.55 – 2,054,235
F18 DSTI 17/09/2018 01/07/2018 01/07/2020 11,243 738 – – – $27.45 308,620 F19 LTI 30/11/2018 01/07/2018 01/07/2021 72,900 4,794 $14.46 $29.72 $29.72 – 1,795,770
F19 DSTI 17/09/2019 01/07/2019 01/07/2021 13,324 370 – – – $36.91 491,789 F20 WISP 01/07/2019 01/07/2019 01/07/2022 66,524 1,852 $17.53 $33.02 $33.02 – 1,853,137
265,535 18,410 6,503,551
The minimum value of share rights is assessed as nil and has not been specifically detailed in the table above on the basis that no share rights will vest unless the performance or vesting criteria are satisfied.
1 Grant date is the date on which there is a shared understanding of the terms and conditions of the share-based payment arrangement.2 Exercise of share rights will occur the day after the full year results are announced to the market.
72
5KMP STATUTORY DISCLOSURES
5.4 SHARE RIGHTS OUTSTANDING FOR EXECUTIVE KMP
The table below sets out the grants and outstanding number of share rights for current Executive KMP. No amounts were paid or are payable by the recipient on receipt of the share rights and there are no outstanding vested share rights as at 28 June 2020.
GRANT DATE FAIR VALUE OF PERFORMANCE SHARE RIGHT3
AWARD GRANT DATE 1PERFORMANCE
PERIOD START DATEEXERCISE
DATE 2 NO. OF RIGHTS
AT 28 JUNE 2020
DIVIDEND EQUIVALENT SHARE RIGHTS
AT 28 JUNE 2020 TSR SALES PER
TRADING SQM ROFE SIGN-ON AND DSTI
MAXIMUM VALUE OF AWARD TO VEST
($)4
Executive KMPB L Banducci F18 LTI 23/11/2017 01/07/2017 28/08/2020 195,278 20,496 $7.19 $26.87 $26.87 – 3,966,096
F18 DSTI 17/09/2018 01/07/2018 01/07/2020 45,126 2,967 – – – $27.45 1,238,709 F19 LTI 21/11/2018 01/07/2018 01/07/2021 140,194 9,171 $13.65 $29.67 $29.67 – 3,410,920
F19 DSTI 17/09/2019 01/07/2019 01/07/2021 29,313 816 – – – $36.91 1,081,943 F20 WISP 16/12/2019 01/07/2019 01/07/2022 133,049 3,706 $28.11 $38.37 $38.37 – 4,650,063
542,960 37,156 14,347,731 S J Donohue F18 LTI 31/10/2017 01/07/2017 28/08/2020 66,257 6,954 $7.59 $26.55 $26.55 – 1,340,379
F18 DSTI 17/09/2018 01/07/2018 01/07/2020 1,689 111 – – – $27.45 46,363 F19 LTI 30/11/2018 01/07/2018 01/07/2021 53,946 3,547 $14.46 $29.72 $29.72 – 1,328,870
F19 DSTI 17/09/2019 01/07/2019 01/07/2021 8,874 246 – – – $36.91 327,539 F20 WISP 1/07/2019 01/07/2019 01/07/2022 49,228 1,370 $17.53 $33.02 $33.02 – 1,371,328
179,994 12,228 4,414,479 S Harrison F18 LTI 31/10/2017 01/07/2017 28/08/2020 47,013 4,933 $7.59 $26.55 $26.55 – 951,073
F19 LTI 30/11/2018 01/07/2018 01/07/2021 33,751 2,218 $14.46 $29.72 $29.72 – 831,400 F20 WISP 01/07/2019 01/07/2019 01/07/2022 46,055 1,282 $17.53 $33.02 $33.02 – 1,282,939
126,819 8,433 3,065,412 C E Peters F18 LTI 31/10/2017 01/07/2017 28/08/2020 101,544 10,656 $7.59 $26.55 $26.55 – 2,054,235
F18 DSTI 17/09/2018 01/07/2018 01/07/2020 11,243 738 – – – $27.45 308,620 F19 LTI 30/11/2018 01/07/2018 01/07/2021 72,900 4,794 $14.46 $29.72 $29.72 – 1,795,770
F19 DSTI 17/09/2019 01/07/2019 01/07/2021 13,324 370 – – – $36.91 491,789 F20 WISP 01/07/2019 01/07/2019 01/07/2022 66,524 1,852 $17.53 $33.02 $33.02 – 1,853,137
265,535 18,410 6,503,551
3 The fair value of share rights with the relative TSR performance measure is calculated at the date of grant using a Monte Carlo simulation model, taking into account the impact of the relative TSR condition whilst the fair value of other share rights are calculated using a Black-Scholes option pricing model. The value disclosed is an input to the calculation of the grant date fair value of the share rights recognised as an expense in each reporting period. No performance conditions, other than ongoing employment, are attached to Deferred STI share rights awards, subject to the operation of the Group's malus policy.
4 The maximum value of award to vest represents the total maximum value of employee benefits expense, as based on the value at grant date that would be recorded if all share rights which remain outstanding at 28 June 2020 satisfied all relevant vesting conditions.
1
2
3
4
5
PERFORM
AN
CE
HIG
HLIG
HTS
BUSIN
ESS REV
IEWD
IRECTORS'
REPORT
FINA
NC
IAL
REPORT
OTH
ER IN
FORM
ATION
73W
OO
LWO
RTHS G
ROU
P A
NN
UA
L REPORT 2020
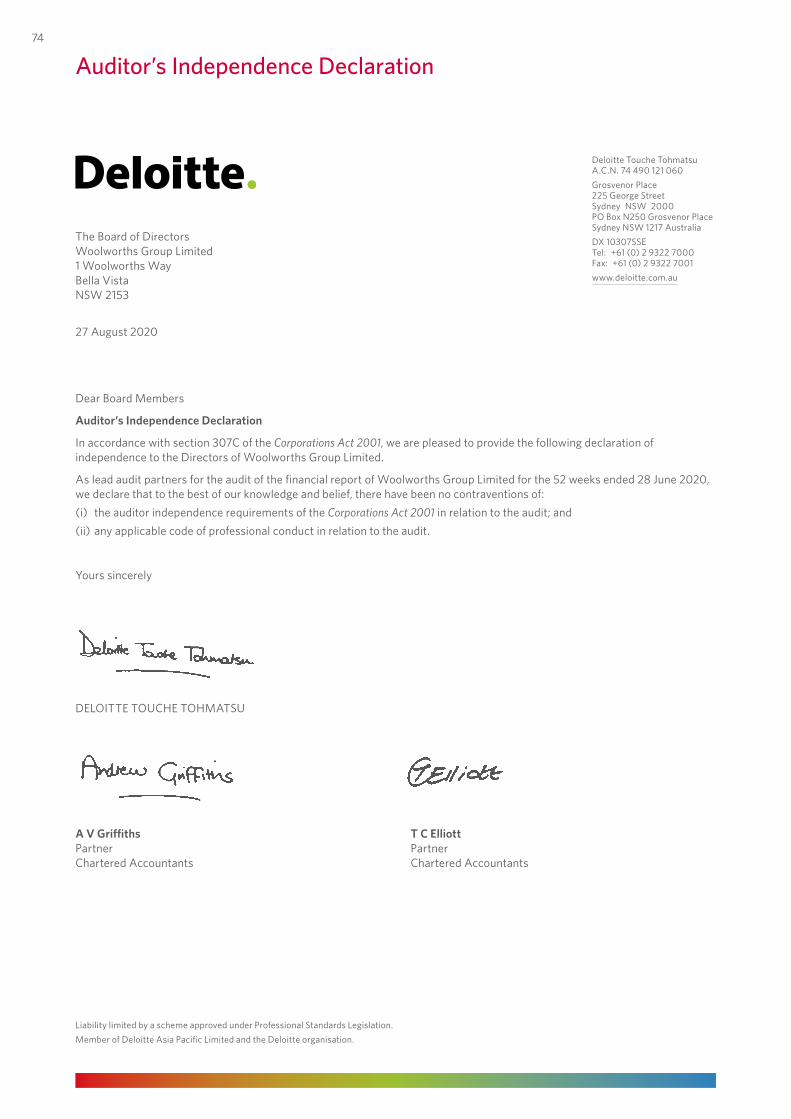
The Board of DirectorsWoolworths Group Limited1 Woolworths WayBella VistaNSW 2153
27 August 2020
Dear Board Members
Auditor’s Independence Declaration
In accordance with section 307C of the Corporations Act 2001, we are pleased to provide the following declaration of independence to the Directors of Woolworths Group Limited.
As lead audit partners for the audit of the financial report of Woolworths Group Limited for the 52 weeks ended 28 June 2020, we declare that to the best of our knowledge and belief, there have been no contraventions of:(i) the auditor independence requirements of the Corporations Act 2001 in relation to the audit; and(ii) any applicable code of professional conduct in relation to the audit.
Yours sincerely
DELOITTE TOUCHE TOHMATSU
A V Griffiths T C Elliott Partner Partner Chartered Accountants Chartered Accountants
Deloitte Touche Tohmatsu A.C.N. 74 490 121 060Grosvenor Place 225 George Street Sydney NSW 2000 PO Box N250 Grosvenor Place Sydney NSW 1217 AustraliaDX 10307SSE Tel: +61 (0) 2 9322 7000 Fax: +61 (0) 2 9322 7001www.deloitte.com.au
Liability limited by a scheme approved under Professional Standards Legislation.Member of Deloitte Asia Pacific Limited and the Deloitte organisation.
Auditor’s Independence Declaration74
Consolidated Financial StatementsConsolidated Statement of Profit or Loss 76Consolidated Statement of Other Comprehensive Income 77Consolidated Statement of Financial Position 78Consolidated Statement of Changes in Equity 79Consolidated Statement of Cash Flows 80
Notes to the Consolidated Financial Statements
1 BASIS OF PREPARATION
1.1 Basis of preparation 811.2 Significant accounting policies 811.3 Critical accounting estimates and judgements 851.4 Restatement for salaried team member remediation 861.5 Individually significant items 871.6 Financial reporting impacts of COVID-19 88
2 GROUP PERFORMANCE
2.1 Revenue from the sale of goods and services from continuing operations 89
2.2 Segment disclosures from continuing operations 902.3 Finance costs from continuing operations 92
3 ASSETS AND LIABILITIES
3.1 Trade and other receivables 933.2 Other financial assets and liabilities 943.3 Leases 953.4 Property, plant and equipment 983.5 Intangible assets 1003.6 Impairment of non-financial assets 1023.7 Income taxes 1053.8 Trade and other payables 1083.9 Provisions 1083.10 Other non-current liabilities 110
4 CAPITAL STRUCTURE, FINANCING, AND RISK MANAGEMENT
4.1 Earnings per share 1114.2 Dividends 1124.3 Contributed equity 1134.4 Reserves 1144.5 Cash and cash equivalents 1164.6 Borrowings 1174.7 Financial risk management 1204.8 Commitments for capital expenditure 126
5 GROUP STRUCTURE
5.1 Discontinued operations 1275.2 Assets held for sale 1285.3 Subsidiaries 1295.4 Parent entity information 1345.5 Related parties 135
6 OTHER
6.1 Contingent liabilities 1366.2 Employee benefits 1366.3 Auditors’ remuneration 1416.4 Subsequent events 142
Directors’ Declaration 143Independent Auditor’s Report 144
2020 Financial Report Table of Contents
$63,675M Revenue from the sale of goods and services from continuing operations
– 52 weeks –
6.2% increase from 2019 – 53 weeks –
SEE PAGE 89
LEASESFrom 1 July 2019, the Group adopted AASB 16 Leases. Detailed disclosure of the lease asset and lease liability
is included in Note 3.3.
SEE PAGE 95
INDIVIDUALLY SIGNIFICANT ITEMS
Details of the $437 million (net of tax) recorded in respect of supply chain network strategy review, Endeavour Group Separation, and salaried team
member remediation included in Note 1.5.
SEE PAGE 87
1
2
3
4
5
PERFORM
AN
CE
HIG
HLIG
HTS
BUSIN
ESS REV
IEWD
IRECTORS'
REPORT
FINA
NC
IAL
REPORT
OTH
ER IN
FORM
ATION
75
WO
OLW
ORTH
S GRO
UP
AN
NU
AL REPO
RT 2020
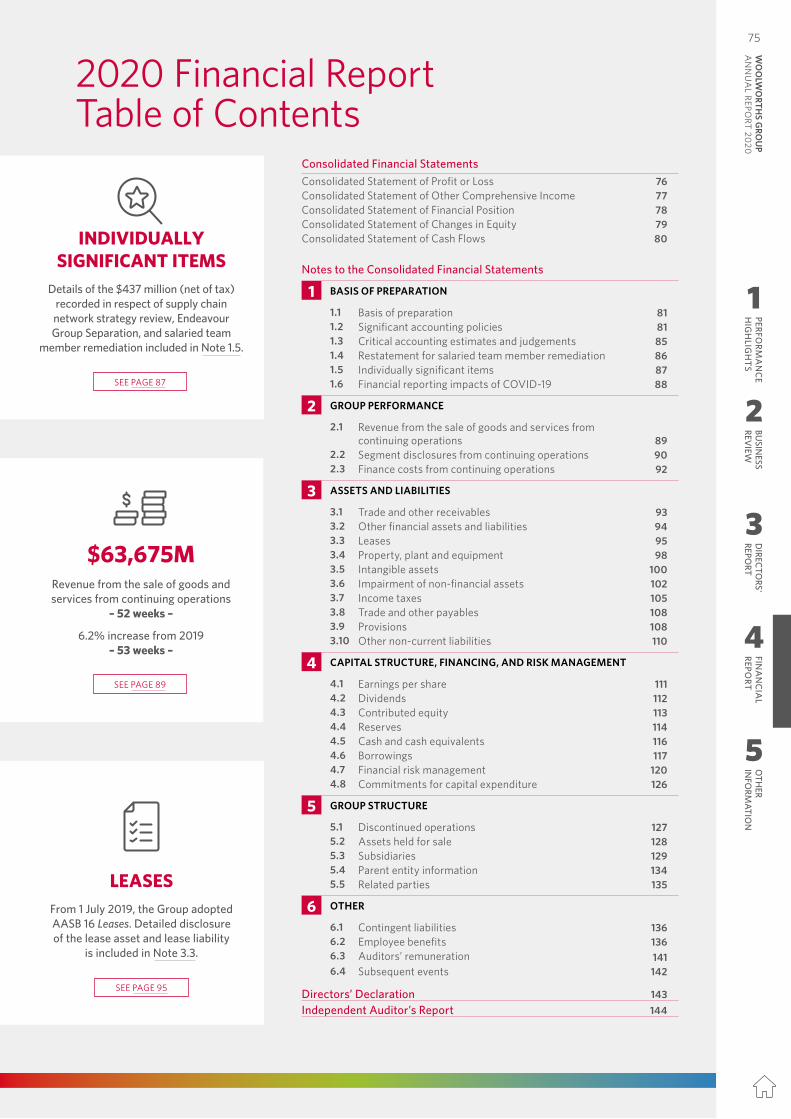
The Board of DirectorsWoolworths Group Limited1 Woolworths WayBella VistaNSW 2153
27 August 2020
Dear Board Members
Auditor’s Independence Declaration
In accordance with section 307C of the Corporations Act 2001, we are pleased to provide the following declaration of independence to the Directors of Woolworths Group Limited.
As lead audit partners for the audit of the financial report of Woolworths Group Limited for the 52 weeks ended 28 June 2020, we declare that to the best of our knowledge and belief, there have been no contraventions of:(i) the auditor independence requirements of the Corporations Act 2001 in relation to the audit; and(ii) any applicable code of professional conduct in relation to the audit.
Yours sincerely
DELOITTE TOUCHE TOHMATSU
A V Griffiths T C Elliott Partner Partner Chartered Accountants Chartered Accountants
Deloitte Touche Tohmatsu A.C.N. 74 490 121 060Grosvenor Place 225 George Street Sydney NSW 2000 PO Box N250 Grosvenor Place Sydney NSW 1217 AustraliaDX 10307SSE Tel: +61 (0) 2 9322 7000 Fax: +61 (0) 2 9322 7001www.deloitte.com.au
Liability limited by a scheme approved under Professional Standards Legislation.Member of Deloitte Asia Pacific Limited and the Deloitte organisation.
Auditor’s Independence Declaration74
Consolidated Financial StatementsConsolidated Statement of Profit or Loss 76Consolidated Statement of Other Comprehensive Income 77Consolidated Statement of Financial Position 78Consolidated Statement of Changes in Equity 79Consolidated Statement of Cash Flows 80
Notes to the Consolidated Financial Statements
1 BASIS OF PREPARATION
1.1 Basis of preparation 811.2 Significant accounting policies 811.3 Critical accounting estimates and judgements 851.4 Restatement for salaried team member remediation 861.5 Individually significant items 871.6 Financial reporting impacts of COVID-19 88
2 GROUP PERFORMANCE
2.1 Revenue from the sale of goods and services from continuing operations 89
2.2 Segment disclosures from continuing operations 902.3 Finance costs from continuing operations 92
3 ASSETS AND LIABILITIES
3.1 Trade and other receivables 933.2 Other financial assets and liabilities 943.3 Leases 953.4 Property, plant and equipment 983.5 Intangible assets 1003.6 Impairment of non-financial assets 1023.7 Income taxes 1053.8 Trade and other payables 1083.9 Provisions 1083.10 Other non-current liabilities 110
4 CAPITAL STRUCTURE, FINANCING, AND RISK MANAGEMENT
4.1 Earnings per share 1114.2 Dividends 1124.3 Contributed equity 1134.4 Reserves 1144.5 Cash and cash equivalents 1164.6 Borrowings 1174.7 Financial risk management 1204.8 Commitments for capital expenditure 126
5 GROUP STRUCTURE
5.1 Discontinued operations 1275.2 Assets held for sale 1285.3 Subsidiaries 1295.4 Parent entity information 1345.5 Related parties 135
6 OTHER
6.1 Contingent liabilities 1366.2 Employee benefits 1366.3 Auditors’ remuneration 1416.4 Subsequent events 142
Directors’ Declaration 143Independent Auditor’s Report 144
2020 Financial Report Table of Contents
$63,675M Revenue from the sale of goods and services from continuing operations
– 52 weeks –
6.2% increase from 2019 – 53 weeks –
SEE PAGE 89
LEASESFrom 1 July 2019, the Group adopted AASB 16 Leases. Detailed disclosure of the lease asset and lease liability
is included in Note 3.3.
SEE PAGE 95
INDIVIDUALLY SIGNIFICANT ITEMS
Details of the $437 million (net of tax) recorded in respect of supply chain network strategy review, Endeavour Group Separation, and salaried team
member remediation included in Note 1.5.
SEE PAGE 87
1
2
3
4
5
PERFORM
AN
CE
HIG
HLIG
HTS
BUSIN
ESS REV
IEWD
IRECTORS'
REPORT
FINA
NC
IAL
REPORT
OTH
ER IN
FORM
ATION
75W
OO
LWO
RTHS G
ROU
P A
NN
UA
L REPORT 2020
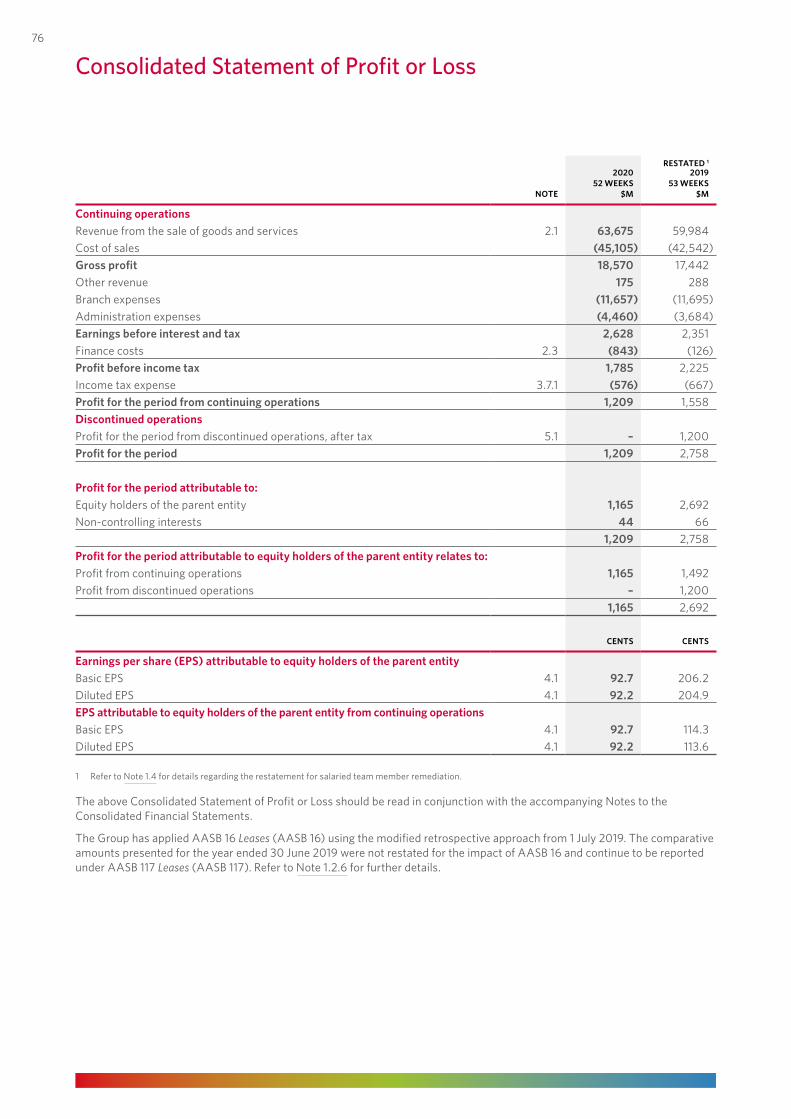
2020RESTATED 1
201952 WEEKS 53 WEEKS
NOTE $M $M
Continuing operationsRevenue from the sale of goods and services 2.1 63,675 59,984 Cost of sales (45,105) (42,542)Gross profit 18,570 17,442 Other revenue 175 288 Branch expenses (11,657) (11,695)Administration expenses (4,460) (3,684)Earnings before interest and tax 2,628 2,351 Finance costs 2.3 (843) (126)Profit before income tax 1,785 2,225 Income tax expense 3.7.1 (576) (667)Profit for the period from continuing operations 1,209 1,558 Discontinued operationsProfit for the period from discontinued operations, after tax 5.1 – 1,200 Profit for the period 1,209 2,758
Profit for the period attributable to:Equity holders of the parent entity 1,165 2,692 Non-controlling interests 44 66
1,209 2,758 Profit for the period attributable to equity holders of the parent entity relates to:Profit from continuing operations 1,165 1,492 Profit from discontinued operations – 1,200
1,165 2,692
CENTS CENTS
Earnings per share (EPS) attributable to equity holders of the parent entityBasic EPS 4.1 92.7 206.2 Diluted EPS 4.1 92.2 204.9 EPS attributable to equity holders of the parent entity from continuing operationsBasic EPS 4.1 92.7 114.3 Diluted EPS 4.1 92.2 113.6
1 Refer to Note 1.4 for details regarding the restatement for salaried team member remediation.
The above Consolidated Statement of Profit or Loss should be read in conjunction with the accompanying Notes to the Consolidated Financial Statements.
The Group has applied AASB 16 Leases (AASB 16) using the modified retrospective approach from 1 July 2019. The comparative amounts presented for the year ended 30 June 2019 were not restated for the impact of AASB 16 and continue to be reported under AASB 117 Leases (AASB 117). Refer to Note 1.2.6 for further details.
Consolidated Statement of Profit or Loss76
2020RESTATED1
201952 WEEKS 53 WEEKS
$M $M
Profit for the period 1,209 2,758 Other comprehensive income
Items that may be reclassified to profit or loss, net of taxEffective portion of changes in the fair value of cash flow hedges (9) 14 Foreign currency translation of foreign operations (54) 76
Items that will not be reclassified to profit or loss, net of taxChange in the fair value of investments in equity securities 1 (9)Actuarial gain/(loss) on defined benefit superannuation plans 4 (3)Other comprehensive (loss)/income for the period, net of tax (58) 78 Total comprehensive income for the period 1,151 2,836
Total comprehensive income for the period attributable to:Equity holders of the parent entity 1,109 2,770 Non-controlling interests 42 66
1,151 2,836 Total comprehensive income for the period from continuing operations attributable to:Equity holders of the parent entity 1,109 1,570 Non-controlling interests 42 66
1,151 1,636
1 Refer to Note 1.4 for details regarding the restatement for salaried team member remediation.
The above Consolidated Statement of Other Comprehensive Income should be read in conjunction with the accompanying Notes to the Consolidated Financial Statements.
Consolidated Statement of Other Comprehensive Income
1
2
3
4
5
PERFORM
AN
CE
HIG
HLIG
HTS
BUSIN
ESS REV
IEWD
IRECTORS'
REPORT
FINA
NC
IAL
REPORT
OTH
ER IN
FORM
ATION
77
WO
OLW
ORTH
S GRO
UP
AN
NU
AL REPO
RT 2020
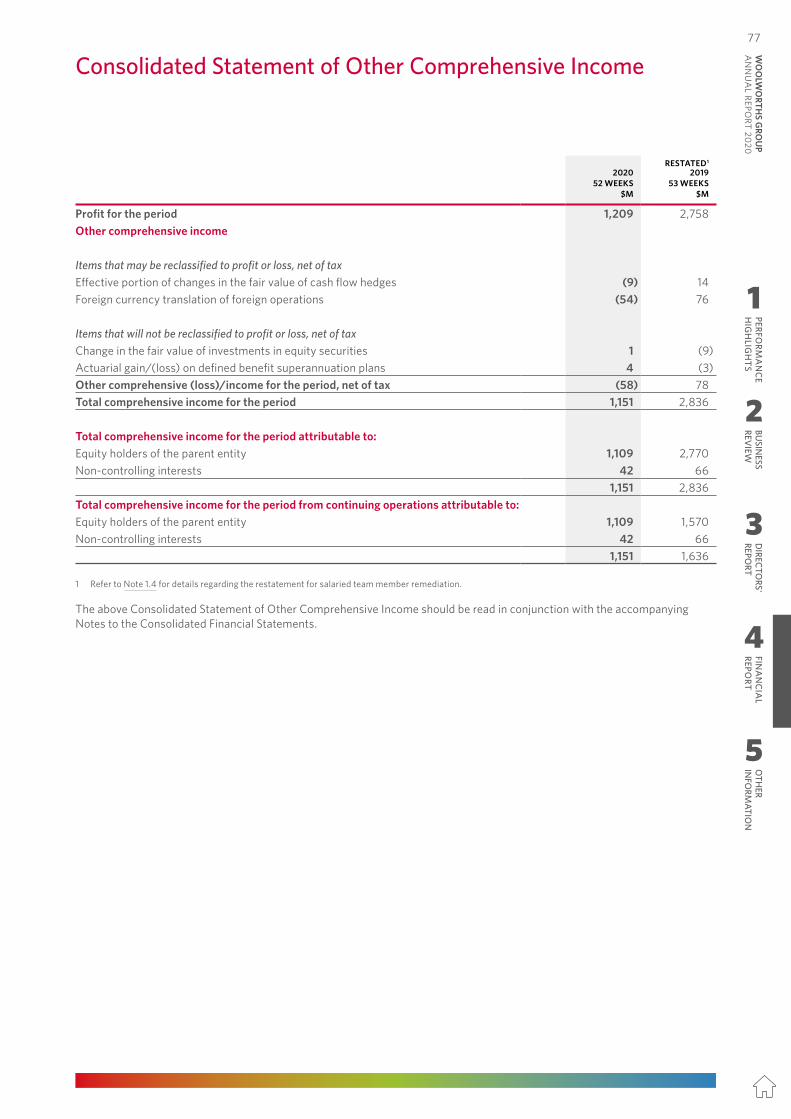
2020RESTATED 1
201952 WEEKS 53 WEEKS
NOTE $M $M
Continuing operationsRevenue from the sale of goods and services 2.1 63,675 59,984 Cost of sales (45,105) (42,542)Gross profit 18,570 17,442 Other revenue 175 288 Branch expenses (11,657) (11,695)Administration expenses (4,460) (3,684)Earnings before interest and tax 2,628 2,351 Finance costs 2.3 (843) (126)Profit before income tax 1,785 2,225 Income tax expense 3.7.1 (576) (667)Profit for the period from continuing operations 1,209 1,558 Discontinued operationsProfit for the period from discontinued operations, after tax 5.1 – 1,200 Profit for the period 1,209 2,758
Profit for the period attributable to:Equity holders of the parent entity 1,165 2,692 Non-controlling interests 44 66
1,209 2,758 Profit for the period attributable to equity holders of the parent entity relates to:Profit from continuing operations 1,165 1,492 Profit from discontinued operations – 1,200
1,165 2,692
CENTS CENTS
Earnings per share (EPS) attributable to equity holders of the parent entityBasic EPS 4.1 92.7 206.2 Diluted EPS 4.1 92.2 204.9 EPS attributable to equity holders of the parent entity from continuing operationsBasic EPS 4.1 92.7 114.3 Diluted EPS 4.1 92.2 113.6
1 Refer to Note 1.4 for details regarding the restatement for salaried team member remediation.
The above Consolidated Statement of Profit or Loss should be read in conjunction with the accompanying Notes to the Consolidated Financial Statements.
The Group has applied AASB 16 Leases (AASB 16) using the modified retrospective approach from 1 July 2019. The comparative amounts presented for the year ended 30 June 2019 were not restated for the impact of AASB 16 and continue to be reported under AASB 117 Leases (AASB 117). Refer to Note 1.2.6 for further details.
Consolidated Statement of Profit or Loss76
2020RESTATED1
201952 WEEKS 53 WEEKS
$M $M
Profit for the period 1,209 2,758 Other comprehensive income
Items that may be reclassified to profit or loss, net of taxEffective portion of changes in the fair value of cash flow hedges (9) 14 Foreign currency translation of foreign operations (54) 76
Items that will not be reclassified to profit or loss, net of taxChange in the fair value of investments in equity securities 1 (9)Actuarial gain/(loss) on defined benefit superannuation plans 4 (3)Other comprehensive (loss)/income for the period, net of tax (58) 78 Total comprehensive income for the period 1,151 2,836
Total comprehensive income for the period attributable to:Equity holders of the parent entity 1,109 2,770 Non-controlling interests 42 66
1,151 2,836 Total comprehensive income for the period from continuing operations attributable to:Equity holders of the parent entity 1,109 1,570 Non-controlling interests 42 66
1,151 1,636
1 Refer to Note 1.4 for details regarding the restatement for salaried team member remediation.
The above Consolidated Statement of Other Comprehensive Income should be read in conjunction with the accompanying Notes to the Consolidated Financial Statements.
Consolidated Statement of Other Comprehensive Income
1
2
3
4
5
PERFORM
AN
CE
HIG
HLIG
HTS
BUSIN
ESS REV
IEWD
IRECTORS'
REPORT
FINA
NC
IAL
REPORT
OTH
ER IN
FORM
ATION
77W
OO
LWO
RTHS G
ROU
P A
NN
UA
L REPORT 2020
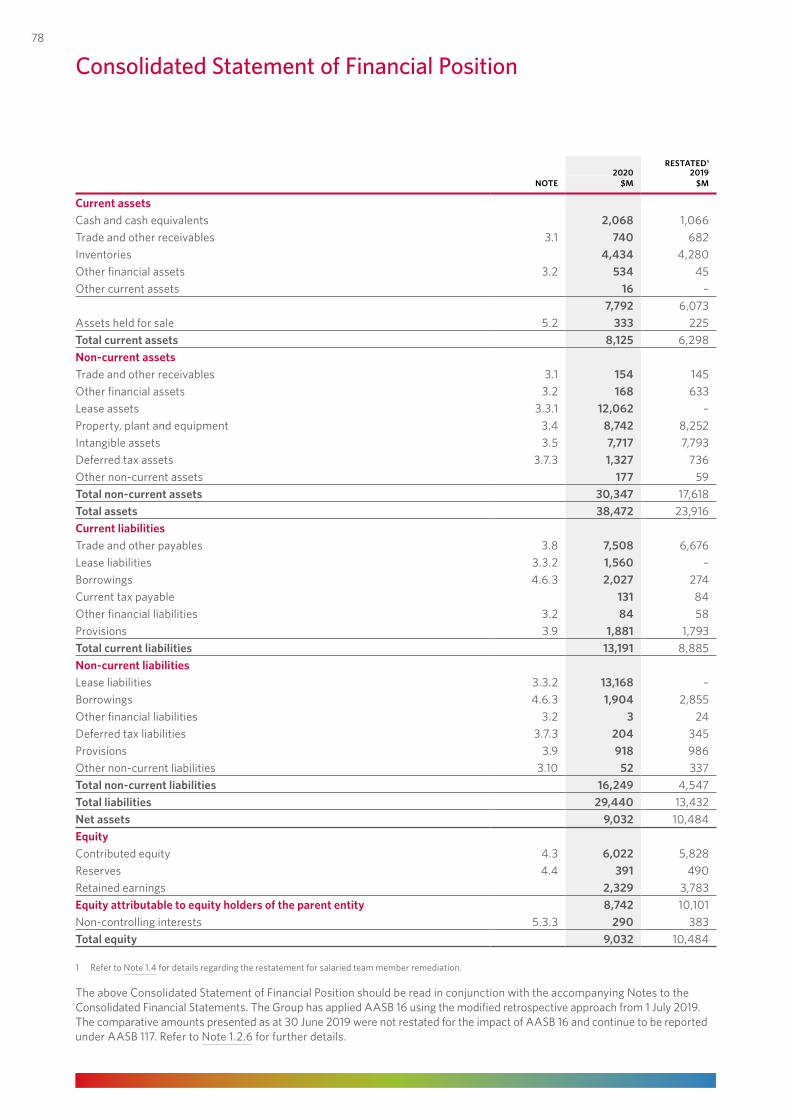
2020RESTATED1
2019NOTE $M $M
Current assetsCash and cash equivalents 2,068 1,066 Trade and other receivables 3.1 740 682 Inventories 4,434 4,280 Other financial assets 3.2 534 45 Other current assets 16 –
7,792 6,073 Assets held for sale 5.2 333 225 Total current assets 8,125 6,298 Non‑current assetsTrade and other receivables 3.1 154 145 Other financial assets 3.2 168 633 Lease assets 3.3.1 12,062 – Property, plant and equipment 3.4 8,742 8,252 Intangible assets 3.5 7,717 7,793 Deferred tax assets 3.7.3 1,327 736 Other non-current assets 177 59 Total non‑current assets 30,347 17,618 Total assets 38,472 23,916 Current liabilitiesTrade and other payables 3.8 7,508 6,676 Lease liabilities 3.3.2 1,560 – Borrowings 4.6.3 2,027 274 Current tax payable 131 84 Other financial liabilities 3.2 84 58 Provisions 3.9 1,881 1,793 Total current liabilities 13,191 8,885 Non‑current liabilitiesLease liabilities 3.3.2 13,168 – Borrowings 4.6.3 1,904 2,855 Other financial liabilities 3.2 3 24 Deferred tax liabilities 3.7.3 204 345Provisions 3.9 918 986 Other non-current liabilities 3.10 52 337 Total non‑current liabilities 16,249 4,547 Total liabilities 29,440 13,432 Net assets 9,032 10,484 EquityContributed equity 4.3 6,022 5,828 Reserves 4.4 391 490 Retained earnings 2,329 3,783 Equity attributable to equity holders of the parent entity 8,742 10,101 Non-controlling interests 5.3.3 290 383 Total equity 9,032 10,484
1 Refer to Note 1.4 for details regarding the restatement for salaried team member remediation.
The above Consolidated Statement of Financial Position should be read in conjunction with the accompanying Notes to the Consolidated Financial Statements. The Group has applied AASB 16 using the modified retrospective approach from 1 July 2019. The comparative amounts presented as at 30 June 2019 were not restated for the impact of AASB 16 and continue to be reported under AASB 117. Refer to Note 1.2.6 for further details.
Consolidated Statement of Financial Position78
ATTRIBUTABLE TO EQUITY HOLDERS OF THE PARENT ENTITY
2020SHARE
CAPITAL $M
SHARES HELD IN
TRUST $M
RESERVES $M
RETAINED EARNINGS
$MTOTAL
$M
NON‑ CONTROLLING
INTERESTS $M
TOTAL EQUITY
$M
Balance at 30 June 2019 6,033 (205) 490 3,783 10,101 383 10,484 Adjustment on initial application of AASB 16, net of tax – – – (1,329) (1,329) (69) (1,398)Adjusted balance at 1 July 2019 6,033 (205) 490 2,454 8,772 314 9,086 Profit for the period – – – 1,165 1,165 44 1,209 Other comprehensive (loss)/income for the period, net of tax – – (60) 4 (56) (2) (58)Total comprehensive (loss)/income for the period, net of tax – – (60) 1,169 1,109 42 1,151 Dividends paid – – – (1,297) (1,297) (66) (1,363)Transfer of shares to satisfy employee long-term incentive plans – 135 (135) – – – – Issue of shares to satisfy the dividend reinvestment plan 164 (3) – 3 164 – 164 Purchase of shares by the Woolworths Employee Share Trust – (102) – – (102) – (102)Share-based payments expense – – 96 – 96 – 96 Balance at 28 June 2020 6,197 (175) 391 2,329 8,742 290 9,032
ATTRIBUTABLE TO EQUITY HOLDERS OF THE PARENT ENTITY
RESTATED 2019 1SHARE
CAPITAL $M
SHARES HELD IN
TRUST $M
RESERVES $M
RETAINED EARNINGS
$MTOTAL
$M
NON‑ CONTROLLING
INTERESTS $M
TOTAL EQUITY
$M
Balance at 24 June 2018, as previously reported 6,201 (146) 353 4,073 10,481 368 10,849 Adjustment on restatement for salaried team member remediation – – – (184) (184) – (184)Restated balance at 24 June 2018 6,201 (146) 353 3,889 10,297 368 10,665 Profit for the period – – – 2,692 2,692 66 2,758 Other comprehensive income/(loss) for the period, net of tax – – 81 (3) 78 – 78 Total comprehensive income for the period, net of tax – – 81 2,689 2,770 66 2,836 Dividends paid – – – (1,381) (1,381) (51) (1,432)Share buy-back (282) – – (1,419) (1,701) – (1,701)Transfer of shares to satisfy employee long-term incentive plans – 6 (6) – – – – Issue of shares to satisfy the dividend reinvestment plan 114 (5) – 5 114 – 114 Purchase of shares by the Woolworths Employee Share Trust – (60) – – (60) – (60)Share-based payments expense – – 62 – 62 – 62 Balance at 30 June 2019 6,033 (205) 490 3,783 10,101 383 10,484
1 Refer to Note 1.4 for details regarding the restatement for salaried team member remediation.
The above Consolidated Statement of Changes in Equity should be read in conjunction with the accompanying Notes to the Consolidated Financial Statements.
Consolidated Statement of Changes in Equity
1
2
3
4
5
PERFORM
AN
CE
HIG
HLIG
HTS
BUSIN
ESS REV
IEWD
IRECTORS'
REPORT
FINA
NC
IAL
REPORT
OTH
ER IN
FORM
ATION
79
WO
OLW
ORTH
S GRO
UP
AN
NU
AL REPO
RT 2020
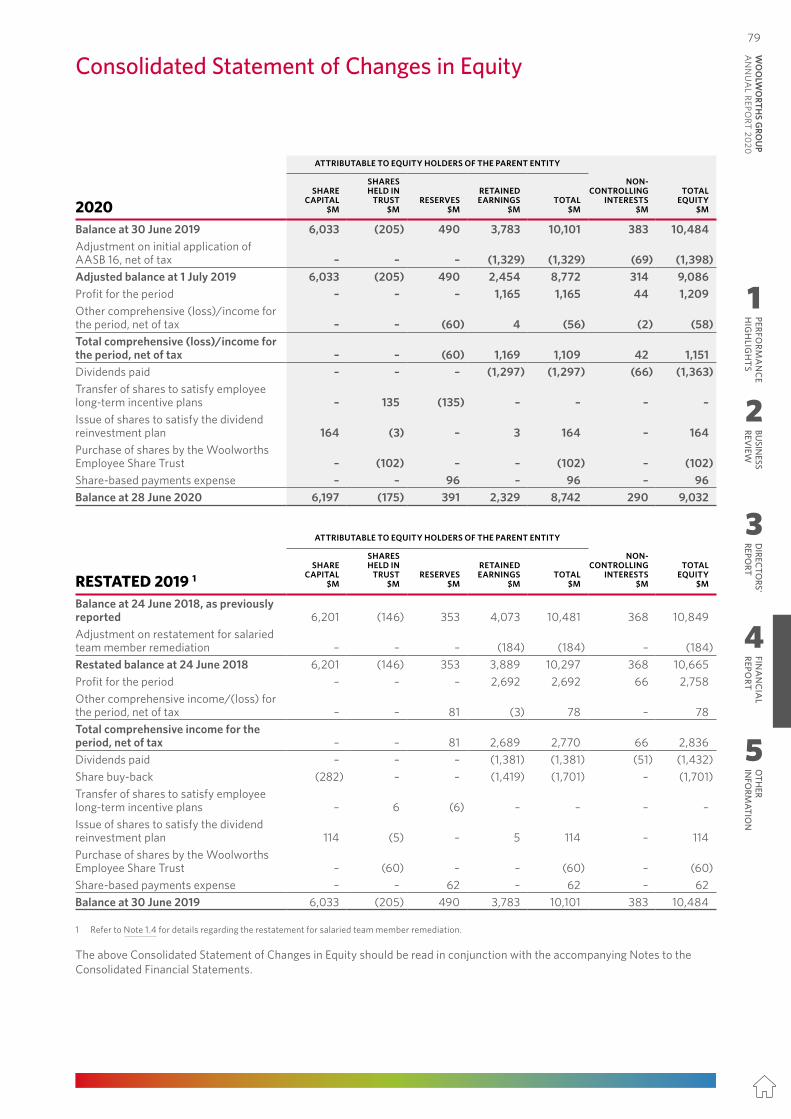
2020RESTATED1
2019NOTE $M $M
Current assetsCash and cash equivalents 2,068 1,066 Trade and other receivables 3.1 740 682 Inventories 4,434 4,280 Other financial assets 3.2 534 45 Other current assets 16 –
7,792 6,073 Assets held for sale 5.2 333 225 Total current assets 8,125 6,298 Non‑current assetsTrade and other receivables 3.1 154 145 Other financial assets 3.2 168 633 Lease assets 3.3.1 12,062 – Property, plant and equipment 3.4 8,742 8,252 Intangible assets 3.5 7,717 7,793 Deferred tax assets 3.7.3 1,327 736 Other non-current assets 177 59 Total non‑current assets 30,347 17,618 Total assets 38,472 23,916 Current liabilitiesTrade and other payables 3.8 7,508 6,676 Lease liabilities 3.3.2 1,560 – Borrowings 4.6.3 2,027 274 Current tax payable 131 84 Other financial liabilities 3.2 84 58 Provisions 3.9 1,881 1,793 Total current liabilities 13,191 8,885 Non‑current liabilitiesLease liabilities 3.3.2 13,168 – Borrowings 4.6.3 1,904 2,855 Other financial liabilities 3.2 3 24 Deferred tax liabilities 3.7.3 204 345Provisions 3.9 918 986 Other non-current liabilities 3.10 52 337 Total non‑current liabilities 16,249 4,547 Total liabilities 29,440 13,432 Net assets 9,032 10,484 EquityContributed equity 4.3 6,022 5,828 Reserves 4.4 391 490 Retained earnings 2,329 3,783 Equity attributable to equity holders of the parent entity 8,742 10,101 Non-controlling interests 5.3.3 290 383 Total equity 9,032 10,484
1 Refer to Note 1.4 for details regarding the restatement for salaried team member remediation.
The above Consolidated Statement of Financial Position should be read in conjunction with the accompanying Notes to the Consolidated Financial Statements. The Group has applied AASB 16 using the modified retrospective approach from 1 July 2019. The comparative amounts presented as at 30 June 2019 were not restated for the impact of AASB 16 and continue to be reported under AASB 117. Refer to Note 1.2.6 for further details.
Consolidated Statement of Financial Position78
ATTRIBUTABLE TO EQUITY HOLDERS OF THE PARENT ENTITY
2020SHARE
CAPITAL $M
SHARES HELD IN
TRUST $M
RESERVES $M
RETAINED EARNINGS
$MTOTAL
$M
NON‑ CONTROLLING
INTERESTS $M
TOTAL EQUITY
$M
Balance at 30 June 2019 6,033 (205) 490 3,783 10,101 383 10,484 Adjustment on initial application of AASB 16, net of tax – – – (1,329) (1,329) (69) (1,398)Adjusted balance at 1 July 2019 6,033 (205) 490 2,454 8,772 314 9,086 Profit for the period – – – 1,165 1,165 44 1,209 Other comprehensive (loss)/income for the period, net of tax – – (60) 4 (56) (2) (58)Total comprehensive (loss)/income for the period, net of tax – – (60) 1,169 1,109 42 1,151 Dividends paid – – – (1,297) (1,297) (66) (1,363)Transfer of shares to satisfy employee long-term incentive plans – 135 (135) – – – – Issue of shares to satisfy the dividend reinvestment plan 164 (3) – 3 164 – 164 Purchase of shares by the Woolworths Employee Share Trust – (102) – – (102) – (102)Share-based payments expense – – 96 – 96 – 96 Balance at 28 June 2020 6,197 (175) 391 2,329 8,742 290 9,032
ATTRIBUTABLE TO EQUITY HOLDERS OF THE PARENT ENTITY
RESTATED 2019 1SHARE
CAPITAL $M
SHARES HELD IN
TRUST $M
RESERVES $M
RETAINED EARNINGS
$MTOTAL
$M
NON‑ CONTROLLING
INTERESTS $M
TOTAL EQUITY
$M
Balance at 24 June 2018, as previously reported 6,201 (146) 353 4,073 10,481 368 10,849 Adjustment on restatement for salaried team member remediation – – – (184) (184) – (184)Restated balance at 24 June 2018 6,201 (146) 353 3,889 10,297 368 10,665 Profit for the period – – – 2,692 2,692 66 2,758 Other comprehensive income/(loss) for the period, net of tax – – 81 (3) 78 – 78 Total comprehensive income for the period, net of tax – – 81 2,689 2,770 66 2,836 Dividends paid – – – (1,381) (1,381) (51) (1,432)Share buy-back (282) – – (1,419) (1,701) – (1,701)Transfer of shares to satisfy employee long-term incentive plans – 6 (6) – – – – Issue of shares to satisfy the dividend reinvestment plan 114 (5) – 5 114 – 114 Purchase of shares by the Woolworths Employee Share Trust – (60) – – (60) – (60)Share-based payments expense – – 62 – 62 – 62 Balance at 30 June 2019 6,033 (205) 490 3,783 10,101 383 10,484
1 Refer to Note 1.4 for details regarding the restatement for salaried team member remediation.
The above Consolidated Statement of Changes in Equity should be read in conjunction with the accompanying Notes to the Consolidated Financial Statements.
Consolidated Statement of Changes in Equity
1
2
3
4
5
PERFORM
AN
CE
HIG
HLIG
HTS
BUSIN
ESS REV
IEWD
IRECTORS'
REPORT
FINA
NC
IAL
REPORT
OTH
ER IN
FORM
ATION
79W
OO
LWO
RTHS G
ROU
P A
NN
UA
L REPORT 2020
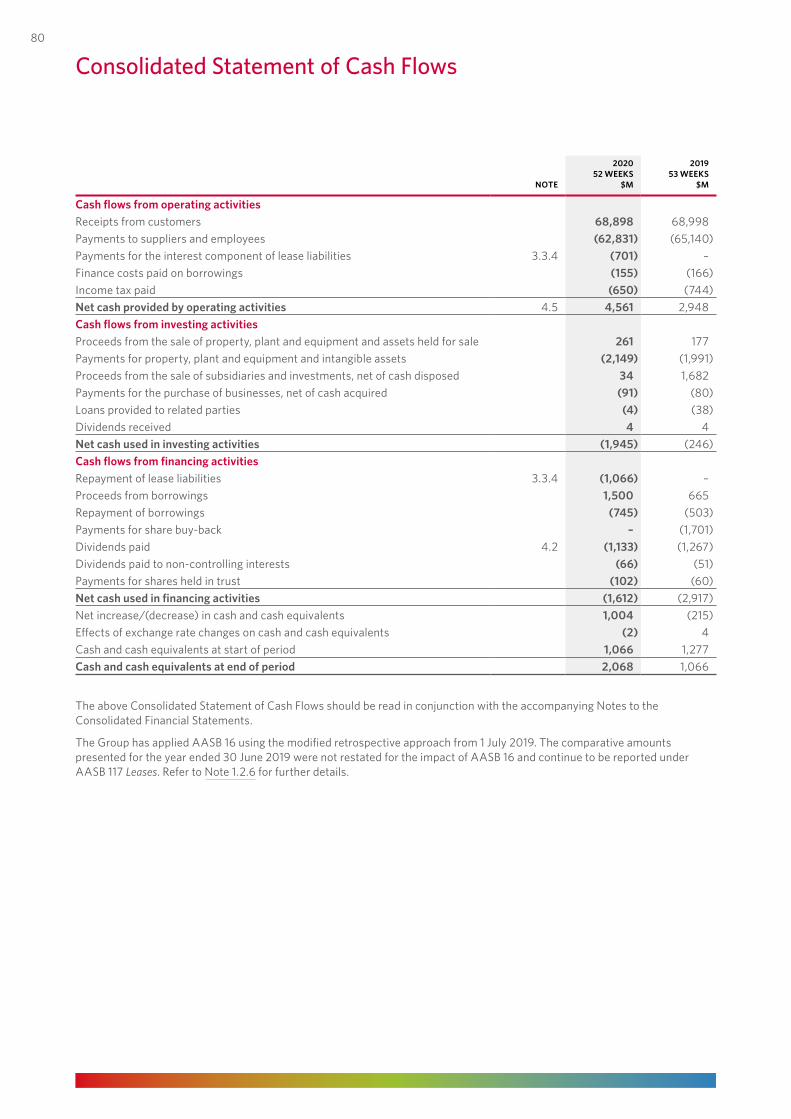
2020 201952 WEEKS 53 WEEKS
NOTE $M $M
Cash flows from operating activitiesReceipts from customers 68,898 68,998Payments to suppliers and employees (62,831) (65,140)Payments for the interest component of lease liabilities 3.3.4 (701) –Finance costs paid on borrowings (155) (166)Income tax paid (650) (744)Net cash provided by operating activities 4.5 4,561 2,948Cash flows from investing activitiesProceeds from the sale of property, plant and equipment and assets held for sale 261 177Payments for property, plant and equipment and intangible assets (2,149) (1,991)Proceeds from the sale of subsidiaries and investments, net of cash disposed 34 1,682Payments for the purchase of businesses, net of cash acquired (91) (80)Loans provided to related parties (4) (38)Dividends received 4 4Net cash used in investing activities (1,945) (246)Cash flows from financing activitiesRepayment of lease liabilities 3.3.4 (1,066) –Proceeds from borrowings 1,500 665Repayment of borrowings (745) (503)Payments for share buy-back – (1,701)Dividends paid 4.2 (1,133) (1,267)Dividends paid to non-controlling interests (66) (51)Payments for shares held in trust (102) (60)Net cash used in financing activities (1,612) (2,917)Net increase/(decrease) in cash and cash equivalents 1,004 (215)Effects of exchange rate changes on cash and cash equivalents (2) 4Cash and cash equivalents at start of period 1,066 1,277Cash and cash equivalents at end of period 2,068 1,066
The above Consolidated Statement of Cash Flows should be read in conjunction with the accompanying Notes to the Consolidated Financial Statements.
The Group has applied AASB 16 using the modified retrospective approach from 1 July 2019. The comparative amounts presented for the year ended 30 June 2019 were not restated for the impact of AASB 16 and continue to be reported under AASB 117 Leases. Refer to Note 1.2.6 for further details.
Consolidated Statement of Cash Flows80
1 BASIS OF PREPARATION
1.1 BASIS OF PREPARATION
This section describes the financial reporting framework within which the Consolidated Financial Statements are prepared and a statement of compliance with the Corporations Act 2001 and Australian Accounting Standards and Interpretations.
Woolworths Group Limited (the Company) is a for-profit company which is incorporated and domiciled in Australia. The Financial Report of the Company is for the 52-week period ended 28 June 2020 and comprises the Company and its subsidiaries (together referred to as the Group). The comparative period is for the 53-week period ended 30 June 2019.
The Financial Report was authorised for issue by the directors on 27 August 2020.
The Consolidated Financial Statements are presented in Australian dollars and amounts have been rounded to the nearest million dollars unless otherwise stated, in accordance with ASIC Corporations (Rounding in Financial/Directors' Reports) Instrument 2016/191.
The Consolidated Financial Statements have been prepared on the historical cost basis except for financial assets at fair value through other comprehensive income, derivative assets and liabilities, and certain financial liabilities which have been measured at fair value, as explained in the accounting policies.
The accounting policies have been applied consistently to all periods presented in the Consolidated Financial Statements, unless otherwise stated.
Certain comparative amounts have been re-presented to conform with the current period’s presentation to better reflect the nature of the financial position and performance of the Group.
The Consolidated Financial Statements of the Group are general purpose financial statements which have been prepared in accordance with the Corporations Act 2001, and Australian Accounting Standards and Interpretations.
Compliance with Australian Accounting Standards ensures that the Financial Report complies with International Financial Reporting Standards (IFRS) as issued by the International Accounting Standards Board (IASB). Consequently, this Financial Report has been prepared in accordance with and complies with IFRS as issued by the IASB.
1.2 SIGNIFICANT ACCOUNTING POLICIES
This section sets out the significant accounting policies upon which the Group’s Consolidated Financial Statements are prepared as a whole and significant accounting policies not otherwise described in the Notes to the Consolidated Financial Statements. Where a significant accounting policy is specific to a note to the Consolidated Financial Statements, the policy is described within that note. This section also shows information on new accounting standards, amendments, and interpretations not yet adopted and the impact they will have on the Group’s Consolidated Financial Statements.
1.2.1 Basis of consolidationThe Consolidated Financial Statements of the Company incorporate the assets, liabilities, and results of all subsidiaries as at and for the period ended 28 June 2020. Subsidiaries are all entities over which the Group has control. The Group controls an entity when it is exposed to, or has rights to, variable returns from its involvement with the entity and has the ability to affect those returns through its power to direct the activities of the entity. Subsidiaries are fully consolidated from the date on which control is transferred to the Group and are deconsolidated from the date that control ceases.
Intragroup balances and transactions, and any unrealised gains and losses arising from intragroup transactions, are eliminated in preparing the Consolidated Financial Statements.
Notes to the Consolidated Financial Statementsfor the period ended 28 June 2020
1
2
3
4
5
PERFORM
AN
CE
HIG
HLIG
HTS
BUSIN
ESS REV
IEWD
IRECTORS'
REPORT
FINA
NC
IAL
REPORT
OTH
ER IN
FORM
ATION
81
WO
OLW
ORTH
S GRO
UP
AN
NU
AL REPO
RT 2020
2020 201952 WEEKS 53 WEEKS
NOTE $M $M
Cash flows from operating activitiesReceipts from customers 68,898 68,998Payments to suppliers and employees (62,831) (65,140)Payments for the interest component of lease liabilities 3.3.4 (701) –Finance costs paid on borrowings (155) (166)Income tax paid (650) (744)Net cash provided by operating activities 4.5 4,561 2,948Cash flows from investing activitiesProceeds from the sale of property, plant and equipment and assets held for sale 261 177Payments for property, plant and equipment and intangible assets (2,149) (1,991)Proceeds from the sale of subsidiaries and investments, net of cash disposed 34 1,682Payments for the purchase of businesses, net of cash acquired (91) (80)Loans provided to related parties (4) (38)Dividends received 4 4Net cash used in investing activities (1,945) (246)Cash flows from financing activitiesRepayment of lease liabilities 3.3.4 (1,066) –Proceeds from borrowings 1,500 665Repayment of borrowings (745) (503)Payments for share buy-back – (1,701)Dividends paid 4.2 (1,133) (1,267)Dividends paid to non-controlling interests (66) (51)Payments for shares held in trust (102) (60)Net cash used in financing activities (1,612) (2,917)Net increase/(decrease) in cash and cash equivalents 1,004 (215)Effects of exchange rate changes on cash and cash equivalents (2) 4Cash and cash equivalents at start of period 1,066 1,277Cash and cash equivalents at end of period 2,068 1,066
The above Consolidated Statement of Cash Flows should be read in conjunction with the accompanying Notes to the Consolidated Financial Statements.
The Group has applied AASB 16 using the modified retrospective approach from 1 July 2019. The comparative amounts presented for the year ended 30 June 2019 were not restated for the impact of AASB 16 and continue to be reported under AASB 117 Leases. Refer to Note 1.2.6 for further details.
Consolidated Statement of Cash Flows80
1 BASIS OF PREPARATION
1.1 BASIS OF PREPARATION
This section describes the financial reporting framework within which the Consolidated Financial Statements are prepared and a statement of compliance with the Corporations Act 2001 and Australian Accounting Standards and Interpretations.
Woolworths Group Limited (the Company) is a for-profit company which is incorporated and domiciled in Australia. The Financial Report of the Company is for the 52-week period ended 28 June 2020 and comprises the Company and its subsidiaries (together referred to as the Group). The comparative period is for the 53-week period ended 30 June 2019.
The Financial Report was authorised for issue by the directors on 27 August 2020.
The Consolidated Financial Statements are presented in Australian dollars and amounts have been rounded to the nearest million dollars unless otherwise stated, in accordance with ASIC Corporations (Rounding in Financial/Directors' Reports) Instrument 2016/191.
The Consolidated Financial Statements have been prepared on the historical cost basis except for financial assets at fair value through other comprehensive income, derivative assets and liabilities, and certain financial liabilities which have been measured at fair value, as explained in the accounting policies.
The accounting policies have been applied consistently to all periods presented in the Consolidated Financial Statements, unless otherwise stated.
Certain comparative amounts have been re-presented to conform with the current period’s presentation to better reflect the nature of the financial position and performance of the Group.
The Consolidated Financial Statements of the Group are general purpose financial statements which have been prepared in accordance with the Corporations Act 2001, and Australian Accounting Standards and Interpretations.
Compliance with Australian Accounting Standards ensures that the Financial Report complies with International Financial Reporting Standards (IFRS) as issued by the International Accounting Standards Board (IASB). Consequently, this Financial Report has been prepared in accordance with and complies with IFRS as issued by the IASB.
1.2 SIGNIFICANT ACCOUNTING POLICIES
This section sets out the significant accounting policies upon which the Group’s Consolidated Financial Statements are prepared as a whole and significant accounting policies not otherwise described in the Notes to the Consolidated Financial Statements. Where a significant accounting policy is specific to a note to the Consolidated Financial Statements, the policy is described within that note. This section also shows information on new accounting standards, amendments, and interpretations not yet adopted and the impact they will have on the Group’s Consolidated Financial Statements.
1.2.1 Basis of consolidationThe Consolidated Financial Statements of the Company incorporate the assets, liabilities, and results of all subsidiaries as at and for the period ended 28 June 2020. Subsidiaries are all entities over which the Group has control. The Group controls an entity when it is exposed to, or has rights to, variable returns from its involvement with the entity and has the ability to affect those returns through its power to direct the activities of the entity. Subsidiaries are fully consolidated from the date on which control is transferred to the Group and are deconsolidated from the date that control ceases.
Intragroup balances and transactions, and any unrealised gains and losses arising from intragroup transactions, are eliminated in preparing the Consolidated Financial Statements.
Notes to the Consolidated Financial Statementsfor the period ended 28 June 2020
1
2
3
4
5
PERFORM
AN
CE
HIG
HLIG
HTS
BUSIN
ESS REV
IEWD
IRECTORS'
REPORT
FINA
NC
IAL
REPORT
OTH
ER IN
FORM
ATION
81W
OO
LWO
RTHS G
ROU
P A
NN
UA
L REPORT 2020
1.2.2 InventoriesInventories are valued at the lower of cost and net realisable value.
Cost is determined on a weighted average basis after deducting supplier rebates and settlement discounts, and includes other costs incurred to bring inventory to its present condition and location for sale.
Net realisable value of inventory has been determined as the estimated selling price in the ordinary course of business, less estimated selling expenses.
1.2.3 Investments in associatesAssociates are those entities in which the Group has significant influence but not control or joint control over the financial and operating policies. Investments in associates are initially recognised at cost, including transaction costs, and are accounted for using the equity method by including the Group’s share of profit or loss and other comprehensive income of associates in the carrying amount of the investment until the date on which significant influence ceases. Dividends received reduce the carrying amount of the investment in associates.
1.2.4 Foreign currency
(i) Functional and presentation currencyItems included in the financial statements of each of the Group’s entities are measured using the currency of the primary economic environment in which the entity operates (the functional currency). The Consolidated Financial Statements are presented in Australian dollars (AUD), which is the Company’s functional currency.
(ii) Foreign currency transactions (entities with a functional currency of AUD)Foreign currency transactions are translated into AUD using the exchange rates at the dates of the transactions. Assets and liabilities denominated in foreign currencies are translated to AUD at the reporting date at the following exchange rates:
FOREIGN CURRENCY AMOUNT APPLICABLE EXCHANGE RATE
Monetary assets and liabilities Reporting dateNon-monetary assets and liabilities measured at historical cost Date of transaction
Foreign exchange differences arising on translation are recognised in the Consolidated Statement of Profit or Loss in the period in which they arise except:• Exchange differences on transactions entered to hedge certain foreign currency risks (refer to Note 4.7); and• Items noted within paragraph (iii) below.
(iii) Foreign operations (entities with a functional currency other than AUD)The profit or loss and financial position of foreign operations are translated to AUD at the following exchange rates:
FOREIGN CURRENCY AMOUNT APPLICABLE EXCHANGE RATE
Revenues and expenses Average for the periodAssets and liabilities, including goodwill and fair value adjustments arising on consolidation Reporting dateEquity items Historical rates
The following foreign exchange differences are recognised in other comprehensive income:• Foreign currency differences arising on translation of foreign operations; and• Exchange differences arising from a monetary item receivable from or payable to a foreign operation, the settlement
of which is neither planned nor likely in the foreseeable future. These monetary items and related hedges are considered to form part of the net investment in a foreign operation and are reclassified into the Consolidated Statement of Profit or Loss upon disposal of the net investment.
Notes to the Consolidated Financial Statements
1.2 SIGNIFICANT ACCOUNTING POLICIES (CONTINUED)
82
1.2.5 Goods and Services Tax (GST)Revenue, expenses, and assets are recognised net of GST, except where the GST incurred is not recoverable from the taxation authority, in which case the GST is recognised as part of the expense or cost of the asset.
Receivables and payables are stated with the amount of GST included. The net amounts of GST recoverable from or payable to the taxation authorities are included as a current asset or current liability in the Consolidated Statement of Financial Position.
Cash flows are included in the Consolidated Statement of Cash Flows on a gross basis. The GST components of cash flows arising from investing and financing activities which are recoverable from or payable to taxation authorities are classified as operating cash flows.
1.2.6 New and amended standards adopted by the GroupThe Group has adopted all relevant new and amended Accounting Standards and Interpretations issued by the Australian Accounting Standards Board which are effective for annual reporting periods beginning on or after 1 July 2019. The standards that had a material effect on the Consolidated Financial Statements in the period are outlined below.
AASB 16 LeasesOn 1 July 2019, the Group adopted AASB 16 Leases (AASB 16) which replaced existing accounting requirements for leases under AASB 117 Leases (AASB 117), Interpretation 4 – Determining whether an Arrangement contains a Lease and Interpretation 115 Operating Leases – Incentives.
The Group has applied AASB 16 using the modified retrospective approach with the cumulative effect of initially applying the new standard recognised on 1 July 2019 to retained earnings. The comparatives have not been restated for the impact of AASB 16 and continue to be reported under AASB 117.
Under AASB 117, leases were classified based on their nature as either finance leases, which were recognised in the Consolidated Statement of Financial Position, or operating leases, which were not recognised in the Consolidated Statement of Financial Position. The Group recognised operating lease expense on a straight-line basis over the term of the leases, and recognised assets and liabilities only to the extent that there was a timing difference between actual lease payments and the expense recognised.
Under AASB 16, where the Group is a lessee, there is no distinction between operating leases and finance leases. The Group recognises leases in the Consolidated Statement of Financial Position as lease assets and associated lease liabilities with the exception of short-term leases for which the Group has elected to continue to account for the lease payments as an expense over the lease term. The Consolidated Statement of Profit or Loss includes a depreciation charge recognised for the lease assets and an interest expense recognised on the lease liabilities. The Consolidated Statement of Cash Flows includes a lease principal repayment charge arising from the lease liabilities. The Group assesses lease assets for impairment under AASB 136 Impairment of Assets (AASB 136).
The Group’s accounting for leases as a lessor remains largely unchanged under AASB 16 and the Group therefore continues to classify these leases as either finance or operating leases.
Transition On 1 July 2019, the Group adopted AASB 16 using the modified retrospective approach. Under this approach, the Group recognised a lease asset calculated as if AASB 16 had always applied, and a lease liability under the lease arrangement using the incremental borrowing rate at 1 July 2019. The incremental borrowing rate was determined by reference to the original lease term measured from the lease commencement date. The impact of the adoption of AASB 16 on the Group was dependent on a number of key estimates and judgements, including the determination of the reasonably certain lease term, the identification and valuation of non-lease components, and the application of an appropriate discount rate.
On transition, the Group elected to apply the following practical expedients:• Grandfather the assessment of which transactions are leases;• Leases with terms less than 12 months remaining from transition date continue to be expensed on a straight-line basis;• Exclude initial direct costs from the measurement of the lease asset; and• Use of hindsight in determining the lease term where the contract contains options to extend or terminate the lease.
At the date of initial application, the Group also assessed the carrying amounts of lease assets where there was an indication of impairment in accordance with AASB 136.
BASIS OFPREPARATION 1
1.2 SIGNIFICANT ACCOUNTING POLICIES (CONTINUED)
1
2
3
4
5
PERFORM
AN
CE
HIG
HLIG
HTS
BUSIN
ESS REV
IEWD
IRECTORS'
REPORT
FINA
NC
IAL
REPORT
OTH
ER IN
FORM
ATION
83
WO
OLW
ORTH
S GRO
UP
AN
NU
AL REPO
RT 2020
1.2.2 InventoriesInventories are valued at the lower of cost and net realisable value.
Cost is determined on a weighted average basis after deducting supplier rebates and settlement discounts, and includes other costs incurred to bring inventory to its present condition and location for sale.
Net realisable value of inventory has been determined as the estimated selling price in the ordinary course of business, less estimated selling expenses.
1.2.3 Investments in associatesAssociates are those entities in which the Group has significant influence but not control or joint control over the financial and operating policies. Investments in associates are initially recognised at cost, including transaction costs, and are accounted for using the equity method by including the Group’s share of profit or loss and other comprehensive income of associates in the carrying amount of the investment until the date on which significant influence ceases. Dividends received reduce the carrying amount of the investment in associates.
1.2.4 Foreign currency
(i) Functional and presentation currencyItems included in the financial statements of each of the Group’s entities are measured using the currency of the primary economic environment in which the entity operates (the functional currency). The Consolidated Financial Statements are presented in Australian dollars (AUD), which is the Company’s functional currency.
(ii) Foreign currency transactions (entities with a functional currency of AUD)Foreign currency transactions are translated into AUD using the exchange rates at the dates of the transactions. Assets and liabilities denominated in foreign currencies are translated to AUD at the reporting date at the following exchange rates:
FOREIGN CURRENCY AMOUNT APPLICABLE EXCHANGE RATE
Monetary assets and liabilities Reporting dateNon-monetary assets and liabilities measured at historical cost Date of transaction
Foreign exchange differences arising on translation are recognised in the Consolidated Statement of Profit or Loss in the period in which they arise except:• Exchange differences on transactions entered to hedge certain foreign currency risks (refer to Note 4.7); and• Items noted within paragraph (iii) below.
(iii) Foreign operations (entities with a functional currency other than AUD)The profit or loss and financial position of foreign operations are translated to AUD at the following exchange rates:
FOREIGN CURRENCY AMOUNT APPLICABLE EXCHANGE RATE
Revenues and expenses Average for the periodAssets and liabilities, including goodwill and fair value adjustments arising on consolidation Reporting dateEquity items Historical rates
The following foreign exchange differences are recognised in other comprehensive income:• Foreign currency differences arising on translation of foreign operations; and• Exchange differences arising from a monetary item receivable from or payable to a foreign operation, the settlement
of which is neither planned nor likely in the foreseeable future. These monetary items and related hedges are considered to form part of the net investment in a foreign operation and are reclassified into the Consolidated Statement of Profit or Loss upon disposal of the net investment.
Notes to the Consolidated Financial Statements
1.2 SIGNIFICANT ACCOUNTING POLICIES (CONTINUED)
82
1.2.5 Goods and Services Tax (GST)Revenue, expenses, and assets are recognised net of GST, except where the GST incurred is not recoverable from the taxation authority, in which case the GST is recognised as part of the expense or cost of the asset.
Receivables and payables are stated with the amount of GST included. The net amounts of GST recoverable from or payable to the taxation authorities are included as a current asset or current liability in the Consolidated Statement of Financial Position.
Cash flows are included in the Consolidated Statement of Cash Flows on a gross basis. The GST components of cash flows arising from investing and financing activities which are recoverable from or payable to taxation authorities are classified as operating cash flows.
1.2.6 New and amended standards adopted by the GroupThe Group has adopted all relevant new and amended Accounting Standards and Interpretations issued by the Australian Accounting Standards Board which are effective for annual reporting periods beginning on or after 1 July 2019. The standards that had a material effect on the Consolidated Financial Statements in the period are outlined below.
AASB 16 LeasesOn 1 July 2019, the Group adopted AASB 16 Leases (AASB 16) which replaced existing accounting requirements for leases under AASB 117 Leases (AASB 117), Interpretation 4 – Determining whether an Arrangement contains a Lease and Interpretation 115 Operating Leases – Incentives.
The Group has applied AASB 16 using the modified retrospective approach with the cumulative effect of initially applying the new standard recognised on 1 July 2019 to retained earnings. The comparatives have not been restated for the impact of AASB 16 and continue to be reported under AASB 117.
Under AASB 117, leases were classified based on their nature as either finance leases, which were recognised in the Consolidated Statement of Financial Position, or operating leases, which were not recognised in the Consolidated Statement of Financial Position. The Group recognised operating lease expense on a straight-line basis over the term of the leases, and recognised assets and liabilities only to the extent that there was a timing difference between actual lease payments and the expense recognised.
Under AASB 16, where the Group is a lessee, there is no distinction between operating leases and finance leases. The Group recognises leases in the Consolidated Statement of Financial Position as lease assets and associated lease liabilities with the exception of short-term leases for which the Group has elected to continue to account for the lease payments as an expense over the lease term. The Consolidated Statement of Profit or Loss includes a depreciation charge recognised for the lease assets and an interest expense recognised on the lease liabilities. The Consolidated Statement of Cash Flows includes a lease principal repayment charge arising from the lease liabilities. The Group assesses lease assets for impairment under AASB 136 Impairment of Assets (AASB 136).
The Group’s accounting for leases as a lessor remains largely unchanged under AASB 16 and the Group therefore continues to classify these leases as either finance or operating leases.
Transition On 1 July 2019, the Group adopted AASB 16 using the modified retrospective approach. Under this approach, the Group recognised a lease asset calculated as if AASB 16 had always applied, and a lease liability under the lease arrangement using the incremental borrowing rate at 1 July 2019. The incremental borrowing rate was determined by reference to the original lease term measured from the lease commencement date. The impact of the adoption of AASB 16 on the Group was dependent on a number of key estimates and judgements, including the determination of the reasonably certain lease term, the identification and valuation of non-lease components, and the application of an appropriate discount rate.
On transition, the Group elected to apply the following practical expedients:• Grandfather the assessment of which transactions are leases;• Leases with terms less than 12 months remaining from transition date continue to be expensed on a straight-line basis;• Exclude initial direct costs from the measurement of the lease asset; and• Use of hindsight in determining the lease term where the contract contains options to extend or terminate the lease.
At the date of initial application, the Group also assessed the carrying amounts of lease assets where there was an indication of impairment in accordance with AASB 136.
BASIS OFPREPARATION 1
1.2 SIGNIFICANT ACCOUNTING POLICIES (CONTINUED)
1
2
3
4
5
PERFORM
AN
CE
HIG
HLIG
HTS
BUSIN
ESS REV
IEWD
IRECTORS'
REPORT
FINA
NC
IAL
REPORT
OTH
ER IN
FORM
ATION
83W
OO
LWO
RTHS G
ROU
P A
NN
UA
L REPORT 2020
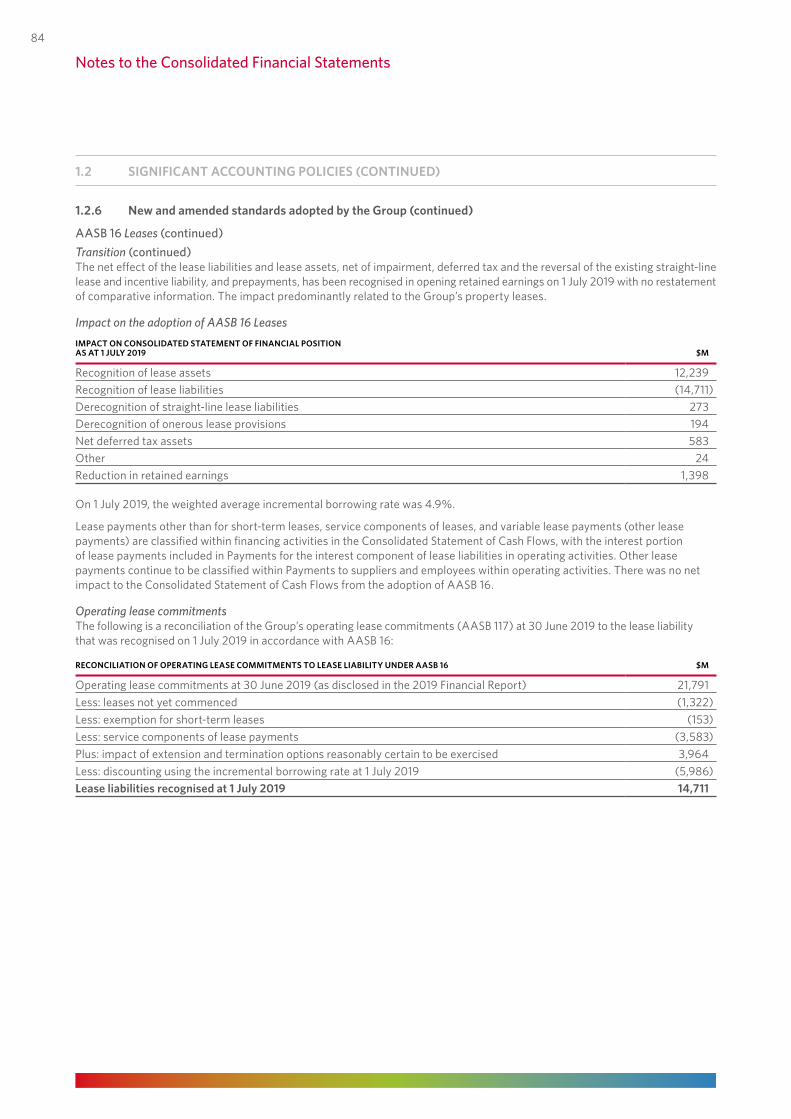
1.2.6 New and amended standards adopted by the Group (continued)
AASB 16 Leases (continued)Transition (continued)The net effect of the lease liabilities and lease assets, net of impairment, deferred tax and the reversal of the existing straight-line lease and incentive liability, and prepayments, has been recognised in opening retained earnings on 1 July 2019 with no restatement of comparative information. The impact predominantly related to the Group’s property leases.
Impact on the adoption of AASB 16 LeasesIMPACT ON CONSOLIDATED STATEMENT OF FINANCIAL POSITION AS AT 1 JULY 2019 $M
Recognition of lease assets 12,239Recognition of lease liabilities (14,711)Derecognition of straight-line lease liabilities 273Derecognition of onerous lease provisions 194Net deferred tax assets 583Other 24Reduction in retained earnings 1,398
On 1 July 2019, the weighted average incremental borrowing rate was 4.9%.
Lease payments other than for short-term leases, service components of leases, and variable lease payments (other lease payments) are classified within financing activities in the Consolidated Statement of Cash Flows, with the interest portion of lease payments included in Payments for the interest component of lease liabilities in operating activities. Other lease payments continue to be classified within Payments to suppliers and employees within operating activities. There was no net impact to the Consolidated Statement of Cash Flows from the adoption of AASB 16.
Operating lease commitments The following is a reconciliation of the Group’s operating lease commitments (AASB 117) at 30 June 2019 to the lease liability that was recognised on 1 July 2019 in accordance with AASB 16:
RECONCILIATION OF OPERATING LEASE COMMITMENTS TO LEASE LIABILITY UNDER AASB 16 $M
Operating lease commitments at 30 June 2019 (as disclosed in the 2019 Financial Report) 21,791Less: leases not yet commenced (1,322)Less: exemption for short-term leases (153)Less: service components of lease payments (3,583)Plus: impact of extension and termination options reasonably certain to be exercised 3,964Less: discounting using the incremental borrowing rate at 1 July 2019 (5,986)Lease liabilities recognised at 1 July 2019 14,711
Notes to the Consolidated Financial Statements
1.2 SIGNIFICANT ACCOUNTING POLICIES (CONTINUED)
84
1.2.7 Issued standards and interpretations not early adoptedThe table below lists the standards and amendments to standards on issue but not yet effective that were available for early adoption and were applicable to the Group. The reported profit or loss and financial position of the Group are not expected to change on adoption of any of the amendments to current standards listed below, unless stated otherwise, as they do not result in any changes to the Group’s existing accounting policies.
EFFECTIVE DATE ADOPTION DATE NEW STANDARDS, INTERPRETATIONS, AND AMENDMENTS REFERENCE
1 January 2020 29 June 2020 Amendments to the definition of a business AASB 2018-6
1 January 2020 29 June 2020 Amendments to the definition of material AASB 2018-7
1 January 2020 29 June 2020 Revised Conceptual Framework for financial reporting AASB 2019-1
1 January 2020 29 June 2020 Interest rate benchmark reform on hedge accounting AASB 2019-3
1 June 2020 29 June 2020 Amendments to Australian Accounting Standards – COVID-19-Related Rent Concessions
AASB 2020-4
1 January 2022 27 June 2022 1 Amendments to Australian Accounting Standards – Sale or Contribution of Assets between an Investor and its Associate or Joint Venture
AASB 2014-10
1 This represents the date the amendment is mandatorily effective for the Group. The Group may elect to early adopt the amendment.
1.3 CRITICAL ACCOUNTING ESTIMATES AND JUDGEMENTS
This section describes the critical accounting estimates and judgements that have been applied and may have a material impact on the Group’s Consolidated Financial Statements.
In applying the Group’s accounting policies, the directors are required to make estimates, judgements, and assumptions that affect amounts reported in this Financial Report. The estimates, judgements, and assumptions are based on historical experience, adjusted for current market conditions, and other factors that are believed to be reasonable under the circumstances, and are reviewed on a regular basis. Actual results may differ from these estimates.
The estimates and judgements which involve a higher degree of complexity or that have a significant risk of causing a material adjustment to the carrying amounts of assets and liabilities within the next period are included in the following notes:• Note 1.4 – Restatement for salaried team member remediation;• Note 3.3 – Leases;• Notes 3.4 and 3.5 – Estimation of useful life of assets;• Note 3.6 – Impairment of non-financial assets; and• Note 3.9 – Provisions.
Revisions to accounting estimates are recognised in the period in which the estimate is revised if the revision affects only that period; or in the period and future periods if the revision affects both current and future periods.
BASIS OFPREPARATION 1
1.2 SIGNIFICANT ACCOUNTING POLICIES (CONTINUED)
1
2
3
4
5
PERFORM
AN
CE
HIG
HLIG
HTS
BUSIN
ESS REV
IEWD
IRECTORS'
REPORT
FINA
NC
IAL
REPORT
OTH
ER IN
FORM
ATION
85
WO
OLW
ORTH
S GRO
UP
AN
NU
AL REPO
RT 2020
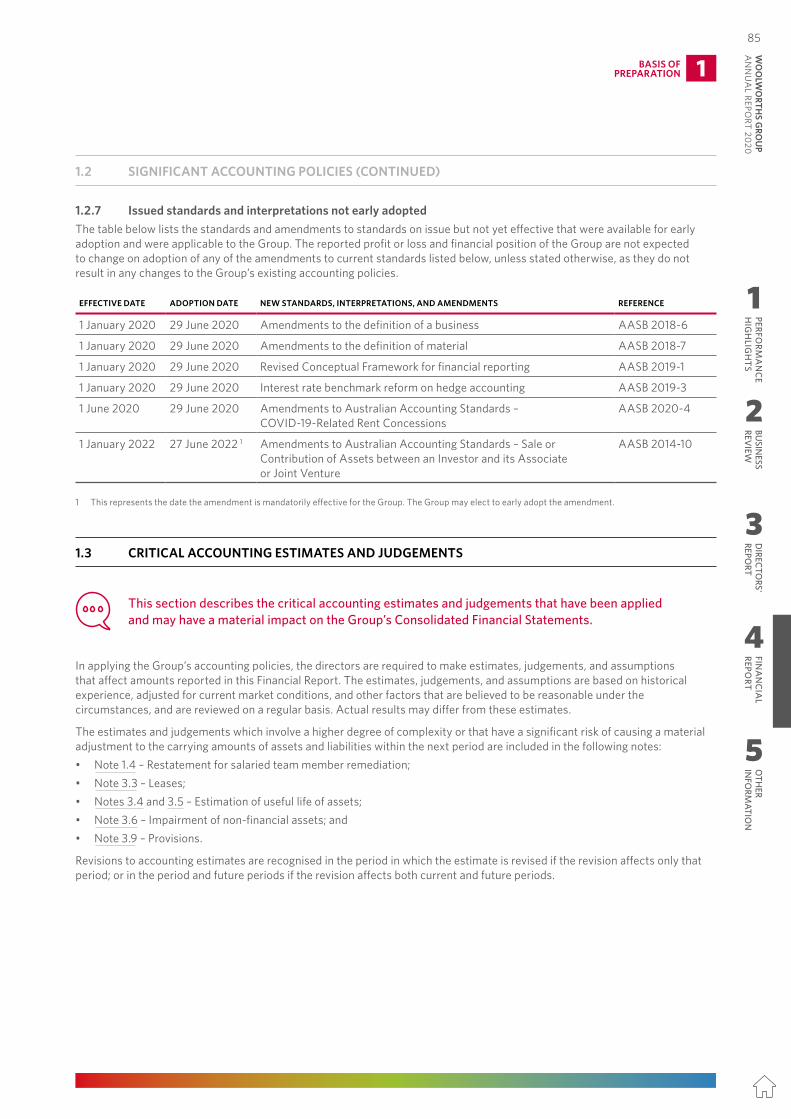
1.2.6 New and amended standards adopted by the Group (continued)
AASB 16 Leases (continued)Transition (continued)The net effect of the lease liabilities and lease assets, net of impairment, deferred tax and the reversal of the existing straight-line lease and incentive liability, and prepayments, has been recognised in opening retained earnings on 1 July 2019 with no restatement of comparative information. The impact predominantly related to the Group’s property leases.
Impact on the adoption of AASB 16 LeasesIMPACT ON CONSOLIDATED STATEMENT OF FINANCIAL POSITION AS AT 1 JULY 2019 $M
Recognition of lease assets 12,239Recognition of lease liabilities (14,711)Derecognition of straight-line lease liabilities 273Derecognition of onerous lease provisions 194Net deferred tax assets 583Other 24Reduction in retained earnings 1,398
On 1 July 2019, the weighted average incremental borrowing rate was 4.9%.
Lease payments other than for short-term leases, service components of leases, and variable lease payments (other lease payments) are classified within financing activities in the Consolidated Statement of Cash Flows, with the interest portion of lease payments included in Payments for the interest component of lease liabilities in operating activities. Other lease payments continue to be classified within Payments to suppliers and employees within operating activities. There was no net impact to the Consolidated Statement of Cash Flows from the adoption of AASB 16.
Operating lease commitments The following is a reconciliation of the Group’s operating lease commitments (AASB 117) at 30 June 2019 to the lease liability that was recognised on 1 July 2019 in accordance with AASB 16:
RECONCILIATION OF OPERATING LEASE COMMITMENTS TO LEASE LIABILITY UNDER AASB 16 $M
Operating lease commitments at 30 June 2019 (as disclosed in the 2019 Financial Report) 21,791Less: leases not yet commenced (1,322)Less: exemption for short-term leases (153)Less: service components of lease payments (3,583)Plus: impact of extension and termination options reasonably certain to be exercised 3,964Less: discounting using the incremental borrowing rate at 1 July 2019 (5,986)Lease liabilities recognised at 1 July 2019 14,711
Notes to the Consolidated Financial Statements
1.2 SIGNIFICANT ACCOUNTING POLICIES (CONTINUED)
84
1.2.7 Issued standards and interpretations not early adoptedThe table below lists the standards and amendments to standards on issue but not yet effective that were available for early adoption and were applicable to the Group. The reported profit or loss and financial position of the Group are not expected to change on adoption of any of the amendments to current standards listed below, unless stated otherwise, as they do not result in any changes to the Group’s existing accounting policies.
EFFECTIVE DATE ADOPTION DATE NEW STANDARDS, INTERPRETATIONS, AND AMENDMENTS REFERENCE
1 January 2020 29 June 2020 Amendments to the definition of a business AASB 2018-6
1 January 2020 29 June 2020 Amendments to the definition of material AASB 2018-7
1 January 2020 29 June 2020 Revised Conceptual Framework for financial reporting AASB 2019-1
1 January 2020 29 June 2020 Interest rate benchmark reform on hedge accounting AASB 2019-3
1 June 2020 29 June 2020 Amendments to Australian Accounting Standards – COVID-19-Related Rent Concessions
AASB 2020-4
1 January 2022 27 June 2022 1 Amendments to Australian Accounting Standards – Sale or Contribution of Assets between an Investor and its Associate or Joint Venture
AASB 2014-10
1 This represents the date the amendment is mandatorily effective for the Group. The Group may elect to early adopt the amendment.
1.3 CRITICAL ACCOUNTING ESTIMATES AND JUDGEMENTS
This section describes the critical accounting estimates and judgements that have been applied and may have a material impact on the Group’s Consolidated Financial Statements.
In applying the Group’s accounting policies, the directors are required to make estimates, judgements, and assumptions that affect amounts reported in this Financial Report. The estimates, judgements, and assumptions are based on historical experience, adjusted for current market conditions, and other factors that are believed to be reasonable under the circumstances, and are reviewed on a regular basis. Actual results may differ from these estimates.
The estimates and judgements which involve a higher degree of complexity or that have a significant risk of causing a material adjustment to the carrying amounts of assets and liabilities within the next period are included in the following notes:• Note 1.4 – Restatement for salaried team member remediation;• Note 3.3 – Leases;• Notes 3.4 and 3.5 – Estimation of useful life of assets;• Note 3.6 – Impairment of non-financial assets; and• Note 3.9 – Provisions.
Revisions to accounting estimates are recognised in the period in which the estimate is revised if the revision affects only that period; or in the period and future periods if the revision affects both current and future periods.
BASIS OFPREPARATION 1
1.2 SIGNIFICANT ACCOUNTING POLICIES (CONTINUED)
1
2
3
4
5
PERFORM
AN
CE
HIG
HLIG
HTS
BUSIN
ESS REV
IEWD
IRECTORS'
REPORT
FINA
NC
IAL
REPORT
OTH
ER IN
FORM
ATION
85W
OO
LWO
RTHS G
ROU
P A
NN
UA
L REPORT 2020
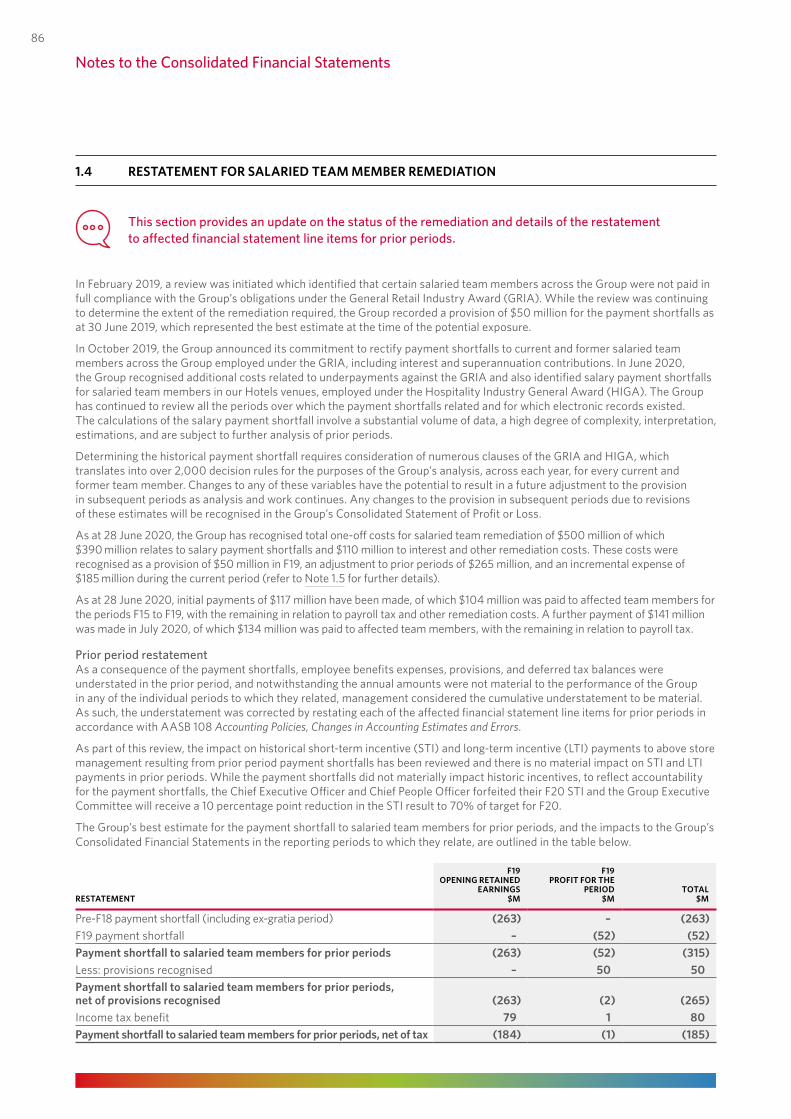
1.4 RESTATEMENT FOR SALARIED TEAM MEMBER REMEDIATION
This section provides an update on the status of the remediation and details of the restatement to affected financial statement line items for prior periods.
In February 2019, a review was initiated which identified that certain salaried team members across the Group were not paid in full compliance with the Group’s obligations under the General Retail Industry Award (GRIA). While the review was continuing to determine the extent of the remediation required, the Group recorded a provision of $50 million for the payment shortfalls as at 30 June 2019, which represented the best estimate at the time of the potential exposure.
In October 2019, the Group announced its commitment to rectify payment shortfalls to current and former salaried team members across the Group employed under the GRIA, including interest and superannuation contributions. In June 2020, the Group recognised additional costs related to underpayments against the GRIA and also identified salary payment shortfalls for salaried team members in our Hotels venues, employed under the Hospitality Industry General Award (HIGA). The Group has continued to review all the periods over which the payment shortfalls related and for which electronic records existed. The calculations of the salary payment shortfall involve a substantial volume of data, a high degree of complexity, interpretation, estimations, and are subject to further analysis of prior periods.
Determining the historical payment shortfall requires consideration of numerous clauses of the GRIA and HIGA, which translates into over 2,000 decision rules for the purposes of the Group’s analysis, across each year, for every current and former team member. Changes to any of these variables have the potential to result in a future adjustment to the provision in subsequent periods as analysis and work continues. Any changes to the provision in subsequent periods due to revisions of these estimates will be recognised in the Group’s Consolidated Statement of Profit or Loss.
As at 28 June 2020, the Group has recognised total one-off costs for salaried team remediation of $500 million of which $390 million relates to salary payment shortfalls and $110 million to interest and other remediation costs. These costs were recognised as a provision of $50 million in F19, an adjustment to prior periods of $265 million, and an incremental expense of $185 million during the current period (refer to Note 1.5 for further details).
As at 28 June 2020, initial payments of $117 million have been made, of which $104 million was paid to affected team members for the periods F15 to F19, with the remaining in relation to payroll tax and other remediation costs. A further payment of $141 million was made in July 2020, of which $134 million was paid to affected team members, with the remaining in relation to payroll tax.
Prior period restatementAs a consequence of the payment shortfalls, employee benefits expenses, provisions, and deferred tax balances were understated in the prior period, and notwithstanding the annual amounts were not material to the performance of the Group in any of the individual periods to which they related, management considered the cumulative understatement to be material. As such, the understatement was corrected by restating each of the affected financial statement line items for prior periods in accordance with AASB 108 Accounting Policies, Changes in Accounting Estimates and Errors.
As part of this review, the impact on historical short-term incentive (STI) and long-term incentive (LTI) payments to above store management resulting from prior period payment shortfalls has been reviewed and there is no material impact on STI and LTI payments in prior periods. While the payment shortfalls did not materially impact historic incentives, to reflect accountability for the payment shortfalls, the Chief Executive Officer and Chief People Officer forfeited their F20 STI and the Group Executive Committee will receive a 10 percentage point reduction in the STI result to 70% of target for F20.
The Group’s best estimate for the payment shortfall to salaried team members for prior periods, and the impacts to the Group’s Consolidated Financial Statements in the reporting periods to which they relate, are outlined in the table below.
RESTATEMENT
F19 OPENING RETAINED
EARNINGS $M
F19 PROFIT FOR THE
PERIOD $M
TOTAL $M
Pre-F18 payment shortfall (including ex-gratia period) (263) – (263)F19 payment shortfall – (52) (52)Payment shortfall to salaried team members for prior periods (263) (52) (315)Less: provisions recognised – 50 50 Payment shortfall to salaried team members for prior periods, net of provisions recognised (263) (2) (265)Income tax benefit 79 1 80 Payment shortfall to salaried team members for prior periods, net of tax (184) (1) (185)
Notes to the Consolidated Financial Statements
86
1.4 RESTATEMENT FOR SALARIED TEAM MEMBER REMEDIATION (CONTINUED)
Consolidated Statement of Profit or Loss (extract)
2019
IMPACT OF RESTATEMENT
PREVIOUSLY REPORTED
$MADJUSTMENTS
$MRESTATED
$M
Continuing operationsAdministration expenses (3,682) (2) (3,684)Profit before income tax 2,227 (2) 2,225 Income tax expense (668) 1 (667)Profit for the period from continuing operations 1,559 (1) 1,558 Discontinued operationsProfit for the period from discontinued operations, after tax 1,200 – 1,200 Profit for the period 2,759 (1) 2,758
The amount of the correction did not have any impact on basic and diluted earnings per share attributable to equity holders of the parent entity for the Group and from continuing operations for the prior reporting period.
Consolidated Statement of Financial Position (extract)
2019
IMPACT OF RESTATEMENT
PREVIOUSLY REPORTED
$MADJUSTMENTS
$MRESTATED
$M
Net deferred tax asset 311 80 391Provisions - current 1,528 265 1,793 Net assets 10,669 (185) 10,484 Retained earnings 3,968 (185) 3,783 Total equity 10,669 (185) 10,484
1.5 INDIVIDUALLY SIGNIFICANT ITEMS
Individually significant items represent non‑recurring income received and expenses incurred that are not part of the core operations of the Group.
Significant items have been highlighted to help users of this Financial Report understand the financial performance of the Group during the reporting period.
The significant items included within administration expenses in the Consolidated Statement of Profit or Loss are as follows:
2020PROFIT BEFORE
INCOME TAX$M
INCOME TAX BENEFIT
$M
PROFIT FOR THE PERIOD
$M
Continuing operationsAustralian FoodSupply chain network strategy review (176) 53 (123)OtherEndeavour Group transformation costs (230) 45 (185)Salaried team member remediation (185) 56 (129)Total Group significant items (591) 154 (437)
BASIS OFPREPARATION 1
1
2
3
4
5
PERFORM
AN
CE
HIG
HLIG
HTS
BUSIN
ESS REV
IEWD
IRECTORS'
REPORT
FINA
NC
IAL
REPORT
OTH
ER IN
FORM
ATION
87
WO
OLW
ORTH
S GRO
UP
AN
NU
AL REPO
RT 2020
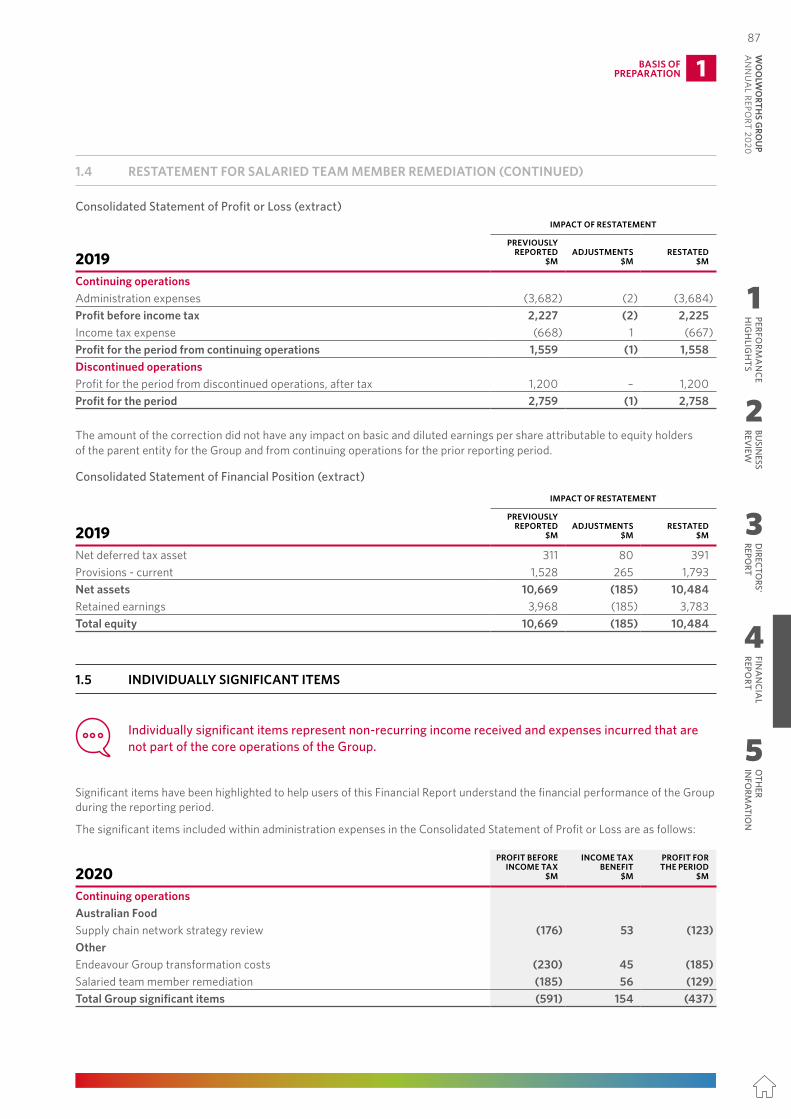
1.4 RESTATEMENT FOR SALARIED TEAM MEMBER REMEDIATION
This section provides an update on the status of the remediation and details of the restatement to affected financial statement line items for prior periods.
In February 2019, a review was initiated which identified that certain salaried team members across the Group were not paid in full compliance with the Group’s obligations under the General Retail Industry Award (GRIA). While the review was continuing to determine the extent of the remediation required, the Group recorded a provision of $50 million for the payment shortfalls as at 30 June 2019, which represented the best estimate at the time of the potential exposure.
In October 2019, the Group announced its commitment to rectify payment shortfalls to current and former salaried team members across the Group employed under the GRIA, including interest and superannuation contributions. In June 2020, the Group recognised additional costs related to underpayments against the GRIA and also identified salary payment shortfalls for salaried team members in our Hotels venues, employed under the Hospitality Industry General Award (HIGA). The Group has continued to review all the periods over which the payment shortfalls related and for which electronic records existed. The calculations of the salary payment shortfall involve a substantial volume of data, a high degree of complexity, interpretation, estimations, and are subject to further analysis of prior periods.
Determining the historical payment shortfall requires consideration of numerous clauses of the GRIA and HIGA, which translates into over 2,000 decision rules for the purposes of the Group’s analysis, across each year, for every current and former team member. Changes to any of these variables have the potential to result in a future adjustment to the provision in subsequent periods as analysis and work continues. Any changes to the provision in subsequent periods due to revisions of these estimates will be recognised in the Group’s Consolidated Statement of Profit or Loss.
As at 28 June 2020, the Group has recognised total one-off costs for salaried team remediation of $500 million of which $390 million relates to salary payment shortfalls and $110 million to interest and other remediation costs. These costs were recognised as a provision of $50 million in F19, an adjustment to prior periods of $265 million, and an incremental expense of $185 million during the current period (refer to Note 1.5 for further details).
As at 28 June 2020, initial payments of $117 million have been made, of which $104 million was paid to affected team members for the periods F15 to F19, with the remaining in relation to payroll tax and other remediation costs. A further payment of $141 million was made in July 2020, of which $134 million was paid to affected team members, with the remaining in relation to payroll tax.
Prior period restatementAs a consequence of the payment shortfalls, employee benefits expenses, provisions, and deferred tax balances were understated in the prior period, and notwithstanding the annual amounts were not material to the performance of the Group in any of the individual periods to which they related, management considered the cumulative understatement to be material. As such, the understatement was corrected by restating each of the affected financial statement line items for prior periods in accordance with AASB 108 Accounting Policies, Changes in Accounting Estimates and Errors.
As part of this review, the impact on historical short-term incentive (STI) and long-term incentive (LTI) payments to above store management resulting from prior period payment shortfalls has been reviewed and there is no material impact on STI and LTI payments in prior periods. While the payment shortfalls did not materially impact historic incentives, to reflect accountability for the payment shortfalls, the Chief Executive Officer and Chief People Officer forfeited their F20 STI and the Group Executive Committee will receive a 10 percentage point reduction in the STI result to 70% of target for F20.
The Group’s best estimate for the payment shortfall to salaried team members for prior periods, and the impacts to the Group’s Consolidated Financial Statements in the reporting periods to which they relate, are outlined in the table below.
RESTATEMENT
F19 OPENING RETAINED
EARNINGS $M
F19 PROFIT FOR THE
PERIOD $M
TOTAL $M
Pre-F18 payment shortfall (including ex-gratia period) (263) – (263)F19 payment shortfall – (52) (52)Payment shortfall to salaried team members for prior periods (263) (52) (315)Less: provisions recognised – 50 50 Payment shortfall to salaried team members for prior periods, net of provisions recognised (263) (2) (265)Income tax benefit 79 1 80 Payment shortfall to salaried team members for prior periods, net of tax (184) (1) (185)
Notes to the Consolidated Financial Statements
86
1.4 RESTATEMENT FOR SALARIED TEAM MEMBER REMEDIATION (CONTINUED)
Consolidated Statement of Profit or Loss (extract)
2019
IMPACT OF RESTATEMENT
PREVIOUSLY REPORTED
$MADJUSTMENTS
$MRESTATED
$M
Continuing operationsAdministration expenses (3,682) (2) (3,684)Profit before income tax 2,227 (2) 2,225 Income tax expense (668) 1 (667)Profit for the period from continuing operations 1,559 (1) 1,558 Discontinued operationsProfit for the period from discontinued operations, after tax 1,200 – 1,200 Profit for the period 2,759 (1) 2,758
The amount of the correction did not have any impact on basic and diluted earnings per share attributable to equity holders of the parent entity for the Group and from continuing operations for the prior reporting period.
Consolidated Statement of Financial Position (extract)
2019
IMPACT OF RESTATEMENT
PREVIOUSLY REPORTED
$MADJUSTMENTS
$MRESTATED
$M
Net deferred tax asset 311 80 391Provisions - current 1,528 265 1,793 Net assets 10,669 (185) 10,484 Retained earnings 3,968 (185) 3,783 Total equity 10,669 (185) 10,484
1.5 INDIVIDUALLY SIGNIFICANT ITEMS
Individually significant items represent non‑recurring income received and expenses incurred that are not part of the core operations of the Group.
Significant items have been highlighted to help users of this Financial Report understand the financial performance of the Group during the reporting period.
The significant items included within administration expenses in the Consolidated Statement of Profit or Loss are as follows:
2020PROFIT BEFORE
INCOME TAX$M
INCOME TAX BENEFIT
$M
PROFIT FOR THE PERIOD
$M
Continuing operationsAustralian FoodSupply chain network strategy review (176) 53 (123)OtherEndeavour Group transformation costs (230) 45 (185)Salaried team member remediation (185) 56 (129)Total Group significant items (591) 154 (437)
BASIS OFPREPARATION 1
1
2
3
4
5
PERFORM
AN
CE
HIG
HLIG
HTS
BUSIN
ESS REV
IEWD
IRECTORS'
REPORT
FINA
NC
IAL
REPORT
OTH
ER IN
FORM
ATION
87W
OO
LWO
RTHS G
ROU
P A
NN
UA
L REPORT 2020
1.5 INDIVIDUALLY SIGNIFICANT ITEMS (CONTINUED)
Supply chain network strategy reviewDuring the year, the Group announced the closure of three sites as part of the New South Wales grocery supply chain transformation. An expense of $176 million was recognised in the period relating to the estimated redundancy costs for impacted team members.
Endeavour Group Transformation costsDuring the period, the Group completed the Restructure Scheme and ALH Merger to combine its Endeavour Drinks and Hotels businesses to create Endeavour Group. This has resulted in the Group recognising one-off costs totalling $230 million in the current period related to the merger and restructure of Endeavour Drinks and ALH Hotels, and the potential separation of Endeavour Group Limited. The costs include stamp duty, IT costs, external consulting costs, contractor costs, and other incremental costs. The Group has deferred the planned separation of Endeavour Group Limited until 2021 due to the impact of COVID-19 on Hotels.
Salaried team member remediationDuring the period, an expense of $185 million was recognised for interest and other salaried team member remediation costs incurred as a result of the Group’s non-compliance with the General Retail Industry Award for salaried team members and payment shortfalls for team members within ALH Hotels employed under the Hospitality Industry General Award. This charge is based on management’s best estimate of these costs as at the end of the period. Refer to Note 1.4 for further details on the payment shortfall for team members for prior periods.
1.6 FINANCIAL REPORTING IMPACTS OF COVID‑19
The COVID‑19 pandemic has had a material impact on the Group’s financial performance for the period. This section provides a summary of the key financial reporting impacts of COVID‑19.
Earnings before interest and tax (EBIT) growth in H2 F20 was impacted by COVID-19 in different ways. The closure of Hotels for much of the last four months of the period led to a material decline in Hotels H2 F20 EBIT compared to F19. However, the impact of the Hotels closures was partially offset by sales and EBIT growth across the other businesses, despite materially higher costs of customer and team safety measures in response to COVID-19.
EBIT growth was impacted by the materially higher costs of operating during COVID-19, due to additional team hours to support the safety of team members and customers, additional costs associated with cleaning, security and personal protective equipment, incremental supply chain costs to meet increased demand, and the cost of the Better Together Recognition Award for team members, to recognise their contribution during COVID-19.
COVID-19 also impacted the customer shopping experience, particularly in March and early April, driven by material levels of pantry-loading. Initially there was a decline in customer scores due to the lower stock availability; however, scores quickly recovered in April as customers recognised the efforts of team members to provide an essential service, keep them safe, and deliver additional convenience.
FINANCIAL REPORTING IMPACTS OF COVID-19
The Group has considered the impact of the COVID-19 pandemic across its businesses. Details about the impact of COVID-19 are included in the following notes:• Note 2.2 – Segment disclosures from continuing operations;• Note 3.1 – Trade and other receivables; and• Note 3.6 – Impairment of non-financial assets.
Notes to the Consolidated Financial Statements
88
2 GROUP PERFORMANCE
2.1 REVENUE FROM THE SALE OF GOODS AND SERVICES FROM CONTINUING OPERATIONS
The Group’s revenue mainly comprises the sale of goods in‑store and online, and leisure and hospitality services.
2020 201952 WEEKS 53 WEEKS
$M $M
Sale of goods in-store 57,796 54,720Sale of goods online 3,523 2,534Leisure and hospitality services 1,320 1,671Other 1 1,036 1,059Total 63,675 59,984
1 Other includes revenue from wholesale distribution of food and related products, and commission received on financial services.
SIGNIFICANT ACCOUNTING POLICIES
RevenueThe Group’s revenue mainly comprises the sale of goods in-store and online, and leisure and hospitality services. Revenue is recognised when control of the goods has transferred to the customer or when the service is provided at an amount that reflects the consideration to which the Group expects to be entitled.
For sale of goods in-store, control of the goods transfers to the customer at the point the customer purchases the goods in-store. For sale of goods online, control of the goods transfers to the customer at the point the goods are delivered to, or collected by, the customer. For leisure and hospitality services, revenue is recognised when the services are rendered. Where payment for the goods is received prior to control transferring to the customer, revenue recognition is deferred in contract liabilities within trade and other payables in the Consolidated Statement of Financial Position until the goods have been delivered to, or collected by, the customer.
Loyalty programRewards points granted by the Group provide customers with a material right to a discount on future purchases. The amounts allocated to rewards points are deferred in contract liabilities within trade and other payables in the Consolidated Statement of Financial Position until redeemed by the customer.
GROUPPERFORMANCE 2
1
2
3
4
5
PERFORM
AN
CE
HIG
HLIG
HTS
BUSIN
ESS REV
IEWD
IRECTORS'
REPORT
FINA
NC
IAL
REPORT
OTH
ER IN
FORM
ATION
89
WO
OLW
ORTH
S GRO
UP
AN
NU
AL REPO
RT 2020
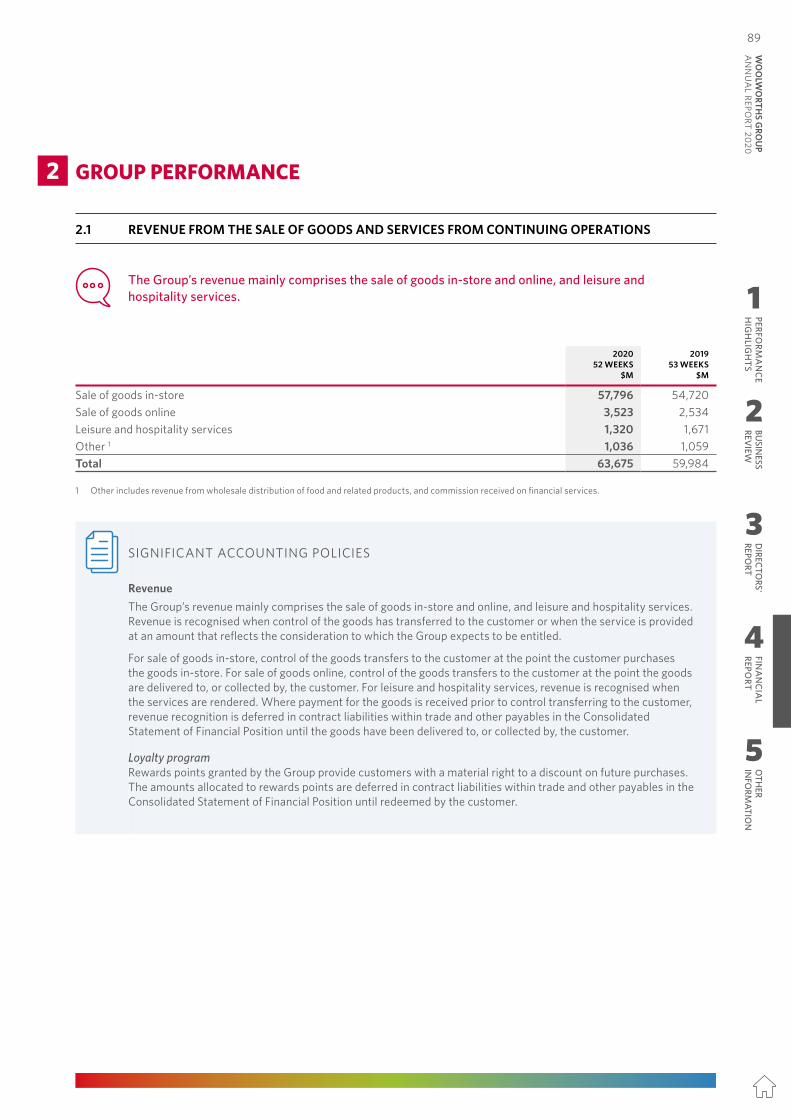
1.5 INDIVIDUALLY SIGNIFICANT ITEMS (CONTINUED)
Supply chain network strategy reviewDuring the year, the Group announced the closure of three sites as part of the New South Wales grocery supply chain transformation. An expense of $176 million was recognised in the period relating to the estimated redundancy costs for impacted team members.
Endeavour Group Transformation costsDuring the period, the Group completed the Restructure Scheme and ALH Merger to combine its Endeavour Drinks and Hotels businesses to create Endeavour Group. This has resulted in the Group recognising one-off costs totalling $230 million in the current period related to the merger and restructure of Endeavour Drinks and ALH Hotels, and the potential separation of Endeavour Group Limited. The costs include stamp duty, IT costs, external consulting costs, contractor costs, and other incremental costs. The Group has deferred the planned separation of Endeavour Group Limited until 2021 due to the impact of COVID-19 on Hotels.
Salaried team member remediationDuring the period, an expense of $185 million was recognised for interest and other salaried team member remediation costs incurred as a result of the Group’s non-compliance with the General Retail Industry Award for salaried team members and payment shortfalls for team members within ALH Hotels employed under the Hospitality Industry General Award. This charge is based on management’s best estimate of these costs as at the end of the period. Refer to Note 1.4 for further details on the payment shortfall for team members for prior periods.
1.6 FINANCIAL REPORTING IMPACTS OF COVID‑19
The COVID‑19 pandemic has had a material impact on the Group’s financial performance for the period. This section provides a summary of the key financial reporting impacts of COVID‑19.
Earnings before interest and tax (EBIT) growth in H2 F20 was impacted by COVID-19 in different ways. The closure of Hotels for much of the last four months of the period led to a material decline in Hotels H2 F20 EBIT compared to F19. However, the impact of the Hotels closures was partially offset by sales and EBIT growth across the other businesses, despite materially higher costs of customer and team safety measures in response to COVID-19.
EBIT growth was impacted by the materially higher costs of operating during COVID-19, due to additional team hours to support the safety of team members and customers, additional costs associated with cleaning, security and personal protective equipment, incremental supply chain costs to meet increased demand, and the cost of the Better Together Recognition Award for team members, to recognise their contribution during COVID-19.
COVID-19 also impacted the customer shopping experience, particularly in March and early April, driven by material levels of pantry-loading. Initially there was a decline in customer scores due to the lower stock availability; however, scores quickly recovered in April as customers recognised the efforts of team members to provide an essential service, keep them safe, and deliver additional convenience.
FINANCIAL REPORTING IMPACTS OF COVID-19
The Group has considered the impact of the COVID-19 pandemic across its businesses. Details about the impact of COVID-19 are included in the following notes:• Note 2.2 – Segment disclosures from continuing operations;• Note 3.1 – Trade and other receivables; and• Note 3.6 – Impairment of non-financial assets.
Notes to the Consolidated Financial Statements
88
2 GROUP PERFORMANCE
2.1 REVENUE FROM THE SALE OF GOODS AND SERVICES FROM CONTINUING OPERATIONS
The Group’s revenue mainly comprises the sale of goods in‑store and online, and leisure and hospitality services.
2020 201952 WEEKS 53 WEEKS
$M $M
Sale of goods in-store 57,796 54,720Sale of goods online 3,523 2,534Leisure and hospitality services 1,320 1,671Other 1 1,036 1,059Total 63,675 59,984
1 Other includes revenue from wholesale distribution of food and related products, and commission received on financial services.
SIGNIFICANT ACCOUNTING POLICIES
RevenueThe Group’s revenue mainly comprises the sale of goods in-store and online, and leisure and hospitality services. Revenue is recognised when control of the goods has transferred to the customer or when the service is provided at an amount that reflects the consideration to which the Group expects to be entitled.
For sale of goods in-store, control of the goods transfers to the customer at the point the customer purchases the goods in-store. For sale of goods online, control of the goods transfers to the customer at the point the goods are delivered to, or collected by, the customer. For leisure and hospitality services, revenue is recognised when the services are rendered. Where payment for the goods is received prior to control transferring to the customer, revenue recognition is deferred in contract liabilities within trade and other payables in the Consolidated Statement of Financial Position until the goods have been delivered to, or collected by, the customer.
Loyalty programRewards points granted by the Group provide customers with a material right to a discount on future purchases. The amounts allocated to rewards points are deferred in contract liabilities within trade and other payables in the Consolidated Statement of Financial Position until redeemed by the customer.
GROUPPERFORMANCE 2
1
2
3
4
5
PERFORM
AN
CE
HIG
HLIG
HTS
BUSIN
ESS REV
IEWD
IRECTORS'
REPORT
FINA
NC
IAL
REPORT
OTH
ER IN
FORM
ATION
89W
OO
LWO
RTHS G
ROU
P A
NN
UA
L REPORT 2020
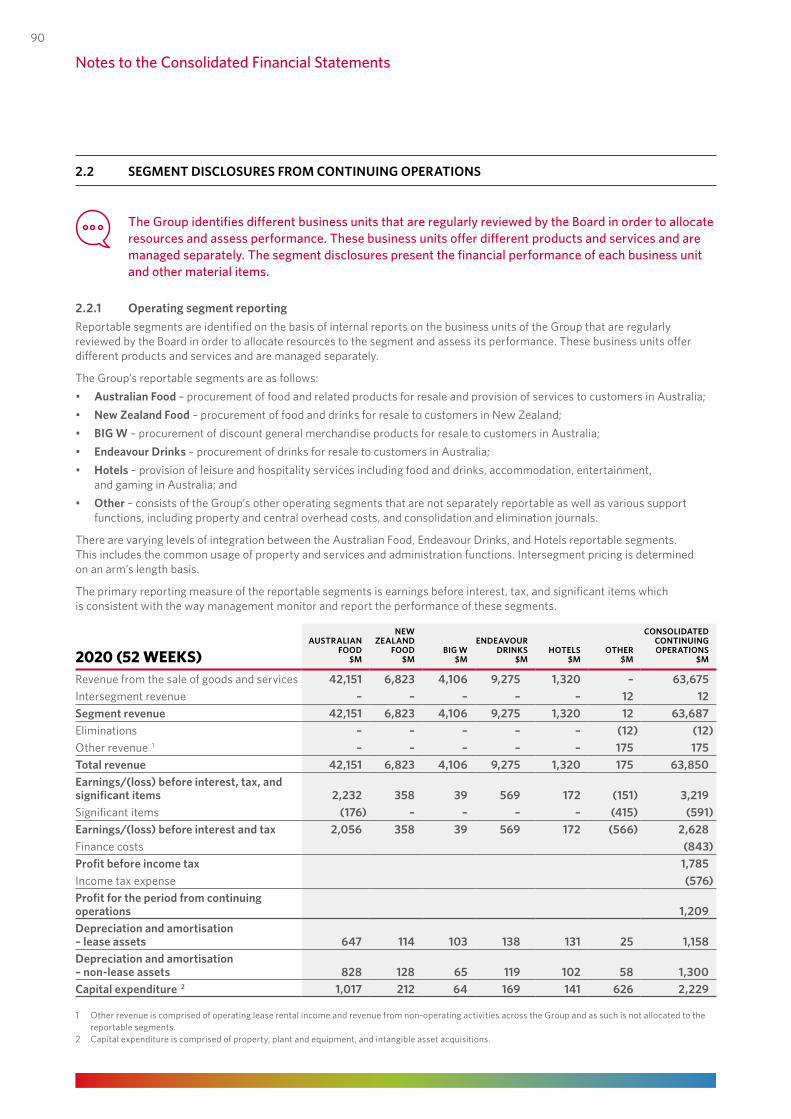
2.2 SEGMENT DISCLOSURES FROM CONTINUING OPERATIONS
The Group identifies different business units that are regularly reviewed by the Board in order to allocate resources and assess performance. These business units offer different products and services and are managed separately. The segment disclosures present the financial performance of each business unit and other material items.
2.2.1 Operating segment reportingReportable segments are identified on the basis of internal reports on the business units of the Group that are regularly reviewed by the Board in order to allocate resources to the segment and assess its performance. These business units offer different products and services and are managed separately.
The Group’s reportable segments are as follows:• Australian Food – procurement of food and related products for resale and provision of services to customers in Australia;• New Zealand Food – procurement of food and drinks for resale to customers in New Zealand;• BIG W – procurement of discount general merchandise products for resale to customers in Australia; • Endeavour Drinks – procurement of drinks for resale to customers in Australia;• Hotels – provision of leisure and hospitality services including food and drinks, accommodation, entertainment,
and gaming in Australia; and• Other – consists of the Group’s other operating segments that are not separately reportable as well as various support
functions, including property and central overhead costs, and consolidation and elimination journals.
There are varying levels of integration between the Australian Food, Endeavour Drinks, and Hotels reportable segments. This includes the common usage of property and services and administration functions. Intersegment pricing is determined on an arm’s length basis.
The primary reporting measure of the reportable segments is earnings before interest, tax, and significant items which is consistent with the way management monitor and report the performance of these segments.
2020 (52 WEEKS)AUSTRALIAN
FOOD $M
NEW ZEALAND
FOOD $M
BIG W $M
ENDEAVOUR DRINKS
$MHOTELS
$MOTHER
$M
CONSOLIDATED CONTINUING OPERATIONS
$M
Revenue from the sale of goods and services 42,151 6,823 4,106 9,275 1,320 – 63,675 Intersegment revenue – – – – – 12 12 Segment revenue 42,151 6,823 4,106 9,275 1,320 12 63,687 Eliminations – – – – – (12) (12) Other revenue 1 – – – – – 175 175 Total revenue 42,151 6,823 4,106 9,275 1,320 175 63,850 Earnings/(loss) before interest, tax, and significant items 2,232 358 39 569 172 (151) 3,219 Significant items (176) – – – – (415) (591)Earnings/(loss) before interest and tax 2,056 358 39 569 172 (566) 2,628 Finance costs (843)Profit before income tax 1,785 Income tax expense (576)Profit for the period from continuing operations 1,209 Depreciation and amortisation – lease assets 647 114 103 138 131 25 1,158 Depreciation and amortisation – non‑lease assets 828 128 65 119 102 58 1,300 Capital expenditure 2 1,017 212 64 169 141 626 2,229
1 Other revenue is comprised of operating lease rental income and revenue from non-operating activities across the Group and as such is not allocated to the reportable segments.
2 Capital expenditure is comprised of property, plant and equipment, and intangible asset acquisitions.
Notes to the Consolidated Financial Statements
90
2.2.1 Operating segment reporting (continued)
RESTATED 2019 (53 WEEKS)AUSTRALIAN
FOOD 1 $M
NEW ZEALAND
FOOD $M
BIG W $M
ENDEAVOUR DRINKS 1
$MHOTELS
$MOTHER 2
$M
CONSOLIDATED CONTINUING OPERATIONS
$M
Revenue from the sale of goods and services 39,635 6,291 3,797 8,590 1,671 – 59,984 Intersegment revenue – – – – – 7 7 Segment revenue 39,635 6,291 3,797 8,590 1,671 7 59,991 Eliminations – – – – – (7) (7)Other revenue 3 – – – – – 288 288 Total revenue 39,635 6,291 3,797 8,590 1,671 288 60,272 Earnings/(loss) before interest, tax, and significant items 1,827 277 (85) 504 261 (62) 2,722 Significant items 4 – – (371) – – – (371)Earnings/(loss) before interest and tax 1,827 277 (456) 504 261 (62) 2,351 Finance costs (126)Profit before income tax 2,225 Income tax expense (667)Profit for the period from continuing operations 1,558 Depreciation and amortisation 756 121 80 105 111 49 1,222 Capital expenditure 5 1,040 176 110 131 176 471 2,104
1 Restated for the transfer of the management of the Summergate business from Endeavour Drinks to Australian Food during the current period.2 Loss before interest and tax for the Other reportable segment has been restated to include $2 million of costs relating to salaried team member remediation.
Consolidated Continuing Operations has also been restated for this cost and the associated tax impact. Refer to Note 1.4.3 Other revenue is comprised of operating lease rental income and revenue from non-operating activities across the Group and as such is not allocated to the
reportable segments.4 The BIG W network review and finalisation resulted in a recognition of expenses totalling $371 million, excluding tax, relating to non-cash asset impairments
and lease and other store exit costs.5 Capital expenditure is comprised of property, plant and equipment, and intangible asset acquisitions.
The Group has applied AASB 16 using the modified retrospective approach from 1 July 2019. The comparative amounts presented for the year ended 30 June 2019 were not restated for the impact of AASB 16 and continue to be reported under AASB 117 Leases. Refer to Note 1.2.6 for further details.
FINANCIAL REPORTING IMPACTS OF COVID-19
Earnings before interest and tax (EBIT) growth in H2 F20 was impacted by COVID-19 in different ways. The closure of Hotels for much of the last four months of the period led to a material decline in Hotels H2 F20 EBIT compared to F19. However, the impact of the Hotels closures was partially offset by sales and EBIT growth across the other businesses, despite materially higher costs of customer and team safety measures in response to COVID-19.
GROUPPERFORMANCE 2
2.2 SEGMENT DISCLOSURES FROM CONTINUING OPERATIONS (CONTINUED)
1
2
3
4
5
PERFORM
AN
CE
HIG
HLIG
HTS
BUSIN
ESS REV
IEWD
IRECTORS'
REPORT
FINA
NC
IAL
REPORT
OTH
ER IN
FORM
ATION
91
WO
OLW
ORTH
S GRO
UP
AN
NU
AL REPO
RT 2020
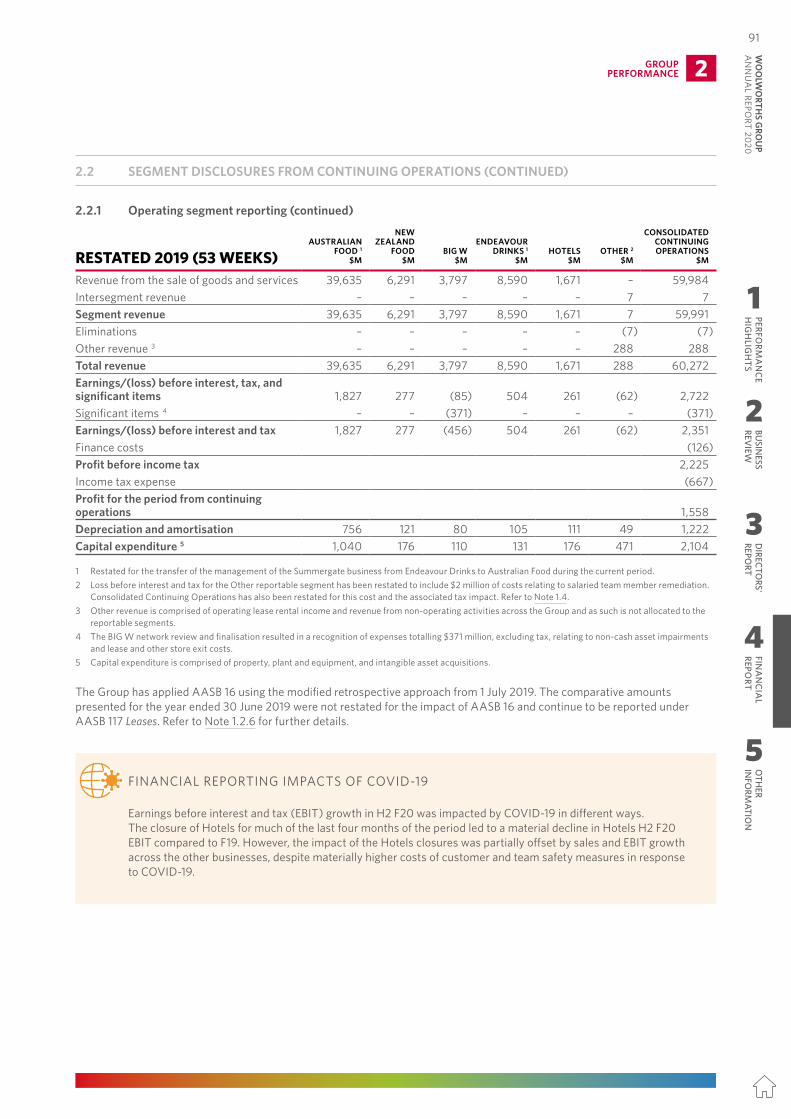
2.2 SEGMENT DISCLOSURES FROM CONTINUING OPERATIONS
The Group identifies different business units that are regularly reviewed by the Board in order to allocate resources and assess performance. These business units offer different products and services and are managed separately. The segment disclosures present the financial performance of each business unit and other material items.
2.2.1 Operating segment reportingReportable segments are identified on the basis of internal reports on the business units of the Group that are regularly reviewed by the Board in order to allocate resources to the segment and assess its performance. These business units offer different products and services and are managed separately.
The Group’s reportable segments are as follows:• Australian Food – procurement of food and related products for resale and provision of services to customers in Australia;• New Zealand Food – procurement of food and drinks for resale to customers in New Zealand;• BIG W – procurement of discount general merchandise products for resale to customers in Australia; • Endeavour Drinks – procurement of drinks for resale to customers in Australia;• Hotels – provision of leisure and hospitality services including food and drinks, accommodation, entertainment,
and gaming in Australia; and• Other – consists of the Group’s other operating segments that are not separately reportable as well as various support
functions, including property and central overhead costs, and consolidation and elimination journals.
There are varying levels of integration between the Australian Food, Endeavour Drinks, and Hotels reportable segments. This includes the common usage of property and services and administration functions. Intersegment pricing is determined on an arm’s length basis.
The primary reporting measure of the reportable segments is earnings before interest, tax, and significant items which is consistent with the way management monitor and report the performance of these segments.
2020 (52 WEEKS)AUSTRALIAN
FOOD $M
NEW ZEALAND
FOOD $M
BIG W $M
ENDEAVOUR DRINKS
$MHOTELS
$MOTHER
$M
CONSOLIDATED CONTINUING OPERATIONS
$M
Revenue from the sale of goods and services 42,151 6,823 4,106 9,275 1,320 – 63,675 Intersegment revenue – – – – – 12 12 Segment revenue 42,151 6,823 4,106 9,275 1,320 12 63,687 Eliminations – – – – – (12) (12) Other revenue 1 – – – – – 175 175 Total revenue 42,151 6,823 4,106 9,275 1,320 175 63,850 Earnings/(loss) before interest, tax, and significant items 2,232 358 39 569 172 (151) 3,219 Significant items (176) – – – – (415) (591)Earnings/(loss) before interest and tax 2,056 358 39 569 172 (566) 2,628 Finance costs (843)Profit before income tax 1,785 Income tax expense (576)Profit for the period from continuing operations 1,209 Depreciation and amortisation – lease assets 647 114 103 138 131 25 1,158 Depreciation and amortisation – non‑lease assets 828 128 65 119 102 58 1,300 Capital expenditure 2 1,017 212 64 169 141 626 2,229
1 Other revenue is comprised of operating lease rental income and revenue from non-operating activities across the Group and as such is not allocated to the reportable segments.
2 Capital expenditure is comprised of property, plant and equipment, and intangible asset acquisitions.
Notes to the Consolidated Financial Statements
90
2.2.1 Operating segment reporting (continued)
RESTATED 2019 (53 WEEKS)AUSTRALIAN
FOOD 1 $M
NEW ZEALAND
FOOD $M
BIG W $M
ENDEAVOUR DRINKS 1
$MHOTELS
$MOTHER 2
$M
CONSOLIDATED CONTINUING OPERATIONS
$M
Revenue from the sale of goods and services 39,635 6,291 3,797 8,590 1,671 – 59,984 Intersegment revenue – – – – – 7 7 Segment revenue 39,635 6,291 3,797 8,590 1,671 7 59,991 Eliminations – – – – – (7) (7)Other revenue 3 – – – – – 288 288 Total revenue 39,635 6,291 3,797 8,590 1,671 288 60,272 Earnings/(loss) before interest, tax, and significant items 1,827 277 (85) 504 261 (62) 2,722 Significant items 4 – – (371) – – – (371)Earnings/(loss) before interest and tax 1,827 277 (456) 504 261 (62) 2,351 Finance costs (126)Profit before income tax 2,225 Income tax expense (667)Profit for the period from continuing operations 1,558 Depreciation and amortisation 756 121 80 105 111 49 1,222 Capital expenditure 5 1,040 176 110 131 176 471 2,104
1 Restated for the transfer of the management of the Summergate business from Endeavour Drinks to Australian Food during the current period.2 Loss before interest and tax for the Other reportable segment has been restated to include $2 million of costs relating to salaried team member remediation.
Consolidated Continuing Operations has also been restated for this cost and the associated tax impact. Refer to Note 1.4.3 Other revenue is comprised of operating lease rental income and revenue from non-operating activities across the Group and as such is not allocated to the
reportable segments.4 The BIG W network review and finalisation resulted in a recognition of expenses totalling $371 million, excluding tax, relating to non-cash asset impairments
and lease and other store exit costs.5 Capital expenditure is comprised of property, plant and equipment, and intangible asset acquisitions.
The Group has applied AASB 16 using the modified retrospective approach from 1 July 2019. The comparative amounts presented for the year ended 30 June 2019 were not restated for the impact of AASB 16 and continue to be reported under AASB 117 Leases. Refer to Note 1.2.6 for further details.
FINANCIAL REPORTING IMPACTS OF COVID-19
Earnings before interest and tax (EBIT) growth in H2 F20 was impacted by COVID-19 in different ways. The closure of Hotels for much of the last four months of the period led to a material decline in Hotels H2 F20 EBIT compared to F19. However, the impact of the Hotels closures was partially offset by sales and EBIT growth across the other businesses, despite materially higher costs of customer and team safety measures in response to COVID-19.
GROUPPERFORMANCE 2
2.2 SEGMENT DISCLOSURES FROM CONTINUING OPERATIONS (CONTINUED)
1
2
3
4
5
PERFORM
AN
CE
HIG
HLIG
HTS
BUSIN
ESS REV
IEWD
IRECTORS'
REPORT
FINA
NC
IAL
REPORT
OTH
ER IN
FORM
ATION
91W
OO
LWO
RTHS G
ROU
P A
NN
UA
L REPORT 2020
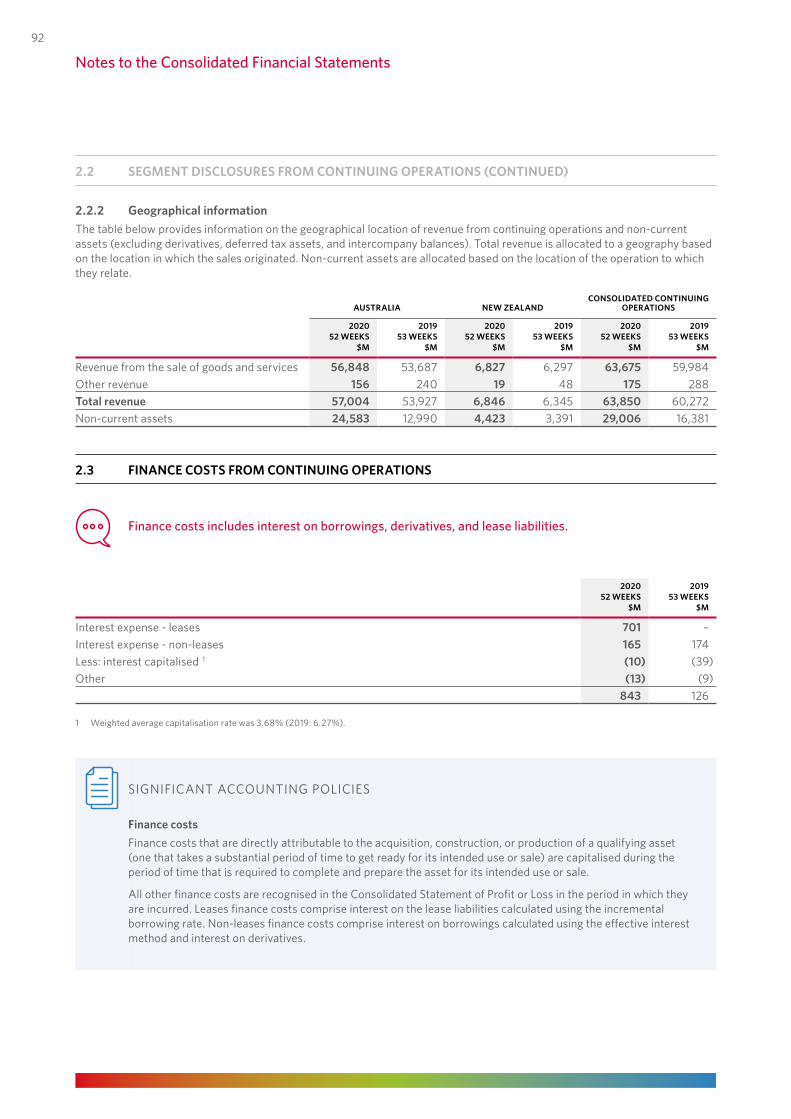
2.2.2 Geographical informationThe table below provides information on the geographical location of revenue from continuing operations and non-current assets (excluding derivatives, deferred tax assets, and intercompany balances). Total revenue is allocated to a geography based on the location in which the sales originated. Non-current assets are allocated based on the location of the operation to which they relate.
AUSTRALIA NEW ZEALANDCONSOLIDATED CONTINUING
OPERATIONS
2020 2019 2020 2019 2020 201952 WEEKS 53 WEEKS 52 WEEKS 53 WEEKS 52 WEEKS 53 WEEKS
$M $M $M $M $M $M
Revenue from the sale of goods and services 56,848 53,687 6,827 6,297 63,675 59,984Other revenue 156 240 19 48 175 288Total revenue 57,004 53,927 6,846 6,345 63,850 60,272Non-current assets 24,583 12,990 4,423 3,391 29,006 16,381
2.3 FINANCE COSTS FROM CONTINUING OPERATIONS
Finance costs includes interest on borrowings, derivatives, and lease liabilities.
2020 201952 WEEKS 53 WEEKS
$M $M
Interest expense - leases 701 – Interest expense - non-leases 165 174 Less: interest capitalised 1 (10) (39)Other (13) (9)
843 126
1 Weighted average capitalisation rate was 3.68% (2019: 6.27%).
SIGNIFICANT ACCOUNTING POLICIES
Finance costsFinance costs that are directly attributable to the acquisition, construction, or production of a qualifying asset (one that takes a substantial period of time to get ready for its intended use or sale) are capitalised during the period of time that is required to complete and prepare the asset for its intended use or sale.
All other finance costs are recognised in the Consolidated Statement of Profit or Loss in the period in which they are incurred. Leases finance costs comprise interest on the lease liabilities calculated using the incremental borrowing rate. Non-leases finance costs comprise interest on borrowings calculated using the effective interest method and interest on derivatives.
Notes to the Consolidated Financial Statements
2.2 SEGMENT DISCLOSURES FROM CONTINUING OPERATIONS (CONTINUED)
92
3 ASSETS AND LIABILITIES
3.1 TRADE AND OTHER RECEIVABLES
Trade and other receivables consists of amounts owed to the Group by customers for sales of goods and services in the ordinary course of business and amounts paid to suppliers in advance.
2020 2019$M $M
CurrentTrade receivables 1 138 132 Loss allowance (10) (11)
128 121 Other receivables 1 429 358 Loss allowance (9) (9)
420 349 Prepayments 192 212 Total current trade and other receivables 740 682 Non‑current Prepayments 40 42 Other receivables 114 103 Total non‑current trade and other receivables 154 145 Total 894 827
1 Includes supplier rebates of $84 million (2019: $84 million).
FINANCIAL REPORTING IMPACTS OF COVID-19
The Group assesses the expected credit losses associated with its trade and other receivables on a forward-looking basis. COVID-19 has not had a material impact on the loss allowances recognised at the end of the period.
SIGNIFICANT ACCOUNTING POLICIES
Trade and other receivablesTrade and other receivables are recognised initially at fair value and are subsequently measured at amortised cost using the effective interest method, less a loss allowance. They generally have terms of up to 30 days.
Impairment of trade and other receivablesThe Group assesses the expected credit losses associated with its trade and other receivables on a forward-looking basis. The Group applies the simplified approach to measuring expected credit losses, which requires expected lifetime losses to be recognised from initial recognition of the receivables. To measure the expected credit losses, trade and other receivables that share similar credit risk characteristics and days past due are grouped and then assessed for collectability as a whole.
ASSETS ANDLIABILITIES 3
1
2
3
4
5
PERFORM
AN
CE
HIG
HLIG
HTS
BUSIN
ESS REV
IEWD
IRECTORS'
REPORT
FINA
NC
IAL
REPORT
OTH
ER IN
FORM
ATION
93
WO
OLW
ORTH
S GRO
UP
AN
NU
AL REPO
RT 2020
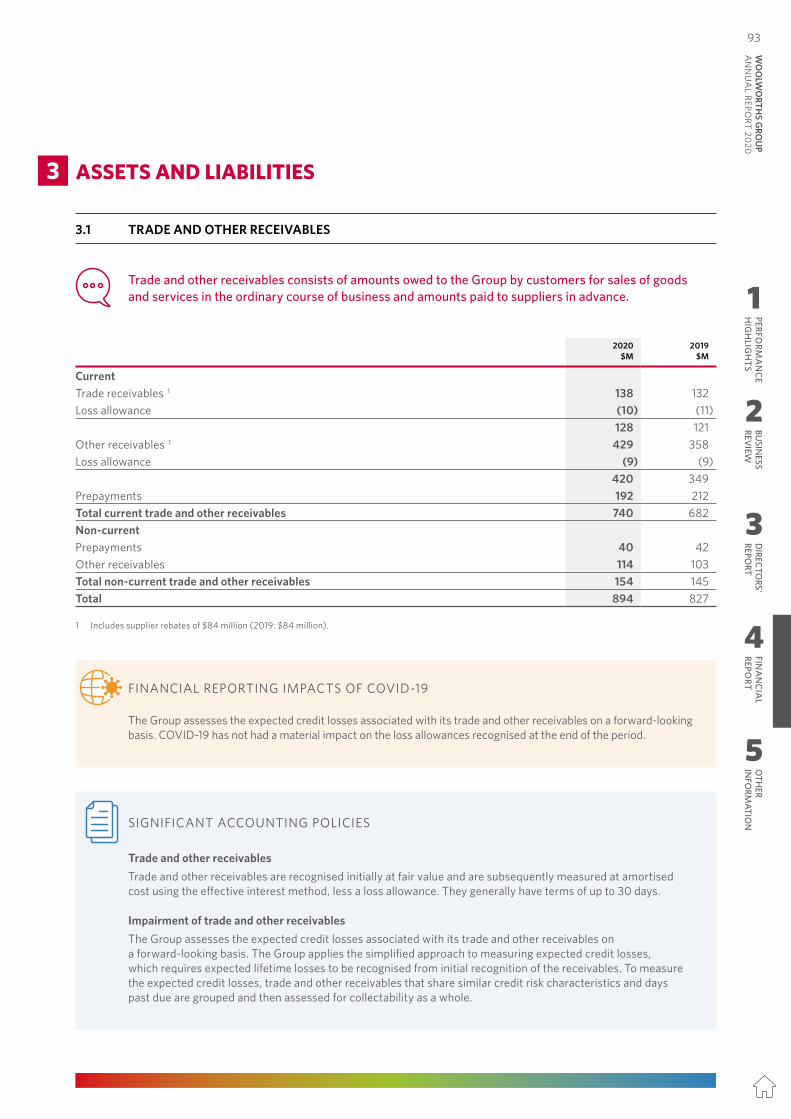
2.2.2 Geographical informationThe table below provides information on the geographical location of revenue from continuing operations and non-current assets (excluding derivatives, deferred tax assets, and intercompany balances). Total revenue is allocated to a geography based on the location in which the sales originated. Non-current assets are allocated based on the location of the operation to which they relate.
AUSTRALIA NEW ZEALANDCONSOLIDATED CONTINUING
OPERATIONS
2020 2019 2020 2019 2020 201952 WEEKS 53 WEEKS 52 WEEKS 53 WEEKS 52 WEEKS 53 WEEKS
$M $M $M $M $M $M
Revenue from the sale of goods and services 56,848 53,687 6,827 6,297 63,675 59,984Other revenue 156 240 19 48 175 288Total revenue 57,004 53,927 6,846 6,345 63,850 60,272Non-current assets 24,583 12,990 4,423 3,391 29,006 16,381
2.3 FINANCE COSTS FROM CONTINUING OPERATIONS
Finance costs includes interest on borrowings, derivatives, and lease liabilities.
2020 201952 WEEKS 53 WEEKS
$M $M
Interest expense - leases 701 – Interest expense - non-leases 165 174 Less: interest capitalised 1 (10) (39)Other (13) (9)
843 126
1 Weighted average capitalisation rate was 3.68% (2019: 6.27%).
SIGNIFICANT ACCOUNTING POLICIES
Finance costsFinance costs that are directly attributable to the acquisition, construction, or production of a qualifying asset (one that takes a substantial period of time to get ready for its intended use or sale) are capitalised during the period of time that is required to complete and prepare the asset for its intended use or sale.
All other finance costs are recognised in the Consolidated Statement of Profit or Loss in the period in which they are incurred. Leases finance costs comprise interest on the lease liabilities calculated using the incremental borrowing rate. Non-leases finance costs comprise interest on borrowings calculated using the effective interest method and interest on derivatives.
Notes to the Consolidated Financial Statements
2.2 SEGMENT DISCLOSURES FROM CONTINUING OPERATIONS (CONTINUED)
92
3 ASSETS AND LIABILITIES
3.1 TRADE AND OTHER RECEIVABLES
Trade and other receivables consists of amounts owed to the Group by customers for sales of goods and services in the ordinary course of business and amounts paid to suppliers in advance.
2020 2019$M $M
CurrentTrade receivables 1 138 132 Loss allowance (10) (11)
128 121 Other receivables 1 429 358 Loss allowance (9) (9)
420 349 Prepayments 192 212 Total current trade and other receivables 740 682 Non‑current Prepayments 40 42 Other receivables 114 103 Total non‑current trade and other receivables 154 145 Total 894 827
1 Includes supplier rebates of $84 million (2019: $84 million).
FINANCIAL REPORTING IMPACTS OF COVID-19
The Group assesses the expected credit losses associated with its trade and other receivables on a forward-looking basis. COVID-19 has not had a material impact on the loss allowances recognised at the end of the period.
SIGNIFICANT ACCOUNTING POLICIES
Trade and other receivablesTrade and other receivables are recognised initially at fair value and are subsequently measured at amortised cost using the effective interest method, less a loss allowance. They generally have terms of up to 30 days.
Impairment of trade and other receivablesThe Group assesses the expected credit losses associated with its trade and other receivables on a forward-looking basis. The Group applies the simplified approach to measuring expected credit losses, which requires expected lifetime losses to be recognised from initial recognition of the receivables. To measure the expected credit losses, trade and other receivables that share similar credit risk characteristics and days past due are grouped and then assessed for collectability as a whole.
ASSETS ANDLIABILITIES 3
1
2
3
4
5
PERFORM
AN
CE
HIG
HLIG
HTS
BUSIN
ESS REV
IEWD
IRECTORS'
REPORT
FINA
NC
IAL
REPORT
OTH
ER IN
FORM
ATION
93W
OO
LWO
RTHS G
ROU
P A
NN
UA
L REPORT 2020
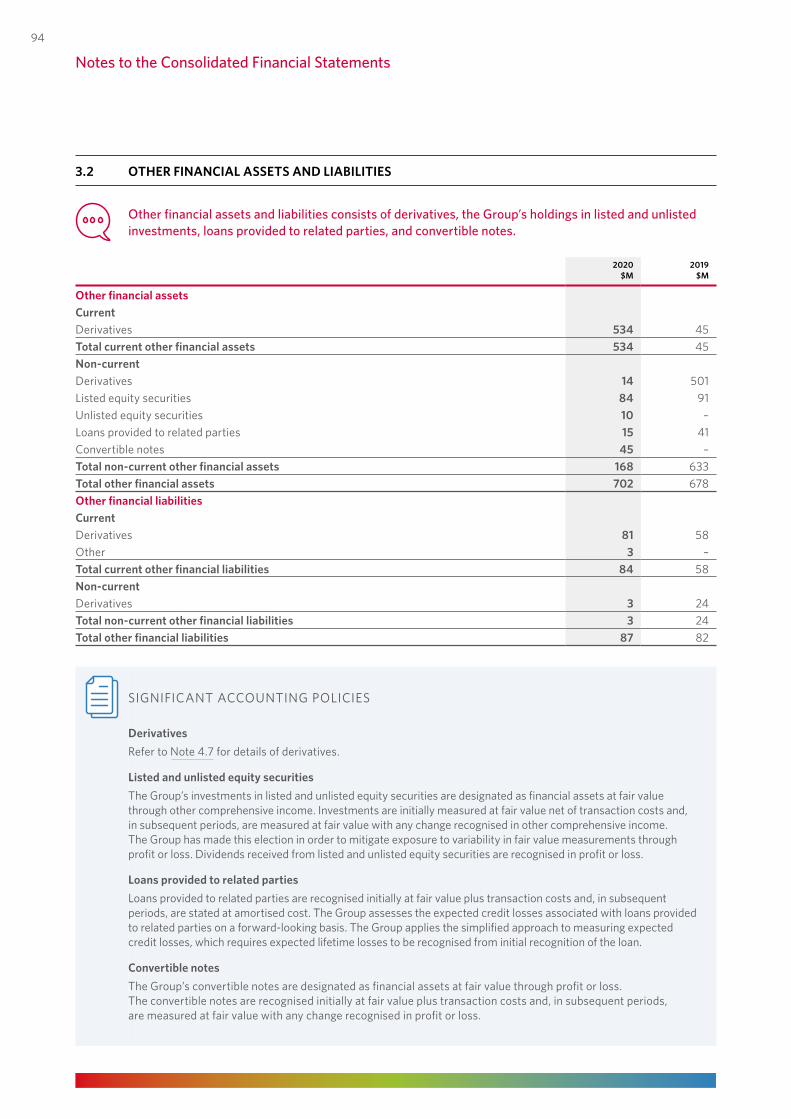
3.2 OTHER FINANCIAL ASSETS AND LIABILITIES
Other financial assets and liabilities consists of derivatives, the Group’s holdings in listed and unlisted investments, loans provided to related parties, and convertible notes.
2020 2019$M $M
Other financial assetsCurrentDerivatives 534 45Total current other financial assets 534 45Non‑currentDerivatives 14 501Listed equity securities 84 91Unlisted equity securities 10 –Loans provided to related parties 15 41Convertible notes 45 –Total non‑current other financial assets 168 633Total other financial assets 702 678Other financial liabilitiesCurrentDerivatives 81 58Other 3 –Total current other financial liabilities 84 58Non‑currentDerivatives 3 24Total non‑current other financial liabilities 3 24Total other financial liabilities 87 82
SIGNIFICANT ACCOUNTING POLICIES
DerivativesRefer to Note 4.7 for details of derivatives.
Listed and unlisted equity securitiesThe Group’s investments in listed and unlisted equity securities are designated as financial assets at fair value through other comprehensive income. Investments are initially measured at fair value net of transaction costs and, in subsequent periods, are measured at fair value with any change recognised in other comprehensive income. The Group has made this election in order to mitigate exposure to variability in fair value measurements through profit or loss. Dividends received from listed and unlisted equity securities are recognised in profit or loss.
Loans provided to related partiesLoans provided to related parties are recognised initially at fair value plus transaction costs and, in subsequent periods, are stated at amortised cost. The Group assesses the expected credit losses associated with loans provided to related parties on a forward-looking basis. The Group applies the simplified approach to measuring expected credit losses, which requires expected lifetime losses to be recognised from initial recognition of the loan.
Convertible notesThe Group’s convertible notes are designated as financial assets at fair value through profit or loss. The convertible notes are recognised initially at fair value plus transaction costs and, in subsequent periods, are measured at fair value with any change recognised in profit or loss.
Notes to the Consolidated Financial Statements
94
3.3 LEASES
The Group leases various properties (stores, support offices, distribution centres, and warehouses), equipment, and vehicles. Property rental contracts are typically made for fixed periods of five to 12 years with up to 10 options of two to five years. Other lease contracts are typically made for fixed periods of two to 10 years. Lease terms are negotiated on an individual basis and contain a wide range of different terms and conditions.
3.3.1 Lease assets
2020 PROPERTIES $M
PLANT AND EQUIPMENT
$MOTHER
$MTOTAL
$M
Cost 20,414 179 114 20,707Less: Accumulated depreciation and impairment (8,502) (46) (97) (8,645)Carrying amount at end of period 11,912 133 17 12,062 Movement:Recognition on initial application of AASB 16 12,113 112 14 12,239 Additions 776 68 11 855Terminations (62) (2) – (64)Remeasurements 328 (1) – 327Depreciation expense (1,111) (39) (8) (1,158)Impairment expense (34) – – (34)Derecognition due to sub-lease (90) – – (90)Other (8) (5) – (13)Carrying amount at end of period 11,912 133 17 12,062
3.3.2 Lease liabilities2020
$M
Movement:Recognition on initial application of AASB 16 14,711Additions 842Terminations (77)Remeasurements 327Interest expense 701Payments for the interest component of lease liabilities (701)Repayment of lease liabilities (1,066)Other (9)Carrying amount at end of period 14,728Current 1,560 Non-current 13,168 Carrying amount at end of period 14,728
MATURITY PROFILE OF CONTRACTUAL UNDISCOUNTED CASH FLOWS AS AT 28 JUNE 2020 $M
One year or less 1,867One year to two years 1,829Two years to five years 3,830Five years to 10 years 7,301Over 10 years 6,101Total undiscounted lease liabilities 20,928
ASSETS ANDLIABILITIES 3
1
2
3
4
5
PERFORM
AN
CE
HIG
HLIG
HTS
BUSIN
ESS REV
IEWD
IRECTORS'
REPORT
FINA
NC
IAL
REPORT
OTH
ER IN
FORM
ATION
95
WO
OLW
ORTH
S GRO
UP
AN
NU
AL REPO
RT 2020
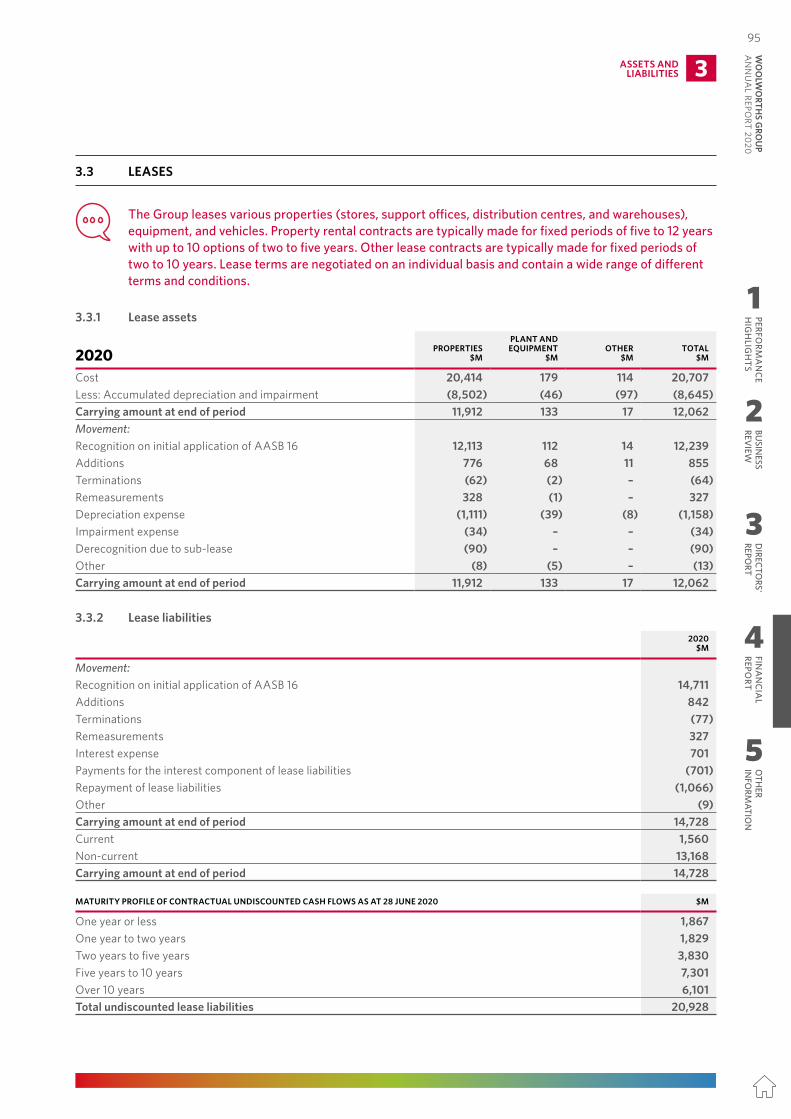
3.2 OTHER FINANCIAL ASSETS AND LIABILITIES
Other financial assets and liabilities consists of derivatives, the Group’s holdings in listed and unlisted investments, loans provided to related parties, and convertible notes.
2020 2019$M $M
Other financial assetsCurrentDerivatives 534 45Total current other financial assets 534 45Non‑currentDerivatives 14 501Listed equity securities 84 91Unlisted equity securities 10 –Loans provided to related parties 15 41Convertible notes 45 –Total non‑current other financial assets 168 633Total other financial assets 702 678Other financial liabilitiesCurrentDerivatives 81 58Other 3 –Total current other financial liabilities 84 58Non‑currentDerivatives 3 24Total non‑current other financial liabilities 3 24Total other financial liabilities 87 82
SIGNIFICANT ACCOUNTING POLICIES
DerivativesRefer to Note 4.7 for details of derivatives.
Listed and unlisted equity securitiesThe Group’s investments in listed and unlisted equity securities are designated as financial assets at fair value through other comprehensive income. Investments are initially measured at fair value net of transaction costs and, in subsequent periods, are measured at fair value with any change recognised in other comprehensive income. The Group has made this election in order to mitigate exposure to variability in fair value measurements through profit or loss. Dividends received from listed and unlisted equity securities are recognised in profit or loss.
Loans provided to related partiesLoans provided to related parties are recognised initially at fair value plus transaction costs and, in subsequent periods, are stated at amortised cost. The Group assesses the expected credit losses associated with loans provided to related parties on a forward-looking basis. The Group applies the simplified approach to measuring expected credit losses, which requires expected lifetime losses to be recognised from initial recognition of the loan.
Convertible notesThe Group’s convertible notes are designated as financial assets at fair value through profit or loss. The convertible notes are recognised initially at fair value plus transaction costs and, in subsequent periods, are measured at fair value with any change recognised in profit or loss.
Notes to the Consolidated Financial Statements
94
3.3 LEASES
The Group leases various properties (stores, support offices, distribution centres, and warehouses), equipment, and vehicles. Property rental contracts are typically made for fixed periods of five to 12 years with up to 10 options of two to five years. Other lease contracts are typically made for fixed periods of two to 10 years. Lease terms are negotiated on an individual basis and contain a wide range of different terms and conditions.
3.3.1 Lease assets
2020 PROPERTIES $M
PLANT AND EQUIPMENT
$MOTHER
$MTOTAL
$M
Cost 20,414 179 114 20,707Less: Accumulated depreciation and impairment (8,502) (46) (97) (8,645)Carrying amount at end of period 11,912 133 17 12,062 Movement:Recognition on initial application of AASB 16 12,113 112 14 12,239 Additions 776 68 11 855Terminations (62) (2) – (64)Remeasurements 328 (1) – 327Depreciation expense (1,111) (39) (8) (1,158)Impairment expense (34) – – (34)Derecognition due to sub-lease (90) – – (90)Other (8) (5) – (13)Carrying amount at end of period 11,912 133 17 12,062
3.3.2 Lease liabilities2020
$M
Movement:Recognition on initial application of AASB 16 14,711Additions 842Terminations (77)Remeasurements 327Interest expense 701Payments for the interest component of lease liabilities (701)Repayment of lease liabilities (1,066)Other (9)Carrying amount at end of period 14,728Current 1,560 Non-current 13,168 Carrying amount at end of period 14,728
MATURITY PROFILE OF CONTRACTUAL UNDISCOUNTED CASH FLOWS AS AT 28 JUNE 2020 $M
One year or less 1,867One year to two years 1,829Two years to five years 3,830Five years to 10 years 7,301Over 10 years 6,101Total undiscounted lease liabilities 20,928
ASSETS ANDLIABILITIES 3
1
2
3
4
5
PERFORM
AN
CE
HIG
HLIG
HTS
BUSIN
ESS REV
IEWD
IRECTORS'
REPORT
FINA
NC
IAL
REPORT
OTH
ER IN
FORM
ATION
95W
OO
LWO
RTHS G
ROU
P A
NN
UA
L REPORT 2020
3.3.2 Lease liabilities (continued)Commitments for leases not yet commenced
At 28 June 2020, the Group had committed to leases which had not yet commenced. Accordingly, these lease contracts are not included in the calculation of the Group’s lease liability. The Group has estimated that the potential future lease payments for these lease contracts as at the end of the financial period would result in an increase in undiscounted lease liabilities of $929 million.
3.3.3 Other amounts recognised in the Consolidated Statement of Profit or Loss
2020BRANCH
EXPENSES $M
FINANCE COSTS
$M
Interest expense on lease liabilities – 701 Variable lease payments not included in the measurement of lease liabilities 1 52 – Expense relating to short-term leases 45 –
1 Variable lease payments represent less than 2% of total lease payments.
3.3.4 Amounts recognised in the Consolidated Statement of Cash Flows
2020 $M
Payments for short-term leases, service components of leases, and variable payments (included in Payments to suppliers and employees) 558 Payments for the interest component of lease liabilities 701Repayment of lease liabilities 1,066Total cash outflow for leases 2,325
SIGNIFICANT ACCOUNTING POLICIES
The Group assesses whether a contract is, or contains, a lease at inception of the contract. A lease conveys the right to direct the use and obtain substantially all of the economic benefits from an identified asset for a period of time in exchange for consideration. A lease liability and corresponding lease asset are recognised at commencement of the lease.
Lease liabilitiesLease liabilities are measured at the present value of lease payments, discounted using the interest rate implicit in the lease or, if that rate cannot be determined, at the Group’s incremental borrowing rate specific to the lease term. Lease payments (excluding non-lease components) include:• Fixed payments (including in-substance fixed payments), less any lease incentives receivable;• Variable lease payments that are based on an index or a rate;• Amounts expected to be payable by the Group under residual value guarantees;• Exercise price of a purchase option that the Group is reasonably certain to exercise; and• Payments of penalties for terminating the lease, if the lease term reflects the Group exercising that option.
Lease liabilities are subsequently measured at amortised cost using the effective interest rate method. When there is a change in lease term or a change in future lease payments, lease liabilities are remeasured, with a corresponding adjustment to lease assets.
Lease assetsLease assets are initially measured at cost comprising the initial lease liability, any lease payments made at or before the commencement date (less any lease incentives received), any initial direct costs, and any restoration costs.
Lease assets are subsequently depreciated on a straight-line basis over the shorter of the lease term or the useful life of the underlying asset. The expected useful lives are 40 years for property lease assets and 15 years for non-property lease assets.
Notes to the Consolidated Financial Statements
3.3 LEASES
96
SIGNIFICANT ACCOUNTING POLICIES (CONTINUED)
Lease assets (continued)Lease assets are tested for impairment in accordance with the policy adopted for non-financial assets in Note 3.6.
Short‑term leasesShort-term leases of 12 months or less are recognised as an expense in the Consolidated Statement of Profit or Loss as incurred.
Non‑lease componentsNon-lease components of lease payments are recognised as an expense in the Consolidated Statement of Profit or Loss as incurred and include items such as embedded property outgoings and repairs and maintenance.
CRITICAL ACCOUNTING ESTIMATES
Determining the lease termIn determining the lease term, the Group considers all facts and circumstances that create an economic incentive to exercise an extension option, or not exercise a termination option. The assessment is reviewed if a significant event or a significant change in circumstances occurs which affects this assessment. Extension options are most common for property leases. At the end of the reporting period, the weighted average lease expiries for the portfolio of leases were:
AS AT 28 JUNE 2020
WEIGHTED AVERAGE LEASE
EXPIRY 1
YEARS
Australian Food 10.9New Zealand Food 9.8BIG W 8.8Endeavour Drinks 8.5Hotels 15.0Other 7.7Group 10.71 Represents the weighted average number of years from the end of the reporting period to the end of the reasonably certain lease term.
During the current financial period, revising lease terms for exercising extension options resulted in an increase in recognised lease liabilities and lease assets of $223 million.
Determination of non‑lease componentsDetermining the non-lease components of lease payments requires significant judgement. The Group separates the non-lease components for property leases based on a residual method using property outgoing market data and separates the non-lease components for other leases based on the individual contract breakdown of these costs or otherwise best estimate of these costs.
Discount ratesIn calculating the lease liability, the lease payments are discounted using the rate implicit in the lease or the Group’s incremental borrowing rate. Determining the incremental borrowing rate requires significant judgement. The discount rate is derived from key external market based rates, the Group’s credit margin, and the length of the lease.
At the end of the reporting period, the weighted average incremental borrowing rate for the Group was 4.8%.
ASSETS ANDLIABILITIES 3
3.3 LEASES
1
2
3
4
5
PERFORM
AN
CE
HIG
HLIG
HTS
BUSIN
ESS REV
IEWD
IRECTORS'
REPORT
FINA
NC
IAL
REPORT
OTH
ER IN
FORM
ATION
97
WO
OLW
ORTH
S GRO
UP
AN
NU
AL REPO
RT 2020
3.3.2 Lease liabilities (continued)Commitments for leases not yet commenced
At 28 June 2020, the Group had committed to leases which had not yet commenced. Accordingly, these lease contracts are not included in the calculation of the Group’s lease liability. The Group has estimated that the potential future lease payments for these lease contracts as at the end of the financial period would result in an increase in undiscounted lease liabilities of $929 million.
3.3.3 Other amounts recognised in the Consolidated Statement of Profit or Loss
2020BRANCH
EXPENSES $M
FINANCE COSTS
$M
Interest expense on lease liabilities – 701 Variable lease payments not included in the measurement of lease liabilities 1 52 – Expense relating to short-term leases 45 –
1 Variable lease payments represent less than 2% of total lease payments.
3.3.4 Amounts recognised in the Consolidated Statement of Cash Flows
2020 $M
Payments for short-term leases, service components of leases, and variable payments (included in Payments to suppliers and employees) 558 Payments for the interest component of lease liabilities 701Repayment of lease liabilities 1,066Total cash outflow for leases 2,325
SIGNIFICANT ACCOUNTING POLICIES
The Group assesses whether a contract is, or contains, a lease at inception of the contract. A lease conveys the right to direct the use and obtain substantially all of the economic benefits from an identified asset for a period of time in exchange for consideration. A lease liability and corresponding lease asset are recognised at commencement of the lease.
Lease liabilitiesLease liabilities are measured at the present value of lease payments, discounted using the interest rate implicit in the lease or, if that rate cannot be determined, at the Group’s incremental borrowing rate specific to the lease term. Lease payments (excluding non-lease components) include:• Fixed payments (including in-substance fixed payments), less any lease incentives receivable;• Variable lease payments that are based on an index or a rate;• Amounts expected to be payable by the Group under residual value guarantees;• Exercise price of a purchase option that the Group is reasonably certain to exercise; and• Payments of penalties for terminating the lease, if the lease term reflects the Group exercising that option.
Lease liabilities are subsequently measured at amortised cost using the effective interest rate method. When there is a change in lease term or a change in future lease payments, lease liabilities are remeasured, with a corresponding adjustment to lease assets.
Lease assetsLease assets are initially measured at cost comprising the initial lease liability, any lease payments made at or before the commencement date (less any lease incentives received), any initial direct costs, and any restoration costs.
Lease assets are subsequently depreciated on a straight-line basis over the shorter of the lease term or the useful life of the underlying asset. The expected useful lives are 40 years for property lease assets and 15 years for non-property lease assets.
Notes to the Consolidated Financial Statements
3.3 LEASES
96
SIGNIFICANT ACCOUNTING POLICIES (CONTINUED)
Lease assets (continued)Lease assets are tested for impairment in accordance with the policy adopted for non-financial assets in Note 3.6.
Short‑term leasesShort-term leases of 12 months or less are recognised as an expense in the Consolidated Statement of Profit or Loss as incurred.
Non‑lease componentsNon-lease components of lease payments are recognised as an expense in the Consolidated Statement of Profit or Loss as incurred and include items such as embedded property outgoings and repairs and maintenance.
CRITICAL ACCOUNTING ESTIMATES
Determining the lease termIn determining the lease term, the Group considers all facts and circumstances that create an economic incentive to exercise an extension option, or not exercise a termination option. The assessment is reviewed if a significant event or a significant change in circumstances occurs which affects this assessment. Extension options are most common for property leases. At the end of the reporting period, the weighted average lease expiries for the portfolio of leases were:
AS AT 28 JUNE 2020
WEIGHTED AVERAGE LEASE
EXPIRY 1
YEARS
Australian Food 10.9New Zealand Food 9.8BIG W 8.8Endeavour Drinks 8.5Hotels 15.0Other 7.7Group 10.71 Represents the weighted average number of years from the end of the reporting period to the end of the reasonably certain lease term.
During the current financial period, revising lease terms for exercising extension options resulted in an increase in recognised lease liabilities and lease assets of $223 million.
Determination of non‑lease componentsDetermining the non-lease components of lease payments requires significant judgement. The Group separates the non-lease components for property leases based on a residual method using property outgoing market data and separates the non-lease components for other leases based on the individual contract breakdown of these costs or otherwise best estimate of these costs.
Discount ratesIn calculating the lease liability, the lease payments are discounted using the rate implicit in the lease or the Group’s incremental borrowing rate. Determining the incremental borrowing rate requires significant judgement. The discount rate is derived from key external market based rates, the Group’s credit margin, and the length of the lease.
At the end of the reporting period, the weighted average incremental borrowing rate for the Group was 4.8%.
ASSETS ANDLIABILITIES 3
3.3 LEASES
1
2
3
4
5
PERFORM
AN
CE
HIG
HLIG
HTS
BUSIN
ESS REV
IEWD
IRECTORS'
REPORT
FINA
NC
IAL
REPORT
OTH
ER IN
FORM
ATION
97W
OO
LWO
RTHS G
ROU
P A
NN
UA
L REPORT 2020
3.4 PROPERTY, PLANT AND EQUIPMENT
Property, plant and equipment represents the investment by the Group in tangible assets such as freehold land, warehouses, retail and other properties, store fit‑outs, distribution infrastructure, and technology.
2020DEVELOPMENT
PROPERTIES $M
FREEHOLD LAND, WAREHOUSE,
RETAIL, AND OTHER PROPERTIES
$M
LEASEHOLD IMPROVEMENTS
$M
PLANT AND EQUIPMENT
$MTOTAL 1
$M
Cost 1,055 1,527 3,769 10,645 16,996 Less: accumulated depreciation, amortisation, and impairment (77) (256) (1,805) (6,116) (8,254)Carrying amount at end of period 978 1,271 1,964 4,529 8,742 Movement:Carrying amount at start of period 675 1,343 1,711 4,523 8,252 Additions 464 34 275 1,097 1,870 Acquisition of businesses – 33 – 6 39 Disposals 2 (9) (3) (12) (32) (56)Transfer to assets held for sale (16) (244) (1) (71) (332)Depreciation expense – (26) – (748) (774)Amortisation expense – – (218) – (218)Transfers and other (134) 139 212 (236) (19)Effect of movements in foreign exchange rates (2) (5) (3) (10) (20)Carrying amount at end of period 978 1,271 1,964 4,529 8,742
2019DEVELOPMENT
PROPERTIES $M
FREEHOLD LAND, WAREHOUSE,
RETAIL, AND OTHER PROPERTIES
$M
LEASEHOLD IMPROVEMENTS
$M
PLANT AND EQUIPMENT 3
$MTOTAL
$M
Cost 722 1,647 2,983 9,534 14,886Less: accumulated depreciation, amortisation, and impairment (47) (304) (1,272) (5,011) (6,634)Carrying amount at end of period 675 1,343 1,711 4,523 8,252 Movement:Carrying amount at start of period 677 1,188 1,586 4,537 7,988 Additions 238 61 350 920 1,569 Acquisition of businesses – 33 1 2 36 Disposals 2 – (6) (10) (22) (38)Transfer to assets held for sale (24) (171) (26) (12) (233)Depreciation expense – (27) – (768) (795)Amortisation expense – – (182) – (182)Impairment reversal/(expense) – 37 – (166) (129)Transfers and other (219) 220 (11) 19 9 Effect of movements in foreign exchange rates 3 8 3 13 27 Carrying amount at end of period 675 1,343 1,711 4,523 8,252
1 Includes assets under construction of $715 million (2019: $404 million).2 Net loss on disposal and write-off of property, plant and equipment, including those classified as held for sale, during the period from continuing operations
was $11 million (2019: $27 million).3 Re-presented for the reclassification of software to intangible assets.
Notes to the Consolidated Financial Statements
98
SIGNIFICANT ACCOUNTING POLICIES
Carrying valueThe Group’s property, plant and equipment are measured at cost less accumulated depreciation, amortisation, and impairment losses. The cost of self-constructed assets includes the cost of materials, direct labour, and a proportion of overheads. The cost of development properties (those being constructed or developed for future use) includes borrowing, holding, and development costs until the asset is complete.
DepreciationAssets are depreciated on a straight-line basis over their estimated useful lives to their residual values. Leasehold improvements are amortised over the expected useful life of the improvement. Useful lives are reassessed each reporting period. Where parts of an item of property, plant and equipment have different useful lives, they are accounted for as separate assets.
The expected useful lives are as follows:
Buildings 25–40 years
Plant and equipment 2.5–20 years
Leasehold improvements Up to 25 years (retail properties) or 40 years (hotels)
Proceeds from sale of assetsThe gross proceeds from asset sales are recognised at the date that an unconditional contract of sale is exchanged with the purchaser or when title passes. The net gain or loss is recognised in the Consolidated Statement of Profit or Loss.
ImpairmentProperty, plant and equipment are tested for impairment in accordance with the policy for impairment of non-financial assets disclosed in Note 3.6.
CRITICAL ACCOUNTING ESTIMATES
Estimation of useful life of assetsEstimates of remaining useful lives require significant judgement as to the period over which an asset is expected to be available for use by the Group based on experience with similar assets. Useful lives are reviewed at least annually. Where useful lives are changed, the net written down value of the asset is depreciated or amortised from the date of the change in accordance with the revised useful life. Depreciation recognised in prior reporting periods is not changed.
ASSETS ANDLIABILITIES 3
3.4 PROPERTY, PLANT AND EQUIPMENT (CONTINUED)
1
2
3
4
5
PERFORM
AN
CE
HIG
HLIG
HTS
BUSIN
ESS REV
IEWD
IRECTORS'
REPORT
FINA
NC
IAL
REPORT
OTH
ER IN
FORM
ATION
99
WO
OLW
ORTH
S GRO
UP
AN
NU
AL REPO
RT 2020
3.4 PROPERTY, PLANT AND EQUIPMENT
Property, plant and equipment represents the investment by the Group in tangible assets such as freehold land, warehouses, retail and other properties, store fit‑outs, distribution infrastructure, and technology.
2020DEVELOPMENT
PROPERTIES $M
FREEHOLD LAND, WAREHOUSE,
RETAIL, AND OTHER PROPERTIES
$M
LEASEHOLD IMPROVEMENTS
$M
PLANT AND EQUIPMENT
$MTOTAL 1
$M
Cost 1,055 1,527 3,769 10,645 16,996 Less: accumulated depreciation, amortisation, and impairment (77) (256) (1,805) (6,116) (8,254)Carrying amount at end of period 978 1,271 1,964 4,529 8,742 Movement:Carrying amount at start of period 675 1,343 1,711 4,523 8,252 Additions 464 34 275 1,097 1,870 Acquisition of businesses – 33 – 6 39 Disposals 2 (9) (3) (12) (32) (56)Transfer to assets held for sale (16) (244) (1) (71) (332)Depreciation expense – (26) – (748) (774)Amortisation expense – – (218) – (218)Transfers and other (134) 139 212 (236) (19)Effect of movements in foreign exchange rates (2) (5) (3) (10) (20)Carrying amount at end of period 978 1,271 1,964 4,529 8,742
2019DEVELOPMENT
PROPERTIES $M
FREEHOLD LAND, WAREHOUSE,
RETAIL, AND OTHER PROPERTIES
$M
LEASEHOLD IMPROVEMENTS
$M
PLANT AND EQUIPMENT 3
$MTOTAL
$M
Cost 722 1,647 2,983 9,534 14,886Less: accumulated depreciation, amortisation, and impairment (47) (304) (1,272) (5,011) (6,634)Carrying amount at end of period 675 1,343 1,711 4,523 8,252 Movement:Carrying amount at start of period 677 1,188 1,586 4,537 7,988 Additions 238 61 350 920 1,569 Acquisition of businesses – 33 1 2 36 Disposals 2 – (6) (10) (22) (38)Transfer to assets held for sale (24) (171) (26) (12) (233)Depreciation expense – (27) – (768) (795)Amortisation expense – – (182) – (182)Impairment reversal/(expense) – 37 – (166) (129)Transfers and other (219) 220 (11) 19 9 Effect of movements in foreign exchange rates 3 8 3 13 27 Carrying amount at end of period 675 1,343 1,711 4,523 8,252
1 Includes assets under construction of $715 million (2019: $404 million).2 Net loss on disposal and write-off of property, plant and equipment, including those classified as held for sale, during the period from continuing operations
was $11 million (2019: $27 million).3 Re-presented for the reclassification of software to intangible assets.
Notes to the Consolidated Financial Statements
98
SIGNIFICANT ACCOUNTING POLICIES
Carrying valueThe Group’s property, plant and equipment are measured at cost less accumulated depreciation, amortisation, and impairment losses. The cost of self-constructed assets includes the cost of materials, direct labour, and a proportion of overheads. The cost of development properties (those being constructed or developed for future use) includes borrowing, holding, and development costs until the asset is complete.
DepreciationAssets are depreciated on a straight-line basis over their estimated useful lives to their residual values. Leasehold improvements are amortised over the expected useful life of the improvement. Useful lives are reassessed each reporting period. Where parts of an item of property, plant and equipment have different useful lives, they are accounted for as separate assets.
The expected useful lives are as follows:
Buildings 25–40 years
Plant and equipment 2.5–20 years
Leasehold improvements Up to 25 years (retail properties) or 40 years (hotels)
Proceeds from sale of assetsThe gross proceeds from asset sales are recognised at the date that an unconditional contract of sale is exchanged with the purchaser or when title passes. The net gain or loss is recognised in the Consolidated Statement of Profit or Loss.
ImpairmentProperty, plant and equipment are tested for impairment in accordance with the policy for impairment of non-financial assets disclosed in Note 3.6.
CRITICAL ACCOUNTING ESTIMATES
Estimation of useful life of assetsEstimates of remaining useful lives require significant judgement as to the period over which an asset is expected to be available for use by the Group based on experience with similar assets. Useful lives are reviewed at least annually. Where useful lives are changed, the net written down value of the asset is depreciated or amortised from the date of the change in accordance with the revised useful life. Depreciation recognised in prior reporting periods is not changed.
ASSETS ANDLIABILITIES 3
3.4 PROPERTY, PLANT AND EQUIPMENT (CONTINUED)
1
2
3
4
5
PERFORM
AN
CE
HIG
HLIG
HTS
BUSIN
ESS REV
IEWD
IRECTORS'
REPORT
FINA
NC
IAL
REPORT
OTH
ER IN
FORM
ATION
99W
OO
LWO
RTHS G
ROU
P A
NN
UA
L REPORT 2020
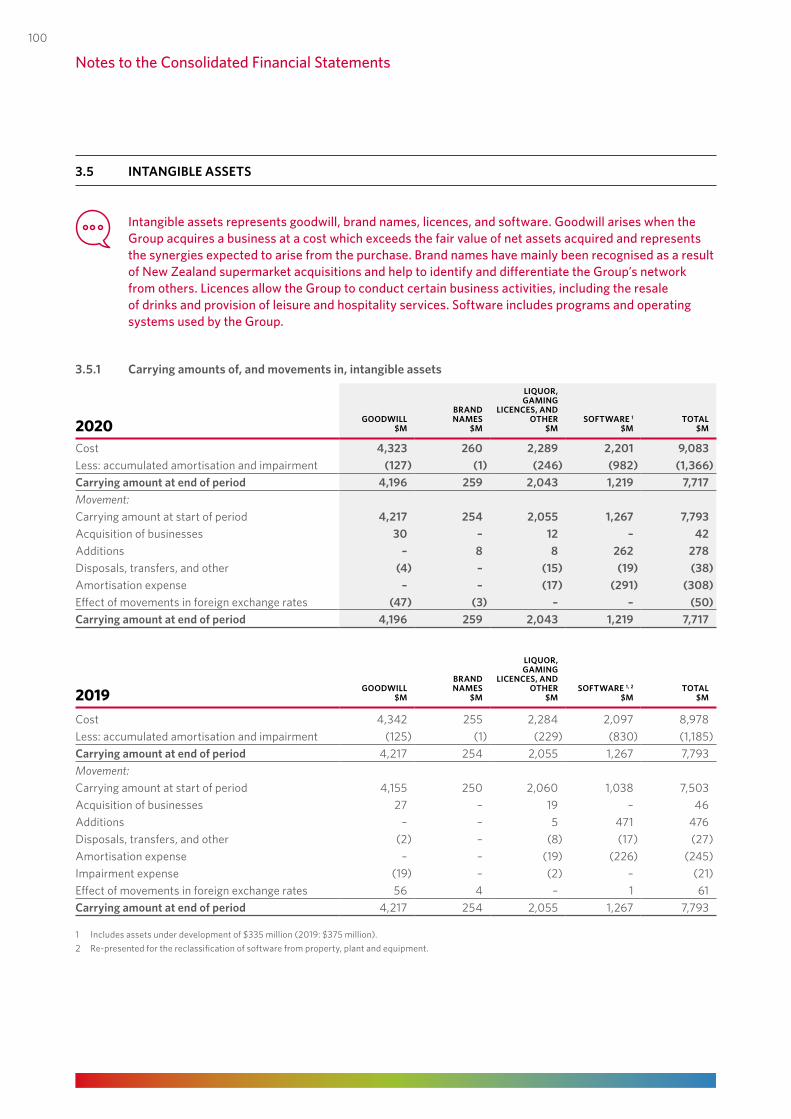
3.5 INTANGIBLE ASSETS
Intangible assets represents goodwill, brand names, licences, and software. Goodwill arises when the Group acquires a business at a cost which exceeds the fair value of net assets acquired and represents the synergies expected to arise from the purchase. Brand names have mainly been recognised as a result of New Zealand supermarket acquisitions and help to identify and differentiate the Group’s network from others. Licences allow the Group to conduct certain business activities, including the resale of drinks and provision of leisure and hospitality services. Software includes programs and operating systems used by the Group.
3.5.1 Carrying amounts of, and movements in, intangible assets
2020 GOODWILL $M
BRAND NAMES
$M
LIQUOR, GAMING
LICENCES, AND OTHER
$MSOFTWARE 1
$MTOTAL
$M
Cost 4,323 260 2,289 2,201 9,083 Less: accumulated amortisation and impairment (127) (1) (246) (982) (1,366)Carrying amount at end of period 4,196 259 2,043 1,219 7,717 Movement:Carrying amount at start of period 4,217 254 2,055 1,267 7,793 Acquisition of businesses 30 – 12 – 42 Additions – 8 8 262 278 Disposals, transfers, and other (4) – (15) (19) (38)Amortisation expense – – (17) (291) (308)Effect of movements in foreign exchange rates (47) (3) – – (50)Carrying amount at end of period 4,196 259 2,043 1,219 7,717
2019 GOODWILL $M
BRAND NAMES
$M
LIQUOR, GAMING
LICENCES, AND OTHER
$MSOFTWARE 1, 2
$MTOTAL
$M
Cost 4,342 255 2,284 2,097 8,978 Less: accumulated amortisation and impairment (125) (1) (229) (830) (1,185)Carrying amount at end of period 4,217 254 2,055 1,267 7,793 Movement:Carrying amount at start of period 4,155 250 2,060 1,038 7,503 Acquisition of businesses 27 – 19 – 46 Additions – – 5 471 476Disposals, transfers, and other (2) – (8) (17) (27)Amortisation expense – – (19) (226) (245)Impairment expense (19) – (2) – (21)Effect of movements in foreign exchange rates 56 4 – 1 61 Carrying amount at end of period 4,217 254 2,055 1,267 7,793
1 Includes assets under development of $335 million (2019: $375 million).2 Re-presented for the reclassification of software from property, plant and equipment.
Notes to the Consolidated Financial Statements
100
3.5.2 Allocation of indefinite life intangible assets to groups of cash‑generating units
GOODWILL BRAND NAMESLIQUOR, GAMING LICENCES,
AND OTHER
2020 2019 2020 2019 2020 2019$M $M $M $M $M $M
Australian Food 381 370 3 – – –New Zealand Food 2,119 2,165 244 247 – –Endeavour Drinks 962 948 12 7 1,016 1,009Hotels 734 734 – – 991 993
4,196 4,217 259 254 2,007 2,002
SIGNIFICANT ACCOUNTING POLICIES
GoodwillGoodwill represents the excess of the cost of an acquisition over the fair value of the share of the net identifiable assets acquired. Following initial recognition, goodwill is measured at cost less any accumulated impairment losses.
Other intangible assetsOther intangible assets are measured at cost less accumulated amortisation and impairment losses. Where acquired in a business combination, cost represents the fair value at the date of acquisition.
Intangible assets with finite lives are amortised on a straight-line basis over their estimated useful lives. Useful lives are reassessed each reporting period. The useful lives of intangible assets have been assessed as follows:
Brand names Indefinite useful life
Liquor and gaming licences Indefinite useful life
Victorian gaming entitlements Life of the gaming entitlement (10 years)
Software Three to five years (five to 10 years for core systems)
Other (primarily customer relationships and property development rights)
Indefinite and finite up to 20 years
ImpairmentIntangible assets are tested for impairment in accordance with the policy for impairment of non-financial assets disclosed in Note 3.6.
CRITICAL ACCOUNTING ESTIMATES
Estimation of useful life of assetsAssessments of useful lives and estimates of remaining useful lives require significant management judgement. Brand names are assessed as having an indefinite useful life on the basis of brand strength, ongoing expected profitability, and continuing support. Brand names incorporate complementary assets such as store formats, networks, and product offerings. Liquor and gaming licences (excluding Victorian gaming entitlements) have been assessed to have an indefinite useful life on the basis that the licences are expected to be renewed in line with ongoing regulatory requirements.
ASSETS ANDLIABILITIES 3
3.5 INTANGIBLE ASSETS (CONTINUED)
1
2
3
4
5
PERFORM
AN
CE
HIG
HLIG
HTS
BUSIN
ESS REV
IEWD
IRECTORS'
REPORT
FINA
NC
IAL
REPORT
OTH
ER IN
FORM
ATION
101
WO
OLW
ORTH
S GRO
UP
AN
NU
AL REPO
RT 2020
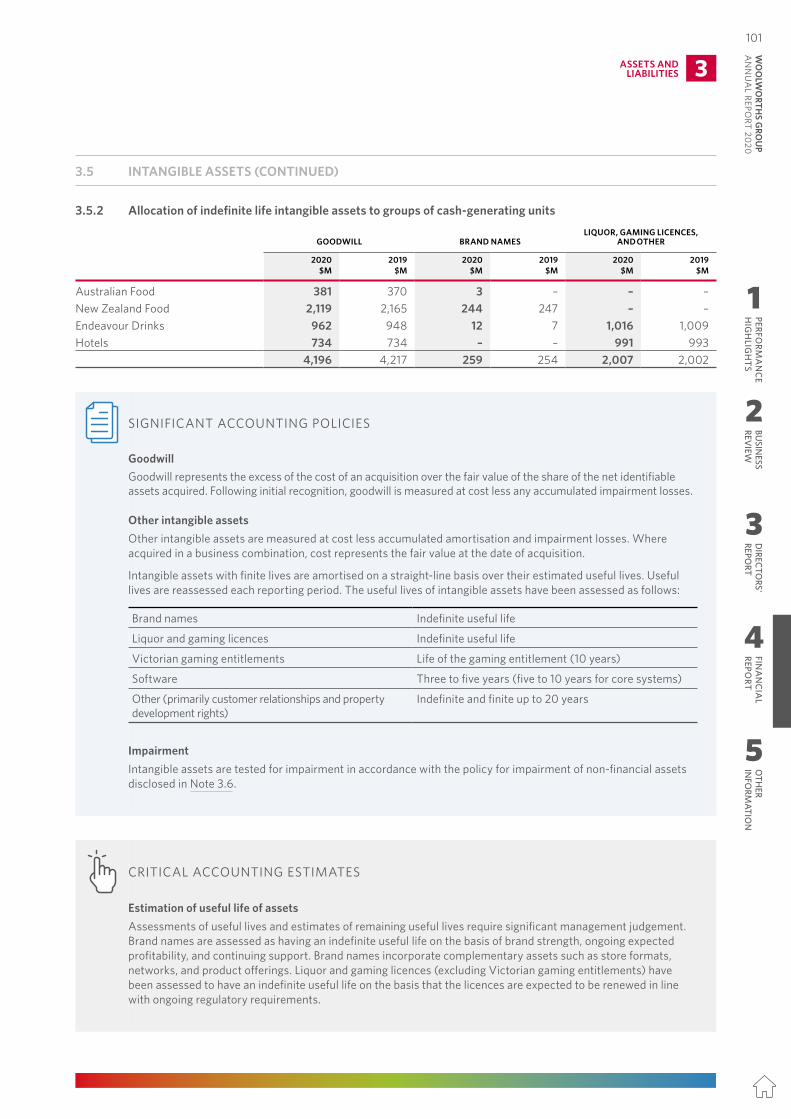
3.5 INTANGIBLE ASSETS
Intangible assets represents goodwill, brand names, licences, and software. Goodwill arises when the Group acquires a business at a cost which exceeds the fair value of net assets acquired and represents the synergies expected to arise from the purchase. Brand names have mainly been recognised as a result of New Zealand supermarket acquisitions and help to identify and differentiate the Group’s network from others. Licences allow the Group to conduct certain business activities, including the resale of drinks and provision of leisure and hospitality services. Software includes programs and operating systems used by the Group.
3.5.1 Carrying amounts of, and movements in, intangible assets
2020 GOODWILL $M
BRAND NAMES
$M
LIQUOR, GAMING
LICENCES, AND OTHER
$MSOFTWARE 1
$MTOTAL
$M
Cost 4,323 260 2,289 2,201 9,083 Less: accumulated amortisation and impairment (127) (1) (246) (982) (1,366)Carrying amount at end of period 4,196 259 2,043 1,219 7,717 Movement:Carrying amount at start of period 4,217 254 2,055 1,267 7,793 Acquisition of businesses 30 – 12 – 42 Additions – 8 8 262 278 Disposals, transfers, and other (4) – (15) (19) (38)Amortisation expense – – (17) (291) (308)Effect of movements in foreign exchange rates (47) (3) – – (50)Carrying amount at end of period 4,196 259 2,043 1,219 7,717
2019 GOODWILL $M
BRAND NAMES
$M
LIQUOR, GAMING
LICENCES, AND OTHER
$MSOFTWARE 1, 2
$MTOTAL
$M
Cost 4,342 255 2,284 2,097 8,978 Less: accumulated amortisation and impairment (125) (1) (229) (830) (1,185)Carrying amount at end of period 4,217 254 2,055 1,267 7,793 Movement:Carrying amount at start of period 4,155 250 2,060 1,038 7,503 Acquisition of businesses 27 – 19 – 46 Additions – – 5 471 476Disposals, transfers, and other (2) – (8) (17) (27)Amortisation expense – – (19) (226) (245)Impairment expense (19) – (2) – (21)Effect of movements in foreign exchange rates 56 4 – 1 61 Carrying amount at end of period 4,217 254 2,055 1,267 7,793
1 Includes assets under development of $335 million (2019: $375 million).2 Re-presented for the reclassification of software from property, plant and equipment.
Notes to the Consolidated Financial Statements
100
3.5.2 Allocation of indefinite life intangible assets to groups of cash‑generating units
GOODWILL BRAND NAMESLIQUOR, GAMING LICENCES,
AND OTHER
2020 2019 2020 2019 2020 2019$M $M $M $M $M $M
Australian Food 381 370 3 – – –New Zealand Food 2,119 2,165 244 247 – –Endeavour Drinks 962 948 12 7 1,016 1,009Hotels 734 734 – – 991 993
4,196 4,217 259 254 2,007 2,002
SIGNIFICANT ACCOUNTING POLICIES
GoodwillGoodwill represents the excess of the cost of an acquisition over the fair value of the share of the net identifiable assets acquired. Following initial recognition, goodwill is measured at cost less any accumulated impairment losses.
Other intangible assetsOther intangible assets are measured at cost less accumulated amortisation and impairment losses. Where acquired in a business combination, cost represents the fair value at the date of acquisition.
Intangible assets with finite lives are amortised on a straight-line basis over their estimated useful lives. Useful lives are reassessed each reporting period. The useful lives of intangible assets have been assessed as follows:
Brand names Indefinite useful life
Liquor and gaming licences Indefinite useful life
Victorian gaming entitlements Life of the gaming entitlement (10 years)
Software Three to five years (five to 10 years for core systems)
Other (primarily customer relationships and property development rights)
Indefinite and finite up to 20 years
ImpairmentIntangible assets are tested for impairment in accordance with the policy for impairment of non-financial assets disclosed in Note 3.6.
CRITICAL ACCOUNTING ESTIMATES
Estimation of useful life of assetsAssessments of useful lives and estimates of remaining useful lives require significant management judgement. Brand names are assessed as having an indefinite useful life on the basis of brand strength, ongoing expected profitability, and continuing support. Brand names incorporate complementary assets such as store formats, networks, and product offerings. Liquor and gaming licences (excluding Victorian gaming entitlements) have been assessed to have an indefinite useful life on the basis that the licences are expected to be renewed in line with ongoing regulatory requirements.
ASSETS ANDLIABILITIES 3
3.5 INTANGIBLE ASSETS (CONTINUED)
1
2
3
4
5
PERFORM
AN
CE
HIG
HLIG
HTS
BUSIN
ESS REV
IEWD
IRECTORS'
REPORT
FINA
NC
IAL
REPORT
OTH
ER IN
FORM
ATION
101W
OO
LWO
RTHS G
ROU
P A
NN
UA
L REPORT 2020
3.6 IMPAIRMENT OF NON‑FINANCIAL ASSETS
An impairment loss is incurred when the carrying amount of an asset or a cash‑generating unit (CGU) exceeds its estimated recoverable amount. The Group reviews the carrying amount of assets and CGUs at least annually and/or when there is an indication that the asset or CGU may be impaired.
The Group’s impairment testing is performed at both a total business unit level (group of CGUs) and individual CGU level. The Group assessed the carrying amounts of property, plant and equipment, lease assets, goodwill, and intangible assets and no impairments were recognised at the total business unit level. At the individual CGU level, there no were impairments recognised other than for BIG W.
BIG WIn 2019, prior to the adoption of AASB 16 Leases, the Group recognised a non-cash asset impairment of $166 million for store and centrally held plant and equipment and a provision for lease and other store exit costs of $205 million for approximately 30 BIG W stores that will close over the next three years, and two distribution centres that will close at the end of their leases.
As at 28 June 2020, based on our impairment testing, the estimated recoverable amount at the business unit level is greater than the carrying amount of $1,120 million (2019: $404 million), which includes $850 million of lease assets. As part of the Group’s annual impairment testing at an individual CGU level, an impairment charge of $34 million was required against lease assets for stores that are being considered for closure (as part of the store closure plan announced in F19).
In addition, the Group reassessed its provision for lease and other store exit costs for planned store closures based on the best estimate of the expenditure required to exit the remaining BIG W stores and distribution centres, resulting in a release of the provision of $34 million. Refer to Note 3.9 for further details on the Group’s restructuring, onerous contracts, store exit costs, and other provisions.
There are a number of risks and uncertainties associated with the execution of the BIG W three-year strategic plan (the plan) at a business unit and individual CGU level, including adverse changes in trading conditions, the competitive landscape, and the ability of BIG W to execute the plan in line with the assumptions made. The assessment of the recoverable amount at a business unit and individual CGU level represents management’s best estimate, taking into account risks, uncertainties, and opportunities for improvement in the business. The Group has made good progress on BIG W’s turnaround plan reflected by an increase in sales of 8.2% and EBIT of $39 million for the period ended 28 June 2020 compared to a loss in the prior period. Management continue to assess the progress of BIG W against these estimates and it is possible that further asset impairments and onerous contract provisions may be required in relation to the BIG W store and distribution network in future periods should performance not continue to improve. A 50 basis point reduction in the gross profit margin at an individual CGU level, with all other assumptions remaining the same, would not result in an additional impairment charge. A 50 basis point reduction in the gross profit margin at the business unit level, with all other assumptions remaining the same, would result in a reduction in the recoverable amount of the business but would not result in an impairment charge.
FINANCIAL REPORTING IMPACTS OF COVID-19
Calculation of recoverable amountThere is a significant degree of uncertainty associated with the impacts of COVID-19. Given the uncertainties associated with COVID-19, the F21 Board approved business plan used in assessing value in use is for one year only, incorporating the estimated impact on the Group from COVID-19. Refer to Critical accounting estimates and judgements for further details.
InventoriesThe carrying value of assets subject to impairment testing includes inventories which are carried at the lower of cost or net realisable value. There have been no material changes to the Group’s inventory provisions as a result of COVID-19.
Notes to the Consolidated Financial Statements
102
IDENTIFYING AND MANAGING CLIMATE RISKS
During the period, the Group analysed a number of scenarios to assess the impact of climate change on the Australian Food CGU. Some of these analyses resulted in a reduction in the recoverable amount of the CGU but did not result in an impairment charge being recognised for the year ended 28 June 2020.
SIGNIFICANT ACCOUNTING POLICIES
Impairment of non‑financial assetsThe carrying amounts of the Group’s lease assets (refer to Note 3.3), property, plant and equipment (refer to Note 3.4), goodwill, and intangible assets (refer to Note 3.5) are reviewed for impairment as follows:
Lease assets, property, plant and equipment, and finite life intangibles
When there is an indication that the asset may be impaired (assessed at least each reporting date) or when there is an indication that a previously recognised impairment may need to be reversed
Goodwill and indefinite life intangibles At least annually and when there is an indication that the asset may be impaired
Calculation of recoverable amountThe recoverable amount of an asset is the greater of its value in use and its fair value less costs to dispose. For an asset that does not generate largely independent cash inflows, recoverable amount is assessed at the cash-generating unit (CGU) level, which is the smallest group of assets generating cash inflows independent of other CGUs that benefit from the use of the respective asset. Goodwill is allocated to those CGUs or groups of CGUs that are expected to benefit from the business combination in which the goodwill arose, identified according to operating segments and grouped at the lowest levels for which goodwill is monitored for internal management purposes.
For properties, the recoverable amount is assessed with reference to external valuations obtained every three years using current market rental value with regard to recent sales of comparable sites. Internal value in use assessments are performed during the intervening periods.
An impairment loss is recognised whenever the carrying amount of an asset or its CGU exceeds its recoverable amount. Impairment losses are recognised in the Consolidated Statement of Profit or Loss.
Impairment losses recognised in respect of a CGU are allocated first to reduce the carrying amount of any goodwill allocated to the CGU and then to reduce the carrying amount of other assets in the CGU on a pro-rata basis to their carrying amounts.
Reversal of impairmentAn impairment loss in respect of goodwill is not reversed. In respect of other assets, an impairment loss is reversed if there has been a change in the estimates used to determine the recoverable amount. An impairment loss is reversed only to the extent that the asset’s carrying amount does not exceed the carrying amount that would have been determined, net of depreciation or amortisation, if no impairment loss had been recognised.
ASSETS ANDLIABILITIES 3
3.6 IMPAIRMENT OF NON‑FINANCIAL ASSETS (CONTINUED)
1
2
3
4
5
PERFORM
AN
CE
HIG
HLIG
HTS
BUSIN
ESS REV
IEWD
IRECTORS'
REPORT
FINA
NC
IAL
REPORT
OTH
ER IN
FORM
ATION
103
WO
OLW
ORTH
S GRO
UP
AN
NU
AL REPO
RT 2020
3.6 IMPAIRMENT OF NON‑FINANCIAL ASSETS
An impairment loss is incurred when the carrying amount of an asset or a cash‑generating unit (CGU) exceeds its estimated recoverable amount. The Group reviews the carrying amount of assets and CGUs at least annually and/or when there is an indication that the asset or CGU may be impaired.
The Group’s impairment testing is performed at both a total business unit level (group of CGUs) and individual CGU level. The Group assessed the carrying amounts of property, plant and equipment, lease assets, goodwill, and intangible assets and no impairments were recognised at the total business unit level. At the individual CGU level, there no were impairments recognised other than for BIG W.
BIG WIn 2019, prior to the adoption of AASB 16 Leases, the Group recognised a non-cash asset impairment of $166 million for store and centrally held plant and equipment and a provision for lease and other store exit costs of $205 million for approximately 30 BIG W stores that will close over the next three years, and two distribution centres that will close at the end of their leases.
As at 28 June 2020, based on our impairment testing, the estimated recoverable amount at the business unit level is greater than the carrying amount of $1,120 million (2019: $404 million), which includes $850 million of lease assets. As part of the Group’s annual impairment testing at an individual CGU level, an impairment charge of $34 million was required against lease assets for stores that are being considered for closure (as part of the store closure plan announced in F19).
In addition, the Group reassessed its provision for lease and other store exit costs for planned store closures based on the best estimate of the expenditure required to exit the remaining BIG W stores and distribution centres, resulting in a release of the provision of $34 million. Refer to Note 3.9 for further details on the Group’s restructuring, onerous contracts, store exit costs, and other provisions.
There are a number of risks and uncertainties associated with the execution of the BIG W three-year strategic plan (the plan) at a business unit and individual CGU level, including adverse changes in trading conditions, the competitive landscape, and the ability of BIG W to execute the plan in line with the assumptions made. The assessment of the recoverable amount at a business unit and individual CGU level represents management’s best estimate, taking into account risks, uncertainties, and opportunities for improvement in the business. The Group has made good progress on BIG W’s turnaround plan reflected by an increase in sales of 8.2% and EBIT of $39 million for the period ended 28 June 2020 compared to a loss in the prior period. Management continue to assess the progress of BIG W against these estimates and it is possible that further asset impairments and onerous contract provisions may be required in relation to the BIG W store and distribution network in future periods should performance not continue to improve. A 50 basis point reduction in the gross profit margin at an individual CGU level, with all other assumptions remaining the same, would not result in an additional impairment charge. A 50 basis point reduction in the gross profit margin at the business unit level, with all other assumptions remaining the same, would result in a reduction in the recoverable amount of the business but would not result in an impairment charge.
FINANCIAL REPORTING IMPACTS OF COVID-19
Calculation of recoverable amountThere is a significant degree of uncertainty associated with the impacts of COVID-19. Given the uncertainties associated with COVID-19, the F21 Board approved business plan used in assessing value in use is for one year only, incorporating the estimated impact on the Group from COVID-19. Refer to Critical accounting estimates and judgements for further details.
InventoriesThe carrying value of assets subject to impairment testing includes inventories which are carried at the lower of cost or net realisable value. There have been no material changes to the Group’s inventory provisions as a result of COVID-19.
Notes to the Consolidated Financial Statements
102
IDENTIFYING AND MANAGING CLIMATE RISKS
During the period, the Group analysed a number of scenarios to assess the impact of climate change on the Australian Food CGU. Some of these analyses resulted in a reduction in the recoverable amount of the CGU but did not result in an impairment charge being recognised for the year ended 28 June 2020.
SIGNIFICANT ACCOUNTING POLICIES
Impairment of non‑financial assetsThe carrying amounts of the Group’s lease assets (refer to Note 3.3), property, plant and equipment (refer to Note 3.4), goodwill, and intangible assets (refer to Note 3.5) are reviewed for impairment as follows:
Lease assets, property, plant and equipment, and finite life intangibles
When there is an indication that the asset may be impaired (assessed at least each reporting date) or when there is an indication that a previously recognised impairment may need to be reversed
Goodwill and indefinite life intangibles At least annually and when there is an indication that the asset may be impaired
Calculation of recoverable amountThe recoverable amount of an asset is the greater of its value in use and its fair value less costs to dispose. For an asset that does not generate largely independent cash inflows, recoverable amount is assessed at the cash-generating unit (CGU) level, which is the smallest group of assets generating cash inflows independent of other CGUs that benefit from the use of the respective asset. Goodwill is allocated to those CGUs or groups of CGUs that are expected to benefit from the business combination in which the goodwill arose, identified according to operating segments and grouped at the lowest levels for which goodwill is monitored for internal management purposes.
For properties, the recoverable amount is assessed with reference to external valuations obtained every three years using current market rental value with regard to recent sales of comparable sites. Internal value in use assessments are performed during the intervening periods.
An impairment loss is recognised whenever the carrying amount of an asset or its CGU exceeds its recoverable amount. Impairment losses are recognised in the Consolidated Statement of Profit or Loss.
Impairment losses recognised in respect of a CGU are allocated first to reduce the carrying amount of any goodwill allocated to the CGU and then to reduce the carrying amount of other assets in the CGU on a pro-rata basis to their carrying amounts.
Reversal of impairmentAn impairment loss in respect of goodwill is not reversed. In respect of other assets, an impairment loss is reversed if there has been a change in the estimates used to determine the recoverable amount. An impairment loss is reversed only to the extent that the asset’s carrying amount does not exceed the carrying amount that would have been determined, net of depreciation or amortisation, if no impairment loss had been recognised.
ASSETS ANDLIABILITIES 3
3.6 IMPAIRMENT OF NON‑FINANCIAL ASSETS (CONTINUED)
1
2
3
4
5
PERFORM
AN
CE
HIG
HLIG
HTS
BUSIN
ESS REV
IEWD
IRECTORS'
REPORT
FINA
NC
IAL
REPORT
OTH
ER IN
FORM
ATION
103W
OO
LWO
RTHS G
ROU
P A
NN
UA
L REPORT 2020
CRITICAL ACCOUNTING ESTIMATES
Key assumptions used in determining the recoverable amount of assets include expected future cash flows, long-term growth rates (terminal value assumptions), and discount rates.
In assessing value in use (VIU), estimated future cash flows are based on the Group’s most recent Board approved business plan covering a period not exceeding five years. The F21 Board approved business plan incorporates the estimated impact on the Group from COVID-19 restrictions and the challenging market conditions forecast through the recovery phase. Given the uncertainties associated with COVID-19, the F21 Board approved business plan is for one year only. For impairment testing purposes, cash flows for Years 2 and 3 are based on management’s best estimate derived from the growth rates in the F20 Board approved business plan with cash flows for Years 4 and beyond extrapolated using estimated long-term growth rates.
Long-term growth rates are based on past experience, expectations of external market operating conditions, and other assumptions which take account of the specific features of each business unit.
The recoverable amount has been determined using a VIU discounted cash flow model. In assessing VIU, the estimated future pre-tax cash flows are discounted to their present value using a pre-tax discount rate that reflects the current market assessments of the time value of money and risks specific to the asset. Pre-tax discount rates used vary depending on the nature of the business and the country of operation.
On adoption of AASB 16, the Group has recognised lease liabilities which for the purposes of the discount rate calculation are considered debt. The Group’s cost of debt is lower than its cost of equity which, accompanied with the change in debt/equity mix, has resulted in a decrease in the pre-tax discount rate compared to the prior period.
The ranges of rates used in determining recoverable amounts are set out below:
2020%
2019%
Long-term growth rate 2.5 2.5Pre-tax discount rate 9–13 12–17
The Group believes that any reasonably possible change in the key assumptions applied would not cause the carrying value of assets to exceed their recoverable amount and result in a material impairment based on current economic conditions and CGU performance.
There is a significant degree of uncertainty associated with the impacts of COVID-19. The assessment of the recoverable amounts represents management’s best estimates taking into account the impacts of COVID-19 on the Group, and this has not resulted in a material change in the recoverable amount. However, if the impacts of COVID-19 extend beyond the forecast period, and restrictions result in extensive store and venue closures or disruption to the Group’s supply chain, there is a risk of a material change in the recoverable amount which may result in impairment.
Notes to the Consolidated Financial Statements
3.6 IMPAIRMENT OF NON‑FINANCIAL ASSETS (CONTINUED)
104
3.7 INCOME TAXES
This section presents the total income tax expense charged to the Group in respect of amounts currently owing for taxable profits and future income taxes recoverable or payable in respect of temporary differences. The Group presents a reconciliation of its effective tax rate and a summary of changes in future income tax recoverable or payable by major category.
3.7.1 Income tax expense recognised in the Consolidated Statement of Profit or Loss
2020RESTATED
2019 1
52 WEEKS 53 WEEKS$M $M
Income tax expenseCurrent tax expense 688 730Adjustments recognised in the current period in relation to the current tax of prior periods 8 (11)Deferred tax relating to the origination and reversal of temporary differences (120) (52)
576 667Income tax expense is attributable to:Profit from continuing operations (as reported in the Consolidated Statement of Profit or Loss) 576 667Profit from discontinued operations (refer to Note 5.1) – –
576 667
1 Refer to Note 1.4 for details regarding the restatement for salaried team member remediation.
3.7.2 Reconciliation between profit before income tax and income tax expense
2020RESTATED
2019 1
52 WEEKS 53 WEEKS$M $M
Profit before income tax – continuing operations 1,785 2,225Profit before income tax – discontinued operations (refer to Note 5.1) – 1,200Profit before income tax 1,785 3,425Income tax expense using the Australian corporate tax rate of 30% 536 1,027Tax effect of amounts which are not (taxable)/deductible in calculating taxable income:Capital gain offset by capital losses – (327)De-recognised deferred tax liability on sale of business – (33)Non-deductible expenses 39 9Unrecognised tax losses from the current year 4 4Impact of differences in offshore tax rates (6) (5)Other (5) 3
568 678Adjustments relating to prior periods 8 (11)Income tax expense 576 667
1 Refer to Note 1.4 for details regarding the restatement for salaried team member remediation.
3.7.3 Deferred tax balances recognised in the Consolidated Statement of Financial Position
2020RESTATED
2019 1
$M $M
Deferred tax asset 1,327 736Deferred tax liabilities (204) (345)Net deferred tax asset 1,123 391
ASSETS ANDLIABILITIES 3
1
2
3
4
5
PERFORM
AN
CE
HIG
HLIG
HTS
BUSIN
ESS REV
IEWD
IRECTORS'
REPORT
FINA
NC
IAL
REPORT
OTH
ER IN
FORM
ATION
105
WO
OLW
ORTH
S GRO
UP
AN
NU
AL REPO
RT 2020
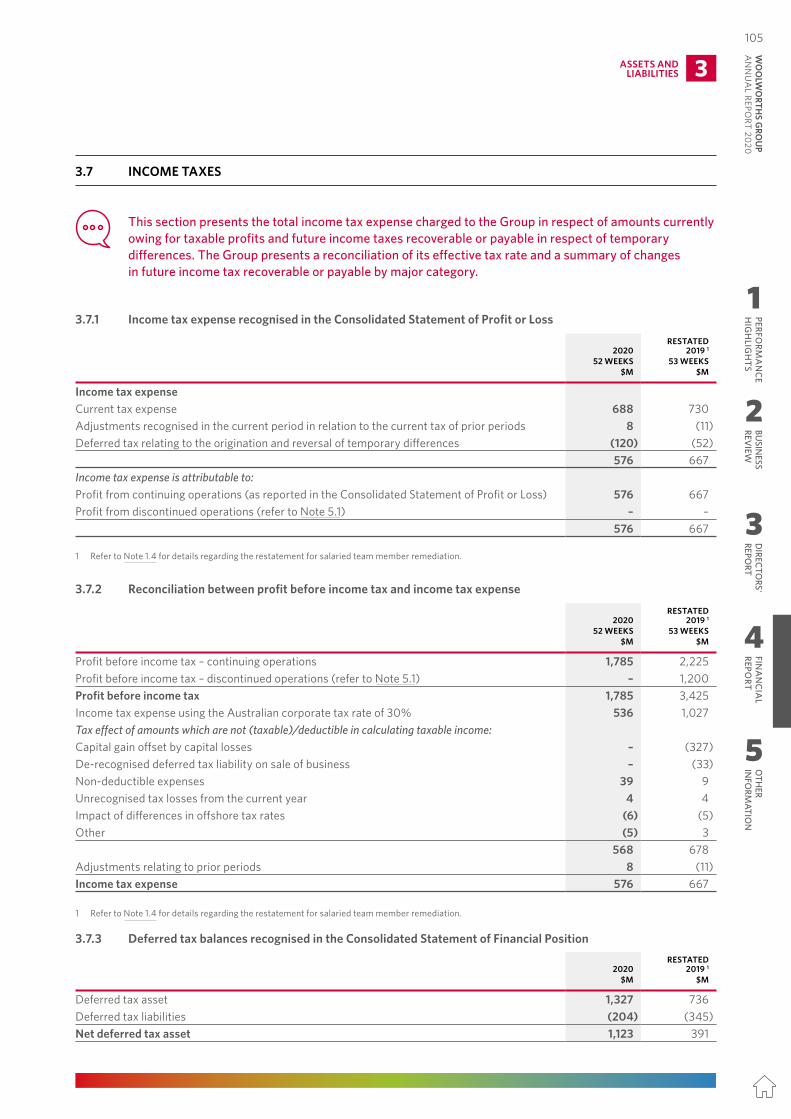
CRITICAL ACCOUNTING ESTIMATES
Key assumptions used in determining the recoverable amount of assets include expected future cash flows, long-term growth rates (terminal value assumptions), and discount rates.
In assessing value in use (VIU), estimated future cash flows are based on the Group’s most recent Board approved business plan covering a period not exceeding five years. The F21 Board approved business plan incorporates the estimated impact on the Group from COVID-19 restrictions and the challenging market conditions forecast through the recovery phase. Given the uncertainties associated with COVID-19, the F21 Board approved business plan is for one year only. For impairment testing purposes, cash flows for Years 2 and 3 are based on management’s best estimate derived from the growth rates in the F20 Board approved business plan with cash flows for Years 4 and beyond extrapolated using estimated long-term growth rates.
Long-term growth rates are based on past experience, expectations of external market operating conditions, and other assumptions which take account of the specific features of each business unit.
The recoverable amount has been determined using a VIU discounted cash flow model. In assessing VIU, the estimated future pre-tax cash flows are discounted to their present value using a pre-tax discount rate that reflects the current market assessments of the time value of money and risks specific to the asset. Pre-tax discount rates used vary depending on the nature of the business and the country of operation.
On adoption of AASB 16, the Group has recognised lease liabilities which for the purposes of the discount rate calculation are considered debt. The Group’s cost of debt is lower than its cost of equity which, accompanied with the change in debt/equity mix, has resulted in a decrease in the pre-tax discount rate compared to the prior period.
The ranges of rates used in determining recoverable amounts are set out below:
2020%
2019%
Long-term growth rate 2.5 2.5Pre-tax discount rate 9–13 12–17
The Group believes that any reasonably possible change in the key assumptions applied would not cause the carrying value of assets to exceed their recoverable amount and result in a material impairment based on current economic conditions and CGU performance.
There is a significant degree of uncertainty associated with the impacts of COVID-19. The assessment of the recoverable amounts represents management’s best estimates taking into account the impacts of COVID-19 on the Group, and this has not resulted in a material change in the recoverable amount. However, if the impacts of COVID-19 extend beyond the forecast period, and restrictions result in extensive store and venue closures or disruption to the Group’s supply chain, there is a risk of a material change in the recoverable amount which may result in impairment.
Notes to the Consolidated Financial Statements
3.6 IMPAIRMENT OF NON‑FINANCIAL ASSETS (CONTINUED)
104
3.7 INCOME TAXES
This section presents the total income tax expense charged to the Group in respect of amounts currently owing for taxable profits and future income taxes recoverable or payable in respect of temporary differences. The Group presents a reconciliation of its effective tax rate and a summary of changes in future income tax recoverable or payable by major category.
3.7.1 Income tax expense recognised in the Consolidated Statement of Profit or Loss
2020RESTATED
2019 1
52 WEEKS 53 WEEKS$M $M
Income tax expenseCurrent tax expense 688 730Adjustments recognised in the current period in relation to the current tax of prior periods 8 (11)Deferred tax relating to the origination and reversal of temporary differences (120) (52)
576 667Income tax expense is attributable to:Profit from continuing operations (as reported in the Consolidated Statement of Profit or Loss) 576 667Profit from discontinued operations (refer to Note 5.1) – –
576 667
1 Refer to Note 1.4 for details regarding the restatement for salaried team member remediation.
3.7.2 Reconciliation between profit before income tax and income tax expense
2020RESTATED
2019 1
52 WEEKS 53 WEEKS$M $M
Profit before income tax – continuing operations 1,785 2,225Profit before income tax – discontinued operations (refer to Note 5.1) – 1,200Profit before income tax 1,785 3,425Income tax expense using the Australian corporate tax rate of 30% 536 1,027Tax effect of amounts which are not (taxable)/deductible in calculating taxable income:Capital gain offset by capital losses – (327)De-recognised deferred tax liability on sale of business – (33)Non-deductible expenses 39 9Unrecognised tax losses from the current year 4 4Impact of differences in offshore tax rates (6) (5)Other (5) 3
568 678Adjustments relating to prior periods 8 (11)Income tax expense 576 667
1 Refer to Note 1.4 for details regarding the restatement for salaried team member remediation.
3.7.3 Deferred tax balances recognised in the Consolidated Statement of Financial Position
2020RESTATED
2019 1
$M $M
Deferred tax asset 1,327 736Deferred tax liabilities (204) (345)Net deferred tax asset 1,123 391
ASSETS ANDLIABILITIES 3
1
2
3
4
5
PERFORM
AN
CE
HIG
HLIG
HTS
BUSIN
ESS REV
IEWD
IRECTORS'
REPORT
FINA
NC
IAL
REPORT
OTH
ER IN
FORM
ATION
105W
OO
LWO
RTHS G
ROU
P A
NN
UA
L REPORT 2020
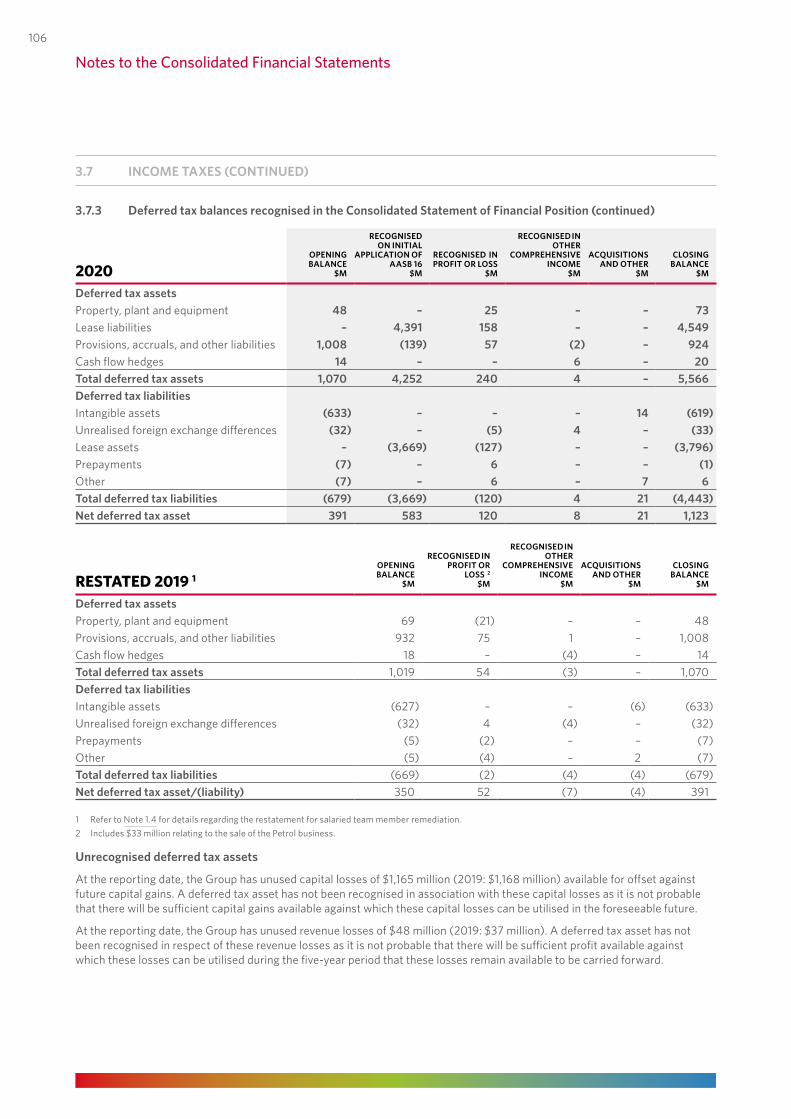
3.7.3 Deferred tax balances recognised in the Consolidated Statement of Financial Position (continued)
2020OPENING BALANCE
$M
RECOGNISED ON INITIAL
APPLICATION OF AASB 16
$M
RECOGNISED IN PROFIT OR LOSS
$M
RECOGNISED IN OTHER
COMPREHENSIVE INCOME
$M
ACQUISITIONS AND OTHER
$M
CLOSING BALANCE
$M
Deferred tax assetsProperty, plant and equipment 48 – 25 – – 73Lease liabilities – 4,391 158 – – 4,549Provisions, accruals, and other liabilities 1,008 (139) 57 (2) – 924Cash flow hedges 14 – – 6 – 20Total deferred tax assets 1,070 4,252 240 4 – 5,566Deferred tax liabilitiesIntangible assets (633) – – – 14 (619)Unrealised foreign exchange differences (32) – (5) 4 – (33)Lease assets – (3,669) (127) – – (3,796)Prepayments (7) – 6 – – (1)Other (7) – 6 – 7 6Total deferred tax liabilities (679) (3,669) (120) 4 21 (4,443)Net deferred tax asset 391 583 120 8 21 1,123
RESTATED 2019 1OPENING BALANCE
$M
RECOGNISED IN PROFIT OR
LOSS 2 $M
RECOGNISED IN OTHER
COMPREHENSIVE INCOME
$M
ACQUISITIONS AND OTHER
$M
CLOSING BALANCE
$M
Deferred tax assetsProperty, plant and equipment 69 (21) – – 48Provisions, accruals, and other liabilities 932 75 1 – 1,008Cash flow hedges 18 – (4) – 14Total deferred tax assets 1,019 54 (3) – 1,070Deferred tax liabilitiesIntangible assets (627) – – (6) (633)Unrealised foreign exchange differences (32) 4 (4) – (32)Prepayments (5) (2) – – (7)Other (5) (4) – 2 (7)Total deferred tax liabilities (669) (2) (4) (4) (679)Net deferred tax asset/(liability) 350 52 (7) (4) 391
1 Refer to Note 1.4 for details regarding the restatement for salaried team member remediation.2 Includes $33 million relating to the sale of the Petrol business.
Unrecognised deferred tax assets
At the reporting date, the Group has unused capital losses of $1,165 million (2019: $1,168 million) available for offset against future capital gains. A deferred tax asset has not been recognised in association with these capital losses as it is not probable that there will be sufficient capital gains available against which these capital losses can be utilised in the foreseeable future.
At the reporting date, the Group has unused revenue losses of $48 million (2019: $37 million). A deferred tax asset has not been recognised in respect of these revenue losses as it is not probable that there will be sufficient profit available against which these losses can be utilised during the five-year period that these losses remain available to be carried forward.
Notes to the Consolidated Financial Statements
3.7 INCOME TAXES (CONTINUED)
106
3.7.4 Tax consolidation
The Company and its wholly-owned Australian resident entities formed a tax consolidated group with effect from 1 July 2002. Woolworths Group Limited is the head entity of the tax consolidated group and has assumed the current tax liabilities of the members in the tax consolidated group (the Woolworths tax group). Income tax expense or benefit, deferred tax assets, and deferred tax liabilities arising from temporary differences of the members of the tax consolidated group are recognised by each subsidiary where the subsidiary would have been able to recognise the deferred tax asset or deferred tax liability on a standalone basis.The members of the tax consolidated group have entered into a tax funding agreement with the Company which sets out the funding obligations in respect of income tax amounts. The agreement requires payments by the subsidiary to the Company equal to the income tax liability assumed by the Company. The Company is required to make payment to the subsidiary equal to the current tax asset assumed by the Company.In respect of carried forward tax losses brought into the group on consolidation by subsidiary members, the Company will pay the subsidiary member for such losses when these losses are transferred to the tax consolidated group, where the subsidiary member would have been entitled to recognise the benefit of these losses on a standalone basis.Endeavour Group Limited and a number of its wholly-owned Australian resident subsidiaries were part of the Woolworths tax group. On 3 February 2020, a clean exit was made by these entities from the Woolworths tax group in accordance with the Woolworths Tax Sharing Agreement and the Woolworths Tax Funding Agreement. As a result, no further obligation to the Company exists on balance date in relation to the period of time that these entities were a member of the Woolworths tax group. Endeavour Group Limited, and its wholly owned subsidiaries, have not formed a new tax consolidated group since leaving the Woolworths tax group which means that they are each now separate taxpayers.Income tax expense of $117 million (2019: $104 million) was charged by the Company to subsidiaries during the period through at call intercompany accounts.
SIGNIFICANT ACCOUNTING POLICIES
Income tax expense in the Consolidated Statement of Profit or Loss for the period presented comprises current and deferred tax. Income tax is recognised in the Consolidated Statement of Profit or Loss except to the extent that it relates to items recognised in other comprehensive income, or directly in equity, in which case the tax is also recognised in other comprehensive income, or directly in equity, respectively.
Current taxCurrent tax payable represents the amount expected to be paid to taxation authorities on taxable income for the period, using tax rates enacted or substantively enacted at the reporting date and any adjustment to tax payable in respect of previous periods.
Deferred taxDeferred tax is calculated using the balance sheet method, providing for temporary differences between the carrying amounts of assets and liabilities for financial reporting and taxation purposes. Deferred tax is measured at the rates that are expected to apply in the period in which the liability is settled, or asset realised, based on tax rates enacted or substantively enacted at the reporting date.Deferred tax assets and liabilities are not recognised if the temporary difference arises from the initial recognition (other than in a business combination) of assets and liabilities in a transaction that affects neither the taxable profit nor the accounting profit or in relation to the initial recognition of goodwill.A deferred tax asset is recognised only to the extent that it is probable that future taxable profits will be available against which the deductible temporary differences or unused tax losses and tax offsets can be utilised. Deferred tax assets are reduced to the extent that it is no longer probable that the related tax benefit will be realised.The benefit of intangible assets with an indefinite useful life will flow to the Group on an annual basis, therefore the carrying amount will be recovered through use.Deferred tax assets and liabilities are offset when they relate to income taxes levied by the same taxation authority and the Group intends to settle its current tax assets and liabilities on a net basis.
ASSETS ANDLIABILITIES 3
3.7 INCOME TAXES (CONTINUED)
1
2
3
4
5
PERFORM
AN
CE
HIG
HLIG
HTS
BUSIN
ESS REV
IEWD
IRECTORS'
REPORT
FINA
NC
IAL
REPORT
OTH
ER IN
FORM
ATION
107
WO
OLW
ORTH
S GRO
UP
AN
NU
AL REPO
RT 2020
3.7.3 Deferred tax balances recognised in the Consolidated Statement of Financial Position (continued)
2020OPENING BALANCE
$M
RECOGNISED ON INITIAL
APPLICATION OF AASB 16
$M
RECOGNISED IN PROFIT OR LOSS
$M
RECOGNISED IN OTHER
COMPREHENSIVE INCOME
$M
ACQUISITIONS AND OTHER
$M
CLOSING BALANCE
$M
Deferred tax assetsProperty, plant and equipment 48 – 25 – – 73Lease liabilities – 4,391 158 – – 4,549Provisions, accruals, and other liabilities 1,008 (139) 57 (2) – 924Cash flow hedges 14 – – 6 – 20Total deferred tax assets 1,070 4,252 240 4 – 5,566Deferred tax liabilitiesIntangible assets (633) – – – 14 (619)Unrealised foreign exchange differences (32) – (5) 4 – (33)Lease assets – (3,669) (127) – – (3,796)Prepayments (7) – 6 – – (1)Other (7) – 6 – 7 6Total deferred tax liabilities (679) (3,669) (120) 4 21 (4,443)Net deferred tax asset 391 583 120 8 21 1,123
RESTATED 2019 1OPENING BALANCE
$M
RECOGNISED IN PROFIT OR
LOSS 2 $M
RECOGNISED IN OTHER
COMPREHENSIVE INCOME
$M
ACQUISITIONS AND OTHER
$M
CLOSING BALANCE
$M
Deferred tax assetsProperty, plant and equipment 69 (21) – – 48Provisions, accruals, and other liabilities 932 75 1 – 1,008Cash flow hedges 18 – (4) – 14Total deferred tax assets 1,019 54 (3) – 1,070Deferred tax liabilitiesIntangible assets (627) – – (6) (633)Unrealised foreign exchange differences (32) 4 (4) – (32)Prepayments (5) (2) – – (7)Other (5) (4) – 2 (7)Total deferred tax liabilities (669) (2) (4) (4) (679)Net deferred tax asset/(liability) 350 52 (7) (4) 391
1 Refer to Note 1.4 for details regarding the restatement for salaried team member remediation.2 Includes $33 million relating to the sale of the Petrol business.
Unrecognised deferred tax assets
At the reporting date, the Group has unused capital losses of $1,165 million (2019: $1,168 million) available for offset against future capital gains. A deferred tax asset has not been recognised in association with these capital losses as it is not probable that there will be sufficient capital gains available against which these capital losses can be utilised in the foreseeable future.
At the reporting date, the Group has unused revenue losses of $48 million (2019: $37 million). A deferred tax asset has not been recognised in respect of these revenue losses as it is not probable that there will be sufficient profit available against which these losses can be utilised during the five-year period that these losses remain available to be carried forward.
Notes to the Consolidated Financial Statements
3.7 INCOME TAXES (CONTINUED)
106
3.7.4 Tax consolidation
The Company and its wholly-owned Australian resident entities formed a tax consolidated group with effect from 1 July 2002. Woolworths Group Limited is the head entity of the tax consolidated group and has assumed the current tax liabilities of the members in the tax consolidated group (the Woolworths tax group). Income tax expense or benefit, deferred tax assets, and deferred tax liabilities arising from temporary differences of the members of the tax consolidated group are recognised by each subsidiary where the subsidiary would have been able to recognise the deferred tax asset or deferred tax liability on a standalone basis.The members of the tax consolidated group have entered into a tax funding agreement with the Company which sets out the funding obligations in respect of income tax amounts. The agreement requires payments by the subsidiary to the Company equal to the income tax liability assumed by the Company. The Company is required to make payment to the subsidiary equal to the current tax asset assumed by the Company.In respect of carried forward tax losses brought into the group on consolidation by subsidiary members, the Company will pay the subsidiary member for such losses when these losses are transferred to the tax consolidated group, where the subsidiary member would have been entitled to recognise the benefit of these losses on a standalone basis.Endeavour Group Limited and a number of its wholly-owned Australian resident subsidiaries were part of the Woolworths tax group. On 3 February 2020, a clean exit was made by these entities from the Woolworths tax group in accordance with the Woolworths Tax Sharing Agreement and the Woolworths Tax Funding Agreement. As a result, no further obligation to the Company exists on balance date in relation to the period of time that these entities were a member of the Woolworths tax group. Endeavour Group Limited, and its wholly owned subsidiaries, have not formed a new tax consolidated group since leaving the Woolworths tax group which means that they are each now separate taxpayers.Income tax expense of $117 million (2019: $104 million) was charged by the Company to subsidiaries during the period through at call intercompany accounts.
SIGNIFICANT ACCOUNTING POLICIES
Income tax expense in the Consolidated Statement of Profit or Loss for the period presented comprises current and deferred tax. Income tax is recognised in the Consolidated Statement of Profit or Loss except to the extent that it relates to items recognised in other comprehensive income, or directly in equity, in which case the tax is also recognised in other comprehensive income, or directly in equity, respectively.
Current taxCurrent tax payable represents the amount expected to be paid to taxation authorities on taxable income for the period, using tax rates enacted or substantively enacted at the reporting date and any adjustment to tax payable in respect of previous periods.
Deferred taxDeferred tax is calculated using the balance sheet method, providing for temporary differences between the carrying amounts of assets and liabilities for financial reporting and taxation purposes. Deferred tax is measured at the rates that are expected to apply in the period in which the liability is settled, or asset realised, based on tax rates enacted or substantively enacted at the reporting date.Deferred tax assets and liabilities are not recognised if the temporary difference arises from the initial recognition (other than in a business combination) of assets and liabilities in a transaction that affects neither the taxable profit nor the accounting profit or in relation to the initial recognition of goodwill.A deferred tax asset is recognised only to the extent that it is probable that future taxable profits will be available against which the deductible temporary differences or unused tax losses and tax offsets can be utilised. Deferred tax assets are reduced to the extent that it is no longer probable that the related tax benefit will be realised.The benefit of intangible assets with an indefinite useful life will flow to the Group on an annual basis, therefore the carrying amount will be recovered through use.Deferred tax assets and liabilities are offset when they relate to income taxes levied by the same taxation authority and the Group intends to settle its current tax assets and liabilities on a net basis.
ASSETS ANDLIABILITIES 3
3.7 INCOME TAXES (CONTINUED)
1
2
3
4
5
PERFORM
AN
CE
HIG
HLIG
HTS
BUSIN
ESS REV
IEWD
IRECTORS'
REPORT
FINA
NC
IAL
REPORT
OTH
ER IN
FORM
ATION
107W
OO
LWO
RTHS G
ROU
P A
NN
UA
L REPORT 2020
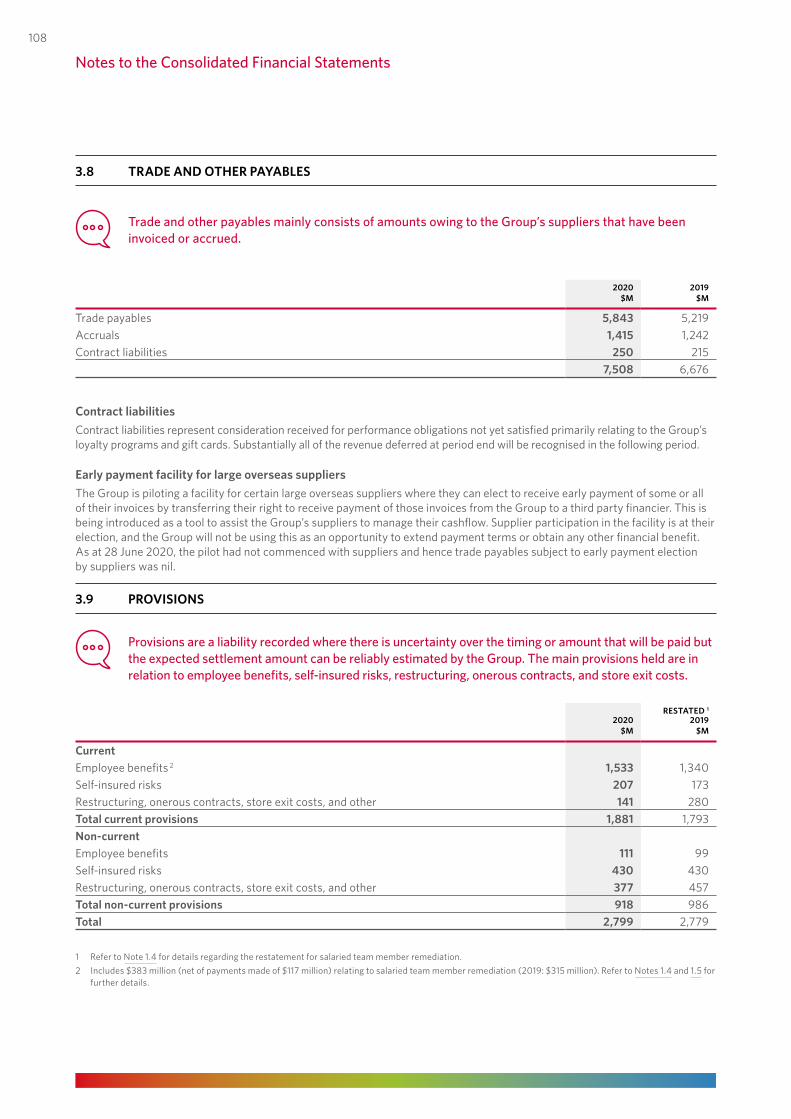
3.8 TRADE AND OTHER PAYABLES
Trade and other payables mainly consists of amounts owing to the Group’s suppliers that have been invoiced or accrued.
2020 2019$M $M
Trade payables 5,843 5,219 Accruals 1,415 1,242 Contract liabilities 250 215
7,508 6,676
Contract liabilitiesContract liabilities represent consideration received for performance obligations not yet satisfied primarily relating to the Group’s loyalty programs and gift cards. Substantially all of the revenue deferred at period end will be recognised in the following period.
Early payment facility for large overseas suppliersThe Group is piloting a facility for certain large overseas suppliers where they can elect to receive early payment of some or all of their invoices by transferring their right to receive payment of those invoices from the Group to a third party financier. This is being introduced as a tool to assist the Group’s suppliers to manage their cashflow. Supplier participation in the facility is at their election, and the Group will not be using this as an opportunity to extend payment terms or obtain any other financial benefit. As at 28 June 2020, the pilot had not commenced with suppliers and hence trade payables subject to early payment election by suppliers was nil.
3.9 PROVISIONS
Provisions are a liability recorded where there is uncertainty over the timing or amount that will be paid but the expected settlement amount can be reliably estimated by the Group. The main provisions held are in relation to employee benefits, self‑insured risks, restructuring, onerous contracts, and store exit costs.
2020RESTATED 1
2019$M $M
CurrentEmployee benefits 2 1,533 1,340 Self-insured risks 207 173 Restructuring, onerous contracts, store exit costs, and other 141 280 Total current provisions 1,881 1,793 Non‑currentEmployee benefits 111 99 Self-insured risks 430 430 Restructuring, onerous contracts, store exit costs, and other 377 457 Total non‑current provisions 918 986 Total 2,799 2,779
1 Refer to Note 1.4 for details regarding the restatement for salaried team member remediation.2 Includes $383 million (net of payments made of $117 million) relating to salaried team member remediation (2019: $315 million). Refer to Notes 1.4 and 1.5 for
further details.
Notes to the Consolidated Financial Statements
108
Movements in total self‑insured risks, restructuring, onerous contracts, store exit costs, and other provisions
SELF‑INSURED RISKS
RESTRUCTURING, ONEROUS CONTRACTS, STORE EXIT COSTS,
AND OTHER
2020 $M
2019 $M
2020 $M
2019 $M
Movement:Balance at 30 June 2019, as previously reported 603 596 737 679 Adjustments on initial application of AASB 16 – – (194) – Adjusted balance at 1 July 2019 603 596 543 679Net provisions recognised 187 177 128 225Cash payments (134) (157) (144) (162)Other (19) (13) (9) (5)Balance at end of period 637 603 518 737 Current 207 173 141 280 Non-current 430 430 377 457 Balance at end of period 637 603 518 737
SIGNIFICANT ACCOUNTING POLICIES
A provision is recognised when the Group has a present legal or constructive obligation as a result of a past event, it is probable that an outflow of economic benefits will be required to settle the obligation, and a reliable estimate can be made as to the amount of the obligation. The amount recognised is the best estimate of the consideration required to settle the present obligation at the reporting date, taking into account the risks and uncertainties surrounding the obligation.
Employee benefitsA liability is recognised for benefits accruing to employees in respect of annual leave and long service leave.
Liabilities expected to be settled within 12 months are measured at their nominal values using the remuneration rate expected to apply at the time of settlement.
Liabilities which are not expected to be settled within 12 months are measured as the present value of the estimated future cash outflows to be made by the Group in respect of services provided by employees up to the reporting date.
Self‑insuranceThe provision for self-insured risks primarily represents the estimated liability for workers’ compensation and public liability claims.
RestructuringProvision for restructuring is recognised when the Group has developed a detailed formal plan for the restructuring and has raised a valid expectation in those affected by the restructuring that the restructuring will occur.
Onerous contracts and store exit costsAn onerous contract is a contract in which the unavoidable costs of meeting the obligations under the contract exceed the economic benefits expected to be received under it. The unavoidable costs under a contract reflect the least net cost of exiting from the contract, which is the lower of the cost of fulfilling it and any compensation or penalties arising from failure to fulfil it.
ASSETS ANDLIABILITIES 3
3.9 PROVISIONS (CONTINUED)
1
2
3
4
5
PERFORM
AN
CE
HIG
HLIG
HTS
BUSIN
ESS REV
IEWD
IRECTORS'
REPORT
FINA
NC
IAL
REPORT
OTH
ER IN
FORM
ATION
109
WO
OLW
ORTH
S GRO
UP
AN
NU
AL REPO
RT 2020
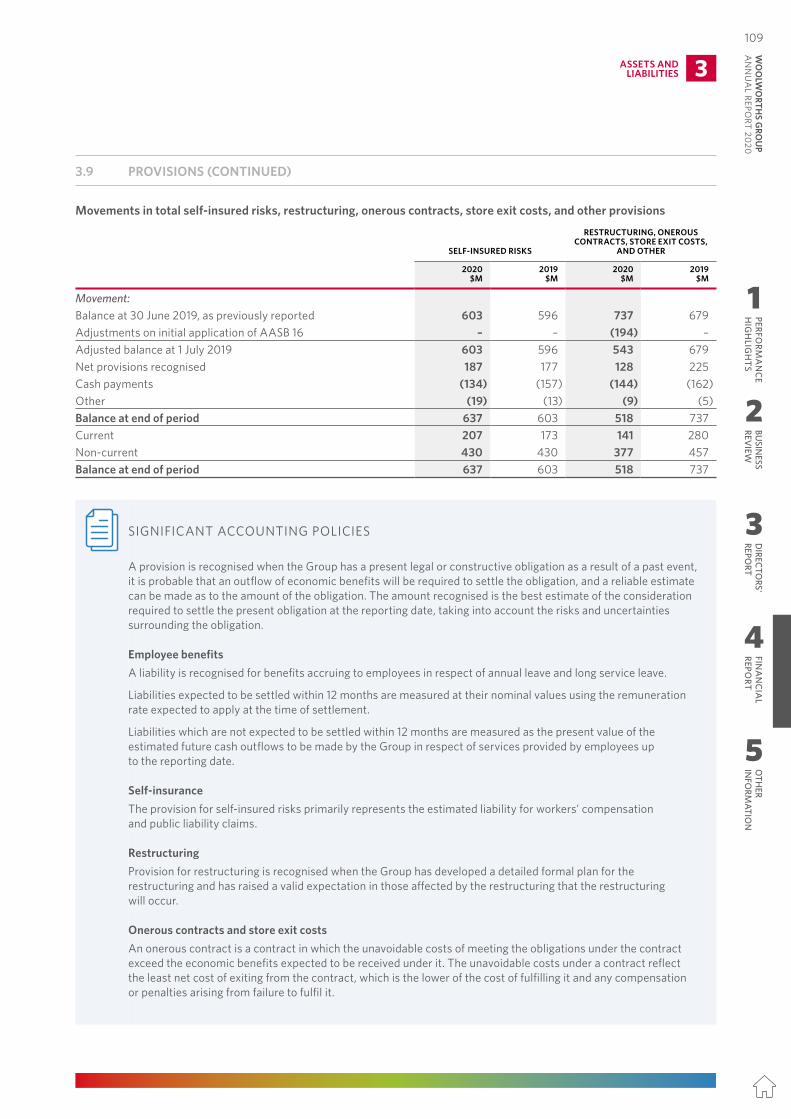
3.8 TRADE AND OTHER PAYABLES
Trade and other payables mainly consists of amounts owing to the Group’s suppliers that have been invoiced or accrued.
2020 2019$M $M
Trade payables 5,843 5,219 Accruals 1,415 1,242 Contract liabilities 250 215
7,508 6,676
Contract liabilitiesContract liabilities represent consideration received for performance obligations not yet satisfied primarily relating to the Group’s loyalty programs and gift cards. Substantially all of the revenue deferred at period end will be recognised in the following period.
Early payment facility for large overseas suppliersThe Group is piloting a facility for certain large overseas suppliers where they can elect to receive early payment of some or all of their invoices by transferring their right to receive payment of those invoices from the Group to a third party financier. This is being introduced as a tool to assist the Group’s suppliers to manage their cashflow. Supplier participation in the facility is at their election, and the Group will not be using this as an opportunity to extend payment terms or obtain any other financial benefit. As at 28 June 2020, the pilot had not commenced with suppliers and hence trade payables subject to early payment election by suppliers was nil.
3.9 PROVISIONS
Provisions are a liability recorded where there is uncertainty over the timing or amount that will be paid but the expected settlement amount can be reliably estimated by the Group. The main provisions held are in relation to employee benefits, self‑insured risks, restructuring, onerous contracts, and store exit costs.
2020RESTATED 1
2019$M $M
CurrentEmployee benefits 2 1,533 1,340 Self-insured risks 207 173 Restructuring, onerous contracts, store exit costs, and other 141 280 Total current provisions 1,881 1,793 Non‑currentEmployee benefits 111 99 Self-insured risks 430 430 Restructuring, onerous contracts, store exit costs, and other 377 457 Total non‑current provisions 918 986 Total 2,799 2,779
1 Refer to Note 1.4 for details regarding the restatement for salaried team member remediation.2 Includes $383 million (net of payments made of $117 million) relating to salaried team member remediation (2019: $315 million). Refer to Notes 1.4 and 1.5 for
further details.
Notes to the Consolidated Financial Statements
108
Movements in total self‑insured risks, restructuring, onerous contracts, store exit costs, and other provisions
SELF‑INSURED RISKS
RESTRUCTURING, ONEROUS CONTRACTS, STORE EXIT COSTS,
AND OTHER
2020 $M
2019 $M
2020 $M
2019 $M
Movement:Balance at 30 June 2019, as previously reported 603 596 737 679 Adjustments on initial application of AASB 16 – – (194) – Adjusted balance at 1 July 2019 603 596 543 679Net provisions recognised 187 177 128 225Cash payments (134) (157) (144) (162)Other (19) (13) (9) (5)Balance at end of period 637 603 518 737 Current 207 173 141 280 Non-current 430 430 377 457 Balance at end of period 637 603 518 737
SIGNIFICANT ACCOUNTING POLICIES
A provision is recognised when the Group has a present legal or constructive obligation as a result of a past event, it is probable that an outflow of economic benefits will be required to settle the obligation, and a reliable estimate can be made as to the amount of the obligation. The amount recognised is the best estimate of the consideration required to settle the present obligation at the reporting date, taking into account the risks and uncertainties surrounding the obligation.
Employee benefitsA liability is recognised for benefits accruing to employees in respect of annual leave and long service leave.
Liabilities expected to be settled within 12 months are measured at their nominal values using the remuneration rate expected to apply at the time of settlement.
Liabilities which are not expected to be settled within 12 months are measured as the present value of the estimated future cash outflows to be made by the Group in respect of services provided by employees up to the reporting date.
Self‑insuranceThe provision for self-insured risks primarily represents the estimated liability for workers’ compensation and public liability claims.
RestructuringProvision for restructuring is recognised when the Group has developed a detailed formal plan for the restructuring and has raised a valid expectation in those affected by the restructuring that the restructuring will occur.
Onerous contracts and store exit costsAn onerous contract is a contract in which the unavoidable costs of meeting the obligations under the contract exceed the economic benefits expected to be received under it. The unavoidable costs under a contract reflect the least net cost of exiting from the contract, which is the lower of the cost of fulfilling it and any compensation or penalties arising from failure to fulfil it.
ASSETS ANDLIABILITIES 3
3.9 PROVISIONS (CONTINUED)
1
2
3
4
5
PERFORM
AN
CE
HIG
HLIG
HTS
BUSIN
ESS REV
IEWD
IRECTORS'
REPORT
FINA
NC
IAL
REPORT
OTH
ER IN
FORM
ATION
109W
OO
LWO
RTHS G
ROU
P A
NN
UA
L REPORT 2020
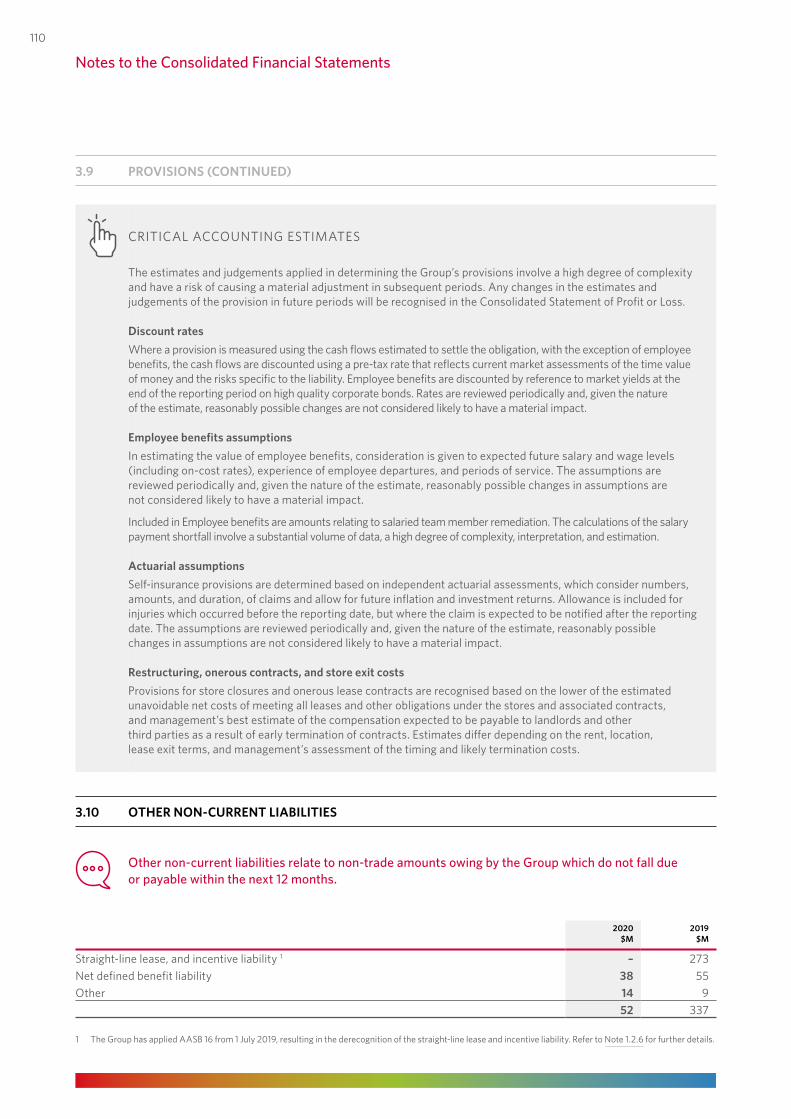
CRITICAL ACCOUNTING ESTIMATES
The estimates and judgements applied in determining the Group’s provisions involve a high degree of complexity and have a risk of causing a material adjustment in subsequent periods. Any changes in the estimates and judgements of the provision in future periods will be recognised in the Consolidated Statement of Profit or Loss.
Discount ratesWhere a provision is measured using the cash flows estimated to settle the obligation, with the exception of employee benefits, the cash flows are discounted using a pre-tax rate that reflects current market assessments of the time value of money and the risks specific to the liability. Employee benefits are discounted by reference to market yields at the end of the reporting period on high quality corporate bonds. Rates are reviewed periodically and, given the nature of the estimate, reasonably possible changes are not considered likely to have a material impact.
Employee benefits assumptionsIn estimating the value of employee benefits, consideration is given to expected future salary and wage levels (including on-cost rates), experience of employee departures, and periods of service. The assumptions are reviewed periodically and, given the nature of the estimate, reasonably possible changes in assumptions are not considered likely to have a material impact.
Included in Employee benefits are amounts relating to salaried team member remediation. The calculations of the salary payment shortfall involve a substantial volume of data, a high degree of complexity, interpretation, and estimation.
Actuarial assumptionsSelf-insurance provisions are determined based on independent actuarial assessments, which consider numbers, amounts, and duration, of claims and allow for future inflation and investment returns. Allowance is included for injuries which occurred before the reporting date, but where the claim is expected to be notified after the reporting date. The assumptions are reviewed periodically and, given the nature of the estimate, reasonably possible changes in assumptions are not considered likely to have a material impact.
Restructuring, onerous contracts, and store exit costsProvisions for store closures and onerous lease contracts are recognised based on the lower of the estimated unavoidable net costs of meeting all leases and other obligations under the stores and associated contracts, and management’s best estimate of the compensation expected to be payable to landlords and other third parties as a result of early termination of contracts. Estimates differ depending on the rent, location, lease exit terms, and management’s assessment of the timing and likely termination costs.
3.10 OTHER NON‑CURRENT LIABILITIES
Other non‑current liabilities relate to non‑trade amounts owing by the Group which do not fall due or payable within the next 12 months.
2020 2019$M $M
Straight-line lease, and incentive liability 1 – 273 Net defined benefit liability 38 55 Other 14 9
52 337
1 The Group has applied AASB 16 from 1 July 2019, resulting in the derecognition of the straight-line lease and incentive liability. Refer to Note 1.2.6 for further details.
3.9 PROVISIONS (CONTINUED)
Notes to the Consolidated Financial Statements
110
4 CAPITAL STRUCTURE, FINANCING, AND RISK MANAGEMENT
4.1 EARNINGS PER SHARE
Earnings per share presents the amount of profit generated for the reporting period attributable to shareholders divided by the weighted average number of shares on issue. The potential for any share rights issued by the Group to dilute existing shareholders’ ownership when the share rights are exercised are also presented.
2020RESTATED 1
201952 WEEKS 53 WEEKS
Profit for the period attributable to equity holders of the parent entity used in earnings per share ($M)Continuing operations 1 1,165 1,492Discontinued operations – 1,200
1,165 2,692Weighted average number of shares used in earnings per share (shares, millions) 2
Basic earnings per share 1,257.9 1,305.7Diluted earnings per share 3 1,265.4 1,313.7Basic earnings per share (cents per share) 2
Continuing operations 92.7 114.3Discontinued operations – 91.9
92.7 206.2Diluted earnings per share (cents per share) 2, 3
Continuing operations 92.2 113.6Discontinued operations – 91.3
92.2 204.9
1 Refer to Note 1.4 for details regarding the restatement for salaried team member remediation.2 Weighted average number of shares has been adjusted to remove shares held in trust by Woolworths Custodian Pty Ltd (as trustee of various employee
share trusts).
3 Includes 7.8 million (2019: 8.0 million) shares deemed to be issued for no consideration in respect of employee performance rights.
CAPITAL STRUCTURE, FINANCING, AND RISK MANAGEMENT 4
1
2
3
4
5
PERFORM
AN
CE
HIG
HLIG
HTS
BUSIN
ESS REV
IEWD
IRECTORS'
REPORT
FINA
NC
IAL
REPORT
OTH
ER IN
FORM
ATION
111
WO
OLW
ORTH
S GRO
UP
AN
NU
AL REPO
RT 2020
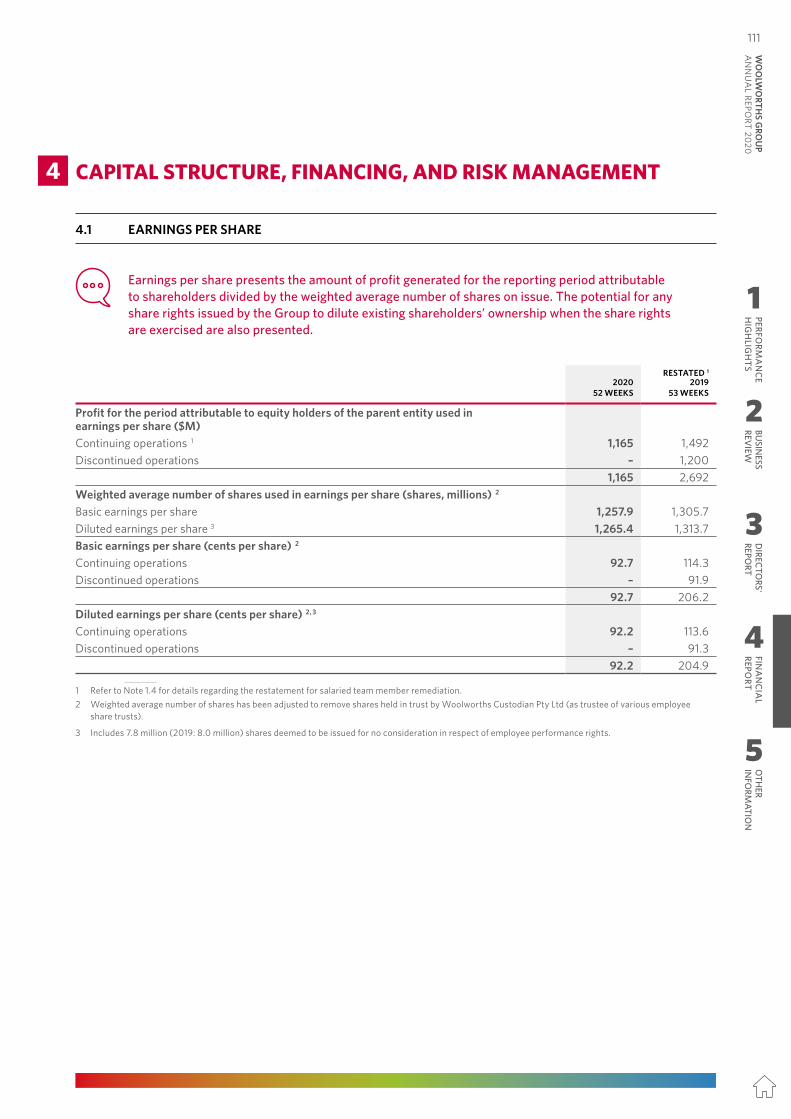
CRITICAL ACCOUNTING ESTIMATES
The estimates and judgements applied in determining the Group’s provisions involve a high degree of complexity and have a risk of causing a material adjustment in subsequent periods. Any changes in the estimates and judgements of the provision in future periods will be recognised in the Consolidated Statement of Profit or Loss.
Discount ratesWhere a provision is measured using the cash flows estimated to settle the obligation, with the exception of employee benefits, the cash flows are discounted using a pre-tax rate that reflects current market assessments of the time value of money and the risks specific to the liability. Employee benefits are discounted by reference to market yields at the end of the reporting period on high quality corporate bonds. Rates are reviewed periodically and, given the nature of the estimate, reasonably possible changes are not considered likely to have a material impact.
Employee benefits assumptionsIn estimating the value of employee benefits, consideration is given to expected future salary and wage levels (including on-cost rates), experience of employee departures, and periods of service. The assumptions are reviewed periodically and, given the nature of the estimate, reasonably possible changes in assumptions are not considered likely to have a material impact.
Included in Employee benefits are amounts relating to salaried team member remediation. The calculations of the salary payment shortfall involve a substantial volume of data, a high degree of complexity, interpretation, and estimation.
Actuarial assumptionsSelf-insurance provisions are determined based on independent actuarial assessments, which consider numbers, amounts, and duration, of claims and allow for future inflation and investment returns. Allowance is included for injuries which occurred before the reporting date, but where the claim is expected to be notified after the reporting date. The assumptions are reviewed periodically and, given the nature of the estimate, reasonably possible changes in assumptions are not considered likely to have a material impact.
Restructuring, onerous contracts, and store exit costsProvisions for store closures and onerous lease contracts are recognised based on the lower of the estimated unavoidable net costs of meeting all leases and other obligations under the stores and associated contracts, and management’s best estimate of the compensation expected to be payable to landlords and other third parties as a result of early termination of contracts. Estimates differ depending on the rent, location, lease exit terms, and management’s assessment of the timing and likely termination costs.
3.10 OTHER NON‑CURRENT LIABILITIES
Other non‑current liabilities relate to non‑trade amounts owing by the Group which do not fall due or payable within the next 12 months.
2020 2019$M $M
Straight-line lease, and incentive liability 1 – 273 Net defined benefit liability 38 55 Other 14 9
52 337
1 The Group has applied AASB 16 from 1 July 2019, resulting in the derecognition of the straight-line lease and incentive liability. Refer to Note 1.2.6 for further details.
3.9 PROVISIONS (CONTINUED)
Notes to the Consolidated Financial Statements
110
4 CAPITAL STRUCTURE, FINANCING, AND RISK MANAGEMENT
4.1 EARNINGS PER SHARE
Earnings per share presents the amount of profit generated for the reporting period attributable to shareholders divided by the weighted average number of shares on issue. The potential for any share rights issued by the Group to dilute existing shareholders’ ownership when the share rights are exercised are also presented.
2020RESTATED 1
201952 WEEKS 53 WEEKS
Profit for the period attributable to equity holders of the parent entity used in earnings per share ($M)Continuing operations 1 1,165 1,492Discontinued operations – 1,200
1,165 2,692Weighted average number of shares used in earnings per share (shares, millions) 2
Basic earnings per share 1,257.9 1,305.7Diluted earnings per share 3 1,265.4 1,313.7Basic earnings per share (cents per share) 2
Continuing operations 92.7 114.3Discontinued operations – 91.9
92.7 206.2Diluted earnings per share (cents per share) 2, 3
Continuing operations 92.2 113.6Discontinued operations – 91.3
92.2 204.9
1 Refer to Note 1.4 for details regarding the restatement for salaried team member remediation.2 Weighted average number of shares has been adjusted to remove shares held in trust by Woolworths Custodian Pty Ltd (as trustee of various employee
share trusts).
3 Includes 7.8 million (2019: 8.0 million) shares deemed to be issued for no consideration in respect of employee performance rights.
CAPITAL STRUCTURE, FINANCING, AND RISK MANAGEMENT 4
1
2
3
4
5
PERFORM
AN
CE
HIG
HLIG
HTS
BUSIN
ESS REV
IEWD
IRECTORS'
REPORT
FINA
NC
IAL
REPORT
OTH
ER IN
FORM
ATION
111W
OO
LWO
RTHS G
ROU
P A
NN
UA
L REPORT 2020
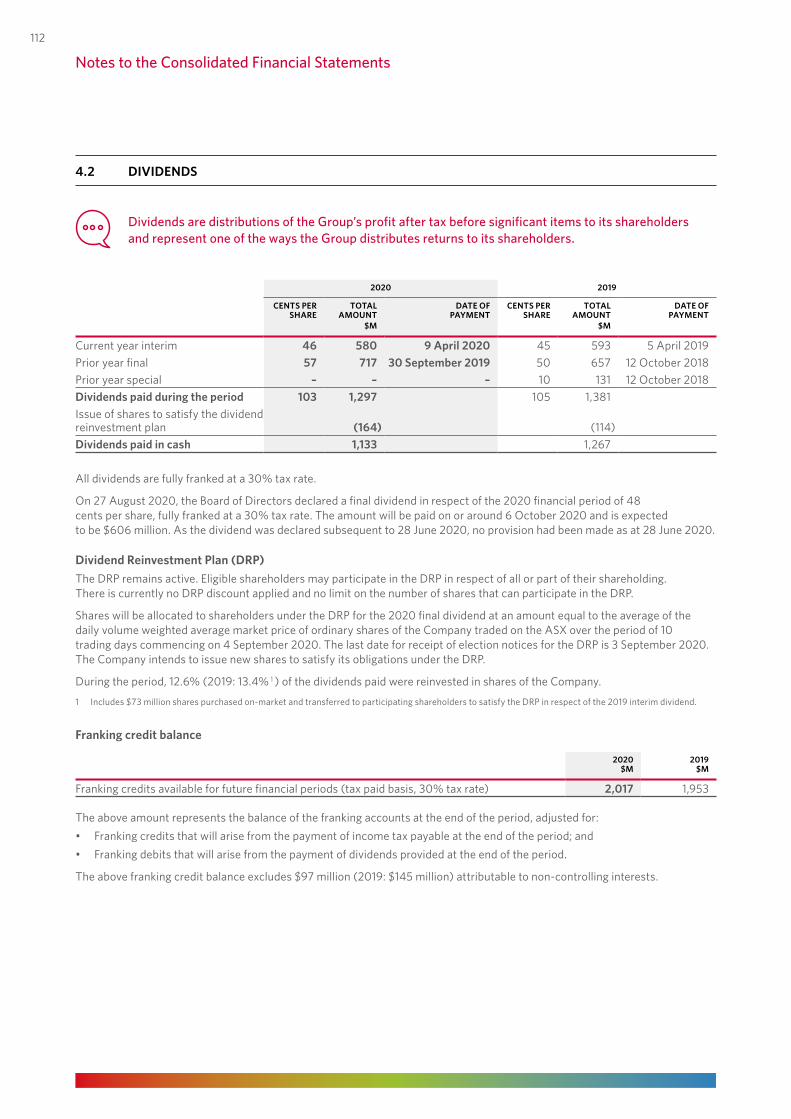
4.2 DIVIDENDS
Dividends are distributions of the Group’s profit after tax before significant items to its shareholders and represent one of the ways the Group distributes returns to its shareholders.
2020 2019
CENTS PER SHARE
TOTAL AMOUNT
DATE OF PAYMENT
CENTS PER SHARE
TOTAL AMOUNT
DATE OF PAYMENT
$M $M
Current year interim 46 580 9 April 2020 45 593 5 April 2019Prior year final 57 717 30 September 2019 50 657 12 October 2018Prior year special – – – 10 131 12 October 2018Dividends paid during the period 103 1,297 105 1,381Issue of shares to satisfy the dividend reinvestment plan (164) (114)Dividends paid in cash 1,133 1,267
All dividends are fully franked at a 30% tax rate.
On 27 August 2020, the Board of Directors declared a final dividend in respect of the 2020 financial period of 48 cents per share, fully franked at a 30% tax rate. The amount will be paid on or around 6 October 2020 and is expected to be $606 million. As the dividend was declared subsequent to 28 June 2020, no provision had been made as at 28 June 2020.
Dividend Reinvestment Plan (DRP)The DRP remains active. Eligible shareholders may participate in the DRP in respect of all or part of their shareholding. There is currently no DRP discount applied and no limit on the number of shares that can participate in the DRP.
Shares will be allocated to shareholders under the DRP for the 2020 final dividend at an amount equal to the average of the daily volume weighted average market price of ordinary shares of the Company traded on the ASX over the period of 10 trading days commencing on 4 September 2020. The last date for receipt of election notices for the DRP is 3 September 2020. The Company intends to issue new shares to satisfy its obligations under the DRP.
During the period, 12.6% (2019: 13.4% 1 ) of the dividends paid were reinvested in shares of the Company.
1 Includes $73 million shares purchased on-market and transferred to participating shareholders to satisfy the DRP in respect of the 2019 interim dividend.
Franking credit balance
2020 $M
2019 $M
Franking credits available for future financial periods (tax paid basis, 30% tax rate) 2,017 1,953
The above amount represents the balance of the franking accounts at the end of the period, adjusted for:• Franking credits that will arise from the payment of income tax payable at the end of the period; and• Franking debits that will arise from the payment of dividends provided at the end of the period.
The above franking credit balance excludes $97 million (2019: $145 million) attributable to non-controlling interests.
Notes to the Consolidated Financial Statements
112
4.3 CONTRIBUTED EQUITY
Contributed equity represents the number of ordinary shares on issue less shares held by the Group. A reconciliation is presented to show the total number of ordinary shares held by the Group which reduces the number of total shares traded on‑market.
2020 2019
SHARE CAPITALNUMBER
$MNUMBER
$MM M
1,263,091,936 fully paid ordinary shares (2019: 1,258,690,067)Movement:Balance at start of period 1,258.7 6,033 1,313.3 6,201 Share buy-back – – (58.7) (282)Issue of shares to satisfy the dividend reinvestment plan 4.4 164 4.1 114 Balance at end of period 1,263.1 6,197 1,258.7 6,033
SHARES HELD IN TRUST
Movement:Balance at start of period (6.9) (205) (4.9) (146)Issue of shares to satisfy employee long-term incentive plans 4.7 135 0.2 6 Issue of shares to satisfy the dividend reinvestment plan (0.1) (3) (0.2) (5)Purchase of shares by the Woolworths Employee Share Trust (2.8) (102) (2.0) (60)Balance at end of period (5.1) (175) (6.9) (205)
Contributed equity at end of period 1,258.0 6,022 1,251.8 5,828
Share capitalHolders of ordinary shares are entitled to receive dividends as declared and are entitled to one vote per share at shareholders’ meetings. In the event of winding up of the Company, ordinary shareholders rank after creditors and are fully entitled to any proceeds on liquidation.
Share options and performance rightsRefer to Note 6.2 for further details of outstanding options and performance rights. Performance rights carry no rights to dividends and no voting rights.
CAPITAL STRUCTURE, FINANCING, AND RISK MANAGEMENT 4
1
2
3
4
5
PERFORM
AN
CE
HIG
HLIG
HTS
BUSIN
ESS REV
IEWD
IRECTORS'
REPORT
FINA
NC
IAL
REPORT
OTH
ER IN
FORM
ATION
113
WO
OLW
ORTH
S GRO
UP
AN
NU
AL REPO
RT 2020
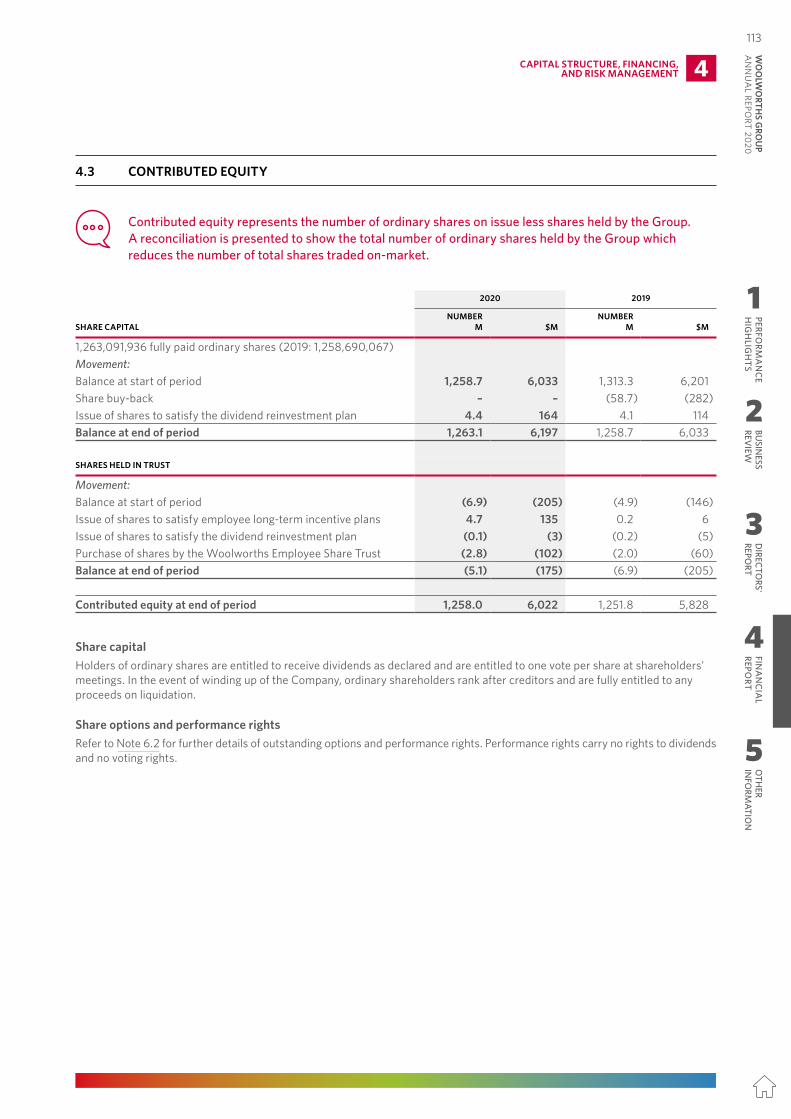
4.2 DIVIDENDS
Dividends are distributions of the Group’s profit after tax before significant items to its shareholders and represent one of the ways the Group distributes returns to its shareholders.
2020 2019
CENTS PER SHARE
TOTAL AMOUNT
DATE OF PAYMENT
CENTS PER SHARE
TOTAL AMOUNT
DATE OF PAYMENT
$M $M
Current year interim 46 580 9 April 2020 45 593 5 April 2019Prior year final 57 717 30 September 2019 50 657 12 October 2018Prior year special – – – 10 131 12 October 2018Dividends paid during the period 103 1,297 105 1,381Issue of shares to satisfy the dividend reinvestment plan (164) (114)Dividends paid in cash 1,133 1,267
All dividends are fully franked at a 30% tax rate.
On 27 August 2020, the Board of Directors declared a final dividend in respect of the 2020 financial period of 48 cents per share, fully franked at a 30% tax rate. The amount will be paid on or around 6 October 2020 and is expected to be $606 million. As the dividend was declared subsequent to 28 June 2020, no provision had been made as at 28 June 2020.
Dividend Reinvestment Plan (DRP)The DRP remains active. Eligible shareholders may participate in the DRP in respect of all or part of their shareholding. There is currently no DRP discount applied and no limit on the number of shares that can participate in the DRP.
Shares will be allocated to shareholders under the DRP for the 2020 final dividend at an amount equal to the average of the daily volume weighted average market price of ordinary shares of the Company traded on the ASX over the period of 10 trading days commencing on 4 September 2020. The last date for receipt of election notices for the DRP is 3 September 2020. The Company intends to issue new shares to satisfy its obligations under the DRP.
During the period, 12.6% (2019: 13.4% 1 ) of the dividends paid were reinvested in shares of the Company.
1 Includes $73 million shares purchased on-market and transferred to participating shareholders to satisfy the DRP in respect of the 2019 interim dividend.
Franking credit balance
2020 $M
2019 $M
Franking credits available for future financial periods (tax paid basis, 30% tax rate) 2,017 1,953
The above amount represents the balance of the franking accounts at the end of the period, adjusted for:• Franking credits that will arise from the payment of income tax payable at the end of the period; and• Franking debits that will arise from the payment of dividends provided at the end of the period.
The above franking credit balance excludes $97 million (2019: $145 million) attributable to non-controlling interests.
Notes to the Consolidated Financial Statements
112
4.3 CONTRIBUTED EQUITY
Contributed equity represents the number of ordinary shares on issue less shares held by the Group. A reconciliation is presented to show the total number of ordinary shares held by the Group which reduces the number of total shares traded on‑market.
2020 2019
SHARE CAPITALNUMBER
$MNUMBER
$MM M
1,263,091,936 fully paid ordinary shares (2019: 1,258,690,067)Movement:Balance at start of period 1,258.7 6,033 1,313.3 6,201 Share buy-back – – (58.7) (282)Issue of shares to satisfy the dividend reinvestment plan 4.4 164 4.1 114 Balance at end of period 1,263.1 6,197 1,258.7 6,033
SHARES HELD IN TRUST
Movement:Balance at start of period (6.9) (205) (4.9) (146)Issue of shares to satisfy employee long-term incentive plans 4.7 135 0.2 6 Issue of shares to satisfy the dividend reinvestment plan (0.1) (3) (0.2) (5)Purchase of shares by the Woolworths Employee Share Trust (2.8) (102) (2.0) (60)Balance at end of period (5.1) (175) (6.9) (205)
Contributed equity at end of period 1,258.0 6,022 1,251.8 5,828
Share capitalHolders of ordinary shares are entitled to receive dividends as declared and are entitled to one vote per share at shareholders’ meetings. In the event of winding up of the Company, ordinary shareholders rank after creditors and are fully entitled to any proceeds on liquidation.
Share options and performance rightsRefer to Note 6.2 for further details of outstanding options and performance rights. Performance rights carry no rights to dividends and no voting rights.
CAPITAL STRUCTURE, FINANCING, AND RISK MANAGEMENT 4
1
2
3
4
5
PERFORM
AN
CE
HIG
HLIG
HTS
BUSIN
ESS REV
IEWD
IRECTORS'
REPORT
FINA
NC
IAL
REPORT
OTH
ER IN
FORM
ATION
113W
OO
LWO
RTHS G
ROU
P A
NN
UA
L REPORT 2020
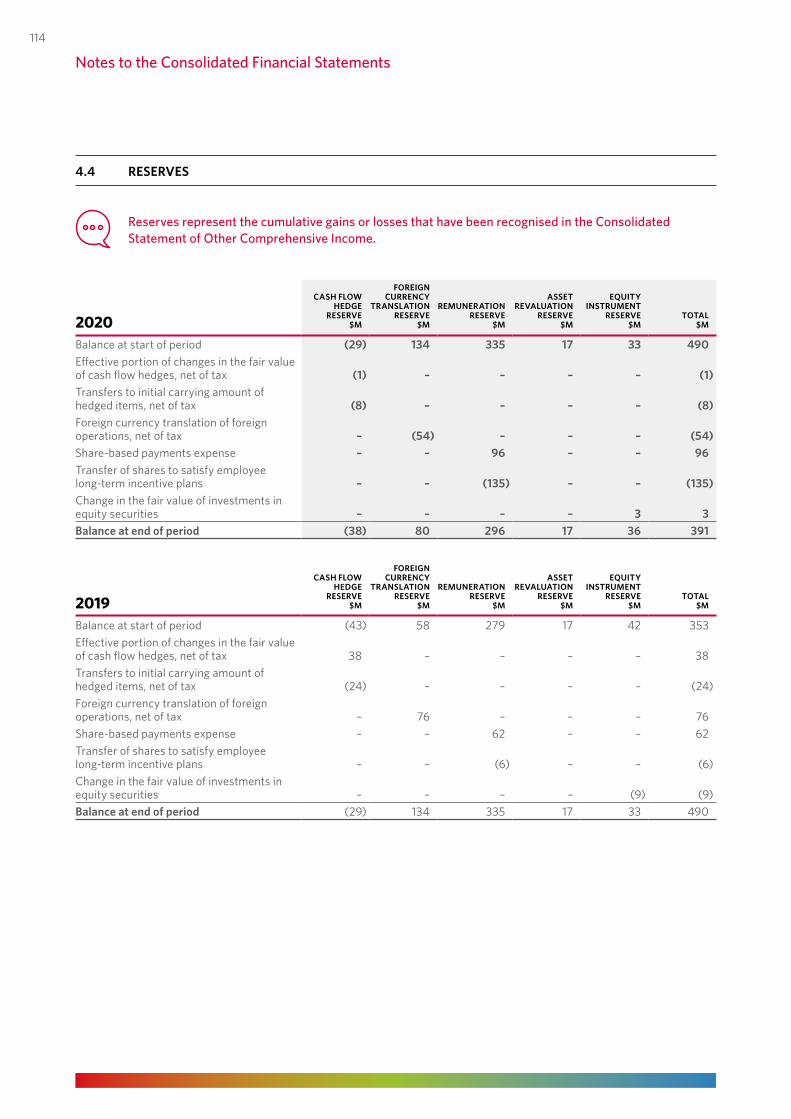
4.4 RESERVES
Reserves represent the cumulative gains or losses that have been recognised in the Consolidated Statement of Other Comprehensive Income.
2020
CASH FLOW HEDGE
RESERVE $M
FOREIGN CURRENCY
TRANSLATION RESERVE
$M
REMUNERATION RESERVE
$M
ASSET REVALUATION
RESERVE $M
EQUITY INSTRUMENT
RESERVE $M
TOTAL $M
Balance at start of period (29) 134 335 17 33 490 Effective portion of changes in the fair value of cash flow hedges, net of tax (1) – – – – (1)Transfers to initial carrying amount of hedged items, net of tax (8) – – – – (8) Foreign currency translation of foreign operations, net of tax – (54) – – – (54)Share-based payments expense – – 96 – – 96 Transfer of shares to satisfy employee long-term incentive plans – – (135) – – (135)Change in the fair value of investments in equity securities – – – – 3 3 Balance at end of period (38) 80 296 17 36 391
2019
CASH FLOW HEDGE
RESERVE $M
FOREIGN CURRENCY
TRANSLATION RESERVE
$M
REMUNERATION RESERVE
$M
ASSET REVALUATION
RESERVE $M
EQUITY INSTRUMENT
RESERVE $M
TOTAL $M
Balance at start of period (43) 58 279 17 42 353 Effective portion of changes in the fair value of cash flow hedges, net of tax 38 – – – – 38 Transfers to initial carrying amount of hedged items, net of tax (24) – – – – (24)Foreign currency translation of foreign operations, net of tax – 76 – – – 76 Share-based payments expense – – 62 – – 62 Transfer of shares to satisfy employee long-term incentive plans – – (6) – – (6)Change in the fair value of investments in equity securities – – – – (9) (9)Balance at end of period (29) 134 335 17 33 490
Notes to the Consolidated Financial Statements
114
SIGNIFICANT ACCOUNTING POLICIES
Cash flow hedge reserveThe cash flow hedge reserve comprises the effective portion of the cumulative net change in the fair value of cash flow hedging instruments related to hedged transactions that have not yet occurred. The cumulative deferred gain or loss on the hedge is recognised in the Consolidated Statement of Profit or Loss when the hedged transaction impacts profit or loss, consistent with the applicable accounting policy. Refer to Note 4.7 for details of hedging.
Foreign currency translation reserve (FCTR)FCTR comprises all foreign exchange differences arising from the translation of the financial statements of foreign operations where their functional currency is different to the Group’s presentation currency. Gains and losses on hedging instruments that are designated as hedging instruments for hedges of net investments in foreign operations are also included in the FCTR. Refer to Note 4.7 for details of hedging.
Remuneration reserveThe employee remuneration reserve comprises the fair value of share-based payment plans recognised as an expense in the Consolidated Statement of Profit or Loss. Refer to Note 6.2 for details of share-based payments. Shares issued by the Woolworths Employee Share Trust are charged against the reserve.
Asset revaluation reserveThe asset revaluation reserve arose on acquisition of the previously equity accounted investment in MGW Hotels Pty Ltd and relates to the change in fair value of the Group’s interest in non-current assets from the date of acquisition of the initial investment to the date control was achieved.
Equity instrument reserveThe equity instrument reserve arises on the revaluation of investments in listed and unlisted equity securities. Subsequent to initial recognition, these investments are measured at fair value with any changes recognised in other comprehensive income.
CAPITAL STRUCTURE, FINANCING, AND RISK MANAGEMENT 4
4.4 RESERVES (CONTINUED)
1
2
3
4
5
PERFORM
AN
CE
HIG
HLIG
HTS
BUSIN
ESS REV
IEWD
IRECTORS'
REPORT
FINA
NC
IAL
REPORT
OTH
ER IN
FORM
ATION
115
WO
OLW
ORTH
S GRO
UP
AN
NU
AL REPO
RT 2020
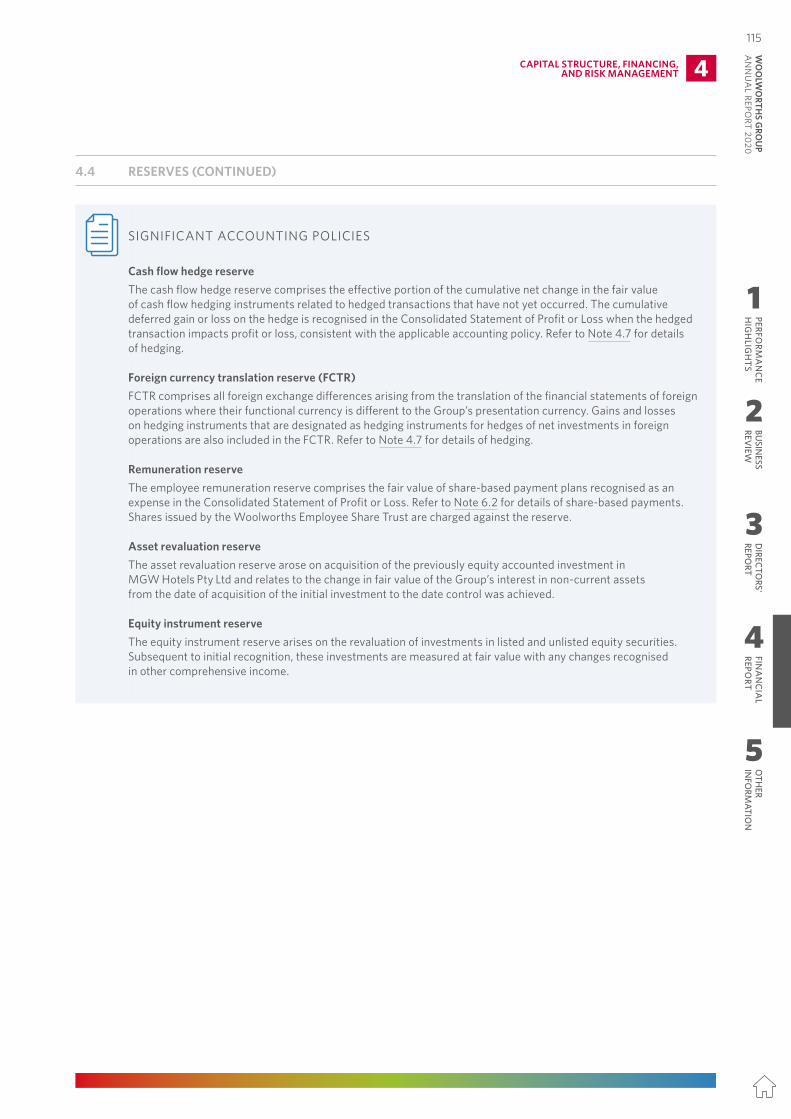
4.4 RESERVES
Reserves represent the cumulative gains or losses that have been recognised in the Consolidated Statement of Other Comprehensive Income.
2020
CASH FLOW HEDGE
RESERVE $M
FOREIGN CURRENCY
TRANSLATION RESERVE
$M
REMUNERATION RESERVE
$M
ASSET REVALUATION
RESERVE $M
EQUITY INSTRUMENT
RESERVE $M
TOTAL $M
Balance at start of period (29) 134 335 17 33 490 Effective portion of changes in the fair value of cash flow hedges, net of tax (1) – – – – (1)Transfers to initial carrying amount of hedged items, net of tax (8) – – – – (8) Foreign currency translation of foreign operations, net of tax – (54) – – – (54)Share-based payments expense – – 96 – – 96 Transfer of shares to satisfy employee long-term incentive plans – – (135) – – (135)Change in the fair value of investments in equity securities – – – – 3 3 Balance at end of period (38) 80 296 17 36 391
2019
CASH FLOW HEDGE
RESERVE $M
FOREIGN CURRENCY
TRANSLATION RESERVE
$M
REMUNERATION RESERVE
$M
ASSET REVALUATION
RESERVE $M
EQUITY INSTRUMENT
RESERVE $M
TOTAL $M
Balance at start of period (43) 58 279 17 42 353 Effective portion of changes in the fair value of cash flow hedges, net of tax 38 – – – – 38 Transfers to initial carrying amount of hedged items, net of tax (24) – – – – (24)Foreign currency translation of foreign operations, net of tax – 76 – – – 76 Share-based payments expense – – 62 – – 62 Transfer of shares to satisfy employee long-term incentive plans – – (6) – – (6)Change in the fair value of investments in equity securities – – – – (9) (9)Balance at end of period (29) 134 335 17 33 490
Notes to the Consolidated Financial Statements
114
SIGNIFICANT ACCOUNTING POLICIES
Cash flow hedge reserveThe cash flow hedge reserve comprises the effective portion of the cumulative net change in the fair value of cash flow hedging instruments related to hedged transactions that have not yet occurred. The cumulative deferred gain or loss on the hedge is recognised in the Consolidated Statement of Profit or Loss when the hedged transaction impacts profit or loss, consistent with the applicable accounting policy. Refer to Note 4.7 for details of hedging.
Foreign currency translation reserve (FCTR)FCTR comprises all foreign exchange differences arising from the translation of the financial statements of foreign operations where their functional currency is different to the Group’s presentation currency. Gains and losses on hedging instruments that are designated as hedging instruments for hedges of net investments in foreign operations are also included in the FCTR. Refer to Note 4.7 for details of hedging.
Remuneration reserveThe employee remuneration reserve comprises the fair value of share-based payment plans recognised as an expense in the Consolidated Statement of Profit or Loss. Refer to Note 6.2 for details of share-based payments. Shares issued by the Woolworths Employee Share Trust are charged against the reserve.
Asset revaluation reserveThe asset revaluation reserve arose on acquisition of the previously equity accounted investment in MGW Hotels Pty Ltd and relates to the change in fair value of the Group’s interest in non-current assets from the date of acquisition of the initial investment to the date control was achieved.
Equity instrument reserveThe equity instrument reserve arises on the revaluation of investments in listed and unlisted equity securities. Subsequent to initial recognition, these investments are measured at fair value with any changes recognised in other comprehensive income.
CAPITAL STRUCTURE, FINANCING, AND RISK MANAGEMENT 4
4.4 RESERVES (CONTINUED)
1
2
3
4
5
PERFORM
AN
CE
HIG
HLIG
HTS
BUSIN
ESS REV
IEWD
IRECTORS'
REPORT
FINA
NC
IAL
REPORT
OTH
ER IN
FORM
ATION
115W
OO
LWO
RTHS G
ROU
P A
NN
UA
L REPORT 2020
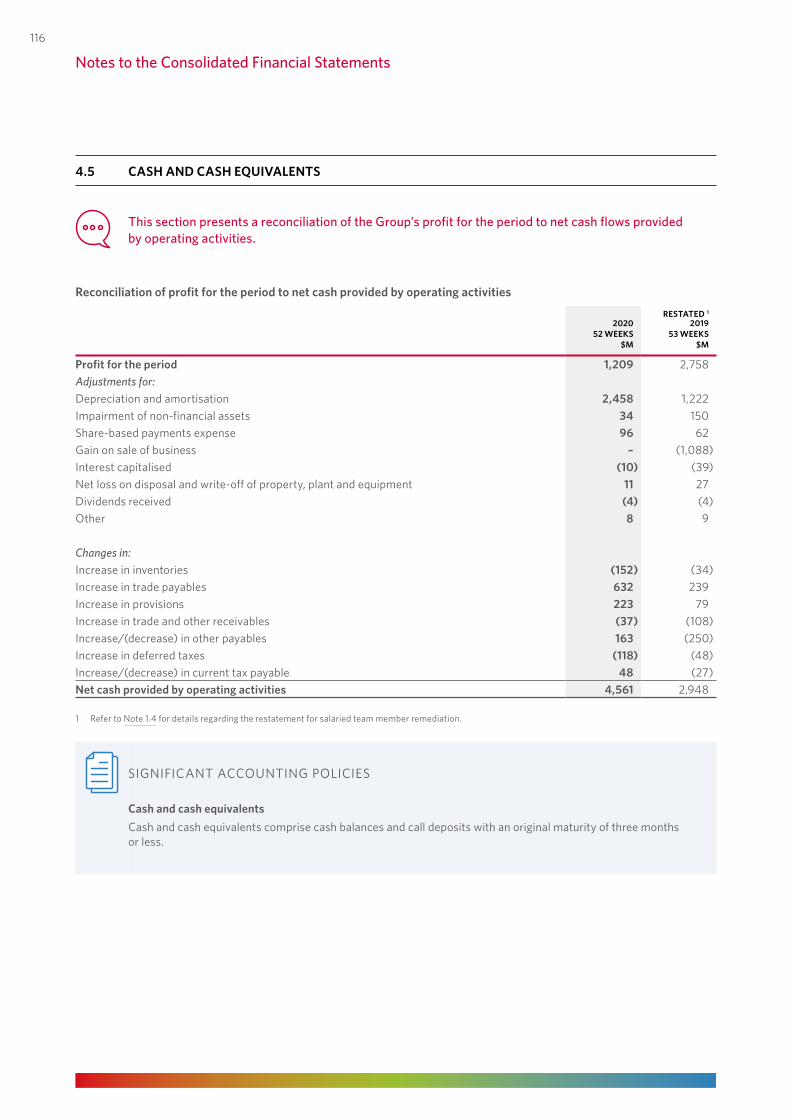
4.5 CASH AND CASH EQUIVALENTS
This section presents a reconciliation of the Group’s profit for the period to net cash flows provided by operating activities.
Reconciliation of profit for the period to net cash provided by operating activities
2020RESTATED 1
201952 WEEKS 53 WEEKS
$M $M
Profit for the period 1,209 2,758Adjustments for:Depreciation and amortisation 2,458 1,222Impairment of non-financial assets 34 150Share-based payments expense 96 62Gain on sale of business – (1,088)Interest capitalised (10) (39)Net loss on disposal and write-off of property, plant and equipment 11 27Dividends received (4) (4)Other 8 9
Changes in:Increase in inventories (152) (34)Increase in trade payables 632 239Increase in provisions 223 79Increase in trade and other receivables (37) (108)Increase/(decrease) in other payables 163 (250)Increase in deferred taxes (118) (48)Increase/(decrease) in current tax payable 48 (27)Net cash provided by operating activities 4,561 2,948
1 Refer to Note 1.4 for details regarding the restatement for salaried team member remediation.
SIGNIFICANT ACCOUNTING POLICIES
Cash and cash equivalentsCash and cash equivalents comprise cash balances and call deposits with an original maturity of three months or less.
Notes to the Consolidated Financial Statements
116
4.6 BORROWINGS
This section provides a summary of the capital management activity of the Group during the period, including the Group’s borrowings. The Group manages its liquidity requirements with a range of short‑term money market loans, bank loans, and flexible debt instruments with varying maturities.
4.6.1 Capital structureThe Group manages its capital structure with the objective of enhancing long-term shareholder value through funding its business at an optimised weighted average cost of capital.
The Group returns capital to shareholders when consistent with its long-term capital structure objectives and where it will enhance shareholder value.
The Group remains committed to solid investment grade credit ratings and a number of actions can be undertaken to support the credit profile, including the sale of non-core assets, further working capital initiatives, and adjusting growth capital expenditure and the property leasing profile. The Group’s credit ratings 1 are BBB (stable outlook) according to S&P and Baa2 (stable outlook) according to Moody’s.
4.6.2 Borrowings
(i) Borrowing transactions during 2020In May 2020, the Group issued $1 billion of domestic Medium Term Notes consisting of a $400 million tranche maturing in May 2025 and a $600 million tranche maturing in May 2030. The Medium Term Notes have been issued to refinance the Group’s upcoming US Senior Notes maturing in September 2020 and European Medium Term Notes maturing in November 2020.
In November 2019, the Group refinanced its $2 billion syndicated bank facilities consisting of two $750 million revolving credit facilities (four-year and five-year tenor) and $500 million term loan (seven-year tenor). These actions continue the Group’s focus on lowering effective interest rates and lengthening the weighted average maturity.
(ii) Upcoming maturitiesIn September 2020, the $654 million US Senior Notes and $65 million bank loans are due to mature. In November 2020 the $229 million European Medium Term Notes are also due to mature. The Group has refinanced all these upcoming maturities with the domestic Medium Term Notes issued in May 2020.
In April 2021, the $424 million US Senior Notes and $76 million bank loans are due to mature. The Group intends to refinance these at maturity.
In November 2020, the Group’s $500 million bank guarantee facility is due to mature. The purpose of this facility is to support the Group’s WorkCover obligations as a ‘self-insurer’, where bank guarantees are issued in favour of Australian WorkCover authorities and is underpinned by the international surety market. The Group intends to refinance this maturity.
1 These credit ratings have been issued by a credit rating agency which holds an Australian Financial Services Licence with an authorisation to issue credit ratings to wholesale clients only and are for the benefit of the Group’s debt providers.
CAPITAL STRUCTURE, FINANCING, AND RISK MANAGEMENT 4
1
2
3
4
5
PERFORM
AN
CE
HIG
HLIG
HTS
BUSIN
ESS REV
IEWD
IRECTORS'
REPORT
FINA
NC
IAL
REPORT
OTH
ER IN
FORM
ATION
117
WO
OLW
ORTH
S GRO
UP
AN
NU
AL REPO
RT 2020
4.5 CASH AND CASH EQUIVALENTS
This section presents a reconciliation of the Group’s profit for the period to net cash flows provided by operating activities.
Reconciliation of profit for the period to net cash provided by operating activities
2020RESTATED 1
201952 WEEKS 53 WEEKS
$M $M
Profit for the period 1,209 2,758Adjustments for:Depreciation and amortisation 2,458 1,222Impairment of non-financial assets 34 150Share-based payments expense 96 62Gain on sale of business – (1,088)Interest capitalised (10) (39)Net loss on disposal and write-off of property, plant and equipment 11 27Dividends received (4) (4)Other 8 9
Changes in:Increase in inventories (152) (34)Increase in trade payables 632 239Increase in provisions 223 79Increase in trade and other receivables (37) (108)Increase/(decrease) in other payables 163 (250)Increase in deferred taxes (118) (48)Increase/(decrease) in current tax payable 48 (27)Net cash provided by operating activities 4,561 2,948
1 Refer to Note 1.4 for details regarding the restatement for salaried team member remediation.
SIGNIFICANT ACCOUNTING POLICIES
Cash and cash equivalentsCash and cash equivalents comprise cash balances and call deposits with an original maturity of three months or less.
Notes to the Consolidated Financial Statements
116
4.6 BORROWINGS
This section provides a summary of the capital management activity of the Group during the period, including the Group’s borrowings. The Group manages its liquidity requirements with a range of short‑term money market loans, bank loans, and flexible debt instruments with varying maturities.
4.6.1 Capital structureThe Group manages its capital structure with the objective of enhancing long-term shareholder value through funding its business at an optimised weighted average cost of capital.
The Group returns capital to shareholders when consistent with its long-term capital structure objectives and where it will enhance shareholder value.
The Group remains committed to solid investment grade credit ratings and a number of actions can be undertaken to support the credit profile, including the sale of non-core assets, further working capital initiatives, and adjusting growth capital expenditure and the property leasing profile. The Group’s credit ratings 1 are BBB (stable outlook) according to S&P and Baa2 (stable outlook) according to Moody’s.
4.6.2 Borrowings
(i) Borrowing transactions during 2020In May 2020, the Group issued $1 billion of domestic Medium Term Notes consisting of a $400 million tranche maturing in May 2025 and a $600 million tranche maturing in May 2030. The Medium Term Notes have been issued to refinance the Group’s upcoming US Senior Notes maturing in September 2020 and European Medium Term Notes maturing in November 2020.
In November 2019, the Group refinanced its $2 billion syndicated bank facilities consisting of two $750 million revolving credit facilities (four-year and five-year tenor) and $500 million term loan (seven-year tenor). These actions continue the Group’s focus on lowering effective interest rates and lengthening the weighted average maturity.
(ii) Upcoming maturitiesIn September 2020, the $654 million US Senior Notes and $65 million bank loans are due to mature. In November 2020 the $229 million European Medium Term Notes are also due to mature. The Group has refinanced all these upcoming maturities with the domestic Medium Term Notes issued in May 2020.
In April 2021, the $424 million US Senior Notes and $76 million bank loans are due to mature. The Group intends to refinance these at maturity.
In November 2020, the Group’s $500 million bank guarantee facility is due to mature. The purpose of this facility is to support the Group’s WorkCover obligations as a ‘self-insurer’, where bank guarantees are issued in favour of Australian WorkCover authorities and is underpinned by the international surety market. The Group intends to refinance this maturity.
1 These credit ratings have been issued by a credit rating agency which holds an Australian Financial Services Licence with an authorisation to issue credit ratings to wholesale clients only and are for the benefit of the Group’s debt providers.
CAPITAL STRUCTURE, FINANCING, AND RISK MANAGEMENT 4
1
2
3
4
5
PERFORM
AN
CE
HIG
HLIG
HTS
BUSIN
ESS REV
IEWD
IRECTORS'
REPORT
FINA
NC
IAL
REPORT
OTH
ER IN
FORM
ATION
117W
OO
LWO
RTHS G
ROU
P A
NN
UA
L REPORT 2020
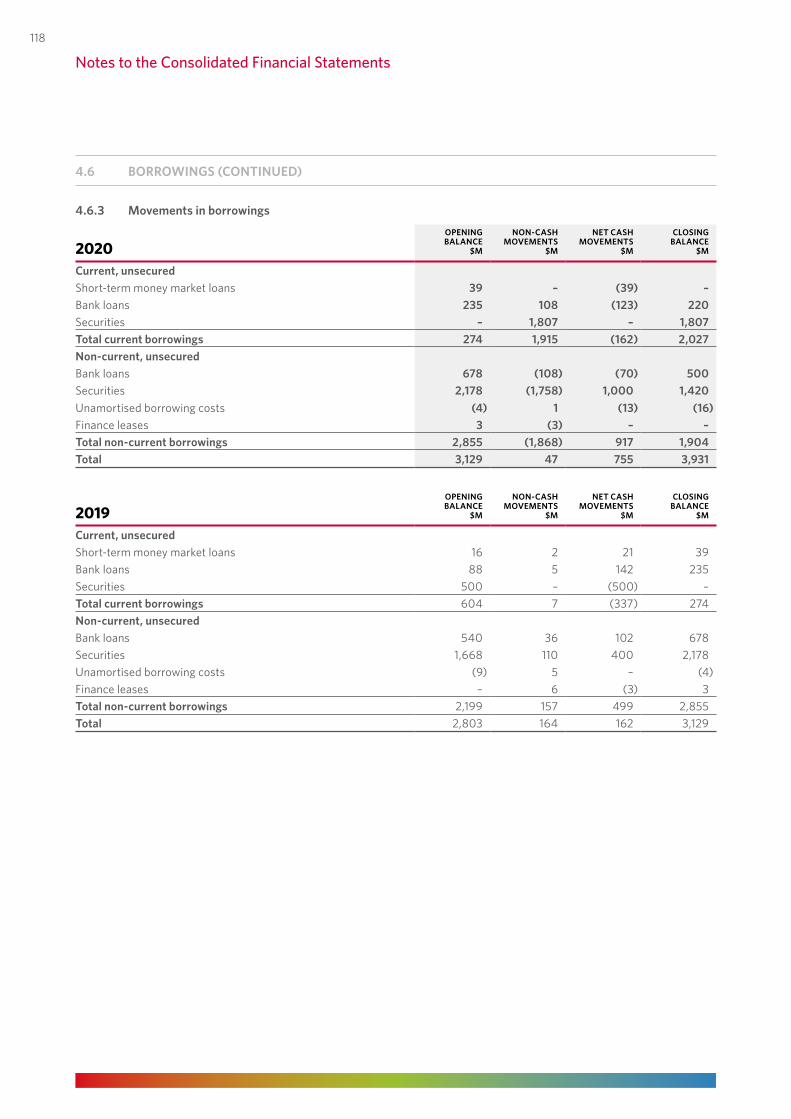
4.6.3 Movements in borrowings
2020OPENING BALANCE
$M
NON‑CASH MOVEMENTS
$M
NET CASH MOVEMENTS
$M
CLOSING BALANCE
$M
Current, unsecuredShort-term money market loans 39 – (39) –Bank loans 235 108 (123) 220Securities – 1,807 – 1,807Total current borrowings 274 1,915 (162) 2,027Non‑current, unsecuredBank loans 678 (108) (70) 500Securities 2,178 (1,758) 1,000 1,420Unamortised borrowing costs (4) 1 (13) (16)Finance leases 3 (3) – –Total non‑current borrowings 2,855 (1,868) 917 1,904Total 3,129 47 755 3,931
2019OPENING BALANCE
$M
NON‑CASH MOVEMENTS
$M
NET CASH MOVEMENTS
$M
CLOSING BALANCE
$M
Current, unsecuredShort-term money market loans 16 2 21 39Bank loans 88 5 142 235Securities 500 – (500) –Total current borrowings 604 7 (337) 274Non‑current, unsecuredBank loans 540 36 102 678Securities 1,668 110 400 2,178Unamortised borrowing costs (9) 5 – (4)Finance leases – 6 (3) 3Total non‑current borrowings 2,199 157 499 2,855Total 2,803 164 162 3,129
Notes to the Consolidated Financial Statements
4.6 BORROWINGS (CONTINUED)
118
4.6.4 Composition of debt
CURRENCY (IF NOT AUD)
NOTIONAL VALUE CARRYING VALUE
MATURITY2020 2019 2020 2019
$M $M $M $M
Short‑term money market loansShort-term loan, at call 1 NZD At call – 39 – 39
– 39 – 39 Bank loans (current)Committed Revolving Credit Facility 1 CNY, USD Feb-21 79 56 79 58 Committed Revolving Credit Facility 1 NZD Oct-20 – 177 – 177 Bank loans 2 Sep-20 65 – 65 –Bank loans 2 Apr-21 76 – 76 –
220 233 220 235Securities (current)US Senior Notes (US 144A) USD Sep-20 654 – 898 –US Senior Notes (US 144A) USD Apr-21 424 – 637 –European Medium Term Notes JPY Nov-20 229 – 272 –
1,307 – 1,807 –Bank loans (non‑current)Syndicated Bank Loan USD Oct-21 – 355 – 370 Syndicated Bank Loan USD Nov-20 – 184 – 200 Bank Loans Sep-20 – 44 – 44Bank Loans Apr-21 – 64 – 64Syndicated Bank Loan Nov-26 500 – 500 –
500 647 500 678Securities (non‑current)US Senior Notes (US 144A) USD Sep-20 – 654 – 879US Senior Notes (US 144A) USD Apr-21 – 424 – 625European Medium Term Notes JPY Nov-20 – 229 – 265 Medium Term Notes (Green Bonds) 3 Apr-24 400 400 420 409 Domestic Notes May-25 400 – 400 –Domestic Notes May-30 600 – 600 –
1,400 1,707 1,420 2,178
1 Drawn by a subsidiary outside the Woolworths Group Limited Deed of Cross Guarantee.2 In May 2019, the Group entered into a series of cross currency swaps with a bank counterparty to bring forward and realise the positive fair value from
existing cross currency swaps hedging the US Senior Notes. 3 The Medium Term Notes (Green Bonds) are the hedged item in a fair value hedge relationship and are subject to changes in the carrying amount due to fair
value adjustments.
SIGNIFICANT ACCOUNTING POLICIES
BorrowingsBorrowings are recognised initially at fair value less attributable transaction costs. Subsequently, borrowings are stated at amortised cost. Any difference between cost and redemption value is recognised in the Consolidated Statement of Profit or Loss over the period of the borrowings.
CAPITAL STRUCTURE, FINANCING, AND RISK MANAGEMENT 4
4.6 BORROWINGS (CONTINUED)
1
2
3
4
5
PERFORM
AN
CE
HIG
HLIG
HTS
BUSIN
ESS REV
IEWD
IRECTORS'
REPORT
FINA
NC
IAL
REPORT
OTH
ER IN
FORM
ATION
119
WO
OLW
ORTH
S GRO
UP
AN
NU
AL REPO
RT 2020
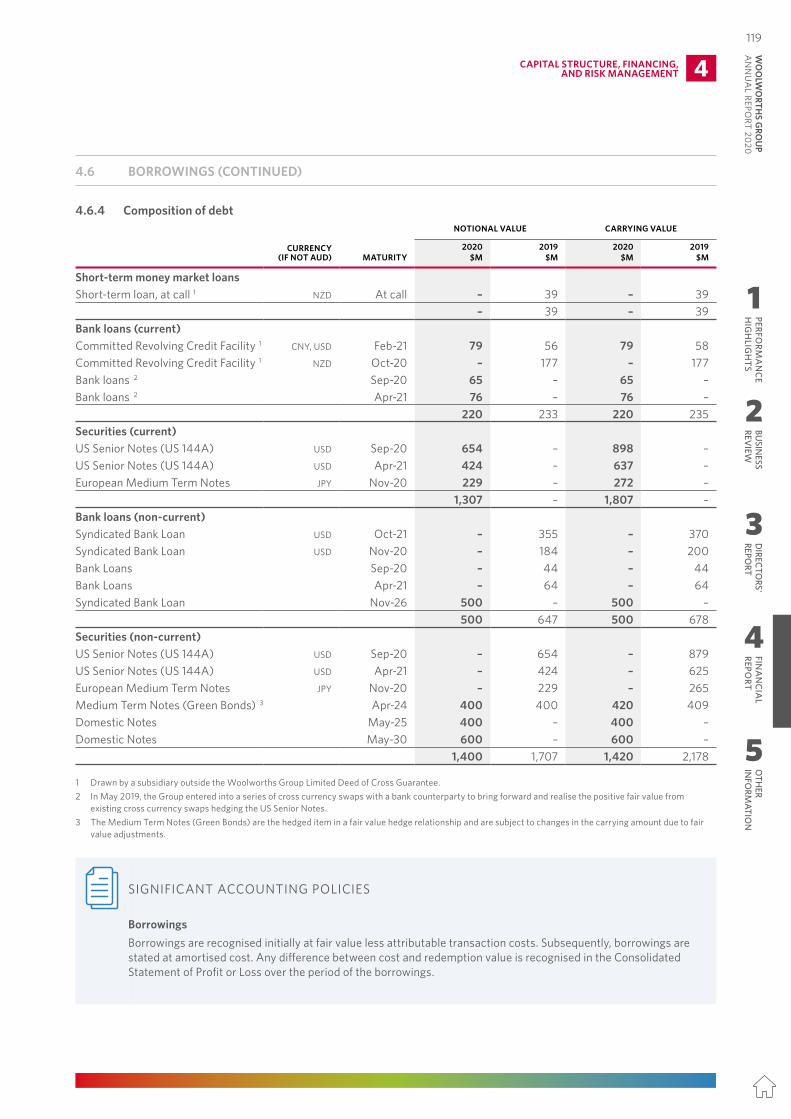
4.6.3 Movements in borrowings
2020OPENING BALANCE
$M
NON‑CASH MOVEMENTS
$M
NET CASH MOVEMENTS
$M
CLOSING BALANCE
$M
Current, unsecuredShort-term money market loans 39 – (39) –Bank loans 235 108 (123) 220Securities – 1,807 – 1,807Total current borrowings 274 1,915 (162) 2,027Non‑current, unsecuredBank loans 678 (108) (70) 500Securities 2,178 (1,758) 1,000 1,420Unamortised borrowing costs (4) 1 (13) (16)Finance leases 3 (3) – –Total non‑current borrowings 2,855 (1,868) 917 1,904Total 3,129 47 755 3,931
2019OPENING BALANCE
$M
NON‑CASH MOVEMENTS
$M
NET CASH MOVEMENTS
$M
CLOSING BALANCE
$M
Current, unsecuredShort-term money market loans 16 2 21 39Bank loans 88 5 142 235Securities 500 – (500) –Total current borrowings 604 7 (337) 274Non‑current, unsecuredBank loans 540 36 102 678Securities 1,668 110 400 2,178Unamortised borrowing costs (9) 5 – (4)Finance leases – 6 (3) 3Total non‑current borrowings 2,199 157 499 2,855Total 2,803 164 162 3,129
Notes to the Consolidated Financial Statements
4.6 BORROWINGS (CONTINUED)
118
4.6.4 Composition of debt
CURRENCY (IF NOT AUD)
NOTIONAL VALUE CARRYING VALUE
MATURITY2020 2019 2020 2019
$M $M $M $M
Short‑term money market loansShort-term loan, at call 1 NZD At call – 39 – 39
– 39 – 39 Bank loans (current)Committed Revolving Credit Facility 1 CNY, USD Feb-21 79 56 79 58 Committed Revolving Credit Facility 1 NZD Oct-20 – 177 – 177 Bank loans 2 Sep-20 65 – 65 –Bank loans 2 Apr-21 76 – 76 –
220 233 220 235Securities (current)US Senior Notes (US 144A) USD Sep-20 654 – 898 –US Senior Notes (US 144A) USD Apr-21 424 – 637 –European Medium Term Notes JPY Nov-20 229 – 272 –
1,307 – 1,807 –Bank loans (non‑current)Syndicated Bank Loan USD Oct-21 – 355 – 370 Syndicated Bank Loan USD Nov-20 – 184 – 200 Bank Loans Sep-20 – 44 – 44Bank Loans Apr-21 – 64 – 64Syndicated Bank Loan Nov-26 500 – 500 –
500 647 500 678Securities (non‑current)US Senior Notes (US 144A) USD Sep-20 – 654 – 879US Senior Notes (US 144A) USD Apr-21 – 424 – 625European Medium Term Notes JPY Nov-20 – 229 – 265 Medium Term Notes (Green Bonds) 3 Apr-24 400 400 420 409 Domestic Notes May-25 400 – 400 –Domestic Notes May-30 600 – 600 –
1,400 1,707 1,420 2,178
1 Drawn by a subsidiary outside the Woolworths Group Limited Deed of Cross Guarantee.2 In May 2019, the Group entered into a series of cross currency swaps with a bank counterparty to bring forward and realise the positive fair value from
existing cross currency swaps hedging the US Senior Notes. 3 The Medium Term Notes (Green Bonds) are the hedged item in a fair value hedge relationship and are subject to changes in the carrying amount due to fair
value adjustments.
SIGNIFICANT ACCOUNTING POLICIES
BorrowingsBorrowings are recognised initially at fair value less attributable transaction costs. Subsequently, borrowings are stated at amortised cost. Any difference between cost and redemption value is recognised in the Consolidated Statement of Profit or Loss over the period of the borrowings.
CAPITAL STRUCTURE, FINANCING, AND RISK MANAGEMENT 4
4.6 BORROWINGS (CONTINUED)
1
2
3
4
5
PERFORM
AN
CE
HIG
HLIG
HTS
BUSIN
ESS REV
IEWD
IRECTORS'
REPORT
FINA
NC
IAL
REPORT
OTH
ER IN
FORM
ATION
119W
OO
LWO
RTHS G
ROU
P A
NN
UA
L REPORT 2020
This section provides a summary of the Group’s exposure to market, liquidity, and credit risks, along with the Group’s policies and strategies in place to mitigate these risks.
The Group’s Treasury function is responsible for managing its liquidity, funding, and capital requirements, and identifying and managing financial risks relating to the Group’s operations. These financial risks include:• Market risk (refer to Note 4.7.1);• Liquidity risk (refer to Note 4.7.2); and• Credit risk (refer to Note 4.7.3).
These risks affect the fair value measurements applied by the Group, which are detailed in Note 4.7.4.
The Group adheres to a treasury policy approved by the Board of Directors, which set written principles on liquidity risk, interest rate risk, foreign exchange risk, credit risk, and the use of derivatives for hedging purposes. The Treasury function reports on its compliance with the policy to the Board of Directors and such compliance is reviewed periodically by the Group’s internal auditors.
The Group holds various types of derivatives to hedge its exposures to variability in interest rates and foreign exchange rates.
The Group does not enter into or trade financial instruments, including derivatives, for speculative purposes.
4.7.1 Market risk
(i) Interest rate riskInterest rate risk is the risk that a change in interest rates may negatively impact the Group’s cash flow or profitability because the Group’s borrowings reset directly in accordance with interest rate benchmarks or reset regularly to current rates influenced by interest rate benchmarks. The risk is managed by maintaining an appropriate mix between floating and fixed rate borrowings and through the use of approved derivatives to hedge the risk.
(ii) Foreign exchange riskForeign exchange risk is the risk that a change in foreign exchange rates may negatively impact the Group's cash flow or profitability because the Group has an exposure to a foreign currency or has foreign currency denominated obligations. To hedge against the majority of this exposure, the Group uses approved derivatives to hedge up to 100% of the risk. The exposure to purchases of inventory in foreign currencies is primarily managed through forward exchange contracts and foreign currency options. These have been designated as cash flow hedges and the Group has established a 100% hedge relationship against the identified exposure.
To hedge the risk of adverse movements in foreign exchange rates in relation to borrowings denominated in foreign currency, the Group enters into cross currency swaps under which it agrees to exchange specified principal and interest foreign currency amounts at an agreed future date at a specified exchange rate. All foreign currency term borrowings are 100% hedged in this way.
Foreign currency exposures arising on translation of net investments in foreign subsidiaries are predominantly unhedged.
Notes to the Consolidated Financial Statements
4.7 FINANCIAL RISK MANAGEMENT
120
4.7.1 Market risk (continued)
(iii) Hedging arrangementsAt the reporting date, the fair value and notional amounts of derivatives entered into for hedging purposes for the Group are:
NOTIONAL VALUE FAIR VALUE ASSET FAIR VALUE LIABILITY
2020 2019 2020 2019 2020 2019$M $M $M $M $M $M
Cash flow hedgesForward exchange contracts 1,523 590 7 15 (53) –Foreign currency options 74 338 2 2 – –Cross currency swaps
Syndicated Bank Loan – 355 – 14 – –Syndicated Bank Loan – 184 – 15 – –US Senior Notes (US144A) 654 654 248 232 – –US Senior Notes (US144A) 424 424 229 219 – –European Medium Term Notes 229 229 42 40 – (4)
519 520 – (4)Interest rate swaps
US Senior Notes (US144A) 654 654 – – (9) (36)US Senior Notes (US144A) 424 424 – – (20) (37)European Medium Term Notes 229 229 – – (2) (5)
Fair value hedges (31) (78)Interest rate swaps
Medium Term Notes (Green Bonds) 400 400 20 9 – –20 9 – –
Total 548 546 (84) (82)
Forward exchange contracts and foreign currency optionsAt the reporting date, the net amount of unrealised losses under forward exchange contracts and foreign currency options hedging anticipated purchases of inventory and equipment is $44 million (2019: $17 million unrealised gain). These fair value calculations include an option premium paid of nil (2019: $2 million).
The hedge relationships are all assessed as highly effective with insignificant hedge ineffectiveness and the loss of $44 million has been recognised in the hedge reserve (2019: $15 million gain).
The weighted average exchange rates hedged by outstanding forward exchange contracts and foreign currency options are: AUD/USD 0.67 (2019: 0.72) and AUD/EUR 0.60 (2019: 0.62).
Cross currency swapsAt the reporting date, cross currency swaps have a net unrealised gain of $519 million (2019: $516 million unrealised gain), of which $500 million is attributable to an unrealised gain on the foreign exchange component (2019: $494 million unrealised gain) and $19 million is attributable to an unrealised gain on the interest rate component (2019: $22 million unrealised gain).
The interest rate component of the cross currency swaps are designated as cash flow hedges, in a 100% hedge relationship with the underlying debt. Accordingly, the unrealised gain of $19 million attributable to the interest rate component has been recognised in the cash flow hedge reserve (2019: $22 million unrealised gain) at the reporting date, with insignificant hedge ineffectiveness.
The movement in the unrealised gain attributable to the foreign exchange component of $6 million (2019: $131 million unrealised gain) has been recognised in the Consolidated Statement of Profit or Loss during the period completely offsetting the foreign exchange revaluation of the underlying debt.
The weighted average exchange rates hedged by outstanding cross currency swaps are AUD/USD: 0.98 (2019: 0.90) and AUD/JPY: 87.51 (2019: 87.51), and the weighted average interest rate hedged is BBSW + 1.90% (2019: BBSW + 1.94%).
CAPITAL STRUCTURE, FINANCING, AND RISK MANAGEMENT 4
4.7 FINANCIAL RISK MANAGEMENT (CONTINUED)
1
2
3
4
5
PERFORM
AN
CE
HIG
HLIG
HTS
BUSIN
ESS REV
IEWD
IRECTORS'
REPORT
FINA
NC
IAL
REPORT
OTH
ER IN
FORM
ATION
121
WO
OLW
ORTH
S GRO
UP
AN
NU
AL REPO
RT 2020
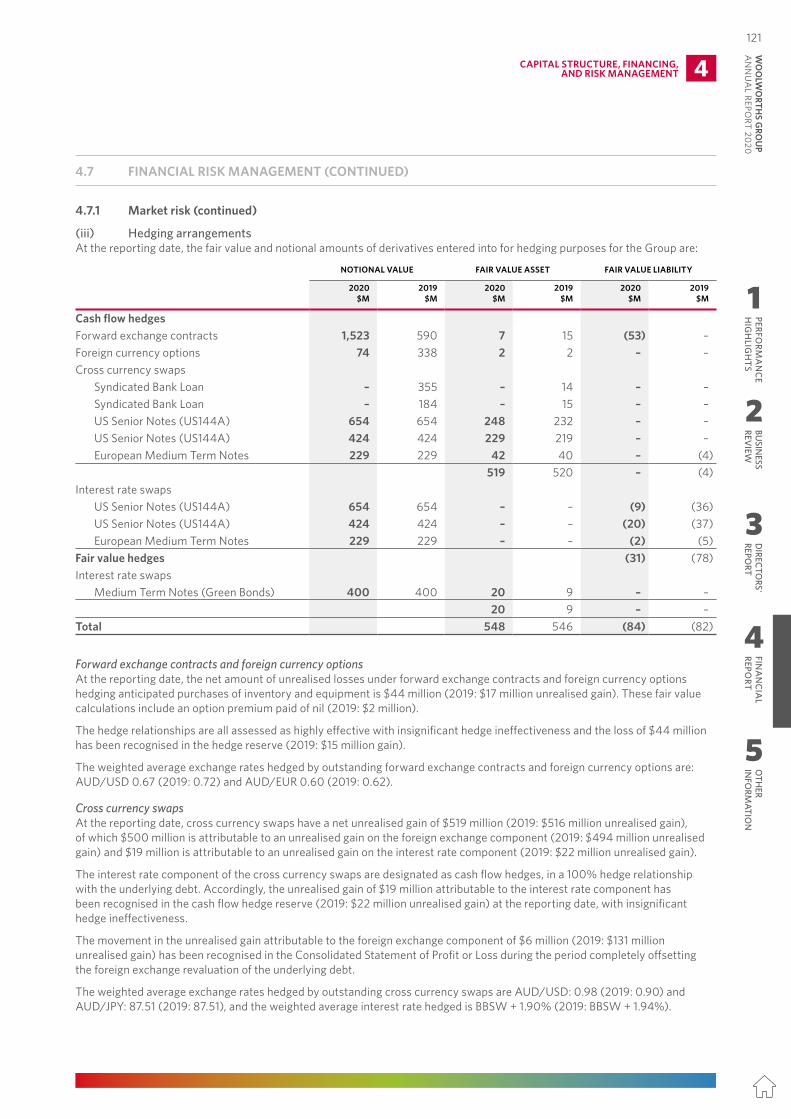
This section provides a summary of the Group’s exposure to market, liquidity, and credit risks, along with the Group’s policies and strategies in place to mitigate these risks.
The Group’s Treasury function is responsible for managing its liquidity, funding, and capital requirements, and identifying and managing financial risks relating to the Group’s operations. These financial risks include:• Market risk (refer to Note 4.7.1);• Liquidity risk (refer to Note 4.7.2); and• Credit risk (refer to Note 4.7.3).
These risks affect the fair value measurements applied by the Group, which are detailed in Note 4.7.4.
The Group adheres to a treasury policy approved by the Board of Directors, which set written principles on liquidity risk, interest rate risk, foreign exchange risk, credit risk, and the use of derivatives for hedging purposes. The Treasury function reports on its compliance with the policy to the Board of Directors and such compliance is reviewed periodically by the Group’s internal auditors.
The Group holds various types of derivatives to hedge its exposures to variability in interest rates and foreign exchange rates.
The Group does not enter into or trade financial instruments, including derivatives, for speculative purposes.
4.7.1 Market risk
(i) Interest rate riskInterest rate risk is the risk that a change in interest rates may negatively impact the Group’s cash flow or profitability because the Group’s borrowings reset directly in accordance with interest rate benchmarks or reset regularly to current rates influenced by interest rate benchmarks. The risk is managed by maintaining an appropriate mix between floating and fixed rate borrowings and through the use of approved derivatives to hedge the risk.
(ii) Foreign exchange riskForeign exchange risk is the risk that a change in foreign exchange rates may negatively impact the Group's cash flow or profitability because the Group has an exposure to a foreign currency or has foreign currency denominated obligations. To hedge against the majority of this exposure, the Group uses approved derivatives to hedge up to 100% of the risk. The exposure to purchases of inventory in foreign currencies is primarily managed through forward exchange contracts and foreign currency options. These have been designated as cash flow hedges and the Group has established a 100% hedge relationship against the identified exposure.
To hedge the risk of adverse movements in foreign exchange rates in relation to borrowings denominated in foreign currency, the Group enters into cross currency swaps under which it agrees to exchange specified principal and interest foreign currency amounts at an agreed future date at a specified exchange rate. All foreign currency term borrowings are 100% hedged in this way.
Foreign currency exposures arising on translation of net investments in foreign subsidiaries are predominantly unhedged.
Notes to the Consolidated Financial Statements
4.7 FINANCIAL RISK MANAGEMENT
120
4.7.1 Market risk (continued)
(iii) Hedging arrangementsAt the reporting date, the fair value and notional amounts of derivatives entered into for hedging purposes for the Group are:
NOTIONAL VALUE FAIR VALUE ASSET FAIR VALUE LIABILITY
2020 2019 2020 2019 2020 2019$M $M $M $M $M $M
Cash flow hedgesForward exchange contracts 1,523 590 7 15 (53) –Foreign currency options 74 338 2 2 – –Cross currency swaps
Syndicated Bank Loan – 355 – 14 – –Syndicated Bank Loan – 184 – 15 – –US Senior Notes (US144A) 654 654 248 232 – –US Senior Notes (US144A) 424 424 229 219 – –European Medium Term Notes 229 229 42 40 – (4)
519 520 – (4)Interest rate swaps
US Senior Notes (US144A) 654 654 – – (9) (36)US Senior Notes (US144A) 424 424 – – (20) (37)European Medium Term Notes 229 229 – – (2) (5)
Fair value hedges (31) (78)Interest rate swaps
Medium Term Notes (Green Bonds) 400 400 20 9 – –20 9 – –
Total 548 546 (84) (82)
Forward exchange contracts and foreign currency optionsAt the reporting date, the net amount of unrealised losses under forward exchange contracts and foreign currency options hedging anticipated purchases of inventory and equipment is $44 million (2019: $17 million unrealised gain). These fair value calculations include an option premium paid of nil (2019: $2 million).
The hedge relationships are all assessed as highly effective with insignificant hedge ineffectiveness and the loss of $44 million has been recognised in the hedge reserve (2019: $15 million gain).
The weighted average exchange rates hedged by outstanding forward exchange contracts and foreign currency options are: AUD/USD 0.67 (2019: 0.72) and AUD/EUR 0.60 (2019: 0.62).
Cross currency swapsAt the reporting date, cross currency swaps have a net unrealised gain of $519 million (2019: $516 million unrealised gain), of which $500 million is attributable to an unrealised gain on the foreign exchange component (2019: $494 million unrealised gain) and $19 million is attributable to an unrealised gain on the interest rate component (2019: $22 million unrealised gain).
The interest rate component of the cross currency swaps are designated as cash flow hedges, in a 100% hedge relationship with the underlying debt. Accordingly, the unrealised gain of $19 million attributable to the interest rate component has been recognised in the cash flow hedge reserve (2019: $22 million unrealised gain) at the reporting date, with insignificant hedge ineffectiveness.
The movement in the unrealised gain attributable to the foreign exchange component of $6 million (2019: $131 million unrealised gain) has been recognised in the Consolidated Statement of Profit or Loss during the period completely offsetting the foreign exchange revaluation of the underlying debt.
The weighted average exchange rates hedged by outstanding cross currency swaps are AUD/USD: 0.98 (2019: 0.90) and AUD/JPY: 87.51 (2019: 87.51), and the weighted average interest rate hedged is BBSW + 1.90% (2019: BBSW + 1.94%).
CAPITAL STRUCTURE, FINANCING, AND RISK MANAGEMENT 4
4.7 FINANCIAL RISK MANAGEMENT (CONTINUED)
1
2
3
4
5
PERFORM
AN
CE
HIG
HLIG
HTS
BUSIN
ESS REV
IEWD
IRECTORS'
REPORT
FINA
NC
IAL
REPORT
OTH
ER IN
FORM
ATION
121W
OO
LWO
RTHS G
ROU
P A
NN
UA
L REPORT 2020
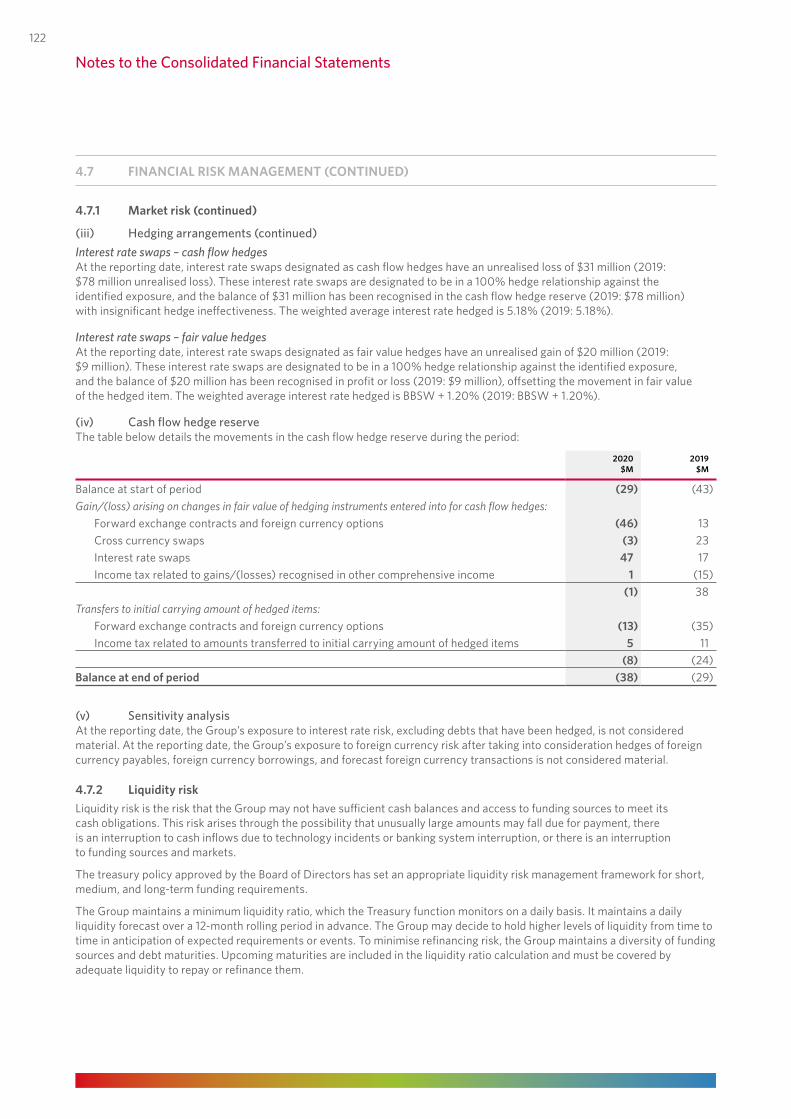
4.7.1 Market risk (continued)
(iii) Hedging arrangements (continued)Interest rate swaps – cash flow hedgesAt the reporting date, interest rate swaps designated as cash flow hedges have an unrealised loss of $31 million (2019: $78 million unrealised loss). These interest rate swaps are designated to be in a 100% hedge relationship against the identified exposure, and the balance of $31 million has been recognised in the cash flow hedge reserve (2019: $78 million) with insignificant hedge ineffectiveness. The weighted average interest rate hedged is 5.18% (2019: 5.18%).
Interest rate swaps – fair value hedgesAt the reporting date, interest rate swaps designated as fair value hedges have an unrealised gain of $20 million (2019: $9 million). These interest rate swaps are designated to be in a 100% hedge relationship against the identified exposure, and the balance of $20 million has been recognised in profit or loss (2019: $9 million), offsetting the movement in fair value of the hedged item. The weighted average interest rate hedged is BBSW + 1.20% (2019: BBSW + 1.20%).
(iv) Cash flow hedge reserveThe table below details the movements in the cash flow hedge reserve during the period:
2020 2019$M $M
Balance at start of period (29) (43)Gain/(loss) arising on changes in fair value of hedging instruments entered into for cash flow hedges:
Forward exchange contracts and foreign currency options (46) 13Cross currency swaps (3) 23Interest rate swaps 47 17Income tax related to gains/(losses) recognised in other comprehensive income 1 (15)
(1) 38Transfers to initial carrying amount of hedged items:
Forward exchange contracts and foreign currency options (13) (35)Income tax related to amounts transferred to initial carrying amount of hedged items 5 11
(8) (24)Balance at end of period (38) (29)
(v) Sensitivity analysisAt the reporting date, the Group’s exposure to interest rate risk, excluding debts that have been hedged, is not considered material. At the reporting date, the Group’s exposure to foreign currency risk after taking into consideration hedges of foreign currency payables, foreign currency borrowings, and forecast foreign currency transactions is not considered material.
4.7.2 Liquidity riskLiquidity risk is the risk that the Group may not have sufficient cash balances and access to funding sources to meet its cash obligations. This risk arises through the possibility that unusually large amounts may fall due for payment, there is an interruption to cash inflows due to technology incidents or banking system interruption, or there is an interruption to funding sources and markets.
The treasury policy approved by the Board of Directors has set an appropriate liquidity risk management framework for short, medium, and long-term funding requirements.
The Group maintains a minimum liquidity ratio, which the Treasury function monitors on a daily basis. It maintains a daily liquidity forecast over a 12-month rolling period in advance. The Group may decide to hold higher levels of liquidity from time to time in anticipation of expected requirements or events. To minimise refinancing risk, the Group maintains a diversity of funding sources and debt maturities. Upcoming maturities are included in the liquidity ratio calculation and must be covered by adequate liquidity to repay or refinance them.
Notes to the Consolidated Financial Statements
4.7 FINANCIAL RISK MANAGEMENT (CONTINUED)
122
4.7.2 Liquidity risk (continued)At the reporting date, the Group has total undrawn committed facilities of $3,031 million (2019: $2,854 million) available. These facilities may be drawn at any time, subject to the terms of the lending agreements. Some facilities are subject to certain financial covenants and undertakings. No covenants have been breached during the period.
The following tables detail the Group’s undiscounted non-derivative liabilities and derivative assets and liabilities and their contractual maturities. The maturity profile of the Group’s undiscounted lease liabilities is included in Note 3.3.2.
MATURITY ANALYSIS OF FINANCIAL LIABILITIES
2020ONE YEAR OR
LESSONE TO TWO
YEARSTWO TO FIVE
YEARSOVER FIVE
YEARS TOTAL$M $M $M $M $M
Non‑derivative liabilitiesBorrowings (floating) (87) (8) (23) (512) (630)Borrowings (fixed) (1,535) (36) (895) (684) (3,150)Trade and other payables 1 (7,258) – – – (7,258)
(8,880) (44) (918) (1,196) (11,038)Derivative assets and liabilitiesNet foreign exchange contracts (46) – – – (46)Cross currency swaps pay floating (1,319) – – – (1,319)Cross currency swaps receive fixed/floating 1,354 – – – 1,354Net pay interest rate swaps 2 (30) 6 12 – (12)
(41) 6 12 – (23)Total (8,921) (38) (906) (1,196) (11,061)
MATURITY ANALYSIS OF FINANCIAL LIABILITIES
2019ONE YEAR OR
LESSONE TO TWO
YEARSTWO TO FIVE
YEARSOVER FIVE
YEARS TOTAL$M $M $M $M $M
Non‑derivative liabilitiesBorrowings (floating) (260) (350) (362) – (972)Borrowings (fixed) (37) (1,507) (434) – (1,978)Trade and other payables 1 (6,461) – – – (6,461)
(6,758) (1,857) (796) – (9,411)Derivative assets and liabilitiesNet foreign exchange contracts 15 – – – 15Cross currency swaps pay floating (61) (1,527) (361) – (1,949)Cross currency swaps receive fixed/floating 90 1,557 362 – 2,009Net pay interest rate swaps 2 (50) (27) 6 – (71)
(6) 3 7 – 4Total (6,764) (1,854) (789) – (9,407)
1 Excludes contract liabilities.2 Interest rate swaps are net settled.
For floating rate instruments, the amount disclosed is determined by reference to the interest rate at the last re-pricing date. Cash flows represented are contractual and calculated on an undiscounted basis, based on current rates at the reporting date.
CAPITAL STRUCTURE, FINANCING, AND RISK MANAGEMENT 4
4.7 FINANCIAL RISK MANAGEMENT (CONTINUED)
1
2
3
4
5
PERFORM
AN
CE
HIG
HLIG
HTS
BUSIN
ESS REV
IEWD
IRECTORS'
REPORT
FINA
NC
IAL
REPORT
OTH
ER IN
FORM
ATION
123
WO
OLW
ORTH
S GRO
UP
AN
NU
AL REPO
RT 2020
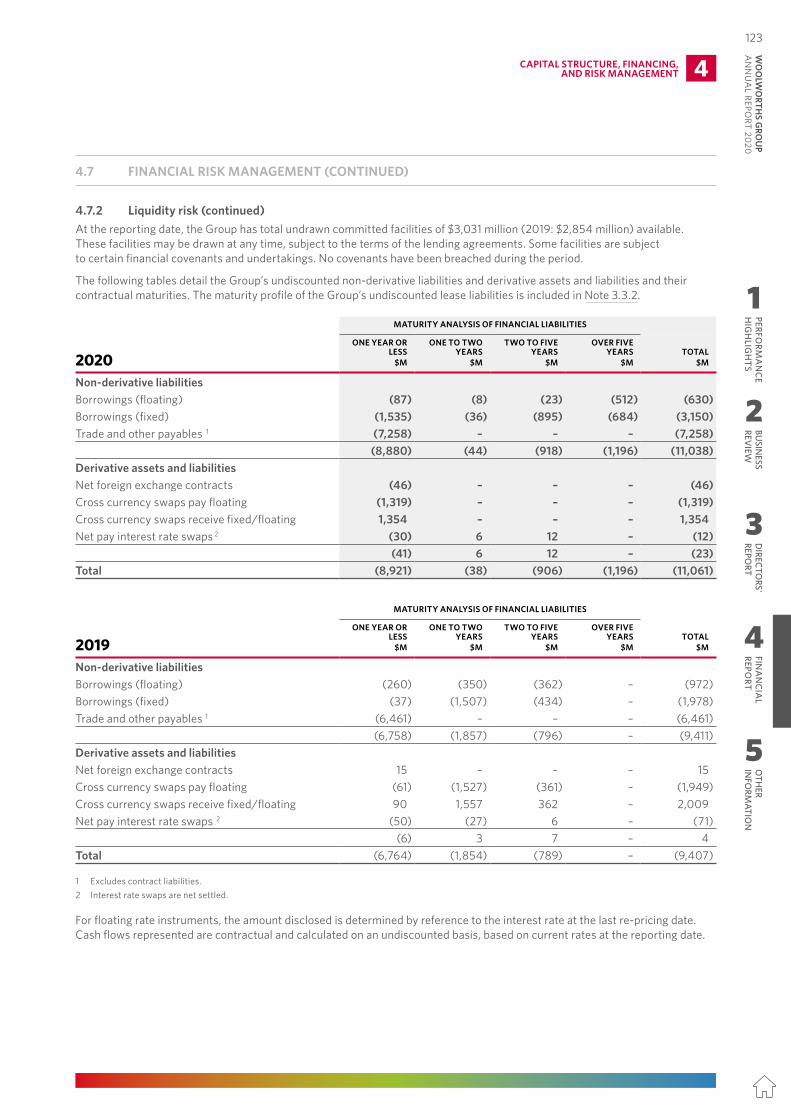
4.7.1 Market risk (continued)
(iii) Hedging arrangements (continued)Interest rate swaps – cash flow hedgesAt the reporting date, interest rate swaps designated as cash flow hedges have an unrealised loss of $31 million (2019: $78 million unrealised loss). These interest rate swaps are designated to be in a 100% hedge relationship against the identified exposure, and the balance of $31 million has been recognised in the cash flow hedge reserve (2019: $78 million) with insignificant hedge ineffectiveness. The weighted average interest rate hedged is 5.18% (2019: 5.18%).
Interest rate swaps – fair value hedgesAt the reporting date, interest rate swaps designated as fair value hedges have an unrealised gain of $20 million (2019: $9 million). These interest rate swaps are designated to be in a 100% hedge relationship against the identified exposure, and the balance of $20 million has been recognised in profit or loss (2019: $9 million), offsetting the movement in fair value of the hedged item. The weighted average interest rate hedged is BBSW + 1.20% (2019: BBSW + 1.20%).
(iv) Cash flow hedge reserveThe table below details the movements in the cash flow hedge reserve during the period:
2020 2019$M $M
Balance at start of period (29) (43)Gain/(loss) arising on changes in fair value of hedging instruments entered into for cash flow hedges:
Forward exchange contracts and foreign currency options (46) 13Cross currency swaps (3) 23Interest rate swaps 47 17Income tax related to gains/(losses) recognised in other comprehensive income 1 (15)
(1) 38Transfers to initial carrying amount of hedged items:
Forward exchange contracts and foreign currency options (13) (35)Income tax related to amounts transferred to initial carrying amount of hedged items 5 11
(8) (24)Balance at end of period (38) (29)
(v) Sensitivity analysisAt the reporting date, the Group’s exposure to interest rate risk, excluding debts that have been hedged, is not considered material. At the reporting date, the Group’s exposure to foreign currency risk after taking into consideration hedges of foreign currency payables, foreign currency borrowings, and forecast foreign currency transactions is not considered material.
4.7.2 Liquidity riskLiquidity risk is the risk that the Group may not have sufficient cash balances and access to funding sources to meet its cash obligations. This risk arises through the possibility that unusually large amounts may fall due for payment, there is an interruption to cash inflows due to technology incidents or banking system interruption, or there is an interruption to funding sources and markets.
The treasury policy approved by the Board of Directors has set an appropriate liquidity risk management framework for short, medium, and long-term funding requirements.
The Group maintains a minimum liquidity ratio, which the Treasury function monitors on a daily basis. It maintains a daily liquidity forecast over a 12-month rolling period in advance. The Group may decide to hold higher levels of liquidity from time to time in anticipation of expected requirements or events. To minimise refinancing risk, the Group maintains a diversity of funding sources and debt maturities. Upcoming maturities are included in the liquidity ratio calculation and must be covered by adequate liquidity to repay or refinance them.
Notes to the Consolidated Financial Statements
4.7 FINANCIAL RISK MANAGEMENT (CONTINUED)
122
4.7.2 Liquidity risk (continued)At the reporting date, the Group has total undrawn committed facilities of $3,031 million (2019: $2,854 million) available. These facilities may be drawn at any time, subject to the terms of the lending agreements. Some facilities are subject to certain financial covenants and undertakings. No covenants have been breached during the period.
The following tables detail the Group’s undiscounted non-derivative liabilities and derivative assets and liabilities and their contractual maturities. The maturity profile of the Group’s undiscounted lease liabilities is included in Note 3.3.2.
MATURITY ANALYSIS OF FINANCIAL LIABILITIES
2020ONE YEAR OR
LESSONE TO TWO
YEARSTWO TO FIVE
YEARSOVER FIVE
YEARS TOTAL$M $M $M $M $M
Non‑derivative liabilitiesBorrowings (floating) (87) (8) (23) (512) (630)Borrowings (fixed) (1,535) (36) (895) (684) (3,150)Trade and other payables 1 (7,258) – – – (7,258)
(8,880) (44) (918) (1,196) (11,038)Derivative assets and liabilitiesNet foreign exchange contracts (46) – – – (46)Cross currency swaps pay floating (1,319) – – – (1,319)Cross currency swaps receive fixed/floating 1,354 – – – 1,354Net pay interest rate swaps 2 (30) 6 12 – (12)
(41) 6 12 – (23)Total (8,921) (38) (906) (1,196) (11,061)
MATURITY ANALYSIS OF FINANCIAL LIABILITIES
2019ONE YEAR OR
LESSONE TO TWO
YEARSTWO TO FIVE
YEARSOVER FIVE
YEARS TOTAL$M $M $M $M $M
Non‑derivative liabilitiesBorrowings (floating) (260) (350) (362) – (972)Borrowings (fixed) (37) (1,507) (434) – (1,978)Trade and other payables 1 (6,461) – – – (6,461)
(6,758) (1,857) (796) – (9,411)Derivative assets and liabilitiesNet foreign exchange contracts 15 – – – 15Cross currency swaps pay floating (61) (1,527) (361) – (1,949)Cross currency swaps receive fixed/floating 90 1,557 362 – 2,009Net pay interest rate swaps 2 (50) (27) 6 – (71)
(6) 3 7 – 4Total (6,764) (1,854) (789) – (9,407)
1 Excludes contract liabilities.2 Interest rate swaps are net settled.
For floating rate instruments, the amount disclosed is determined by reference to the interest rate at the last re-pricing date. Cash flows represented are contractual and calculated on an undiscounted basis, based on current rates at the reporting date.
CAPITAL STRUCTURE, FINANCING, AND RISK MANAGEMENT 4
4.7 FINANCIAL RISK MANAGEMENT (CONTINUED)
1
2
3
4
5
PERFORM
AN
CE
HIG
HLIG
HTS
BUSIN
ESS REV
IEWD
IRECTORS'
REPORT
FINA
NC
IAL
REPORT
OTH
ER IN
FORM
ATION
123W
OO
LWO
RTHS G
ROU
P A
NN
UA
L REPORT 2020
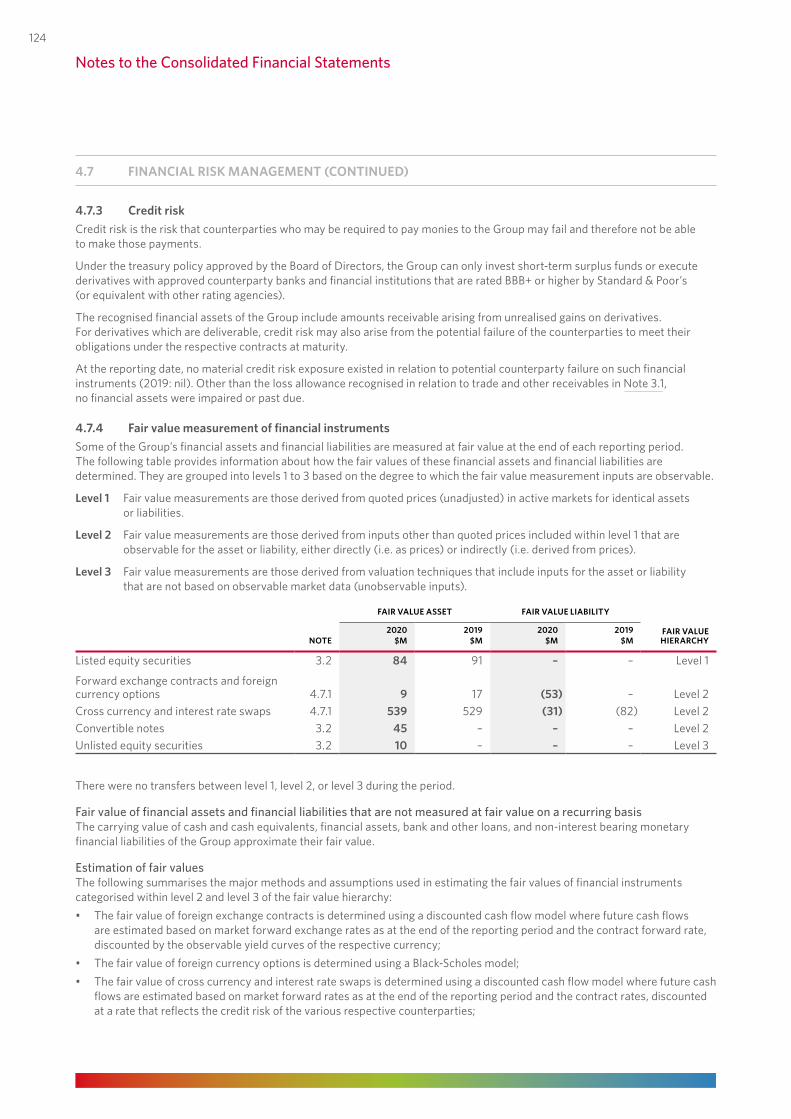
4.7.3 Credit riskCredit risk is the risk that counterparties who may be required to pay monies to the Group may fail and therefore not be able to make those payments.
Under the treasury policy approved by the Board of Directors, the Group can only invest short-term surplus funds or execute derivatives with approved counterparty banks and financial institutions that are rated BBB+ or higher by Standard & Poor’s (or equivalent with other rating agencies).
The recognised financial assets of the Group include amounts receivable arising from unrealised gains on derivatives. For derivatives which are deliverable, credit risk may also arise from the potential failure of the counterparties to meet their obligations under the respective contracts at maturity.
At the reporting date, no material credit risk exposure existed in relation to potential counterparty failure on such financial instruments (2019: nil). Other than the loss allowance recognised in relation to trade and other receivables in Note 3.1, no financial assets were impaired or past due.
4.7.4 Fair value measurement of financial instrumentsSome of the Group’s financial assets and financial liabilities are measured at fair value at the end of each reporting period. The following table provides information about how the fair values of these financial assets and financial liabilities are determined. They are grouped into levels 1 to 3 based on the degree to which the fair value measurement inputs are observable.
Level 1 Fair value measurements are those derived from quoted prices (unadjusted) in active markets for identical assets or liabilities.
Level 2 Fair value measurements are those derived from inputs other than quoted prices included within level 1 that are observable for the asset or liability, either directly (i.e. as prices) or indirectly (i.e. derived from prices).
Level 3 Fair value measurements are those derived from valuation techniques that include inputs for the asset or liability that are not based on observable market data (unobservable inputs).
FAIR VALUE ASSET FAIR VALUE LIABILITY
NOTE2020 2019 2020 2019 FAIR VALUE
HIERARCHY$M $M $M $M
Listed equity securities 3.2 84 91 – – Level 1
Forward exchange contracts and foreign currency options 4.7.1 9 17 (53) – Level 2Cross currency and interest rate swaps 4.7.1 539 529 (31) (82) Level 2Convertible notes 3.2 45 – – – Level 2Unlisted equity securities 3.2 10 – – – Level 3
There were no transfers between level 1, level 2, or level 3 during the period.
Fair value of financial assets and financial liabilities that are not measured at fair value on a recurring basisThe carrying value of cash and cash equivalents, financial assets, bank and other loans, and non-interest bearing monetary financial liabilities of the Group approximate their fair value.
Estimation of fair valuesThe following summarises the major methods and assumptions used in estimating the fair values of financial instruments categorised within level 2 and level 3 of the fair value hierarchy:• The fair value of foreign exchange contracts is determined using a discounted cash flow model where future cash flows
are estimated based on market forward exchange rates as at the end of the reporting period and the contract forward rate, discounted by the observable yield curves of the respective currency;
• The fair value of foreign currency options is determined using a Black-Scholes model; • The fair value of cross currency and interest rate swaps is determined using a discounted cash flow model where future cash
flows are estimated based on market forward rates as at the end of the reporting period and the contract rates, discounted at a rate that reflects the credit risk of the various respective counterparties;
Notes to the Consolidated Financial Statements
4.7 FINANCIAL RISK MANAGEMENT (CONTINUED)
124
4.7.4 Fair value measurement of financial instruments (continued)
Estimation of fair values(continued)• The fair value of convertible notes is determined using a Black-Scholes model or a Monte Carlo simulation model; and• The fair value of unlisted equity securities is determined using the pricing from the latest external fundraising of the unlisted
entity which represents the current market value of the investment or, where this is not available, using an appropriate model such as a discounted cash flow model based on estimated future cash flows, discounted at a rate that reflects the relative risks of the investment.
SIGNIFICANT ACCOUNTING POLICIES
DerivativesDerivatives are initially recognised at fair value. Subsequently, at each reporting date, the derivative is re-measured at fair value and the gain or loss on remeasurement is recognised in the Consolidated Statement of Profit or Loss, unless the derivatives are designated as the hedging instrument in a cash flow hedge where the gain or loss is recognised in other comprehensive income. A derivative is presented as a non-current asset or a non-current liability if the remaining maturity of the instrument is more than 12 months and it is not due to be realised or settled within 12 months.
Cash flow hedgeA cash flow hedge is a hedge of an exposure to variability in cash flows that is attributable to a particular risk associated with a recognised asset or liability or a highly probable forecast transaction that could affect profit or loss.
Where a derivative is designated as the hedging instrument in a cash flow hedge, the effective part of any gain or loss on the derivative is recognised in other comprehensive income and accumulated in a separate cash flow hedge reserve within equity.
When the forecast transaction subsequently results in the recognition of a non-financial asset or non-financial liability, the associated cumulative gain or loss is removed from equity and included in the initial cost or other carrying amount of the non-financial asset or liability. If the forecast transaction subsequently results in the recognition of a financial asset or a financial liability, then the associated gains and losses that were accumulated in equity will be reclassified into profit or loss in the same period or periods during which the asset acquired or liability assumed affects profit or loss. The ineffective part of any derivative designated as the hedging instrument in a cash flow hedge is recognised immediately in the Consolidated Statement of Profit or Loss.
When a hedging instrument expires or is sold, terminated, or exercised, but the hedged forecast transaction is still expected to occur, the cumulative gain or loss at that point remains in equity and is recognised in accordance with the above policy when the transaction occurs. If the hedged transaction is no longer expected to take place, the cumulative unrealised gain or loss accumulated in equity is reclassified immediately into the Consolidated Statement of Profit or Loss. Gains or losses removed from equity during the period in relation to interest rate hedge instruments are recognised within finance costs in the Consolidated Statement of Profit or Loss.
Fair value hedgeA fair value hedge is a hedge of an exposure to changes in fair value of a recognised asset or liability that is attributable to a particular risk and could affect profit or loss. Where a derivative is designated as the hedging instrument in a fair value hedge, the gain or loss on the hedging instrument is recognised in the Consolidated Statement of Profit or Loss, together with the gain or loss on the hedged item attributable to the hedged risk, in the line item relating to the hedged item.
Hedge accounting is discontinued when the Group revokes the hedging relationship, when the hedging instrument expires or is sold, terminated, or exercised, or when it no longer qualifies for hedge accounting. The fair value adjustment to the carrying amount of the hedged item arising from the hedged risk is amortised in the Consolidated Statement of Profit or Loss from that date.
CAPITAL STRUCTURE, FINANCING, AND RISK MANAGEMENT 4
4.7 FINANCIAL RISK MANAGEMENT (CONTINUED)
1
2
3
4
5
PERFORM
AN
CE
HIG
HLIG
HTS
BUSIN
ESS REV
IEWD
IRECTORS'
REPORT
FINA
NC
IAL
REPORT
OTH
ER IN
FORM
ATION
125
WO
OLW
ORTH
S GRO
UP
AN
NU
AL REPO
RT 2020
4.7.3 Credit riskCredit risk is the risk that counterparties who may be required to pay monies to the Group may fail and therefore not be able to make those payments.
Under the treasury policy approved by the Board of Directors, the Group can only invest short-term surplus funds or execute derivatives with approved counterparty banks and financial institutions that are rated BBB+ or higher by Standard & Poor’s (or equivalent with other rating agencies).
The recognised financial assets of the Group include amounts receivable arising from unrealised gains on derivatives. For derivatives which are deliverable, credit risk may also arise from the potential failure of the counterparties to meet their obligations under the respective contracts at maturity.
At the reporting date, no material credit risk exposure existed in relation to potential counterparty failure on such financial instruments (2019: nil). Other than the loss allowance recognised in relation to trade and other receivables in Note 3.1, no financial assets were impaired or past due.
4.7.4 Fair value measurement of financial instrumentsSome of the Group’s financial assets and financial liabilities are measured at fair value at the end of each reporting period. The following table provides information about how the fair values of these financial assets and financial liabilities are determined. They are grouped into levels 1 to 3 based on the degree to which the fair value measurement inputs are observable.
Level 1 Fair value measurements are those derived from quoted prices (unadjusted) in active markets for identical assets or liabilities.
Level 2 Fair value measurements are those derived from inputs other than quoted prices included within level 1 that are observable for the asset or liability, either directly (i.e. as prices) or indirectly (i.e. derived from prices).
Level 3 Fair value measurements are those derived from valuation techniques that include inputs for the asset or liability that are not based on observable market data (unobservable inputs).
FAIR VALUE ASSET FAIR VALUE LIABILITY
NOTE2020 2019 2020 2019 FAIR VALUE
HIERARCHY$M $M $M $M
Listed equity securities 3.2 84 91 – – Level 1
Forward exchange contracts and foreign currency options 4.7.1 9 17 (53) – Level 2Cross currency and interest rate swaps 4.7.1 539 529 (31) (82) Level 2Convertible notes 3.2 45 – – – Level 2Unlisted equity securities 3.2 10 – – – Level 3
There were no transfers between level 1, level 2, or level 3 during the period.
Fair value of financial assets and financial liabilities that are not measured at fair value on a recurring basisThe carrying value of cash and cash equivalents, financial assets, bank and other loans, and non-interest bearing monetary financial liabilities of the Group approximate their fair value.
Estimation of fair valuesThe following summarises the major methods and assumptions used in estimating the fair values of financial instruments categorised within level 2 and level 3 of the fair value hierarchy:• The fair value of foreign exchange contracts is determined using a discounted cash flow model where future cash flows
are estimated based on market forward exchange rates as at the end of the reporting period and the contract forward rate, discounted by the observable yield curves of the respective currency;
• The fair value of foreign currency options is determined using a Black-Scholes model; • The fair value of cross currency and interest rate swaps is determined using a discounted cash flow model where future cash
flows are estimated based on market forward rates as at the end of the reporting period and the contract rates, discounted at a rate that reflects the credit risk of the various respective counterparties;
Notes to the Consolidated Financial Statements
4.7 FINANCIAL RISK MANAGEMENT (CONTINUED)
124
4.7.4 Fair value measurement of financial instruments (continued)
Estimation of fair values(continued)• The fair value of convertible notes is determined using a Black-Scholes model or a Monte Carlo simulation model; and• The fair value of unlisted equity securities is determined using the pricing from the latest external fundraising of the unlisted
entity which represents the current market value of the investment or, where this is not available, using an appropriate model such as a discounted cash flow model based on estimated future cash flows, discounted at a rate that reflects the relative risks of the investment.
SIGNIFICANT ACCOUNTING POLICIES
DerivativesDerivatives are initially recognised at fair value. Subsequently, at each reporting date, the derivative is re-measured at fair value and the gain or loss on remeasurement is recognised in the Consolidated Statement of Profit or Loss, unless the derivatives are designated as the hedging instrument in a cash flow hedge where the gain or loss is recognised in other comprehensive income. A derivative is presented as a non-current asset or a non-current liability if the remaining maturity of the instrument is more than 12 months and it is not due to be realised or settled within 12 months.
Cash flow hedgeA cash flow hedge is a hedge of an exposure to variability in cash flows that is attributable to a particular risk associated with a recognised asset or liability or a highly probable forecast transaction that could affect profit or loss.
Where a derivative is designated as the hedging instrument in a cash flow hedge, the effective part of any gain or loss on the derivative is recognised in other comprehensive income and accumulated in a separate cash flow hedge reserve within equity.
When the forecast transaction subsequently results in the recognition of a non-financial asset or non-financial liability, the associated cumulative gain or loss is removed from equity and included in the initial cost or other carrying amount of the non-financial asset or liability. If the forecast transaction subsequently results in the recognition of a financial asset or a financial liability, then the associated gains and losses that were accumulated in equity will be reclassified into profit or loss in the same period or periods during which the asset acquired or liability assumed affects profit or loss. The ineffective part of any derivative designated as the hedging instrument in a cash flow hedge is recognised immediately in the Consolidated Statement of Profit or Loss.
When a hedging instrument expires or is sold, terminated, or exercised, but the hedged forecast transaction is still expected to occur, the cumulative gain or loss at that point remains in equity and is recognised in accordance with the above policy when the transaction occurs. If the hedged transaction is no longer expected to take place, the cumulative unrealised gain or loss accumulated in equity is reclassified immediately into the Consolidated Statement of Profit or Loss. Gains or losses removed from equity during the period in relation to interest rate hedge instruments are recognised within finance costs in the Consolidated Statement of Profit or Loss.
Fair value hedgeA fair value hedge is a hedge of an exposure to changes in fair value of a recognised asset or liability that is attributable to a particular risk and could affect profit or loss. Where a derivative is designated as the hedging instrument in a fair value hedge, the gain or loss on the hedging instrument is recognised in the Consolidated Statement of Profit or Loss, together with the gain or loss on the hedged item attributable to the hedged risk, in the line item relating to the hedged item.
Hedge accounting is discontinued when the Group revokes the hedging relationship, when the hedging instrument expires or is sold, terminated, or exercised, or when it no longer qualifies for hedge accounting. The fair value adjustment to the carrying amount of the hedged item arising from the hedged risk is amortised in the Consolidated Statement of Profit or Loss from that date.
CAPITAL STRUCTURE, FINANCING, AND RISK MANAGEMENT 4
4.7 FINANCIAL RISK MANAGEMENT (CONTINUED)
1
2
3
4
5
PERFORM
AN
CE
HIG
HLIG
HTS
BUSIN
ESS REV
IEWD
IRECTORS'
REPORT
FINA
NC
IAL
REPORT
OTH
ER IN
FORM
ATION
125W
OO
LWO
RTHS G
ROU
P A
NN
UA
L REPORT 2020
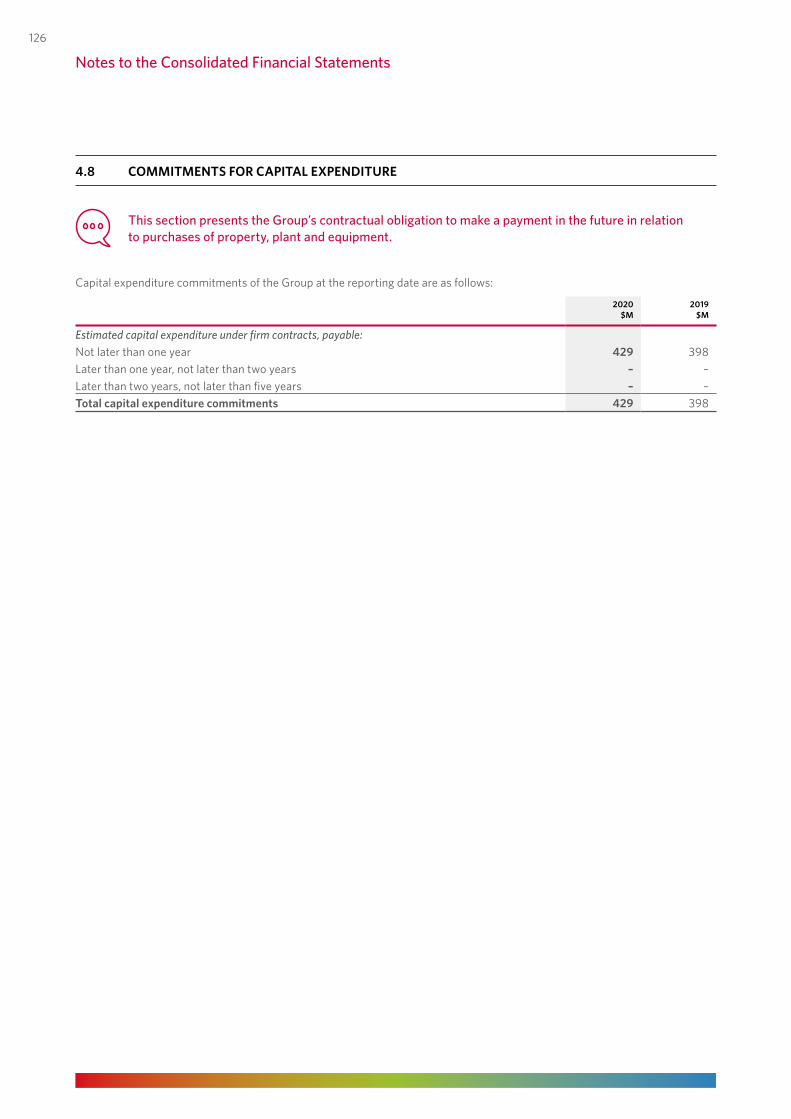
This section presents the Group’s contractual obligation to make a payment in the future in relation to purchases of property, plant and equipment.
Capital expenditure commitments of the Group at the reporting date are as follows:
2020 2019$M $M
Estimated capital expenditure under firm contracts, payable:Not later than one year 429 398 Later than one year, not later than two years – – Later than two years, not later than five years – – Total capital expenditure commitments 429 398
4.8 COMMITMENTS FOR CAPITAL EXPENDITURE
Notes to the Consolidated Financial Statements
126
5 GROUP STRUCTURE
5.1 DISCONTINUED OPERATIONS
This section presents the profit or loss from components of the Group that have either been disposed of or are currently held for sale. During the previous reporting period, the Group completed the sale of the Petrol business.
On 1 April 2019, the Group completed the sale of its Petrol business to EG Group. The transaction resulted in the sale of 540 fuel convenience sites to EG Group for $1,682 million (proceeds of $1,725 million, net of a working capital adjustment of $28 million, and cash disposed of $15 million).
5.1.1 Profit for the period from discontinued operations
2020 201952 WEEKS 53 WEEKS
PETROL $M $M
Revenue from the sale of goods – 3,696Expenses – (3,584)Earnings before interest and tax – 112Finance income – – Profit before gain on sale and tax – 112Gain on sale of the Petrol business – 1,088Profit before income tax – 1,200Income tax expense – – Profit for the period from discontinued operations – 1,200
5.1.2 Cash flows from/(used in) discontinued operationsThe condensed cash flows from/(used in) the discontinued operations during the period are set out below:
2020 201952 WEEKS 53 WEEKS
PETROL $M $M
Net cash inflow from operating activities – 34Net cash outflow from investing activities – (23)Net cash outflow from financing activities – –Net increase in cash and cash equivalents – 11Cash and cash equivalents at start of period – 4Cash and cash equivalents at end of period 1 – 15
1 Cash and cash equivalents at end of period for 2019 represents the cash position of the Petrol business at the date of sale.
GROUPSTRUCTURE 5
1
2
3
4
5
PERFORM
AN
CE
HIG
HLIG
HTS
BUSIN
ESS REV
IEWD
IRECTORS'
REPORT
FINA
NC
IAL
REPORT
OTH
ER IN
FORM
ATION
127
WO
OLW
ORTH
S GRO
UP
AN
NU
AL REPO
RT 2020
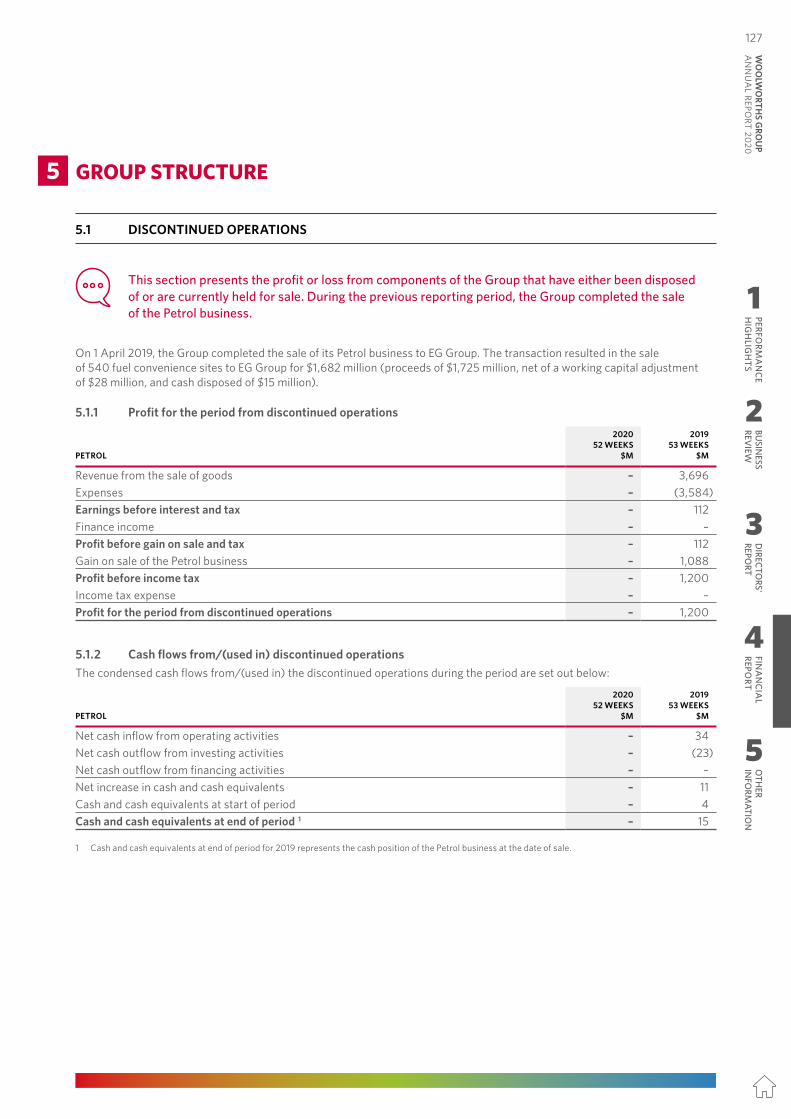
This section presents the Group’s contractual obligation to make a payment in the future in relation to purchases of property, plant and equipment.
Capital expenditure commitments of the Group at the reporting date are as follows:
2020 2019$M $M
Estimated capital expenditure under firm contracts, payable:Not later than one year 429 398 Later than one year, not later than two years – – Later than two years, not later than five years – – Total capital expenditure commitments 429 398
4.8 COMMITMENTS FOR CAPITAL EXPENDITURE
Notes to the Consolidated Financial Statements
126
5 GROUP STRUCTURE
5.1 DISCONTINUED OPERATIONS
This section presents the profit or loss from components of the Group that have either been disposed of or are currently held for sale. During the previous reporting period, the Group completed the sale of the Petrol business.
On 1 April 2019, the Group completed the sale of its Petrol business to EG Group. The transaction resulted in the sale of 540 fuel convenience sites to EG Group for $1,682 million (proceeds of $1,725 million, net of a working capital adjustment of $28 million, and cash disposed of $15 million).
5.1.1 Profit for the period from discontinued operations
2020 201952 WEEKS 53 WEEKS
PETROL $M $M
Revenue from the sale of goods – 3,696Expenses – (3,584)Earnings before interest and tax – 112Finance income – – Profit before gain on sale and tax – 112Gain on sale of the Petrol business – 1,088Profit before income tax – 1,200Income tax expense – – Profit for the period from discontinued operations – 1,200
5.1.2 Cash flows from/(used in) discontinued operationsThe condensed cash flows from/(used in) the discontinued operations during the period are set out below:
2020 201952 WEEKS 53 WEEKS
PETROL $M $M
Net cash inflow from operating activities – 34Net cash outflow from investing activities – (23)Net cash outflow from financing activities – –Net increase in cash and cash equivalents – 11Cash and cash equivalents at start of period – 4Cash and cash equivalents at end of period 1 – 15
1 Cash and cash equivalents at end of period for 2019 represents the cash position of the Petrol business at the date of sale.
GROUPSTRUCTURE 5
1
2
3
4
5
PERFORM
AN
CE
HIG
HLIG
HTS
BUSIN
ESS REV
IEWD
IRECTORS'
REPORT
FINA
NC
IAL
REPORT
OTH
ER IN
FORM
ATION
127W
OO
LWO
RTHS G
ROU
P A
NN
UA
L REPORT 2020
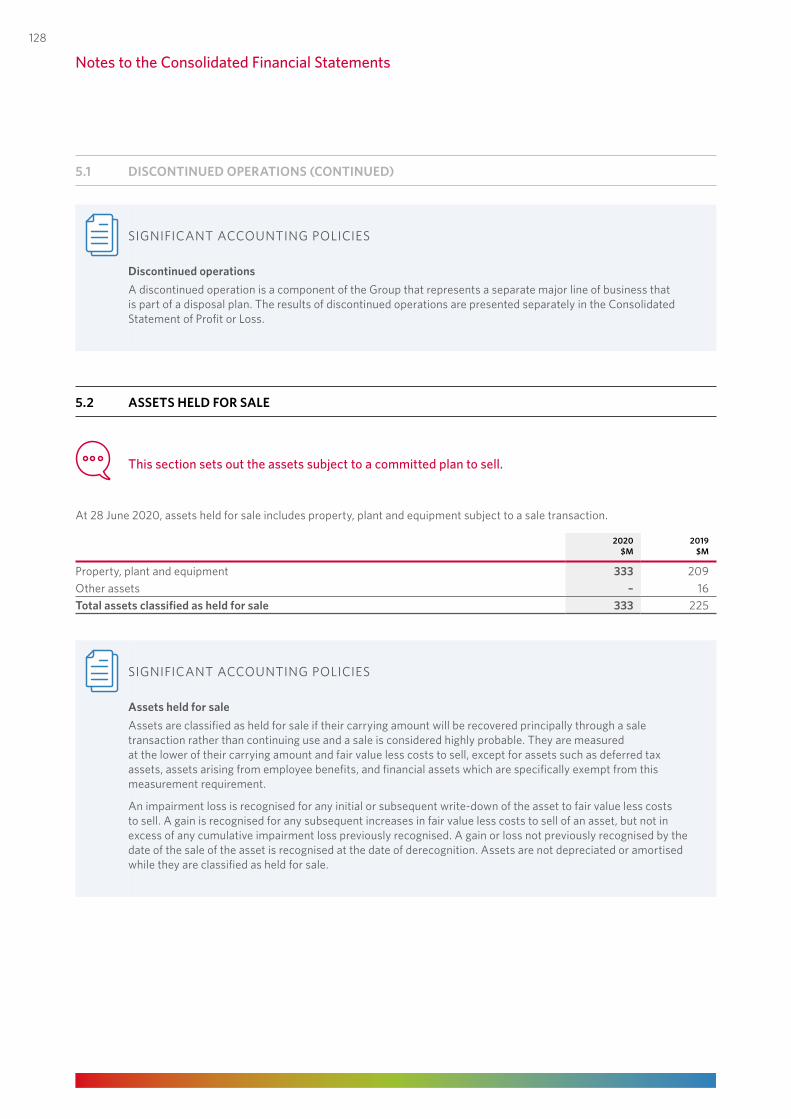
SIGNIFICANT ACCOUNTING POLICIES
Discontinued operationsA discontinued operation is a component of the Group that represents a separate major line of business that is part of a disposal plan. The results of discontinued operations are presented separately in the Consolidated Statement of Profit or Loss.
5.2 ASSETS HELD FOR SALE
This section sets out the assets subject to a committed plan to sell.
At 28 June 2020, assets held for sale includes property, plant and equipment subject to a sale transaction.
2020 2019$M $M
Property, plant and equipment 333 209 Other assets – 16 Total assets classified as held for sale 333 225
SIGNIFICANT ACCOUNTING POLICIES
Assets held for saleAssets are classified as held for sale if their carrying amount will be recovered principally through a sale transaction rather than continuing use and a sale is considered highly probable. They are measured at the lower of their carrying amount and fair value less costs to sell, except for assets such as deferred tax assets, assets arising from employee benefits, and financial assets which are specifically exempt from this measurement requirement.
An impairment loss is recognised for any initial or subsequent write-down of the asset to fair value less costs to sell. A gain is recognised for any subsequent increases in fair value less costs to sell of an asset, but not in excess of any cumulative impairment loss previously recognised. A gain or loss not previously recognised by the date of the sale of the asset is recognised at the date of derecognition. Assets are not depreciated or amortised while they are classified as held for sale.
Notes to the Consolidated Financial Statements
5.1 DISCONTINUED OPERATIONS (CONTINUED)
128
5.3 SUBSIDIARIES
The following section sets out the list of Australian subsidiaries (which together with Woolworths Group Limited are referred to as the Closed Group) and their consolidated financial performance and position.
5.3.1 Deed of cross guarantee Woolworths Group Limited and each of the wholly owned subsidiaries set out below (together referred to as the Closed Group) have entered into a Deed of Cross Guarantee (the Deed), as defined in ASIC Corporations (Wholly-owned Companies) Instrument 2016/785 (the Instrument). The effect of the Deed is that each entity in the Closed Group guarantees the payment in full of all debts of the other entities in the Closed Group in the event of their winding up.
During the period, the Group completed the Restructure Scheme and ALH Merger to combine its Endeavour Drinks and Hotels businesses to create Endeavour Group. Effective from that date, the Group holds 85.4% of the combined Endeavour Group. The companies listed in section (ii) were party to the Deed but ceased to be wholly-owned by Woolworths Group Limited as a result of the Restructure Scheme. These companies were removed from the Deed by way of a Revocation Deed on 4 February 2020.
Pursuant to the Instrument, the wholly-owned subsidiaries within the Closed Group are relieved from the requirement to prepare, audit, and lodge separate financial reports.
(i) Parties to the Deed
COMPANY
ACN 001 259 301 Pty Limited Hydrogen Nominees Pty. Ltd
Advantage Supermarkets Pty Ltd Hydrox Brands Pty Ltd
Advantage Supermarkets WA Pty Ltd Jack Butler & Staff Pty. Ltd.
Andmist Pty. Limited Josona Pty Ltd
Australian Grocery Wholesalers Pty Limited Kiaora Lands Pty Limited
Australian Independent Retailers Pty Ltd Leasehold Investments Pty Ltd
Australian Safeway Stores Pty. Ltd. Masters Installation Pty Limited
Barjok Pty Ltd Nalos Pty Ltd
Calvartan Pty. Limited Oxygen Nominees Pty. Ltd.
Cartology Pty Limited PEH (NZ IP) Pty Ltd
Cenijade Pty. Limited Philip Leong Stores Pty Limited
Charmtex Pty Ltd Primary Connect International Pty Limited 1
DB Deals Online Pty Limited Progressive Enterprises Holdings Limited
Drystone Pty Ltd QFD Pty. Limited
Dentra Pty. Limited Queensland Property Investments Pty Ltd
Drumstar Pty Ltd Universal Wholesalers Pty Limited
Fabcot Pty Ltd Vincentia Nominees Pty Ltd
Fabsky Pty Ltd W23 Pty Limited
Gembond Pty. Limited W23 Investments Pty Limited
GreenGrocer.com.au Pty Ltd W23 Investments 2 Pty Limited 1
Grocery Wholesalers Pty Ltd W23 Investments 3 Pty Limited 2
HP Distribution Pty Ltd W23 Investments 4 Pty Limited 2
1 These wholly-owned subsidiaries became a party to the Deed by way of an Assumption Deed on 4 February 2020.2 These wholly-owned subsidiaries became a party to the Deed by way of an Assumption Deed on 17 June 2020.
GROUPSTRUCTURE 5
1
2
3
4
5
PERFORM
AN
CE
HIG
HLIG
HTS
BUSIN
ESS REV
IEWD
IRECTORS'
REPORT
FINA
NC
IAL
REPORT
OTH
ER IN
FORM
ATION
129
WO
OLW
ORTH
S GRO
UP
AN
NU
AL REPO
RT 2020
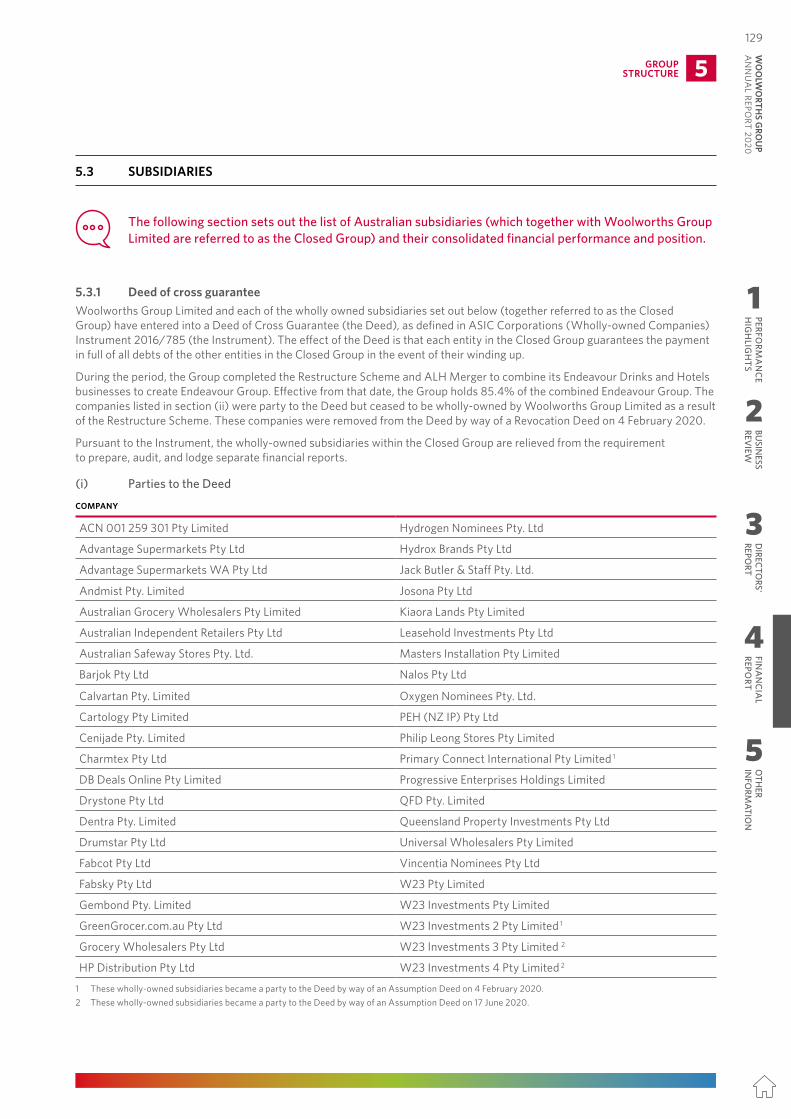
SIGNIFICANT ACCOUNTING POLICIES
Discontinued operationsA discontinued operation is a component of the Group that represents a separate major line of business that is part of a disposal plan. The results of discontinued operations are presented separately in the Consolidated Statement of Profit or Loss.
5.2 ASSETS HELD FOR SALE
This section sets out the assets subject to a committed plan to sell.
At 28 June 2020, assets held for sale includes property, plant and equipment subject to a sale transaction.
2020 2019$M $M
Property, plant and equipment 333 209 Other assets – 16 Total assets classified as held for sale 333 225
SIGNIFICANT ACCOUNTING POLICIES
Assets held for saleAssets are classified as held for sale if their carrying amount will be recovered principally through a sale transaction rather than continuing use and a sale is considered highly probable. They are measured at the lower of their carrying amount and fair value less costs to sell, except for assets such as deferred tax assets, assets arising from employee benefits, and financial assets which are specifically exempt from this measurement requirement.
An impairment loss is recognised for any initial or subsequent write-down of the asset to fair value less costs to sell. A gain is recognised for any subsequent increases in fair value less costs to sell of an asset, but not in excess of any cumulative impairment loss previously recognised. A gain or loss not previously recognised by the date of the sale of the asset is recognised at the date of derecognition. Assets are not depreciated or amortised while they are classified as held for sale.
Notes to the Consolidated Financial Statements
5.1 DISCONTINUED OPERATIONS (CONTINUED)
128
5.3 SUBSIDIARIES
The following section sets out the list of Australian subsidiaries (which together with Woolworths Group Limited are referred to as the Closed Group) and their consolidated financial performance and position.
5.3.1 Deed of cross guarantee Woolworths Group Limited and each of the wholly owned subsidiaries set out below (together referred to as the Closed Group) have entered into a Deed of Cross Guarantee (the Deed), as defined in ASIC Corporations (Wholly-owned Companies) Instrument 2016/785 (the Instrument). The effect of the Deed is that each entity in the Closed Group guarantees the payment in full of all debts of the other entities in the Closed Group in the event of their winding up.
During the period, the Group completed the Restructure Scheme and ALH Merger to combine its Endeavour Drinks and Hotels businesses to create Endeavour Group. Effective from that date, the Group holds 85.4% of the combined Endeavour Group. The companies listed in section (ii) were party to the Deed but ceased to be wholly-owned by Woolworths Group Limited as a result of the Restructure Scheme. These companies were removed from the Deed by way of a Revocation Deed on 4 February 2020.
Pursuant to the Instrument, the wholly-owned subsidiaries within the Closed Group are relieved from the requirement to prepare, audit, and lodge separate financial reports.
(i) Parties to the Deed
COMPANY
ACN 001 259 301 Pty Limited Hydrogen Nominees Pty. Ltd
Advantage Supermarkets Pty Ltd Hydrox Brands Pty Ltd
Advantage Supermarkets WA Pty Ltd Jack Butler & Staff Pty. Ltd.
Andmist Pty. Limited Josona Pty Ltd
Australian Grocery Wholesalers Pty Limited Kiaora Lands Pty Limited
Australian Independent Retailers Pty Ltd Leasehold Investments Pty Ltd
Australian Safeway Stores Pty. Ltd. Masters Installation Pty Limited
Barjok Pty Ltd Nalos Pty Ltd
Calvartan Pty. Limited Oxygen Nominees Pty. Ltd.
Cartology Pty Limited PEH (NZ IP) Pty Ltd
Cenijade Pty. Limited Philip Leong Stores Pty Limited
Charmtex Pty Ltd Primary Connect International Pty Limited 1
DB Deals Online Pty Limited Progressive Enterprises Holdings Limited
Drystone Pty Ltd QFD Pty. Limited
Dentra Pty. Limited Queensland Property Investments Pty Ltd
Drumstar Pty Ltd Universal Wholesalers Pty Limited
Fabcot Pty Ltd Vincentia Nominees Pty Ltd
Fabsky Pty Ltd W23 Pty Limited
Gembond Pty. Limited W23 Investments Pty Limited
GreenGrocer.com.au Pty Ltd W23 Investments 2 Pty Limited 1
Grocery Wholesalers Pty Ltd W23 Investments 3 Pty Limited 2
HP Distribution Pty Ltd W23 Investments 4 Pty Limited 2
1 These wholly-owned subsidiaries became a party to the Deed by way of an Assumption Deed on 4 February 2020.2 These wholly-owned subsidiaries became a party to the Deed by way of an Assumption Deed on 17 June 2020.
GROUPSTRUCTURE 5
1
2
3
4
5
PERFORM
AN
CE
HIG
HLIG
HTS
BUSIN
ESS REV
IEWD
IRECTORS'
REPORT
FINA
NC
IAL
REPORT
OTH
ER IN
FORM
ATION
129W
OO
LWO
RTHS G
ROU
P A
NN
UA
L REPORT 2020
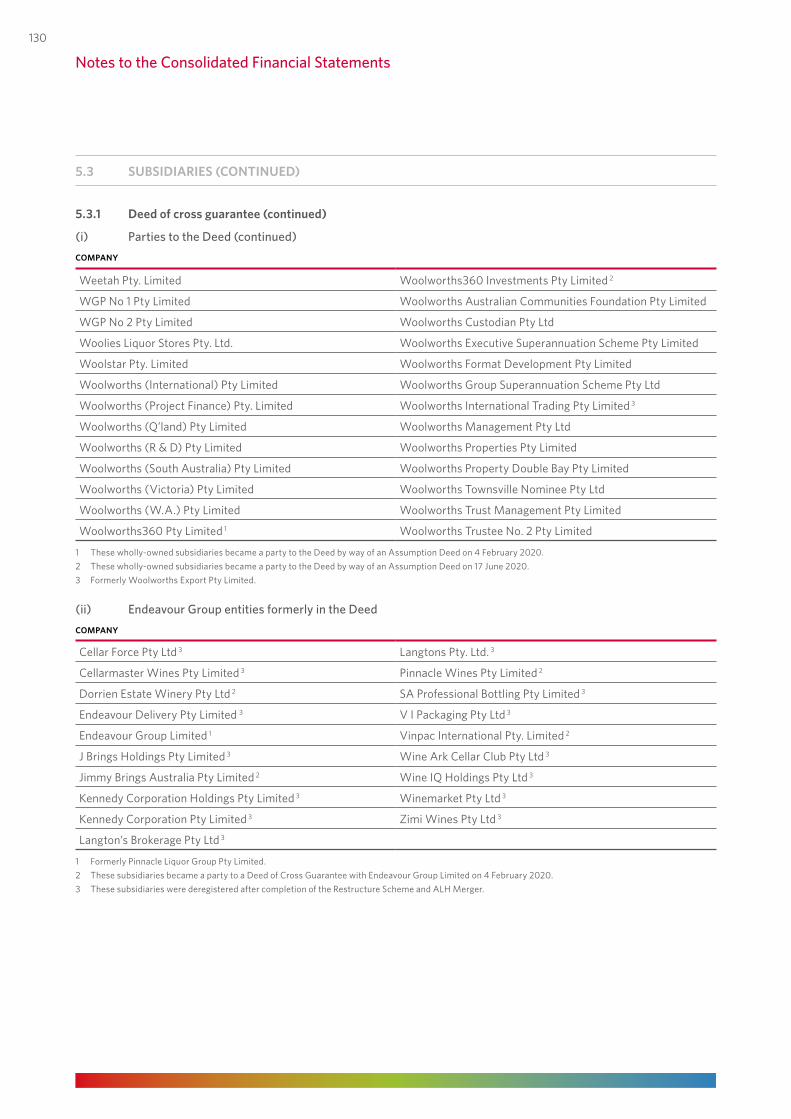
5.3 SUBSIDIARIES (CONTINUED)
5.3.1 Deed of cross guarantee (continued)
(i) Parties to the Deed (continued)COMPANY
Weetah Pty. Limited Woolworths360 Investments Pty Limited 2
WGP No 1 Pty Limited Woolworths Australian Communities Foundation Pty Limited
WGP No 2 Pty Limited Woolworths Custodian Pty Ltd
Woolies Liquor Stores Pty. Ltd. Woolworths Executive Superannuation Scheme Pty Limited
Woolstar Pty. Limited Woolworths Format Development Pty Limited
Woolworths (International) Pty Limited Woolworths Group Superannuation Scheme Pty Ltd
Woolworths (Project Finance) Pty. Limited Woolworths International Trading Pty Limited 3
Woolworths (Q’land) Pty Limited Woolworths Management Pty Ltd
Woolworths (R & D) Pty Limited Woolworths Properties Pty Limited
Woolworths (South Australia) Pty Limited Woolworths Property Double Bay Pty Limited
Woolworths (Victoria) Pty Limited Woolworths Townsville Nominee Pty Ltd
Woolworths (W.A.) Pty Limited Woolworths Trust Management Pty Limited
Woolworths360 Pty Limited 1 Woolworths Trustee No. 2 Pty Limited
1 These wholly-owned subsidiaries became a party to the Deed by way of an Assumption Deed on 4 February 2020.2 These wholly-owned subsidiaries became a party to the Deed by way of an Assumption Deed on 17 June 2020.3 Formerly Woolworths Export Pty Limited.
(ii) Endeavour Group entities formerly in the DeedCOMPANY
Cellar Force Pty Ltd 3 Langtons Pty. Ltd. 3
Cellarmaster Wines Pty Limited 3 Pinnacle Wines Pty Limited 2
Dorrien Estate Winery Pty Ltd 2 SA Professional Bottling Pty Limited 3
Endeavour Delivery Pty Limited 3 V I Packaging Pty Ltd 3
Endeavour Group Limited 1 Vinpac International Pty. Limited 2
J Brings Holdings Pty Limited 3 Wine Ark Cellar Club Pty Ltd 3
Jimmy Brings Australia Pty Limited 2 Wine IQ Holdings Pty Ltd 3
Kennedy Corporation Holdings Pty Limited 3 Winemarket Pty Ltd 3
Kennedy Corporation Pty Limited 3 Zimi Wines Pty Ltd 3
Langton’s Brokerage Pty Ltd 3
1 Formerly Pinnacle Liquor Group Pty Limited.2 These subsidiaries became a party to a Deed of Cross Guarantee with Endeavour Group Limited on 4 February 2020.3 These subsidiaries were deregistered after completion of the Restructure Scheme and ALH Merger.
Notes to the Consolidated Financial Statements
130
A Statement of Profit or Loss and retained earnings, and Statement of Financial Position for the entities which are party to the Deed at the reporting date are as follows:
Statement of Profit or Loss and retained earnings
2020RESTATED 1
201952 WEEKS 53 WEEKS
$M $M
Continuing operationsRevenue from the sale of goods and services 49,550 48,744Cost of sales (35,251) (35,049)Gross profit 14,299 13,695Other revenue 131 206Branch expenses (9,037) (9,231)Administration expenses (3,577) (3,098)Earnings before interest and tax 1,816 1,572Finance (costs)/income (280) 272Profit before income tax 1,536 1,844Income tax expense (396) (467)Profit for the period from continuing operations 1,140 1,377Discontinued operationsProfit from discontinued operations, after tax – 1,200Profit for the period 1,140 2,577
Retained earningsBalance at start of period 2,445 2,671Adjustment on initial application of AASB 16, net of tax (1,031) –Profit for the period 1,140 2,577Dividends paid (refer to Note 4.2) (1,297) (1,381)Share buy-back – (1,419)Actuarial gain/(loss) on defined benefit superannuation plans, net of tax 4 (3)Adjustment for companies transferred out of the Closed Group (99) –Balance at end of period 1,162 2,445
1 Refer to Note 1.4 for details regarding the restatement for salaried team member remediation.
The Closed Group has applied AASB 16 using the modified retrospective approach from 1 July 2019. The comparative amounts presented for the year ended 30 June 2019 were not restated for the impact of AASB 16 and continue to be reported under AASB 117. Refer to Note 1.2.6 for further details.
GROUPSTRUCTURE 5
5.3 SUBSIDIARIES (CONTINUED)
5.3.1 Deed of cross guarantee (continued)
1
2
3
4
5
PERFORM
AN
CE
HIG
HLIG
HTS
BUSIN
ESS REV
IEWD
IRECTORS'
REPORT
FINA
NC
IAL
REPORT
OTH
ER IN
FORM
ATION
131
WO
OLW
ORTH
S GRO
UP
AN
NU
AL REPO
RT 2020
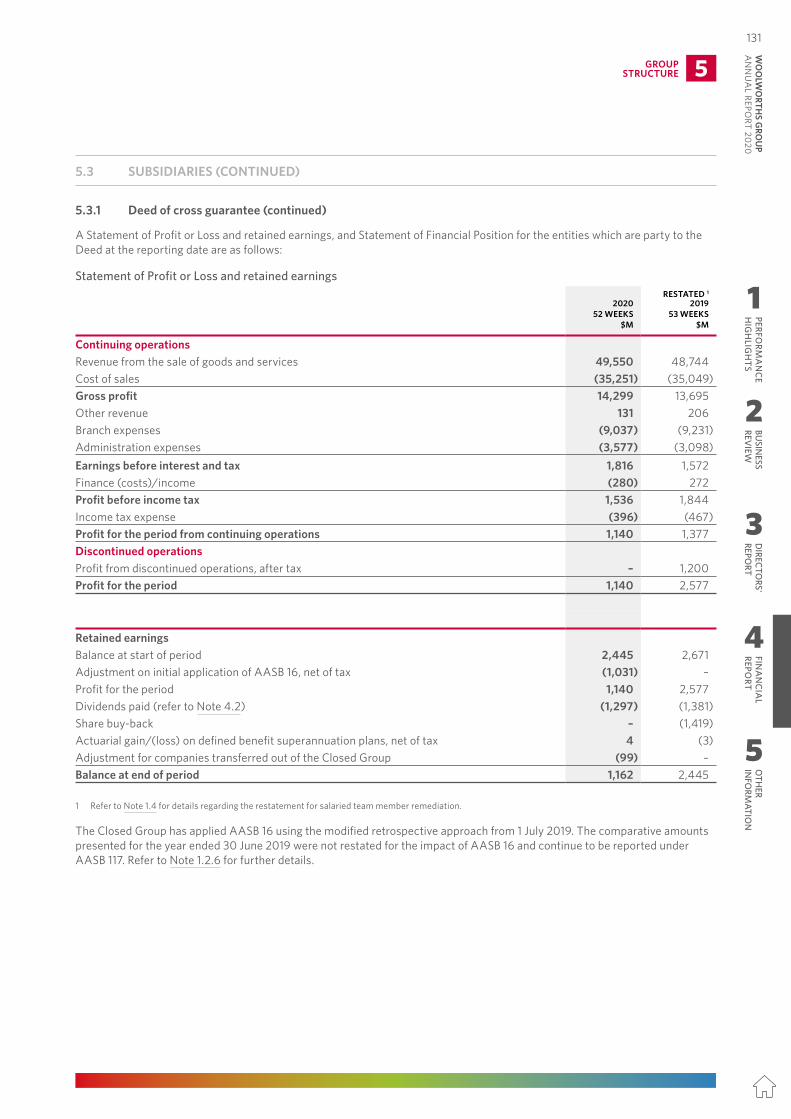
5.3 SUBSIDIARIES (CONTINUED)
5.3.1 Deed of cross guarantee (continued)
(i) Parties to the Deed (continued)COMPANY
Weetah Pty. Limited Woolworths360 Investments Pty Limited 2
WGP No 1 Pty Limited Woolworths Australian Communities Foundation Pty Limited
WGP No 2 Pty Limited Woolworths Custodian Pty Ltd
Woolies Liquor Stores Pty. Ltd. Woolworths Executive Superannuation Scheme Pty Limited
Woolstar Pty. Limited Woolworths Format Development Pty Limited
Woolworths (International) Pty Limited Woolworths Group Superannuation Scheme Pty Ltd
Woolworths (Project Finance) Pty. Limited Woolworths International Trading Pty Limited 3
Woolworths (Q’land) Pty Limited Woolworths Management Pty Ltd
Woolworths (R & D) Pty Limited Woolworths Properties Pty Limited
Woolworths (South Australia) Pty Limited Woolworths Property Double Bay Pty Limited
Woolworths (Victoria) Pty Limited Woolworths Townsville Nominee Pty Ltd
Woolworths (W.A.) Pty Limited Woolworths Trust Management Pty Limited
Woolworths360 Pty Limited 1 Woolworths Trustee No. 2 Pty Limited
1 These wholly-owned subsidiaries became a party to the Deed by way of an Assumption Deed on 4 February 2020.2 These wholly-owned subsidiaries became a party to the Deed by way of an Assumption Deed on 17 June 2020.3 Formerly Woolworths Export Pty Limited.
(ii) Endeavour Group entities formerly in the DeedCOMPANY
Cellar Force Pty Ltd 3 Langtons Pty. Ltd. 3
Cellarmaster Wines Pty Limited 3 Pinnacle Wines Pty Limited 2
Dorrien Estate Winery Pty Ltd 2 SA Professional Bottling Pty Limited 3
Endeavour Delivery Pty Limited 3 V I Packaging Pty Ltd 3
Endeavour Group Limited 1 Vinpac International Pty. Limited 2
J Brings Holdings Pty Limited 3 Wine Ark Cellar Club Pty Ltd 3
Jimmy Brings Australia Pty Limited 2 Wine IQ Holdings Pty Ltd 3
Kennedy Corporation Holdings Pty Limited 3 Winemarket Pty Ltd 3
Kennedy Corporation Pty Limited 3 Zimi Wines Pty Ltd 3
Langton’s Brokerage Pty Ltd 3
1 Formerly Pinnacle Liquor Group Pty Limited.2 These subsidiaries became a party to a Deed of Cross Guarantee with Endeavour Group Limited on 4 February 2020.3 These subsidiaries were deregistered after completion of the Restructure Scheme and ALH Merger.
Notes to the Consolidated Financial Statements
130
A Statement of Profit or Loss and retained earnings, and Statement of Financial Position for the entities which are party to the Deed at the reporting date are as follows:
Statement of Profit or Loss and retained earnings
2020RESTATED 1
201952 WEEKS 53 WEEKS
$M $M
Continuing operationsRevenue from the sale of goods and services 49,550 48,744Cost of sales (35,251) (35,049)Gross profit 14,299 13,695Other revenue 131 206Branch expenses (9,037) (9,231)Administration expenses (3,577) (3,098)Earnings before interest and tax 1,816 1,572Finance (costs)/income (280) 272Profit before income tax 1,536 1,844Income tax expense (396) (467)Profit for the period from continuing operations 1,140 1,377Discontinued operationsProfit from discontinued operations, after tax – 1,200Profit for the period 1,140 2,577
Retained earningsBalance at start of period 2,445 2,671Adjustment on initial application of AASB 16, net of tax (1,031) –Profit for the period 1,140 2,577Dividends paid (refer to Note 4.2) (1,297) (1,381)Share buy-back – (1,419)Actuarial gain/(loss) on defined benefit superannuation plans, net of tax 4 (3)Adjustment for companies transferred out of the Closed Group (99) –Balance at end of period 1,162 2,445
1 Refer to Note 1.4 for details regarding the restatement for salaried team member remediation.
The Closed Group has applied AASB 16 using the modified retrospective approach from 1 July 2019. The comparative amounts presented for the year ended 30 June 2019 were not restated for the impact of AASB 16 and continue to be reported under AASB 117. Refer to Note 1.2.6 for further details.
GROUPSTRUCTURE 5
5.3 SUBSIDIARIES (CONTINUED)
5.3.1 Deed of cross guarantee (continued)
1
2
3
4
5
PERFORM
AN
CE
HIG
HLIG
HTS
BUSIN
ESS REV
IEWD
IRECTORS'
REPORT
FINA
NC
IAL
REPORT
OTH
ER IN
FORM
ATION
131W
OO
LWO
RTHS G
ROU
P A
NN
UA
L REPORT 2020
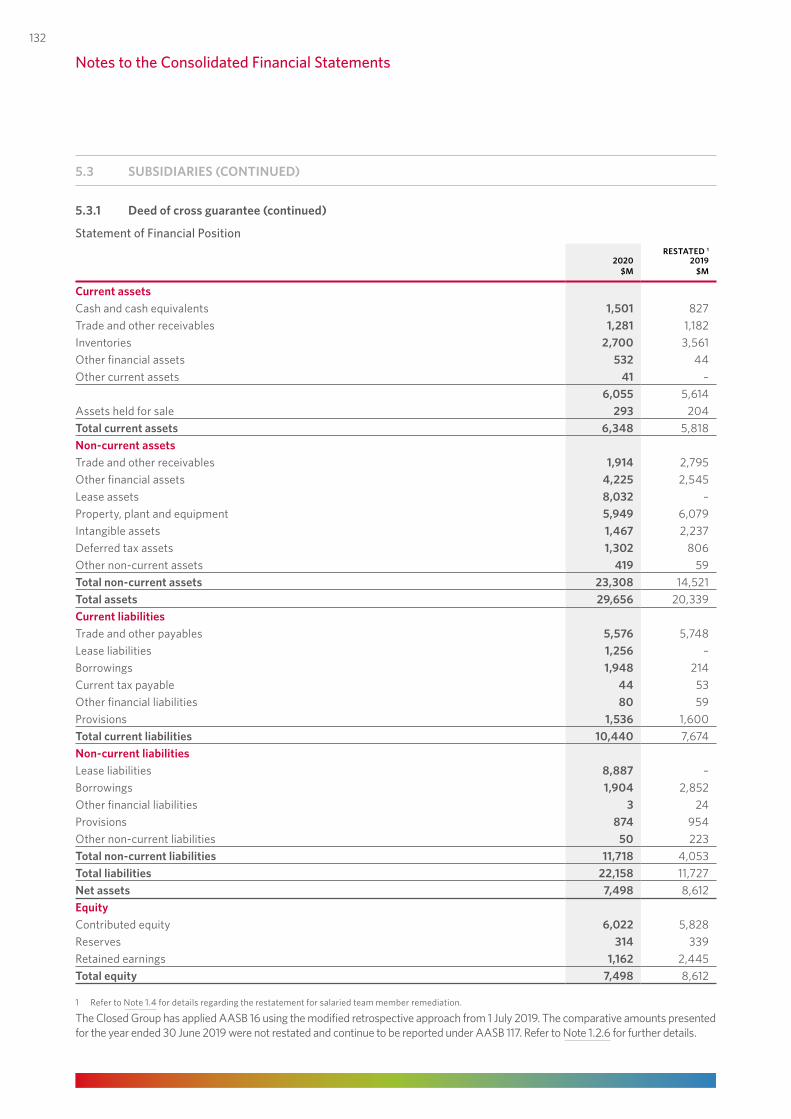
5.3.1 Deed of cross guarantee (continued)
Statement of Financial Position
2020RESTATED 1
2019$M $M
Current assetsCash and cash equivalents 1,501 827Trade and other receivables 1,281 1,182Inventories 2,700 3,561Other financial assets 532 44Other current assets 41 –
6,055 5,614Assets held for sale 293 204Total current assets 6,348 5,818Non‑current assetsTrade and other receivables 1,914 2,795Other financial assets 4,225 2,545Lease assets 8,032 –Property, plant and equipment 5,949 6,079Intangible assets 1,467 2,237Deferred tax assets 1,302 806Other non-current assets 419 59Total non‑current assets 23,308 14,521Total assets 29,656 20,339Current liabilitiesTrade and other payables 5,576 5,748Lease liabilities 1,256 –Borrowings 1,948 214Current tax payable 44 53Other financial liabilities 80 59Provisions 1,536 1,600Total current liabilities 10,440 7,674Non‑current liabilitiesLease liabilities 8,887 –Borrowings 1,904 2,852Other financial liabilities 3 24Provisions 874 954Other non-current liabilities 50 223Total non‑current liabilities 11,718 4,053Total liabilities 22,158 11,727Net assets 7,498 8,612EquityContributed equity 6,022 5,828Reserves 314 339Retained earnings 1,162 2,445Total equity 7,498 8,612
1 Refer to Note 1.4 for details regarding the restatement for salaried team member remediation.
The Closed Group has applied AASB 16 using the modified retrospective approach from 1 July 2019. The comparative amounts presented for the year ended 30 June 2019 were not restated and continue to be reported under AASB 117. Refer to Note 1.2.6 for further details.
Notes to the Consolidated Financial Statements
5.3 SUBSIDIARIES (CONTINUED)
132
5.3.2 Details of wholly owned subsidiaries that are material to the GroupMaterial subsidiaries of Woolworths Group Limited, with the exception of those disclosed in Note 5.3.1 and Note 5.3.3, are as follows:
COMPANY COUNTRY OF INCORPORATION ULTIMATE AUSTRALIAN CONTROLLING ENTITY
Woolworths New Zealand Group Limited New Zealand Woolworths Group LimitedGeneral Distributors Limited New Zealand Woolworths Group Limited
5.3.3 Details of non‑wholly owned subsidiaries that have material non‑controlling interests
PROPORTION OF VOTING RIGHTS HELD BY
NON‑CONTROLLING INTERESTS
TOTAL COMPREHENSIVE INCOME ALLOCATED
TO NON‑CONTROLLING INTERESTS
TOTAL NON‑CONTROLLING
INTERESTS
DIVIDENDS TO NON‑CONTROLLING
INTERESTS
NAME OF SUBSIDIARY PRINCIPAL PLACE OF BUSINESS
2020 2019 2020 2019 2020 2019 2020 2019% % $M $M $M $M $M $M
Endeavour Group Limited Australia 14.6 n/a 32 n/a 259 n/a 58 n/aALH Group Pty Ltd 1 Australia n/a 25 – 56 – 351 – 42Individually immaterial subsidiaries n/a n/a 10 10 31 32 8 9
42 66 290 383 66 51
Summarised financial information in respect of each of the Group’s subsidiaries that has a material non-controlling interest were as follows:
ENDEAVOUR GROUP LIMITED
2020$M
Current assets 1,993Non-current assets 8,802Current liabilities 2,886Non-current liabilities 4,522Revenue from the sale of goods and services 4,141Loss for the period (64)Total comprehensive loss for the period (79)Net increase in cash and cash equivalents 144
ALH GROUP PTY LTD 1
2019$M
Current assets 452Non-current assets 4,331Current liabilities (1,800)Non-current liabilities (1,522)Revenue 4,672Profit after tax 222Total comprehensive income 222Net cash inflow 4
1 During the period, the Group completed the Restructure Scheme and ALH Merger to combine its Endeavour Drinks and Hotels businesses to create Endeavour Group. Effective from that date, ALH Group Pty Ltd was 100% owned by Endeavour Group Limited. The non-controlling interest of Endeavour Group Limited is 14.6%.
GROUPSTRUCTURE 5
5.3 SUBSIDIARIES (CONTINUED)
1
2
3
4
5
PERFORM
AN
CE
HIG
HLIG
HTS
BUSIN
ESS REV
IEWD
IRECTORS'
REPORT
FINA
NC
IAL
REPORT
OTH
ER IN
FORM
ATION
133
WO
OLW
ORTH
S GRO
UP
AN
NU
AL REPO
RT 2020
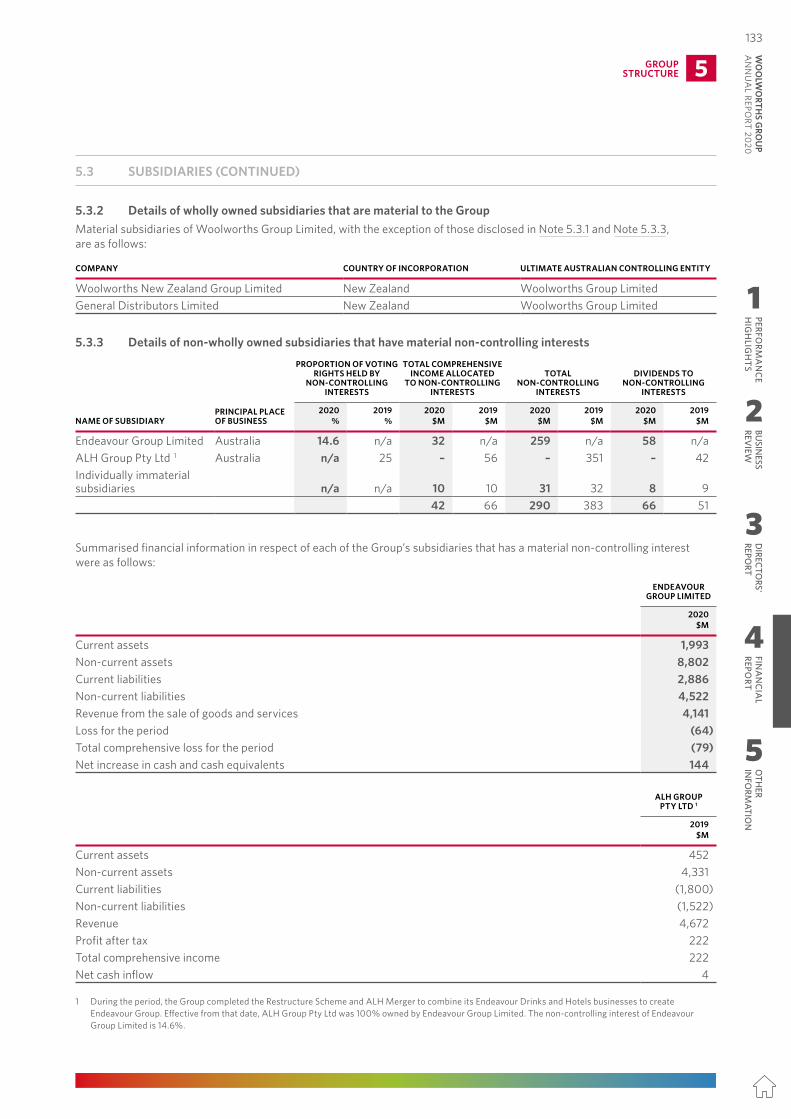
5.3.1 Deed of cross guarantee (continued)
Statement of Financial Position
2020RESTATED 1
2019$M $M
Current assetsCash and cash equivalents 1,501 827Trade and other receivables 1,281 1,182Inventories 2,700 3,561Other financial assets 532 44Other current assets 41 –
6,055 5,614Assets held for sale 293 204Total current assets 6,348 5,818Non‑current assetsTrade and other receivables 1,914 2,795Other financial assets 4,225 2,545Lease assets 8,032 –Property, plant and equipment 5,949 6,079Intangible assets 1,467 2,237Deferred tax assets 1,302 806Other non-current assets 419 59Total non‑current assets 23,308 14,521Total assets 29,656 20,339Current liabilitiesTrade and other payables 5,576 5,748Lease liabilities 1,256 –Borrowings 1,948 214Current tax payable 44 53Other financial liabilities 80 59Provisions 1,536 1,600Total current liabilities 10,440 7,674Non‑current liabilitiesLease liabilities 8,887 –Borrowings 1,904 2,852Other financial liabilities 3 24Provisions 874 954Other non-current liabilities 50 223Total non‑current liabilities 11,718 4,053Total liabilities 22,158 11,727Net assets 7,498 8,612EquityContributed equity 6,022 5,828Reserves 314 339Retained earnings 1,162 2,445Total equity 7,498 8,612
1 Refer to Note 1.4 for details regarding the restatement for salaried team member remediation.
The Closed Group has applied AASB 16 using the modified retrospective approach from 1 July 2019. The comparative amounts presented for the year ended 30 June 2019 were not restated and continue to be reported under AASB 117. Refer to Note 1.2.6 for further details.
Notes to the Consolidated Financial Statements
5.3 SUBSIDIARIES (CONTINUED)
132
5.3.2 Details of wholly owned subsidiaries that are material to the GroupMaterial subsidiaries of Woolworths Group Limited, with the exception of those disclosed in Note 5.3.1 and Note 5.3.3, are as follows:
COMPANY COUNTRY OF INCORPORATION ULTIMATE AUSTRALIAN CONTROLLING ENTITY
Woolworths New Zealand Group Limited New Zealand Woolworths Group LimitedGeneral Distributors Limited New Zealand Woolworths Group Limited
5.3.3 Details of non‑wholly owned subsidiaries that have material non‑controlling interests
PROPORTION OF VOTING RIGHTS HELD BY
NON‑CONTROLLING INTERESTS
TOTAL COMPREHENSIVE INCOME ALLOCATED
TO NON‑CONTROLLING INTERESTS
TOTAL NON‑CONTROLLING
INTERESTS
DIVIDENDS TO NON‑CONTROLLING
INTERESTS
NAME OF SUBSIDIARY PRINCIPAL PLACE OF BUSINESS
2020 2019 2020 2019 2020 2019 2020 2019% % $M $M $M $M $M $M
Endeavour Group Limited Australia 14.6 n/a 32 n/a 259 n/a 58 n/aALH Group Pty Ltd 1 Australia n/a 25 – 56 – 351 – 42Individually immaterial subsidiaries n/a n/a 10 10 31 32 8 9
42 66 290 383 66 51
Summarised financial information in respect of each of the Group’s subsidiaries that has a material non-controlling interest were as follows:
ENDEAVOUR GROUP LIMITED
2020$M
Current assets 1,993Non-current assets 8,802Current liabilities 2,886Non-current liabilities 4,522Revenue from the sale of goods and services 4,141Loss for the period (64)Total comprehensive loss for the period (79)Net increase in cash and cash equivalents 144
ALH GROUP PTY LTD 1
2019$M
Current assets 452Non-current assets 4,331Current liabilities (1,800)Non-current liabilities (1,522)Revenue 4,672Profit after tax 222Total comprehensive income 222Net cash inflow 4
1 During the period, the Group completed the Restructure Scheme and ALH Merger to combine its Endeavour Drinks and Hotels businesses to create Endeavour Group. Effective from that date, ALH Group Pty Ltd was 100% owned by Endeavour Group Limited. The non-controlling interest of Endeavour Group Limited is 14.6%.
GROUPSTRUCTURE 5
5.3 SUBSIDIARIES (CONTINUED)
1
2
3
4
5
PERFORM
AN
CE
HIG
HLIG
HTS
BUSIN
ESS REV
IEWD
IRECTORS'
REPORT
FINA
NC
IAL
REPORT
OTH
ER IN
FORM
ATION
133W
OO
LWO
RTHS G
ROU
P A
NN
UA
L REPORT 2020
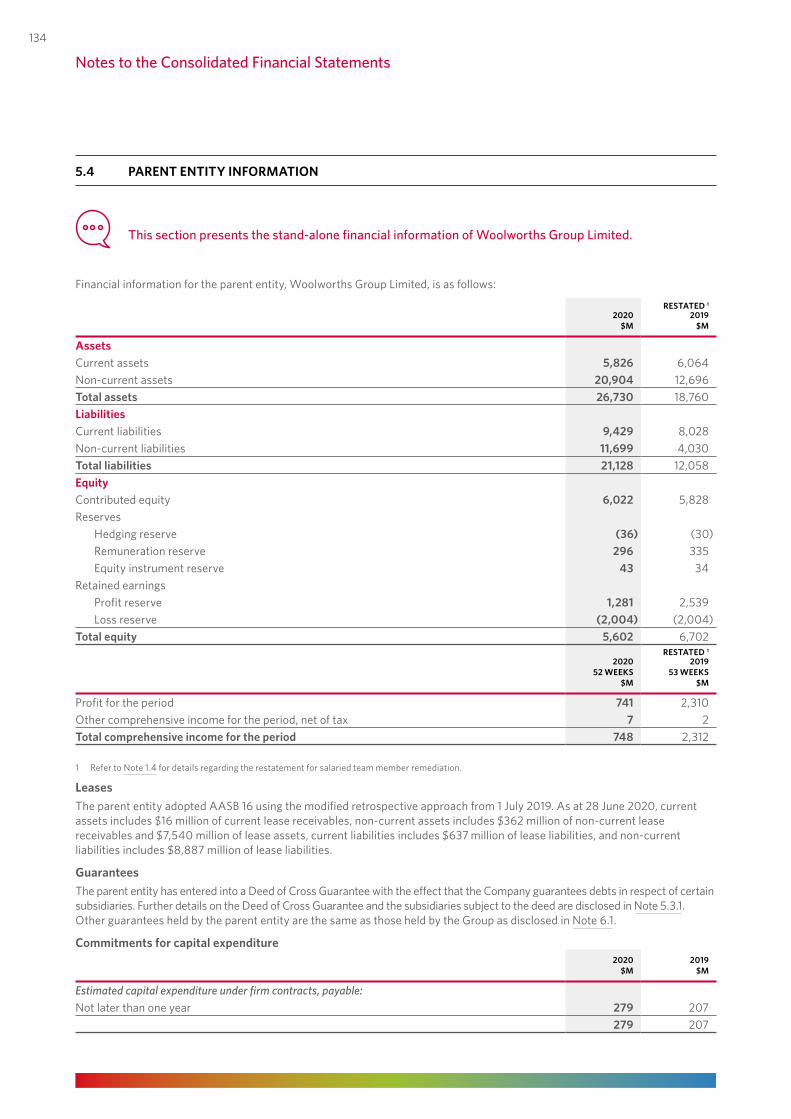
5.4 PARENT ENTITY INFORMATION
This section presents the stand‑alone financial information of Woolworths Group Limited.
Financial information for the parent entity, Woolworths Group Limited, is as follows:
2020RESTATED 1
2019$M $M
AssetsCurrent assets 5,826 6,064Non-current assets 20,904 12,696Total assets 26,730 18,760LiabilitiesCurrent liabilities 9,429 8,028Non-current liabilities 11,699 4,030Total liabilities 21,128 12,058EquityContributed equity 6,022 5,828Reserves
Hedging reserve (36) (30)Remuneration reserve 296 335Equity instrument reserve 43 34
Retained earningsProfit reserve 1,281 2,539Loss reserve (2,004) (2,004)
Total equity 5,602 6,702
2020RESTATED 1
201952 WEEKS 53 WEEKS
$M $M
Profit for the period 741 2,310Other comprehensive income for the period, net of tax 7 2Total comprehensive income for the period 748 2,312
1 Refer to Note 1.4 for details regarding the restatement for salaried team member remediation.
LeasesThe parent entity adopted AASB 16 using the modified retrospective approach from 1 July 2019. As at 28 June 2020, current assets includes $16 million of current lease receivables, non-current assets includes $362 million of non-current lease receivables and $7,540 million of lease assets, current liabilities includes $637 million of lease liabilities, and non-current liabilities includes $8,887 million of lease liabilities.
GuaranteesThe parent entity has entered into a Deed of Cross Guarantee with the effect that the Company guarantees debts in respect of certain subsidiaries. Further details on the Deed of Cross Guarantee and the subsidiaries subject to the deed are disclosed in Note 5.3.1. Other guarantees held by the parent entity are the same as those held by the Group as disclosed in Note 6.1.
Commitments for capital expenditure
2020 2019
$M $M
Estimated capital expenditure under firm contracts, payable:Not later than one year 279 207
279 207
Notes to the Consolidated Financial Statements
134
SIGNIFICANT ACCOUNTING POLICIES
Financial information for the Company, Woolworths Group Limited, has been prepared on the same basis as the Consolidated Financial Statements with the exception of investments in subsidiaries and lessor accounting.
Investments in subsidiariesInvestments in subsidiaries are accounted for at cost and are tested for impairment in accordance with the policy adopted for non-financial assets in Note 3.6.
Lessor accountingThe Company recognises amounts due from lessees under finance leases as receivables at the amount of the Company’s net investment in the leases. Finance lease income is allocated to accounting periods so as to reflect a constant periodic rate of return on the Company’s net investment outstanding in respect of the leases. The Company recognises lease payments received under operating leases as rental income on a straight-line basis over the lease term. Initial direct costs incurred in negotiating and arranging an operating lease are added to the carrying amount of the leased asset and recognised over the lease term on the same basis as rental income.
5.5 RELATED PARTIES
This section highlights the Group’s transactions with its related parties, such as its subsidiaries and Key Management Personnel.
Transactions within the GroupDuring the reporting period and previous reporting periods, Woolworths Group Limited advanced loans to, received and repaid loans from, and provided treasury, accounting, legal, taxation, and administrative services to other entities within the Group.
Entities within the Group also exchanged goods and services in sale and purchase transactions. All transactions occurred on the basis of normal commercial terms and conditions. Balances and transactions between the Company and its subsidiaries, which are related parties of the Company, have been eliminated on consolidation and are not disclosed in this note.
Directors and Key Management PersonnelAll transactions with directors and Key Management Personnel (including their related parties) were conducted on an arm’s length basis in the ordinary course of business and under normal terms and conditions for customers and employees. Related parties of Key Management Personnel who are employees received normal employee benefits on standard terms and conditions.
The total remuneration for Key Management Personnel of the Group is as follows:
2020 2019$ $
Short-term employee benefits 10,190,022 12,175,184Post employment benefits 169,512 322,733Other long-term benefits 109,341 161,569Share-based payments 6,476,698 9,177,425
16,945,573 21,836,911
Equity instrument disclosures relating to Key Management PersonnelDetails of equity instruments provided as compensation to Key Management Personnel and shares issued on exercise of these instruments, together with the terms and conditions of the instruments, are disclosed in the Remuneration Report.
GROUPSTRUCTURE 5
5.4 PARENT ENTITY INFORMATION (CONTINUED)
1
2
3
4
5
PERFORM
AN
CE
HIG
HLIG
HTS
BUSIN
ESS REV
IEWD
IRECTORS'
REPORT
FINA
NC
IAL
REPORT
OTH
ER IN
FORM
ATION
135
WO
OLW
ORTH
S GRO
UP
AN
NU
AL REPO
RT 2020
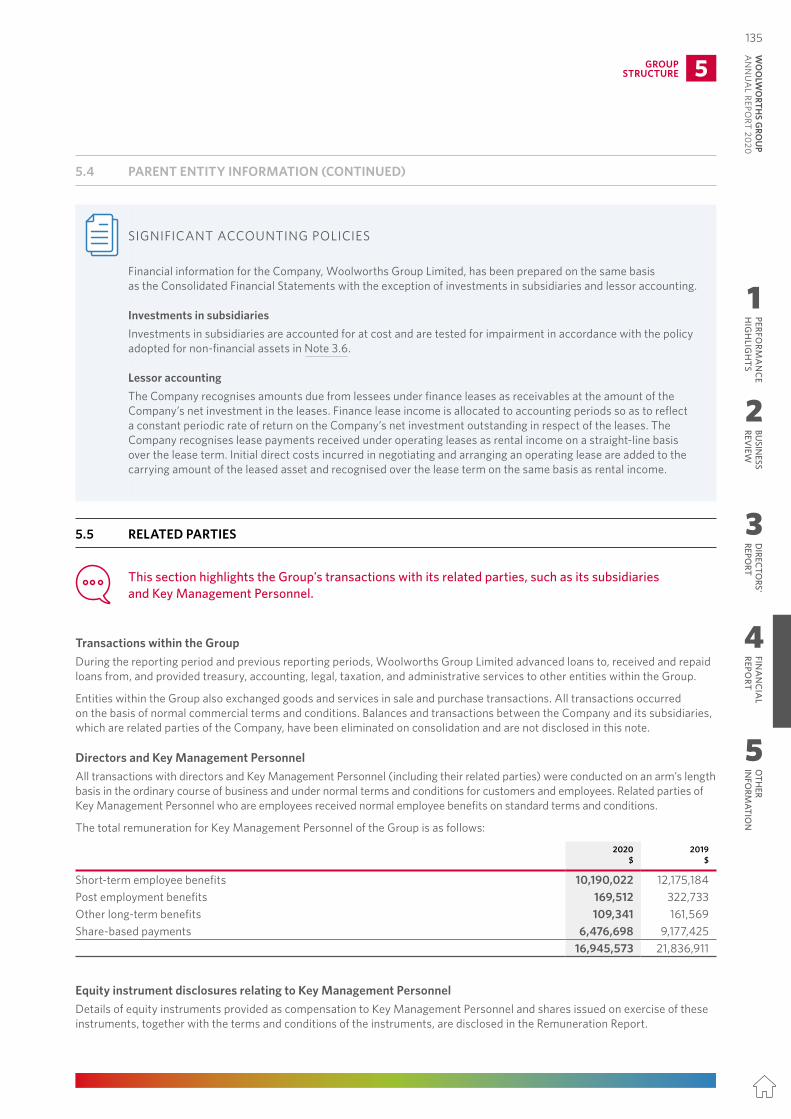
5.4 PARENT ENTITY INFORMATION
This section presents the stand‑alone financial information of Woolworths Group Limited.
Financial information for the parent entity, Woolworths Group Limited, is as follows:
2020RESTATED 1
2019$M $M
AssetsCurrent assets 5,826 6,064Non-current assets 20,904 12,696Total assets 26,730 18,760LiabilitiesCurrent liabilities 9,429 8,028Non-current liabilities 11,699 4,030Total liabilities 21,128 12,058EquityContributed equity 6,022 5,828Reserves
Hedging reserve (36) (30)Remuneration reserve 296 335Equity instrument reserve 43 34
Retained earningsProfit reserve 1,281 2,539Loss reserve (2,004) (2,004)
Total equity 5,602 6,702
2020RESTATED 1
201952 WEEKS 53 WEEKS
$M $M
Profit for the period 741 2,310Other comprehensive income for the period, net of tax 7 2Total comprehensive income for the period 748 2,312
1 Refer to Note 1.4 for details regarding the restatement for salaried team member remediation.
LeasesThe parent entity adopted AASB 16 using the modified retrospective approach from 1 July 2019. As at 28 June 2020, current assets includes $16 million of current lease receivables, non-current assets includes $362 million of non-current lease receivables and $7,540 million of lease assets, current liabilities includes $637 million of lease liabilities, and non-current liabilities includes $8,887 million of lease liabilities.
GuaranteesThe parent entity has entered into a Deed of Cross Guarantee with the effect that the Company guarantees debts in respect of certain subsidiaries. Further details on the Deed of Cross Guarantee and the subsidiaries subject to the deed are disclosed in Note 5.3.1. Other guarantees held by the parent entity are the same as those held by the Group as disclosed in Note 6.1.
Commitments for capital expenditure
2020 2019
$M $M
Estimated capital expenditure under firm contracts, payable:Not later than one year 279 207
279 207
Notes to the Consolidated Financial Statements
134
SIGNIFICANT ACCOUNTING POLICIES
Financial information for the Company, Woolworths Group Limited, has been prepared on the same basis as the Consolidated Financial Statements with the exception of investments in subsidiaries and lessor accounting.
Investments in subsidiariesInvestments in subsidiaries are accounted for at cost and are tested for impairment in accordance with the policy adopted for non-financial assets in Note 3.6.
Lessor accountingThe Company recognises amounts due from lessees under finance leases as receivables at the amount of the Company’s net investment in the leases. Finance lease income is allocated to accounting periods so as to reflect a constant periodic rate of return on the Company’s net investment outstanding in respect of the leases. The Company recognises lease payments received under operating leases as rental income on a straight-line basis over the lease term. Initial direct costs incurred in negotiating and arranging an operating lease are added to the carrying amount of the leased asset and recognised over the lease term on the same basis as rental income.
5.5 RELATED PARTIES
This section highlights the Group’s transactions with its related parties, such as its subsidiaries and Key Management Personnel.
Transactions within the GroupDuring the reporting period and previous reporting periods, Woolworths Group Limited advanced loans to, received and repaid loans from, and provided treasury, accounting, legal, taxation, and administrative services to other entities within the Group.
Entities within the Group also exchanged goods and services in sale and purchase transactions. All transactions occurred on the basis of normal commercial terms and conditions. Balances and transactions between the Company and its subsidiaries, which are related parties of the Company, have been eliminated on consolidation and are not disclosed in this note.
Directors and Key Management PersonnelAll transactions with directors and Key Management Personnel (including their related parties) were conducted on an arm’s length basis in the ordinary course of business and under normal terms and conditions for customers and employees. Related parties of Key Management Personnel who are employees received normal employee benefits on standard terms and conditions.
The total remuneration for Key Management Personnel of the Group is as follows:
2020 2019$ $
Short-term employee benefits 10,190,022 12,175,184Post employment benefits 169,512 322,733Other long-term benefits 109,341 161,569Share-based payments 6,476,698 9,177,425
16,945,573 21,836,911
Equity instrument disclosures relating to Key Management PersonnelDetails of equity instruments provided as compensation to Key Management Personnel and shares issued on exercise of these instruments, together with the terms and conditions of the instruments, are disclosed in the Remuneration Report.
GROUPSTRUCTURE 5
5.4 PARENT ENTITY INFORMATION (CONTINUED)
1
2
3
4
5
PERFORM
AN
CE
HIG
HLIG
HTS
BUSIN
ESS REV
IEWD
IRECTORS'
REPORT
FINA
NC
IAL
REPORT
OTH
ER IN
FORM
ATION
135W
OO
LWO
RTHS G
ROU
P A
NN
UA
L REPORT 2020
6 OTHER
6.1 CONTINGENT LIABILITIES
Contingent liabilities are potential future cash payments where the likelihood of payment is not considered probable or cannot be measured reliably.
The Group has entered the following guarantees however the probability of having to make a payment under these guarantees is considered remote: • Guarantees in the normal course of business relating to conditions set out in development applications and for the sale
of properties; and • Guarantees against workers’ compensation self-insurance liabilities as required by State WorkCover authorities.
The guarantees are based on independent actuarial advice of the outstanding liability.
No provision has been made in the Consolidated Financial Statements in respect of these contingencies, however there is a provision of $637 million for self-insured risks (2019: $603 million), which includes liabilities relating to workers’ compensation claims, that have been recognised in the Consolidated Statement of Financial Position at the reporting date.
6.2 EMPLOYEE BENEFITS
This section presents the Group’s benefits provided to its employees, including salaries, bonuses, superannuation, share schemes, and defined benefit plans.
6.2.1 Employee benefits expense from continuing operations
2020RESTATED 1
201952 WEEKS 53 WEEKS
$M $M
Remuneration and on-costs 2 8,837 7,905 Superannuation expense 637 613 Share-based payments expense 96 62
9,570 8,580
1 Refer to Note 1.4 for details regarding the restatement for salaried team member remediation.2 Includes amounts relating to the Group’s compliance with the General Retail Industry Award in the current period and a significant items charge of
$185 million relating to salaried team member remediation for prior periods (2019: $52 million). Refer to Notes 1.4 and 1.5 for further details.
6.2.2 Share‑based payments
Long‑Term Incentive (LTI) planEquity settled share-based payments form part of the remuneration of eligible employees of the Group. The Group continues to operate the Woolworths Long-Term Incentive (LTI) plan.
All sub-plans within the LTI plan are subject to performance hurdles being met. The Group’s sub-plans are as follows:• Performance rights sub-plan – delivers a right to acquire a share at a future date;• Performance shares sub-plan – delivers a right to acquire a share immediately; and• Cash award sub-plan – delivers a right to acquire cash at a future date.
No grants have been made under the performance shares or cash award sub-plans.
The performance rights sub-plan has been used to make long-term incentive offers to eligible employees. Upon exercise, each performance right offered under this sub-plan entitles the holder to one ordinary fully paid Woolworths Group Limited share.
Notes to the Consolidated Financial Statements
136
6.2.2 Share‑based payments (continued)
A summary of the LTI plan performance hurdles for all outstanding grants is as follows:
RELATIVE TOTAL SHAREHOLDER RETURN (TSR)
SALES PER TRADING SQUARE METRE
(SQM) 1RETURN ON FUNDS EMPLOYED (ROFE) 1
GRANT YEAR
VESTING PERIOD
(YEARS)WEIGHTING
(%)
HURDLE/ RANGE
(PERCENTILE)WEIGHTING
(%)WEIGHTING
(%)
F18 2 Three 33.34 50th – 90th 33.33 33.33F19 3 Three 33.34 50th – 75th 33.33 33.33F20 3 Three 33.34 50th – 75th 33.33 33.33
1 Hurdle/range not published (np) for sales per trading SQM and ROFE for the F18, F19, and F20 grants, as the Group does not provide market guidance on these metrics and the targets are commercially sensitive. The LTI targets and performance will be published following the end of the performance period.
2 The TSR component vests progressively upon attaining the gateway share price and where TSR equals or exceeds the 50th percentile of the comparator group up to the full 33.34% vesting, where TSR equals the 90th percentile of the comparator group. Sales per trading SQM and ROFE components vest progressively, upon attaining certain hurdles, to a maximum weighting of 33.33% respectively.
3 The TSR component vests progressively where TSR equals or exceeds the 50th percentile of the comparator group up to the full 33.34% vesting, where TSR equals the 75th percentile of the comparator group. Sales per trading SQM and ROFE components vest progressively, upon attaining certain hurdles, to a maximum weighting of 33.33% respectively.
Deferred Short‑Term Incentive (Deferred STI)The performance rights sub-plan has also been used to make offers of Deferred STI which have the following features:• For the F18, F19, and F20 Deferred STI plan, a one-year performance measure linked to sales, EBIT, working capital,
customer satisfaction, and safety; and• If the performance hurdles are met, participants are required to remain employed for a further two years to gain access
to the performance rights, or otherwise forfeit the performance rights unless the board exercises its discretion in accordance with the performance rights sub-plan rules.
Sign‑on and retention rightsThe performance rights sub-plan has also been used to compensate new hires for foregone equity, and ensure that key employees are retained to protect and deliver on the Group’s strategic direction. It has been offered to:• Executives of newly acquired businesses in order to retain intellectual property during transition periods; or• Attract new executives.Sign-on and retention rights generally do not have performance measures attached to them due to the objective of retaining key talent and vest subject to the executive remaining employed by the Group, generally for two or more years.
Recognition share planThe performance rights sub-plan has also been used to reward employees of the Group. Participants are required to meet a service condition to gain access to the performance rights.
Movements in outstanding performance rightsThe following table summarises movements in outstanding rights:
2020 2019NO. OF RIGHTS NO. OF RIGHTS
Outstanding at start of period 13,477,758 10,692,594Granted during the period 4,230,388 4,465,617Vested during the period (4,664,750) (182,601)Lapsed during the period (1,323,091) (1,497,852)Outstanding at end of period 11,720,305 13,477,758
OTHER 6
6.2 EMPLOYEE BENEFITS (CONTINUED)
1
2
3
4
5
PERFORM
AN
CE
HIG
HLIG
HTS
BUSIN
ESS REV
IEWD
IRECTORS'
REPORT
FINA
NC
IAL
REPORT
OTH
ER IN
FORM
ATION
137
WO
OLW
ORTH
S GRO
UP
AN
NU
AL REPO
RT 2020
6 OTHER
6.1 CONTINGENT LIABILITIES
Contingent liabilities are potential future cash payments where the likelihood of payment is not considered probable or cannot be measured reliably.
The Group has entered the following guarantees however the probability of having to make a payment under these guarantees is considered remote: • Guarantees in the normal course of business relating to conditions set out in development applications and for the sale
of properties; and • Guarantees against workers’ compensation self-insurance liabilities as required by State WorkCover authorities.
The guarantees are based on independent actuarial advice of the outstanding liability.
No provision has been made in the Consolidated Financial Statements in respect of these contingencies, however there is a provision of $637 million for self-insured risks (2019: $603 million), which includes liabilities relating to workers’ compensation claims, that have been recognised in the Consolidated Statement of Financial Position at the reporting date.
6.2 EMPLOYEE BENEFITS
This section presents the Group’s benefits provided to its employees, including salaries, bonuses, superannuation, share schemes, and defined benefit plans.
6.2.1 Employee benefits expense from continuing operations
2020RESTATED 1
201952 WEEKS 53 WEEKS
$M $M
Remuneration and on-costs 2 8,837 7,905 Superannuation expense 637 613 Share-based payments expense 96 62
9,570 8,580
1 Refer to Note 1.4 for details regarding the restatement for salaried team member remediation.2 Includes amounts relating to the Group’s compliance with the General Retail Industry Award in the current period and a significant items charge of
$185 million relating to salaried team member remediation for prior periods (2019: $52 million). Refer to Notes 1.4 and 1.5 for further details.
6.2.2 Share‑based payments
Long‑Term Incentive (LTI) planEquity settled share-based payments form part of the remuneration of eligible employees of the Group. The Group continues to operate the Woolworths Long-Term Incentive (LTI) plan.
All sub-plans within the LTI plan are subject to performance hurdles being met. The Group’s sub-plans are as follows:• Performance rights sub-plan – delivers a right to acquire a share at a future date;• Performance shares sub-plan – delivers a right to acquire a share immediately; and• Cash award sub-plan – delivers a right to acquire cash at a future date.
No grants have been made under the performance shares or cash award sub-plans.
The performance rights sub-plan has been used to make long-term incentive offers to eligible employees. Upon exercise, each performance right offered under this sub-plan entitles the holder to one ordinary fully paid Woolworths Group Limited share.
Notes to the Consolidated Financial Statements
136
6.2.2 Share‑based payments (continued)
A summary of the LTI plan performance hurdles for all outstanding grants is as follows:
RELATIVE TOTAL SHAREHOLDER RETURN (TSR)
SALES PER TRADING SQUARE METRE
(SQM) 1RETURN ON FUNDS EMPLOYED (ROFE) 1
GRANT YEAR
VESTING PERIOD
(YEARS)WEIGHTING
(%)
HURDLE/ RANGE
(PERCENTILE)WEIGHTING
(%)WEIGHTING
(%)
F18 2 Three 33.34 50th – 90th 33.33 33.33F19 3 Three 33.34 50th – 75th 33.33 33.33F20 3 Three 33.34 50th – 75th 33.33 33.33
1 Hurdle/range not published (np) for sales per trading SQM and ROFE for the F18, F19, and F20 grants, as the Group does not provide market guidance on these metrics and the targets are commercially sensitive. The LTI targets and performance will be published following the end of the performance period.
2 The TSR component vests progressively upon attaining the gateway share price and where TSR equals or exceeds the 50th percentile of the comparator group up to the full 33.34% vesting, where TSR equals the 90th percentile of the comparator group. Sales per trading SQM and ROFE components vest progressively, upon attaining certain hurdles, to a maximum weighting of 33.33% respectively.
3 The TSR component vests progressively where TSR equals or exceeds the 50th percentile of the comparator group up to the full 33.34% vesting, where TSR equals the 75th percentile of the comparator group. Sales per trading SQM and ROFE components vest progressively, upon attaining certain hurdles, to a maximum weighting of 33.33% respectively.
Deferred Short‑Term Incentive (Deferred STI)The performance rights sub-plan has also been used to make offers of Deferred STI which have the following features:• For the F18, F19, and F20 Deferred STI plan, a one-year performance measure linked to sales, EBIT, working capital,
customer satisfaction, and safety; and• If the performance hurdles are met, participants are required to remain employed for a further two years to gain access
to the performance rights, or otherwise forfeit the performance rights unless the board exercises its discretion in accordance with the performance rights sub-plan rules.
Sign‑on and retention rightsThe performance rights sub-plan has also been used to compensate new hires for foregone equity, and ensure that key employees are retained to protect and deliver on the Group’s strategic direction. It has been offered to:• Executives of newly acquired businesses in order to retain intellectual property during transition periods; or• Attract new executives.Sign-on and retention rights generally do not have performance measures attached to them due to the objective of retaining key talent and vest subject to the executive remaining employed by the Group, generally for two or more years.
Recognition share planThe performance rights sub-plan has also been used to reward employees of the Group. Participants are required to meet a service condition to gain access to the performance rights.
Movements in outstanding performance rightsThe following table summarises movements in outstanding rights:
2020 2019NO. OF RIGHTS NO. OF RIGHTS
Outstanding at start of period 13,477,758 10,692,594Granted during the period 4,230,388 4,465,617Vested during the period (4,664,750) (182,601)Lapsed during the period (1,323,091) (1,497,852)Outstanding at end of period 11,720,305 13,477,758
OTHER 6
6.2 EMPLOYEE BENEFITS (CONTINUED)
1
2
3
4
5
PERFORM
AN
CE
HIG
HLIG
HTS
BUSIN
ESS REV
IEWD
IRECTORS'
REPORT
FINA
NC
IAL
REPORT
OTH
ER IN
FORM
ATION
137W
OO
LWO
RTHS G
ROU
P A
NN
UA
L REPORT 2020
6.2.2 Share‑based payments (continued)Share-based payments expense for the period was $95,696,477 (2019: $62,028,117). The variables in the table below are used as inputs into the model to determine the fair value of performance rights.
2020 2019F20 LTI F19 LTI
Grant date 1 1 Jul 2019 30 Nov 2018Performance period start date 1 Jul 2019 1 Jul 2018Exercise date 1 Jul 2022 1 Jul 2021Expected volatility 2 15.0% 15.0%Expected dividend yield 4.0% 4.0%Risk-free interest rate 1.0% 2.1%Weighted average fair value at grant date $27.86 $24.641 Grant date represents the date on which there is a shared understanding of the terms and conditions of the arrangement.2 The expected volatility is based on the historical implied volatility calculated based on the weighted average remaining life of the performance rights adjusted
for any expected changes to future volatility due to publicly available information.
SIGNIFICANT ACCOUNTING POLICIES
Share‑based paymentsThe grant date fair value of equity-settled share-based payments is recognised as an expense proportionally over the vesting period, with a corresponding increase in equity.
The fair value of instruments with market-based performance conditions (e.g. TSR) is calculated at the date of grant using a Monte Carlo simulation model. The probability of achieving market-based performance conditions is incorporated into the determination of the fair value per instrument.
The fair value of instruments with non-market-based performance conditions (e.g. EPS, sales per trading SQM, ROFE) and service conditions and retention rights is calculated using a Black-Scholes option pricing model.
The amount recognised as an expense over the vesting period is adjusted to reflect the actual number of instruments that vest except where forfeiture is due to failure to achieve market-based performance conditions.
6.2.3 Share schemesThe total shares purchased during the year were 423,979 (2019: 491,884) at an average price per share of $37.49 (2019: $29.66), comprised of purchases under the Employee Share Purchase Plan and the Non-executive Directors’ Equity Plan. No additional expense is recognised in relation to these shares as they are acquired out of salary sacrificed remuneration.
Employee Share Purchase Plan (SPP)The SPP provides permanent full-time and part-time employees who are Australian tax residents and are aged 18 years or over with the opportunity to purchase shares from pre-tax income via salary sacrifice. The Group pays the associated brokerage costs.
Non‑executive Directors’ Equity Plan (NEDP)The NEDP allows Non-executive Directors to acquire share rights through a pre-tax fee sacrifice plan.
Notes to the Consolidated Financial Statements
6.2 EMPLOYEE BENEFITS (CONTINUED)
138
6.2.4 Retirement plans
Defined benefit plansThe Company sponsors a defined benefit plan, the Woolworths Group Superannuation Plan (WGSP or the Plan), that provides superannuation benefits for employees upon retirement. The defined benefit plan is closed to new members. The assets of the WGSP are held in a sub-plan within AMP SignatureSuper that is legally separated from the Group. The WGSP invests entirely in pooled unit trust products where prices are quoted on a daily basis.
The WGSP consists of members with defined benefit entitlements and defined contribution benefits. The plan also pays allocated pensions to a small number of pensioners. The following disclosures relate only to the Group’s obligation in respect of defined benefit entitlements.
The Group contributes to the WGSP at rates as set out in the Trust Deed and Rules and the Participation Deed between the Group and AMP Superannuation Limited. Members contribute to the WGSP at rates dependent upon their membership category. The plan provides lump sum defined benefits that are defined by salary and period of membership.
An actuarial valuation was carried out at both reporting dates by Mr Nicholas Wilkinson, FIAA, Willis Towers Watson. The principal actuarial assumptions used for the purpose of the valuation are as follows:
2020 2019% %
Discount rate 2.3 2.9Expected rate of salary increase 2.5 2.5Rate of price inflation 2.0 2.0
The average duration of the defined benefit obligation at the end of the reporting period is 6.4 years (2019: 6.8 years) which relates wholly to active participants.
(i) Categories of plan assetsThe plan invests entirely in pooled superannuation trust products where prices are quoted daily. The asset allocation of the plan has been set taking into account the membership profile, the liquidity requirements of the plan, and risk appetite of the Group.
The percentage invested in each asset class is as follows:
2020 2019% %
Equity instruments 56.0 53.9Debt instruments 20.0 18.6Real estate 6.0 10.8Cash and cash equivalents 3.0 3.7Other 15.0 13.0Total 100.0 100.0
OTHER 6
6.2 EMPLOYEE BENEFITS (CONTINUED)
1
2
3
4
5
PERFORM
AN
CE
HIG
HLIG
HTS
BUSIN
ESS REV
IEWD
IRECTORS'
REPORT
FINA
NC
IAL
REPORT
OTH
ER IN
FORM
ATION
139
WO
OLW
ORTH
S GRO
UP
AN
NU
AL REPO
RT 2020
6.2.2 Share‑based payments (continued)Share-based payments expense for the period was $95,696,477 (2019: $62,028,117). The variables in the table below are used as inputs into the model to determine the fair value of performance rights.
2020 2019F20 LTI F19 LTI
Grant date 1 1 Jul 2019 30 Nov 2018Performance period start date 1 Jul 2019 1 Jul 2018Exercise date 1 Jul 2022 1 Jul 2021Expected volatility 2 15.0% 15.0%Expected dividend yield 4.0% 4.0%Risk-free interest rate 1.0% 2.1%Weighted average fair value at grant date $27.86 $24.641 Grant date represents the date on which there is a shared understanding of the terms and conditions of the arrangement.2 The expected volatility is based on the historical implied volatility calculated based on the weighted average remaining life of the performance rights adjusted
for any expected changes to future volatility due to publicly available information.
SIGNIFICANT ACCOUNTING POLICIES
Share‑based paymentsThe grant date fair value of equity-settled share-based payments is recognised as an expense proportionally over the vesting period, with a corresponding increase in equity.
The fair value of instruments with market-based performance conditions (e.g. TSR) is calculated at the date of grant using a Monte Carlo simulation model. The probability of achieving market-based performance conditions is incorporated into the determination of the fair value per instrument.
The fair value of instruments with non-market-based performance conditions (e.g. EPS, sales per trading SQM, ROFE) and service conditions and retention rights is calculated using a Black-Scholes option pricing model.
The amount recognised as an expense over the vesting period is adjusted to reflect the actual number of instruments that vest except where forfeiture is due to failure to achieve market-based performance conditions.
6.2.3 Share schemesThe total shares purchased during the year were 423,979 (2019: 491,884) at an average price per share of $37.49 (2019: $29.66), comprised of purchases under the Employee Share Purchase Plan and the Non-executive Directors’ Equity Plan. No additional expense is recognised in relation to these shares as they are acquired out of salary sacrificed remuneration.
Employee Share Purchase Plan (SPP)The SPP provides permanent full-time and part-time employees who are Australian tax residents and are aged 18 years or over with the opportunity to purchase shares from pre-tax income via salary sacrifice. The Group pays the associated brokerage costs.
Non‑executive Directors’ Equity Plan (NEDP)The NEDP allows Non-executive Directors to acquire share rights through a pre-tax fee sacrifice plan.
Notes to the Consolidated Financial Statements
6.2 EMPLOYEE BENEFITS (CONTINUED)
138
6.2.4 Retirement plans
Defined benefit plansThe Company sponsors a defined benefit plan, the Woolworths Group Superannuation Plan (WGSP or the Plan), that provides superannuation benefits for employees upon retirement. The defined benefit plan is closed to new members. The assets of the WGSP are held in a sub-plan within AMP SignatureSuper that is legally separated from the Group. The WGSP invests entirely in pooled unit trust products where prices are quoted on a daily basis.
The WGSP consists of members with defined benefit entitlements and defined contribution benefits. The plan also pays allocated pensions to a small number of pensioners. The following disclosures relate only to the Group’s obligation in respect of defined benefit entitlements.
The Group contributes to the WGSP at rates as set out in the Trust Deed and Rules and the Participation Deed between the Group and AMP Superannuation Limited. Members contribute to the WGSP at rates dependent upon their membership category. The plan provides lump sum defined benefits that are defined by salary and period of membership.
An actuarial valuation was carried out at both reporting dates by Mr Nicholas Wilkinson, FIAA, Willis Towers Watson. The principal actuarial assumptions used for the purpose of the valuation are as follows:
2020 2019% %
Discount rate 2.3 2.9Expected rate of salary increase 2.5 2.5Rate of price inflation 2.0 2.0
The average duration of the defined benefit obligation at the end of the reporting period is 6.4 years (2019: 6.8 years) which relates wholly to active participants.
(i) Categories of plan assetsThe plan invests entirely in pooled superannuation trust products where prices are quoted daily. The asset allocation of the plan has been set taking into account the membership profile, the liquidity requirements of the plan, and risk appetite of the Group.
The percentage invested in each asset class is as follows:
2020 2019% %
Equity instruments 56.0 53.9Debt instruments 20.0 18.6Real estate 6.0 10.8Cash and cash equivalents 3.0 3.7Other 15.0 13.0Total 100.0 100.0
OTHER 6
6.2 EMPLOYEE BENEFITS (CONTINUED)
1
2
3
4
5
PERFORM
AN
CE
HIG
HLIG
HTS
BUSIN
ESS REV
IEWD
IRECTORS'
REPORT
FINA
NC
IAL
REPORT
OTH
ER IN
FORM
ATION
139W
OO
LWO
RTHS G
ROU
P A
NN
UA
L REPORT 2020
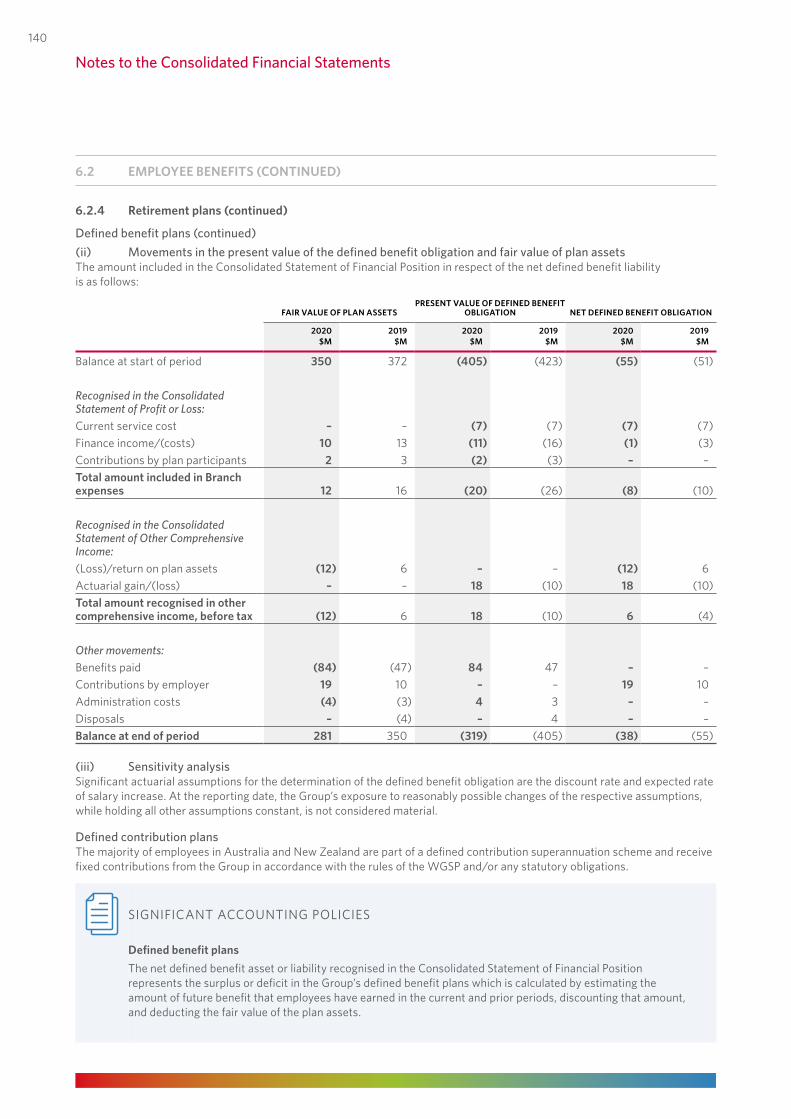
6.2.4 Retirement plans (continued)
Defined benefit plans (continued)(ii) Movements in the present value of the defined benefit obligation and fair value of plan assetsThe amount included in the Consolidated Statement of Financial Position in respect of the net defined benefit liability is as follows:
FAIR VALUE OF PLAN ASSETSPRESENT VALUE OF DEFINED BENEFIT
OBLIGATION NET DEFINED BENEFIT OBLIGATION
2020 2019 2020 2019 2020 2019$M $M $M $M $M $M
Balance at start of period 350 372 (405) (423) (55) (51)
Recognised in the Consolidated Statement of Profit or Loss:Current service cost – – (7) (7) (7) (7)Finance income/(costs) 10 13 (11) (16) (1) (3)Contributions by plan participants 2 3 (2) (3) – –Total amount included in Branch expenses 12 16 (20) (26) (8) (10)
Recognised in the Consolidated Statement of Other Comprehensive Income:(Loss)/return on plan assets (12) 6 – – (12) 6Actuarial gain/(loss) – – 18 (10) 18 (10)Total amount recognised in other comprehensive income, before tax (12) 6 18 (10) 6 (4)
Other movements:Benefits paid (84) (47) 84 47 – –Contributions by employer 19 10 – – 19 10Administration costs (4) (3) 4 3 – –Disposals – (4) – 4 – –Balance at end of period 281 350 (319) (405) (38) (55)
(iii) Sensitivity analysisSignificant actuarial assumptions for the determination of the defined benefit obligation are the discount rate and expected rate of salary increase. At the reporting date, the Group’s exposure to reasonably possible changes of the respective assumptions, while holding all other assumptions constant, is not considered material.
Defined contribution plansThe majority of employees in Australia and New Zealand are part of a defined contribution superannuation scheme and receive fixed contributions from the Group in accordance with the rules of the WGSP and/or any statutory obligations.
SIGNIFICANT ACCOUNTING POLICIES
Defined benefit plansThe net defined benefit asset or liability recognised in the Consolidated Statement of Financial Position represents the surplus or deficit in the Group’s defined benefit plans which is calculated by estimating the amount of future benefit that employees have earned in the current and prior periods, discounting that amount, and deducting the fair value of the plan assets.
Notes to the Consolidated Financial Statements
6.2 EMPLOYEE BENEFITS (CONTINUED)
140
6.2.4 Retirement plans (continued)
SIGNIFICANT ACCOUNTING POLICIES (CONTINUED)
Defined benefit plans (continued)
The calculation of the defined benefit obligation is performed at the end of each annual reporting period by a qualified actuary using the projected unit credit method.
Remeasurements of the net defined benefit asset or liability, which comprise actuarial gains and losses, and the return on plan assets (excluding interest), are recognised in the period in which they occur, directly in other comprehensive income and will not be reclassified to profit or loss.
The Group determines the net interest income or expense on the net defined benefit asset or liability for the period by applying the discount rate at the start of the period to the net defined benefit asset or liability, taking into account any changes during the period as a result of contributions and benefit payments. Net interest income or expense, service cost and other expenses related to defined benefit plans are recognised in the Consolidated Statement of Profit or Loss.
Defined contribution plansPayments to defined contribution plans are recognised as an expense when employees have rendered service entitling them to the contributions.
6.3 AUDITORS’ REMUNERATION
This section presents the total remuneration of the Group’s external auditors for audit, assurance, and other services.
The auditors’ remuneration for the Group is as follows:
2020 2019$’000 $’000
Deloitte and related network firmsAudit or review of the financial reports:
Group 2,115 1,983Subsidiaries 2,562 1,504
Total audit or review of the financial reports 4,677 3,487
Statutory assurance services required by legislation to be provided by the auditor 55 –Other assurance and agreed-upon procedures under other legislation or contractual agreements1 1,269 566Other services:
Tax compliance services 158 62Consulting services 2 1,741 –Other non-assurance services 134 47
Total other services 2,033 1098,034 4,162
1 Other assurance and agreed upon procedures in 2020 include $875,000 in relation to assurance services with respect to the Endeavour Group Transformation, and $130,000 in relation to review of the Sustainability Report.
2 Consulting services represent fees for work performed by a service provider to the Group which was acquired by Deloitte during 2020. The Group had service agreements in place with the provider prior the Deloitte acquisition. These services have transitioned to a new service provider and no further services will be provided in 2021.
OTHER 6
6.2 EMPLOYEE BENEFITS (CONTINUED)
1
2
3
4
5
PERFORM
AN
CE
HIG
HLIG
HTS
BUSIN
ESS REV
IEWD
IRECTORS'
REPORT
FINA
NC
IAL
REPORT
OTH
ER IN
FORM
ATION
141
WO
OLW
ORTH
S GRO
UP
AN
NU
AL REPO
RT 2020
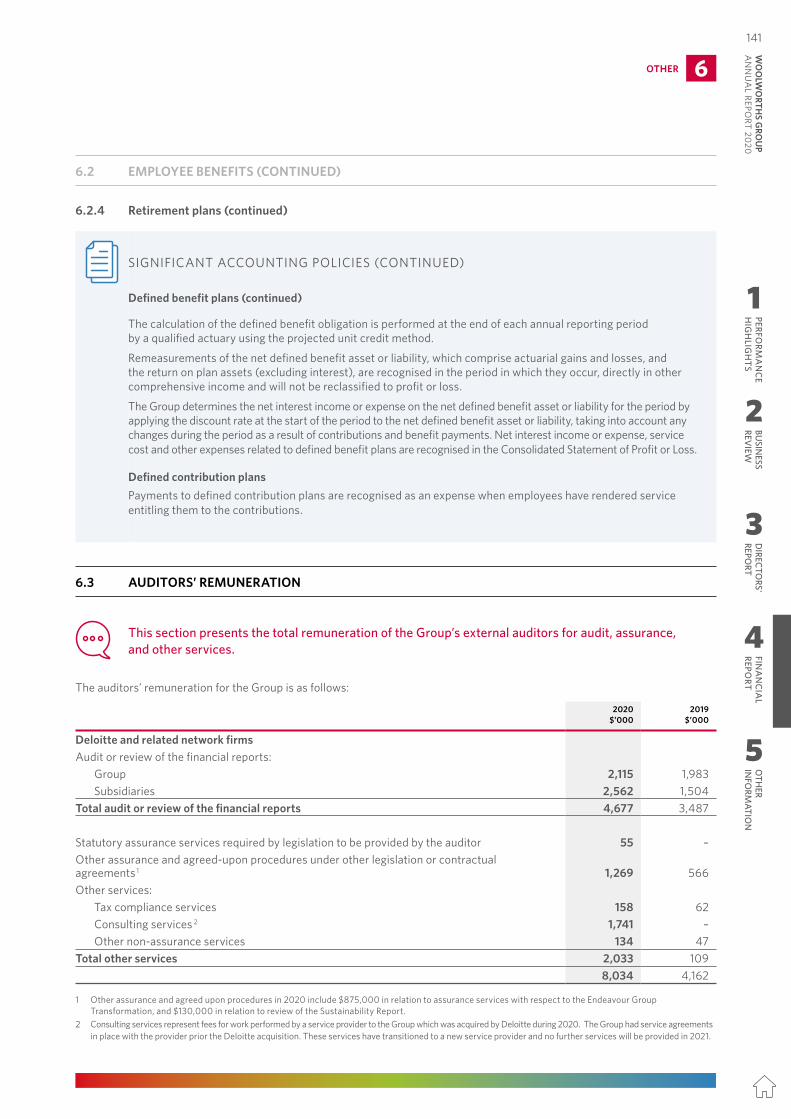
6.2.4 Retirement plans (continued)
Defined benefit plans (continued)(ii) Movements in the present value of the defined benefit obligation and fair value of plan assetsThe amount included in the Consolidated Statement of Financial Position in respect of the net defined benefit liability is as follows:
FAIR VALUE OF PLAN ASSETSPRESENT VALUE OF DEFINED BENEFIT
OBLIGATION NET DEFINED BENEFIT OBLIGATION
2020 2019 2020 2019 2020 2019$M $M $M $M $M $M
Balance at start of period 350 372 (405) (423) (55) (51)
Recognised in the Consolidated Statement of Profit or Loss:Current service cost – – (7) (7) (7) (7)Finance income/(costs) 10 13 (11) (16) (1) (3)Contributions by plan participants 2 3 (2) (3) – –Total amount included in Branch expenses 12 16 (20) (26) (8) (10)
Recognised in the Consolidated Statement of Other Comprehensive Income:(Loss)/return on plan assets (12) 6 – – (12) 6Actuarial gain/(loss) – – 18 (10) 18 (10)Total amount recognised in other comprehensive income, before tax (12) 6 18 (10) 6 (4)
Other movements:Benefits paid (84) (47) 84 47 – –Contributions by employer 19 10 – – 19 10Administration costs (4) (3) 4 3 – –Disposals – (4) – 4 – –Balance at end of period 281 350 (319) (405) (38) (55)
(iii) Sensitivity analysisSignificant actuarial assumptions for the determination of the defined benefit obligation are the discount rate and expected rate of salary increase. At the reporting date, the Group’s exposure to reasonably possible changes of the respective assumptions, while holding all other assumptions constant, is not considered material.
Defined contribution plansThe majority of employees in Australia and New Zealand are part of a defined contribution superannuation scheme and receive fixed contributions from the Group in accordance with the rules of the WGSP and/or any statutory obligations.
SIGNIFICANT ACCOUNTING POLICIES
Defined benefit plansThe net defined benefit asset or liability recognised in the Consolidated Statement of Financial Position represents the surplus or deficit in the Group’s defined benefit plans which is calculated by estimating the amount of future benefit that employees have earned in the current and prior periods, discounting that amount, and deducting the fair value of the plan assets.
Notes to the Consolidated Financial Statements
6.2 EMPLOYEE BENEFITS (CONTINUED)
140
6.2.4 Retirement plans (continued)
SIGNIFICANT ACCOUNTING POLICIES (CONTINUED)
Defined benefit plans (continued)
The calculation of the defined benefit obligation is performed at the end of each annual reporting period by a qualified actuary using the projected unit credit method.
Remeasurements of the net defined benefit asset or liability, which comprise actuarial gains and losses, and the return on plan assets (excluding interest), are recognised in the period in which they occur, directly in other comprehensive income and will not be reclassified to profit or loss.
The Group determines the net interest income or expense on the net defined benefit asset or liability for the period by applying the discount rate at the start of the period to the net defined benefit asset or liability, taking into account any changes during the period as a result of contributions and benefit payments. Net interest income or expense, service cost and other expenses related to defined benefit plans are recognised in the Consolidated Statement of Profit or Loss.
Defined contribution plansPayments to defined contribution plans are recognised as an expense when employees have rendered service entitling them to the contributions.
6.3 AUDITORS’ REMUNERATION
This section presents the total remuneration of the Group’s external auditors for audit, assurance, and other services.
The auditors’ remuneration for the Group is as follows:
2020 2019$’000 $’000
Deloitte and related network firmsAudit or review of the financial reports:
Group 2,115 1,983Subsidiaries 2,562 1,504
Total audit or review of the financial reports 4,677 3,487
Statutory assurance services required by legislation to be provided by the auditor 55 –Other assurance and agreed-upon procedures under other legislation or contractual agreements1 1,269 566Other services:
Tax compliance services 158 62Consulting services 2 1,741 –Other non-assurance services 134 47
Total other services 2,033 1098,034 4,162
1 Other assurance and agreed upon procedures in 2020 include $875,000 in relation to assurance services with respect to the Endeavour Group Transformation, and $130,000 in relation to review of the Sustainability Report.
2 Consulting services represent fees for work performed by a service provider to the Group which was acquired by Deloitte during 2020. The Group had service agreements in place with the provider prior the Deloitte acquisition. These services have transitioned to a new service provider and no further services will be provided in 2021.
OTHER 6
6.2 EMPLOYEE BENEFITS (CONTINUED)
1
2
3
4
5
PERFORM
AN
CE
HIG
HLIG
HTS
BUSIN
ESS REV
IEWD
IRECTORS'
REPORT
FINA
NC
IAL
REPORT
OTH
ER IN
FORM
ATION
141W
OO
LWO
RTHS G
ROU
P A
NN
UA
L REPORT 2020
6.4 SUBSEQUENT EVENTS
This section outlines events which have occurred between the reporting date and the date the Financial Report is authorised for issue.
Store and venue closures in VictoriaOn 4 August 2020, the Group announced the closure of 22 BIG W stores in metropolitan Melbourne for six weeks from 5 August 2020 under Stage Four restrictions implemented by the Victorian Government. Under Stage Four restrictions, BIG W will provide contactless in-store Pick up services from all stores and will continue to offer contactless Home Delivery to all Victorians.
The Group’s Hotels business operates 80 venues in Victoria, all of which are closed.
There are also new Victorian Government restrictions proposed on the meat industry and supply chain. The Group has negotiated a compromise over lockdown restrictions that allow it to meet new rules by changing working arrangement of staff across its business.
Home Consortium security arrangementsOn 11 August 2020, the Group announced a proposal to restructure the security the Group holds for its guarantee of Masters leases that transferred to Home Consortium when the Group exited its Masters business in 2017. The proposed restructure was entered into at the same time as completion of the sale of three neighbourhood centres to Home Consortium for $128 million. The proposal is subject to a number of conditions, including Home Consortium securityholder approval.
Strategic investment in PFD Food ServicesOn 19 August 2020, the Group announced its intention to acquire a 65% equity interest in PFD Food Services (PFD) for $302 million, subject to working capital completion adjustments. The Group will also acquire PFD’s freehold distribution centre properties for $249 million which will be leased back to PFD. The transaction is subject to ACCC approval and the satisfaction of customary closing conditions with completion expected by the end of calendar year 2020.
Notes to the Consolidated Financial Statements
142
The directors declare that:(a) in the directors’ opinion, there are reasonable grounds to believe that the Company will be able to pay its debts as and when
they become due and payable;(b) in the directors’ opinion, the attached Consolidated Financial Statements are in compliance with International Financial
Reporting Standards, as stated in Note 1.1 to the Consolidated Financial Statements;(c) in the directors’ opinion, the attached Consolidated Financial Statements and notes thereto are in accordance with the
Corporations Act 2001, including compliance with accounting standards and giving a true and fair view of the financial position and performance of the Group; and
(d) the directors have been given the declarations required by s.295A of the Corporations Act 2001.
At the date of this declaration, the Company is within the class of companies affected by ASIC Corporations (Wholly-owned Companies) Instrument 2016/785. The nature of the deed of cross guarantee is such that each company which is party to the deed guarantees to each creditor payment in full of any debt in accordance with the deed of cross guarantee.
In the directors’ opinion, there are reasonable grounds to believe that the Company and the companies to which the Instrument applies, as detailed in Note 5.3 to the Consolidated Financial Statements will, as a group, be able to meet any obligations or liabilities to which they are, or may become, subject by virtue of the deed of cross guarantee.
Signed in accordance with a resolution of the directors made pursuant to s.295(5) of the Corporations Act 2001. On behalf of the directors.
Gordon Cairns Chairman
Brad Banducci Chief Executive Officer
27 August 2020
Directors' Declaration
1
2
3
4
5
PERFORM
AN
CE
HIG
HLIG
HTS
BUSIN
ESS REV
IEWD
IRECTORS'
REPORT
FINA
NC
IAL
REPORT
OTH
ER IN
FORM
ATION
143
WO
OLW
ORTH
S GRO
UP
AN
NU
AL REPO
RT 2020
6.4 SUBSEQUENT EVENTS
This section outlines events which have occurred between the reporting date and the date the Financial Report is authorised for issue.
Store and venue closures in VictoriaOn 4 August 2020, the Group announced the closure of 22 BIG W stores in metropolitan Melbourne for six weeks from 5 August 2020 under Stage Four restrictions implemented by the Victorian Government. Under Stage Four restrictions, BIG W will provide contactless in-store Pick up services from all stores and will continue to offer contactless Home Delivery to all Victorians.
The Group’s Hotels business operates 80 venues in Victoria, all of which are closed.
There are also new Victorian Government restrictions proposed on the meat industry and supply chain. The Group has negotiated a compromise over lockdown restrictions that allow it to meet new rules by changing working arrangement of staff across its business.
Home Consortium security arrangementsOn 11 August 2020, the Group announced a proposal to restructure the security the Group holds for its guarantee of Masters leases that transferred to Home Consortium when the Group exited its Masters business in 2017. The proposed restructure was entered into at the same time as completion of the sale of three neighbourhood centres to Home Consortium for $128 million. The proposal is subject to a number of conditions, including Home Consortium securityholder approval.
Strategic investment in PFD Food ServicesOn 19 August 2020, the Group announced its intention to acquire a 65% equity interest in PFD Food Services (PFD) for $302 million, subject to working capital completion adjustments. The Group will also acquire PFD’s freehold distribution centre properties for $249 million which will be leased back to PFD. The transaction is subject to ACCC approval and the satisfaction of customary closing conditions with completion expected by the end of calendar year 2020.
Notes to the Consolidated Financial Statements
142
The directors declare that:(a) in the directors’ opinion, there are reasonable grounds to believe that the Company will be able to pay its debts as and when
they become due and payable;(b) in the directors’ opinion, the attached Consolidated Financial Statements are in compliance with International Financial
Reporting Standards, as stated in Note 1.1 to the Consolidated Financial Statements;(c) in the directors’ opinion, the attached Consolidated Financial Statements and notes thereto are in accordance with the
Corporations Act 2001, including compliance with accounting standards and giving a true and fair view of the financial position and performance of the Group; and
(d) the directors have been given the declarations required by s.295A of the Corporations Act 2001.
At the date of this declaration, the Company is within the class of companies affected by ASIC Corporations (Wholly-owned Companies) Instrument 2016/785. The nature of the deed of cross guarantee is such that each company which is party to the deed guarantees to each creditor payment in full of any debt in accordance with the deed of cross guarantee.
In the directors’ opinion, there are reasonable grounds to believe that the Company and the companies to which the Instrument applies, as detailed in Note 5.3 to the Consolidated Financial Statements will, as a group, be able to meet any obligations or liabilities to which they are, or may become, subject by virtue of the deed of cross guarantee.
Signed in accordance with a resolution of the directors made pursuant to s.295(5) of the Corporations Act 2001. On behalf of the directors.
Gordon Cairns Chairman
Brad Banducci Chief Executive Officer
27 August 2020
Directors' Declaration
1
2
3
4
5
PERFORM
AN
CE
HIG
HLIG
HTS
BUSIN
ESS REV
IEWD
IRECTORS'
REPORT
FINA
NC
IAL
REPORT
OTH
ER IN
FORM
ATION
143W
OO
LWO
RTHS G
ROU
P A
NN
UA
L REPORT 2020
Deloitte Touche Tohmatsu A.B.N. 74 490 121 060
Grosvenor Place 225 George Street Sydney NSW 2000 PO Box N250 Grosvenor Place Sydney NSW 1220 Australia
DX 10307SSE Tel: +61 (0) 2 9322 7000 Fax: +61 (0) 2 9322 7001 www.deloitte.com.au
Independent Auditor’s Report to the Members of Woolworths Group Limited
Report on the Audit of the Financial ReportOpinion We have audited the financial report of Woolworths Group Limited (the Company), and its subsidiaries (the Group) which comprises the Consolidated Statement of Financial Position as at 28 June 2020, the Consolidated Statement of Profit or Loss, the Consolidated Statement of Other Comprehensive Income, the Consolidated Statement of Changes in Equity and Consolidated Statement of Cash Flows for the 52-week period then ended, and notes to the financial statements, including a summary of significant accounting policies, and the Directors’ Declaration. In our opinion, the accompanying financial report of the Group is in accordance with the Corporations Act 2001, including: (i) giving a true and fair view of the Group’s financial position as at 28 June 2020 and of its financial performance for the
52-week period then ended; and(ii) complying with Australian Accounting Standards and the Corporations Regulations 2001.
Basis for Opinion We conducted our audit in accordance with Australian Auditing Standards. Our responsibilities under those standards are further described in the Auditor’s Responsibilities for the Audit of the Financial Report section of our report. We are independent of the Group in accordance with the auditor independence requirements of the Corporations Act 2001 and the ethical requirements of the Accounting Professional and Ethical Standards Board’s APES 110 Code of Ethics for Professional Accountants (including Independence Standards) (the Code) that are relevant to our audit of the financial report in Australia. We have also fulfilled our other ethical responsibilities in accordance with the Code.
We confirm that the independence declaration required by the Corporations Act 2001, which has been given to the directors of the Company, would be in the same terms if given to the directors as at the time of this auditor’s report.
We believe that the audit evidence we have obtained is sufficient and appropriate to provide a basis for our opinion.
Key Audit Matters Key audit matters are those matters that, in our professional judgement, were of most significance in our audit of the financial report of the current period. These matters were addressed in the context of our audit of the financial report as a whole, and in forming our opinion thereon, and we do not provide a separate opinion on these matters.
Liability limited by a scheme approved under Professional Standards Legislation.Member of Deloitte Asia Pacific Limited and the Deloitte organisation.
Independent Auditor's Report144
Key Audit Matter How the scope of our audit responded to the Key Audit Matter
Salaried team member remediation As disclosed in Notes 1.4 and 3.9, the Group identified that certain salaried team members were not paid in full compliance with the Group’s obligations under relevant industrial awards.
At 28 June 2020, the Group has estimated the total cost to remediate payment shortfalls associated with 2019 and prior years, including interest and other associated costs, to be $500 million before tax with payments of $117 million made, of which $104 million was paid to affected salaried team members, with the remaining in relation to payroll tax and other remediation costs.
As required by Australian Accounting Standards, $265 million of this was accounted for as a prior period error and the Group restated each of the affected 2019 financial statement line items.
The estimated cost of remediation is based on a significant volume of historical data from a number of different sources, involves a high degree of complexity, interpretation, judgement, estimation and remains subject to further analysis.
The provision for underpayment of salaried team members under the General Retail Industry Award (GRIA) is material and the determination of the provision is subject to significant judgements and estimates and has been considered to be a key audit matter.
Our procedures included but were not limited to:• Developing an understanding of the basis for management’s
best estimate of the provision and the key areas of judgement applied in determining the provision.
• Evaluating the competence, capabilities and objectivity of the Group’s external experts used to assist management in the interpretation of the GRIA and to prepare the model used to determine the estimated cost of remediation in accordance with those interpretations.
• Obtaining and critically evaluating the assumptions used by management and their experts in developing the estimated cost of remediation.
• On a sample basis, evaluating the accuracy and completeness of the historical data used in the calculation of the provision.
• Considering the appropriateness of any extrapolation of data, statistical methods used and assumptions made for periods for which detailed calculations have not yet been performed at the reporting date.
• On a sample basis, recalculating the remediation estimate for a sample of affected salaried team members and evaluating the results.
• Assessing the appropriateness of the disclosures included in Note 1.4.
AASB 16 LeasesAs disclosed in Notes 1.2.3 and 3.3, the Group adopted AASB 16 Leases (AASB 16) on 1 July 2019 and as a result recognised lease assets and lease liabilities of $12.2 billion and $14.7 billion respectively.
The recognition and measurement of lease liabilities and the corresponding lease assets on transition, as well as the recognition of new leases or lease amendments entered into during the year, are dependent on a number of key judgements and estimates. These include the determination of the lease term, identification and determination of non-lease components and the determination of an appropriate discount rate for each lease.
Our procedures included but were not limited to:
• Obtaining an understanding of the Group’s processes and the design and implementation of key controls to recognise, measure and disclose leases in accordance with AASB 16.
• Assessing the Group’s accounting policy for compliance with AASB 16.
• Evaluating and challenging the key assumptions used in the recognition of lease assets and lease liabilities at transition and in relation to new leases and lease amendments made during the financial year ended 28 June 2020, which included assessing:
– lease terms, including option periods that are reasonably certain to be exercised by comparing the selected lease term against the Group’s policy and supporting documentation;
– the appropriateness of the incremental borrowing rates by challenging the Group’s methodology. We involved our treasury specialists in re-performing a sample of the inputs to the calculations of the incremental borrowing rates; and
– the identification and determination of non-lease components by reference to external data.
Independent Auditor's Report
1
2
3
4
5
PERFORM
AN
CE
HIG
HLIG
HTS
BUSIN
ESS REV
IEWD
IRECTORS'
REPORT
FINA
NC
IAL
REPORT
OTH
ER IN
FORM
ATION
145
WO
OLW
ORTH
S GRO
UP
AN
NU
AL REPO
RT 2020
Deloitte Touche Tohmatsu A.B.N. 74 490 121 060
Grosvenor Place 225 George Street Sydney NSW 2000 PO Box N250 Grosvenor Place Sydney NSW 1220 Australia
DX 10307SSE Tel: +61 (0) 2 9322 7000 Fax: +61 (0) 2 9322 7001 www.deloitte.com.au
Independent Auditor’s Report to the Members of Woolworths Group Limited
Report on the Audit of the Financial ReportOpinion We have audited the financial report of Woolworths Group Limited (the Company), and its subsidiaries (the Group) which comprises the Consolidated Statement of Financial Position as at 28 June 2020, the Consolidated Statement of Profit or Loss, the Consolidated Statement of Other Comprehensive Income, the Consolidated Statement of Changes in Equity and Consolidated Statement of Cash Flows for the 52-week period then ended, and notes to the financial statements, including a summary of significant accounting policies, and the Directors’ Declaration. In our opinion, the accompanying financial report of the Group is in accordance with the Corporations Act 2001, including: (i) giving a true and fair view of the Group’s financial position as at 28 June 2020 and of its financial performance for the
52-week period then ended; and(ii) complying with Australian Accounting Standards and the Corporations Regulations 2001.
Basis for Opinion We conducted our audit in accordance with Australian Auditing Standards. Our responsibilities under those standards are further described in the Auditor’s Responsibilities for the Audit of the Financial Report section of our report. We are independent of the Group in accordance with the auditor independence requirements of the Corporations Act 2001 and the ethical requirements of the Accounting Professional and Ethical Standards Board’s APES 110 Code of Ethics for Professional Accountants (including Independence Standards) (the Code) that are relevant to our audit of the financial report in Australia. We have also fulfilled our other ethical responsibilities in accordance with the Code.
We confirm that the independence declaration required by the Corporations Act 2001, which has been given to the directors of the Company, would be in the same terms if given to the directors as at the time of this auditor’s report.
We believe that the audit evidence we have obtained is sufficient and appropriate to provide a basis for our opinion.
Key Audit Matters Key audit matters are those matters that, in our professional judgement, were of most significance in our audit of the financial report of the current period. These matters were addressed in the context of our audit of the financial report as a whole, and in forming our opinion thereon, and we do not provide a separate opinion on these matters.
Liability limited by a scheme approved under Professional Standards Legislation.Member of Deloitte Asia Pacific Limited and the Deloitte organisation.
Independent Auditor's Report144
Key Audit Matter How the scope of our audit responded to the Key Audit Matter
Salaried team member remediation As disclosed in Notes 1.4 and 3.9, the Group identified that certain salaried team members were not paid in full compliance with the Group’s obligations under relevant industrial awards.
At 28 June 2020, the Group has estimated the total cost to remediate payment shortfalls associated with 2019 and prior years, including interest and other associated costs, to be $500 million before tax with payments of $117 million made, of which $104 million was paid to affected salaried team members, with the remaining in relation to payroll tax and other remediation costs.
As required by Australian Accounting Standards, $265 million of this was accounted for as a prior period error and the Group restated each of the affected 2019 financial statement line items.
The estimated cost of remediation is based on a significant volume of historical data from a number of different sources, involves a high degree of complexity, interpretation, judgement, estimation and remains subject to further analysis.
The provision for underpayment of salaried team members under the General Retail Industry Award (GRIA) is material and the determination of the provision is subject to significant judgements and estimates and has been considered to be a key audit matter.
Our procedures included but were not limited to:• Developing an understanding of the basis for management’s
best estimate of the provision and the key areas of judgement applied in determining the provision.
• Evaluating the competence, capabilities and objectivity of the Group’s external experts used to assist management in the interpretation of the GRIA and to prepare the model used to determine the estimated cost of remediation in accordance with those interpretations.
• Obtaining and critically evaluating the assumptions used by management and their experts in developing the estimated cost of remediation.
• On a sample basis, evaluating the accuracy and completeness of the historical data used in the calculation of the provision.
• Considering the appropriateness of any extrapolation of data, statistical methods used and assumptions made for periods for which detailed calculations have not yet been performed at the reporting date.
• On a sample basis, recalculating the remediation estimate for a sample of affected salaried team members and evaluating the results.
• Assessing the appropriateness of the disclosures included in Note 1.4.
AASB 16 LeasesAs disclosed in Notes 1.2.3 and 3.3, the Group adopted AASB 16 Leases (AASB 16) on 1 July 2019 and as a result recognised lease assets and lease liabilities of $12.2 billion and $14.7 billion respectively.
The recognition and measurement of lease liabilities and the corresponding lease assets on transition, as well as the recognition of new leases or lease amendments entered into during the year, are dependent on a number of key judgements and estimates. These include the determination of the lease term, identification and determination of non-lease components and the determination of an appropriate discount rate for each lease.
Our procedures included but were not limited to:
• Obtaining an understanding of the Group’s processes and the design and implementation of key controls to recognise, measure and disclose leases in accordance with AASB 16.
• Assessing the Group’s accounting policy for compliance with AASB 16.
• Evaluating and challenging the key assumptions used in the recognition of lease assets and lease liabilities at transition and in relation to new leases and lease amendments made during the financial year ended 28 June 2020, which included assessing:
– lease terms, including option periods that are reasonably certain to be exercised by comparing the selected lease term against the Group’s policy and supporting documentation;
– the appropriateness of the incremental borrowing rates by challenging the Group’s methodology. We involved our treasury specialists in re-performing a sample of the inputs to the calculations of the incremental borrowing rates; and
– the identification and determination of non-lease components by reference to external data.
Independent Auditor's Report
1
2
3
4
5
PERFORM
AN
CE
HIG
HLIG
HTS
BUSIN
ESS REV
IEWD
IRECTORS'
REPORT
FINA
NC
IAL
REPORT
OTH
ER IN
FORM
ATION
145W
OO
LWO
RTHS G
ROU
P A
NN
UA
L REPORT 2020
Key Audit Matter How the scope of our audit responded to the Key Audit Matter
• Selecting a sample of leases at transition, new leases entered into and leases modified during the financial year ended 28 June 2020, and:
– agreeing these to lease contracts and other supporting documentation; and
– independently modelling the expected lease assets and lease liabilities and comparing the results to the amount recorded in the Group’s financial records.
• Testing the completeness of the Group’s lease portfolio: – On transition by:
• reconciling the Group’s lease commitments at 30 June 2019 to leases recognised at transition;
• considering the nature of key service contracts to assess whether they contain a lease under AASB 16; and
• confirming the inclusion of a sample of leases selected from the Group’s lease agreement records and rent expense general ledger accounts for the financial year ended 30 June 2019.
– For the financial year ended 28 June 2020 by:• reconciling property leases data to individual store
listings; and • reviewing internal board reporting.
• Assessing the appropriateness of the disclosures included in Notes 1.2.6 and 3.3.
Recoverable amount of BIG WIn the financial year ended 30 June 2019, the Group recognised an impairment of $166 million and a provision of $205 million relating to lease and other store exit costs as disclosed in Note 3.6. In the financial year ended 28 June 2020 the Group has transitioned to AASB 16 and recognised lease assets net of impairment.
At 28 June 2020, the carrying value of BIG W is $1,120 million including lease assets of $850 million. As part of the Group’s annual impairment testing an additional impairment of $34 million was recognised against lease assets mainly for the stores that are being considered for closure.
As disclosed in Note 3.6, significant judgement is required in the determination of the recoverable amount of property, plant and equipment and lease assets, including adverse changes in trading conditions, the competitive landscape and the ability of BIG W to execute the strategic plan in line with the assumptions made.
There is also a significant degree of uncertainty associated with the impacts of COVID-19 on future trading performance and cash flows.
Our procedures included but were not limited to:• Updating our understanding of the Group’s processes and
controls over the assessment of the recoverable amount of property, plant and equipment and lease assets.
• Identification and evaluation of cash-generating units, allocation of assets and costs to these cash-generating units.
• Challenging the key assumptions used in the future cash flow forecasts with reference to past performance, external data and the assumptions made in relation sales growth and gross margins in the Group’s forecasts.
• Evaluating historical accuracy of forecast cash flows.• Involving our internal valuation specialists to assist us in
evaluating the appropriateness of the discount rates and application of the requirements of AASB 136 Impairment of assets, including the impact of AASB 16.
• Assessing the accuracy of the Group’s discounted cash flow model including testing, on a sample basis, the mathematical accuracy of the impairment models.
• Reviewing and challenging the adequacy of the Group’s sensitivity analysis in relation to key assumptions to consider the extent of change in those assumptions that either individually or collectively would be required for the assets to be impaired.
• Assessing the appropriateness of the disclosures included in Note 3.6.
Independent Auditor's Report
146
Key Audit Matter How the scope of our audit responded to the Key Audit Matter
IT SystemsThe IT systems across the Group are complex and there are varying levels of integration. These systems are vital to the ongoing operations of the business and to the integrity of the financial reporting process and as a result the assessment of IT systems forms a key component of our external audit.
Our procedures included but were not limited to:
• Discussing with management the IT environment and consideration of the key financial processes to identify IT systems to include in the scope of our testing.
• Testing the design and implementation of the key IT controls of relevant financial reporting systems of the Group.
• Responding to deficiencies identified, by designing and performing additional procedures which included the identification and testing of compensating controls and varying the nature, timing and extent of the substantive procedures performed.
Other Information The directors are responsible for the other information. The other information comprises the information included in the Group’s Annual Report for the 52-week period ended 28 June 2020 but does not include the financial report and our auditor’s report thereon.
Our opinion on the financial report does not cover the other information and accordingly we do not express any form of assurance conclusion thereon.
In connection with our audit of the financial report, our responsibility is to read the other information and, in doing so, consider whether the other information is materially inconsistent with the financial report or our knowledge obtained in the audit or otherwise appears to be materially misstated.
If, based on the work we have performed, we conclude that there is a material misstatement of this other information, we are required to report that fact. We have nothing to report in this regard.
Directors’ Responsibilities for the Financial Report The directors of the company are responsible for the preparation of the financial report that gives a true and fair view in accordance with Australian Accounting Standards and the Corporations Act 2001 and for such internal control as the directors determine is necessary to enable the preparation of the financial report that gives a true and fair view and is free from material misstatement, whether due to fraud or error.
In preparing the financial report, the directors are responsible for assessing the ability of the Group to continue as a going concern, disclosing, as applicable, matters related to going concern and using the going concern basis of accounting unless the directors either intend to liquidate the Group or to cease operations, or have no realistic alternative but to do so.
Auditor’s Responsibilities for the Audit of the Financial Report Our objectives are to obtain reasonable assurance about whether the financial report as a whole is free from material misstatement, whether due to fraud or error, and to issue an auditor’s report that includes our opinion. Reasonable assurance is a high level of assurance but is not a guarantee that an audit conducted in accordance with the Australian Auditing Standards will always detect a material misstatement when it exists. Misstatements can arise from fraud or error and are considered material if, individually or in the aggregate, they could reasonably be expected to influence the economic decisions of users taken on the basis of this financial report.
As part of an audit in accordance with the Australian Auditing Standards, we exercise professional judgement and maintain professional scepticism throughout the audit. We also: • Identify and assess the risks of material misstatement of the financial report, whether due to fraud or error, design and
perform audit procedures responsive to those risks, and obtain audit evidence that is sufficient and appropriate to provide a basis for our opinion. The risk of not detecting a material misstatement resulting from fraud is higher than for one resulting from error, as fraud may involve collusion, forgery, intentional omissions, misrepresentations, or the override of internal control.
• Obtain an understanding of internal control relevant to the audit in order to design audit procedures that are appropriate in the circumstances, but not for the purpose of expressing an opinion on the effectiveness of the Group’s internal control.
Independent Auditor's Report
1
2
3
4
5
PERFORM
AN
CE
HIG
HLIG
HTS
BUSIN
ESS REV
IEWD
IRECTORS'
REPORT
FINA
NC
IAL
REPORT
OTH
ER IN
FORM
ATION
147
WO
OLW
ORTH
S GRO
UP
AN
NU
AL REPO
RT 2020
Key Audit Matter How the scope of our audit responded to the Key Audit Matter
• Selecting a sample of leases at transition, new leases entered into and leases modified during the financial year ended 28 June 2020, and:
– agreeing these to lease contracts and other supporting documentation; and
– independently modelling the expected lease assets and lease liabilities and comparing the results to the amount recorded in the Group’s financial records.
• Testing the completeness of the Group’s lease portfolio: – On transition by:
• reconciling the Group’s lease commitments at 30 June 2019 to leases recognised at transition;
• considering the nature of key service contracts to assess whether they contain a lease under AASB 16; and
• confirming the inclusion of a sample of leases selected from the Group’s lease agreement records and rent expense general ledger accounts for the financial year ended 30 June 2019.
– For the financial year ended 28 June 2020 by:• reconciling property leases data to individual store
listings; and • reviewing internal board reporting.
• Assessing the appropriateness of the disclosures included in Notes 1.2.6 and 3.3.
Recoverable amount of BIG WIn the financial year ended 30 June 2019, the Group recognised an impairment of $166 million and a provision of $205 million relating to lease and other store exit costs as disclosed in Note 3.6. In the financial year ended 28 June 2020 the Group has transitioned to AASB 16 and recognised lease assets net of impairment.
At 28 June 2020, the carrying value of BIG W is $1,120 million including lease assets of $850 million. As part of the Group’s annual impairment testing an additional impairment of $34 million was recognised against lease assets mainly for the stores that are being considered for closure.
As disclosed in Note 3.6, significant judgement is required in the determination of the recoverable amount of property, plant and equipment and lease assets, including adverse changes in trading conditions, the competitive landscape and the ability of BIG W to execute the strategic plan in line with the assumptions made.
There is also a significant degree of uncertainty associated with the impacts of COVID-19 on future trading performance and cash flows.
Our procedures included but were not limited to:• Updating our understanding of the Group’s processes and
controls over the assessment of the recoverable amount of property, plant and equipment and lease assets.
• Identification and evaluation of cash-generating units, allocation of assets and costs to these cash-generating units.
• Challenging the key assumptions used in the future cash flow forecasts with reference to past performance, external data and the assumptions made in relation sales growth and gross margins in the Group’s forecasts.
• Evaluating historical accuracy of forecast cash flows.• Involving our internal valuation specialists to assist us in
evaluating the appropriateness of the discount rates and application of the requirements of AASB 136 Impairment of assets, including the impact of AASB 16.
• Assessing the accuracy of the Group’s discounted cash flow model including testing, on a sample basis, the mathematical accuracy of the impairment models.
• Reviewing and challenging the adequacy of the Group’s sensitivity analysis in relation to key assumptions to consider the extent of change in those assumptions that either individually or collectively would be required for the assets to be impaired.
• Assessing the appropriateness of the disclosures included in Note 3.6.
Independent Auditor's Report
146
Key Audit Matter How the scope of our audit responded to the Key Audit Matter
IT SystemsThe IT systems across the Group are complex and there are varying levels of integration. These systems are vital to the ongoing operations of the business and to the integrity of the financial reporting process and as a result the assessment of IT systems forms a key component of our external audit.
Our procedures included but were not limited to:
• Discussing with management the IT environment and consideration of the key financial processes to identify IT systems to include in the scope of our testing.
• Testing the design and implementation of the key IT controls of relevant financial reporting systems of the Group.
• Responding to deficiencies identified, by designing and performing additional procedures which included the identification and testing of compensating controls and varying the nature, timing and extent of the substantive procedures performed.
Other Information The directors are responsible for the other information. The other information comprises the information included in the Group’s Annual Report for the 52-week period ended 28 June 2020 but does not include the financial report and our auditor’s report thereon.
Our opinion on the financial report does not cover the other information and accordingly we do not express any form of assurance conclusion thereon.
In connection with our audit of the financial report, our responsibility is to read the other information and, in doing so, consider whether the other information is materially inconsistent with the financial report or our knowledge obtained in the audit or otherwise appears to be materially misstated.
If, based on the work we have performed, we conclude that there is a material misstatement of this other information, we are required to report that fact. We have nothing to report in this regard.
Directors’ Responsibilities for the Financial Report The directors of the company are responsible for the preparation of the financial report that gives a true and fair view in accordance with Australian Accounting Standards and the Corporations Act 2001 and for such internal control as the directors determine is necessary to enable the preparation of the financial report that gives a true and fair view and is free from material misstatement, whether due to fraud or error.
In preparing the financial report, the directors are responsible for assessing the ability of the Group to continue as a going concern, disclosing, as applicable, matters related to going concern and using the going concern basis of accounting unless the directors either intend to liquidate the Group or to cease operations, or have no realistic alternative but to do so.
Auditor’s Responsibilities for the Audit of the Financial Report Our objectives are to obtain reasonable assurance about whether the financial report as a whole is free from material misstatement, whether due to fraud or error, and to issue an auditor’s report that includes our opinion. Reasonable assurance is a high level of assurance but is not a guarantee that an audit conducted in accordance with the Australian Auditing Standards will always detect a material misstatement when it exists. Misstatements can arise from fraud or error and are considered material if, individually or in the aggregate, they could reasonably be expected to influence the economic decisions of users taken on the basis of this financial report.
As part of an audit in accordance with the Australian Auditing Standards, we exercise professional judgement and maintain professional scepticism throughout the audit. We also: • Identify and assess the risks of material misstatement of the financial report, whether due to fraud or error, design and
perform audit procedures responsive to those risks, and obtain audit evidence that is sufficient and appropriate to provide a basis for our opinion. The risk of not detecting a material misstatement resulting from fraud is higher than for one resulting from error, as fraud may involve collusion, forgery, intentional omissions, misrepresentations, or the override of internal control.
• Obtain an understanding of internal control relevant to the audit in order to design audit procedures that are appropriate in the circumstances, but not for the purpose of expressing an opinion on the effectiveness of the Group’s internal control.
Independent Auditor's Report
1
2
3
4
5
PERFORM
AN
CE
HIG
HLIG
HTS
BUSIN
ESS REV
IEWD
IRECTORS'
REPORT
FINA
NC
IAL
REPORT
OTH
ER IN
FORM
ATION
147W
OO
LWO
RTHS G
ROU
P A
NN
UA
L REPORT 2020
Auditor’s Responsibilities for the Audit of the Financial Report (continued)
• Evaluate the appropriateness of accounting policies used and the reasonableness of accounting estimates and related disclosures made by management and the directors.
• Conclude on the appropriateness of the directors’ use of the going concern basis of accounting and, based on the audit evidence obtained, whether a material uncertainty exists related to events or conditions that may cast significant doubt on the Group’s ability to continue as a going concern. If we conclude that a material uncertainty exists, we are required to draw attention in our auditor’s report to the related disclosures in the financial report or, if such disclosures are inadequate, to modify our opinion. Our conclusions are based on the audit evidence obtained up to the date of our auditor’s report. However, future events or conditions may cause the Group to cease to continue as a going concern.
• Evaluate the overall presentation, structure and content of the financial report, including the disclosures, and whether the financial report represents the underlying transactions and events in a manner that achieves fair presentation.
• Obtain sufficient appropriate audit evidence regarding the financial information of the entities or business activities within the Group to express an opinion on the financial report. We are responsible for the direction, supervision and performance of the Group audit. We remain solely responsible for our audit opinion.
We communicate with the directors, regarding, among other matters, the planned scope and timing of the audit and significant audit findings, including any significant deficiencies in internal control that we identify during our audit.
We also provide the directors with a statement that we have complied with relevant ethical requirements regarding independence, and to communicate with them all relationships and other matters that may reasonably be thought to bear on our independence, and where applicable, actions taken to eliminate threats or safeguards applied.
From the matters communicated with the directors, we determine those matters that were of most significance in the audit of the financial report of the current period and are therefore the key audit matters. We describe these matters in our auditor’s report unless law or regulation precludes public disclosure about the matter or when, in extremely rare circumstances, we determine that a matter should not be communicated in our report because the adverse consequences of doing so would reasonably be expected to outweigh the public interest benefits of such communication.
Report on the Remuneration Report
Opinion on the Remuneration ReportWe have audited the Remuneration Report included in pages 52 to 73 of the Directors’ Report for the 52-week period ended 28 June 2020.
In our opinion, the Remuneration Report of Woolworths Group Limited, for the 52-week period ended 28 June 2020, complies with section 300A of the Corporations Act 2001.
Responsibilities The directors of the Company are responsible for the preparation and presentation of the Remuneration Report in accordance with section 300A of the Corporations Act 2001. Our responsibility is to express an opinion on the Remuneration Report, based on our audit conducted in accordance with Australian Auditing Standards.
DELOITTE TOUCHE TOHMATSU
A V Griffiths T C Elliott Partner Partner Chartered Accountants Chartered Accountants
Sydney, 27 August 2020
Independent Auditor's Report
148
The shareholder information set out below was applicable as at 1 August 2020.
DISTRIBUTION OF SHARESAnalysis of numbers of shareholders by size of holding:
RANGE OF SHARESNUMBER OF
SHAREHOLDERSNUMBER
OF SHARES
1 – 1,000 234,012 82,358,8371,001 – 5,000 104,219 221,842,9405,001 – 10,000 9,964 69,750,30910,001 – 100,000 4,508 85,813,680100,001 and over 107 803,326,170Total 352,810 1,263,091,936
All shares above are fully paid ordinary shares.
There were 6,871 holders of less than a marketable parcel of shares.
TOP 20 LARGEST SHAREHOLDERS
NAME NUMBER OF SHARES
PERCENTAGE OF TOTAL SHARES
ISSUED (%)
1 HSBC Custody Nominees (Australia) Limited 325,809,124 25.792 JP Morgan Nominees Australia Pty Limited 211,513,848 16.753 Citicorp Nominees Pty Limited 91,467,329 7.244 BNP Paribas Nominees Pty Ltd 74,376,637 5.895 National Nominees Limited 43,457,451 3.446 Pacific Custodians Pty Limited 7,758,020 0.617 Australian Foundation Investment Company Limited 5,666,718 0.458 Woolworths Custodian Pty Ltd 4,924,694 0.399 Argo Investments Limited 3,229,526 0.2610 Netwealth Investments Limited <Wrap Services A/C> 3,162,870 0.2511 Milton Corporation Limited 2,936,973 0.2312 IOOF Investment Management Limited 2,690,836 0.2113 AMP Life Limited 1,929,271 0.1514 Navigator Australia Ltd <MLC Investment Sett A/C> 1,753,757 0.1415 Custodial Services Limited <beneficiaries Holding A/C> 1,614,124 0.1316 BKI Investment Company Limited 1,428,744 0.1117 Nulis Nominees (Australia) Limited <Navigator Mast Plan Sett A/C> 1,221,189 0.1018 Australia United Investment Company Limited 1,000,000 0.0819 The Senior Master of the Supreme Court <Common Fund No 3 A/C> 959,970 0.0820 BNP Paribas Noms (NZ) Ltd <DRP> 936,552 0.07
SUBSTANTIAL SHAREHOLDERSWoolworths Group Limited had received the following substantial shareholder notifications. As at 1 August 2020, no other substantial shareholder notices have been received.
HOLDERSHARES HELD AT DATE OF
NOTICE
PERCENTAGE OF SHARES HELD AT DATE OF NOTICE
(%) DATE OF NOTICE
BlackRock Group 80,972,196 6.43 29/05/2019The Vanguard Group, Inc 75,845,088 6.01 02/04/2020
Shareholder information (as at 1 August 2020)
1
2
3
4
5
PERFORM
AN
CE
HIG
HLIG
HTS
BUSIN
ESS REV
IEWD
IRECTORS'
REPORT
FINA
NC
IAL
REPORT
OTH
ER IN
FORM
ATION
149
WO
OLW
ORTH
S GRO
UP
AN
NU
AL REPO
RT 2020
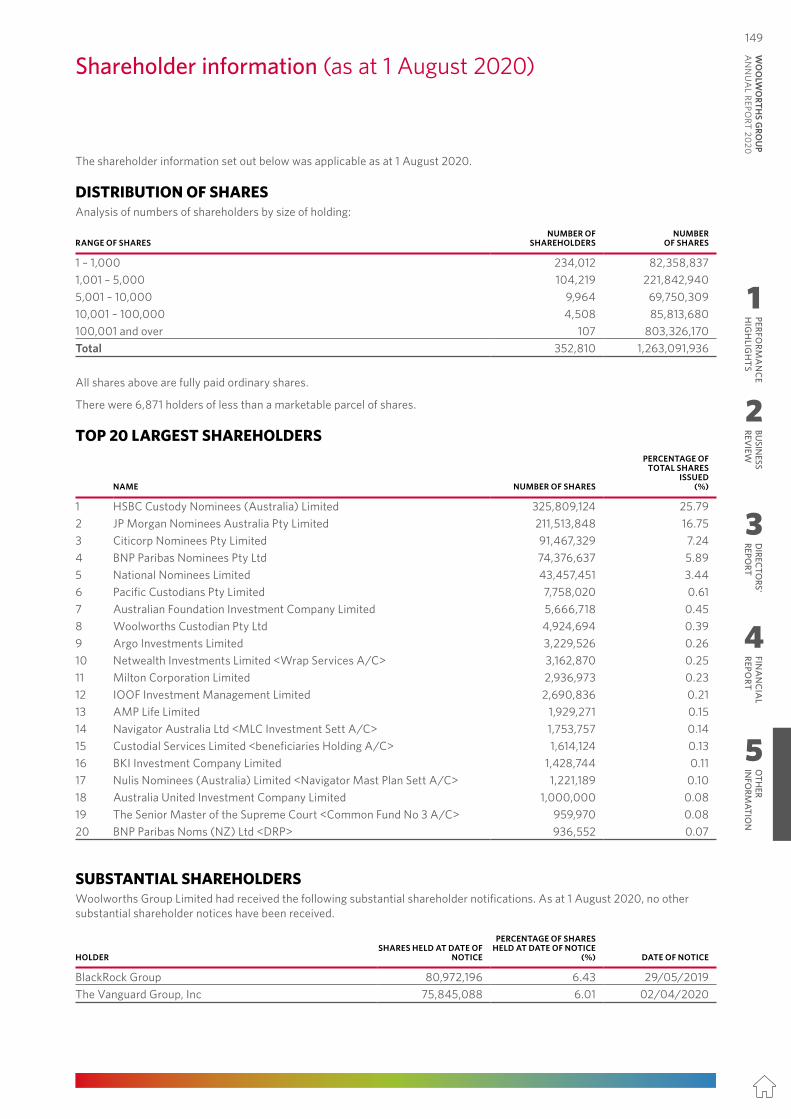
Auditor’s Responsibilities for the Audit of the Financial Report (continued)
• Evaluate the appropriateness of accounting policies used and the reasonableness of accounting estimates and related disclosures made by management and the directors.
• Conclude on the appropriateness of the directors’ use of the going concern basis of accounting and, based on the audit evidence obtained, whether a material uncertainty exists related to events or conditions that may cast significant doubt on the Group’s ability to continue as a going concern. If we conclude that a material uncertainty exists, we are required to draw attention in our auditor’s report to the related disclosures in the financial report or, if such disclosures are inadequate, to modify our opinion. Our conclusions are based on the audit evidence obtained up to the date of our auditor’s report. However, future events or conditions may cause the Group to cease to continue as a going concern.
• Evaluate the overall presentation, structure and content of the financial report, including the disclosures, and whether the financial report represents the underlying transactions and events in a manner that achieves fair presentation.
• Obtain sufficient appropriate audit evidence regarding the financial information of the entities or business activities within the Group to express an opinion on the financial report. We are responsible for the direction, supervision and performance of the Group audit. We remain solely responsible for our audit opinion.
We communicate with the directors, regarding, among other matters, the planned scope and timing of the audit and significant audit findings, including any significant deficiencies in internal control that we identify during our audit.
We also provide the directors with a statement that we have complied with relevant ethical requirements regarding independence, and to communicate with them all relationships and other matters that may reasonably be thought to bear on our independence, and where applicable, actions taken to eliminate threats or safeguards applied.
From the matters communicated with the directors, we determine those matters that were of most significance in the audit of the financial report of the current period and are therefore the key audit matters. We describe these matters in our auditor’s report unless law or regulation precludes public disclosure about the matter or when, in extremely rare circumstances, we determine that a matter should not be communicated in our report because the adverse consequences of doing so would reasonably be expected to outweigh the public interest benefits of such communication.
Report on the Remuneration Report
Opinion on the Remuneration ReportWe have audited the Remuneration Report included in pages 52 to 73 of the Directors’ Report for the 52-week period ended 28 June 2020.
In our opinion, the Remuneration Report of Woolworths Group Limited, for the 52-week period ended 28 June 2020, complies with section 300A of the Corporations Act 2001.
Responsibilities The directors of the Company are responsible for the preparation and presentation of the Remuneration Report in accordance with section 300A of the Corporations Act 2001. Our responsibility is to express an opinion on the Remuneration Report, based on our audit conducted in accordance with Australian Auditing Standards.
DELOITTE TOUCHE TOHMATSU
A V Griffiths T C Elliott Partner Partner Chartered Accountants Chartered Accountants
Sydney, 27 August 2020
Independent Auditor's Report
148
The shareholder information set out below was applicable as at 1 August 2020.
DISTRIBUTION OF SHARESAnalysis of numbers of shareholders by size of holding:
RANGE OF SHARESNUMBER OF
SHAREHOLDERSNUMBER
OF SHARES
1 – 1,000 234,012 82,358,8371,001 – 5,000 104,219 221,842,9405,001 – 10,000 9,964 69,750,30910,001 – 100,000 4,508 85,813,680100,001 and over 107 803,326,170Total 352,810 1,263,091,936
All shares above are fully paid ordinary shares.
There were 6,871 holders of less than a marketable parcel of shares.
TOP 20 LARGEST SHAREHOLDERS
NAME NUMBER OF SHARES
PERCENTAGE OF TOTAL SHARES
ISSUED (%)
1 HSBC Custody Nominees (Australia) Limited 325,809,124 25.792 JP Morgan Nominees Australia Pty Limited 211,513,848 16.753 Citicorp Nominees Pty Limited 91,467,329 7.244 BNP Paribas Nominees Pty Ltd 74,376,637 5.895 National Nominees Limited 43,457,451 3.446 Pacific Custodians Pty Limited 7,758,020 0.617 Australian Foundation Investment Company Limited 5,666,718 0.458 Woolworths Custodian Pty Ltd 4,924,694 0.399 Argo Investments Limited 3,229,526 0.2610 Netwealth Investments Limited <Wrap Services A/C> 3,162,870 0.2511 Milton Corporation Limited 2,936,973 0.2312 IOOF Investment Management Limited 2,690,836 0.2113 AMP Life Limited 1,929,271 0.1514 Navigator Australia Ltd <MLC Investment Sett A/C> 1,753,757 0.1415 Custodial Services Limited <beneficiaries Holding A/C> 1,614,124 0.1316 BKI Investment Company Limited 1,428,744 0.1117 Nulis Nominees (Australia) Limited <Navigator Mast Plan Sett A/C> 1,221,189 0.1018 Australia United Investment Company Limited 1,000,000 0.0819 The Senior Master of the Supreme Court <Common Fund No 3 A/C> 959,970 0.0820 BNP Paribas Noms (NZ) Ltd <DRP> 936,552 0.07
SUBSTANTIAL SHAREHOLDERSWoolworths Group Limited had received the following substantial shareholder notifications. As at 1 August 2020, no other substantial shareholder notices have been received.
HOLDERSHARES HELD AT DATE OF
NOTICE
PERCENTAGE OF SHARES HELD AT DATE OF NOTICE
(%) DATE OF NOTICE
BlackRock Group 80,972,196 6.43 29/05/2019The Vanguard Group, Inc 75,845,088 6.01 02/04/2020
Shareholder information (as at 1 August 2020)
1
2
3
4
5
PERFORM
AN
CE
HIG
HLIG
HTS
BUSIN
ESS REV
IEWD
IRECTORS'
REPORT
FINA
NC
IAL
REPORT
OTH
ER IN
FORM
ATION
149W
OO
LWO
RTHS G
ROU
P A
NN
UA
L REPORT 2020
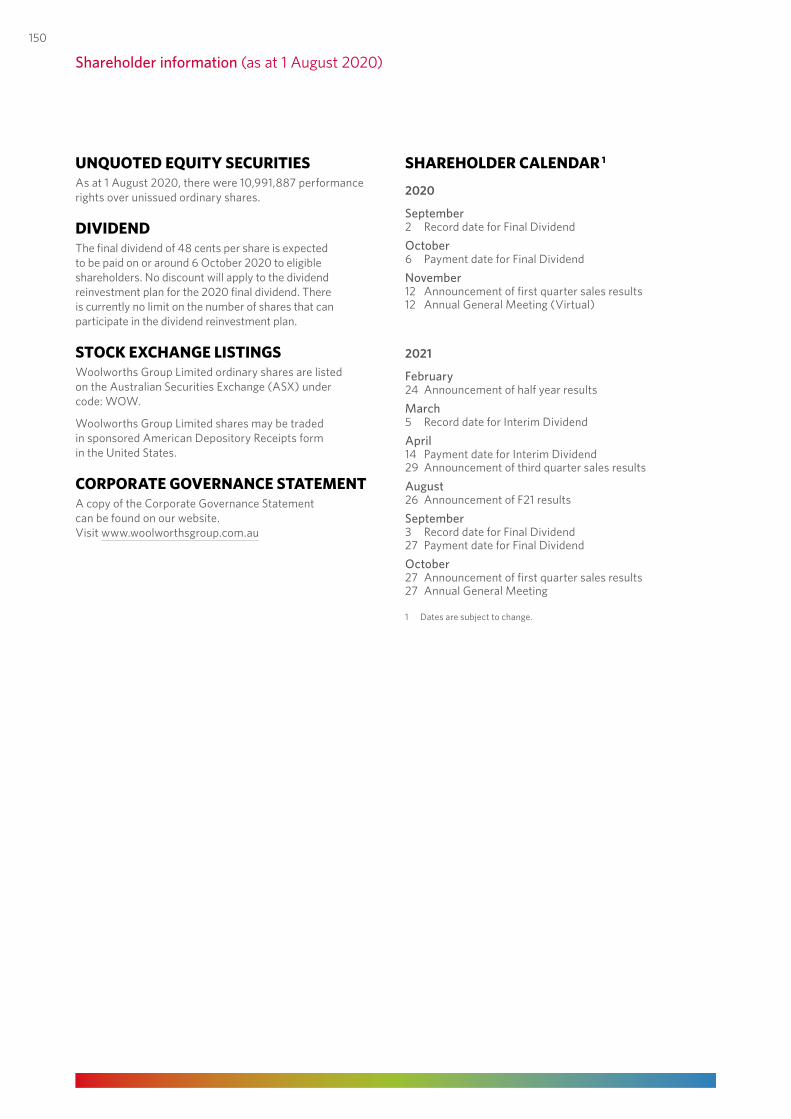
UNQUOTED EQUITY SECURITIESAs at 1 August 2020, there were 10,991,887 performance rights over unissued ordinary shares.
DIVIDENDThe final dividend of 48 cents per share is expected to be paid on or around 6 October 2020 to eligible shareholders. No discount will apply to the dividend reinvestment plan for the 2020 final dividend. There is currently no limit on the number of shares that can participate in the dividend reinvestment plan.
STOCK EXCHANGE LISTINGSWoolworths Group Limited ordinary shares are listed on the Australian Securities Exchange (ASX) under code: WOW.
Woolworths Group Limited shares may be traded in sponsored American Depository Receipts form in the United States.
CORPORATE GOVERNANCE STATEMENTA copy of the Corporate Governance Statement can be found on our website. Visit www.woolworthsgroup.com.au
SHAREHOLDER CALENDAR 1
2020
September2 Record date for Final DividendOctober6 Payment date for Final DividendNovember12 Announcement of first quarter sales results12 Annual General Meeting (Virtual)
2021
February24 Announcement of half year resultsMarch5 Record date for Interim DividendApril14 Payment date for Interim Dividend29 Announcement of third quarter sales resultsAugust26 Announcement of F21 resultsSeptember3 Record date for Final Dividend27 Payment date for Final DividendOctober27 Announcement of first quarter sales results27 Annual General Meeting
1 Dates are subject to change.
Shareholder information (as at 1 August 2020)
150
GLOSSARY
Cash realisation ratio Operating cash flow as a percentage of Group net profit after tax before depreciation and amortisation
Comparable sales Measure of sales which excludes stores that have been opened or closed in the last 12 months and demonstrable impact on existing stores from store disruption because of store refurbishment or new store openings
Cost of doing business (CODB)
Expenses which relate to the operation of the business
Customer 1st Ranging Developing a clearly defined range to provide an easier shopping experience for the customer
Customer fulfilment centre (CFC)
Dedicated online distribution centres
Drive Convenient options for customers to pick up online orders through Drive up or Drive thru facilities
E2E End-to-end
eStore Store which utilises automation for the fulfilment of online orders
Fixed charges cover ratio Group earnings before interest, tax, depreciation, amortisation and rent (EBITDAR) divided by rent and interest costs. Rent and interest costs include capitalised interest but exclude foreign exchange gains/losses and dividend income
Free cash flow Cash flow generated by the Woolworths Group after equity related financing activities including dividends
Funds employed Net assets employed, excluding net tax balances
MFC Micro-fulfilment centre
MSRDC Melbourne South Regional Distribution Centre
Net assets employed Net assets, excluding net debt and other financial liabilities
Net Promoter Score (NPS) A loyalty measure based on a single question where a customer rates a business on a scale of zero to 10. The score is the net result of the percentage of customers providing a score of nine or 10 (promoters) less the percentage of customers providing a score of zero to six (detractors)
On Demand/express delivery
An express or scheduled delivery service providing online orders at the customer's convenience
Pick up A service which enables collection of online shopping orders in-store or at select locations
Glossary
1
2
3
4
5
PERFORM
AN
CE
HIG
HLIG
HTS
BUSIN
ESS REV
IEWD
IRECTORS'
REPORT
FINA
NC
IAL
REPORT
OTH
ER IN
FORM
ATION
151
WO
OLW
ORTH
S GRO
UP
AN
NU
AL REPO
RT 2020
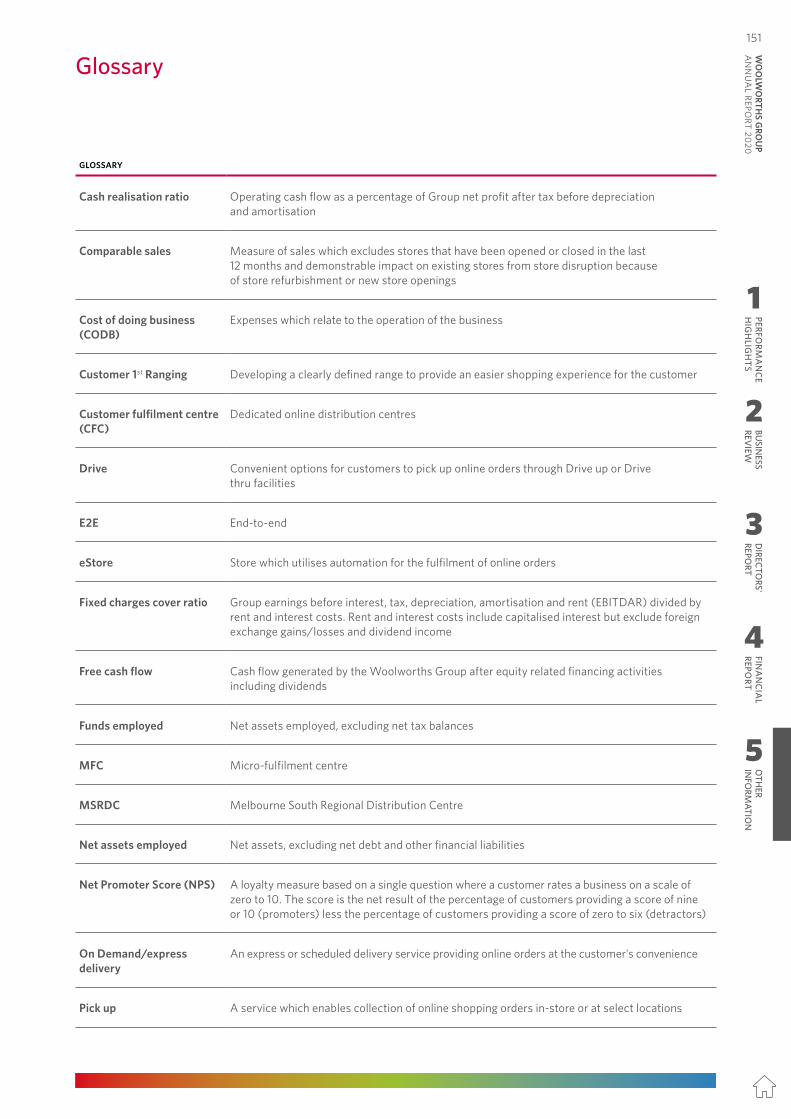
UNQUOTED EQUITY SECURITIESAs at 1 August 2020, there were 10,991,887 performance rights over unissued ordinary shares.
DIVIDENDThe final dividend of 48 cents per share is expected to be paid on or around 6 October 2020 to eligible shareholders. No discount will apply to the dividend reinvestment plan for the 2020 final dividend. There is currently no limit on the number of shares that can participate in the dividend reinvestment plan.
STOCK EXCHANGE LISTINGSWoolworths Group Limited ordinary shares are listed on the Australian Securities Exchange (ASX) under code: WOW.
Woolworths Group Limited shares may be traded in sponsored American Depository Receipts form in the United States.
CORPORATE GOVERNANCE STATEMENTA copy of the Corporate Governance Statement can be found on our website. Visit www.woolworthsgroup.com.au
SHAREHOLDER CALENDAR 1
2020
September2 Record date for Final DividendOctober6 Payment date for Final DividendNovember12 Announcement of first quarter sales results12 Annual General Meeting (Virtual)
2021
February24 Announcement of half year resultsMarch5 Record date for Interim DividendApril14 Payment date for Interim Dividend29 Announcement of third quarter sales resultsAugust26 Announcement of F21 resultsSeptember3 Record date for Final Dividend27 Payment date for Final DividendOctober27 Announcement of first quarter sales results27 Annual General Meeting
1 Dates are subject to change.
Shareholder information (as at 1 August 2020)
150
GLOSSARY
Cash realisation ratio Operating cash flow as a percentage of Group net profit after tax before depreciation and amortisation
Comparable sales Measure of sales which excludes stores that have been opened or closed in the last 12 months and demonstrable impact on existing stores from store disruption because of store refurbishment or new store openings
Cost of doing business (CODB)
Expenses which relate to the operation of the business
Customer 1st Ranging Developing a clearly defined range to provide an easier shopping experience for the customer
Customer fulfilment centre (CFC)
Dedicated online distribution centres
Drive Convenient options for customers to pick up online orders through Drive up or Drive thru facilities
E2E End-to-end
eStore Store which utilises automation for the fulfilment of online orders
Fixed charges cover ratio Group earnings before interest, tax, depreciation, amortisation and rent (EBITDAR) divided by rent and interest costs. Rent and interest costs include capitalised interest but exclude foreign exchange gains/losses and dividend income
Free cash flow Cash flow generated by the Woolworths Group after equity related financing activities including dividends
Funds employed Net assets employed, excluding net tax balances
MFC Micro-fulfilment centre
MSRDC Melbourne South Regional Distribution Centre
Net assets employed Net assets, excluding net debt and other financial liabilities
Net Promoter Score (NPS) A loyalty measure based on a single question where a customer rates a business on a scale of zero to 10. The score is the net result of the percentage of customers providing a score of nine or 10 (promoters) less the percentage of customers providing a score of zero to six (detractors)
On Demand/express delivery
An express or scheduled delivery service providing online orders at the customer's convenience
Pick up A service which enables collection of online shopping orders in-store or at select locations
Glossary
1
2
3
4
5
PERFORM
AN
CE
HIG
HLIG
HTS
BUSIN
ESS REV
IEWD
IRECTORS'
REPORT
FINA
NC
IAL
REPORT
OTH
ER IN
FORM
ATION
151W
OO
LWO
RTHS G
ROU
P A
NN
UA
L REPORT 2020
GLOSSARY
Renewals A total store transformation focused on the overall store environment, team, range and process efficiency (including digital)
Return on Funds Employed (ROFE)
ROFE is calculated as EBIT before significant items for the previous 12 months as a percentage of average (opening, mid and closing) funds employed, including significant items provisions
Sales per square metre Total sales for the previous 12 months by business divided by average trading area
Simpler for Stores Simplification of end-to-end processes for store teams, improving customer experience and productivity
Smart Store A store that employs technology to improve process efficiency for customers and team members
Total net debt Borrowings, less cash balances including debt hedging derivatives
Total stock loss The value of stock written-off, wasted, stolen, cleared, marked-down or adjusted from all stores nationally (sometimes expressed as a percentage of sales)
Upgrades A light renewal typically involving a front-of-store upgrade, Produce/Bakery enhancement and grocery macro space relay
Voice of Customer (VOC) Externally facilitated survey of a sample of Woolworths Group customers where customers rate Woolworths Group businesses on a number of criteria. Expressed as the percentage of customers providing a rating of six or seven on a seven-point scale
VOC NPS VOC NPS is based on feedback from Woolworths Rewards members. VOC NPS is the number of promoters (score of nine or 10) less the number of detractors (score of six or below)
Voice of Supplier (VOS) A survey of a broad spectrum of suppliers facilitated by an external provider. The survey is used to provide an ongoing measure of the effectiveness of business relationships with the supplier community. VOS is the average of the suppliers’ rating across various attributes scored as a percentage of suppliers that provided a rating of six or seven on a seven-point scale
Voice of Team (VOT) Survey measuring sustainable engagement of our team members as well as their advocacy of Woolworths as a place to work and shop. The survey consists of nine sustainable engagement questions, three key driver questions and two advocacy questions
VOT NPS VOT NPS is a metric to assess Woolworths Team Member advocacy. VOT NPS is the percentage of promoters (those rating 9 or 10 on a scale of 0–10) minus the percentage of detractors (those rating 6 or below on a scale of 0–10)
Glossary
152
REGISTERED OFFICE1 Woolworths WayBella Vista NSW 2153Tel: (02) 8885 0000Web: www.woolworthsgroup.com.au
COMPANY SECRETARYMarcin Firek
INVESTOR RELATIONSPaul van Meurs
AUDITORDeloitte Touche Tohmatsu225 George Street, Sydney NSW 2000Tel: (02) 9322 7000Web: www.deloitte.com.au
SHAREHOLDER ENQUIRIESLink Market ServicesLocked Bag A14, Sydney South NSW 1235Web: www.linkmarketservices.com.au
For shareholders:Tel: 1300 368 664Email: [email protected]
For team members:Tel: 1800 111 281Email: [email protected]
MEDIAWoolworths Press OfficeTel: (02) 8885 1033Email: [email protected]
FIVE YEAR SUMMARYThe Five Year Summary is available on the Woolworths Group website.
Designed and produced by ArmstrongQ ArmstrongQ.com.au
This annual report is printed on Somerset Matt and Pacesetter Satin which are both FSC certified. Somerset Matt and Pacesetter Satin are manufactured from 100% fibre pulp sourced from Responsible Forestry.
FSC MIX
Landscape Logos
Portrait Logos
Company directory

We create better
experiences together
for a better tomorrow
What we mean by ‘create’We constantly innovate to make a positive impact on the lives of our customers and team
What we mean by ‘we’Our team and our partners
What we mean by ‘experiences’The moments we create in store and online for customers, communities and shareholders, as we work together in our teams – and with our partners
What we mean by ‘together’How we work in partnership – with each other, as well as with our partners and communities
What we mean by ‘tomorrow’The plans we make and the actions we take today will have a positive impact for generations to come
What we mean by ‘better’We always look for ways to improve – for our customers, team, communities and partners
Related Documents