OHA 2395 (11/3/21) Data are provisional and subject to change. 1 COVID-19 Weekly Report Oregon’s Weekly Surveillance Summary Novel Coronavirus (COVID-19) Weekly Data Report - November 3, 2021 Table of Contents Background .......................................................................................................................... 3 Weekly Report Summary ...................................................................................................... 4 Clinical Characteristics and risk factors ................................................................................ 5 Epidemiologic links ........................................................................................................... 5 Figure 1. Epidemiologic link of recent COVID-19 cases by week of onset .................... 6 Figure 2. Epidemiologic link of all COVID-19 cases by week of onset ........................... 7 Figure 3. Recent sporadic COVID-19 cases by race and week of onset ....................... 8 Figure 4. All sporadic COVD-19 cases by race and week of onset ............................... 9 Figure 5. Recent sporadic COVID-19 cases by ethnicity and week of onset ............... 10 Figure 6. All sporadic COVID-19 cases by ethnicity and week of onset ...................... 11 Clinical symptoms and reported risk factors .................................................................... 11 Figure 7. Reported signs and symptoms for all COVID-19 cases ................................ 12 Figure 8. Reported symptoms among all COVID-19 cases by week of onset .............. 13 Figure 9. Reported risk factors among all COVID-19 cases ........................................ 14 Demographics .................................................................................................................... 14 Geography ...................................................................................................................... 15 Figure 10. Case rates per 100,000 population, by county ........................................... 15 Sex ................................................................................................................................. 16 Table 1. Severity and rates of COVID-19 by sex ......................................................... 16 Figure 11. Recent COVID-19 cases by sex and week of onset ................................... 17 Figure 12. All COVID-19 cases by sex and week of onset .......................................... 18 Age ................................................................................................................................. 19 Table 2. Severity and rates of COVID-19 by age......................................................... 19 Figure 13. Recent COVID-19 cases by age and week of onset ................................... 20 Figure 14. All COVID-19 cases (counts) by age and week of onset ............................ 21 Figure 15. All COVID-19 cases (case rate per 100,000) by age and week of onset .... 22 Race ............................................................................................................................... 23

Welcome message from author
This document is posted to help you gain knowledge. Please leave a comment to let me know what you think about it! Share it to your friends and learn new things together.
Transcript

OHA 2395 (11/3/21) Data are provisional and subject to change.
1
COVID-19 Weekly Report Oregon’s Weekly Surveillance Summary
Novel Coronavirus (COVID-19)
Weekly Data Report - November 3, 2021
Table of Contents Background .......................................................................................................................... 3
Weekly Report Summary ...................................................................................................... 4
Clinical Characteristics and risk factors ................................................................................ 5
Epidemiologic links ........................................................................................................... 5
Figure 1. Epidemiologic link of recent COVID-19 cases by week of onset .................... 6
Figure 2. Epidemiologic link of all COVID-19 cases by week of onset ........................... 7
Figure 3. Recent sporadic COVID-19 cases by race and week of onset ....................... 8
Figure 4. All sporadic COVD-19 cases by race and week of onset ............................... 9
Figure 5. Recent sporadic COVID-19 cases by ethnicity and week of onset ............... 10
Figure 6. All sporadic COVID-19 cases by ethnicity and week of onset ...................... 11
Clinical symptoms and reported risk factors .................................................................... 11
Figure 7. Reported signs and symptoms for all COVID-19 cases ................................ 12
Figure 8. Reported symptoms among all COVID-19 cases by week of onset .............. 13
Figure 9. Reported risk factors among all COVID-19 cases ........................................ 14
Demographics .................................................................................................................... 14
Geography ...................................................................................................................... 15
Figure 10. Case rates per 100,000 population, by county ........................................... 15
Sex ................................................................................................................................. 16
Table 1. Severity and rates of COVID-19 by sex ......................................................... 16
Figure 11. Recent COVID-19 cases by sex and week of onset ................................... 17
Figure 12. All COVID-19 cases by sex and week of onset .......................................... 18
Age ................................................................................................................................. 19
Table 2. Severity and rates of COVID-19 by age......................................................... 19
Figure 13. Recent COVID-19 cases by age and week of onset ................................... 20
Figure 14. All COVID-19 cases (counts) by age and week of onset ............................ 21
Figure 15. All COVID-19 cases (case rate per 100,000) by age and week of onset .... 22
Race ............................................................................................................................... 23

OHA 2395 (11/3/21) Data are provisional and subject to change.
2
COVID-19 Weekly Report Oregon’s Weekly Surveillance Summary
Novel Coronavirus (COVID-19)
Table 3. Severity and rates of COVID-19 by race........................................................ 23
Figure 16. Recent COVID-19 cases by race and week of onset .................................. 24
Figure 17. All COVID-19 cases (counts) by race and week of onset ........................... 25
Figure 18. All COVID-19 cases (case rates per 100,000) by race and week of onset . 26
Ethnicity .......................................................................................................................... 27
Table 4. Severity and rates of COVID-19 by ethnicity ................................................. 27
Figure 19. Recent COVID-19 cases by ethnicity and week of onset............................ 28
Figure 20. All COVID-19 cases by ethnicity (counts) and week of onset ..................... 29
Figure 21. All COVID-19 cases by ethnicity (case rates per 100,000) and week of onset .................................................................................................................................... 30
Age-adjustment ............................................................................................................... 31
Table 5. Ratio of age-adjusted rates for cases, hospitalizations, and deaths by race .. 31
Table 6. Ratio of age-adjusted rates for cases, hospitalizations, and deaths by ethnicity .................................................................................................................................... 31
Follow-up ............................................................................................................................ 32
Figure 22. Follow up attempted within 24 hours, % by race ........................................ 33
Figure 23. Follow up attempted within 24 hours, % by ethnicity .................................. 34
Figure 24. Cases interviewed, by race ........................................................................ 35
Figure 25. Cases interviewed, by ethnicity .................................................................. 36
Recovery ............................................................................................................................ 36
Figure 26. Time to recovery among symptomatic people with COVID-19 ................... 37
People with Intellectual and Developmental Disabilities ..................................................... 37
Weekly COVID-19 Hospitalizations (HOSCAP) .................................................................. 38
Table 7. Hospitals reporting 10 or more COVID-19 patients. ....................................... 38
Table 8. Hospitals reporting 1–9 COVID-19 patients. .................................................. 40
ZIP code ............................................................................................................................. 41

OHA 2395 (11/3/21) Data are provisional and subject to change.
3
COVID-19 Weekly Report Oregon’s Weekly Surveillance Summary
Novel Coronavirus (COVID-19)
Background
COVID-19 Weekly Report data will be finalized every Sunday at 11 p.m. PDT/PST, and the report will be published on Wednesday. Please note that the data reported here are continually being updated. For daily up-to-date information, visit the OHA COVID-19 web page: https://govstatus.egov.com/OR-OHA-COVID-19.
As of 11 p.m. Sunday, October 31, there have been 367,608 cases of COVID-19 reported to the Oregon Health Authority. Of these, 12,204 (3.3%) are “presumptive” cases—i.e., people with COVID-19-like symptoms and close contact with a confirmed case, but who did not have a confirmatory laboratory test. Though not confirmed, presumptive cases are highly likely to have COVID-19, given their specific symptoms and known exposure. Presumptive cases are encouraged to seek testing to confirm that they do have COVID-19. Presumptive cases who test positive are recategorized as confirmed cases.
These data represent a snapshot of COVID-19 risk factors and clinical and demographic characteristics of cases, and they include data on cases with pending investigations. Not all cases have been interviewed at the time of this report. The data shown in this report come from Oregon’s electronic disease surveillance system for reportable diseases.
During the week of October 24–October 301, 130,325 tests for COVID-19 were performed on Oregonians; of these, 7.4% had a positive result.2 This figure represents a “test-based” method, whereby all electronic lab reports received by OHA are used to calculate percent positivity.3 Detailed tables of the number of tests and percent positivity can be found online at https://public.tableau.com/profile/oregon.health.authority.covid.19#!/vizhome/OregonHealthAuthorityCOVID-19DataDashboard/OregonsCOVID-19ELRsbyCounty.
1 This date range aligns with CDC’s “MMWR week.”
2 Does not include antibody (serology) tests.
3 www.cdc.gov/coronavirus/2019-ncov/lab/resources/calculating-percent-positivity.html

OHA 2395 (11/3/21) Data are provisional and subject to change.
4
COVID-19 Weekly Report Oregon’s Weekly Surveillance Summary
Novel Coronavirus (COVID-19)
Weekly Report Summary
During Monday, October 25, through Sunday, October 31, 2021, OHA recorded 7,877 new cases of COVID-19 infection—a 2.2% increase over last week’s count, and the first increase after eight consecutive weeks of declining counts. The increase occurred despite a 5.1% decrease in testing, with test positivity stable at 7.4%. The overall incidence of reported COVID-19 in Oregon was 174 per 100,000 this week, and again higher in counties with population vaccination rates <50% (collectively, 252 per 100,000) and 50%–60% (223 per 100,000). Counties with vaccination rates >60% had a collective COVID-19 incidence of 144 per 100,000. To date, 8.6% of Oregonians have been reported as having had COVID-19; the highest cumulative incidence has been among those 20–29 years of age (13.0%). Through September 5, 6.2% of reported cases had been in children <10 years of age; since September 5, 11.3% of cases have been reported from this age cohort.
Newly reported COVID-19-associated hospitalizations fell from 415 last week to 313 this week—the lowest figure since the week of July 26–August 1, 2021. The recent increase in the proportion of reported cases among persons <10 years of age has not been accompanied by a commensurate increase in COVID-19-associated hospitalizations: 1.2% of hospitalizations were reported in persons this age group before September 5 and 1.3% since that date.
Eighty-two COVID-19-associated deaths were reported last week—down from 110 the previous week. Of the 367,608 cases reported in Oregon to date, 19,565 (5.3%) have been hospitalized, and 4,377 (1.2%) have died. The proportion of COVID-19-associated deaths that have been among those ≥80 years of age has been lower (31%) during the July–October surge than previously (50%); conversely, the proportion among those 30–69 years of age has risen from 25% to 42%. To date, 5 COVID-19-associated deaths (0.1%) have been among persons <20 years of age. Data on mortality in Oregon, including deaths associated with COVID-19, are available at https://public.tableau.com/profile/oha.center.for.health.statistics.
Additional data are available at https://public.tableau.com/profile/oregon.health.authority.covid.19#!/vizhome/OregonCOVID-19CaseDemographicsandDiseaseSeverityStatewide/DemographicData.

OHA 2395 (11/3/21) Data are provisional and subject to change.
5
COVID-19 Weekly Report Oregon’s Weekly Surveillance Summary
Novel Coronavirus (COVID-19)
Clinical Characteristics and risk factors
This section of the report describes the epidemiology of Oregon’s COVID-19 cases, including indicators of COVID-19 transmission, common symptoms experienced by COVID-19 cases, and demographic breakdowns for sex, age, race, and ethnicity. Indicators of disease severity, specifically hospitalizations and deaths, are included in the tables.
Epidemiologic links
The figures below show the epidemiologic link of COVID-19 cases. Public health classifies all cases as part of a household, part of an outbreak, part of a cluster, a close contact of another case, or sporadic. Sporadic indicates that a case was not linked to a known source of COVID-19. Lower numbers of sporadic cases suggest lower community spread of COVID-19. Figure 1 focuses on recent cases of COVID-19, and allows for the easy comparison of different types of epidemiologic link. Figure 2 includes all COVID-19 cases, showing the pattern of epidemiologic links since the first cases were identified in Oregon. Figures 3 and 4 show sporadic cases by race, and figures 5 and 6 show sporadic cases by ethnicity. Looking at the data by race and ethnicity helps public health to identify disparities.
Epidemiologic link designations:
• Sporadic:4 Cases who do not have known exposure to another case or outbreak.
• Outbreak: Cases who have a shared, defined exposure with at least one other case. For example, a defined exposure could be an event, a workplace, a congregate facility, etc.
• Cluster: Cases who had contact with another case, but the exposure is not well defined. For example, cases from two households who interacted many times prior to illness onset.
• Household: Cases who were exposed to another case in their household.
4 Due to the lag between case reporting and case investigation, the proportion of cases categorized as sporadic is high in the most recent week or more; some of these cases will be recategorized after investigation is completed.

OHA 2395 (11/3/21) Data are provisional and subject to change.
6
COVID-19 Weekly Report Oregon’s Weekly Surveillance Summary
Novel Coronavirus (COVID-19)
• Close contact: Cases who were exposed to another case, not in their household. This designation was added on 7/15/2020.
Figure 1. Epidemiologic link of recent COVID-19 cases by week of onset

OHA 2395 (11/3/21) Data are provisional and subject to change.
7
COVID-19 Weekly Report Oregon’s Weekly Surveillance Summary
Novel Coronavirus (COVID-19)
Figure 2. Epidemiologic link of all COVID-19 cases by week of onset

OHA 2395 (11/3/21) Data are provisional and subject to change.
8
COVID-19 Weekly Report Oregon’s Weekly Surveillance Summary
Novel Coronavirus (COVID-19)
Figure 3. Recent sporadic COVID-19 cases by race and week of onset

OHA 2395 (11/3/21) Data are provisional and subject to change.
9
COVID-19 Weekly Report Oregon’s Weekly Surveillance Summary
Novel Coronavirus (COVID-19)
Figure 4. All sporadic COVID-19 cases by race and week of onset

OHA 2395 (11/3/21) Data are provisional and subject to change.
10
COVID-19 Weekly Report Oregon’s Weekly Surveillance Summary
Novel Coronavirus (COVID-19)
Figure 5. Recent sporadic COVID-19 cases by ethnicity and week of onset

OHA 2395 (11/3/21) Data are provisional and subject to change.
11
COVID-19 Weekly Report Oregon’s Weekly Surveillance Summary
Novel Coronavirus (COVID-19)
Figure 6. All sporadic COVID-19 cases by ethnicity and week of onset
Clinical symptoms and reported risk factors
Figure 7 provides information on signs and symptoms from all COVID-19 cases. Of 367,608 cases, 189,825 (51.6%) reported having signs and symptoms of COVID-19. The most commonly reported symptoms are cough (n=105,758, 28.8%) and headache (n=84,899, 23.1%). Figure 8 provides information on the percentage of COVID-19 cases that report symptoms over time. Figure 9 provides information on risk factors from all COVID-19 cases. The most common risk factors are having contact with a known COVID-19 case prior to symptom onset (n=149,089, 40.6%) and having underlying medical conditions (n=230,661, 62.7%). Note that a person may report more than one sign/symptom or risk factor. Where displayed by week in this report, case data are categorized by week of reported symptom onset, not by date of case report. This results in reduced numbers in the most recent week or more due to reporting lags.

OHA 2395 (11/3/21) Data are provisional and subject to change.
12
COVID-19 Weekly Report Oregon’s Weekly Surveillance Summary
Novel Coronavirus (COVID-19)
Figure 7. Reported signs and symptoms for all COVID-19 cases

OHA 2395 (11/3/21) Data are provisional and subject to change.
13
COVID-19 Weekly Report Oregon’s Weekly Surveillance Summary
Novel Coronavirus (COVID-19)
Figure 8. Reported symptoms among all COVID-19 cases by week of onset

OHA 2395 (11/3/21) Data are provisional and subject to change.
14
COVID-19 Weekly Report Oregon’s Weekly Surveillance Summary
Novel Coronavirus (COVID-19)
Figure 9. Reported risk factors among all COVID-19 cases
Risk factor definitions:
• Congregate living situations include, but are not limited to, long-term care facilities, group homes, prisons, and shelters. Data include people with confirmed cases who live or work in congregate living situations.
• Direct patient care is only asked if a case is a healthcare worker or volunteer. The denominator is the number of healthcare workers or volunteers.
• Underlying medical conditions include cardiovascular disease, chronic liver disease, chronic lung disease, chronic renal disease, current or former smoker, diabetes mellitus, immunocompromised condition, neurologic and neurodevelopmental conditions, obesity, or other chronic diseases.
Demographics
The following tables and figures show the demographic characteristics for all COVID-19 cases. The tables show case counts, case rates, and indicators of severity by sex, age, race and ethnicity. The figures show cases over time, by week of onset, for sex, age,

OHA 2395 (11/3/21) Data are provisional and subject to change.
15
COVID-19 Weekly Report Oregon’s Weekly Surveillance Summary
Novel Coronavirus (COVID-19)
race, and ethnicity. Figure 10 displays case rates by county, in comparison to the case rate for all of Oregon.
Geography
The following figure shows case rates by county for the most recently completed MMWR week, which is currently October 24 to October 30, 2021. Cases are displayed using the date that the case became known to public health.
Figure 10. Case rates per 100,000 population, by county

OHA 2395 (11/3/21) Data are provisional and subject to change.
16
COVID-19 Weekly Report Oregon’s Weekly Surveillance Summary
Novel Coronavirus (COVID-19)
1. Counties that had case rates above the case rate for the state are displayed in orange. Counties that had case rates below the case rate for the state are displayed in blue.
2. Counties that had zero cases in the time period displayed appear on the list, but do not have a bar to display.
Sex
Table 1. Severity and rates of COVID-19 by sex
Sex Cases % of total
cases Cases per
100,000 Hospitalized % Hospitalized Deaths
Case fatality
Female 185,653 50.5 8,583.4 9,179 4.9 1,974 1.1
Male 175,209 47.7 8,323.0 10,238 5.8 2,387 1.4
Non-Binary 37 0.0 0 0.0 0 0.0
Not Available
6,709 1.8 148 2.2 16 0.2
Total 367,608 100.0 8,613.0 19,565 5.3 4,377 1.2
1. Rates are calculated using population estimates from the 2020 Annual Population Report from Portland State University’s College of Urban & Public Affairs Population Research Center and 2019 housing and demographic data from the U.S. Census Bureau’s American Community Survey (ACS).

OHA 2395 (11/3/21) Data are provisional and subject to change.
17
COVID-19 Weekly Report Oregon’s Weekly Surveillance Summary
Novel Coronavirus (COVID-19)
Figure 11. Recent COVID-19 cases by sex and week of onset

OHA 2395 (11/3/21) Data are provisional and subject to change.
18
COVID-19 Weekly Report Oregon’s Weekly Surveillance Summary
Novel Coronavirus (COVID-19)
Figure 12. All COVID-19 cases by sex and week of onset

OHA 2395 (11/3/21) Data are provisional and subject to change.
19
COVID-19 Weekly Report Oregon’s Weekly Surveillance Summary
Novel Coronavirus (COVID-19)
Age
Table 2. Severity and rates of COVID-19 by age
Age group
Cases % of total
cases Cases per
100,000 Hospitalized % Hospitalized Deaths
Case fatality
0-9 26,370 7.2 5,623.8 240 0.9 2 0.0
10-19 41,867 11.4 8,296.6 335 0.8 3 0.0
20-29 71,520 19.5 12,987.3 1,158 1.6 23 0.0
30-39 64,426 17.5 10,868.6 1,605 2.5 58 0.1
40-49 54,779 14.9 10,152.6 2,144 3.9 163 0.3
50-59 45,438 12.4 8,511.8 3,120 6.9 377 0.8
60-69 32,298 8.8 5,897.1 3,962 12.3 784 2.4
70-79 18,789 5.1 5,340.0 3,776 20.1 1,066 5.7
80+ 11,478 3.1 6,443.5 3,218 28.0 1,901 16.6
Not Available
643 0.2 7 1.1 0 0.0
Total 367,608 100.0 8,613.0 19,565 5.3 4,377 1.2
1. Rates are calculated using population estimates from the 2020 Annual Population Report from Portland State University’s College of Urban & Public Affairs Population Research Center and 2019 housing and demographic data from the U.S. Census Bureau’s American Community Survey (ACS).

OHA 2395 (11/3/21) Data are provisional and subject to change.
20
COVID-19 Weekly Report Oregon’s Weekly Surveillance Summary
Novel Coronavirus (COVID-19)
Figure 13. Recent COVID-19 cases by age and week of onset

OHA 2395 (11/3/21) Data are provisional and subject to change.
21
COVID-19 Weekly Report Oregon’s Weekly Surveillance Summary
Novel Coronavirus (COVID-19)
Figure 14. All COVID-19 cases (counts) by age and week of onset

OHA 2395 (11/3/21) Data are provisional and subject to change.
22
COVID-19 Weekly Report Oregon’s Weekly Surveillance Summary
Novel Coronavirus (COVID-19)
Figure 15. All COVID-19 cases (case rate per 100,000) by age and week of onset

OHA 2395 (11/3/21) Data are provisional and subject to change.
23
COVID-19 Weekly Report Oregon’s Weekly Surveillance Summary
Novel Coronavirus (COVID-19)
Race
Table 3. Severity and rates of COVID-19 by race
Race Cases % of total
cases Cases per
100,000 Hospitalized % Hospitalized Deaths
Case fatality
> 1 race 5,266 1.4 2,568.9 290 5.5 67 1.3
American Indian/Alaska Native
6,118 1.7 12,317.6 422 6.9 78 1.3
Asian 8,170 2.2 4,377.8 477 5.8 87 1.1
Black 8,329 2.3 10,243.1 640 7.7 78 0.9
Not Available 85,769 23.3 2,304 2.7 742 0.9
Other 54,264 14.8 2,556 4.7 323 0.6
Pacific Islander 2,159 0.6 12,565.8 202 9.4 25 1.2
White 197,533 53.7 5,490.9 12,674 6.4 2,977 1.5
Total 367,608 100.0 8,613.0 19,565 5.3 4,377 1.2
1. During the case investigation, people are asked to self-report their race, ethnicity, tribal affiliation, country of origin or ancestry.
2. Rates are calculated using population estimates from the 2020 Annual Population Report from Portland State University’s College of Urban & Public Affairs Population Research Center and 2019 housing and demographic data from the U.S. Census Bureau’s American Community Survey (ACS).
3. Persons for which race information was not available were not included in these estimates. The number of persons with race data unavailable can be found in Table 3.
4. 43,140 (79.5%) of the 54,264 persons who identify as “Other” race also self-identify as Hispanic or Latino.

OHA 2395 (11/3/21) Data are provisional and subject to change.
24
COVID-19 Weekly Report Oregon’s Weekly Surveillance Summary
Novel Coronavirus (COVID-19)
Figure 16. Recent COVID-19 cases by race and week of onset

OHA 2395 (11/3/21) Data are provisional and subject to change.
25
COVID-19 Weekly Report Oregon’s Weekly Surveillance Summary
Novel Coronavirus (COVID-19)
Figure 17. All COVID-19 cases (counts) by race and week of onset

OHA 2395 (11/3/21) Data are provisional and subject to change.
26
COVID-19 Weekly Report Oregon’s Weekly Surveillance Summary
Novel Coronavirus (COVID-19)
Figure 18. All COVID-19 cases (case rates per 100,000) by race and week of onset

OHA 2395 (11/3/21) Data are provisional and subject to change.
27
COVID-19 Weekly Report Oregon’s Weekly Surveillance Summary
Novel Coronavirus (COVID-19)
Ethnicity
Table 4. Severity and rates of COVID-19 by ethnicity
Ethnicity Cases % of total
cases Cases per
100,000 Hospitalized % Hospitalized Deaths
Case fatality rate
Hispanic 61,725 16.8 11,124.7 2,680 4.3 307 0.5
Not Hispanic
185,045 50.3 4,983.4 12,138 6.6 2,720 1.5
Unknown 120,838 32.9 4,747 3.9 1,350 1.1
Total 367,608 100.0 8,613.0 19,565 5.3 4,377 1.2
1. Rates are calculated using population estimates from the 2020 Annual Population Report from Portland State University’s College of Urban & Public Affairs Population Research Center and 2019 housing and demographic data from the U.S. Census Bureau’s American Community Survey (ACS).

OHA 2395 (11/3/21) Data are provisional and subject to change.
28
COVID-19 Weekly Report Oregon’s Weekly Surveillance Summary
Novel Coronavirus (COVID-19)
Figure 19. Recent COVID-19 cases by ethnicity and week of onset

OHA 2395 (11/3/21) Data are provisional and subject to change.
29
COVID-19 Weekly Report Oregon’s Weekly Surveillance Summary
Novel Coronavirus (COVID-19)
Figure 20. All COVID-19 cases by ethnicity (counts) and week of onset

OHA 2395 (11/3/21) Data are provisional and subject to change.
30
COVID-19 Weekly Report Oregon’s Weekly Surveillance Summary
Novel Coronavirus (COVID-19)
Figure 21. All COVID-19 cases by ethnicity (case rates per 100,000) and week of onset

OHA 2395 (11/3/21) Data are provisional and subject to change.
31
COVID-19 Weekly Report Oregon’s Weekly Surveillance Summary
Novel Coronavirus (COVID-19)
Age-adjustment
Tables 5 and 6 show the ratio of age-adjusted rates of COVID-19 for cases, hospitalizations and deaths by race and ethnicity. Each table compares the rates of cases, hospitalizations and deaths between each group and a reference group and accounts for differences in population distributions in each group.
Table 5. Ratio of age-adjusted rates for cases, hospitalizations, and deaths by race
Age-adjusted rate ratios of cases, hospitalizations and deaths, compared to white persons
Race Cases Hospitalizations Deaths
> 1 race 0.5 0.8 1.2
American Indian/Alaska Native
2.2 2.9 3.0
Asian 0.8 0.9 0.9
Black 1.8 3.1 2.2
Pacific Islander 2.3 5.8 5.7
White 1.0 1.0 1.0
1. During the case investigation, people are asked to self-report their race, ethnicity, tribal affiliation, country of origin or ancestry.
2. U.S. Census Bureau; American Community Survey, 2019 American Community Survey 5-Year Estimates.
3. Persons for which race information was not available were not included in these estimates. The number of persons with race data unavailable can be found in Table 3.
Table 6. Ratio of age-adjusted rates for cases, hospitalizations, and deaths by ethnicity
Age-adjusted rate ratios of cases, hospitalizations and deaths, compared to non-Hispanic

OHA 2395 (11/3/21) Data are provisional and subject to change.
32
COVID-19 Weekly Report Oregon’s Weekly Surveillance Summary
Novel Coronavirus (COVID-19)
Ethnicity Cases Hospitalizations Deaths
Hispanic 2 2.6 2.3
Non-Hispanic 1 1.0 1.0
1. During the case investigation, people are asked to self-report their race, ethnicity, tribal affiliation, country of origin or ancestry.
2. U.S. Census Bureau; American Community Survey, 2019 American Community Survey 5-Year Estimates.
3. Persons for which ethnicity information was not available were not included in these estimates. The number of persons with ethnicity data unavailable can be found in Table 4.
Follow-up
Figure 22 shows the percentage of cases that were called within 24 hours of being reported to public health by race. Figure 23 shows the percentage of cases that were called within 24 hours of being reported to public health by ethnicity. Figure 24 shows the percentage of cases that were interviewed by race. Figure 25 shows the percentage of cases that were interviewed, by ethnicity. Race and ethnicity data are collected when cases are interviewed. Race and ethnicity data for cases that were not interviewed are abstracted from laboratory reports and medical records if it is available. The orange line in figures 22 and 23 represents the state metric for timely follow up for all cases: 95%.

OHA 2395 (11/3/21) Data are provisional and subject to change.
33
COVID-19 Weekly Report Oregon’s Weekly Surveillance Summary
Novel Coronavirus (COVID-19)
Figure 22. Follow up attempted within 24 hours, % by race

OHA 2395 (11/3/21) Data are provisional and subject to change.
34
COVID-19 Weekly Report Oregon’s Weekly Surveillance Summary
Novel Coronavirus (COVID-19)
Figure 23. Follow up attempted within 24 hours, % by ethnicity

OHA 2395 (11/3/21) Data are provisional and subject to change.
35
COVID-19 Weekly Report Oregon’s Weekly Surveillance Summary
Novel Coronavirus (COVID-19)
Figure 24. Cases interviewed, by race

OHA 2395 (11/3/21) Data are provisional and subject to change.
36
COVID-19 Weekly Report Oregon’s Weekly Surveillance Summary
Novel Coronavirus (COVID-19)
Figure 25. Cases interviewed, by ethnicity
Recovery
OHA staff periodically call people with reported COVID-19 who experienced fever, cough, shortness of breath or diarrhea and were initially interviewed before May 1, 2020, when OHA changed its definition of recovery, to inquire about resolution of symptoms. This group includes 1,884 people who were all diagnosed before mid-April and have not succumbed to their illness. Among these, 1,682 (88.8%) are considered to have recovered, and a recovery date is available for 1,387 people; their time to recovery

OHA 2395 (11/3/21) Data are provisional and subject to change.
37
COVID-19 Weekly Report Oregon’s Weekly Surveillance Summary
Novel Coronavirus (COVID-19)
is depicted in Figure 26. Of these 1,884 people, 16 (0.8%), have not yet recovered; and recovery status is not available for 186 (9.8%). People are assumed to have recovered three days after resolution of all symptoms. The median time to recovery among non-hospitalized symptomatic cases is 20 days (interquartile range: 15–29 days); among symptomatic cases who were hospitalized it is 26 days (interquartile range: 18–37 days).
Figure 26. Time to recovery among symptomatic people with COVID-19
Notes about recovery data:
• Recovery definition: three days after reported resolution of diarrhea, cough, shortness of breath and fever.
• Inclusion criteria: cases who were interviewed about their date of recovery before a change in recovery definition on May 1, 2020.
• Data for 1,387 cases are included.
• This was last updated on September 16, 2020; Data will be updated again as new information is available.
People with Intellectual and Developmental Disabilities
As of September 26, 2021 OHA is aware of 1,407 people with intellectual or developmental disabilities who have had COVID-19 to date. This includes individuals who live in congregate settings and in family or individual homes. To date, there are 41 deaths among people with intellectual or developmental disabilities. This number is from

OHA 2395 (11/3/21) Data are provisional and subject to change.
38
COVID-19 Weekly Report Oregon’s Weekly Surveillance Summary
Novel Coronavirus (COVID-19)
conducting a match between the ODHS Office of Developmental Disabilities Services client list and the Oregon COVID-19 case database. OHA will update this number on a quarterly basis.
Additional information about the ODDS program and COVID-19 can be found here: https://www.oregon.gov/dhs/SENIORS-DISABILITIES/DD/ODDS%20Resource%20Library/ODDS-Residential-COVID-19-Report.pdf.
ODDS data is based on self-reports from providers and case management entities and therefore may differ from testing data received from the Oregon Health Authority.
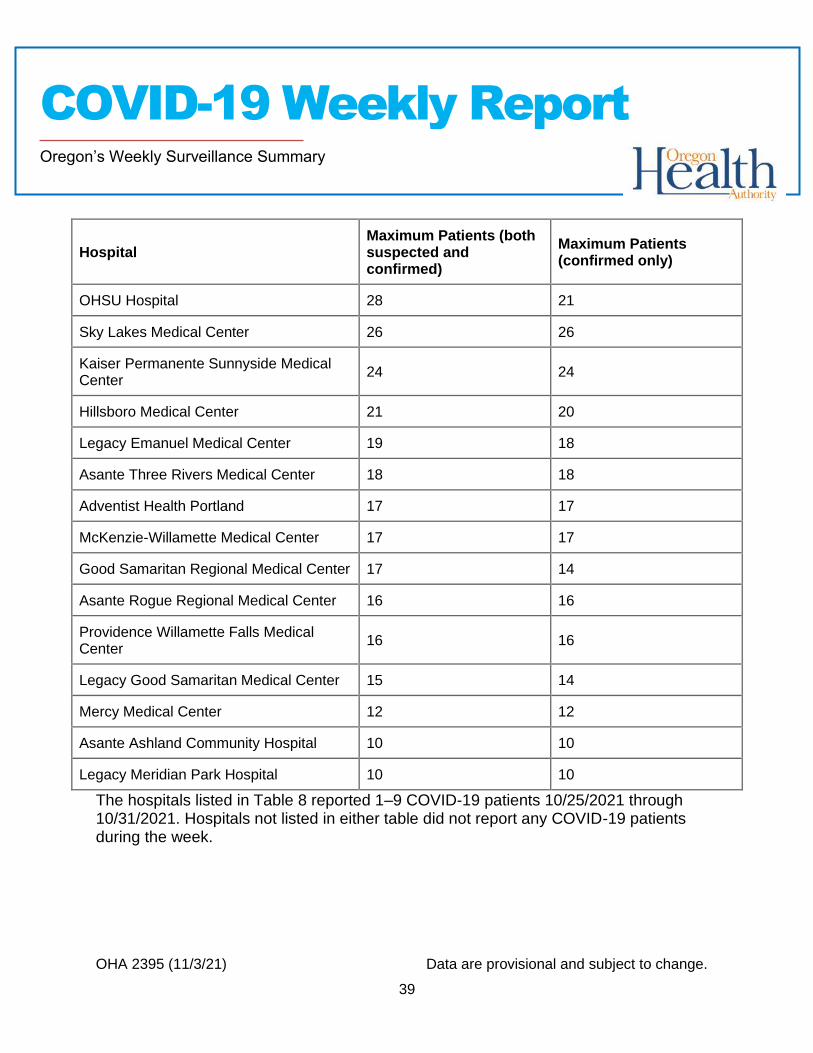
Weekly COVID-19 Hospitalizations (HOSCAP)
OHA is publishing data on the number of COVID-19 hospitalizations by hospital in the prior week; data are from HOSCAP. Table 7 lists all hospitals which, at some time during the week reported, had 10 or more COVID-19 patients. The left column shows the highest number of COVID-19 hospitalized patients for each hospital between 10/25/2021 and 10/31/2021. The right column shows the highest number of COVID-19 patients hospitalized during the same time period.
Table 7. Hospitals reporting 10 or more COVID-19 patients.
Hospital Maximum Patients (both suspected and confirmed)
Maximum Patients (confirmed only)
St. Charles Bend 76 74
Salem Health Hospital 55 54
PeaceHealth Sacred Heart MC at Riverbend
38 38
Providence St. Vincent Medical Center 38 38
Providence Medford Medical Center 29 28
Providence Portland Medical Center 28 26
OHA 2395 (11/3/21) Data are provisional and subject to change.
39
COVID-19 Weekly Report Oregon’s Weekly Surveillance Summary
Novel Coronavirus (COVID-19)
Hospital Maximum Patients (both suspected and confirmed)
Maximum Patients (confirmed only)
OHSU Hospital 28 21
Sky Lakes Medical Center 26 26
Kaiser Permanente Sunnyside Medical Center
24 24
Hillsboro Medical Center 21 20
Legacy Emanuel Medical Center 19 18
Asante Three Rivers Medical Center 18 18
Adventist Health Portland 17 17
McKenzie-Willamette Medical Center 17 17
Good Samaritan Regional Medical Center 17 14
Asante Rogue Regional Medical Center 16 16
Providence Willamette Falls Medical Center
16 16
Legacy Good Samaritan Medical Center 15 14
Mercy Medical Center 12 12
Asante Ashland Community Hospital 10 10
Legacy Meridian Park Hospital 10 10
The hospitals listed in Table 8 reported 1–9 COVID-19 patients 10/25/2021 through 10/31/2021. Hospitals not listed in either table did not report any COVID-19 patients during the week.

OHA 2395 (11/3/21) Data are provisional and subject to change.
40
COVID-19 Weekly Report Oregon’s Weekly Surveillance Summary
Novel Coronavirus (COVID-19)
Table 8. Hospitals reporting 1–9 COVID-19 patients.
Hospital
Adventist Health Tillamook
Bay Area Hospital
Columbia Memorial Hospital
Curry General Hospital
Good Shepherd Health Care System
Grande Ronde Hospital
Harney District Hospital
Kaiser Permanente Westside Medical Center
Lake District Hospital
Legacy Mount Hood Medical Center
Legacy Silverton Medical Center
Lower Umpqua Hospital
Mid-Columbia Medical Center
OHSU Doernbecher Children's Hospital
Providence Hood River Memorial Hospital
Providence Milwaukie Hospital
Providence Newberg Medical Center
Randall Children's Hospital at Legacy Emanuel
Samaritan Albany General Hospital
Samaritan Lebanon Community Hospital
Samaritan North Lincoln Hospital

OHA 2395 (11/3/21) Data are provisional and subject to change.
41
COVID-19 Weekly Report Oregon’s Weekly Surveillance Summary
Novel Coronavirus (COVID-19)
Hospital
Samaritan Pacific Communities Hospital
Santiam Hospital
Southern Coos Hospital and Health Center
St. Alphonsus Medical Center - Baker City
St. Alphonsus Medical Center - Ontario
St. Anthony Hospital
St. Charles Madras
St. Charles Prineville
St. Charles Redmond
VA Portland Health Care System
Wallowa Memorial Hospital
Willamette Valley Medical Center
ZIP code
OHA is publishing data on cases at the ZIP code level, available online at:
https://public.tableau.com/profile/oregon.health.authority.covid.19#!/vizhome/OregonCOVID-19CasesbyZIPCode/OregonsCOVID-19CasesbyZipCode?publish=yes.
Summary table of all zip codes available here:

OHA 2395 (11/3/21) Data are provisional and subject to change.
42
COVID-19 Weekly Report Oregon’s Weekly Surveillance Summary
Novel Coronavirus (COVID-19)
https://public.tableau.com/profile/oregon.health.authority.covid.19#!/vizhome/OregonCOVID-19CasesbyZIPCode-SummaryTable/CasesbyZIPCodeSummaryTable?publish=yes.
Document accessibility: For individuals with disabilities or individuals who speak a language other than English, OHA can provide information in alternate formats such as translations, large print, or braille. Contact the Health Information Center at 1-971-673-2411, 711 TTY or [email protected].
Related Documents


