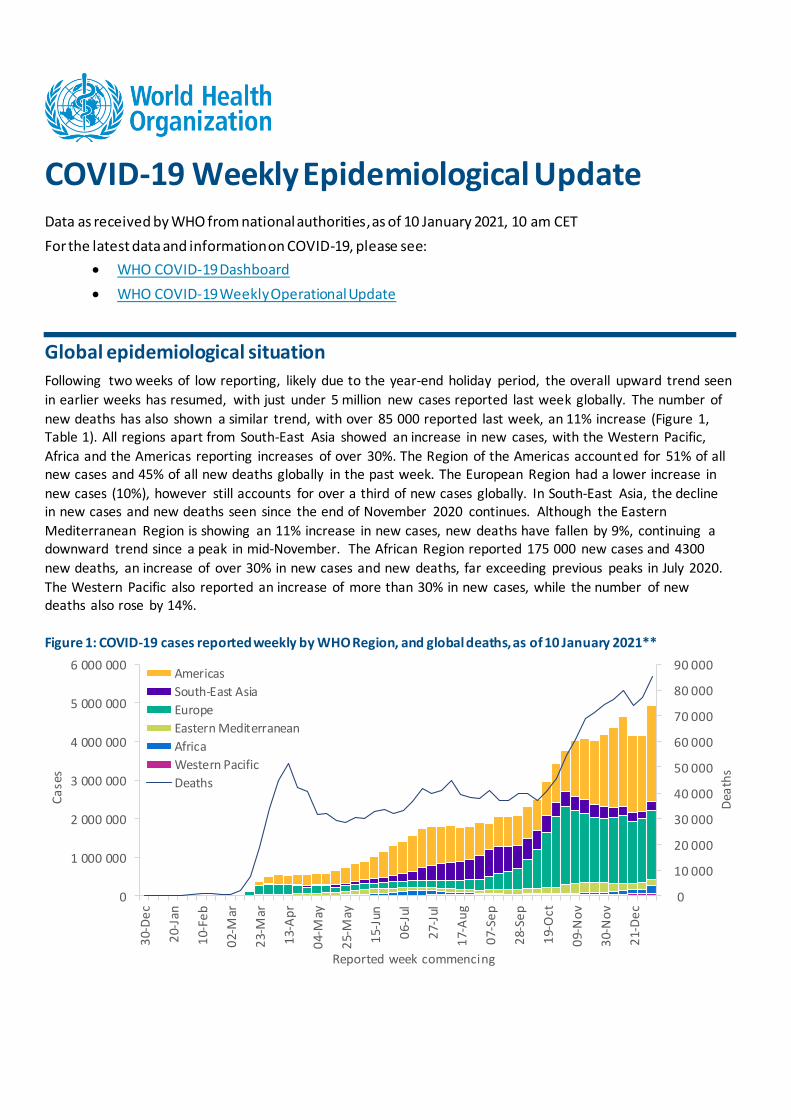
COVID-19 Weekly Epidemiological Update Data as received by WHO from national authorities, as of 10 January 2021, 10 am CET For the latest data and information on COVID-19, please see: • WHO COVID-19 Dashboard • WHO COVID-19 Weekly Operational Update Global epidemiological situation Following two weeks of low reporting, likely due to the year-end holiday period, the overall upward trend seen in earlier weeks has resumed, with just under 5 million new cases reported last week globally. The number of new deaths has also shown a similar trend, with over 85 000 reported last week, an 11% increase (Figure 1, Table 1). All regions apart from South-East Asia showed an increase in new cases, with the Western Pacific, Africa and the Americas reporting increases of over 30%. The Region of the Americas accounted for 51% of all new cases and 45% of all new deaths globally in the past week. The European Region had a lower increase in new cases (10%), however still accounts for over a third of new cases globally. In South-East Asia, the decline in new cases and new deaths seen since the end of November 2020 continues. Although the Eastern Mediterranean Region is showing an 11% increase in new cases, new deaths have fallen by 9%, continuing a downward trend since a peak in mid-November. The African Region reported 175 000 new cases and 4300 new deaths, an increase of over 30% in new cases and new deaths, far exceeding previous peaks in July 2020. The Western Pacific also reported an increase of more than 30% in new cases, while the number of new deaths also rose by 14%. Figure 1: COVID-19 cases reported weekly by WHO Region, and global deaths, as of 10 January 2021** 0 10 000 20 000 30 000 40 000 50 000 60 000 70 000 80 000 90 000 0 1 000 000 2 000 000 3 000 000 4 000 000 5 000 000 6 000 000 30-Dec 20-Jan 10-Feb 02-Mar 23-Mar 13-Apr 04-May 25-May 15-Jun 06-Jul 27-Jul 17-Aug 07-Sep 28-Sep 19-Oct 09-Nov 30-Nov 21-Dec Deaths Cases Reported week commencing Americas South-East Asia Europe Eastern Mediterranean Africa Western Pacific Deaths

Welcome message from author
This document is posted to help you gain knowledge. Please leave a comment to let me know what you think about it! Share it to your friends and learn new things together.
Transcript
COVID-19 Weekly Epidemiological Update Data as received by WHO from national authorities, as of 10 January 2021, 10 am CET
For the latest data and information on COVID-19, please see:
• WHO COVID-19 Dashboard
• WHO COVID-19 Weekly Operational Update
Global epidemiological situation Following two weeks of low reporting, likely due to the year-end holiday period, the overall upward trend seen
in earlier weeks has resumed, with just under 5 million new cases reported last week globally. The number of
new deaths has also shown a similar trend, with over 85 000 reported last week, an 11% increase (Figure 1, Table 1). All regions apart from South-East Asia showed an increase in new cases, with the Western Pacific,
Africa and the Americas reporting increases of over 30%. The Region of the Americas accounted for 51% of all new cases and 45% of all new deaths globally in the past week. The European Region had a lower increase in
new cases (10%), however still accounts for over a third of new cases globally. In South-East Asia, the decline in new cases and new deaths seen since the end of November 2020 continues. Although the Eastern
Mediterranean Region is showing an 11% increase in new cases, new deaths have fallen by 9%, continuing a downward trend since a peak in mid-November. The African Region reported 175 000 new cases and 4300
new deaths, an increase of over 30% in new cases and new deaths, far exceeding previous peaks in July 2020.
The Western Pacific also reported an increase of more than 30% in new cases, while the number of new deaths also rose by 14%.
Figure 1: COVID-19 cases reported weekly by WHO Region, and global deaths, as of 10 January 2021**
0
10 000
20 000
30 000
40 000
50 000
60 000
70 000
80 000
90 000
0
1 000 000
2 000 000
3 000 000
4 000 000
5 000 000
6 000 000
30-
De
c
20-
Jan
10-
Feb
02-
Mar
23-
Mar
13-
Ap
r
04-
May
25-
May
15-
Jun
06-
Jul
27-
Jul
17-
Au
g
07-
Sep
28-
Sep
19-
Oct
09-
No
v
30-
No
v
21-
De
c
Dea
ths
Ca
ses
Reported week commencing
Americas
South-East Asia
Europe
Eastern Mediterranean
Africa
Western Pacific
Deaths
In the past week, the five countries reporting the highest number of cases were the United States of America
(with 1 786 773 cases, a 35% increase), the United Kingdom of Great Britain and Northern Ireland (417 620 cases, a 22% increase), Brazil (313 130 cases, a 24% increase), the Russian Federation (165 167 cases,
continuing last week’s decrease with an 12% decrease) and Germany (142 861 cases, reversing last week’s decrease with a 15% increase).
Additional Region-specific information can be found below: African Region, Region of the Americas, Eastern
Mediterranean Region, European Region, South-East Asia Region, and Western Pacific Region.
Please note: New cases and deaths will be reported per 100 000 population instead of per 1 mill ion population, starting from this report.
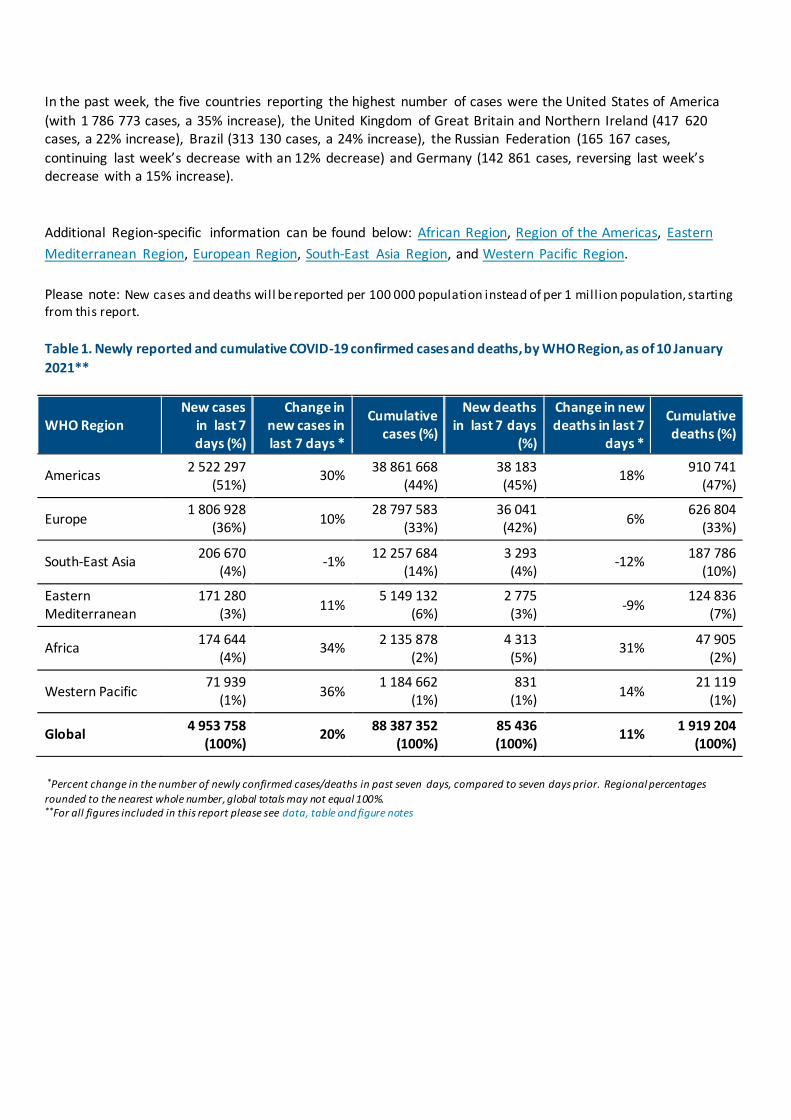
Table 1. Newly reported and cumulative COVID-19 confirmed cases and deaths, by WHO Region, as of 10 January
2021**
WHO Region New cases
in last 7 days (%)
Change in new cases in last 7 days *
Cumulative cases (%)
New deaths in last 7 days
(%)
Change in new deaths in last 7
days *
Cumulative deaths (%)
Americas 2 522 297
(51%) 30%
38 861 668 (44%)
38 183 (45%)
18% 910 741
(47%)
Europe 1 806 928
(36%) 10%
28 797 583 (33%)
36 041 (42%)
6% 626 804
(33%)
South-East Asia 206 670
(4%) -1%
12 257 684 (14%)
3 293 (4%)
-12% 187 786
(10%)
Eastern Mediterranean
171 280 (3%)
11% 5 149 132
(6%) 2 775 (3%)
-9% 124 836
(7%)
Africa 174 644
(4%) 34%
2 135 878 (2%)
4 313 (5%)
31% 47 905
(2%)
Western Pacific 71 939
(1%) 36%
1 184 662 (1%)
831 (1%)
14% 21 119
(1%)
Global 4 953 758
(100%) 20%
88 387 352 (100%)
85 436 (100%)
11% 1 919 204
(100%)
*Percent change in the number of newly confirmed cases/deaths in past seven days, compared to seven days prior. Regional percentages
rounded to the nearest whole number, global totals may not equal 100%. **For all figures included in this report please see data, table and figure notes

Figure 2. COVID-19 cases per 1 million population reported in the last seven days by countries, territories and areas, 4 January through 10 January 2021**
**See data, table and figure notes
SARS-CoV-2 Variants of concern Since the start of the COVID-19 pandemic, WHO has received several reports of public health events
associated with SARS-CoV-2 variants. When considered to potentially having different epidemiological, immunological or pathogenic properties, variants are reported to WHO and further investigated by national
authorities and scientists. Further background on variants of concern (VOC) is available in Disease Outbreak News and the Weekly Epidemiological Update published 5 January 2021. In collaboration with local
authorities, institutions and researchers, WHO routinely assesses if SARS-CoV-2 variants have altered transmissibility, clinical presentation and severity, or if they may respond differently to countermeasures,
including diagnostics, therapeutics and vaccines. While investigations are ongoing, in the following update, we
highlight the geographical extent of two variants – VOC 202012/01 (initially identified in the United Kingdom) and 501Y.V2 (initially identified in South Africa) – reported by countries, territories and areas as of 12 January
2021, as well as highlight recent reports of other new variants of potential concern.
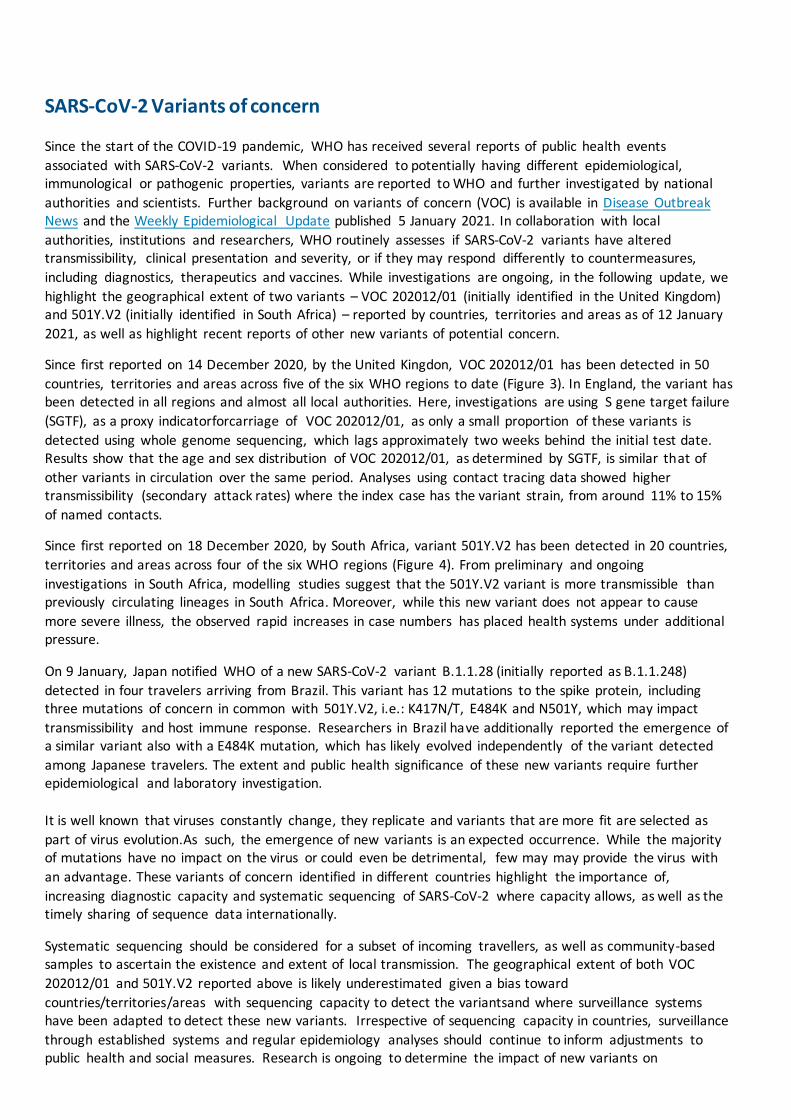
Since first reported on 14 December 2020, by the United Kingdon, VOC 202012/01 has been detected in 50
countries, territories and areas across five of the six WHO regions to date (Figure 3). In England, the variant has been detected in all regions and almost all local authorities. Here, investigations are using S gene target failure
(SGTF), as a proxy indicatorforcarriage of VOC 202012/01, as only a small proportion of these variants is
detected using whole genome sequencing, which lags approximately two weeks behind the initial test date. Results show that the age and sex distribution of VOC 202012/01, as determined by SGTF, is similar that of
other variants in circulation over the same period. Analyses using contact tracing data showed higher transmissibility (secondary attack rates) where the index case has the variant strain, from around 11% to 15%
of named contacts.
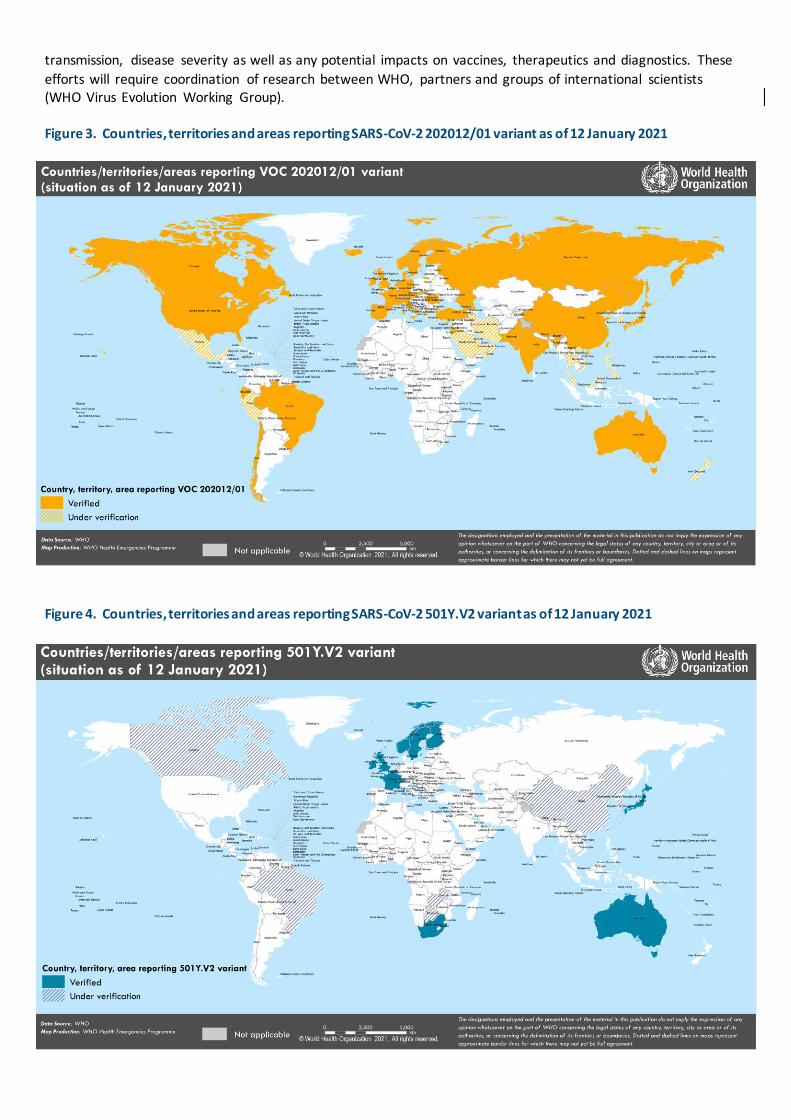
Since first reported on 18 December 2020, by South Africa, variant 501Y.V2 has been detected in 20 countries,
territories and areas across four of the six WHO regions (Figure 4). From preliminary and ongoing
investigations in South Africa, modelling studies suggest that the 501Y.V2 variant is more transmissible than previously circulating lineages in South Africa. Moreover, while this new variant does not appear to cause
more severe illness, the observed rapid increases in case numbers has placed health systems under additional pressure.
On 9 January, Japan notified WHO of a new SARS-CoV-2 variant B.1.1.28 (initially reported as B.1.1.248)
detected in four travelers arriving from Brazil. This variant has 12 mutations to the spike protein, including three mutations of concern in common with 501Y.V2, i.e.: K417N/T, E484K and N501Y, which may impact
transmissibility and host immune response. Researchers in Brazil have additionally reported the emergence of a similar variant also with a E484K mutation, which has likely evolved independently of the variant detected
among Japanese travelers. The extent and public health significance of these new variants require further epidemiological and laboratory investigation.
It is well known that viruses constantly change, they replicate and variants that are more fit are selected as
part of virus evolution.As such, the emergence of new variants is an expected occurrence. While the majority of mutations have no impact on the virus or could even be detrimental, few may may provide the virus with
an advantage. These variants of concern identified in different countries highlight the importance of,
increasing diagnostic capacity and systematic sequencing of SARS-CoV-2 where capacity allows, as well as the timely sharing of sequence data internationally.
Systematic sequencing should be considered for a subset of incoming travellers, as well as community-based samples to ascertain the existence and extent of local transmission. The geographical extent of both VOC
202012/01 and 501Y.V2 reported above is likely underestimated given a bias toward
countries/territories/areas with sequencing capacity to detect the variantsand where surveillance systems have been adapted to detect these new variants. Irrespective of sequencing capacity in countries, surveillance
through established systems and regular epidemiology analyses should continue to inform adjustments to public health and social measures. Research is ongoing to determine the impact of new variants on
transmission, disease severity as well as any potential impacts on vaccines, therapeutics and diagnostics. These
efforts will require coordination of research between WHO, partners and groups of international scientists (WHO Virus Evolution Working Group).
Figure 3. Countries, territories and areas reporting SARS-CoV-2 202012/01 variant as of 12 January 2021
Figure 4. Countries, territories and areas reporting SARS-CoV-2 501Y.V2 variant as of 12 January 2021
Situation by WHO Region
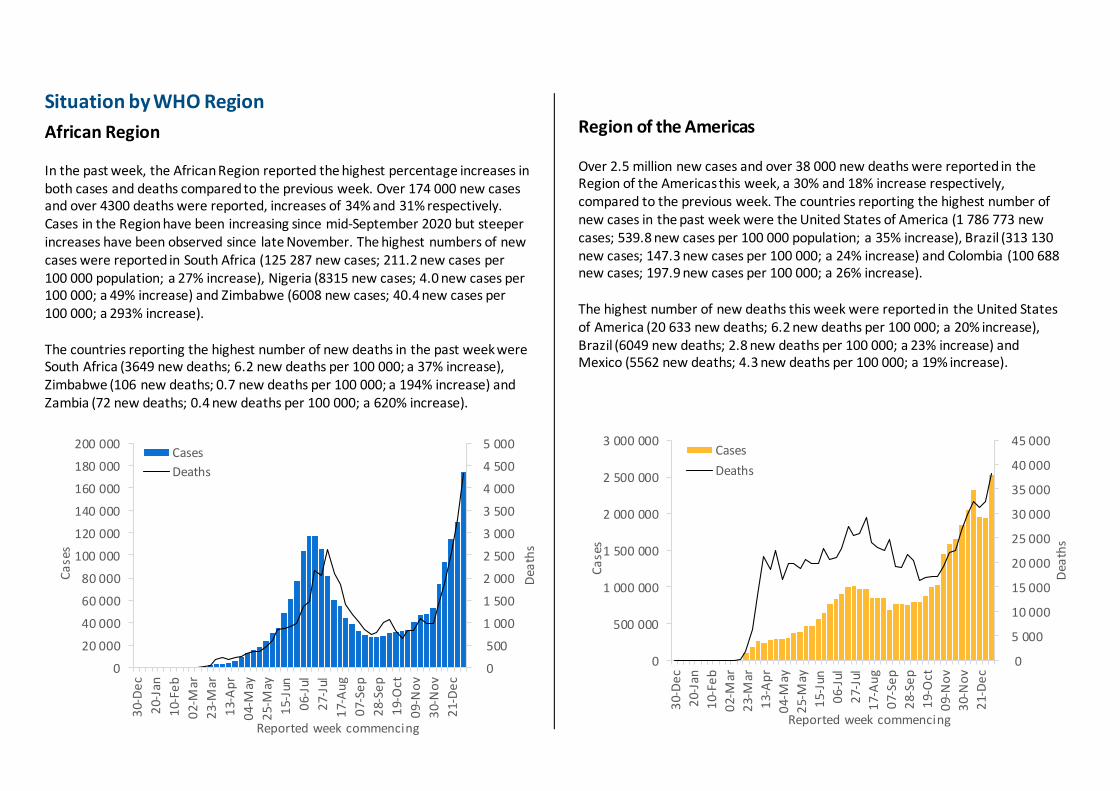
African Region In the past week, the African Region reported the highest percentage increases in both cases and deaths compared to the previous week. Over 174 000 new cases and over 4300 deaths were reported, increases of 34% and 31% respectively. Cases in the Region have been increasing since mid-September 2020 but steeper increases have been observed since late November. The highest numbers of new cases were reported in South Africa (125 287 new cases; 211.2 new cases per 100 000 population; a 27% increase), Nigeria (8315 new cases; 4.0 new cases per 100 000; a 49% increase) and Zimbabwe (6008 new cases; 40.4 new cases per 100 000; a 293% increase). The countries reporting the highest number of new deaths in the past week were South Africa (3649 new deaths; 6.2 new deaths per 100 000; a 37% increase), Zimbabwe (106 new deaths; 0.7 new deaths per 100 000; a 194% increase) and Zambia (72 new deaths; 0.4 new deaths per 100 000; a 620% increase).
Region of the Americas Over 2.5 million new cases and over 38 000 new deaths were reported in the Region of the Americas this week, a 30% and 18% increase respectively, compared to the previous week. The countries reporting the highest number of new cases in the past week were the United States of America (1 786 773 new cases; 539.8 new cases per 100 000 population; a 35% increase), Brazil (313 130 new cases; 147.3 new cases per 100 000; a 24% increase) and Colombia (100 688 new cases; 197.9 new cases per 100 000; a 26% increase). The highest number of new deaths this week were reported in the United States of America (20 633 new deaths; 6.2 new deaths per 100 000; a 20% increase), Brazil (6049 new deaths; 2.8 new deaths per 100 000; a 23% increase) and Mexico (5562 new deaths; 4.3 new deaths per 100 000; a 19% increase).
0
5 000
10 000
15 000
20 000
25 000
30 000
35 000
40 000
45 000
0
500 000
1 000 000
1 500 000
2 000 000
2 500 000
3 000 000
30-
De
c
20-
Jan
10-
Feb
02-
Mar
23-
Mar
13-
Ap
r
04-
May
25-
May
15-
Jun
06-
Jul
27-
Jul
17-
Au
g
07-
Sep
28-
Sep
19-
Oct
09-
No
v
30-
No
v
21-
De
c
Dea
ths
Ca
ses
Reported week commencing
Cases
Deaths
0
500
1 000
1 500
2 000
2 500
3 000
3 500
4 000
4 500
5 000
0
20 000
40 000
60 000
80 000
100 000
120 000
140 000
160 000
180 000
200 000
30-
De
c
20-
Jan
10-
Feb
02-
Mar
23-
Mar
13-
Ap
r
04-
May
25-
May
15-
Jun
06-
Jul
27-
Jul
17-
Au
g
07-
Sep
28-
Sep
19-
Oct
09-
No
v
30-
No
v
21-
De
c
Dea
ths
Ca
ses
Reported week commencing
Cases
Deaths
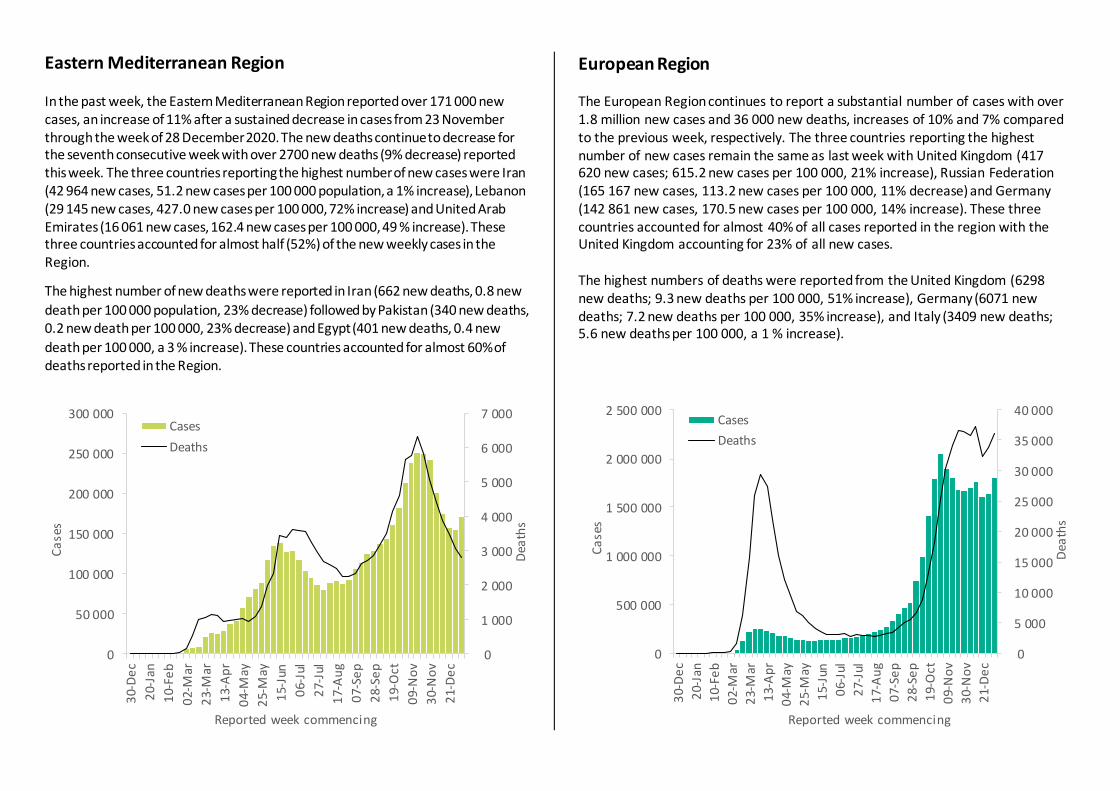
Eastern Mediterranean Region
In the past week, the Eastern Mediterranean Region reported over 171 000 new cases, an increase of 11% after a sustained decrease in cases from 23 November through the week of 28 December 2020. The new deaths continue to decrease for the seventh consecutive week with over 2700 new deaths (9% decrease) reported this week. The three countries reporting the highest number of new cases were Iran (42 964 new cases, 51.2 new cases per 100 000 population, a 1% increase), Lebanon (29 145 new cases, 427.0 new cases per 100 000, 72% increase) and United Arab Emirates (16 061 new cases, 162.4 new cases per 100 000, 49 % increase). These three countries accounted for almost half (52%) of the new weekly cases in the Region.
The highest number of new deaths were reported in Iran (662 new deaths, 0.8 new
death per 100 000 population, 23% decrease) followed by Pakistan (340 new deaths, 0.2 new death per 100 000, 23% decrease) and Egypt (401 new deaths, 0.4 new
death per 100 000, a 3 % increase). These countries accounted for almost 60% of deaths reported in the Region.
European Region
The European Region continues to report a substantial number of cases with over 1.8 million new cases and 36 000 new deaths, increases of 10% and 7% compared to the previous week, respectively. The three countries reporting the highest number of new cases remain the same as last week with United Kingdom (417 620 new cases; 615.2 new cases per 100 000, 21% increase), Russian Federation (165 167 new cases, 113.2 new cases per 100 000, 11% decrease) and Germany (142 861 new cases, 170.5 new cases per 100 000, 14% increase). These three countries accounted for almost 40% of all cases reported in the region with the United Kingdom accounting for 23% of all new cases. The highest numbers of deaths were reported from the United Kingdom (6298 new deaths; 9.3 new deaths per 100 000, 51% increase), Germany (6071 new deaths; 7.2 new deaths per 100 000, 35% increase), and Italy (3409 new deaths; 5.6 new deaths per 100 000, a 1 % increase).
0
1 000
2 000
3 000
4 000
5 000
6 000
7 000
0
50 000
100 000
150 000
200 000
250 000
300 000
30-
De
c
20-
Jan
10-
Feb
02-
Mar
23-
Mar
13-
Ap
r
04-
May
25-
May
15-
Jun
06-
Jul
27-
Jul
17-
Au
g
07-
Sep
28-
Sep
19-
Oct
09-
No
v
30-
No
v
21-
De
c
Dea
ths
Ca
ses
Reported week commencing
Cases
Deaths
0
5 000
10 000
15 000
20 000
25 000
30 000
35 000
40 000
0
500 000
1 000 000
1 500 000
2 000 000
2 500 000
30-
De
c
20-
Jan
10-
Feb
02-
Mar
23-
Mar
13-
Ap
r
04-
May
25-
May
15-
Jun
06-
Jul
27-
Jul
17-
Au
g
07-
Sep
28-
Sep
19-
Oct
09-
No
v
30-
No
v
21-
De
c
Dea
ths
Ca
ses
Reported week commencing
Cases
Deaths

South-East Asia Region
The South-East Asia Region reported similar numbers of new cases and deaths,
with an overall declining trend observed since early September 2020. Just over 200 000 new cases and 3200 new deaths were reported in the past week, a 1%
and 12% decrease respectively, compared to the previous week. The three countries reporting the highest number of new cases and new deaths were India
(126 319 new cases; 9.2 new cases per 100 000, a 7% decrease; 1564 new deaths; 0.1 new death per 100 000, a 14% decrease), Indonesia (59 913 new cases; 21.9
new cases per 100 000; a 16% increase; 1392 new deaths; 0.5 new death per 100 000, a 11% decrease) and Bangladesh (6198 new cases; 3.8 new cases per 100
000; a 13% decrease; 157 new deaths; 0.1 new death per 100 000; an 8% decrease). India has consistently reported the highest number of new cases and
deaths cumulatively in the region since the end of the first week of April 2020.
Western Pacific Region
In the past week, the Western Pacific Region reported an increase in the number of new cases by 36% (over 71 000) and new deaths by 14% (over 800)
compared to the previous week. An upward trend in new weekly cases has been reported since late October 2020. The three countries reporting the
highest numbers of new cases this week were Japan (39 821 new cases; 31.5 new cases per 100 000, a 68% increase), Malaysia (16 186 new cases; 50.0
new cases per 100 000, a 20% increase) and the Philippines (8881 new cases;
8.1 new cases per 100 000, a 12% increase).
The three countries reporting the highest numbers of new deaths this week
were Japan (448 new deaths; 0.4 new deaths per 100 000, a 34% increase), the Republic of Korea (163 new deaths; 0.3 new deaths per 100 000, a 6%
increase) and the Philippines (145 new deaths; 0.1 new deaths per 100 000, a
22% decrease).
0
1 000
2 000
3 000
4 000
5 000
6 000
7 000
8 000
9 000
10 000
0
100 000
200 000
300 000
400 000
500 000
600 000
700 000
800 000
30-
De
c
20-
Jan
10-
Feb
02-
Mar
23-
Mar
13-
Ap
r
04-
May
25-
May
15-
Jun
06-
Jul
27-
Jul
17-
Au
g
07-
Sep
28-
Sep
19-
Oct
09-
No
v
30-
No
v
21-
De
c
Dea
ths
Ca
ses
Reported week commencing
Cases
Deaths
0
200
400
600
800
1 000
1 200
1 400
1 600
0
10 000
20 000
30 000
40 000
50 000
60 000
70 000
80 000
30-
De
c
20-
Jan
10-
Feb
02-
Mar
23-
Mar
13-
Ap
r
04-
May
25-
May
15-
Jun
06-
Jul
27-
Jul
17-
Au
g
07-
Sep
28-
Sep
19-
Oct
09-
No
v
30-
No
v
21-
De
c
Dea
ths
Ca
ses
Reported week commencing
Cases
Deaths
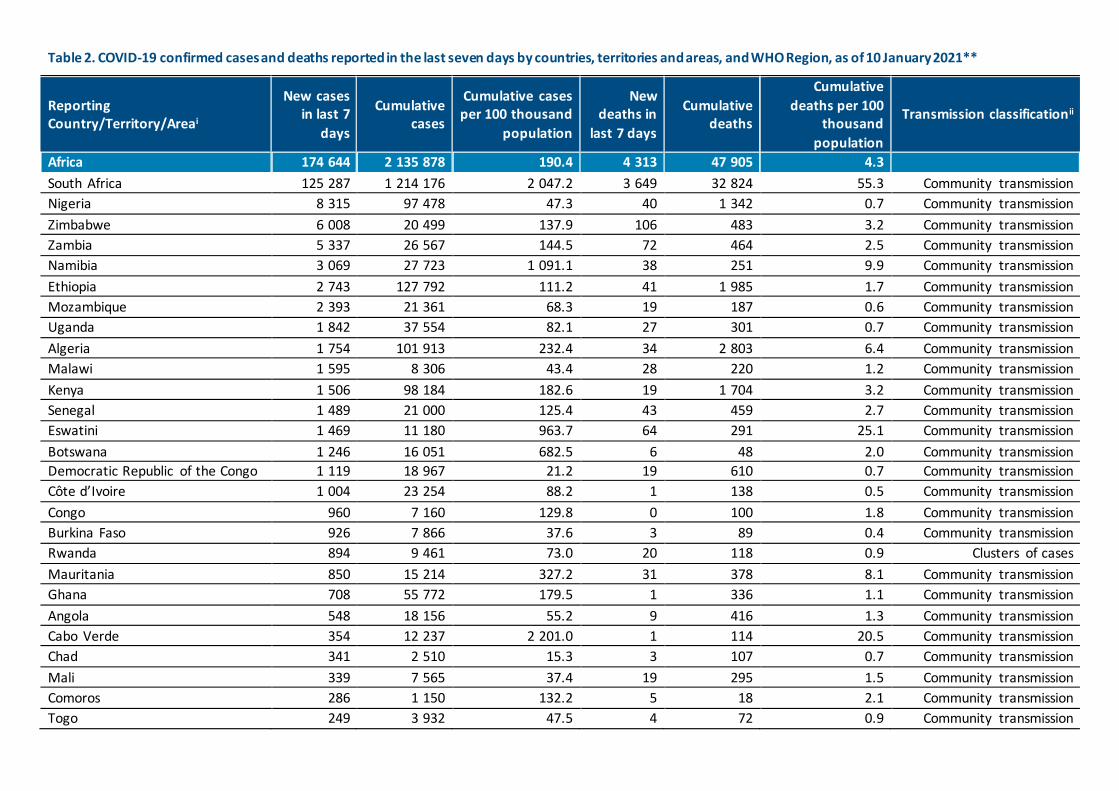
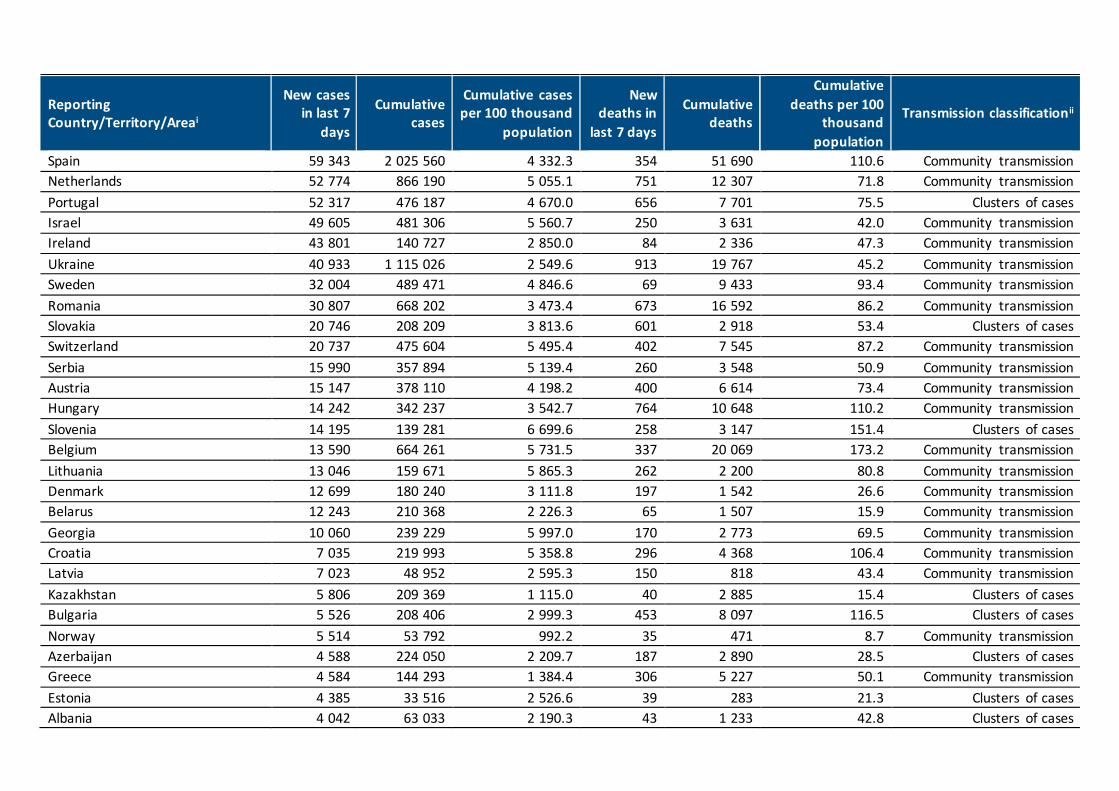
Table 2. COVID-19 confirmed cases and deaths reported in the last seven days by countries, territories and areas, and WHO Region, as of 10 January 2021**
Reporting Country/Territory/Areai
New cases in last 7
days
Cumulative cases
Cumulative cases per 100 thousand
population
New deaths in
last 7 days
Cumulative deaths
Cumulative
deaths per 100 thousand
population
Transmission classification ii
Africa 174 644 2 135 878 190.4 4 313 47 905 4.3
South Africa 125 287 1 214 176 2 047.2 3 649 32 824 55.3 Community transmission
Nigeria 8 315 97 478 47.3 40 1 342 0.7 Community transmission
Zimbabwe 6 008 20 499 137.9 106 483 3.2 Community transmission
Zambia 5 337 26 567 144.5 72 464 2.5 Community transmission
Namibia 3 069 27 723 1 091.1 38 251 9.9 Community transmission
Ethiopia 2 743 127 792 111.2 41 1 985 1.7 Community transmission
Mozambique 2 393 21 361 68.3 19 187 0.6 Community transmission
Uganda 1 842 37 554 82.1 27 301 0.7 Community transmission
Algeria 1 754 101 913 232.4 34 2 803 6.4 Community transmission
Malawi 1 595 8 306 43.4 28 220 1.2 Community transmission
Kenya 1 506 98 184 182.6 19 1 704 3.2 Community transmission
Senegal 1 489 21 000 125.4 43 459 2.7 Community transmission
Eswatini 1 469 11 180 963.7 64 291 25.1 Community transmission
Botswana 1 246 16 051 682.5 6 48 2.0 Community transmission
Democratic Republic of the Congo 1 119 18 967 21.2 19 610 0.7 Community transmission
Côte d’Ivoire 1 004 23 254 88.2 1 138 0.5 Community transmission
Congo 960 7 160 129.8 0 100 1.8 Community transmission
Burkina Faso 926 7 866 37.6 3 89 0.4 Community transmission
Rwanda 894 9 461 73.0 20 118 0.9 Clusters of cases
Mauritania 850 15 214 327.2 31 378 8.1 Community transmission
Ghana 708 55 772 179.5 1 336 1.1 Community transmission
Angola 548 18 156 55.2 9 416 1.3 Community transmission
Cabo Verde 354 12 237 2 201.0 1 114 20.5 Community transmission
Chad 341 2 510 15.3 3 107 0.7 Community transmission
Mali 339 7 565 37.4 19 295 1.5 Community transmission
Comoros 286 1 150 132.2 5 18 2.1 Community transmission
Togo 249 3 932 47.5 4 72 0.9 Community transmission

Reporting Country/Territory/Areai
New cases in last 7
days
Cumulative cases
Cumulative cases per 100 thousand
population
New deaths in
last 7 days
Cumulative deaths
Cumulative
deaths per 100 thousand
population
Transmission classification ii
Sierra Leone 243 2 803 35.1 1 77 1.0 Community transmission
Eritrea 236 1 556 43.9 3 6 0.2 Sporadic cases
Seychelles 218 502 510.4 1 1 1.0 Sporadic cases
Burundi 153 986 8.3 0 2 0.0 Community transmission
Gabon 123 9 694 435.5 2 66 3.0 Community transmission
Guinea 120 13 904 105.9 0 81 0.6 Community transmission
Niger 114 3 322 13.7 2 104 0.4 Community transmission
South Sudan 82 3 640 32.5 0 63 0.6 Community transmission
Gambia 55 3 857 159.6 1 125 5.2 Community transmission
Benin 53 3 304 27.3 0 44 0.4 Community transmission
Sao Tome and Principe 30 1 054 480.9 0 17 7.8 Community transmission
Equatorial Guinea 12 5 289 377.0 0 86 6.1 Community transmission
Mauritius 12 539 42.4 0 10 0.8 Clusters of cases
Central African Republic 10 4 973 103.0 0 63 1.3 Community transmission
Cameroon 0 26 848 101.1 0 448 1.7 Community transmission
Guinea-Bissau 0 2 447 124.3 0 45 2.3 Community transmission
Lesotho 0 2 577 120.3 0 50 2.3 Community transmission
Liberia 0 1 800 35.6 0 83 1.6 Community transmission
Madagascar 0 17 767 64.2 0 262 0.9 Community transmission
United Republic of Tanzania 0 509 0.9 0 21 0.0 Community transmission
Territoriesiii
Mayotte 342 6 232 2 284.3 1 56 20.5 Clusters of cases
Réunion 210 9 247 1 032.8 0 42 4.7 Clusters of cases
Americas 2 522 297 38 861 668 3 799.6 38 183 910 741 89.0
United States of America 1 786 773 21 761 186 6 574.3 20 633 365 886 110.5 Community transmission
Brazil 313 130 8 013 708 3 770.1 6 049 201 460 94.8 Community transmission
Colombia 100 688 1 755 568 3 450.2 1 936 45 431 89.3 Community transmission
Argentina 73 758 1 703 352 3 768.8 954 44 273 98.0 Community transmission

Reporting
Country/Territory/Areai
New cases in last 7
days
Cumulative
cases
Cumulative cases per 100 thousand
population
New deaths in
last 7 days
Cumulative
deaths
Cumulative deaths per 100
thousand population
Transmission classification ii
Mexico 70 746 1 507 931 1 169.5 5 562 132 069 102.4 Community transmission
Canada 56 071 644 348 1 707.2 966 16 707 44.3 Community transmission
Panama 23 304 273 037 6 328.0 299 4 363 101.1 Community transmission
Chile 21 840 637 742 3 336.1 313 17 037 89.1 Community transmission
Peru 12 272 1 029 471 3 122.3 421 38 145 115.7 Community transmission
Bolivia (Plurinational State of) 9 099 171 154 1 466.2 142 9 328 79.9 Community transmission
Dominican Republic 7 679 180 644 1 665.2 8 2 424 22.3 Community transmission
Costa Rica 7 023 177 614 3 486.6 112 2 305 45.2 Community transmission
Ecuador 5 836 220 349 1 248.9 118 14 177 80.4 Community transmission
Paraguay 5 645 113 994 1 598.2 110 2 372 33.3 Community transmission
Guatemala 4 811 143 127 798.9 172 4 999 27.9 Community transmission
Uruguay 4 586 24 339 700.7 47 240 6.9 Community transmission
Honduras 3 422 126 396 1 276.1 106 3 266 33.0 Community transmission
El Salvador 2 332 48 574 748.9 57 1 408 21.7 Community transmission
Venezuela (Bolivarian Republic of) 2 105 115 667 406.8 28 1 056 3.7 Community transmission
Cuba 1 963 14 188 125.3 2 148 1.3 Clusters of cases
Suriname 577 6 854 1 168.4 8 131 22.3 Clusters of cases
Jamaica 524 13 455 454.4 8 311 10.5 Community transmission
Barbados 413 808 281.2 0 7 2.4 Clusters of cases
Belize 395 11 202 2 817.2 22 271 68.2 Community transmission
Haiti 164 10 241 89.8 1 237 2.1 Community transmission
Guyana 118 6 469 822.5 3 167 21.2 Clusters of cases
Saint Vincent and the Grenadines 82 204 183.9 0 0 0.0 Sporadic cases
Bahamas 70 7 969 2 026.5 4 175 44.5 Clusters of cases
Trinidad and Tobago 61 7 219 515.8 0 127 9.1 Community transmission
Saint Lucia 42 395 215.1 0 5 2.7 Sporadic cases
Nicaragua 38 4 867 73.5 1 166 2.5 Community transmission
Antigua and Barbuda 10 169 172.6 0 5 5.1 Sporadic cases
Dominica 10 106 147.2 0 0 0.0 Clusters of cases

Reporting Country/Territory/Areai
New cases in last 7
days
Cumulative cases
Cumulative cases per 100 thousand
population
New deaths in
last 7 days
Cumulative deaths
Cumulative
deaths per 100 thousand
population
Transmission classification ii
Grenada 5 135 120.0 0 1 0.9 Sporadic cases
Saint Kitts and Nevis 1 34 63.9 0 0 0.0 Sporadic cases
Territoriesiii
Puerto Rico 4 698 82 630 2 888.3 90 1 616 56.5 Community transmission
French Guiana 840 14 113 4 725.1 3 74 24.8 Community transmission
Aruba 441 5 883 5 510.2 1 50 46.8 Community transmission
Curaçao 175 4 405 2 684.5 4 18 11.0 Community transmission
United States Virgin Islands 107 2 143 2 052.2 1 24 23.0 Community transmission
Sint Maarten 97 1 531 3 570.3 0 27 63.0 Community transmission
Bonaire 89 254 1 214.4 0 3 14.3 Sporadic cases
Guadeloupe 82 8 702 2 174.8 0 155 38.7 Community transmission
Turks and Caicos Islands 57 965 2 492.4 0 6 15.5 Clusters of cases
Bermuda 42 646 1 037.4 2 12 19.3 Clusters of cases
Martinique 26 6 117 1 630.0 0 43 11.5 Community transmission
British Virgin Islands 21 114 377.0 0 1 3.3 Clusters of cases
Cayman Islands 21 359 546.3 0 2 3.0 Sporadic cases
Saint Martin 7 1 002 2 591.9 0 12 31.0 Community transmission
Saint Barthélemy 1 191 1 932.2 0 0 0.0 Sporadic cases
Anguilla 0 15 100.0 0 0 0.0 Sporadic cases
Falkland Islands (Malvinas) 0 29 832.6 0 0 0.0 No cases
Montserrat 0 13 260.1 0 1 20.0 No cases
Saba 0 5 258.7 0 0 0.0 No cases
Saint Pierre and Miquelon 0 16 276.1 0 0 0.0 Sporadic cases
Sint Eustatius 0 19 605.3 0 0 0.0 Sporadic cases
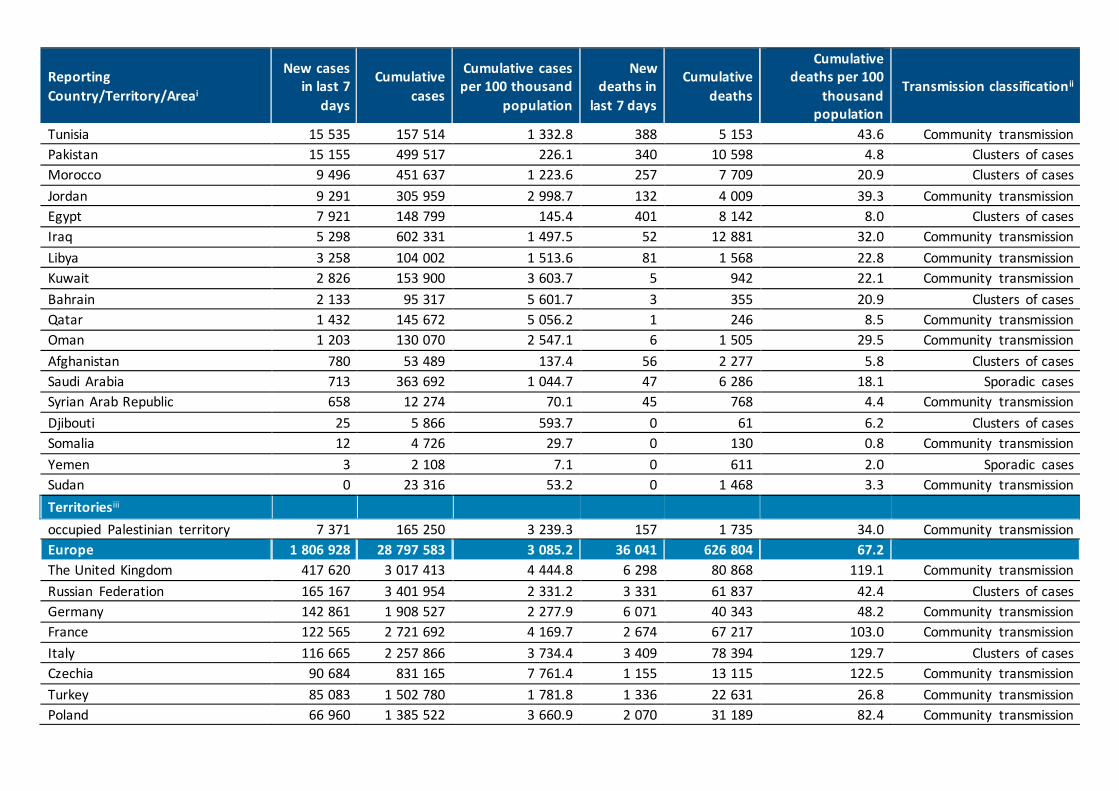
Eastern Mediterranean 171 280 5 149 132 704.6 2 775 124 836 17.1
Iran (Islamic Republic of) 42 964 1 280 438 1 524.5 662 56 100 66.8 Community transmission
Lebanon 29 145 215 553 3 158.1 114 1 590 23.3 Community transmission
United Arab Emirates 16 061 227 702 2 302.3 28 702 7.1 Community transmission
Reporting
Country/Territory/Areai
New cases in last 7
days
Cumulative
cases
Cumulative cases per 100 thousand
population
New deaths in
last 7 days
Cumulative
deaths
Cumulative deaths per 100
thousand population
Transmission classification ii
Tunisia 15 535 157 514 1 332.8 388 5 153 43.6 Community transmission
Pakistan 15 155 499 517 226.1 340 10 598 4.8 Clusters of cases
Morocco 9 496 451 637 1 223.6 257 7 709 20.9 Clusters of cases
Jordan 9 291 305 959 2 998.7 132 4 009 39.3 Community transmission
Egypt 7 921 148 799 145.4 401 8 142 8.0 Clusters of cases
Iraq 5 298 602 331 1 497.5 52 12 881 32.0 Community transmission
Libya 3 258 104 002 1 513.6 81 1 568 22.8 Community transmission
Kuwait 2 826 153 900 3 603.7 5 942 22.1 Community transmission
Bahrain 2 133 95 317 5 601.7 3 355 20.9 Clusters of cases
Qatar 1 432 145 672 5 056.2 1 246 8.5 Community transmission
Oman 1 203 130 070 2 547.1 6 1 505 29.5 Community transmission
Afghanistan 780 53 489 137.4 56 2 277 5.8 Clusters of cases
Saudi Arabia 713 363 692 1 044.7 47 6 286 18.1 Sporadic cases
Syrian Arab Republic 658 12 274 70.1 45 768 4.4 Community transmission
Djibouti 25 5 866 593.7 0 61 6.2 Clusters of cases
Somalia 12 4 726 29.7 0 130 0.8 Community transmission
Yemen 3 2 108 7.1 0 611 2.0 Sporadic cases
Sudan 0 23 316 53.2 0 1 468 3.3 Community transmission
Territoriesiii
occupied Palestinian territory 7 371 165 250 3 239.3 157 1 735 34.0 Community transmission
Europe 1 806 928 28 797 583 3 085.2 36 041 626 804 67.2
The United Kingdom 417 620 3 017 413 4 444.8 6 298 80 868 119.1 Community transmission
Russian Federation 165 167 3 401 954 2 331.2 3 331 61 837 42.4 Clusters of cases
Germany 142 861 1 908 527 2 277.9 6 071 40 343 48.2 Community transmission
France 122 565 2 721 692 4 169.7 2 674 67 217 103.0 Community transmission
Italy 116 665 2 257 866 3 734.4 3 409 78 394 129.7 Clusters of cases
Czechia 90 684 831 165 7 761.4 1 155 13 115 122.5 Community transmission
Turkey 85 083 1 502 780 1 781.8 1 336 22 631 26.8 Community transmission
Poland 66 960 1 385 522 3 660.9 2 070 31 189 82.4 Community transmission
Reporting Country/Territory/Areai
New cases in last 7
days
Cumulative cases
Cumulative cases per 100 thousand
population
New deaths in
last 7 days
Cumulative deaths
Cumulative
deaths per 100 thousand
population
Transmission classification ii
Spain 59 343 2 025 560 4 332.3 354 51 690 110.6 Community transmission
Netherlands 52 774 866 190 5 055.1 751 12 307 71.8 Community transmission
Portugal 52 317 476 187 4 670.0 656 7 701 75.5 Clusters of cases
Israel 49 605 481 306 5 560.7 250 3 631 42.0 Community transmission
Ireland 43 801 140 727 2 850.0 84 2 336 47.3 Community transmission
Ukraine 40 933 1 115 026 2 549.6 913 19 767 45.2 Community transmission
Sweden 32 004 489 471 4 846.6 69 9 433 93.4 Community transmission
Romania 30 807 668 202 3 473.4 673 16 592 86.2 Community transmission
Slovakia 20 746 208 209 3 813.6 601 2 918 53.4 Clusters of cases
Switzerland 20 737 475 604 5 495.4 402 7 545 87.2 Community transmission
Serbia 15 990 357 894 5 139.4 260 3 548 50.9 Community transmission
Austria 15 147 378 110 4 198.2 400 6 614 73.4 Community transmission
Hungary 14 242 342 237 3 542.7 764 10 648 110.2 Community transmission
Slovenia 14 195 139 281 6 699.6 258 3 147 151.4 Clusters of cases
Belgium 13 590 664 261 5 731.5 337 20 069 173.2 Community transmission
Lithuania 13 046 159 671 5 865.3 262 2 200 80.8 Community transmission
Denmark 12 699 180 240 3 111.8 197 1 542 26.6 Community transmission
Belarus 12 243 210 368 2 226.3 65 1 507 15.9 Community transmission
Georgia 10 060 239 229 5 997.0 170 2 773 69.5 Community transmission
Croatia 7 035 219 993 5 358.8 296 4 368 106.4 Community transmission
Latvia 7 023 48 952 2 595.3 150 818 43.4 Community transmission
Kazakhstan 5 806 209 369 1 115.0 40 2 885 15.4 Clusters of cases
Bulgaria 5 526 208 406 2 999.3 453 8 097 116.5 Clusters of cases
Norway 5 514 53 792 992.2 35 471 8.7 Community transmission
Azerbaijan 4 588 224 050 2 209.7 187 2 890 28.5 Clusters of cases
Greece 4 584 144 293 1 384.4 306 5 227 50.1 Community transmission
Estonia 4 385 33 516 2 526.6 39 283 21.3 Clusters of cases
Albania 4 042 63 033 2 190.3 43 1 233 42.8 Clusters of cases

Reporting
Country/Territory/Areai
New cases in last 7
days
Cumulative
cases
Cumulative cases per 100 thousand
population
New deaths in
last 7 days
Cumulative
deaths
Cumulative deaths per 100
thousand population
Transmission classification ii
Cyprus 3 566 27 011 2 237.2 18 147 12.2 Clusters of cases
Republic of Moldova 3 399 149 093 3 695.9 110 3 130 77.6 Community transmission
Bosnia and Herzegovina 3 034 115 379 3 516.8 205 4 305 131.2 Community transmission
Montenegro 2 989 52 468 8 353.9 36 725 115.4 Clusters of cases
North Macedonia 2 361 86 150 4 135.1 92 2 614 125.5 Community transmission
Armenia 2 104 162 131 5 471.4 79 2 929 98.8 Community transmission
Finland 1 464 38 068 687.1 25 586 10.6 Community transmission
Malta 1 399 14 396 3 260.4 13 233 52.8 Clusters of cases
Luxembourg 1 038 47 876 7 648.2 27 530 84.7 Community transmission
Kyrgyzstan 968 82 273 1 261.0 10 1 369 21.0 Clusters of cases
Andorra 420 8 586 11 112.4 1 85 110.0 Community transmission
Uzbekistan 334 77 572 231.8 3 617 1.8 Clusters of cases
San Marino 187 2 650 7 808.4 3 64 188.6 Community transmission
Liechtenstein 158 2 379 6 238.0 5 38 99.6 Sporadic cases
Monaco 152 1 053 2 683.2 1 5 12.7 Sporadic cases
Iceland 126 5 880 1 723.1 0 29 8.5 Community transmission
Tajikistan 31 13 705 143.7 0 91 1.0 Pending
Holy See 0 26 3 213.8 0 0 0.0 Sporadic cases
Territoriesiii
Kosovo 1 792 53 480 2 874.7 35 1 365 73.4 Community transmission
Gibraltar 809 3 021 8 966.8 5 12 35.6 Clusters of cases
Jersey 161 2 921 2 684.7 13 57 52.4 Community transmission
Faroe Islands 32 646 1 322.0 1 1 2.0 Sporadic cases
Isle of Man 12 392 461.0 0 25 29.4 No cases
Guernsey 3 302 477.9 0 13 20.6 Community transmission
Greenland 2 29 51.1 0 0 0.0 No cases
South-East Asia 206 670 12 257 684 606.4 3 293 187 786 9.3
India 126 319 10 450 284 757.3 1 564 150 999 10.9 Clusters of cases
Indonesia 59 913 818 386 299.2 1 392 23 947 8.8 Community transmission

Reporting Country/Territory/Areai
New cases in last 7
days
Cumulative cases
Cumulative cases per 100 thousand
population
New deaths in
last 7 days
Cumulative deaths
Cumulative
deaths per 100 thousand
population
Transmission classification ii
Bangladesh 6 198 521 382 316.6 157 7 756 4.7 Community transmission
Myanmar 4 433 130 049 239.0 115 2 826 5.2 Clusters of cases
Sri Lanka 3 469 47 840 223.4 18 229 1.1 Clusters of cases
Nepal 3 083 264 521 907.9 42 1 912 6.6 Clusters of cases
Thailand 2 919 10 298 14.8 3 67 0.1 Clusters of cases
Maldives 231 14 065 2 602.0 1 49 9.1 Clusters of cases
Bhutan 100 810 105.0 1 1 0.1 Clusters of cases
Timor-Leste 5 49 3.7 0 0 0.0 Sporadic cases
Western Pacific 71 939 1 184 662 60.3 831 21 119 1.1
Japan 39 821 280 775 222.0 448 3 996 3.2 Clusters of cases
Malaysia 16 186 133 559 412.7 59 542 1.7 Clusters of cases
Philippines 8 881 485 797 443.3 145 9 398 8.6 Community transmission
Republic of Korea 5 420 68 663 133.9 163 1 125 2.2 Clusters of cases
China 624 97 518 6.6 7 4 798 0.3 Clusters of cases
Singapore 203 58 865 1 006.2 0 29 0.5 Sporadic cases
Mongolia 166 1 408 42.9 0 0 0.0 Clusters of cases
Australia 120 28 582 112.1 0 909 3.6 Clusters of cases
New Zealand 37 1 862 38.6 0 25 0.5 Clusters of cases
Papua New Guinea 31 811 9.1 0 9 0.1 Community transmission
Viet Nam 31 1 513 1.6 0 35 0.0 Clusters of cases
Brunei Darussalam 16 173 39.5 0 3 0.7 Sporadic cases
Cambodia 10 391 2.3 0 0 0.0 Sporadic cases
Fiji 4 53 5.9 0 2 0.2 Sporadic cases
Lao People's Democratic Republic 0 41 0.6 0 0 0.0 Sporadic cases
Solomon Islands 0 17 2.5 0 0 0.0 No cases
Territoriesiii
French Polynesia 315 17 241 6 137.6 8 122 43.4 Sporadic cases
Guam 70 7 218 4 276.7 1 124 73.5 Clusters of cases

Reporting
Country/Territory/Areai
New cases in last 7
days
Cumulative
cases
Cumulative cases per 100 thousand
population
New deaths in
last 7 days
Cumulative
deaths
Cumulative deaths per 100
thousand population
Transmission classification ii
Northern Mariana Islands
(Commonwealth of the) 3 125 217.2 0 2 3.5 Pending
Micronesia (Federated States of) 1 1 0.9 0 0 0.0 No cases
Marshall Islands 0 4 6.8 0 0 0.0 No cases
New Caledonia 0 40 14.0 0 0 0.0 Sporadic cases
Vanuatu 0 1 0.3 0 0 0.0 No cases
Wallis and Futuna 0 4 35.6 0 0 0.0 Sporadic cases
Global 4 953 758 88 387 352 1 133.9 85 436 1 919 204 24.6
**See data, table and figure notes
Key Weekly Updates
• WHO Director-General Dr Tedros Adhanom Ghebreyesus at the Member States briefing on COVID-19 - 7 January
2021
“Vaccines are giving us real hope of bringing the pandemic under control in the next 12 months.”
• COVAX, WHO’s vaccines pillar of the Access to COVID-19 Tools (ACT) Accelerator
COVAX – set up by GAVI, CEPI and WHO in April last year – has secured contracts of 2 billion doses of safe and
effective COVID-19 vaccines
• Pfizer-BioNTech COVID-19 vaccine
WHO issues its first emergency use validation for a COVID-19 vaccine and emphasizes need for equitable global access
Who can take the Pfizer-BioNTech COVID-19 vaccine?
Interim recommendations for use of the Pfizer–BioNTech COVID-19 vaccine, BNT162b2, under Emergency Use Listing
• Genomic sequencing
Genomic sequencing of SARS-CoV-2: a guide to implementation for maximum impact on public health
SARS-CoV-2 genomic sequencing for public health goals: Interim guidance, 8 January 2021
• Infection prevention and control for long-term care facilities
Infection prevention and control guidance for long-term care facilities in the context of COVID-19 update
Technical guidance and other resources – Technical guidance
– WHO Coronavirus Disease (COVID-19) Dashboard
– Weekly COVID-19 Operational Updates
– WHO COVID-19 case definitions
– COVID-19 Supply Chain Inter-Agency Coordination Cell Weekly Situational Update
– Research and Development
– Online courses on COVID-19 in official UN languages and in additional national languages
– The Strategic Preparedness and Response Plan (SPRP) outlining the support the international community can
provide to all countries to prepare and respond to the virus
– Updates from WHO regions
– African Region – Region of the Americas
– Eastern Mediterranean Region – South-East Asia Region
– European Region – Western Pacific Region
Recommendations and advice for the public
– Protect yourself
– Questions and answers
– Travel advice
– EPI-WIN: tailored information for individuals, organizations and communities
Data, table and figure notes
Data presented are based on official laboratory-confirmed COVID-19 case and deaths reported to WHO by
country/territories/areas, largely based upon WHO case definitions and surveillance guidance. While steps are
taken to ensure accuracy and reliability, all data are subject to continuous verification and change, and caution
must be taken when interpreting these data as several factors influence the counts presented, with variable
underestimation of true case and death incidence, and variable delays to reflecting these data at global level. Case
detection, inclusion criteria, testing strategies, reporting practices, and data cut-off and lag times differ between
countries/territories/areas. A small number of countries/territories/areas report combined probable and
laboratory-confirmed cases. Differences are to be expected between information products published by WHO,
national public health authorities, and other sources. Due to public health authorities conducting data
reconciliation exercises which remove large numbers of cases or deaths from their total counts, negative numbers
may be displayed in the new cases/deaths columns as appropriate. When additional details become available that
allow the subtractions to be suitably apportioned to previous days, graphics will be updated accordingly. See the
log of major changes and errata for details. Prior situation reports will not be edited; see covid19.who.int for the
most up-to-date data.
Global totals include 745 cases and 13 deaths reported from international conveyances.
The designations employed, and the presentation of these materials do not imply the expression of any
opinion whatsoever on the part of WHO concerning the legal status of any country, territory or area or of its
authorities, or concerning the delimitation of its frontiers or boundaries. Dotted and dashed lines on maps

represent approximate border lines for which there may not yet be full agreement. Countries, territories and
areas are arranged under the administering WHO region. The mention of specific companies or of certain
manufacturers’ products does not imply that they are endorsed or recommended by WHO in preference to
others of a similar nature that are not mentioned. Errors and omissions excepted, the names of proprietary
products are distinguished by initial capital letters.
[1] All references to Kosovo should be understood to be in the context of the United Nations Security Council
resolution 1244 (1999). In the map, number of cases of Serbia and Kosovo (UNSCR 1244, 1999) have been
aggregated for visualization purposes.
i Excludes countries, territories, and areas that have never reported a confirmed COVID-19 case.
ii Transmission classification is based on a process of country/territory/area self-reporting. Classifications are
reviewed on a weekly basis and may be revised as new information becomes available. Differing degrees of
transmission may be present within countries/territories/areas. For further information, please see:
Considerations for implementing and adjusting public health and social measures in the context of COVID-19:
• No (active) cases: No new cases detected for at least 28 days (two times the maximum incubation period), in
the presence of a robust surveillance system. This implies a near-zero risk of infection for the general
population.
• Imported / Sporadic cases: Cases detected in the past 14 days are all imported, sporadic (e.g. laboratory
acquired or zoonotic) or are all linked to imported/sporadic cases, and there are no clear signals of further
locally acquired transmission. This implies minimal risk of infection for the general population.
• Clusters of cases: Cases detected in the past 14 days are predominantly limited to well-defined clusters that
are not directly linked to imported cases, but which are all linked by time, geographic location and common
exposures. It is assumed that there are a number of unidentified cases in the area. This implies a low risk of
infection to others in the wider community if exposure to these clusters is avoided.
• Community transmission: Which encompasses a range of levels from low to very high incidence, as described
below and informed by a series of indicators described in the aforementioned guidance. As these
subcategorization are not currently collated at the global level, but rather intended for use by national and
sub-national public health authorities for local decision-making, community transmission has not been
disaggregated in this information product.
o CT1: Low incidence of locally acquired, widely dispersed cases detected in the past 14 days, with many of
the cases not linked to specific clusters; transmission may be focused in certain population sub-groups.
Low risk of infection for the general population.
o CT2: Moderate incidence of locally acquired, widely dispersed cases detected in the past 14 days;
transmission less focused in certain population sub-groups. Moderate risk of infection for the general
population.
o CT3: High incidence of locally acquired, widely dispersed cases in the past 14 days; transmission
widespread and not focused in population sub-groups. High risk of infection for the general population.
o CT4: Very high incidence of locally acquired, widely dispersed cases in the past 14 days. Very high risk of
infection for the general population.
• Pending: transmission classification has not been reported to WHO. iii “Territories” include territories, areas, overseas dependencies and other jurisdictions of similar status.
Related Documents


