COUNTY GOVERNMENTS ANNUAL BUDGET IMPLEMENTATION REVIEW REPORT FY 2018/19 AUGUST, 2019

Welcome message from author
This document is posted to help you gain knowledge. Please leave a comment to let me know what you think about it! Share it to your friends and learn new things together.
Transcript
COUNTY GOVERNMENTS BUDGET IMPLEMENTATION REVIEW REPORT, HALF YEAR, FY 2016/17
COUNTY GOVERNMENTSANNUAL BUDGET IMPLEMENTATION REVIEW
REPORT
FY 2018/19
AUGUST, 2019
COUNTY GOVERNMENTSANNUAL BUDGET IMPLEMENTATION REVIEW REPORT
FY 2018/19
AUGUST, 2019

ii
COUNTY GOVERNMENTS ANNUAL BUDGET IMPLEMENTATION REVIEW REPORT FOR FY 2018/19
PREFACE
I am pleased to present the Annual County Governments Budget Implementation Review Report (CBIRR) for the Financial Year (FY) 2018/19. The report has been prepared in conformity with Article 228 (6) of the Constitution and Section 9 of the Controller of Budget Act, 2016, which requires the Controller of Budget (COB) to submit to Parliament a report on the implementation of the budgets of the national and County Governments every four months.
This report presents budget performance of the forty seven County Governments for the period of July, 2018 to June, 2019. It is based on analysis of reports on financial and non-financial performance submitted to the Office of the Controller of Budget (OCOB) by County Treasuries, financial reports generated from the Integrated Financial Management Information System (IFMIS) and financial information maintained by the OCOB. In addition to performance, the report highlights the key challenges encountered by the Counties in budget implementation and also contains suggested measures to address the challenges.
Preparation of this report was made possible through concerted efforts of staff from County Treasuries and the Office of the Controller of Budget to whom I am grateful.
The information contained in this report is useful to many stakeholders including; policy makers, legislators, analysts, practitioners, and the general public. While successful budget implementation depends on a number of factors, public participation and effective monitoring of its implementation remain critical principles. It is my hope that this report will generate interest and participation by the public and other stakeholders in monitoring budget implementation by the Counties.
I urge all readers to constructively engage County Governments in order to improve prudence in utilization of public funds.
CPA Stephen Masha Ag. CONTROLLER OF BUDGET

iii
COUNTY GOVERNMENTS ANNUAL BUDGET IMPLEMENTATION REVIEW REPORT FOR FY 2018/19
TABLE OF CONTENTS
PREFACE ................................................................................................................................................ II
ACRONYMS ........................................................................................................................................ XV
EXECUTIVE SUMMARY .............................................................................................................XVII
KEY HIGHLIGHTS ..........................................................................................................................XIX
1 INTRODUCTION ...........................................................................................................................1
2 FINANCIAL ANALYSIS OF COUNTY GOVERNMENTS PERFORMANCE IN FY 2018/19 .................................................................................................22.1 Introduction .......................................................................................................................................................... 2
2.2 Funds Released to the Counties .......................................................................................................................... 5
2.3 Expenditure Analysis........................................................................................................................................... 7
2.4 Pending Bills as of 30th June, 2019 .................................................................................................................. 14
3 BUDGET PERFORMANCE BY COUNTY .............................................................................163.1 Baringo County .................................................................................................................................................. 16
3.2 Bomet County ..................................................................................................................................................... 22
3.3 Bungoma County ................................................................................................................................................ 28
3.4 Busia County ...................................................................................................................................................... 34
3.5 Elgeyo Marakwet County .................................................................................................................................. 40
3.6 Embu County ...................................................................................................................................................... 46
3.7 Garissa County ................................................................................................................................................... 52
3.8 Homa Bay County .............................................................................................................................................. 58
3.9 Isiolo County ....................................................................................................................................................... 64
3.10 Kajiado County .................................................................................................................................................. 71
3.11 Kakamega County ............................................................................................................................................. 77
3.12 Kericho County .................................................................................................................................................. 83
3.13 Kiambu County .................................................................................................................................................. 89
3.14 KilifiCounty ....................................................................................................................................................... 96
3.15 Kirinyaga County ............................................................................................................................................ 102
3.16 Kisii County ...................................................................................................................................................... 109
3.17 Kisumu County ................................................................................................................................................ 115
3.18 Kitui County ..................................................................................................................................................... 121
3.19 Kwale County ................................................................................................................................................... 127
3.20 Laikipia County ............................................................................................................................................... 133
3.21 Lamu County .................................................................................................................................................... 139
3.22 Machakos County ............................................................................................................................................. 145
3.23 Makueni County ............................................................................................................................................... 151
3.24 Mandera County .............................................................................................................................................. 158

iv
COUNTY GOVERNMENTS ANNUAL BUDGET IMPLEMENTATION REVIEW REPORT FOR FY 2018/19
3.25 Marsabit County .............................................................................................................................................. 164
3.26 Meru County..................................................................................................................................................... 170
3.27 Migori County .................................................................................................................................................. 176
3.28 Mombasa County ............................................................................................................................................. 182
3.29 Murang’a County ............................................................................................................................................. 188
3.30 Nairobi City County ........................................................................................................................................ 194
3.31 Nakuru County ................................................................................................................................................. 201
3.32 Nandi County .................................................................................................................................................... 207
3.33 Narok County ................................................................................................................................................... 214
3.34 Nyamira County ............................................................................................................................................... 221
3.35 Nyandarua County ........................................................................................................................................... 227
3.36 Nyeri County ..................................................................................................................................................... 234
3.37 Samburu County .............................................................................................................................................. 240
3.38 Siaya County ..................................................................................................................................................... 246
3.39 Taita Taveta County ......................................................................................................................................... 252
3.40 Tana River County ........................................................................................................................................... 259
3.41 Tharaka Nithi County ..................................................................................................................................... 266
3.42 Trans Nzoia County ......................................................................................................................................... 272
3.43 Turkana County ............................................................................................................................................... 279
3.44 Uasin Gishu County ......................................................................................................................................... 286
3.45 Vihiga County ................................................................................................................................................... 292
3.46 Wajir County .................................................................................................................................................... 299
3.47 West Pokot County ........................................................................................................................................... 305
4 KEY CHALLENGES AND RECOMMENDATIONS .........................................................3124.1 High Expenditure on Personnel Emoluments ............................................................................................... 312
4.2 Delays in Submission of Financial Reports to the Controller of Budget .................................................... 312
4.3 High Expenditure on Travel Costs ................................................................................................................. 312
4.4 Failure to Establish County Budget and Economic Forums(CBEF) ......................................................... 313
4.5 Failure to Establish Internal Audit Committees ......................................................................................... 313
5 CONCLUSION .............................................................................................................................314

v
COUNTY GOVERNMENTS ANNUAL BUDGET IMPLEMENTATION REVIEW REPORT FOR FY 2018/19
LIST OF TABLES
Table 2.1: Conditional Grants as per CARA, 2018 .........................................................................................................................................2
Table 2.2: Own Source Revenue Collection for FY 2018/19 .........................................................................................................................3
Table 2.3: The Exchequer Issues to the County Assembly and the County Executive for FY 2018/19 ...................................................6
Table 2.4: Expenditure by Economic Classification - FY 2018/19 ................................................................................................................7
Table 2.5: County Budget Allocation, Expenditure and Absorption Rate for FY 2018/19 .......................................................................9
Table 2.6: MCAs Budget Allocation, Expenditure and Absorption Rate in FY 2018/19 ........................................................................11
Table 2.7: Expenditure on Domestic and Foreign Travels by the County Assembly and the County
Executive in FY 2018/19 (Kshs.Million) ......................................................................................................................................13
Table 2.8: Pending Bills for the Counties as at June 30th, 2019 ....................................................................................................................14
Table 3.1: Baringo County, Conditional Grants/Loans Received in the FY 2018/19 ...............................................................................17
Table 3.2: Baringo County, List of Development Projects with the Highest Expenditure in FY 2018/19 .............................................19
Table 3.3: Baringo County, Budget Performance by Department .............................................................................................................21
Table 3.4: Bomet County, Conditional Grants/Loans Received in the FY 2018/19 ................................................................................ 23
Table 3.5: Bomet County, List of Development Projects with the Highest Expenditure in FY 2018/19 .............................................. 25
Table 3.6: Bomet County, Budget Performance by Department in FY 2018/19 ...................................................................................... 26
Table 3.7: Bungoma County, Conditional Grants/Loans Received in the FY 2018/19 ........................................................................... 29
Table 3.8: Bungoma County, List of Development Projects with the Highest Expenditure in FY 2018/19 ..........................................31
Table 3.9: Bungoma County, Budget Performance by Department in FY 2018/19 .................................................................................33
Table 3.10: Busia County, Conditional Grants/Loans Received in the FY 2018/19 ...................................................................................35
Table 3.11: Busia County, Budget Performance by Department in FY 2018/19 ........................................................................................ 38
Table 3.12: Elgeyo Marakwet County, Conditional Grants/Loans Received in the FY 2018/19 ..............................................................41
Table 3.13: Elgeyo Marakwet County, List of Development Projects with the Highest Expenditure in FY 2018/19 ............................43
Table 3.14: Elgeyo Marakwet County, Budget Performance by Department in FY 2018/19 ...................................................................45
Table 3.15: Embu County, Conditional Grants/Loans Received in the FY 2018/19 ..................................................................................47
Table 3.16: Embu County, List of Development Projects with the Highest Expenditure in FY 2018/19 ................................................ 49
Table 3.17: Embu County, Budget Performance by Department in FY 2018/19 ........................................................................................51
Table 3.18: Garissa County, Conditional Grants/Loans Received in the FY 2018/19 ............................................................................... 54
Table 3.19: Garissa County, Budget Performance by Department in FY 2018/19 .....................................................................................57
Table 3.20: Homa Bay County, Conditional Grants/Loans Received in the FY 2018/19 ......................................................................... 59
Table 3.21: Homa Bay County, List of Development Projects with the Highest Expenditure in FY 2018/19 ........................................61
Table 3.22: Homa Bay County, Budget Performance by Department in FY 2018/19 ............................................................................... 63
Table 3.23: Isiolo County, Conditional Grants/Loans Received in the FY 2018/19................................................................................... 66
Table 3.24: Isiolo County, List of Development Projects with the Highest Expenditure in FY 2018/19 ................................................. 67
Table 3.25: Isiolo County, Budget Performance by Department in FY 2018/19 ........................................................................................ 69
Table 3.26: Kajiado County, Conditional Grants/Loans Received in the FY 2018/19 .............................................................................. 72
Table 3.27: Kajiado County, List of Development Projects with the Highest Expenditure in FY 2018/19 .............................................74
Table 3.28: Kajiado County, Budget Performance by Department in FY 2018/19 .....................................................................................76

vi
COUNTY GOVERNMENTS ANNUAL BUDGET IMPLEMENTATION REVIEW REPORT FOR FY 2018/19
Table 3.29: Kakamega County, Conditional Grants/Loans Received in the FY 2018/19 ......................................................................... 78
Table 3.30: Kakamega County, List of Development Projects with the Highest Expenditure in FY 2018/19 ....................................... 80
Table 3.31: Kakamega County, Budget Performance by Department in FY 2018/19 .............................................................................. 82
Table 3.32: Kericho County, Conditional Grants/Loans Received in the FY 2018/19 .............................................................................. 85
Table 3.33: Kericho County, List of Development Projects with the Highest Expenditure in FY 2018/19 ............................................ 86
Table 3.34: Kericho County, Budget Performance by Department in FY 2018/19 ................................................................................... 88
Table 3.35: Kiambu County, Conditional Grants/Loans Received in the FY 2018/19 ...............................................................................91
Table 3.36: Kiambu County, List of Development Projects with the Highest Expenditure in FY 2018/19 ............................................ 93
Table 3.37: Kiambu County, Budget Performance by Department in FY 2018/19 ................................................................................... 94
Table 3.38: Kilifi County, Conditional Grants/Loans Received in the FY 2018/19 ................................................................................... 97
Table 3.39: Kilifi County, List of Development Projects with the Highest Expenditure in FY 2018/19 ................................................. 99
Table 3.40: Kilifi County, Budget Performance by Department in FY 2018/19 .......................................................................................101
Table 3.41: Kirinyaga County, Conditional Grants/Loans Received in the FY 2018/19 ........................................................................ 104
Table 3.42: Kirinyaga County, List of Development Projects with the Highest Expenditure in FY 2018/19 ...................................... 106
Table 3.43: Kirinyaga County, Budget Performance by Department in FY 2018/19 .............................................................................. 108
Table 3.44: Kisii County, Conditional Grants/Loans Received in the FY 2018/19 ...................................................................................110
Table 3.45: Kisii County, List of Development Projects with the Highest Expenditure in FY 2018/19 .................................................112
Table 3.46: Kisii County, Budget Performance by Department in FY 2018/19 ........................................................................................114
Table 3.47: Kisumu County, Conditional Grants/Loans Received in the FY 2018/19 .............................................................................116
Table 3.48: Kisumu County, List of Development Projects with the Highest Expenditure in FY 2018/19 ...........................................118
Table 3.49: Kisumu County, Budget Performance by Department in FY 2018/19 ..................................................................................119
Table 3.50: Kitui County, Conditional Grants/Loans Received in the FY 2018/19 ................................................................................. 122
Table 3.51: Kitui County, List of Development Projects with the Highest Expenditure in FY 2018/19 ............................................... 124
Table 3.52: Kitui County, Budget Performance by Department in FY 2018/19 ...................................................................................... 126
Table 3.53: Kwale County, Conditional Grants/Loans Received in the FY 2018/19 ............................................................................... 128
Table 3.54: Kwale County, List of Development Projects with the Highest Expenditure in FY 2018/19 ............................................. 130
Table 3.55: Kwale County, Budget Performance by Department in FY 2018/19 ................................................................................... 132
Table 3.56: Laikipia County, Conditional Grants/Loans Received in the FY 2018/19 ........................................................................... 134
Table 3.57: Laikipia County, List of Development Projects with the Highest Expenditure in FY 2018/19 .......................................... 136
Table 3.58: Laikipia County, Budget Performance by Department in FY 2018/19 ................................................................................. 138
Table 3.59: Lamu County, Conditional Grants/Loans Received in the FY 2018/19 ................................................................................ 140
Table 3.60: Lamu County, List of Development Projects with the Highest Expenditure in FY 2018/19 ...............................................142
Table 3.61: Lamu County, Budget Performance by Department in FY 2018/19 ..................................................................................... 144
Table 3.62: Machakos County, Conditional Grants/Loans Received in the FY 2018/19 ........................................................................ 146
Table 3.63: Machakos County, List of Development Projects with the Highest Expenditure in the FY 2018/19 ................................ 148
Table 3.64: Machakos County, Budget Performance by Department in FY 2018/19 ............................................................................. 150
Table 3.65: Makueni County, Conditional Grants/Loans Received in the FY 2018/19 ...........................................................................153
Table 3.66: Makueni County, List of Development Projects with the Highest Expenditure in FY 2018/19 .........................................155
Table 3.67: Makueni County, Budget Performance by Department in FY 2018/19................................................................................ 156

vii
COUNTY GOVERNMENTS ANNUAL BUDGET IMPLEMENTATION REVIEW REPORT FOR FY 2018/19
Table 3.68: Mandera County, Conditional Grants/Loans Received in the FY 2018/19 ...........................................................................159
Table 3.69: Mandera County, List of Development Projects with the Highest Expenditure in FY 2018/19 .........................................161
Table 3.70: Mandera County, Budget Performance by Department in FY 2018/19 .................................................................................163
Table 3.71: Marsabit County, Conditional Grants/Loans Received in the FY 2018/19............................................................................165
Table 3.72: Marasabit County, List of Development Projects with the Highest Expenditure in FY 2018/19 ........................................167
Table 3.73: Marsabit County, Budget Performance by Department in FY 2018/19 .................................................................................169
Table 3.74: Meru County, Conditional Grants/Loans Received in the FY 2018/19 .................................................................................171
Table 3.75: Meru County, List of Development Projects with the Highest Expenditure in FY 2018/19 ...............................................173
Table 3.76: Meru County, Budget Performance by Department in FY 2018/19 .......................................................................................175
Table 3.77: Migori County, Conditional Grants/Loans Received in the FY 2018/19 ...............................................................................177
Table 3.78: Migori County, List of Development Projects with the Highest Expenditure in FY 2018/19 .............................................179
Table 3.79: Migori County, Budget Performance by Department in FY 2018/19 ....................................................................................181
Table 3.80: Mombasa County, Conditional Grants/Loans Received in the FY 2018/19 ..........................................................................183
Table 3.81: Mombasa County, List of Development Projects with the Highest Expenditure in FY 2018/19 ........................................185
Table 3.82: Mombasa County, Budget Performance by Department in FY 2018/19 ...............................................................................187
Table 3.83: Murang’a County, Conditional Grants/Loans Received in the FY 2018/19 ..........................................................................189
Table 3.84: Murang’a County, List of Development Projects with the Highest Expenditure in FY 2018/19 ........................................191
Table 3.85: Murang’a County, Budget Performance by Department in FY 2018/19 ............................................................................... 193
Table 3.86: Nairobi City County, Conditional Grants/Loans Received in the FY 2018/19 .................................................................... 196
Table 3.87: Nairobi City County, List of Development Projects with the Highest Expenditure in FY 2018/19 .................................. 198
Table 3.88: Nairobi City County, Budget Performance by Department in FY2018/19 ...........................................................................200
Table 3.89: Nakuru County, Conditional Grants/Loans Received in the FY 2018/19 ............................................................................202
Table 3.90: Nakuru County, List of Development Projects with the Highest Expenditure in FY 2018/19 ...........................................204
Table 3.91: Nakuru County, Budget Performance by Department in FY 2018/19 ..................................................................................206
Table 3.92: Nandi County, Conditional Grants/Loans Received in the FY 2018/19 ...............................................................................209
Table 3.93: Nandi County County, List of Development Projects with the Highest Expenditure in FY 2018/19 ................................211
Table 3.94: Nandi County, Budget Performance by Department in the FY 2018/2019 ...........................................................................213
Table 3.95: Narok County, Conditional Grants/Loans Received in the FY 2018/19 ................................................................................216
Table 3.96: Narok County, List of Development Projects with the Highest Expenditure in FY 2018/19 ..............................................218
Table 3.97: Narok County, Budget Performance by Department in the FY 2018/19 ...............................................................................219
Table 3.98: Nyamira County, Conditional Grants/Loans Received in the FY 2018/19 ..........................................................................222
Table 3.99: Nyamira County, List of Development Projects with the Highest Expenditure in FY 2018/19 .........................................224
Table 3.100: Nyamira County, Budget Performance by Department in FY 2018/2019 ............................................................................226
Table 3.101: Nyandarua County, Conditional Grants/Loans Received in the FY 2018/19 ......................................................................229
Table 3.102: Nyandarua County, List of Development Projects with the Highest Expenditure in FY 2018/19......................................231
Table 3.103: Nyandarua County, Budget Performance by Department in the FY 2018/19...................................................................... 233
Table 3.104: Nyeri County, Conditional Grants/Loans Received in the FY 2018/19 ................................................................................ 235
Table 3.105: Nyeri County, List of Development Projects with the Highest Expenditure in FY 2018/19 .............................................. 237
viii
COUNTY GOVERNMENTS ANNUAL BUDGET IMPLEMENTATION REVIEW REPORT FOR FY 2018/19
Table 3.106: Nyeri County, Budget Performance by Department in FY 2018/19 ...................................................................................... 239
Table 3.107: Samburu County, Conditional Grants/Loans Received in the FY 2018/19 .......................................................................... 241
Table 3.108: Samburu County, List of Development Projects with the Highest Expenditure in FY 2018/19 ........................................ 243
Table3.109: Samburu County, Budget Performance by Department in the FY 2018/2019 ..................................................................... 245
Table 3.110: Siaya County, Conditional Grants/Loans Received in the FY 2018/19 ................................................................................. 247
Table 3.111: Siaya County, List of Development Projects with the Highest Expenditure in FY 2018/19 ...............................................249
Table 3.112: Siaya County, Budget Performance by Department in the FY 2018/19 ................................................................................ 251
Table 3.113: Taita Taveta County, Conditional Grants/Loans Received in the FY 2018/19 .....................................................................254
Table 3.114: Taita Taveta County, List of Development Projects with the Highest Expenditure in FY 2018/19 ................................... 256
Table 3.115: Taita Taveta County, Budget Performance by Department in the FY 2018/19 .................................................................... 258
Table 3.116: Tana River County, Conditional Grants/Loans Received in the FY 2018/19 ....................................................................... 261
Table 3.117: Tana River County, List of Development Projects with the Highest Expenditure in FY 2018/19 ..................................... 263
Table 3.118: Tana River County, Budget Performance by Department in FY 2018/2019 ........................................................................ 265
Table 3.119: Tharaka Nithi County, Conditional Grants/Loans Received in the FY 2018/19 ................................................................. 267
Table 3.120: Tharaka Nithi County, List of Development Projects with the Highest Expenditure in FY 2018/19................................269
Table 3.121: Tharaka Nithi County, Budget Performance by Department for the FY 2018/19 ............................................................... 271
Table 3.122: Trans Nzoia County, Conditional Grants/Loans Received in the FY 2018/19 ..................................................................... 274
Table 3.123: Trans Nzoia County, List of Development Projects with the Highest Expenditure in FY 2018/19 ................................... 276
Table 3.124: Trans Nzoia County, Budget Performance by Department in FY 2018/19 .......................................................................... 278
Table 3.125: Turkana County, Conditional Grants/Loans Received in the FY 2018/19 ............................................................................280
Table 3.126: Turkana County County, List of Development Projects with the Highest Expenditure in FY 2018/19 ............................284
Table 3.127: Turkana County, Budget Performance by Department in FY 2018/19 .................................................................................284
Table 3.128: Uasin Gishu County, Conditional Grants/Loans Received in the FY 2018/19 ....................................................................287
Table 3.129: Uasin Gishu County, List of Development Projects with the Highest Expenditure in FY 2018/19...................................289
Table 3.130: Uasin Gishu County, Budget Performance by Department in FY 2018/19 ...........................................................................291
Table 3.131: Vihiga County, Conditional Grants/Loans Received in the FY 2018/19 ..............................................................................294
Table 3.132: Vihiga County, List of Development Projects with the Highest Expenditure in FY 2018/19 ............................................296
Table 3.133: Vihiga County, Budget Performance by Department in FY 2018/19 .................................................................................... 298
Table 3.134: Wajir County, Conditional Grants/Loans Received in the FY 2018/19.................................................................................300
Table 3.135: Wajir County, Budget Performance by Department in FY 2018/19 ......................................................................................304
Table 3.136: West Pokot County, Conditional Grants/Loans Received in the FY 2018/19 ......................................................................306
Table 3.137: West Pokot County, List of Development Projects with the Highest Expenditure in FY 2018/19 ....................................308
Table 3.138: West Pokot County, Budget Performance by Department in FY 2018/19 .............................................................................310

ix
COUNTY GOVERNMENTS ANNUAL BUDGET IMPLEMENTATION REVIEW REPORT FOR FY 2018/19
LIST OF FIGURES
Figure 2.1: Expected Sources of Budget Financing in FY 2018/19 ................................................................................................................2
Figure 3.1: Baringo County, Expected Sources of Budget Financing in FY 2018/19 ................................................................................16
Figure 3.2: Baringo County, Own Source Revenue Collection for FY 2013/14 to FY 2018/19 ................................................................17
Figure 3.3: Baringo County, Expenditure by Economic Classification .......................................................................................................19
Figure 3.4: Baringo County, Operations and Maintenance Expenditure by Major Categories in FY 2018/19 ..................................... 20
Figure 3.5: Bomet County, Expected Sources of Budget Financing in FY 2018/19 ................................................................................. 22
Figure 3.6: Bomet County, Own Source Revenue Collection for FY 2013/14 to FY 2018/19 ................................................................. 23
Figure 3.7: Bomet County, Expenditure by Economic Classification......................................................................................................... 24
Figure 3.8: Bomet County, Operations and Maintenance Expenditure by Major Categories in FY 2018/19 ........................................ 26
Figure 3.9: Bungoma County, Expected Sources of Budget Financing in FY 2018/19 ............................................................................ 28
Figure 3.10: Bungoma County, Own Source Revenue Collection for FY 2013/14 to FY 2018/19 ............................................................ 29
Figure 3.11: Bungoma County, Expenditure by Economic Classification ....................................................................................................31
Figure 3.12: Bungoma County, Operations and Maintenance Expenditure by Major Categories in FY 2018/19 ...................................32
Figure 3.13: Busia County, Expected Sources of Budget Financing in FY 2018/19 ................................................................................... 34
Figure 3.14: Busia County, Own Source Revenue Collection for FY 2013/14 to FY 2018/19 ....................................................................35
Figure 3.15: Busia County, Expenditure by Economic Classification ...........................................................................................................37
Figure 3.16: Busia County, Operations and Maintenance Expenditure by Major Categories in FY 2018/19 ......................................... 38
Figure 3.17: Elgeyo Marakwet County, Expected Sources of Budget Financing in FY 2018/19 .............................................................. 40
Figure 3.18: Elgeyo Marakwet County, Own Source Revenue Collection for FY 2013/14 to FY 2018/19 ...............................................41
Figure 3.19: Elgeyo Marakwet County, Expenditure by Economic Classification ......................................................................................43
Figure 3.20: Elgeyo Marakwet County, Operations and Maintenance Expenditure by Major Categories in FY 2018/19 ....................44
Figure 3.21: Embu County, Expected Sources of Budget Financing in FY 2018/19 ................................................................................... 46
Figure 3.22: Embu County, Own Source Revenue Collection for FY 2013/14 to FY 2018/19 ...................................................................47
Figure 3.23: Embu County, Expenditure by Economic Classification .......................................................................................................... 49
Figure 3.24: Embu County, Operations and Maintenance Expenditure by Major Categories in FY 2018/19 ......................................... 50
Figure 3.25: Garissa County, Expected Sources of Budget Financing in FY 2018/19 .................................................................................53
Figure 3.26: Garissa County, Own Source Revenue Collection for FY 2013/14 to FY 2018/19 .................................................................53
Figure 3.27: Garissa County, Expenditure by Economic Classification ........................................................................................................55
Figure 3.28: Garissa County, Operations and Maintenance Expenditure by Major Categories in FY 2018/19 ...................................... 56
Figure 3.29: Homa Bay County, Expected Sources of Budget Financing in FY 2018/19 .......................................................................... 58
Figure 3.30: Homa Bay County, Own Source Revenue Collection for FY 2013/14 to FY 2018/19 .......................................................... 59
Figure 3.31: Homa Bay County, Expenditure by Economic Classification ..................................................................................................61
Figure 3.32: Homa Bay County, Operations and Maintenance Expenditure by Major Categories in FY 2018/19 ................................ 62
x
COUNTY GOVERNMENTS ANNUAL BUDGET IMPLEMENTATION REVIEW REPORT FOR FY 2018/19
Figure 3.33: Isiolo County, Expected Sources of Budget Financing in FY 2018/19 .................................................................................... 65
Figure 3.34: Isiolo County, Own Source Revenue Collection for FY 2013/14 to FY 2018/19 ................................................................... 65
Figure 3.35: Isiolo County, Expenditure by Economic Classification ........................................................................................................... 67
Figure 3.36: Isiolo County, Operations and Maintenance Expenditure by Major Categories in FY 2018/19 .......................................... 68
Figure 3.37: Kajiado County, Expected Sources of Budget Financing in FY 2018/19 ................................................................................71
Figure 3.38: Kajiado County, Own Source Revenue Collection for FY 2014/15 to FY 2018/19 ............................................................... 72
Figure 3.39: Kajiado County, Expenditure by Economic Classification....................................................................................................... 73
Figure 3.40: Kajiado County, Operations and Maintenance Expenditure by Major Categories in FY 2018/19 .......................................75
Figure 3.41: Kakamega County, Expected Sources of Budget Financing in FY 2018/19 .......................................................................... 77
Figure 3.42: Kakamega County, Own Source Revenue Collection for FY 2013/14 to FY 2018/19 .......................................................... 78
Figure 3.43: Kakamega County, Expenditure by Economic Classification ................................................................................................. 80
Figure 3.44: Kakamega County, Operations and Maintenance Expenditure by Major Categories in FY 2018/19 .................................81
Figure 3.45: Kericho County, Expected Sources of Budget Financing in FY 2018/19 ............................................................................... 83
Figure 3.46: Kericho County, Own Source Revenue Collection for FY 2013/14 to FY 2018/19 ............................................................... 84
Figure 3.47: Kericho County, Expenditure by Economic Classification ...................................................................................................... 86
Figure 3.48: Kericho County, Operations and Maintenance Expenditure by Major Categories in FY 2018/19 ..................................... 87
Figure 3.49: Kiambu County, Expected Sources of Budget Financing in FY 2018/19 ............................................................................... 90
Figure 3.50: Kiambu County, Own Source Revenue Collection for FY 2013/14 to FY 2018/19............................................................... 90
Figure 3.51: Kiambu County, Expenditure by Economic Classification ...................................................................................................... 92
Figure 3.52: Kiambu County, Operations and Maintenance Expenditure by Major Categories in FY 2018/19 ..................................... 94
Figure 3.53: Kilifi County, Expected Sources of Budget Financing in FY 2018/19 .................................................................................... 96
Figure 3.54: Kilifi County, Own Source Revenue Collection for FY 2013/14 to FY 2018/19 ................................................................... 97
Figure 3.55: Kilifi County, Expenditure by Economic Classification ........................................................................................................... 99
Figure 3.56: Kilifi County, Operations and Maintenance Expenditure by Major Categories in FY 2018/19 ........................................ 100
Figure 3.57: Kirinyaga County, Expected Sources of Budget Financing in FY 2018/19 ......................................................................... 103
Figure 3.58: Kirinyaga County, Own Source Revenue Collection for FY 2013/14 to FY 2018/19 ......................................................... 104
Figure 3.59: Kirinyaga County, Expenditure by Economic Classification ................................................................................................ 105
Figure 3.60: Kirinyaga County, Operations and Maintenance Expenditure by Major Categories in FY 2018/19................................ 107
Figure 3.61: Kisii County, Expected Sources of Budget Financing in FY 2018/19 ................................................................................... 109
Figure 3.62: Kisii County, Own Source Revenue Collection for FY 2013/14 to FY 2018/19 ...................................................................110
Figure 3.63: Kisii County, Expenditure by Economic Classification ...........................................................................................................112
Figure 3.64: Kisii County, Operations and Maintenance Expenditure by Major Categories in FY 2018/19 ..........................................113
Figure 3.65: Kisumu County, Expected Sources of Budget Financing in FY 2018/19 ..............................................................................115
Figure 3.66: Kisumu County, Own Source Revenue Collection for FY 2013/14 to FY 2018/19 ..............................................................116
Figure 3.67: Kisumu County, Expenditure by Economic Classification .....................................................................................................118

xi
COUNTY GOVERNMENTS ANNUAL BUDGET IMPLEMENTATION REVIEW REPORT FOR FY 2018/19
Figure 3.68: Kisumu County, Operations and Maintenance Expenditure by Major Categories in FY 2018/19 ....................................119
Figure 3.69: Kitui County, Expected Sources of Budget Financing in FY 2018/19 ...................................................................................121
Figure 3.70: Kitui County, Own Source Revenue Collection for FY 2013/14 to FY 2018/19 .................................................................. 122
Figure 3.71: Kitui County, Expenditure by Economic Classification ......................................................................................................... 124
Figure 3.72: Kitui County, Operations and Maintenance Expenditure by Major Categories in FY 2018/19 ........................................ 125
Figure 3.73: Kwale County, Expected Sources of Budget Financing in FY 2018/19 ................................................................................ 127
Figure 3.74: Kwale County, Own Source Revenue Collection for FY 2013/14 to FY 2018/19 ................................................................ 128
Figure 3.75: Kwale County, Expenditure by Economic Classification ....................................................................................................... 130
Figure 3.76: Kwale County, Operations and Maintenance Expenditure by Major Categories in FY 2018/19 .......................................131
Figure 3.77: Laikipia County, Expected Sources of Budget Financing in FY 2018/19 ..............................................................................133
Figure 3.78: Laikipia County, Own Source Revenue Collection for FY 2013/14 to FY 2018/19 ............................................................ 134
Figure 3.79: Laikipia County, Expenditure by Economic Classification .................................................................................................... 136
Figure 3.80: Laikipia County, Operations and Maintenance Expenditure by Major Categories in FY 2018/19 ................................... 137
Figure 3.81: Lamu County, Expected Sources of Budget Financing in FY 2018/19 ................................................................................. 139
Figure 3.82: Lamu County, Own Source Revenue Collection for FY 2013/14 to FY 2018/19 ................................................................ 140
Figure 3.83: Lamu County, Expenditure by Economic Classification .........................................................................................................142
Figure 3.84: Lamu County, Operations and Maintenance Expenditure by Major Categories in FY 2018/19 ........................................143
Figure 3.85: Machakos County, Expected Sources of Budget Financing in FY 2018/19 ..........................................................................145
Figure 3.86: Machakos County, Trend in Own Source Revenue Collection in FY 2018/19 .................................................................... 146
Figure 3.87: Machakos County, Expenditure by Economic Classification ................................................................................................ 148
Figure 3.88: Machakos County, Operations and Maintenance Expenditure by Major Categories in FY 2018/19 ................................149
Figure 3.89: Makueni County, Expected Sources of Budget Financing in FY 2018/19 ............................................................................152
Figure 3.90: Makueni County, Own Source Revenue Collection for FY 2013/14 to FY 2018/19 ............................................................152
Figure 3.91: Makueni County, Expenditure by Economic Classification .................................................................................................. 154
Figure 3.92: Makueni County, Operations and Maintenance Expenditure by Major Categories in FY 2018/19 ................................. 156
Figure 3.93: Mandera County, Expected Sources of Budget Financing in FY 2018/19 ........................................................................... 158
Figure 3.94: Mandera County, Own Source Revenue Collection for FY 2013/14 to FY 2018/19 ............................................................159
Figure 3.95: Mandera County, Expenditure by Economic Classification ...................................................................................................161
Figure 3.96: Mandera County, Operations and Maintenance Expenditure by Major Categories in FY 2018/19...................................162
Figure 3.97: Marsabit County, Expected Sources of Budget Financing in FY 2018/19 ............................................................................ 164
Figure 3.98: Marsabit County, Own Source Revenue Collection for FY 2013/14 to FY 2018/19 ............................................................165
Figure 3.99: Marsabit County, Expenditure by Economic Classification ....................................................................................................167
Figure 3.100: Marsabit County, Operations and Maintenance Expenditure by Major Categories in FY 2018/19 .................................. 168
Figure 3.101: Meru County, Expected Sources of Budget Financing in FY 2018/19 ..................................................................................170
Figure 3.102: Meru County, Own Source Revenue Collection for FY 2013/14 to FY 2018/19 ..................................................................171

xii
COUNTY GOVERNMENTS ANNUAL BUDGET IMPLEMENTATION REVIEW REPORT FOR FY 2018/19
Figure 3.103: Meru County, Expenditure by Economic Classification..........................................................................................................173
Figure 3.104: Meru County, Operations and Maintenance Expenditure by Major Categories in FY 2018/19 .........................................174
Figure 3.105: Migori County, Expected Sources of Budget Financing in FY 2018/19 ................................................................................176
Figure 3.106: Migori County, Own Source Revenue Collection for FY 2013/14 to FY 2018/19 ................................................................177
Figure 3.107: Migori County, Expenditure by Economic Classification .......................................................................................................179
Figure 3.108: Migori County, Operations and Maintenance Expenditure by Major Categories in FY 2018/19 ..................................... 180
Figure 3.109: Mombasa County, Expected Sources of Budget Financing in FY 2018/19 ...........................................................................182
Figure 3.110: Mombasa County, Own Source Revenue Collection for FY 2013/14 to FY 2018/19 ..........................................................183
Figure 3.111: Mombasa County, Expenditure by Economic Classification ..................................................................................................185
Figure 3.112: Mombasa County, Operations and Maintenance Expenditure by Major Categories in FY 2018/19 .................................186
Figure 3.113: Murang’a County, Expected Sources of Budget Financing in FY 2018/19 .......................................................................... 188
Figure 3.114: Murang’a County, Own Source Revenue Collection for FY 2013/14 to FY 2018/19 ...........................................................189
Figure 3.115: Murang’a County, Expenditure by Economic Classification ..................................................................................................191
Figure 3.116: Murang’a County, Operations and Maintenance Expenditure by Major Categories in FY 2018/19 ................................ 192
Figure 3.117: Nairobi City County, Expected Sources of Budget Financing in FY 2018/19 ..................................................................... 195
Figure 3.118: Nairobi City County, Own Source Revenue Collection for FY 2013/14 to FY 2018/19 ..................................................... 196
Figure 3.119: Nairobi City County, Expenditure by Economic Classification............................................................................................. 197
Figure 3.120: Nairobi City County, Operations and Maintenance Expenditure by Major Categories in FY 2018/19 ............................ 199
Figure 3.121: Nakuru County, Expected Sources of Budget Financing in FY 2018/19.............................................................................. 201
Figure 3.122: Nakuru County, Own Source Revenue Collection for FY 2013/14 to FY 2018/19 .............................................................202
Figure 3.123: Nakuru County, Expenditure by Economic Classification .....................................................................................................204
Figure 3.124: Nakuru County, Operations and Maintenance Expenditure by Major Categories in FY 2018/19 ....................................205
Figure 3.125: Nandi County, Expected Sources of Budget Financing in FY 2018/19 ................................................................................208
Figure 3.126: Nandi County, Own Source Revenue Collection for FY 2013/14 to FY 2018/19 ................................................................209
Figure 3.127: Nandi County, Expenditure by Economic Classification ........................................................................................................211
Figure 3.128: Nandi County, Operations and Maintenance Expenditure by Major Categories in FY 2018/19 ........................................212
Figure 3.129: Narok County, Expected Sources of Budget Financing in FY 2018/19 .................................................................................215
Figure 3.130: Narok County, Own Source Revenue Collection for FY 2013/14 to FY 2018/19 .................................................................216
Figure 3.131: Narok County, Expenditure by Economic Classification ........................................................................................................217
Figure 3.132: Narok County, Operations and Maintenance Expenditure by Major Categories in FY 2018/19 .......................................219
Figure 3.133: Nyamira County, Expected Sources of Budget Financing in FY 2018/19 ............................................................................ 221
Figure 3.134: Nyamira County, Own Source Revenue Collection for FY 2013/14 to FY 2018/19 ...........................................................222
Figure 3.135: Nyamira County, Expenditure by Economic Classification ...................................................................................................224
Figure 3.136: Nyamira County, Operations and Maintenance Expenditure by Major Categories in FY 2018/19 ..................................225
Figure 3.137: Nyandarua County, Expected Sources of Budget Financing in FY 2018/19 .......................................................................228
xiii
COUNTY GOVERNMENTS ANNUAL BUDGET IMPLEMENTATION REVIEW REPORT FOR FY 2018/19
Figure 3.138: Nyandarua County, Own Source Revenue Collection for FY 2013/14 to FY 2018/19 .......................................................229
Figure 3.139: Nyandarua County, Expenditure by Economic Classification ................................................................................................231
Figure 3.140: Nyandarua County, Operations and Maintenance Expenditure by Major Categories in FY 2018/19 .............................. 232
Figure 3.141: Nyeri County, Expected Sources of Budget Financing in FY 2018/19 .................................................................................234
Figure 3.142: Nyeri County, Own Source Revenue Collection for FY 2013/14 to FY 2018/19 ................................................................. 235
Figure 3.143: Nyeri County, Expenditure by Economic Classification ........................................................................................................ 237
Figure 3.144: Nyeri County, Operations and Maintenance Expenditure by Major Categories in FY 2018/19 ....................................... 238
Figure 3.145: Samburu County, Expected Sources of Budget Financing in FY 2018/19 ...........................................................................240
Figure 3.146: Samburu County, Own Source Revenue Collection from the FY 2013/14 to FY 2018/19 ................................................. 241
Figure 3.147: Samburu County, Expenditure by Economic Classification .................................................................................................. 243
Figure 3.148: Samburu County, Operations and Maintenance Expenditure by Major Categories in theFY 2018/19 ............................244
Figure 3.149: Siaya County, Expected Sources of Budget Financing in FY 2018/19 ..................................................................................246
Figure 3.150: Siaya County, Own Source Revenue Collection for FY 2013/14 to FY 2018/19 ................................................................. 247
Figure 3.151: Siaya County, Expenditure by Economic Classification .........................................................................................................248
Figure 3.152: Siaya County, Operations and Maintenance Expenditure by Major Categories in FY 2018/19 ........................................250
Figure 3.153: Taita Taveta County, Expected Sources of Budget Financing in FY 2018/19 ...................................................................... 253
Figure 3.154: Taita Taveta County, Own Source Revenue Collection for FY 2013/14 to FY 2018/19 ......................................................254
Figure 3.155: Taita Taveta County, Expenditure by Economic Classification .............................................................................................256
Figure 3.156: Taita Taveta County, Operations and Maintenance Expenditure by Major Categories in FY 2018/19 ............................ 257
Figure 3.157: Tana River County, Expected Sources of Budget Financing in FY 2018/19 ........................................................................260
Figure 3.158: Tana River County, Own Source Revenue Collection for FY 2013/14 to FY 2018/19 ........................................................ 261
Figure 3.159: Tana River County, Expenditure by Economic Classification ............................................................................................... 263
Figure 3.160: Tana River County, Operations and Maintenance Expenditure by Major Categories in FY 2018/19 ..............................264
Figure 3.161: Tharaka Nithi County, Expected Sources of Budget Financing in FY 2018/19...................................................................266
Figure 3.162: Tharaka Nithi County, Own Source Revenue Collection for FY 2013/14 to FY 2018/19 .................................................. 267
Figure 3.163: Tharaka Nithi County, Expenditure by Economic Classification ..........................................................................................269
Figure 3.164: Tharaka Nithi County, Operations and Maintenance Expenditure by Major Categories in FY 2018/19 ......................... 270
Figure 3.165: Trans Nzoia County, Expected Sources of Budget Financing in FY 2018/19 ...................................................................... 273
Figure 3.166: Trans Nzoia County, Own Source Revenue Collection for FY 2013/14 to FY 2018/19 ...................................................... 274
Figure 3.167: Trans Nzoia County, Expenditure by Economic Classification ............................................................................................. 276
Figure 3.168: Trans Nzoia County, Operations and Maintenance Expenditure by Major Categories in FY 2018/19 ............................ 277
Figure 3.169: Turkana County, Expected Sources of Budget Financing in FY 2018/19 ............................................................................. 279
Figure 3.170: Turkana County, Own Source Revenue Collection for the FY 2013/14 to FY 2018/19 ......................................................280
Figure 3.171: Turkana County, Expenditure by Economic Classification ....................................................................................................282
Figure 3.172: Turkana County, Operations and Maintenance Expenditure by Major Categories in the FY 2018/19.............................283
xiv
COUNTY GOVERNMENTS ANNUAL BUDGET IMPLEMENTATION REVIEW REPORT FOR FY 2018/19
Figure 3.173: Uasin Gishu County, Expected Sources of Budget Financing in FY 2018/19 .....................................................................286
Figure 3.174: Uasin Gishu County, Own Source Revenue Collection for FY 2013/14 to FY 2018/19 .....................................................287
Figure 3.175: Uasin Gishu County, Expenditure by Economic Classification .............................................................................................289
Figure 3.176: Uasin Gishu County, Operations and Maintenance Expenditure by Major Categories in FY 2018/19 ............................290
Figure 3.177: Vihiga County, Expected Sources of Budget Financing in FY 2018/19 ............................................................................... 293
Figure 3.178: Vihiga County, Own Source Revenue Collection for FY 2013/14 to FY 2018/19 ...............................................................294
Figure 3.179: Vihiga County, Expenditure by Economic Classification ......................................................................................................296
Figure 3.180: Vihiga County, Operations and Maintenance Expenditure by Major Categories in FY 2018/19 .....................................297
Figure 3.181: Wajir County, Expected Sources of Budget Financing in FY 2018/19 ..................................................................................299
Figure 3.182: Wajir County, Own Source Revenue Collection for FY 2013/14 to FY 2018/19 .................................................................300
Figure 3.183: Wajir County, Expenditure by Economic Classification .........................................................................................................302
Figure 3.184: Wajir County, Operations and Maintenance Expenditure by Major Categories in FY 2018/19 ........................................303
Figure 3.185: West Pokot County, Expected Sources of Budget Financing in FY 2018/19 .......................................................................305
Figure 3.186: West Pokot County, Own Source Revenue Collection for FY 2013/14 to FY 2018/19 .......................................................306
Figure 3.187: West Pokot County, Expenditure by Economic Classification...............................................................................................308
Figure 3.188: West Pokot County, Operations and Maintenance Expenditure by Major Categories in FY 2018/19 ..............................309

xv
COUNTY GOVERNMENTS ANNUAL BUDGET IMPLEMENTATION REVIEW REPORT FOR FY 2018/19
ACRONYMS
ADP Annual Development Plan
A-I-A Appropriations in Aid
ASDSP Agriculture Sector Development Support Programme
CA County Assembly
CARA County Allocation of Revenue Act
CBEF County Budget and Economic Forum
CBIRR County Budget Implementation Review Report
CBK Central Bank of Kenya
CBROP County Budget Review and Outlook Paper
CEC County Executive Committee
CFSP County Fiscal Strategy Paper
CECM-F County Executive Committee Member for Finance
CIDP County Integrated Development Plan
COB Controller of Budget
CRF County Revenue Fund
DANIDA Danish International Development Agency
ERP Enterprise Resource Planning
EU European Union
ECDE Early Childhood Development Education
FAO Food and Agriculture Organization
FY Financial Year
IB Internet Banking
ICT Information Communication Technology
IDA International Development Association
IDEAS Instruments for Devolution Advice and Support
IFMIS Integrated Financial Management Information System
IPPD Integrated Payroll Personnel Database
KASP Kenya Agricultural Support Programme

xvi
COUNTY GOVERNMENTS ANNUAL BUDGET IMPLEMENTATION REVIEW REPORT FOR FY 2018/19
KCSAP Kenya Climate Smart Agriculture Project
KDSP Kenya Devolution Support Programme
KRB Kenya Roads Board
Kshs Kenya Shillings
KUSP Kenya Urban Support Project
MCA Member of County Assembly
NARIGP National Agricultural and Rural Inclusive Growth Project
O&M Operations and Maintenance
OCOB Office of the Controller of Budget
PE Personnel Emoluments
PFM Public Finance Management
RMLF Road Maintenance Levy Fund
SRC Salaries and Remuneration Commission
THSUC Transforming Health Systems for Universal Health Care
UHC Universal Health Care
UIG Urban Institutional Grants
WSDP Water & Sanitation Development Project

xvii
COUNTY GOVERNMENTS ANNUAL BUDGET IMPLEMENTATION REVIEW REPORT FOR FY 2018/19
EXECUTIVE SUMMARY
This is the Annual County Budget Implementation Review Report (CBIRR) for the financial year 2018/19. It covers the period July, 2018 to June, 2019. The report has been prepared in fulfilment of the requirements of Article 228 (6) of the Constitution of Kenya, 2010 and Section 9 of the Controller of Budget Act, 2016. It highlights the status of the County budget implementation by analysing revenue and expenditure performance against the annual budget estimates. Expenditure is based on financial reports submitted by County Treasuries and those generated from the Integrated Financial Management System (IFMIS).
During the year, aggregate budget estimates for the 47 County Governments amounted to Kshs.483.47 billion comprising Kshs.297.71 billion (61.6 per cent) for recurrent expenditure and Kshs.185.76 billion (38.4 per cent) for development expenditure. In order to finance the budget, County Governments were allocated Kshs.314 billion as equitable share of revenue raised nationally and Kshs.62.48 billion as conditional grants from the National Government and Development Partners. Additionally, County Governments expected to generate own source revenue amounting to Kshs.53.86 billion, and also utilize Kshs.55.08 billion projected cash balance from FY 2017/18.
The total revenue available to the County Governments in FY 2018/19 amounted to Kshs.445.36 billion which comprised of Kshs.314 billion as equitable share of revenue raised nationally, Kshs.4.33 billion grant to Level 5 Hospitals, Kshs.900 million for Foregone User Fees, Kshs.960.64 million for rehabilitation of Youth Polytechnics, Kshs.7.42 billion from the Road Maintenance Fuel Levy Fund, Kshs.22.37 billion from development partners, Kshs.40.30 billion as revenue raised from own sources, and Kshs.55.08 billion as cash balance from FY 2017/18.
The aggregate own source revenue raised by County Governments of Kshs.40.30 billion was 74.8 per cent of the annual target of Kshs.53.86 billion. This was a significant improvement compared to Kshs.32.49 billion generated in FY 2017/18. Analysis of own source revenue as a proportion of the annual revenue target indicated that thirteen counties namely; Lamu, Vihiga, Taita Taveta, Narok, Elgeyo Marakwet, Isiolo, Nakuru, Bungoma, Tana River, Kwale, Laikipia, Kirinyaga, and Kiambu exceeded their annual targets.
During the period, the Controller of Budget (COB) authorised withdrawal of Kshs.405.17 billion from the County Revenue Funds to the various County Operational Accounts. This amount consisted of Kshs.285.66 billion (70.5 per cent) for recurrent expenditure and Kshs.119.51 billion (29.5 per cent) for development activities. Nairobi City County received the highest amount from its CRF account to the operational accounts at Kshs.24.43 billion followed by Mombasa and Kiambu at Kshs.22.33 billion and Kshs.14.95 billion respectively. The Counties that received the least amounts were; Samburu at Kshs.4.54 billion, Elgeyo Marakwet at Kshs.4.47 billion, and Lamu at Kshs.2.97 billion.
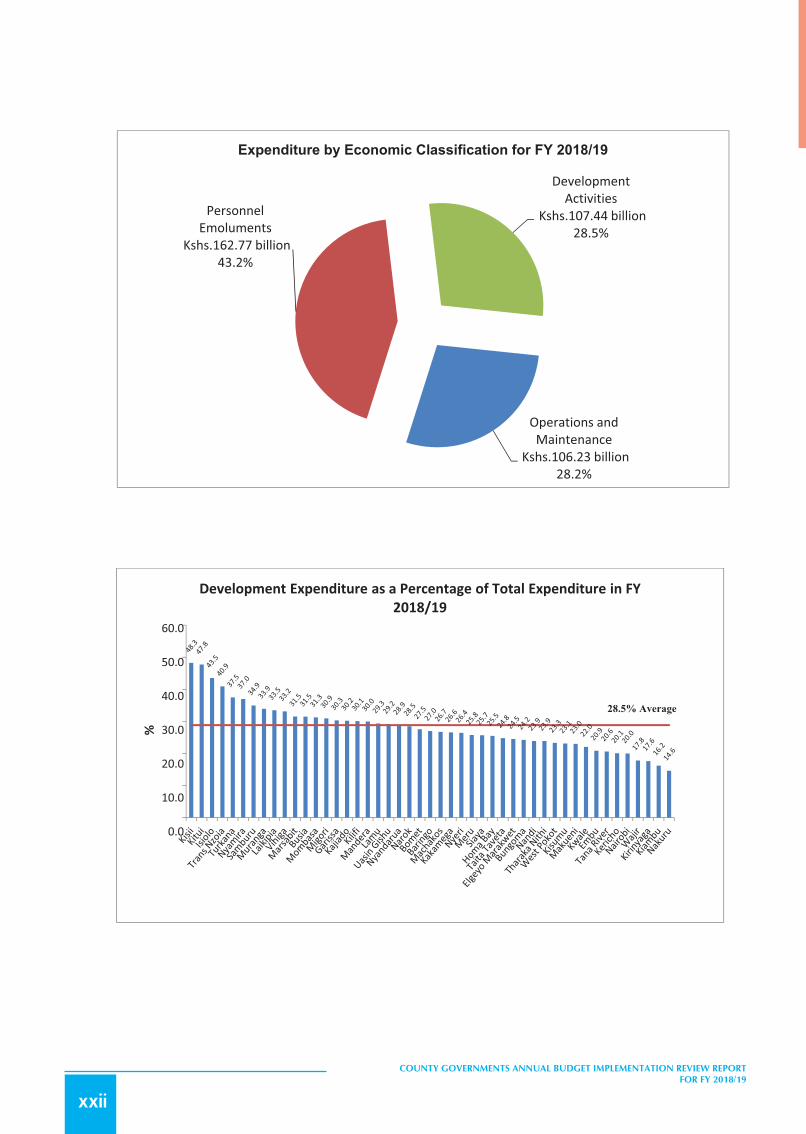
The total expenditure in FY 2018/19 was Kshs.376.43 billion which comprised of Kshs.269 billion for recurrent expenditure (90.4 per cent of the annual recurrent budget) and Kshs.107.44 billion for development expenditure (57.8 per cent of the annual development budget). This expenditure was 77.9 per cent of the total annual County Government budgets. Analysis of development expenditure as a proportion of approved annual development budget shows that Narok, Marsabit, and Mandera Counties attained the highest absorption rate at 95.4 per cent, 81.5 per cent, and 81.3 per cent respectively. Lamu County, and Turkana County and Nakuru County reported the lowest absorption rate of development budget at 30.4 per cent, 29.1 per cent, and 18.4 per cent respectively. Absorption rate is computed as a percentage of total expenditure to the Approved Budget. A review of expenditure by economic classification showed that Kshs.162.77 billion (43.2 per cent) was spent on personnel emoluments, Kshs.106.23 billion (28.2 per cent) on operations and maintenance, and Kshs.107.44 billion (28.5 per cent) on development expenditure.

xviii
COUNTY GOVERNMENTS ANNUAL BUDGET IMPLEMENTATION REVIEW REPORT FOR FY 2018/19
The expenditure of Kshs.162.77 billion on personnel emoluments represented 60.5 per cent of the total recurrent expenditure and 43.2 per cent of total expenditure. This expenditure was an increase from Kshs.151.09 billion spent in FY 2017/18 when expenditure on personnel emoluments translated to 49.7 per cent of the total expenditure. Counties that reported the highest percentage of expenditure on personnel emoluments to total expenditure included; Nakuru, Baringo, Nyamira and Homa Bay, which recorded 58.4 per cent, 57.5 per cent, 56 per cent and 54.5 per cent respectively. Only five counties: namely Tana River, Marsabit, Turkana, Mandera and Kilifi reported expenditure on personnel emoluments that was within the maximum allowed limit of 35 per cent of their total expenditure in FY 2018/19 at 34 per cent, 32.7 per cent, 29.2 per cent, 24.2 per cent and 21.1 per cent respectively.
The key challenges identified by the Office as hindering effective budget execution by County Governments incuded; high expenditure on personnel emoluments, delay in submissions of financial reports by County Treasuries to the Controller of Budget contrary to Section 166 and 168 of the PFM Act, 2012, under-performance of own source revenue collection, high expenditure on travel costs which amounted to Ksh.16.2 billion and was 4.3 per cent of total expenditure for the year.
The Office recommends that the County Governments should establish an optimal staffing level to ensure that expenditure on personnel emoluments is within the set limit of 35 per cent of the County’s total revenue as provided in Regulation 25 (1) of the Public Finance Management (County Governments) Regulations, 2015. County Treasuries should also develop and implement strategies to enhance own source revenue collection, ensure compliance with PFM Act, 2012 on submission of financial and non-financial expenditure returns. Finally, Office recommends that expenditure on non-core activities, such as travelling, should be rationalised in order to free fund for implementation of key development programmes.

xix
COUNTY GOVERNMENTS ANNUAL BUDGET IMPLEMENTATION REVIEW REPORT FOR FY 2018/19
KEY HIGHLIGHTS
OVERALL ABSORPTION RATE FOR THE FY 2018/19

xx
COUNTY GOVERNMENTS ANNUAL BUDGET IMPLEMENTATION REVIEW REPORT FOR FY 2018/19
Development
Recurrent

xxi
COUNTY GOVERNMENTS ANNUAL BUDGET IMPLEMENTATION REVIEW REPORT FOR FY 2018/19
xxii
COUNTY GOVERNMENTS ANNUAL BUDGET IMPLEMENTATION REVIEW REPORT FOR FY 2018/19
1
COUNTY GOVERNMENTS ANNUAL BUDGET IMPLEMENTATION REVIEW REPORT FOR FY 2018/19
1 INTRODUCTION
The Office of the Controller of Budget (OCOB) is an oversight institution established under Article 228 of the Constitution of Kenya, 2010 with the mandate to oversee and report on the implementation of the budgets for both the National and County Governments. Article 228(4) and 228 (6) of the Constitution, and Section 9 of the Controller of Budget (COB) Act, 2016, require the Controller of Budget to authorize withdrawal of public funds and report on budget implementation to each House of Parliament every four months.
The report presents performance on budget implementation by the 47 County Governments for the financial year 2018/19. It contains information on the approved budgets, disbursement of equitable share of revenue from the National Treasury, conditional grants from both the National Government and Development Partners, own source revenue performance, expenditure, and the key challenges encountered in budget execution during the financial year.
The County Budget Implementation Review Report (CBIRR) is primarily aimed at providing information to the Legislature and Executive. The report is also useful to other stakeholders and the public at large as it also satisfies the requirements of Section 39(8) of the Public Finance Management (PFM) Act, 2012, which obliges the COB to ensure that members of the public are provided with information on budget implementation.
The report is organized into five chapters. Chapter one is the introduction, Chapter two provides aggregate analysis of budget performance by the Counties during the reporting period. It presents revenue performance, exchequer issues to the County Governments and expenditure performance disaggregated into development and recurrent expenditure in line with Section 9 (3) (a) of the Controller of Budget Act, 2016. Analysis of the revenues received by the County Governments is based on the various revenue sources such as equitable share of revenue from the National Government, conditional grants from the National Government and Development Partners, and own-source revenues collected by the Counties.
Chapter three presents performance by individual Counties. The chapter presents information on revenue, budget allocation, exchequer issues, and expenditure performance. The key challenges faced by the County Governments in implementing their budgets are highlighted in chapter four, which also provides suggested measures to address the challenges. Finally, chapter five provides the conclusion.

2
COUNTY GOVERNMENTS ANNUAL BUDGET IMPLEMENTATION REVIEW REPORT FOR FY 2018/19
2 FINANCIAL ANALYSIS OF COUNTY GOVERNMENTS PERFORMANCE IN FY 2018/19
2.1 IntroductionThis chapter presents status of budget implementation in aggregated terms by County Governments in the FY 2018/19.
2.1.1 Revenue AnalysisIn FY 2018/19, the combined County Governments’ budgets approved by the county assemblies amounted to Kshs.483.47 billion and comprised of Kshs.297.71 billion (61.6 per cent) allocated to recurrent expenditure and Kshs.185.76 billion (38.4 per cent) for development expenditure.
In order to finance the budgets, County Governments expected to receive Kshs.314 billion as equitable share of revenue raised nationally, Kshs.62.48 billion as total conditional grants from the National Government and development partners, generate Kshs.53.86 billion from own revenue sources, and utilize Kshs.55.08 billion as cash balance from FY 2017/18. Figure 2.1 shows expected sources of budget financing in FY 2018/19.
Figure 2.1: Expected Sources of Budget Financing in FY 2018/19
34
2 FINANCIAL ANALYSIS OF COUNTY GOVERNMENTS PERFORMANCE IN FY 2018/19
2.1 Introduction
This chapter presents status of budget implementation in aggregated terms by County Governments in the FY 2018/19.
2.1.1 Revenue Analysis In FY 2018/19, the combined county governments’ budgets approved by the county assemblies amounted to Kshs.483.47
billion and comprised of Kshs.297.71 billion (61.6 per cent) allocated to recurrent expenditure and Kshs.185.76 billion (38.4
per cent) for development expenditure.
In order to finance the budgets, county governments expected to receive Kshs.314 billion as equitable share of revenue
raised nationally, Kshs.62.48 billion as total conditional grants from the National Government and development partners,
generate Kshs.53.86 billion from own revenue sources, and utilize Kshs.55.08 billion as cash balance from FY 2017/18.
Figure 2.1 shows expected sources of budget financing in FY 2018/19.
Figure 2.1: Expected Sources of Budget Financing in FY 2018/19
The breakdown of conditional grants as per CARA, 2018 are shown in Table 2.1.
Table 2.1: Conditional Grants as per CARA, 2018
S/No.
Grants Contained in CARA, 2018 Annual CARA, 2018 Allocation (Kshs.)
Conditional grants from the National Government
1 Leasing of Medical Equipment 9,400,000,000
Conditional Grants from National Government
5.3%
Equitable Share64.7%
Conditional Grants from Development
Partners7.6%
Own-Source Revenue11.1%
Cash Balance from FY 2017/18
11.3%
The breakdown of conditional grants as per CARA, 2018 are shown in Table 2.1.
Table 2.1: Conditional Grants as per CARA, 2018S /No.
Grants Contained in CARA, 2018 Annual CARA, 2018 Allocation (Kshs.)
Conditional grants from the National Government
1 Leasing of Medical Equipment 9,400,000,000
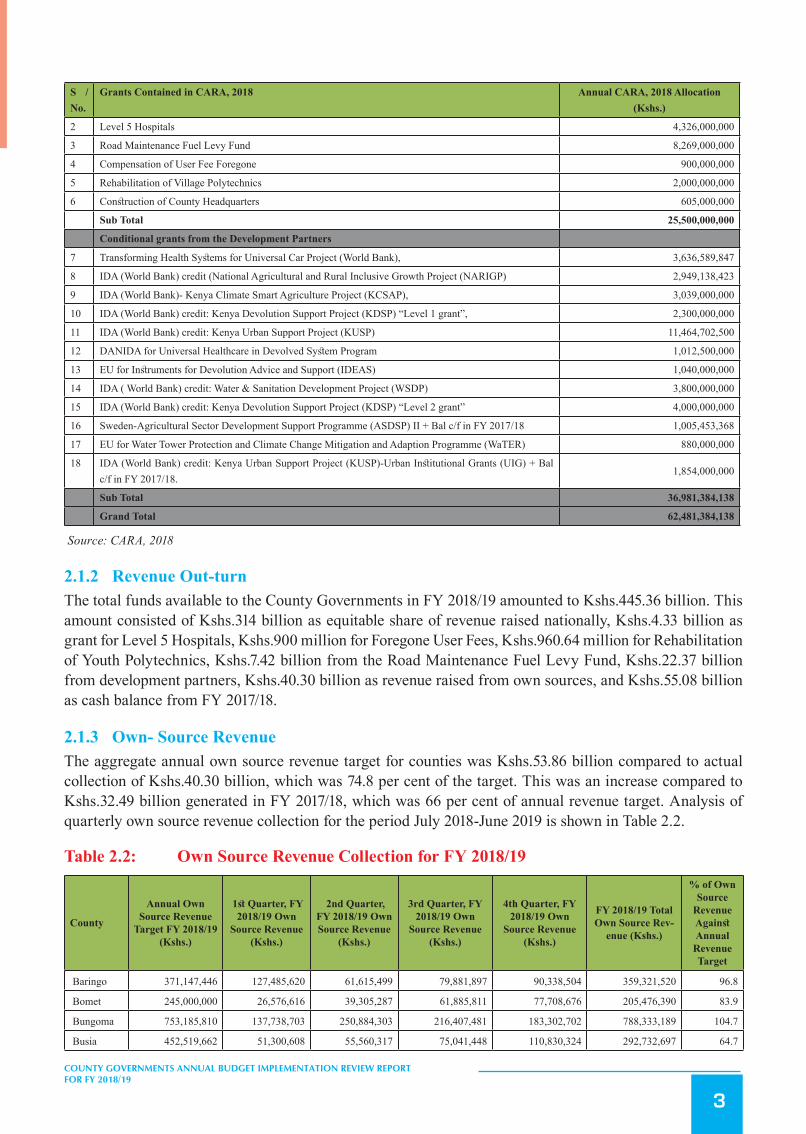
3
COUNTY GOVERNMENTS ANNUAL BUDGET IMPLEMENTATION REVIEW REPORT FOR FY 2018/19
S /No.
Grants Contained in CARA, 2018 Annual CARA, 2018 Allocation (Kshs.)
2 Level 5 Hospitals 4,326,000,000
3 Road Maintenance Fuel Levy Fund 8,269,000,000
4 Compensation of User Fee Foregone 900,000,000
5 Rehabilitation of Village Polytechnics 2,000,000,000
6 Construction of County Headquarters 605,000,000
Sub Total 25,500,000,000
Conditional grants from the Development Partners
7 Transforming Health Systems for Universal Car Project (World Bank), 3,636,589,847
8 IDA (World Bank) credit (National Agricultural and Rural Inclusive Growth Project (NARIGP) 2,949,138,423
9 IDA (World Bank)- Kenya Climate Smart Agriculture Project (KCSAP), 3,039,000,000
10 IDA (World Bank) credit: Kenya Devolution Support Project (KDSP) “Level 1 grant”, 2,300,000,000
11 IDA (World Bank) credit: Kenya Urban Support Project (KUSP) 11,464,702,500
12 DANIDA for Universal Healthcare in Devolved System Program 1,012,500,000
13 EU for Instruments for Devolution Advice and Support (IDEAS) 1,040,000,000
14 IDA ( World Bank) credit: Water & Sanitation Development Project (WSDP) 3,800,000,000
15 IDA (World Bank) credit: Kenya Devolution Support Project (KDSP) “Level 2 grant” 4,000,000,000
16 Sweden-Agricultural Sector Development Support Programme (ASDSP) II + Bal c/f in FY 2017/18 1,005,453,368
17 EU for Water Tower Protection and Climate Change Mitigation and Adaption Programme (WaTER) 880,000,000
18 IDA (World Bank) credit: Kenya Urban Support Project (KUSP)-Urban Institutional Grants (UIG) + Bal c/f in FY 2017/18.
1,854,000,000
Sub Total 36,981,384,138
Grand Total 62,481,384,138
Source: CARA, 2018
2.1.2 Revenue Out-turnThe total funds available to the County Governments in FY 2018/19 amounted to Kshs.445.36 billion. This amount consisted of Kshs.314 billion as equitable share of revenue raised nationally, Kshs.4.33 billion as grant for Level 5 Hospitals, Kshs.900 million for Foregone User Fees, Kshs.960.64 million for Rehabilitation of Youth Polytechnics, Kshs.7.42 billion from the Road Maintenance Fuel Levy Fund, Kshs.22.37 billion from development partners, Kshs.40.30 billion as revenue raised from own sources, and Kshs.55.08 billion as cash balance from FY 2017/18.
2.1.3 Own- Source RevenueThe aggregate annual own source revenue target for counties was Kshs.53.86 billion compared to actual collection of Kshs.40.30 billion, which was 74.8 per cent of the target. This was an increase compared to Kshs.32.49 billion generated in FY 2017/18, which was 66 per cent of annual revenue target. Analysis of quarterly own source revenue collection for the period July 2018-June 2019 is shown in Table 2.2.
Table 2.2: Own Source Revenue Collection for FY 2018/19
County
Annual Own Source Revenue
Target FY 2018/19 (Kshs.)
1stQuarter,FY2018/19 Own
Source Revenue (Kshs.)
2ndQuarter,FY 2018/19 Own Source Revenue
(Kshs.)
3rdQuarter,FY2018/19 Own
Source Revenue (Kshs.)
4thQuarter,FY2018/19 Own
Source Revenue (Kshs.)
FY 2018/19 Total Own Source Rev-
enue (Kshs.)
% of Own Source
Revenue AgainstAnnual Revenue Target
Baringo 371,147,446 127,485,620 61,615,499 79,881,897 90,338,504 359,321,520 96.8
Bomet 245,000,000 26,576,616 39,305,287 61,885,811 77,708,676 205,476,390 83.9
Bungoma 753,185,810 137,738,703 250,884,303 216,407,481 183,302,702 788,333,189 104.7
Busia 452,519,662 51,300,608 55,560,317 75,041,448 110,830,324 292,732,697 64.7

4
COUNTY GOVERNMENTS ANNUAL BUDGET IMPLEMENTATION REVIEW REPORT FOR FY 2018/19
County
Annual Own Source Revenue
Target FY 2018/19 (Kshs.)
1stQuarter,FY2018/19 Own
Source Revenue (Kshs.)
2ndQuarter,FY 2018/19 Own Source Revenue
(Kshs.)
3rdQuarter,FY2018/19 Own
Source Revenue (Kshs.)
4thQuarter,FY2018/19 Own
Source Revenue (Kshs.)
FY 2018/19 Total Own Source Rev-
enue (Kshs.)
% of Own Source
Revenue AgainstAnnual Revenue Target
Elgeyo/Marakwet 130,438,893 31,144,600 25,728,858 48,804,491 36,178,554 141,856,503 108.8
Embu 950,000,000 129,137,644 126,713,806 224,393,645 149,184,730 629,429,825 66.3
Garissa 250,000,000 25,888,954 19,568,754 35,939,146 26,900,580 108,297,434 43.3
Homa Bay 172,996,417 14,800,000 22,288,000 21,180,000 43,700,000 101,968,000 58.9
Isiolo 150,861,337 54,018,229 33,241,463 39,948,242 34,559,388 161,767,322 107.2
Kajiado 1,583,856,996 189,767,731 174,125,862 367,162,108 345,642,843 1,076,698,544 68.0
Kakamega 1,200,000,000 116,332,994 96,598,242 356,950,026 288,454,320 858,335,582 71.5
Kericho 694,819,121 38,239,441 65,109,734 202,017,983 168,611,242 473,978,400 68.2
Kiambu 2,736,734,640 443,119,237 563,383,200 830,834,362 904,886,319 2,742,223,118 100.2
Kilifi 1,345,066,521 117,304,323 146,126,594 288,148,675 240,914,219 792,493,811 58.9
Kirinyaga 430,000,000 68,189,093 62,557,392 191,587,958 110,304,005 432,638,447 100.6
Kisii 950,000,000 59,441,728 60,848,093 139,811,094 82,545,775 342,646,690 36.1
Kisumu 1,382,567,120 153,863,368 251,439,702 147,836,651 289,676,677 842,816,398 61.0
Kitui 797,985,098 98,979,332 107,654,882 118,202,978 115,686,731 440,523,923 55.2
Kwale 303,112,305 46,645,873 49,039,867 116,569,260 102,770,181 315,025,181 103.9
Laikipia 800,000,000 164,311,119 121,463,522 287,043,147 242,972,370 815,790,157 102.0
Lamu 70,000,000 6,152,697 11,731,571 24,342,404 39,610,655 81,837,327 116.9
Machakos 1,720,061,674 210,000,629 231,882,889 85,556,271 1,029,790,000 1,557,229,789 90.5
Makueni 796,500,000 76,463,362 65,424,891 175,394,062 194,419,757 511,702,072 64.2
Mandera 179,089,080 17,850,940 20,019,620 28,761,230 27,602,790 94,234,580 52.6
Marsabit 140,000,000 16,706,255 16,950,779 42,942,072 47,505,864 124,104,970 88.6
Meru 1,228,796,286 131,008,515 86,534,234 144,208,404 188,338,675 550,089,828 44.8
Migori 1,452,626,670 69,202,604 64,281,920 126,606,412 116,133,825 376,224,761 25.9
Mombasa 4,741,939,082 298,643,016 706,556,984 1,606,566,184 1,093,631,863 3,705,398,047 78.1
Murang’a 1,000,000,000 131,294,165 117,986,598 244,298,891 210,450,766 704,030,420 70.4
Nairobi City 15,496,709,206 1,794,436,818 2,080,733,392 4,367,220,300 2,006,034,875 10,248,425,385 66.1
Nakuru 2,685,000,000 545,562,704 1,000,000,000 413,076,924 855,988,897 2,814,628,525 104.8
Nandi 459,293,246 41,322,950 42,051,284 62,425,372 62,545,418 208,345,024 45.4
Narok 2,862,640,836 1,193,858,907 647,322,628 823,191,193 458,010,932 3,122,383,660 109.1
Nyamira 255,566,158 32,822,467 31,646,767 55,832,317 45,146,019 165,447,570 64.7
Nyandarua 410,000,000 63,937,791 55,739,244 89,077,278 194,648,228 403,402,541 98.4
Nyeri 1,000,000,000 170,264,077 160,757,830 269,975,066 218,814,700 819,811,673 82.0
Samburu 254,030,128 87,248,352 87,248,352 15,830,532 53,533,865 243,861,101 96.0
Siaya 325,000,000 27,628,284 36,330,000 51,776,000 73,933,738 189,668,022 58.4
Taita/Tav-eta 300,000,000 66,827,522 57,419,785 93,717,983 114,747,262 332,712,552 110.9
Tana River 60,000,000 10,751,827 9,222,820 12,238,356 30,435,711 62,648,714 104.4
Tharaka -Nithi 300,000,000 44,347,211 39,964,044 45,303,459 115,702,446 245,317,160 81.8
Trans Nzoia 500,000,000 36,234,629 41,221,772 154,202,867 139,165,483 370,824,751 74.2
Turkana 250,000,000 36,361,611 33,559,561 43,206,777 61,900,802 175,028,751 70.0
Uasin Gishu 1,200,000,000 157,220,822 125,609,483 397,045,447 239,066,500 918,942,252 76.6
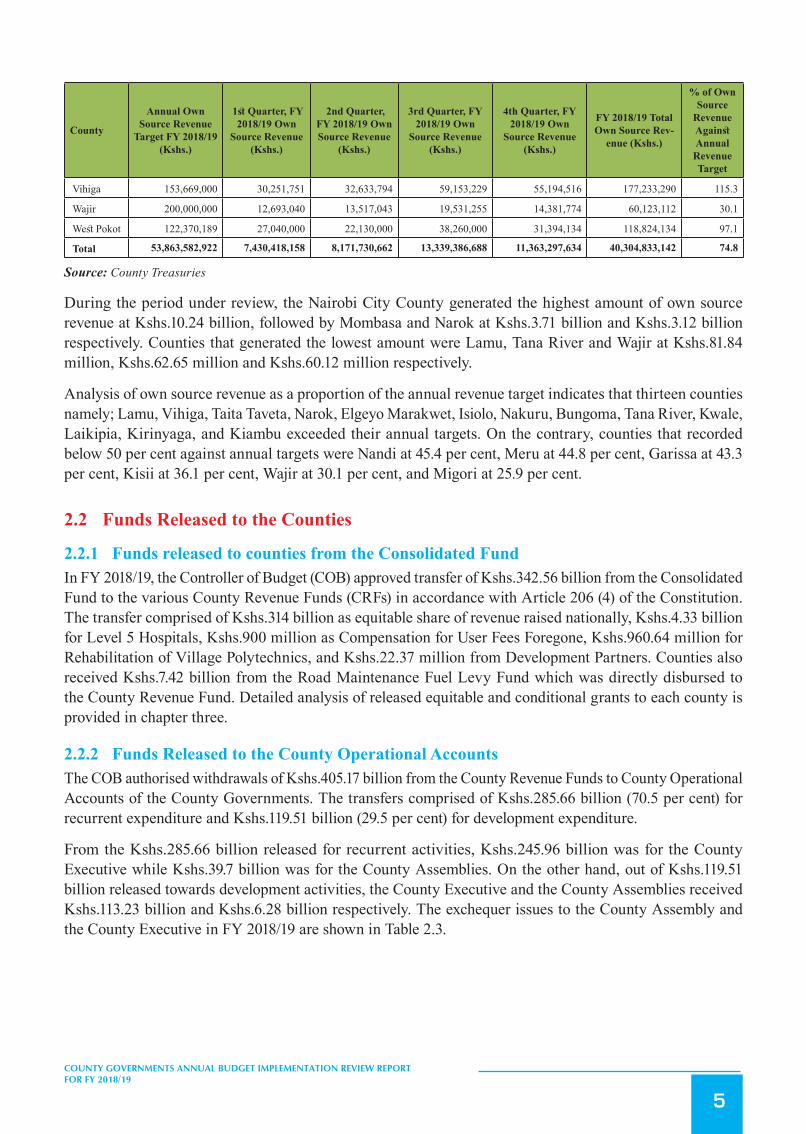
5
COUNTY GOVERNMENTS ANNUAL BUDGET IMPLEMENTATION REVIEW REPORT FOR FY 2018/19
County
Annual Own Source Revenue
Target FY 2018/19 (Kshs.)
1stQuarter,FY2018/19 Own
Source Revenue (Kshs.)
2ndQuarter,FY 2018/19 Own Source Revenue
(Kshs.)
3rdQuarter,FY2018/19 Own
Source Revenue (Kshs.)
4thQuarter,FY2018/19 Own
Source Revenue (Kshs.)
FY 2018/19 Total Own Source Rev-
enue (Kshs.)
% of Own Source
Revenue AgainstAnnual Revenue Target
Vihiga 153,669,000 30,251,751 32,633,794 59,153,229 55,194,516 177,233,290 115.3
Wajir 200,000,000 12,693,040 13,517,043 19,531,255 14,381,774 60,123,112 30.1
West Pokot 122,370,189 27,040,000 22,130,000 38,260,000 31,394,134 118,824,134 97.1
Total 53,863,582,922 7,430,418,158 8,171,730,662 13,339,386,688 11,363,297,634 40,304,833,142 74.8
Source: County Treasuries
During the period under review, the Nairobi City County generated the highest amount of own source revenue at Kshs.10.24 billion, followed by Mombasa and Narok at Kshs.3.71 billion and Kshs.3.12 billion respectively. Counties that generated the lowest amount were Lamu, Tana River and Wajir at Kshs.81.84 million, Kshs.62.65 million and Kshs.60.12 million respectively.
Analysis of own source revenue as a proportion of the annual revenue target indicates that thirteen counties namely; Lamu, Vihiga, Taita Taveta, Narok, Elgeyo Marakwet, Isiolo, Nakuru, Bungoma, Tana River, Kwale, Laikipia, Kirinyaga, and Kiambu exceeded their annual targets. On the contrary, counties that recorded below 50 per cent against annual targets were Nandi at 45.4 per cent, Meru at 44.8 per cent, Garissa at 43.3 per cent, Kisii at 36.1 per cent, Wajir at 30.1 per cent, and Migori at 25.9 per cent.
2.2 Funds Released to the Counties
2.2.1 Funds released to counties from the Consolidated FundIn FY 2018/19, the Controller of Budget (COB) approved transfer of Kshs.342.56 billion from the Consolidated Fund to the various County Revenue Funds (CRFs) in accordance with Article 206 (4) of the Constitution. The transfer comprised of Kshs.314 billion as equitable share of revenue raised nationally, Kshs.4.33 billion for Level 5 Hospitals, Kshs.900 million as Compensation for User Fees Foregone, Kshs.960.64 million for Rehabilitation of Village Polytechnics, and Kshs.22.37 million from Development Partners. Counties also received Kshs.7.42 billion from the Road Maintenance Fuel Levy Fund which was directly disbursed to the County Revenue Fund. Detailed analysis of released equitable and conditional grants to each county is provided in chapter three.
2.2.2 Funds Released to the County Operational AccountsThe COB authorised withdrawals of Kshs.405.17 billion from the County Revenue Funds to County Operational Accounts of the County Governments. The transfers comprised of Kshs.285.66 billion (70.5 per cent) for recurrent expenditure and Kshs.119.51 billion (29.5 per cent) for development expenditure.
From the Kshs.285.66 billion released for recurrent activities, Kshs.245.96 billion was for the County Executive while Kshs.39.7 billion was for the County Assemblies. On the other hand, out of Kshs.119.51 billion released towards development activities, the County Executive and the County Assemblies received Kshs.113.23 billion and Kshs.6.28 billion respectively. The exchequer issues to the County Assembly and the County Executive in FY 2018/19 are shown in Table 2.3.
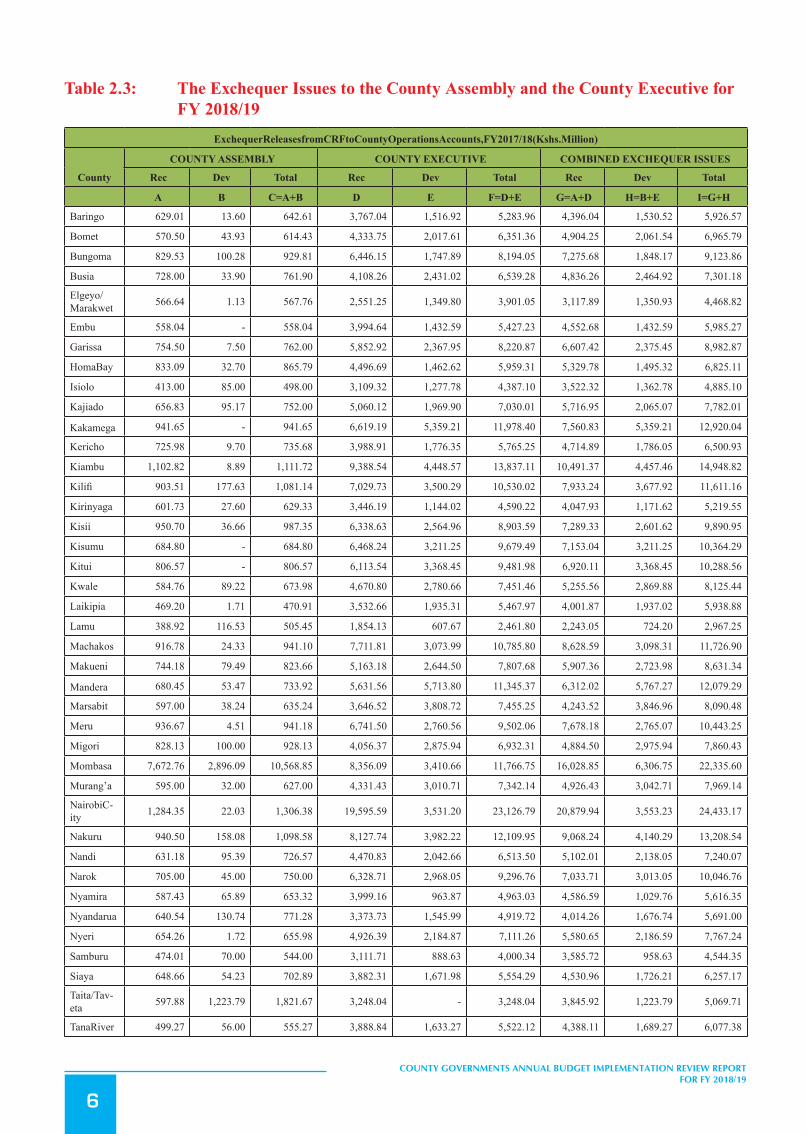
6
COUNTY GOVERNMENTS ANNUAL BUDGET IMPLEMENTATION REVIEW REPORT FOR FY 2018/19
Table 2.3: The Exchequer Issues to the County Assembly and the County Executive for FY 2018/19
ExchequerReleasesfromCRFtoCountyOperationsAccounts,FY2017/18(Kshs.Million)
County
COUNTY ASSEMBLY COUNTY EXECUTIVE COMBINEDEXCHEQUERISSUES
Rec Dev Total Rec Dev Total Rec Dev Total
A B C=A+B D E F=D+E G=A+D H=B+E I=G+H
Baringo 629.01 13.60 642.61 3,767.04 1,516.92 5,283.96 4,396.04 1,530.52 5,926.57
Bomet 570.50 43.93 614.43 4,333.75 2,017.61 6,351.36 4,904.25 2,061.54 6,965.79
Bungoma 829.53 100.28 929.81 6,446.15 1,747.89 8,194.05 7,275.68 1,848.17 9,123.86
Busia 728.00 33.90 761.90 4,108.26 2,431.02 6,539.28 4,836.26 2,464.92 7,301.18
Elgeyo/Marakwet 566.64 1.13 567.76 2,551.25 1,349.80 3,901.05 3,117.89 1,350.93 4,468.82
Embu 558.04 - 558.04 3,994.64 1,432.59 5,427.23 4,552.68 1,432.59 5,985.27
Garissa 754.50 7.50 762.00 5,852.92 2,367.95 8,220.87 6,607.42 2,375.45 8,982.87
HomaBay 833.09 32.70 865.79 4,496.69 1,462.62 5,959.31 5,329.78 1,495.32 6,825.11
Isiolo 413.00 85.00 498.00 3,109.32 1,277.78 4,387.10 3,522.32 1,362.78 4,885.10
Kajiado 656.83 95.17 752.00 5,060.12 1,969.90 7,030.01 5,716.95 2,065.07 7,782.01
Kakamega 941.65 - 941.65 6,619.19 5,359.21 11,978.40 7,560.83 5,359.21 12,920.04
Kericho 725.98 9.70 735.68 3,988.91 1,776.35 5,765.25 4,714.89 1,786.05 6,500.93
Kiambu 1,102.82 8.89 1,111.72 9,388.54 4,448.57 13,837.11 10,491.37 4,457.46 14,948.82
Kilifi 903.51 177.63 1,081.14 7,029.73 3,500.29 10,530.02 7,933.24 3,677.92 11,611.16
Kirinyaga 601.73 27.60 629.33 3,446.19 1,144.02 4,590.22 4,047.93 1,171.62 5,219.55
Kisii 950.70 36.66 987.35 6,338.63 2,564.96 8,903.59 7,289.33 2,601.62 9,890.95
Kisumu 684.80 - 684.80 6,468.24 3,211.25 9,679.49 7,153.04 3,211.25 10,364.29
Kitui 806.57 - 806.57 6,113.54 3,368.45 9,481.98 6,920.11 3,368.45 10,288.56
Kwale 584.76 89.22 673.98 4,670.80 2,780.66 7,451.46 5,255.56 2,869.88 8,125.44
Laikipia 469.20 1.71 470.91 3,532.66 1,935.31 5,467.97 4,001.87 1,937.02 5,938.88
Lamu 388.92 116.53 505.45 1,854.13 607.67 2,461.80 2,243.05 724.20 2,967.25
Machakos 916.78 24.33 941.10 7,711.81 3,073.99 10,785.80 8,628.59 3,098.31 11,726.90
Makueni 744.18 79.49 823.66 5,163.18 2,644.50 7,807.68 5,907.36 2,723.98 8,631.34
Mandera 680.45 53.47 733.92 5,631.56 5,713.80 11,345.37 6,312.02 5,767.27 12,079.29
Marsabit 597.00 38.24 635.24 3,646.52 3,808.72 7,455.25 4,243.52 3,846.96 8,090.48
Meru 936.67 4.51 941.18 6,741.50 2,760.56 9,502.06 7,678.18 2,765.07 10,443.25
Migori 828.13 100.00 928.13 4,056.37 2,875.94 6,932.31 4,884.50 2,975.94 7,860.43
Mombasa 7,672.76 2,896.09 10,568.85 8,356.09 3,410.66 11,766.75 16,028.85 6,306.75 22,335.60
Murang’a 595.00 32.00 627.00 4,331.43 3,010.71 7,342.14 4,926.43 3,042.71 7,969.14
NairobiC-ity 1,284.35 22.03 1,306.38 19,595.59 3,531.20 23,126.79 20,879.94 3,553.23 24,433.17
Nakuru 940.50 158.08 1,098.58 8,127.74 3,982.22 12,109.95 9,068.24 4,140.29 13,208.54
Nandi 631.18 95.39 726.57 4,470.83 2,042.66 6,513.50 5,102.01 2,138.05 7,240.07
Narok 705.00 45.00 750.00 6,328.71 2,968.05 9,296.76 7,033.71 3,013.05 10,046.76
Nyamira 587.43 65.89 653.32 3,999.16 963.87 4,963.03 4,586.59 1,029.76 5,616.35
Nyandarua 640.54 130.74 771.28 3,373.73 1,545.99 4,919.72 4,014.26 1,676.74 5,691.00
Nyeri 654.26 1.72 655.98 4,926.39 2,184.87 7,111.26 5,580.65 2,186.59 7,767.24
Samburu 474.01 70.00 544.00 3,111.71 888.63 4,000.34 3,585.72 958.63 4,544.35
Siaya 648.66 54.23 702.89 3,882.31 1,671.98 5,554.29 4,530.96 1,726.21 6,257.17
Taita/Tav-eta 597.88 1,223.79 1,821.67 3,248.04 - 3,248.04 3,845.92 1,223.79 5,069.71
TanaRiver 499.27 56.00 555.27 3,888.84 1,633.27 5,522.12 4,388.11 1,689.27 6,077.38

7
COUNTY GOVERNMENTS ANNUAL BUDGET IMPLEMENTATION REVIEW REPORT FOR FY 2018/19
ExchequerReleasesfromCRFtoCountyOperationsAccounts,FY2017/18(Kshs.Million)
County
COUNTY ASSEMBLY COUNTY EXECUTIVE COMBINEDEXCHEQUERISSUES
Rec Dev Total Rec Dev Total Rec Dev Total
A B C=A+B D E F=D+E G=A+D H=B+E I=G+H
Tharaka–Nithi 352.00 - 352.00 2,980.33 1,396.13 4,376.46 3,332.33 1,396.13 4,728.46
TransNzoia 614.08 34.59 648.67 4,176.92 2,077.57 6,254.50 4,791.00 2,112.16 6,903.17
Turkana 839.00 114.60 953.60 7,733.26 2,484.91 10,218.17 8,572.26 2,599.51 11,171.77
U a s i n G -ishu 671.48 - 671.48 4,506.49 2,591.16 7,097.66 5,177.97 2,591.16 7,769.14
Vihiga 607.25 18.35 625.61 3,895.28 1,713.97 5,609.25 4,502.53 1,732.32 6,234.85
Wajir 719.76 - 719.76 5,329.99 4,560.07 9,890.05 6,049.75 4,560.07 10,609.81
WestPokot 559.79 78.97 638.76 3,578.29 1,422.71 5,001.00 4,138.07 1,501.68 5,639.76
Total 39,697.19 6,278.65 45,975.84 245,962.76 113,228.96 359,191.72 285,659.95 119,507.62 405,167.57
Source: County Treasuries and OCOB
Nairobi City County received the highest amount from its CRF account to the operational accounts at Kshs.24.43 billion followed by Mombasa and Kiambu at Kshs.22.33 billion and Kshs.14.95 billion respectively. The Counties that received the least amounts were; Samburu at Kshs.4.54 billion, Elgeyo Marakwet at Kshs.4.47 billion, and Lamu at Kshs.2.97 billion.
2.3 Expenditure AnalysisThe total expenditure by County Governments was Kshs.376.43 billion representing an absorption rate of 77.9 per cent of the total annual County Governments Budgets. This was an increase from an absorption rate of 74 per cent reported attained in FY 2017/18 where total expenditure was Kshs.303.83 billion.
Recurrent expenditure was Kshs.269 billion, representing 90.4 per cent of the annual recurrent budget, and an increase from 87.3 per cent reported in FY 2017/18. Development expenditure amounted to Kshs.107.44 billion, representing an absorption rate of 57.8 per cent, and an improvement from 48.1 per cent attained in FY 2017/18 when total development expenditure was Kshs.66.89 billion. The analysis of expenditure by economic classification in FY 2018/19 is provided in Table 2.4.
Table2.4: ExpenditurebyEconomicClassification-FY2018/19
CountyPersonnel Emoluments
(Kshs.)Operations & Mainte-
nance (Kshs.)Development Expenditure
(Kshs.) Total Expenditure (Kshs.)
A B C D=A+B+C
Baringo 3,190,741,416 1,203,488,641 1,158,453,258 5,552,683,315
Bomet 2,623,682,974 2,197,979,360 2,062,222,096 6,883,884,430
Bungoma 4,416,591,562 2,809,822,580 2,344,534,589 9,570,948,730
Busia 2,766,782,649 1,940,808,960 1,941,069,347 6,648,660,955
Elgeyo/Marakwet 2,386,608,991 707,689,170 1,333,298,209 4,427,596,370
Embu 3,118,656,203 1,433,377,168 1,361,227,707 5,913,261,077
Garissa 4,457,773,195 2,157,456,657 2,375,450,323 8,990,680,175
Homa Bay 3,128,810,057 1,598,176,621 1,011,124,450 5,738,111,128
Isiolo 1,593,195,581 1,688,022,368 997,919,995 4,279,137,943
Kajiado 2,891,245,856 2,444,431,464 2,391,165,152 7,726,842,472
Kakamega 5,115,975,529 2,078,656,671 4,983,672,543 12,178,304,743
Kericho 2,691,540,024 2,023,236,810 1,417,092,688 6,131,869,521
Kiambu 6,782,284,756 2,982,733,872 4,495,230,979 14,260,249,607
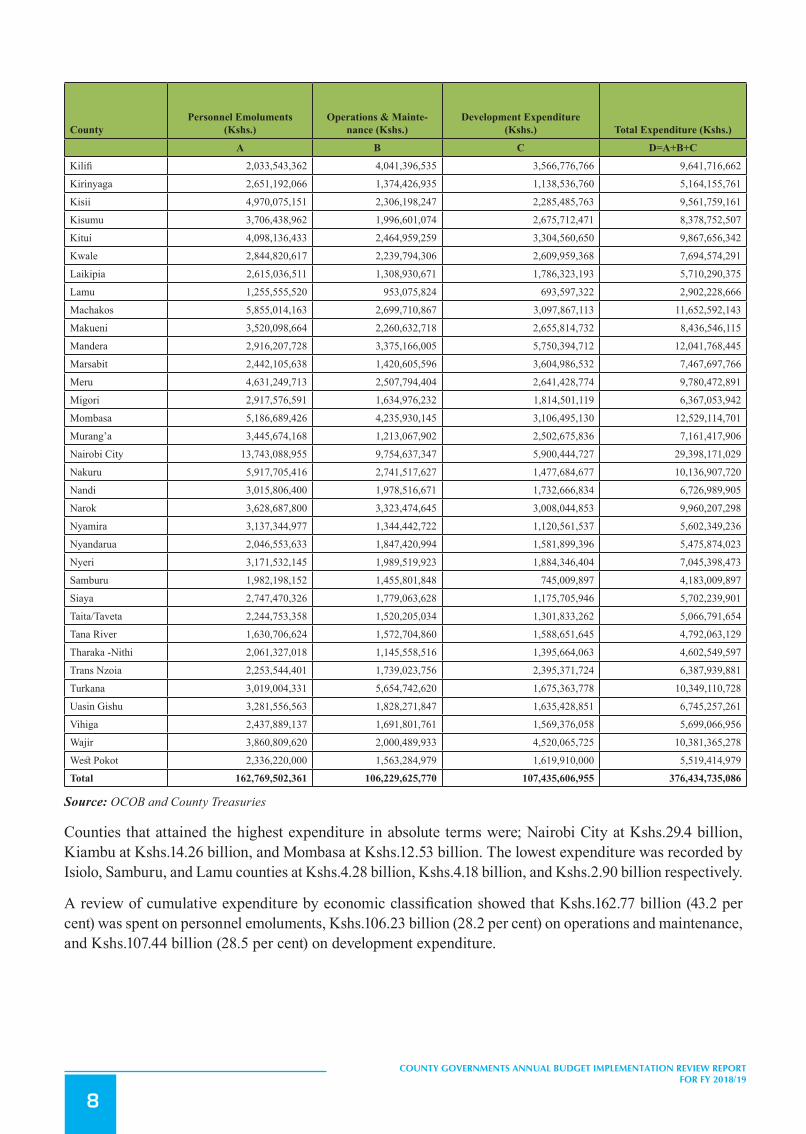
8
COUNTY GOVERNMENTS ANNUAL BUDGET IMPLEMENTATION REVIEW REPORT FOR FY 2018/19
CountyPersonnel Emoluments
(Kshs.)Operations & Mainte-
nance (Kshs.)Development Expenditure
(Kshs.) Total Expenditure (Kshs.)
A B C D=A+B+C
Kilifi 2,033,543,362 4,041,396,535 3,566,776,766 9,641,716,662
Kirinyaga 2,651,192,066 1,374,426,935 1,138,536,760 5,164,155,761
Kisii 4,970,075,151 2,306,198,247 2,285,485,763 9,561,759,161
Kisumu 3,706,438,962 1,996,601,074 2,675,712,471 8,378,752,507
Kitui 4,098,136,433 2,464,959,259 3,304,560,650 9,867,656,342
Kwale 2,844,820,617 2,239,794,306 2,609,959,368 7,694,574,291
Laikipia 2,615,036,511 1,308,930,671 1,786,323,193 5,710,290,375
Lamu 1,255,555,520 953,075,824 693,597,322 2,902,228,666
Machakos 5,855,014,163 2,699,710,867 3,097,867,113 11,652,592,143
Makueni 3,520,098,664 2,260,632,718 2,655,814,732 8,436,546,115
Mandera 2,916,207,728 3,375,166,005 5,750,394,712 12,041,768,445
Marsabit 2,442,105,638 1,420,605,596 3,604,986,532 7,467,697,766
Meru 4,631,249,713 2,507,794,404 2,641,428,774 9,780,472,891
Migori 2,917,576,591 1,634,976,232 1,814,501,119 6,367,053,942
Mombasa 5,186,689,426 4,235,930,145 3,106,495,130 12,529,114,701
Murang’a 3,445,674,168 1,213,067,902 2,502,675,836 7,161,417,906
Nairobi City 13,743,088,955 9,754,637,347 5,900,444,727 29,398,171,029
Nakuru 5,917,705,416 2,741,517,627 1,477,684,677 10,136,907,720
Nandi 3,015,806,400 1,978,516,671 1,732,666,834 6,726,989,905
Narok 3,628,687,800 3,323,474,645 3,008,044,853 9,960,207,298
Nyamira 3,137,344,977 1,344,442,722 1,120,561,537 5,602,349,236
Nyandarua 2,046,553,633 1,847,420,994 1,581,899,396 5,475,874,023
Nyeri 3,171,532,145 1,989,519,923 1,884,346,404 7,045,398,473
Samburu 1,982,198,152 1,455,801,848 745,009,897 4,183,009,897
Siaya 2,747,470,326 1,779,063,628 1,175,705,946 5,702,239,901
Taita/Taveta 2,244,753,358 1,520,205,034 1,301,833,262 5,066,791,654
Tana River 1,630,706,624 1,572,704,860 1,588,651,645 4,792,063,129
Tharaka -Nithi 2,061,327,018 1,145,558,516 1,395,664,063 4,602,549,597
Trans Nzoia 2,253,544,401 1,739,023,756 2,395,371,724 6,387,939,881
Turkana 3,019,004,331 5,654,742,620 1,675,363,778 10,349,110,728
Uasin Gishu 3,281,556,563 1,828,271,847 1,635,428,851 6,745,257,261
Vihiga 2,437,889,137 1,691,801,761 1,569,376,058 5,699,066,956
Wajir 3,860,809,620 2,000,489,933 4,520,065,725 10,381,365,278
West Pokot 2,336,220,000 1,563,284,979 1,619,910,000 5,519,414,979
Total 162,769,502,361 106,229,625,770 107,435,606,955 376,434,735,086
Source: OCOB and County Treasuries
Counties that attained the highest expenditure in absolute terms were; Nairobi City at Kshs.29.4 billion, Kiambu at Kshs.14.26 billion, and Mombasa at Kshs.12.53 billion. The lowest expenditure was recorded by Isiolo, Samburu, and Lamu counties at Kshs.4.28 billion, Kshs.4.18 billion, and Kshs.2.90 billion respectively.
A review of cumulative expenditure by economic classification showed that Kshs.162.77 billion (43.2 per cent) was spent on personnel emoluments, Kshs.106.23 billion (28.2 per cent) on operations and maintenance, and Kshs.107.44 billion (28.5 per cent) on development expenditure.

9
COUNTY GOVERNMENTS ANNUAL BUDGET IMPLEMENTATION REVIEW REPORT FOR FY 2018/19
2.3.1 Development ExpenditureThe County Governments spent Kshs.107.44 billion on development activities, representing an absorption rate of 57.8 per cent of the annual development budget, which is an improvement from 48.1 per cent, reported in FY 2017/18 when development expenditure was Kshs.66.89 billion. The Analysis of county budgets and expenditure in FY 2018/19 is provided in Table 2.5.
Table 2.5: County Budget Allocation, Expenditure and Absorption Rate for FY 2018/19County BudgetEstimates(Kshs.Million) Expenditure (Kshs. Million) Recurrent
Absorption Rate (%)
Development Absorption Rate (%)
Overall Absorption
RateRec Dev Total Rec Dev Total
A B C=A+B D E F=D+E G=D/A*100 H=E/B*100 I=F/C*100
Baringo 4,528.48 3,596.55 8,125.03 4,394.23 1,158.45 5,552.68 97.0 32.2 68.3
Bomet 5,186.16 2,947.82 8,133.98 4,821.66 2,062.22 6,883.88 93.0 70.0 84.6
Bungoma 8,571.21 4,194.11 12,765.31 7,226.41 2,344.53 9,570.95 84.3 55.9 75.0
Busia 5,152.32 3,674.16 8,826.48 4,707.59 1,941.07 6,648.66 91.4 52.8 75.3
Elgeyo/Mar-akwet 3,135.27 2,465.81 5,601.08 3,094.30 1,333.30 4,427.60 98.7 54.1 79.0
Embu 4,660.95 2,166.29 6,827.24 4,552.03 1,361.23 5,913.26 97.7 62.8 86.6
Garissa 6,528.52 4,193.71 10,722.24 6,615.23 2,375.45 8,990.68 101.3 56.6 83.9
Homa Bay 5,354.43 3,112.91 8,467.34 4,726.99 1,011.12 5,738.11 88.3 32.5 67.8
Isiolo 3,624.21 1,859.88 5,484.10 3,281.22 997.92 4,279.14 90.5 53.7 78.0
Kajiado 5,835.96 3,769.29 9,605.25 5,335.68 2,391.17 7,726.84 91.4 63.4 80.4
Kakamega 7,685.24 6,804.18 14,489.42 7,194.63 4,983.67 12,178.30 93.6 73.2 84.0
Kericho 4,773.71 3,644.26 8,417.97 4,714.78 1,417.09 6,131.87 98.8 38.9 72.8
Kiambu 10,949.23 5,965.12 16,914.35 9,765.02 4,495.23 14,260.25 89.2 75.4 84.3
Kilifi 8,711.84 5,770.64 14,482.48 6,074.94 3,566.78 9,641.72 69.7 61.8 66.6
Kirinyaga 4,093.31 1,818.15 5,911.46 4,025.62 1,138.54 5,164.16 98.3 62.6 87.4
Kisii 8,013.42 3,997.58 12,011.00 7,276.27 2,285.49 9,561.76 90.8 57.2 79.6
Kisumu 7,246.43 4,629.11 11,875.53 5,703.04 2,675.71 8,378.75 78.7 57.8 70.6
Kitui 7,059.91 4,628.76 11,688.67 6,563.10 3,304.56 9,867.66 93.0 71.4 84.4
Kwale 5,398.24 6,119.78 11,518.02 5,084.61 2,609.96 7,694.57 94.2 42.6 66.8
Laikipia 4,125.79 2,802.17 6,927.96 3,923.97 1,786.32 5,710.29 95.1 63.7 82.4
Lamu 2,562.14 2,284.60 4,846.74 2,208.63 693.60 2,902.23 86.2 30.4 59.9
Machakos 9,569.68 5,395.55 14,965.22 8,554.73 3,097.87 11,652.59 89.4 57.4 77.9
Makueni 6,234.36 4,417.36 10,651.72 5,780.73 2,655.81 8,436.55 92.7 60.1 79.2
Mandera 6,633.04 7,076.92 13,709.96 6,291.37 5,750.39 12,041.77 94.8 81.3 87.8
Marsabit 4,296.84 4,421.96 8,718.80 3,862.71 3,604.99 7,467.70 89.9 81.5 85.7
Meru 7,862.71 4,693.39 12,556.10 7,139.04 2,641.43 9,780.47 90.8 56.3 77.9
Migori 5,141.56 3,659.55 8,801.12 4,552.55 1,814.50 6,367.05 88.5 49.6 72.3
Mombasa 10,112.51 4,343.98 14,456.50 9,422.62 3,106.50 12,529.11 93.2 71.5 86.7
Murang’a 5,262.20 3,588.58 8,850.78 4,658.74 2,502.68 7,161.42 88.5 69.7 80.9
Nairobi City 25,662.42 7,405.82 33,068.25 23,497.73 5,900.44 29,398.17 91.6 79.7 88.9
Nakuru 10,467.35 8,011.58 18,478.94 8,659.22 1,477.68 10,136.91 82.7 18.4 54.9
Nandi 5,206.59 3,220.26 8,426.86 4,994.32 1,732.67 6,726.99 95.9 53.8 79.8
Narok 7,041.48 3,153.37 10,194.86 6,952.16 3,008.04 9,960.21 98.7 95.4 97.7
Nyamira 4,828.60 2,130.48 6,959.07 4,481.79 1,120.56 5,602.35 92.8 52.6 80.5
Nyandarua 4,502.83 3,166.70 7,669.54 3,893.97 1,581.90 5,475.87 86.5 50.0 71.4
Nyeri 5,975.85 2,860.69 8,836.54 5,161.05 1,884.35 7,045.40 86.4 65.9 79.7
Samburu 3,856.21 2,004.91 5,861.12 3,438.00 745.01 4,183.01 89.2 37.2 71.4

10
COUNTY GOVERNMENTS ANNUAL BUDGET IMPLEMENTATION REVIEW REPORT FOR FY 2018/19
County BudgetEstimates(Kshs.Million) Expenditure (Kshs. Million) Recurrent Absorption Rate (%)
Development Absorption Rate (%)
Overall Absorption
RateRec Dev Total Rec Dev Total
A B C=A+B D E F=D+E G=D/A*100 H=E/B*100 I=F/C*100
Siaya 4,712.63 3,730.96 8,443.59 4,526.53 1,175.71 5,702.24 96.1 31.5 67.5
Taita/Taveta 3,955.76 2,031.69 5,987.45 3,764.96 1,301.83 5,066.79 95.2 64.1 84.6
Tana River 4,637.30 2,936.06 7,573.36 3,203.41 1,588.65 4,792.06 69.1 54.1 63.3
T h a r a k a -Nithi 3,542.94 2,178.06 5,721.00 3,206.89 1,395.66 4,602.55 90.5 64.1 80.5
Trans Nzoia 4,867.14 3,175.42 8,042.56 3,992.57 2,395.37 6,387.94 82.0 75.4 79.4
Turkana 9,600.34 5,751.96 15,352.30 8,673.75 1,675.36 10,349.11 90.3 29.1 67.4
Uasin Gishu 5,469.52 4,488.54 9,958.06 5,109.83 1,635.43 6,745.26 93.4 36.4 67.7
Vihiga 4,517.44 2,485.13 7,002.57 4,129.69 1,569.38 5,699.07 91.4 63.2 81.4
Wajir 6,417.51 6,758.18 13,175.69 5,861.30 4,520.07 10,381.37 91.3 66.9 78.8
West Pokot 4,139.23 2,230.28 6,369.51 3,899.50 1,619.91 5,519.41 94.2 72.6 86.7
Total 297,710.85 185,762.26 483,473.12 268,999.13 107,435.61 376,434.74 90.4 57.8 77.9
Source: OCOB and County Treasuries
Analysis of development expenditure as a proportion of approved annual development budget shows that Narok, Marsabit, and Mandera Counties attained the highest absorption rate at 95.4 per cent, 81.5 per cent, and 81.3 per cent respectively. Lamu County, Turkana County, and Nakuru County reported the lowest absorption rate of their development budget at 30.4 per cent, 29.1 per cent, and 18.4 per cent respectively. Detailed analysis of development projects undertaken by counties is provided in chapter three.
2.3.2 Recurrent ExpenditureThe Counties spent an aggregate of Kshs.269 billion or 71.5 per cent of the total expenditure on recurrent activities. This expenditure represents 90.4 per cent of the annual County Government’s budget for recurrent activities, and an improvement from 87.3 per cent recorded in FY 2017/18 when expenditure stood at Kshs.236.94 billion.
Analysis of expenditure in absolute terms shows that Nairobi City County attained the highest expenditure on recurrent activities at Kshs.23.5 billion, followed by Kiambu and Mombasa Counties at Kshs.9.77 billion and Kshs.9.42 billion respectively. Counties with the lowest expenditure on recurrent activities included Tana River at Kshs.3.20 billion, Elgeyo at Kshs.3.09 billion, and Lamu at Kshs.2.21 billion.
2.3.2.1 Personnel EmolumentsIn the period July, 2018 to June, 2019, County Governments spent Kshs.162.77 billion on personnel emoluments, representing 60.5 per cent of the total recurrent expenditure and 43.2 per cent of total expenditure. This expenditure was an increase from Kshs.151.09 billion spent in FY 2017/18 when personnel expenditure translated to 49.7 per cent of the total expenditure.
Analysis of personnel emoluments as a percentage of total expenditure by county shows that Nakuru, Baringo, Nyamira and Homa Bay recorded the highest percentage at 58.4 per cent, 57.5 per cent, 56 per cent and 54.5 per cent respectively. Turkana, Mandera, and Kilifi reported the least proportions at 29.2 per cent, 24.2 per cent and 21.1 per cent respectively.
2.3.2.2 Operations and Maintenance ExpenditureA total of Kshs.106.23 billion was spent on operations and maintenance (O&M) during the reporting period, which translated to 28.2 per cent of the total expenditure. Counties that reported the highest expenditure on
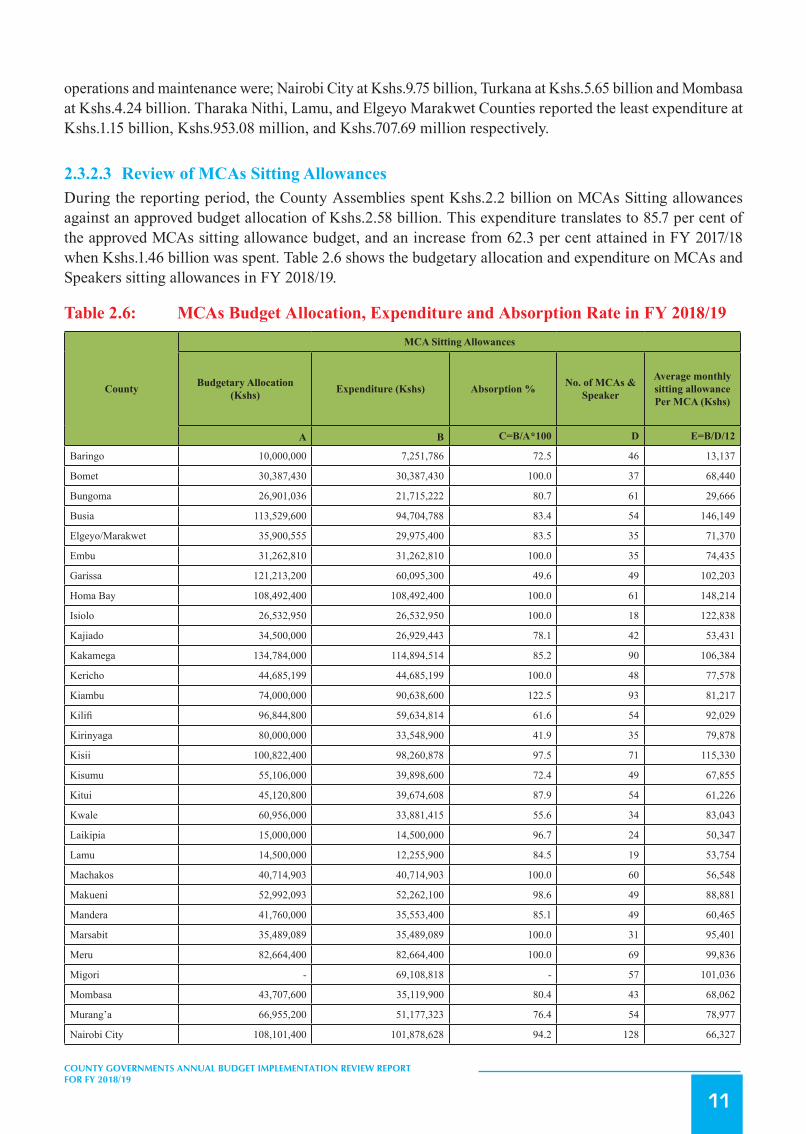
11
COUNTY GOVERNMENTS ANNUAL BUDGET IMPLEMENTATION REVIEW REPORT FOR FY 2018/19
operations and maintenance were; Nairobi City at Kshs.9.75 billion, Turkana at Kshs.5.65 billion and Mombasa at Kshs.4.24 billion. Tharaka Nithi, Lamu, and Elgeyo Marakwet Counties reported the least expenditure at Kshs.1.15 billion, Kshs.953.08 million, and Kshs.707.69 million respectively.
2.3.2.3 Review of MCAs Sitting AllowancesDuring the reporting period, the County Assemblies spent Kshs.2.2 billion on MCAs Sitting allowances against an approved budget allocation of Kshs.2.58 billion. This expenditure translates to 85.7 per cent of the approved MCAs sitting allowance budget, and an increase from 62.3 per cent attained in FY 2017/18 when Kshs.1.46 billion was spent. Table 2.6 shows the budgetary allocation and expenditure on MCAs and Speakers sitting allowances in FY 2018/19.
Table 2.6: MCAs Budget Allocation, Expenditure and Absorption Rate in FY 2018/19
County
MCA Sitting Allowances
Budgetary Allocation (Kshs) Expenditure (Kshs) Absorption % No. of MCAs &
Speaker
Average monthly sitting allowance Per MCA (Kshs)
A B C=B/A*100 D E=B/D/12
Baringo 10,000,000 7,251,786 72.5 46 13,137
Bomet 30,387,430 30,387,430 100.0 37 68,440
Bungoma 26,901,036 21,715,222 80.7 61 29,666
Busia 113,529,600 94,704,788 83.4 54 146,149
Elgeyo/Marakwet 35,900,555 29,975,400 83.5 35 71,370
Embu 31,262,810 31,262,810 100.0 35 74,435
Garissa 121,213,200 60,095,300 49.6 49 102,203
Homa Bay 108,492,400 108,492,400 100.0 61 148,214
Isiolo 26,532,950 26,532,950 100.0 18 122,838
Kajiado 34,500,000 26,929,443 78.1 42 53,431
Kakamega 134,784,000 114,894,514 85.2 90 106,384
Kericho 44,685,199 44,685,199 100.0 48 77,578
Kiambu 74,000,000 90,638,600 122.5 93 81,217
Kilifi 96,844,800 59,634,814 61.6 54 92,029
Kirinyaga 80,000,000 33,548,900 41.9 35 79,878
Kisii 100,822,400 98,260,878 97.5 71 115,330
Kisumu 55,106,000 39,898,600 72.4 49 67,855
Kitui 45,120,800 39,674,608 87.9 54 61,226
Kwale 60,956,000 33,881,415 55.6 34 83,043
Laikipia 15,000,000 14,500,000 96.7 24 50,347
Lamu 14,500,000 12,255,900 84.5 19 53,754
Machakos 40,714,903 40,714,903 100.0 60 56,548
Makueni 52,992,093 52,262,100 98.6 49 88,881
Mandera 41,760,000 35,553,400 85.1 49 60,465
Marsabit 35,489,089 35,489,089 100.0 31 95,401
Meru 82,664,400 82,664,400 100.0 69 99,836
Migori - 69,108,818 - 57 101,036
Mombasa 43,707,600 35,119,900 80.4 43 68,062
Murang’a 66,955,200 51,177,323 76.4 54 78,977
Nairobi City 108,101,400 101,878,628 94.2 128 66,327

12
COUNTY GOVERNMENTS ANNUAL BUDGET IMPLEMENTATION REVIEW REPORT FOR FY 2018/19
County
MCA Sitting Allowances
Budgetary Allocation (Kshs) Expenditure (Kshs) Absorption % No. of MCAs &
Speaker
Average monthly sitting allowance Per MCA (Kshs)
A B C=B/A*100 D E=B/D/12
Nakuru 106,800,000 106,800,000 100.0 79 112,658
Nandi 38,103,996 35,974,900 94.4 40 74,948
Narok 63,813,760 63,741,814 99.9 48 110,663
Nyamira 66,643,200 66,643,200 100.0 37 150,097
Nyandarua 43,757,188 43,757,144 100.0 40 91,161
Nyeri 79,164,800 39,761,800 50.2 45 73,633
Samburu 29,019,944 29,019,944 100.0 28 86,369
Siaya 48,693,500 48,707,800 100.0 43 94,395
Taita/Taveta 23,948,000 20,653,000 86.2 34 50,620
Tana River 39,951,600 39,947,281 100.0 24 138,706
Tharaka –Nithi 28,370,000 20,171,654 71.1 21 80,046
Trans Nzoia 69,297,600 31,486,500 45.4 40 65,597
Turkana 81,764,000 23,448,900 28.7 48 40,710
Uasin Gishu 40,509,389 40,509,389 100.0 48 70,329
Vihiga 44,678,400 38,138,550 85.4 39 81,493
Wajir 23,751,000 23,524,693 99.0 46 42,617
West Pokot 21,156,314 17,850,560 84.4 34 43,751
Total 2,582,346,557 2,213,326,648 85.7 2,243 82,231
Source: OCOB and County Treasuries
Four County Assemblies reported higher expenditure on sitting allowance than Salaries and Remuneration Commission (SRC) recommended monthly ceiling of Kshs.124, 800. These were; were: Busia at Kshs.146,149, Homa Bay at Kshs.148,214, Nyamira at Kshs.150,097, and Tana River at Kshs.138,706. Migori County Assembly reported an expenditure of Kshs.69.11 million without a budget allocation for MCAs sitting allowance in the Approved Budget.
2.3.2.4 ReviewofExpenditureonDomesticandForeignTravelsThe County Governments incurred Kshs.11.36 billion on domestic and foreign travel during the reporting period. This amount comprised of Kshs.9.86 billion on domestic travel and Kshs.1.5 billion on foreign travel and was a decrease of 6.5 per cent compared to Kshs.12.15 billion incurred in FY 2016/17.
The expenditure on domestic and foreign travels by both the County Assembly and the County Executive in FY2017/18 is presented in Table 2.7.

13
COUNTY GOVERNMENTS ANNUAL BUDGET IMPLEMENTATION REVIEW REPORT FOR FY 2018/19
Table 2.7: Expenditure on Domestic and Foreign Travels by the County Assembly and the County Executive in FY 2018/19 (Kshs.Million)
County Assembly County Executive Total Expenditure
DomesticExp.
Foreign Exp. Total Domestic
Exp.Foreign
Exp. Total DomesticExp.
Foreign Exp. Total
County
A B C=B+A D E F=D+E G=A+D H=B+E I=G+H
Baringo 80.37 27.25 107.63 46.39 29.22 75.61 126.76 56.48 183.24
Bomet 97.98 30.08 128.06 132.07 52.44 184.51 230.05 82.52 312.56
Bungoma 19.78 3.16 22.94 333.57 24.77 358.35 353.35 27.93 381.28
Busia 63.20 14.97 78.17 78.27 31.27 109.53 141.47 46.24 187.71
Elgeyo/Marak-wet 67.80 14.92 82.72 25.22 2.71 27.93 93.02 17.63 110.65
Embu 156.52 - 156.52 139.35 3.77 143.12 295.87 3.77 299.64
Garissa 112.04 - 112.04 308.09 8.41 316.50 420.13 8.41 428.54
Homa Bay 143.20 - 143.20 217.82 - 217.82 361.02 - 361.02
Isiolo 65.40 3.74 69.14 106.57 23.41 129.98 171.97 27.14 199.12
Kajiado 153.31 42.64 195.95 294.23 70.92 365.15 447.54 113.56 561.10
Kakamega 163.69 15.36 179.04 201.83 22.86 224.70 365.52 38.22 403.74
Kericho 127.44 25.36 152.80 116.35 43.93 160.28 243.79 69.29 313.08
Kiambu 221.05 115.19 336.24 174.52 77.61 252.13 395.57 192.80 588.37
Kilifi 187.91 31.42 219.33 167.34 50.27 217.61 355.25 81.69 436.94
Kirinyaga 76.00 28.00 104.00 46.13 17.08 63.21 122.13 45.08 167.21
Kisii 102.53 33.33 135.86 404.39 57.48 461.87 506.92 90.81 597.73
Kisumu 131.81 32.18 163.99 87.81 13.74 101.55 219.62 45.92 265.54
Kitui 106.21 61.99 168.20 297.85 10.46 308.32 404.06 72.45 476.51
Kwale 97.54 20.80 118.34 316.37 42.93 359.30 413.91 63.74 477.65
Laikipia 65.10 7.98 73.08 122.95 - 122.95 188.05 7.98 196.03
Lamu 63.87 32.15 96.02 118.83 5.13 123.96 182.70 37.28 219.98
Machakos 269.57 57.54 327.11 280.49 35.33 315.82 550.06 92.87 642.93
Makueni 92.49 11.21 103.70 106.60 21.04 127.64 199.09 32.25 231.34
Mandera 82.24 24.71 106.95 103.45 21.50 124.95 185.69 46.21 231.90
Marsabit 88.26 19.51 107.77 115.26 21.10 136.36 203.52 40.61 244.13
Meru 190.53 69.48 260.01 63.41 4.96 68.37 253.94 74.44 328.37
Migori 96.99 22.45 119.44 430.71 12.56 443.26 527.70 35.01 562.71
Mombasa 0.11 6.08 6.19 333.32 217.67 550.99 333.43 223.75 557.18
Murang’a 150.43 19.74 170.17 117.02 4.86 121.88 267.45 24.61 292.06
Nairobi City 55.28 40.32 95.60 414.46 131.05 545.51 469.73 171.38 641.11
Nakuru 125.11 42.60 167.72 157.94 51.90 209.84 283.06 94.50 377.56
Nandi 41.61 28.05 69.66 135.01 27.78 162.80 176.62 55.83 232.45
Narok 246.43 10.45 256.88 164.33 57.36 221.69 410.76 67.81 478.57
Nyamira 114.55 33.06 147.61 215.83 27.93 243.75 330.38 60.98 391.37
Nyandarua 75.20 22.30 97.51 176.91 17.68 194.59 252.11 39.99 292.10
Nyeri 160.70 52.91 213.60 111.11 7.73 118.84 271.81 60.63 332.44
Samburu 53.50 18.94 72.44 40.80 3.69 44.49 94.30 22.63 116.93
Siaya 122.36 9.90 132.26 190.14 43.44 233.58 312.50 53.34 365.84
Taita/Taveta 134.63 54.14 188.77 240.13 41.34 281.47 374.75 95.48 470.24
Tana River 21.31 28.39 49.71 141.60 62.55 204.15 162.91 90.94 253.85
Tharaka-Nithi 80.44 17.05 97.49 86.38 13.24 99.62 166.82 30.29 197.11
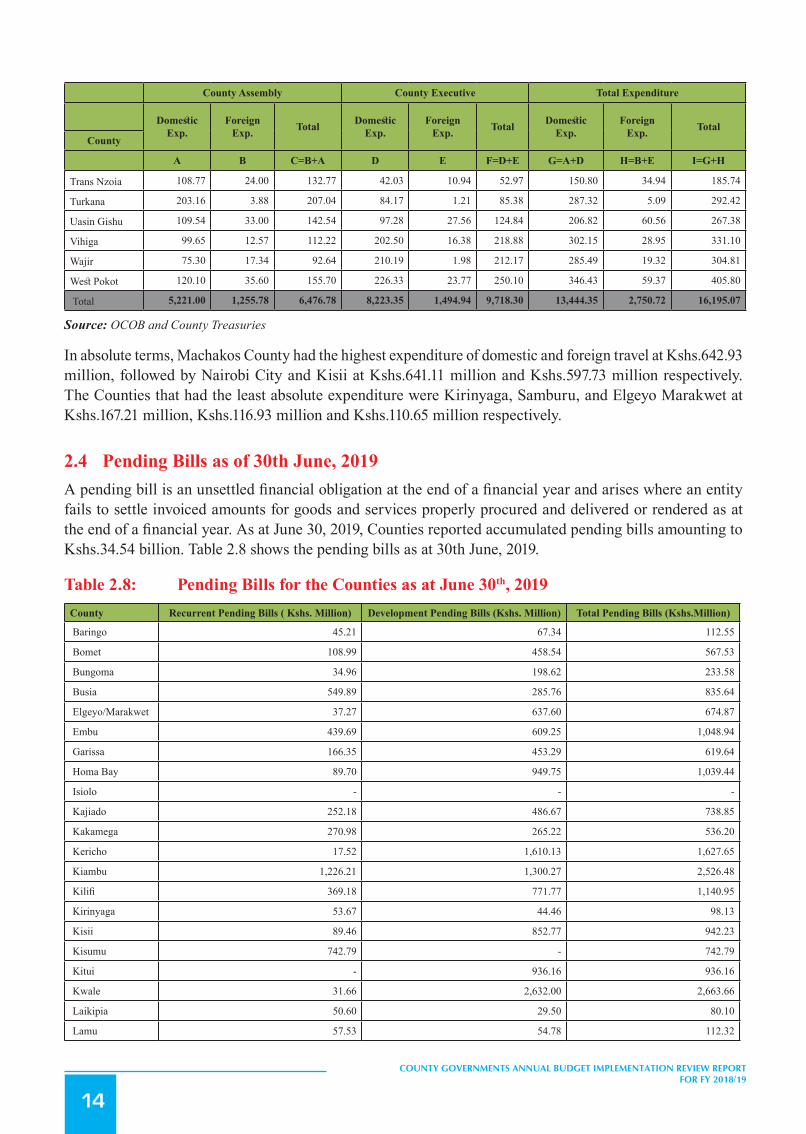
14
COUNTY GOVERNMENTS ANNUAL BUDGET IMPLEMENTATION REVIEW REPORT FOR FY 2018/19
County Assembly County Executive Total Expenditure
DomesticExp.
Foreign Exp. Total Domestic
Exp.Foreign
Exp. Total DomesticExp.
Foreign Exp. Total
County
A B C=B+A D E F=D+E G=A+D H=B+E I=G+H
Trans Nzoia 108.77 24.00 132.77 42.03 10.94 52.97 150.80 34.94 185.74
Turkana 203.16 3.88 207.04 84.17 1.21 85.38 287.32 5.09 292.42
Uasin Gishu 109.54 33.00 142.54 97.28 27.56 124.84 206.82 60.56 267.38
Vihiga 99.65 12.57 112.22 202.50 16.38 218.88 302.15 28.95 331.10
Wajir 75.30 17.34 92.64 210.19 1.98 212.17 285.49 19.32 304.81
West Pokot 120.10 35.60 155.70 226.33 23.77 250.10 346.43 59.37 405.80
Total 5,221.00 1,255.78 6,476.78 8,223.35 1,494.94 9,718.30 13,444.35 2,750.72 16,195.07
Source: OCOB and County Treasuries
In absolute terms, Machakos County had the highest expenditure of domestic and foreign travel at Kshs.642.93 million, followed by Nairobi City and Kisii at Kshs.641.11 million and Kshs.597.73 million respectively. The Counties that had the least absolute expenditure were Kirinyaga, Samburu, and Elgeyo Marakwet at Kshs.167.21 million, Kshs.116.93 million and Kshs.110.65 million respectively.
2.4 Pending Bills as of 30th June, 2019A pending bill is an unsettled financial obligation at the end of a financial year and arises where an entity fails to settle invoiced amounts for goods and services properly procured and delivered or rendered as at the end of a financial year. As at June 30, 2019, Counties reported accumulated pending bills amounting to Kshs.34.54 billion. Table 2.8 shows the pending bills as at 30th June, 2019.
Table 2.8: Pending Bills for the Counties as at June 30th, 2019County Recurrent Pending Bills ( Kshs. Million) Development Pending Bills (Kshs. Million) Total Pending Bills (Kshs.Million)
Baringo 45.21 67.34 112.55
Bomet 108.99 458.54 567.53
Bungoma 34.96 198.62 233.58
Busia 549.89 285.76 835.64
Elgeyo/Marakwet 37.27 637.60 674.87
Embu 439.69 609.25 1,048.94
Garissa 166.35 453.29 619.64
Homa Bay 89.70 949.75 1,039.44
Isiolo - - -
Kajiado 252.18 486.67 738.85
Kakamega 270.98 265.22 536.20
Kericho 17.52 1,610.13 1,627.65
Kiambu 1,226.21 1,300.27 2,526.48
Kilifi 369.18 771.77 1,140.95
Kirinyaga 53.67 44.46 98.13
Kisii 89.46 852.77 942.23
Kisumu 742.79 - 742.79
Kitui - 936.16 936.16
Kwale 31.66 2,632.00 2,663.66
Laikipia 50.60 29.50 80.10
Lamu 57.53 54.78 112.32

15
COUNTY GOVERNMENTS ANNUAL BUDGET IMPLEMENTATION REVIEW REPORT FOR FY 2018/19
County Recurrent Pending Bills ( Kshs. Million) Development Pending Bills (Kshs. Million) Total Pending Bills (Kshs.Million)
Machakos 73.44 486.15 559.59
Makueni 1.47 6.99 8.46
Mandera - - -
Marsabit - - -
Meru 276.81 966.55 1,243.36
Migori 596.94 392.04 988.99
Mombasa 3,261.38 762.77 4,024.14
Murang’a 39.52 317.80 357.32
Nairobi City - - -
Nakuru 42.00 52.47 94.47
Nandi 12.95 1,757.39 1,770.34
Narok 316.94 867.11 1,184.05
Nyamira 1.52 1.54 3.06
Nyandarua 93.12 718.07 811.20
Nyeri 39.51 22.18 61.69
Samburu - 134.91 134.91
Siaya 258.26 187.42 445.67
Taita/Taveta - 199.41 199.41
Tana River 490.51 891.60 1,382.11
Tharaka –Nithi 189.61 143.60 333.21
Trans Nzoia 421.71 317.51 739.22
Turkana 345.07 1,889.36 2,234.43
Uasin Gishu 229.78 51.73 281.51
Vihiga 113.51 61.25 174.76
Wajir 188.45 40.00 228.45
West Pokot - - -
Total 11,626.34 22,911.73 34,538.06
Source: County Treasuries
Five Counties namely: Isiolo, Mandera, Marsabit, Nairobi City, and West Pokot had not submitted the status of pending bills as the time of finalizing this report. Counties that reported the highest amount of pending bills were: Mombasa at Kshs.4.02 billion, Kwale at Kshs.2.66 billion, and Kiambu at Kshs.2.53 billion. The pending bill reported by Taita Taveta County was not disaggregated into recurrent and development expenditure.
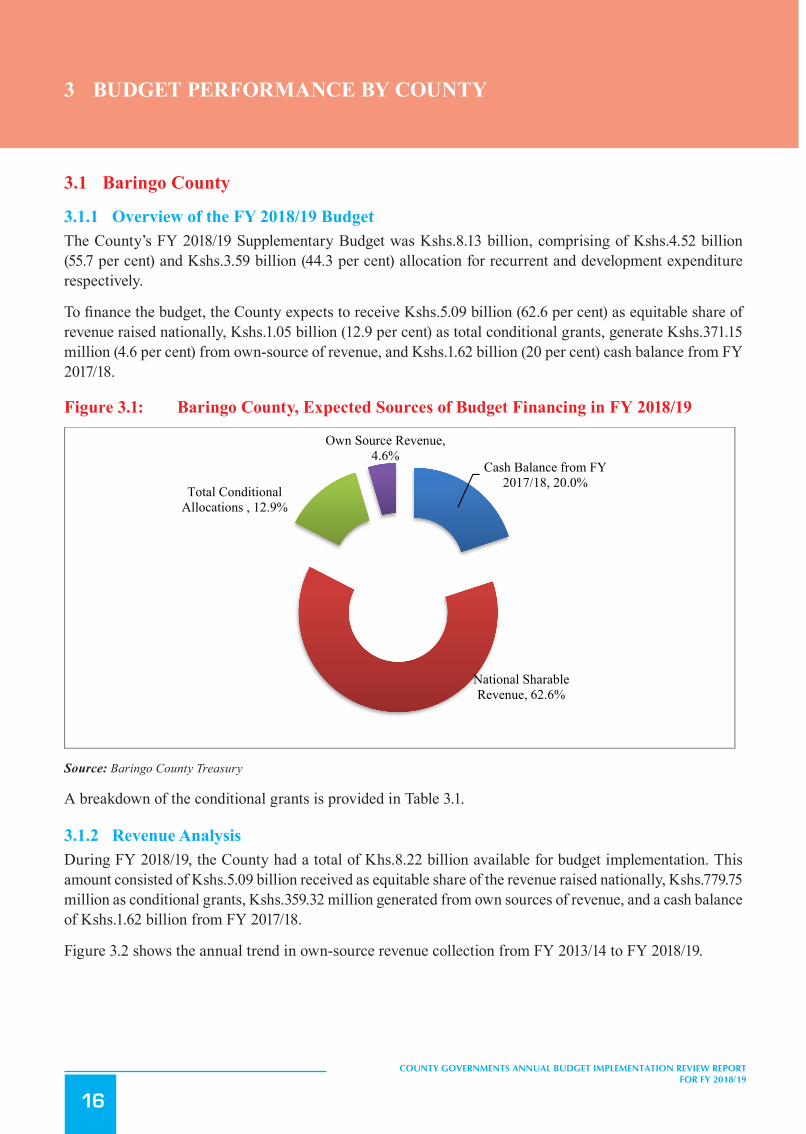
16
COUNTY GOVERNMENTS ANNUAL BUDGET IMPLEMENTATION REVIEW REPORT FOR FY 2018/19
3 BUDGET PERFORMANCE BY COUNTY
3.1 Baringo County
3.1.1 Overview of the FY 2018/19 BudgetThe County’s FY 2018/19 Supplementary Budget was Kshs.8.13 billion, comprising of Kshs.4.52 billion (55.7 per cent) and Kshs.3.59 billion (44.3 per cent) allocation for recurrent and development expenditure respectively.
To finance the budget, the County expects to receive Kshs.5.09 billion (62.6 per cent) as equitable share of revenue raised nationally, Kshs.1.05 billion (12.9 per cent) as total conditional grants, generate Kshs.371.15 million (4.6 per cent) from own-source of revenue, and Kshs.1.62 billion (20 per cent) cash balance from FY 2017/18.
Figure 3.1: Baringo County, Expected Sources of Budget Financing in FY 2018/19
50
3 BUDGET PERFORMANCE BY COUNTY
3.1 Baringo County
3.1.1 Overview of the FY 2018/19 Budget The County’s FY 2018/19 Supplementary Budget was Kshs.8.13 billion, comprising of Kshs.4.52 billion (55.7 per cent) and
Kshs.3.59 billion (44.3 per cent) allocation for recurrent and development expenditure respectively.
To finance the budget, the County expects to receive Kshs.5.09 billion (62.6 per cent) as equitable share of revenue raised
nationally, Kshs.1.05 billion (12.9 per cent) as total conditional grants, generate Kshs.371.15 million (4.6 per cent) from
own-source of revenue, and Kshs.1.62 billion (20 per cent) cash balance from FY 2017/18.
Figure 3.1: Baringo County, Expected Sources of Budget Financing in FY 2018/19
Source: Baringo County Treasury
A breakdown of the conditional grants is provided in Table 3.1.
3.1.2 Revenue Analysis During FY 2018/19, the County had a total of Khs.8.22 billion available for budget implementation. This amount consisted
of Kshs.5.09 billion received as equitable share of the revenue raised nationally, Kshs.779.75 million as conditional grants,
Kshs.359.32 million generated from own sources of revenue, and a cash balance of Kshs.1.62 billion from FY 2017/18.
Figure 3.2 shows the annual trend in own-source revenue collection from FY 2013/14 to FY 2018/19.
Figure 3.2: Baringo County, Own Source Revenue Collection for FY 2013/14 to FY 2018/19
Cash Balance from FY 2017/18, 20.0%
National Sharable Revenue, 62.6%
Total Conditional Allocations , 12.9%
Own Source Revenue, 4.6%
Source: Baringo County Treasury
A breakdown of the conditional grants is provided in Table 3.1.
3.1.2 Revenue AnalysisDuring FY 2018/19, the County had a total of Khs.8.22 billion available for budget implementation. This amount consisted of Kshs.5.09 billion received as equitable share of the revenue raised nationally, Kshs.779.75 million as conditional grants, Kshs.359.32 million generated from own sources of revenue, and a cash balance of Kshs.1.62 billion from FY 2017/18.
Figure 3.2 shows the annual trend in own-source revenue collection from FY 2013/14 to FY 2018/19.

17
COUNTY GOVERNMENTS ANNUAL BUDGET IMPLEMENTATION REVIEW REPORT FOR FY 2018/19
Figure 3.2: Baringo County, Own Source Revenue Collection for FY 2013/14 to FY 2018/19
51
Source: Baringo County Treasury
The County generated a total of Kshs.359.32 million from own revenue sources in FY 2018/19. This amount represented an
increase of Kshs.57.92 million compared to that realised in FY 2017/18 and was 96.8 per cent of the annual target.
3.1.3 Conditional Grants During the reporting period, the County received Kshs.779.75 million as conditional grants as shown in Table 3.1.
Table 3.1: Baringo County, Conditional Grants/Loans Received in the FY 2018/19
S/No Grant Details
Annual Allocation-(CARA
, 2018) (Kshs)
Annual Budget Allocation
(Kshs)
Receipts in FY 2018/19 (Kshs)
Receipts as Percentage of
Annual Budget Allocation
(%)
1 Compensation for User Fee Foregone 13,191,000 13,191,000 13,191,000 100 2 Leasing of Medical Equipment 200,000,000 200,000,000 - -
3 Road Maintenance Fuel Levy 133,931,014 133,931,014 133,931,014 100
4 Rehabilitation of Village Polytechnics 35,605,000 35,605,000 - -
5 Transforming Health Systems for Universal Care Project (WB) 78,899,347 78,899,347 34,008,071 43.1
6 Kenya Devolution Support Project (KDSP) "Level III grant" - - 138,074,112 -
7 Kenya Climate Smart Agriculture Project (KCSAP) 117,000,000 117,000,000 49,627,345 42.4
8 Kenya Devolution Support Project (KDSP) "Level 1 grant" 43,729,455 43,729,455 - -
9 Kenya Urban Support Programme 52,360,500 52,360,500 52,360,500 100
201.52
249.72
279.32 288.52301.40
359.32
0
50
100
150
200
250
300
350
400
FY 2013/14 FY 2014/15 FY 2015/16 FY 2016/17 FY 2017/18 FY 2018/19
Ksh
s. M
illio
ns
Trend in Own Source Revenue
Source: Baringo County Treasury
The County generated a total of Kshs.359.32 million from own revenue sources in FY 2018/19. This amount represented an increase of Kshs.57.92 million compared to that realised in FY 2017/18 and was 96.8 per cent of the annual target.
3.1.3 Conditional GrantsDuring the reporting period, the County received Kshs.779.75 million as conditional grants as shown in Table 3.1.
Table 3.1: Baringo County, Conditional Grants/Loans Received in the FY 2018/19
S/No Grant DetailsAnnual Allo-
cation-(CARA, 2018)(Kshs)
Annual Budget Allocation (Kshs)
Receipts in FY 2018/19 (Kshs)
Receipts as Percent-age of Annual Budget
Allocation (%)
1 Compensation for User Fee Foregone 13,191,000 13,191,000 13,191,000 100
2 Leasing of Medical Equipment 200,000,000 200,000,000 - -
3 Road Maintenance Fuel Levy 133,931,014 133,931,014 133,931,014 100
4 Rehabilitation of Village Polytechnics 35,605,000 35,605,000 - -
5 Transforming Health Systems for Universal Care Project (WB) 78,899,347 78,899,347 34,008,071 43.1
6 Kenya Devolution Support Project (KDSP) “Level III grant” - - 138,074,112 -
7 Kenya Climate Smart Agriculture Project (KCSAP) 117,000,000 117,000,000 49,627,345 42.4
8 Kenya Devolution Support Project (KDSP) “Level 1 grant” 43,729,455 43,729,455 - -
9 Kenya Urban Support Programme 52,360,500 52,360,500 52,360,500 100
10 DANIDA Grant 16,706,250 16,706,250 16,706,250 100
11 EU Grant for instrument for Devolution Advice and support 85,000,000 85,000,000 73,254,422 86.2
12 Kenya Devolution Support Project (KDSP) “Level II grant” - 173,023,342 173,023,342 100
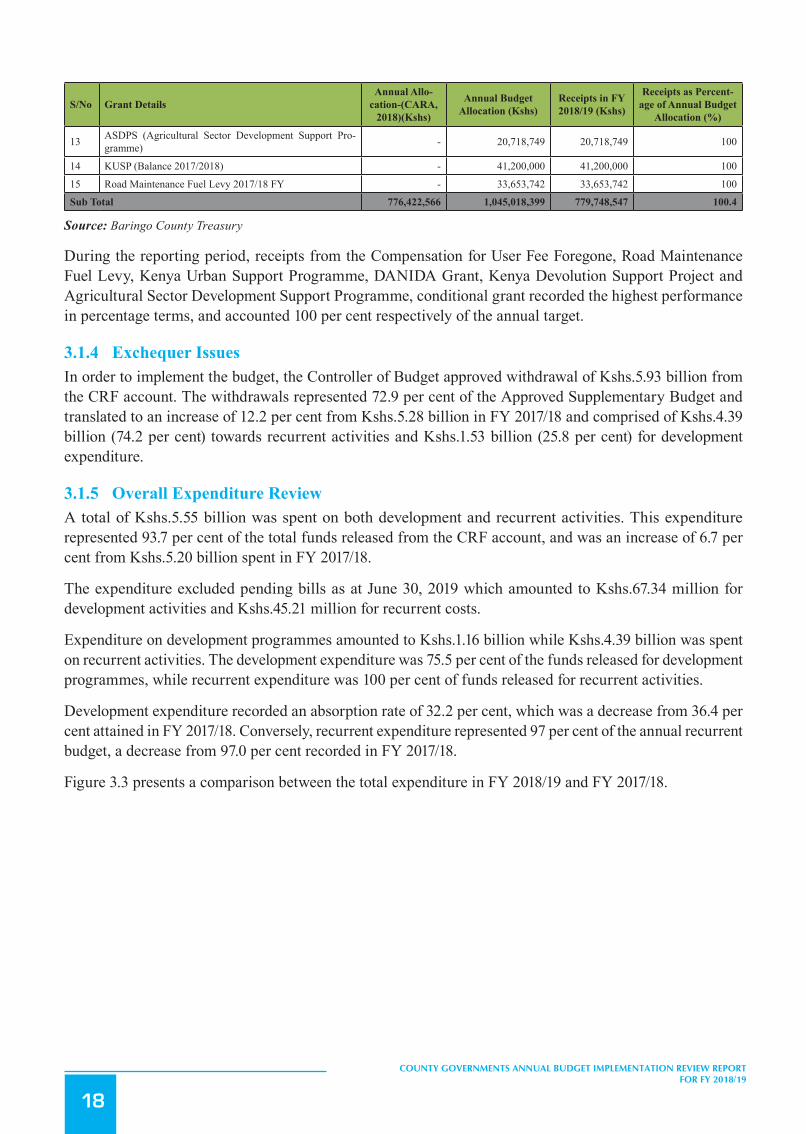
18
COUNTY GOVERNMENTS ANNUAL BUDGET IMPLEMENTATION REVIEW REPORT FOR FY 2018/19
S/No Grant DetailsAnnual Allo-
cation-(CARA, 2018)(Kshs)
Annual Budget Allocation (Kshs)
Receipts in FY 2018/19 (Kshs)
Receipts as Percent-age of Annual Budget
Allocation (%)
13 ASDPS (Agricultural Sector Development Support Pro-gramme) - 20,718,749 20,718,749 100
14 KUSP (Balance 2017/2018) - 41,200,000 41,200,000 100
15 Road Maintenance Fuel Levy 2017/18 FY - 33,653,742 33,653,742 100
Sub Total 776,422,566 1,045,018,399 779,748,547 100.4
Source: Baringo County Treasury
During the reporting period, receipts from the Compensation for User Fee Foregone, Road Maintenance Fuel Levy, Kenya Urban Support Programme, DANIDA Grant, Kenya Devolution Support Project and Agricultural Sector Development Support Programme, conditional grant recorded the highest performance in percentage terms, and accounted 100 per cent respectively of the annual target.
3.1.4 Exchequer IssuesIn order to implement the budget, the Controller of Budget approved withdrawal of Kshs.5.93 billion from the CRF account. The withdrawals represented 72.9 per cent of the Approved Supplementary Budget and translated to an increase of 12.2 per cent from Kshs.5.28 billion in FY 2017/18 and comprised of Kshs.4.39 billion (74.2 per cent) towards recurrent activities and Kshs.1.53 billion (25.8 per cent) for development expenditure.
3.1.5 Overall Expenditure ReviewA total of Kshs.5.55 billion was spent on both development and recurrent activities. This expenditure represented 93.7 per cent of the total funds released from the CRF account, and was an increase of 6.7 per cent from Kshs.5.20 billion spent in FY 2017/18.
The expenditure excluded pending bills as at June 30, 2019 which amounted to Kshs.67.34 million for development activities and Kshs.45.21 million for recurrent costs.
Expenditure on development programmes amounted to Kshs.1.16 billion while Kshs.4.39 billion was spent on recurrent activities. The development expenditure was 75.5 per cent of the funds released for development programmes, while recurrent expenditure was 100 per cent of funds released for recurrent activities.
Development expenditure recorded an absorption rate of 32.2 per cent, which was a decrease from 36.4 per cent attained in FY 2017/18. Conversely, recurrent expenditure represented 97 per cent of the annual recurrent budget, a decrease from 97.0 per cent recorded in FY 2017/18.
Figure 3.3 presents a comparison between the total expenditure in FY 2018/19 and FY 2017/18.
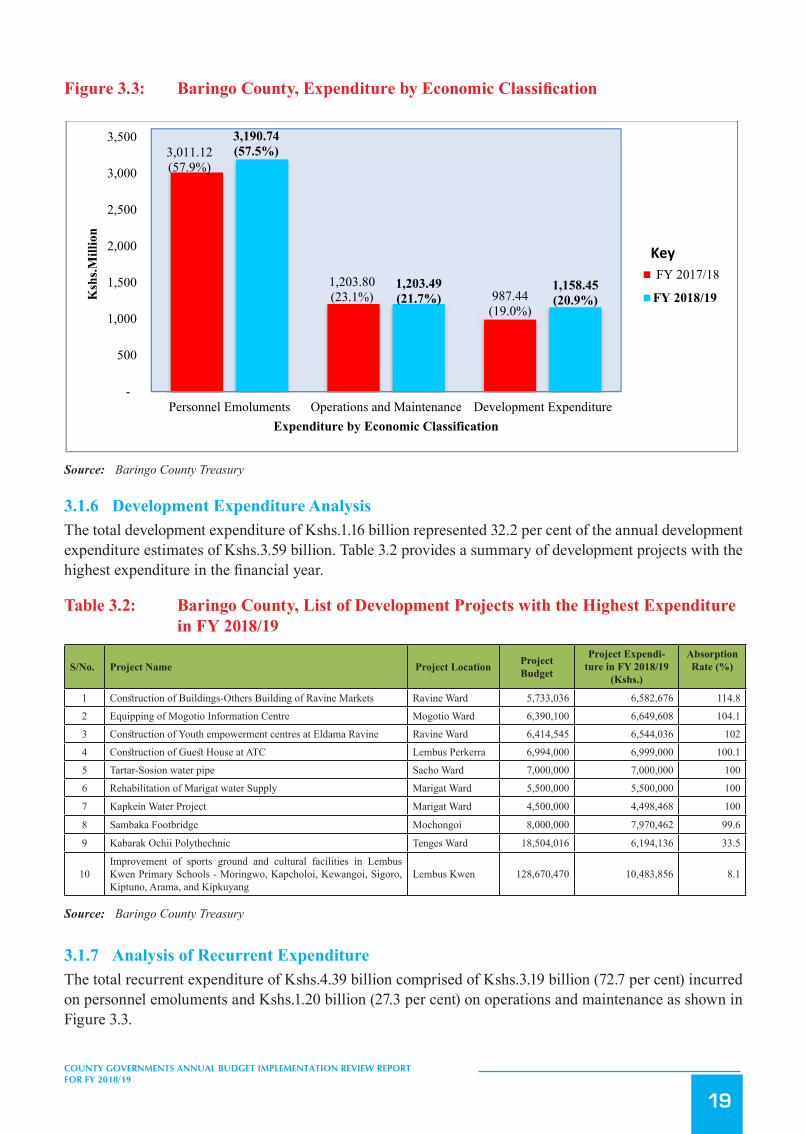
19
COUNTY GOVERNMENTS ANNUAL BUDGET IMPLEMENTATION REVIEW REPORT FOR FY 2018/19
Figure3.3: BaringoCounty,ExpenditurebyEconomicClassification
53
Source: Baringo County Treasury
3.1.6 Development Expenditure Analysis The total development expenditure of Kshs.1.16 billion represented 32.2 per cent of the annual development expenditure
estimates of Kshs.3.59 billion. Table 3.2 provides a summary of development projects with the highest expenditure in the
financial year.
Table 3.2: Baringo County, List of Development Projects with the Highest Expenditure in FY 2018/19
S/No. Project Name Project Location Project Budget
Project Expenditure in FY 2018/19(Kshs.)
Absorption Rate (%)
1 Construction of Buildings-Others Building of Ravine Markets Ravine Ward 5,733,036 6,582,676 114.8
2 Equipping of Mogotio Information Centre Mogotio Ward 6,390,100 6,649,608 104.1 3 Construction of Youth empowerment centres at Eldama Ravine Ravine Ward 6,414,545 6,544,036 1024 Construction of Guest House at ATC Lembus Perkerra 6,994,000 6,999,000 100.1 5 Tartar-Sosion water pipe Sacho Ward 7,000,000 7,000,000 1006 Rehabilitation of Marigat water Supply Marigat Ward 5,500,000 5,500,000 100
7 Kapkein Water Project Marigat Ward 4,500,000 4,498,468 100
8 Sambaka Footbridge Mochongoi 8,000,000 7,970,462 99.6
9 Kabarak Ochii Polythechnic Tenges Ward 18,504,016 6,194,136 33.5
10 Improvement of sports ground and cultural facilities in Lembus Kwen Primary Schools - Moringwo, Kapcholoi, Kewangoi, Sigoro, Kiptuno, Arama, and Kipkuyang
Lembus Kwen 128,670,470 10,483,856 8.1
Source: Baringo County Treasury
3,011.12(57.9%)
1,203.80(23.1%) 987.44
(19.0%)
3,190.74(57.5%)
1,203.49(21.7%)
1,158.45(20.9%)
-
500
1,000
1,500
2,000
2,500
3,000
3,500
Personnel Emoluments Operations and Maintenance Development Expenditure
Ksh
s.Mill
ion
Expenditure by Economic Classification
FY 2017/18
FY 2018/19
Key
Source: Baringo County Treasury
3.1.6 Development Expenditure AnalysisThe total development expenditure of Kshs.1.16 billion represented 32.2 per cent of the annual development expenditure estimates of Kshs.3.59 billion. Table 3.2 provides a summary of development projects with the highest expenditure in the financial year.
Table 3.2: Baringo County, List of Development Projects with the Highest Expenditure in FY 2018/19
S/No. Project Name Project Location Project Budget
Project Expendi-ture in FY 2018/19
(Kshs.)
Absorption Rate (%)
1 Construction of Buildings-Others Building of Ravine Markets Ravine Ward 5,733,036 6,582,676 114.8
2 Equipping of Mogotio Information Centre Mogotio Ward 6,390,100 6,649,608 104.1
3 Construction of Youth empowerment centres at Eldama Ravine Ravine Ward 6,414,545 6,544,036 102
4 Construction of Guest House at ATC Lembus Perkerra 6,994,000 6,999,000 100.1
5 Tartar-Sosion water pipe Sacho Ward 7,000,000 7,000,000 100
6 Rehabilitation of Marigat water Supply Marigat Ward 5,500,000 5,500,000 100
7 Kapkein Water Project Marigat Ward 4,500,000 4,498,468 100
8 Sambaka Footbridge Mochongoi 8,000,000 7,970,462 99.6
9 Kabarak Ochii Polythechnic Tenges Ward 18,504,016 6,194,136 33.5
10Improvement of sports ground and cultural facilities in Lembus Kwen Primary Schools - Moringwo, Kapcholoi, Kewangoi, Sigoro, Kiptuno, Arama, and Kipkuyang
Lembus Kwen 128,670,470 10,483,856 8.1
Source: Baringo County Treasury
3.1.7 Analysis of Recurrent ExpenditureThe total recurrent expenditure of Kshs.4.39 billion comprised of Kshs.3.19 billion (72.7 per cent) incurred on personnel emoluments and Kshs.1.20 billion (27.3 per cent) on operations and maintenance as shown in Figure 3.3.
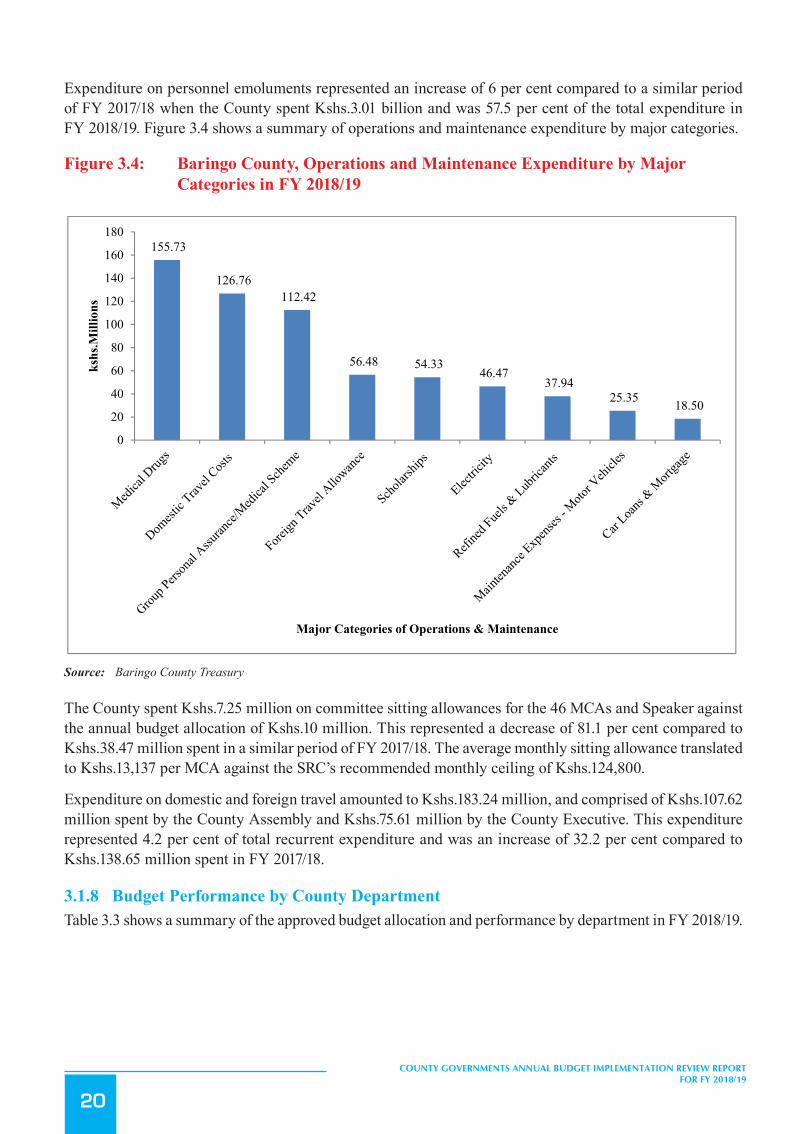
20
COUNTY GOVERNMENTS ANNUAL BUDGET IMPLEMENTATION REVIEW REPORT FOR FY 2018/19
Expenditure on personnel emoluments represented an increase of 6 per cent compared to a similar period of FY 2017/18 when the County spent Kshs.3.01 billion and was 57.5 per cent of the total expenditure in FY 2018/19. Figure 3.4 shows a summary of operations and maintenance expenditure by major categories.
Figure 3.4: Baringo County, Operations and Maintenance Expenditure by Major Categories in FY 2018/19
54
3.1.7 Analysis of Recurrent Expenditure The total recurrent expenditure of Kshs.4.39 billion comprised of Kshs.3.19 billion (72.7 per cent) incurred on personnel
emoluments and Kshs.1.20 billion (27.3 per cent) on operations and maintenance as shown in Figure 3.3.
Expenditure on personnel emoluments represented an increase of 6 per cent compared to a similar period of FY 2017/18
when the County spent Kshs.3.01 billion and was 57.5 per cent of the total expenditure in FY 2018/19. Figure 3.4 shows a
summary of operations and maintenance expenditure by major categories.
Figure 3.4: Baringo County, Operations and Maintenance Expenditure by Major Categories in FY 2018/19
Source: Baringo County Treasury
The County spent Kshs.7.25 million on committee sitting allowances for the 46 MCAs and Speaker against the annual
budget allocation of Kshs.10 million. This represented a decrease of 81.1 per cent compared to Kshs.38.47 million spent in a
similar period of FY 2017/18. The average monthly sitting allowance translated to Kshs.13,137 per MCA against the SRC’s
recommended monthly ceiling of Kshs.124,800.
Expenditure on domestic and foreign travel amounted to Kshs.183.24 million, and comprised of Kshs.107.62 million spent
by the County Assembly and Kshs.75.61 million by the County Executive. This expenditure represented 4.2 per cent of total
recurrent expenditure and was an increase of 32.2 per cent compared to Kshs.138.65 million spent in FY 2017/18.
3.1.8 Budget Performance by County Department Table 3.3 shows a summary of the approved budget allocation and performance by department in FY 2018/19.
155.73
126.76 112.42
56.48 54.33 46.47
37.94 25.35 18.50
0
20
40
60
80
100
120
140
160
180
kshs
.Mill
ions
Major Categories of Operations & Maintenance
Source: Baringo County Treasury
The County spent Kshs.7.25 million on committee sitting allowances for the 46 MCAs and Speaker against the annual budget allocation of Kshs.10 million. This represented a decrease of 81.1 per cent compared to Kshs.38.47 million spent in a similar period of FY 2017/18. The average monthly sitting allowance translated to Kshs.13,137 per MCA against the SRC’s recommended monthly ceiling of Kshs.124,800.
Expenditure on domestic and foreign travel amounted to Kshs.183.24 million, and comprised of Kshs.107.62 million spent by the County Assembly and Kshs.75.61 million by the County Executive. This expenditure represented 4.2 per cent of total recurrent expenditure and was an increase of 32.2 per cent compared to Kshs.138.65 million spent in FY 2017/18.
3.1.8 Budget Performance by County DepartmentTable 3.3 shows a summary of the approved budget allocation and performance by department in FY 2018/19.
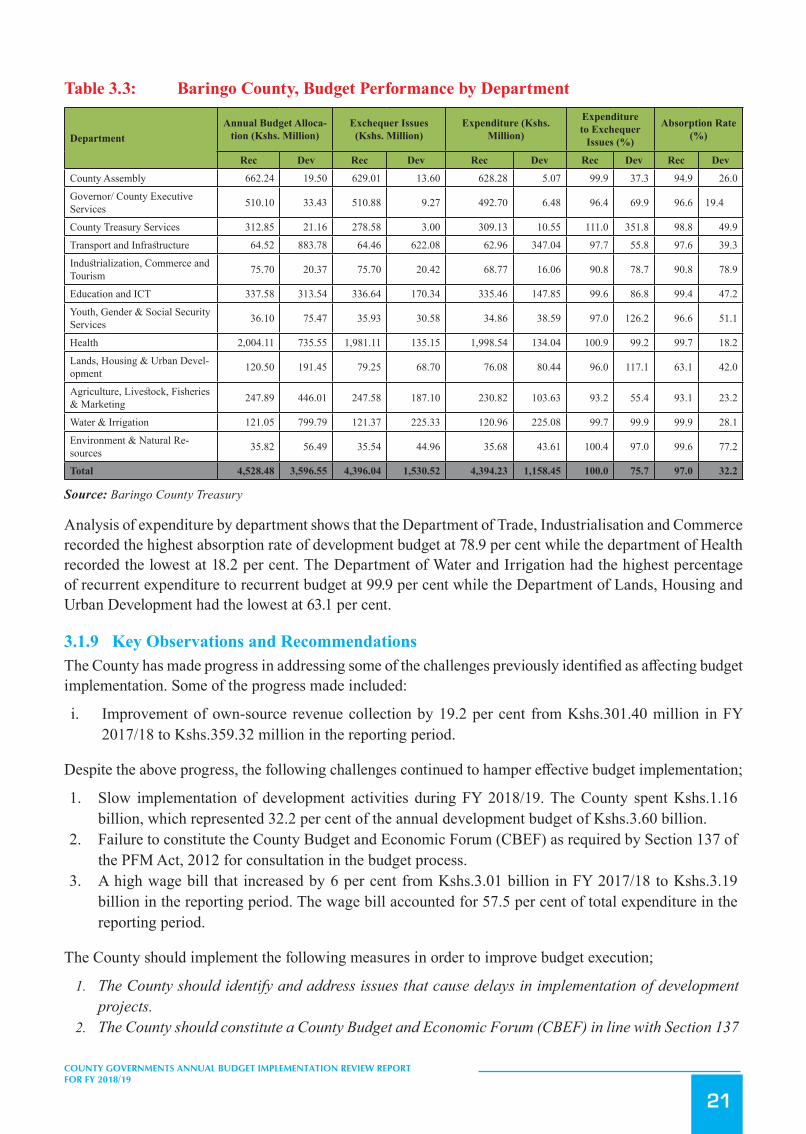
21
COUNTY GOVERNMENTS ANNUAL BUDGET IMPLEMENTATION REVIEW REPORT FOR FY 2018/19
Table 3.3: Baringo County, Budget Performance by Department
DepartmentAnnual Budget Alloca-
tion (Kshs. Million)Exchequer Issues
(Kshs. Million)Expenditure (Kshs.
Million)
Expenditure to Exchequer
Issues (%)
Absorption Rate (%)
Rec Dev Rec Dev Rec Dev Rec Dev Rec Dev
County Assembly 662.24 19.50 629.01 13.60 628.28 5.07 99.9 37.3 94.9 26.0
Governor/ County Executive Services 510.10 33.43 510.88 9.27 492.70 6.48 96.4 69.9 96.6 19.4
County Treasury Services 312.85 21.16 278.58 3.00 309.13 10.55 111.0 351.8 98.8 49.9
Transport and Infrastructure 64.52 883.78 64.46 622.08 62.96 347.04 97.7 55.8 97.6 39.3
Industrialization, Commerce and Tourism 75.70 20.37 75.70 20.42 68.77 16.06 90.8 78.7 90.8 78.9
Education and ICT 337.58 313.54 336.64 170.34 335.46 147.85 99.6 86.8 99.4 47.2
Youth, Gender & Social Security Services 36.10 75.47 35.93 30.58 34.86 38.59 97.0 126.2 96.6 51.1
Health 2,004.11 735.55 1,981.11 135.15 1,998.54 134.04 100.9 99.2 99.7 18.2
Lands, Housing & Urban Devel-opment 120.50 191.45 79.25 68.70 76.08 80.44 96.0 117.1 63.1 42.0
Agriculture, Livestock, Fisheries & Marketing 247.89 446.01 247.58 187.10 230.82 103.63 93.2 55.4 93.1 23.2
Water & Irrigation 121.05 799.79 121.37 225.33 120.96 225.08 99.7 99.9 99.9 28.1
Environment & Natural Re-sources 35.82 56.49 35.54 44.96 35.68 43.61 100.4 97.0 99.6 77.2
Total 4,528.48 3,596.55 4,396.04 1,530.52 4,394.23 1,158.45 100.0 75.7 97.0 32.2
Source: Baringo County Treasury
Analysis of expenditure by department shows that the Department of Trade, Industrialisation and Commerce recorded the highest absorption rate of development budget at 78.9 per cent while the department of Health recorded the lowest at 18.2 per cent. The Department of Water and Irrigation had the highest percentage of recurrent expenditure to recurrent budget at 99.9 per cent while the Department of Lands, Housing and Urban Development had the lowest at 63.1 per cent.
3.1.9 Key Observations and RecommendationsThe County has made progress in addressing some of the challenges previously identified as affecting budget implementation. Some of the progress made included:
i. Improvement of own-source revenue collection by 19.2 per cent from Kshs.301.40 million in FY 2017/18 to Kshs.359.32 million in the reporting period.
Despite the above progress, the following challenges continued to hamper effective budget implementation;
1. Slow implementation of development activities during FY 2018/19. The County spent Kshs.1.16 billion, which represented 32.2 per cent of the annual development budget of Kshs.3.60 billion.
2. Failure to constitute the County Budget and Economic Forum (CBEF) as required by Section 137 of the PFM Act, 2012 for consultation in the budget process.
3. A high wage bill that increased by 6 per cent from Kshs.3.01 billion in FY 2017/18 to Kshs.3.19 billion in the reporting period. The wage bill accounted for 57.5 per cent of total expenditure in the reporting period.
The County should implement the following measures in order to improve budget execution;
1. The County should identify and address issues that cause delays in implementation of development projects.
2. The County should constitute a County Budget and Economic Forum (CBEF) in line with Section 137

22
COUNTY GOVERNMENTS ANNUAL BUDGET IMPLEMENTATION REVIEW REPORT FOR FY 2018/19
of the PFM Act, 2012.3. The County Public Service Board should develop an optimal staffing structure and devise strategies
to contain expenditure on personnel costs within 35 per cent of County’s total revenue in line with Regulation 25(1) (b) of the PFM (County Governments) Regulations, 2015.
3.2 Bomet County
3.2.1 Overview of the FY 2018/19 BudgetThe County’s FY 2018/19 Supplementary Budget was Kshs.8.14 billion, comprising of Kshs.2.95 billion (36.2 per cent) and Kshs.5.19 billion (63.8 per cent) allocation for development and recurrent expenditure respectively.
To finance the budget, the County expects to receive Kshs.5.93 billion (73 per cent) as equitable share of the revenue raised nationally, Kshs.916.77 million ( 11 per cent) as total conditional grants, generate Kshs.245 million (3 per cent) from own sources of revenue, and Kshs.1.06 billion (13 per cent) cash balance from FY 2017/18.
Figure 3.5: Bomet County, Expected Sources of Budget Financing in FY 2018/19
56
2012.
3. The County Public Service Board should develop an optimal staffing structure and devise strategies to contain
expenditure on personnel costs within 35 per cent of County’s total revenue in line with Regulation 25(1) (b) of the PFM
(County Governments) Regulations, 2015.
3.23.2 Bomet County
3.2.1 Overview of the FY 2018/19 Budget The County’s FY 2018/19 Supplementary Budget was Kshs.8.14 billion, comprising of Kshs.2.95 billion (36.2 per cent) and
Kshs.5.19 billion (63.8 per cent) allocation for development and recurrent expenditure respectively.
To finance the budget, the County expects to receive Kshs.5.93 billion (73 per cent) as equitable share of the revenue raised
nationally, Kshs.916.77 million ( 11 per cent) as total conditional grants, generate Kshs.245 million (3 per cent) from own
sources of revenue, and Kshs.1.06 billion (13 per cent) cash balance from FY 2017/18.
Figure 3.5: Bomet County, Expected Sources of Budget Financing in FY 2018/19
Source: Bomet County Treasury
A breakdown of the conditional grants is provided in Table 3.4.
3.2.2 Revenue Analysis During FY 2018/19, the County had a total of Khs.7.76 billion available for budget implementation. This amount consisted
of Kshs.5.93 billion received as equitable share of the revenue raised nationally, Kshs.575.05 million as conditional grants,
Kshs.210.93 million generated from own sources of revenue, and a cash balance of Kshs.1.06 billion from FY 2017/18.
Figure 3.6 shows the annual trend in own-source revenue collection from FY 2013/14 to FY 2018/19.
Cash Balance from FY 2017/18, 13%
National Sharable Revenue, 73.0%
Total Conditional Allocations , 11%
Own Source Revenue, 3.0%
Source: Bomet County Treasury
A breakdown of the conditional grants is provided in Table 3.4.
3.2.2 Revenue AnalysisDuring FY 2018/19, the County had a total of Khs.7.76 billion available for budget implementation. This amount consisted of Kshs.5.93 billion received as equitable share of the revenue raised nationally, Kshs.575.05 million as conditional grants, Kshs.210.93 million generated from own sources of revenue, and a cash balance of Kshs.1.06 billion from FY 2017/18.
Figure 3.6 shows the annual trend in own-source revenue collection from FY 2013/14 to FY 2018/19.

23
COUNTY GOVERNMENTS ANNUAL BUDGET IMPLEMENTATION REVIEW REPORT FOR FY 2018/19
Figure 3.6: Bomet County, Own Source Revenue Collection for FY 2013/14 to FY 2018/19
57
Figure 3.6: Bomet County, Own Source Revenue Collection for FY 2013/14 to FY 2018/19
Source: Bomet County Treasury
The County generated a total of Kshs.210.93 million from own revenue sources in FY 2018/19. This amount represented an
increase of Kshs.29.55 million compared to that realised in FY 2017/18 and was 74 per cent of the annual target.
3.2.3 Conditional Grants During the reporting period, the County received Kshs.575.05 million as conditional grants as shown in Table 3.4.
Table 3.4: Bomet County, Conditional Grants/Loans Received in the FY 2018/19
S/No Grants Annual CARA, 2018
Allocation (in Kshs) Annual Budget Allocation (in Kshs)
Actual receipts in the FY 2018/19 (in Kshs.)
Actual Receipts as Percentage of Annual Allocation (%)
1. Compensation for User Fee Foregone 16,713,356.00 16,713,356 - -
2. Leasing of Medical Equipment 200,000,000.00 200,000,000 - -
3. Road Maintenance Fuel Levy 156,252,849.00 156,252,849 275,556,847 176.4
4. Transforming Health Systems for Universal Care Project (World Bank) 86,405,581.00 86,405,581 34,250,678 39.6
5. IDA (World Bank) -Kenya Climate Smart Agriculture Project (KCSAP) 117,000,000.00 117,000,000 46,841,567 40
6. IDA (World Bank) -Kenya Urban Support Project (KUSP) 209,534,800 209,534,800 168,000,000 80.2
7. DANIDA - Universal Healthcare in Devolved System Programme 17,617,500 17,617,500 - -
8. Kenya Devolution Support Programme “Level 1 grant” 44,888,193 44,888,193 - -
9. Agricultural Sector Development Support Programme(ASDSP) 20,485,395 20,485,395 14,258,275 69.6
10. CA- Development of Youth polytechnics 47,875,000 47,875,000 36,145,625 75.5
Total 916,772,674 916,772,674 575,052,992 62.7
203.79 205.97
166.99
236.70
181.38
210.93
0
50
100
150
200
250
FY 2013/14 FY 2014/15 FY 2015/16 FY 2016/17 FY 2017/18 FY 2018/19
Ksh
s. M
illio
ns
Trend in Own Source Revenue
Source: Bomet County Treasury
The County generated a total of Kshs.210.93 million from own revenue sources in FY 2018/19. This amount represented an increase of Kshs.29.55 million compared to that realised in FY 2017/18 and was 74 per cent of the annual target.
3.2.3 Conditional GrantsDuring the reporting period, the County received Kshs.575.05 million as conditional grants as shown in Table 3.4.
Table 3.4: Bomet County, Conditional Grants/Loans Received in the FY 2018/19
S/No GrantsAnnual CARA,
2018 Allocation (in Kshs)
Annual Budget Allocation (in
Kshs)
Actual receipts in the FY 2018/19 (in
Kshs.)
Actual Receipts as Percentage
of Annual Allo-cation (%)
1 Compensation for User Fee Foregone 16,713,356.00 16,713,356 - -
2 Leasing of Medical Equipment 200,000,000.00 200,000,000 - -
3 Road Maintenance Fuel Levy 156,252,849.00 156,252,849 275,556,847 176.4
4 Transforming Health Systems for Universal Care Project (World Bank) 86,405,581.00 86,405,581 34,250,678 39.6
5 IDA (World Bank) -Kenya Climate Smart Agriculture Project (KCSAP) 117,000,000.00 117,000,000 46,841,567 40
6 IDA (World Bank) -Kenya Urban Support Project (KUSP) 209,534,800 209,534,800 168,000,000 80.2
7 DANIDA - Universal Healthcare in Devolved System Programme 17,617,500 17,617,500 - -
8 Kenya Devolution Support Programme “Level 1 grant” 44,888,193 44,888,193 - -
9 Agricultural Sector Development Support Program-me(ASDSP) 20,485,395 20,485,395 14,258,275 69.6
10 CA- Development of Youth polytechnics 47,875,000 47,875,000 36,145,625 75.5
Total 916,772,674 916,772,674 575,052,992 62.7
Source: Bomet County Treasury
During the reporting period, receipts from the Road Maintenance Fuel Levy conditional grant recorded the highest performance in percentage terms, and accounted 176.4 per cent of the annual target.

24
COUNTY GOVERNMENTS ANNUAL BUDGET IMPLEMENTATION REVIEW REPORT FOR FY 2018/19
3.2.4 Exchequer IssuesIn order to implement the budget, the Controller of Budget approved withdrawal of Kshs.6.96 billion from the CRF account. The withdrawals represented 85.6 per cent of the Approved Supplementary Budget and translated to an increase 32.1 per cent from Kshs.5.27 billion in FY 2017/18 and comprised of Kshs.2.06 billion (29.6 per cent) towards development activities and Kshs.4.90 billion (70.4 per cent) for recurrent expenditure.
3.2.5 Overall Expenditure ReviewA total of Kshs.6.88 billion was spent on both development and recurrent activities. This expenditure represented 99 per cent of the total funds released from the CRF account, and was an increase of 28.1 per cent from Kshs.4.95 billion spent in FY 2017/18.
The expenditure excluded pending bills as at June 30, 2019 which amounted to Kshs.458.54 million for development activities and Kshs.108.99 million for recurrent costs.
Expenditure on development programmes amounted to Kshs.2.06 billion while Kshs.4.82 billion was spent on recurrent activities. The development expenditure was 100 per cent of the funds released for development programmes, while recurrent expenditure was 98.3 per cent of funds released for recurrent activities.
Development expenditure recorded an absorption rate of 70 per cent, which was an increase from 46.9 per cent attained in FY 2017/18. Conversely, recurrent expenditure represented 93 per cent of the annual recurrent budget, a decrease from 93.1 per cent recorded in FY 2017/18.
Figure 3.7 presents a comparison between the total expenditure in FY 2018/19 and FY 2017/18.
Figure3.7: BometCounty,ExpenditurebyEconomicClassification
59
Source: Bomet County Treasury
3.2.6 Development Expenditure Analysis The total development expenditure of Kshs.2.06 billion represented 70 per cent of the annual development expenditure
estimates of Kshs.2.95 billion. Table 3.5 provides a summary of development projects with the highest expenditure in the
financial year.
Table 3.5: Bomet County, List of Development Projects with the Highest Expenditure in FY 2018/19
S/No.
Project Name Project Location Project Budget (Kshs.)
FY2018/19 Project Expenditure (Kshs.)
Absorption rate (%)
1 Construction of Roads Varied 579,172,515 578,936,432 100.0
2 Development of Water Supply Sotik , Chepalungu, Konoin, Bomet East, Bomet Central 264,761,471 265,915,171 100.4
3 Construction of ECDs Kametori, Kipraisi, Nyatembe, Chebelion etc 143,422,164 140,875,943 98.2
4 Development of Sport facilities Bomet Town 29,000,000 29,000,000 100
5 Construction of Mini Chamber- County Assembly County Assembly 59,124,178 28,820,575 48.7
6 Purchase of Fire Engine Bomet Town 32,000,000 25,000,000 78.1
7 Market Development Bomet Town 23,808,564 22,808,564 95.8
8 Construction of Cattle Dips and Slaughter Houses Varied 20,600,000 20,490,967
99.5
9 Automation of own Source Revenue System Treasury Department 22,427,759 13,606,861 60.7
Source: Bomet County Treasury
2,429.99(49.1%)
1,644.42(33.2%)
873.54(17.7%)
2,623.68(38.1%)
2,197.98(31.9%) 2,062.22
(39.1%)
-
500
1,000
1,500
2,000
2,500
3,000
Personnel Emoluments Operations and Maintenance Development Expenditure
Ksh
s.Mill
ion
Expenditure by Economic Classification
FY 2018/19
FY 2018/19
Key
Source: Bomet County Treasury

25
COUNTY GOVERNMENTS ANNUAL BUDGET IMPLEMENTATION REVIEW REPORT FOR FY 2018/19
3.2.6 Development Expenditure AnalysisThe total development expenditure of Kshs.2.06 billion represented 70 per cent of the annual development expenditure estimates of Kshs.2.95 billion. Table 3.5 provides a summary of development projects with the highest expenditure in the financial year.
Table 3.5: Bomet County, List of Development Projects with the Highest Expenditure in FY 2018/19
S/No. Project Name Project Location Project Budget
(Kshs.)FY2018/19 Project
Expenditure (Kshs.)Absorption
rate (%)
1 Construction of Roads Varied 579,172,515 578,936,432 100.0
2 Development of Water Supply Sotik , Chepalungu, Konoin, Bom-et East, Bomet Central 264,761,471 265,915,171 100.4
3 Construction of ECDs Kametori, Kipraisi, Nyatembe, Chebelion etc 143,422,164 140,875,943 98.2
4 Development of Sport facilities Bomet Town 29,000,000 29,000,000 100
5 Construction of Mini Chamber- County Assem-bly County Assembly 59,124,178 28,820,575 48.7
6 Purchase of Fire Engine Bomet Town 32,000,000 25,000,000 78.1
7 Market Development Bomet Town 23,808,564 22,808,564 95.8
8 Construction of Cattle Dips and Slaughter Houses Varied 20,600,000 20,490,967 99.5
9 Automation of own Source Revenue System Treasury Department 22,427,759 13,606,86160.7
Source: Bomet County Treasury
3.2.7 Analysis of Recurrent ExpenditureThe total recurrent expenditure of Kshs.4.82 billion comprised of Kshs.2.62 billion (55.3 per cent) incurred on personnel emoluments and Kshs.2.2 billion (44.7 per cent) on operations and maintenance as shown in Figure 3.7.
Expenditure on personnel emoluments represented an increase of 8 per cent compared to a similar period of FY 2017/18 when the County spent Kshs.2.43 billion and was 38.1 per cent of the total expenditure in FY 2018/19. Figure 3.8 shows a summary of operations and maintenance expenditure by major categories.
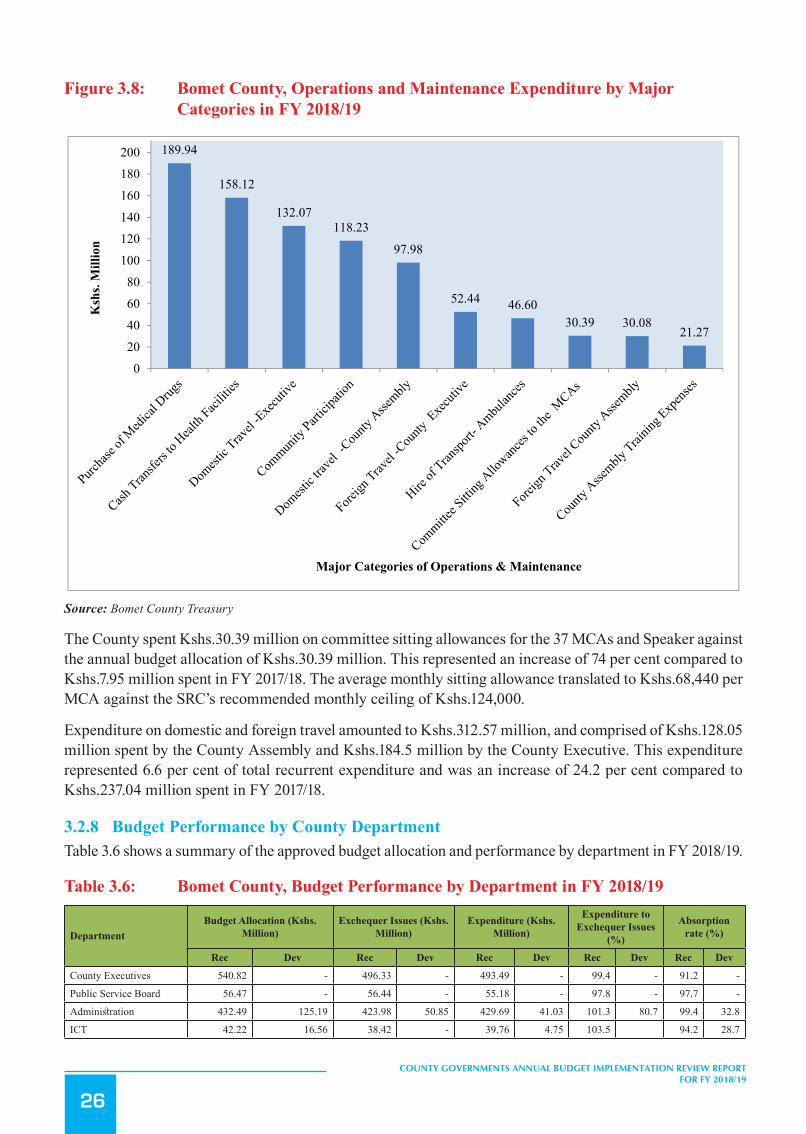
26
COUNTY GOVERNMENTS ANNUAL BUDGET IMPLEMENTATION REVIEW REPORT FOR FY 2018/19
Figure 3.8: Bomet County, Operations and Maintenance Expenditure by Major Categories in FY 2018/19
60
3.2.7 Analysis of Recurrent Expenditure The total recurrent expenditure of Kshs.4.82 billion comprised of Kshs.2.62 billion (55.3 per cent) incurred on personnel
emoluments and Kshs.2.2 billion (44.7 per cent) on operations and maintenance as shown in Figure 3.7.
Expenditure on personnel emoluments represented an increase of 8 per cent compared to a similar period of FY 2017/18
when the County spent Kshs.2.43 billion and was 38.1 per cent of the total expenditure in FY 2018/19. Figure 3.7 shows a
summary of operations and maintenance expenditure by major categories.
Figure 3.8: Bomet County, Operations and Maintenance Expenditure by Major Categories in FY 2018/19
Source: Bomet County Treasury
The County spent Kshs.30.39 million on committee sitting allowances for the 37 MCAs and Speaker against the annual
budget allocation of Kshs.30.39 million. This represented an increase of 74 per cent compared to Kshs.7.95 million spent in
FY 2017/18. The average monthly sitting allowance translated to Kshs.68,440 per MCA against the SRC’s recommended
monthly ceiling of Kshs.124,000.
Expenditure on domestic and foreign travel amounted to Kshs.312.57 million, and comprised of Kshs.128.05 million spent
by the County Assembly and Kshs.184.5 million by the County Executive. This expenditure represented 6.6 per cent of total
recurrent expenditure and was an increase of 24.2 per cent compared to Kshs.237.04 million spent in FY 2017/18.
3.2.8 Budget Performance by County Department Table 3.6 shows a summary of the approved budget allocation and performance by department in FY 2018/19.
189.94
158.12
132.07118.23
97.98
52.44 46.6030.39 30.08
21.27
020406080
100120140160180200
Ksh
s. M
illio
n
Major Categories of Operations & Maintenance
Source: Bomet County Treasury
The County spent Kshs.30.39 million on committee sitting allowances for the 37 MCAs and Speaker against the annual budget allocation of Kshs.30.39 million. This represented an increase of 74 per cent compared to Kshs.7.95 million spent in FY 2017/18. The average monthly sitting allowance translated to Kshs.68,440 per MCA against the SRC’s recommended monthly ceiling of Kshs.124,000.
Expenditure on domestic and foreign travel amounted to Kshs.312.57 million, and comprised of Kshs.128.05 million spent by the County Assembly and Kshs.184.5 million by the County Executive. This expenditure represented 6.6 per cent of total recurrent expenditure and was an increase of 24.2 per cent compared to Kshs.237.04 million spent in FY 2017/18.
3.2.8 Budget Performance by County DepartmentTable 3.6 shows a summary of the approved budget allocation and performance by department in FY 2018/19.
Table 3.6: Bomet County, Budget Performance by Department in FY 2018/19
DepartmentBudget Allocation (Kshs.
Million)Exchequer Issues (Kshs.
Million)Expenditure (Kshs.
Million)
Expenditure to Exchequer Issues
(%)
Absorption rate (%)
Rec Dev Rec Dev Rec Dev Rec Dev Rec Dev
County Executives 540.82 - 496.33 - 493.49 - 99.4 - 91.2 -
Public Service Board 56.47 - 56.44 - 55.18 - 97.8 - 97.7 -
Administration 432.49 125.19 423.98 50.85 429.69 41.03 101.3 80.7 99.4 32.8
ICT 42.22 16.56 38.42 - 39.76 4.75 103.5 94.2 28.7
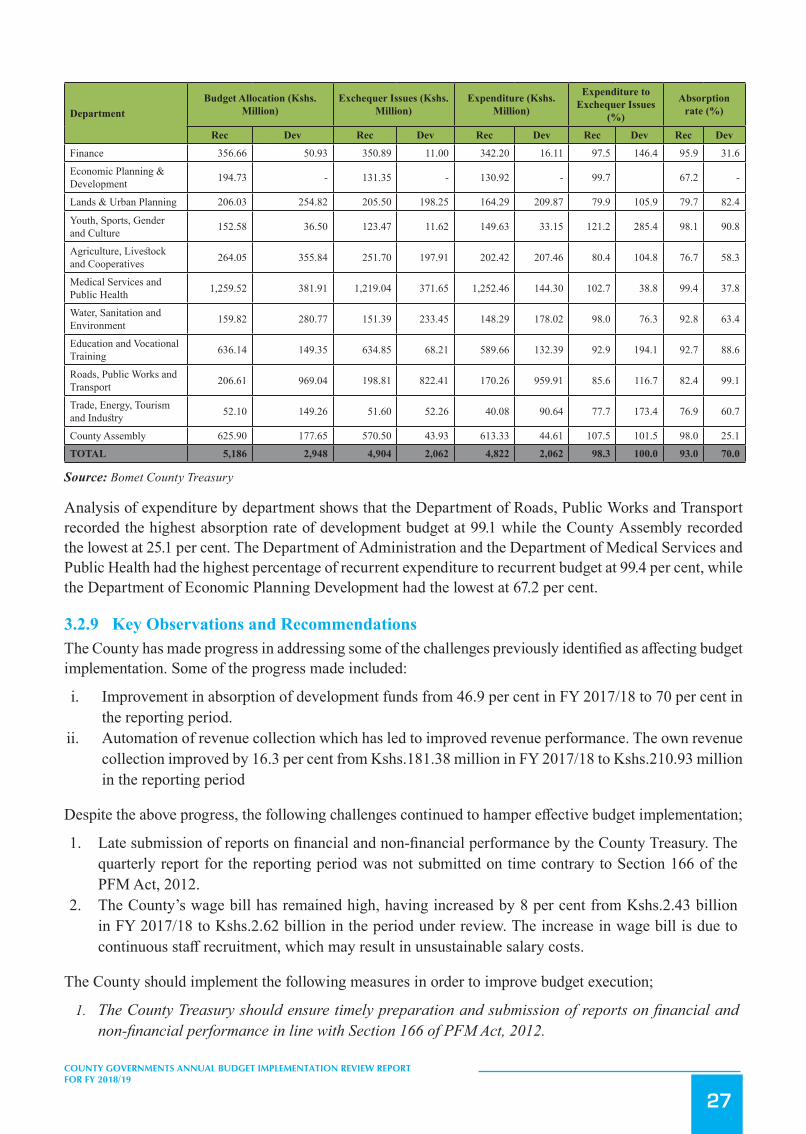
27
COUNTY GOVERNMENTS ANNUAL BUDGET IMPLEMENTATION REVIEW REPORT FOR FY 2018/19
DepartmentBudget Allocation (Kshs.
Million)Exchequer Issues (Kshs.
Million)Expenditure (Kshs.
Million)
Expenditure to Exchequer Issues
(%)
Absorption rate (%)
Rec Dev Rec Dev Rec Dev Rec Dev Rec Dev
Finance 356.66 50.93 350.89 11.00 342.20 16.11 97.5 146.4 95.9 31.6
Economic Planning & Development 194.73 - 131.35 - 130.92 - 99.7 67.2 -
Lands & Urban Planning 206.03 254.82 205.50 198.25 164.29 209.87 79.9 105.9 79.7 82.4
Youth, Sports, Gender and Culture 152.58 36.50 123.47 11.62 149.63 33.15 121.2 285.4 98.1 90.8
Agriculture, Livestock and Cooperatives 264.05 355.84 251.70 197.91 202.42 207.46 80.4 104.8 76.7 58.3
Medical Services and Public Health 1,259.52 381.91 1,219.04 371.65 1,252.46 144.30 102.7 38.8 99.4 37.8
Water, Sanitation and Environment 159.82 280.77 151.39 233.45 148.29 178.02 98.0 76.3 92.8 63.4
Education and Vocational Training 636.14 149.35 634.85 68.21 589.66 132.39 92.9 194.1 92.7 88.6
Roads, Public Works and Transport 206.61 969.04 198.81 822.41 170.26 959.91 85.6 116.7 82.4 99.1
Trade, Energy, Tourism and Industry 52.10 149.26 51.60 52.26 40.08 90.64 77.7 173.4 76.9 60.7
County Assembly 625.90 177.65 570.50 43.93 613.33 44.61 107.5 101.5 98.0 25.1
TOTAL 5,186 2,948 4,904 2,062 4,822 2,062 98.3 100.0 93.0 70.0
Source: Bomet County Treasury
Analysis of expenditure by department shows that the Department of Roads, Public Works and Transport recorded the highest absorption rate of development budget at 99.1 while the County Assembly recorded the lowest at 25.1 per cent. The Department of Administration and the Department of Medical Services and Public Health had the highest percentage of recurrent expenditure to recurrent budget at 99.4 per cent, while the Department of Economic Planning Development had the lowest at 67.2 per cent.
3.2.9 Key Observations and RecommendationsThe County has made progress in addressing some of the challenges previously identified as affecting budget implementation. Some of the progress made included:
i. Improvement in absorption of development funds from 46.9 per cent in FY 2017/18 to 70 per cent in the reporting period.
ii. Automation of revenue collection which has led to improved revenue performance. The own revenue collection improved by 16.3 per cent from Kshs.181.38 million in FY 2017/18 to Kshs.210.93 million in the reporting period
Despite the above progress, the following challenges continued to hamper effective budget implementation;
1. Late submission of reports on financial and non-financial performance by the County Treasury. The quarterly report for the reporting period was not submitted on time contrary to Section 166 of the PFM Act, 2012.
2. The County’s wage bill has remained high, having increased by 8 per cent from Kshs.2.43 billion in FY 2017/18 to Kshs.2.62 billion in the period under review. The increase in wage bill is due to continuous staff recruitment, which may result in unsustainable salary costs.
The County should implement the following measures in order to improve budget execution;
1. The County Treasury should ensure timely preparation and submission of reports on financial and non-financial performance in line with Section 166 of PFM Act, 2012.
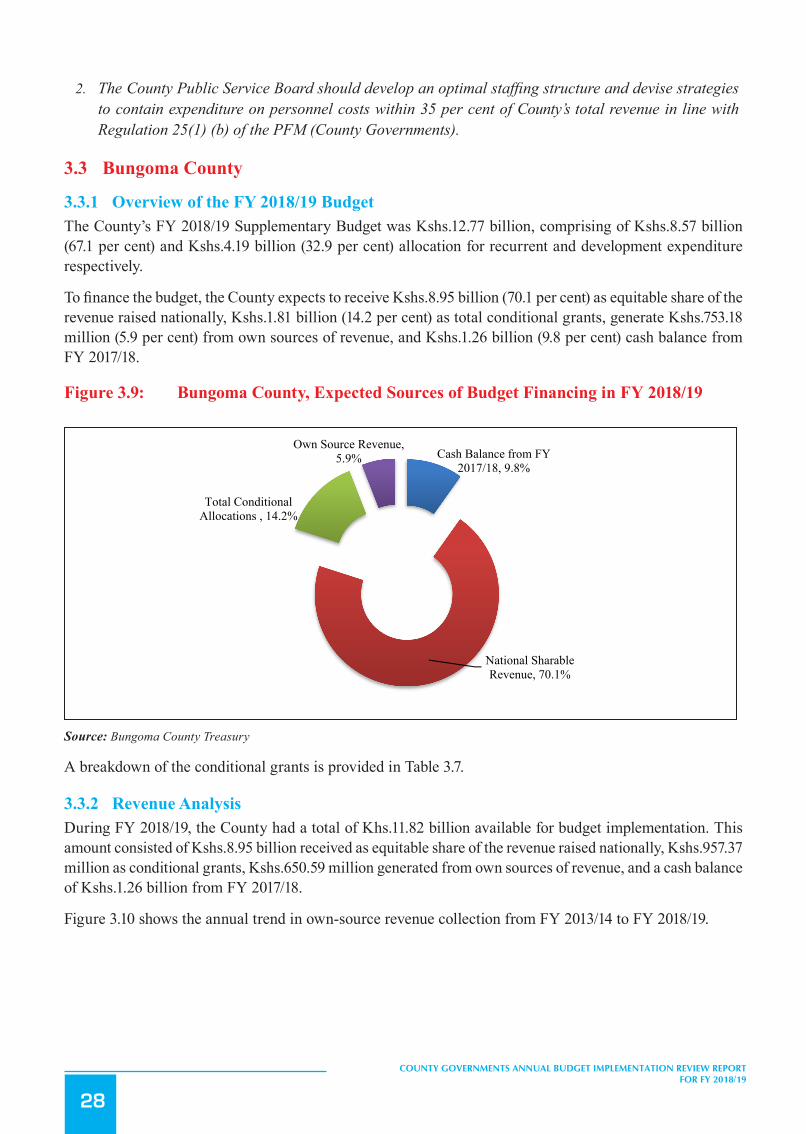
28
COUNTY GOVERNMENTS ANNUAL BUDGET IMPLEMENTATION REVIEW REPORT FOR FY 2018/19
2. The County Public Service Board should develop an optimal staffing structure and devise strategies to contain expenditure on personnel costs within 35 per cent of County’s total revenue in line with Regulation 25(1) (b) of the PFM (County Governments).
3.3 Bungoma County
3.3.1 Overview of the FY 2018/19 BudgetThe County’s FY 2018/19 Supplementary Budget was Kshs.12.77 billion, comprising of Kshs.8.57 billion (67.1 per cent) and Kshs.4.19 billion (32.9 per cent) allocation for recurrent and development expenditure respectively.
To finance the budget, the County expects to receive Kshs.8.95 billion (70.1 per cent) as equitable share of the revenue raised nationally, Kshs.1.81 billion (14.2 per cent) as total conditional grants, generate Kshs.753.18 million (5.9 per cent) from own sources of revenue, and Kshs.1.26 billion (9.8 per cent) cash balance from FY 2017/18.
Figure 3.9: Bungoma County, Expected Sources of Budget Financing in FY 2018/19
62
The County should implement the following measures in order to improve budget execution;
1. The County Treasury should ensure timely preparation and submission of reports on financial and non -financial
performance in line with Section 166 of PFM Act, 2012.
2. The County Public Service Board should develop an optimal staffing structure and devise strategies to contain
expenditure on personnel costs within 35 per cent of County’s total revenue in line with Regulation 25(1) (b) of the PFM
(County Governments).
3.3 Bungoma County
3.3.1 Overview of the FY 2018/19 Budget The County’s FY 2018/19 Supplementary Budget was Kshs.12.77 billion, comprising of Kshs.8.57 billion (67.1 per cent)
and Kshs.4.19 billion (32.9 per cent) allocation for recurrent and development expenditure respectively.
To finance the budget, the County expects to receive Kshs.8.95 billion (70.1 per cent) as equitable share of the revenue
raised nationally, Kshs.1.81 billion (14.2 per cent) as total conditional grants, generate Kshs.753.18 million (5.9 per cent)
from own sources of revenue, and Kshs.1.26 billion (9.8 per cent) cash balance from FY 2017/18.
Figure 3.9: County Expected Sources of Budget Financing in FY 2018/19
Source: Bungoma County Treasury
A breakdown of the conditional grants is provided in Table 3.7.
3.3.2 Revenue Analysis During FY 2018/19, the County had a total of Khs.11.82 billion available for budget implementation. This amount consisted
of Kshs.8.95 billion received as equitable share of the revenue raised nationally, Kshs.957.37 million as conditional grants,
Kshs.650.59 million generated from own sources of revenue, and a cash balance of Kshs.1.26 billion from FY 2017/18.
Figure 3.10 shows the annual trend in own-source revenue collection from FY 2013/14 to FY 2018/19.
Cash Balance from FY 2017/18, 9.8%
National Sharable Revenue, 70.1%
Total Conditional Allocations , 14.2%
Own Source Revenue, 5.9%
Source: Bungoma County Treasury
A breakdown of the conditional grants is provided in Table 3.7.
3.3.2 Revenue AnalysisDuring FY 2018/19, the County had a total of Khs.11.82 billion available for budget implementation. This amount consisted of Kshs.8.95 billion received as equitable share of the revenue raised nationally, Kshs.957.37 million as conditional grants, Kshs.650.59 million generated from own sources of revenue, and a cash balance of Kshs.1.26 billion from FY 2017/18.
Figure 3.10 shows the annual trend in own-source revenue collection from FY 2013/14 to FY 2018/19.

29
COUNTY GOVERNMENTS ANNUAL BUDGET IMPLEMENTATION REVIEW REPORT FOR FY 2018/19
Figure 3.10: Bungoma County, Own Source Revenue Collection for FY 2013/14 to FY 2018/19
63
Figure 3.10: Bungoma County, Own Source Revenue Collection for FY 2013/14 to FY 2018/19
Source: Bungoma County Treasury
The County generated a total of Kshs.650.59 million from own revenue sources in FY 2018/19. This amount represented an
increase of Kshs.31.19 million compared to that realised in FY 2017/18 and was 86.4 per cent of the annual target.
3.3.3 Conditional Grants During the reporting period, the County received Kshs.957.37 million as conditional grants as shown in Table 3.7.
Table 3.7: Bungoma County, Conditional Grants/Loans Received in the FY 2018/19
S/No Grants Annual CARA, 2018
Allocation (in Kshs) Annual Budget Allocation (in Kshs)
Actual receipts in the FY 2018/19 (in Kshs.)
Actual Receipts as Percentage of Annual Allocation (%)
A Grants Contained in the CARA, 2018
1 Road Maintenance Fuel Levy Fund 235,619,376 235,619,376 117,809,688 50.0
2 Leasing of Medical Equipment 200,000,000 200,000,000 - -
3 Kenya Devolution Support Programme (KDSP) 58,329,310 74,742,386 212,537,789 284.4 4 Compensation for User Fee Foregone 32,838,307 32,837,307 32,837,307 100.0 5 DANIDA Grant 29,362,500 41,551,298 29,362,500 71.0
6 Agriculture, livestock fisheries and coop development: ASDSP II 22,404,685 22,404,685 - -
7 Development of Youth Polytechnics 65,500,000 141,776,625 - - 8 Water and natural resources 80,000,000 80,000,000 - -
9 World Bank Loan for Transforming Health System for universal Care Project 100,000,000 115,388,909 72,564,291 73.0
182.70
504.62
630.99 661.59619.40
650.59
0
100
200
300
400
500
600
700
FY 2013/14 FY 2014/15 FY 2015/16 FY 2016/17 FY 2017/18 FY 2018/19
Ksh
s. M
illio
ns
Trend in Own Source Revenue
Source: Bungoma County Treasury
The County generated a total of Kshs.650.59 million from own revenue sources in FY 2018/19. This amount represented an increase of Kshs.31.19 million compared to that realised in FY 2017/18 and was 86.4 per cent of the annual target.
3.3.3 Conditional GrantsDuring the reporting period, the County received Kshs.957.37 million as conditional grants as shown in Table 3.7.
Table 3.7: Bungoma County, Conditional Grants/Loans Received in the FY 2018/19
S/No Grants Annual CARA, 2018
Allocation (in Kshs)Annual Budget Alloca-
tion (in Kshs)
Actual receipts in the FY 2018/19 (in
Kshs.)
Actual Receipts as Percentage of
Annual Allocation (%)
A Grants Contained in the CARA, 2018
1 Road Maintenance Fuel Levy Fund 235,619,376 235,619,376 117,809,688 50.0
2 Leasing of Medical Equipment 200,000,000 200,000,000 - -
3 Kenya Devolution Support Programme (KDSP) 58,329,310 74,742,386 212,537,789 284.4
4 Compensation for User Fee Foregone 32,838,307 32,837,307 32,837,307 100.0
5 DANIDA Grant 29,362,500 41,551,298 29,362,500 71.0
6 Agriculture, livestock fisheries and coop devel-opment: ASDSP II 22,404,685 22,404,685 - -
7 Development of Youth Polytechnics 65,500,000 141,776,625 - -
8 Water and natural resources 80,000,000 80,000,000 - -
9 World Bank Loan for Transforming Health Sys-tem for universal Care Project 100,000,000 115,388,909 72,564,291 73.0
10 World Bank Loan for National Agricultural & Rural Inclusive Project 140,435,163 181,550,578 50,078,476 36.0
11 Kenya Urban Support Project (KUSP) 342,177,100 342,177,100 342,177,100 100.0
Sub Total 1,306,666,441 1,468,048,264 857,367,151 66.0
B Other Grants

30
COUNTY GOVERNMENTS ANNUAL BUDGET IMPLEMENTATION REVIEW REPORT FOR FY 2018/19
S/No Grants Annual CARA, 2018
Allocation (in Kshs)Annual Budget Alloca-
tion (in Kshs)
Actual receipts in the FY 2018/19 (in
Kshs.)
Actual Receipts as Percentage of
Annual Allocation (%)
A Grants Contained in the CARA, 2018
13 Roads and Public works: RMLF - 239,129,429 - -
14 Sirisia Hospital Grant - 99,999,945 99,999,945 -
Sub Total - 339,129,374 99,999,945 -
Grand Total 1,306,666,441 1,807,177,638.0 957,367,096.4 73.0
Source: Bungoma County Treasury
During the reporting period, receipts from the Kenya Devolution Support Programme (KDSP) conditional grant recorded the highest performance in percentage terms, and accounted 284.4 percent of the annual target.
3.3.4 Exchequer IssuesIn order to implement the budget, the Controller of Budget approved withdrawal of Kshs.9.12 billion from the CRF account. The withdrawals represented 71.5 per cent of the Approved Supplementary Budget and translated to a decrease of 0.7 per cent from Kshs.9.06 billion in FY 2017/18 and comprised of Kshs.1.85 billion (20.3 per cent) towards development activities and Kshs.7.28 billion (79.7 per cent) for recurrent expenditure.
3.3.5 Overall Expenditure ReviewA total of Kshs.9.57 billion was spent on both development and recurrent activities. This expenditure represented 104.9 per cent of the total funds released from the CRF account, and was an increase of 10.9 per cent from Kshs.8.63 billion spent in FY 2017/18.
The expenditure excluded pending bills as at June 30, 2019 which amounted to Kshs.198.62 million for development activities and Kshs.34.96 million for recurrent costs.
Expenditure on development programmes amounted to Kshs.2.34 billion while Kshs.7.23 billion was spent on recurrent activities. The development expenditure was 126.9 per cent of the funds released for development programmes, while recurrent expenditure was 99.3 per cent of funds released for recurrent activities.
Development expenditure recorded an absorption rate of 55.9 per cent, which was an increase from 42.3 per cent attained in FY 2017/18. Conversely, recurrent expenditure represented 84.3 per cent of the annual recurrent budget, a decrease from 92.6 per cent recorded in FY 2017/18.
Figure 3.11 presents a comparison between the total expenditure in FY 2018/19 and FY 2017/18.
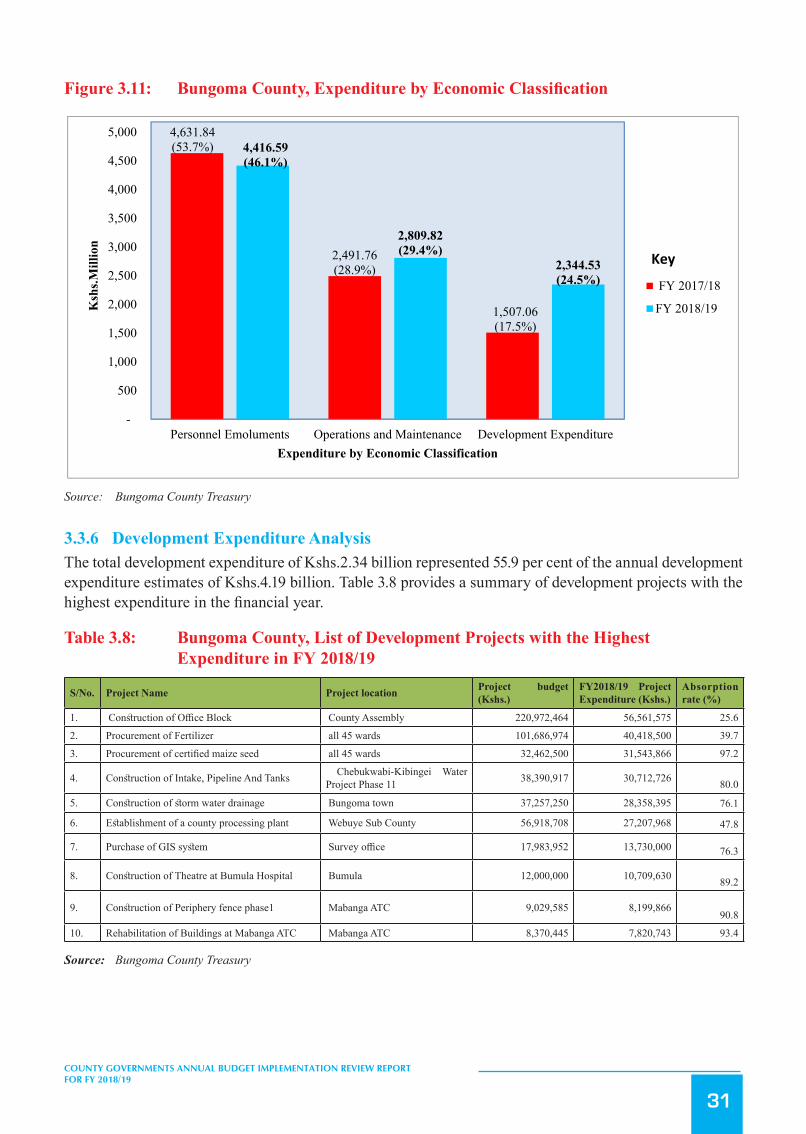
31
COUNTY GOVERNMENTS ANNUAL BUDGET IMPLEMENTATION REVIEW REPORT FOR FY 2018/19
Figure3.11: BungomaCounty,ExpenditurebyEconomicClassification
65
Figure 3.11:Bungoma County, Expenditure by Economic Classification
Source: Bungoma County Treasury
3.3.6 Development Expenditure Analysis The total development expenditure of Kshs.2.34 billion represented 55.9 per cent of the annual development expenditure
estimates of Kshs.4.19 billion. Table 3.8 provides a summary of development projects with the highest expenditure in the
financial year.
Table 3.8: Bungoma County, List of Development Projects with the Highest Expenditure in FY 2018/19
S/No. Project Name Project location Project budget (Kshs.)
FY2018/19 Project Expenditure (Kshs.)
Absorption rate (%)
1. Construction of Office Block County Assembly 220,972,464 56,561,575 25.62. Procurement of Fertilizer all 45 wards 101,686,974 40,418,500 39.73. Procurement of certified maize seed all 45 wards 32,462,500 31,543,866 97.2
4. Construction of Intake, Pipeline And Tanks Chebukwabi-Kibingei Water Project Phase 11 38,390,917 30,712,726 80.0
5. Construction of storm water drainage Bungoma town 37,257,250 28,358,395 76.1
6. Establishment of a county processing plant Webuye Sub County 56,918,708 27,207,968 47.8
7. Purchase of GIS system Survey office 17,983,952 13,730,000 76.3
8. Construction of Theatre at Bumula Hospital Bumula 12,000,000 10,709,630 89.2
9. Construction of Periphery fence phase1 Mabanga ATC 9,029,585 8,199,866 90.8
10. Rehabilitation of Buildings at Mabanga ATC Mabanga ATC 8,370,445 7,820,743 93.4
Source: Bungoma County Treasury
4,631.84(53.7%)
2,491.76(28.9%)
1,507.06(17.5%)
4,416.59(46.1%)
2,809.82(29.4%)
2,344.53(24.5%)
-
500
1,000
1,500
2,000
2,500
3,000
3,500
4,000
4,500
5,000
Personnel Emoluments Operations and Maintenance Development Expenditure
Ksh
s.Mill
ion
Expenditure by Economic Classification
FY 2017/18
FY 2018/19
Key
Source: Bungoma County Treasury
3.3.6 Development Expenditure AnalysisThe total development expenditure of Kshs.2.34 billion represented 55.9 per cent of the annual development expenditure estimates of Kshs.4.19 billion. Table 3.8 provides a summary of development projects with the highest expenditure in the financial year.
Table 3.8: Bungoma County, List of Development Projects with the Highest Expenditure in FY 2018/19
S/No. Project Name Project location Project budget (Kshs.)
FY2018/19 Project Expenditure (Kshs.)
Absorption rate (%)
1. Construction of Office Block County Assembly 220,972,464 56,561,575 25.6
2. Procurement of Fertilizer all 45 wards 101,686,974 40,418,500 39.7
3. Procurement of certified maize seed all 45 wards 32,462,500 31,543,866 97.2
4. Construction of Intake, Pipeline And Tanks Chebukwabi-Kibingei Water Project Phase 11 38,390,917 30,712,726 80.0
5. Construction of storm water drainage Bungoma town 37,257,250 28,358,395 76.1
6. Establishment of a county processing plant Webuye Sub County 56,918,708 27,207,968 47.8
7. Purchase of GIS system Survey office 17,983,952 13,730,000 76.3
8. Construction of Theatre at Bumula Hospital Bumula 12,000,000 10,709,630 89.2
9. Construction of Periphery fence phase1 Mabanga ATC 9,029,585 8,199,86690.8
10. Rehabilitation of Buildings at Mabanga ATC Mabanga ATC 8,370,445 7,820,743 93.4
Source: Bungoma County Treasury
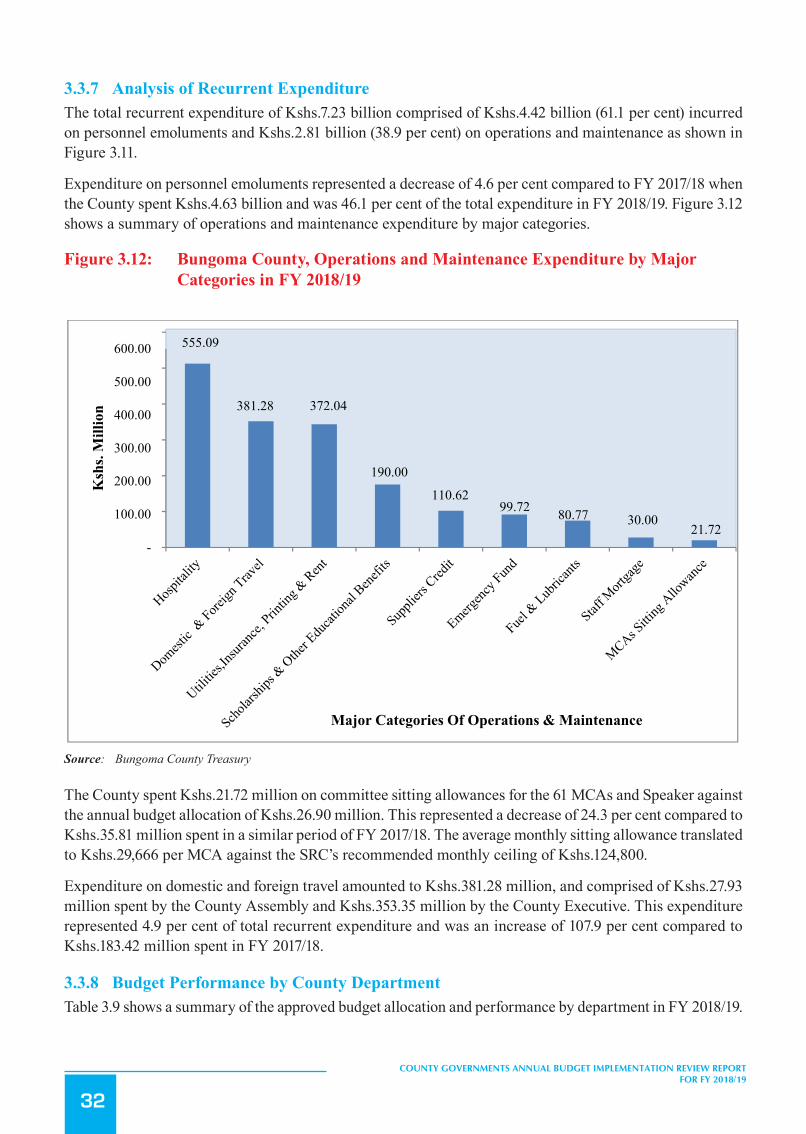
32
COUNTY GOVERNMENTS ANNUAL BUDGET IMPLEMENTATION REVIEW REPORT FOR FY 2018/19
3.3.7 Analysis of Recurrent ExpenditureThe total recurrent expenditure of Kshs.7.23 billion comprised of Kshs.4.42 billion (61.1 per cent) incurred on personnel emoluments and Kshs.2.81 billion (38.9 per cent) on operations and maintenance as shown in Figure 3.11.
Expenditure on personnel emoluments represented a decrease of 4.6 per cent compared to FY 2017/18 when the County spent Kshs.4.63 billion and was 46.1 per cent of the total expenditure in FY 2018/19. Figure 3.12 shows a summary of operations and maintenance expenditure by major categories.
Figure 3.12: Bungoma County, Operations and Maintenance Expenditure by Major Categories in FY 2018/19
66
3.3.7 Analysis of Recurrent Expenditure The total recurrent expenditure of Kshs.7.23 billion comprised of Kshs.4.42 billion (61.1 per cent) incurred on personnel
emoluments and Kshs.2.81 billion (38.9 per cent) on operations and maintenance as shown in Figure 3.11.
Expenditure on personnel emoluments represented a decrease of 4.6 per cent compared to FY 2017/18 when the County
spent Kshs.4.63 billion and was 46.1 per cent of the total expenditure in FY 2018/19. Figure 3.12 shows a summary of
operations and maintenance expenditure by major categories.
Figure 3.12: Bungoma County, Operations and Maintenance Expenditure by Major Categories in FY 2018/19
Source: Bungoma County Treasury
The County spent Kshs.21.72 million on committee sitting allowances for the 61 MCAs and Speaker against the annual
budget allocation of Kshs.26.90 million. This represented a decrease of 24.3 per cent compared to Kshs.35.81 million spent
in a similar period of FY 2017/18. The average monthly sitting allowance translated to Kshs.29,666 per MCA against the
SRC’s recommended monthly ceiling of Kshs.124,800.
Expenditure on domestic and foreign travel amounted to Kshs.381.28 million, and comprised of Kshs.27.93 million spent by
the County Assembly and Kshs.353.35 million by the County Executive. This expenditure represented 4.9 per cent of total
recurrent expenditure and was an increase of 107.9 per cent compared to Kshs.183.42 million spent in FY 2017/18.
3.3.8 Budget Performance by County Department Table 3.9 shows a summary of the approved budget allocation and performance by department in FY 2018/19.
Table 3.9: Bungoma County Budget Performance by Department in FY 2018/19
555.09
381.28 372.04
190.00
110.62 99.72 80.77 30.00
21.72 -
100.00
200.00
300.00
400.00
500.00
600.00
Ksh
s. M
illio
n
Major Categories Of Operations & Maintenance
Source: Bungoma County Treasury
The County spent Kshs.21.72 million on committee sitting allowances for the 61 MCAs and Speaker against the annual budget allocation of Kshs.26.90 million. This represented a decrease of 24.3 per cent compared to Kshs.35.81 million spent in a similar period of FY 2017/18. The average monthly sitting allowance translated to Kshs.29,666 per MCA against the SRC’s recommended monthly ceiling of Kshs.124,800.
Expenditure on domestic and foreign travel amounted to Kshs.381.28 million, and comprised of Kshs.27.93 million spent by the County Assembly and Kshs.353.35 million by the County Executive. This expenditure represented 4.9 per cent of total recurrent expenditure and was an increase of 107.9 per cent compared to Kshs.183.42 million spent in FY 2017/18.
3.3.8 Budget Performance by County DepartmentTable 3.9 shows a summary of the approved budget allocation and performance by department in FY 2018/19.
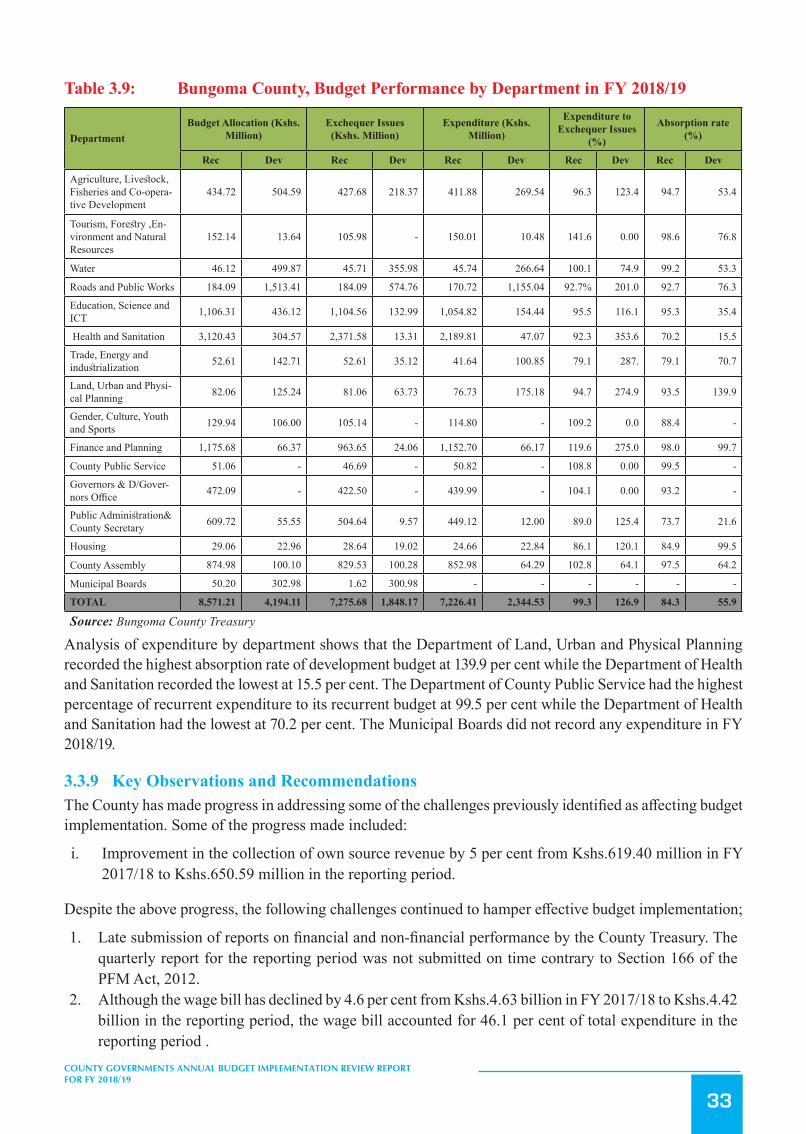
33
COUNTY GOVERNMENTS ANNUAL BUDGET IMPLEMENTATION REVIEW REPORT FOR FY 2018/19
Table 3.9: Bungoma County, Budget Performance by Department in FY 2018/19
DepartmentBudget Allocation (Kshs.
Million)Exchequer Issues
(Kshs. Million)Expenditure (Kshs.
Million)
Expenditure to Exchequer Issues
(%)
Absorption rate (%)
Rec Dev Rec Dev Rec Dev Rec Dev Rec Dev
Agriculture, Livestock, Fisheries and Co-opera-tive Development
434.72 504.59 427.68 218.37 411.88 269.54 96.3 123.4 94.7 53.4
Tourism, Forestry ,En-vironment and Natural Resources
152.14 13.64 105.98 - 150.01 10.48 141.6 0.00 98.6 76.8
Water 46.12 499.87 45.71 355.98 45.74 266.64 100.1 74.9 99.2 53.3
Roads and Public Works 184.09 1,513.41 184.09 574.76 170.72 1,155.04 92.7% 201.0 92.7 76.3
Education, Science and ICT 1,106.31 436.12 1,104.56 132.99 1,054.82 154.44 95.5 116.1 95.3 35.4
Health and Sanitation 3,120.43 304.57 2,371.58 13.31 2,189.81 47.07 92.3 353.6 70.2 15.5
Trade, Energy and industrialization 52.61 142.71 52.61 35.12 41.64 100.85 79.1 287. 79.1 70.7
Land, Urban and Physi-cal Planning 82.06 125.24 81.06 63.73 76.73 175.18 94.7 274.9 93.5 139.9
Gender, Culture, Youth and Sports 129.94 106.00 105.14 - 114.80 - 109.2 0.0 88.4 -
Finance and Planning 1,175.68 66.37 963.65 24.06 1,152.70 66.17 119.6 275.0 98.0 99.7
County Public Service 51.06 - 46.69 - 50.82 - 108.8 0.00 99.5 -
Governors & D/Gover-nors Office 472.09 - 422.50 - 439.99 - 104.1 0.00 93.2 -
Public Administration& County Secretary 609.72 55.55 504.64 9.57 449.12 12.00 89.0 125.4 73.7 21.6
Housing 29.06 22.96 28.64 19.02 24.66 22.84 86.1 120.1 84.9 99.5
County Assembly 874.98 100.10 829.53 100.28 852.98 64.29 102.8 64.1 97.5 64.2
Municipal Boards 50.20 302.98 1.62 300.98 - - - - - -
TOTAL 8,571.21 4,194.11 7,275.68 1,848.17 7,226.41 2,344.53 99.3 126.9 84.3 55.9
Source: Bungoma County Treasury
Analysis of expenditure by department shows that the Department of Land, Urban and Physical Planning recorded the highest absorption rate of development budget at 139.9 per cent while the Department of Health and Sanitation recorded the lowest at 15.5 per cent. The Department of County Public Service had the highest percentage of recurrent expenditure to its recurrent budget at 99.5 per cent while the Department of Health and Sanitation had the lowest at 70.2 per cent. The Municipal Boards did not record any expenditure in FY 2018/19.
3.3.9 Key Observations and RecommendationsThe County has made progress in addressing some of the challenges previously identified as affecting budget implementation. Some of the progress made included:
i. Improvement in the collection of own source revenue by 5 per cent from Kshs.619.40 million in FY 2017/18 to Kshs.650.59 million in the reporting period.
Despite the above progress, the following challenges continued to hamper effective budget implementation;
1. Late submission of reports on financial and non-financial performance by the County Treasury. The quarterly report for the reporting period was not submitted on time contrary to Section 166 of the PFM Act, 2012.
2. Although the wage bill has declined by 4.6 per cent from Kshs.4.63 billion in FY 2017/18 to Kshs.4.42 billion in the reporting period, the wage bill accounted for 46.1 per cent of total expenditure in the reporting period .
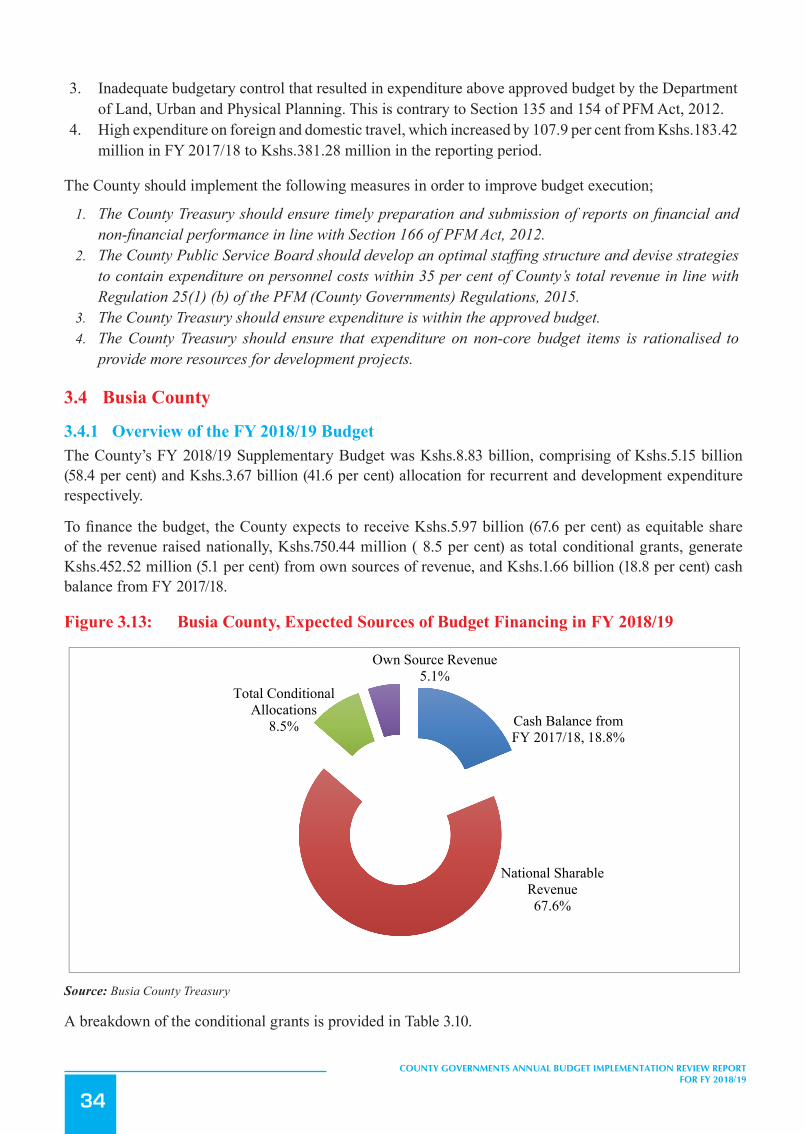
34
COUNTY GOVERNMENTS ANNUAL BUDGET IMPLEMENTATION REVIEW REPORT FOR FY 2018/19
3. Inadequate budgetary control that resulted in expenditure above approved budget by the Department of Land, Urban and Physical Planning. This is contrary to Section 135 and 154 of PFM Act, 2012.
4. High expenditure on foreign and domestic travel, which increased by 107.9 per cent from Kshs.183.42 million in FY 2017/18 to Kshs.381.28 million in the reporting period.
The County should implement the following measures in order to improve budget execution;
1. The County Treasury should ensure timely preparation and submission of reports on financial and non-financial performance in line with Section 166 of PFM Act, 2012.
2. The County Public Service Board should develop an optimal staffing structure and devise strategies to contain expenditure on personnel costs within 35 per cent of County’s total revenue in line with Regulation 25(1) (b) of the PFM (County Governments) Regulations, 2015.
3. The County Treasury should ensure expenditure is within the approved budget.4. The County Treasury should ensure that expenditure on non-core budget items is rationalised to
provide more resources for development projects.
3.4 Busia County
3.4.1 Overview of the FY 2018/19 BudgetThe County’s FY 2018/19 Supplementary Budget was Kshs.8.83 billion, comprising of Kshs.5.15 billion (58.4 per cent) and Kshs.3.67 billion (41.6 per cent) allocation for recurrent and development expenditure respectively.
To finance the budget, the County expects to receive Kshs.5.97 billion (67.6 per cent) as equitable share of the revenue raised nationally, Kshs.750.44 million ( 8.5 per cent) as total conditional grants, generate Kshs.452.52 million (5.1 per cent) from own sources of revenue, and Kshs.1.66 billion (18.8 per cent) cash balance from FY 2017/18.
Figure 3.13: Busia County, Expected Sources of Budget Financing in FY 2018/19
69
Source: Busia County Treasury
A breakdown of the conditional grants is provided in Table 3.10.
3.4.2 Revenue Analysis During FY 2018/19, the County had a total of Khs.8.83 billion available for budget implementation. This amount consisted
of Kshs.5.97 billion received as equitable share of the revenue raised nationally, Kshs.580.59 million as conditional grants,
Kshs.299.37 million generated from own sources of revenue, and a cash balance of Kshs.1.66 billion from FY 2017/18.
Figure 3.14 shows the annual trend in own-source revenue collection from FY 2013/14 to FY 2018/19.
Figure 3.14: Busia County, Own Source Revenue Collection for FY 2013/14 to FY 2018/19
Cash Balance from FY 2017/18, 18.8%
National Sharable Revenue67.6%
Total Conditional Allocations
8.5%
Own Source Revenue5.1%
Source: Busia County Treasury
A breakdown of the conditional grants is provided in Table 3.10.
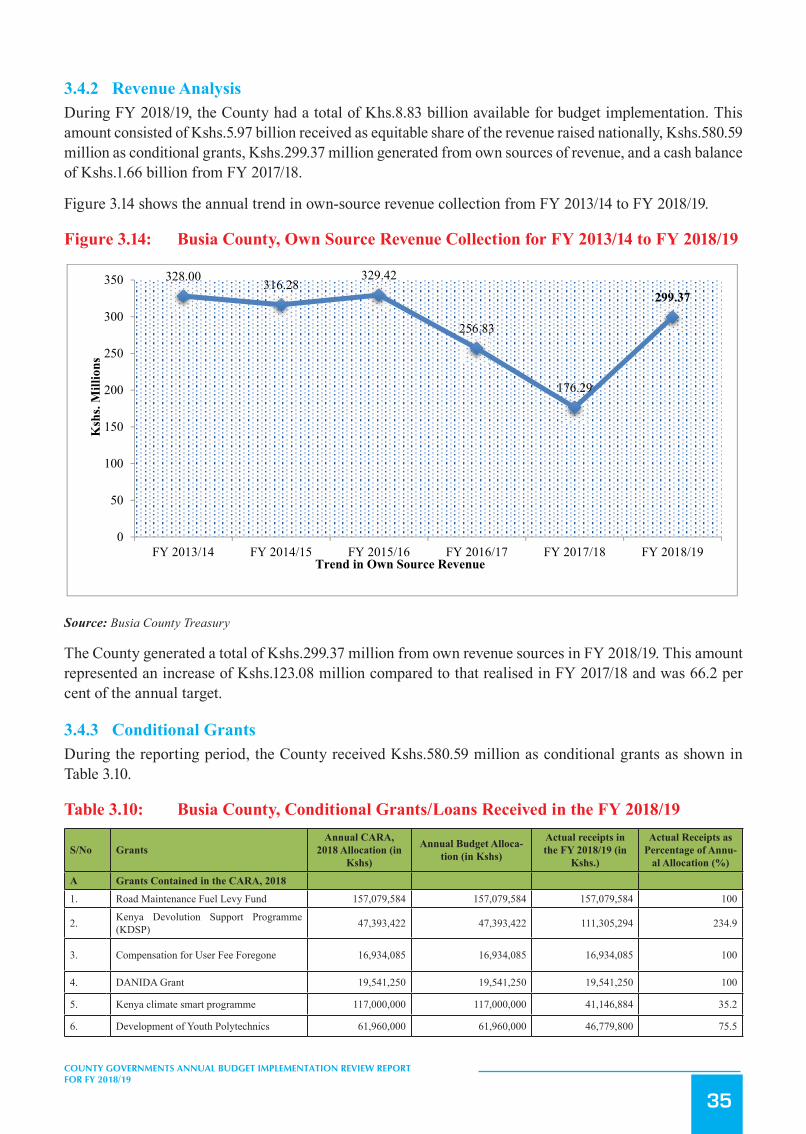
35
COUNTY GOVERNMENTS ANNUAL BUDGET IMPLEMENTATION REVIEW REPORT FOR FY 2018/19
3.4.2 Revenue AnalysisDuring FY 2018/19, the County had a total of Khs.8.83 billion available for budget implementation. This amount consisted of Kshs.5.97 billion received as equitable share of the revenue raised nationally, Kshs.580.59 million as conditional grants, Kshs.299.37 million generated from own sources of revenue, and a cash balance of Kshs.1.66 billion from FY 2017/18.
Figure 3.14 shows the annual trend in own-source revenue collection from FY 2013/14 to FY 2018/19.
Figure 3.14: Busia County, Own Source Revenue Collection for FY 2013/14 to FY 2018/19
70
Source: Busia County Treasury
The County generated a total of Kshs.299.37 million from own revenue sources in FY 2018/19. This amount represented an
increase of Kshs.123.08 million compared to that realised in FY 2017/18 and was 66.2 per cent of the annual target.
3.4.3 Conditional Grants During the reporting period, the County received Kshs.580.59 million as conditional grants as shown in Table 3.10.
Table 3.10: Busia County, Conditional Grants/Loans Received in the FY 2018/19
S/No Grants Annual CARA, 2018 Allocation (in Kshs)
Annual Budget Allocation (in Kshs)
Actual receipts in the FY 2018/19 (in Kshs.)
Actual Receipts as Percentage of Annual Allocation (%)
A Grants Contained in the CARA, 2018 1. Road Maintenance Fuel Levy Fund 157,079,584 157,079,584 157,079,584 100
2. Kenya Devolution Support Programme (KDSP) 47,393,422 47,393,422 111,305,294 234.9
3. Compensation for User Fee Foregone 16,934,085 16,934,085 16,934,085 100
4. DANIDA Grant 19,541,250 19,541,250 19,541,250 100
5. Kenya climate smart programme 117,000,000 117,000,000 41,146,884 35.2
6. Development of Youth Polytechnics 61,960,000 61,960,000 46,779,800 75.5
7. World Bank Loan for Transforming Health System for universal Care Project 86,622,298 86,622,298 37,651,624 43.5
8. Kenya Urban Support Programme 101,071,500 101,071,500 101,071,500 100
9. Kenya Urban Institutional Grant 41,200,000 41,200,000 41,200,000 100
328.00 316.28329.42
256.83
176.29
299.37
0
50
100
150
200
250
300
350
FY 2013/14 FY 2014/15 FY 2015/16 FY 2016/17 FY 2017/18 FY 2018/19
Ksh
s. M
illio
ns
Trend in Own Source Revenue
Source: Busia County Treasury
The County generated a total of Kshs.299.37 million from own revenue sources in FY 2018/19. This amount represented an increase of Kshs.123.08 million compared to that realised in FY 2017/18 and was 66.2 per cent of the annual target.
3.4.3 Conditional GrantsDuring the reporting period, the County received Kshs.580.59 million as conditional grants as shown in Table 3.10.
Table 3.10: Busia County, Conditional Grants/Loans Received in the FY 2018/19
S/No GrantsAnnual CARA,
2018 Allocation (in Kshs)
Annual Budget Alloca-tion (in Kshs)
Actual receipts in the FY 2018/19 (in
Kshs.)
Actual Receipts as Percentage of Annu-
al Allocation (%)
A Grants Contained in the CARA, 2018
1. Road Maintenance Fuel Levy Fund 157,079,584 157,079,584 157,079,584 100
2. Kenya Devolution Support Programme (KDSP) 47,393,422 47,393,422 111,305,294 234.9
3. Compensation for User Fee Foregone 16,934,085 16,934,085 16,934,085 100
4. DANIDA Grant 19,541,250 19,541,250 19,541,250 100
5. Kenya climate smart programme 117,000,000 117,000,000 41,146,884 35.2
6. Development of Youth Polytechnics 61,960,000 61,960,000 46,779,800 75.5

36
COUNTY GOVERNMENTS ANNUAL BUDGET IMPLEMENTATION REVIEW REPORT FOR FY 2018/19
S/No GrantsAnnual CARA,
2018 Allocation (in Kshs)
Annual Budget Alloca-tion (in Kshs)
Actual receipts in the FY 2018/19 (in
Kshs.)
Actual Receipts as Percentage of Annu-
al Allocation (%)
A Grants Contained in the CARA, 2018
7. World Bank Loan for Transforming Health System for universal Care Project 86,622,298 86,622,298 37,651,624 43.5
8. Kenya Urban Support Programme 101,071,500 101,071,500 101,071,500 100
9. Kenya Urban Institutional Grant 41,200,000 41,200,000 41,200,000 100
Sub Total 648,802,139 648,802,139 572,710,021 88.3
B Other Grants
10. Kenya Agricultural Support Grant 21,640,239 21,640,239 7,878,728 36.4
11. Water Tower Protection and Climate Change Mitigation 80,000,000 80,000,000 - -
Sub Total 101,640,239 101,640,239 7,878,728 7.8
Grand Total 750,442,378 750,442,378 580,588,748 77.4
Source: Busia County Treasury
During the reporting period, receipts from the Kenya Devolution Support Programme (KDSP) conditional grant recorded the highest performance in percentage terms, and accounted 234.9 per cent of the annual target.
3.4.4 Exchequer IssuesIn order to implement the budget, the Controller of Budget approved withdrawal of Kshs.7.30 billion from the CRF account. The withdrawals represented 82.7 per cent of the Approved Supplementary Budget and translated to an increase of 20.3 per cent from Kshs.6.07 billion in FY 2017/18 and comprised of Kshs.2.46 billion (33.8 per cent) towards development activities and Kshs.4.84 billion (66.2 per cent) for recurrent expenditure.
3.4.5 Overall Expenditure ReviewA total of Kshs.6.65 billion was spent on both development and recurrent activities. This expenditure represented 91.1 per cent of the total funds released from the CRF account, and was an increase of 14.5 per cent from Kshs.5.81 billion spent in FY 2017/18.
The expenditure excluded pending bills as at June 30, 2019 which amounted to Kshs.285.76 million for development activities and Kshs.549.89 million for recurrent costs.
Expenditure on development programmes amounted to Kshs.1.94 billion while Kshs.4.71 billion was spent on recurrent activities. The development expenditure was 78.7 per cent of the funds released for development programmes, while recurrent expenditure was 97.3 per cent of funds released for recurrent activities.
Development expenditure recorded an absorption rate of 52.8 per cent, which was an increase from 45.1 per cent attained in FY 2017/18. Conversely, recurrent expenditure represented 91.4 per cent of the annual recurrent budget, a decrease from 93.5 per cent recorded in FY 2017/18.
Figure 3.15 presents a comparison between the total expenditure in FY 2018/19 and FY 2017/18.
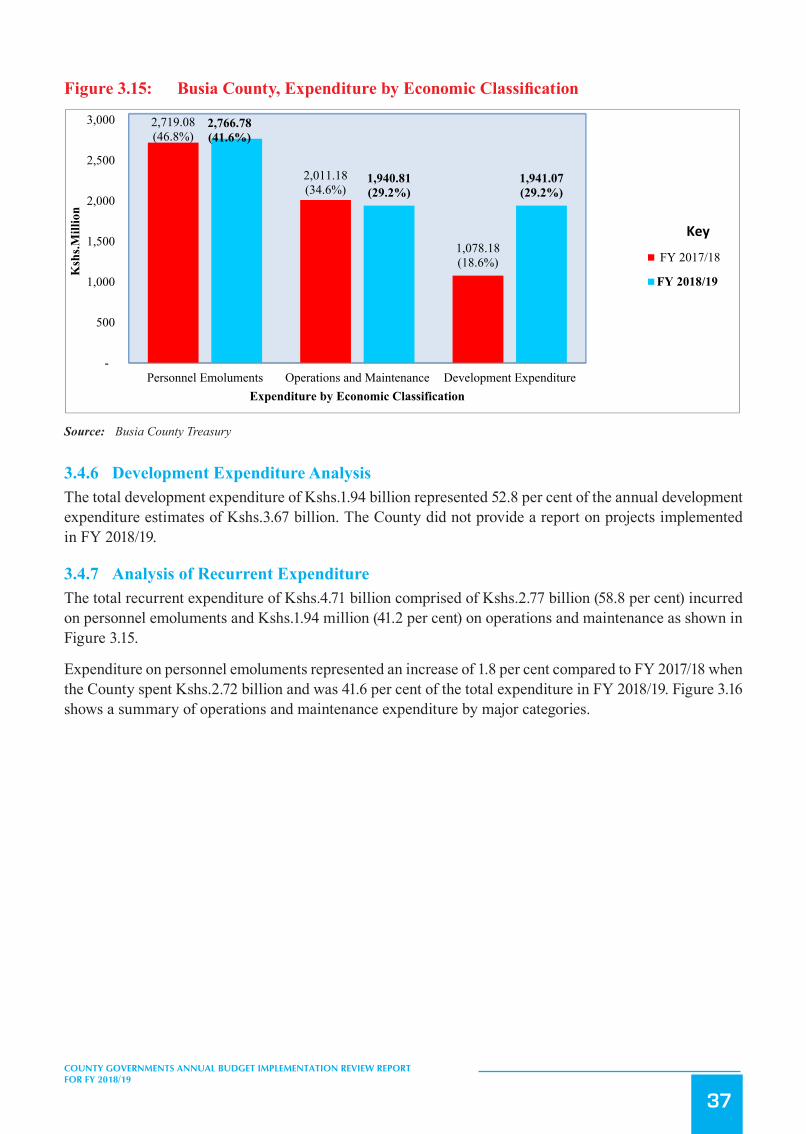
37
COUNTY GOVERNMENTS ANNUAL BUDGET IMPLEMENTATION REVIEW REPORT FOR FY 2018/19
Figure3.15: BusiaCounty,ExpenditurebyEconomicClassification
72
Figure 3.15: Busia County, Expenditure by Economic Classification
Source: Busia County Treasury
3.4.6 Development Expenditure Analysis The total development expenditure of Kshs.1.94 billion represented 52.8 per cent of the annual development expenditure
estimates of Kshs.3.67 billion. The County did not provide a report on projects implemented in FY 2018/19.
3.4.7 Analysis of Recurrent Expenditure The total recurrent expenditure of Kshs.4.71 billion comprised of Kshs.2.77 billion (58.8 per cent) incurred on personnel
emoluments and Kshs.1.94 million (41.2 per cent) on operations and maintenance as shown in Figure 3.3.
Expenditure on personnel emoluments represented an increase of 1.8 per cent compared to FY 2017/18 when the County
spent Kshs.2.72 billion and was 41.6 per cent of the total expenditure in FY 2018/19. Figure 3.4 shows a summary of
operations and maintenance expenditure by major categories.
Figure 3.16: Busia County, Operations and Maintenance Expenditure by Major Categories in FY 2018/19
2,719.08(46.8%)
2,011.18(34.6%)
1,078.18(18.6%)
2,766.78(41.6%)
1,940.81(29.2%)
1,941.07(29.2%)
-
500
1,000
1,500
2,000
2,500
3,000
Personnel Emoluments Operations and Maintenance Development Expenditure
Ksh
s.Mill
ion
Expenditure by Economic Classification
FY 2017/18
FY 2018/19
Key
Source: Busia County Treasury
3.4.6 Development Expenditure AnalysisThe total development expenditure of Kshs.1.94 billion represented 52.8 per cent of the annual development expenditure estimates of Kshs.3.67 billion. The County did not provide a report on projects implemented in FY 2018/19.
3.4.7 Analysis of Recurrent ExpenditureThe total recurrent expenditure of Kshs.4.71 billion comprised of Kshs.2.77 billion (58.8 per cent) incurred on personnel emoluments and Kshs.1.94 million (41.2 per cent) on operations and maintenance as shown in Figure 3.15.
Expenditure on personnel emoluments represented an increase of 1.8 per cent compared to FY 2017/18 when the County spent Kshs.2.72 billion and was 41.6 per cent of the total expenditure in FY 2018/19. Figure 3.16 shows a summary of operations and maintenance expenditure by major categories.
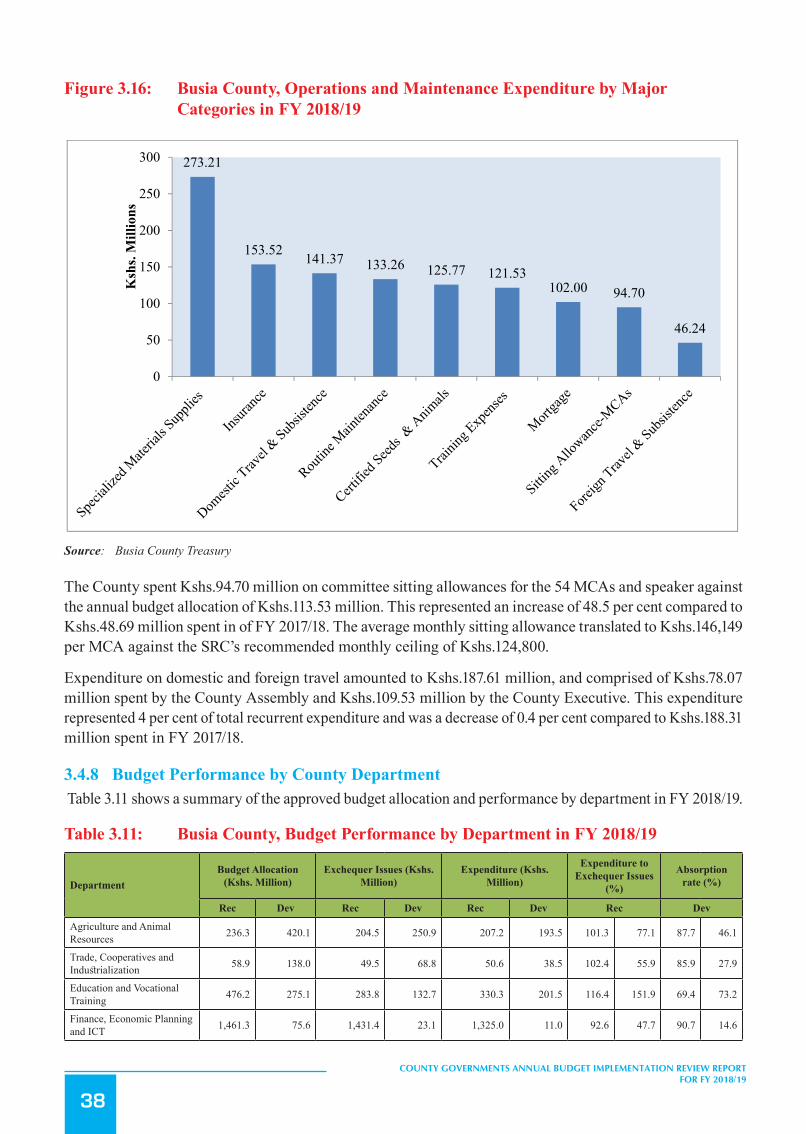
38
COUNTY GOVERNMENTS ANNUAL BUDGET IMPLEMENTATION REVIEW REPORT FOR FY 2018/19
Figure 3.16: Busia County, Operations and Maintenance Expenditure by Major Categories in FY 2018/19
73
Source: Busia County Treasury
The County spent Kshs.94.70 million on committee sitting allowances for the 54 MCAs and speaker against the annual
budget allocation of Kshs.113.53 million. This represented an increase of 48.5 per cent compared to Kshs.48.69 million
spent in of FY 2017/18. The average monthly sitting allowance translated to Kshs.146,149 per MCA against the SRC’s
recommended monthly ceiling of Kshs.124,800.
Expenditure on domestic and foreign travel amounted to Kshs.187.61 million, and comprised of Kshs.78.07 million spent by
the County Assembly and Kshs.109.53 million by the County Executive. This expenditure represented 4 per cent of total
recurrent expenditure and was a decrease of 0.4 per cent compared to Kshs.188.31 million spent in FY 2017/18.
3.4.8 Budget Performance by County Department Table 3.11 shows a summary of the approved budget allocation and performance by department in FY 2018/19.
Table 3.11: Busia County, Budget Performance by Department in FY 2018/19
Department Budget Allocation (Kshs. Million)
Exchequer Issues (Kshs. Million)
Expenditure (Kshs. Million)
Expenditure to Exchequer Issues (%)
Absorption rate (%)
Rec Dev Rec Dev Rec Dev Rec Dev Agriculture and Animal Resources 236.3 420.1 204.5 250.9 207.2 193.5 101.3 77.1 87.7 46.1
Trade, Cooperatives and Industrialization 58.9 138.0 49.5 68.8 50.6 38.5 102.4 55.9 85.9 27.9
Education and Vocational Training 476.2 275.1 283.8 132.7 330.3 201.5 116.4 151.9 69.4 73.2
Finance, Economic Planning and ICT 1,461.3 75.6 1,431.4 23.1 1,325.0 11.0 92.6 47.7 90.7 14.6
Youth, Culture, sports, Tourism and Social Services
76.9 110.6 76.9 85.3 74.3 109.3 96.5 128.2 96.5 98.9
273.21
153.52 141.37 133.26 125.77 121.53102.00 94.70
46.24
0
50
100
150
200
250
300
Ksh
s. M
illio
ns
Source: Busia County Treasury
The County spent Kshs.94.70 million on committee sitting allowances for the 54 MCAs and speaker against the annual budget allocation of Kshs.113.53 million. This represented an increase of 48.5 per cent compared to Kshs.48.69 million spent in of FY 2017/18. The average monthly sitting allowance translated to Kshs.146,149 per MCA against the SRC’s recommended monthly ceiling of Kshs.124,800.
Expenditure on domestic and foreign travel amounted to Kshs.187.61 million, and comprised of Kshs.78.07 million spent by the County Assembly and Kshs.109.53 million by the County Executive. This expenditure represented 4 per cent of total recurrent expenditure and was a decrease of 0.4 per cent compared to Kshs.188.31 million spent in FY 2017/18.
3.4.8 Budget Performance by County Department Table 3.11 shows a summary of the approved budget allocation and performance by department in FY 2018/19.
Table 3.11: Busia County, Budget Performance by Department in FY 2018/19
DepartmentBudget Allocation
(Kshs. Million)Exchequer Issues (Kshs.
Million)Expenditure (Kshs.
Million)
Expenditure to Exchequer Issues
(%)
Absorption rate (%)
Rec Dev Rec Dev Rec Dev Rec Dev
Agriculture and Animal Resources 236.3 420.1 204.5 250.9 207.2 193.5 101.3 77.1 87.7 46.1
Trade, Cooperatives and Industrialization 58.9 138.0 49.5 68.8 50.6 38.5 102.4 55.9 85.9 27.9
Education and Vocational Training 476.2 275.1 283.8 132.7 330.3 201.5 116.4 151.9 69.4 73.2
Finance, Economic Planning and ICT 1,461.3 75.6 1,431.4 23.1 1,325.0 11.0 92.6 47.7 90.7 14.6
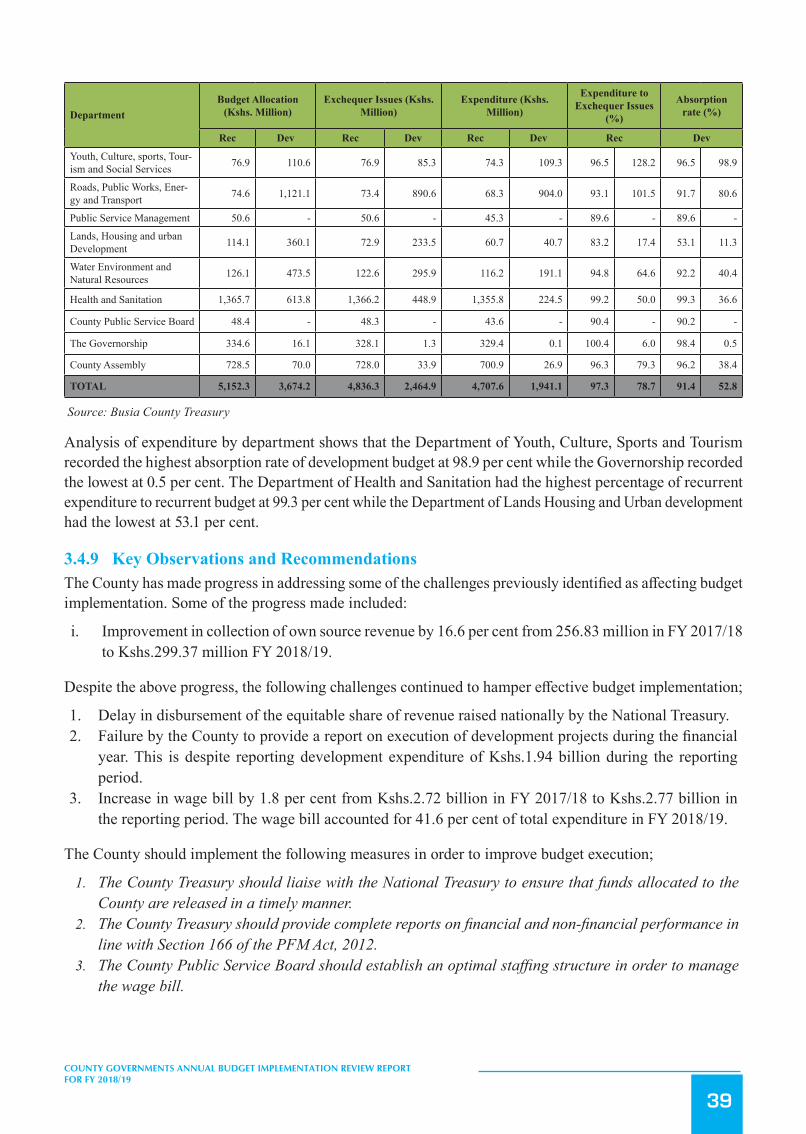
39
COUNTY GOVERNMENTS ANNUAL BUDGET IMPLEMENTATION REVIEW REPORT FOR FY 2018/19
DepartmentBudget Allocation
(Kshs. Million)Exchequer Issues (Kshs.
Million)Expenditure (Kshs.
Million)
Expenditure to Exchequer Issues
(%)
Absorption rate (%)
Rec Dev Rec Dev Rec Dev Rec Dev
Youth, Culture, sports, Tour-ism and Social Services 76.9 110.6 76.9 85.3 74.3 109.3 96.5 128.2 96.5 98.9
Roads, Public Works, Ener-gy and Transport 74.6 1,121.1 73.4 890.6 68.3 904.0 93.1 101.5 91.7 80.6
Public Service Management 50.6 - 50.6 - 45.3 - 89.6 - 89.6 -
Lands, Housing and urban Development 114.1 360.1 72.9 233.5 60.7 40.7 83.2 17.4 53.1 11.3
Water Environment and Natural Resources 126.1 473.5 122.6 295.9 116.2 191.1 94.8 64.6 92.2 40.4
Health and Sanitation 1,365.7 613.8 1,366.2 448.9 1,355.8 224.5 99.2 50.0 99.3 36.6
County Public Service Board 48.4 - 48.3 - 43.6 - 90.4 - 90.2 -
The Governorship 334.6 16.1 328.1 1.3 329.4 0.1 100.4 6.0 98.4 0.5
County Assembly 728.5 70.0 728.0 33.9 700.9 26.9 96.3 79.3 96.2 38.4
TOTAL 5,152.3 3,674.2 4,836.3 2,464.9 4,707.6 1,941.1 97.3 78.7 91.4 52.8
Source: Busia County Treasury
Analysis of expenditure by department shows that the Department of Youth, Culture, Sports and Tourism recorded the highest absorption rate of development budget at 98.9 per cent while the Governorship recorded the lowest at 0.5 per cent. The Department of Health and Sanitation had the highest percentage of recurrent expenditure to recurrent budget at 99.3 per cent while the Department of Lands Housing and Urban development had the lowest at 53.1 per cent.
3.4.9 Key Observations and RecommendationsThe County has made progress in addressing some of the challenges previously identified as affecting budget implementation. Some of the progress made included:
i. Improvement in collection of own source revenue by 16.6 per cent from 256.83 million in FY 2017/18 to Kshs.299.37 million FY 2018/19.
Despite the above progress, the following challenges continued to hamper effective budget implementation;
1. Delay in disbursement of the equitable share of revenue raised nationally by the National Treasury.2. Failure by the County to provide a report on execution of development projects during the financial
year. This is despite reporting development expenditure of Kshs.1.94 billion during the reporting period.
3. Increase in wage bill by 1.8 per cent from Kshs.2.72 billion in FY 2017/18 to Kshs.2.77 billion in the reporting period. The wage bill accounted for 41.6 per cent of total expenditure in FY 2018/19.
The County should implement the following measures in order to improve budget execution;
1. The County Treasury should liaise with the National Treasury to ensure that funds allocated to the County are released in a timely manner.
2. The County Treasury should provide complete reports on financial and non-financial performance in line with Section 166 of the PFM Act, 2012.
3. The County Public Service Board should establish an optimal staffing structure in order to manage the wage bill.

40
COUNTY GOVERNMENTS ANNUAL BUDGET IMPLEMENTATION REVIEW REPORT FOR FY 2018/19
3.5 Elgeyo Marakwet County
3.5.1 Overview of the FY 2018/19 BudgetThe County’s FY 2018/19 Supplementary Budget was Kshs.5.60 billion, comprising of Kshs.3.14 billion (56.1 per cent) and Kshs.2.47 billion (43.9 per cent) allocation for recurrent and expenditure respectively.
To finance the budget, the County expects to receive Kshs.3.77 billion (67.3 per cent) as equitable share of the revenue raised nationally, Kshs.959.44 billion (17.1 per cent) as total conditional grants, generate Kshs.130.44 million (2.3 per cent) from own sources of revenue, Kshs.620.90 million (11.1 per cent) cash balance from FY 2017/18, and Kshs.122.30 million (2.2 per cent) from other sources.
Figure 3.17: Elgeyo Marakwet County, Expected Sources of Budget Financing in FY 2018/19
75
3.5 Elgeyo Marakwet County
3.5.1 Overview of the FY 2018/19 Budget The County’s FY 2018/19 Supplementary Budget was Kshs.5.60 billion, comprising of Kshs.3.14 billion (56.1 per cent) and
Kshs.2.47 billion (43.9 per cent) allocation for recurrent and expenditure respectively.
To finance the budget, the County expects to receive Kshs.3.77 billion (67.3 per cent) as equitable share of the revenue
raised nationally, Kshs.959.44 billion (17.1 per cent) as total conditional grants, generate Kshs.130.44 million (2.3 per cent)
from own sources of revenue, Kshs.620.90 million (11.1 per cent) cash balance from FY 2017/18, and Kshs.122.30 million
(2.2 per cent) from other sources.
Figure 3.17: Elgeyo Marakwet County, Expected Sources of Budget Financing in FY 2018/19
Source: Elgeyo Marakwet County Treasury
A breakdown of the conditional grants is provided in Table 3.12.
3.5.2 Revenue Analysis During FY 2018/19, the County had a total of Khs.4.94 billion available for budget implementation. This amount consisted
of Kshs.3.77 billion received as equitable share of the revenue raised nationally, Kshs.343.54 million as conditional grants,
Kshs.141.61 million generated from own sources of revenue, cash balance of Kshs.620.90 million from FY 2017/18 and
Kshs.66.50 million from other received revenue.
Figure 3.18 shows the annual trend in own-source revenue collection from FY 2013/14 to FY 2018/19.
Figure 3.18: Elgeyo Marakwet County, Own Source Revenue Collection for FY 2013/14 to FY 2018/19
Cash Balance from FY 2017/18, 11.1%
National Sharable Revenue67.3%
Total Conditional Allocations
17.1%
Own Source Revenue2.3%
Other Revenues Expected During the
year2.2%
Source: Elgeyo Marakwet County Treasury
A breakdown of the conditional grants is provided in Table 3.12.
3.5.2 Revenue AnalysisDuring FY 2018/19, the County had a total of Khs.4.94 billion available for budget implementation. This amount consisted of Kshs.3.77 billion received as equitable share of the revenue raised nationally, Kshs.343.54 million as conditional grants, Kshs.141.61 million generated from own sources of revenue, cash balance of Kshs.620.90 million from FY 2017/18 and Kshs.66.50 million from other received revenue.
Figure 3.18 shows the annual trend in own-source revenue collection from FY 2013/14 to FY 2018/19.
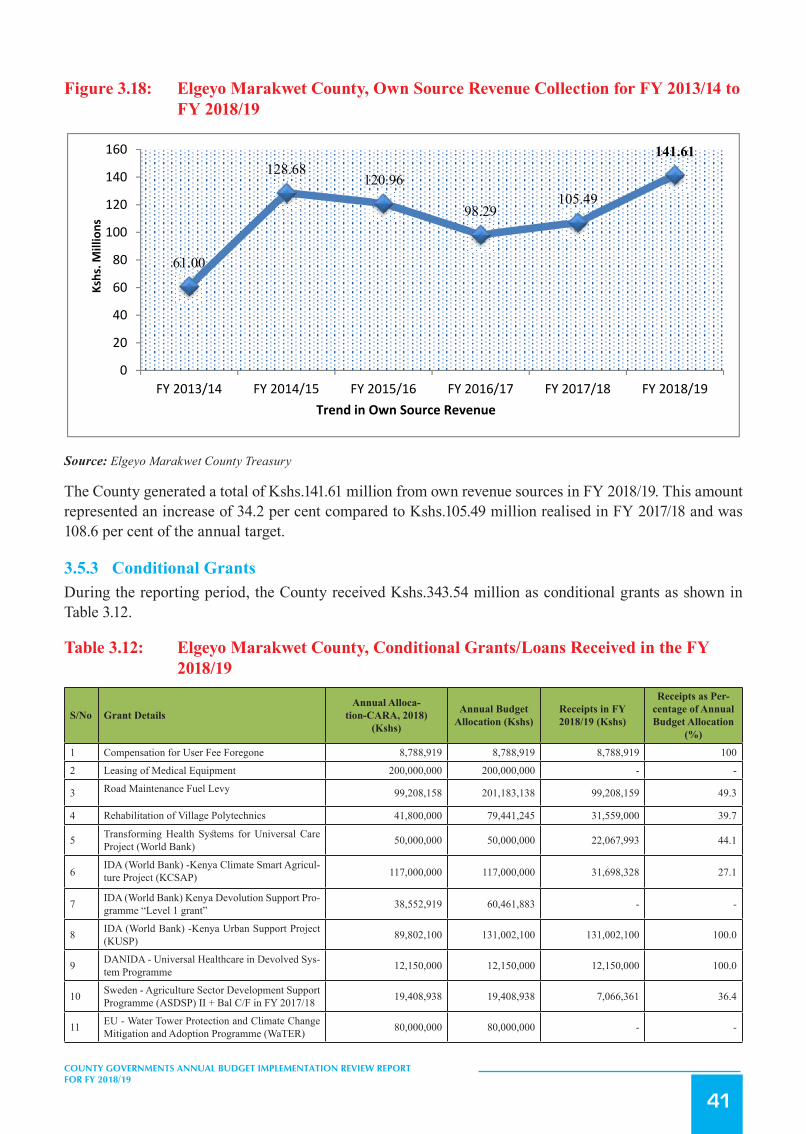
41
COUNTY GOVERNMENTS ANNUAL BUDGET IMPLEMENTATION REVIEW REPORT FOR FY 2018/19
Figure 3.18: Elgeyo Marakwet County, Own Source Revenue Collection for FY 2013/14 to FY 2018/19
76
Source: Elgeyo Marakwet County Treasury
The County generated a total of Kshs.141.61 million from own revenue sources in FY 2018/19. This amount represented an
increase of 34.2 per cent compared to Kshs.105.49 million realised in FY 2017/18 and was 108.6 per cent of the annual
target.
3.5.3 Conditional Grants During the reporting period, the County received Kshs.343.54 million as conditional grants as shown in Table 3.12.
Table 3.12: Elgeyo Marakwet County, Conditional Grants/Loans Received in the FY 2018/19
S/No Grant Details
Annual Allocation-CARA, 2018) (Kshs)
Annual Budget Allocation (Kshs)
Receipts in FY 2018/19 (Kshs)
Receipts as Percentage of Annual Budget Allocation (%)
1 Compensation for User Fee Foregone 8,788,919 8,788,919 8,788,919 100
2 Leasing of Medical Equipment 200,000,000 200,000,000 - -
3 Road Maintenance Fuel Levy
99,208,158 201,183,138 99,208,159 49.3
4 Rehabilitation of Village Polytechnics
41,800,000 79,441,245 31,559,000 39.7
5 Transforming Health Systems for Universal Care Project (World Bank) 50,000,000 50,000,000 22,067,993 44.1
6 IDA (World Bank) -Kenya Climate Smart Agriculture Project (KCSAP) 117,000,000 117,000,000 31,698,328 27.1
61.00
128.68120.96
98.29105.49
141.61
0
20
40
60
80
100
120
140
160
FY 2013/14 FY 2014/15 FY 2015/16 FY 2016/17 FY 2017/18 FY 2018/19
Kshs. M
illions
Trend in Own Source Revenue
Source: Elgeyo Marakwet County Treasury
The County generated a total of Kshs.141.61 million from own revenue sources in FY 2018/19. This amount represented an increase of 34.2 per cent compared to Kshs.105.49 million realised in FY 2017/18 and was 108.6 per cent of the annual target.
3.5.3 Conditional GrantsDuring the reporting period, the County received Kshs.343.54 million as conditional grants as shown in Table 3.12.
Table 3.12: Elgeyo Marakwet County, Conditional Grants/Loans Received in the FY 2018/19
S/No Grant DetailsAnnual Alloca-
tion-CARA, 2018)(Kshs)
Annual Budget Allocation (Kshs)
Receipts in FY 2018/19 (Kshs)
Receipts as Per-centage of Annual Budget Allocation
(%)
1 Compensation for User Fee Foregone 8,788,919 8,788,919 8,788,919 100
2 Leasing of Medical Equipment 200,000,000 200,000,000 - -
3 Road Maintenance Fuel Levy 99,208,158 201,183,138 99,208,159 49.3
4 Rehabilitation of Village Polytechnics 41,800,000 79,441,245 31,559,000 39.7
5 Transforming Health Systems for Universal Care Project (World Bank) 50,000,000 50,000,000 22,067,993 44.1
6IDA (World Bank) -Kenya Climate Smart Agricul-ture Project (KCSAP) 117,000,000 117,000,000 31,698,328 27.1
7 IDA (World Bank) Kenya Devolution Support Pro-gramme “Level 1 grant” 38,552,919 60,461,883 - -
8 IDA (World Bank) -Kenya Urban Support Project (KUSP) 89,802,100 131,002,100 131,002,100 100.0
9 DANIDA - Universal Healthcare in Devolved Sys-tem Programme 12,150,000 12,150,000 12,150,000 100.0
10 Sweden - Agriculture Sector Development Support Programme (ASDSP) II + Bal C/F in FY 2017/18 19,408,938 19,408,938 7,066,361 36.4
11 EU - Water Tower Protection and Climate Change Mitigation and Adoption Programme (WaTER) 80,000,000 80,000,000 - -

42
COUNTY GOVERNMENTS ANNUAL BUDGET IMPLEMENTATION REVIEW REPORT FOR FY 2018/19
S/No Grant DetailsAnnual Alloca-
tion-CARA, 2018)(Kshs)
Annual Budget Allocation (Kshs)
Receipts in FY 2018/19 (Kshs)
Receipts as Per-centage of Annual Budget Allocation
(%)
12IDA (World Bank) credit: Kenya Urban Support Project (KUSP) - Urban Institutional Grants (UIG) + Bal C/F in FY 2017/18
41,200,000 - - -
Sub Total 797,911,034 959,436,223 343,540,860 35.8
Other Revenue Sources
13 World Bank – Maternal Health - 1,009,812 - -
14 Savings from Staff Exists - 54,797,763 - -
15 Retention Monies - 66,495,981 66,495,981 100.0
Sub Total - 122,303,556 66,495,981 54.4
Grand Total 797,911,034 1,081,739,779 410,036,840 37.9
Source: Elgeyo Marakwet County Treasury
During the reporting period, receipts from the Compensation for User Fee Foregone, and Kenya Urban Support Project (KUSP) conditional grants recorded the highest performance in percentage terms, and accounted 100 per cent of the annual target.
3.5.4 Exchequer IssuesIn order to implement the budget, the Controller of Budget approved withdrawal of Kshs.4.47 billion from the CRF account. The withdrawals represented 79.8 per cent of the Approved Supplementary Budget and translated to an increase of 9.8 per cent from Kshs.4.07 billion in FY 2017/18 and comprised of Kshs.1.35 billion (30.2 per cent) towards development activities and Kshs.3.12 billion (69.8 per cent) for recurrent expenditure.
3.5.5 Overall Expenditure ReviewA total of Kshs.4.43 billion was spent on both development and recurrent activities. This expenditure represented 99.1 per cent of the total funds released from the CRF account, and was an increase of 14.5 per cent from Kshs.3.87 billion spent in FY 2017/18.
The expenditure excluded pending bills as at June 30, 2019 which amounted to Kshs.637.60 million for development activities and Kshs.37.27 million for recurrent costs.
Expenditure on development programmes amounted to Kshs.1.33 billion while Kshs.3.09 billion was spent on recurrent activities. The development expenditure was 98.7 per cent of the funds released for development programmes, while recurrent expenditure was 99.2 per cent of funds released for recurrent activities.
Development expenditure recorded an absorption rate of 54.1 per cent, which was an increase from 49 per cent attained in FY 2017/18. Conversely, recurrent expenditure represented 98.4 per cent of the annual recurrent budget, an increase from 97.2 per cent recorded in FY 2017/18.
Figure 3.19 presents a comparison between the total expenditure in FY 2018/19 and FY 2017/18.
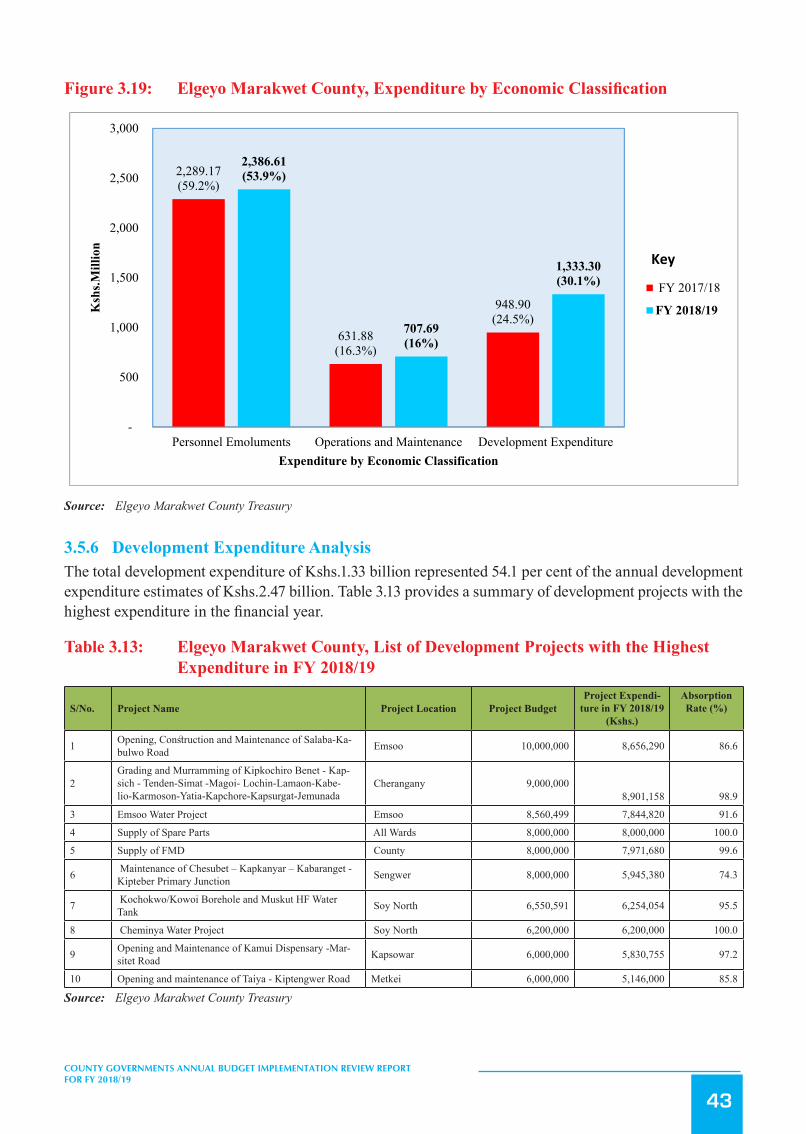
43
COUNTY GOVERNMENTS ANNUAL BUDGET IMPLEMENTATION REVIEW REPORT FOR FY 2018/19
Figure3.19: ElgeyoMarakwetCounty,ExpenditurebyEconomicClassification
78
Development expenditure recorded an absorption rate of 54.1 per cent, which was an increase from 49 per cent attained in
FY 2017/18. Conversely, recurrent expenditure represented 98.4 per cent of the annual recurrent budget, an increase from
97.2 per cent recorded in FY 2017/18.
Figure 3.19 presents a comparison between the total expenditure in FY 2018/19 and FY 2017/18.
Figure 3.19: Elgeyo Marakwet County, Expenditure by Economic Classification
Source: Elgeyo Marakwet County Treasury
3.5.6 Development Expenditure Analysis The total development expenditure of Kshs.1.33 billion represented 54.1 per cent of the annual development expenditure
estimates of Kshs.2.47 billion. Figure 3.13 provides a summary of development projects with the highest expenditure in the
financial year.
Table 3.13: Elgeyo Marakwet County, List of Development Projects with the Highest Expenditure in FY 2018/19
S/No. Project Name Project Location Project Budget
Project Expenditure in FY 2018/19 (Kshs.)
Absorption Rate (%)
1 Opening, Construction and Maintenance of Salaba-Kabulwo Road
Emsoo 10,000,000 8,656,290 86.6
2 Grading and Murramming of Kipkochiro Benet - Kapsich - Tenden-Simat -Magoi- Lochin-Lamaon-Kabelio-Karmoson-Yatia-Kapch
Cherangany 9,000,000 8,901,158
98.9
2,289.17(59.2%)
631.88(16.3%)
948.90(24.5%)
2,386.61(53.9%)
707.69(16%)
1,333.30(30.1%)
-
500
1,000
1,500
2,000
2,500
3,000
Personnel Emoluments Operations and Maintenance Development Expenditure
Ksh
s.Mill
ion
Expenditure by Economic Classification
FY 2017/18
FY 2018/19
Key
Source: Elgeyo Marakwet County Treasury
3.5.6 Development Expenditure AnalysisThe total development expenditure of Kshs.1.33 billion represented 54.1 per cent of the annual development expenditure estimates of Kshs.2.47 billion. Table 3.13 provides a summary of development projects with the highest expenditure in the financial year.
Table 3.13: Elgeyo Marakwet County, List of Development Projects with the Highest Expenditure in FY 2018/19
S/No. Project Name Project Location Project BudgetProject Expendi-
ture in FY 2018/19 (Kshs.)
Absorption Rate (%)
1 Opening, Construction and Maintenance of Salaba-Ka-bulwo Road Emsoo 10,000,000 8,656,290 86.6
2Grading and Murramming of Kipkochiro Benet - Kap-sich - Tenden-Simat -Magoi- Lochin-Lamaon-Kabe-lio-Karmoson-Yatia-Kapchore-Kapsurgat-Jemunada
Cherangany 9,000,0008,901,158 98.9
3 Emsoo Water Project Emsoo 8,560,499 7,844,820 91.6
4 Supply of Spare Parts All Wards 8,000,000 8,000,000 100.0
5 Supply of FMD County 8,000,000 7,971,680 99.6
6 Maintenance of Chesubet – Kapkanyar – Kabaranget - Kipteber Primary Junction Sengwer 8,000,000 5,945,380 74.3
7 Kochokwo/Kowoi Borehole and Muskut HF Water Tank Soy North 6,550,591 6,254,054 95.5
8 Cheminya Water Project Soy North 6,200,000 6,200,000 100.0
9 Opening and Maintenance of Kamui Dispensary -Mar-sitet Road Kapsowar 6,000,000 5,830,755 97.2
10 Opening and maintenance of Taiya - Kiptengwer Road Metkei 6,000,000 5,146,000 85.8
Source: Elgeyo Marakwet County Treasury
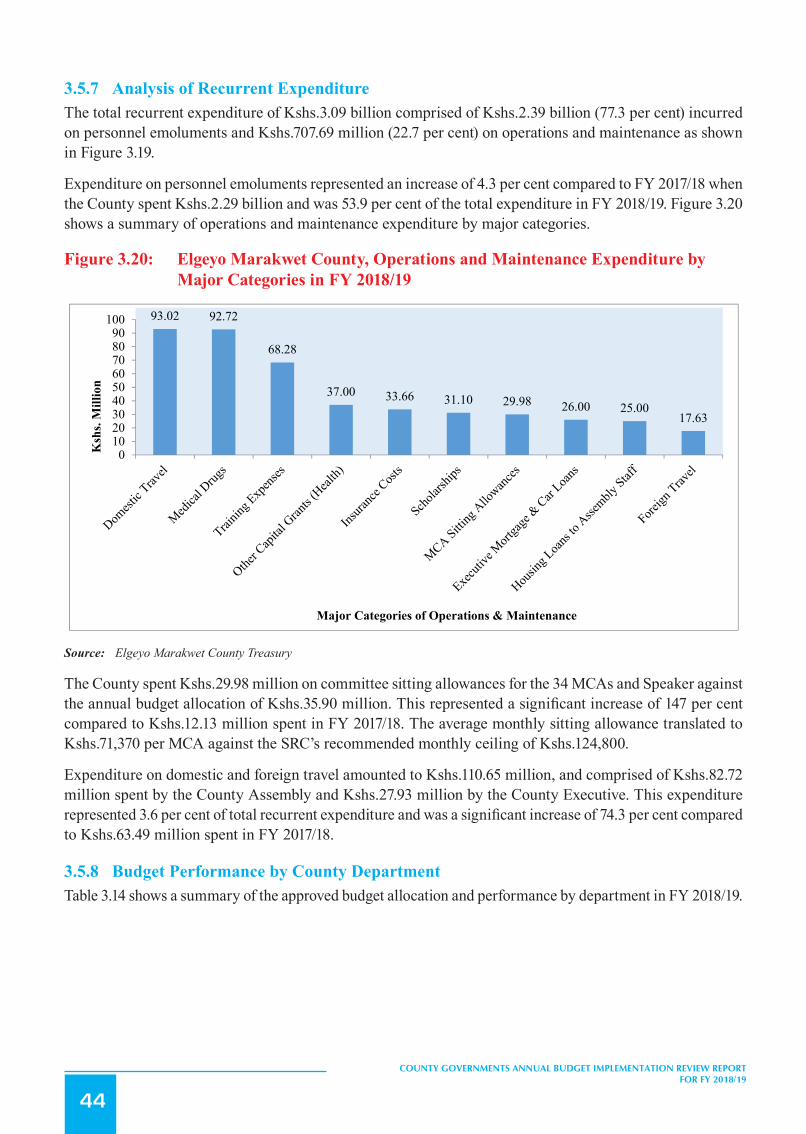
44
COUNTY GOVERNMENTS ANNUAL BUDGET IMPLEMENTATION REVIEW REPORT FOR FY 2018/19
3.5.7 Analysis of Recurrent ExpenditureThe total recurrent expenditure of Kshs.3.09 billion comprised of Kshs.2.39 billion (77.3 per cent) incurred on personnel emoluments and Kshs.707.69 million (22.7 per cent) on operations and maintenance as shown in Figure 3.19.
Expenditure on personnel emoluments represented an increase of 4.3 per cent compared to FY 2017/18 when the County spent Kshs.2.29 billion and was 53.9 per cent of the total expenditure in FY 2018/19. Figure 3.20 shows a summary of operations and maintenance expenditure by major categories.
Figure 3.20: Elgeyo Marakwet County, Operations and Maintenance Expenditure by Major Categories in FY 2018/19
S/No. Project Name Project Location Project Budget
Project Expenditure in FY 2018/19 (Kshs.)
Absorption Rate (%)
ore-Kapsurgat-Jemunada
3 Emsoo Water Project Emsoo 8,560,499 7,844,820 91.6
4 Supply of Spare Parts All Wards 8,000,000 8,000,000 100.0
5 Supply of FMD County 8,000,000 7,971,680 99.6
6 Maintenance of Chesubet – Kapkanyar –
Kabaranget - Kipteber Primary Junction Sengwer 8,000,000 5,945,380 74.3
7 Kochokwo/Kowoi Borehole and Muskut HF
Water Tank Soy North 6,550,591 6,254,054 95.5
8 Cheminya Water Project Soy North 6,200,000 6,200,000 100.0
9 Opening and Maintenance of Kamui Dispensary-Marsitet Road Kapsowar 6,000,000 5,830,755 97.2
10 Opening and maintenance of Taiya - KiptengwerRoad Metkei 6,000,000 5,146,000 85.8
Source: Elgeyo Marakwet County Treasury
3.5.7 Analysis of Recurrent Expenditure The total recurrent expenditure of Kshs.3.09 billion comprised of Kshs.2.39 billion (77.3 per cent) incurred on personnel
emoluments and Kshs.707.69 million (22.7 per cent) on operations and maintenance as shown in Figure 3.19.
Expenditure on personnel emoluments represented an increase of 4.3 per cent compared to FY 2017/18 when the County
spent Kshs.2.29 billion and was 53.9 per cent of the total expenditure in FY 2018/19. Figure 3.20 shows a summary of
operations and maintenance expenditure by major categories.
Figure 3.20: Elgeyo Marakwet County, Operations and Maintenance Expenditure by Major Categories in FY 2018/19
93.02 92.72
68.28
37.00 33.66 31.10 29.98 26.00 25.0017.63
0102030405060708090
100
Ksh
s. M
illio
n
Major Categories of Operations & Maintenance
Source: Elgeyo Marakwet County Treasury
The County spent Kshs.29.98 million on committee sitting allowances for the 34 MCAs and Speaker against the annual budget allocation of Kshs.35.90 million. This represented a significant increase of 147 per cent compared to Kshs.12.13 million spent in FY 2017/18. The average monthly sitting allowance translated to Kshs.71,370 per MCA against the SRC’s recommended monthly ceiling of Kshs.124,800.
Expenditure on domestic and foreign travel amounted to Kshs.110.65 million, and comprised of Kshs.82.72 million spent by the County Assembly and Kshs.27.93 million by the County Executive. This expenditure represented 3.6 per cent of total recurrent expenditure and was a significant increase of 74.3 per cent compared to Kshs.63.49 million spent in FY 2017/18.
3.5.8 Budget Performance by County DepartmentTable 3.14 shows a summary of the approved budget allocation and performance by department in FY 2018/19.

45
COUNTY GOVERNMENTS ANNUAL BUDGET IMPLEMENTATION REVIEW REPORT FOR FY 2018/19
Table 3.14: Elgeyo Marakwet County, Budget Performance by Department in FY 2018/19
DepartmentAnnual Budget Allocation
(Kshs. Million)Exchequer Issues
(Kshs. Million)Expenditure (Kshs.
Million)
Expenditure to Exchequer Issues
(%)
Absorption Rate (%)
Rec Dev Rec Dev Rec Dev Rec Dev Rec Dev
County Assembly 566.84 1.13 566.64 1.13 566.48 1.13 100 100 99.9 100.
Office of the Governor 161.59 - 160.87 - 159.97 - 99.4 - 99.0 -
Finance and Economic Planning 243.24 - 235.09 - 219.38 - 93.3 - 90.2 -
Agriculture, and Irri-gation 96.76 277.93 96.66 147.62 95.75 117.37 79.5 79.5 99.0 42.2
Education and Tech. Training 212.63 384.99 212.55 198.87 211.52 241.22 99.5 121.3 99.5 62.7
Health and Sanitation 1,384.06 478.89 1,378.81 149.76 1,378.90 137.59 100.0 91.9 99.6 28.7
Water, Lands, Environ-ment & Climate Change 73.79 553.57 73.42 368.73 73.16 324.68 99.6 88.1 99.1 58.7
Roads, Public Works and Transport 65.28 478.05 65.10 292.82 63.97 328.28 98.3 112.1 98.0 68.7
Tourism, Culture, Wild-life, Trade & Industry 36.93 54.62 36.38 35.12 36.39 37.86 100.0 107.8 98.5 69.3
Youth Affairs, Sports, ICT & Social Services 36.77 117.76 36.39 75.22 35.07 72.02 96.4 95.7 95.4 61.2
Public Service Man-agement & County Administration
108.49 76.67 108.01 43.48 107.28 35.01 99.3 80.5 98.9 45.7
County Public Service Board 55.44 0.48 54.86 0.48 54.26 479.00 98.9 100.0 97.9 100
Livestock Production, Fisheries & Cooperative Development
93.43 41.72 93.11 37.70 92.15 37.67 99.0 99.8 98.6 90.3
Total 3,135.27 2,465.81 3,117.89 1,350.93 3,091.30 1,333.30 99.2 98.7 98.7 54.1
Source: Elgeyo Marakwet County Treasury
Analysis of expenditure by department shows that the County Public service Board and County Assembly recorded the highest absorption rate of development budget at 100 while the Department of Health and Sanitation recorded the lowest at 28.7 per cent. The County Assembly had the highest percentage of recurrent expenditure to recurrent budget at 99.9 per cent while the Department of Finance and Economic planning had the lowest at 90.2 per cent.
3.5.9 Key Observations and RecommendationsThe County has made progress in addressing some of the challenges previously identified as affecting budget implementation. Some of the progress made included:
i. Improvement in the absorption of the development budget from 49 per cent attained in FY 2017/18 to 54.1 per cent in the reporting period.
ii. Improvement in own source revenue collection by 34.2 per cent from Kshs.105.49 million collected in the FY 2017/18 to Kshs.141.61 million in the reporting period, which represented 108.6 per cent of annual target.
Despite the above progress, the following challenges continued to hamper effective budget implementation;
1. A high wage bill that increased by 4.4 per cent from Kshs.2.29 billion in the FY 2017/18 to Kshs.2.39 billion in the reporting period. The wage bill accounted for 53.9 per cent of total expenditure in the reporting period.
2. Delay in disbursement of the equitable share of revenue raised nationally by the National Treasury.

46
COUNTY GOVERNMENTS ANNUAL BUDGET IMPLEMENTATION REVIEW REPORT FOR FY 2018/19
3. Late submission of financial reports by the County Treasury to the OCOB, which affected timely preparation of budget implementation report contrary to Section 166 of the PFM Act, 2012.
4. High expenditure on foreign and domestic travel, which increased by 74.3 per cent from Kshs.63.49 million in FY 2017/18 to Kshs.110.65 million in the reporting period.
The County should implement the following measures in order to improve budget execution;
1. The County Public Service Board should develop an optimal staffing structure and devise strategies to contain expenditure on personnel costs within 35 per cent of County’s total revenue in line with Regulation 25(1) (b) of the PFM (County Government) Regulations, 2015.
2. The County Treasury should liaise with the National Treasury to ensure that funds allocated to the County are released in a timely manner.
3. The County Treasury should ensure timely preparation and submission of financial reports in line with Section 166 of the PFM Act, 2012.
4. The County Treasury should ensure that expenditure on non-core budget items is rationalised to provide more resources for development projects.
3.6 Embu County
3.6.1 Overview of the FY 2018/19 BudgetThe County’s FY 2018/19 Supplementary Budget was Kshs.6.83 billion, comprising of Kshs.4.66 billion (68.3 per cent) and Kshs.2.17 billion (31.7 per cent) allocation for recurrent and development expenditure respectively.
To finance the budget, the County expects to receive Kshs.4.46 billion (65.3 per cent) as equitable share of revenue raised nationally, Kshs.1.10 billion (16.1 per cent) as total conditional grants, generate Kshs.950 million (13.9 per cent) from own-source of revenue, and Kshs.389.88 million (5.7 per cent) cash balance from FY 2017/18.
Figure 3.21: Embu County, Expected Sources of Budget Financing in FY 2018/19
82
Source: Embu County Treasury
A breakdown of the conditional grants is provided in Table 3.15.
3.6.2 Revenue Analysis During FY 2018/19, the County had a total of Khs.6.17 billion available for budget implementation. This amount consisted
of Kshs.4.46 billion received as equitable share of the revenue raised nationally, Kshs.692.68 million as conditional grants,
Kshs.629.43 million generated from own sources of revenue, and a cash balance of Kshs.389.88 million from FY 2017/18.
Figure 3.22 shows the annual trend in own-source revenue collection from FY 2013/14 to FY 2018/19.
Figure 3.22: Embu County, Own Source Revenue Collection for FY 2013/14 to FY 2018/19
Source: Embu County Treasury
Cash Balance from FY 2017/18
5.7%
National Sharable Revenue65.3%
Total Conditional Allocations
16.1%
Own Source Revenue13.9%
168.48
401.09 396.52 415.27 437.38
629.43
0
100
200
300
400
500
600
700
FY 2013/14 FY 2014/15 FY 2015/16 FY 2016/17 FY 2017/18 FY 2018/19
Kshs. M
illions
Trend in Own Source Revenue
Source: Embu County Treasury
A breakdown of the conditional grants is provided in Table 3.15.

47
COUNTY GOVERNMENTS ANNUAL BUDGET IMPLEMENTATION REVIEW REPORT FOR FY 2018/19
3.6.2 Revenue AnalysisDuring FY 2018/19, the County had a total of Khs.6.17 billion available for budget implementation. This amount consisted of Kshs.4.46 billion received as equitable share of the revenue raised nationally, Kshs.692.68 million as conditional grants, Kshs.629.43 million generated from own sources of revenue, and a cash balance of Kshs.389.88 million from FY 2017/18.
Figure 3.22 shows the annual trend in own-source revenue collection from FY 2013/14 to FY 2018/19.
Figure 3.22: Embu County, Own Source Revenue Collection for FY 2013/14 to FY 2018/19
82
Source: Embu County Treasury
A breakdown of the conditional grants is provided in Table 3.15.
3.6.2 Revenue Analysis During FY 2018/19, the County had a total of Khs.6.17 billion available for budget implementation. This amount consisted
of Kshs.4.46 billion received as equitable share of the revenue raised nationally, Kshs.692.68 million as conditional grants,
Kshs.629.43 million generated from own sources of revenue, and a cash balance of Kshs.389.88 million from FY 2017/18.
Figure 3.22 shows the annual trend in own-source revenue collection from FY 2013/14 to FY 2018/19.
Figure 3.22: Embu County, Own Source Revenue Collection for FY 2013/14 to FY 2018/19
Source: Embu County Treasury
Cash Balance from FY 2017/18
5.7%
National Sharable Revenue65.3%
Total Conditional Allocations
16.1%
Own Source Revenue13.9%
168.48
401.09 396.52 415.27 437.38
629.43
0
100
200
300
400
500
600
700
FY 2013/14 FY 2014/15 FY 2015/16 FY 2016/17 FY 2017/18 FY 2018/19
Kshs. M
illions
Trend in Own Source Revenue
Source: Embu County Treasury
The County generated a total of Kshs.629.43 million from own revenue sources in FY 2018/19. This amount represented an increase of Kshs.192.05 million compared to that realised in FY 2017/18 and represented 66.3 per cent of the annual target.
3.6.3 Conditional GrantsDuring the reporting period, the County received Kshs.692.68 million as conditional grants as shown in Table 3.15.
Table 3.15: Embu County, Conditional Grants/Loans Received in the FY 2018/19
No Grants Annual CARA, 2018 Allocation (in Kshs)
Annual Budget Al-location (in Kshs)
Actual receipts in the FY 2018/19
(in Kshs.)
Actual Receipts as Percentage
of Annual Allo-cation (%)
1 Grants to Level- 5 Hospital 301,040,462 301,040,462 301,040,462 100.0
2 Leasing of Medical Equipment 200,000,000 200,000,000 - -
3 IDA (World Bank) -National Agricultural and Rural Inclu-sive Growth Project (NARIGP) 140,435,163 140,435,163 50,078,476 35.7
4 IDA (World Bank) -Kenya Urban Support Project (KUSP) 119,892,100 119,892,100 119,892,100 100.0
5 Road Maintenance Fuel Levy 117,396,321 117,396,321 117,396,321 100.0
6 Transforming Health Systems for Universal Care Project (World Bank) 50,000,000 50,000,000 38,574,958 77.1
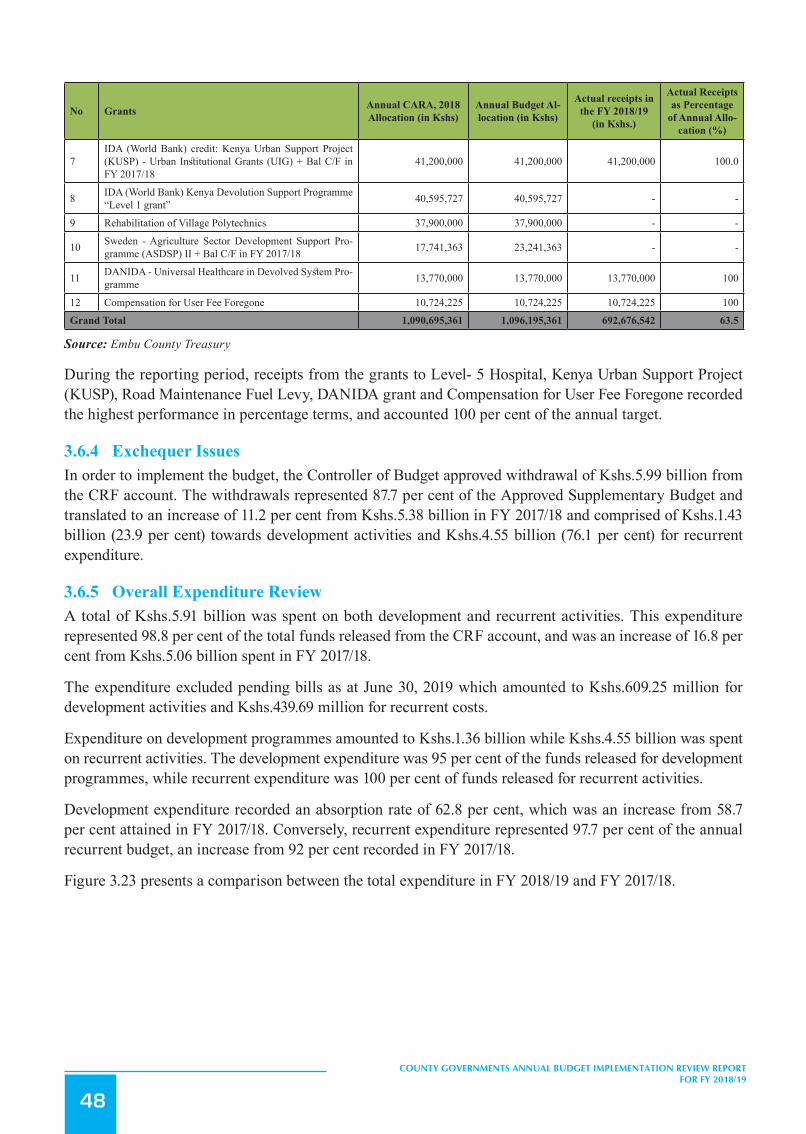
48
COUNTY GOVERNMENTS ANNUAL BUDGET IMPLEMENTATION REVIEW REPORT FOR FY 2018/19
No Grants Annual CARA, 2018 Allocation (in Kshs)
Annual Budget Al-location (in Kshs)
Actual receipts in the FY 2018/19
(in Kshs.)
Actual Receipts as Percentage
of Annual Allo-cation (%)
7IDA (World Bank) credit: Kenya Urban Support Project (KUSP) - Urban Institutional Grants (UIG) + Bal C/F in FY 2017/18
41,200,000 41,200,000 41,200,000 100.0
8 IDA (World Bank) Kenya Devolution Support Programme “Level 1 grant” 40,595,727 40,595,727 - -
9 Rehabilitation of Village Polytechnics 37,900,000 37,900,000 - -
10 Sweden - Agriculture Sector Development Support Pro-gramme (ASDSP) II + Bal C/F in FY 2017/18 17,741,363 23,241,363 - -
11 DANIDA - Universal Healthcare in Devolved System Pro-gramme 13,770,000 13,770,000 13,770,000 100
12 Compensation for User Fee Foregone 10,724,225 10,724,225 10,724,225 100
Grand Total 1,090,695,361 1,096,195,361 692,676,542 63.5
Source: Embu County Treasury
During the reporting period, receipts from the grants to Level- 5 Hospital, Kenya Urban Support Project (KUSP), Road Maintenance Fuel Levy, DANIDA grant and Compensation for User Fee Foregone recorded the highest performance in percentage terms, and accounted 100 per cent of the annual target.
3.6.4 Exchequer IssuesIn order to implement the budget, the Controller of Budget approved withdrawal of Kshs.5.99 billion from the CRF account. The withdrawals represented 87.7 per cent of the Approved Supplementary Budget and translated to an increase of 11.2 per cent from Kshs.5.38 billion in FY 2017/18 and comprised of Kshs.1.43 billion (23.9 per cent) towards development activities and Kshs.4.55 billion (76.1 per cent) for recurrent expenditure.
3.6.5 Overall Expenditure ReviewA total of Kshs.5.91 billion was spent on both development and recurrent activities. This expenditure represented 98.8 per cent of the total funds released from the CRF account, and was an increase of 16.8 per cent from Kshs.5.06 billion spent in FY 2017/18.
The expenditure excluded pending bills as at June 30, 2019 which amounted to Kshs.609.25 million for development activities and Kshs.439.69 million for recurrent costs.
Expenditure on development programmes amounted to Kshs.1.36 billion while Kshs.4.55 billion was spent on recurrent activities. The development expenditure was 95 per cent of the funds released for development programmes, while recurrent expenditure was 100 per cent of funds released for recurrent activities.
Development expenditure recorded an absorption rate of 62.8 per cent, which was an increase from 58.7 per cent attained in FY 2017/18. Conversely, recurrent expenditure represented 97.7 per cent of the annual recurrent budget, an increase from 92 per cent recorded in FY 2017/18.
Figure 3.23 presents a comparison between the total expenditure in FY 2018/19 and FY 2017/18.

49
COUNTY GOVERNMENTS ANNUAL BUDGET IMPLEMENTATION REVIEW REPORT FOR FY 2018/19
Figure3.23: EmbuCounty,ExpenditurebyEconomicClassification
84
3.6.5 Overall Expenditure Review A total of Kshs.5.91 billion was spent on both development and recurrent activities. This expenditure represented 98.8 per
cent of the total funds released from the CRF account, and was an increase of 16.8 per cent from Kshs.5.06 billion spent in
FY 2017/18.
The expenditure excluded pending bills as at June 30, 2019 which amounted to Kshs.609.25 million for development
activities and Kshs.439.69 million for recurrent costs.
Expenditure on development programmes amounted to Kshs.1.36 billion while Kshs.4.55 billion was spent on recurrent
activities. The development expenditure was 95 per cent of the funds released for development programmes, while recurrent
expenditure was 100 per cent of funds released for recurrent activities.
Development expenditure recorded an absorption rate of 62.8 per cent, which was an increase from 58.7 per cent attained in
FY 2017/18. Conversely, recurrent expenditure represented 97.7 per cent of the annual recurrent budget, an increase from 92
per cent recorded in FY 2017/18.
Figure 3.23 presents a comparison between the total expenditure in FY 2018/19 and FY 2017/18.
Figure 3.23: Embu County, Expenditure by Economic Classification
Source: Embu County Treasury
3.6.6 Development Expenditure Analysis The total development expenditure of Kshs.1.36 billion represented 62.8 per cent of the annual development expenditure
estimates of Kshs.2.17 billion. Table 3.16 provides a summary of development projects with the highest expenditure in the
financial year.
2,813.64(52.7%)
1,158.22(24.2%)
1,090.53(21.5%)
3,118.66(55.6%)
1,433.38(23.8%) 1,361.23
(23.0%)
-
500
1,000
1,500
2,000
2,500
3,000
3,500
Personnel Emoluments Operations and Maintenance Development Expenditure
Ksh
s.Mill
ion
Expenditure by Economic Classification
FY 2017/18
FY 2018/19
Key
Source: Embu County Treasury
3.6.6 Development Expenditure AnalysisThe total development expenditure of Kshs.1.36 billion represented 62.8 per cent of the annual development expenditure estimates of Kshs.2.17 billion. Table 3.16 provides a summary of development projects with the highest expenditure in the financial year.
Table 3.16: Embu County, List of Development Projects with the Highest Expenditure in FY 2018/19
No Project Name Project Location Project budget (Kshs.)
FY2018/19 Project Expenditure
(Kshs.)
Absorption rate (%)
1 Geo-Referencing at Mwea 58 Parcels of Land-Other Parcels of Lands Mwea Scheme 7,057,340 70,115,856 993.5
2 Tarmacking of Mukuuri/Nduuri Road Runyenjes Central 147,728,002 59,155,331 40.0
3 Upgrading to Bitumen - Kwa Mutoi - Nduuri Road Runyenjes Central 147,728,002 49,288,317 33.4
4 Construction of Badea Wards Phase II Level 5- Kirimari 27,585,695 24,393,402 88.4
5
Rehabilitation of Bus Parks, Parking lots within CBD and Pedestrian Walkways along Beekay- Kubukubu Road; Rupingazi river to Governor’s Office; Installa-tion of Cabro Pavement on Mama Ngina Street
Kirimari 50,000,000 19,046,132
38.1
6 Equipping of Level 4 Hospitals-Kianjokoma, Runyenjes, Ishiara, Siakago, Kiritiri, Kairuri
25,475,000 18,583,417 72.9
7Tarmacking of Kutus Wholesalers-Kenya Power-Blue Valley Road (1.2KM), Rehabilitation of Kirimari Shell to Jatomy Supermarket
Kirimari 50,000,000 18,000,000 36.0
8 Rehabilitation Paving and Cabros for Runyenjes Town and Ishiara.
Runyenjes Town and Ishiara 50,800,000 17,362,160 34.2
9 Construction of Kindaruma, Mutuovare and Gitaru Mathigira Kenda Water Supply System
Kindaruma, Mutuovare and Gitaru Mathigira Kenda
17,228,000 17,228,000 100.0
10 Upgrading of Oxygen Plant Level 5- Kirimari 88,000,000 17,000,000 19.3
Source: Embu County Treasury

50
COUNTY GOVERNMENTS ANNUAL BUDGET IMPLEMENTATION REVIEW REPORT FOR FY 2018/19
3.6.7 Analysis of Recurrent ExpenditureThe total recurrent expenditure of Kshs.4.55 billion comprised of Kshs.3.12 billion (68.5 per cent) incurred on personnel emoluments and Kshs.1.43 billion (31.5 per cent) on operations and maintenance as shown in Figure 3.23.
Expenditure on personnel emoluments represented an increase of 10.8 per cent compared to a similar period of FY 2017/18 when the County spent Kshs.2.81 billion and was 55.6 per cent of the total expenditure in FY 2018/19. Figure 3.24 shows a summary of operations and maintenance expenditure by major categories.
Figure 3.24: Embu County, Operations and Maintenance Expenditure by Major Categories in FY 2018/19
86
Source: Embu County Treasury
The County spent Kshs.31.26 million on committee sitting allowances for the 34 MCAs and Speaker against the annual
budget allocation of Kshs.31.26 million. This represented a decrease of 3.4 per cent compared to Kshs.32.36 million spent in
FY 2017/18. The average monthly sitting allowance translated to Kshs.74,435 per MCA against the SRC’s recommended
monthly ceiling of Kshs.124,800.
Expenditure on domestic and foreign travel amounted to Kshs.299.64 million, and comprised of Kshs.156.52 million spent
by the County Assembly and Kshs.143.12 million by the County Executive. This expenditure represented 6.6 per cent of
total recurrent expenditure and was an increase of 115.8 per cent compared to Kshs.138.85 million spent in FY 2017/18.
3.6.8 Budget Performance by County Department Table 3.17 shows a summary of the approved budget allocation and performance by department in FY 2018/19.
Table 3.17: Embu County, Budget Performance by Department in FY 2018/19
Department Budget Allocation (Kshs. Million)
Exchequer Issues (Kshs. Million)
Expenditure (Kshs. Million)
Expenditure to Exchequer Issues (%)
Absorption rate (%)
Rec Dev Rec Dev Rec Dev Rec Dev Rec Dev Office of the Governor 171.89 - 171.89 - 168.82 - 98.2 0 98.2 - County Public Service 27.72 - 27.72 - 27.13 - 97.9 - 97.9 -
295.87 289.60
249.15 227.42
177.59
103.46
34.16 31.26 23.74 20.46 -
50.00
100.00
150.00
200.00
250.00
300.00
350.00
Source: Embu County Treasury
The County spent Kshs.31.26 million on committee sitting allowances for the 34 MCAs and Speaker against the annual budget allocation of Kshs.31.26 million. This represented a decrease of 3.4 per cent compared to Kshs.32.36 million spent in FY 2017/18. The average monthly sitting allowance translated to Kshs.74,435 per MCA against the SRC’s recommended monthly ceiling of Kshs.124,800.
Expenditure on domestic and foreign travel amounted to Kshs.299.64 million, and comprised of Kshs.156.52 million spent by the County Assembly and Kshs.143.12 million by the County Executive. This expenditure represented 6.6 per cent of total recurrent expenditure and was an increase of 115.8 per cent compared to Kshs.138.85 million spent in FY 2017/18.
3.6.8 Budget Performance by County DepartmentTable 3.17 shows a summary of the approved budget allocation and performance by department in FY 2018/19.

51
COUNTY GOVERNMENTS ANNUAL BUDGET IMPLEMENTATION REVIEW REPORT FOR FY 2018/19
Table 3.17: Embu County, Budget Performance by Department in FY 2018/19
DepartmentBudget Allocation (Kshs.
Million)Exchequer Issues (Kshs.
Million)Expenditure (Kshs. Mil-
lion)
Expenditure to Exchequer
Issues (%)
Absorption rate (%)
Rec Dev Rec Dev Rec Dev Rec Dev Rec Dev
Office of the Gov-ernor 171.89 - 171.89 - 168.82 - 98.2 0 98.2 -
County Public Ser-vice Board 27.72 - 27.72 - 27.13 - 97.9 - 97.9 -
Finance, Economic Planning 174.63 21.00 148.93 21.00 176.80 15.98 118.7 76.1 101.2 76.1
Education, Youth Empowerment & Sports
437.38 113.54 414.81 67.60 419.15 63.51 101.0 93.9 95.8 55.9
Health & Sanitation 1,929.10 247.23 1,900.43 101.03 1,928.88 74.11 101.5 73.4 100.0 30.0
Infrastructure, Public Works, Housing & Energy
68.32 854.29 68.32 676.73 66.28 717.56 97.0 106.0 97.0 84.0
Trade, Tourism, Investment & Indus-trialization
18.88 85.19 18.88 75.74 18.33 67.93 97.0 89.7 97.0 79.7
Agriculture, Live-stock, Fisheries & Co-op Devt
379.28 160.23 379.28 76.61 300.15 59.39 79.1 77.5 79.1 37.1
Water, Environment & Natural Resources 57.38 83.82 57.38 26.91 51.35 57.16 89.5 212.4 89.5 68.2
Lands, Physical Planning & Urban Development
91.26 188.35 94.23 141.68 88.82 134.25 94.3 94.8 97.3 71.3
Gender, Culture, Children & Social Services
8.48 38.50 8.87 38.50 7.92 19.37 89.3 50.3 93.4 50.3
Public Service and Administration 468.45 11.00 468.45 11.00 507.83 10.99 108.4 100.0 108.4 100.0
Embu Level Five Hospital 235.45 291.12 235.45 195.78 234.52 140.96 99.6 72.0 99.6 48.4
County Assembly 592.74 72.00 558.04 - 556.07 - 99.6 - 93.8 0.0
TOTAL 4,661.95 2,166.29 4,552.68 1,432.59 4,552.03 1,361.23 100.0 95.0 97.7 62.8
Source: Embu County Treasury
Analysis of expenditure by department shows that the Department of Public Service and Administration recorded the highest absorption rate of development budget at 100 per cent while the Department of Health recorded the lowest at 30 per cent. The Department of Public Service and Administration had the highest percentage of recurrent expenditure to its recurrent budget at 108.4 per cent while the Department of Agriculture, Livestock, Fisheries & Co-operatives Development had the lowest at 79.1 per cent.
3.6.9 Key Observations and RecommendationsThe County has made progress in addressing some of the challenges previously identified as affecting budget implementation. Some of the progress made included:
i. Improvement in own source revenue collection by 43.9 per cent from Kshs.437.38 million in the FY 2017/18 to Kshs.629.43 million in the reporting period.
ii. Improvement in absorption of the development budget by 24.8 per cent from Kshs.1.09 billion in FY 2017/18 to Kshs.1.36 billion in the reporting period.
Despite the above progress, the following challenges continued to hamper effective budget implementation;
52
COUNTY GOVERNMENTS ANNUAL BUDGET IMPLEMENTATION REVIEW REPORT FOR FY 2018/19
1. Inadequate budgetary control that resulted in expenditure above approved budget such as on “Geo-Referencing at Mwea 58 Parcels of Land-Other Parcels of Lands”.This is contrary to Section 135 and 154 of PFM Act, 2012.
2. The County operationalised the Emergency Fund and spent Kshs.5.55 million before enactment of appropriate legislation as provided under Section 116 of the PFM Act, 2012.
3. Delay by Fund Administrators to submit expenditure reports of the Car Loan and Mortgage Fund, Emergency Fund, Bursary Fund and the Youth and Women Funds contrary to Section 168 of the PFM Act, 2012.
4. Late submission of financial reports by the County Treasury, which affected timely preparation of budget implementation report contrary to Section 166 of the PFM Act, 2012.
5. A high wage bill that increased by 10.8 per cent from Kshs.2.81 billion in FY 2017/18 to Kshs.3.12 billion in the reporting period. The wage bill accounted for 55.6 per cent of total expenditure in the reporting period.
The County should implement the following measures in order to improve budget execution;
1. The County Treasury should ensure expenditure is within the approved budget.2. The County Treasury should enact legislation to operationalize the county Emergency Fund in
compliance to section 116 of the PFM Act 20123. All Fund Administrators should ensure timely submission of expenditure reports on established Funds
in line with Section 168 of PFM Act 2012.4. The County Treasury should ensure timely preparation and submission of financial reports in line
with Section 166 of PFM Act, 2012.5. The County Public Service Board should develop an optimal staffing structure and devise strategies
to contain expenditure on personnel costs within 35 per cent of County’s total revenue in line with Regulation 25(1) (b) of the PFM (County Governments) Regulations, 2015.
3.7 Garissa County
3.7.1 Overview of the FY 2018/19 BudgetThe County’s FY 2018/19 Supplementary Budget was Kshs.10.72 billion, comprising of Kshs.6.53 billion (60.9 per cent) and Kshs.4.19 billion (39.1 per cent) allocation for recurrent and development expenditure respectively.
To finance the budget, the County expects to receive Kshs.6.94. billion (65.3 per cent) as equitable share of the revenue raised nationally, Kshs.2.31 billion (21.7 per cent) as total conditional grants, generate Kshs.250 million (2.4 per cent) from own sources of revenue, and Kshs.1.13 billion (10.6 per cent) cash balance from FY 2017/18.
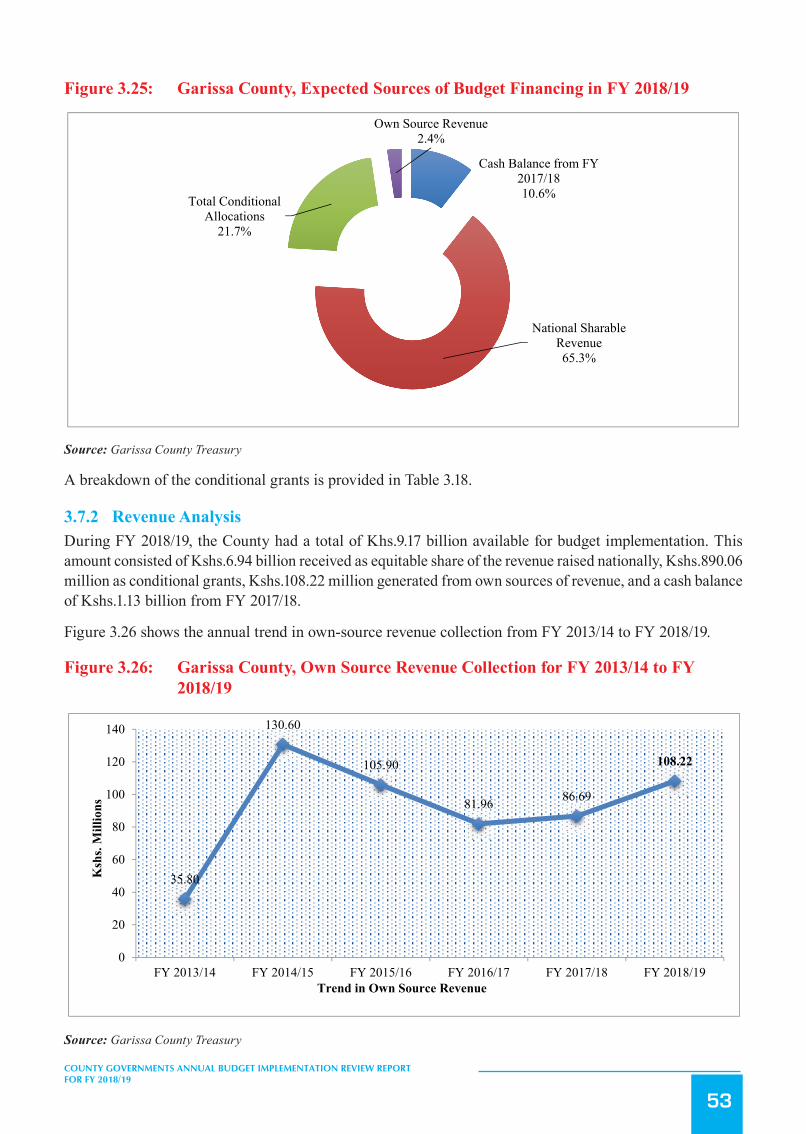
53
COUNTY GOVERNMENTS ANNUAL BUDGET IMPLEMENTATION REVIEW REPORT FOR FY 2018/19
Figure 3.25: Garissa County, Expected Sources of Budget Financing in FY 2018/19
89
Source: Garissa County Treasury
A breakdown of the conditional grants is provided in Table 3.18.
3.7.2 Revenue Analysis During FY 2018/19, the County had a total of Khs.9.17 billion available for budget implementation. This amount consisted
of Kshs.6.94 billion received as equitable share of the revenue raised nationally, Kshs.890.06 million as conditional grants,
Kshs.108.22 million generated from own sources of revenue, and a cash balance of Kshs.1.13 billion from FY 2017/18.
Figure 3.26 shows the annual trend in own-source revenue collection from FY 2013/14 to FY 2018/19.
Figure 3.26: Garissa County, Own Source Revenue Collection for FY 2013/14 to FY 2018/19
Source: Garissa County Treasury
Cash Balance from FY 2017/1810.6%
National Sharable Revenue65.3%
Total Conditional Allocations
21.7%
Own Source Revenue2.4%
35.80
130.60
105.90
81.96 86.69
108.22
0
20
40
60
80
100
120
140
FY 2013/14 FY 2014/15 FY 2015/16 FY 2016/17 FY 2017/18 FY 2018/19
Ksh
s. M
illio
ns
Trend in Own Source Revenue
Source: Garissa County Treasury
A breakdown of the conditional grants is provided in Table 3.18.
3.7.2 Revenue AnalysisDuring FY 2018/19, the County had a total of Khs.9.17 billion available for budget implementation. This amount consisted of Kshs.6.94 billion received as equitable share of the revenue raised nationally, Kshs.890.06 million as conditional grants, Kshs.108.22 million generated from own sources of revenue, and a cash balance of Kshs.1.13 billion from FY 2017/18.
Figure 3.26 shows the annual trend in own-source revenue collection from FY 2013/14 to FY 2018/19.
Figure 3.26: Garissa County, Own Source Revenue Collection for FY 2013/14 to FY 2018/19
89
Source: Garissa County Treasury
A breakdown of the conditional grants is provided in Table 3.18.
3.7.2 Revenue Analysis During FY 2018/19, the County had a total of Khs.9.17 billion available for budget implementation. This amount consisted
of Kshs.6.94 billion received as equitable share of the revenue raised nationally, Kshs.890.06 million as conditional grants,
Kshs.108.22 million generated from own sources of revenue, and a cash balance of Kshs.1.13 billion from FY 2017/18.
Figure 3.26 shows the annual trend in own-source revenue collection from FY 2013/14 to FY 2018/19.
Figure 3.26: Garissa County, Own Source Revenue Collection for FY 2013/14 to FY 2018/19
Source: Garissa County Treasury
Cash Balance from FY 2017/1810.6%
National Sharable Revenue65.3%
Total Conditional Allocations
21.7%
Own Source Revenue2.4%
35.80
130.60
105.90
81.96 86.69
108.22
0
20
40
60
80
100
120
140
FY 2013/14 FY 2014/15 FY 2015/16 FY 2016/17 FY 2017/18 FY 2018/19
Ksh
s. M
illio
ns
Trend in Own Source Revenue
Source: Garissa County Treasury

54
COUNTY GOVERNMENTS ANNUAL BUDGET IMPLEMENTATION REVIEW REPORT FOR FY 2018/19
The County generated a total of Kshs.108.22 million from own revenue sources in FY 2018/19. This amount represented an increase of Kshs.21.53 million compared to that realised in FY 2017/18 and was 43.3 per cent of the annual target.
3.7.3 Conditional GrantsDuring the reporting period, the County received Kshs.890.06 million as conditional grants as shown in Table 3.18.
Table 3.18: Garissa County, Conditional Grants/Loans Received in the FY 2018/19
S/No Grant DetailsAnnual Alloca-
tion-CARA, 2018) (Kshs)
Annual Budget Allocation (Kshs)
Receipts in FY 2018/19 (Kshs)
Receipts as Per-centage of Annual Budget Allocation
(%)
1 Conditional Grants to Level - 5 Hospital 344,739,884. 344,739,884 344,739,884 100
3 Compensation for User Fee Foregone 12,964,636. 12,964,636 12,964,636 100
4 Leasing of Medical Equipment 200,000,000. 200,000,000 - -
5 Road Maintenance Fuel Levy 182,708,358. 182,708,358 91,354,179 50
6 Grants to Youth polytechnic 35,355,000. 35,355,000 35,355,000 100
7 Transforming Health Systems for Universal Care Pro-ject (WB) 100,000,000 100,000,000 68,556,430 68.9
8 Water and Sanitation Development (World Bank) 1,000,000,000 1,000,000,000 - -
9 Kenya Climate Smart Agriculture Project (KCSAP) 150,000,000 150,000,000 55,847,540 37.2
10 Kenya Devolution Support Project (KDSP) “Level 1 grant” 47,735,752 47,735,752 47,735,752 100
11 Kenya Urban Support Project (KUSP) 233,506,000 233,506,000 233,506,000 100
Total 2,307,009,630 2,307,009,630 890,059,421 38.6
Garissa County Treasury
During the reporting period, receipts from the Grants to Level -5 Hospital, Compensation for User Fess Foregone, grants to Youth Polytechnic, Kenya Devolution Support Project, and Kenya Urban Support Project conditional grant recorded the highest performance in percentage terms, and accounted 100 per cent respectively of the annual target.
3.7.4 Exchequer IssuesIn order to implement the budget, the Controller of Budget approved withdrawal of Kshs.8.84 billion from the CRF account. The withdrawals represented 82.5 per cent of the Approved Supplementary Budget and translated to an increase of 35.2 per cent from Kshs.6.54 billion in FY 2017/18 and comprised of Kshs.2.38 billion (26.9 per cent) towards development activities and Kshs.6.47 billion (73.1 per cent) for recurrent expenditure.
3.7.5 Overall Expenditure ReviewA total of Kshs.8.95 billion was spent on both development and recurrent activities. This expenditure represented 101.2 per cent of the total funds released from the CRF account, and was an increase of 37.3 per cent from Kshs.6.52 billion spent in FY 2017/18. The expenditure excluded pending bills as at June 30, 2019 which amounted to Kshs.453.29 million for development activities and Kshs.167.35 million for recurrent costs.
Development expenditure recorded an absorption rate of 55.5 per cent, which was an increase from 42.2 per cent attained in FY 2017/18. Conversely, recurrent expenditure represented 101.3 per cent of the annual recurrent budget, an increase from 98.4 per cent recorded in FY 2017/18.
Figure 3.27 presents a comparison between the total expenditure in FY 2018/19 and FY 2017/18.
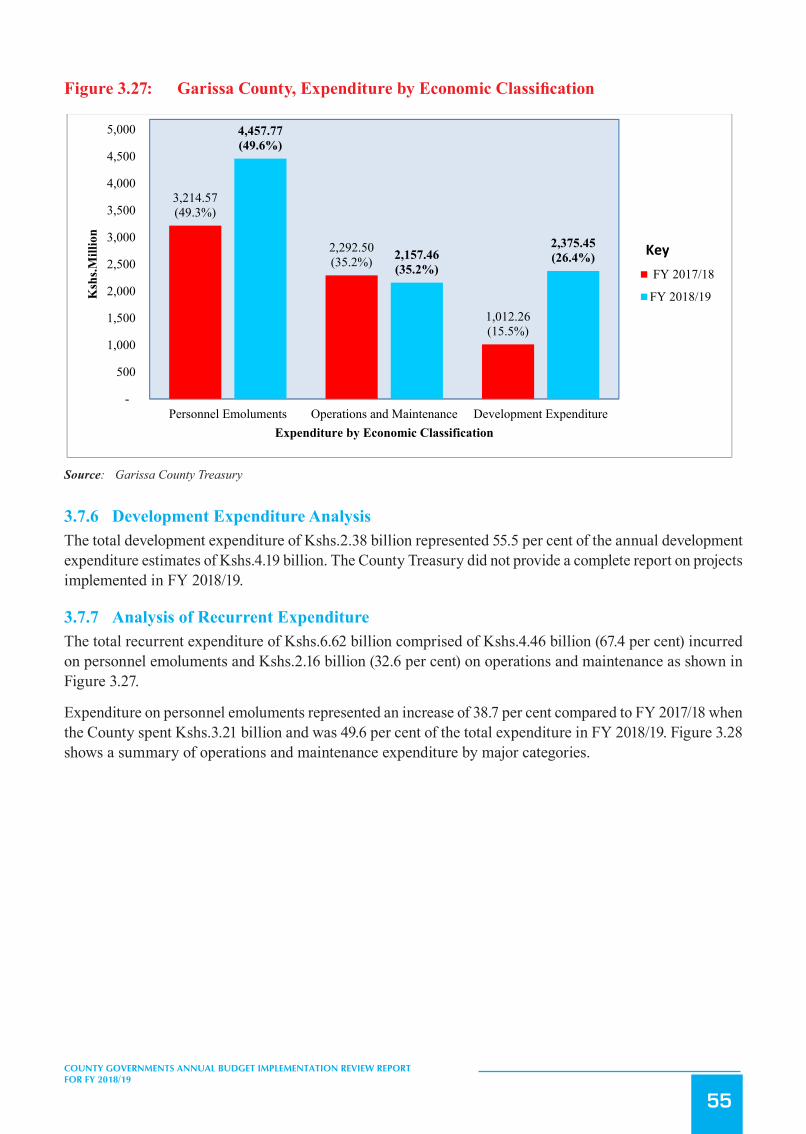
55
COUNTY GOVERNMENTS ANNUAL BUDGET IMPLEMENTATION REVIEW REPORT FOR FY 2018/19
Figure3.27: GarissaCounty,ExpenditurebyEconomicClassification
91
Figure 3.27 presents a comparison between the total expenditure in FY 2018/19 and FY 2017/18.
Figure 3.27: Garissa County, Expenditure by Economic Classification
Source: Garissa County Treasury
3.7.6 Development Expenditure Analysis The total development expenditure of Kshs.2.38 billion represented 55.5 per cent of the annual development expenditure
estimates of Kshs.4.19 billion. The County Treasury did not provide a complete report on projects implemented in FY
2018/19.
3.7.7 Analysis of Recurrent Expenditure The total recurrent expenditure of Kshs.6.62 billion comprised of Kshs.4.46 billion (67.4 per cent) incurred on personnel
emoluments and Kshs.2.16 billion (32.6 per cent) on operations and maintenance as shown in Figure 3.27.
Expenditure on personnel emoluments represented an increase of 38.7 per cent compared to FY 2017/18 when the County
spent Kshs.3.21 billion and was 49.6 per cent of the total expenditure in FY 2018/19. Figure 3.28 shows a summary of
operations and maintenance expenditure by major categories.
Figure 3.28: Garissa County, Operations and Maintenance Expenditure by Major Categories in FY 2018/19
3,214.57(49.3%)
2,292.50(35.2%)
1,012.26(15.5%)
4,457.77(49.6%)
2,157.46(35.2%)
2,375.45(26.4%)
-
500
1,000
1,500
2,000
2,500
3,000
3,500
4,000
4,500
5,000
Personnel Emoluments Operations and Maintenance Development Expenditure
Ksh
s.Mill
ion
Expenditure by Economic Classification
FY 2017/18
FY 2018/19
Key
Source: Garissa County Treasury
3.7.6 Development Expenditure AnalysisThe total development expenditure of Kshs.2.38 billion represented 55.5 per cent of the annual development expenditure estimates of Kshs.4.19 billion. The County Treasury did not provide a complete report on projects implemented in FY 2018/19.
3.7.7 Analysis of Recurrent ExpenditureThe total recurrent expenditure of Kshs.6.62 billion comprised of Kshs.4.46 billion (67.4 per cent) incurred on personnel emoluments and Kshs.2.16 billion (32.6 per cent) on operations and maintenance as shown in Figure 3.27.
Expenditure on personnel emoluments represented an increase of 38.7 per cent compared to FY 2017/18 when the County spent Kshs.3.21 billion and was 49.6 per cent of the total expenditure in FY 2018/19. Figure 3.28 shows a summary of operations and maintenance expenditure by major categories.
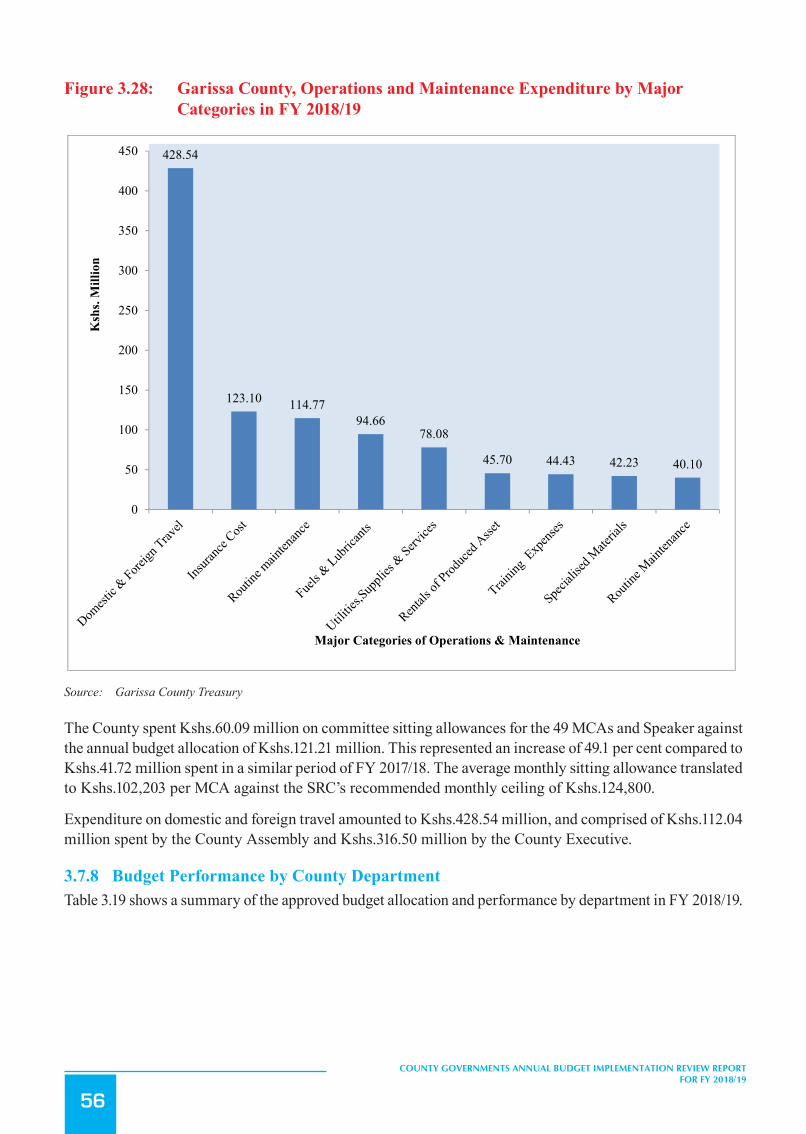
56
COUNTY GOVERNMENTS ANNUAL BUDGET IMPLEMENTATION REVIEW REPORT FOR FY 2018/19
Figure 3.28: Garissa County, Operations and Maintenance Expenditure by Major Categories in FY 2018/19
92
Source: Garissa County Treasury
The County spent Kshs.60.09 million on committee sitting allowances for the 49 MCAs and Speaker against the annual
budget allocation of Kshs.121.21 million. This represented an increase of 49.1 per cent compared to Kshs.41.72 million
spent in a similar period of FY 2017/18. The average monthly sitting allowance translated to Kshs.102,203 per MCA
against the SRC’s recommended monthly ceiling of Kshs.124,800.
Expenditure on domestic and foreign travel amounted to Kshs.428.54 million, and comprised of Kshs.112.04 million spent
by the County Assembly and Kshs.316.50 million by the County Executive.
3.7.8 Budget Performance by County Department Table 3.19 shows a summary of the approved budget allocation and performance by department in FY 2018/19.
Table 3.19: Garissa County, Budget Performance by Department in FY 2018/19
Department Annual Budget Allocation (Kshs. Million)
Exchequer Issues (Kshs. Million)
Expenditure (Kshs.Million)
Expenditure to Exchequer Issues(%)
Absorption Rate (%)
428.54
123.10 114.7794.66
78.08
45.70 44.43 42.23 40.10
0
50
100
150
200
250
300
350
400
450
Ksh
s. M
illio
n
Major Categories of Operations & Maintenance
Source: Garissa County Treasury
The County spent Kshs.60.09 million on committee sitting allowances for the 49 MCAs and Speaker against the annual budget allocation of Kshs.121.21 million. This represented an increase of 49.1 per cent compared to Kshs.41.72 million spent in a similar period of FY 2017/18. The average monthly sitting allowance translated to Kshs.102,203 per MCA against the SRC’s recommended monthly ceiling of Kshs.124,800.
Expenditure on domestic and foreign travel amounted to Kshs.428.54 million, and comprised of Kshs.112.04 million spent by the County Assembly and Kshs.316.50 million by the County Executive.
3.7.8 Budget Performance by County DepartmentTable 3.19 shows a summary of the approved budget allocation and performance by department in FY 2018/19.
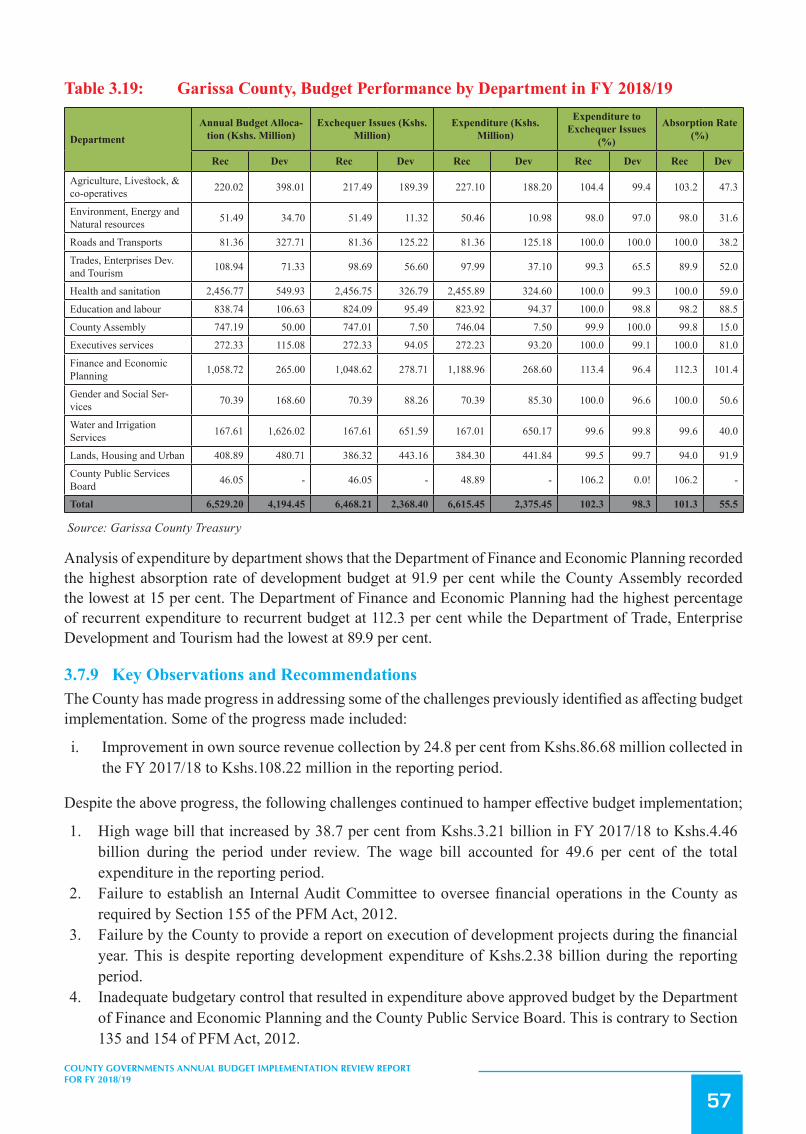
57
COUNTY GOVERNMENTS ANNUAL BUDGET IMPLEMENTATION REVIEW REPORT FOR FY 2018/19
Table 3.19: Garissa County, Budget Performance by Department in FY 2018/19
DepartmentAnnual Budget Alloca-
tion (Kshs. Million)Exchequer Issues (Kshs.
Million)Expenditure (Kshs.
Million)
Expenditure to Exchequer Issues
(%)
Absorption Rate (%)
Rec Dev Rec Dev Rec Dev Rec Dev Rec Dev
Agriculture, Livestock, & co-operatives 220.02 398.01 217.49 189.39 227.10 188.20 104.4 99.4 103.2 47.3
Environment, Energy and Natural resources 51.49 34.70 51.49 11.32 50.46 10.98 98.0 97.0 98.0 31.6
Roads and Transports 81.36 327.71 81.36 125.22 81.36 125.18 100.0 100.0 100.0 38.2
Trades, Enterprises Dev. and Tourism 108.94 71.33 98.69 56.60 97.99 37.10 99.3 65.5 89.9 52.0
Health and sanitation 2,456.77 549.93 2,456.75 326.79 2,455.89 324.60 100.0 99.3 100.0 59.0
Education and labour 838.74 106.63 824.09 95.49 823.92 94.37 100.0 98.8 98.2 88.5
County Assembly 747.19 50.00 747.01 7.50 746.04 7.50 99.9 100.0 99.8 15.0
Executives services 272.33 115.08 272.33 94.05 272.23 93.20 100.0 99.1 100.0 81.0
Finance and Economic Planning 1,058.72 265.00 1,048.62 278.71 1,188.96 268.60 113.4 96.4 112.3 101.4
Gender and Social Ser-vices 70.39 168.60 70.39 88.26 70.39 85.30 100.0 96.6 100.0 50.6
Water and Irrigation Services 167.61 1,626.02 167.61 651.59 167.01 650.17 99.6 99.8 99.6 40.0
Lands, Housing and Urban 408.89 480.71 386.32 443.16 384.30 441.84 99.5 99.7 94.0 91.9
County Public Services Board 46.05 - 46.05 - 48.89 - 106.2 0.0! 106.2 -
Total 6,529.20 4,194.45 6,468.21 2,368.40 6,615.45 2,375.45 102.3 98.3 101.3 55.5
Source: Garissa County Treasury
Analysis of expenditure by department shows that the Department of Finance and Economic Planning recorded the highest absorption rate of development budget at 91.9 per cent while the County Assembly recorded the lowest at 15 per cent. The Department of Finance and Economic Planning had the highest percentage of recurrent expenditure to recurrent budget at 112.3 per cent while the Department of Trade, Enterprise Development and Tourism had the lowest at 89.9 per cent.
3.7.9 Key Observations and RecommendationsThe County has made progress in addressing some of the challenges previously identified as affecting budget implementation. Some of the progress made included:
i. Improvement in own source revenue collection by 24.8 per cent from Kshs.86.68 million collected in the FY 2017/18 to Kshs.108.22 million in the reporting period.
Despite the above progress, the following challenges continued to hamper effective budget implementation;
1. High wage bill that increased by 38.7 per cent from Kshs.3.21 billion in FY 2017/18 to Kshs.4.46 billion during the period under review. The wage bill accounted for 49.6 per cent of the total expenditure in the reporting period.
2. Failure to establish an Internal Audit Committee to oversee financial operations in the County as required by Section 155 of the PFM Act, 2012.
3. Failure by the County to provide a report on execution of development projects during the financial year. This is despite reporting development expenditure of Kshs.2.38 billion during the reporting period.
4. Inadequate budgetary control that resulted in expenditure above approved budget by the Department of Finance and Economic Planning and the County Public Service Board. This is contrary to Section 135 and 154 of PFM Act, 2012.
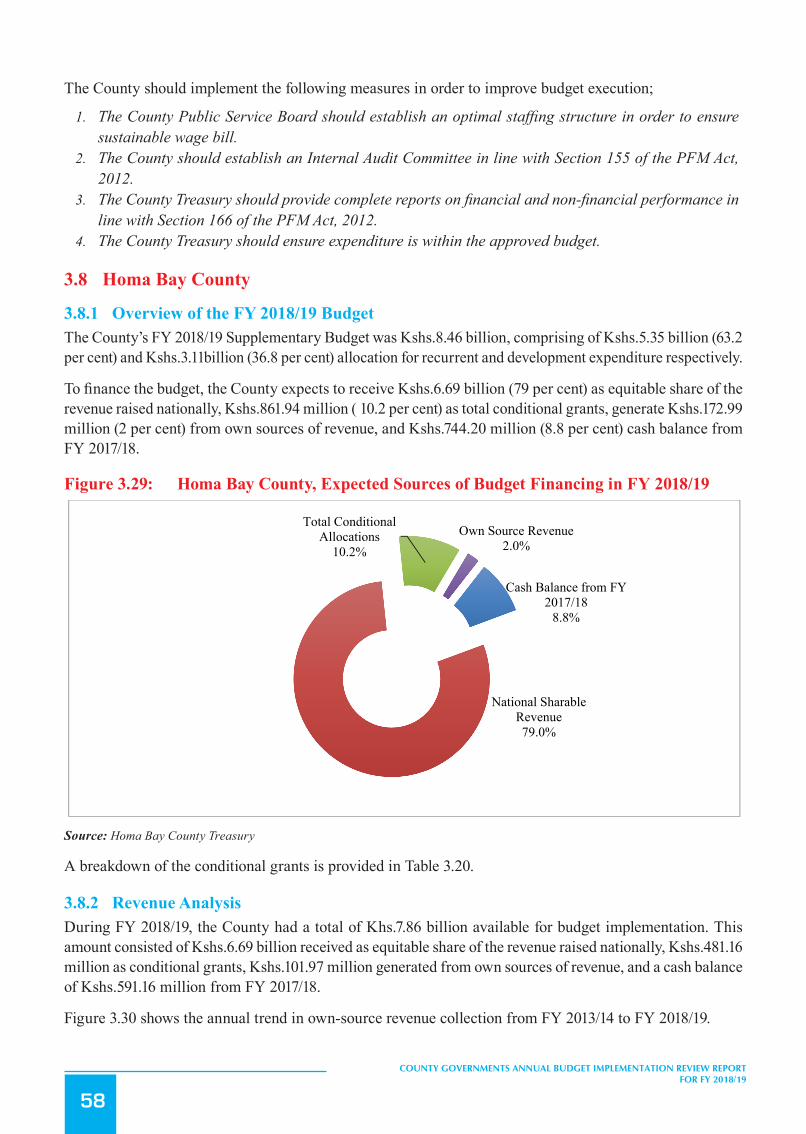
58
COUNTY GOVERNMENTS ANNUAL BUDGET IMPLEMENTATION REVIEW REPORT FOR FY 2018/19
The County should implement the following measures in order to improve budget execution;
1. The County Public Service Board should establish an optimal staffing structure in order to ensure sustainable wage bill.
2. The County should establish an Internal Audit Committee in line with Section 155 of the PFM Act, 2012.
3. The County Treasury should provide complete reports on financial and non-financial performance in line with Section 166 of the PFM Act, 2012.
4. The County Treasury should ensure expenditure is within the approved budget.
3.8 Homa Bay County
3.8.1 Overview of the FY 2018/19 BudgetThe County’s FY 2018/19 Supplementary Budget was Kshs.8.46 billion, comprising of Kshs.5.35 billion (63.2 per cent) and Kshs.3.11billion (36.8 per cent) allocation for recurrent and development expenditure respectively.
To finance the budget, the County expects to receive Kshs.6.69 billion (79 per cent) as equitable share of the revenue raised nationally, Kshs.861.94 million ( 10.2 per cent) as total conditional grants, generate Kshs.172.99 million (2 per cent) from own sources of revenue, and Kshs.744.20 million (8.8 per cent) cash balance from FY 2017/18.
Figure 3.29: Homa Bay County, Expected Sources of Budget Financing in FY 2018/19
94
1. The County Public Service Board should establish an optimal staffing structure in order to ensure sustainable
wage bill.
2. The County should establish an Internal Audit Committee in line with Section 155 of the PFM Act, 2012.
3. The County Treasury should provide complete reports on financial and non -financial performance in line with
Section 166 of the PFM Act, 2012.
4. The County Treasury should ensure expenditure is within the approved budget.
3.8 Homa Bay County
3.8.1 Overview of the FY 2018/19 Budget The County’s FY 2018/19 Supplementary Budget was Kshs.8.46 billion, comprising of Kshs.5.35 billion (63.2 per cent) and
Kshs.3.11billion (36.8 per cent) allocation for recurrent and development expenditure respectively.
To finance the budget, the County expects to receive Kshs.6.69 billion (79 per cent) as equitable share of the revenue raised
nationally, Kshs.861.94 million ( 10.2 per cent) as total conditional grants, generate Kshs.172.99 million (2 per cent) from
own sources of revenue, and Kshs.744.20 million (8.8 per cent) cash balance from FY 2017/18.
Figure 3.29: Homa Bay County, Expected Sources of Budget Financing in FY 2018/19
Source: Homa Bay County Treasury
A breakdown of the conditional grants is provided in Table 3.20.
3.8.2 Revenue Analysis During FY 2018/19, the County had a total of Khs.7.86 billion available for budget implementation. This amount consisted
of Kshs.6.69 billion received as equitable share of the revenue raised nationally, Kshs.481.16 million as conditional grants,
Kshs.101.97 million generated from own sources of revenue, and a cash balance of Kshs.591.16 million from FY 2017/18.
Cash Balance from FY 2017/18
8.8%
National Sharable Revenue79.0%
Total Conditional Allocations
10.2%Own Source Revenue
2.0%
Source: Homa Bay County Treasury
A breakdown of the conditional grants is provided in Table 3.20.
3.8.2 Revenue AnalysisDuring FY 2018/19, the County had a total of Khs.7.86 billion available for budget implementation. This amount consisted of Kshs.6.69 billion received as equitable share of the revenue raised nationally, Kshs.481.16 million as conditional grants, Kshs.101.97 million generated from own sources of revenue, and a cash balance of Kshs.591.16 million from FY 2017/18.
Figure 3.30 shows the annual trend in own-source revenue collection from FY 2013/14 to FY 2018/19.
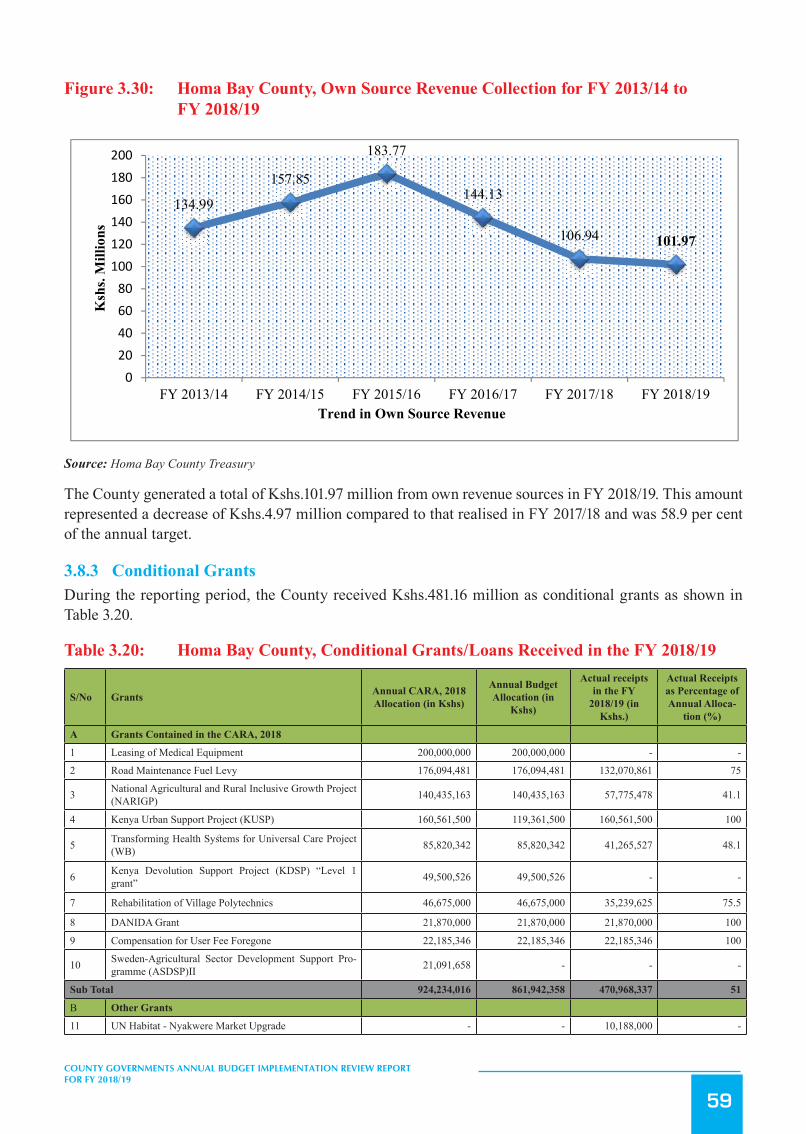
59
COUNTY GOVERNMENTS ANNUAL BUDGET IMPLEMENTATION REVIEW REPORT FOR FY 2018/19
Figure 3.30: Homa Bay County, Own Source Revenue Collection for FY 2013/14 to FY 2018/19
95
Figure 3.30 shows the annual trend in own-source revenue collection from FY 2013/14 to FY 2018/19.
Figure 3.30: Homa Bay County, Own Source Revenue Collection for FY 2013/14 to FY 2018/19
Source: Homa Bay Treasury
The County generated a total of Kshs.101.97 million from own revenue sources in FY 2018/19. This amount represented a
decrease of Kshs.4.97 million compared to that realised in FY 2017/18 and was 58.9 per cent of the annual target.
3.8.3 Conditional Grants During the reporting period, the County received Kshs.481.16 million as conditional grants as shown in Table 3.20.
Table 3.20: Homa Bay County, Conditional Grants/Loans Received in the FY 2018/19
S/No Grants Annual CARA, 2018 Allocation (in Kshs)
Annual Budget Allocation (in Kshs)
Actual receipts in the FY 2018/19 (in Kshs.)
Actual Receipts as Percentage of Annual Allocation (%)
A Grants Contained in the CARA, 2018 1 Leasing of Medical Equipment 200,000,000 200,000,000 - - 2 Road Maintenance Fuel Levy 176,094,481 176,094,481 132,070,861 75
3 National Agricultural and Rural Inclusive Growth Project (NARIGP) 140,435,163 140,435,163 57,775,478 41.1
4 Kenya Urban Support Project (KUSP) 160,561,500 119,361,500 160,561,500 100
5 Transforming Health Systems for Universal Care Project (WB) 85,820,342 85,820,342 41,265,527 48.1
6 Kenya Devolution Support Project (KDSP) "Level 1 grant" 49,500,526 49,500,526 - -
134.99
157.85
183.77
144.13
106.94 101.97
020406080
100120140160180200
FY 2013/14 FY 2014/15 FY 2015/16 FY 2016/17 FY 2017/18 FY 2018/19
Ksh
s. M
illio
ns
Trend in Own Source Revenue
Source: Homa Bay County Treasury
The County generated a total of Kshs.101.97 million from own revenue sources in FY 2018/19. This amount represented a decrease of Kshs.4.97 million compared to that realised in FY 2017/18 and was 58.9 per cent of the annual target.
3.8.3 Conditional GrantsDuring the reporting period, the County received Kshs.481.16 million as conditional grants as shown in Table 3.20.
Table 3.20: Homa Bay County, Conditional Grants/Loans Received in the FY 2018/19
S/No Grants Annual CARA, 2018 Allocation (in Kshs)
Annual Budget Allocation (in
Kshs)
Actual receipts in the FY
2018/19 (in Kshs.)
Actual Receipts as Percentage of Annual Alloca-
tion (%)
A Grants Contained in the CARA, 2018
1 Leasing of Medical Equipment 200,000,000 200,000,000 - -
2 Road Maintenance Fuel Levy 176,094,481 176,094,481 132,070,861 75
3 National Agricultural and Rural Inclusive Growth Project (NARIGP) 140,435,163 140,435,163 57,775,478 41.1
4 Kenya Urban Support Project (KUSP) 160,561,500 119,361,500 160,561,500 100
5 Transforming Health Systems for Universal Care Project (WB) 85,820,342 85,820,342 41,265,527 48.1
6 Kenya Devolution Support Project (KDSP) “Level 1 grant” 49,500,526 49,500,526 - -
7 Rehabilitation of Village Polytechnics 46,675,000 46,675,000 35,239,625 75.5
8 DANIDA Grant 21,870,000 21,870,000 21,870,000 100
9 Compensation for User Fee Foregone 22,185,346 22,185,346 22,185,346 100
10 Sweden-Agricultural Sector Development Support Pro-gramme (ASDSP)II 21,091,658 - - -
Sub Total 924,234,016 861,942,358 470,968,337 51
B Other Grants
11 UN Habitat - Nyakwere Market Upgrade - - 10,188,000 -

60
COUNTY GOVERNMENTS ANNUAL BUDGET IMPLEMENTATION REVIEW REPORT FOR FY 2018/19
S/No Grants Annual CARA, 2018 Allocation (in Kshs)
Annual Budget Allocation (in
Kshs)
Actual receipts in the FY
2018/19 (in Kshs.)
Actual Receipts as Percentage of Annual Alloca-
tion (%)
A Grants Contained in the CARA, 2018
Sub Total - - 10,188,000 -
Grand Total 924,234,016 861,942,358 481,156,337 52.1
Source: Homa Bay County Treasury
During the reporting period, receipts from Kenya Urban Support Project (KUSP), DANIDA and Compensation for User Fee Foregone conditional grants recorded the highest performance in percentage terms, and accounted 100 per cent of the annual target respectively.
3.8.4 Exchequer IssuesIn order to implement the budget, the Controller of Budget approved withdrawal of Kshs.6.83 billion from the CRF account. The withdrawals represented 80.6 per cent of the Approved Supplementary Budget and translated to an increase of 8.4 per cent from Kshs.6.29 billion in FY 2017/18 and comprised of Kshs.1.50 billion (21.9 per cent) towards development activities and Kshs.5.33 billion (78.1 per cent) for recurrent expenditure.
3.8.5 Overall Expenditure ReviewA total of Kshs.5.74 billion was spent on both development and recurrent activities. This expenditure represented 84.1 per cent of the total funds released from the CRF account, and was an increase of 11.4 per cent from Kshs.5.15 billion spent in FY 2017/18.
The expenditure excluded pending bills as at June 30, 2019 which amounted to Kshs.949.74 million for development activities and Kshs.89.70 million for recurrent costs.
Expenditure on development programmes amounted to Kshs.1.01 billion while Kshs.4.73 billion was spent on recurrent activities. The development expenditure was 67.6 per cent of the funds released for development programmes, while recurrent expenditure was 88.7 per cent of funds released for recurrent activities.
Development expenditure recorded an absorption rate of 32.5 per cent, which was a decrease from 42.8 per cent attained in FY 2017/18. Conversely, recurrent expenditure represented 88.3 per cent of the annual recurrent budget, an increase from 80.6 per cent recorded in FY 2017/18.
Figure 3.31 presents a comparison between the total expenditure in FY 2018/19 and FY 2017/18.
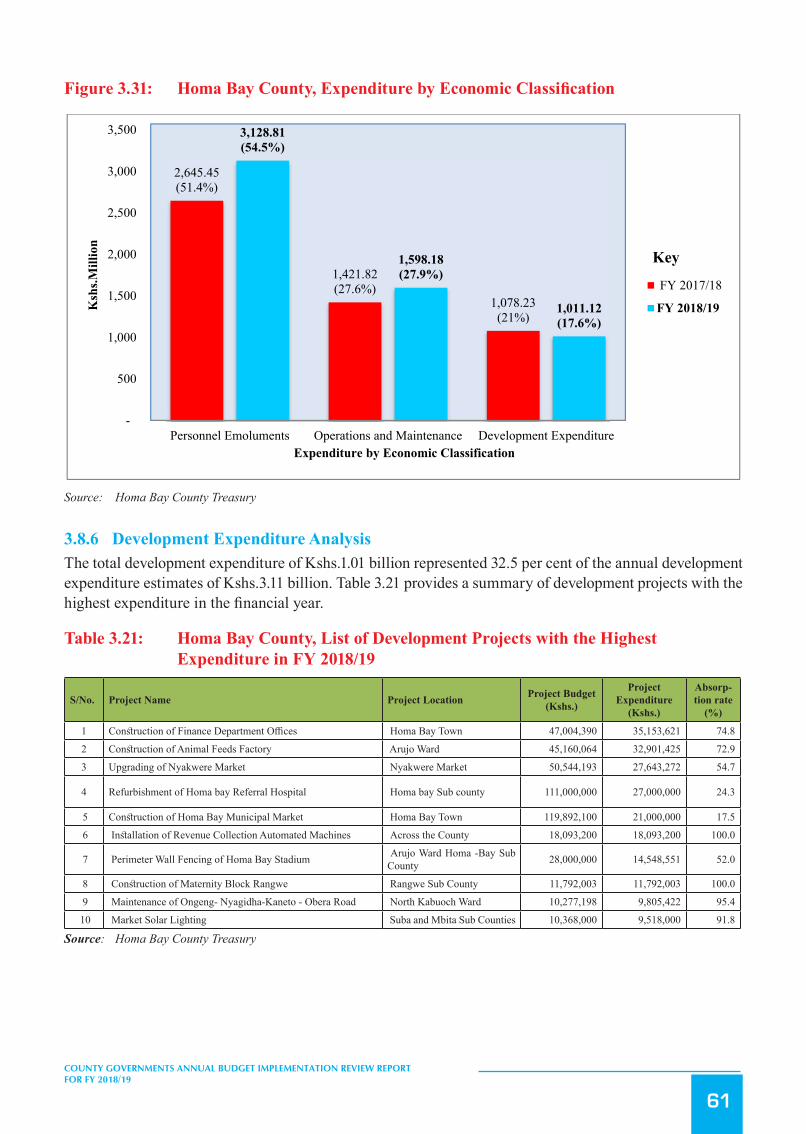
61
COUNTY GOVERNMENTS ANNUAL BUDGET IMPLEMENTATION REVIEW REPORT FOR FY 2018/19
Figure3.31: HomaBayCounty,ExpenditurebyEconomicClassification
97
Development expenditure recorded an absorption rate of 32.5 per cent, which was a decrease from 42.8 per cent attained in
FY 2017/18. Conversely, recurrent expenditure represented 88.3 per cent of the annual recurrent budget, an increase from
80.6 per cent recorded in FY 2017/18.
Figure 3.31 presents a comparison between the total expenditure in FY 2018/19 and FY 2017/18.
Figure 3.31: Homa Bay County, Expenditure by Economic Classification
Source: Homa Bay County Treasury
3.8.6 Development Expenditure Analysis The total development expenditure of Kshs.1.01 billion represented 32.5 per cent of the annual development expenditure
estimates of Kshs.3.11 billion. Table 3.21 provides a summary of development projects with the highest expenditure in the
financial year.
Table 3.21: Homa Bay County, List of Development Projects with the Highest Expenditure in FY 2018/19
S/No. Project Name Project Location Project Budget(Kshs.)
Project Expenditure (Kshs.)
Absorption rate (%)
1 Construction of Finance Department Offices Homa Bay Town 47,004,390 35,153,621 74.82 Construction of Animal Feeds Factory Arujo Ward 45,160,064 32,901,425 72.93 Upgrading of Nyakwere Market Nyakwere Market 50,544,193 27,643,272 54.7
4 Refurbishment of Homa bay Referral Hospital Homa bay Sub county 111,000,000 27,000,000 24.3
5 Construction of Homa Bay Municipal Market Homa Bay Town 119,892,100 21,000,000 17.5
6 Installation of Revenue Collection Automated
Machines Across the County 18,093,200 18,093,200 100.0
7 Perimeter Wall Fencing of Homa Bay Stadium Arujo Ward Homa -Bay SubCounty 28,000,000 14,548,551 52.0
2,645.45(51.4%)
1,421.82(27.6%)
1,078.23(21%)
3,128.81(54.5%)
1,598.18(27.9%)
1,011.12(17.6%)
-
500
1,000
1,500
2,000
2,500
3,000
3,500
Personnel Emoluments Operations and Maintenance Development Expenditure
Ksh
s.Mill
ion
Expenditure by Economic Classification
FY 2017/18
FY 2018/19
Key
Source: Homa Bay County Treasury
3.8.6 Development Expenditure AnalysisThe total development expenditure of Kshs.1.01 billion represented 32.5 per cent of the annual development expenditure estimates of Kshs.3.11 billion. Table 3.21 provides a summary of development projects with the highest expenditure in the financial year.
Table 3.21: Homa Bay County, List of Development Projects with the Highest Expenditure in FY 2018/19
S/No. Project Name Project Location Project Budget (Kshs.)
Project Expenditure
(Kshs.)
Absorp-tion rate
(%)
1 Construction of Finance Department Offices Homa Bay Town 47,004,390 35,153,621 74.8
2 Construction of Animal Feeds Factory Arujo Ward 45,160,064 32,901,425 72.9
3 Upgrading of Nyakwere Market Nyakwere Market 50,544,193 27,643,272 54.7
4 Refurbishment of Homa bay Referral Hospital Homa bay Sub county 111,000,000 27,000,000 24.3
5 Construction of Homa Bay Municipal Market Homa Bay Town 119,892,100 21,000,000 17.5
6 Installation of Revenue Collection Automated Machines Across the County 18,093,200 18,093,200 100.0
7 Perimeter Wall Fencing of Homa Bay Stadium Arujo Ward Homa -Bay Sub County 28,000,000 14,548,551 52.0
8 Construction of Maternity Block Rangwe Rangwe Sub County 11,792,003 11,792,003 100.0
9 Maintenance of Ongeng- Nyagidha-Kaneto - Obera Road North Kabuoch Ward 10,277,198 9,805,422 95.4
10 Market Solar Lighting Suba and Mbita Sub Counties 10,368,000 9,518,000 91.8
Source: Homa Bay County Treasury
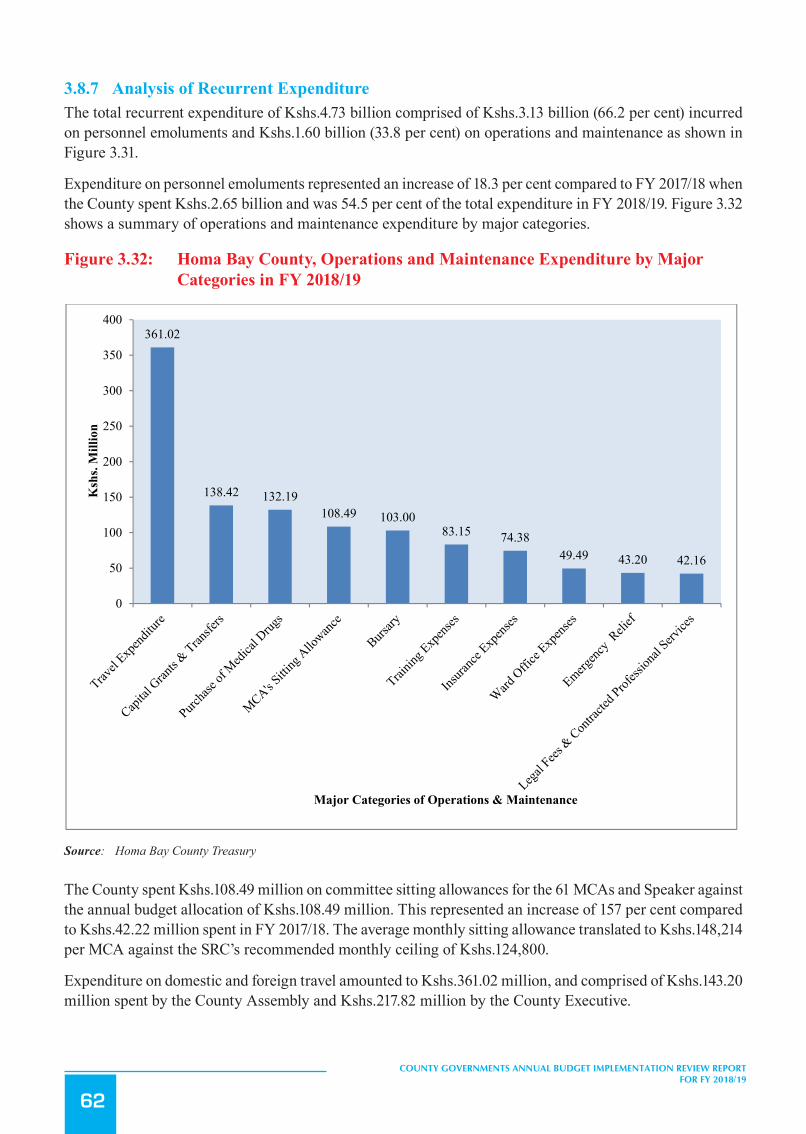
62
COUNTY GOVERNMENTS ANNUAL BUDGET IMPLEMENTATION REVIEW REPORT FOR FY 2018/19
3.8.7 Analysis of Recurrent ExpenditureThe total recurrent expenditure of Kshs.4.73 billion comprised of Kshs.3.13 billion (66.2 per cent) incurred on personnel emoluments and Kshs.1.60 billion (33.8 per cent) on operations and maintenance as shown in Figure 3.31.
Expenditure on personnel emoluments represented an increase of 18.3 per cent compared to FY 2017/18 when the County spent Kshs.2.65 billion and was 54.5 per cent of the total expenditure in FY 2018/19. Figure 3.32 shows a summary of operations and maintenance expenditure by major categories.
Figure 3.32: Homa Bay County, Operations and Maintenance Expenditure by Major Categories in FY 2018/19
98
S/No. Project Name Project Location Project Budget (Kshs.)
Project Expenditure (Kshs.)
Absorption rate (%)
8 Construction of Maternity Block Rangwe Rangwe Sub County 11,792,003 11,792,003 100.0
9
Maintenance of Ongeng- Nyagidha-Kaneto - Obera Road North Kabuoch Ward 10,277,198 9,805,422 95.4
10 Market Solar Lighting Suba and Mbita Sub Counties 10,368,000 9,518,000 91.8
Source: Homa Bay County Treasury
3.8.7 Analysis of Recurrent Expenditure The total recurrent expenditure of Kshs.4.73 billion comprised of Kshs.3.13 billion (66.2 per cent) incurred on personnel
emoluments and Kshs.1.60 billion (33.8 per cent) on operations and maintenance as shown in Figure 3.31.
Expenditure on personnel emoluments represented an increase of 18.3 per cent compared to FY 2017/18 when the County
spent Kshs.2.65 billion and was 54.5 per cent of the total expenditure in FY 2018/19. Figure 3.32 shows a summary of
operations and maintenance expenditure by major categories.
Figure 3.32:Homa Bay County, Operations and Maintenance Expenditure by Major Categories in FY 2018/19
Source: Homa Bay County Treasury
361.02
138.42 132.19108.49 103.00
83.15 74.3849.49 43.20 42.16
0
50
100
150
200
250
300
350
400
Ksh
s. M
illio
n
Major Categories of Operations & Maintenance
Source: Homa Bay County Treasury
The County spent Kshs.108.49 million on committee sitting allowances for the 61 MCAs and Speaker against the annual budget allocation of Kshs.108.49 million. This represented an increase of 157 per cent compared to Kshs.42.22 million spent in FY 2017/18. The average monthly sitting allowance translated to Kshs.148,214 per MCA against the SRC’s recommended monthly ceiling of Kshs.124,800.
Expenditure on domestic and foreign travel amounted to Kshs.361.02 million, and comprised of Kshs.143.20 million spent by the County Assembly and Kshs.217.82 million by the County Executive.
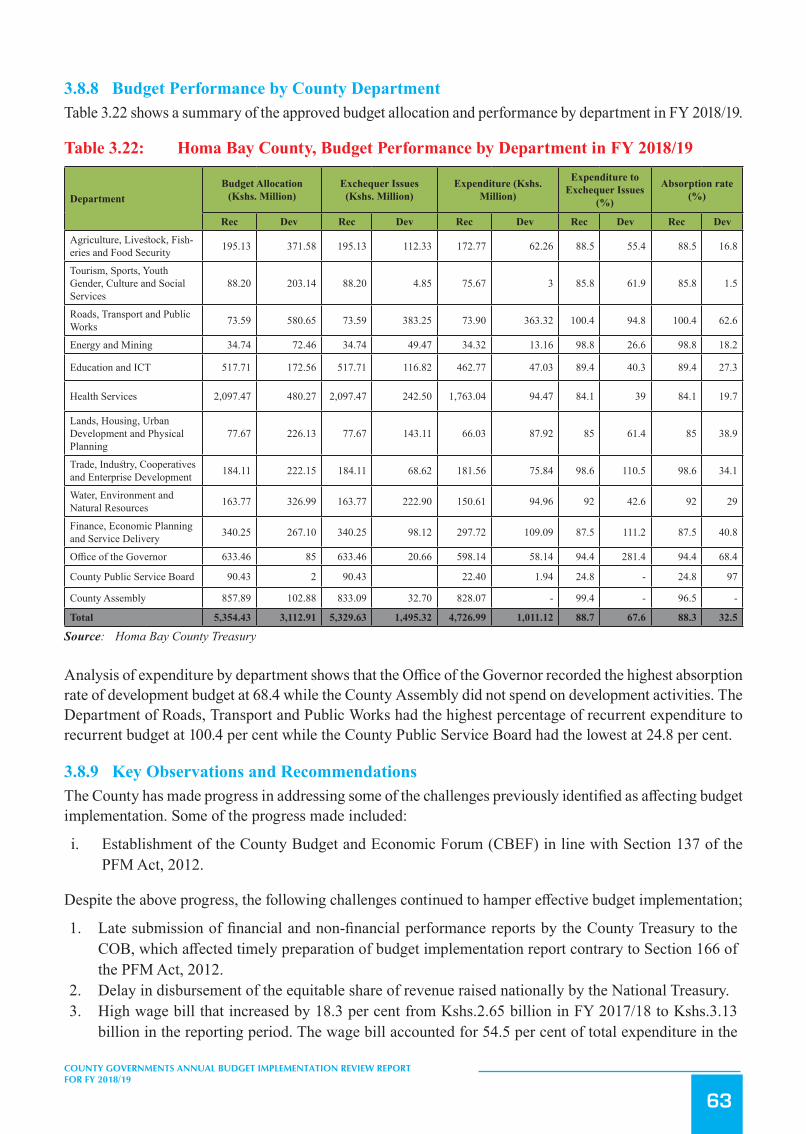
63
COUNTY GOVERNMENTS ANNUAL BUDGET IMPLEMENTATION REVIEW REPORT FOR FY 2018/19
3.8.8 Budget Performance by County DepartmentTable 3.22 shows a summary of the approved budget allocation and performance by department in FY 2018/19.
Table 3.22: Homa Bay County, Budget Performance by Department in FY 2018/19
DepartmentBudget Allocation
(Kshs. Million)Exchequer Issues
(Kshs. Million)Expenditure (Kshs.
Million)
Expenditure to Exchequer Issues
(%)
Absorption rate (%)
Rec Dev Rec Dev Rec Dev Rec Dev Rec Dev
Agriculture, Livestock, Fish-eries and Food Security 195.13 371.58 195.13 112.33 172.77 62.26 88.5 55.4 88.5 16.8
Tourism, Sports, Youth Gender, Culture and Social Services
88.20 203.14 88.20 4.85 75.67 3 85.8 61.9 85.8 1.5
Roads, Transport and Public Works 73.59 580.65 73.59 383.25 73.90 363.32 100.4 94.8 100.4 62.6
Energy and Mining 34.74 72.46 34.74 49.47 34.32 13.16 98.8 26.6 98.8 18.2
Education and ICT 517.71 172.56 517.71 116.82 462.77 47.03 89.4 40.3 89.4 27.3
Health Services 2,097.47 480.27 2,097.47 242.50 1,763.04 94.47 84.1 39 84.1 19.7
Lands, Housing, Urban Development and Physical Planning
77.67 226.13 77.67 143.11 66.03 87.92 85 61.4 85 38.9
Trade, Industry, Cooperatives and Enterprise Development 184.11 222.15 184.11 68.62 181.56 75.84 98.6 110.5 98.6 34.1
Water, Environment and Natural Resources 163.77 326.99 163.77 222.90 150.61 94.96 92 42.6 92 29
Finance, Economic Planning and Service Delivery 340.25 267.10 340.25 98.12 297.72 109.09 87.5 111.2 87.5 40.8
Office of the Governor 633.46 85 633.46 20.66 598.14 58.14 94.4 281.4 94.4 68.4
County Public Service Board 90.43 2 90.43 22.40 1.94 24.8 - 24.8 97
County Assembly 857.89 102.88 833.09 32.70 828.07 - 99.4 - 96.5 -
Total 5,354.43 3,112.91 5,329.63 1,495.32 4,726.99 1,011.12 88.7 67.6 88.3 32.5
Source: Homa Bay County Treasury
Analysis of expenditure by department shows that the Office of the Governor recorded the highest absorption rate of development budget at 68.4 while the County Assembly did not spend on development activities. The Department of Roads, Transport and Public Works had the highest percentage of recurrent expenditure to recurrent budget at 100.4 per cent while the County Public Service Board had the lowest at 24.8 per cent.
3.8.9 Key Observations and RecommendationsThe County has made progress in addressing some of the challenges previously identified as affecting budget implementation. Some of the progress made included:
i. Establishment of the County Budget and Economic Forum (CBEF) in line with Section 137 of the PFM Act, 2012.
Despite the above progress, the following challenges continued to hamper effective budget implementation;
1. Late submission of financial and non-financial performance reports by the County Treasury to the COB, which affected timely preparation of budget implementation report contrary to Section 166 of the PFM Act, 2012.
2. Delay in disbursement of the equitable share of revenue raised nationally by the National Treasury.3. High wage bill that increased by 18.3 per cent from Kshs.2.65 billion in FY 2017/18 to Kshs.3.13
billion in the reporting period. The wage bill accounted for 54.5 per cent of total expenditure in the

64
COUNTY GOVERNMENTS ANNUAL BUDGET IMPLEMENTATION REVIEW REPORT FOR FY 2018/19
reporting period.4. Delay by Fund Administrators to submit expenditure reports to the COB of the Car Loan and Mortgage
Fund and Bursary Fund contrary to Section 168 of the PFM Act, 2012.5. Under-performance in own-source revenue collection, which declined by 4.6 per cent from
Kshs.106.94 million in FY 2017/18 to Kshs.101.97 million in the reporting period.6. Inadequate budgetary control that resulted in expenditure above approved budget by the Department
of Roads, Transport and Public Works. This is contrary to Section 135 and 154 of PFM Act, 2012.
The County should implement the following measures in order to improve budget execution;
1. The County Treasury should ensure timely preparation and submission of financial and non-financial performance reports in line with Section 166 of PFM Act, 2012.
2. The County Treasury should liaise with the National Treasury to ensure that funds are released in a timely manner.
3. The County Public Service Board should develop an optimal staffing structure and devise strategies to contain expenditure on personnel costs within 35 per cent of County’s total revenue in line with Regulation 25(1) (b) of the PFM (County Government) Regulations, 2015.
4. All Fund Administrators should ensure timely submission of expenditure reports on established Funds in line with Section 168 of PFM Act 2012.
5. The County Treasury should address the under-performance of own-source revenue in order to enhance budget execution.
6. The County Treasury should ensure expenditure is within the approved budget.
3.9 Isiolo County
3.9.1 Overview of the FY 2018/19 BudgetThe County’s FY 2018/19 Supplementary Budget was Kshs.5.48 billion, comprising of Kshs.1.86 billion (33.9 per cent) and Kshs.3.62 billion (66.1 per cent) allocation for development and recurrent expenditure respectively.
To finance the budget, the County expects to receive Kshs.3.93 billion (71.6 per cent) as equitable share of the revenue raised nationally, Kshs.989.58 million (18 per cent) as total conditional grants, generate Kshs.150.86 million (2.8 per cent) from own sources of revenue, and Kshs.418.66 million (7.6 per cent) cash balance from FY 2017/18.

65
COUNTY GOVERNMENTS ANNUAL BUDGET IMPLEMENTATION REVIEW REPORT FOR FY 2018/19
Figure 3.33: Isiolo County, Expected Sources of Budget Financing in FY 2018/19
101
Source: Isiolo County Treasury
A breakdown of the conditional grants is provided in Table 3.23.
3.9.2 Revenue Analysis During FY 2018/19, the County had a total of Khs.4.98 billion available for budget implementation. This amount consisted
of Kshs.3.93 billion received as equitable share of the revenue raised nationally, Kshs.475.8 million as conditional grants,
Kshs.161.77 million generated from own sources of revenue, and a cash balance of Kshs.418.66 million from FY 2017/18.
Figure 3.34 shows the annual trend in own-source revenue collection from FY 2013/14 to FY 2018/19.
Figure 3.34: Isiolo County, Own Source Revenue Collection for FY 2013/14 to FY 2018/19
Source: Isiolo County Treasury
Cash Balance from FY 2017/18
7.6%National Sharable
Revenue71.6%
Total Conditional Allocations
18.0%
Own Source Revenue2.8%
125.06133.28
110.1194.99
114.56
161.77
0
20
40
60
80
100
120
140
160
180
FY 2013/14 FY 2014/15 FY 2015/16 FY 2016/17 FY 2017/18 FY 2018/19
Kshs
. Mill
ions
Trend in Own Source Revenue
Source: Isiolo County Treasury
A breakdown of the conditional grants is provided in Table 3.23.
3.9.2 Revenue AnalysisDuring FY 2018/19, the County had a total of Khs.4.98 billion available for budget implementation. This amount consisted of Kshs.3.93 billion received as equitable share of the revenue raised nationally, Kshs.475.8 million as conditional grants, Kshs.161.77 million generated from own sources of revenue, and a cash balance of Kshs.418.66 million from FY 2017/18.
Figure 3.34 shows the annual trend in own-source revenue collection from FY 2013/14 to FY 2018/19.
Figure 3.34: Isiolo County, Own Source Revenue Collection for FY 2013/14 to FY 2018/19
101
Source: Isiolo County Treasury
A breakdown of the conditional grants is provided in Table 3.23.
3.9.2 Revenue Analysis During FY 2018/19, the County had a total of Khs.4.98 billion available for budget implementation. This amount consisted
of Kshs.3.93 billion received as equitable share of the revenue raised nationally, Kshs.475.8 million as conditional grants,
Kshs.161.77 million generated from own sources of revenue, and a cash balance of Kshs.418.66 million from FY 2017/18.
Figure 3.34 shows the annual trend in own-source revenue collection from FY 2013/14 to FY 2018/19.
Figure 3.34: Isiolo County, Own Source Revenue Collection for FY 2013/14 to FY 2018/19
Source: Isiolo County Treasury
Cash Balance from FY 2017/18
7.6%National Sharable
Revenue71.6%
Total Conditional Allocations
18.0%
Own Source Revenue2.8%
125.06133.28
110.1194.99
114.56
161.77
0
20
40
60
80
100
120
140
160
180
FY 2013/14 FY 2014/15 FY 2015/16 FY 2016/17 FY 2017/18 FY 2018/19
Ksh
s. M
illio
ns
Trend in Own Source Revenue
Source: Isiolo County Treasury
The County generated a total of Kshs.161.77 million from own revenue sources in FY 2018/19. This amount represented an increase of Kshs.47.21 million compared to that realised in FY 2017/18 and was 107.2 per cent of the annual target.

66
COUNTY GOVERNMENTS ANNUAL BUDGET IMPLEMENTATION REVIEW REPORT FOR FY 2018/19
3.9.3 Conditional GrantsDuring the reporting period, the County received Kshs.475.8 million as conditional grants as shown in Table 3.23.
Table 3.23: Isiolo County, Conditional Grants/Loans Received in the FY 2018/19
S/No Grants Annual CARA, 2018 Allo-cation (in Kshs)
Annual Budget Alloca-tion (in Kshs)
Actual receipts in the FY 2018/19 (in
Kshs.)
Actual Receipts as Percentage
of Annual Allo-cation (%)
A Grants Contained in the CARA, 2018
1 World Bank Loan for Climate Smart Agriculture Project 150,000,000 150,000,000 32,966,823 22
2 Supplement for Construction of County Headquarters 121,000,000 121,000,000 - -
3 Road Maintenance Fuel Levy Fund 103,341,833 103,341,833 77,506,374 75
4 Urban Support Project- Development 93,968,100 93,968,100 93,968,100 100
5 World Bank Loan for Transforming Health System for universal Care Project 66,229,830 66,229,830 40,147,057 60.6
6 Urban Support Project- Recurrent (2017/18+2018/19) 41,200,000 41,200,000 41,200,000 100
7 Sweden Agricultural Sector Development Support Programme (ASDSP) 22,028,970 22,028,970 8,020,256 36.4
8 Development of Youth Polytechnics 21,235,000 21,235,000 - -
9 DANIDA Grant 12,656,250 12,656,250 12,656,250 100
10 Kenya Devolution Support Programme 38,668,826 38,668,826 - -
11 Food and Agriculture Organization of the United Nations-Livestock grant - 9,023,720 - -
12 Compensation for User Fee Foregone 3,472,461 3,472,461 3,472,461 100
Sub Total 673,801,270 682,824,990 309,937,321 46
B Other Grants
13 Universal Health Care (UHC) - 283,586,466 142,698,094 -
14 Road Maintenance Fuel Levy Fund bal. 2017/18 - 23,164,758 23,164,758 -
Sub Total - 306,751,224 165,862,852 -
Grand Total 673,801,270 989,576,214 475,800,173.4 70.6
Source: Isiolo County Treasury
During the reporting period, receipts from the DANIDA Grant, Compensation for User Fee Foregone, Urban Support Project conditional grant recorded the highest performance in percentage terms, and accounted 100 per cent of the annual target respectively.
3.9.4 Exchequer IssuesIn order to implement the budget, the Controller of Budget approved withdrawal of Kshs.4.89 billion from the CRF account. The withdrawals represented 89.1 per cent of the Approved Supplementary Budget and translated to an increase of 29.9 per cent from Kshs.3.76 billion in FY 2017/18 and comprised of Kshs.1.36 billion (27.9 per cent) towards development activities and Kshs.3.52 billion (72.1 per cent) for recurrent expenditure.
3.9.5 Overall Expenditure ReviewA total of Kshs.4.28 billion was spent on both development and recurrent activities. This expenditure represented 87.6 per cent of the total funds released from the CRF account, and was an increase of 26.2 per cent from Kshs.3.39 billion spent in FY 2017/18.

67
COUNTY GOVERNMENTS ANNUAL BUDGET IMPLEMENTATION REVIEW REPORT FOR FY 2018/19
Expenditure on development programmes amounted to Kshs.997.92 million while Kshs.3.28 billion was spent on recurrent activities. The development expenditure was 73.2 per cent of the funds released for development programmes, while recurrent expenditure was 93.2 per cent of funds released for recurrent activities.
Development expenditure recorded an absorption rate of 53.7 per cent, which was a decrease from 72.4 per cent attained in FY 2017/18. Conversely, recurrent expenditure represented 90.5 per cent of the annual recurrent budget, an increase from 81.3 per cent recorded in FY 2017/18.
Figure 3.35 presents a comparison between the total expenditure in FY 2018/19 and FY 2017/18.
Figure3.35: IsioloCounty,ExpenditurebyEconomicClassification
103
3.9.4 Exchequer Issues In order to implement the budget, the Controller of Budget approved withdrawal of Kshs.4.89 billion from the CRF account.
The withdrawals represented 89.1 per cent of the Approved Supplementary Budget and translated to an increase of 29.9 per
cent from Kshs.3.76 billion in FY 2017/18 and comprised of Kshs.1.36 billion (27.9 per cent) towards development
activities and Kshs.3.52 billion (72.1 per cent) for recurrent expenditure.
3.9.5 Overall Expenditure Review A total of Kshs.4.28 billion was spent on both development and recurrent activities. This expenditure represented 87.6 per
cent of the total funds released from the CRF account, and was an increase of 26.2 per cent from Kshs.3.39 billion spent in
FY 2017/18.
Expenditure on development programmes amounted to Kshs.997.92 million while Kshs.3.28 billion was spent on recurrent
activities. The development expenditure was 73.2 per cent of the funds released for development programmes, while
recurrent expenditure was 93.2 per cent of funds released for recurrent activities.
Development expenditure recorded an absorption rate of 53.7 per cent, which was a decrease from 72.4 per cent attained in
FY 2017/18. Conversely, recurrent expenditure represented 90.5 per cent of the annual recurrent budget, an increase from
81.3 per cent recorded in FY 2017/18.
Figure 3.35 presents a comparison between the total expenditure in FY 2018/19 and FY 2017/18.
Figure 3.35: Isiolo County, Expenditure by Economic Classification
Source: Isiolo County Treasury
1,474.16(43.5%)
777.75(22.9%)
1,138.42(36.6%)
1,593.20(37.2%)
1,688.02(39.4%)
997.92(23.3%)
-
200
400
600
800
1,000
1,200
1,400
1,600
1,800
Personnel Emoluments Operations and Maintenance Development Expenditure
Ksh
s.Mill
ion
Expenditure by Economic Classification
FY 2017/18
FY 2018/19
Key
Source: Isiolo County Treasury
3.9.6 Development Expenditure AnalysisThe total development expenditure of Kshs.997.92 million represented 53.7 per cent of the annual development expenditure estimates of Kshs.1.86 billion. Table 3.24 provides a summary of development projects with the highest expenditure in the financial year.
Table 3.24: Isiolo County, List of Development Projects with the Highest Expenditure in FY 2018/19
S/No. Project Name Project Location Project budget (Kshs.) FY2018/19 Project Ex-penditure (Kshs.)
A b s o r p t i o n rate (%)
1 Construction of Isiolo Stadium Wabera 130,000,000 130,000,000 100.0
2 Construction of County HQ Wabera 200,000,000 79,000,000 39.5
3 Construction of Isiolo Market Bula pesa 13,042,362 13,042,362 100.0
4 Sericho Polytechnic Sericho 12,985,000 10,087,596 77.7
5 Oldonyiro Youth Polytechnic Oldonyiro 12,987,916 5,342,639 41.1
6 Titling Bula pesa 15,000,000 5,000,000 33.3
7 Construction of perimeter fence at ATC Burat 4,500,000 4,451,666 98.9

68
COUNTY GOVERNMENTS ANNUAL BUDGET IMPLEMENTATION REVIEW REPORT FOR FY 2018/19
S/No. Project Name Project Location Project budget (Kshs.) FY2018/19 Project Ex-penditure (Kshs.)
A b s o r p t i o n rate (%)
8 Repair of Main Abattoir Building Burat 4,200,000 4,169,272 99.3
9 Expansion of Kulamawe Water Supply Kinna 4,000,000 3,939,200 98.5
10 Supply of Borehole Generator Cherab 4,000,000 3,927,124 98.2
Source: Isiolo County Treasury
3.9.7 Analysis of Recurrent ExpenditureThe total recurrent expenditure of Kshs.3.28 billion comprised of Kshs.1.59 billion (48.6 per cent) incurred on personnel emoluments and Kshs.1.69 billion (51.4 per cent) on operations and maintenance as shown in Figure 3.35.
Expenditure on personnel emoluments represented an increase of 8.1 per cent compared to FY 2017/18 when the County spent Kshs.1.47 billion and was 37.2 per cent of the total expenditure in FY 2018/19. Figure 3.36 shows a summary of operations and maintenance expenditure by major categories.
Figure 3.36: Isiolo County, Operations and Maintenance Expenditure by Major Categories in FY 2018/19
105
Source: Isiolo County Treasury
The County spent Kshs.26.53 million on committee sitting allowances for the 18 MCAs and speaker against the annual
budget allocation of Kshs.26.53 million. This represented an increase of 63.8 per cent compared to Kshs.16.2 million spent
in a similar period of FY 2017/18. The average monthly sitting allowance translated to Kshs.122,838 per MCA against the
SRC’s recommended monthly ceiling of Kshs.124,800.
Expenditure on domestic travel amounted to Kshs.171.97 million, and comprised of Kshs.65.4 million spent by the County
Assembly and Kshs.106.57 million by the County Executive. This expenditure represented 5.2 per cent of total recurrent
expenditure and was a decrease of 5 per cent compared to Kshs.180.32 million spent in FY 2017/18.
3.9.8 Budget Performance by County Department Table 3.25 shows a summary of the approved budget allocation and performance by department in FY 2018/19.
Table 3.25: Isiolo County, Budget Performance by Department in FY 2018/19
Department Budget Allocation (Kshs. Million)
Exchequer Issues (Kshs. Million)
Expenditure (Kshs. Million)
Expenditure to Exchequer Issues (%)
Absorption rate (%)
372.85
171.97
106.04 105.69
72.40 69.1853.44 51.45 50.84
26.53
0
50
100
150
200
250
300
350
400
Ksh
s. M
illio
n
Major Categories of Operations & Maintenance
Source: Isiolo County Treasury

69
COUNTY GOVERNMENTS ANNUAL BUDGET IMPLEMENTATION REVIEW REPORT FOR FY 2018/19
The County spent Kshs.26.53 million on committee sitting allowances for the 18 MCAs and speaker against the annual budget allocation of Kshs.26.53 million. This represented an increase of 63.8 per cent compared to Kshs.16.2 million spent in a similar period of FY 2017/18. The average monthly sitting allowance translated to Kshs.122,838 per MCA against the SRC’s recommended monthly ceiling of Kshs.124,800.
Expenditure on domestic travel amounted to Kshs.171.97 million, and comprised of Kshs.65.4 million spent by the County Assembly and Kshs.106.57 million by the County Executive. This expenditure represented 5.2 per cent of total recurrent expenditure and was a decrease of 5 per cent compared to Kshs.180.32 million spent in FY 2017/18.
3.9.8 Budget Performance by County DepartmentTable 3.25 shows a summary of the approved budget allocation and performance by department in FY 2018/19.
Table 3.25: Isiolo County, Budget Performance by Department in FY 2018/19
DepartmentBudget Allocation
(Kshs. Million)Exchequer Issues (Kshs.
Million)Expenditure (Kshs.
Million)Expenditure to Ex-chequer Issues (%) Absorption rate (%)
Rec Dev Rec Dev Rec Dev Rec Dev Rec Dev
County Assembly 415.28 85 413 85 393.67 76.21 95.3 89.7 94.8 89.7
Office of the Governor 298.44 - 295.24 - 293.17 - 99.3 - 98.2 -
County Public Service Board 52.41 - 52.41 - 54.55 - 104.1 - 104.1 -
County Secretary 33.16 3.94 30.71 - 30.06 2.38 97.9 - 90.6 60.3
Administration and PSM 167.14 29.80 162.42 29.80 132.17 49.09 81.4 164.7 79.1 164.7
Delivery Unit 10.48 - 9.28 - 10.11 - 108.9 - 96.4 -
Office of the Deputy Governor 24.00 - 23.33 - 20.96 - 89.8 - 87.3 -
Cohesion, Intergov-ernmental Relations, coordination, Disaster Management
45.88 - 44.46 - 41.40 - 93.1 - 90.2 -
Finance and Economic Planning 222.05 210.91 219.57 99.98 173.33 79.57 78.9 79.6 78.1 37.7
Special Programmes and ICT 432.37 17.37 431.85 17.37 414.44 3.51 96 20.2 95.9 20.2
Economic Planning 44.43 - 43.75 - 39.77 - 90.9 - 89.5 -
Lands and Physical Planning 31.12 34.39 23.10 24.39 28.71 28.87 124.3 118.4 92.3 83.9
Roads and Infrastructure 15.60 163.05 14.55 163.05 14.22 100.88 97.8 61.9 91.2 61.9
Public Works and Housing 27.77 3.30 23.88 - 26.01 3.30 108.9 - 93.7 100
Municipal Administration 82.16 135.81 43.59 133.05 - 49.09 - 36.9 - 36.2
Agriculture 54.08 223 53.76 37.13 52.59 19.71 97.8 53.1 97.2 8.8
Livestock, Veterinary and Fisheries 123.57 71.41 123.09 70.97 94.60 31.36 76.9 44.2 76.6 43.9
Education and Vocational Training 225.21 89.97 212.76 85.50 210.72 - 99 - 93.6 -
Youth and Sports 24.85 136 20.23 130 16.45 164.50 81.3 126.5 66.2 121
Culture and Social Services 37.90 17.10 33.71 5.90 28.54 1.50 84.7 25.4 75.3 8.8
Tourism and Wildlife Management 126.75 19.87 126.75 15.20 111.43 13.30 87.9 87.5 87.9 66.9
Trade, Industries, Coop-eratives 25.08 4.75 24.29 - 13.30 - 54.8 - 53 -
Water and Irrigation 67.78 99.87 64.89 99.60 62.16 84.15 95.8 84.5 91.7 84.3

70
COUNTY GOVERNMENTS ANNUAL BUDGET IMPLEMENTATION REVIEW REPORT FOR FY 2018/19
DepartmentBudget Allocation
(Kshs. Million)Exchequer Issues (Kshs.
Million)Expenditure (Kshs.
Million)Expenditure to Ex-chequer Issues (%) Absorption rate (%)
Rec Dev Rec Dev Rec Dev Rec Dev Rec Dev
Environment and Natural Resources 34.41 15.68 34.29 14.97 31.44 3.40 91.7 22.7 91.4 21.7
Health Services 1,002.28 498.67 997.39 350.87 987.42 287.10 99 81.8 98.5 57.6
Total 3,624.21 1,859.88 3,522.32 1,362.78 3,281.22 997.92 93.2 73.2 90.5 53.7
Source: Isiolo County Treasury
Analysis of expenditure by department shows that the Department of Administration and Public Service Management recorded the highest absorption rate of development budget at 164.7 while the Department of Trade, Industries, and Cooperatives and the Department of Education and Vocational Training did not spend on development budget. The County Public Service Board had the highest percentage of recurrent expenditure to recurrent budget at 104.1 per cent while the Department of Municipal Administration did not spend on the recurrent budget.
3.9.9 Key Observations and RecommendationsThe County has made progress in addressing some of the challenges previously identified as affecting budget implementation. Some of the progress made included:
i. Improvement in own-source revenue collection by 41.2 per cent from Kshs.114.56 million in FY 2017/18 to Kshs.161.77 million in FY 2018/19.
ii. Establishment and operationalization of an Audit Committee and the Internal Audit Department in line with Section 155 of PFM Act, 2012.
Despite the above progress, the following challenges continued to hamper effective budget implementation;
1. Delay in disbursement of the equitable share of revenue raised nationally by the National Treasury.2. During the reporting period, it was observed that the County did not process all payments through
IFMIS and the Internet Banking platform contrary to Government Policy.3. Decline in absorption of development budget. In the reporting period, the County attained an
absorption rate of 53.7 per cent compared to 72.4 per cent in FY 2017/18.4. Inadequate budgetary control that resulted in expenditure above approved budget by the Department
of Administration and PSM and the County Public Service Board. This is contrary to Section 135 and 154 of PFM Act, 2012.
5. Increase in wage bill by 8.1 per cent from Kshs.1.47 billion in FY 2017/18 to Kshs.1.59 billion in the reporting period. The wage bill accounted for 37.2 per cent of total expenditure in FY 2018/19.
6. Failure by the County to provide a detailed report on pending bills as of the end of the financial year.
The County should implement the following measures in order to improve budget execution;
1. The County Treasury should liaise with the National Treasury to ensure that funds allocated to the County are released in a timely manner.
2. The County should ensure all payments are processed through IFMIS and the Internet Banking platform.
3. The County should formulate strategies to enhance absorption of development budget.4. The County Treasury should ensure expenditure is within the approved budget.5. The County Public Service Board should develop an optimal staffing structure and devise strategies
to contain expenditure on personnel costs within 35 per cent of County’s total revenue in line with Regulation 25(1) (b) of the PFM (County Government) Regulations, 2015.
6. The County Treasury should provide a report on status of pending bills as at 30th June, 2019 as
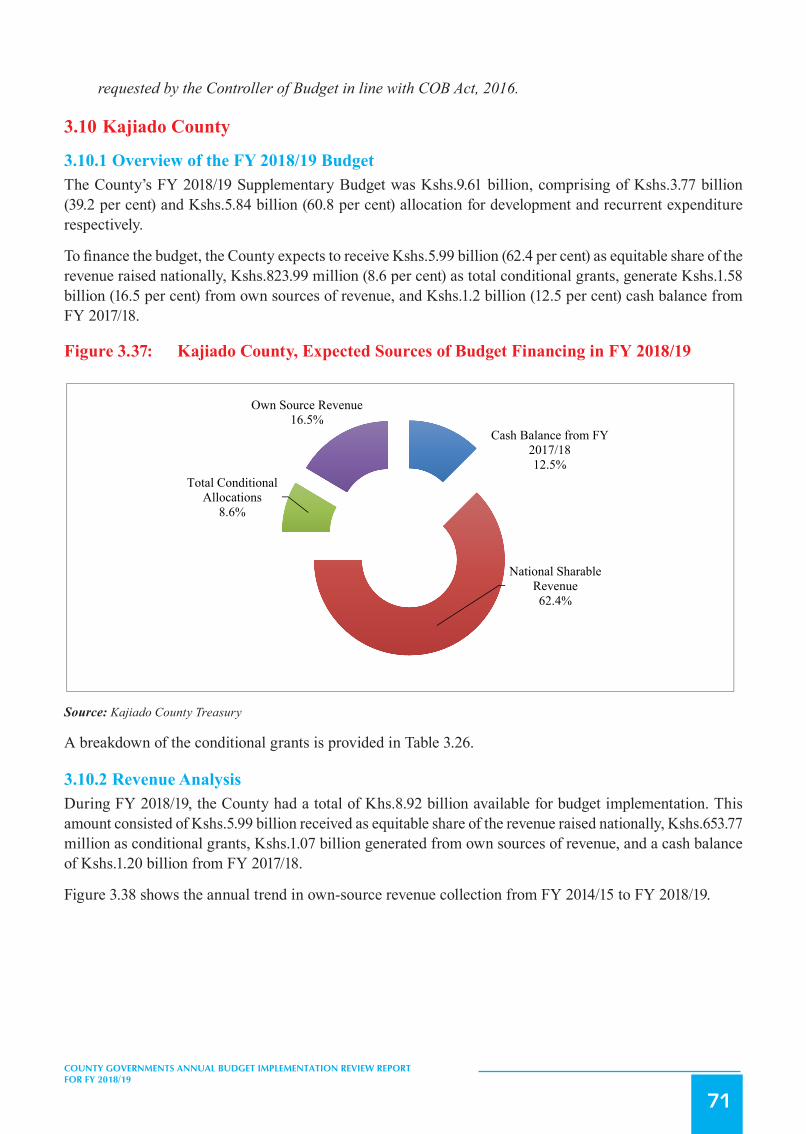
71
COUNTY GOVERNMENTS ANNUAL BUDGET IMPLEMENTATION REVIEW REPORT FOR FY 2018/19
requested by the Controller of Budget in line with COB Act, 2016.
3.10 Kajiado County
3.10.1 Overview of the FY 2018/19 BudgetThe County’s FY 2018/19 Supplementary Budget was Kshs.9.61 billion, comprising of Kshs.3.77 billion (39.2 per cent) and Kshs.5.84 billion (60.8 per cent) allocation for development and recurrent expenditure respectively.
To finance the budget, the County expects to receive Kshs.5.99 billion (62.4 per cent) as equitable share of the revenue raised nationally, Kshs.823.99 million (8.6 per cent) as total conditional grants, generate Kshs.1.58 billion (16.5 per cent) from own sources of revenue, and Kshs.1.2 billion (12.5 per cent) cash balance from FY 2017/18.
Figure 3.37: Kajiado County, Expected Sources of Budget Financing in FY 2018/19
108
To finance the budget, the County expects to receive Kshs.5.99 billion (62.4 per cent) as equitable share of the revenue
raised nationally, Kshs.823.99 billion (8.6 per cent) as total conditional grants, generate Kshs.1.58 billion (16.5 per cent)
from own sources of revenue, and Kshs.1.2 billion (12.5 per cent) cash balance from FY 2017/18.
Figure 3.37: Kajiado County, Expected Sources of Budget Financing in FY 2018/19
Source: Kajiado County Treasury
A breakdown of the conditional grants is provided in Table 3.26.
3.10.2 Revenue Analysis During FY 2018/19, the County had a total of Khs.8.92 billion available for budget implementation. This amount consisted
of Kshs.5.99 billion received as equitable share of the revenue raised nationally, Kshs.653.77 million as conditional grants,
Kshs.1.07 billion generated from own sources of revenue, and a cash balance of Kshs.1.20 billion from FY 2017/18.
Figure 3.38 shows the annual trend in own-source revenue collection from FY 2014/15 to FY 2018/19.
Figure 3.38: Kajiado County, Own Source Revenue Collection for FY 2014/15 to FY 2018/19
Cash Balance from FY 2017/1812.5%
National Sharable Revenue62.4%
Total Conditional Allocations
8.6%
Own Source Revenue16.5%
Source: Kajiado County Treasury
A breakdown of the conditional grants is provided in Table 3.26.
3.10.2 Revenue AnalysisDuring FY 2018/19, the County had a total of Khs.8.92 billion available for budget implementation. This amount consisted of Kshs.5.99 billion received as equitable share of the revenue raised nationally, Kshs.653.77 million as conditional grants, Kshs.1.07 billion generated from own sources of revenue, and a cash balance of Kshs.1.20 billion from FY 2017/18.
Figure 3.38 shows the annual trend in own-source revenue collection from FY 2014/15 to FY 2018/19.

72
COUNTY GOVERNMENTS ANNUAL BUDGET IMPLEMENTATION REVIEW REPORT FOR FY 2018/19
Figure 3.38: Kajiado County, Own Source Revenue Collection for FY 2014/15 to FY 2018/19
109
Source: Kajiado County Treasury
The County generated a total of Kshs.1.07 billion from own source revenue in FY 2018/19. This amount represented an
increase of Kshs.345.64 million compared to that realised in FY 2017/18 and was 67.7 per cent of the annual target.
3.10.3 Conditional Grants During the reporting period, the County received Kshs.653.77 million as conditional grants as shown in Table 3.26.
Table 3.26: Kajiado County, Conditional Grants/Loans Received in the FY 2018/19
S/No Grants
Annual CARA, 2018 Allocation
(in Kshs)
Annual Budget
Allocation (in Kshs)
Actual receipts in the FY 2018/19 (in
Kshs.)
Actual Receipts as Percentage of Annual Allocation
(%)
A Grants Contained in the CARA, 2018 1 Compensation for User Fee Foregone 16,995,365 28,197,865 16,607,973 97.7 2 Leasing of Medical Equipment 200,000,000 - - - 3 Road Maintenance Fuel Levy Fund 157,906,319 157,906,319 157,906,320 100 4 Rehabilitation of Village Polytechnics 40,345,000 40,345,000 30,460,475 75.5 5 Transforming Health Systems for Universal Care Project (World Bank) 62,478,710 62,478,710 12,775,524 20.4 6 IDA (World Bank)-Kenya Climate Smart Agriculture Project (KCSAP) 117,000,000 117,000,000 34,359,919 29.4
7 IDA (World Bank) Kenya Devolution Support Project (KDSP) "Level 1 grant" 45,860,424 64,324,384 66,231,532 144.4
8 IDA (World Bank) -Kenya Urban Support Project (KUSP) 307,160,300 307,160,300 307,150,300 100 9 DANIDA - Universal Healthcare in Devolved System Programme 19,338,750 26,277,348 20,884,748 108
10 Sweden - Agriculture Sector Development Support Programme (ASDSP) II + Bal C/F in FY 2017/18 20,305,981 20,305,981 7,392,954 36.4
Total 987,390,849 823,995,907 653,769,744 66.2
Source: Kajiado County Treasury
During the reporting period, receipts from the Kenya Devolution Support Programme conditional grant recorded the highest
performance in percentage terms, and accounted for 144.4 per cent of the annual target.
786.20
650.99
499.58
726.69
1,072.33
0
200
400
600
800
1,000
1,200
FY 2014/15 FY 2015/16 FY 2016/17 FY 2017/18 FY 2018/19
Kshs. M
illions
Trend in Own Source Revenue
Source: Kajiado County Treasury
The County generated a total of Kshs.1.07 billion from own source revenue in FY 2018/19. This amount represented an increase of Kshs.345.64 million compared to that realised in FY 2017/18 and was 67.7 per cent of the annual target.
3.10.3 Conditional GrantsDuring the reporting period, the County received Kshs.653.77 million as conditional grants as shown in Table 3.26.
Table 3.26: Kajiado County, Conditional Grants/Loans Received in the FY 2018/19
S/No GrantsAnnual CARA, 2018 Allocation
(in Kshs)
Annual Budget Allocation (in
Kshs)
Actual receipts in the FY
2018/19 (in Kshs.)
Actual Receipts as
Percentage of Annual Allo-cation (%)
A Grants Contained in the CARA, 2018
1 Compensation for User Fee Foregone 16,995,365 28,197,865 16,607,973 97.7
2 Leasing of Medical Equipment 200,000,000 - - -
3 Road Maintenance Fuel Levy Fund 157,906,319 157,906,319 157,906,320 100
4 Rehabilitation of Village Polytechnics 40,345,000 40,345,000 30,460,475 75.5
5 Transforming Health Systems for Universal Care Project (World Bank) 62,478,710 62,478,710 12,775,524 20.4
6 IDA (World Bank)-Kenya Climate Smart Agriculture Project (KCSAP) 117,000,000 117,000,000 34,359,919 29.4
7 IDA (World Bank) Kenya Devolution Support Project (KDSP) “Level 1 grant” 45,860,424 64,324,384 66,231,532 144.4
8 IDA (World Bank) -Kenya Urban Support Project (KUSP) 307,160,300 307,160,300 307,150,300 100
9 DANIDA - Universal Healthcare in Devolved System Programme 19,338,750 26,277,348 20,884,748 108
10 Sweden - Agriculture Sector Development Support Programme (ASDSP) II + Bal C/F in FY 2017/18 20,305,981 20,305,981 7,392,954 36.4
Total 987,390,849 823,995,907 653,769,744 66.2
Source: Kajiado County Treasury

73
COUNTY GOVERNMENTS ANNUAL BUDGET IMPLEMENTATION REVIEW REPORT FOR FY 2018/19
During the reporting period, receipts from the Kenya Devolution Support Programme conditional grant recorded the highest performance in percentage terms, and accounted for 144.4 per cent of the annual target.
3.10.4 Exchequer IssuesIn order to implement the budget, the Controller of Budget approved withdrawal of Kshs.7.78 billion from the CRF account. The withdrawals represented 81 per cent of the Approved Supplementary Budget and translated to an increase of 20.3 per cent from Kshs.6.47 billion in FY 2017/18 and comprised of Kshs.2.07 billion (26.5 per cent) towards development activities and Kshs.5.72 billion (73.5 per cent) for recurrent expenditure.
3.10.5 Overall Expenditure ReviewA total of Kshs.7.73 billion was spent on both development and recurrent activities. This expenditure represented 99.3 per cent of the total funds released from the CRF account, and was an increase of 40.3 per cent from Kshs.5.51 billion spent in FY 2017/18.
The expenditure excluded pending bills as at June 30, 2019 which amounted to Kshs.486.67 million for development activities and Kshs.252.18 million for recurrent costs.
Expenditure on development programmes amounted to Kshs.2.39 billion while Kshs.5.34 billion was spent on recurrent activities. The development expenditure was 115.8 per cent of the funds released for development programmes, while recurrent expenditure was 93.3 per cent of funds released for recurrent activities.
Development expenditure recorded an absorption rate of 63.4 per cent, which was an increase from 37.2 per cent attained in FY 2017/18. Conversely, recurrent expenditure represented 91.4 per cent of the annual recurrent budget, an increase from 86.4 per cent recorded in FY 2017/18.
Figure 3.39 presents a comparison between the total expenditure in FY 2018/19 and FY 2017/18.
Figure3.39: KajiadoCounty,ExpenditurebyEconomicClassification
111
Source: Kajiado County Treasury
3.10.6 Development Expenditure Analysis The total development expenditure of Kshs.2.39 billion represented 63.4 per cent of the annual development expenditure
estimates of Kshs.3.77 billion. Table 3.27 provides a summary of development projects with the highest expenditure in the
financial year.
Table 3.27: Kajiado County, List of Development Projects with the Highest Expenditure in FY 2018/19
S/No.
Project Name Project Location Project Budget (Kshs.)
FY2018/19 Project Expenditure (Kshs.)
Absorption rate
(%) 1 Construction of Ngong sport complex Ngong
198,464,940
16,000,096 8.1
2 Maternity wing & wards at Kajiado referral hospital Ildamat
66,407,983
6,432,014 9.7
3 Construction of Kiserian market Keekonyokie
61,242,373
10,037,631 16.4
4
Payment for Consultancy services for preparation of Kajiado county spatial plan Headquarters
52,534,358
52,534,358 100
5 Construction of Kitengela market Kitengela
39,564,363
24,110,484 60.9
6
Tarmacking of JCN A104 KCB Kitengela - Orata-Saitoti Hospital Road Kitengela
37,935,190
20,125,909 53.1
7 MRI & CT scan machine and civil works Headquarters
37,120,000
28,828,052 77.7
8 Dining hall at Olkejuado High School Dalalekutuk Ward
36,980,846
19,289,721 52.2
9 Modern drug store at Kajiado county referral hospital Ildamat Ward
32,298,889
19,273,516 59.7
10 Upgrading of Loitoktok hospital Kuku Ward
29,977,592
19,875,324 66.3
Source: Kajiado County Treasury
2,551.93(49.8%)
1,384.72(27%) 1,185.16
(23.1%)
2,891.25(37.4%)
2,444.43(31.6%)
2,391.17(30.9%)
-
500
1,000
1,500
2,000
2,500
3,000
3,500
Personnel Emoluments Operations and Maintenance Development Expenditure
Ksh
s.Mill
ion
Expenditure by Economic Classification
FY 2017/18
FY 2018/19
Key
Source: Kajiado County Treasury

74
COUNTY GOVERNMENTS ANNUAL BUDGET IMPLEMENTATION REVIEW REPORT FOR FY 2018/19
3.10.6 Development Expenditure AnalysisThe total development expenditure of Kshs.2.39 billion represented 63.4 per cent of the annual development expenditure estimates of Kshs.3.77 billion. Table 3.27 provides a summary of development projects with the highest expenditure in the financial year.
Table 3.27: Kajiado County, List of Development Projects with the Highest Expenditure in FY 2018/19
S/No. Project Name Project Location Project Budget (Kshs.)
FY2018/19 Project Ex-penditure (Kshs.)
Absorp-tion rate
(%)
1 Construction of Ngong sport complex Ngong 198,464,940 16,000,096 8.1
2 Maternity wing & wards at Kajiado referral hospital Ildamat 66,407,983 6,432,014 9.7
3 Construction of Kiserian market Keekonyokie 61,242,373 10,037,631 16.4
4 Payment for Consultancy services for preparation of Kajiado county spatial plan Headquarters 52,534,358 52,534,358 100
5 Construction of Kitengela market Kitengela 39,564,363 24,110,484 60.9
6 Tarmacking of JCN A104 KCB Kitengela - Ora-ta-Saitoti Hospital Road Kitengela 37,935,190 20,125,909 53.1
7 MRI & CT scan machine and civil works Headquarters 37,120,000 28,828,052 77.7
8 Dining hall at Olkejuado High School Dalalekutuk Ward 36,980,846 19,289,721 52.2
9 Modern drug store at Kajiado county referral hospital Ildamat Ward 32,298,889 19,273,516 59.7
10 Upgrading of Loitoktok hospital Kuku Ward 29,977,592 19,875,324 66.3Source: Kajiado County Treasury
3.10.7 Analysis of Recurrent ExpenditureThe total recurrent expenditure of Kshs.5.34 billion comprised of Kshs.2.89 billion (54.2 per cent) incurred on personnel emoluments and Kshs.2.44 billion (45.8 per cent) on operations and maintenance as shown in Figure 3.39.
Expenditure on personnel emoluments represented an increase of 13.3 per cent compared FY 2017/18 when the County spent Kshs.2.55 billion and was 37.4 per cent of the total expenditure in FY 2018/19. Figure 3.40 shows a summary of operations and maintenance expenditure by major categories.

75
COUNTY GOVERNMENTS ANNUAL BUDGET IMPLEMENTATION REVIEW REPORT FOR FY 2018/19
Figure 3.40: Kajiado County, Operations and Maintenance Expenditure by Major Categories in FY 2018/19
112
3.10.7 Analysis of Recurrent Expenditure The total recurrent expenditure of Kshs.5.34 billion comprised of Kshs.2.89 billion (54.2 per cent) incurred on personnel
emoluments and Kshs.2.44 billion (45.8 per cent) on operations and maintenance as shown in Figure 3.39.
Expenditure on personnel emoluments represented an increase of 13.3 per cent compared FY 2017/18 when the County
spent Kshs.2.55 billion and was 37.4 per cent of the total expenditure in FY 2018/19. Figure 3.40 shows a summary of
operations and maintenance expenditure by major categories.
Figure 3.40: Kajiado County, Operations and Maintenance Expenditure by Major Categories in FY 2018/19
Source: Kajiado County Treasury
The County spent Kshs.26.93 million on committee sitting allowances for the 42 MCAs and Speaker against the annual
budget allocation of Kshs.34.50 million. This represented an increase of 186.7 per cent compared to Kshs.9.39 million spent
in FY 2017/18. The average monthly sitting allowance translated to Kshs.53,431 per MCA against the SRC’s recommended
monthly ceiling of Kshs.124,800.
Expenditure on domestic and foreign travel amounted to Kshs.561.10 million, and comprised of Kshs.195.95 million spent
by the County Assembly and Kshs.365.15 million by the County Executive. This expenditure represented 10.5 per cent of
total recurrent expenditure and was an increase of 179.9 per cent compared to Kshs.200.47 million spent in FY 2017/18.
447.54
253.21
131.27113.56
93.74 77.76 75.55 75.43 66.40
0
50
100
150
200
250
300
350
400
450
500
Ksh
s. M
illio
n
Major Categories of Operations & Maintenance
Source: Kajiado County Treasury
The County spent Kshs.26.93 million on committee sitting allowances for the 42 MCAs and Speaker against the annual budget allocation of Kshs.34.50 million. This represented an increase of 186.7 per cent compared to Kshs.9.39 million spent in FY 2017/18. The average monthly sitting allowance translated to Kshs.53,431 per MCA against the SRC’s recommended monthly ceiling of Kshs.124,800.
Expenditure on domestic and foreign travel amounted to Kshs.561.10 million, and comprised of Kshs.195.95 million spent by the County Assembly and Kshs.365.15 million by the County Executive. This expenditure represented 10.5 per cent of total recurrent expenditure and was an increase of 179.9 per cent compared to Kshs.200.47 million spent in FY 2017/18.
3.10.8 Budget Performance by County DepartmentTable 3.28 shows a summary of the approved budget allocation and performance by department in FY 2018/19.

76
COUNTY GOVERNMENTS ANNUAL BUDGET IMPLEMENTATION REVIEW REPORT FOR FY 2018/19
Table 3.28: Kajiado County, Budget Performance by Department in FY 2018/19
DepartmentBudget Allocation
(Kshs. Million)Exchequer Issues
(Kshs. Million)Expenditure (Kshs.
Million)Expenditure to Excheq-
uer Issues (%)Absorption rate
(%)
Rec Dev Rec Dev Rec Dev Rec Dev Rec Dev
Office of the Governor & Deputy Governor 348.25 - 348.25 - 316.36 - 90.8 - 90.8 -
County Public Service Board 107.80 - 107.80 - 102.37 - 95.0 - 95.0 -
Education & Vocational Training 484.84 286.85 484.84 139.79 482.25 176.02 99.5 125.9 99.5 61.4
Medical Services, Public Health & Sanitation 2,011.12 386.50 1,985.31 186.71 1,970.78 237.22 99.3 127.1 98.0 61.4
Youth, Sports, Gender & Social Services 178.04 131.50 178.04 25.54 156.78 18.27 88.1 71.5 88.1 13.9
Agriculture, Livestock, Fisheries & Cooperative Development
350.40 195.00 338.07 31.73 317.86 13.73 94.0 43.3 90.7 7.0
Water, Irrigation, Environment & Natural Resources
220.62 311.00 220.62 133.26 198.07 195.56 89.8 146.7 89.8 62.9
Roads, Transport, Public Works, Housing & Energy
165.61 842.91 165.61 354.37 145.29 556.01 87.7 156.9 87.7 66.0
Public Service, Ad-ministration & Citizen Participation
464.02 15.00 464.02 0.00 346.79 7.57 74.7 - 74.7 50.5
County Treasury 612.17 1,029.99 531.31 749.17 510.87 1,002.06 96.2 133.8 83.5 97.3
Trade, Culture, Tourism & Wildlife 93.23 106.50 93.23 54.71 77.85 52.20 83.5 95.4 83.5 49.0
Lands & Physical Planning 143.01 321.96 143.01 294.61 60.80 35.96 42.5 12.2 42.5 11.2
County Assembly 656.83 142.09 656.83 95.17 649.63 96.57 98.9 101.5 98.9 68.0
Total 5,835.96 3,769.29 5,716.95 2,065.07 5,335.68 2,391.17 93.3 115.8 91.4 63.4
Source: Kajiado County Treasury
Analysis of expenditure by department shows that the County Treasury recorded the highest absorption rate of development budget at 97.3 per cent while the Department of Agriculture, Livestock, Fisheries & Cooperative Development recorded the lowest at 7 per cent. The Department of Education and Vocational Training had the highest percentage of recurrent expenditure to recurrent budget at 99.5 per cent while the Department of Lands and Physical Planning had the lowest at 42.5 per cent.
3.10.9 Key Observations and RecommendationsThe County has made progress in addressing some of the challenges previously identified as affecting budget implementation. Some of the progress made included:
i. Improvement in own-source revenue collection by 47.6 per cent from Kshs.726.69 million collected in FY 2017/18 to Kshs.1.07 billion in FY 2018/19.
Despite the above progress, the following challenges continued to hamper effective budget implementation;
1. High expenditure on domestic travel, which increased by 187 per cent from Kshs.156.02 million in FY 2017/18 to Kshs.447.54 million in the reporting period.
2. Failure by Fund Administrators to submit expenditure reports of the Car Loan and Mortgage Fund, Emergency Fund, Bursary Fund, Disability Fund and the Youth and Women Enterprise Fund contrary to Section 168 of the PFM Act, 2012.
3. Late submission of reports on financial and non-financial performance by the County Treasury to the

77
COUNTY GOVERNMENTS ANNUAL BUDGET IMPLEMENTATION REVIEW REPORT FOR FY 2018/19
Controller of Budget, which affected timely preparation of budget implementation report contrary to Section 166 of the PFM Act, 2012.
4. Increase in wage bill by 13.3 per cent from Kshs.2.55 billion in FY 2017/18 to Kshs.2.89 billion in the reporting period. The wage bill accounted for 37.4 per cent of total expenditure in FY 2018/19.
The County should implement the following measures in order to improve budget execution;
1. The County Treasury should ensure that expenditure on non-core budget items is rationalised to provide more resources for development projects.
2. All Fund Administrators should ensure timely submission of expenditure reports on established Funds in line with Section 168 of PFM Act 2012.
3. The County Treasury should ensure timely preparation and submission of reports on financial and non-financial performance in line with Section 166 of PFM Act, 2012.
4. The County Public Service Board should develop an optimal staffing structure and devise strategies to contain expenditure on personnel costs within 35 per cent of County’s total revenue in line with Regulation 25(1) (b) of the PFM (County Government) Regulations, 2015.
3.11 Kakamega County
3.11.1 Overview of the FY 2018/19 BudgetThe County’s FY 2018/19 Supplementary Budget was Kshs.14.49 billion, comprising of Kshs.6.80 billion (47 per cent) and Kshs.7.69 billion (53 per cent) allocation for development and recurrent expenditure respectively.
To finance the budget, the County expects to receive Kshs.10.33 billion (71.3 per cent) as equitable share of the revenue raised nationally, Kshs.1.66 billion (11.5 per cent) as total conditional grants, generate Kshs.1.2 billion (8.3 per cent) from own sources of revenue, and Kshs.1.29 billion (8.9 per cent) cash balance from FY 2017/18.
Figure 3.41: Kakamega County, Expected Sources of Budget Financing in FY 2018/19
115
Source: Kakamega County Treasury
A breakdown of the conditional grants is provided in Table 3.29.
3.11.2 Revenue Analysis During FY 2018/19, the County had a total of Khs.14.15 billion available for budget implementation. This amount consisted
of Kshs.10.33 billion received as equitable share of the revenue raised nationally, Kshs.1.62 billion as conditional grants,
Kshs.896.66 million generated from own sources of revenue, and a cash balance of Kshs.1.29 billion from FY 2017/18.
Figure 3.42 shows the annual trend in own-source revenue collection from FY 2013/14 to FY 2018/19.
Figure 3.42: Kakamega County, Own Source Revenue Collection for FY 2013/14 to FY 2018/19
Cash Balance from FY 2017/18
8.9%
National Sharable Revenue71.3%
Conditional Allocations 11.5%
Own Source Revenue8.3%
Source: Kakamega County Treasury
A breakdown of the conditional grants is provided in Table 3.29.
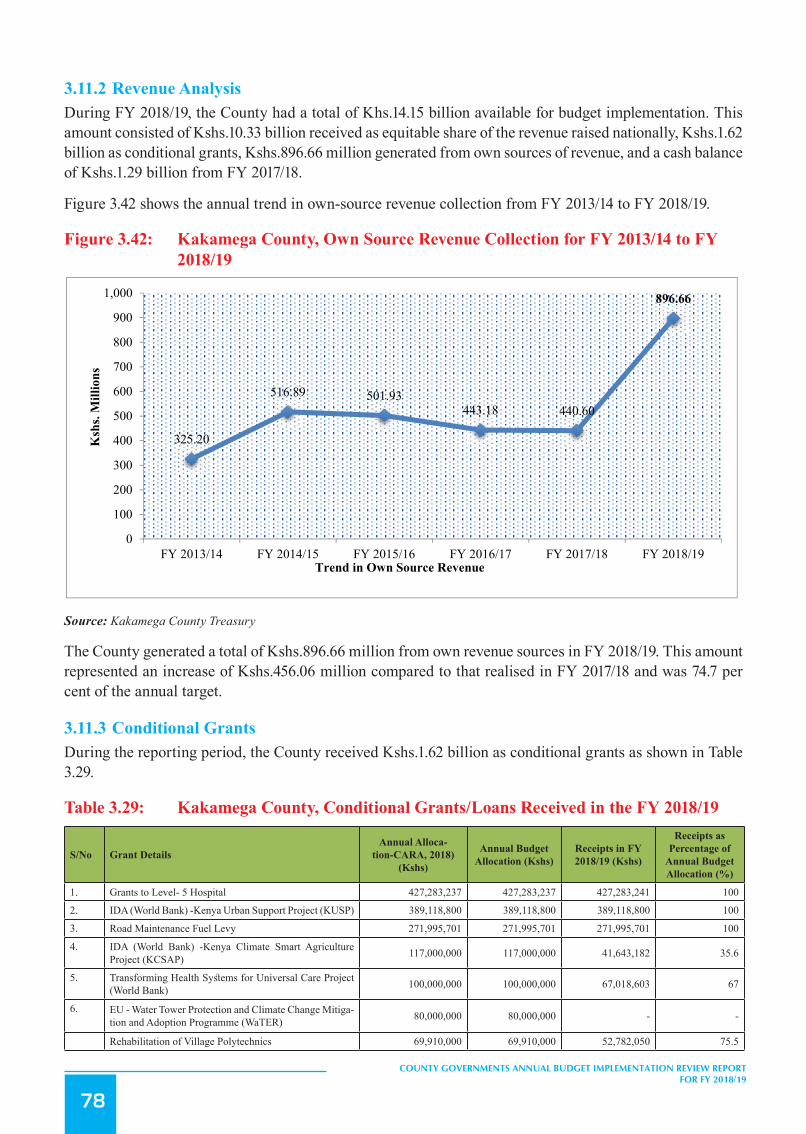
78
COUNTY GOVERNMENTS ANNUAL BUDGET IMPLEMENTATION REVIEW REPORT FOR FY 2018/19
3.11.2 Revenue AnalysisDuring FY 2018/19, the County had a total of Khs.14.15 billion available for budget implementation. This amount consisted of Kshs.10.33 billion received as equitable share of the revenue raised nationally, Kshs.1.62 billion as conditional grants, Kshs.896.66 million generated from own sources of revenue, and a cash balance of Kshs.1.29 billion from FY 2017/18.
Figure 3.42 shows the annual trend in own-source revenue collection from FY 2013/14 to FY 2018/19.
Figure 3.42: Kakamega County, Own Source Revenue Collection for FY 2013/14 to FY 2018/19
116
Source: Kakamega County Treasury
The County generated a total of Kshs.896.66 million from own revenue sources in FY 2018/19. This amount represented an
increase of Kshs.456.06 million compared to that realised in FY 2017/18 and was 74.7 per cent of the annual target.
1.1.1 Conditional Grants During the reporting period, the County received Kshs.1.62 billion as conditional grants as shown in Table 3.29.
Table 3.29: Kakamega County, Conditional Grants/Loans Received in the FY 2018/19
S/No Grant Details
Annual Allocation-CARA, 2018) (Kshs)
Annual Budget Allocation (Kshs)
Receipts in FY 2018/19 (Kshs)
Receipts as Percentage of Annual Budget Allocation (%)
1. Grants to Level- 5 Hospital 427,283,237 427,283,237 427,283,241 100 2. IDA (World Bank) -Kenya Urban Support Project (KUSP) 389,118,800 389,118,800 389,118,800 100 3.
Road Maintenance Fuel Levy 271,995,701 271,995,701 271,995,701 100
4. IDA (World Bank) -Kenya Climate Smart Agriculture Project (KCSAP) 117,000,000 117,000,000 41,643,182 35.6
5. Transforming Health Systems for Universal Care Project (World Bank) 100,000,000 100,000,000 67,018,603 67
6. EU - Water Tower Protection and Climate Change Mitigation and Adoption Programme (WaTER) 80,000,000 80,000,000 - -
7. Rehabilitation of Village Polytechnics 69,910,000 69,910,000 52,782,050 75.5 8. IDA (World Bank) Kenya Devolution Support Programme
“Level 1 grant” 63,508,830 63,508,830 - -
325.20
516.89 501.93443.18 440.60
896.66
0
100
200
300
400
500
600
700
800
900
1,000
FY 2013/14 FY 2014/15 FY 2015/16 FY 2016/17 FY 2017/18 FY 2018/19
Ksh
s. M
illio
ns
Trend in Own Source Revenue
Source: Kakamega County Treasury
The County generated a total of Kshs.896.66 million from own revenue sources in FY 2018/19. This amount represented an increase of Kshs.456.06 million compared to that realised in FY 2017/18 and was 74.7 per cent of the annual target.
3.11.3 Conditional GrantsDuring the reporting period, the County received Kshs.1.62 billion as conditional grants as shown in Table 3.29.
Table 3.29: Kakamega County, Conditional Grants/Loans Received in the FY 2018/19
S/No Grant DetailsAnnual Alloca-
tion-CARA, 2018)(Kshs)
Annual Budget Allocation (Kshs)
Receipts in FY 2018/19 (Kshs)
Receipts as Percentage of
Annual Budget Allocation (%)
1. Grants to Level- 5 Hospital 427,283,237 427,283,237 427,283,241 100
2. IDA (World Bank) -Kenya Urban Support Project (KUSP) 389,118,800 389,118,800 389,118,800 100
3. Road Maintenance Fuel Levy 271,995,701 271,995,701 271,995,701 100
4. IDA (World Bank) -Kenya Climate Smart Agriculture Project (KCSAP) 117,000,000 117,000,000 41,643,182 35.6
5. Transforming Health Systems for Universal Care Project (World Bank) 100,000,000 100,000,000 67,018,603 67
6. EU - Water Tower Protection and Climate Change Mitiga-tion and Adoption Programme (WaTER) 80,000,000 80,000,000 - -
Rehabilitation of Village Polytechnics 69,910,000 69,910,000 52,782,050 75.5
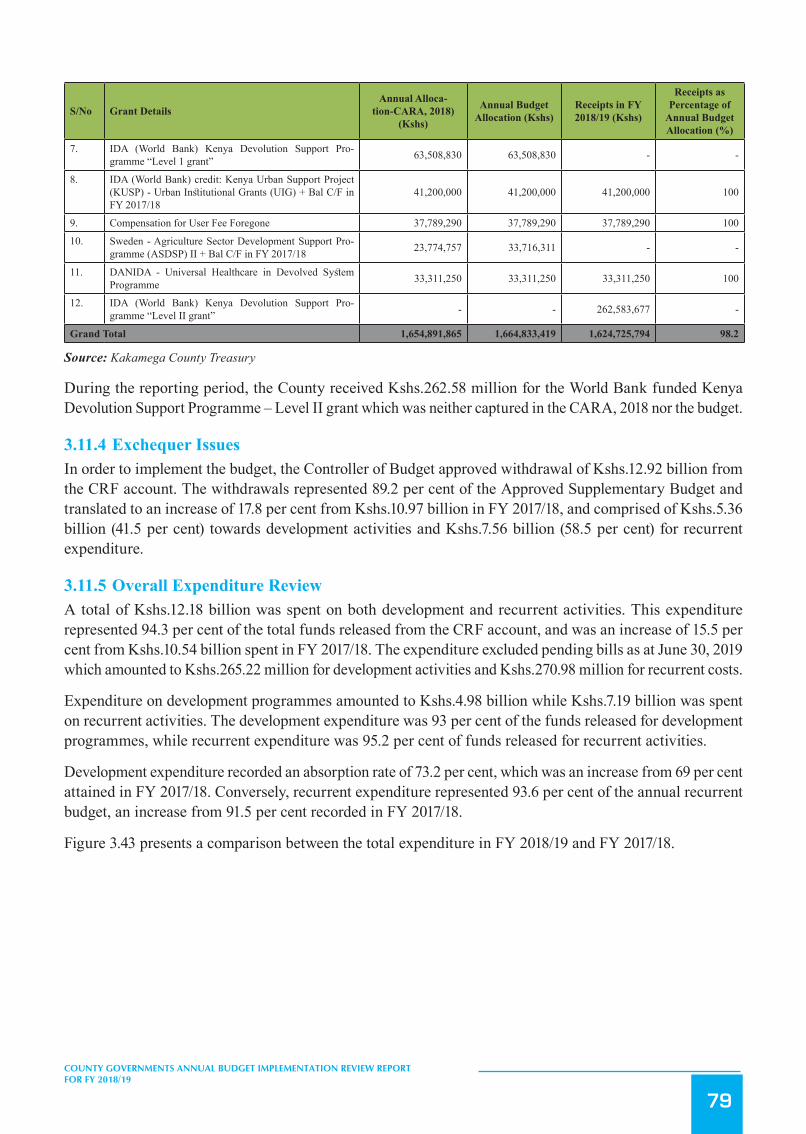
79
COUNTY GOVERNMENTS ANNUAL BUDGET IMPLEMENTATION REVIEW REPORT FOR FY 2018/19
S/No Grant DetailsAnnual Alloca-
tion-CARA, 2018)(Kshs)
Annual Budget Allocation (Kshs)
Receipts in FY 2018/19 (Kshs)
Receipts as Percentage of
Annual Budget Allocation (%)
7. IDA (World Bank) Kenya Devolution Support Pro-gramme “Level 1 grant” 63,508,830 63,508,830 - -
8. IDA (World Bank) credit: Kenya Urban Support Project (KUSP) - Urban Institutional Grants (UIG) + Bal C/F in FY 2017/18
41,200,000 41,200,000 41,200,000 100
9. Compensation for User Fee Foregone 37,789,290 37,789,290 37,789,290 100
10. Sweden - Agriculture Sector Development Support Pro-gramme (ASDSP) II + Bal C/F in FY 2017/18 23,774,757 33,716,311 - -
11. DANIDA - Universal Healthcare in Devolved System Programme 33,311,250 33,311,250 33,311,250 100
12. IDA (World Bank) Kenya Devolution Support Pro-gramme “Level II grant” - - 262,583,677 -
Grand Total 1,654,891,865 1,664,833,419 1,624,725,794 98.2
Source: Kakamega County Treasury
During the reporting period, the County received Kshs.262.58 million for the World Bank funded Kenya Devolution Support Programme – Level II grant which was neither captured in the CARA, 2018 nor the budget.
3.11.4 Exchequer IssuesIn order to implement the budget, the Controller of Budget approved withdrawal of Kshs.12.92 billion from the CRF account. The withdrawals represented 89.2 per cent of the Approved Supplementary Budget and translated to an increase of 17.8 per cent from Kshs.10.97 billion in FY 2017/18, and comprised of Kshs.5.36 billion (41.5 per cent) towards development activities and Kshs.7.56 billion (58.5 per cent) for recurrent expenditure.
3.11.5 Overall Expenditure ReviewA total of Kshs.12.18 billion was spent on both development and recurrent activities. This expenditure represented 94.3 per cent of the total funds released from the CRF account, and was an increase of 15.5 per cent from Kshs.10.54 billion spent in FY 2017/18. The expenditure excluded pending bills as at June 30, 2019 which amounted to Kshs.265.22 million for development activities and Kshs.270.98 million for recurrent costs.
Expenditure on development programmes amounted to Kshs.4.98 billion while Kshs.7.19 billion was spent on recurrent activities. The development expenditure was 93 per cent of the funds released for development programmes, while recurrent expenditure was 95.2 per cent of funds released for recurrent activities.
Development expenditure recorded an absorption rate of 73.2 per cent, which was an increase from 69 per cent attained in FY 2017/18. Conversely, recurrent expenditure represented 93.6 per cent of the annual recurrent budget, an increase from 91.5 per cent recorded in FY 2017/18.
Figure 3.43 presents a comparison between the total expenditure in FY 2018/19 and FY 2017/18.

80
COUNTY GOVERNMENTS ANNUAL BUDGET IMPLEMENTATION REVIEW REPORT FOR FY 2018/19
Figure3.43: KakamegaCounty,ExpenditurebyEconomicClassification
118
Source: Kakamega County Treasury
3.11.5 Development Expenditure Analysis
The total development expenditure of Kshs.4.98 million represented 73.2 per cent of the annual development expenditure
estimates of Kshs.6.8 billion. Table 3.30 provides a summary of development projects with the highest expenditure in the
financial year.
Table 3.30: Kakamega County, List of Development Projects with the Highest Expenditure in FY 2018/19
S/No. Project Name Project Location Project Budget
Project Expenditure in FY 2018/19 (Kshs.)
Absorption Rate (%)
1 Bitumen Road Countywide 751,014,412 743,688,041 99 2 Farm Inputs Countywide 392,837,041 391,975,715 100 3 Level 5 Hospital Grant Kakamega Town 427,283,237 370,723,771 87
4 10km per ward roads-Ward based All the wards 365,848,904 338,895,808 93
5 Road Levy Fund Countywide 379,809,498 320,215,609 84
6 Kakamega Teaching and Referral Kakamega Town 300,000,000 299,515,171 100
7 County Youth Services-Ward Based All the wards 250,000,000 220,757,110 88
8 ECD Centres-Ward Based All the wards 160,000,000 158,959,288 99
9 Water Infrastructure Development All the wards 150,620,000 141,493,789 94
10 Enterprise Resource Planning (ERP) At the County Headquarters 132,036,000 131,891,997 100
Source: Kakamega County Treasury
4,874.92(46.2%)
1,789.12(17.0%)
3,879.96(36.8%)
5,115.98(42.1%)
2,078.66(17.1%)
4,983.67(41%)
-
1,000
2,000
3,000
4,000
5,000
6,000
Personnel Emoluments Operations and Maintenance Development Expenditure
Ksh
s.Mill
ion
Expenditure by Economic Classification
FY 2017/18
FY 2018/19
Key
Source: Kakamega County Treasury
3.11.6 Development Expenditure AnalysisThe total development expenditure of Kshs.4.98 million represented 73.2 per cent of the annual development expenditure estimates of Kshs.6.8 billion. Table 3.30 provides a summary of development projects with the highest expenditure in the financial year.
Table 3.30: Kakamega County, List of Development Projects with the Highest Expenditure in FY 2018/19
S/No. Project Name Project Location Project Budget Project Expenditure in FY 2018/19 (Kshs.)
Absorption Rate (%)
1 Bitumen Road Countywide 751,014,412 743,688,041 99
2 Farm Inputs Countywide 392,837,041 391,975,715 100
3 Level 5 Hospital Grant Kakamega Town 427,283,237 370,723,771 87
4 10km per ward roads-Ward based All the wards 365,848,904 338,895,808 93
5 Road Levy Fund Countywide 379,809,498 320,215,609 84
6 Kakamega Teaching and Referral Kakamega Town 300,000,000 299,515,171 100
7 County Youth Services-Ward Based All the wards 250,000,000 220,757,110 88
8 ECD Centres-Ward Based All the wards 160,000,000 158,959,288 99
9 Water Infrastructure Development All the wards 150,620,000 141,493,789 94
10 Enterprise Resource Planning (ERP) At the County Headquarters 132,036,000 131,891,997 100
Source: Kakamega County Treasury
3.11.7 Analysis of Recurrent ExpenditureThe total recurrent expenditure of Kshs.7.19 billion comprised of Kshs.5.12 billion (71.1 per cent) incurred on personnel emoluments and Kshs.2.08 billion (28.9 per cent) on operations and maintenance as shown in Table 3.30.

81
COUNTY GOVERNMENTS ANNUAL BUDGET IMPLEMENTATION REVIEW REPORT FOR FY 2018/19
Expenditure on personnel emoluments represented an increase of 4.9 per cent compared to FY 2017/18 when the County spent Kshs.4.87 billion and was 42.1 per cent of the total expenditure in FY 2018/19. Figure 3.44 shows a summary of operations and maintenance expenditure by major categories.
Figure 3.44: Kakamega County, Operations and Maintenance Expenditure by Major Categories in FY 2018/19
119
3.11.6 Analysis of Recurrent Expenditure The total recurrent expenditure of Kshs.7.19 billion comprised of Kshs.5.12 billion (71.1 per cent) incurred on personnel
emoluments and Kshs.2.08 billion (28.9 per cent) on operations and maintenance as shown in Table 3.30.
Expenditure on personnel emoluments represented an increase of 4.9 per cent compared to FY 2017/18 when the County
spent Kshs.4.87 billion and was 42.1 per cent of the total expenditure in FY 2018/19. Figure 3.44 shows a summary of
operations and maintenance expenditure by major categories.
Figure 3.44: Kakamega County, Operations and Maintenance Expenditure by Major Categories in FY 2018/19
Source: Kakamega County Treasury
The County spent Kshs.114.89 million on committee sitting allowances for the 90 MCAs and speaker against the annual
budget allocation of Kshs.134.78 million. This represented a decrease of 12.8 per cent compared to Kshs.131.79 million
spent in FY 2017/18. The average monthly sitting allowance translated to Kshs.106,384 per MCA against the SRC’s
recommended monthly ceiling of Kshs.124,800.
365.52
219.91208.14
157.35
128.90
99.89 93.5780.00 72.43
0
50
100
150
200
250
300
350
400
Ksh
s. M
illio
n
Major Categories of Operations & Maintenance
Source: Kakamega County Treasury
The County spent Kshs.114.89 million on committee sitting allowances for the 90 MCAs and speaker against the annual budget allocation of Kshs.134.78 million. This represented a decrease of 12.8 per cent compared to Kshs.131.79 million spent in FY 2017/18. The average monthly sitting allowance translated to Kshs.106,384 per MCA against the SRC’s recommended monthly ceiling of Kshs.124,800.
Expenditure on domestic and foreign travel amounted to Kshs.403.74 million, and comprised of Kshs.179.04 million spent by the County Assembly and Kshs.224.70 million by the County Executive. This expenditure represented 5.6 per cent of total recurrent expenditure and was an increase of 15.3 per cent compared to Kshs.350.16 million spent in FY 2017/18.
3.11.8 Budget Performance by County DepartmentTable 3.31 shows a summary of the approved budget allocation and performance by department in FY 2018/19.

82
COUNTY GOVERNMENTS ANNUAL BUDGET IMPLEMENTATION REVIEW REPORT FOR FY 2018/19
Table 3.31: Kakamega County, Budget Performance by Department in FY 2018/19
DepartmentAnnual Budget Allocation
(Kshs. Million)Exchequer Issues (Kshs.
Million)Expenditure (Kshs.
Million)
Expenditure to Exchequer Issues
(%)
Absorption Rate (%)
Rec Dev Rec Dev Rec Dev Rec Dev Rec Dev
Public Service Board 29.82 - 29.83 - 29.73 - 99.7 - 99.7 -
Public Service and Administration 5,030.71 156.22 5,057.07 49.27 4,865.67 60.05 96.2 121.9 96.7 38.4
County Assembly 1,061.36 - 941.65 - 1,059.93 - 112.6 - 99.9 -
Health Services 519.89 1,339 519.54 1,212.70 389.10 1,135.71 74.9 93.7 74.8 84.8
Office of the Governor 200.58 83 201.36 28.19 177.08 34.49 87.9 122.3 88.3 41.6
ICT, E-government & Communication 52.75 199.04 52.75 115.51 42.78 139.84 81.1 121.1 81.1 70.3
Labour, Social Servic-es, Youth and Sports 49.11 225.50 49.11 85.05 37.15 138.90 75.6 163.3 75.6 61.6
Lands, Housing, Ur-ban Areas and Physical Planning
205.47 527.47 176.96 505.20 130.17 112.15 73.6 22.2 63.4 21.3
Environment, Natural Resources, Water & Forestry
41.56 328.82 41.56 117.28 34.34 185.34 82.6 158.0 82.6 56.4
Agriculture, Livestock, Fisheries and Cooper-atives
61.38 841.55 61.38 559.72 51.59 609.57 84.0 108.9 84.0 72.4
Education, Science & Technology & ICT 114.15 635.91 114.66 565.89 113.61 575.37 99.1 101.7 99.5 90.5
County Treasury and Economic Planning 233.07 255.00 233.47 90.06 200.03 93.28 85.7 103.6 85.8 36.6
Industrialization, Trade and Tourism 40.47 260.00 38.06 100.52 37.43 104.42 98.3 103.9 92.5 40.2
Transport, Infrastruc-ture & Public Works 44.93 1,952.67 43.44 1,929.81 26.02 1,794.56 59.9 93.0 57.9 91.9
Total 7,685.25 6,804.18 7,560.84 5,359.20 7,194.63 4,983.68 95.2 93.0 93.6 73.2
Source: Kakamega County Treasury
Analysis of expenditure by department shows that the Department of Transport, Infrastructure & Public Works recorded the highest absorption rate of development budget at 91.9 per cent while the Department of Lands, Housing, Urban Areas and Physical Planning recorded the lowest at 21.3 per cent. The County Assembly had the highest percentage of recurrent expenditure to recurrent budget at 99.9 per cent while the Department of Transport, Infrastructure & Public Works had the lowest at 57.9 per cent.
3.11.9 Key Observations and RecommendationsThe County has made progress in addressing some of the challenges previously identified as affecting budget implementation. Some of the progress made included:
i. The absolute collection of own source revenue is on an upward trajectory. The collection in the FY 2013/14 was Kshs.325.2 million while that of FY 2018/19 was Kshs.896.7 million. Collection of own source revenue is expected to be enhanced further by the digitization of revenue collection in FY 2018/19.
ii. Improvement in the overall absorption of the budget. The total budget absorption for the reporting period was 84 per cent compared to 81.7 per cent in FY 2017/18, while expenditure on development budget was 73.2 per cent compared to 69 per cent achieved in FY 2017/18
Despite the above progress, the following challenges continued to hamper effective budget implementation;
1. A high wage bill that increased by 4.9 per cent from Kshs.4.87 billion in FY 2017/18 to Kshs.5.12

83
COUNTY GOVERNMENTS ANNUAL BUDGET IMPLEMENTATION REVIEW REPORT FOR FY 2018/19
billion in the reporting period. The wage bill accounted for 42.1 per cent of total expenditure in the reporting period
2. The COB has noted, from the analysis of bank statements and expenditure reports that the County maintains numerous accounts at the commercial banks and has continued to make payments from those bank accounts through Cheques. This contravenes Government policy which requires all payments by government to be made online through Internet Banking platform.
The County should implement the following measures in order to improve budget execution;
1. The County Public Service Board should develop an optimal staffing structure and devise strategies to contain expenditure on personnel costs within 35 per cent of County’s total revenue in line with Regulation 25(1) (b) of the PFM (County Governments) Regulations, 2015.
2. All Accounting Officers in the County should ensure all payments are made online through the prescribed Internet Banking platform at the Central Bank of Kenya Ltd.
3.12 Kericho County
3.12.1 Overview of the FY 2018/19 BudgetThe County’s FY 2018/19 Supplementary Budget was Kshs.8.42 billion, comprising of Kshs.3.65 billion (43.3 per cent) and Kshs.4.77 billion (56.7 per cent) allocation for development and recurrent expenditure respectively.
To finance the budget, the County expects to receive Kshs.5.71 billion (67.9 per cent) as equitable share of the revenue raised nationally, Kshs.953.04 million (11.3 per cent) as total conditional grants, generate Kshs.694.82 million (8.3 per cent) from own sources of revenue, and Kshs.1.06 billion (12.5 per cent) cash balance from FY 2017/18.
Figure 3.45: Kericho County, Expected Sources of Budget Financing in FY 2018/19
122
Source: Kericho County Treasury
A breakdown of the conditional grants is provided in Table 3.32.
3.12.2 Revenue Analysis During FY 2018/19, the County had a total of Khs.7.8 billion available for budget implementation. This amount consisted of
Kshs.5.71 billion received as equitable share of the revenue raised nationally, Kshs.559.34 million as conditional grants
outlined in CARA,2018, Kshs.473.98 million generated from own sources of revenue, a cash balance of Kshs.1.06 billion
and unspent conditional grants of Kshs.181.28 million from FY 2017/18
Figure 3.46 shows the annual trend in own-source revenue collection from FY 2013/14 to FY 2018/19.
Figure 3.46: Kericho County, Own Source Revenue Collection for FY 2013/14 to FY 2018/19
Cash Balance from FY 2017/18
12.5%
National Sharable Revenue67.9%
Total Conditional Allocation
(CARA,2018) + Balances B/F
11.3%
Own Source Revenue8.3%
Source: Kericho County Treasury

84
COUNTY GOVERNMENTS ANNUAL BUDGET IMPLEMENTATION REVIEW REPORT FOR FY 2018/19
A breakdown of the conditional grants is provided in Table 3.32.
3.12.2 Revenue AnalysisDuring FY 2018/19, the County had a total of Khs.7.8 billion available for budget implementation. This amount consisted of Kshs.5.71 billion received as equitable share of the revenue raised nationally, Kshs.559.34 million as conditional grants outlined in CARA,2018, Kshs.473.98 million generated from own sources of revenue, a cash balance of Kshs.1.06 billion and unspent conditional grants of Kshs.181.28 million from FY 2017/18
Figure 3.46 shows the annual trend in own-source revenue collection from FY 2013/14 to FY 2018/19.
Figure 3.46: Kericho County, Own Source Revenue Collection for FY 2013/14 to FY 2018/19
123
Source: Kericho County Treasury
The County generated a total of Kshs.473.98 million from own revenue sources in FY 2018/19. This amount represented an
increase of Kshs.59.93 million compared to that realised in FY 2017/18 and was 68.2 per cent of the annual target.
3.12.3 Conditional Grants During the reporting period, the County received Kshs.559.34 million as conditional grants as shown in Table 3.32.
Table 3.32: Kericho County, Conditional Grants/Loans Received in the FY 2018/19
S/No. Grants/Loans Annual CARA, 2018 Allocation (Kshs)
Annual Budget Allocation (Kshs)
Actual receipts in FY 2018/19 (in Kshs)
Actual Receipts as Percentage of Annual Allocation (%)
1. IDA (World Bank) -Kenya Urban Support Project 256,299,000 256,299,000 256,299,000 100 2. Road Maintenance Fuel Levy Fund +Bal.C/F in FY2017/18 150,465,707 287,501,906 150,465,707 100 3. IDA (World Bank)-Kenya Climate Smart Agriculture Project 116,443,510 116,443,510 42,837,552 36.6
4. World Bank-Transforming Health Systems for Universal Care Project +Bal.C/F in FY 2017/18 61,507,974 70,007,974 26,017,062 42.3
5. IDA (World Bank)Kenya Devolution Support Programme “Level 2 grant” 44,538,343 44,538,343 - -
6. SIDA -Kenya Urban Institutional Support Program 41,200,000 41,200,000 41,200,000 100 7. Rehabilitation of Village Polytechnics +Bal.C/F in FY2017/18 41,005,000 76,752,121 - - 8. Agricultural Sector development support Fund(ASDSP II) 24,732,548 24,732,548 6,957,746 36.4 9. Compensation for User Fee Foregone 18,048,789 18,048,789 18,048,789 100
10. DANIDA - Universal Healthcare to Devolved System Programme 17,516,250 17,516,250 17,516,250 100
Total 771,757,121 953,040,441 559,342,106 73
Source: Kericho County Treasury
371.41413.58
434.45
490.58
414.05
473.98
0
100
200
300
400
500
600
FY 2013/14 FY 2014/15 FY 2015/16 FY 2016/17 FY 2017/18 FY 2018/19
Ksh
s. M
illio
ns
Trend in Own Source Revenue
Source: Kericho County Treasury
The County generated a total of Kshs.473.98 million from own revenue sources in FY 2018/19. This amount represented an increase of Kshs.59.93 million compared to that realised in FY 2017/18 and was 68.2 per cent of the annual target.
3.12.3 Conditional GrantsDuring the reporting period, the County received Kshs.559.34 million as conditional grants as shown in Table 3.32.

85
COUNTY GOVERNMENTS ANNUAL BUDGET IMPLEMENTATION REVIEW REPORT FOR FY 2018/19
Table 3.32: Kericho County, Conditional Grants/Loans Received in the FY 2018/19
S/No. Grants/LoansAnnual CARA, 2018 Allocation
(Kshs)
Annual Budget Allocation (Kshs)
Actual receipts in FY 2018/19
(in Kshs)
Actual Receipts as Percentage of Annual Alloca-
tion (%)
1. IDA (World Bank) -Kenya Urban Support Project 256,299,000 256,299,000 256,299,000 100
2. Road Maintenance Fuel Levy Fund +Bal.C/F in FY2017/18 150,465,707 287,501,906 150,465,707 100
3. IDA (World Bank)-Kenya Climate Smart Agriculture Pro-ject 116,443,510 116,443,510 42,837,552 36.6
4. World Bank-Transforming Health Systems for Universal Care Project +Bal.C/F in FY 2017/18 61,507,974 70,007,974 26,017,062 42.3
5. IDA (World Bank)Kenya Devolution Support Programme “Level 2 grant” 44,538,343 44,538,343 - -
6. SIDA -Kenya Urban Institutional Support Program 41,200,000 41,200,000 41,200,000 100
7. Rehabilitation of Village Polytechnics +Bal.C/F in FY2017/18 41,005,000 76,752,121 - -
8. Agricultural Sector development support Fund(ASDSP II) 24,732,548 24,732,548 6,957,746 36.4
9. Compensation for User Fee Foregone 18,048,789 18,048,789 18,048,789 100
10. DANIDA - Universal Healthcare to Devolved System Pro-gramme 17,516,250 17,516,250 17,516,250 100
Total 771,757,121 953,040,441 559,342,106 73
Source: Kericho County Treasury
During the reporting period, the County received full allocation from the Kenya Urban Support Program (KUSP), Road Maintenance Fuel Levy, Kenya Urban Institutional Grant (KUIG), User Fees Foregone, and DANIDA grant for Universal Health Care in Devolved System Programme.
3.12.4 Exchequer IssuesIn order to implement the budget, the Controller of Budget approved withdrawal of Kshs.6.5 billion from the CRF account. The withdrawals represented 77.2 per cent of the Approved Supplementary Budget and translated to an increase of 22.6 per cent from Kshs.5.31 billion authorised in FY 2017/18 and comprised of Kshs.1.79 billion (27.5 per cent) towards development activities and Kshs.4.71 billion (72.5 per cent) for recurrent expenditure.
3.12.5 Overall Expenditure ReviewA total of Kshs.6.13 billion was spent on both development and recurrent activities. This expenditure represented 94.3 per cent of the total funds released from the CRF account, and was an increase of 18.5 per cent from Kshs.5.18 billion spent in FY 2017/18.
The expenditure excluded pending bills as at June 30, 2019 which amounted to Kshs.1.61 billion for development activities and Kshs.17.5 million for recurrent costs.
Expenditure on development programmes amounted to Kshs.1.42 billion while Kshs.4.71 billion was spent on recurrent activities. The development expenditure was 79.3 per cent of the funds released for development programmes, while recurrent expenditure was 100 per cent of funds released for recurrent activities.
Development expenditure recorded an absorption rate of 38.9 per cent, which was a decrease from 48.8 per cent attained in FY 2017/18. Conversely, recurrent expenditure represented 98.8 per cent of the annual recurrent budget, an increase from 92.9 per cent recorded in FY 2017/18. Figure 3.47 presents a comparison between the total expenditure in FY 2018/19 and FY 2017/18.
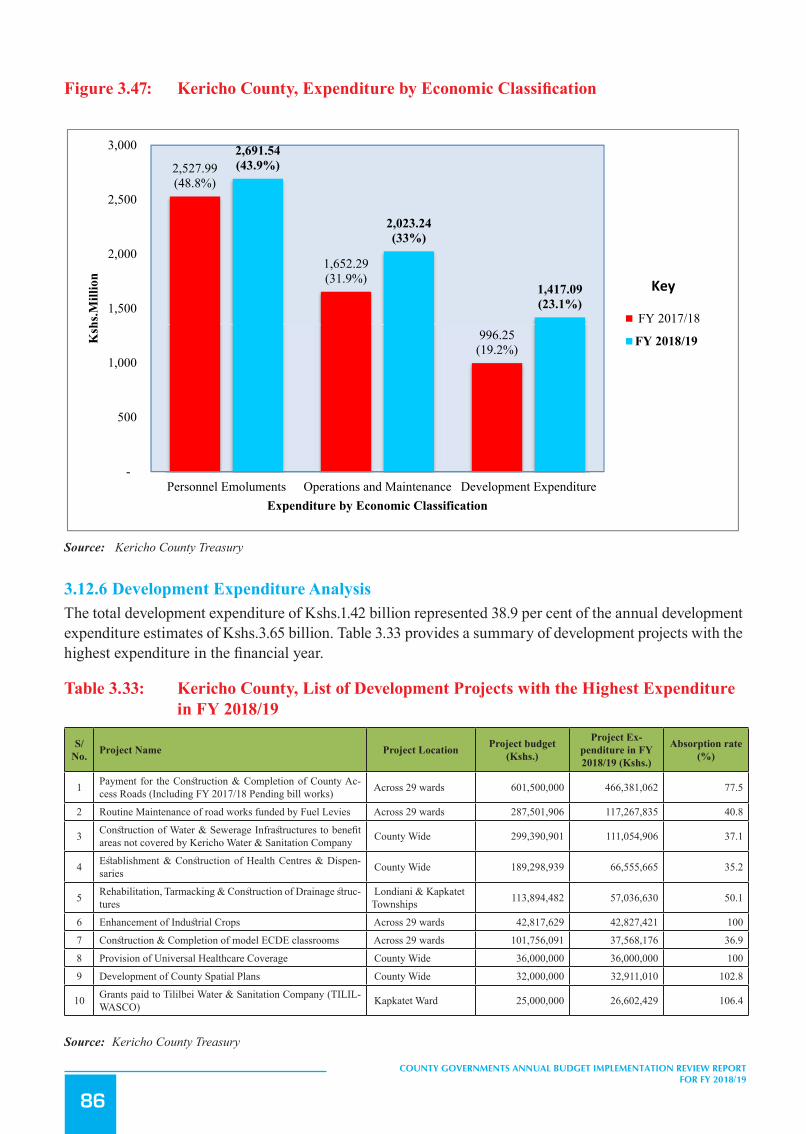
86
COUNTY GOVERNMENTS ANNUAL BUDGET IMPLEMENTATION REVIEW REPORT FOR FY 2018/19
Figure3.47: KerichoCounty,ExpenditurebyEconomicClassification
125
Source: Kericho County Treasury
3.12.6 Development Expenditure Analysis The total development expenditure of Kshs.1.42 billion represented 38.9 per cent of the annual development expenditure
estimates of Kshs.3.65 billion. Table 3.33 provides a summary of development projects with the highest expenditure in the
financial year.
Table 3.33:Kericho County, List of Development Projects with the Highest Expenditure in FY 2018/19
S/No.
Project Name Project Location Project budget (Kshs.)
Project Expenditure in FY 2018/19 (Kshs.)
Absorption rate (%)
1 Payment for the Construction & Completion of County Access Roads (Including FY 2017/18 Pending bill works)
Across 29 wards 601,500,000 466,381,062 77.5
2 Routine Maintenance of road works funded by Fuel Levies Across 29 wards 287,501,906 117,267,835 40.8
3 Construction of Water & Sewerage Infrastructures to benefit areas not covered by Kericho Water & Sanitation Company
County Wide 299,390,901 111,054,906 37.1
4 Establishment & Construction of Health Centres & Dispensaries County Wide 189,298,939 66,555,665 35.2
5 Rehabilitation, Tarmacking & Construction of Drainage structures
Londiani & Kapkatet Townships 113,894,482 57,036,630 50.1
6 Enhancement of Industrial Crops Across 29 wards 42,817,629 42,827,421 100 7 Construction & Completion of model ECDE classrooms Across 29 wards 101,756,091 37,568,176 36.9 8 Provision of Universal Healthcare Coverage County Wide 36,000,000 36,000,000 100 9 Development of County Spatial Plans County Wide 32,000,000 32,911,010 102.8
10 Grants paid to Tililbei Water & Sanitation Company (TILILWASCO) Kapkatet Ward 25,000,000 26,602,429 106.4
2,527.99(48.8%)
1,652.29(31.9%)
996.25(19.2%)
2,691.54(43.9%)
2,023.24(33%)
1,417.09(23.1%)
-
500
1,000
1,500
2,000
2,500
3,000
Personnel Emoluments Operations and Maintenance Development Expenditure
Ksh
s.Mill
ion
Expenditure by Economic Classification
FY 2017/18
FY 2018/19
Key
Source: Kericho County Treasury
3.12.6 Development Expenditure AnalysisThe total development expenditure of Kshs.1.42 billion represented 38.9 per cent of the annual development expenditure estimates of Kshs.3.65 billion. Table 3.33 provides a summary of development projects with the highest expenditure in the financial year.
Table 3.33: Kericho County, List of Development Projects with the Highest Expenditure in FY 2018/19
S/No. Project Name Project Location Project budget
(Kshs.)
Project Ex-penditure in FY 2018/19 (Kshs.)
Absorption rate (%)
1 Payment for the Construction & Completion of County Ac-cess Roads (Including FY 2017/18 Pending bill works) Across 29 wards 601,500,000 466,381,062 77.5
2 Routine Maintenance of road works funded by Fuel Levies Across 29 wards 287,501,906 117,267,835 40.8
3 Construction of Water & Sewerage Infrastructures to benefit areas not covered by Kericho Water & Sanitation Company County Wide 299,390,901 111,054,906 37.1
4 Establishment & Construction of Health Centres & Dispen-saries County Wide 189,298,939 66,555,665 35.2
5 Rehabilitation, Tarmacking & Construction of Drainage struc-tures
Londiani & Kapkatet Townships 113,894,482 57,036,630 50.1
6 Enhancement of Industrial Crops Across 29 wards 42,817,629 42,827,421 100
7 Construction & Completion of model ECDE classrooms Across 29 wards 101,756,091 37,568,176 36.9
8 Provision of Universal Healthcare Coverage County Wide 36,000,000 36,000,000 100
9 Development of County Spatial Plans County Wide 32,000,000 32,911,010 102.8
10 Grants paid to Tililbei Water & Sanitation Company (TILIL-WASCO) Kapkatet Ward 25,000,000 26,602,429 106.4
Source: Kericho County Treasury

87
COUNTY GOVERNMENTS ANNUAL BUDGET IMPLEMENTATION REVIEW REPORT FOR FY 2018/19
3.12.7 Analysis of Recurrent ExpenditureThe total recurrent expenditure of Kshs.4.71 billion comprised of Kshs.2.69 billion (57.1 per cent) incurred on personnel emoluments and Kshs.2.02 billion (42.9 per cent) on operations and maintenance as shown in Figure 3.47.
Expenditure on personnel emoluments represented an increase of 6.5 per cent compared to FY 2017/18 when the County spent Kshs.2.53 billion and was 43.9 per cent of the total expenditure in FY 2018/19. Figure 3.48 shows a summary of operations and maintenance expenditure by major categories.
Figure 3.48: Kericho County, Operations and Maintenance Expenditure by Major Categories in FY 2018/19
126
Source: Kericho County Treasury
3.12.7 Analysis of Recurrent Expenditure The total recurrent expenditure of Kshs.4.71 billion comprised of Kshs.2.69 billion (57.1 per cent) incurred on personnel
emoluments and Kshs.2.02 billion (42.9 per cent) on operations and maintenance as shown in Figure 3.47Table 3.48.
Expenditure on personnel emoluments represented an increase of 6.5 per cent compared to FY 2017/18 when the County
spent Kshs.2.53 billion and was 43.9 per cent of the total expenditure in FY 2018/19. Figure 3.48 shows a summary of
operations and maintenance expenditure by major categories.
Figure 3.48: Kericho County, Operations and Maintenance Expenditure by Major Categories in FY 2018/19
Source: Kericho County Treasury
The County spent Kshs.44.69 million on committee sitting allowances for the 47 MCAs and Speaker against the annual
budget allocation of Kshs.44.69 million. This represented an increase of 31.4 per cent compared to Kshs.34 million spent in
FY 2017/18. The average monthly sitting allowance translated to Kshs.77,579 per MCA against the SRC’s recommended
monthly ceiling of Kshs.124,800.
476.21
243.79
132.12 129.55 121.6287.70 82.00 79.68 75.41 69.29
0
100
200
300
400
500
600
Ksh
s. M
illio
n
Major Categories of Operations & Maintenance
Source: Kericho County Treasury
The County spent Kshs.44.69 million on committee sitting allowances for the 47 MCAs and Speaker against the annual budget allocation of Kshs.44.69 million. This represented an increase of 31.4 per cent compared to Kshs.34 million spent in FY 2017/18. The average monthly sitting allowance translated to Kshs.77,579 per MCA against the SRC’s recommended monthly ceiling of Kshs.124,800.
Expenditure on domestic and foreign travel amounted to Kshs.313.08 million, and comprised of Kshs.152.80 million spent by the County Assembly and Kshs.160.28 million by the County Executive. This expenditure represented 6.6 per cent of total recurrent expenditure and was an increase of 8.7 per cent compared to Kshs.287.95 million spent in FY 2017/18.
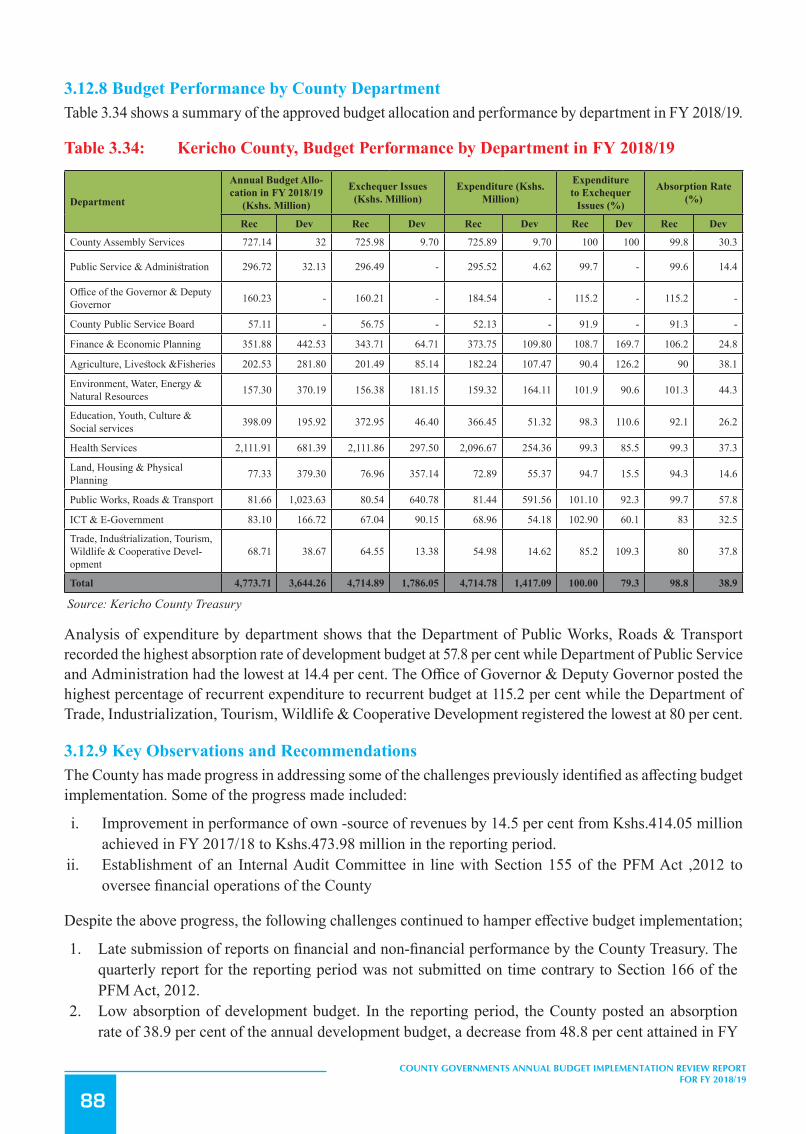
88
COUNTY GOVERNMENTS ANNUAL BUDGET IMPLEMENTATION REVIEW REPORT FOR FY 2018/19
3.12.8 Budget Performance by County DepartmentTable 3.34 shows a summary of the approved budget allocation and performance by department in FY 2018/19.
Table 3.34: Kericho County, Budget Performance by Department in FY 2018/19
Department
Annual Budget Allo-cation in FY 2018/19
(Kshs. Million)
Exchequer Issues (Kshs. Million)
Expenditure (Kshs. Million)
Expenditure to Exchequer
Issues (%)
Absorption Rate (%)
Rec Dev Rec Dev Rec Dev Rec Dev Rec Dev
County Assembly Services 727.14 32 725.98 9.70 725.89 9.70 100 100 99.8 30.3
Public Service & Administration 296.72 32.13 296.49 - 295.52 4.62 99.7 - 99.6 14.4
Office of the Governor & Deputy Governor 160.23 - 160.21 - 184.54 - 115.2 - 115.2 -
County Public Service Board 57.11 - 56.75 - 52.13 - 91.9 - 91.3 -
Finance & Economic Planning 351.88 442.53 343.71 64.71 373.75 109.80 108.7 169.7 106.2 24.8
Agriculture, Livestock &Fisheries 202.53 281.80 201.49 85.14 182.24 107.47 90.4 126.2 90 38.1
Environment, Water, Energy & Natural Resources 157.30 370.19 156.38 181.15 159.32 164.11 101.9 90.6 101.3 44.3
Education, Youth, Culture & Social services 398.09 195.92 372.95 46.40 366.45 51.32 98.3 110.6 92.1 26.2
Health Services 2,111.91 681.39 2,111.86 297.50 2,096.67 254.36 99.3 85.5 99.3 37.3
Land, Housing & Physical Planning 77.33 379.30 76.96 357.14 72.89 55.37 94.7 15.5 94.3 14.6
Public Works, Roads & Transport 81.66 1,023.63 80.54 640.78 81.44 591.56 101.10 92.3 99.7 57.8
ICT & E-Government 83.10 166.72 67.04 90.15 68.96 54.18 102.90 60.1 83 32.5
Trade, Industrialization, Tourism, Wildlife & Cooperative Devel-opment
68.71 38.67 64.55 13.38 54.98 14.62 85.2 109.3 80 37.8
Total 4,773.71 3,644.26 4,714.89 1,786.05 4,714.78 1,417.09 100.00 79.3 98.8 38.9
Source: Kericho County Treasury
Analysis of expenditure by department shows that the Department of Public Works, Roads & Transport recorded the highest absorption rate of development budget at 57.8 per cent while Department of Public Service and Administration had the lowest at 14.4 per cent. The Office of Governor & Deputy Governor posted the highest percentage of recurrent expenditure to recurrent budget at 115.2 per cent while the Department of Trade, Industrialization, Tourism, Wildlife & Cooperative Development registered the lowest at 80 per cent.
3.12.9 Key Observations and RecommendationsThe County has made progress in addressing some of the challenges previously identified as affecting budget implementation. Some of the progress made included:
i. Improvement in performance of own -source of revenues by 14.5 per cent from Kshs.414.05 million achieved in FY 2017/18 to Kshs.473.98 million in the reporting period.
ii. Establishment of an Internal Audit Committee in line with Section 155 of the PFM Act ,2012 to oversee financial operations of the County
Despite the above progress, the following challenges continued to hamper effective budget implementation;
1. Late submission of reports on financial and non-financial performance by the County Treasury. The quarterly report for the reporting period was not submitted on time contrary to Section 166 of the PFM Act, 2012.
2. Low absorption of development budget. In the reporting period, the County posted an absorption rate of 38.9 per cent of the annual development budget, a decrease from 48.8 per cent attained in FY

89
COUNTY GOVERNMENTS ANNUAL BUDGET IMPLEMENTATION REVIEW REPORT FOR FY 2018/19
2017/18.3. High expenditure on employee emoluments. The County spent Kshs.2.69 billion on personnel
emoluments which was an increase of 6.5 per cent from Kshs.2.53 billion incurred in FY 2017/18 and accounted for 43.9 per cent of the total expenditure of Kshs.6.13 billion in the reporting period.
4. Delay in disbursement of the equitable share of revenue raised nationally by the National Treasury.5. High pending bills at the end of the financial year which amounted to Kshs.1.61 billion for development
activities and Kshs.17.5 million for recurrent activities.6. Inadequate budgetary control that resulted in expenditure above approved budget by the Department of
Finance & Economic Planning, the Department of Environment, Water, Energy & Natural Resources, and the Office of the Governor and Deputy Governor. This is contrary to Section 135 and 154 of PFM Act, 2012.
The County should implement the following measures in order to improve budget execution;
1. The County Treasury should ensure timely preparation and submission of reports on financial and non-financial performance in line with Section 166 of the PFM Act ,2012
2. The County should identify and address the causes of low absorption of development budget in order to ensure effective budget implementation
3. The County Public Service Board should expedite on establishment of an optimal staffing structure and devise strategies to contain escalating wage bill within 35 per cent of the County’s total revenue in line with Regulation 25(1) (b) of the PFM (County Government) Regulations, 2015.
4. The County Treasury should liaise with the National Treasury to ensure that funds are released in a timely manner.
5. The County should identify and address the causes of huge pending bills as at the end of the financial year. These pending bills should be verified and paid as a first charge in FY 2019/20.
6. The County Treasury should ensure expenditure is within the approved budget.
3.13 Kiambu County
3.13.1 Overview of the FY 2018/19 BudgetThe County’s FY 2018/19 Supplementary Budget was Kshs.16.91 billion, comprising of Kshs.5.97 billion (35.3 per cent) and Kshs.10.95 billion (64.7 per cent) allocation for development and recurrent expenditure respectively.
To finance the budget, the County expected to receive Kshs.9.36 billion (55.3 per cent) as equitable share of the revenue raised nationally, Kshs.4.05 billion (23.9 per cent) as total conditional grants, generate Kshs.2.74 billion (16.2 per cent) from own sources of revenue, and a cash balance of Kshs.774.03 million (4.6 per cent) from FY 2017/18.
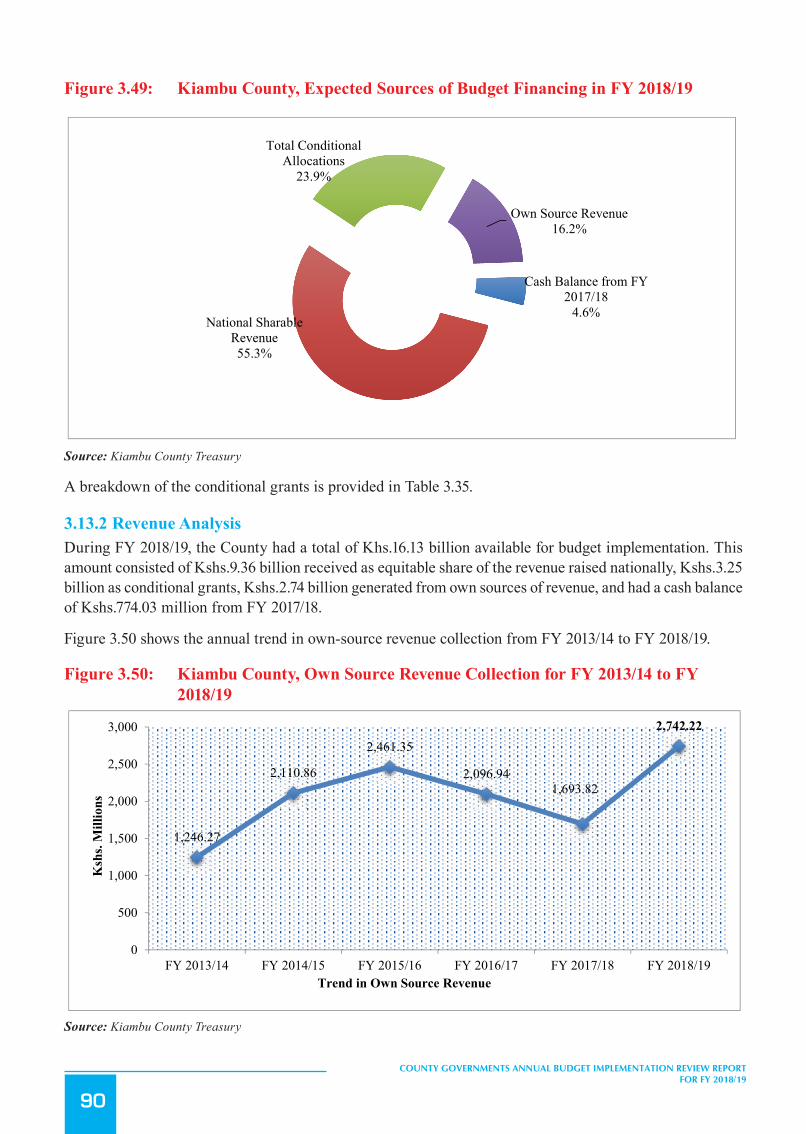
90
COUNTY GOVERNMENTS ANNUAL BUDGET IMPLEMENTATION REVIEW REPORT FOR FY 2018/19
Figure 3.49: Kiambu County, Expected Sources of Budget Financing in FY 2018/19
129
3.13 Kiambu County
3.13.1 Overview of the FY 2018/19 Budget The County’s FY 2018/19 Supplementary Budget was Kshs.16.91 billion, comprising of Kshs.5.97 billion (35.3 per
cent) and Kshs.10.95 billion (64.7 per cent) allocation for development and recurrent expenditure respectively.
To finance the budget, the County expected to receive Kshs.9.36 billion (55.3 per cent) as equitable share of the
revenue raised nationally, Kshs.4.05 billion (23.9 per cent) as total conditional grants, generate Kshs.2.74 billion (16.2
per cent) from own sources of revenue, and a cash balance of Kshs.774.03 million (4.6 per cent) from FY 2017/18.
Figure 3.49: Kiambu County, Expected Sources of Budget Financing in FY 2018/19
Source: Kiambu County Treasury
A breakdown of the conditional grants is provided in Table 3.35.
3.13.2 Revenue Analysis During FY 2018/19, the County had a total of Khs.16.13 billion available for budget implementation. This amount
consisted of Kshs.9.36 billion received as equitable share of the revenue raised nationally, Kshs.3.25 billion as
conditional grants, Kshs.2.74 billion generated from own sources of revenue, and had a cash balance of Kshs.774.03
million from FY 2017/18.
Figure 3.50 shows the annual trend in own-source revenue collection from FY 2013/14 to FY 2018/19.
Figure 3.50: Kiambu County, Own Source Revenue Collection for FY 2013/14 to FY 2018/19
Cash Balance from FY 2017/18
4.6%National Sharable
Revenue55.3%
Total Conditional Allocations
23.9%
Own Source Revenue16.2%
Source: Kiambu County Treasury
A breakdown of the conditional grants is provided in Table 3.35.
3.13.2 Revenue AnalysisDuring FY 2018/19, the County had a total of Khs.16.13 billion available for budget implementation. This amount consisted of Kshs.9.36 billion received as equitable share of the revenue raised nationally, Kshs.3.25 billion as conditional grants, Kshs.2.74 billion generated from own sources of revenue, and had a cash balance of Kshs.774.03 million from FY 2017/18.
Figure 3.50 shows the annual trend in own-source revenue collection from FY 2013/14 to FY 2018/19.
Figure 3.50: Kiambu County, Own Source Revenue Collection for FY 2013/14 to FY 2018/19
130
Source: Kiambu County Treasury
The County generated a total of Kshs.2.74 billion from own revenue sources in FY 2018/19. This amount represented an
increase of Kshs.1.05 billion compared to that realised in FY 2017/18 and represented 100.2 per cent of the annual
target.
3.13.3 Conditional Grants During the reporting period, the County received Kshs.3.25 billion as conditional grants as shown in Table 3.35.
Table 3.35: Kiambu County, Conditional Grants/Loans Received in the FY 2018/19
S/No Grants
Annual CARA, 2018 Allocation (in Kshs)
Annual Budget Allocation (in Kshs)
Actual receipts in the FY 2018/19 (in Kshs.)
Actual Receipts as Percentage of Annual Allocation (%)
A Grants Contained in the CARA, 2018
1 IDA (World Bank) credit: Kenya Urban Support Project(KUSP) 1,885,993,000 1,885,993,000 1,885,993,000 100
2 Conditional Grants to Level - 5 Hospital 538,716,763 538,716,765 538,716,762 100
3 Kenya Devolution Support Project (KDSP) "Level 2 grant" 289,565,839 527,565,839 289,565,839 100
4 Conditional Grant-Road Maintenance Fuel Levy 246,366,927 394,366,926 302,930,786 123
5 Conditional Grant-Leasing of Medical Equipment 200,000,000 - - -
6 IDA (World Bank) credit (National Agricultural and Rural Inclusive Growth Project (NARIGP) 140,435,163 146,935,163 50,078,476 36
7 Conditional Grant-Rehabilitation of Village Polytechnics 68,110,000 108,796,220 51,423,050 76
8 IDA (World Bank) credit: Kenya Devolution Support Project (KDSP) " Level 1 grant" 60,455,156 60,455,156 - -
9 Transforming Health Systems for Universal Care Project (WB) 50,000,000 50,000,000 20,524,353 41
10 IDA World Bank Credit; Kenya Urban Support Project (KUSP) Urban Institutional Grants (UIG) 41,200,000 41,200,000 41,200,000 100
11 Conditional Grant-Compensation for User Fee Foregone 34,671,542 34,671,542 34,671,542 100
1,246.27
2,110.86
2,461.35
2,096.941,693.82
2,742.22
0
500
1,000
1,500
2,000
2,500
3,000
FY 2013/14 FY 2014/15 FY 2015/16 FY 2016/17 FY 2017/18 FY 2018/19
Ksh
s. M
illio
ns
Trend in Own Source Revenue
Source: Kiambu County Treasury
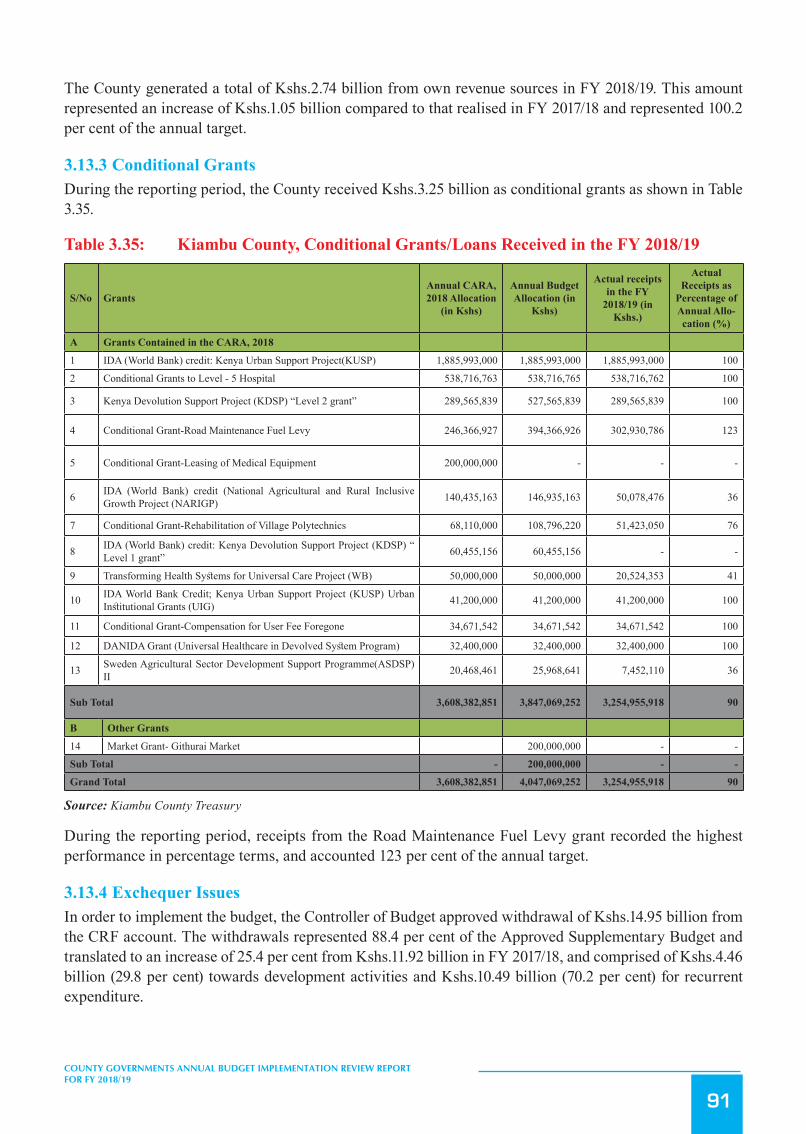
91
COUNTY GOVERNMENTS ANNUAL BUDGET IMPLEMENTATION REVIEW REPORT FOR FY 2018/19
The County generated a total of Kshs.2.74 billion from own revenue sources in FY 2018/19. This amount represented an increase of Kshs.1.05 billion compared to that realised in FY 2017/18 and represented 100.2 per cent of the annual target.
3.13.3 Conditional GrantsDuring the reporting period, the County received Kshs.3.25 billion as conditional grants as shown in Table 3.35.
Table 3.35: Kiambu County, Conditional Grants/Loans Received in the FY 2018/19
S/No GrantsAnnual CARA, 2018 Allocation
(in Kshs)
Annual Budget Allocation (in
Kshs)
Actual receipts in the FY
2018/19 (in Kshs.)
Actual Receipts as
Percentage of Annual Allo-cation (%)
A Grants Contained in the CARA, 2018
1 IDA (World Bank) credit: Kenya Urban Support Project(KUSP) 1,885,993,000 1,885,993,000 1,885,993,000 100
2 Conditional Grants to Level - 5 Hospital 538,716,763 538,716,765 538,716,762 100
3 Kenya Devolution Support Project (KDSP) “Level 2 grant” 289,565,839 527,565,839 289,565,839 100
4 Conditional Grant-Road Maintenance Fuel Levy 246,366,927 394,366,926 302,930,786 123
5 Conditional Grant-Leasing of Medical Equipment 200,000,000 - - -
6 IDA (World Bank) credit (National Agricultural and Rural Inclusive Growth Project (NARIGP) 140,435,163 146,935,163 50,078,476 36
7 Conditional Grant-Rehabilitation of Village Polytechnics 68,110,000 108,796,220 51,423,050 76
8 IDA (World Bank) credit: Kenya Devolution Support Project (KDSP) “ Level 1 grant” 60,455,156 60,455,156 - -
9 Transforming Health Systems for Universal Care Project (WB) 50,000,000 50,000,000 20,524,353 41
10 IDA World Bank Credit; Kenya Urban Support Project (KUSP) Urban Institutional Grants (UIG) 41,200,000 41,200,000 41,200,000 100
11 Conditional Grant-Compensation for User Fee Foregone 34,671,542 34,671,542 34,671,542 100
12 DANIDA Grant (Universal Healthcare in Devolved System Program) 32,400,000 32,400,000 32,400,000 100
13 Sweden Agricultural Sector Development Support Programme(ASDSP) II 20,468,461 25,968,641 7,452,110 36
Sub Total 3,608,382,851 3,847,069,252 3,254,955,918 90
B Other Grants
14 Market Grant- Githurai Market 200,000,000 - -
Sub Total - 200,000,000 - -
Grand Total 3,608,382,851 4,047,069,252 3,254,955,918 90
Source: Kiambu County Treasury
During the reporting period, receipts from the Road Maintenance Fuel Levy grant recorded the highest performance in percentage terms, and accounted 123 per cent of the annual target.
3.13.4 Exchequer IssuesIn order to implement the budget, the Controller of Budget approved withdrawal of Kshs.14.95 billion from the CRF account. The withdrawals represented 88.4 per cent of the Approved Supplementary Budget and translated to an increase of 25.4 per cent from Kshs.11.92 billion in FY 2017/18, and comprised of Kshs.4.46 billion (29.8 per cent) towards development activities and Kshs.10.49 billion (70.2 per cent) for recurrent expenditure.

92
COUNTY GOVERNMENTS ANNUAL BUDGET IMPLEMENTATION REVIEW REPORT FOR FY 2018/19
3.13.5 Overall Expenditure ReviewA total of Kshs.14.26 billion was spent on both development and recurrent activities. This expenditure represented 95.4 per cent of the total funds released from the CRF account, and was an increase of 32.5 per cent from Kshs.10.76 billion spent in FY 2017/18.
The expenditure excluded pending bills as at June 30, 2019 which amounted to Kshs.1.30 billion for development activities and Kshs.1.23 billion for recurrent costs.
Expenditure on development programmes amounted to Kshs.4.50 billion while Kshs.9.77 billion was spent on recurrent activities. The development expenditure was 100.8 per cent of the funds released for development programmes, while recurrent expenditure was 93.1 per cent of funds released for recurrent activities.
Development expenditure recorded an absorption rate of 75.4 per cent, which was an increase from 66.1 per cent attained in FY 2017/18. Conversely, recurrent expenditure represented 89.2 per cent of the annual recurrent budget, a decrease from 91 per cent recorded in FY 2017/18.
Figure 3.51 presents a comparison between the total expenditure in FY 2018/19 and FY 2017/18.
Figure3.51: KiambuCounty,ExpenditurebyEconomicClassification
132
Source: Kiambu County Treasury
3.13.6 Development Expenditure Analysis The total development expenditure of Kshs.4.50 billion represented 75.4 per cent of the annual development
expenditure estimates of Kshs.5.97 billion. Table 3.36 provides a summary of development projects with the highest
expenditure in the financial year.
Table 3.36: Kiambu County, List of Development Projects with the Highest Expenditure in FY 2018/19
S/No. Project Name Project Location Project Budget
(Kshs.)
FY2018/19 Project Expenditure (Kshs.)
Absorption Rate (%)
1 Githunguri-Ndumberi Road Githunguri 340,801,794 318,760,290 93.5
2 Construction of RH unit in Thika level 5 hospital (Conditional Grant) Hospital, Kiambu 766,002,030 189,897,659 24.8
3 Improvement of Kiambu Level 5 Hospital (Conditional Grant) Hospital, Kiambu 538,716,763 189,897,659 35.3
4 Construction of level 4 Hospital at Githunguri Health Centre Githunguri 676,000,000 180,759,533 26.7
5 Construction of Gatitu Junction and other Roads Thika 221,005,870 162,034,722 73.3
6 Transfer ( Kiambu County Polytechnics) Kiambu County Polytechnics 108,796,220 108,622,420 99.8
7 A2 Junction Kimbo Matangini Kimbo 170,552,896 93,929,411 55.1 8 Thogoto-Ndaire Road Thogoto 181,452,510 81,327,181 44.8 9 Construction of Githunguri CBD roads Githunguri 103,997,581 78,019,224 75.0
10 Purchase of vehicles and equipment (2 graders purchased) Headquarters 65,857,070 39,057,070 59.3
Source: Kiambu County Treasury
3.13.7 Analysis of Recurrent Expenditure The total recurrent expenditure of Kshs.9.77 billion comprised of Kshs.6.78 billion (69.5 per cent) incurred on personnel
emoluments and Kshs.2.98 billion (30.5 per cent) on operations and maintenance as shown in Figure 3.51 .
Expenditure on personnel emoluments represented an increase of 12.4 per cent compared to FY 2017/18 when the
County spent Kshs.6.04 billion and was 47.6 per cent of the total expenditure in FY 2018/19. Figure 3.52 shows a
summary of operations and maintenance expenditure by major categories.
6,035.27(56.1%)
2,894.72(26.9%)
1,833.63(17%)
6,782.28(47.6%)
2,982.73(20.9%)
4,495.23(31.5%)
-
1,000
2,000
3,000
4,000
5,000
6,000
7,000
8,000
Personnel Emoluments Operations and Maintenance Development Expenditure
Ksh
s.Mill
ion
Expenditure by Economic Classification
FY 2017/18
FY 2018/19
Key
Source: Kiambu County Treasury
3.13.6 Development Expenditure AnalysisThe total development expenditure of Kshs.4.50 billion represented 75.4 per cent of the annual development expenditure estimates of Kshs.5.97 billion. Table 3.36 provides a summary of development projects with the highest expenditure in the financial year.

93
COUNTY GOVERNMENTS ANNUAL BUDGET IMPLEMENTATION REVIEW REPORT FOR FY 2018/19
Table 3.36: Kiambu County, List of Development Projects with the Highest Expenditure in FY 2018/19
S/No. Project Name Project Location Project Budget (Kshs.)
FY2018/19 Project Expenditure
(Kshs.)
Absorption Rate (%)
1 Githunguri-Ndumberi Road Githunguri 340,801,794 318,760,290 93.5
2 Construction of RH unit in Thika level 5 hospital (Conditional Grant) Hospital, Kiambu 766,002,030 189,897,659 24.8
3 Improvement of Kiambu Level 5 Hospital (Condi-tional Grant) Hospital, Kiambu 538,716,763 189,897,659 35.3
4 Construction of level 4 Hospital at Githunguri Health Centre Githunguri 676,000,000 180,759,533 26.7
5 Construction of Gatitu Junction and other Roads Thika 221,005,870 162,034,722 73.3
6 Transfer ( Kiambu County Polytechnics) Kiambu County Poly-technics 108,796,220 108,622,420 99.8
7 A2 Junction Kimbo Matangini Kimbo 170,552,896 93,929,411 55.1
8 Thogoto-Ndaire Road Thogoto 181,452,510 81,327,181 44.8
9 Construction of Githunguri CBD roads Githunguri 103,997,581 78,019,224 75.0
10 Purchase of vehicles and equipment (2 graders pur-chased) Headquarters 65,857,070 39,057,070 59.3
Source: Kiambu County Treasury
3.13.7 Analysis of Recurrent ExpenditureThe total recurrent expenditure of Kshs.9.77 billion comprised of Kshs.6.78 billion (69.5 per cent) incurred on personnel emoluments and Kshs.2.98 billion (30.5 per cent) on operations and maintenance as shown in Figure 3.51 .
Expenditure on personnel emoluments represented an increase of 12.4 per cent compared to FY 2017/18 when the County spent Kshs.6.04 billion and was 47.6 per cent of the total expenditure in FY 2018/19. Figure 3.52 shows a summary of operations and maintenance expenditure by major categories.
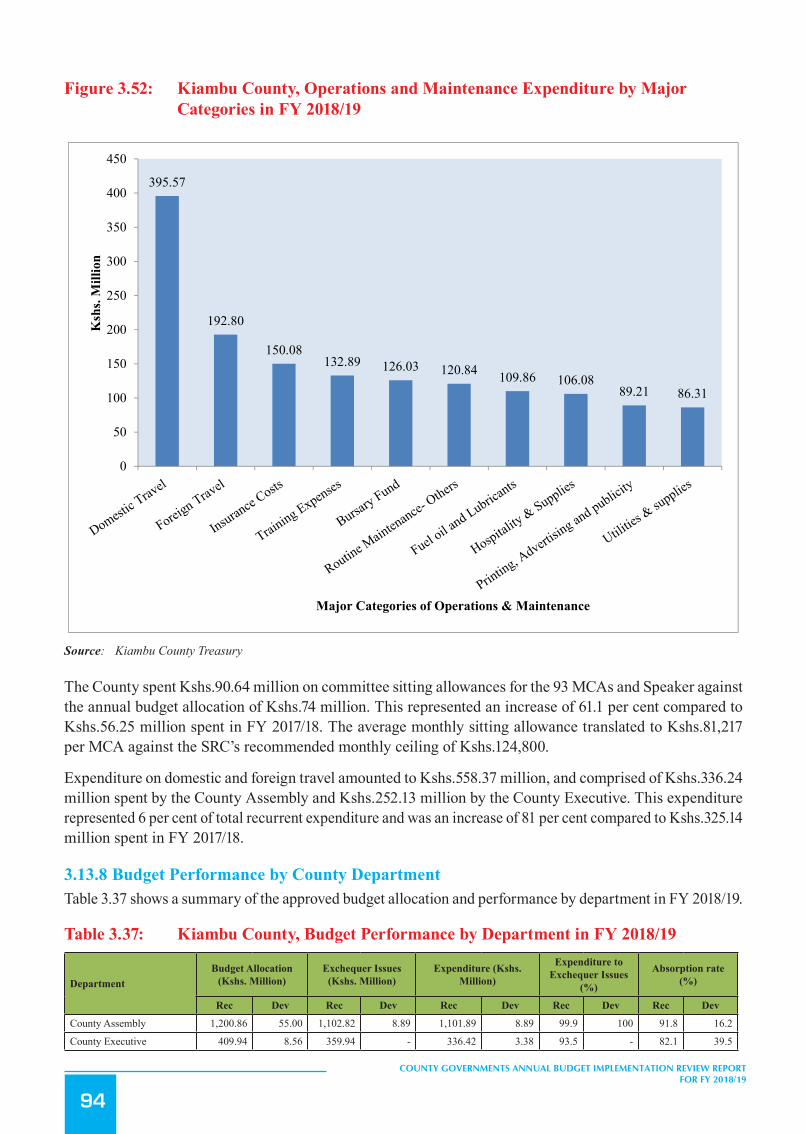
94
COUNTY GOVERNMENTS ANNUAL BUDGET IMPLEMENTATION REVIEW REPORT FOR FY 2018/19
Figure 3.52: Kiambu County, Operations and Maintenance Expenditure by Major Categories in FY 2018/19
133
Figure 3.52: Kiambu County, Operations and Maintenance Expenditure by Major Categories in FY 2018/19
Source: Kiambu County Treasury
The County spent Kshs.90.64 million on committee sitting allowances for the 93 MCAs and Speaker against the annual
budget allocation of Kshs.74 million. This represented an increase of 61.1 per cent compared to Kshs.56.25 million
spent in FY 2017/18. The average monthly sitting allowance translated to Kshs.81,217 per MCA against the SRC’s
recommended monthly ceiling of Kshs.124,800.
Expenditure on domestic and foreign travel amounted to Kshs.558.37 million, and comprised of Kshs.336.24 million
spent by the County Assembly and Kshs.252.13 million by the County Executive. This expenditure represented 6 per
cent of total recurrent expenditure and was an increase of 81 per cent compared to Kshs.325.14 million spent in FY
2017/18.
3.13.8 Budget Performance by County Department Table 3.37 shows a summary of the approved budget allocation and performance by department in FY 2018/19.
Table 3.37: Kiambu County, Budget Performance by Department in FY 2018/19
Department Budget Allocation (Kshs. Million)
Exchequer Issues (Kshs. Million)
Expenditure (Kshs. Million)
Expenditure to Exchequer Issues (%)
Absorption rate (%)
Rec Dev Rec Dev Rec Dev Rec Dev Rec Dev
395.57
192.80
150.08132.89 126.03 120.84 109.86 106.08
89.21 86.31
0
50
100
150
200
250
300
350
400
450
Ksh
s. M
illio
n
Major Categories of Operations & Maintenance
Source: Kiambu County Treasury
The County spent Kshs.90.64 million on committee sitting allowances for the 93 MCAs and Speaker against the annual budget allocation of Kshs.74 million. This represented an increase of 61.1 per cent compared to Kshs.56.25 million spent in FY 2017/18. The average monthly sitting allowance translated to Kshs.81,217 per MCA against the SRC’s recommended monthly ceiling of Kshs.124,800.
Expenditure on domestic and foreign travel amounted to Kshs.558.37 million, and comprised of Kshs.336.24 million spent by the County Assembly and Kshs.252.13 million by the County Executive. This expenditure represented 6 per cent of total recurrent expenditure and was an increase of 81 per cent compared to Kshs.325.14 million spent in FY 2017/18.
3.13.8 Budget Performance by County DepartmentTable 3.37 shows a summary of the approved budget allocation and performance by department in FY 2018/19.
Table 3.37: Kiambu County, Budget Performance by Department in FY 2018/19
DepartmentBudget Allocation
(Kshs. Million)Exchequer Issues
(Kshs. Million)Expenditure (Kshs.
Million)
Expenditure to Exchequer Issues
(%)
Absorption rate (%)
Rec Dev Rec Dev Rec Dev Rec Dev Rec Dev
County Assembly 1,200.86 55.00 1,102.82 8.89 1,101.89 8.89 99.9 100 91.8 16.2
County Executive 409.94 8.56 359.94 - 336.42 3.38 93.5 - 82.1 39.5

95
COUNTY GOVERNMENTS ANNUAL BUDGET IMPLEMENTATION REVIEW REPORT FOR FY 2018/19
DepartmentBudget Allocation
(Kshs. Million)Exchequer Issues
(Kshs. Million)Expenditure (Kshs.
Million)
Expenditure to Exchequer Issues
(%)
Absorption rate (%)
Rec Dev Rec Dev Rec Dev Rec Dev Rec Dev
County Public Service Board 76.32 - 76.32 - 64.01 - 83.9 - 83.9 -
Finance, ICT and Economic Planning 1,118.98 573.77 1,118.98 248.90 964.40 298.45 86.2 119.9 86.2 52
Administration, Public Ser-vice & Communication 1,212.03 14.50 1,212.03 11.96 1,155.45 11.25 95.3 94 95.3 77.6
Agriculture, Crop Produc-tion and Irrigation 239.26 284.59 239.26 121.90 224.56 176.10 93.9 144.5 93.9 61.9
Water, Environment & Natural Resources 290.68 223.23 290.68 145.92 262.84 104.50 90.4 71.6 90.4 46.8
Health Services 4,234.49 833.07 4,006.78 661.51 3,774.35 600.10 94.2 90.7 89.1 72.0
Education, Youth, Sports Culture, & Social Service 1,065.76 417.54 1,024.85 159.77 971.74 269.52 94.8 168.7 91.2 64.6
Youth and Sports 90.68 25.13 90.68 - 80.17 - 88.4 - 88.4 0.0
Lands, Physical Planning & Housing 262.20 1,937.76 221.00 1,937.76 144.93 1,941.37 65.6 100.2 55.3 100.2
Trade, Tourism, Industry & Cooperative 159.48 259.89 159.48 56.51 145.28 61.35 91.1 108.6 91.1 23.6
Roads, Transport & Public Works 347.89 1,208.11 347.89 1,091.38 315.52 991.10 90.7 90.8 90.7 82.0
Livestock, Fisheries and Marketing 240.65 123.97 240.65 12.95 223.46 29.22 92.9 225.6 92.9 23.6
TOTAL 10,949 5,965 10,491 4,457 9,765 4,495 93.1 100.8 89.2 75.4
Source: Kiambu County Treasury
Analysis of expenditure by department shows that the Department of Lands, Physical Planning & Housing recorded the highest absorption rate of development budget at 100.2 per cent while the Department of Youth and Sports did not spend on the development budget. The Department of Administration, Public Service & Communication had the highest percentage of recurrent expenditure to recurrent budget at 95.3 per cent while the Department of Lands, Physical Planning & Housing had the lowest at 55.3 per cent.
3.13.9 Key Observations and RecommendationsThe County has made progress in addressing some of the challenges previously identified as affecting budget implementation. Some of the progress made included:
i. Improvement in the absorption of development expenditure by 145.2 per cent from Kshs.1.83 billion in FY 2017/18 to Kshs.4.50 billion in the reporting period.
ii. Improvement in the collection of own source revenue by 61.9 per cent from Kshs.1.69 billion in FY 2017/18 to Kshs.2.74 billion in the reporting period, and was 100.2 per cent of the annual target.
Despite the above progress, the following challenges continued to hamper effective budget implementation;
1. High expenditure on personnel emoluments which has increased by 12.4 per cent from Kshs.6.04 billion to Kshs.6.78 billion. The wage bill accounted for 47.6 per cent of total expenditure in the reporting period.
2. High expenditure on foreign and domestic travel, which increased by 81 per cent from Kshs.325.14 million in FY 2017/18 to Kshs.558.37 million in the reporting period.
3. Inadequate budgetary control that resulted in expenditure above approved budget by the Department of Lands, Physical Planning & Housing. This is contrary to Section 135 and 154 of PFM Act, 2012.
The County should implement the following measures in order to improve budget execution;

96
COUNTY GOVERNMENTS ANNUAL BUDGET IMPLEMENTATION REVIEW REPORT FOR FY 2018/19
1. The County Public Service Board should put in place measures to ensure the wage bill does not increase above the legal limit in the medium term.
2. The County Treasury should ensure that expenditure on non-core budget items is rationalised to provide more resources for development projects.
3. The County Treasury should ensure expenditure is within the approved budget.
3.14 KilifiCounty
3.14.1 Overview of the FY 2018/19 BudgetThe County’s FY 2018/19 Supplementary Budget was Kshs.14.48 billion, comprising of Kshs.8.71 billion (60.2 per cent) and Kshs.5.77 billion (39.8 per cent) allocation for recurrent and development expenditure respectively.
To finance the budget, the County expects to receive Kshs.10.83 billion (74.8 per cent) as equitable share of the revenue raised nationally, Kshs.1.83 billion (12.6 per cent) as total conditional grants, generate Kshs.1.35 billion (9.3 per cent) from own sources of revenue, Kshs.10.99 million (0.1 per cent) as other revenues expected during the year and Kshs.465.43 million (3.2 per cent) cash balance from FY 2017/18.
Figure3.53: KilifiCounty,ExpectedSourcesofBudgetFinancinginFY2018/19
135
1. The County Public Service Board should put in place measures to ensure the wage bill does not increase above
the legal limit in the medium term.
2. The County Treasury should ensure that expenditure on non-core budget items is rationalised to provide more
resources for development projects.
3. The County Treasury should ensure expenditure is within the approved budget.
3.14 Kilifi County
3.14.1 Overview of the FY 2018/19 Budget The County’s FY 2018/19 Supplementary Budget was Kshs.14.48 billion, comprising of Kshs.8.71 billion (60.2 per
cent) and Kshs.5.77 billion (39.8 per cent) allocation for recurrent and development expenditure respectively.
To finance the budget, the County expects to receive Kshs.10.83 billion (74.8 per cent) as equitable share of the revenue
raised nationally, Kshs.1.83 billion (12.6 per cent) as total conditional grants, generate Kshs.1.35 billion (9.3 per cent)
from own sources of revenue, Kshs.10.99 million (0.1 per cent) as other revenues expected during the year and
Kshs.465.43 million (3.2 per cent) cash balance from FY 2017/18.
Figure 3.53: Kilifi County, Expected Sources of Budget Financing in FY 2018/19
Source: Kilifi County Treasury
A breakdown of the conditional grants is provided in Table 3.38.
3.14.2 Revenue Analysis During FY 2018/19, the County had a total of Khs.12.86 billion available for budget implementation. This amount
consisted of Kshs.10.83 billion received as equitable share of the revenue raised nationally, Kshs.1.06 billion as
conditional grants, Kshs.787.69 million generated from own sources of revenue, and a cash balance of Kshs.180.51
million from FY 2017/18.
Cash Balance from FY 2017/18, 3.2%
National Sharable Revenue74.8%
Total Conditional Allocations , 12.6%
Own Source Revenue, 9.3%
Other Revenues Expected During the
year, 0.1%
Source: Kilifi County Treasury
A breakdown of the conditional grants is provided in Table 3.38.

97
COUNTY GOVERNMENTS ANNUAL BUDGET IMPLEMENTATION REVIEW REPORT FOR FY 2018/19
3.14.2 Revenue AnalysisDuring FY 2018/19, the County had a total of Khs.12.86 billion available for budget implementation. This amount consisted of Kshs.10.83 billion received as equitable share of the revenue raised nationally, Kshs.1.06 billion as conditional grants, Kshs.787.69 million generated from own sources of revenue, and a cash balance of Kshs.180.51 million from FY 2017/18.
Figure 3.54 shows the annual trend in own-source revenue collection from FY 2013/14 to FY 2018/19.
Figure3.54: KilifiCounty,OwnSourceRevenueCollectionforFY2013/14toFY2018/19
136
Figure 3.54 shows the annual trend in own-source revenue collection from FY 2013/14 to FY 2018/19.
Figure 3.54: Kilifi County, Own Source Revenue Collection for FY 2013/14 to FY 2018/19
Source: Kilifi County Treasury
The County generated a total of Kshs.787.69 million from own revenue sources in FY 2018/19. This amount
represented an increase of 50. 8 per cent compared to Kshs.522.33 million realised in FY 2017/18 and was 58.6 per cent
of the annual target.
3.14.3 Conditional Grants During the reporting period, the County received Kshs.1.06 billion as conditional grants as shown inTable 3.38.
Table 3.38: Kilifi County, Conditional Grants/Loans Received in the FY 2018/19
S/No Grant Details
Annual Allocation-CAR
A, 2018) (Kshs)
Annual Budget Allocation
(Kshs)
Receipts in FY 2018/19 (Kshs)
Receipts as Percentage of
Annual Budget
Allocation (%)
1 Water and Sanitation Development Project (WSDP) 400,000,000 400,000,000 - -
2 Kenya Urban Support Programme (KUSP) 330,534,500 330,534,500 330,534,500 100
3 Road Maintenance Fuel Levy Fund 285,223,455 293,653,336 293,653,337 103
4 Leasing of Medical Equipment 200,000,000 200,000,000 - -
5 World Bank Loan for National Agricultural & Rural Inclusive Project
140,435,163 196,045,018 112,109,855 79.8
6 World Bank Loan for Transforming Health Systems for Universal Care (WB) (THSUC)
100,000,000 101,527,335 81,946,553 81.9
7 WB -Kenya Devolution Support Programme (KDSP) 61,148,106 83,874,401 22,726,295 37.2
457.90
550.82
446.50
620.09
522.33
787.69
0
100
200
300
400
500
600
700
800
900
FY 2013/14 FY 2014/15 FY 2015/16 FY 2016/17 FY 2017/18 FY 2018/19
Ksh
s. M
illio
ns
Trend in Own Source Revenue
Source: Kilifi County Treasury
The County generated a total of Kshs.787.69 million from own revenue sources in FY 2018/19. This amount represented an increase of 50. 8 per cent compared to Kshs.522.33 million realised in FY 2017/18 and was 58.6 per cent of the annual target.
3.14.3 Conditional GrantsDuring the reporting period, the County received Kshs.1.06 billion as conditional grants as shown inTable 3.38.
Table3.38: KilifiCounty,ConditionalGrants/LoansReceivedintheFY2018/19
S/No Grant DetailsAnnual Alloca-
tion-CARA, 2018)(Kshs)
Annual Budget Allocation(Kshs)
Receipts in FY 2018/19 (Kshs)
Receipts as Percentage of
Annual Budget Allocation (%)
1 Water and Sanitation Development Project (WSDP) 400,000,000 400,000,000 - -
2 Kenya Urban Support Programme (KUSP) 330,534,500 330,534,500 330,534,500 100
3 Road Maintenance Fuel Levy Fund 285,223,455 293,653,336 293,653,337 103
4 Leasing of Medical Equipment 200,000,000 200,000,000 - -
5 World Bank Loan for National Agricultural & Rural In-clusive Project 140,435,163 196,045,018 112,109,855 79.8
6 World Bank Loan for Transforming Health Systems for Universal Care (WB) (THSUC) 100,000,000 101,527,335 81,946,553 81.9
7 WB -Kenya Devolution Support Programme (KDSP) 61,148,106 83,874,401 22,726,295 37.2
8 Development of Youth Polytechnics/ Rehabilitation of Village Polytechnic 53,035,000 87,896,049 74,902,474 141.2
9 DANIDA Grant 33,361,875 45,178,279 45,178,279 135.4

98
COUNTY GOVERNMENTS ANNUAL BUDGET IMPLEMENTATION REVIEW REPORT FOR FY 2018/19
S/No Grant DetailsAnnual Alloca-
tion-CARA, 2018)(Kshs)
Annual Budget Allocation(Kshs)
Receipts in FY 2018/19 (Kshs)
Receipts as Percentage of
Annual Budget Allocation (%)
10 Compensation for User Fee Foregone 25,969,864 26,072,672 39,166,163 150.8
11 Agricultural Sector Development Support Program-me(ASDSP)II 23,653,874 22,011,311 13,611,847 57.7
12 Kenya Urban Support Programme-Urban Institutional Grant - 41,200,000 41,200,000 -
Total 1,653,361,837 1,827,992,901 1,055,029,303 63.8
Source: Kilifi County Treasury
During the reporting period, receipts from the Compensation for User Fee Foregone conditional grant recorded the highest performance in percentage terms, and accounted for 150.8 per cent of the annual target.
3.14.4 Exchequer IssuesIn order to implement the budget, the Controller of Budget approved withdrawal of Kshs.11.61 billion from the CRF account. The withdrawals represented 80.2 per cent of the Approved Supplementary Budget and translated to an increase of 8.4 per cent from Kshs.10.71 billion in FY 2017/18, and comprised of Kshs.3.68 billion (31.7 per cent) towards development activities and Kshs.7.93 billion (68.3 per cent) for recurrent expenditure.
3.14.5 Overall Expenditure ReviewA total of Kshs.9.64 billion was spent on both development and recurrent activities. This expenditure represented 83 per cent of the total funds released from the CRF account, and was an increase of 1.2 per cent from Kshs.9.53 billion spent in FY 2017/18.
The expenditure excluded pending bills as at June 30, 2019 which amounted to Kshs.771.77 million for development activities and Kshs.369.18 million for recurrent costs.
Expenditure on development programmes amounted to Kshs.3.57 billion while Kshs.6.07 billion was spent on recurrent activities. The development expenditure was 97 per cent of the funds released for development programmes, while recurrent expenditure was 76.6 per cent of funds released for recurrent activities.
Development expenditure recorded an absorption rate of 61.8 per cent, which was a decrease from 73.1 per cent attained in FY 2017/18. Conversely, recurrent expenditure represented 69.7 per cent of the annual recurrent budget, a decrease from 81.5 per cent recorded in FY 2017/18.
Figure 3.55 presents a comparison between the total expenditure in FY 2018/19 and FY 2017/18.
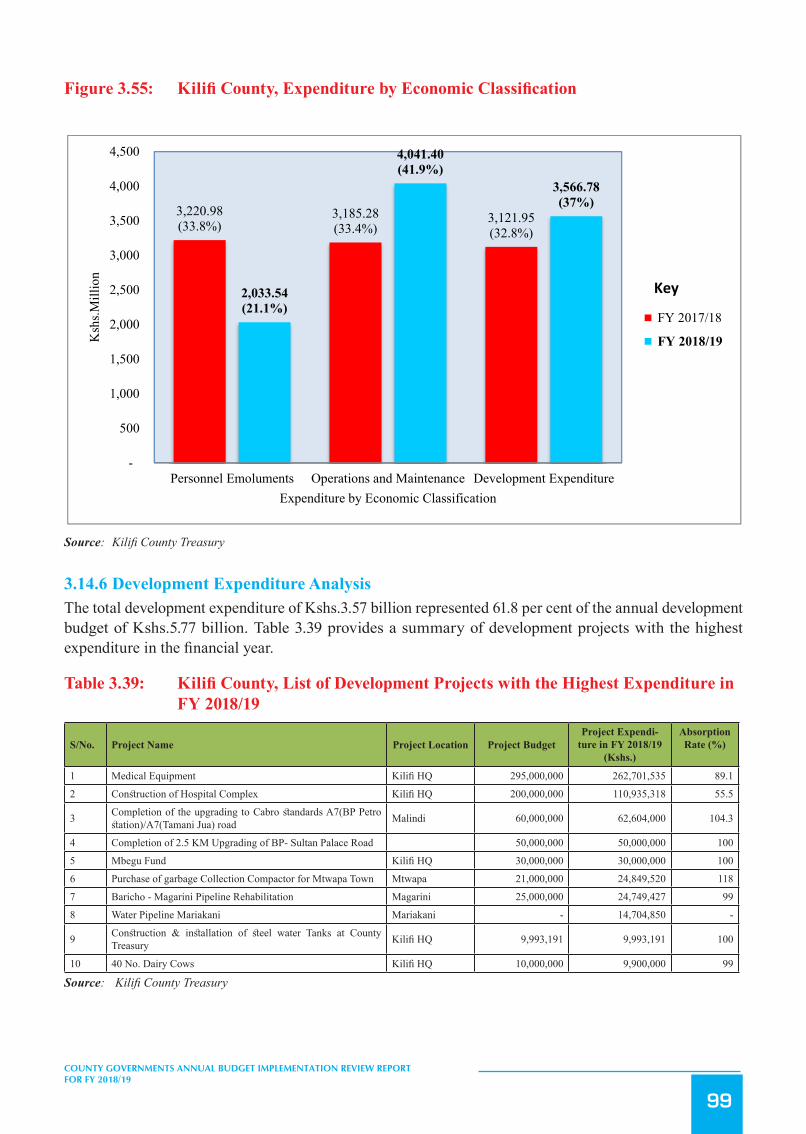
99
COUNTY GOVERNMENTS ANNUAL BUDGET IMPLEMENTATION REVIEW REPORT FOR FY 2018/19
Figure3.55: KilifiCounty,ExpenditurebyEconomicClassification
138
Source: Kilifi County Treasury
3.14.6 Development Expenditure Analysis The total development expenditure of Kshs.3.57 billion represented 61.8 per cent of the annual development budget of
Kshs.5.77 billion. Table 3.39 provides a summary of development projects with the highest expenditure in the financial
year.
Table 3.39: Kilifi County, List of Development Projects with the Highest Expenditure in FY 2018/19
S/No. Project Name Project
Location Project Budget
Project Expenditure in FY 2018/19 (Kshs.)
Absorption Rate (%)
1 Medical Equipment Kilifi HQ 295,000,000 262,701,535 89.1 2 Construction of Hospital Complex Kilifi HQ 200,000,000 110,935,318 55.5
3 Completion of the upgrading to Cabro standards A7(BP Petro station)/A7(Tamani Jua) road Malindi 60,000,000 62,604,000 104.3
4 Completion of 2.5 KM Upgrading of BP- Sultan Palace Road 50,000,000 50,000,000 100
5 Mbegu Fund Kilifi HQ 30,000,000 30,000,000 100
6 Purchase of garbage Collection Compactor for Mtwapa Town Mtwapa 21,000,000 24,849,520 118
7 Baricho - Magarini Pipeline Rehabilitation Magarini 25,000,000 24,749,427 99
8 Water Pipeline Mariakani Mariakani - 14,704,850 -
9 Construction & installation of steel water Tanks at County Treasury Kilifi HQ 9,993,191 9,993,191 100
10 40 No. Dairy Cows Kilifi HQ 10,000,000 9,900,000 99 Source: Kilifi County Treasury
3.14.7 Analysis of Recurrent Expenditure The total recurrent expenditure of Kshs.6.07 billion comprised of Kshs.2.03 billion (33.5 per cent) incurred on personnel
emoluments and Kshs.4.04 billion (66.5 per cent) on operations and maintenance as shown in Figure 3.55.
3,220.98(33.8%)
3,185.28(33.4%)
3,121.95(32.8%)
2,033.54(21.1%)
4,041.40(41.9%)
3,566.78(37%)
-
500
1,000
1,500
2,000
2,500
3,000
3,500
4,000
4,500
Personnel Emoluments Operations and Maintenance Development Expenditure
Ksh
s.Mill
ion
Expenditure by Economic Classification
FY 2017/18
FY 2018/19
Key
Source: Kilifi County Treasury
3.14.6 Development Expenditure AnalysisThe total development expenditure of Kshs.3.57 billion represented 61.8 per cent of the annual development budget of Kshs.5.77 billion. Table 3.39 provides a summary of development projects with the highest expenditure in the financial year.
Table3.39: KilifiCounty,ListofDevelopmentProjectswiththeHighestExpenditureinFY 2018/19
S/No. Project Name Project Location Project BudgetProject Expendi-
ture in FY 2018/19 (Kshs.)
Absorption Rate (%)
1 Medical Equipment Kilifi HQ 295,000,000 262,701,535 89.1
2 Construction of Hospital Complex Kilifi HQ 200,000,000 110,935,318 55.5
3 Completion of the upgrading to Cabro standards A7(BP Petro station)/A7(Tamani Jua) road Malindi 60,000,000 62,604,000 104.3
4 Completion of 2.5 KM Upgrading of BP- Sultan Palace Road 50,000,000 50,000,000 100
5 Mbegu Fund Kilifi HQ 30,000,000 30,000,000 100
6 Purchase of garbage Collection Compactor for Mtwapa Town Mtwapa 21,000,000 24,849,520 118
7 Baricho - Magarini Pipeline Rehabilitation Magarini 25,000,000 24,749,427 99
8 Water Pipeline Mariakani Mariakani - 14,704,850 -
9 Construction & installation of steel water Tanks at County Treasury Kilifi HQ 9,993,191 9,993,191 100
10 40 No. Dairy Cows Kilifi HQ 10,000,000 9,900,000 99
Source: Kilifi County Treasury

100
COUNTY GOVERNMENTS ANNUAL BUDGET IMPLEMENTATION REVIEW REPORT FOR FY 2018/19
3.14.7 Analysis of Recurrent ExpenditureThe total recurrent expenditure of Kshs.6.07 billion comprised of Kshs.2.03 billion (33.5 per cent) incurred on personnel emoluments and Kshs.4.04 billion (66.5 per cent) on operations and maintenance as shown in Figure 3.55.
Expenditure on personnel emoluments represented a decrease of 36.9 per cent compared to FY 2017/18 when the County spent Kshs.3.22 billion and was 21.1 per cent of the total expenditure in FY 2018/19. The decline in personnel emoluments was as a result of laying off casuals by the County Government. Figure 3.56 shows a summary of operations and maintenance expenditure by major categories.
Figure3.56: KilifiCounty,OperationsandMaintenanceExpenditurebyMajorCategories in FY 2018/19
139
Expenditure on personnel emoluments represented a decrease of 36.9 per cent compared to FY 2017/18 when the
County spent Kshs.3.22 billion and was 21.1 per cent of the total expenditure in FY 2018/19. The decline in personnel
emoluments was as a result of laying off casuals by the County Government. Figure 3.56 shows a summary of
operations and maintenance expenditure by major categories.
Figure 3.56: Kilifi County, Operations and Maintenance Expenditure by Major Categories in FY 2018/19
Source: Kilifi County Treasury
The County spent Kshs.59.63 million on committee sitting allowances for the 54 MCAs and speaker against the annual
budget allocation of Kshs.96.84 million. This represented an increase of 143.6 per cent compared to Kshs.24.49 million
spent in FY 2017/18. The average monthly sitting allowance translated to Kshs.92,029 per MCA against the SRC’s
recommended monthly ceiling of Kshs.124,800.
Expenditure on domestic and foreign travel amounted to Kshs.436.94 million, and comprised of Kshs.219.33 million
spent by the County Assembly and Kshs.217.61 million by the County Executive. This expenditure represented 7.2 per
cent of total recurrent expenditure and was an increase of 75.9 per cent compared to Kshs.248.28 million spent in FY
2017/18.
3.14.8 Budget Performance by County Department Table 3.40 shows a summary of the approved budget allocation and performance by department in FY 2018/19.
Table 3.40: Kilifi County, Budget Performance by Department in FY 2018/19
485.16
436.94402.77
383.85 382.56350.00
314.21 310.81282.15 276.16
0
100
200
300
400
500
600
Ksh
s. M
illio
n
Major Categories of Operations & Maintenance
Source: Kilifi County Treasury
The County spent Kshs.59.63 million on committee sitting allowances for the 54 MCAs and speaker against the annual budget allocation of Kshs.96.84 million. This represented an increase of 143.6 per cent compared to Kshs.24.49 million spent in FY 2017/18. The average monthly sitting allowance translated to Kshs.92,029 per MCA against the SRC’s recommended monthly ceiling of Kshs.124,800.

101
COUNTY GOVERNMENTS ANNUAL BUDGET IMPLEMENTATION REVIEW REPORT FOR FY 2018/19
Expenditure on domestic and foreign travel amounted to Kshs.436.94 million, and comprised of Kshs.219.33 million spent by the County Assembly and Kshs.217.61 million by the County Executive. This expenditure represented 7.2 per cent of total recurrent expenditure and was an increase of 75.9 per cent compared to Kshs.248.28 million spent in FY 2017/18.
3.14.8 Budget Performance by County DepartmentTable 3.40 shows a summary of the approved budget allocation and performance by department in FY 2018/19.
Table3.40: KilifiCounty,BudgetPerformancebyDepartmentinFY2018/19
Department
Annual Budget Allocation (Kshs.
Million)
Exchequer Issues (Kshs. Million)
Expenditure (Kshs. Million)
Expenditure to Exchequer
Issues (%)
Absorption rate (%)
Rec Dev Rec Dev Rec Dev Rec Dev Rec Dev
County Assembly 903.51 311.17 903.51 177.63 895.97 128.22 99.2 72.2 99.2 41.2
Office of the Governor 371.34 - 325.62 - 306.72 - 94.2 - 82.6 -
County Attorney 121.51 - 120.77 - 95.98 - 79.5 - 79.0 -
Finance 577.80 18.81 365.08 18.81 361.33 7.89 99.0 41.9 62.5 41.9
Economic Planning 51.13 - 34.43 - 35.36 - 102.7 - 69.1 -
Agriculture 584.40 183.47 479.46 123.99 415.56 105.73 86.7 85.3 71.1 57.6
Livestock 28.50 131.80 22.60 111.95 22.99 97.07 101.7 86.7 80.7 73.7
Fisheries 28.80 59.23 5.67 30.49 23.27 21.51 410.7 70.6 80.8 36.3
Water and Sanitation 241.08 988.62 210.06 621.61 216.31 595.26 103.0 95.8 89.7 60.2
Environment , Natural Resources and Wildlife 89.72 95.50 56.85 107.21 82.17 69.40 144.5 64.7 91.6 72.7
Education Sports & Youth Affairs 930.85 838.48 930.85 385.69 659.96 400.09 70.9 103.7 70.9 47.7
Information, Communication & Tech-nology 37.00 10.00 34.97 5.00 23.21 4.02 66.4 80.4 62.7 40.2
Medical Services 2,671.17 845.79 2,646.92 388.34 1,227.59 434.91 46.4 112.0 46.0 51.4
Public Health 267.69 - 214.18 - 256.80 - 119.9 - 95.9 -
Roads, Transport and Public Works 466.69 1,213.59 449.74 1,037.70 460.49 1,071.15 102.4 103.2 98.7 88.3
Lands and energy 151.39 61.80 138.91 27.45 107.06 27.53 77.1 100.3 70.7 44.6
Physical Planning ,Urban Development and Housing 52.36 539.61 40.36 400.69 27.54 352.88 68.3 88.1 52.6 65.4
Gender, Culture, Social Services and Sports 184.44 217.99 169.39 55.03 118.26 77.45 69.8 140.7 64.1 35.5
Trade and Tourism 119.89 186.95 118.84 136.09 101.50 157.96 85.4 116.1 84.7 84.5
Cooperatives Development 9.57 - - - 8.32 - - - 86.9 -
County Public Service Board 72.45 - 66.69 - 60.27 - 90.4 - 83.2 -
Devolution, Public Service and Disaster Management 750.53 67.84 598.36 50.24 568.27 15.70 95.0 31.2 75.7 23.1
Total 8,712 5,771 7,933 3,678 6,075 3,567 76.6 97 69.7 61.8
Source: Kilifi County Treasury
Analysis of expenditure by department shows that the Department of Roads, Transport and Public Works recorded the highest absorption rate of development budget at 88.3 per cent while the Department of Devolution, Public Service and Disaster Management recorded the lowest at 23.1 per cent. The County Assembly had the highest percentage of recurrent expenditure to recurrent budget at 99.2 per cent while the Department of Medical Services had the lowest at 46 per cent.
3.14.9 Key Observations and RecommendationsThe County has made progress in addressing some of the challenges previously identified as affecting budget implementation. Some of the progress made included:

102
COUNTY GOVERNMENTS ANNUAL BUDGET IMPLEMENTATION REVIEW REPORT FOR FY 2018/19
i. Improved internet connectivity, resulting into effective use of IFMISii. Establishment of an Internal Audit Committee in line with Section 155 of the PFM Act, 2012.
Despite the above progress, the following challenges continued to hamper effective budget implementation;
1. Late submission of reports on financial and non-financial performance by the County Treasury, which affected timely preparation of budget implementation report contrary to section 166 of the PFM Act, 2012.
2. Delay by Fund Administrators to submit expenditure reports of the Mbegu Fund, Emergency Fund, Scholarship Fund and the County Assembly Staff Mortgage Fund contrary to Section 168 of the PFM Act, 2012.
3. Under-performance of own-source revenue collection. The County collected Kshs.787.69 million which was 58.6 per cent of the annual target of Kshs.1.35 billion.
4. The County Treasury operationalised the Housing and Car Loans to Public Servants by depositing Kshs.39 million to this Fund before getting an approval from the Controller of Budget for withdrawal from the CRF. This is an indication of a weak financial control as the amount was diverted from other funded programmes.
5. High expenditure on foreign and domestic travel, which increased by 75.9 per cent from Kshs.248.28 million in FY 2017/18 to Kshs.436.94 million in the reporting period.
The County should implement the following measures in order to improve budget execution;
1. The County Treasury should ensure timely preparation and submission of reports on financial and non-financial performance in line with Section 166 of PFM Act, 2012.
2. All Fund Administrators should ensure timely submission of expenditure reports on established Funds in line with Section 168 of PFM Act 2012.
3. The County Treasury should formulate and implement strategies to enhance own-source revenue collection.
4. The County Treasury should put in place proper systems to ensure that funds are utilised in line with Article 201, 207 & 228 of the Constitution, and Section 109 of the PFM Act, 2012.
5. The County Treasury should ensure that expenditure on non-core budget items is rationalised to provide more resources for development projects.
3.15 Kirinyaga County
3.15.1 Overview of the FY 2018/19 BudgetThe County’s FY 2018/19 Supplementary Budget was Kshs.5.91 billion, comprising of Kshs.1.82 billion (30.8 per cent) and Kshs.4.09 billion (69.2 per cent) allocation for development and recurrent expenditure respectively.
To finance the budget, the County expects to receive Kshs.4.11 billion (69.6 per cent) as equitable share of the revenue raised nationally, Kshs.530.59 million ( 9.0 per cent) as total conditional grants, generate Kshs.430 million (7.3 per cent) from own sources of revenue, and Kshs.900.12 million (15.2 per cent) cash balance from FY 2017/18.

103
COUNTY GOVERNMENTS ANNUAL BUDGET IMPLEMENTATION REVIEW REPORT FOR FY 2018/19
Figure 3.57: Kirinyaga County, Expected Sources of Budget Financing in FY 2018/19
142
Source: Kirinyaga County Treasury
A breakdown of the conditional grants is provided in Table 3.41.
3.15.2 Revenue AnalysisDuring FY 2018/19, the County had a total of Kshs.5.65 billion available for budget implementation. This amount
consisted of Kshs.4.11 billion received as equitable share of the revenue raised nationally, Kshs.359.85 million as
conditional grants, Kshs.432.64 million generated from own sources of revenue, and a cash balance of Kshs.831.68
million from FY 2017/18.
Figure 3.58 shows the annual trend in own-source revenue collection from FY 2013/14 to FY 2018/19.
Figure 3.58: Kirinyaga County, Own Source Revenue Collection for FY 2013/14 to FY 2018/19
Cash Balance from FY 2017/18 15.2%
National Sharable Revenue69.6%
Total Conditional Allocations
9 %Own Source
Revenue7.3%
199.69
309.54
390.38
320.64344.41
432.64
0
50
100
150
200
250
300
350
400
450
500
FY 2013/14 FY 2014/15 FY 2015/16 FY 2016/17 FY 2017/18 FY 2018/19
Ksh
s.M
illio
ns
Trend in Own Source Revenue
Source: Kirinyaga County Treasury
A breakdown of the conditional grants is provided in Table 3.41.
3.15.2 Revenue AnalysisDuring FY 2018/19, the County had a total of Kshs.5.65 billion available for budget implementation. This amount consisted of Kshs.4.11 billion received as equitable share of the revenue raised nationally, Kshs.359.85 million as conditional grants, Kshs.432.64 million generated from own sources of revenue, and a cash balance of Kshs.831.68 million from FY 2017/18.
Figure 3.58 shows the annual trend in own-source revenue collection from FY 2013/14 to FY 2018/19.

104
COUNTY GOVERNMENTS ANNUAL BUDGET IMPLEMENTATION REVIEW REPORT FOR FY 2018/19
Figure 3.58: Kirinyaga County, Own Source Revenue Collection for FY 2013/14 to FY 2018/19
142
Source: Kirinyaga County Treasury
A breakdown of the conditional grants is provided in Table 3.41.
3.15.2 Revenue Analysis During FY 2018/19, the County had a total of Kshs.5.65 billion available for budget implementation. This amount
consisted of Kshs.4.11 billion received as equitable share of the revenue raised nationally, Kshs.359.85 million as
conditional grants, Kshs.432.64 million generated from own sources of revenue, and a cash balance of Kshs.831.68
million from FY 2017/18.
Figure 3.58 shows the annual trend in own-source revenue collection from FY 2013/14 to FY 2018/19.
Figure 3.58: Kirinyaga County, Own Source Revenue Collection for FY 2013/14 to FY 2018/19
Cash Balance from FY 2017/18
15.2%
National Sharable Revenue69.6%
Total Conditional Allocations
9 %
Own Source Revenue
7.3%
199.69
309.54
390.38
320.64344.41
432.64
0
50
100
150
200
250
300
350
400
450
500
FY 2013/14 FY 2014/15 FY 2015/16 FY 2016/17 FY 2017/18 FY 2018/19
Ksh
s. M
illio
ns
Trend in Own Source Revenue
Source: Kirinyaga County Treasury
The County generated a total of Kshs.432.64 million from own revenue sources in FY 2018/19. This amount represented an increase of Kshs.88.23 million compared to that realised in FY 2017/18 and represented 100.6 per cent of the annual target.
3.15.3 Conditional GrantsDuring the reporting period, the County received Kshs.359.85 million as conditional grants as shown in Table 3.41.
Table 3.41: Kirinyaga County, Conditional Grants/Loans Received in the FY 2018/19
S/No Grants Annual CARA, 2018 Allocation (in Kshs)
Annual Budget Al-location (in Kshs)
Actual receipts in the FY 2018/19 (in
Kshs.)
Actual Receipts as Percentage of Annual
Allocation (%)
A Grants Contained in the CARA, 2018
1 Road Maintenance Fuel Levy Fund 108,302,240 108,302,240 108,302,240 100
2 Leasing of Medical Equipment 200,000,000 - -
3 Transforming Health Systems for Universal Care Project (WB) 50,000,000 50,000,000 23,485,608 47
4 Kenya Devolution Support Programme (KDSP) 41,078,830 41,078,830 - -
5 Compensation for User Fee Foregone 11,282,570 11,282,570 11,282,570 100
6 DANIDA Grant 14,782,500 14,782,500 14,782,500 100
7 Kenya Urban Support Project (KUSP) 71,302,200 71,302,200 71,302,200 100
9 Development of Youth Polytechnics 52,210,000 52,210,000 39,418,550 75.5
12 World Bank Loan for National Agricultural & Rural Inclusive Project 140,435,163 140,435,163 50,078,476 35.7
13 IDA (World Bank) as credit for Kenya Urban Support Project- Urban Institution Grant 41,200,000 41,200,000 41,200,000 100
Total 730,593,503 530,593,503 359,852,144 49.3
Source: Kirinyaga County Treasury
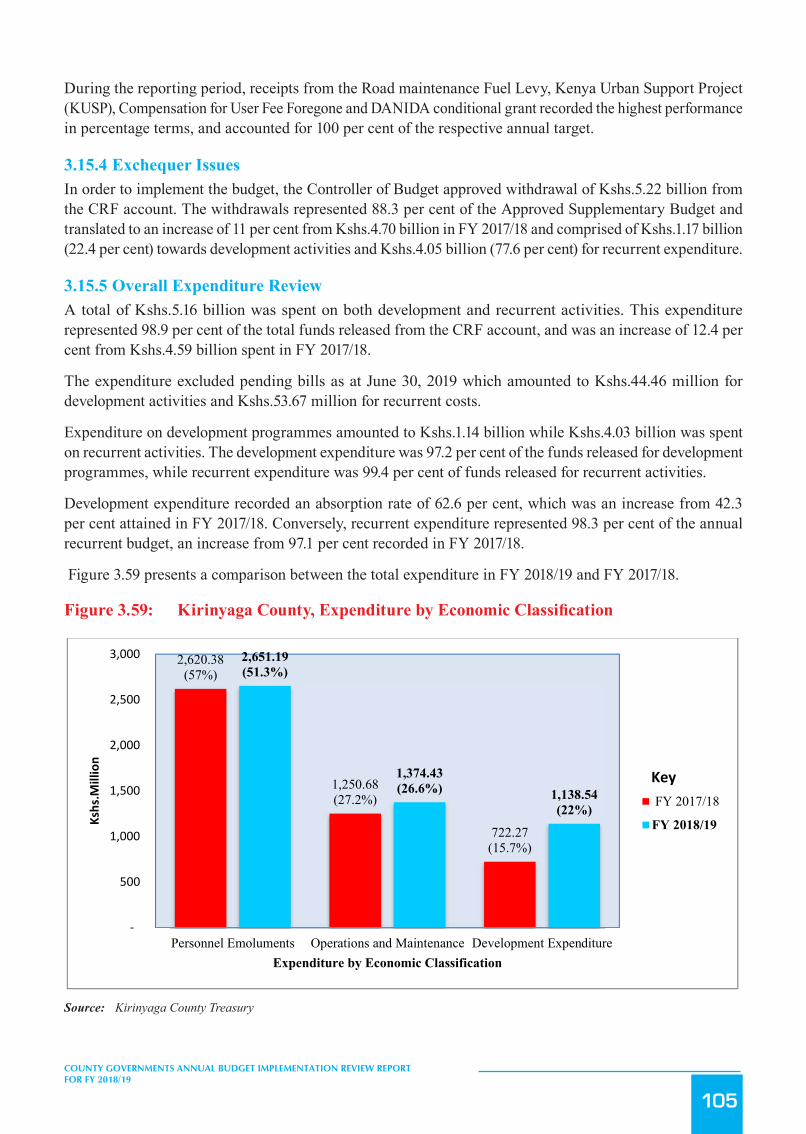
105
COUNTY GOVERNMENTS ANNUAL BUDGET IMPLEMENTATION REVIEW REPORT FOR FY 2018/19
During the reporting period, receipts from the Road maintenance Fuel Levy, Kenya Urban Support Project (KUSP), Compensation for User Fee Foregone and DANIDA conditional grant recorded the highest performance in percentage terms, and accounted for 100 per cent of the respective annual target.
3.15.4 Exchequer IssuesIn order to implement the budget, the Controller of Budget approved withdrawal of Kshs.5.22 billion from the CRF account. The withdrawals represented 88.3 per cent of the Approved Supplementary Budget and translated to an increase of 11 per cent from Kshs.4.70 billion in FY 2017/18 and comprised of Kshs.1.17 billion (22.4 per cent) towards development activities and Kshs.4.05 billion (77.6 per cent) for recurrent expenditure.
3.15.5 Overall Expenditure ReviewA total of Kshs.5.16 billion was spent on both development and recurrent activities. This expenditure represented 98.9 per cent of the total funds released from the CRF account, and was an increase of 12.4 per cent from Kshs.4.59 billion spent in FY 2017/18.
The expenditure excluded pending bills as at June 30, 2019 which amounted to Kshs.44.46 million for development activities and Kshs.53.67 million for recurrent costs.
Expenditure on development programmes amounted to Kshs.1.14 billion while Kshs.4.03 billion was spent on recurrent activities. The development expenditure was 97.2 per cent of the funds released for development programmes, while recurrent expenditure was 99.4 per cent of funds released for recurrent activities.
Development expenditure recorded an absorption rate of 62.6 per cent, which was an increase from 42.3 per cent attained in FY 2017/18. Conversely, recurrent expenditure represented 98.3 per cent of the annual recurrent budget, an increase from 97.1 per cent recorded in FY 2017/18.
Figure 3.59 presents a comparison between the total expenditure in FY 2018/19 and FY 2017/18.
Figure3.59: KirinyagaCounty,ExpenditurebyEconomicClassification
144
3.15.5 Overall Expenditure Review A total of Kshs.5.16 billion was spent on both development and recurrent activities. This expenditure represented 98.9
per cent of the total funds released from the CRF account, and was an increase of 12.4 per cent from Kshs.4.59 billion
spent in FY 2017/18.
The expenditure excluded pending bills as at June 30, 2019 which amounted to Kshs.44.46 million for development
activities and Kshs.53.67 million for recurrent costs.
Expenditure on development programmes amounted to Kshs.1.14 billion while Kshs.4.03 billion was spent on recurrent
activities. The development expenditure was 97.2 per cent of the funds released for development programmes, while
recurrent expenditure was 99.4 per cent of funds released for recurrent activities.
Development expenditure recorded an absorption rate of 62.6 per cent, which was an increase from 42.3 per cent
attained in FY 2017/18. Conversely, recurrent expenditure represented 98.3 per cent of the annual recurrent budget, an
increase from 97.1 per cent recorded in FY 2017/18.
Figure 3.59 presents a comparison between the total expenditure in FY 2018/19 and FY 2017/18.
Figure 3.59: Kirinyaga County, Expenditure by Economic Classification
Source: Kirinyaga County Treasury
3.15.6 Development Expenditure Analysis The total development expenditure of Kshs.1.14 billion represented 62.6 per cent of the annual development
expenditure estimates of Kshs.1.82 billion. Table 3.42 provides a summary of development projects with the highest
expenditure in the financial year.
Table 3.42: Kirinyaga County, List of Development Projects with the Highest Expenditure in FY 2018/19
2,620.38(57%)
1,250.68(27.2%)
722.27(15.7%)
2,651.19(51.3%)
1,374.43(26.6%) 1,138.54
(22%)
‐
500
1,000
1,500
2,000
2,500
3,000
Personnel Emoluments Operations and Maintenance Development Expenditure
Kshs.M
illion
Expenditure by Economic Classification
FY 2017/18
FY 2018/19
Key
Source: Kirinyaga County Treasury
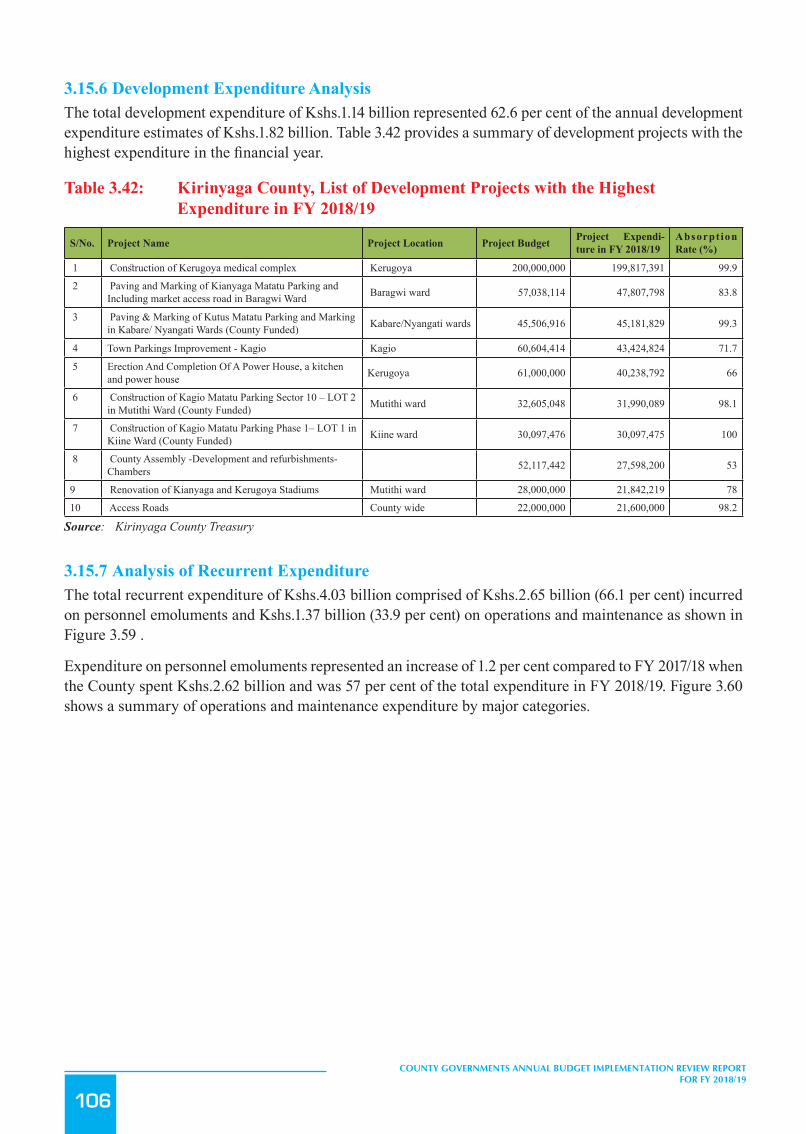
106
COUNTY GOVERNMENTS ANNUAL BUDGET IMPLEMENTATION REVIEW REPORT FOR FY 2018/19
3.15.6 Development Expenditure AnalysisThe total development expenditure of Kshs.1.14 billion represented 62.6 per cent of the annual development expenditure estimates of Kshs.1.82 billion. Table 3.42 provides a summary of development projects with the highest expenditure in the financial year.
Table 3.42: Kirinyaga County, List of Development Projects with the Highest Expenditure in FY 2018/19
S/No. Project Name Project Location Project Budget Project Expendi-ture in FY 2018/19
Absorpt ion Rate (%)
1 Construction of Kerugoya medical complex Kerugoya 200,000,000 199,817,391 99.9
2 Paving and Marking of Kianyaga Matatu Parking and Including market access road in Baragwi Ward Baragwi ward 57,038,114 47,807,798 83.8
3 Paving & Marking of Kutus Matatu Parking and Marking in Kabare/ Nyangati Wards (County Funded) Kabare/Nyangati wards 45,506,916 45,181,829 99.3
4 Town Parkings Improvement - Kagio Kagio 60,604,414 43,424,824 71.7
5 Erection And Completion Of A Power House, a kitchen and power house Kerugoya 61,000,000 40,238,792 66
6 Construction of Kagio Matatu Parking Sector 10 – LOT 2 in Mutithi Ward (County Funded) Mutithi ward 32,605,048 31,990,089 98.1
7 Construction of Kagio Matatu Parking Phase 1– LOT 1 in Kiine Ward (County Funded) Kiine ward 30,097,476 30,097,475 100
8 County Assembly -Development and refurbishments- Chambers 52,117,442 27,598,200 53
9 Renovation of Kianyaga and Kerugoya Stadiums Mutithi ward 28,000,000 21,842,219 78
10 Access Roads County wide 22,000,000 21,600,000 98.2
Source: Kirinyaga County Treasury
3.15.7 Analysis of Recurrent ExpenditureThe total recurrent expenditure of Kshs.4.03 billion comprised of Kshs.2.65 billion (66.1 per cent) incurred on personnel emoluments and Kshs.1.37 billion (33.9 per cent) on operations and maintenance as shown in Figure 3.59 .
Expenditure on personnel emoluments represented an increase of 1.2 per cent compared to FY 2017/18 when the County spent Kshs.2.62 billion and was 57 per cent of the total expenditure in FY 2018/19. Figure 3.60 shows a summary of operations and maintenance expenditure by major categories.

107
COUNTY GOVERNMENTS ANNUAL BUDGET IMPLEMENTATION REVIEW REPORT FOR FY 2018/19
Figure 3.60: Kirinyaga County, Operations and Maintenance Expenditure by Major Categories in FY 2018/19
146
Source: Kirinyaga County Treasury
The County spent Kshs.33.55 million on committee sitting allowances for the 34 MCAs and speaker against the annual
budget allocation of Kshs.80 million. This represented an increase of 65.5 per cent compared to Kshs.20.27 million
spent in FY 2017/18. The average monthly sitting allowance translated to Kshs.79,878 per MCA against the SRC’s
recommended monthly ceiling of Kshs.124,800.
Expenditure on domestic and foreign travel amounted to Kshs.167.21 million, and comprised of Kshs.103.99 million
spent by the County Assembly and Kshs.63.21 million by the County Executive. This expenditure represented 4.2 per
cent of total recurrent expenditure and was an increase of 7.8 per cent compared to Kshs.155.15 million spent in FY
2017/18.
3.15.8 Budget Performance by County Department Table 3.43 shows a summary of the approved budget allocation and performance by department in FY 2018/19.
Table 3.43: Kirinyaga County, Budget Performance by Department in FY 2018/19
Department
Annual Budget Allocation (Kshs. Million)
Exchequer Issues (Kshs. Million)
Expenditure (Kshs. Million)
Expenditure to Exchequer Issues (%)
Absorption Rate (%)
Rec Dev. Rec Dev. Rec Dev. Rec Dev. Rec Dev. County Executive (Office of the Governor) 472.44 86.08 450.94 76.33 450.94 68.22 100.0 89.4 95.4 79.3
Culture and Social Services 47.24 27.61 47.24 7.72 42.72 7.72 90.4 100.0 90.4 28.0 Trade Development and 42.6 129.5 39.67 64.92 39.03 64.92 98.4 100.0 91.6 50.1
149.59
122.13
102.69
70.82
57.71 56.3348.93 47.06 47.00
0
20
40
60
80
100
120
140
160
Kshs. M
illion
Major Categories of Operations & Maintenance
Source: Kirinyaga County Treasury
The County spent Kshs.33.55 million on committee sitting allowances for the 34 MCAs and speaker against the annual budget allocation of Kshs.80 million. This represented an increase of 65.5 per cent compared to Kshs.20.27 million spent in FY 2017/18. The average monthly sitting allowance translated to Kshs.79,878 per MCA against the SRC’s recommended monthly ceiling of Kshs.124,800.
Expenditure on domestic and foreign travel amounted to Kshs.167.21 million, and comprised of Kshs.103.99 million spent by the County Assembly and Kshs.63.21 million by the County Executive. This expenditure represented 4.2 per cent of total recurrent expenditure and was an increase of 7.8 per cent compared to Kshs.155.15 million spent in FY 2017/18.
3.15.8 Budget Performance by County DepartmentTable 3.43 shows a summary of the approved budget allocation and performance by department in FY 2018/19.

108
COUNTY GOVERNMENTS ANNUAL BUDGET IMPLEMENTATION REVIEW REPORT FOR FY 2018/19
Table 3.43: Kirinyaga County, Budget Performance by Department in FY 2018/19
Department
Annual Budget Allocation (Kshs.
Million)
Exchequer Issues (Kshs. Million)
Expenditure (Kshs. Million)
Expenditure to Exchequer Issues
(%)
Absorption Rate (%)
Rec Dev. Rec Dev. Rec Dev. Rec Dev. Rec Dev.
County Executive (Office of the Governor) 472.44 86.08 450.94 76.33 450.94 68.22 100.0 89.4 95.4 79.3
Culture and Social Services 47.24 27.61 47.24 7.72 42.72 7.72 90.4 100.0 90.4 28.0
Trade Development and Coopera-tives 42.6 129.5 39.67 64.92 39.03 64.92 98.4 100.0 91.6 50.1
Finance and Planning 347.7 32.74 347.7 21.84 344.07 21.84 99.0 100.0 99.0 66.7
Environment and Natural resources 92.4 107.44 90.73 57.44 88.6 56.17 97.7 97.8 95.9 52.3
Agriculture, &Livestock, Develop-ment 276.28 185.22 270.62 73.2 270.62 66.24 100.0 90.5 98.0 35.8
Health Services 1,811.25 409.38 1,808.27 305.02 1,802.86 297.14 99.7 97.4 99.5 72.6
Transport, Roads and Public Works 88.31 574.62 88.31 423.63 82.76 417.28 93.7 98.5 93.7 72.6
Education 208.96 72.64 208.96 9.33 208.96 9.33 100.0 100.0 100.0 12.8
Physical Planning And Develop-ment 72.25 77.3 70.71 71.3 70.41 71.3 99.6 100.0 97.5 92.2
Youth And Sports 31.95 43.49 23.06 33.28 22.91 33.28 99.3 100.0 71.7 76.5
County Assembly 601.93 72.12 601.73 27.6 601.73 25.08 100.0 90.9 100.0 34.8
Total 4,093.31 1,818.14 4,047.94 1,171.61 4,025.61 1,138.52 99.4 97.2 98.3 62.6
Source: Kirinyaga County Treasury
Analysis of expenditure by department shows that the Department of Physical Planning and Development recorded the highest absorption rate of development budget at 92.2 while the Department of Education recorded the lowest at 12.8 per cent. The Department of Education had the highest percentage of recurrent expenditure to its recurrent budget at 100 per cent while the Department of Youth and Sports had the lowest at 71.7 per cent.
3.15.9 Key Observations and RecommendationsThe County has made progress in addressing some of the challenges previously identified as affecting budget implementation. Some of the progress made included:
i. Improved performance of own-source revenue collection. At the end of the period under review, the County had collected Kshs.432.64 million representing 100.6 per cent of the annual target of Kshs.430 million.
ii. Establishment of Internal Audit Committee in compliance to Section 155 (5) of the PFM Act, 2012.iii. Improvement in the administration and reporting on the established funds in line with Section 116
and 168 of the PFM Act , 2012.
Despite the above progress, the following challenges continued to hamper effective budget implementation;
1. A high wage bill that increased by 1.2 per cent from Kshs.2.62 billion in FY 2017/18 to Kshs.2.65 billion in the reporting period. The wage bill accounted for 51.3 per cent of total expenditure in the reporting period.
2. Delay in disbursement of the equitable share of revenue raised nationally by the National Treasury.3. High expenditure on foreign and domestic travel, which increased by 7.8 per cent from Kshs.155.15
million in FY 2017/18 to Kshs.167.21 million in the reporting period.
The County should implement the following measures in order to improve budget execution;
1. The County Public Service Board should develop an optimal staffing structure and devise strategies
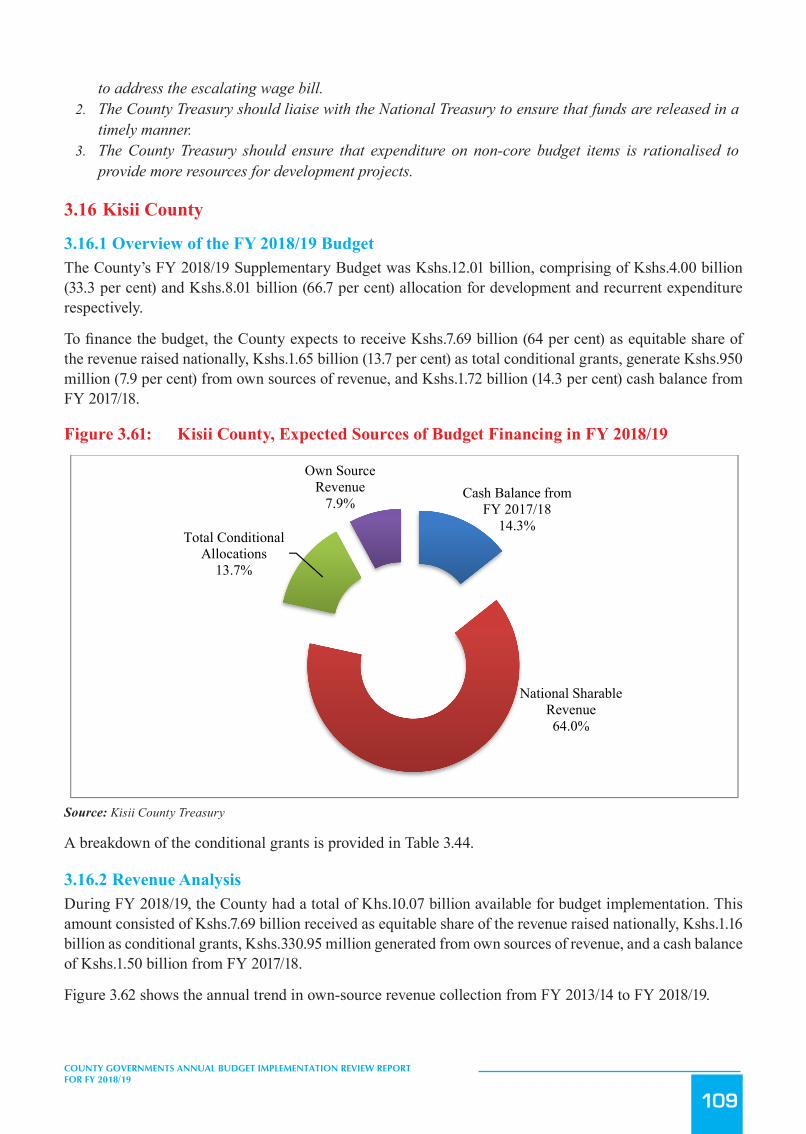
109
COUNTY GOVERNMENTS ANNUAL BUDGET IMPLEMENTATION REVIEW REPORT FOR FY 2018/19
to address the escalating wage bill.2. The County Treasury should liaise with the National Treasury to ensure that funds are released in a
timely manner.3. The County Treasury should ensure that expenditure on non-core budget items is rationalised to
provide more resources for development projects.
3.16 Kisii County
3.16.1 Overview of the FY 2018/19 BudgetThe County’s FY 2018/19 Supplementary Budget was Kshs.12.01 billion, comprising of Kshs.4.00 billion (33.3 per cent) and Kshs.8.01 billion (66.7 per cent) allocation for development and recurrent expenditure respectively.
To finance the budget, the County expects to receive Kshs.7.69 billion (64 per cent) as equitable share of the revenue raised nationally, Kshs.1.65 billion (13.7 per cent) as total conditional grants, generate Kshs.950 million (7.9 per cent) from own sources of revenue, and Kshs.1.72 billion (14.3 per cent) cash balance from FY 2017/18.
Figure 3.61: Kisii County, Expected Sources of Budget Financing in FY 2018/19
148
3. The County Treasury should ensure that expenditure on non-core budget items is rationalised to provide more
resources for development projects.
3.16 Kisii County
3.16.1 Overview of the FY 2018/19 Budget The County’s FY 2018/19 Supplementary Budget was Kshs.12.01 billion, comprising of Kshs.4.00 billion (33.3 per
cent) and Kshs.8.01 billion (66.7 per cent) allocation for development and recurrent expenditure respectively.
To finance the budget, the County expects to receive Kshs.7.69 billion (64 per cent) as equitable share of the revenue
raised nationally, Kshs.1.65 billion (13.7 per cent) as total conditional grants, generate Kshs.950 million (7.9 per cent)
from own sources of revenue, and Kshs.1.72 billion (14.3 per cent) cash balance from FY 2017/18.
Figure 3.61: Kisii County, Expected Sources of Budget Financing in FY 2018/19
Source: Kisii County Treasury
A breakdown of the conditional grants is provided in Table 3.44.
3.16.2 Revenue Analysis During FY 2018/19, the County had a total of Khs.10.07 billion available for budget implementation. This amount
consisted of Kshs.7.69 billion received as equitable share of the revenue raised nationally, Kshs.1.16 billion as
conditional grants, Kshs.330.95 million generated from own sources of revenue, and a cash balance of Kshs.1.50 billion
from FY 2017/18.
Figure 3.62 shows the annual trend in own-source revenue collection from FY 2013/14 to FY 2018/19.
Figure 3.62: Kisii County, Own Source Revenue Collection for FY 2013/14 to FY 2018/19
Cash Balance from FY 2017/18
14.3%
National Sharable Revenue64.0%
Total Conditional Allocations
13.7%
Own Source Revenue
7.9%
Source: Kisii County Treasury
A breakdown of the conditional grants is provided in Table 3.44.
3.16.2 Revenue AnalysisDuring FY 2018/19, the County had a total of Khs.10.07 billion available for budget implementation. This amount consisted of Kshs.7.69 billion received as equitable share of the revenue raised nationally, Kshs.1.16 billion as conditional grants, Kshs.330.95 million generated from own sources of revenue, and a cash balance of Kshs.1.50 billion from FY 2017/18.
Figure 3.62 shows the annual trend in own-source revenue collection from FY 2013/14 to FY 2018/19.

110
COUNTY GOVERNMENTS ANNUAL BUDGET IMPLEMENTATION REVIEW REPORT FOR FY 2018/19
Figure 3.62: Kisii County, Own Source Revenue Collection for FY 2013/14 to FY 2018/19
149
Source: Kisii County Treasury
The County generated a total of Kshs.330.95 million from own revenue sources in FY 2018/19. This amount
represented an increase of Kshs.74.66 million compared to that realised in FY 2017/18 and was 34.8 per cent of the
annual target.
3.16.3 Conditional Grants During the reporting period, the County received Kshs.1.16 billion as conditional grants as shown in Table 3.44.
Table 3.44: Kisii County, Conditional Grants/Loans Received in the FY 2018/19
S/No Grant Details
Annual Allocation-CARA, 2018) (Kshs)
Annual Budget Allocation (Kshs)
Receipts in FY 2018/19 (Kshs)
Receipts as Percentage of Annual Budget Allocation (%)
1 Grant to Level-5 Hospital 417,572,254 417,572,254 417,572,254 100
2 Road Maintenance Fuel Levy 203,376,725 203,376,725 203,376,725 100
3 Leasing of Medical Equipment 200,000,000 200,000,000 - -
4 IDA (World Bank) credit: Kenya Devolution Support Programme (KDSP) 53,938,093 180,384,638 126,446,545 70.1
5 IDA (World Bank) -Kenya Urban Support Project (KUSP) 164,053,800 164,053,800 164,053,800 100
6 World Bank Loan for National Agricultural & Rural Inclusive Project 140,435,163 140,435,163 50,000,000 35.6
7 World Bank Loan for Transforming Health System for universal Care Project 74,159,514 74,159,514 36,746,947 49.6
8 Development of Youth Polytechnics 70,090,000 70,090,000 52,917,950 75.5
9 EU Grant- Instruments for Devolution Advice and Support- IDEAS) 70,000,000 70,000,000 48,161,217 68.8
250.22
296.77 306.13
271.64256.28
330.95
0
50
100
150
200
250
300
350
FY 2013/14 FY 2014/15 FY 2015/16 FY 2016/17 FY 2017/18 FY 2018/19
Kshs
. Mill
ions
Trend in Own Source Revenue
Source: Kisii County Treasury
The County generated a total of Kshs.330.95 million from own revenue sources in FY 2018/19. This amount represented an increase of Kshs.74.66 million compared to that realised in FY 2017/18 and was 34.8 per cent of the annual target.
3.16.3 Conditional GrantsDuring the reporting period, the County received Kshs.1.16 billion as conditional grants as shown in Table 3.44.
Table 3.44: Kisii County, Conditional Grants/Loans Received in the FY 2018/19
S/No Grant DetailsAnnual Allo-
cation-CARA, 2018)(Kshs)
Annual Budget Allocation (Kshs)
Receipts in FY 2018/19 (Kshs)
Receipts as Percent-age of Annual Budget
Allocation (%)
1 Grant to Level-5 Hospital 417,572,254 417,572,254 417,572,254 100
2 Road Maintenance Fuel Levy 203,376,725 203,376,725 203,376,725 100
3 Leasing of Medical Equipment 200,000,000 200,000,000 - -
4 IDA (World Bank) credit: Kenya Devolution Support Pro-gramme (KDSP) 53,938,093 180,384,638 126,446,545 70.1
5 IDA (World Bank) -Kenya Urban Support Project (KUSP) 164,053,800 164,053,800 164,053,800 100
6 World Bank Loan for National Agricultural & Rural In-clusive Project 140,435,163 140,435,163 50,000,000 35.6
7 World Bank Loan for Transforming Health System for universal Care Project 74,159,514 74,159,514 36,746,947 49.6
8 Development of Youth Polytechnics 70,090,000 70,090,000 52,917,950 75.5
9 EU Grant- Instruments for Devolution Advice and Sup-port- IDEAS) 70,000,000 70,000,000 48,161,217 68.8
10IDA (World Bank) credit: Kenya Urban Support Project (KUSP) - Urban Institutional Grants (UIG) + Bal C/F in FY 2017/18
41,200,000 41,200,000 - -
11 DANIDA Grant 24,907,500 36,171,944 24,907,500 68.9
12 Compensation for User Fee Foregone 26,138,997 26,138,997 26,138,997 100
13 Sweden - Agriculture Sector Development Support Pro-gramme (ASDSP) II + Bal C/F in FY 2017/18 22,011,311 22,011,311 8,013,827 36.4
Total 1,507,883,357 1,645,594,346 1,158,335,762 70.4
Source: Kisii County Treasury
111
COUNTY GOVERNMENTS ANNUAL BUDGET IMPLEMENTATION REVIEW REPORT FOR FY 2018/19
During the reporting period, receipts from the Grant to Kisii Level-5 Hospital, Road Maintenance Fuel Levy, IDA (World Bank) -Kenya Urban Support Project (KUSP), and Compensation for User Fee Foregone conditional grant recorded the highest performance in percentage terms, and accounted 100 per cent of the respective annual targets.
3.16.4 Exchequer IssuesIn order to implement the budget, the Controller of Budget approved withdrawal of Kshs.9.89 billion from the CRF account. The withdrawals represented 82.3 per cent of the Approved Supplementary Budget and translated to an increase of 14.5 per cent from Kshs.8.64 billion in FY 2017/18 and comprised of Kshs.2.60 billion (26.3 per cent) towards development activities and Kshs.7.29 billion (73.7 per cent) for recurrent expenditure.
3.16.5 Overall Expenditure ReviewA total of Kshs.9.56 billion was spent on both development and recurrent activities. This expenditure represented 96.7 per cent of the total funds released from the CRF account, and was an increase of 11.4 per cent from Kshs.8.58 billion spent in FY 2017/18.
The expenditure excluded pending bills as at June 30, 2019 which amounted to Kshs.852.77 million for development activities and Kshs.89.77 million for recurrent costs.
Expenditure on development programmes amounted to Kshs.2.29 billion while Kshs.7.28 billion was spent on recurrent activities. The development expenditure was 87.8 per cent of the funds released for development programmes, while recurrent expenditure was 99.8 per cent of funds released for recurrent activities.
Development expenditure recorded an absorption rate of 57.2 per cent, which was an increase from 56.5 per cent attained in FY 2017/18. Conversely, recurrent expenditure represented 90.8 per cent of the annual recurrent budget, an increase from 88.7 per cent recorded in FY 2017/18.
Figure 3.63 presents a comparison between the total expenditure in FY 2018/19 and FY 2017/18.

112
COUNTY GOVERNMENTS ANNUAL BUDGET IMPLEMENTATION REVIEW REPORT FOR FY 2018/19
Figure3.63: KisiiCounty,ExpenditurebyEconomicClassification
151
Source: Kisii County Treasury
3.16.6 Development Expenditure Analysis
The total development expenditure of Kshs.2.29 billion represented 57.2 per cent of the annual development
expenditure estimates of Kshs.4.0 billion. Table 3.45 provides a summary of development projects with the highest
expenditure in the financial year.
Table 3.45: Kisii County, List of Development Projects with the Highest Expenditure in FY 2018/19
S/No. Project Name Project Location Project Budget
Project Expenditure in FY 2018/19 (Kshs.)
Absorption Rate (%)
1 Upgrade of Marani Level 4 Hospital Marani 96,000,000 31,537,876 32.9
2 Supply and Delivery of Brand New Fire Truck Vehicles(10,000 Litres And 5,000 litres) Kisii Town 72,600,000 36,000,000 49.6
3 Delivery of Drilling Rig plus Test Pumping Unit complete with its Accessories & Tools
County Headquarter 60,000,000 60,000,000 100.0
4 Mother – Child Hospital Kisii Level 6 Hospital 51,019,422 50,660,016 99.3
5 Hire of Machinery & Equipment County Headquarters 50,822,581 49,200,000 96.8
6 Completion of Gusii Stadium Kisii Town 49,452,681 47,440,153 95.9
7 Purchase of Medical Equipment Kisii Level 6 Hospital 48,337,476 48,337,476 100.0
8 Purchasing of Assorted Medical Equipment Kisii Level 6 Hospital 35,630,000 35,630,000 100.0
9 Supply & Installation of Computer Networking & Software Upgrade
Kisii Level 6 Hospital 33,000,000 32,998,569 100.0
10 Supply, Delivery & Installation of Morgue / Pathology Equipment & Rehabilitation / Mechanical Works
Kisii Level 6 Hospital 31,000,000 31,000,000 100.0
Source: Kisii County Treasury
4,755.35(55.4%)
1,926.40(22.4%)
1,901.23(22.2%)
4,970.08(52%)
2,306.20(24.1)
2,285.49(23.9%)
-
1,000
2,000
3,000
4,000
5,000
6,000
Personnel Emoluments Operations and Maintenance Development Expenditure
Ksh
s.Mill
ion
Expenditure by Economic Classification
FY 2017/18
FY 2018/19
Key
Source: Kisii County Treasury
3.16.6 Development Expenditure AnalysisThe total development expenditure of Kshs.2.29 billion represented 57.2 per cent of the annual development expenditure estimates of Kshs.4.0 billion. Table 3.45 provides a summary of development projects with the highest expenditure in the financial year.
Table 3.45: Kisii County, List of Development Projects with the Highest Expenditure in FY 2018/19
S/No. Project Name Project Location Project BudgetProject
Expenditure in FY 2018/19 (Kshs.)
Absorption Rate (%)
1 Upgrade of Marani Level 4 Hospital Marani 96,000,000 31,537,876 32.9
2 Supply and Delivery of Brand New Fire Truck Vehi-cles(10,000 Litres And 5,000 litres) Kisii Town 72,600,000 36,000,000 49.6
3 Delivery of Drilling Rig plus Test Pumping Unit complete with its Accessories & Tools County Headquarter 60,000,000 60,000,000 100.0
4 Mother – Child Hospital Kisii Level 6 Hospital 51,019,422 50,660,016 99.3
5 Hire of Machinery & Equipment County Headquarters 50,822,581 49,200,000 96.8
6 Completion of Gusii Stadium Kisii Town 49,452,681 47,440,153 95.9
7 Purchase of Medical Equipment Kisii Level 6 Hospital 48,337,476 48,337,476 100.0
8 Purchasing of Assorted Medical Equipment Kisii Level 6 Hospital 35,630,000 35,630,000 100.0
9 Supply & Installation of Computer Networking & Software Upgrade Kisii Level 6 Hospital 33,000,000 32,998,569 100.0
10 Supply, Delivery & Installation of Morgue / Patholo-gy Equipment & Rehabilitation / Mechanical Works Kisii Level 6 Hospital 31,000,000 31,000,000 100.0
Source: Kisii County Treasury
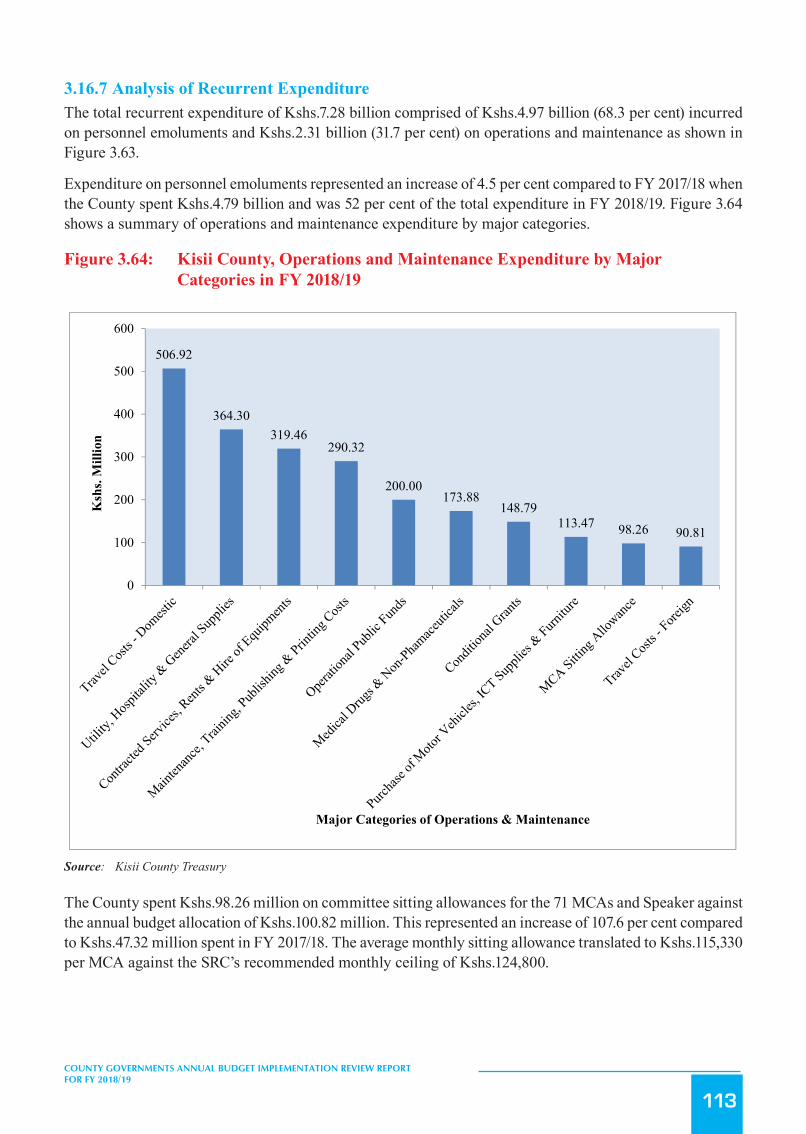
113
COUNTY GOVERNMENTS ANNUAL BUDGET IMPLEMENTATION REVIEW REPORT FOR FY 2018/19
3.16.7 Analysis of Recurrent ExpenditureThe total recurrent expenditure of Kshs.7.28 billion comprised of Kshs.4.97 billion (68.3 per cent) incurred on personnel emoluments and Kshs.2.31 billion (31.7 per cent) on operations and maintenance as shown in Figure 3.63.
Expenditure on personnel emoluments represented an increase of 4.5 per cent compared to FY 2017/18 when the County spent Kshs.4.79 billion and was 52 per cent of the total expenditure in FY 2018/19. Figure 3.64 shows a summary of operations and maintenance expenditure by major categories.
Figure 3.64: Kisii County, Operations and Maintenance Expenditure by Major Categories in FY 2018/19
152
3.16.7 Analysis of Recurrent Expenditure The total recurrent expenditure of Kshs.7.28 billion comprised of Kshs.4.97 billion (68.3 per cent) incurred on personnel
emoluments and Kshs.2.31 billion (31.7 per cent) on operations and maintenance as shown in Figure 3.63.
Expenditure on personnel emoluments represented an increase of 4.5 per cent compared to FY 2017/18 when the
County spent Kshs.4.79 billion and was 52 per cent of the total expenditure in FY 2018/19. Figure 3.64 shows a
summary of operations and maintenance expenditure by major categories.
Figure 3.64: Kisii County, Operations and Maintenance Expenditure by Major Categories in FY 2018/19
Source: Kisii County Treasury
The County spent Kshs.98.26 million on committee sitting allowances for the 71 MCAs and Speaker against the annual
budget allocation of Kshs.100.82 million. This represented an increase of 107.6 per cent compared to Kshs.47.32
million spent in FY 2017/18. The average monthly sitting allowance translated to Kshs.115,330 per MCA against the
SRC’s recommended monthly ceiling of Kshs.124,800.
Expenditure on domestic and foreign travel amounted to Kshs.597.73 million, and comprised of Kshs.135.86 million
spent by the County Assembly and Kshs.461.87 million by the County Executive. This expenditure represented 8.2 per
cent of total recurrent expenditure and was an increase of 23.1 per cent compared to Kshs.485.60 million spent in FY
2017/18.
506.92
364.30319.46
290.32
200.00173.88
148.79113.47 98.26 90.81
0
100
200
300
400
500
600
Ksh
s. M
illio
n
Major Categories of Operations & Maintenance
Source: Kisii County Treasury
The County spent Kshs.98.26 million on committee sitting allowances for the 71 MCAs and Speaker against the annual budget allocation of Kshs.100.82 million. This represented an increase of 107.6 per cent compared to Kshs.47.32 million spent in FY 2017/18. The average monthly sitting allowance translated to Kshs.115,330 per MCA against the SRC’s recommended monthly ceiling of Kshs.124,800.
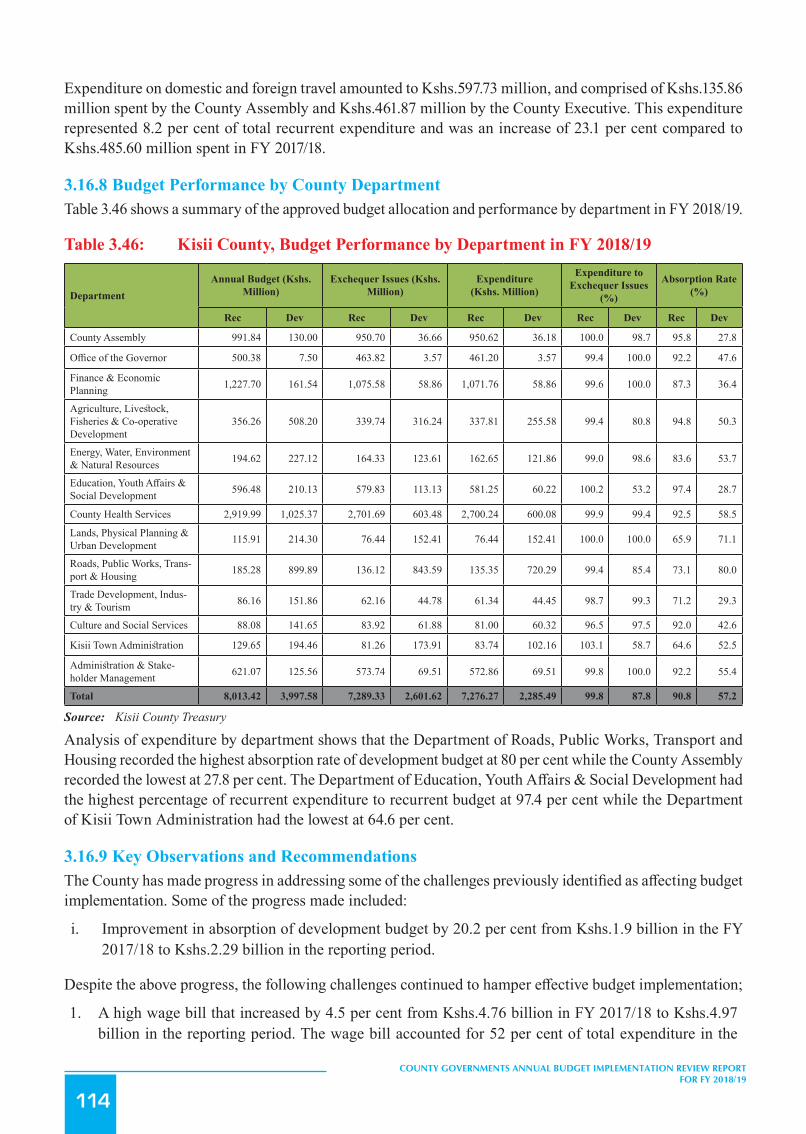
114
COUNTY GOVERNMENTS ANNUAL BUDGET IMPLEMENTATION REVIEW REPORT FOR FY 2018/19
Expenditure on domestic and foreign travel amounted to Kshs.597.73 million, and comprised of Kshs.135.86 million spent by the County Assembly and Kshs.461.87 million by the County Executive. This expenditure represented 8.2 per cent of total recurrent expenditure and was an increase of 23.1 per cent compared to Kshs.485.60 million spent in FY 2017/18.
3.16.8 Budget Performance by County DepartmentTable 3.46 shows a summary of the approved budget allocation and performance by department in FY 2018/19.
Table 3.46: Kisii County, Budget Performance by Department in FY 2018/19
DepartmentAnnual Budget (Kshs.
Million)Exchequer Issues (Kshs.
Million)Expenditure
(Kshs. Million)
Expenditure to Exchequer Issues
(%)
Absorption Rate (%)
Rec Dev Rec Dev Rec Dev Rec Dev Rec Dev
County Assembly 991.84 130.00 950.70 36.66 950.62 36.18 100.0 98.7 95.8 27.8
Office of the Governor 500.38 7.50 463.82 3.57 461.20 3.57 99.4 100.0 92.2 47.6
Finance & Economic Planning 1,227.70 161.54 1,075.58 58.86 1,071.76 58.86 99.6 100.0 87.3 36.4
Agriculture, Livestock, Fisheries & Co-operative Development
356.26 508.20 339.74 316.24 337.81 255.58 99.4 80.8 94.8 50.3
Energy, Water, Environment & Natural Resources 194.62 227.12 164.33 123.61 162.65 121.86 99.0 98.6 83.6 53.7
Education, Youth Affairs & Social Development 596.48 210.13 579.83 113.13 581.25 60.22 100.2 53.2 97.4 28.7
County Health Services 2,919.99 1,025.37 2,701.69 603.48 2,700.24 600.08 99.9 99.4 92.5 58.5
Lands, Physical Planning & Urban Development 115.91 214.30 76.44 152.41 76.44 152.41 100.0 100.0 65.9 71.1
Roads, Public Works, Trans-port & Housing 185.28 899.89 136.12 843.59 135.35 720.29 99.4 85.4 73.1 80.0
Trade Development, Indus-try & Tourism 86.16 151.86 62.16 44.78 61.34 44.45 98.7 99.3 71.2 29.3
Culture and Social Services 88.08 141.65 83.92 61.88 81.00 60.32 96.5 97.5 92.0 42.6
Kisii Town Administration 129.65 194.46 81.26 173.91 83.74 102.16 103.1 58.7 64.6 52.5
Administration & Stake-holder Management 621.07 125.56 573.74 69.51 572.86 69.51 99.8 100.0 92.2 55.4
Total 8,013.42 3,997.58 7,289.33 2,601.62 7,276.27 2,285.49 99.8 87.8 90.8 57.2
Source: Kisii County Treasury
Analysis of expenditure by department shows that the Department of Roads, Public Works, Transport and Housing recorded the highest absorption rate of development budget at 80 per cent while the County Assembly recorded the lowest at 27.8 per cent. The Department of Education, Youth Affairs & Social Development had the highest percentage of recurrent expenditure to recurrent budget at 97.4 per cent while the Department of Kisii Town Administration had the lowest at 64.6 per cent.
3.16.9 Key Observations and RecommendationsThe County has made progress in addressing some of the challenges previously identified as affecting budget implementation. Some of the progress made included:
i. Improvement in absorption of development budget by 20.2 per cent from Kshs.1.9 billion in the FY 2017/18 to Kshs.2.29 billion in the reporting period.
Despite the above progress, the following challenges continued to hamper effective budget implementation;
1. A high wage bill that increased by 4.5 per cent from Kshs.4.76 billion in FY 2017/18 to Kshs.4.97 billion in the reporting period. The wage bill accounted for 52 per cent of total expenditure in the
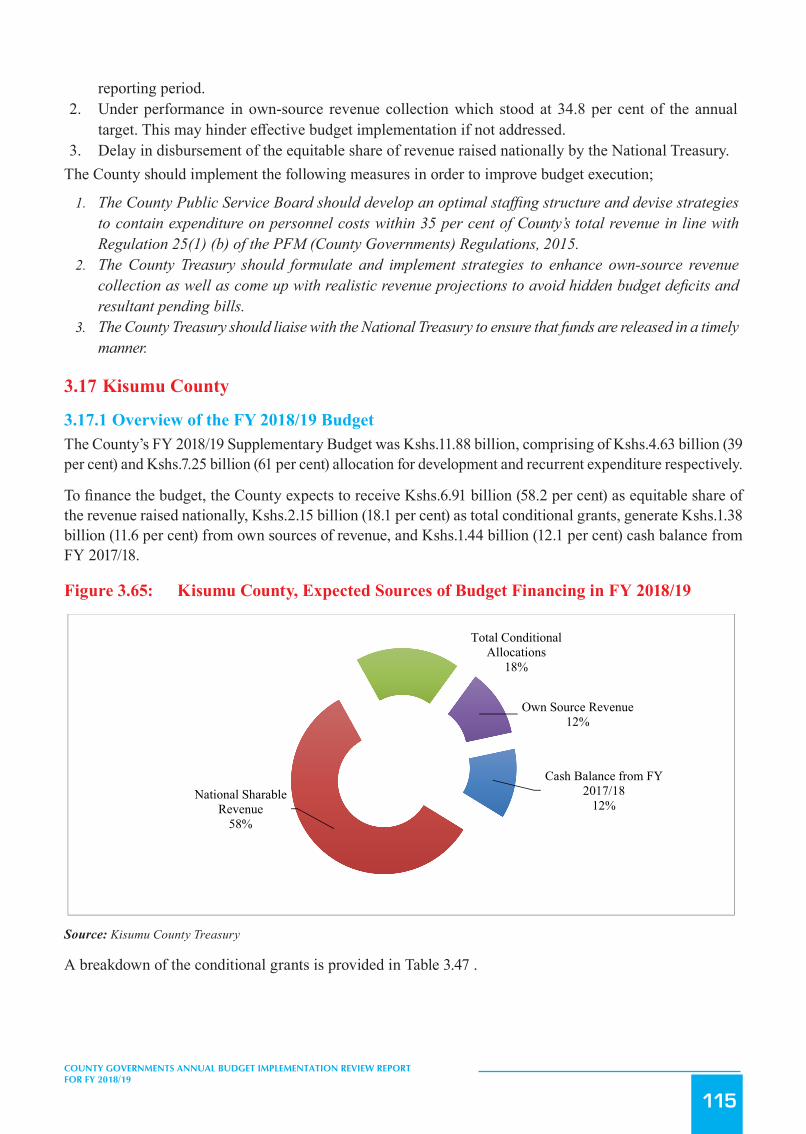
115
COUNTY GOVERNMENTS ANNUAL BUDGET IMPLEMENTATION REVIEW REPORT FOR FY 2018/19
reporting period.2. Under performance in own-source revenue collection which stood at 34.8 per cent of the annual
target. This may hinder effective budget implementation if not addressed.3. Delay in disbursement of the equitable share of revenue raised nationally by the National Treasury.
The County should implement the following measures in order to improve budget execution;
1. The County Public Service Board should develop an optimal staffing structure and devise strategies to contain expenditure on personnel costs within 35 per cent of County’s total revenue in line with Regulation 25(1) (b) of the PFM (County Governments) Regulations, 2015.
2. The County Treasury should formulate and implement strategies to enhance own-source revenue collection as well as come up with realistic revenue projections to avoid hidden budget deficits and resultant pending bills.
3. The County Treasury should liaise with the National Treasury to ensure that funds are released in a timely manner.
3.17 Kisumu County
3.17.1 Overview of the FY 2018/19 BudgetThe County’s FY 2018/19 Supplementary Budget was Kshs.11.88 billion, comprising of Kshs.4.63 billion (39 per cent) and Kshs.7.25 billion (61 per cent) allocation for development and recurrent expenditure respectively.
To finance the budget, the County expects to receive Kshs.6.91 billion (58.2 per cent) as equitable share of the revenue raised nationally, Kshs.2.15 billion (18.1 per cent) as total conditional grants, generate Kshs.1.38 billion (11.6 per cent) from own sources of revenue, and Kshs.1.44 billion (12.1 per cent) cash balance from FY 2017/18.
Figure 3.65: Kisumu County, Expected Sources of Budget Financing in FY 2018/19
154
3. Delay in disbursement of the equitable share of revenue raised nationally by the National Treasury.
The County should implement the following measures in order to improve budget execution;
1. The County Public Service Board should develop an optimal staffing structure and devise strategies to contain
expenditure on personnel costs within 35 per cent of County’s total revenue in line with Regulation 25(1) (b) of the
PFM (County Governments) Regulations, 2015.
2. The County Treasury should formulate and implement strategies to enhance own-source revenue collection as well
as come up with realistic revenue projections to avoid hidden budget deficits and resultant pending bills.
3. The County Treasury should liaise with the National Treasury to ensure that funds are released in a timely manner.
3.17 Kisumu County
3.17.1 Overview of the FY 2018/19 Budget The County’s FY 2018/19 Supplementary Budget was Kshs.11.88 billion, comprising of Kshs.7.25 billion (61 per cent)
and Kshs.4.63 billion (39 per cent) allocation for recurrent and development expenditure respectively.
To finance the budget, the County expects to receive Kshs.6.91 billion (58.2 per cent) as equitable share of the revenue
raised nationally, Kshs.2.15 billion (18.1 per cent) as total conditional grants, generate Kshs.1.38 billion (11.6 per
cent) from own sources of revenue, and Kshs.1.44 billion (12.1 per cent) cash balance from FY 2017/18.
Figure 3.65: Kisumu County Expected Sources of Budget Financing in FY 2018/19
Source: Kisumu County Treasury
A breakdown of the conditional grants is provided in Table 3.47 .
3.17.2 Revenue Analysis During FY 2018/19, the County had a total of Khs.10.87 billion available for budget implementation. This amount
consisted of Kshs.6.91 billion received as equitable share of the revenue raised nationally, Kshs.1.68 billion as
conditional grants, Kshs.842.82 million generated from own sources of revenue, and a cash balance of Kshs.1.44 billion
from FY 2017/18.
Figure 3.66 shows the annual trend in own-source revenue collection from FY 2013/14 to FY 2018/19.
Cash Balance from FY 2017/18
12%National Sharable
Revenue58%
Total Conditional Allocations
18%
Own Source Revenue12%
Source: Kisumu County Treasury
A breakdown of the conditional grants is provided in Table 3.47 .

116
COUNTY GOVERNMENTS ANNUAL BUDGET IMPLEMENTATION REVIEW REPORT FOR FY 2018/19
3.17.2 Revenue AnalysisDuring FY 2018/19, the County had a total of Khs.10.87 billion available for budget implementation. This amount consisted of Kshs.6.91 billion received as equitable share of the revenue raised nationally, Kshs.1.68 billion as conditional grants, Kshs.842.82 million generated from own sources of revenue, and a cash balance of Kshs.1.44 billion from FY 2017/18.
Figure 3.66 shows the annual trend in own-source revenue collection from FY 2013/14 to FY 2018/19.
Figure 3.66: Kisumu County, Own Source Revenue Collection for FY 2013/14 to FY 2018/19
155
Figure 3.66: Kisumu County, Own Source Revenue Collection for FY 2013/14 to FY 2018/19
Source: Kisumu County Treasury
The County generated a total of Kshs.841.82 million from own revenue sources in FY 2018/19. This amount
represented a decrease of Kshs.32.09 million compared to that realised in FY 2017/18 and was 61 per cent of the annual
target.
3.17.3 Conditional Grants During the reporting period, the County received Kshs.1.68 billion as conditional grants as shown in Table 3.47.
Table 3.47: Kisumu County, Conditional Grants/Loans Received in the FY 2018/19
S/No Grants
Annual CARA, 2018 Allocation (in Kshs)
Annual Budget Allocation (in Kshs)
Actual receipts in the FY 2018/19 (in Kshs.)
Actual Receipts as Percentage of Annual Allocation (%)
1
World Bank credit for Kenya Urban Support Project (KUSP) 773,573,300 773,573,300 773,573,300 100
2 Conditional Grant to Level 5 Hospital 369,017,341 369,017,341 369,017,341 100
3 Universal Health Coverage 274,576,632 274,576,632 132,164,132 48.1
4
Conditional Allocation from the Road Maintenance Fuel Levy Fund 181,881,624 181,881,624 179,467,760 98.7
5
World Bank Grant for Kenya Climate Smart Agriculture Project (KCSAP) 117,000,000 117,000,000 39,654,018 33.9
6
EU Grant for Instrument for Devolution Advice & Support (IDEAS) 90,000,000 90,000,000 58,304,401 64.8
7
EU - Water Tower and Protection Climate Change Mitigation and Adaptive Programme (WATER) 80,000,000 80,000,000 - -
8
World Bank credit for Transforming Health Systems for Universal Care Project 67,364,355 67,364,355 28,263,789 42.0
9
World Bank credit for Kenya Devolution Support Project (KDSP) - Level 1 49,642,674 49,642,674 - -
10
Conditional Allocation for Rehabilitation of Youth Polytechnics 41,650,000 41,650,000 31,445,750 75.5
621.86
970.90 978.89 1,004.04
874.90 842.82
0
200
400
600
800
1,000
1,200
FY 2013/14 FY 2014/15 FY 2015/16 FY 2016/17 FY 2017/18 FY 2018/19
Ksh
s. M
illio
ns
Trend in Own Source Revenue
Source: Kisumu County Treasury
The County generated a total of Kshs.842.82 million from own revenue sources in FY 2018/19. This amount represented a decrease of Kshs.32.09 million compared to that realised in FY 2017/18 and was 61 per cent of the annual target.
3.17.3 Conditional GrantsDuring the reporting period, the County received Kshs.1.68 billion as conditional grants as shown in Table 3.47.
Table 3.47: Kisumu County, Conditional Grants/Loans Received in the FY 2018/19
S/No Grants Annual CARA, 2018 Allocation (in Kshs)
Annual Budget Alloca-tion (in Kshs)
Actual receipts in the FY 2018/19 (in
Kshs.)
Actual Receipts as Percentage of Annual Alloca-
tion (%)
1 World Bank credit for Kenya Urban Support Pro-ject (KUSP) 773,573,300 773,573,300 773,573,300 100
2 Conditional Grant to Level 5 Hospital 369,017,341 369,017,341 369,017,341 100
3 Universal Health Coverage 274,576,632 274,576,632 132,164,132 48.1
4 Conditional Allocation from the Road Mainte-nance Fuel Levy Fund 181,881,624 181,881,624 179,467,760 98.7
5 World Bank Grant for Kenya Climate Smart Agri-culture Project (KCSAP) 117,000,000 117,000,000 39,654,018 33.9
6 EU Grant for Instrument for Devolution Advice & Support (IDEAS) 90,000,000 90,000,000 58,304,401 64.8

117
COUNTY GOVERNMENTS ANNUAL BUDGET IMPLEMENTATION REVIEW REPORT FOR FY 2018/19
S/No Grants Annual CARA, 2018 Allocation (in Kshs)
Annual Budget Alloca-tion (in Kshs)
Actual receipts in the FY 2018/19 (in
Kshs.)
Actual Receipts as Percentage of Annual Alloca-
tion (%)
7 EU - Water Tower and Protection Climate Change Mitigation and Adaptive Programme (WATER) 80,000,000 80,000,000 - -
8 World Bank credit for Transforming Health Sys-tems for Universal Care Project 67,364,355 67,364,355 28,263,789 42.0
9 World Bank credit for Kenya Devolution Support Project (KDSP) - Level 1 49,642,674 49,642,674 - -
10 Conditional Allocation for Rehabilitation of Youth Polytechnics 41,650,000 41,650,000 31,445,750 75.5
11 IDA (World Bank) credit - Kenya Urban Support Project (KUSP) Urban Institution Grants 41,200,000 41,200,000 41,200,000 100
12 DANIDA grant - Universal Healthcare for De-volved System Program 21,971,250 21,971,250 21,971,250 100
13 Conditional Allocation to support abolishment of user fees in health centres and dispensaries 21,299,489 21,299,489 - -
14 Sweden Agricultural Sector Development Support Program (ASDSP) 19,953,472 19,953,472 7,264,613 36.4
Total 2,149,130,137 2,149,130,137 1,682,326,354 78.3
Source: Kisumu County Treasury
During the reporting period, receipts from World Bank credit for Kenya Urban Support Project (KUSP), Conditional grant to Level 5 Hospital, IDA (World Bank) credit - Kenya Urban Support Project (KUSP) Urban Institution Grants, and DANIDA grant recorded the highest performance in percentage terms, and accounted for 100 per cent of the annual target respectively.
3.17.4 Exchequer IssuesIn order to implement the budget, the Controller of Budget approved withdrawal of Kshs.10.36 billion from the CRF account. The withdrawals represented 87.3 per cent of the Approved Supplementary Budget and translated to an increase of 41.2 per cent from Kshs.7.34 billion in FY 2017/18 and comprised of Kshs.7.15 billion (69 per cent) towards development activities and Kshs.3.21 billion (31 per cent) for recurrent expenditure.
3.17.5 Overall Expenditure ReviewA total of Kshs.8.38 billion was spent on both development and recurrent activities. This expenditure represented 80.8 per cent of the total funds released from the CRF account, and was an increase of 30.4 per cent from Kshs.6.43 billion spent in FY 2017/18. The expenditure excluded pending bills as at June 30, 2019 which amounted to Kshs.933.60 million for development activities and Kshs.742.79 million for recurrent costs.
Expenditure on development programmes amounted to Kshs.2.68 billion while Kshs.5.7 billion was spent on recurrent activities. The development expenditure was 83.3 per cent of the funds released for development programmes, while recurrent expenditure was 79.7 per cent of funds released for recurrent activities.
Development expenditure recorded an absorption rate of 57.8 per cent, which was an increase from 23.7 per cent attained in FY 2017/18. Conversely, recurrent expenditure represented 78.7 per cent of the annual recurrent budget, a decrease from 90.3 per cent recorded in FY 2017/18.
Figure 3.67 presents a comparison between the total expenditure in FY 2018/19 and FY 2017/18.
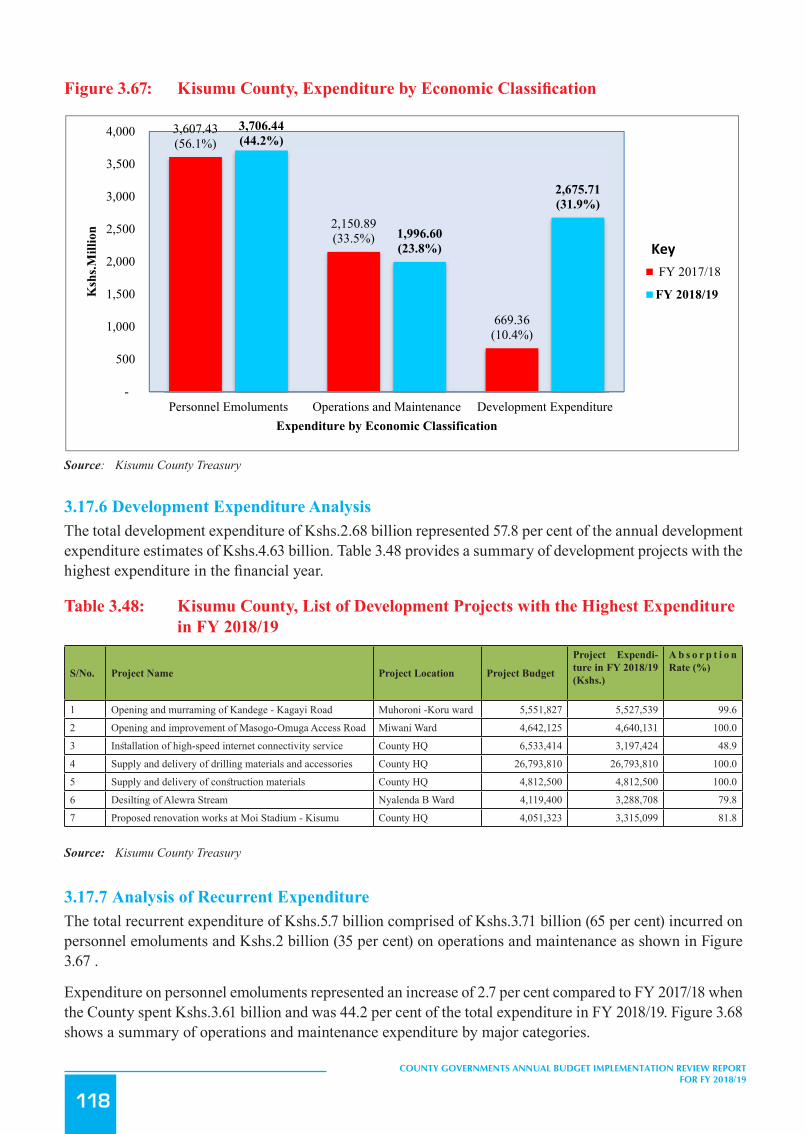
118
COUNTY GOVERNMENTS ANNUAL BUDGET IMPLEMENTATION REVIEW REPORT FOR FY 2018/19
Figure3.67: KisumuCounty,ExpenditurebyEconomicClassification
157
Source: Kisumu County Treasury
3.17.5 Development Expenditure Analysis
The total development expenditure of Kshs.2.68 billion represented 57.8 per cent of the annual development
expenditure estimates of Kshs.4.63 billion. Table 3.47 provides a summary of development projects with the highest
expenditure in the financial year.
Table 3.48: Kisumu County, List of Development Projects with the Highest Expenditure in FY 2018/19
S/No. Project Name Project Location Project
Budget
Project Expenditure in FY 2018/19 (Kshs.)
Absorption Rate (%)
1 Opening and murraming of Kandege - Kagayi Road Muhoroni -Koru ward 5,551,827 5,527,539 99.6
2 Opening and improvement of Masogo-Omuga Access Road Miwani Ward 4,642,125 4,640,131 100.0
3 Installation of high-speed internet connectivity service County HQ 6,533,414 3,197,424 48.9
4 Supply and delivery of drilling materials and accessories County HQ 26,793,810 26,793,810 100.0
5 Supply and delivery of construction materials County HQ 4,812,500 4,812,500 100.0
6 Desilting of Alewra Stream Nyalenda B Ward 4,119,400 3,288,708 79.8
7 Proposed renovation works at Moi Stadium - Kisumu County HQ 4,051,323 3,315,099 81.8
Source: Kisumu County Treasury
3.17.6 Analysis of Recurrent Expenditure The total recurrent expenditure of Kshs.5.7 billion comprised of Kshs.3.71 billion (65 per cent) incurred on personnel
emoluments and Kshs.2 billion (35 per cent) on operations and maintenance as shown in Figure 3.67 .
3,607.43(56.1%)
2,150.89(33.5%)
669.36(10.4%)
3,706.44(44.2%)
1,996.60(23.8%)
2,675.71(31.9%)
-
500
1,000
1,500
2,000
2,500
3,000
3,500
4,000
Personnel Emoluments Operations and Maintenance Development Expenditure
Ksh
s.Mill
ion
Expenditure by Economic Classification
FY 2017/18
FY 2018/19
Key
Source: Kisumu County Treasury
3.17.6 Development Expenditure AnalysisThe total development expenditure of Kshs.2.68 billion represented 57.8 per cent of the annual development expenditure estimates of Kshs.4.63 billion. Table 3.48 provides a summary of development projects with the highest expenditure in the financial year.
Table 3.48: Kisumu County, List of Development Projects with the Highest Expenditure in FY 2018/19
S/No. Project Name Project Location Project Budget
Project Expendi-ture in FY 2018/19 (Kshs.)
A b s o r p t i o n Rate (%)
1 Opening and murraming of Kandege - Kagayi Road Muhoroni -Koru ward 5,551,827 5,527,539 99.6
2 Opening and improvement of Masogo-Omuga Access Road Miwani Ward 4,642,125 4,640,131 100.0
3 Installation of high-speed internet connectivity service County HQ 6,533,414 3,197,424 48.9
4 Supply and delivery of drilling materials and accessories County HQ 26,793,810 26,793,810 100.0
5 Supply and delivery of construction materials County HQ 4,812,500 4,812,500 100.0
6 Desilting of Alewra Stream Nyalenda B Ward 4,119,400 3,288,708 79.8
7 Proposed renovation works at Moi Stadium - Kisumu County HQ 4,051,323 3,315,099 81.8
Source: Kisumu County Treasury
3.17.7 Analysis of Recurrent ExpenditureThe total recurrent expenditure of Kshs.5.7 billion comprised of Kshs.3.71 billion (65 per cent) incurred on personnel emoluments and Kshs.2 billion (35 per cent) on operations and maintenance as shown in Figure 3.67 .
Expenditure on personnel emoluments represented an increase of 2.7 per cent compared to FY 2017/18 when the County spent Kshs.3.61 billion and was 44.2 per cent of the total expenditure in FY 2018/19. Figure 3.68 shows a summary of operations and maintenance expenditure by major categories.
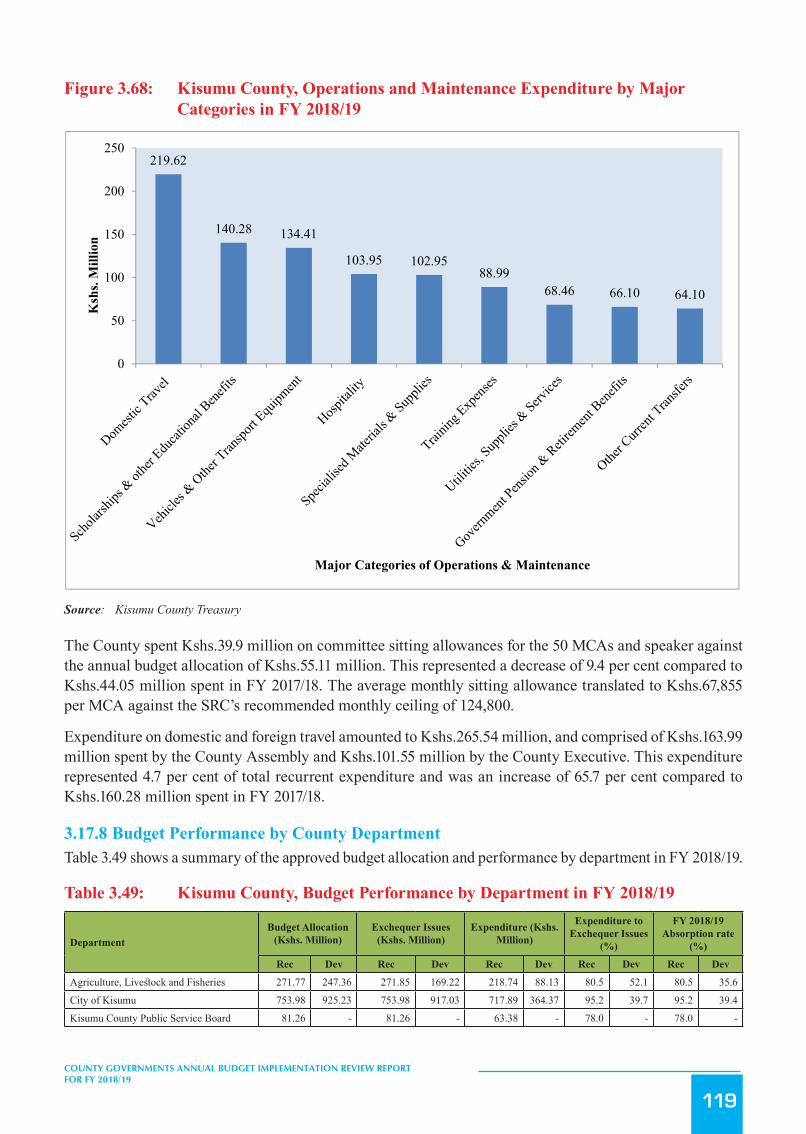
119
COUNTY GOVERNMENTS ANNUAL BUDGET IMPLEMENTATION REVIEW REPORT FOR FY 2018/19
Figure 3.68: Kisumu County, Operations and Maintenance Expenditure by Major Categories in FY 2018/19
158
Expenditure on personnel emoluments represented an increase of 2.7 per cent compared to FY 2017/18 when the
County spent Kshs.3.61 billion and was 44.2 per cent of the total expenditure in FY 2018/19. Figure 3.68 shows a
summary of operations and maintenance expenditure by major categories.
Figure 3.68: Kisumu County, Operations and Maintenance Expenditure by Major Categories in FY 2018/19
Source: Kisumu County Treasury
The County spent Kshs.39.9 million on committee sitting allowances for the 50 MCAs and speaker against the annual
budget allocation of Kshs.55.11 million. This represented a decrease of 9.4 per cent compared to Kshs.44.05 million
spent in FY 2017/18. The average monthly sitting allowance translated to Kshs.67,855 per MCA against the SRC’s
recommended monthly ceiling of 124,800.
Expenditure on domestic and foreign travel amounted to Kshs.265.54 million, and comprised of Kshs.163.99 million
spent by the County Assembly and Kshs.101.55 million by the County Executive. This expenditure represented 4.7 per
cent of total recurrent expenditure and was an increase of 65.7 per cent compared to Kshs.160.28 million spent in FY
2017/18.
3.17.7 Budget Performance by County Department Table 3.49 shows a summary of the approved budget allocation and performance by department in FY 2018/19.
Table 3.49: Kisumu County, Budget Performance by Department in FY 2018/19
Department Budget Allocation (Kshs. Million)
Exchequer Issues (Kshs. Million)
Expenditure (Kshs. Million)
Expenditure to Exchequer
FY 2018/19 Absorption
219.62
140.28 134.41
103.95 102.9588.99
68.46 66.10 64.10
0
50
100
150
200
250
Ksh
s. M
illio
n
Major Categories of Operations & Maintenance
Source: Kisumu County Treasury
The County spent Kshs.39.9 million on committee sitting allowances for the 50 MCAs and speaker against the annual budget allocation of Kshs.55.11 million. This represented a decrease of 9.4 per cent compared to Kshs.44.05 million spent in FY 2017/18. The average monthly sitting allowance translated to Kshs.67,855 per MCA against the SRC’s recommended monthly ceiling of 124,800.
Expenditure on domestic and foreign travel amounted to Kshs.265.54 million, and comprised of Kshs.163.99 million spent by the County Assembly and Kshs.101.55 million by the County Executive. This expenditure represented 4.7 per cent of total recurrent expenditure and was an increase of 65.7 per cent compared to Kshs.160.28 million spent in FY 2017/18.
3.17.8 Budget Performance by County DepartmentTable 3.49 shows a summary of the approved budget allocation and performance by department in FY 2018/19.
Table 3.49: Kisumu County, Budget Performance by Department in FY 2018/19
DepartmentBudget Allocation
(Kshs. Million)Exchequer Issues
(Kshs. Million)Expenditure (Kshs.
Million)
Expenditure to Exchequer Issues
(%)
FY 2018/19 Absorption rate
(%)
Rec Dev Rec Dev Rec Dev Rec Dev Rec Dev
Agriculture, Livestock and Fisheries 271.77 247.36 271.85 169.22 218.74 88.13 80.5 52.1 80.5 35.6
City of Kisumu 753.98 925.23 753.98 917.03 717.89 364.37 95.2 39.7 95.2 39.4
Kisumu County Public Service Board 81.26 - 81.26 - 63.38 - 78.0 - 78.0 -

120
COUNTY GOVERNMENTS ANNUAL BUDGET IMPLEMENTATION REVIEW REPORT FOR FY 2018/19
DepartmentBudget Allocation
(Kshs. Million)Exchequer Issues
(Kshs. Million)Expenditure (Kshs.
Million)
Expenditure to Exchequer Issues
(%)
FY 2018/19 Absorption rate
(%)
Rec Dev Rec Dev Rec Dev Rec Dev Rec Dev
Education, Gender, Youth, Human Re-source Development, ICT and Social Ser-vices
404.19 294.42 404.19 160.27 305.63 220.33 75.6 137.5 75.6 74.8
Office of the Governor and County Admin-istration 513.75 120.95 513.75 109.00 375.36 64.63 73.1 59.3 73.1 53.4
Health Services 3,101.94 401.86 3,008.48 166.00 2,400.19 115.24 79.8 69.4 77.4 28.7
Economic Planning 49.11 62.94 49.11 53.46 32.68 55.19 66.5 103.2 66.5 87.7
Tourism, Culture, Sports and Information 92.19 210.10 92.19 38.18 65.19 151.35 70.7 396.4 70.7 72
Roads, Transport and Public Works 190.10 539.80 190.10 260.59 131.15 447.36 69.0 171.7 69 82.9
Lands, Housing and Physical Planning 100.04 121.90 100.04 96.97 39.67 53.81 39.7 55.5 39.7 44.1
Business, Energy and Industry 123.08 371.52 123.08 167.46 75.22 155.70 61.1 93 61.1 41.9
Finance 733.54 963.68 733.54 815.08 538.86 831.55 73.5 102 73.5 86.3
Water, Environment and Natural Resources 146.67 318.60 146.67 257.99 113.64 128.06 77.5 49.6 77.5 40.2
County Assembly 684.80 50.76 684.80 - 625.45 - 91.3 - 91.3 -
Total 7,246 4,629 7,153 3,211 5,703 2,676 79.7 83.3 78.7 57.8
Source: Kisumu County Treasury
Analysis of expenditure by department shows that the Department of Economic Planning recorded the highest absorption rate of development budget at 87.7 per cent while the County Assembly did not incur any development expenditure. The Department of City of Kisumu had the highest percentage of recurrent expenditure to recurrent budget at 95.2 per cent while the Department of Lands, Housing and Physical Planning had the lowest at 39.7 per cent.
3.17.9 Key Observations and RecommendationsThe County has made progress in addressing some of the challenges previously identified as affecting budget implementation. Some of the progress made included:
i. Improvement in absorption of development budget by 229.7 per cent from Kshs.669.36 million in FY 2017/18 to Kshs.2.68 billion in the reporting period.
Despite the above progress, the following challenges continued to hamper effective budget implementation;
1. Under-performance of own-source revenue collection. The County collected Kshs.842.82 million which was 61 per cent of the annual target of Kshs.1.38 billion in the reporting period.
2. Late submission of reports on financial and non-financial performance by the County Treasury, which affected timely preparation of budget implementation report. Section 166 of the PFM Act, 2012 requires the financial reports to be submitted by the 15th day after the end of each quarter.
3. A high wage bill that increased by 2.71 per cent from Kshs.3.61 billion in FY 2017/18 to Kshs.3.71 billion in the reporting period. The wage bill accounted for 44.2 per cent of total expenditure in the reporting period.
4. Delay in disbursement of equitable share of revenue raised nationally by the National Treasury.5. Failure by Fund Administrators to submit expenditure reports of all the County Established Funds
contrary to Section 168 of the PFM Act, 2012.6. Failure by the County to provide a complete report on execution of development projects during
the financial year. This is despite reporting development expenditure of Kshs.2.68 billion during the reporting period.
The County should implement the following measures in order to improve budget execution;

121
COUNTY GOVERNMENTS ANNUAL BUDGET IMPLEMENTATION REVIEW REPORT FOR FY 2018/19
1. The County Treasury should formulate and implement strategies to enhance own-source revenue collection.
2. The County Treasury should ensure timely preparation and submission of reports on financial and non-financial performance in line with Section 166 of PFM Act, 2012.
3. The County Public Service Board should develop an optimal staffing structure and devise strategies to contain expenditure on personnel costs within 35 per cent of County’s total revenue in line with Regulation 25(1) (b) of the PFM (County Governments) Regulations, 2015.
4. The County Treasury should liaise with the National Treasury to ensure that the funds are released in timely manner.
5. All Fund Administrators should ensure timely submission of expenditure reports in line with Section 168 of the PFM Act, 2012.
6. The County Treasury should provide complete report on development projects implemented in FY 2018/19 in line with Section 166 of the PFM Act, 2012.
3.18 Kitui County
3.18.1 Overview of the FY 2018/19 BudgetThe County’s FY 2018/19 Supplementary Budget was Kshs.11.69 billion, comprising of Kshs.4.63 billion (39.6 per cent) and Kshs.7.06 billion (60.4 per cent) allocation for development and recurrent expenditure respectively.
To finance the budget, the County expects to receive Kshs.8.73 billion (74.7 per cent) as equitable share of the revenue raised nationally, Kshs.1.22 billion (10.4 per cent) as total conditional grants, generate Kshs.797.99 million (6.8 per cent) from own sources of revenue, and Kshs.941.22 million (8.1 per cent) cash balance from FY 2017/18.
Figure 3.69: Kitui County, Expected Sources of Budget Financing in FY 2018/19
160
1. The County Treasury should formulate and implement strategies to enhance own-source revenue collection.
2. The County Treasury should ensure timely preparation and submission of reports on f inancial and
non - f inancial performance in line with Section 166 of PFM Act, 2012.
3. The County Public Service Board should develop an optimal staffing structure and devise strategies to
contain expenditure on personnel costs within 35 per cent of County’s total revenue in line with Regulation
25(1) (b) of the PFM (County Governments) Regulations, 2015.
4. The County Treasury should liaise with the National Treasury to ensure that the funds are released in timely
manner.
5. All Fund Administrators should ensure timely submission of expenditure reports in line with Section 168 of
the PFM Act, 2012.
6. The County Treasury should provide complete report on development projects implemented in FY 2018/19 in
line with Section 166 of the PFM Act, 2012.
3.18 Kitui County
3.18.1 Overview of the FY 2018/19 Budget The County’s FY 2018/19 Supplementary Budget was Kshs.11.69 billion, comprising of Kshs.4.63 billion (39.6 per
cent) and Kshs.7.06 billion (60.4 per cent) allocation for development and recurrent expenditure respectively.
To finance the budget, the County expects to receive Kshs.8.73 billion (74.7 per cent) as equitable share of the revenue
raised nationally, Kshs.1.22 billion (10.4 per cent) as total conditional grants, generate Kshs.797.99 million (6.8 per
cent) from own sources of revenue, and Kshs.941.22 million (8.1 per cent) cash balance from FY 2017/18.
Figure 3.69: Kitui County Expected Sources of Budget Financing in FY 2018/19
Source: Kitui county Treasury
A breakdown of the conditional grants is provided in Table 3.50.
3.18.2 Revenue Analysis During FY 2018/19, the County had a total of Khs.10.84 billion available for budget implementation. This amount
consisted of Kshs.8.73 billion received as equitable share of the revenue raised nationally, Kshs.725.16 million as
Cash Balance from FY 2017/18
8.1%
National Sharable Revenue74.7%
Total Conditional Allocations
10.4% Own Source Revenue
6.8%
Source: Kitui county Treasury
A breakdown of the conditional grants is provided in Table 3.50.
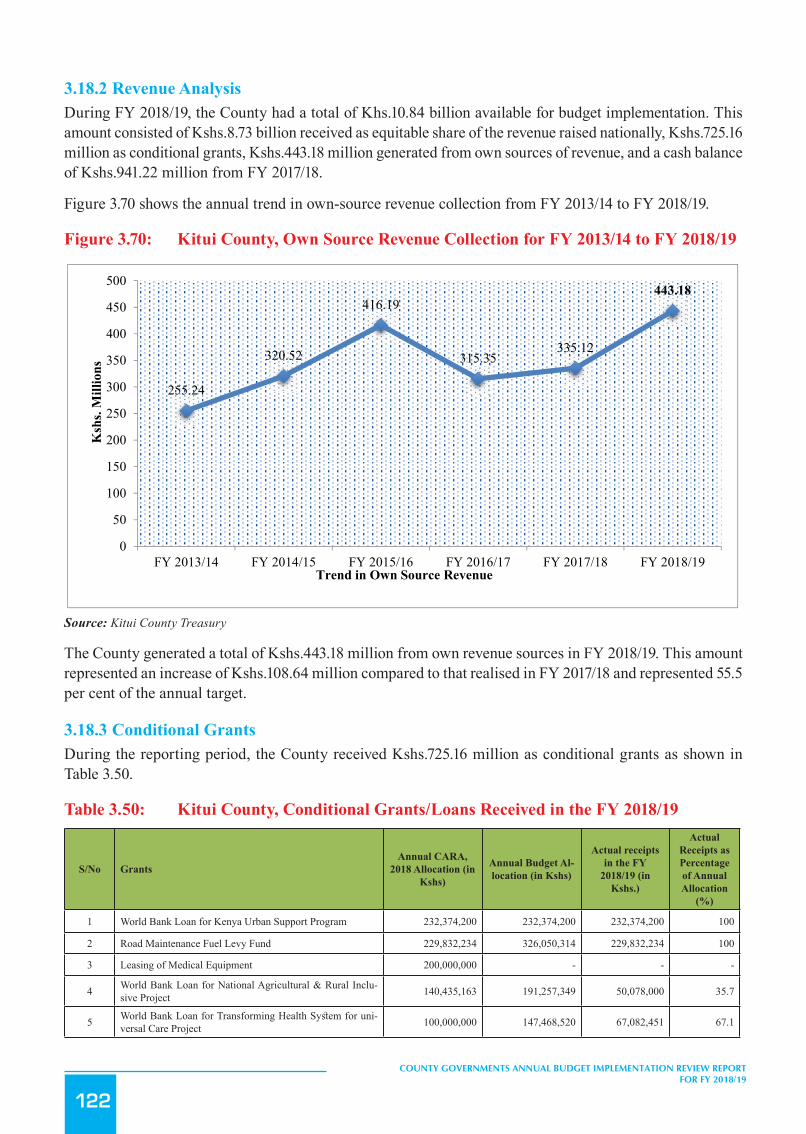
122
COUNTY GOVERNMENTS ANNUAL BUDGET IMPLEMENTATION REVIEW REPORT FOR FY 2018/19
3.18.2 Revenue AnalysisDuring FY 2018/19, the County had a total of Khs.10.84 billion available for budget implementation. This amount consisted of Kshs.8.73 billion received as equitable share of the revenue raised nationally, Kshs.725.16 million as conditional grants, Kshs.443.18 million generated from own sources of revenue, and a cash balance of Kshs.941.22 million from FY 2017/18.
Figure 3.70 shows the annual trend in own-source revenue collection from FY 2013/14 to FY 2018/19.
Figure 3.70: Kitui County, Own Source Revenue Collection for FY 2013/14 to FY 2018/19
161
conditional grants, Kshs.443.18 million generated from own sources of revenue, and a cash balance of Kshs.941.22
million from FY 2017/18.
Figure 3.70 shows the annual trend in own-source revenue collection from FY 2013/14 to FY 2018/19.
Figure 3.70: Kitui County, Own Source Revenue Collection for FY 2013/14 to FY 2018/19
Source: Kitui County Treasury
The County generated a total of Kshs.443.18 million from own revenue sources in FY 2018/19. This amount
represented an increase of Kshs.108.64 million compared to that realised in FY 2017/18 and represented 55.5 per cent of
the annual target.
3.18.3 Conditional Grants During the reporting period, the County received Kshs.725.16 million as conditional grants as shown in Table 3.50.
Table 3.50: Kitui County, Conditional Grants/Loans Received in the FY 2018/19
S/No Grants Annual CARA, 2018 Allocation (in Kshs)
Annual Budget Allocation (in Kshs)
Actual receipts in the FY 2018/19 (in Kshs.)
Actual Receipts as Percentage of Annual Allocation (%)
1 World Bank Loan for Kenya Urban Support Program 232,374,200 232,374,200 232,374,200 100
2 Road Maintenance Fuel Levy Fund 229,832,234 326,050,314 229,832,234 100
3 Leasing of Medical Equipment 200,000,000 - - -
4 World Bank Loan for National Agricultural & Rural Inclusive Project 140,435,163 191,257,349 50,078,000 35.7
5 World Bank Loan for Transforming Health System for universal Care Project 100,000,000 147,468,520 67,082,451 67.1
255.24
320.52
416.19
315.35335.12
443.18
0
50
100
150
200
250
300
350
400
450
500
FY 2013/14 FY 2014/15 FY 2015/16 FY 2016/17 FY 2017/18 FY 2018/19
Ksh
s. M
illio
ns
Trend in Own Source Revenue
Source: Kitui County Treasury
The County generated a total of Kshs.443.18 million from own revenue sources in FY 2018/19. This amount represented an increase of Kshs.108.64 million compared to that realised in FY 2017/18 and represented 55.5 per cent of the annual target.
3.18.3 Conditional GrantsDuring the reporting period, the County received Kshs.725.16 million as conditional grants as shown in Table 3.50.
Table 3.50: Kitui County, Conditional Grants/Loans Received in the FY 2018/19
S/No GrantsAnnual CARA,
2018 Allocation (in Kshs)
Annual Budget Al-location (in Kshs)
Actual receipts in the FY
2018/19 (in Kshs.)
Actual Receipts as Percentage of Annual Allocation
(%)
1 World Bank Loan for Kenya Urban Support Program 232,374,200 232,374,200 232,374,200 100
2 Road Maintenance Fuel Levy Fund 229,832,234 326,050,314 229,832,234 100
3 Leasing of Medical Equipment 200,000,000 - - -
4 World Bank Loan for National Agricultural & Rural Inclu-sive Project 140,435,163 191,257,349 50,078,000 35.7
5 World Bank Loan for Transforming Health System for uni-versal Care Project 100,000,000 147,468,520 67,082,451 67.1

123
COUNTY GOVERNMENTS ANNUAL BUDGET IMPLEMENTATION REVIEW REPORT FOR FY 2018/19
S/No GrantsAnnual CARA,
2018 Allocation (in Kshs)
Annual Budget Al-location (in Kshs)
Actual receipts in the FY
2018/19 (in Kshs.)
Actual Receipts as Percentage of Annual Allocation
(%)
6 Development of Youth Polytechnics 58,465,000 126,041,636 44,141,075 75.5
7 Kenya Devolution Support Programme (KDSP) 57,462,594 65,054,392 - -
8 Kenya Urban Support Project - urban institutional grant 41,200,000 41,200,000 41,200,000 100
9 DANIDA Grant 29,008,125 33,824,572 29,008,125 100
10 Agriculture Sector Development Support Programme (ASD-SP) 24,573,008 24,573,008 8,946,484 36.4
11 Compensation for User Fee Foregone 22,499,905 22,499,906 22,499,906 100
12 FAO Support Vaccination Program - 9,925,960 - -
Sub Total 1,135,850,229 1,220,269,857 725,162,475 63.8
Source: Kitui County Treasury
During the reporting period, receipts from the Kenya Urban Support Program, Road Maintenance Fuel levy fund, Urban Institutional Grants, DANIDA grant, and Compensation for User Fees Foregone recorded the highest performance in percentage terms, and accounted for 100 per cent of the annual target respectively.
3.18.4 Exchequer IssuesIn order to implement the budget, the Controller of Budget approved withdrawal of Kshs.10.29 billion from the CRF account. The withdrawals represented 88 per cent of the Approved Supplementary Budget and translated to an increase of 4.9 per cent from Kshs.9.81 billion in FY 2017/18, and comprised of Kshs.3.37 billion (32.8 per cent) towards development activities and Kshs.6.92 billion (67.2 per cent) for recurrent expenditure.
3.18.5 Overall Expenditure ReviewA total of Kshs.9.87 billion was spent on both development and recurrent activities. This expenditure represented 95.9 per cent of the total funds released from the CRF account, and was an increase of 9.32 per cent from Kshs.9.32 billion spent in FY 2017/18.
The expenditure excluded pending bills as at June 30, 2019 which amounted to Kshs.936.16 million for development activities and Kshs.230.93 million for recurrent costs.
Expenditure on development programmes amounted to Kshs.3.30 billion while Kshs.6.56 billion was spent on recurrent activities. The development expenditure was 98.1 per cent of the funds released for development programmes, while recurrent expenditure was 94.8 per cent of funds released for recurrent activities.
Development expenditure recorded an absorption rate of 71.4 per cent, which was a decrease from 73.4 per cent attained in FY 2017/18. Conversely, recurrent expenditure represented 92.9 per cent of the annual recurrent budget, an increase from 89.4 per cent recorded in FY 2017/18.
Figure 3.71 presents a comparison between the total expenditure in FY 2018/19 and FY 2017/18.
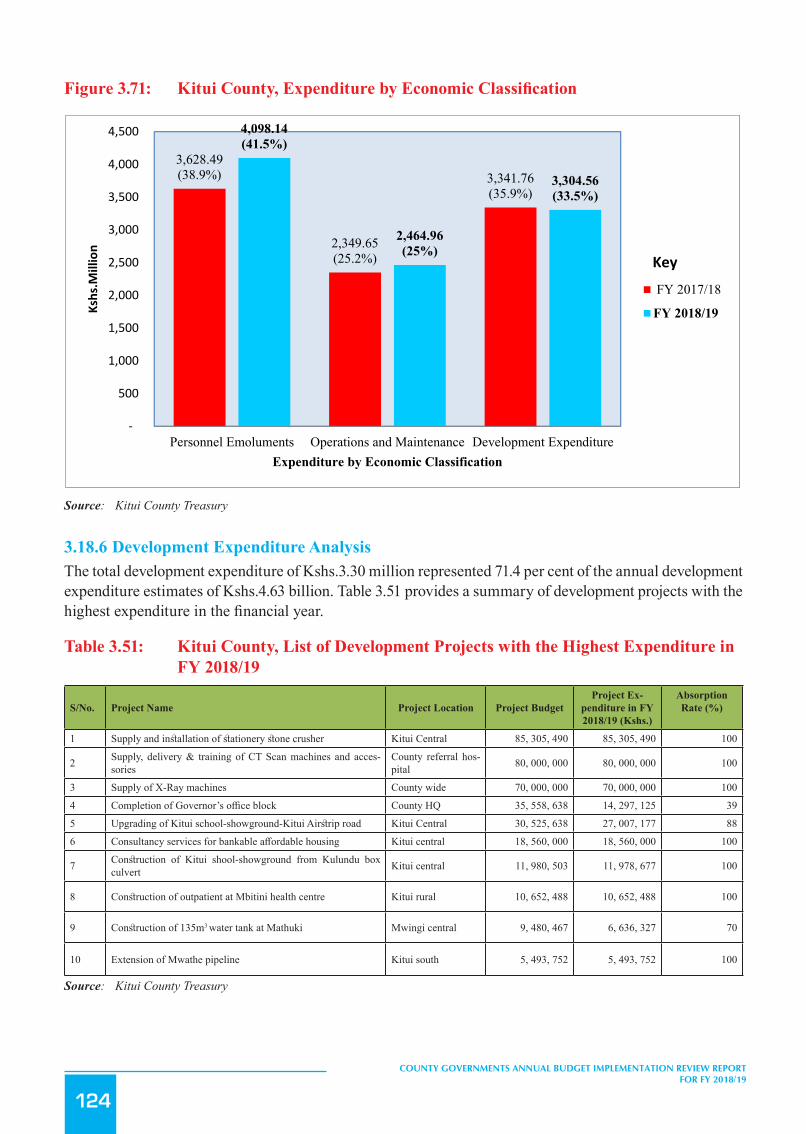
124
COUNTY GOVERNMENTS ANNUAL BUDGET IMPLEMENTATION REVIEW REPORT FOR FY 2018/19
Figure3.71: KituiCounty,ExpenditurebyEconomicClassification
163
Figure 3.71: Kitui County, Expenditure by Economic Classification
Source: Kitui County Treasury
3.18.5 Development Expenditure Analysis The total development expenditure of Kshs.3.30 million represented 71.4 per cent of the annual development
expenditure estimates of Kshs.4.62 billion. Table 3.51 provides a summary of development projects with the highest
expenditure in the financial year.
Table 3.51: Kitui County, List of Development Projects with the Highest Expenditure in FY 2018/19
S/No.
Project Name Project Location Project Budget
Project Expenditure in FY 2018/19 (Kshs.)
Absorption Rate (%)
1 Supply and installation of stationery stone crusher Kitui Central 85, 305, 490 85, 305, 490 100
2 Supply, delivery & training of CT Scan machines and accessories County referral hospital 80, 000, 000 80, 000, 000 100
3 Supply of X-Ray machines County wide 70, 000, 000 70, 000, 000 100
4 Completion of Governor’s office block County HQ 35, 558, 638 14, 297, 125 39
5 Upgrading of Kitui school-showground-Kitui Airstrip road Kitui Central 30, 525, 638 27, 007, 177 88
6 Consultancy services for bankable affordable housing Kitui central 18, 560, 000 18, 560, 000 100
7 Construction of Kitui shool-showground from Kulundu box culvert Kitui central 11, 980, 503 11, 978, 677 100
8 Construction of outpatient at Mbitini health centre Kitui rural 10, 652, 488 10, 652, 488 100
9 Construction of 135m3 water tank at Mathuki Mwingi central 9, 480, 467 6, 636, 327 70
10 Extension of Mwathe pipeline Kitui south 5, 493, 752 5, 493, 752 100
Source: Kitui County Treasury
3,628.49(38.9%)
2,349.65(25.2%)
3,341.76(35.9%)
4,098.14(41.5%)
2,464.96(25%)
3,304.56(33.5%)
‐
500
1,000
1,500
2,000
2,500
3,000
3,500
4,000
4,500
Personnel Emoluments Operations and Maintenance Development Expenditure
Kshs.M
illion
Expenditure by Economic Classification
FY 2017/18
FY 2018/19
Key
Source: Kitui County Treasury
3.18.6 Development Expenditure AnalysisThe total development expenditure of Kshs.3.30 million represented 71.4 per cent of the annual development expenditure estimates of Kshs.4.63 billion. Table 3.51 provides a summary of development projects with the highest expenditure in the financial year.
Table 3.51: Kitui County, List of Development Projects with the Highest Expenditure in FY 2018/19
S/No. Project Name Project Location Project BudgetProject Ex-
penditure in FY 2018/19 (Kshs.)
Absorption Rate (%)
1 Supply and installation of stationery stone crusher Kitui Central 85, 305, 490 85, 305, 490 100
2 Supply, delivery & training of CT Scan machines and acces-sories
County referral hos-pital 80, 000, 000 80, 000, 000 100
3 Supply of X-Ray machines County wide 70, 000, 000 70, 000, 000 100
4 Completion of Governor’s office block County HQ 35, 558, 638 14, 297, 125 39
5 Upgrading of Kitui school-showground-Kitui Airstrip road Kitui Central 30, 525, 638 27, 007, 177 88
6 Consultancy services for bankable affordable housing Kitui central 18, 560, 000 18, 560, 000 100
7 Construction of Kitui shool-showground from Kulundu box culvert Kitui central 11, 980, 503 11, 978, 677 100
8 Construction of outpatient at Mbitini health centre Kitui rural 10, 652, 488 10, 652, 488 100
9 Construction of 135m3 water tank at Mathuki Mwingi central 9, 480, 467 6, 636, 327 70
10 Extension of Mwathe pipeline Kitui south 5, 493, 752 5, 493, 752 100
Source: Kitui County Treasury

125
COUNTY GOVERNMENTS ANNUAL BUDGET IMPLEMENTATION REVIEW REPORT FOR FY 2018/19
3.18.7 Analysis of Recurrent ExpenditureThe total recurrent expenditure of Kshs.6.56 billion comprised of Kshs.4.10 billion (62.5 per cent) incurred on personnel emoluments and Kshs.2.46 billion (37.5 per cent) on operations and maintenance as shown in Figure 3.71.
Expenditure on personnel emoluments represented an increase of 12.9 per cent compared to FY 2017/18 when the County spent Kshs.3.62 billion and was 41.5 per cent of the total expenditure in FY 2018/19. Figure 3.72 shows a summary of operations and maintenance expenditure by major categories.
Figure 3.72: Kitui County, Operations and Maintenance Expenditure by Major Categories in FY 2018/19
164
3.18.6 Analysis of Recurrent Expenditure The total recurrent expenditure of Kshs.6.56 billion comprised of Kshs.4.10 billion (62.5 per cent) incurred on personnel
emoluments and Kshs.2.46 billion (37.5 per cent) on operations and maintenance as shown in Figure 3.71.
Expenditure on personnel emoluments represented an increase of 12.9 per cent compared to FY 2017/18 when the
County spent Kshs.3.62 billion and was 41.5 per cent of the total expenditure in FY 2018/19. Figure 3.72 shows a
summary of operations and maintenance expenditure by major categories.
Figure 3.72: Kitui County, Operations and Maintenance Expenditure by Major Categories in FY 2018/19
Source: Kitui County Treasury
The County spent Kshs.39.67 million on committee sitting allowances for the 54 MCAs and speaker against the annual
budget allocation of Kshs.45.12 million. This represented an increase of 132.1 per cent compared to Kshs.17.09 million
spent in a similar period of FY 2017/18. The average monthly sitting allowance translated to Kshs.61,226 per MCA
against the SRC’s recommended monthly ceiling of Kshs.124,800.
476.51
398.75
249.34
173.37151.49 138.11 134.87 134.79
105.85
39.67
0
100
200
300
400
500
600
Ksh
s. M
illio
n
Major Categories of Operations & Maintenance
Source: Kitui County Treasury
The County spent Kshs.39.67 million on committee sitting allowances for the 54 MCAs and speaker against the annual budget allocation of Kshs.45.12 million. This represented an increase of 132.1 per cent compared to Kshs.17.09 million spent in FY 2017/18. The average monthly sitting allowance translated to Kshs.61,226 per MCA against the SRC’s recommended monthly ceiling of Kshs.124,800.

126
COUNTY GOVERNMENTS ANNUAL BUDGET IMPLEMENTATION REVIEW REPORT FOR FY 2018/19
Expenditure on domestic and foreign travel amounted to Kshs.476.51 million, and comprised of Kshs.168.20 million spent by the County Assembly and Kshs.308.31 million by the County Executive. This expenditure represented 6.2 per cent of total recurrent expenditure and was a decrease of 1.9 per cent compared to Kshs.485.54 million spent in FY 2017/18.
3.18.8 Budget Performance by County DepartmentTable 3.52 shows a summary of the approved budget allocation and performance by department in FY 2018/19.
Table 3.52: Kitui County, Budget Performance by Department in FY 2018/19
DepartmentAnnual Budget Allo-cation (Kshs. Million)
Exchequer Issues (Kshs. Million)
Expenditure (Kshs. Million)
Expenditure to Exchequer Issues
(%)
Absorption Rate (%)
Rec Dev Rec Dev Rec Dev Rec Dev Rec Dev
Office of the Governor 577.94 795.87 576.33 528.90 528.54 459.30 91.7 86.8 91.5 57.7
Administration & Coordi-nation Of County Affairs 373 - 373.00 - 333.59 - 89.4 - 89.4 -
County Treasury 383.31 68.05 383.31 - 359.84 13.35 93.9 - 93.9 19.6
Health and Sanitation 2, 791.04 640.35 2, 788.7 475.58 2, 686 492.99 96.3 103.7 96.2 77
Basic Education, ICT & Youth development 537.47 204.84 537.47 108.90 513.22 65.36 95.5 60.0 95.5 31.9
Trade, Co-operatives and investments 101.61 263.89 101.61 225.10 90.41 185.68 89.0 82.5 89.0 70.4
Lands, Infrastructure, Housing and Urban Devel-opment.
353.85 757.16 353.85 585.12 350.21 754.54 99.0 129.0 99.0 99.7
Tourism, Sports and Culture 135.08 101.07 135.08 44.15 115.28 68.74 85.3 155.7 85.3 68
Agriculture, Water and Livestock Development 476.13 1, 251.11 476.13 1, 058.29 463.38 1, 033.32 97.3 97.6 97.3 82.6
Environment and Natural Resources 122.89 100.34 122.89 66.60 113.35 61.59 92.2 92.5 92.2 61.4
County Public Service Board 61.14 - 61.14 - 44.77 - 73.2 - 73.2 -
County Assembly 904.80 130 806.57 - 795.18 16.04 98.6 - 87.9 12.3
Kitui Town Administration 159.66 272.08 122.04 243.12 117.27 118.15 96.1 48.6 73.4 43.4
Mwingi Town Adminis-tration 81.99 44 81.99 32.69 52.06 35.51 63.5 108.6 63.5 80.7
Total 7, 059.91 4, 628.76 6, 920.11 3, 368.45 6, 563.10 3, 304.57 94.8 98.1 93.0 71.4
Source: Kitui County Treasury
Analysis of expenditure by department shows that the Department of Lands, Infrastructure, Housing and Urban Development recorded the highest absorption rate of development budget at 99.7 per cent while the County Assembly recorded the lowest at 12.3 per cent. The Department of Lands, Infrastructure, Housing and Urban Development had the highest percentage of recurrent expenditure to recurrent budget at 99 per cent while the Department of Mwingi Town Administration had the lowest at 63.5 per cent.
3.18.9 Key Observations and RecommendationsThe County has made progress in addressing some of the challenges previously identified as affecting budget implementation. Some of the progress made included:
i. Improvement in own source revenue collection by 32.2 per cent from Kshs.335.12 million in FY 2017/18 to Kshs.443.18 million in the reporting period.
ii. Improvement rationalised spending on non core activities resulting in reduction in expenditure on domestic and foreign travel by Kshs.9.03 million from Kshs.485.54 million in FY 2017/18 to

127
COUNTY GOVERNMENTS ANNUAL BUDGET IMPLEMENTATION REVIEW REPORT FOR FY 2018/19
Kshs.476.51 million in the reporting period.
Despite the above progress, the following challenges continued to hamper effective budget implementation;
1. A high wage bill that increased by 12.9 per cent from Kshs.3.63 billion in FY 2017/18 to Kshs.4.1 billion in the reporting period. The wage bill accounted for 41.5 per cent of total expenditure in the reporting period.
The County should implement the following measures in order to improve budget execution;
1. The County Public Service Board should develop an optimal staffing structure and devise strategies to contain expenditure on personnel costs within 35 per cent of County’s total revenue in line with Regulation 25(1) (b) of the PFM (County Governments) Regulations, 2015.
3.19 Kwale County
3.19.1 Overview of the FY 2018/19 BudgetThe County’s FY 2018/19 Supplementary Budget was Kshs.11.52 billion, comprising of Kshs.6.12 billion (53.1 per cent) and Kshs.5.40 billion (46.9 per cent) allocation for development and recurrent expenditure respectively.
To finance the budget, the County expects to receive Kshs.7.54 billion (65.4 per cent) as equitable share of revenue raised nationally, Kshs.1.46 billion (12.7 per cent) as total conditional grants, generate Kshs.303.11 million (2.6 per cent) from own revenue sources, and Kshs.2.22 billion (19.3 per cent) cash balance from FY 2017/18.
Figure 3.73: Kwale County, Expected Sources of Budget Financing in FY 2018/19
166
2. Reduction in expenditure on domestic and foreign travel by Kshs.9.03 million from Kshs.485.54 million in FY
2017/18 to Kshs.476.51 million in the reporting period.
Despite the above progress, the following challenges continued to hamper effective budget implementation;
1. A high wage bill that increased by 12.9 per cent from Kshs.3.63 billion in FY 2017/18 to Kshs.4.1 billion in the
reporting period. The wage bill accounted for 41.5 per cent of total expenditure in the reporting period.
The County should implement the following measures in order to improve budget execution;
1. The County Public Service Board should develop an optimal staffing structure and devise strategies to contain
expenditure on personnel costs within 35 per cent of County’s total revenue in line with Regulation 25(1) (b) of the
PFM (County Governments) Regulations, 2015.
3.19 Kwale County
3.19.1 Overview of the FY 2018/19 Budget The County’s FY 2018/19 second Supplementary Budget was Kshs.11.52 billion, comprising of Kshs.6.12 billion (53.1
per cent) and Kshs.5.40 billion (46.9 per cent) allocation for development and recurrent expenditure respectively.
To finance the budget, the County expects to receive Kshs.7.54 billion (65.4 per cent) as equitable share of revenue
raised nationally, Kshs.1.46 billion (12.7 per cent) as total conditional grants, generate Kshs.303.11 million (2.6 per
cent) from own revenue sources, and Kshs.2.22 billion (19.3 per cent) cash balance from FY 2017/18.
Figure 3.73: Kwale County, Expected Sources of Budget Financing in FY 2018/19
Source: Kwale County Treasury
A breakdown of the conditional grants is provided in Table 3.53.
3.19.2 Revenue Analysis During FY 2018/19, the County had a total of Khs.10.69 billion available for budget implementation. This amount
consisted of Kshs.7.54 billion received as equitable share of the revenue raised nationally, Kshs.526.86 million as
Cash Balance from FY 2017/1819.3%
National Sharable Revenue65.4%
Total Conditional Allocations
12.7%Own Source Revenue
2.6%
Source: Kwale County Treasury
A breakdown of the conditional grants is provided in Table 3.53.

128
COUNTY GOVERNMENTS ANNUAL BUDGET IMPLEMENTATION REVIEW REPORT FOR FY 2018/19
3.19.2 Revenue AnalysisDuring FY 2018/19, the County had a total of Khs.10.69 billion available for budget implementation. This amount consisted of Kshs.7.54 billion received as equitable share of the revenue raised nationally, Kshs.526.86 million as conditional grants, Kshs.315.03 million generated from own sources of revenue, and a cash balance of Kshs.2.22 billion from FY 2017/18.
Figure 3.74 shows the annual trend in own-source revenue collection from FY 2013/14 to FY 2018/19.
Figure 3.74: Kwale County, Own Source Revenue Collection for FY 2013/14 to FY 2018/19
167
conditional grants, Kshs.315.03 million generated from own sources of revenue, and a cash balance of Kshs.2.22 billion
from FY 2017/18.
Figure 3.74 shows the annual trend in own-source revenue collection from FY 2013/14 to FY 2018/19.
Figure 3.74: Kwale County, Own Source Revenue Collection for FY 2013/14 to FY 2018/19
Source: Kwale County Treasury
The County generated a total of Kshs.315.03 million from own revenue sources in FY 2018/19. This amount
represented an increase of Kshs.88.81 million compared to that realised in FY 2017/18 and was 103.9 per cent of the
annual target.
3.19.3 Conditional Grants During the reporting period, the County received Kshs.526.86 million as conditional grants and Kshs.50.03 million as
other grants as shown in Table 3.53.
Table 3.53: Kwale County, Conditional Grants/Loans Received in the FY 2018/19
S/No Grants Annual CARA, 2018 Allocation (in Kshs)
Annual Budget Allocation (in Kshs)
Actual receipts in the FY 2018/19
(in Kshs.)
Actual Receipts as
Percentage of Annual
Allocation (%)
A Grants Contained in the CARA, 2018
1 IDA (World Bank) - Water & Sanitation Development Project (WSDP) 400,000,000 400,000,000 - -
2 Leasing of Medical Equipment 200,000,000 200,000,000 - - 3 Road Maintenance Fuel Levy Fund 198,416,317 198,416,317 198,416,317 100
4 IDA (World Bank) -National Agricultural and Rural Inclusive Growth Project 140,435,163 197,545,018 50,078,476 35.7
5 World Bank-Transforming Health Systems for Universal Care Project 98,175,267 98,175,267 57,611,664 58.7
6 IDA (World Bank) Kenya Devolution Support Programme “Level 1 grant” 50,747,782 77,810,388 - -
208.50
253.91 248.62221.01 226.21
315.03
0
50
100
150
200
250
300
350
FY 2013/14 FY 2014/15 FY 2015/16 FY 2016/17 FY 2017/18 FY 2018/19
Ksh
s. M
illio
ns
Trend in Own Source Revenue
Source: Kwale County Treasury
The County generated a total of Kshs.315.03 million from own revenue sources in FY 2018/19. This amount represented an increase of Kshs.88.81 million compared to that realised in FY 2017/18 and was 103.9 per cent of the annual target.
3.19.3 Conditional GrantsDuring the reporting period, the County received Kshs.526.86 million as conditional grants and Kshs.50.03 million as other grants as shown in Table 3.53.
Table 3.53: Kwale County, Conditional Grants/Loans Received in the FY 2018/19
S/No GrantsAnnual CARA, 2018 Allocation
(in Kshs)
Annual Budget Allocation (in
Kshs)
Actual receipts in the FY
2018/19 (in Kshs.)
Actual Receipts as Percentage of Annu-
al Allocation (%)
A Grants Contained in the CARA, 2018
1 IDA (World Bank) - Water & Sanitation Development Project (WSDP) 400,000,000 400,000,000 - -
2 Leasing of Medical Equipment 200,000,000 200,000,000 - -
3 Road Maintenance Fuel Levy Fund 198,416,317 198,416,317 198,416,317 100
4 IDA (World Bank) -National Agricultural and Rural Inclusive Growth Project 140,435,163 197,545,018 50,078,476 35.7
5 World Bank-Transforming Health Systems for Univer-sal Care Project 98,175,267 98,175,267 57,611,664 58.7
6 IDA (World Bank) Kenya Devolution Support Pro-gramme “Level 1 grant” 50,747,782 77,810,388 - -
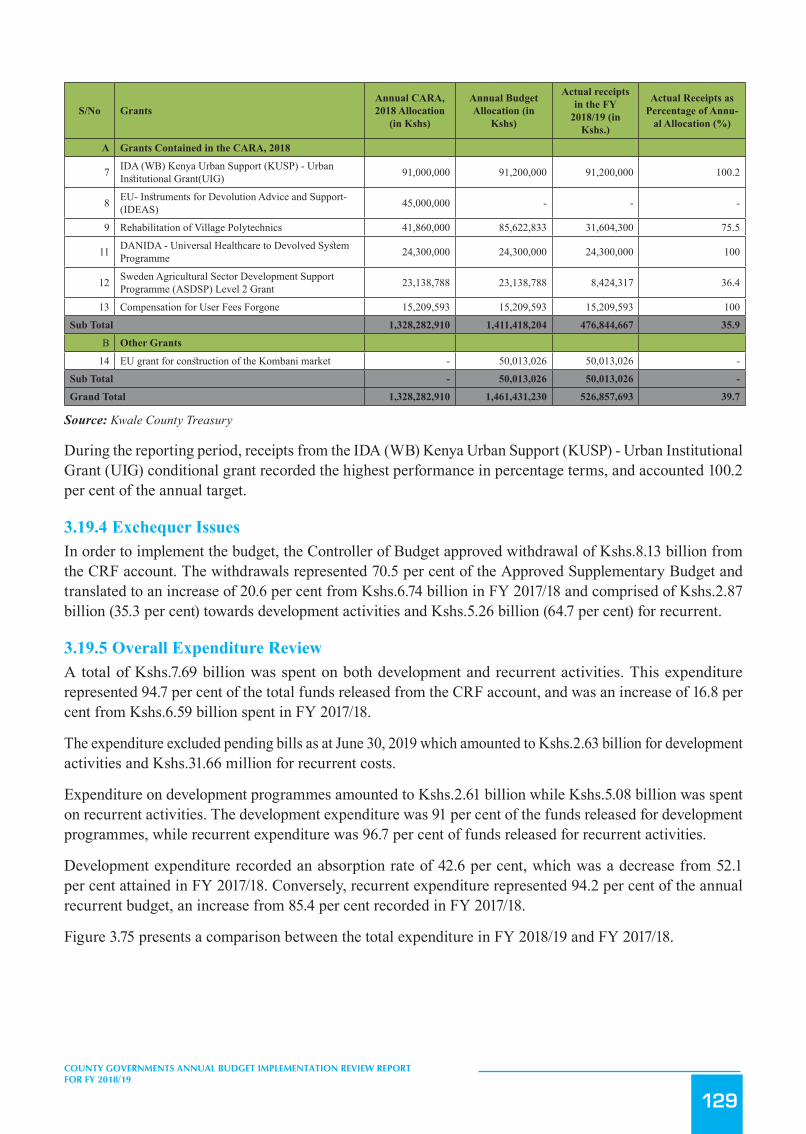
129
COUNTY GOVERNMENTS ANNUAL BUDGET IMPLEMENTATION REVIEW REPORT FOR FY 2018/19
S/No GrantsAnnual CARA, 2018 Allocation
(in Kshs)
Annual Budget Allocation (in
Kshs)
Actual receipts in the FY
2018/19 (in Kshs.)
Actual Receipts as Percentage of Annu-
al Allocation (%)
A Grants Contained in the CARA, 2018
7 IDA (WB) Kenya Urban Support (KUSP) - Urban Institutional Grant(UIG) 91,000,000 91,200,000 91,200,000 100.2
8 EU- Instruments for Devolution Advice and Support- (IDEAS) 45,000,000 - - -
9 Rehabilitation of Village Polytechnics 41,860,000 85,622,833 31,604,300 75.5
11 DANIDA - Universal Healthcare to Devolved System Programme 24,300,000 24,300,000 24,300,000 100
12 Sweden Agricultural Sector Development Support Programme (ASDSP) Level 2 Grant 23,138,788 23,138,788 8,424,317 36.4
13 Compensation for User Fees Forgone 15,209,593 15,209,593 15,209,593 100
Sub Total 1,328,282,910 1,411,418,204 476,844,667 35.9
B Other Grants
14 EU grant for construction of the Kombani market - 50,013,026 50,013,026 -
Sub Total - 50,013,026 50,013,026 -
Grand Total 1,328,282,910 1,461,431,230 526,857,693 39.7
Source: Kwale County Treasury
During the reporting period, receipts from the IDA (WB) Kenya Urban Support (KUSP) - Urban Institutional Grant (UIG) conditional grant recorded the highest performance in percentage terms, and accounted 100.2 per cent of the annual target.
3.19.4 Exchequer IssuesIn order to implement the budget, the Controller of Budget approved withdrawal of Kshs.8.13 billion from the CRF account. The withdrawals represented 70.5 per cent of the Approved Supplementary Budget and translated to an increase of 20.6 per cent from Kshs.6.74 billion in FY 2017/18 and comprised of Kshs.2.87 billion (35.3 per cent) towards development activities and Kshs.5.26 billion (64.7 per cent) for recurrent.
3.19.5 Overall Expenditure ReviewA total of Kshs.7.69 billion was spent on both development and recurrent activities. This expenditure represented 94.7 per cent of the total funds released from the CRF account, and was an increase of 16.8 per cent from Kshs.6.59 billion spent in FY 2017/18.
The expenditure excluded pending bills as at June 30, 2019 which amounted to Kshs.2.63 billion for development activities and Kshs.31.66 million for recurrent costs.
Expenditure on development programmes amounted to Kshs.2.61 billion while Kshs.5.08 billion was spent on recurrent activities. The development expenditure was 91 per cent of the funds released for development programmes, while recurrent expenditure was 96.7 per cent of funds released for recurrent activities.
Development expenditure recorded an absorption rate of 42.6 per cent, which was a decrease from 52.1 per cent attained in FY 2017/18. Conversely, recurrent expenditure represented 94.2 per cent of the annual recurrent budget, an increase from 85.4 per cent recorded in FY 2017/18.
Figure 3.75 presents a comparison between the total expenditure in FY 2018/19 and FY 2017/18.

130
COUNTY GOVERNMENTS ANNUAL BUDGET IMPLEMENTATION REVIEW REPORT FOR FY 2018/19
Figure3.75: KwaleCounty,ExpenditurebyEconomicClassification
169
Source: Kwale County Treasury
3.19.6 Development Expenditure Analysis The total development expenditure of Kshs.2.61 billion represented 42.6 per cent of the annual development budget
estimates of Kshs.6.12 billion. Table 3.54 provides a summary of development projects with the highest expenditure in
the financial year.
Table 3.54: Kwale County, List of Development Projects with the Highest Expenditure in FY 2018/19
S/No. Project Name Project Location
Project Budget (Kshs.)
FY2018/19 Project Expenditure (Kshs.)
Absorption rate (%)
1 Grant to Youth Polytechnics Kwale 85,622,833 70,770,000 82.7 2 Preparation of County Spatial Plan Kwale 98,455,290 67,909,761 69.0 3 Purchase of Certified Seeds & seedlings Kwale 27,600,000 27,600,000 100.0 4 Purchase of Graders/Shovel Kwale 28,000,000 26,967,000 96.3 5 Proposed improvement Marere Godoni pipeline Marere 45,000,000 22,272,000 49.5 6 Design & installation of fibre optic cable Kwale 18,396,057 18,396,056 100.0 7 Maternity complex wing Phase 2 Ramisi Ward 27,867,352 16,440,008 59.0 8 Purchase of Motorcycles Kwale 10,000,000 9,599,634 96.0 9 Rehab Centre perimeter wall Kombani 9,699,980 8,426,231 86.9
10 Construction of Kinango Biashara Centre Kinango 5,548,250 4,755,221 85.7
Source: Kwale County Treasury
3.19.7 Analysis of Recurrent Expenditure The total recurrent expenditure of Kshs.5.08 billion comprised of Kshs.2.84 billion (44.1 per cent) incurred on personnel
emoluments and Kshs.2.24 billion (55.9 per cent) on operations and maintenance as shown in Figure 3.75.
Expenditure on personnel emoluments represented an increase of 17.2 per cent compared to FY 2017/18 when the
County spent Kshs.2.43 billion and was 37 per cent of the total expenditure in FY 2018/19. Figure 3.76 shows a
summary of operations and maintenance expenditure by major categories.
2,426.46(36.8%)
2,018.33(30.6%)
2,143.28(32.5%)
2,844.82(37%)
2,239.79(29.1%)
2,609.96(33.9%)
-
500
1,000
1,500
2,000
2,500
3,000
Personnel Emoluments Operations and Maintenance Development Expenditure
Ksh
s.Mill
ion
Expenditure by Economic Classification
FY 2017/18
FY 2018/19
Key
Source: Kwale County Treasury
3.19.6 Development Expenditure AnalysisThe total development expenditure of Kshs.2.61 billion represented 42.6 per cent of the annual development budget estimates of Kshs.6.12 billion. Table 3.54 provides a summary of development projects with the highest expenditure in the financial year.
Table 3.54: Kwale County, List of Development Projects with the Highest Expenditure in FY 2018/19
S/No. Project Name Project Location Project Budget (Kshs.)
FY2018/19 Project Expenditure (Kshs.)
Absorption rate (%)
1 Grant to Youth Polytechnics Kwale 85,622,833 70,770,000 82.7
2 Preparation of County Spatial Plan Kwale 98,455,290 67,909,761 69.0
3 Purchase of Certified Seeds & seedlings Kwale 27,600,000 27,600,000 100.0
4 Purchase of Graders/Shovel Kwale 28,000,000 26,967,000 96.3
5 Proposed improvement Marere Godoni pipeline Marere 45,000,000 22,272,000 49.5
6 Design & installation of fibre optic cable Kwale 18,396,057 18,396,056 100.0
7 Maternity complex wing Phase 2 Ramisi Ward 27,867,352 16,440,008 59.0
8 Purchase of Motorcycles Kwale 10,000,000 9,599,634 96.0
9 Rehab Centre perimeter wall Kombani 9,699,980 8,426,231 86.9
10 Construction of Kinango Biashara Centre Kinango 5,548,250 4,755,221 85.7
Source: Kwale County Treasury
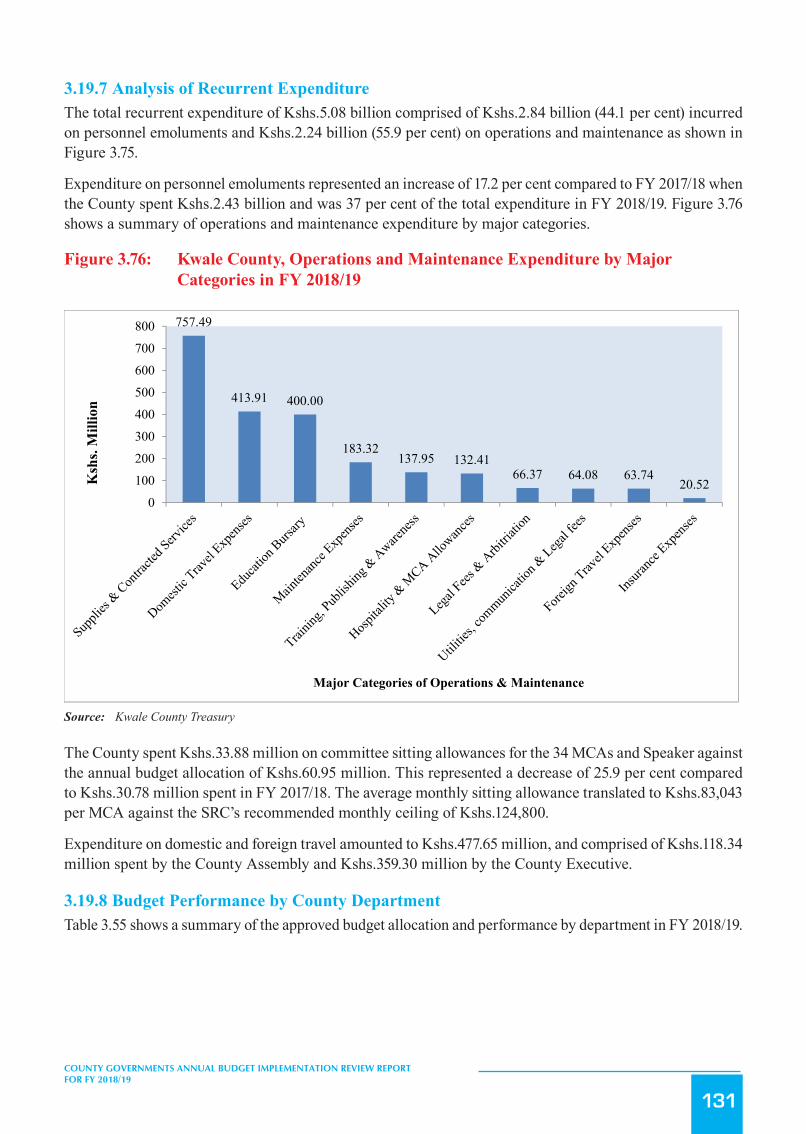
131
COUNTY GOVERNMENTS ANNUAL BUDGET IMPLEMENTATION REVIEW REPORT FOR FY 2018/19
3.19.7 Analysis of Recurrent ExpenditureThe total recurrent expenditure of Kshs.5.08 billion comprised of Kshs.2.84 billion (44.1 per cent) incurred on personnel emoluments and Kshs.2.24 billion (55.9 per cent) on operations and maintenance as shown in Figure 3.75.
Expenditure on personnel emoluments represented an increase of 17.2 per cent compared to FY 2017/18 when the County spent Kshs.2.43 billion and was 37 per cent of the total expenditure in FY 2018/19. Figure 3.76 shows a summary of operations and maintenance expenditure by major categories.
Figure 3.76: Kwale County, Operations and Maintenance Expenditure by Major Categories in FY 2018/19
170
Figure 3.76: Kwale County, Operations and Maintenance Expenditure by Major Categories in FY 2018/19
Source: Kwale County Treasury
The County spent Kshs.33.88 million on committee sitting allowances for the 34 MCAs and Speaker against the annual
budget allocation of Kshs.60.95 million. This represented a decrease of 25.9 per cent compared to Kshs.30.78 million
spent in FY 2017/18. The average monthly sitting allowance translated to Kshs.83,043 per MCA against the SRC’s
recommended monthly ceiling of Kshs.124,800.
Expenditure on domestic and foreign travel amounted to Kshs.477.65 million, and comprised of Kshs.118.34 million
spent by the County Assembly and Kshs.359.30 million by the County Executive.
3.19.8 Budget Performance by County Department
Table 3.55 shows a summary of the approved budget allocation and performance by department in FY 2018/19.
Table 3.55: Kwale County, Budget Performance by Department in FY 2018/19
Department Budget Allocation
(Kshs. Million) Exchequer Issues (Kshs. Million)
Expenditure (Kshs. Million)
Expenditure to Exchequer Issues (%)
Absorption rate (%)
Rec Dev Rec Dev Rec Dev Rec Dev Rec Dev
Executive Services 212.32 107.56 241.08 47.486 174.90 47.49 72.5 100 82.4 44.1 Public Service & Administration 174.99 60.16 248.93 39.88 172.29 39.88 69.2 100 98.5 66.3
Finance & Economic Planning 877.21 46.78 654.59 21.47 805.46 15.64 123 72.8 91.8 33.4
Agriculture ,Livestock & Fisheries 179.81 441.37 172.86 242.64 170.54 127.83 98.7 52.7 94.8 29.0 Education, Research And Hr Development 802.33 1,091.16 808.33 539.23 786.36 523.17 97.3 97 98 47.9
757.49
413.91 400.00
183.32137.95 132.41
66.37 64.08 63.7420.52
0100200300400500600700800
Ksh
s. M
illio
n
Major Categories of Operations & Maintenance
Source: Kwale County Treasury
The County spent Kshs.33.88 million on committee sitting allowances for the 34 MCAs and Speaker against the annual budget allocation of Kshs.60.95 million. This represented a decrease of 25.9 per cent compared to Kshs.30.78 million spent in FY 2017/18. The average monthly sitting allowance translated to Kshs.83,043 per MCA against the SRC’s recommended monthly ceiling of Kshs.124,800.
Expenditure on domestic and foreign travel amounted to Kshs.477.65 million, and comprised of Kshs.118.34 million spent by the County Assembly and Kshs.359.30 million by the County Executive.
3.19.8 Budget Performance by County DepartmentTable 3.55 shows a summary of the approved budget allocation and performance by department in FY 2018/19.

132
COUNTY GOVERNMENTS ANNUAL BUDGET IMPLEMENTATION REVIEW REPORT FOR FY 2018/19
Table 3.55: Kwale County, Budget Performance by Department in FY 2018/19
DepartmentBudget Allocation
(Kshs. Million)Exchequer Issues
(Kshs. Million)Expenditure (Kshs.
Million)
Expenditure to Exchequer Issues
(%)
Absorption rate (%)
Rec Dev Rec Dev Rec Dev Rec Dev Rec Dev
Executive Services 212.32 107.56 241.08 47.486 174.90 47.49 72.5 100 82.4 44.1
Public Service & Adminis-tration 174.99 60.16 248.93 39.88 172.29 39.88 69.2 100 98.5 66.3
Finance & Economic Plan-ning 877.21 46.78 654.59 21.47 805.46 15.64 123 72.8 91.8 33.4
Agriculture ,Livestock & Fisheries 179.81 441.37 172.86 242.64 170.54 127.83 98.7 52.7 94.8 29.0
Education, Research And Hr Development 802.33 1,091.16 808.33 539.23 786.36 523.17 97.3 97 98 47.9
Medical & Public Health Services 1,985.33 1,097.53 1948.33 415.95 1,909.14 561.55 98 135 96.2 51.2
Trade Investment & Cooper-atives 61.33 216.18 67.83 115.22 56.46 69.73 83.2 60.5 92.1 32.3
Tourism & ICT53.36 109.71 46.56 76.65 50.63 77.51 108.7 101.1 94.9 70.6
Social Services & Talent Management 139.65 255.05 147.95 80.23 121.87 79.67 82.4 99.3 87.3 31.2
Roads & Public Works140.33 784.53 145.02 578.48 133.06 361.53 91.8 62.5 94.8 46.1
Land, Environment & Natural Resources 104.48 232.07 102.98 189.7 47.90 128.07 46.5 67.5 45.8 55.2
Water Services 82.34 1,447.88 86.34 433.42 76.44 488.69 88.5 112.8 92.8 33.8
County Assembly584.76 229.80 584.76 89.22 579.56 89.19 99.1 100 99.1 38.8
TOTAL 5,398.24 6,119.78 5,255.56 2,869.58 5,084.61 2,609.95 96.7 91 94.2 42.6
Source: Kwale County Treasury
Analysis of expenditure by department shows that the Department of Tourism & ICT recorded the highest absorption rate of development budget at 70.6 per cent while the Department of Agriculture, Livestock and Fisheries had the lowest at 29 per cent. The County Assembly had the highest percentage of recurrent expenditure to recurrent budget at 99.1 per cent while the Department Land, Environment and Natural Resources had the lowest at 45.8 per cent.
3.19.9 Key Observations and RecommendationsThe County has made progress in addressing some of the challenges previously identified as affecting budget implementation. Some of the progress made included:
i. Improvement in own source revenue collection by 39.3 per cent to Kshs.315.03 million in the reporting period from Kshs.226.21 million in FY 2017/18.
ii. Timely preparation and approval of key planning documents such as the CBROP, CFSP and the budget estimates.
The County should implement the following measures in order to improve budget execution;
1. Low absorption of development budget. In the reporting period, the County attained an absorption rate of 42.6 per cent compared to 52.1 per cent in a similar period in FY 2017/18.

133
COUNTY GOVERNMENTS ANNUAL BUDGET IMPLEMENTATION REVIEW REPORT FOR FY 2018/19
2. A high wage bill that increased by 17.2 per cent from Kshs.2.43 billion in FY 2017/18 to Kshs.2.84 billion in the reporting period. The wage bill accounted for 37 per cent of total expenditure in the reporting period.
The County should implement the following measures in order to improve budget execution;
1. The County should identify and address issues that cause delays in the implementation of development projects.
2. The County Public Service Board should establish an optimal staffing structure in order to manage the wage bill.
3.20 Laikipia County
3.20.1 Overview of the FY 2018/19 BudgetThe County’s FY 2018/19 Supplementary Budget was Kshs.6.93 billion, comprising of Kshs.2.8 billion (40.4 per cent) and Kshs.4.13 billion (59.6 per cent) allocation for development and recurrent expenditure respectively.
To finance the budget, the County expects to receive Kshs.4.13 billion (59.4 per cent) as equitable share of the revenue raised nationally, Kshs.981.65 million (14.2 per cent) as total conditional grants, generate Kshs.800 million (11.5 per cent) from own sources of revenue, Kshs.800 million (11.5 per cent) cash balance from FY 2017/18 and Kshs.232.9 million (3.4 per cent) from other revenue sources expected during the year.
Figure 3.77: Laikipia County, Expected Sources of Budget Financing in FY 2018/19
172
3.20 Laikipia County
3.20.1 Overview of the FY 2018/19 Budget The County’s FY 2018/19 Supplementary Budget was Kshs.6.93 billion, comprising of Kshs.2.8 billion (40.4 per cent)
and Kshs.4.13 billion (59.6 per cent) allocation for development and recurrent expenditure respectively.
To finance the budget, the County expects to receive Kshs.4.13 billion (59.4 per cent) as equitable share of the revenue
raised nationally, Kshs.981.65 million (14.2 per cent) as total conditional grants, generate Kshs.800 million (11.5 per
cent) from own sources of revenue, Kshs.800 million (11.5 per cent) cash balance from FY 2017/18 and Kshs.232.9
million (3.4 per cent) from other revenue sources expected during the year.
Figure 3.77: Laikipia County, Expected Sources of Budget Financing in FY 2018/19
Source: Laikipia County Treasury
A breakdown of the conditional grants is provided in Table 3.56.
1.1.4 Revenue Analysis During FY 2018/19, the County had a total of Khs4.86 billion available for budget implementation. This amount
consisted of Kshs.3.64 billion received as equitable share of the revenue raised nationally, Kshs.397.89 million as
conditional grants, and Kshs.815.79 million generated from own sources of revenue.
Figure 3.78 shows the annual trend in own-source revenue collection from FY 2013/14 to FY 2018/19.
Figure 3.78: Laikipia County, Own Source Revenue Collection for FY 2013/14 to FY 2018/19
Cash Balance from FY 2017/18
11.5%
National Sharable Revenue59.4%
Conditional Allocations
14.2%Own Source Revenue
11.5%
Other Revenues Expected During the
year3.4%
Source: Laikipia County Treasury
A breakdown of the conditional grants is provided in Table 3.56.
3.20.2 Revenue AnalysisDuring FY 2018/19, the County had a total of Khs4.86 billion available for budget implementation. This amount consisted of Kshs.3.64 billion received as equitable share of the revenue raised nationally, Kshs.397.89 million as conditional grants, and Kshs.815.79 million generated from own sources of revenue.

134
COUNTY GOVERNMENTS ANNUAL BUDGET IMPLEMENTATION REVIEW REPORT FOR FY 2018/19
Figure 3.78 shows the annual trend in own-source revenue collection from FY 2013/14 to FY 2018/19.
Figure 3.78: Laikipia County, Own Source Revenue Collection for FY 2013/14 to FY 2018/19
173
Source: Laikipia County Treasury
The County generated a total of Kshs.815.79 million from own revenue sources in FY 2018/19. This amount
represented an increase of 33.7 per cent compared to FY 2017/18 and represented 102 per cent of the annual target.
3.20.2 Conditional Grants During the reporting period, the County received Kshs.397.89 million as conditional grants as shown in Table 3.56.
Table 3.56: Laikipia County, Conditional Grants/Loans Received in the FY 2018/19
S/No Grants Annual CARA, 2018 Allocation (in Kshs)
Annual Budget Allocation (in Kshs)
Actual receipts in the FY 2018/19 (in Kshs.)
Actual Receipts as Percentage of Annual Allocation (%)
A Grants Contained in the CARA, 2018
1 Compensation for User Fee Foregone 15,209,593 9,968,208 9,968,208 66
2 Leasing of Medical Equipment 200,000,000 200,000,000 - -
3 Road Maintenance Fuel Levy 198,416,317 109,128,974 109,128,974 55
4 Rehabilitation of Village Polytechnics 41,860,000 28,525,000 - -
5 Transforming Health Systems for Universal Care Project (WB) 67,077,728 67,077,728 42,077,093 63
6 National Agricultural and Rural Inclusive Growth Project (NARIGP) - 19,398,638 7,062,611 -
7 Kenya Climate Smart Agriculture Project (KCSAP) 117,000,000 117,000,000 39,402,608 34
8 Kenya Devolution Support Project (KDSP) "Level 1 grant" 41,121,027 37,000,000 - -
9 Kenya Urban Support Project (KUSP) 50,000,000 91,200,000 91,200,000 182
347.14400.50
471.15 462.72
610.34
815.79
0
100
200
300
400
500
600
700
800
900
FY 2013/14 FY 2014/15 FY 2015/16 FY 2016/17 FY 2017/18 FY 2018/19
Ksh
s. M
illio
ns
Trend in Own Source Revenue
Source: Laikipia County Treasury
The County generated a total of Kshs.815.79 million from own revenue sources in FY 2018/19. This amount represented an increase of 33.7 per cent compared to FY 2017/18 and represented 102 per cent of the annual target.
3.20.3 Conditional GrantsDuring the reporting period, the County received Kshs.397.89 million as conditional grants as shown in Table 3.56.
Table 3.56: Laikipia County, Conditional Grants/Loans Received in the FY 2018/19
S/No GrantsAnnual CARA, 2018 Allocation
(in Kshs)
Annual Budget Allocation (in
Kshs)
Actual receipts in the FY
2018/19 (in Kshs.)
Actual Receipts as Percentage of Annual Alloca-
tion (%)
A Grants Contained in the CARA, 2018
1 Compensation for User Fee Foregone 15,209,593 9,968,208 9,968,208 66
2 Leasing of Medical Equipment 200,000,000 200,000,000 - -
3 Road Maintenance Fuel Levy 198,416,317 109,128,974 109,128,974 55
4 Rehabilitation of Village Polytechnics 41,860,000 28,525,000 - -
5 Transforming Health Systems for Universal Care Project (WB) 67,077,728 67,077,728 42,077,093 63
6 National Agricultural and Rural Inclusive Growth Project (NARIGP) - 19,398,638 7,062,611 -
7 Kenya Climate Smart Agriculture Project (KCSAP) 117,000,000 117,000,000 39,402,608 34
8 Kenya Devolution Support Project (KDSP) “Level 1 grant” 41,121,027 37,000,000 - -
9 Kenya Urban Support Project (KUSP) 50,000,000 91,200,000 91,200,000 182
10 Danish International Development Agency (DANIDA) Grant 15,086,250 15,086,250 15,086,250 100
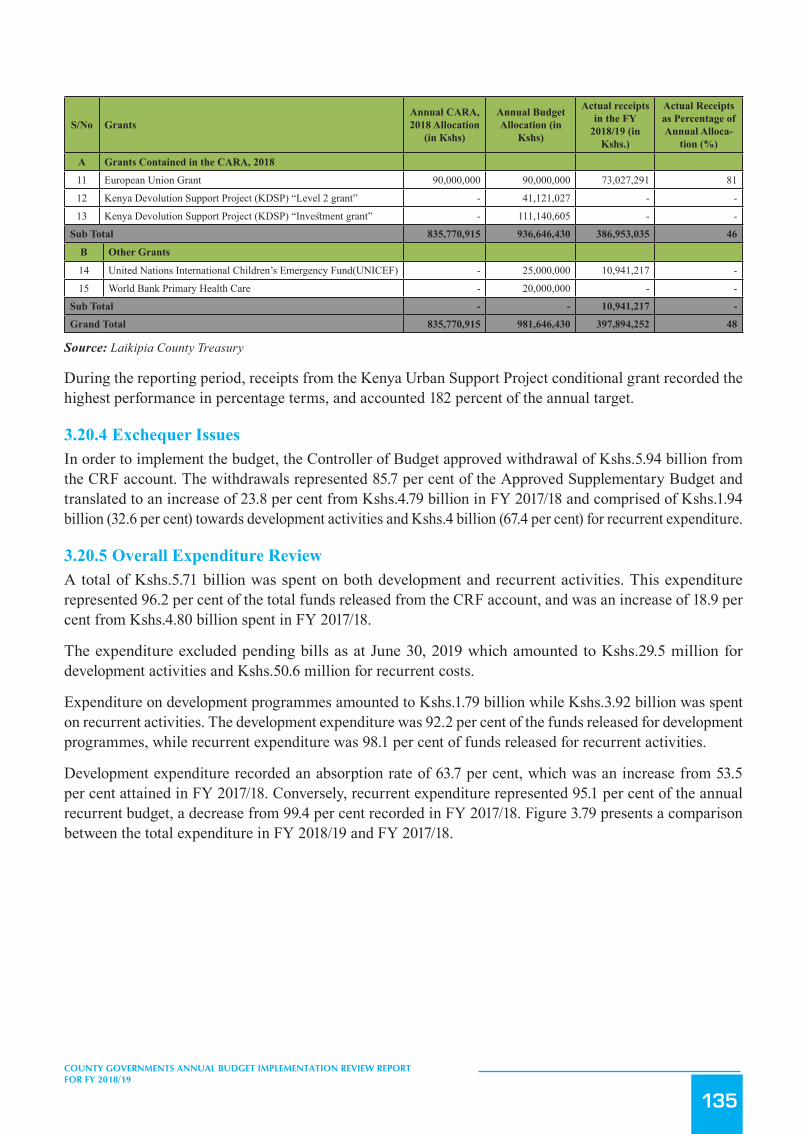
135
COUNTY GOVERNMENTS ANNUAL BUDGET IMPLEMENTATION REVIEW REPORT FOR FY 2018/19
S/No GrantsAnnual CARA, 2018 Allocation
(in Kshs)
Annual Budget Allocation (in
Kshs)
Actual receipts in the FY
2018/19 (in Kshs.)
Actual Receipts as Percentage of Annual Alloca-
tion (%)
A Grants Contained in the CARA, 2018
11 European Union Grant 90,000,000 90,000,000 73,027,291 81
12 Kenya Devolution Support Project (KDSP) “Level 2 grant” - 41,121,027 - -
13 Kenya Devolution Support Project (KDSP) “Investment grant” - 111,140,605 - -
Sub Total 835,770,915 936,646,430 386,953,035 46
B Other Grants
14 United Nations International Children’s Emergency Fund(UNICEF) - 25,000,000 10,941,217 -
15 World Bank Primary Health Care - 20,000,000 - -
Sub Total - - 10,941,217 -
Grand Total 835,770,915 981,646,430 397,894,252 48
Source: Laikipia County Treasury
During the reporting period, receipts from the Kenya Urban Support Project conditional grant recorded the highest performance in percentage terms, and accounted 182 percent of the annual target.
3.20.4 Exchequer IssuesIn order to implement the budget, the Controller of Budget approved withdrawal of Kshs.5.94 billion from the CRF account. The withdrawals represented 85.7 per cent of the Approved Supplementary Budget and translated to an increase of 23.8 per cent from Kshs.4.79 billion in FY 2017/18 and comprised of Kshs.1.94 billion (32.6 per cent) towards development activities and Kshs.4 billion (67.4 per cent) for recurrent expenditure.
3.20.5 Overall Expenditure ReviewA total of Kshs.5.71 billion was spent on both development and recurrent activities. This expenditure represented 96.2 per cent of the total funds released from the CRF account, and was an increase of 18.9 per cent from Kshs.4.80 billion spent in FY 2017/18.
The expenditure excluded pending bills as at June 30, 2019 which amounted to Kshs.29.5 million for development activities and Kshs.50.6 million for recurrent costs.
Expenditure on development programmes amounted to Kshs.1.79 billion while Kshs.3.92 billion was spent on recurrent activities. The development expenditure was 92.2 per cent of the funds released for development programmes, while recurrent expenditure was 98.1 per cent of funds released for recurrent activities.
Development expenditure recorded an absorption rate of 63.7 per cent, which was an increase from 53.5 per cent attained in FY 2017/18. Conversely, recurrent expenditure represented 95.1 per cent of the annual recurrent budget, a decrease from 99.4 per cent recorded in FY 2017/18. Figure 3.79 presents a comparison between the total expenditure in FY 2018/19 and FY 2017/18.

136
COUNTY GOVERNMENTS ANNUAL BUDGET IMPLEMENTATION REVIEW REPORT FOR FY 2018/19
Figure3.79: LaikipiaCounty,ExpenditurebyEconomicClassification
175
Source: Laikipia County Treasury
1.1.6 Development Expenditure Analysis The total development expenditure of Kshs.1.79 billion represented 63.7 per cent of the annual development
expenditure estimates of Kshs.2.8 billion. Table 3.57 provides a summary of development projects with the highest
expenditure in the financial year.
Table 3.57: Laikipia County, List of Development Projects with the Highest Expenditure in FY 2018/19
S/No. Project Name Project Location Project Budget (Kshs.)
FY2018/19 Project Expenditure (Kshs.)
Absorption rate (%)
1 Upgrading to cobble stone standard Wiyumiririe 46,751,729 46,751,729 100.0 2 Supply of Building Material for Wiyumiririe Wiyumiririe 23,546,180 23,546,180 100.0 3 Ewaso Ngiro River Bridge H/O 24,996,458 21,979,644 87.9 4 Nanyuki Teaching and Referral Hospital Maternity Nanyuki 50,000,000 20,000,000 40.0 5 Nyahururu Maternity Igwamiti 50,000,000 20,000,000 40.0 6 Construction of box culvert Wiyumiririe 18,387,068 18,387,068 100.0 7 Maintenance of Lenana Road Nanyuki 16,000,000 16,000,000 100.0 8 Construction of Rumuruti county headquarters Rumuruti 13,055,000 11,754,063 90.0 9 Construction of Nairutia water project Ngobit 11,594,374 9,487,396 81.8
Source: Laikipia County Treasury
1.1.7 Analysis of Recurrent Expenditure The total recurrent expenditure of Kshs.3.92 billion comprised of Kshs.2.62 billion (66.6 per cent) incurred on personnel
emoluments and Kshs.1.31 billion (33.4 per cent) on operations and maintenance as shown in Figure 3.79.
Expenditure on personnel emoluments represented an increase of 1.4 per cent compared to FY 2017/18 when the
County spent Kshs.2.58 billion and was 45.8 per cent of the total expenditure in FY 2018/19. Figure 3.80 shows a
summary of operations and maintenance expenditure by major categories.
2,577.73(53.7%)
1,213.63(25.3%) 1,011.32
(21.1%)
2,615.04(45.8%)
1,308.93(22.9%)
1,786.32(31.3%)
-
500
1,000
1,500
2,000
2,500
3,000
Personnel Emoluments Operations and Maintenance Development Expenditure
Ksh
s.Mill
ion
Expenditure by Economic Classification
FY 2017/18
FY 2018/19
Key
Source: Laikipia County Treasury
3.20.6 Development Expenditure AnalysisThe total development expenditure of Kshs.1.79 billion represented 63.7 per cent of the annual development expenditure estimates of Kshs.2.8 billion. Table 3.57 provides a summary of development projects with the highest expenditure in the financial year.
Table 3.57: Laikipia County, List of Development Projects with the Highest Expenditure in FY 2018/19
S/No. Project Name Project Location Project Budget (Kshs.)
FY2018/19 Project Expenditure
(Kshs.)
Absorption rate (%)
1 Upgrading to cobble stone standard Wiyumiririe 46,751,729 46,751,729 100.0
2 Supply of Building Material for Wiyumiririe Wiyumiririe 23,546,180 23,546,180 100.0
3 Ewaso Ngiro River Bridge H/O 24,996,458 21,979,644 87.9
4 Nanyuki Teaching and Referral Hospital Maternity Nanyuki 50,000,000 20,000,000 40.0
5 Nyahururu Maternity Igwamiti 50,000,000 20,000,000 40.0
6 Construction of box culvert Wiyumiririe 18,387,068 18,387,068 100.0
7 Maintenance of Lenana Road Nanyuki 16,000,000 16,000,000 100.0
8 Construction of Rumuruti county headquarters Rumuruti 13,055,000 11,754,063 90.0
9 Construction of Nairutia water project Ngobit 11,594,374 9,487,396 81.8
Source: Laikipia County Treasury
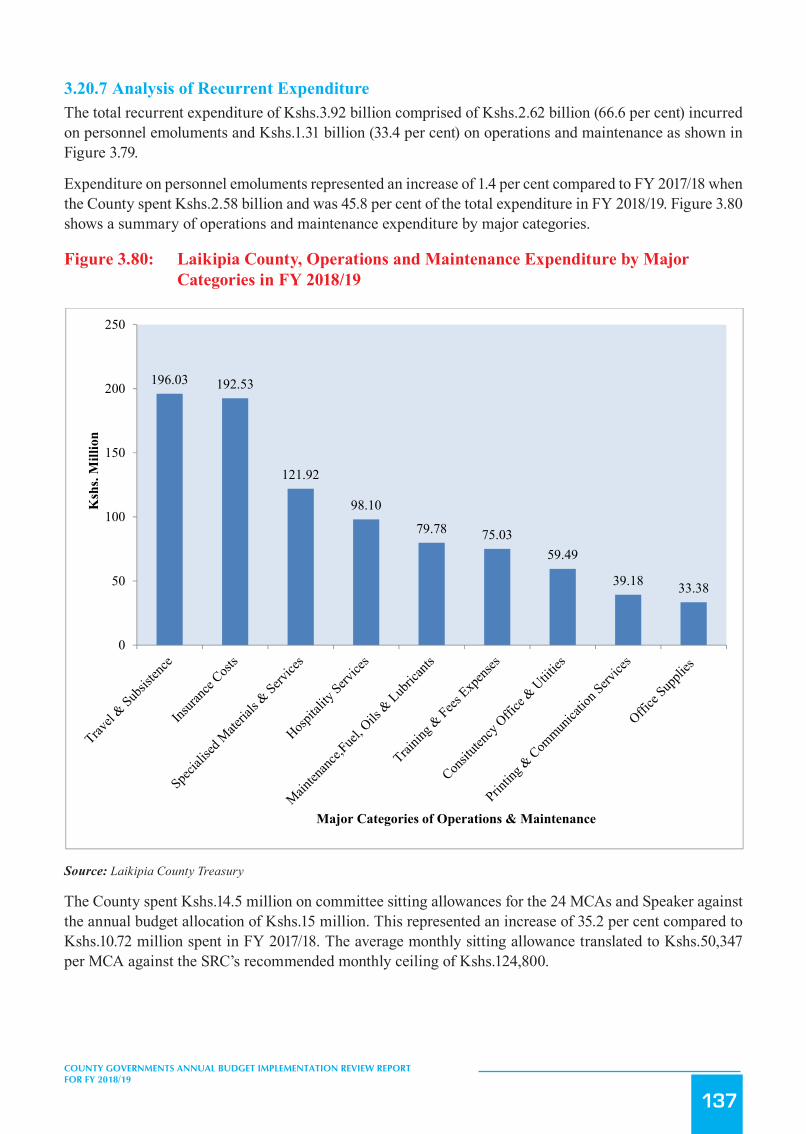
137
COUNTY GOVERNMENTS ANNUAL BUDGET IMPLEMENTATION REVIEW REPORT FOR FY 2018/19
3.20.7 Analysis of Recurrent ExpenditureThe total recurrent expenditure of Kshs.3.92 billion comprised of Kshs.2.62 billion (66.6 per cent) incurred on personnel emoluments and Kshs.1.31 billion (33.4 per cent) on operations and maintenance as shown in Figure 3.79.
Expenditure on personnel emoluments represented an increase of 1.4 per cent compared to FY 2017/18 when the County spent Kshs.2.58 billion and was 45.8 per cent of the total expenditure in FY 2018/19. Figure 3.80 shows a summary of operations and maintenance expenditure by major categories.
Figure 3.80: Laikipia County, Operations and Maintenance Expenditure by Major Categories in FY 2018/19
176
Figure 3.80: Laikipia County, Operations and Maintenance Expenditure by Major Categories in FY 2018/19
Source: Laikipia County Treasury
The County spent Kshs.14.5 million on committee sitting allowances for the 24 MCAs and Speaker against the annual
budget allocation of Kshs.15 million. This represented an increase of 35.2 per cent compared to Kshs.10.72 million
spent in FY 2017/18. The average monthly sitting allowance translated to Kshs.50,347 per MCA against the SRC’s
recommended monthly ceiling of Kshs.124,800.
Expenditure on domestic and foreign travel amounted to Kshs.196.03 million, and comprised of Kshs.73.08 million
spent by the County Assembly and Kshs.122.95 million by the County Executive. This expenditure represented 5 per
cent of total recurrent expenditure and was an increase of 26.2 per cent compared to Kshs.155.36 million spent in FY
2017/18.
3.20.4 Budget Performance by County Department Table 3.58 shows a summary of the approved budget allocation and performance by department in FY 2018/19.
Table 3.58: Laikipia County, Budget Performance by Department in FY 2018/19
Department Budget Allocation (Kshs. Million)
Exchequer Issues (Kshs. Million)
Expenditure (Kshs. Million)
Expenditure to Exchequer Issues (%)
Absorption rate (%)
196.03 192.53
121.92
98.10
79.78 75.0359.49
39.18 33.38
0
50
100
150
200
250
Ksh
s. M
illio
n
Major Categories of Operations & Maintenance
Source: Laikipia County Treasury
The County spent Kshs.14.5 million on committee sitting allowances for the 24 MCAs and Speaker against the annual budget allocation of Kshs.15 million. This represented an increase of 35.2 per cent compared to Kshs.10.72 million spent in FY 2017/18. The average monthly sitting allowance translated to Kshs.50,347 per MCA against the SRC’s recommended monthly ceiling of Kshs.124,800.

138
COUNTY GOVERNMENTS ANNUAL BUDGET IMPLEMENTATION REVIEW REPORT FOR FY 2018/19
Expenditure on domestic and foreign travel amounted to Kshs.196.03 million, and comprised of Kshs.73.08 million spent by the County Assembly and Kshs.122.95 million by the County Executive. This expenditure represented 5 per cent of total recurrent expenditure and was an increase of 26.2 per cent compared to Kshs.155.36 million spent in FY 2017/18.
3.20.8 Budget Performance by County DepartmentTable 3.58 shows a summary of the approved budget allocation and performance by department in FY 2018/19.
Table 3.58: Laikipia County, Budget Performance by Department in FY 2018/19
DepartmentBudget Allocation
(Kshs. Million)Exchequer Issues
(Kshs. Million)Expenditure (Kshs.
Million)Expenditure to Ex-chequer Issues (%) Absorption rate (%)
Rec Dev Rec Dev Rec Dev Rec Dev Rec Dev
County Administration 2,735.64 68.90 2,698.19 63.04 2,746.02 63.08 101.8 100.1 100.4 91.5
Finance and Planning 310.62 936.50 286.63 844.93 261.01 918.13 91.1 108.7 84.0 98
Health 382.76 583.21 333.21 265.21 282.70 282.18 84.8 106.4 73.9 48.4
Agriculture 43.30 309.50 30.96 173.79 26.08 66.54 84.2 38.3 60.2 21.5
Infrastructure 67.00 433.77 67.00 337.24 26.02 201.05 38.8 59.6 38.8 46.3
Education 78.50 116.88 78.48 33.36 76.87 17.60 97.9 52.8 97.9 15.1
Trade & Industrialization 16.50 135.00 16.11 68.44 15.63 66.20 97.0 96.7 94.7 49
Water 22.20 211.50 22.07 149.31 20.44 169.85 92.6 113.8 92.1 80.3
County Assembly 469.27 6.90 469.20 1.71 469.20 1.71 100 100 100 24.8
TOTAL 4,126 2,802 4,002 1,937 3,924 1,786 98.1 92.2 95.1 63.7
Source: Laikipia County Treasury
Analysis of expenditure by department shows that the Department of Finance and Planning recorded the highest absorption rate of development budget at 98 per cent while the Department of Education recorded the lowest absorption rate of 15.1 per cent. The Department of County Administration had the highest percentage of recurrent expenditure to recurrent budget at 100.4 per cent while the Department of Infrastructure had the lowest at 38.8 per cent.
3.20.9 Key Observations and RecommendationsThe County has made progress in addressing some of the challenges previously identified as affecting budget implementation. Some of the progress made included:
i. Improvement in the utilization of IFMIS and E-procurement module in processing financial transactions.
ii. Improvement in own-source revenue collection by 33.7 per cent from Kshs.610.34 million in FY 2017/18 to Kshs.815.79 million in the reporting period.
Despite the above progress, the following challenges continued to hamper effective budget implementation:
1. Diversion of development funds to pay salaries amounting to Kshs.136.41 million in June, 2019.2. Failure to exercise prudence management of public funds which led to direct charge of Kshs.43
million from the County Bank Account by Kenya Revenue Authority (KRA) for non-remittance of salary tax deductions.
3. High expenditure on domestic and foreign travel, which increased by 26.2 per cent from Kshs.155.36 million in FY 2017/18 to Kshs.196.03 million in the reporting period.
4. A high wage bill that increased by 1.4 per cent from Kshs.2.58 billion in FY 2017/18 to Kshs.2.62 billion in the reporting period. The wage bill accounted for 45.8 per cent of total expenditure in the reporting period.

139
COUNTY GOVERNMENTS ANNUAL BUDGET IMPLEMENTATION REVIEW REPORT FOR FY 2018/19
5. Inadequate budgetary control that resulted in expenditure above approved budget by the Department of County Administration. This is contrary to Section 135 and 154 of PFM Act, 2012.
The County should implement the following measures in order to improve budget execution;
1. The County Treasury should ensure prudence in utilization of funds in compliance with Section 135, 154 and Regulation 42 of PFM Act 2012.
2. The County Treasury should ensure all statutory deductions are paid to the respective Government Institutions in line with the Law.
3. The County Treasury should ensure that expenditure on non-core budget items is rationalised to provide more resources for development projects.
4. The County Public Service Board should develop an optimal staffing structure and devise strategies to contain expenditure on personnel costs within 35 per cent of County’s total revenue in line with Regulation 25(1) (b) of the PFM (County Governments) Regulations, 2015.
5. The County Treasury should ensure expenditure is within the approved budget.
3.21 Lamu County
3.21.1 Overview of the FY 2018/19 BudgetThe County’s FY 2018/19 Approved Supplementary Budget was Kshs.4.85 billion, comprising of Kshs.2.28 billion (47.1 per cent) and Kshs.2.56 billion (52.9 per cent) allocation for development and recurrent expenditure respectively.
To finance the budget, the County expects to receive Kshs.3.55 billion (73.2 per cent) as equitable share of the revenue raised nationally, Kshs.677.34 million (14 per cent) as total conditional grants, generate Kshs.70 million (1.4 per cent) from own sources of revenue, and Kshs.507.05 million (10.5 per cent) cash balance from FY 2017/18 and Ksh.2.95 million (0.1 per cent) as revenue from other sources.
Figure 3.81: Lamu County, Expected Sources of Budget Financing in FY 2018/19
178
3.21 Lamu County
3.21.1 Overview of the FY 2018/19 Budget The County’s FY 2018/19 Approved Supplementary Budget was Kshs.4.85 billion, comprising of Kshs.2.28 billion
(47.1 per cent) and Kshs.2.56 billion (52.9 per cent) allocation for development and recurrent expenditure
respectively.
To finance the budget, the County expects to receive Kshs.3.55 billion (73.2 per cent) as equitable share of the revenue
raised nationally, Kshs.677.34 million (14 per cent) as total conditional grants, generate Kshs.70 million (1.4 per cent)
from own sources of revenue, and Kshs.507.05 million (10.5 per cent) cash balance from FY 2017/18 and Ksh.2.95
million (0.1 per cent) as revenue from other sources.
Figure 3.81: Lamu County, Expected Sources of Budget Financing in FY 2018/19
Source: Lamu County Treasury
A breakdown of the conditional grants is provided in Table 3.59.
3.21.2 Revenue Analysis During FY 2018/19, the County had a total of Khs.4.33 billion available for budget implementation. This amount
consisted of Kshs.3.55 billion received as equitable share of the revenue raised nationally, Kshs.199.86 million as
conditional grants, Kshs.71.87 million generated from own sources of revenue, and a cash balance of Kshs.507.05
million from FY 2017/18.
Figure 3.82 shows the annual trend in own-source revenue collection from FY 2013/14 to FY 2018/19.
Figure 3.82: Lamu County, Own Source Revenue Collection for FY 2013/14 to FY 2018/19
Cash Balance from FY 2017/1810.6%
National Sharable Revenue73.8%
Total Conditional Allocations
14.1%
Own Source Revenue
1.5%
Other Revenues Expected During
the year0.1%
Source: Lamu County Treasury

140
COUNTY GOVERNMENTS ANNUAL BUDGET IMPLEMENTATION REVIEW REPORT FOR FY 2018/19
A breakdown of the conditional grants is provided in Table 3.59.
3.21.2 Revenue AnalysisDuring FY 2018/19, the County had a total of Khs.4.33 billion available for budget implementation. This amount consisted of Kshs.3.55 billion received as equitable share of the revenue raised nationally, Kshs.199.86 million as conditional grants, Kshs.71.87 million generated from own sources of revenue, and a cash balance of Kshs.507.05 million from FY 2017/18.
Figure 3.82 shows the annual trend in own-source revenue collection from FY 2013/14 to FY 2018/19.
Figure 3.82: Lamu County, Own Source Revenue Collection for FY 2013/14 to FY 2018/19
179
Source: Lamu County Treasury
The County generated a total of Kshs.71.87 million from own revenue sources in FY 2018/19. This amount represented
an increase of Kshs.19.67 million compared to that realised in FY 2017/18 and was 102.7 per cent of the annual target.
3.21.3 Conditional Grants During the reporting period, the County received Kshs.199.86 million as conditional grants as shown in Table 3.59.
Table 3.59: Lamu County, Conditional Grants/Loans Received in the FY 2018/19
S/No Grants Annual CARA,
2018 Allocation (inKshs)
Annual BudgetAllocation (in
Kshs)
Actual Receipts in the FY 2018/19 (in
Kshs.)
Actual Receipts as Percentage of
Annual Allocation (%)
1 Road Maintenance Fuel Levy Fund 93,421,016 93,421,016 - - 2 Leasing of Medical Equipment 200,000,000 - - -
3 Kenya Devolution Support Programme (KDSP) 33,793,559 33,793,559 - -
4 Compensation for User Fee Foregone 2,451,034 2,451,034 2,451,034 100 5 DANIDA Grant 8,302,500 8,302,500 8,302,500 100
6 Supplement for Construction of CountyHeadquarters 121,000,000 242,000,000 - -
7 Development of Youth Polytechnics (TVETs grants) 31,210,000 31,210,000 23,563,550 75.5
8 Conditional Allocation - Other Loans & Grants - 16,158,635 - -
9 World Bank Loan for Transforming HealthSystem for Universal Care Project 50,000,000 50,000,000 20,540,204 41.1
10 Kenya Climate Smart Agriculture Project 150,000,000 150,000,000 53,806,243 36 11 KENYA Urban Support Program 50,000,000 50,000,000 91,200,000 182.4
Grand Total 740,178,109.0 677,336,744.0 199,863,530.5 27
Source: Lamu County Treasury
During the reporting period, receipts from the Kenya Urban Support Program (KUSP) conditional grant recorded the
highest performance in percentage terms, and accounted 182.4 per cent of the annual target.
3.21.4 Exchequer IssuesIn order to implement the budget, the Controller of Budget approved withdrawal of Kshs.2.97 billion from the CRF
account. The withdrawals represented 61.2 per cent of the Approved Supplementary Budget and translated to an
increase of 25.9 per cent from Kshs.2.36 billion in FY 2017/18 and comprised of Kshs.724.20 million (24.4 per cent)
towards development activities and Kshs.2.24 billion (75.6 per cent) for recurrent expenditure.
35.57
61.6757.32
76.96
54.69
71.87
0
10
20
30
40
50
60
70
80
90
FY 2013/14 FY 2014/15 FY 2015/16 FY 2016/17 FY 2017/18 FY 2018/19
Ksh
s. M
illio
ns
Trend in Own Source Revenue
Source: Lamu County Treasury
The County generated a total of Kshs.71.87 million from own revenue sources in FY 2018/19. This amount represented an increase of Kshs.19.67 million compared to that realised in FY 2017/18 and was 102.7 per cent of the annual target.
3.21.3 Conditional GrantsDuring the reporting period, the County received Kshs.199.86 million as conditional grants as shown in Table 3.59.
Table 3.59: Lamu County, Conditional Grants/Loans Received in the FY 2018/19
S/No Grants Annual CARA, 2018 Allocation (in Kshs)
Annual Budget Allocation (in
Kshs)
Actual Receipts in the FY 2018/19 (in
Kshs.)
Actual Receipts as Percentage of Annu-
al Allocation (%)
1 Road Maintenance Fuel Levy Fund 93,421,016 93,421,016 - -
2 Leasing of Medical Equipment 200,000,000 - - -
3 Kenya Devolution Support Programme (KDSP) 33,793,559 33,793,559 - -
4 Compensation for User Fee Foregone 2,451,034 2,451,034 2,451,034 100
5 DANIDA Grant 8,302,500 8,302,500 8,302,500 100
6 Supplement for Construction of County Head-quarters 121,000,000 242,000,000 - -
7 Development of Youth Polytechnics (TVETs grants) 31,210,000 31,210,000 23,563,550 75.5
8 Conditional Allocation - Other Loans & Grants - 16,158,635 - -

141
COUNTY GOVERNMENTS ANNUAL BUDGET IMPLEMENTATION REVIEW REPORT FOR FY 2018/19
S/No Grants Annual CARA, 2018 Allocation (in Kshs)
Annual Budget Allocation (in
Kshs)
Actual Receipts in the FY 2018/19 (in
Kshs.)
Actual Receipts as Percentage of Annu-
al Allocation (%)
9 World Bank Loan for Transforming Health Sys-tem for Universal Care Project 50,000,000 50,000,000 20,540,204 41.1
10 Kenya Climate Smart Agriculture Project 150,000,000 150,000,000 53,806,243 36
11 KENYA Urban Support Program 50,000,000 50,000,000 91,200,000 182.4
Grand Total 740,178,109.0 677,336,744.0 199,863,530.5 27
Source: Lamu County Treasury
During the reporting period, receipts from the Kenya Urban Support Program (KUSP) conditional grant recorded the highest performance in percentage terms, and accounted 182.4 per cent of the annual target.
3.21.4 Exchequer IssuesIn order to implement the budget, the Controller of Budget approved withdrawal of Kshs.2.97 billion from the CRF account. The withdrawals represented 61.2 per cent of the Approved Supplementary Budget and translated to an increase of 25.9 per cent from Kshs.2.36 billion in FY 2017/18 and comprised of Kshs.724.20 million (24.4 per cent) towards development activities and Kshs.2.24 billion (75.6 per cent) for recurrent expenditure.
3.21.5 Overall Expenditure ReviewA total of Kshs.2.90 billion was spent on both development and recurrent activities. This expenditure represented 97.8 per cent of the total funds released from the CRF account, and was an increase of 40.8 per cent from Kshs.2.06 billion spent in FY 2017/18.
The expenditure excluded pending bills as at June 30, 2019 which amounted to Kshs.54.78 million for development activities and Kshs.57.53 million for recurrent costs.
Expenditure on development programmes amounted to Kshs.693.60 million while Kshs.2.21 billion was spent on recurrent activities. The development expenditure was 95.8 per cent of the funds released for development programmes, while recurrent expenditure was 98.5 per cent of funds released for recurrent activities.
Development expenditure recorded an absorption rate of 30.4 per cent, which was a decrease from 35.8 per cent attained in FY 2017/18. Conversely, recurrent expenditure represented 86.2 per cent of the annual recurrent budget, an increase from 84.6 per cent recorded in FY 2017/18.
Figure 3.83 presents a comparison between the total expenditure in FY 2018/19 and FY 2017/18.

142
COUNTY GOVERNMENTS ANNUAL BUDGET IMPLEMENTATION REVIEW REPORT FOR FY 2018/19
Figure3.83: LamuCounty,ExpenditurebyEconomicClassification
180
3.21.5 Overall Expenditure Review A total of Kshs.2.90 billion was spent on both development and recurrent activities. This expenditure represented 97.8
per cent of the total funds released from the CRF account, and was an increase of 40.8 per cent from Kshs.2.06 billion
spent in FY 2017/18.
The expenditure excluded pending bills as at June 30, 2019 which amounted to Kshs.54.78 million for development
activities and Kshs.57.53 million for recurrent costs.
Expenditure on development programmes amounted to Kshs.693.60 million while Kshs.2.21 billion was spent on
recurrent activities. The development expenditure was 95.8 per cent of the funds released for development programmes,
while recurrent expenditure was 98.5 per cent of funds released for recurrent activities.
Development expenditure recorded an absorption rate of 30.4 per cent, which was a decrease from 35.8 per cent attained
in FY 2017/18. Conversely, recurrent expenditure represented 86.2 per cent of the annual recurrent budget, an increase
from 84.6 per cent recorded in FY 2017/18.
Figure 3.83 presents a comparison between the total expenditure in FY 2018/19 and FY 2017/18.
Figure 3.83:Lamu County, Expenditure by Economic Classification
Source: Lamu County Treasury
3.21.6 Development Expenditure Analysis The total development expenditure of Kshs.693.60 million represented 30.4 per cent of the annual development
expenditure estimates of Kshs.2.28 billion. Table 3.60 provides a summary of development projects with the highest
expenditure in the financial year.
Table 3.60:Lamu County, List of Development Projects with the Highest Expenditure in FY 2018/19
1,090.44(52.9%)
609.31(29.6%)
361.27(17.5%)
1,255.56(43.3%)
953.08(32.8%)
693.60(23.9%)
-
200
400
600
800
1,000
1,200
1,400
Personnel Emoluments Operations and Maintenance Development Expenditure
Ksh
s.Mill
ion
Expenditure by Economic Classification
FY 2017/18
FY 2018/19
Key
Source: Lamu County Treasury
3.21.6 Development Expenditure AnalysisThe total development expenditure of Kshs.693.60 million represented 30.4 per cent of the annual development expenditure estimates of Kshs.2.28 billion. Table 3.60 provides a summary of development projects with the highest expenditure in the financial year.
Table 3.60: Lamu County, List of Development Projects with the Highest Expenditure in FY 2018/19
S/No. Project Name Project Location Project Budget (Kshs.)
FY2018/19 Project Expenditure
(Kshs.)
Absorption rate (%)
1 Project on street lighting Lamu County 162,000,000 124,071,835 77
2 Universal Health Care Insurance Lamu County 120,000,000 113,627,100 95
3 County Assembly headquarters. Mokowe -Hindi ward 245,000,000 67,102,000 27
4 Speaker’s residence Shella/Manda ward 160,000,000 49,427,000 31
5 Supply and delivery of certified seeds Lamu County 32,636,000 32,636,000 100
6 Transfers of vocational training village polytechnic Lamu County 62,990,441 31,780,441 50
7 Maintenance of road A7 junction Mokowe Mokowe village 16,977,673 16,977,673 100
8 Routine maintenance of bangure - kizuke junction Mpeketoni 15,945,682 15,945,682 100
9 Road maintenance Mpeketoni - Ndambwe Mpeketoni 14,888,151 14,888,151 100
10 Routine maintenance works at Ras Kitau Shella ward 14,605,792 14,605,792 100
Source: Lamu County Treasury
3.21.7 Analysis of Recurrent ExpenditureThe total recurrent expenditure of Kshs.2.21 billion comprised of Kshs.1.26 billion (57 per cent) incurred on personnel emoluments and Kshs.953.08 million (43 per cent) on operations and maintenance as shown in Figure 3.83.

143
COUNTY GOVERNMENTS ANNUAL BUDGET IMPLEMENTATION REVIEW REPORT FOR FY 2018/19
Expenditure on personnel emoluments represented an increase of 15.1 per cent compared to FY 2017/18 when the County spent Kshs.1.09 billion and was 43.3 per cent of the total expenditure in FY 2018/19.Figuer 3.84 shows a summary of operations and maintenance expenditure by major categories.
Figure 3.84: Lamu County, Operations and Maintenance Expenditure by Major Categories in FY 2018/19
181
S/No. Project Name Project Location Project Budget
(Kshs.)
FY2018/19 Project
Expenditure (Kshs.)
Absorption rate (%)
1 Project on street lighting Lamu County 162,000,000 124,071,835 77 2 Universal Health Care Insurance Lamu County 120,000,000 113,627,100 95
3 County Assembly headquarters. Mokowe -Hindi ward 245,000,000 67,102,000 27
4 Speaker's residence Shella/Manda ward 160,000,000 49,427,000 31 5 Supply and delivery of certified seeds Lamu County 32,636,000 32,636,000 100 6 Transfers of vocational training village polytechnic Lamu County 62,990,441 31,780,441 50 7 Maintenance of road A7 junction Mokowe Mokowe village 16,977,673 16,977,673 100 8 Routine maintenance of bangure - kizuke junction Mpeketoni 15,945,682 15,945,682 100 9 Road maintenance Mpeketoni - Ndambwe Mpeketoni 14,888,151 14,888,151 100 10 Routine maintenance works at Ras Kitau Shella ward 14,605,792 14,605,792 100 Source: Lamu County Treasury
3.21.7 Analysis of Recurrent Expenditure The total recurrent expenditure of Kshs.2.21 billion comprised of Kshs.1.26 billion (57 per cent) incurred on personnel
emoluments and Kshs.953.08 million (43 per cent) on operations and maintenance as shown in Figure 3.83.
Expenditure on personnel emoluments represented an increase of 15.1 per cent compared to FY 2017/18 when the
County spent Kshs.1.09 billion and was 43.3 per cent of the total expenditure in FY 2018/19.Figuer 4 shows a summary
of operations and maintenance expenditure by major categories.
Figure 3.84: Lamu County, Operations and Maintenance Expenditure by Major Categories in FY 2018/19
Source: Lamu County Treasury
182.70
126.90
73.8666.33
52.85 50.10 49.8640.00 37.28 36.02
0
20
40
60
80
100
120
140
160
180
200
Ksh
s. M
illio
n
Major Categories of Operations & Maintenance
Source: Lamu County Treasury
The County spent Kshs.12.26 million on committee sitting allowances for the 18 MCAs and Speaker against the annual budget allocation of Kshs.14.50 million. This represented an increase of 2.9 per cent compared to Kshs.11.91 million spent in FY 2017/18. The average monthly sitting allowance translated to Kshs.53,754 per MCA against the SRC’s recommended monthly ceiling of Kshs.124,800.
Expenditure on domestic and foreign travel amounted to Kshs.219.98 million, and comprised of Kshs.96.02 million spent by the County Assembly and Kshs.123.96 million by the County Executive. This expenditure represented 8.6 per cent of total recurrent expenditure and was an increase of 65.2 per cent compared to Kshs.133.14 million spent in FY 2017/18.
3.21.8 Budget Performance by County DepartmentTable 3.61 shows a summary of the approved budget allocation and performance by department in FY 2018/19.

144
COUNTY GOVERNMENTS ANNUAL BUDGET IMPLEMENTATION REVIEW REPORT FOR FY 2018/19
Table 3.61: Lamu County, Budget Performance by Department in FY 2018/19
Department Budget Allocation
(Kshs. Million) Exchequer Issues
(Kshs. Million) Expenditure (Kshs.
Million) Expenditure to Ex-chequer Issues (%) Absorption rate (%)
Rec Dev Rec Dev Rec Dev Rec Dev Rec Dev
County Assembly 404.00 250.00 388.92 116.53 353.69 116.53 90.9 100 87.6 46.6
County Executive 483.53 404.13 398.51 17.00 373.65 17.00 93.8 100 77.3 4.2
Finance, Strategy and Economic Planning 195.42 4.10 159.01 - 160.91 - 101.1 - 82.3 -
Agriculture, Irrigation and Water 130.41 339.27 124.38 101.89 71.04 36.61 57.1 35.9 54.5 10.8
Land, Physical Plan-ning, Infrastructure and Energy 78.54 680.20 71.32 314.00 72.54 321.05 101.7 102.2 92.4 47.2
Education, Gender, Sports, Youth, Culture & Social Services 234.87 170.73 228.52 28.78 223.75 45.87 97.9 159.4 95.3 26.9
Medical Services, Sani-tation and Environment 895.22 339.77 747.98 112.79 829.20 133.23 110.9 118.1 92.6 39.2
Trade, Tourism & In-vestment Development 24.54 35.50 21.47 3.50 19.44 4.39 90.5 125.4 79.2 12.4
Fisheries, Livestock, Veterinary & Coopera-tive Development 68.54 60.90 62.97 24.13 61.79 18.92 98.1 78.4 90.2 31.1
Public Service Board 45.56 - 39.96 - 42.61 - 106.6 - 93.5 -
Public Health 1.51 - - 5.59 - - - - - -
TOTAL 2,562.14 2,284.6 2,243.04 724.21 2,208.62 693.60 98.5 95.8 86.2 30.4
Source: Lamu County Treasury
Analysis of expenditure by department shows that the Department of Land, Physical Planning, Infrastructure and Energy recorded the highest absorption rate of development budget at 47.2 per cent while the Department of Finance, Strategy & Economic Planning did not utilize its development budget. The Department of Education, Gender, Sports, Youth, and Culture & Social Services had the highest percentage of recurrent expenditure to recurrent budget at 95.3 per cent while the Department of Public Health did not incur any expenditure.
3.21.9 Key Observations and RecommendationsThe County has made progress in addressing some of the challenges previously identified as affecting budget implementation. Some of the progress made included:
i. Establishment of the County Budget and Economic Forum (CBEF) in line with Section 137 of the PFM Act, 2012.
ii. Improvement in the collection of own source revenue by 37.7 per cent from Kshs.52.2 million in FY 2017/18 to Ksh.71.87 million in the reporting period, which is 102.7 per cent of the annual target.
Despite the above progress, the following challenges continued to hamper effective budget implementation;
1. High wage bill that has risen by 15.1 per cent from Kshs.1.09 billion in FY 2017/18 to Kshs.1.26 billion in the period under review.
2. Low absorption of development budget. In the reporting period, the County attained an absorption rate of 30.4 per cent which was a drop from 35.8 per cent in FY 2017/18.
3. Late submission of reports on financial and non-financial performance by the County Treasury, which affected timely preparation of budget implementation report contrary to Section 166 of the PFM Act, 2012.
4. IFMIS connectivity challenges, which slowed down approval of procurement requests and payment to suppliers.
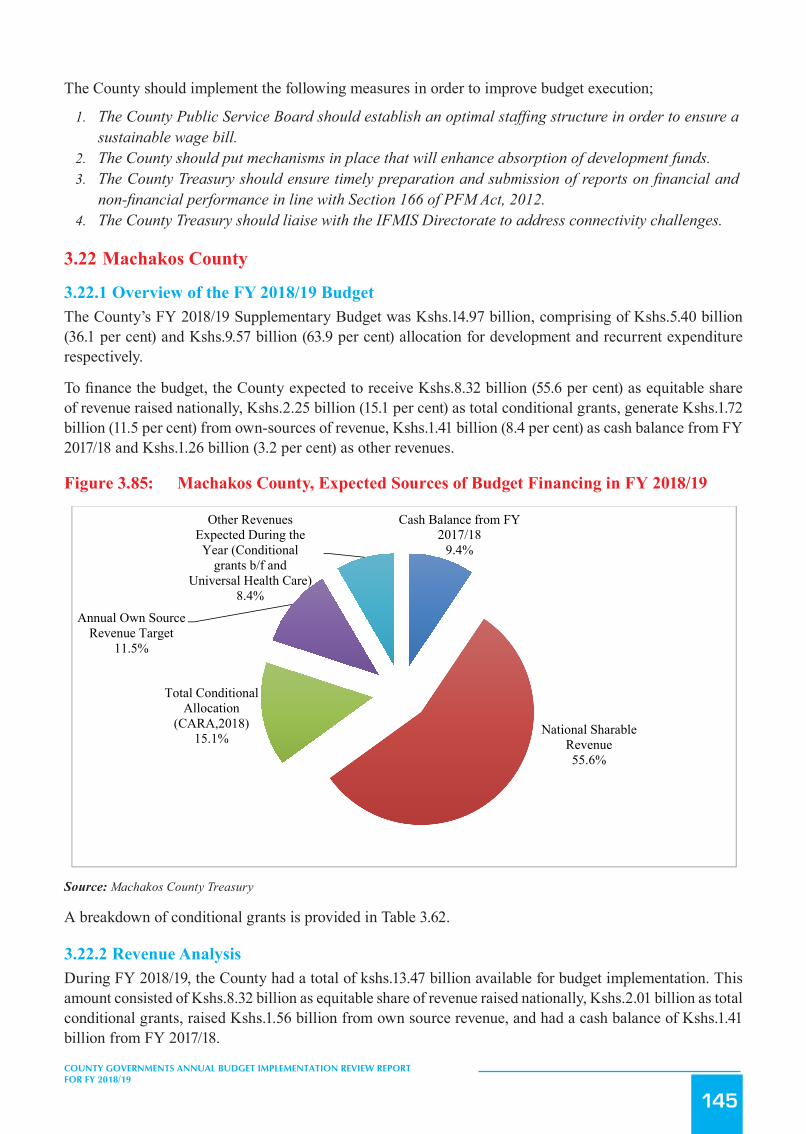
145
COUNTY GOVERNMENTS ANNUAL BUDGET IMPLEMENTATION REVIEW REPORT FOR FY 2018/19
The County should implement the following measures in order to improve budget execution;
1. The County Public Service Board should establish an optimal staffing structure in order to ensure a sustainable wage bill.
2. The County should put mechanisms in place that will enhance absorption of development funds.3. The County Treasury should ensure timely preparation and submission of reports on financial and
non-financial performance in line with Section 166 of PFM Act, 2012.4. The County Treasury should liaise with the IFMIS Directorate to address connectivity challenges.
3.22 Machakos County
3.22.1 Overview of the FY 2018/19 BudgetThe County’s FY 2018/19 Supplementary Budget was Kshs.14.97 billion, comprising of Kshs.5.40 billion (36.1 per cent) and Kshs.9.57 billion (63.9 per cent) allocation for development and recurrent expenditure respectively.
To finance the budget, the County expected to receive Kshs.8.32 billion (55.6 per cent) as equitable share of revenue raised nationally, Kshs.2.25 billion (15.1 per cent) as total conditional grants, generate Kshs.1.72 billion (11.5 per cent) from own-sources of revenue, Kshs.1.41 billion (8.4 per cent) as cash balance from FY 2017/18 and Kshs.1.26 billion (3.2 per cent) as other revenues.
Figure 3.85: Machakos County, Expected Sources of Budget Financing in FY 2018/19
184
Source: Machakos County Treasury A breakdown of conditional grants is provided in Table 3.81 .
3.22.2 Revenue Analysis During FY 2018/19, the County had a total of kshs.13.47 billion available for budget implementation. This amount
consisted of Kshs.8.32 billion as equitable share of revenue raised nationally, Kshs.2.01 billion as total conditional
grants, raised Kshs.1.56 billion from own source revenue, and had a cash balance of Kshs.1.41 billion from FY 2017/18.
Figure 3.86 shows the annual trend in own source revenue collection from FY 2013/14 to FY 2018/19.
Figure 3.86: Machakos County, Trend in Own Source Revenue Collection in FY 2018/19
Cash Balance from FY 2017/18
9.4%
National Sharable Revenue55.6%
Total Conditional Allocation
(CARA,2018)15.1%
Annual Own Source Revenue Target
11.5%
Other Revenues Expected During the
Year (Conditional grants b/f and
Universal Health Care)8.4%
Source: Machakos County Treasury
A breakdown of conditional grants is provided in Table 3.62.
3.22.2 Revenue AnalysisDuring FY 2018/19, the County had a total of kshs.13.47 billion available for budget implementation. This amount consisted of Kshs.8.32 billion as equitable share of revenue raised nationally, Kshs.2.01 billion as total conditional grants, raised Kshs.1.56 billion from own source revenue, and had a cash balance of Kshs.1.41 billion from FY 2017/18.
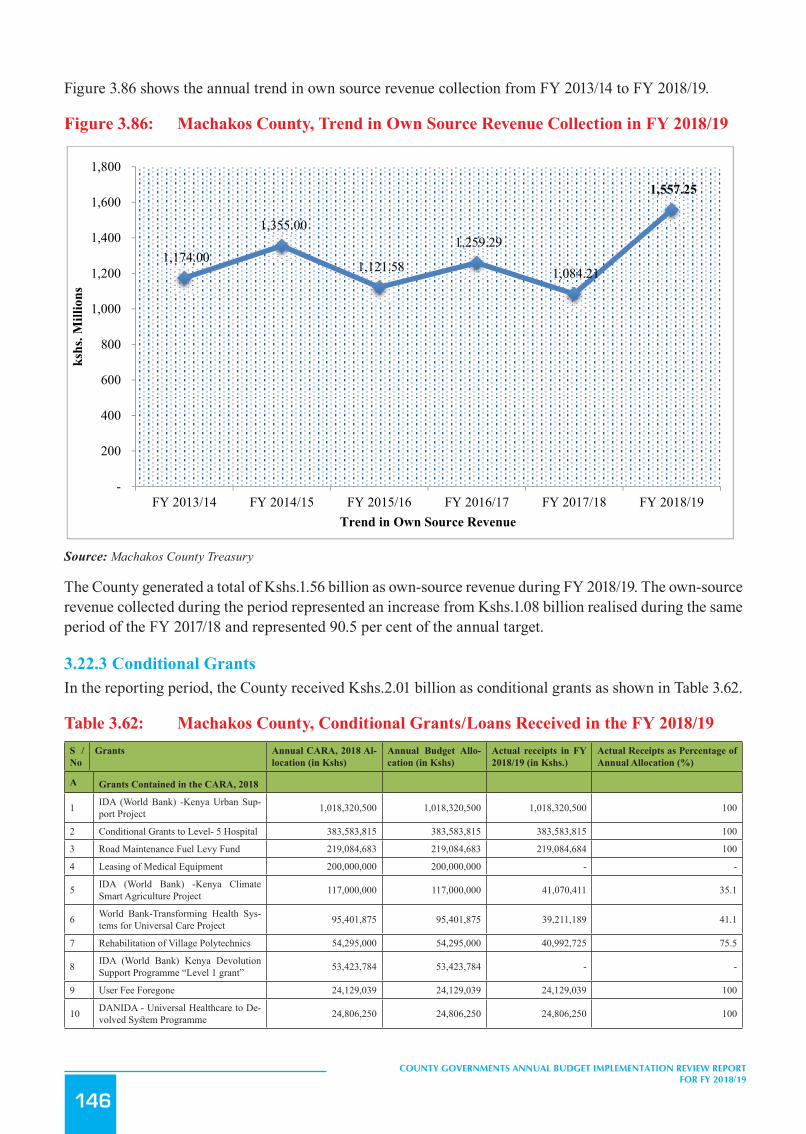
146
COUNTY GOVERNMENTS ANNUAL BUDGET IMPLEMENTATION REVIEW REPORT FOR FY 2018/19
Figure 3.86 shows the annual trend in own source revenue collection from FY 2013/14 to FY 2018/19.
Figure 3.86: Machakos County, Trend in Own Source Revenue Collection in FY 2018/19
185
Source: Machakos County Treasury
The County generated a total of Kshs.1.56 billion as own-source revenue during FY 2018/19. The own-source revenue
collected during the period represented an increase from Kshs.1.08 billion realised during the same period of the FY
2017/18 and represented 90.5 per cent of the annual target.
3.22.3 Conditional Grants In the reporting period, the County received Kshs.2.01 billion as conditional grants as shown in Table 3.62.
Table 3.62: Machakos County, Conditional Grants/Loans Received in the FY 2018/19
S/No Grants Annual CARA, 2018 Allocation (in Kshs)
Annual BudgetAllocation (inKshs)
Actual receipts in FY 2018/19 (inKshs.)
Actual Receipts as Percentage of Annual Allocation (%)
A Grants Contained in the CARA, 2018
1 IDA (World Bank) -Kenya Urban Support Project 1,018,320,500 1,018,320,500 1,018,320,500 100
2 Conditional Grants to Level- 5 Hospital 383,583,815 383,583,815 383,583,815 100 3 Road Maintenance Fuel Levy Fund 219,084,683 219,084,683 219,084,684 100 4 Leasing of Medical Equipment 200,000,000 200,000,000 - -
5 IDA (World Bank) -Kenya Climate Smart Agriculture Project 117,000,000 117,000,000 41,070,411 35.1
6 World Bank-Transforming Health Systems for Universal Care Project 95,401,875 95,401,875 39,211,189 41.1
7 Rehabilitation of Village Polytechnics 54,295,000 54,295,000 40,992,725 75.5
8 IDA (World Bank) Kenya Devolution Support Programme “Level 1 grant” 53,423,784 53,423,784 - -
9 User Fee Foregone 24,129,039 24,129,039 24,129,039 100
10 DANIDA - Universal Healthcare to Devolved System Programme 24,806,250 24,806,250 24,806,250 100
11 IDA (World Bank) -Kenya Urban Support Project - Urban grants 41,200,000 41,200,000.00 41,200,000 100
12 Sweden- ASDSP 21,107,671 21,107,671.00 7,684,832 36.4
1,174.00
1,355.00
1,121.58
1,259.29
1,084.21
1,557.25
-
200
400
600
800
1,000
1,200
1,400
1,600
1,800
FY 2013/14 FY 2014/15 FY 2015/16 FY 2016/17 FY 2017/18 FY 2018/19
kshs
. Mill
ions
Trend in Own Source Revenue
Source: Machakos County Treasury
The County generated a total of Kshs.1.56 billion as own-source revenue during FY 2018/19. The own-source revenue collected during the period represented an increase from Kshs.1.08 billion realised during the same period of the FY 2017/18 and represented 90.5 per cent of the annual target.
3.22.3 Conditional GrantsIn the reporting period, the County received Kshs.2.01 billion as conditional grants as shown in Table 3.62.
Table 3.62: Machakos County, Conditional Grants/Loans Received in the FY 2018/19S /No
Grants Annual CARA, 2018 Al-location (in Kshs)
Annual Budget Allo-cation (in Kshs)
Actual receipts in FY 2018/19 (in Kshs.)
Actual Receipts as Percentage of Annual Allocation (%)
A Grants Contained in the CARA, 2018
1 IDA (World Bank) -Kenya Urban Sup-port Project 1,018,320,500 1,018,320,500 1,018,320,500 100
2 Conditional Grants to Level- 5 Hospital 383,583,815 383,583,815 383,583,815 100
3 Road Maintenance Fuel Levy Fund 219,084,683 219,084,683 219,084,684 100
4 Leasing of Medical Equipment 200,000,000 200,000,000 - -
5 IDA (World Bank) -Kenya Climate Smart Agriculture Project 117,000,000 117,000,000 41,070,411 35.1
6 World Bank-Transforming Health Sys-tems for Universal Care Project 95,401,875 95,401,875 39,211,189 41.1
7 Rehabilitation of Village Polytechnics 54,295,000 54,295,000 40,992,725 75.5
8 IDA (World Bank) Kenya Devolution Support Programme “Level 1 grant” 53,423,784 53,423,784 - -
9 User Fee Foregone 24,129,039 24,129,039 24,129,039 100
10 DANIDA - Universal Healthcare to De-volved System Programme 24,806,250 24,806,250 24,806,250 100

147
COUNTY GOVERNMENTS ANNUAL BUDGET IMPLEMENTATION REVIEW REPORT FOR FY 2018/19
S /No
Grants Annual CARA, 2018 Al-location (in Kshs)
Annual Budget Allo-cation (in Kshs)
Actual receipts in FY 2018/19 (in Kshs.)
Actual Receipts as Percentage of Annual Allocation (%)
11 IDA (World Bank) -Kenya Urban Sup-port Project - Urban grants 41,200,000 41,200,000.00 41,200,000 100
12 Sweden- ASDSP 21,107,671 21,107,671.00 7,684,832 36.4
Sub Total 2,252,352,617 2,252,352,617 1,840,083,445 81.7
B Other Grants
13 Universal Health Coverage (UHC) Grants - 787,524,789 168,066,136.00 21.3
Sub Total - 787,524,789 168,066,136.00 21.3
Grand Total 2,252,352,617 3,039,877,406 2,008,149,581 66.1
Source: Machakos County Treasury
During the reporting period, receipts from the Kenya Urban Support Project, Grants to Level- 5 Hospital, Road Maintenance Fuel Levy Fund, User Fee Foregone, and DANIDA recorded the highest performance in percentage terms and accounted for 100 per cent of the annual target respectively.
3.22.4 Exchequer IssuesIn order to finance the budget, the Controller of Budget approved the withdrawal of Kshs.11.73 billion from the CRF account. The withdrawals represented 78.4 per cent of the Approved Budget and translated to a an increase of 46.3 per cent from Kshs.8.02 billion approved in FY 2017/18 and comprised of Kshs.3.09 billion (26.4 per cent) towards development activities and Kshs.8.63 billion (73.6 per cent) for recurrent expenditure.
3.22.5 Overall Expenditure ReviewA total of Kshs.11.65 billion was spent on both recurrent and development activities. The expenditure represented 99.6 per cent of the total funds released from the CRF account and was an increase of 58.1 per cent from Kshs.7.38 billion spent in FY 2017/18.
The expenditure excluded outstanding commitments as at June 30, 2019 which amounted to Kshs.73.44 million for development activities and Kshs.486.15 million for recurrent expenditure.
Expenditure on development programmes amounted to Kshs.3.09 billion while Kshs.8.55 billion was spent on recurrent activities. The development expenditure was 100 per cent of funds released for development activities while recurrent expenditure was 99.1 per cent of the funds released for recurrent activities, while development expenditure.
Development expenditure recorded an absorption rate of 57.4 per cent, which was an increase from 33.3 per cent attained in FY 2017/18. Conversely, recurrent expenditure represented 89.4 per cent of the annual recurrent budget, a decrease from 90.8 per cent recorded in FY 2017/18.
Figure 3.87 presents a comparison between the total expenditure in FY 2018/19 and the FY 2017/18.

148
COUNTY GOVERNMENTS ANNUAL BUDGET IMPLEMENTATION REVIEW REPORT FOR FY 2018/19
Figure3.87: MachakosCounty,ExpenditurebyEconomicClassification
187
Source: Machakos County Treasury
3.22.6 Development Expenditure Analysis The total development expenditure of Kshs.3.09 billion represented 57.4 per cent of the annual development budget of
Kshs.5.4 billion. Table 3.63 provides a summary of development projects with the highest expenditure in the financial
year.
Table 3.63: Machakos County, List of Development Projects with the Highest Expenditure in the FY 2018/19
S/No.
Project Name ProjectLocation
Project Budget (Kshs.)
ProjectExpenditure in FY 2018/19 (Kshs.)
Absorption rate (%)
1 Construction of Nthungululu Dam Yatta 150,000,000 46,406,868 30.9
2 Construction of a 12 storey building at the Machakos New City. Machakos 394,999,999 41,407,638 10.5
3 Construction of Government building at The Machakos New City Machakos 399,640,361 34,165,960 8.5
4 Construction of Mumbuni Dam Kibauni 78,000,000 19,915,410 25.5
5 Construction of Machakos County Office Machakos 287,110,237 14,971,734 5.2
6 Routine Maintenance of Kithini – Vota road Machakos 21,339,957 12,494,431 58.5
4,834.43(65.5%)
1,527.85(20.7%)
1,021.77(13.8%)
5,855.01(50.2%)
2,699.71,(23.2%)
3,097.87(26.6%)
-
1,000
2,000
3,000
4,000
5,000
6,000
7,000
Personnel Emoluments Operations and Maintenance Development Expenditure
Ksh
s.Mill
ion
Expenditure by Economic Classification
FY 2017/18
FY 2018/19
Key
Source: Machakos County Treasury
3.22.6 Development Expenditure AnalysisThe total development expenditure of Kshs.3.09 billion represented 57.4 per cent of the annual development budget of Kshs.5.4 billion. Table 3.63 provides a summary of development projects with the highest expenditure in the financial year.
Table 3.63: Machakos County, List of Development Projects with the Highest Expenditure in the FY 2018/19
S /No. Project Name Project Location Project Budget
(Kshs.)
Project Expendi-ture in FY 2018/19
(Kshs.)
Absorption rate (%)
1 Construction of Nthungululu Dam Yatta 150,000,000 46,406,868 30.9
2 Construction of a 12 storey building at the Machakos New City. Machakos 394,999,999 41,407,638 10.5
3 Construction of Government building at The Machakos New City Machakos 399,640,361 34,165,960 8.5
4 Construction of Mumbuni Dam Kibauni 78,000,000 19,915,410 25.5
5 Construction of Machakos County Office Machakos 287,110,237 14,971,734 5.2
6 Routine Maintenance of Kithini – Vota road Machakos 21,339,957 12,494,431 58.5
7 Routine Maintenance of Kenol-Mutwani-Lukenya road Yatta 11,225,331 11,211,046 99.9

149
COUNTY GOVERNMENTS ANNUAL BUDGET IMPLEMENTATION REVIEW REPORT FOR FY 2018/19
S /No. Project Name Project Location Project Budget
(Kshs.)
Project Expendi-ture in FY 2018/19
(Kshs.)
Absorption rate (%)
8 Construction of Machakos Conference facility at Machakos People’s Park Machakos 74,170,816 10,830,451 14.6
9 Routine Maintenance at Kathiani – Kangundo road Kangundo 16,211,916 9,994,316 61.6
10 Installation of drainage facilities at Kituluni-Kitambaasye road Matungulu 9,806,000 9,732,800 99.3
Source: Machakos County Treasury.
3.22.7 Analysis of Recurrent ExpenditureThe total recurrent expenditure of Kshs.8.55 billion comprised of Kshs.5.86 billion (68.4 per cent) incurred on personnel emoluments and Kshs.2.70 billion (31.6 per cent) on operations and maintenance.
Expenditure on personnel emoluments represented an increase of 21.1 per cent compared to FY 2017/18 when the County spent Kshs.4.83 billion, and was 50.2 per cent of total expenditure in FY 2018/19.
Figure 3.88 shows a summary of operations and maintenance expenditure by major categories.
Figure 3.88: Machakos County, Operations and Maintenance Expenditure by Major Categories in FY 2018/19
189
Source: Machakos County Treasury
The County spent Kshs.40.71 million to cater for the committee sitting allowances for the 61 MCAs against the annual
budget allocation of Kshs.40.71 million. This represented an increase of 114.1 per cent compared to Kshs.19.02 million
spent in FY 2017/18. The average monthly sitting allowance translated to Kshs.56,548 per MCA against the SRC’s
recommended monthly ceiling of Kshs.124,800.
Expenditure on domestic and foreign travel amounted to Kshs.642.93 million and comprised of Kshs.327.11 million
spent by the County Assembly and Kshs.315.82 million spent by the County Executive. This represented 7.5 per cent of
total recurrent expenditure and was an increase of 70.8 per cent compared to Kshs.376.37 million spent in FY 2017/18.
3.22.8 Budget Performance by County Department Table 3.64 shows a summary of the approved budget allocation and performance by department in FY 2018/19.
Table 3.64: Machakos County, Budget Performance by Department in FY 2018/19
Department Budget Allocation (Kshs. Million)
Exchequer Issues (Kshs. Million)
Expenditure (Kshs. Million)
Expenditure to Exchequer Issues (%)
Absorption rate (%)
Rec Dev Rec Dev Rec Dev Rec Dev Rec Dev
Office of the Governor 595.71 16.84 545.76 - 389.62 10.89 71.4 - 65 65
550.06
228.08
171.72 146.64
124.05 92.87 71.38 68.43 56.18 40.71
0
100
200
300
400
500
600
Ksh
s. M
illio
n
Major Categories of O&M
Source: Machakos County Treasury.
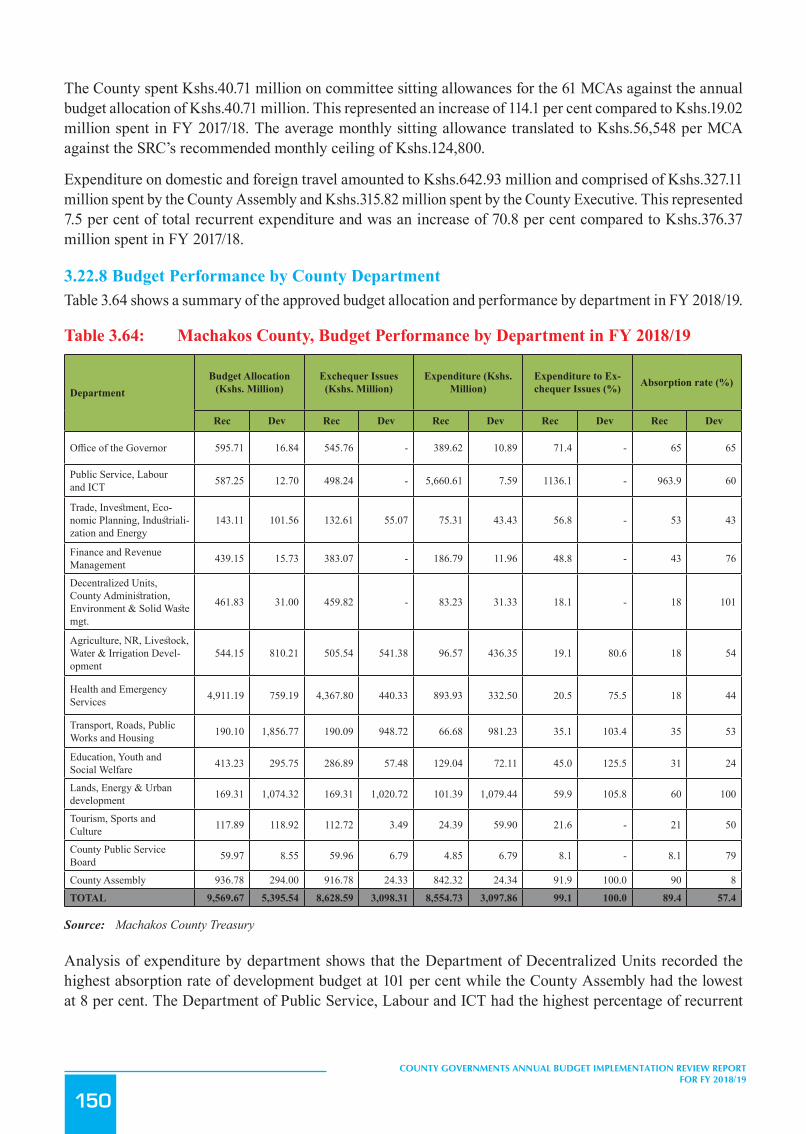
150
COUNTY GOVERNMENTS ANNUAL BUDGET IMPLEMENTATION REVIEW REPORT FOR FY 2018/19
The County spent Kshs.40.71 million on committee sitting allowances for the 61 MCAs against the annual budget allocation of Kshs.40.71 million. This represented an increase of 114.1 per cent compared to Kshs.19.02 million spent in FY 2017/18. The average monthly sitting allowance translated to Kshs.56,548 per MCA against the SRC’s recommended monthly ceiling of Kshs.124,800.
Expenditure on domestic and foreign travel amounted to Kshs.642.93 million and comprised of Kshs.327.11 million spent by the County Assembly and Kshs.315.82 million spent by the County Executive. This represented 7.5 per cent of total recurrent expenditure and was an increase of 70.8 per cent compared to Kshs.376.37 million spent in FY 2017/18.
3.22.8 Budget Performance by County DepartmentTable 3.64 shows a summary of the approved budget allocation and performance by department in FY 2018/19.
Table 3.64: Machakos County, Budget Performance by Department in FY 2018/19
DepartmentBudget Allocation
(Kshs. Million)Exchequer Issues
(Kshs. Million)Expenditure (Kshs.
Million)Expenditure to Ex-chequer Issues (%) Absorption rate (%)
Rec Dev Rec Dev Rec Dev Rec Dev Rec Dev
Office of the Governor 595.71 16.84 545.76 - 389.62 10.89 71.4 - 65 65
Public Service, Labour and ICT 587.25 12.70 498.24 - 5,660.61 7.59 1136.1 - 963.9 60
Trade, Investment, Eco-nomic Planning, Industriali-zation and Energy
143.11 101.56 132.61 55.07 75.31 43.43 56.8 - 53 43
Finance and Revenue Management 439.15 15.73 383.07 - 186.79 11.96 48.8 - 43 76
Decentralized Units, County Administration, Environment & Solid Waste mgt.
461.83 31.00 459.82 - 83.23 31.33 18.1 - 18 101
Agriculture, NR, Livestock, Water & Irrigation Devel-opment
544.15 810.21 505.54 541.38 96.57 436.35 19.1 80.6 18 54
Health and Emergency Services 4,911.19 759.19 4,367.80 440.33 893.93 332.50 20.5 75.5 18 44
Transport, Roads, Public Works and Housing 190.10 1,856.77 190.09 948.72 66.68 981.23 35.1 103.4 35 53
Education, Youth and Social Welfare 413.23 295.75 286.89 57.48 129.04 72.11 45.0 125.5 31 24
Lands, Energy & Urban development 169.31 1,074.32 169.31 1,020.72 101.39 1,079.44 59.9 105.8 60 100
Tourism, Sports and Culture 117.89 118.92 112.72 3.49 24.39 59.90 21.6 - 21 50
County Public Service Board 59.97 8.55 59.96 6.79 4.85 6.79 8.1 - 8.1 79
County Assembly 936.78 294.00 916.78 24.33 842.32 24.34 91.9 100.0 90 8
TOTAL 9,569.67 5,395.54 8,628.59 3,098.31 8,554.73 3,097.86 99.1 100.0 89.4 57.4
Source: Machakos County Treasury
Analysis of expenditure by department shows that the Department of Decentralized Units recorded the highest absorption rate of development budget at 101 per cent while the County Assembly had the lowest at 8 per cent. The Department of Public Service, Labour and ICT had the highest percentage of recurrent

151
COUNTY GOVERNMENTS ANNUAL BUDGET IMPLEMENTATION REVIEW REPORT FOR FY 2018/19
expenditure to recurrent budget at 963.9 per cent while the County Public Service Board had the lowest at 8.1 per cent. The recurrent expenditure by the Department of Public Works, ICT and Labour exceeded the approved recurrent estimates as all wages bills were charged in the department.
3.22.9 Key Observations and RecommendationsThe County has made progress in addressing some of the challenges previously identified as affecting budget implementation. Some of the progress made included:
i. Establishment of the Internal Audit Committee in line with Section 155 of the PFM Act, 2012.ii. Timely submission of financial reports to the Controller of Budget by the County Treasury in line
with Section 166 of the PFM Act, 2012.
Despite the above progress, the following challenges continued to hamper effective budget implementation;
1. A high wage bill that increased by 21.1 per cent from Kshs.4.83 billion in FY 2017/18 to Kshs.5.85 billion in FY 2018/19. The wage bill accounted for 50.2 per cent of total expenditure in the reporting period.
2. High expenditure on foreign and domestic travel, which increased by 70.8 per cent from Kshs.376.37 million in FY 2017/18 to Kshs.642.93 million in the reporting period.
3. Inadequate budgetary control that resulted in expenditure above approved budget by the Department of Public Service, Labour and ICT and the Department of Decentralized Units, County Administration, Environment & Solid Waste Management. This is contrary to Section 135 and 154 of PFM Act, 2012.
The County should implement the following measures in order to improve budget execution;
1. The County Public Service Board should develop an optimal staffing structure and devise strategies to contain expenditure on personnel costs within 35 per cent of County’s total revenue in line with Regulation 25(1) (b) of the PFM (County Governments) Regulations, 2015.
2. The County Treasury should ensure that expenditure on non-core budget items is rationalised to provide more resources for development projects.
3. The County Treasury should ensure expenditure is within the approved budget.
3.23 Makueni County
3.23.1 Overview of the FY 2018/19 BudgetThe County’s FY 2018/19 Supplementary Budget was Kshs.10.65 billion, comprising of Kshs.4.42 billion (41.5 per cent) and Kshs.6.23 billion (58.5 per cent) allocation for development and recurrent expenditure respectively.
To finance the budget, the County expects to receive Kshs.7.13 billion (66.9 per cent) as equitable share of the revenue raised nationally, Kshs.1.24 billion ( 11.6 per cent) as total conditional grants, generate Kshs.796.50 million (7.5 per cent) from own sources of revenue, and Kshs.1.49 billion (14.0 per cent) cash balance from FY 2017/18. Included in own source revenue estimate is Kshs.116.0 million for NHIF-FIF- AIA and Kshs.10 million for Makueni Fruit Processing Plant AIA.

152
COUNTY GOVERNMENTS ANNUAL BUDGET IMPLEMENTATION REVIEW REPORT FOR FY 2018/19
Figure 3.89: Makueni County, Expected Sources of Budget Financing in FY 2018/19
191
1. A high wage bill that increased by 21.1 per cent from Kshs.4.83 billion in FY 2017/18 to Kshs.5.85 billion in
FY 2018/19. The wage bill accounted for 50.2 per cent of total expenditure in the reporting period.
2. High expenditure on foreign and domestic travel, which increased by 70.8 per cent from Kshs.376.37 million
in FY 2017/18 to Kshs.642.93 million in the reporting period.
3. Inadequate budgetary control that resulted in expenditure above approved budget by the Department of
Public Service, Labour and ICT and the Department of Decentralized Units, County Administration,
Environment & Solid Waste Management. This is contrary to Section 135 and 154 of PFM Act, 2012.
The County should implement the following measures in order to improve budget execution;
1. The County Public Service Board should develop an optimal staffing structure and devise strategies to
contain expenditure on personnel costs within 35 per cent of County’s total revenue in line with Regulation
25(1) (b) of the PFM (County Governments) Regulations, 2015.
2. The County Treasury should ensure that expenditure on non-core budget items is rationalised to provide
more resources for development projects.
3. The County Treasury should ensure expenditure is within the approved budget.
3.23 Makueni County
3.23.1 Overview of the FY 2018/19 Budget The County’s FY 2018/19 Supplementary Budget was Kshs.10.65 billion, comprising of Kshs.4.42 billion (41.5 per
cent) and Kshs.6.23 billion (58.5 per cent) allocation for development and recurrent expenditure respectively.
To finance the budget, the County expects to receive Kshs.7.13 billion (66.9 per cent) as equitable share of the revenue
raised nationally, Kshs.1.24 billion ( 11.6 per cent) as total conditional grants, generate Kshs.796.50 million (7.5 per
cent) from own sources of revenue, and Kshs.1.49 billion (14.0 per cent) cash balance from FY 2017/18. Included in
own source revenue estimate is Kshs.116.0 million for NHIF-FIF- AIA and Kshs.10 million for Makueni Fruit
Processing Plant AIA.
Figure 3.89: Makueni County, Expected Sources of Budget Financing in FY 2018/19
Cash Balance from FY 2017/18
14.0%
Equitable Share, 66.9%
Conditional Allocations , 11.6%
Own Source Revenue7.5%
Source: Makueni County Treasury
A breakdown of the conditional grants is provided in Table 3.65 .
3.23.2 Revenue AnalysisDuring FY 2018/19, the County had a total of Khs.9.49 billion available for budget implementation. This amount consisted of Kshs.7.13 billion received as equitable share of the revenue raised nationally, Kshs.758.19 million as conditional grants, Kshs.511.70 million generated from own sources of revenue, and a reported cash balance of Kshs.1.09 billion from FY 2017/18.
Figure 3.90 shows the annual trend in own-source revenue collection from FY 2013/14 to FY 2018/19.
Figure 3.90: Makueni County, Own Source Revenue Collection for FY 2013/14 to FY 2018/19
192
Source: Makueni County Treasury
A breakdown of the conditional grants is provided in Table 3.65 .
3.23.2 Revenue Analysis During FY 2018/19, the County had a total of Khs.9.49 billion available for budget implementation. This amount
consisted of Kshs.7.13 billion received as equitable share of the revenue raised nationally, Kshs.758.19 million as
conditional grants, Kshs.511.70 million generated from own sources of revenue, and a reported cash balance of
Kshs.1.09 billion from FY 2017/18.
Figure 3.90 shows the annual trend in own-source revenue collection from FY 2013/14 to FY 2018/19.
Figure 3.90: Makueni County, Own Source Revenue Collection for FY 2013/14 to FY 2018/19
Source: County Treasury
The County generated a total of Kshs.511.70 million from own revenue sources in FY 2018/19. This amount
represented an increase of Kshs.192.44 million compared to that realised in FY 2017/18 and was 64.2 per cent of the
annual target.
3.23.3 Conditional Grants During the reporting period, the County received Kshs.758.19 million as conditional grants as shown in Table 3.65.
Table 3.65: Makueni County, Conditional Grants/Loans Received in the FY 2018/19
S/No Grants Annual
CARA, 2018 Allocation (in
Kshs)
Annual Budget Allocation (in
Kshs)
Actual receipts in the
FY 2018/19 (in Kshs.)
Actual Receipts as Percentage of Annual Allocation
(%)
A Grants Contained in the CARA, 2018
1 IDA (World Bank) credit: Kenya Urban Support Project (KUSP) - Urban Institutional Grants (UIG) + Bal C/F in FY 2017/18 41,200,000 40,000,000 41,200,000 103
189.19215.35 213.71 216.26
319.27
511.70
0
100
200
300
400
500
600
FY 2013/14 FY 2014/15 FY 2015/16 FY 2016/17 FY 2017/18 FY 2018/19
Kshs
. Mill
ions
Trend in Own Source Revenue
Source: County Treasury

153
COUNTY GOVERNMENTS ANNUAL BUDGET IMPLEMENTATION REVIEW REPORT FOR FY 2018/19
The County generated a total of Kshs.511.70 million from own revenue sources in FY 2018/19. This amount represented an increase of Kshs.192.44 million compared to that realised in FY 2017/18 and was 64.2 per cent of the annual target.
3.23.3 Conditional GrantsDuring the reporting period, the County received Kshs.758.19 million as conditional grants as shown in Table 3.65.
Table 3.65: Makueni County, Conditional Grants/Loans Received in the FY 2018/19
S/No GrantsAnnual CARA, 2018 Allocation
(in Kshs)
Annual Budget Allocation (in
Kshs)
Actual receipts in the FY
2018/19 (in Kshs.)
Actual Receipts as
Percentage of Annual Allo-cation (%)
A Grants Contained in the CARA, 2018
1IDA (World Bank) credit: Kenya Urban Support Project (KUSP) - Urban Institutional Grants (UIG) + Bal C/F in FY 2017/18 41,200,000 40,000,000 41,200,000 103
2 Road Maintenance Fuel Levy 187,668,766 187,668,766 187,668,767 100
3 Compensation for User Fee Foregone 19,435,760 19,435,760 19,435,760 100
4 IDA (World Bank) -Kenya Urban Support Project (KUSP) 136,261,600 136,261,600 136,261,600 100
5 DANIDA - Universal Healthcare in Devolved System Programme 22,882,500 22,882,500 22,882,500 100
6 Rehabilitation of Village Polytechnics 31,570,000 31,570,000 23,835,350 75.5
7 Transforming Health Systems for Universal Care Project (World Bank) 100,000,000 100,000,000 51,160,924 51.2
8Sweden - Agriculture Sector Development Support Programme (ASD-SP) II + Bal C/F in FY 2017/18 22,730,225 21,551,135 8,275,568 38.4
9IDA (World Bank) -National Agricultural and Rural Inclusive Growth Project (NARIGP) 140,435,163 140,435,163 50,078,476 35.7
10 Leasing of Medical Equipment 200,000,000 200,000,000 - -
11IDA (World Bank) Kenya Devolution Support Programme “Level 1 grant” 50,750,604 50,750,604 - -
12 EU Grant- Instruments for Devolution Advice and Support- IDEAS) 45,000,000 45,000,000 - -
Sub Total 997,934,618 995,555,528 540,798,945 54.2
B Other Grants
14 KDSP Grant - Investment Grant - 168,575,682 168,575,682 100
15 EU Grant for instrument for Devolution Advice and support - 66,000,000 48,818,153 74
16DANIDA Grant (Universal Healthcare in Devolved System Program) - FY 2017/18 Funds - 9,479,639 - -
Sub Total - 244,055,321 217,393,835 89.1
Grand Total 997,934,618 1,239,610,849 758,192,780 71.3
Source: Makueni County Treasury
During the reporting period, receipts from the Kenya Urban Support Project conditional grant recorded the highest performance in percentage terms, and accounted for 103 per cent of the annual target.
3.23.4 Exchequer IssuesIn order to implement the budget, the Controller of Budget approved withdrawal of Kshs.8.63 billion from the CRF account. The withdrawals represented 81 per cent of the Approved Supplementary Budget and translated to an increase of 8.2 per cent from Kshs.7.98 billion in FY 2017/18 and comprised of Kshs.2.72 billion (31.6 per cent) towards development activities and Kshs.5.91 billion (68.4 per cent) for recurrent expenditure.
3.23.5 Overall Expenditure ReviewA total of Kshs.8.44 billion was spent on both development and recurrent activities. This expenditure represented 97.7 per cent of the total funds released from the CRF account, and was an increase of 17.3 per cent from Kshs.7.19 billion spent in FY 2017/18.

154
COUNTY GOVERNMENTS ANNUAL BUDGET IMPLEMENTATION REVIEW REPORT FOR FY 2018/19
The expenditure excluded pending bills as at June 30, 2019 which amounted to Kshs.6.99 million for development activities and Kshs.1.47 million for recurrent costs.
Expenditure on development programmes amounted to Kshs.2.66 billion while Kshs.5.78 billion was spent on recurrent activities. The development expenditure was 97.5 per cent of the funds released for development programmes, while recurrent expenditure was 97.9 per cent of funds released for recurrent activities.
Development expenditure recorded an absorption rate of 60.1 per cent, which was an increase from 44.8 per cent attained in FY 2017/18. Conversely, recurrent expenditure represented 92.7 per cent of the annual recurrent budget, an increase from 91.7 per cent recorded in FY 2017/18.
Figure 3.91 presents a comparison between the total expenditure in FY 2018/19 and FY 2017/18.
Figure3.91: MakueniCounty,ExpenditurebyEconomicClassification
194
Development expenditure recorded an absorption rate of 60.1 per cent, which was an increase from 44.8 per cent
attained in FY 2017/18. Conversely, recurrent expenditure represented 92.7 per cent of the annual recurrent budget, an
increase from 91.7 per cent recorded in FY 2017/18.
Figure 3.91 presents a comparison between the total expenditure in FY 2018/19 and FY 2017/18.
Figure 3.91: Makueni County, Expenditure by Economic Classification
Source: Makueni County Treasury
3.23.6 Development Expenditure Analysis The total development expenditure of Kshs.2.66 billion represented 60.1 per cent of the annual development
expenditure estimates of Kshs.4.42 billion. Table 3.66 provides a summary of development projects with the highest
expenditure in the financial year.
Table 3.66: Makueni County, List of Development Projects with the Highest Expenditure in FY 2018/19
S/No.
Project Name Project Location Project Budget
Project Expenditure in
FY 2018/19 (Kshs.) Absorption
Rate (%) 1 Universal Health Care Programme County Wide 166,000,000 164,353,154 99
2 IDA (World Bank) credit: Kenya Devolution Support Project (KDSP) " Investment Grant" County Wide 168,575,682 131,753,797 78.2
3 Construction of Thwake bridge substructures Kalawa 106,000,000 103,772,724 97.9
4 Makueni fruit processing plant - Operationalization (Reconstituting Line & other operations) Kalamba 84,451,717 84,262,273 99.8
5 Purchase of graders Makueni County 78,450,000 79,500,000 101.3
6 IDA (World Bank) credit (National Agricultural and Rural Inclusive Growth Project (NARIGP) County Wide 158,929,463 76,938,310 48.4
7 IDA (World Bank) credit: Kenya Urban Support Project(KUSP) Makueni County 136,261,600 74,316,898 54.5
8 Roads upgrade programme - ward - fuel levy funding Makueni County 39,082,714 65,144,591 166.7
9 Transforming Health Systems for Universal Care Project (WB) County Wide 100,000,000 55,850,368 55.9
3,294.28(45.8%)
2,297.21(31.9%)
1,603.30(22.3%)
3,520.10(41.7%)
2,260.63(26.8%)
2,655.81(31.5%)
-
500
1,000
1,500
2,000
2,500
3,000
3,500
4,000
Personnel Emoluments Operations and Maintenance Development Expenditure
Ksh
s.Mill
ion
Expenditure by Economic Classification
FY 2017/18
FY 2018/19
Key
Source: Makueni County Treasury
3.23.6 Development Expenditure AnalysisThe total development expenditure of Kshs.2.66 billion represented 60.1 per cent of the annual development expenditure estimates of Kshs.4.42 billion. Table 3.66 provides a summary of development projects with the highest expenditure in the financial year.

155
COUNTY GOVERNMENTS ANNUAL BUDGET IMPLEMENTATION REVIEW REPORT FOR FY 2018/19
Table 3.66: Makueni County, List of Development Projects with the Highest Expenditure in FY 2018/19
S/No. Project Name Project Location Project Budget
Project Ex-penditure in FY 2018/19 (Kshs.)
Absorption Rate (%)
1 Universal Health Care Programme County Wide 166,000,000 164,353,154 99
2 IDA (World Bank) credit: Kenya Devolution Support Project (KDSP) “ Investment Grant” County Wide 168,575,682 131,753,797 78.2
3 Construction of Thwake bridge substructures Kalawa 106,000,000 103,772,724 97.9
4 Makueni fruit processing plant - Operationalization (Reconstitut-ing Line & other operations) Kalamba 84,451,717 84,262,273 99.8
5 Purchase of graders Makueni County 78,450,000 79,500,000 101.3
6 IDA (World Bank) credit (National Agricultural and Rural Inclu-sive Growth Project (NARIGP) County Wide 158,929,463 76,938,310 48.4
7 IDA (World Bank) credit: Kenya Urban Support Project(KUSP) Makueni County 136,261,600 74,316,898 54.5
8 Roads upgrade programme - ward - fuel levy funding Makueni County 39,082,714 65,144,591 166.7
9 Transforming Health Systems for Universal Care Project (WB) County Wide 100,000,000 55,850,368 55.9
10 EU Grant for instrument for Devolution Advice and supportKalamba 111,000,000 49,636,306 44.7
11 Makueni Youth service - Youth Economic Empowerment strategy County Wide 47,058,285 42,479,176 90.3
Source: Makueni County Treasury
3.23.7 Analysis of Recurrent ExpenditureThe total recurrent expenditure of Kshs.5.78 billion comprised of Kshs.3.52 billion (60.9 per cent) incurred on personnel emoluments and Kshs.2.26 billion (39.1 per cent) on operations and maintenance as shown in Figure 3.91.
Expenditure on personnel emoluments represented an increase of 6.9 per cent compared to FY 2017/18 when the County spent Kshs.3.29 billion and was 41.7 per cent of the total expenditure in FY 2018/19. Figure 3.92 shows a summary of operations and maintenance expenditure by major categories.

156
COUNTY GOVERNMENTS ANNUAL BUDGET IMPLEMENTATION REVIEW REPORT FOR FY 2018/19
Figure 3.92: Makueni County, Operations and Maintenance Expenditure by Major Categories in FY 2018/19
195
S/No.
Project Name Project Location Project Budget
Project Expenditure in
FY 2018/19 (Kshs.) Absorption
Rate (%)
10 EU Grant for instrument for Devolution Advice and support Kalamba 111,000,000 49,636,306 44.7
11 Makueni Youth service - Youth Economic Empowerment strategy County Wide 47,058,285 42,479,176 90.3
Source: Makueni County Treasury
3.23.7 Analysis of Recurrent Expenditure The total recurrent expenditure of Kshs.5.78 billion comprised of Kshs.3.52 billion (60.9 per cent) incurred on personnel
emoluments and Kshs.2.26 billion (39.1 per cent) on operations and maintenance as shown in Figure 3.91.
Expenditure on personnel emoluments represented an increase of 6.9 per cent compared to FY 2017/18 when the
County spent Kshs.3.29 billion and was 41.7 per cent of the total expenditure in FY 2018/19. Figure 3.92 shows a
summary of operations and maintenance expenditure by major categories.
Figure 3.92: Makueni County, Operations and Maintenance Expenditure by Major Categories in FY 2018/19
Source: Makueni County Treasury
The County spent Kshs.52.26 million on committee sitting allowances for the 48 MCAs and Speaker against the annual
budget allocation of Kshs.52.99 million. This represented an increase of 59.7 per cent compared to Kshs.32.73 million
spent in FY 2017/18. The average monthly sitting allowance translated to Kshs.88,881 per MCA against the SRC’s
recommended monthly ceiling of Kshs.124,800.
326.09
231.34
193.11
147.00
87.0069.52 68.00 66.53 55.13 54.84 52.26
0
50
100
150
200
250
300
350
Ksh
s. M
illio
n
Major Categories of Operations & Maintenance
Source: Makueni County Treasury
The County spent Kshs.52.26 million on committee sitting allowances for the 48 MCAs and Speaker against the annual budget allocation of Kshs.52.99 million. This represented an increase of 59.7 per cent compared to Kshs.32.73 million spent in FY 2017/18. The average monthly sitting allowance translated to Kshs.88,881 per MCA against the SRC’s recommended monthly ceiling of Kshs.124,800.
Expenditure on domestic and foreign travel amounted to Kshs.231.34 million, and comprised of Kshs.103.70 million spent by the County Assembly and Kshs.127.64 million by the County Executive. This expenditure represented 4 per cent of total recurrent expenditure and was a decrease of 7.5 per cent compared to Kshs.250.14 million spent in FY 2017/18.
3.23.8 Budget Performance by County DepartmentTable 3.67 shows a summary of the approved budget allocation and performance by department in FY 2018/19.
Table 3.67: Makueni County, Budget Performance by Department in FY 2018/19
DepartmentBudget Allocation (Kshs.
Million)Exchequer Issues (Kshs.
Million)Expenditure (Kshs.
Million)
Expenditure to Exchequer Issues
(%)
Absorption rate (%)
Rec Dev Rec Dev Rec Dev Rec Dev Rec Dev
County Assembly 746.36 101.09 744.18 79.49 657.64 69.83 88.4 87.9 88.1 69.1
Office of the Governor 187.28 - 161.54 - 181.07 - 112.1 96.7 -

157
COUNTY GOVERNMENTS ANNUAL BUDGET IMPLEMENTATION REVIEW REPORT FOR FY 2018/19
DepartmentBudget Allocation (Kshs.
Million)Exchequer Issues (Kshs.
Million)Expenditure (Kshs.
Million)
Expenditure to Exchequer Issues
(%)
Absorption rate (%)
Rec Dev Rec Dev Rec Dev Rec Dev Rec Dev
Office of the Deputy Governor 16.57 - 14.76 - 14.29 - 96.8 86.2 -
County Attorney’s Office 36.09 - 20.75 - 21.08 - 101.6 58.4 -
County Public Service Board 61.24 - 56.60 - 58.74 - 103.8 95.9 -
Office of the County Secretary 312.13 - 295.80 - 298.36 - 100.9 95.6 -
Devolution, Administration, Par-ticipatory Development & Public Service 285.34 16.46 263.18 - 276.16 8.01 104.9 96.8 48.7
Finance & Socio Economic Planning 643.10 90.43 614.64 30.52 618.26 42.41 100.6 139 96.1 46.9
Agriculture, Irrigation, Livestock & Fisheries Development 240.33 791.67 238.02 442.41 238.64 525.55 100.3 118.8 99.3 66.4
Water, Environment & Climate Change 190.11 972.90 182.23 591.89 172.36 423.08 94.6 71.5 90.7 43.5
Education, Youth & ICT 345.45 336.72 299.96 179.40 330.05 225.01 110.0 125.4 95.5 66.8
Health Services 2,798 766.35 2,673.2 390.52 2,581.2 392.09 96.6 100.4 92.3 51.2
Lands, Urban Planning & Mining 67.89 239.99 65.51 239.90 53.14 130.63 81.1 54.5 78.3 54.4
Transport and Infrastructure 193.35 989.13 174.53 685.02 181.78 753.27 104.2 110 94 76.2
Trade, Tourism & Cooperatives 50.95 78.39 46.20 52.57 46.15 52.49 99.9 99.8 90.6 67
Department of Gender and Social Services 60.12 34.23 56.29 32.27 51.79 33.44 92 103.6 86.1 97.7
Total 6,234.4 4,417.4 5,907.4 2,723.98 5,780.7 2,655.8 97.9 97.5 92.7 60.1
Source: Makueni County Treasury
Analysis of expenditure by department shows that the Department of Gender and Social Services recorded the highest absorption rate of development budget at 97.7 per cent while the Department of Water, Environment and Climate Change recorded the lowest at 43.5 per cent. The Department of Agriculture, Irrigation, and Livestock & Fisheries Development had the highest percentage of recurrent expenditure to recurrent budget at 99.3 per cent while the County Attorney’s Office had the lowest at 58.4 per cent.
3.23.9 Key Observations and RecommendationsThe County has made progress in addressing some of the challenges previously identified as affecting budget implementation. Some of the progress made included:
i. Improvement in the collection of own source revenue by 60.3 per cent from Kshs.319.27 million in FY 2017/18 to Kshs.511.70 million in FY 2018/19
ii. Improvement in the absorption of the development budget to 60.1 per cent in FY 2018/19 compared to 44.8 per cent in FY 2017/18.
Despite the above progress, the following challenges continued to hamper effective budget implementation;
1. Late submission of reports on financial and non-financial performance by the County Treasury, which affected timely preparation of budget implementation report contrary to section 166 of the PFM Act, 2012.
2. Delay by Fund Administrators to submit expenditure reports of the Car Loan and Mortgage, Emergency Fund, Bursary Fund contrary to Section 168 of the PFM Act, 2012.
3. A high wage bill that increased by 6.9 per cent from Kshs.3.29 billion in FY 2017/18 to Kshs.3.52 billion in the reporting period. The wage bill accounted for 41.7 per cent of total expenditure in the reporting period.
The County should implement the following measures in order to improve budget execution;

158
COUNTY GOVERNMENTS ANNUAL BUDGET IMPLEMENTATION REVIEW REPORT FOR FY 2018/19
1. The County Treasury should ensure timely preparation and submission of reports on financial and non-financial performance in line with Section 166 of PFM Act, 2012.
2. All Fund Administrators should ensure timely submission of expenditure reports of established Funds in line with Section 168 of PFM Act 2012.
3. The County Public Service Board should develop an optimal staffing structure and devise strategies to contain expenditure on personnel costs within 35 per cent of County’s total revenue in line with Regulation 25(1) (b) of the PFM (County Governments) Regulations, 2015.
3.24 Mandera County
3.24.1 Overview of the FY 2018/19 BudgetThe County’s FY 2018/19Supplementary Budget was Kshs.13.71 billion, comprising of Kshs.7.08 billion (51.6 per cent) and Kshs.6.63 billion (48.4 per cent) allocation for development and recurrent expenditure respectively.
To finance the budget, the County expects to receive Kshs.10.14 billion (74 per cent) as equitable share of the revenue raised nationally, Kshs.877.9 million (6.4 per cent) as total conditional grants, generate Kshs.179.09 million (1.3 per cent) from own sources of revenue, and Kshs.2.51 billion (18.3 per cent) cash balance from FY 2017/18.
Figure 3.93: Mandera County, Expected Sources of Budget Financing in FY 2018/19
197
1. Late submission of reports on financial and non -financial performance by the County Treasury, which affected
timely preparation of budget implementation report contrary to section 166 of the PFM Act, 2012.
2. Delay by Fund Administrators to submit expenditure reports of the Car Loan and Mortgage, Emergency Fund,
Bursary Fund contrary to Section 168 of the PFM Act, 2012.
3. A high wage bill that increased by 6.9 per cent from Kshs.3.29 billion in FY 2017/18 to Kshs.3.52 billion in the
reporting period. The wage bill accounted for 41.7 per cent of total expenditure in the reporting period.
The County should implement the following measures in order to improve budget execution;
1. The County Treasury should ensure timely preparation and submission of reports on financial and non -financial
performance in line with Section 166 of PFM Act, 2012.
2. All Fund Administrators should ensure timely submission of expenditure reports of established Funds in line with
Section 168 of PFM Act 2012.
3. The County Public Service Board should develop an optimal staffing structure and devise strategies to contain
expenditure on personnel costs within 35 per cent of County’s total revenue in line with Regulation 25(1) (b) of the
PFM (County Governments) Regulations, 2015.
3.24 Mandera County
3.24.1 Overview of the FY 2018/19 Budget The County’s FY 2018/19Supplementary Budget was Kshs.13.71 billion, comprising of Kshs.7.08 billion (51.6 per
cent) and Kshs.6.63 billion (48.4 per cent) allocation for development and recurrent expenditure respectively.
To finance the budget, the County expects to receive Kshs.10.14 billion (74 per cent) as equitable share of the revenue
raised nationally, Kshs.877.9 million (6.4 per cent) as total conditional grants, generate Kshs.179.09 million (1.3 per
cent) from own sources of revenue, and Kshs.2.51 billion (18.3 per cent) cash balance from FY 2017/18.
Figure 3.93: Mandera County, Expected Sources of Budget Financing in FY 2018/19
Source: Mandera County Treasury
Cash Balance from FY 2017/18
18.3%
National Sharable Revenue74.0%
Total Conditional Allocation
(CARA,2018)6.4%
Annual Own Source Revenue Target
1.3%
Source: Mandera County Treasury
A breakdown of the conditional grants is provided in Table 3.68.

159
COUNTY GOVERNMENTS ANNUAL BUDGET IMPLEMENTATION REVIEW REPORT FOR FY 2018/19
3.24.2 Revenue AnalysisDuring FY 2018/19, the County had a total of Kshs.13.63 billion available for budget implementation. This amount consisted of Kshs.10.14 billion received as equitable share of the revenue raised nationally, Kshs.910.30 million as conditional grants, Kshs.95.49 million generated from own sources of revenue, and a cash balance of Kshs.2.48 billion from FY 2017/18.
Figure 3.94 shows the trend in annual own-source revenue collection from FY 2013/14 to FY 2018/19.
Figure 3.94: Mandera County, Own Source Revenue Collection for FY 2013/14 to FY 2018/19
198
A breakdown of the conditional grants is provided in Table 3.68.
3.24.2 Revenue Analysis During FY 2018/19, the County had a total of Kshs.13.63 billion available for budget implementation. This amount
consisted of Kshs.10.14 billion received as equitable share of the revenue raised nationally, Kshs.910.30 million as
conditional grants, Kshs.95.49 million generated from own sources of revenue, and a cash balance of Kshs.2.48 billion
from FY 2017/18.
Figure 3.94 shows the trend in annual own-source revenue collection from FY 2013/14 to FY 2018/19.
Figure 3.94: Mandera County, Own Source Revenue Collection for FY 2013/14 to FY 2018/19
Source: Mandera County Treasury
The County generated a total of Kshs.95.49 million from own revenue sources in FY 2018/19. This amount represented
an increase of Kshs.33.93 million compared to that realised in FY 2017/18 and was 53.3 per cent of the annual target.
3.24.3 Conditional Grants During the reporting period, the County received Kshs.910.30 million as conditional grants as shown in Table 3.68 .
Table 3.68: Mandera County, Conditional Grants/Loans Received in the FY 2018/19
S/No. Grant/Loans Annual Allocation-CARA, 2018) (Kshs.)
Annual Budget Allocation (Kshs.)
Total Receipts (Kshs.)
Receipts as Percentage of Annual Budget Allocation (%)
1 Compensation for User Fee Foregone 25,474,920 25,474,920 25,474,920 100 2 Leasing of Medical Equipment 200,000,000 - - - 3 Road Maintenance Fuel Levy 267,035,293 267,035,293 267,035,293 100 4 Rehabilitation of Village Polytechnics 31,240,000 31,240,000 23,586,200 75.5
5 Transforming Health Systems for Universal Care Project (World Bank) 100,000,000 100,000,000 85,173,208 85.2
90.20 87.72
59.65
44.55 61.56
95.49
-
20
40
60
80
100
120
FY 2013/14 FY 2014/15 FY 2015/16 FY 2016/17 FY 2017/18 FY 2018/19
Ksh
s. M
illio
n
Trend in Own Source Revenue
Source: Mandera County Treasury
The County generated a total of Kshs.95.49 million from own revenue sources in FY 2018/19. This amount represented an increase of Kshs.33.93 million compared to that realised in FY 2017/18 and was 53.3 per cent of the annual target.
3.24.3 Conditional GrantsDuring the reporting period, the County received Kshs.910.30 million as conditional grants as shown in Table 3.68 .
Table 3.68: Mandera County, Conditional Grants/Loans Received in the FY 2018/19
S/No. Grant/LoansAnnual Allo-
cation-CARA, 2018) (Kshs.)
Annual Budget Allocation (Kshs.)
Total Receipts (Kshs.)
Receipts as Per-centage of Annual Budget Allocation
(%)
1 Compensation for User Fee Foregone 25,474,920 25,474,920 25,474,920 100
2 Leasing of Medical Equipment 200,000,000 - - -
3 Road Maintenance Fuel Levy 267,035,293 267,035,293 267,035,293 100
4 Rehabilitation of Village Polytechnics 31,240,000 31,240,000 23,586,200 75.5
5 Transforming Health Systems for Universal Care Project (World Bank) 100,000,000 100,000,000 85,173,208 85.2
6 IDA (World Bank) -Kenya Climate Smart Agriculture Project (KCSAP) 150,000,000 150,000,000 54,858,856 36.6
7 IDA (World Bank) Kenya Devolution Support Programme “Level 1 grant” 58,673,488 58,673,488 235,542,828 401.4

160
COUNTY GOVERNMENTS ANNUAL BUDGET IMPLEMENTATION REVIEW REPORT FOR FY 2018/19
S/No. Grant/LoansAnnual Allo-
cation-CARA, 2018) (Kshs.)
Annual Budget Allocation (Kshs.)
Total Receipts (Kshs.)
Receipts as Per-centage of Annual Budget Allocation
(%)
8 IDA (World Bank) -Kenya Urban Support Project (KUSP) 175,819,500 175,819,500 175,819,500 100
9 DANIDA - Universal Healthcare in Devolved System Programme 32,653,125 32,653,125 32,653,125 100
10 Kenya Devolution Support Programme “Level 2 grant” 41,200,000 - - -
11 Sweden - Agriculture Sector Development Support Programme (ASDSP) II + Bal C/F in FY 2017/18 27,908,979 37,000,000 10,161,036 27.5
Grand Total 1,110,005,305 877,896,326 910,304,966 103.7
Source: Mandera County Treasury
During the reporting period, receipts for Kenya Devolution Support Programme grant recorded the highest performance in percentage terms, and accounted 401.4 per cent of the annual target.
3.24.4 Exchequer IssuesIn order to implement the budget, the Controller of Budget approved withdrawal of Kshs.12.08 billion from the CRF account. The withdrawals represented 88.1 per cent of the Approved Supplementary Budget and translated to an increase of 18.5per cent from Kshs.10.20 billion in FY 2017/18, and comprised of Kshs.5.77 billion (47.7 per cent) towards development activities and Kshs.6.31 billion (52.3 per cent) for recurrent expenditure.
3.24.5 Overall Expenditure ReviewA total of Kshs.12.04 billion was spent on both development and recurrent activities. This expenditure represented 99.7 per cent of the total funds released from the CRF account, and was an increase of 26.3 per cent from Kshs.9.54 billion spent in FY 2017/18.
Expenditure on development programmes amounted to Kshs.5.75 billion while Kshs.6.29 billion was spent on recurrent activities. The development expenditure was 99.7 per cent of the funds released for development programmes, while recurrent expenditure was 99.7 per cent of funds released for recurrent activities.
Development expenditure recorded an absorption rate of 81.3 per cent, which was an increase from 67.4 per cent attained in FY 2017/18. Conversely, recurrent expenditure represented 94.8 per cent of the annual recurrent budget, an increase from 87.2 per cent recorded in FY 2017/18.
Figure 3.95 presents a comparison between the total expenditure in FY 2018/19 and FY 2017/18.

161
COUNTY GOVERNMENTS ANNUAL BUDGET IMPLEMENTATION REVIEW REPORT FOR FY 2018/19
Figure3.95: ManderaCounty,ExpenditurebyEconomicClassification
200
Source: Mandera County Treasury
3.24.6 Development Expenditure Analysis The total development expenditure of Kshs.5.75 billion represented 81.3 per cent of the annual development
expenditure estimates of Kshs.7.08 billion. Table 3.69 provides a summary of development projects with the highest
expenditure in the financial year.
Table 3.69: Mandera County, List of Development Projects with the Highest Expenditure in FY 2018/19
S/No. Project Name Project Location Project Budget
Project Expenditure in FY 2018/19 (Kshs.)
Absorption Rate (%)
1 Tarmac Roads Lot 1 Countywide 268,484,715 268,484,715 100
2 Roads Maintenance Fuel Levy for 2018/2019 (Takaba-Gither, Rhamu - Malka Mari, Kutayu - Elwak, Elwak-Elgolicha, Awara-Morothiley & Guba-Choroqo )
Takaba-Gither, Rhamu - Malka Mari, Kutayu - Elwak, Elwak-Elgolicha, Awara-Morothiley & Guba-Choroqo
267,035,293 267,035,293 100
3 Completion of County Headquarter County Headquarter 245,000,000 245,000,000 100 4 Tarmac Roads Lot II Countywide 244,723,103 244,723,103 100 5 Completion of Rest House County Assembly 140,000,000 140,000,000 100
6 Procurement/Equipment Leasing (A & E and Maternity at Elwak and MCRH)
A & E and Maternity at Elwak and MCRH 75,000,000 75,000,000 100
7 Constructions of modern slaughter house in Mandera East Mandera East 61,291,705 61,291,705 100 8 Elwak SME market Park completion Elwak SME market Park 57,101,136 57,101,136 100
9 Proposed paved parking and drainage system at Elwak SME market Park Elwak SME market Park 50,000,000 50,000,000 100
10 Mandera County Rehabilitation Centre Mandera Town 44,000,000 44,000,000 100
Source: Mandera County Treasury
3.24.7 Analysis of Recurrent Expenditure The total recurrent expenditure of Kshs.6.29 billion comprised of Kshs.2.92 billion (46.4 per cent) incurred on personnel
emoluments and Kshs.3.38 billion (53.6 per cent) on operations and maintenance as shown in Figure 3.96.
2,375.73(24.9%)
3,268.83(34.3%)
3,892.28(40.8%)
2,916.21(24.2%)
3,375.17(28%)
5,750.39(47.8%)
-
1,000
2,000
3,000
4,000
5,000
6,000
7,000
Personnel Emoluments Operations and Maintenance Development Expenditure
Ksh
s.Mill
ion
Expenditure by Economic Classification
FY 2017/18
FY 2018/19
Source: Mandera County Treasury
3.24.6 Development Expenditure AnalysisThe total development expenditure of Kshs.5.75 billion represented 81.3 per cent of the annual development expenditure estimates of Kshs.7.08 billion. Table 3.69 provides a summary of development projects with the highest expenditure in the financial year.
Table 3.69: Mandera County, List of Development Projects with the Highest Expenditure in FY 2018/19
S/No. Project Name Project Location Project BudgetProject Expendi-ture in FY 2018/19 (Kshs.)
Absorption Rate (%)
1 Tarmac Roads Lot 1 Countywide 268,484,715 268,484,715 100
2Roads Maintenance Fuel Levy for 2018/2019 (Takaba-Gith-er, Rhamu - Malka Mari, Kutayu - Elwak, Elwak-Elgolicha, Awara-Morothiley & Guba-Choroqo )
Takaba-Gither, Rhamu - Malka Mari, Kutayu - Elwak, Elwak-Elgolicha, Awara-Morothiley & Guba-Choroqo
267,035,293 267,035,293 100
3 Completion of County Headquarter County Headquarter 245,000,000 245,000,000 100
4 Tarmac Roads Lot II Countywide 244,723,103 244,723,103 100
5 Completion of Rest House County Assembly 140,000,000 140,000,000 100
6 Procurement/Equipment Leasing (A & E and Maternity at Elwak and MCRH)
A & E and Maternity at Elwak and MCRH 75,000,000 75,000,000 100
7 Constructions of modern slaughter house in Mandera East Mandera East 61,291,705 61,291,705 100
8 Elwak SME market Park completion Elwak SME market Park 57,101,136 57,101,136 100
9 Proposed paved parking and drainage system at Elwak SME market Park Elwak SME market Park 50,000,000 50,000,000 100
10 Mandera County Rehabilitation Centre Mandera Town 44,000,000 44,000,000 100
Source: Mandera County Treasury
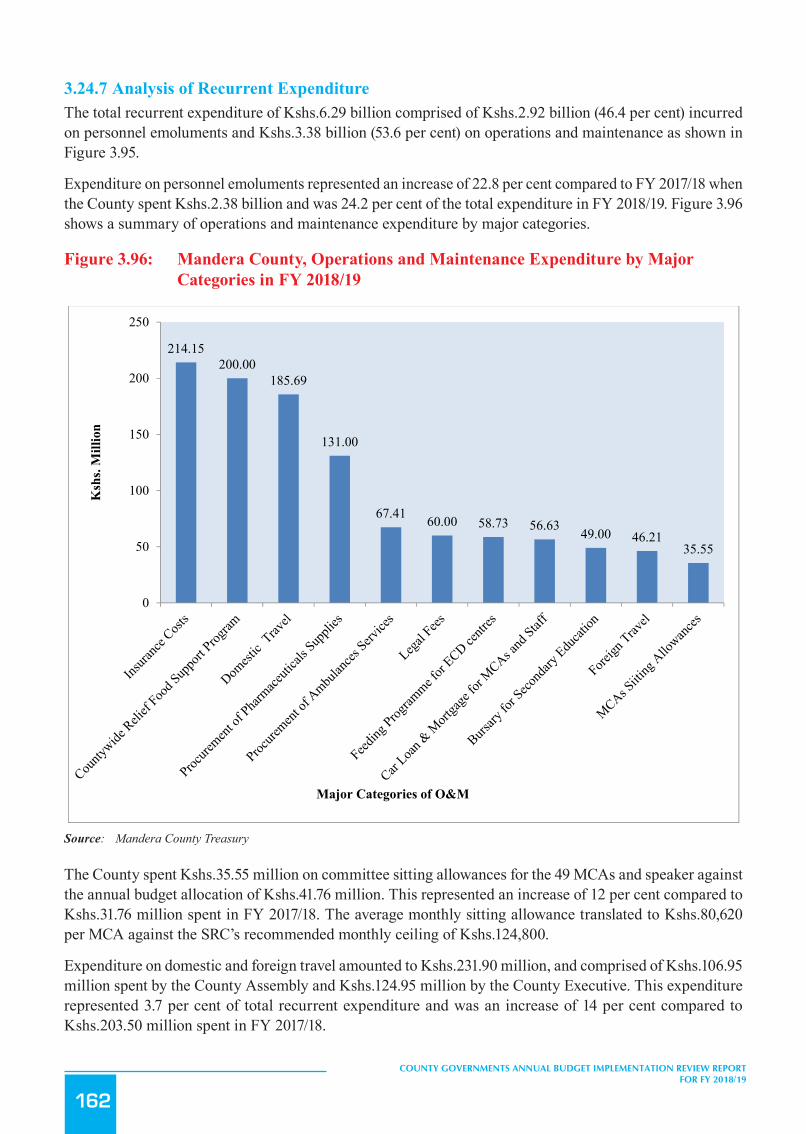
162
COUNTY GOVERNMENTS ANNUAL BUDGET IMPLEMENTATION REVIEW REPORT FOR FY 2018/19
3.24.7 Analysis of Recurrent ExpenditureThe total recurrent expenditure of Kshs.6.29 billion comprised of Kshs.2.92 billion (46.4 per cent) incurred on personnel emoluments and Kshs.3.38 billion (53.6 per cent) on operations and maintenance as shown in Figure 3.95.
Expenditure on personnel emoluments represented an increase of 22.8 per cent compared to FY 2017/18 when the County spent Kshs.2.38 billion and was 24.2 per cent of the total expenditure in FY 2018/19. Figure 3.96 shows a summary of operations and maintenance expenditure by major categories.
Figure 3.96: Mandera County, Operations and Maintenance Expenditure by Major Categories in FY 2018/19
201
Expenditure on personnel emoluments represented an increase of 22.8 per cent compared to FY 2017/18 when the
County spent Kshs.2.38 billion and was 24.2 per cent of the total expenditure in FY 2018/19. Figure 3.96 shows a
summary of operations and maintenance expenditure by major categories.
Figure 3.96: Mandera County, Operations and Maintenance Expenditure by Major Categories in FY 2018/19
Source: Mandera County Treasury
The County spent Kshs.35.55 million on committee sitting allowances for the 49 MCAs and speaker against the annual
budget allocation of Kshs.41.76 million. This represented an increase of 12 per cent compared to Kshs.31.76 million
spent in FY 2017/18. The average monthly sitting allowance translated to Kshs.80,620 per MCA against the SRC’s
recommended monthly ceiling of Kshs.124,800.
Expenditure on domestic and foreign travel amounted to Kshs.231.90 million, and comprised of Kshs.106.95 million
spent by the County Assembly and Kshs.124.95 million by the County Executive. This expenditure represented 3.7 per
cent of total recurrent expenditure and was an increase of 14 per cent compared to Kshs.203.50 million spent in FY
2017/18.
3.24.8 Budget Performance by County Department
Table 3.70 shows a summary of the approved budget allocation and performance by department in FY 2018/19.
Table 3.70: Mandera County, Budget Performance by Department in FY 2018/19
214.15200.00
185.69
131.00
67.41 60.00 58.73 56.63 49.00 46.2135.55
0
50
100
150
200
250
Ksh
s. M
illio
n
Major Categories of O&M
Source: Mandera County Treasury
The County spent Kshs.35.55 million on committee sitting allowances for the 49 MCAs and speaker against the annual budget allocation of Kshs.41.76 million. This represented an increase of 12 per cent compared to Kshs.31.76 million spent in FY 2017/18. The average monthly sitting allowance translated to Kshs.80,620 per MCA against the SRC’s recommended monthly ceiling of Kshs.124,800.
Expenditure on domestic and foreign travel amounted to Kshs.231.90 million, and comprised of Kshs.106.95 million spent by the County Assembly and Kshs.124.95 million by the County Executive. This expenditure represented 3.7 per cent of total recurrent expenditure and was an increase of 14 per cent compared to Kshs.203.50 million spent in FY 2017/18.

163
COUNTY GOVERNMENTS ANNUAL BUDGET IMPLEMENTATION REVIEW REPORT FOR FY 2018/19
3.24.8 Budget Performance by County Department Table 3.70 shows a summary of the approved budget allocation and performance by department in FY 2018/19.
Table 3.70: Mandera County, Budget Performance by Department in FY 2018/19
DepartmentAnnual Budget Allocation
(Kshs. Million)Exchequer Issues (Kshs.
Million) Expenditure Kshs. Million)Expenditure to
Exchequer Issues (%)
Absorption Rate (%)
Rec Dev Rec Dev Rec Dev Rec Dev Rec Dev
Agriculture Livestock and Fisheries 205.06 649.99 202.64 366.63 200.66 366.63 99.0 100 97.8 56.4
Education, Culture and Sports 604.83 498.82 599.45 319.25 599.45 316.25 100 99.1 99.1 63.4
Gender, Youth and Social Service 97.31 129.05 96.98 123.39 96.98 123.39 100 100 99.7 95.6
Finance and Economic Planning and ICT 569.89 159.92 535.80 135.46 535.80 135.46 100 100 94.0 84.7
Health Services 1,716.69 810.94 1,700.56 594.05 1,698.41 580.57 99.9 97.7 98.9 71.6
Trade, Investments Indus-trializations and Cooper-ative Development
47.07 285.23 45.07 265.78 45.07 265.78 100 100 95.8 93.2
County Assembly 810.63 211.26 680.45 53.47 680.45 53.07 100 99.2 83.9 25.1
Lands, Housing and Physical Planning 63.20 156.70 63.20 45.43 63.20 45.43 100 100 100 29.0
Office of the Governor and Deputy Governor 667.60 - 610.42 - 610.42 - 100 - 91.4 -
County Public Service Board 70.06 - 65.02 - 65.02 - 100 - 92.8 -
Public Service, Manage-ment and Devolved Unit 1,267.13 453.00 1,211.49 438.77 1,211.49 438.77 100 100 95.6 96.9
Public Works Roads and Transport 102.81 2,030.51 93.31 1,832.71 93.31 1,832.71 100 100 90.8 90.3
Water, Energy, Environ-ment, Natural Resources Tourism and Wildlife
410.74 1,691.49 407.61 1,592.32 391.11 1,592.32 96.0 100 95.2 94.1
Total 6,633.04 7,076.92 6,312.02 5,767.27 6,291.37 5,750.39 99.7 99.7 94.8 81.3
Source: Mandera County Treasury
Analysis of expenditure by department shows that the Department of Public Service, Management and Devolved Unit recorded the highest absorption rate of development budget at 96.9 while the County Assembly recorded the lowest at 25.1 per cent. The Department of Lands, Housing and Physical Planning had the highest percentage of recurrent expenditure to recurrent budget at 100 per cent while the County Assembly had the lowest at 83.9 per cent.
3.24.9 Key Observations and RecommendationsThe County has made progress in addressing some of the challenges previously identified as affecting budget implementation. Some of the progress made included:
i. Improvement in own source revenue collection by 55.1 per cent from Kshs.61.56 million in FY2017/18 to Kshs. 95.49 million in the reporting period.
ii. Improvement in the absorption of development budget from 67.4 per cent in FY2017/18 to 81.3 per cent in the reporting period.
Despite the above progress, the following challenges continued to hamper effective budget implementation;
1. Delay in disbursement of the equitable share of revenue raised nationally by the National Treasury.2. A high wage bill that increased by 22.8 per cent from Kshs.2.38 billion in FY 2017/18 to Kshs.2.92
billion in the reporting period.
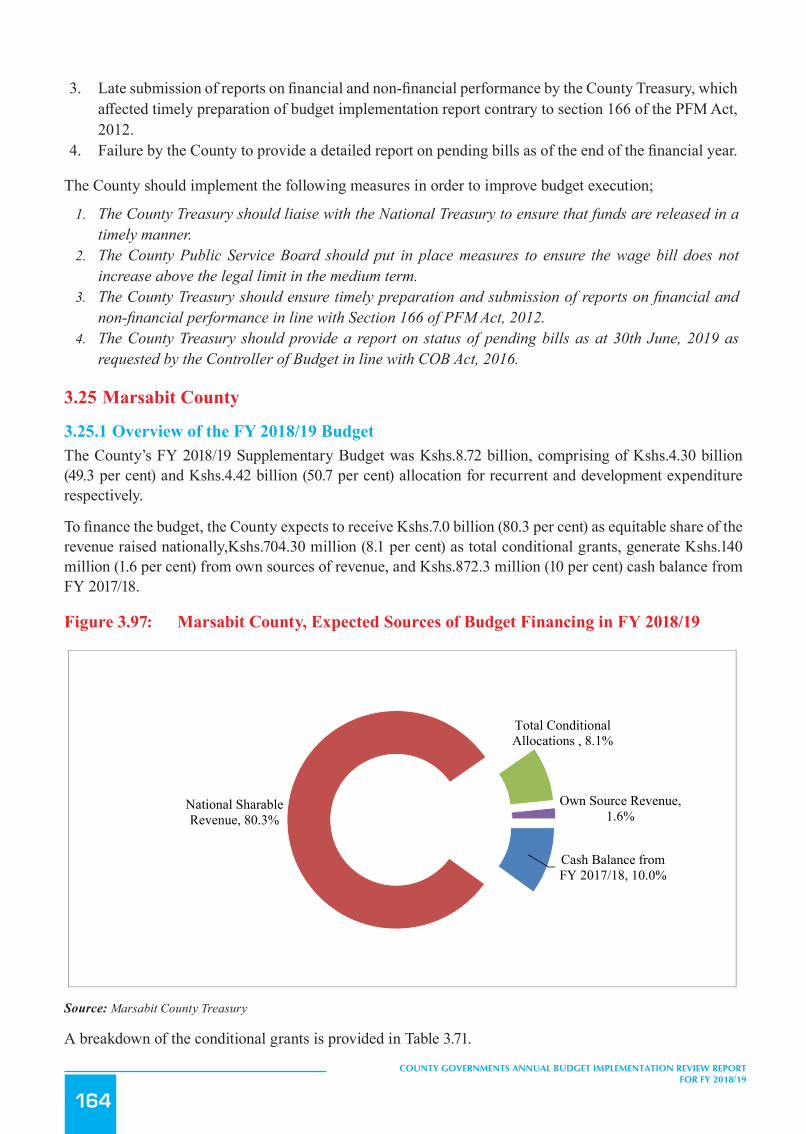
164
COUNTY GOVERNMENTS ANNUAL BUDGET IMPLEMENTATION REVIEW REPORT FOR FY 2018/19
3. Late submission of reports on financial and non-financial performance by the County Treasury, which affected timely preparation of budget implementation report contrary to section 166 of the PFM Act, 2012.
4. Failure by the County to provide a detailed report on pending bills as of the end of the financial year.
The County should implement the following measures in order to improve budget execution;
1. The County Treasury should liaise with the National Treasury to ensure that funds are released in a timely manner.
2. The County Public Service Board should put in place measures to ensure the wage bill does not increase above the legal limit in the medium term.
3. The County Treasury should ensure timely preparation and submission of reports on financial and non-financial performance in line with Section 166 of PFM Act, 2012.
4. The County Treasury should provide a report on status of pending bills as at 30th June, 2019 as requested by the Controller of Budget in line with COB Act, 2016.
3.25 Marsabit County
3.25.1 Overview of the FY 2018/19 BudgetThe County’s FY 2018/19 Supplementary Budget was Kshs.8.72 billion, comprising of Kshs.4.30 billion (49.3 per cent) and Kshs.4.42 billion (50.7 per cent) allocation for recurrent and development expenditure respectively.
To finance the budget, the County expects to receive Kshs.7.0 billion (80.3 per cent) as equitable share of the revenue raised nationally,Kshs.704.30 million (8.1 per cent) as total conditional grants, generate Kshs.140 million (1.6 per cent) from own sources of revenue, and Kshs.872.3 million (10 per cent) cash balance from FY 2017/18.
Figure 3.97: Marsabit County, Expected Sources of Budget Financing in FY 2018/19
203
4. Failure by the County to provide a detailed report on pending bills as of the end of the financial year.
The County should implement the following measures in order to improve budget execution;
1. The County Treasury should liaise with the National Treasury to ensure that funds are released in a timely manner.
2. The County Public Service Board should put in place measures to ensure the wage bill does not increase above the
legal limit in the medium term.
3. The County Treasury should ensure timely preparation and submission of reports on financial and non -financial
performance in line with Section 166 of PFM Act, 2012.
4. The County Treasury should provide a report on status of pending bills as at 30th June, 2019 as requested by the
Controller of Budget in line with COB Act, 2016.
3.25 Marsabit County
3.25.1 Overview of the FY 2018/19 Budget The County’s FY 2018/19 Supplementary Budget was Kshs.8.72 billion, comprising of Kshs.4.30 billion (49.3 per
cent) and Kshs.4.42 billion (50.7 per cent) allocation for recurrent and development expenditure respectively.
To finance the budget, the County expects to receive Kshs.7.0 billion (80.3 per cent) as equitable share of the revenue
raised nationally,Kshs.704.30 million (8.1 per cent) as total conditional grants, generate Kshs.140 million (1.6 per
cent) from own sources of revenue, and Kshs.872.3 million (10 per cent) cash balance from FY 2017/18.
Figure 3.97: Marsabit County, Expected Sources of Budget Financing in FY 2018/19
Source: Marsabit County Treasury
A breakdown of the conditional grants is provided in Table 3.71.
3.25.2 Revenue Analysis During FY 2018/19, the County had a total of Kshs.8.58 billion available for budget implementation. This amount
consisted of Kshs.7.0 billion received as equitable share of the revenue raised nationally, Kshs.582.35 million as
Cash Balance from FY 2017/18, 10.0%
National Sharable Revenue, 80.3%
Total Conditional Allocations , 8.1%
Own Source Revenue, 1.6%
Source: Marsabit County Treasury
A breakdown of the conditional grants is provided in Table 3.71.

165
COUNTY GOVERNMENTS ANNUAL BUDGET IMPLEMENTATION REVIEW REPORT FOR FY 2018/19
3.25.2 Revenue AnalysisDuring FY 2018/19, the County had a total of Kshs.8.58 billion available for budget implementation. This amount consisted of Kshs.7.0 billion received as equitable share of the revenue raised nationally, Kshs.582.35 million as conditional grants, Kshs.124.1 million generated from own sources of revenue, and a cash balance of Kshs.872.30 million from FY 2017/18.
Figure 3.98 shows the trend in annual own-source revenue collection from FY 2013/14 to FY 2018/19.
Figure 3.98: Marsabit County, Own Source Revenue Collection for FY 2013/14 to FY 2018/19
204
conditional grants, Kshs.124.1 million generated from own sources of revenue, and a cash balance of Kshs.872.30
million from FY 2017/18.
Figure 3.98 shows the trend in annual own-source revenue collection from FY 2013/14 to FY 2018/19.
Figure 3.98: Marsabit County, Own Source Revenue Collection for FY 2013/14 to FY 2018/19
Source: Marsabit County Treasury
The County generated a total of Kshs.124.1 million from own revenue sources in FY 2018/19. This amount represented
an increase of Kshs.32.1 million compared to that realised in FY 2017/18 and was 88.6 per cent of the annual target.
3.25.3 Conditional Grants During the reporting period, the County received Kshs.582.35 million as conditional grants as shown in Table 3.71 .
Table 3.71: Marsabit County, Conditional Grants/Loans Received in the FY 2018/19
S/No. Grants
Annual CARA, 2018 Allocation (Kshs)
Annual Budget Allocation (Kshs)
Actual Receipts (Kshs.)
Actual Receipts as Percentage of Annual Allocation (%)
1 Road Maintenance Fuel Levy Fund 184,361,828 184,361,828 223,691,143 121.3
2 IDA (World Bank) -Kenya Climate Smart Agriculture Project (KCSAP) 150,000,000 150,000,000 50,891,757 33.9
3 World Bank Loan for Transforming Health System for universal Care Project 100,000,000 100,000,000 82,026,760 82
4 EU Grant- IDEAS 80,000,000 90,000,000 70,007,619 57.5 5 IDA (World Bank) -Kenya Urban Support Project (KUSP) 50,000,000 50,000,000 50,000,000 100 6 Kenya Devolution Support Programme (KDSP) 48,985,872 48,985,872 - - 7 Rehabilitation of Village Polytechnics 26,275,000 26,275,000 19,837,625 75.5 8 DANIDA Grant 22,072,500 22,072,500 22,072,500 100
46.03
99.11
111.94
128.73
92.01
124.10
0
20
40
60
80
100
120
140
FY 2013/14 FY 2014/15 FY 2015/16 FY 2016/17 FY 2017/18 FY 2018/19
Ksh
s. M
illio
ns
Trend in Own Source Revenue
Source: Marsabit County Treasury
The County generated a total of Kshs.124.1 million from own revenue sources in FY 2018/19. This amount represented an increase of Kshs.32.1 million compared to that realised in FY 2017/18 and was 88.6 per cent of the annual target.
3.25.3 Conditional GrantsDuring the reporting period, the County received Kshs.582.35 million as conditional grants as shown in Table 3.71 .
Table 3.71: Marsabit County, Conditional Grants/Loans Received in the FY 2018/19
S/No. GrantsAnnual CARA, 2018 Allocation
(Kshs)
Annual Budget Allocation
(Kshs)
Actual Receipts (Kshs.)
Actual Receipts as Percentage of
Annual Allocation (%)
1 Road Maintenance Fuel Levy Fund 184,361,828 184,361,828 223,691,143 121.3
2 IDA (World Bank) -Kenya Climate Smart Agriculture Project (KCSAP) 150,000,000 150,000,000 50,891,757 33.9
3 World Bank Loan for Transforming Health System for uni-versal Care Project 100,000,000 100,000,000 82,026,760 82
4 EU Grant- IDEAS 80,000,000 90,000,000 70,007,619 57.5
5 IDA (World Bank) -Kenya Urban Support Project (KUSP) 50,000,000 50,000,000 50,000,000 100
6 Kenya Devolution Support Programme (KDSP) 48,985,872 48,985,872 - -
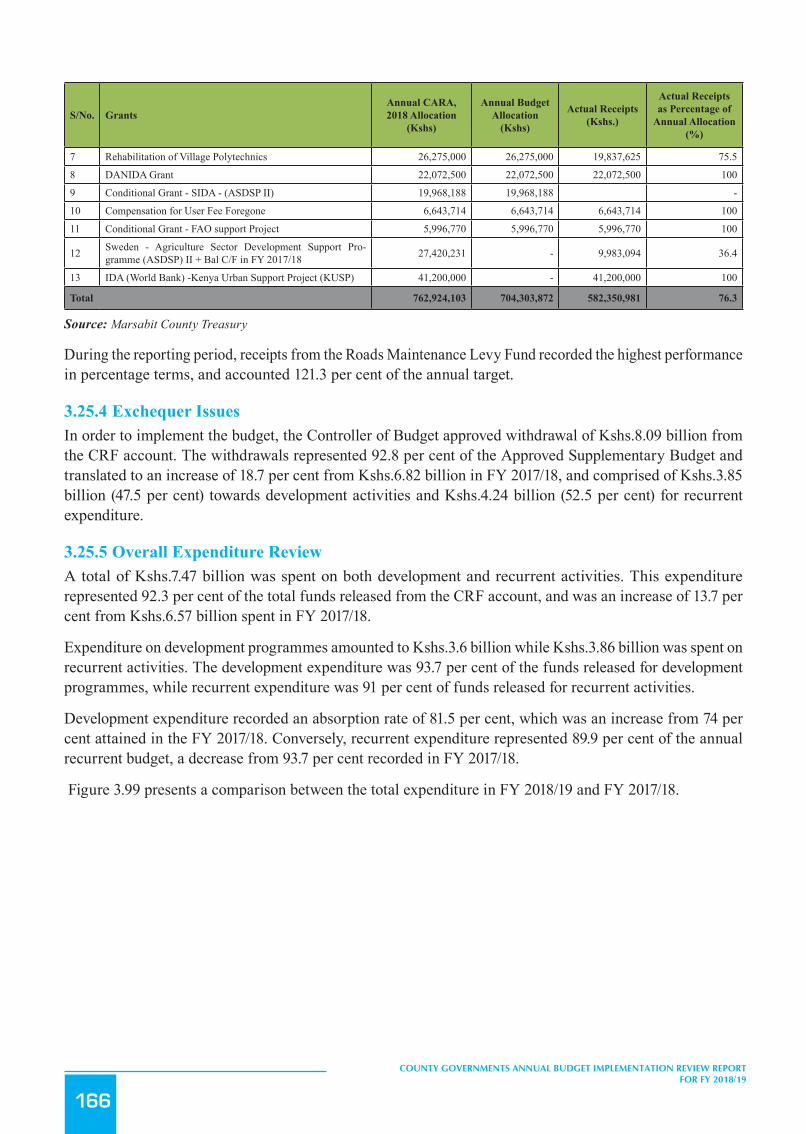
166
COUNTY GOVERNMENTS ANNUAL BUDGET IMPLEMENTATION REVIEW REPORT FOR FY 2018/19
S/No. GrantsAnnual CARA, 2018 Allocation
(Kshs)
Annual Budget Allocation
(Kshs)
Actual Receipts (Kshs.)
Actual Receipts as Percentage of
Annual Allocation (%)
7 Rehabilitation of Village Polytechnics 26,275,000 26,275,000 19,837,625 75.5
8 DANIDA Grant 22,072,500 22,072,500 22,072,500 100
9 Conditional Grant - SIDA - (ASDSP II) 19,968,188 19,968,188 -
10 Compensation for User Fee Foregone 6,643,714 6,643,714 6,643,714 100
11 Conditional Grant - FAO support Project 5,996,770 5,996,770 5,996,770 100
12 Sweden - Agriculture Sector Development Support Pro-gramme (ASDSP) II + Bal C/F in FY 2017/18 27,420,231 - 9,983,094 36.4
13 IDA (World Bank) -Kenya Urban Support Project (KUSP) 41,200,000 - 41,200,000 100
Total 762,924,103 704,303,872 582,350,981 76.3
Source: Marsabit County Treasury
During the reporting period, receipts from the Roads Maintenance Levy Fund recorded the highest performance in percentage terms, and accounted 121.3 per cent of the annual target.
3.25.4 Exchequer IssuesIn order to implement the budget, the Controller of Budget approved withdrawal of Kshs.8.09 billion from the CRF account. The withdrawals represented 92.8 per cent of the Approved Supplementary Budget and translated to an increase of 18.7 per cent from Kshs.6.82 billion in FY 2017/18, and comprised of Kshs.3.85 billion (47.5 per cent) towards development activities and Kshs.4.24 billion (52.5 per cent) for recurrent expenditure.
3.25.5 Overall Expenditure ReviewA total of Kshs.7.47 billion was spent on both development and recurrent activities. This expenditure represented 92.3 per cent of the total funds released from the CRF account, and was an increase of 13.7 per cent from Kshs.6.57 billion spent in FY 2017/18.
Expenditure on development programmes amounted to Kshs.3.6 billion while Kshs.3.86 billion was spent on recurrent activities. The development expenditure was 93.7 per cent of the funds released for development programmes, while recurrent expenditure was 91 per cent of funds released for recurrent activities.
Development expenditure recorded an absorption rate of 81.5 per cent, which was an increase from 74 per cent attained in the FY 2017/18. Conversely, recurrent expenditure represented 89.9 per cent of the annual recurrent budget, a decrease from 93.7 per cent recorded in FY 2017/18.
Figure 3.99 presents a comparison between the total expenditure in FY 2018/19 and FY 2017/18.
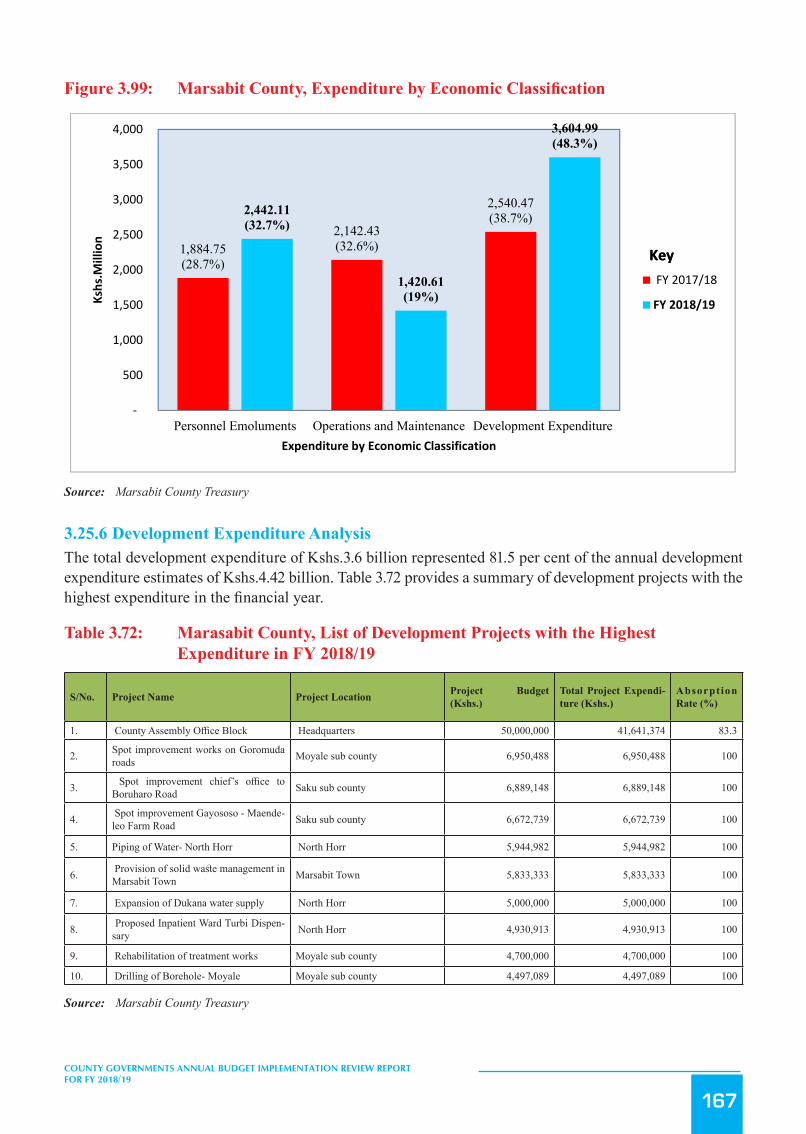
167
COUNTY GOVERNMENTS ANNUAL BUDGET IMPLEMENTATION REVIEW REPORT FOR FY 2018/19
Figure3.99: MarsabitCounty,ExpenditurebyEconomicClassification
206
Source: Marsabit County Treasury
3.25.6 Development Expenditure Analysis
The total development expenditure of Kshs.3.6 billion represented 81.5 per cent of the annual development expenditure
estimates of Kshs.4.42 billion. Table 3.72 provides a summary of development projects with the highest expenditure in
the financial year.
Table 3.72: Marasabit County, List of Development Projects with the Highest Expenditure in FY 2018/19
S/No. Project Name Project Location Project Budget (Kshs.)
Total Project Expenditure (Kshs.)
Absorption Rate (%)
1. County Assembly Office Block Headquarters 50,000,000 41,641,374 83.3
2. Spot improvement works on Goromuda roads Moyale sub county 6,950,488 6,950,488 100
3. Spot improvement chief's office to Boruharo Road Saku sub county 6,889,148 6,889,148 100
4. Spot improvement Gayososo - Maendeleo Farm Road Saku sub county 6,672,739 6,672,739 100
5. Piping of Water- North Horr North Horr 5,944,982 5,944,982 100
6. Provision of solid waste management in Marsabit Town Marsabit Town 5,833,333 5,833,333 100
7. Expansion of Dukana water supply North Horr 5,000,000 5,000,000 100
8. Proposed Inpatient Ward Turbi Dispensary North Horr 4,930,913 4,930,913 100
9. Rehabilitation of treatment works Moyale sub county 4,700,000 4,700,000 100
10. Drilling of Borehole- Moyale Moyale sub county 4,497,089 4,497,089 100
Source: Marsabit County Treasury
1,884.75(28.7%)
2,142.43(32.6%)
2,540.47(38.7%)2,442.11
(32.7%)
1,420.61(19%)
3,604.99(48.3%)
‐
500
1,000
1,500
2,000
2,500
3,000
3,500
4,000
Personnel Emoluments Operations and Maintenance Development Expenditure
Kshs.M
illion
Expenditure by Economic Classification
FY 2017/18
FY 2018/19
KeyKey
Source: Marsabit County Treasury
3.25.6 Development Expenditure AnalysisThe total development expenditure of Kshs.3.6 billion represented 81.5 per cent of the annual development expenditure estimates of Kshs.4.42 billion. Table 3.72 provides a summary of development projects with the highest expenditure in the financial year.
Table 3.72: Marasabit County, List of Development Projects with the Highest Expenditure in FY 2018/19
S/No. Project Name Project Location Project Budget (Kshs.)
Total Project Expendi-ture (Kshs.)
Absorption Rate (%)
1. County Assembly Office Block Headquarters 50,000,000 41,641,374 83.3
2. Spot improvement works on Goromuda roads Moyale sub county 6,950,488 6,950,488 100
3. Spot improvement chief’s office to Boruharo Road Saku sub county 6,889,148 6,889,148 100
4. Spot improvement Gayososo - Maende-leo Farm Road Saku sub county 6,672,739 6,672,739 100
5. Piping of Water- North Horr North Horr 5,944,982 5,944,982 100
6. Provision of solid waste management in Marsabit Town Marsabit Town 5,833,333 5,833,333 100
7. Expansion of Dukana water supply North Horr 5,000,000 5,000,000 100
8. Proposed Inpatient Ward Turbi Dispen-sary North Horr 4,930,913 4,930,913 100
9. Rehabilitation of treatment works Moyale sub county 4,700,000 4,700,000 100
10. Drilling of Borehole- Moyale Moyale sub county 4,497,089 4,497,089 100
Source: Marsabit County Treasury
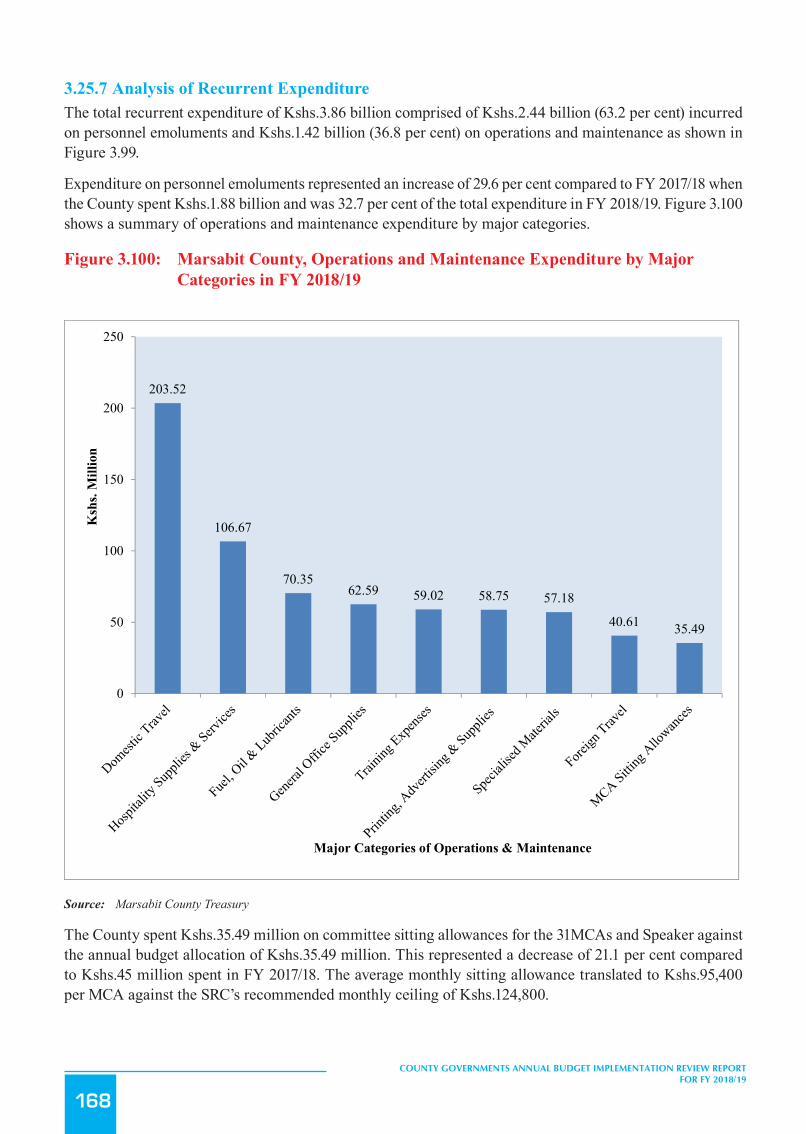
168
COUNTY GOVERNMENTS ANNUAL BUDGET IMPLEMENTATION REVIEW REPORT FOR FY 2018/19
3.25.7 Analysis of Recurrent ExpenditureThe total recurrent expenditure of Kshs.3.86 billion comprised of Kshs.2.44 billion (63.2 per cent) incurred on personnel emoluments and Kshs.1.42 billion (36.8 per cent) on operations and maintenance as shown in Figure 3.99.
Expenditure on personnel emoluments represented an increase of 29.6 per cent compared to FY 2017/18 when the County spent Kshs.1.88 billion and was 32.7 per cent of the total expenditure in FY 2018/19. Figure 3.100 shows a summary of operations and maintenance expenditure by major categories.
Figure 3.100: Marsabit County, Operations and Maintenance Expenditure by Major Categories in FY 2018/19
207
3.25.7 Analysis of Recurrent Expenditure The total recurrent expenditure of Kshs.3.86 billion comprised of Kshs.2.44 billion (63.2 per cent) incurred on personnel
emoluments and Kshs.1.42 billion (36.8 per cent) on operations and maintenance as shown in Figure 3.99.
Expenditure on personnel emoluments represented an increase of 29.6 per cent compared to FY 2017/18 when the
County spent Kshs.1.88 billion and was 32.7 per cent of the total expenditure in FY 2018/19. Figure 3.100 shows a
summary of operations and maintenance expenditure by major categories.
Figure 3.100: Marsabit County, Operations and Maintenance Expenditure by Major Categories in FY 2018/19
Source: Marsabit County Treasury
The County spent Kshs.35.49 million on committee sitting allowances for the 31MCAs and Speaker against the annual
budget allocation of Kshs.35.49 million. This represented a decrease of 21.1 per cent compared to Kshs.45 million spent
in FY 2017/18. The average monthly sitting allowance translated to Kshs.95,400 per MCA against the SRC’s
recommended monthly ceiling of Kshs.124,800.
Expenditure on domestic and foreign travel amounted to Kshs.244.13 million, and comprised of Kshs.107.77 million
spent by the County Assembly and Kshs.136.36 million by the County Executive. This expenditure represented 6.3 per
203.52
106.67
70.3562.59 59.02 58.75 57.18
40.61 35.49
0
50
100
150
200
250
Ksh
s. M
illio
n
Major Categories of Operations & Maintenance
Source: Marsabit County Treasury
The County spent Kshs.35.49 million on committee sitting allowances for the 31MCAs and Speaker against the annual budget allocation of Kshs.35.49 million. This represented a decrease of 21.1 per cent compared to Kshs.45 million spent in FY 2017/18. The average monthly sitting allowance translated to Kshs.95,400 per MCA against the SRC’s recommended monthly ceiling of Kshs.124,800.
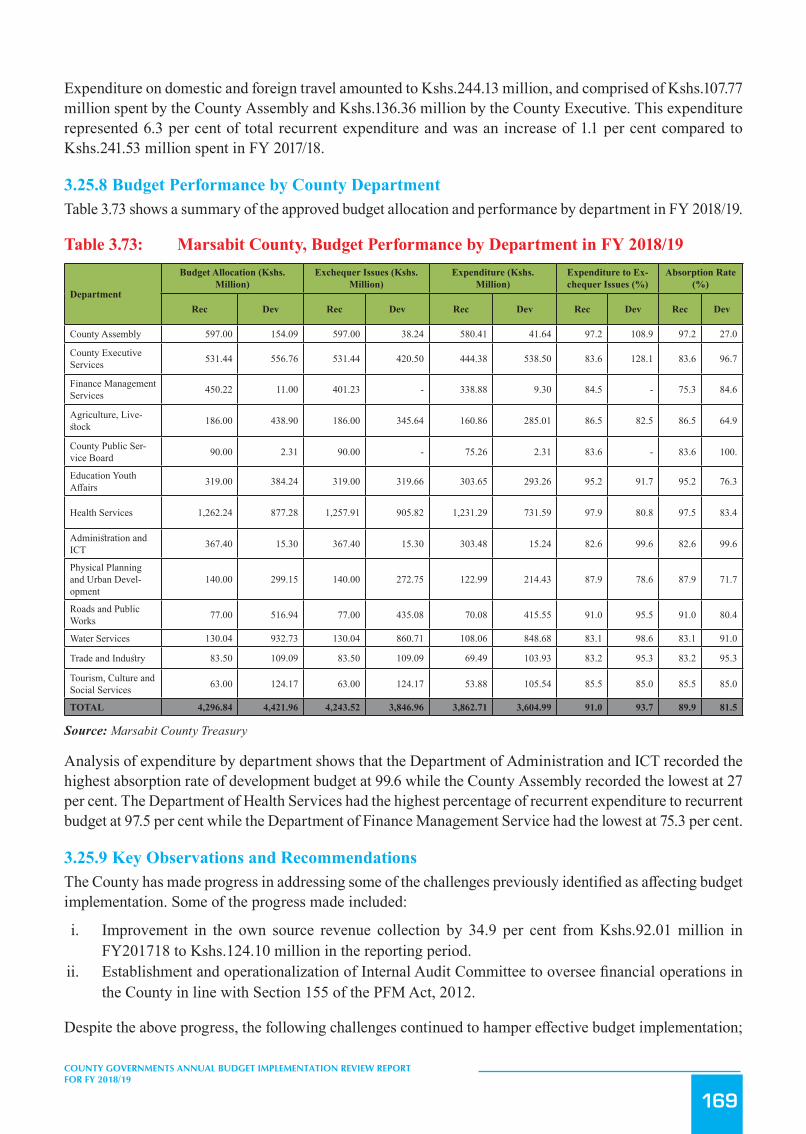
169
COUNTY GOVERNMENTS ANNUAL BUDGET IMPLEMENTATION REVIEW REPORT FOR FY 2018/19
Expenditure on domestic and foreign travel amounted to Kshs.244.13 million, and comprised of Kshs.107.77 million spent by the County Assembly and Kshs.136.36 million by the County Executive. This expenditure represented 6.3 per cent of total recurrent expenditure and was an increase of 1.1 per cent compared to Kshs.241.53 million spent in FY 2017/18.
3.25.8 Budget Performance by County DepartmentTable 3.73 shows a summary of the approved budget allocation and performance by department in FY 2018/19.
Table 3.73: Marsabit County, Budget Performance by Department in FY 2018/19
Department
Budget Allocation (Kshs. Million)
Exchequer Issues (Kshs. Million)
Expenditure (Kshs. Million)
Expenditure to Ex-chequer Issues (%)
Absorption Rate (%)
Rec Dev Rec Dev Rec Dev Rec Dev Rec Dev
County Assembly 597.00 154.09 597.00 38.24 580.41 41.64 97.2 108.9 97.2 27.0
County Executive Services 531.44 556.76 531.44 420.50 444.38 538.50 83.6 128.1 83.6 96.7
Finance Management Services 450.22 11.00 401.23 - 338.88 9.30 84.5 - 75.3 84.6
Agriculture, Live-stock 186.00 438.90 186.00 345.64 160.86 285.01 86.5 82.5 86.5 64.9
County Public Ser-vice Board 90.00 2.31 90.00 - 75.26 2.31 83.6 - 83.6 100.
Education Youth Affairs 319.00 384.24 319.00 319.66 303.65 293.26 95.2 91.7 95.2 76.3
Health Services 1,262.24 877.28 1,257.91 905.82 1,231.29 731.59 97.9 80.8 97.5 83.4
Administration and ICT 367.40 15.30 367.40 15.30 303.48 15.24 82.6 99.6 82.6 99.6
Physical Planning and Urban Devel-opment
140.00 299.15 140.00 272.75 122.99 214.43 87.9 78.6 87.9 71.7
Roads and Public Works 77.00 516.94 77.00 435.08 70.08 415.55 91.0 95.5 91.0 80.4
Water Services 130.04 932.73 130.04 860.71 108.06 848.68 83.1 98.6 83.1 91.0
Trade and Industry 83.50 109.09 83.50 109.09 69.49 103.93 83.2 95.3 83.2 95.3
Tourism, Culture and Social Services 63.00 124.17 63.00 124.17 53.88 105.54 85.5 85.0 85.5 85.0
TOTAL 4,296.84 4,421.96 4,243.52 3,846.96 3,862.71 3,604.99 91.0 93.7 89.9 81.5
Source: Marsabit County Treasury
Analysis of expenditure by department shows that the Department of Administration and ICT recorded the highest absorption rate of development budget at 99.6 while the County Assembly recorded the lowest at 27 per cent. The Department of Health Services had the highest percentage of recurrent expenditure to recurrent budget at 97.5 per cent while the Department of Finance Management Service had the lowest at 75.3 per cent.
3.25.9 Key Observations and RecommendationsThe County has made progress in addressing some of the challenges previously identified as affecting budget implementation. Some of the progress made included:
i. Improvement in the own source revenue collection by 34.9 per cent from Kshs.92.01 million in FY201718 to Kshs.124.10 million in the reporting period.
ii. Establishment and operationalization of Internal Audit Committee to oversee financial operations in the County in line with Section 155 of the PFM Act, 2012.
Despite the above progress, the following challenges continued to hamper effective budget implementation;

170
COUNTY GOVERNMENTS ANNUAL BUDGET IMPLEMENTATION REVIEW REPORT FOR FY 2018/19
1. Delay in disbursement of the equitable share of revenue raised nationally by the National Treasury.2. Late submission of reports on financial and non-financial performance by the County Treasury, which
affected timely preparation of budget implementation report contrary to Section 166 of the PFM Act, 2012.
3. Failure to constitute the County Budget and Economic Forum (CBEF) as per the requirement of Section 137 of the PFM Act, 2012 for consultation in the budget process.
The County should implement the following measures in order to improve budget execution;
1. The County Treasury should liaise with the National Treasury to ensure that funds allocated to the County are released in a timely manner.
2. The County Treasury should ensure timely preparation and submission of reports on financial and non-financial performance in line with Section 166 of PFM Act, 2012.
3. The County should constitute a County Budget and Economic Forum (CBEF) in line with Section 137 of the PFM Act, 2012.
3.26 Meru County
3.26.1 Overview of the FY 2018/19 BudgetThe County’s FY 2018/19 Supplementary Budget was Kshs.12.56 billion, comprising of Kshs.7.86 billion (62.6 per cent) and Kshs.4.69 billion (37.4 per cent) allocation for recurrent and development expenditure respectively.
To finance the budget, the County expects to receive Kshs.8.01 billion( 63.8 per cent) as equitable share of the revenue raised nationally, Kshs.1.40 billion (11.2 per cent) as total conditional grants, generate Kshs.1.23 billion (9.8 per cent) from own sources of revenue, and Kshs.1.92 billion (15.3 per cent) cash balance from FY 2017/18.
Figure 3.101: Meru County, Expected Sources of Budget Financing in FY 2018/19
209
Despite the above progress, the following challenges continued to hamper effective budget implementation;
1. Delay in disbursement of the equitable share of revenue raised nationally by the National Treasury.
2. Late submission of reports on financial and non -financial performance by the County Treasury, which
affected timely preparation of budget implementation report contrary to Section 166 of the PFM Act,
2012.
3. Failure to constitute the County Budget and Economic Forum (CBEF) as per the requirement of Section 137 of
the PFM Act, 2012 for consultation in the budget process.
The County should implement the following measures in order to improve budget execution;
1. The County Treasury should liaise with the National Treasury to ensure that funds allocated to the County are
released in a timely manner.
2. The County Treasury should ensure timely preparation and submission of reports on financial and non -financial
performance in line with Section 166 of PFM Act, 2012.
3. The County should constitute a County Budget and Economic Forum (CBEF) in line with Section 137 of the PFM
Act, 2012.
3.26 Meru County
3.26.1 Overview of the FY 2018/19 Budget The County’s FY 2018/19 Supplementary Budget was Kshs.12.56 billion, comprising of Kshs.7.86 billion (62.6 per
cent) and Kshs.4.69 billion (37.4 per cent) allocation for recurrent and development expenditure respectively.
To finance the budget, the County expects to receive Kshs.8.01 billion( 63.8 per cent) as equitable share of the
revenue raised nationally, Kshs.1.40 billion (11.2 per cent) as total conditional grants, generate Kshs.1.23 billion (9.8
per cent) from own sources of revenue, and Kshs.1.92 billion (15.3 per cent) cash balance from FY 2017/18.
Figure 3.101: Meru County Expected Sources of Budget Financing in FY 2018/19
Source: Meru County Treasury
Cash Balance from FY 2017/18
15.3%
National Sharable Revenue63.8%
Total Conditional Allocations
11.2%
Own Source Revenue
9.8%
Source: Meru County Treasury
A breakdown of the conditional grants is provided in Table 3.74.
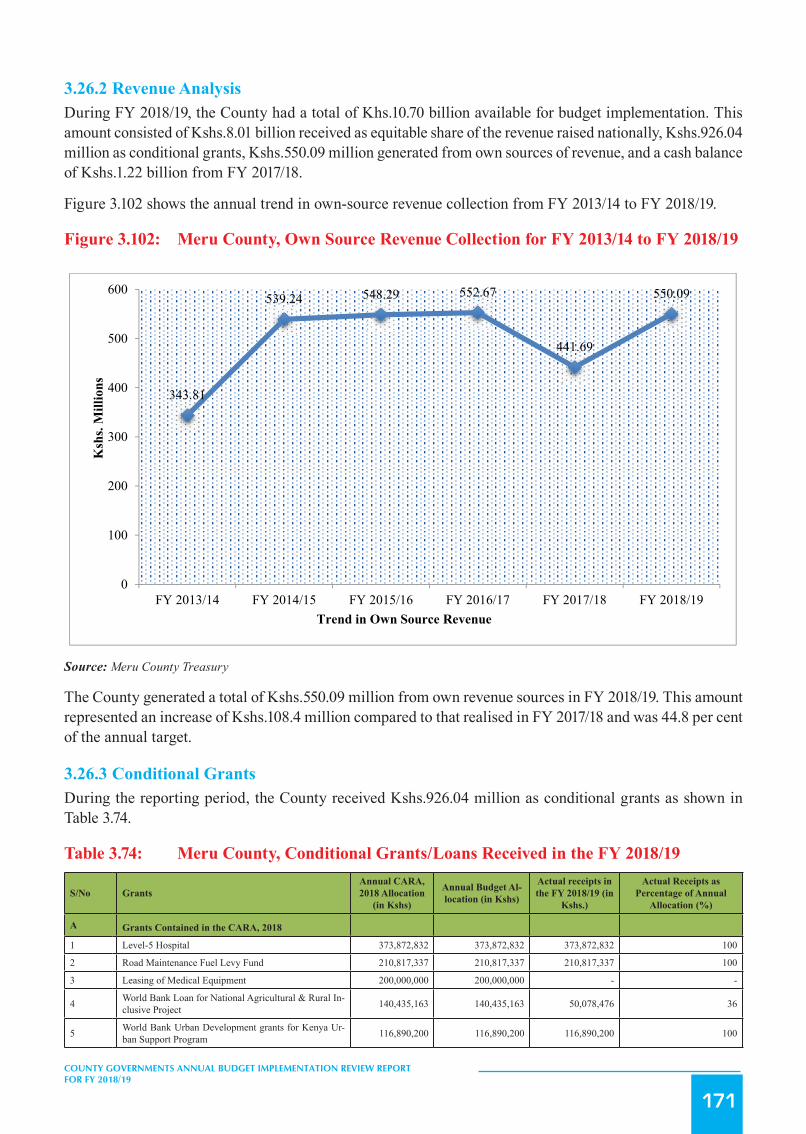
171
COUNTY GOVERNMENTS ANNUAL BUDGET IMPLEMENTATION REVIEW REPORT FOR FY 2018/19
3.26.2 Revenue AnalysisDuring FY 2018/19, the County had a total of Khs.10.70 billion available for budget implementation. This amount consisted of Kshs.8.01 billion received as equitable share of the revenue raised nationally, Kshs.926.04 million as conditional grants, Kshs.550.09 million generated from own sources of revenue, and a cash balance of Kshs.1.22 billion from FY 2017/18.
Figure 3.102 shows the annual trend in own-source revenue collection from FY 2013/14 to FY 2018/19.
Figure 3.102: Meru County, Own Source Revenue Collection for FY 2013/14 to FY 2018/19
210
A breakdown of the conditional grants is provided in Table 3.74.
3.26.2 Revenue Analysis During FY 2018/19, the County had a total of Khs.10.70 billion available for budget implementation. This amount
consisted of Kshs.8.01 billion received as equitable share of the revenue raised nationally, Kshs.926.04 million as
conditional grants, Kshs.550.09 million generated from own sources of revenue, and a cash balance of Kshs.1.22 billion
from FY 2017/18.
Figure 3.102 shows the annual trend in own-source revenue collection from FY 2013/14 to FY 2018/19.
Figure 3.102: Meru County, Own Source Revenue Collection for FY 2013/14 to FY 2018/19
Source: Meru County Treasury
The County generated a total of Kshs.550.09 million from own revenue sources in FY 2018/19. This amount
represented an increase of Kshs.108.4 million compared to that realised in FY 2017/18 and was 44.8 per cent of the
annual target.
3.26.3 Conditional Grants During the reporting period, the County received Kshs.926.04 million as conditional grants as shown in Table 3.74.
Table 3.74: Meru County, Conditional Grants/Loans Received in the FY 2018/19
S/No Grants Annual CARA, 2018 Allocation (in Kshs)
Annual Budget Allocation (in Kshs)
Actual receipts in the FY 2018/19 (in Kshs.)
Actual Receipts as Percentage of Annual Allocation (%)
343.81
539.24 548.29 552.67
441.69
550.09
0
100
200
300
400
500
600
FY 2013/14 FY 2014/15 FY 2015/16 FY 2016/17 FY 2017/18 FY 2018/19
Ksh
s. M
illio
ns
Trend in Own Source Revenue
Source: Meru County Treasury
The County generated a total of Kshs.550.09 million from own revenue sources in FY 2018/19. This amount represented an increase of Kshs.108.4 million compared to that realised in FY 2017/18 and was 44.8 per cent of the annual target.
3.26.3 Conditional GrantsDuring the reporting period, the County received Kshs.926.04 million as conditional grants as shown in Table 3.74.
Table 3.74: Meru County, Conditional Grants/Loans Received in the FY 2018/19
S/No GrantsAnnual CARA, 2018 Allocation
(in Kshs)
Annual Budget Al-location (in Kshs)
Actual receipts in the FY 2018/19 (in
Kshs.)
Actual Receipts as Percentage of Annual
Allocation (%)
A Grants Contained in the CARA, 2018
1 Level-5 Hospital 373,872,832 373,872,832 373,872,832 100
2 Road Maintenance Fuel Levy Fund 210,817,337 210,817,337 210,817,337 100
3 Leasing of Medical Equipment 200,000,000 200,000,000 - -
4 World Bank Loan for National Agricultural & Rural In-clusive Project 140,435,163 140,435,163 50,078,476 36
5 World Bank Urban Development grants for Kenya Ur-ban Support Program 116,890,200 116,890,200 116,890,200 100
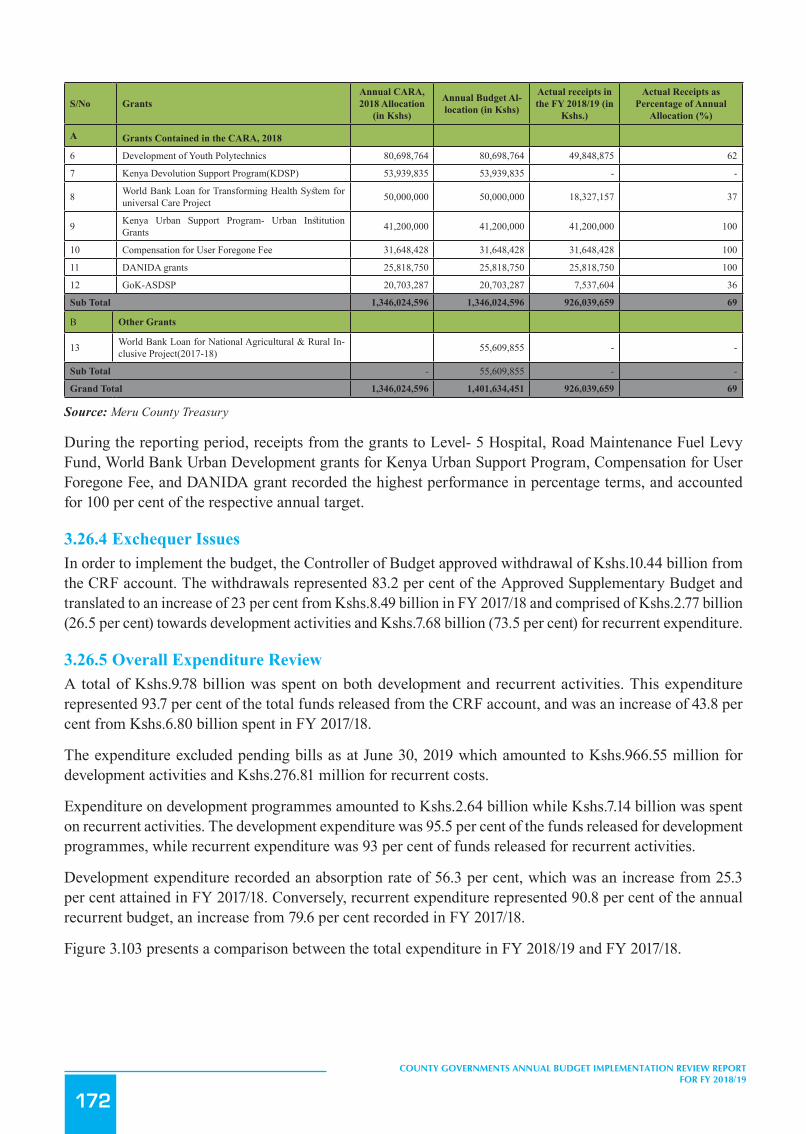
172
COUNTY GOVERNMENTS ANNUAL BUDGET IMPLEMENTATION REVIEW REPORT FOR FY 2018/19
S/No GrantsAnnual CARA, 2018 Allocation
(in Kshs)
Annual Budget Al-location (in Kshs)
Actual receipts in the FY 2018/19 (in
Kshs.)
Actual Receipts as Percentage of Annual
Allocation (%)
A Grants Contained in the CARA, 2018
6 Development of Youth Polytechnics 80,698,764 80,698,764 49,848,875 62
7 Kenya Devolution Support Program(KDSP) 53,939,835 53,939,835 - -
8 World Bank Loan for Transforming Health System for universal Care Project 50,000,000 50,000,000 18,327,157 37
9 Kenya Urban Support Program- Urban Institution Grants 41,200,000 41,200,000 41,200,000 100
10 Compensation for User Foregone Fee 31,648,428 31,648,428 31,648,428 100
11 DANIDA grants 25,818,750 25,818,750 25,818,750 100
12 GoK-ASDSP 20,703,287 20,703,287 7,537,604 36
Sub Total 1,346,024,596 1,346,024,596 926,039,659 69
B Other Grants
13 World Bank Loan for National Agricultural & Rural In-clusive Project(2017-18) 55,609,855 - -
Sub Total - 55,609,855 - -
Grand Total 1,346,024,596 1,401,634,451 926,039,659 69
Source: Meru County Treasury
During the reporting period, receipts from the grants to Level- 5 Hospital, Road Maintenance Fuel Levy Fund, World Bank Urban Development grants for Kenya Urban Support Program, Compensation for User Foregone Fee, and DANIDA grant recorded the highest performance in percentage terms, and accounted for 100 per cent of the respective annual target.
3.26.4 Exchequer IssuesIn order to implement the budget, the Controller of Budget approved withdrawal of Kshs.10.44 billion from the CRF account. The withdrawals represented 83.2 per cent of the Approved Supplementary Budget and translated to an increase of 23 per cent from Kshs.8.49 billion in FY 2017/18 and comprised of Kshs.2.77 billion (26.5 per cent) towards development activities and Kshs.7.68 billion (73.5 per cent) for recurrent expenditure.
3.26.5 Overall Expenditure ReviewA total of Kshs.9.78 billion was spent on both development and recurrent activities. This expenditure represented 93.7 per cent of the total funds released from the CRF account, and was an increase of 43.8 per cent from Kshs.6.80 billion spent in FY 2017/18.
The expenditure excluded pending bills as at June 30, 2019 which amounted to Kshs.966.55 million for development activities and Kshs.276.81 million for recurrent costs.
Expenditure on development programmes amounted to Kshs.2.64 billion while Kshs.7.14 billion was spent on recurrent activities. The development expenditure was 95.5 per cent of the funds released for development programmes, while recurrent expenditure was 93 per cent of funds released for recurrent activities.
Development expenditure recorded an absorption rate of 56.3 per cent, which was an increase from 25.3 per cent attained in FY 2017/18. Conversely, recurrent expenditure represented 90.8 per cent of the annual recurrent budget, an increase from 79.6 per cent recorded in FY 2017/18.
Figure 3.103 presents a comparison between the total expenditure in FY 2018/19 and FY 2017/18.

173
COUNTY GOVERNMENTS ANNUAL BUDGET IMPLEMENTATION REVIEW REPORT FOR FY 2018/19
Figure3.103: MeruCounty,ExpenditurebyEconomicClassification
212
Figure 3.103: Meru County, Expenditure by Economic Classification
Source: Meru County Treasury
3.26.6 Development Expenditure Analysis The total development expenditure of Kshs.2.64 billion represented 56.3 per cent of the annual development
expenditure estimates of Kshs.4.69 billion. Table 3.75 provides a summary of development projects with the highest
expenditure in the financial year.
Table 3.75: Meru County County, List of Development Projects with the Highest Expenditure in FY 2018/19
S/No. Project Name Project
Location Project Budget
Project Expenditure in FY 2018/19 (Kshs.)
Absorption Rate (%)
1 Routine Maintenance of roads County wide 471,030,138 470,993,995 100 2 Drilling and casing of Boreholes County wide 282,102,801 282,102,801 100 3 Construction of ECDE Classes County wide 143,349,540 140,739,540 98 4 Construction of County Headquarter Headquarter 120,000,000 110,000,000 92
5 Construction of ward block at Meru Teaching and Referral Hospital Municipality 350,000,000 77,375,134 22
6 Supply of UPVC pipes County wide 36,610,738 36,610,738 100 7 Meru Youth Services training avenue Municipality 19,500,000 19,500,000 100 8 CCTV installation at Meru Teaching and Referral Hospital Municipality 18,416,837 18,416,837 64 9 Purchase of trucks Buuri 11,338,000 11,338,000 100 10 Construction of Ngudune market Nkubu 10,868,963 10,868,963 100 Source: Meru County Treasury
3.26.7 Analysis of Recurrent Expenditure The total recurrent expenditure of Kshs.7.14 billion comprised of Kshs.4.63 billion (64.8 per cent) incurred on personnel
emoluments and Kshs.2.51 billion (35.2 per cent) on operations and maintenance as shown in Figure 3.103 .
Expenditure on personnel emoluments represented an increase of 6.6 per cent compared to FY 2017/18 when the
County spent Kshs.4.35 billion and was 47.4 per cent of the total expenditure in FY 2018/19. Figure 3.104 shows a
summary of operations and maintenance expenditure by major categories.
Figure 3.104: Meru County, Operations and Maintenance Expenditure by Major Categories in FY 2018/19
4,345.52(63.9 %)
1,642.17(24.1%)
812.69(12%)
4,631.25(47.4%)
2,507.79(25.6%)
2,641.51(27%)
‐
500
1,000
1,500
2,000
2,500
3,000
3,500
4,000
4,500
5,000
Personnel Emoluments Operations and Maintenance Development Expenditure
Ksh
s.Mill
ion
Expenditure by Economic Classification
FY 2017/18
FY 2018/19
Key
Source: Meru County Treasury
3.26.6 Development Expenditure AnalysisThe total development expenditure of Kshs.2.64 billion represented 56.3 per cent of the annual development expenditure estimates of Kshs.4.69 billion. Table 3.75 provides a summary of development projects with the highest expenditure in the financial year.
Table 3.75: Meru County, List of Development Projects with the Highest Expenditure in FY 2018/19
S/No. Project Name Project Location Project BudgetProject Expendi-
ture in FY 2018/19 (Kshs.)
Absorption Rate (%)
1 Routine Maintenance of roads County wide 471,030,138 470,993,995 100
2 Drilling and casing of Boreholes County wide 282,102,801 282,102,801 100
3 Construction of ECDE Classes County wide 143,349,540 140,739,540 98
4 Construction of County Headquarter Headquarter 120,000,000 110,000,000 92
5 Construction of ward block at Meru Teaching and Referral Hospital Municipality 350,000,000 77,375,134 22
6 Supply of UPVC pipes County wide 36,610,738 36,610,738 100
7 Meru Youth Services training avenue Municipality 19,500,000 19,500,000 100
8 CCTV installation at Meru Teaching and Referral Hospital Municipality 18,416,837 18,416,837 64
9 Purchase of trucks Buuri 11,338,000 11,338,000 100
10 Construction of Ngudune market Nkubu 10,868,963 10,868,963 100
Source: Meru County Treasury
3.26.7 Analysis of Recurrent ExpenditureThe total recurrent expenditure of Kshs.7.14 billion comprised of Kshs.4.63 billion (64.8 per cent) incurred on personnel emoluments and Kshs.2.51 billion (35.2 per cent) on operations and maintenance as shown in Figure 3.103 .

174
COUNTY GOVERNMENTS ANNUAL BUDGET IMPLEMENTATION REVIEW REPORT FOR FY 2018/19
Expenditure on personnel emoluments represented an increase of 6.6 per cent compared to FY 2017/18 when the County spent Kshs.4.35 billion and was 47.4 per cent of the total expenditure in FY 2018/19. Figure 3.104 shows a summary of operations and maintenance expenditure by major categories.
Figure 3.104: Meru County, Operations and Maintenance Expenditure by Major Categories in FY 2018/19
213
Source: Meru County Treasury
The County spent Kshs.82.66 million on committee sitting allowances for the 69 MCAs and Speaker against the annual
budget allocation of Kshs.82.66 million. This represented an increase of 70.7 per cent compared to Kshs.48.41 million
spent in FY 2017/18. The average monthly sitting allowance translated to Kshs.99, 836 per MCA against the SRC’s
recommended monthly ceiling of Kshs.124, 800.
Expenditure on domestic and foreign travel amounted to Kshs.328.37 million, and comprised of Kshs.260 million spent
by the County Assembly and Kshs.68.37 million by the County Executive. This expenditure represented 4.6 per cent of
total recurrent expenditure and was an increase of 80.9 per cent compared to Kshs.181.51 million spent in FY 2017/18.
3.26.8 Budget Performance by County Department Table 3.76 shows a summary of the approved budget allocation and performance by department in FY 2018/19.
Table 3.76: Meru County, Budget Performance by Department in FY 2018/19
Department
Annual Budget Allocation (Kshs. Million)
Exchequer Issues (Kshs. Million)
Expenditure (Kshs. Million)
Expenditure to Exchequer Issues (%)
Absorption Rate (%)
Rec Dev Rec Dev Rec Dev Rec Dev Rec Dev
County Assembly 937.22 82.00 936.67 4.51 930.31 4.51 99.3 100 99.3 5.5 Office of the Governor 333.71 5.50 319.78 - 279.44 - 87.4 - 83.7 - Finance, Economic Planning and ICT 939.15 230.91 932.46 145.62 803.71 163.9 86.2 112.
6 85.6 71
328.37301.61
250.40
188.30 187.27
150.00135.33
82.66 73.9754.46
0
50
100
150
200
250
300
350
Ksh
s. M
illio
n
Major Categories of Operations & Maintenance
Source: Meru County Treasury
The County spent Kshs.82.66 million on committee sitting allowances for the 69 MCAs and Speaker against the annual budget allocation of Kshs.82.66 million. This represented an increase of 70.7 per cent compared to Kshs.48.41 million spent in FY 2017/18. The average monthly sitting allowance translated to Kshs.99, 836 per MCA against the SRC’s recommended monthly ceiling of Kshs.124, 800.
Expenditure on domestic and foreign travel amounted to Kshs.328.37 million, and comprised of Kshs.260 million spent by the County Assembly and Kshs.68.37 million by the County Executive. This expenditure represented 4.6 per cent of total recurrent expenditure and was an increase of 80.9 per cent compared to Kshs.181.51 million spent in FY 2017/18.
3.26.8 Budget Performance by County DepartmentTable 3.76 shows a summary of the approved budget allocation and performance by department in FY 2018/19.

175
COUNTY GOVERNMENTS ANNUAL BUDGET IMPLEMENTATION REVIEW REPORT FOR FY 2018/19
Table 3.76: Meru County, Budget Performance by Department in FY 2018/19
DepartmentAnnual Budget Allocation
(Kshs. Million)Exchequer Issues (Kshs.
Million)Expenditure (Kshs.
Million)
Expenditure to Exchequer
Issues (%)
Absorption Rate (%)
Rec Dev Rec Dev Rec Dev Rec Dev Rec Dev
County Assembly 937.22 82.00 936.67 4.51 930.31 4.51 99.3 100 99.3 5.5
Office of the Governor 333.71 5.50 319.78 - 279.44 - 87.4 - 83.7 -
Finance, Economic Planning and ICT 939.15 230.91 932.46 145.62 803.71 163.9 86.2 112.6 85.6 71
Agriculture, Livestock and Fisheries 360.48 468.04 336.66 199.32 355.54 162.63 105.6 81.6 98.6 34.7
Water and Irrigation 121.42 871.72 119.63 800.29 110.64 786.74 92.5 95.6 91.1 87.7
Education, Technology, Gender, Culture and Social Development
944.10 259.68 931.26 203.27 842.49 201.86 90.5 99.3 89.2 77.7
Health Services 2,963.91 645.00 2,931.50 218.13 2,881.86 164.91 98.5 75.6 97.2 25.6
Lands, Physical Planning, Urban Development and Public Works
156.63 340.70 156.49 184.67 71.25 166.56 45.5 90.2 45.5 48.9
Public Service Administra-tion and Legal Affairs 698.07 - 628.93 - 608.83 - 96.8 - 87.2 -
Road, Transport and Energy 103.76 1,353.25 100.50 677.81 69.81 733.33 69.5 108.2 67.3 54.2
Trade, Investment, Indus-trialization, Tourism and Cooperative Development
99.59 206.37 86.79 174.36 82.16 150.83 94.7 86.5 82.5 73.1
Youth Affairs and Sport 138.67 156.91 134.31 111.95 68.26 98.03 50.8 87.6 49.2 62.5
Public Services Board 21.67 - 20.91 - 14.94 - 71.4 - 68.9 -
Environment & Natural Resources 44.34 73.32 42.29 45.15 19.79 30.20 46.8 66.9 44.6 41.2
Total 7,862.71 4,693.39 7,678.18 2,765.07 7,139.04 2,641.51 93.0 95.5 90.8 56.3
Source: Meru County Treasury
Analysis of expenditure by department shows that the Department of Water and Irrigation recorded the highest absorption rate of development budget at 87.7 per cent while the Office of the Governor did not spend in its development budget. The Department of Agriculture, Livestock and Fisheries had the highest percentage of recurrent expenditure to recurrent budget at 98.6 per cent while the Department of Environment and Natural Resources had the lowest at 44.6 per cent.
3.26.9 Key Observations and RecommendationsThe County has made progress in addressing some of the challenges previously identified as affecting budget implementation. Some of the progress made included:
i. Improvement in absorption of development budget. In the reporting period, the County attained an absorption rate of 56.3 per cent compared to 25.3 per cent in FY 2017/18.
ii. Improvement in own source revenue collection by 24.5 per cent from Kshs.441.69 million in FY 2017/18 to Kshs.550.09 million in the reporting period.
Despite the above progress, the following challenges continued to hamper effective budget implementation;
1. A high wage bill that increased by 6.6 per cent from Kshs.4.35 billion in FY 2017/18 to Kshs.4.63 billion in the reporting period. The wage bill accounted for 47.4 per cent of total expenditure in the reporting period.
2. High expenditure on travel, which increased by 80.9 per cent from Kshs.181.51million in FY 2017/18 to Kshs.328.37 million in the reporting period.
3. Delay in disbursement of the equitable share of revenue raised nationally by the National Treasury.4. Late submission of reports on financial and non-financial performance by the County Treasury to the
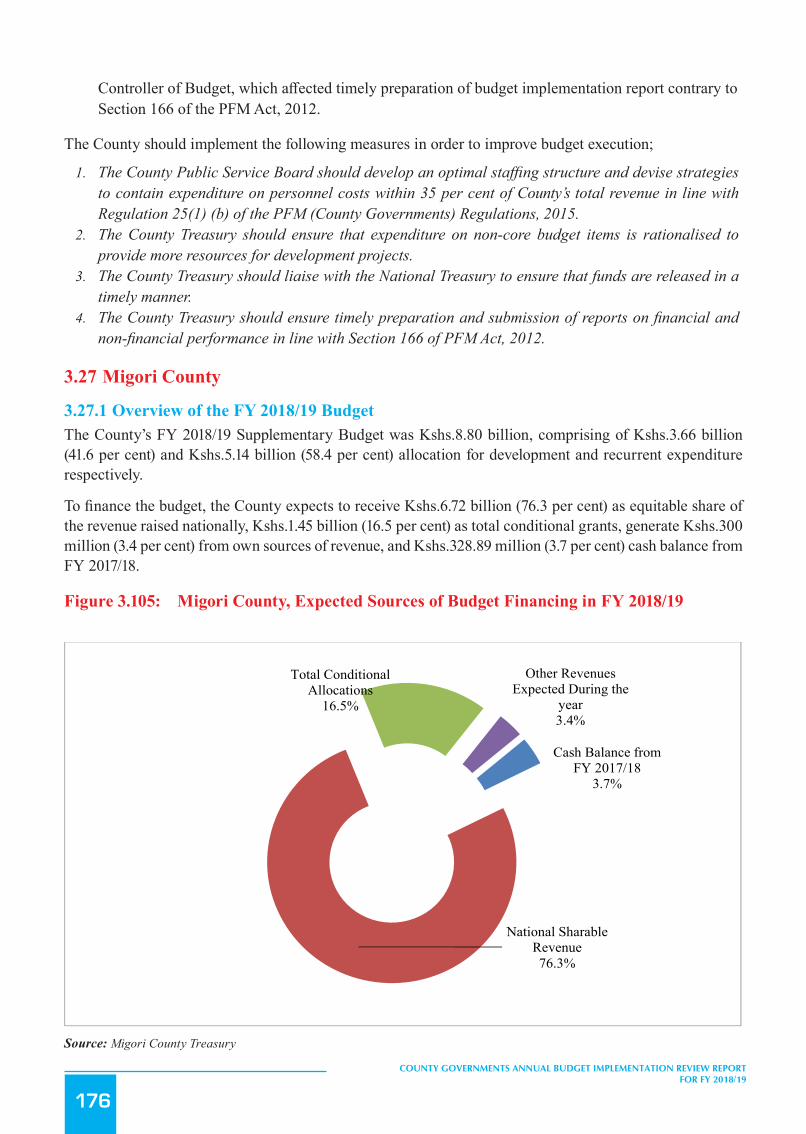
176
COUNTY GOVERNMENTS ANNUAL BUDGET IMPLEMENTATION REVIEW REPORT FOR FY 2018/19
Controller of Budget, which affected timely preparation of budget implementation report contrary to Section 166 of the PFM Act, 2012.
The County should implement the following measures in order to improve budget execution;
1. The County Public Service Board should develop an optimal staffing structure and devise strategies to contain expenditure on personnel costs within 35 per cent of County’s total revenue in line with Regulation 25(1) (b) of the PFM (County Governments) Regulations, 2015.
2. The County Treasury should ensure that expenditure on non-core budget items is rationalised to provide more resources for development projects.
3. The County Treasury should liaise with the National Treasury to ensure that funds are released in a timely manner.
4. The County Treasury should ensure timely preparation and submission of reports on financial and non-financial performance in line with Section 166 of PFM Act, 2012.
3.27 Migori County
3.27.1 Overview of the FY 2018/19 BudgetThe County’s FY 2018/19 Supplementary Budget was Kshs.8.80 billion, comprising of Kshs.3.66 billion (41.6 per cent) and Kshs.5.14 billion (58.4 per cent) allocation for development and recurrent expenditure respectively.
To finance the budget, the County expects to receive Kshs.6.72 billion (76.3 per cent) as equitable share of the revenue raised nationally, Kshs.1.45 billion (16.5 per cent) as total conditional grants, generate Kshs.300 million (3.4 per cent) from own sources of revenue, and Kshs.328.89 million (3.7 per cent) cash balance from FY 2017/18.
Figure 3.105: Migori County, Expected Sources of Budget Financing in FY 2018/19
1.
2.
3.
4.
215
The County should implement the following measures in order to improve budget execution;
The County Public Service Board should develop an optimal staffing structure and devise strategies to contain
expenditure on personnel costs within 35 per cent of County’s total revenue in line with Regulation 25(1) (b) of the
PFM (County Governments) Regulations, 2015.
The County Treasury should ensure that expenditure on non-core budget items is rationalised to provide more
resources for development projects.
The County Treasury should liaise with the National Treasury to ensure that funds are released in a timely manner.
The County Treasury should ensure timely preparation and submission of reports on financial and non -financial
performance in line with Section 166 of PFM Act, 2012.
3.27 Migori County
3.27.1 Overview of the FY 2018/19 Budget The County’s FY 2018/19 Supplementary Budget was Kshs.8.80 billion, comprising of Kshs.3.66 billion (41.6 per
cent) and Kshs.5.14 billion (58.4 per cent) allocation for development and recurrent expenditure respectively.
To finance the budget, the County expects to receive Kshs.6.72 billion (76.3 per cent) as equitable share of the revenue
raised nationally, Kshs.1.45 billion (16.5 per cent) as total conditional grants, generate Kshs.300 million (3.4 per cent)
from own sources of revenue, and Kshs.328.89 million (3.7 per cent) cash balance from FY 2017/18.
Figure 3.105: Migori County, Expected Sources of Budget Financing in FY 2018/19
Source: Migori County Treasury
A breakdown of the conditional grants is provided in Table 3.77 Table 3.1.
3.27.2 Revenue Analysis During FY 2018/19, the County had a total of Khs.8.50 billion available for budget implementation. This amount
consisted of Kshs.6.72 billion received as equitable share of the revenue raised nationally, Kshs.1.07 billion as
Cash Balance from FY 2017/18
3.7%
National Sharable Revenue76.3%
Total Conditional Allocations
16.5%
Other Revenues Expected During the
year3.4%
Source: Migori County Treasury

177
COUNTY GOVERNMENTS ANNUAL BUDGET IMPLEMENTATION REVIEW REPORT FOR FY 2018/19
A breakdown of the conditional grants is provided in Table 3.77.
3.27.2 Revenue AnalysisDuring FY 2018/19, the County had a total of Khs.8.50 billion available for budget implementation. This amount consisted of Kshs.6.72 billion received as equitable share of the revenue raised nationally, Kshs.1.07 billion as conditional grants, Kshs.380.22 million generated from own sources of revenue, and a cash balance of Kshs.328.89 million from FY 2017/18.
Figure 3.106 shows the annual trend in own-source revenue collection from FY 2013/14 to FY 2018/19
Figure 3.106: Migori County, Own Source Revenue Collection for FY 2013/14 to FY 2018/19
216
conditional grants, Kshs.380.22 million generated from own sources of revenue, and a cash balance of Kshs.328.89
million from FY 2017/18.
Figure 3.106 shows the annual trend in own-source revenue collection from FY 2013/14 to FY 2018/19
Figure 3.106: Migori County, Own Source Revenue Collection for FY 2013/14 to FY 2018/19
Source: Migori County Treasury
The County generated a total of Kshs.380.22 million from own revenue sources in FY 2018/19. This amount
represented an increase of Kshs.157.56 million compared to that realised in FY 2017/18 and was 126.7 per cent of the
annual target.
3.27.3 Conditional Grants During the reporting period, the County received Kshs.1.07 billion as conditional grants as shown in Table 3.77.
Table 3.77: Migori County, Conditional Grants/Loans Received in the FY 2018/19
S/No Grant Details
Annual Allocation-CARA, 2018) (Kshs)
Annual BudgetAllocation(Kshs)
Receipts in FY 2018/19 (Kshs)
Receipts asPercentage of Annual Budget Allocation(%)
1 IDA (World Bank) -Kenya Urban Support Project (KUSP) 518,367,800 518,367,800 518,367,800 100
2 Leasing of Medical Equipment 200,000,000 200,000,000 - -
3 Road Maintenance Fuel Levy 176,921,216 216,921,216 216,921,216 122.6
4 IDA (World Bank) National Agriculture and Rural Inclusive Growth Project) (NARIGP) 140,435,163 140,435,163 57,652,716 41.1
5 Transforming Health Systems for Universal Care Project (World Bank) 100,000,000 100,000,000 100,000,000 100
6 EU Grant -Instruments for Devolution Advice andSupport -(IDEAS) 90,000,000 90,000,000 50,705,556 56.3
7 IDA (World Bank)-Kenya Devolution Support Programme " Level 1 grant" 49,609,593 49,609,593 11,812,287 23.8
239.03
353.94 340.54301.75
222.66
380.22
050
100150200250300350400
FY 2013/14 FY 2014/15 FY 2015/16 FY 2016/17 FY 2017/18 FY 2018/19
Kshs. M
illions
Trend in Own Source Revenue
Source: Migori County Treasury
The County generated a total of Kshs.380.22 million from own revenue sources in FY 2018/19. This amount represented an increase of Kshs.157.56 million compared to that realised in FY 2017/18 and was 126.7 per cent of the annual target.
3.27.3 Conditional GrantsDuring the reporting period, the County received Kshs.1.07 billion as conditional grants as shown in Table 3.77.
Table 3.77: Migori County, Conditional Grants/Loans Received in the FY 2018/19
S/No Grant DetailsAnnual Allo-
cation-CARA, 2018)(Kshs)
Annual Budget Allo-cation (Kshs)
Receipts in FY 2018/19 (Kshs)
Receipts as Percentage of Annual
Budget Alloca-tion (%)
1 IDA (World Bank) -Kenya Urban Support Project (KUSP) 518,367,800 518,367,800 518,367,800 100
2 Leasing of Medical Equipment 200,000,000 200,000,000 - -
3 Road Maintenance Fuel Levy 176,921,216 216,921,216 216,921,216 122.6
4 IDA (World Bank) National Agriculture and Rural Inclusive Growth Project) (NARIGP) 140,435,163 140,435,163 57,652,716 41.1
5 Transforming Health Systems for Universal Care Project (World Bank) 100,000,000 100,000,000 100,000,000 100
6 EU Grant -Instruments for Devolution Advice and Support -(IDEAS) 90,000,000 90,000,000 50,705,556 56.3

178
COUNTY GOVERNMENTS ANNUAL BUDGET IMPLEMENTATION REVIEW REPORT FOR FY 2018/19
S/No Grant DetailsAnnual Allo-
cation-CARA, 2018)(Kshs)
Annual Budget Allo-cation (Kshs)
Receipts in FY 2018/19 (Kshs)
Receipts as Percentage of Annual
Budget Alloca-tion (%)
7 IDA (World Bank)-Kenya Devolution Support Programme “ Level 1 grant” 49,609,593 49,609,593 11,812,287 23.8
8 IDA (World Bank ) Credit: Kenya Urban Support Project (KUSP)- Urban Institutional Grants 41,200,000 41,200,000 41,200,000 100
9 Rehabilitation of Village Polytechnics 31,750,000 31,750,000 31,750,000 100
10 DANIDA- Universal Healthcare in Devolved System Pro-gramme 21,667,500 21,667,500 21,667,500 100
11 Compensation for User Fee Forgone 21,655,884 21,655,884 21,655,884 100
12 Sweden -Agriculture Sector Development Support Program-me(ASDSP) II+Bal C/F 2017/2018 21,019,514 21,019,514 - -
Grand Total 1,412,626,670 1,452,626,670 1,071,732959 75.9
Source: Migori County Treasury
During the reporting period, receipts from the Roads Maintenance Fuel Levy Fund recorded the highest performance in percentage terms, and accounted 122.6 per cent of the annual target.
3.27.4 Exchequer IssuesIn order to implement the budget, the Controller of Budget approved withdrawal of Kshs.7.86 billion from the CRF account. The withdrawals represented 89.3 per cent of the Approved Supplementary Budget and translated to increase of 14 per cent from Kshs.6.89 billion in FY 2017/18 and comprised of Kshs.2.98 billion (37.9 per cent) towards development activities and Kshs.4.88 billion (62.1 per cent) for recurrent expenditure.
3.27.5 Overall Expenditure ReviewA total of Kshs.6.37 billion was spent on both development and recurrent activities. This expenditure represented 81 per cent of the total funds released from the CRF account, and was an increase of 7.3 per cent from Kshs.5.93 billion spent in FY 2017/18.
The expenditure excluded pending bills as at June 30, 2019 which amounted to Kshs.392 million for development activities and Kshs.596.94 million for recurrent costs.
Expenditure on development programmes amounted to Kshs.1.81 billion while Kshs.4.55 billion was spent on recurrent activities. The development expenditure was 93.2 per cent of the funds released for development programmes, while recurrent expenditure was 61 per cent of funds released for recurrent activities.
Development expenditure recorded an absorption rate of 49.6 per cent, which was a decrease from 63.6 per cent attained in FY 2017/18. Conversely, recurrent expenditure represented 88.5 per cent of the annual recurrent budget an increase, from 74.7 per cent recorded in FY 2017/18.
Figure 3.107 presents a comparison between the total expenditure in FY 2018/19 and FY 2017/18.

179
COUNTY GOVERNMENTS ANNUAL BUDGET IMPLEMENTATION REVIEW REPORT FOR FY 2018/19
Figure3.107: MigoriCounty,ExpenditurebyEconomicClassification
218
Source: Migori County Treasury
3.27.6 Development Expenditure Analysis The total development expenditure of Kshs.1.81 billion represented 49.6 per cent of the annual development
expenditure estimates of Kshs.3.66 billion. Table 3.78 provides a summary of development projects with the highest
expenditure in the financial year.
Table 3.78: Migori County, List of Development Projects with the Highest Expenditure in FY 2018/19
S/No. Project Name Project Location Project Budget
Project Expenditure in FY 2018/19 (Kshs.)
Absorption Rate (%)
1 Upgrade to Bitumen Standard of Uriri - Oria Road Central and North Kanyamkago Wards 150,000,000 136,042,000 90.7
2 Supply and Installation of Floodlights Countywide 59,000,000 58,443,500 99.1
3 Construction of Awendo roads to bitument standard Central Sakwa ward 161,749,669 50,752,135 31.4
4 Construction of Rongo roads to bitumen standard Central Kamagambo ward 164,756,963 47,985,413 29
5 Construction of Ombo modern market Suna Central Ward 82,910,116 34,655,775 42 6 Construction of Awendo recreation park South Sakwa ward 56,912,624 27,862,539 49 7 Supply of tissue Culture banana seedlings County wide 19,360,000 19,360,000 100 8 Integrated Plan for Migori Town County Headquarters 44,972,838 17,561,164 100
9 Construction of Amenity ward at Migori County Referral Hospital Suna Central Ward 22,745,784 16,990,456 75
10 Rehabilitation of Migori water supply (Ombo bore hole) Suna Central Ward 14,636,400 14,636,400 100
Source: Migori County Treasury
3.27.7 Analysis of Recurrent Expenditure The total recurrent expenditure of Kshs.4.55 billion comprised of Kshs.2.91 billion (64.1 per cent) incurred on personnel
emoluments and Kshs.1.63 billion (35.9 per cent) on operations and maintenance as shown in Figure 3.107.
2,761.99(46.5%)
1,322.72(22.3%)
1,848.99(31.2%
2,917.58(45.8%)
1,634.98(25.7%)
1,814.50(28.5%)
-
500
1,000
1,500
2,000
2,500
3,000
3,500
Personnel Emoluments Operations and Maintenance Development Expenditure
Ksh
s.Mill
ion
Expenditure by Economic Classification
FY 2017/18
FY 2018/19
Key
Source: Migori County Treasury
3.27.6 Development Expenditure AnalysisThe total development expenditure of Kshs.1.81 billion represented 49.6 per cent of the annual development expenditure estimates of Kshs.3.66 billion. Table 3.78 provides a summary of development projects with the highest expenditure in the financial year.
Table 3.78: Migori County, List of Development Projects with the Highest Expenditure in FY 2018/19
S/No. Project Name Project Location Project Budget
Project Expenditure
in FY 2018/19 (Kshs.)
Absorption Rate (%)
1 Upgrade to Bitumen Standard of Uriri - Oria Road Central and North Kanyam-kago Wards 150,000,000 136,042,000 90.7
2 Supply and Installation of Floodlights Countywide 59,000,000 58,443,500 99.1
3 Construction of Awendo roads to bitument standard Central Sakwa ward 161,749,669 50,752,135 31.4
4 Construction of Rongo roads to bitumen standard Central Kamagambo ward 164,756,963 47,985,413 29
5 Construction of Ombo modern market Suna Central Ward 82,910,116 34,655,775 42
6 Construction of Awendo recreation park South Sakwa ward 56,912,624 27,862,539 49
7 Supply of tissue Culture banana seedlings County wide 19,360,000 19,360,000 100
8 Integrated Plan for Migori Town County Headquarters 44,972,838 17,561,164 100
9 Construction of Amenity ward at Migori County Refer-ral Hospital Suna Central Ward 22,745,784 16,990,456 75
10 Rehabilitation of Migori water supply (Ombo bore hole) Suna Central Ward 14,636,400 14,636,400 100
Source: Migori County Treasury
3.27.7 Analysis of Recurrent ExpenditureThe total recurrent expenditure of Kshs.4.55 billion comprised of Kshs.2.91 billion (64.1 per cent) incurred on personnel emoluments and Kshs.1.63 billion (35.9 per cent) on operations and maintenance as shown in Figure 3.107.
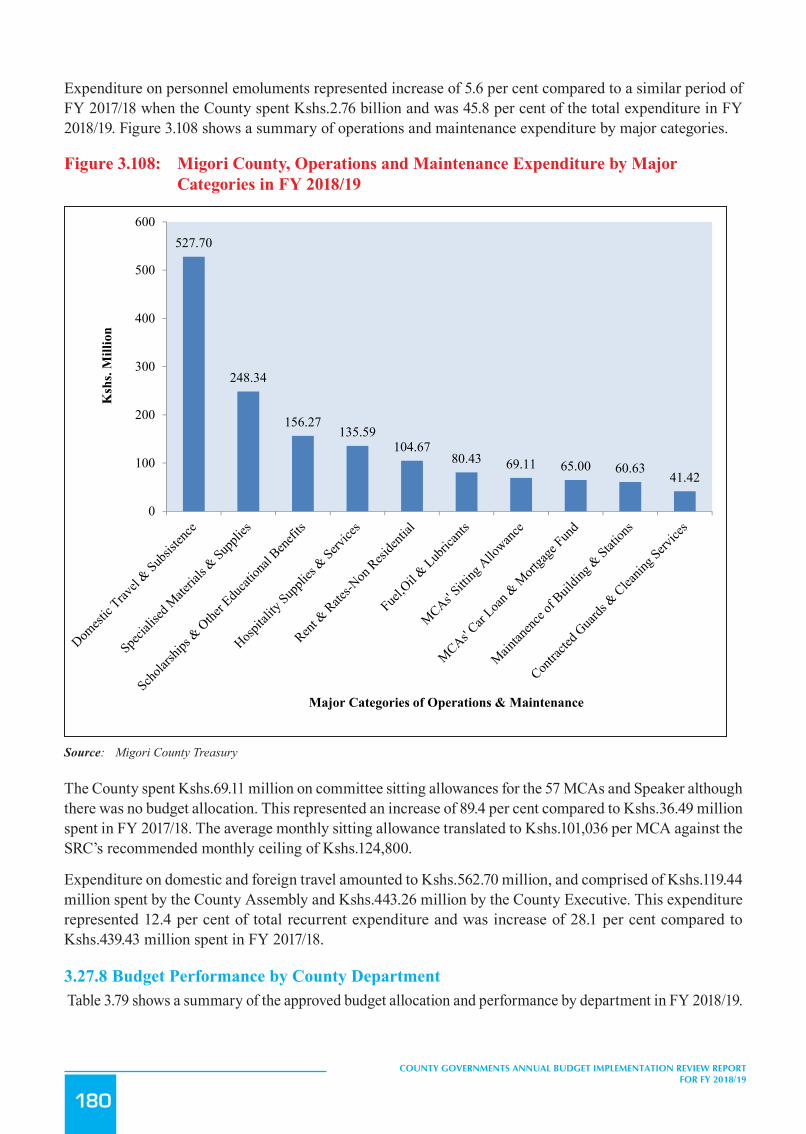
180
COUNTY GOVERNMENTS ANNUAL BUDGET IMPLEMENTATION REVIEW REPORT FOR FY 2018/19
Expenditure on personnel emoluments represented increase of 5.6 per cent compared to a similar period of FY 2017/18 when the County spent Kshs.2.76 billion and was 45.8 per cent of the total expenditure in FY 2018/19. Figure 3.108 shows a summary of operations and maintenance expenditure by major categories.
Figure 3.108: Migori County, Operations and Maintenance Expenditure by Major Categories in FY 2018/19
219
Expenditure on personnel emoluments represented increase of 5.6 per cent compared to a similar period of FY 2017/18
when the County spent Kshs.2.76 billion and was 45.8 per cent of the total expenditure in FY 2018/19. Figure 3.108
shows a summary of operations and maintenance expenditure by major categories.
Figure 3.108: Migori County, Operations and Maintenance Expenditure by Major Categories in FY 2018/19
Source: Migori County Treasury
The County spent Kshs.69.11 million on committee sitting allowances for the 57 MCAs and Speaker although there was
no budget allocation. This represented an increase of 89.4 per cent compared to Kshs.36.49 million spent in a similar
period of FY 2017/18. The average monthly sitting allowance translated to Kshs.101,036 per MCA against the SRC’s
recommended monthly ceiling of Kshs.124,800.
Expenditure on domestic and foreign travel amounted to Kshs.562.70 million, and comprised of Kshs.119.44 million
spent by the County Assembly and Kshs.443.26 million by the County Executive. This expenditure represented 12.4 per
cent of total recurrent expenditure and was increase of 28.1 per cent compared to Kshs.439.43 million spent in FY
2017/18.
3.27.8 Budget Performance by County Department Table 3.79 shows a summary of the approved budget allocation and performance by department in FY 2018/19.
Table 3.79: Migori County, Budget Performance by Department in FY 2018/19
527.70
248.34
156.27135.59
104.6780.43 69.11 65.00 60.63
41.42
0
100
200
300
400
500
600
Ksh
s. M
illio
n
Major Categories of Operations & Maintenance
Source: Migori County Treasury
The County spent Kshs.69.11 million on committee sitting allowances for the 57 MCAs and Speaker although there was no budget allocation. This represented an increase of 89.4 per cent compared to Kshs.36.49 million spent in FY 2017/18. The average monthly sitting allowance translated to Kshs.101,036 per MCA against the SRC’s recommended monthly ceiling of Kshs.124,800.
Expenditure on domestic and foreign travel amounted to Kshs.562.70 million, and comprised of Kshs.119.44 million spent by the County Assembly and Kshs.443.26 million by the County Executive. This expenditure represented 12.4 per cent of total recurrent expenditure and was increase of 28.1 per cent compared to Kshs.439.43 million spent in FY 2017/18.
3.27.8 Budget Performance by County Department Table 3.79 shows a summary of the approved budget allocation and performance by department in FY 2018/19.
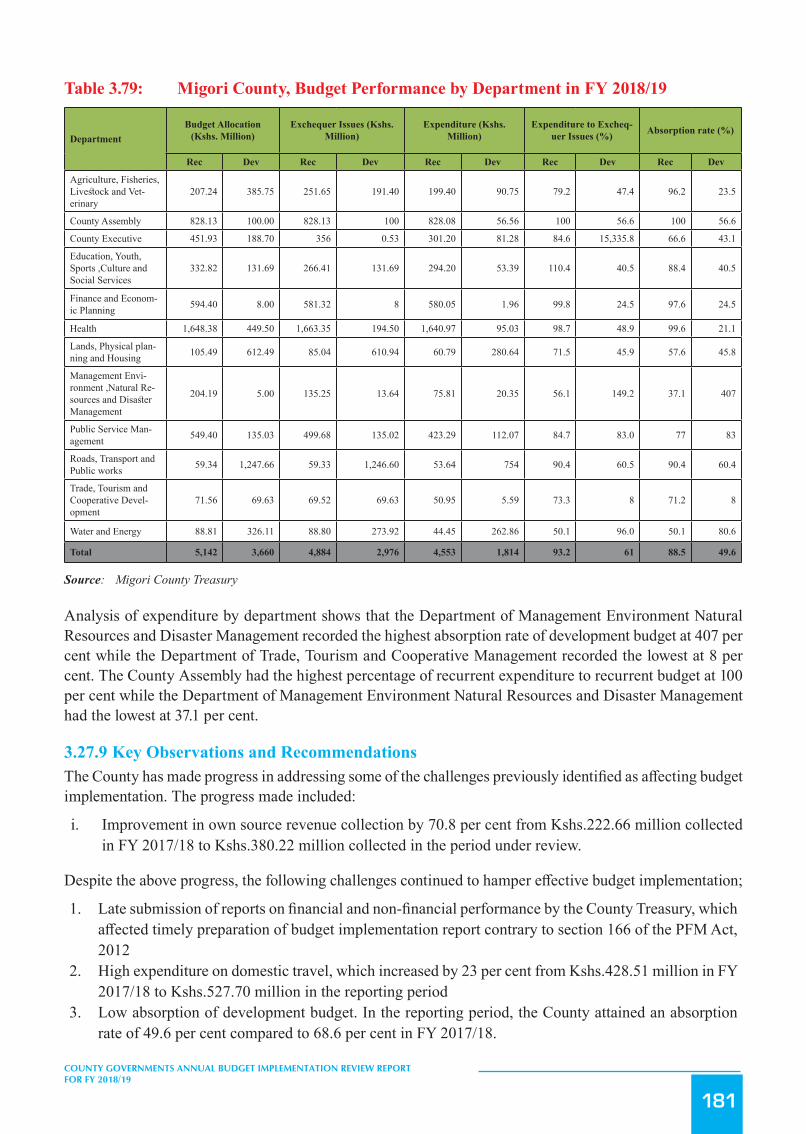
181
COUNTY GOVERNMENTS ANNUAL BUDGET IMPLEMENTATION REVIEW REPORT FOR FY 2018/19
Table 3.79: Migori County, Budget Performance by Department in FY 2018/19
DepartmentBudget Allocation
(Kshs. Million)Exchequer Issues (Kshs.
Million)Expenditure (Kshs.
Million)Expenditure to Excheq-
uer Issues (%) Absorption rate (%)
Rec Dev Rec Dev Rec Dev Rec Dev Rec Dev
Agriculture, Fisheries, Livestock and Vet-erinary
207.24 385.75 251.65 191.40 199.40 90.75 79.2 47.4 96.2 23.5
County Assembly 828.13 100.00 828.13 100 828.08 56.56 100 56.6 100 56.6
County Executive 451.93 188.70 356 0.53 301.20 81.28 84.6 15,335.8 66.6 43.1
Education, Youth, Sports ,Culture and Social Services
332.82 131.69 266.41 131.69 294.20 53.39 110.4 40.5 88.4 40.5
Finance and Econom-ic Planning 594.40 8.00 581.32 8 580.05 1.96 99.8 24.5 97.6 24.5
Health 1,648.38 449.50 1,663.35 194.50 1,640.97 95.03 98.7 48.9 99.6 21.1
Lands, Physical plan-ning and Housing 105.49 612.49 85.04 610.94 60.79 280.64 71.5 45.9 57.6 45.8
Management Envi-ronment ,Natural Re-sources and Disaster Management
204.19 5.00 135.25 13.64 75.81 20.35 56.1 149.2 37.1 407
Public Service Man-agement 549.40 135.03 499.68 135.02 423.29 112.07 84.7 83.0 77 83
Roads, Transport and Public works 59.34 1,247.66 59.33 1,246.60 53.64 754 90.4 60.5 90.4 60.4
Trade, Tourism and Cooperative Devel-opment
71.56 69.63 69.52 69.63 50.95 5.59 73.3 8 71.2 8
Water and Energy 88.81 326.11 88.80 273.92 44.45 262.86 50.1 96.0 50.1 80.6
Total 5,142 3,660 4,884 2,976 4,553 1,814 93.2 61 88.5 49.6
Source: Migori County Treasury
Analysis of expenditure by department shows that the Department of Management Environment Natural Resources and Disaster Management recorded the highest absorption rate of development budget at 407 per cent while the Department of Trade, Tourism and Cooperative Management recorded the lowest at 8 per cent. The County Assembly had the highest percentage of recurrent expenditure to recurrent budget at 100 per cent while the Department of Management Environment Natural Resources and Disaster Management had the lowest at 37.1 per cent.
3.27.9 Key Observations and RecommendationsThe County has made progress in addressing some of the challenges previously identified as affecting budget implementation. The progress made included:
i. Improvement in own source revenue collection by 70.8 per cent from Kshs.222.66 million collected in FY 2017/18 to Kshs.380.22 million collected in the period under review.
Despite the above progress, the following challenges continued to hamper effective budget implementation;
1. Late submission of reports on financial and non-financial performance by the County Treasury, which affected timely preparation of budget implementation report contrary to section 166 of the PFM Act, 2012
2. High expenditure on domestic travel, which increased by 23 per cent from Kshs.428.51 million in FY 2017/18 to Kshs.527.70 million in the reporting period
3. Low absorption of development budget. In the reporting period, the County attained an absorption rate of 49.6 per cent compared to 68.6 per cent in FY 2017/18.

182
COUNTY GOVERNMENTS ANNUAL BUDGET IMPLEMENTATION REVIEW REPORT FOR FY 2018/19
4. A high wage bill that increased by 5.6 per cent from Kshs.2.76 billion in FY 2017/18 to Kshs.2.91 billion in the reporting period. The wage bill accounted for 45.8 per cent of total expenditure in the reporting period.
5. Inadequate budgetary control that resulted in expenditure above approved budget by the Department of Management Environment, Natural Resources and Disaster Management. This is contrary to Section 135 and 154 of PFM Act, 2012.
The County should implement the following measures in order to improve budget execution;
1. The County Treasury should ensure timely preparation and submission of reports on f inancial and non-f inancial performance in line with Section 166 of PFM Act, 2012.
2. The County Treasury should ensure that expenditure on non-core budget items is rationalised to provide more resources for development projects.
3. The County should identify and address issues that cause delays in the implementation of development projects.
4. The County Public Service Board should develop an optimal staffing structure and devise strategies to contain expenditure on personnel costs within 35 per cent of County’s total revenue in line with Regulation 25(1) (b) of the PFM (County Governments) Regulations.
5. The County Treasury should ensure expenditure is within the approved budget.
3.28 Mombasa County
3.28.1 Overview of the FY 2018/19 BudgetThe County’s FY 2018/19 Supplementary Budget was Kshs.14.46 billion, comprising of Kshs.4.34 billion (30 per cent) and Kshs.10.11 billion (70 per cent) allocation for development and recurrent expenditure respectively.
To finance the budget, the County expected to receive Kshs.8.23 billion (56.9 per cent) as equitable share of the revenue raised nationally, Kshs.1.49 billion (10.3 per cent) as total conditional grants, generate Kshs.4.74 billion (32.8 per cent) from own sources of revenue.
Figure 3.109: Mombasa County, Expected Sources of Budget Financing in FY 2018/19
221
4. A high wage bill that increased by 5.6 per cent from Kshs.2.76 billion in FY 2017/18 to Kshs.2.91 billion in the
reporting period. The wage bill accounted for 45.8 per cent of total expenditure in the reporting period.
5. Inadequate budgetary control that resulted in expenditure above approved budget by the Department of Management Environment, Natural Resources and Disaster Management. This is contrary to Section 135 and 154
of PFM Act, 2012.
The County should implement the following measures in order to improve budget execution;
1. The County Treasury should ensure timely preparation and submission of repor ts on f inancial and non
- f inancial performance in line with Section 166 of PFM Act, 2012.
2. The County Treasury should ensure that expenditure on non-core budget items is rationalised to provide more
resources for development projects.
3. The County should identify and address issues that cause delays in the implementation of development projects.
4. The County Public Service Board should develop an optimal staffing structure and devise strategies to contain
expenditure on personnel costs within 35 per cent of County’s total revenue in line with Regulation 25(1) (b) of the
PFM (County Governments) Regulations.
5. The County Treasury should ensure expenditure is within the approved budget.
3.28 Mombasa County
3.28.1 Overview of the FY 2018/19 Budget The County’s FY 2018/19 Supplementary Budget was Kshs.14.46 billion, comprising of Kshs.4.34 billion (30 per cent)
and Kshs.10.11 billion (70 per cent) allocation for development and recurrent expenditure respectively.
To finance the budget, the County expected to receive Kshs.8.23 billion (56.9 per cent) as equitable share of the
revenue raised nationally, Kshs.1.49 billion (10.3 per cent) as total conditional grants, generate Kshs.4.74 billion (32.8
per cent) from own sources of revenue.
Figure 3.109: Mombasa County Expected Sources of Budget Financing in FY 2018/19
Source: Mombasa County Treasury
National Sharable Revenue56.9%
Total Conditional Allocations
10.3%
Own Source Revenue32.8%
Source: Mombasa County Treasury
A breakdown of the conditional grants is provided in Table 3.80.

183
COUNTY GOVERNMENTS ANNUAL BUDGET IMPLEMENTATION REVIEW REPORT FOR FY 2018/19
3.28.2 Revenue AnalysisDuring FY 2018/19, the County had a total of Khs.12.65 billion available for budget implementation. This amount consisted of Kshs.8.23 billion received as equitable share of the revenue raised nationally, Kshs.722.63 million as conditional grants, and generated Kshs.3.71 billion from own sources of revenue.
Figure 3.110 shows the annual trend in own-source revenue collection from FY 2013/14 to FY 2018/19.
Figure 3.110: Mombasa County, Own Source Revenue Collection for FY 2013/14 to FY 2018/19
222
A breakdown of the conditional grants is provided in Table 3.80.
3.28.2 Revenue AnalysisDuring FY 2018/19, the County had a total of Khs.12.65 billion available for budget implementation. This amount
consisted of Kshs.8.23 billion received as equitable share of the revenue raised nationally, Kshs.722.63 million as
conditional grants, and generated Kshs.3.71 billion from own sources of revenue.
Figure 3.110 shows the annual trend in own-source revenue collection from FY 2013/14 to FY 2018/19.
Figure 3.110: Mombasa County, Own Source Revenue Collection for FY 2013/14 to FY 2018/19
Source: Mombasa County Treasury
The County generated a total of Kshs.3.70 billion from own revenue sources in FY 2018/19. This amount represented an
increase of Kshs.545.6 million compared to that realised in FY 2017/18 and was 78.1 per cent of the annual target.
3.28.3 Conditional Grants During the reporting period, the County received Kshs.722.63 million as conditional grants as shown in Table 3.80.
Table 3.80: Mombasa, Conditional Grants/Loans Received in the FY 2018/19
S/No Grants Annual CARA, 2018 Allocation (in Kshs)
Annual Budget Allocation (in Kshs)
Actual receipts in the FY 2018/19 (in Kshs.)
Actual Receipts as Percentageof AnnualAllocation (%)
1 Grants to Level- 5 Hospital 388,439,306 600,000,000 388,439,306 100
2 Supplement for Construction of County Headquarters - 388,439,306 - -
3 Compensation for User Fee Foregone 23,385,934 216,604,479 23,385,934 1004 Leasing of Medical Equipment 200,000,000 - - -
5 IDA (World Bank) -Kenya Urban Support Project (KUSP) - 103,142,787 - -
6 Road Maintenance Fuel Levy 216,604,479 50,000,000 255,997,699 118.2
7 Transforming Health Systems for Universal Care Project (World Bank) 50,000,000 39,895,000 27,473,711 54.9
1,716.00
2,476.63
3,165.79 3,166.24 3,159.00
3,705.40
0
500
1,000
1,500
2,000
2,500
3,000
3,500
4,000
FY 2013/14 FY 2014/15 FY 2015/16 FY 2016/17 FY 2017/18 FY 2018/19
Ksh
s. M
illio
n
Trend in Own Source Revenue
Source: Mombasa County Treasury
The County generated a total of Kshs.3.71 billion from own revenue sources in FY 2018/19. This amount represented an increase of Kshs.545.6 million compared to that realised in FY 2017/18 and was 78.1 per cent of the annual target.
3.28.3 Conditional GrantsDuring the reporting period, the County received Kshs.722.63 million as conditional grants as shown in Table 3.80.
Table 3.80: Mombasa County, Conditional Grants/Loans Received in the FY 2018/19
S/No Grants Annual CARA, 2018 Allocation (in Kshs)
Annual Budget Alloca-tion (in Kshs)
Actual receipts in the FY 2018/19 (in Kshs.)
Actual Receipts as Percentage of Annual Alloca-tion (%)
1 Grants to Level- 5 Hospital 388,439,306 600,000,000 388,439,306 100
2 Supplement for Construction of County Headquarters - 388,439,306 - -
3 Compensation for User Fee Foregone 23,385,934 216,604,479 23,385,934 100
4 Leasing of Medical Equipment 200,000,000 - - -
5 IDA (World Bank) -Kenya Urban Support Project (KUSP) - 103,142,787 - -
6 Road Maintenance Fuel Levy 216,604,479 50,000,000 255,997,699 118.2
7 Transforming Health Systems for Universal Care Project (World Bank) 50,000,000 39,895,000 27,473,711 54.9
8 Rehabilitation of Village Polytechnics 39,895,000 35,591,582 - -
9 IDA (World Bank) -National Agricultural and Rural Inclu-sive Growth Project (NARIGP) - 30,697,405 - -
10 IDA (World Bank) Kenya Devolution Support Programme “Level 1 grant” 53,333,725 23,385,934 - -

184
COUNTY GOVERNMENTS ANNUAL BUDGET IMPLEMENTATION REVIEW REPORT FOR FY 2018/19
S/No Grants Annual CARA, 2018 Allocation (in Kshs)
Annual Budget Alloca-tion (in Kshs)
Actual receipts in the FY 2018/19 (in Kshs.)
Actual Receipts as Percentage of Annual Alloca-tion (%)
11 DANIDA - Universal Healthcare in Devolved System Pro-gramme 27,337,500 - 27,337,500 -
Grand Total 998,995,944 1,487,756,493 722,634,150 72.3
Source: Mombasa County Treasury
During the reporting period, receipts from the Road Maintenance Fuel Levy Fund recorded the highest performance in percentage terms, and accounted 118.2 per cent of the annual target.
3.28.4 Exchequer IssuesIn order to implement the budget, the Controller of Budget approved withdrawal of Kshs.12.39 billion from the CRF account. The withdrawals represented 85.8 per cent of the Approved Supplementary Budget and translated to an increase of 17.3 per cent from Kshs.10.57 billion in FY 2017/18 and comprised of Kshs.3.41 billion (27.5 per cent) towards development activities and Kshs.8.99 billion (72.5 per cent) for recurrent expenditure.
3.28.5 Overall Expenditure ReviewA total of Kshs.12.64 billion was spent on both development and recurrent activities. This expenditure represented 101.1 per cent of the total funds released from the CRF account, and was an increase of 21.6 per cent from Kshs.10.30 billion spent in FY 2017/18.
The expenditure excluded pending bills as at June 30, 2019 which amounted to Kshs.762.79 million for development activities and Kshs.3.26 billion for recurrent costs.
Expenditure on development programmes amounted to Kshs.3.11 billion while Kshs.9.53 billion was spent on recurrent activities. The development expenditure was 91.1 per cent of the funds released for development programmes, while recurrent expenditure was 104.8 per cent of funds released for recurrent activities.
Development expenditure recorded an absorption rate of 71.5 per cent, which was a decrease from 76 per cent attained in FY 2017/18. Conversely, recurrent expenditure represented 93.2 per cent of the annual recurrent budget, a decrease from 83.9 per cent recorded in FY 2017/18.
Figure 3.111 presents a comparison between the total expenditure in FY 2018/19 and FY 2017/18.
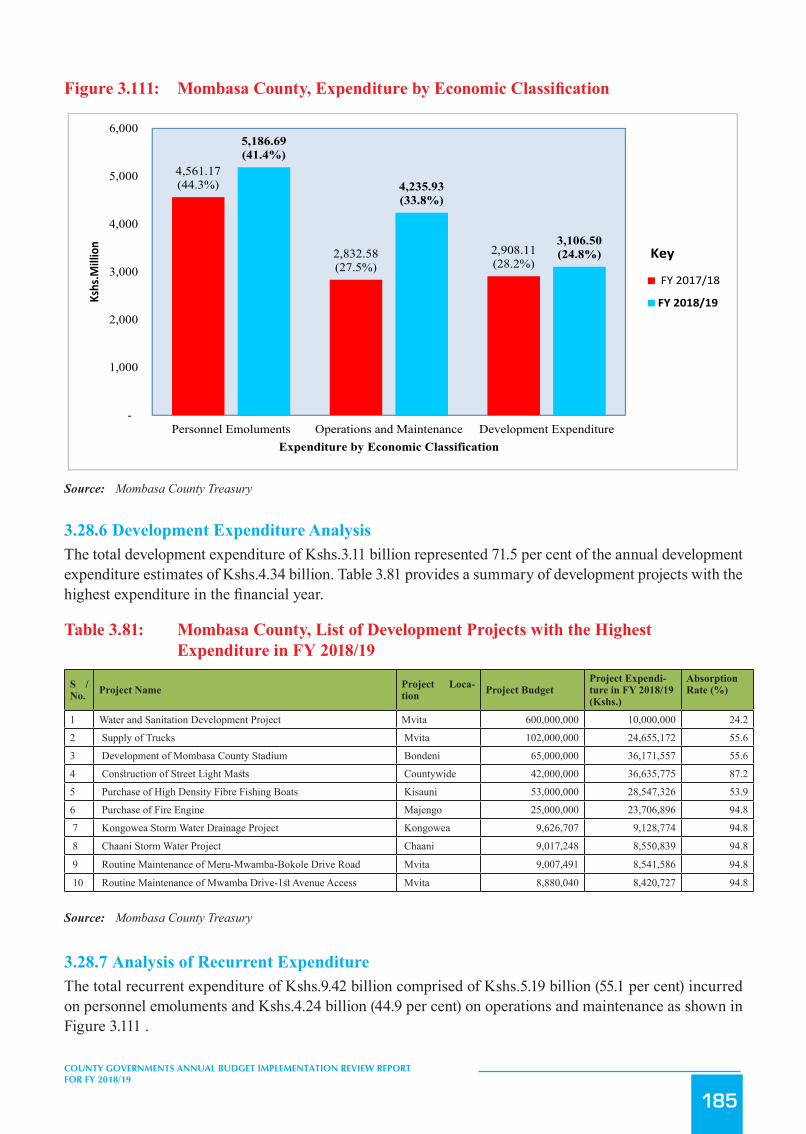
185
COUNTY GOVERNMENTS ANNUAL BUDGET IMPLEMENTATION REVIEW REPORT FOR FY 2018/19
Figure3.111: MombasaCounty,ExpenditurebyEconomicClassification
224
Source: Mombasa County Treasury
3.28.6 Development Expenditure Analysis
The total development expenditure of Kshs.3.11 billion represented 71.5 per cent of the annual development
expenditure estimates of Kshs.4.34 billion. Table 3.81 provides a summary of development projects with the highest
expenditure in the financial year.
Table 3.81: Mombasa County, List of Development Projects with the Highest Expenditure in FY 2018/19
S/No.
Project Name Project Location Project Budget
Project Expenditure in FY 2018/19 (Kshs.)
Absorption Rate (%)
1 Water and Sanitation Development Project Mvita 600,000,000 10,000,000 24.2 2 Supply of Trucks Mvita 102,000,000 24,655,172 55.6 3 Development of Mombasa County Stadium Bondeni 65,000,000 36,171,557 55.6 4 Construction of Street Light Masts Countywide 42,000,000 36,635,775 87.2 5 Purchase of High Density Fibre Fishing Boats Kisauni 53,000,000 28,547,326 53.9 6 Purchase of Fire Engine Majengo 25,000,000 23,706,896 94.8 7 Kongowea Storm Water Drainage Project Kongowea 9,626,707 9,128,774 94.8
8 Chaani Storm Water Project Chaani 9,017,248 8,550,839 94.8
9 Routine Maintenance of Meru-Mwamba-Bokole Drive Road Mvita 9,007,491 8,541,586 94.8
10 Routine Maintenance of Mwamba Drive-1st Avenue Access Mvita 8,880,040 8,420,727 94.8
Source: Mombasa County Treasury
3.28.7 Analysis of Recurrent Expenditure The total recurrent expenditure of Kshs.9.42 billion comprised of Kshs.5.19 billion (55.1 per cent) incurred on
personnel emoluments and Kshs.4.24 billion (44.9 per cent) on operations and maintenance as shown in Figure 3.111 .
4,561.17(44.3%)
2,832.58(27.5%)
2,908.11(28.2%)
5,186.69(41.4%)
4,235.93(33.8%)
3,106.50(24.8%)
-
1,000
2,000
3,000
4,000
5,000
6,000
Personnel Emoluments Operations and Maintenance Development Expenditure
Kshs.M
illion
Expenditure by Economic Classification
FY 2017/18
FY 2018/19
Key
Source: Mombasa County Treasury
3.28.6 Development Expenditure AnalysisThe total development expenditure of Kshs.3.11 billion represented 71.5 per cent of the annual development expenditure estimates of Kshs.4.34 billion. Table 3.81 provides a summary of development projects with the highest expenditure in the financial year.
Table 3.81: Mombasa County, List of Development Projects with the Highest Expenditure in FY 2018/19
S /No. Project Name Project Loca-
tion Project BudgetProject Expendi-ture in FY 2018/19 (Kshs.)
Absorption Rate (%)
1 Water and Sanitation Development Project Mvita 600,000,000 10,000,000 24.2
2 Supply of Trucks Mvita 102,000,000 24,655,172 55.6
3 Development of Mombasa County Stadium Bondeni 65,000,000 36,171,557 55.6
4 Construction of Street Light Masts Countywide 42,000,000 36,635,775 87.2
5 Purchase of High Density Fibre Fishing Boats Kisauni 53,000,000 28,547,326 53.9
6 Purchase of Fire Engine Majengo 25,000,000 23,706,896 94.8
7 Kongowea Storm Water Drainage Project Kongowea 9,626,707 9,128,774 94.8
8 Chaani Storm Water Project Chaani 9,017,248 8,550,839 94.8
9 Routine Maintenance of Meru-Mwamba-Bokole Drive Road Mvita 9,007,491 8,541,586 94.8
10 Routine Maintenance of Mwamba Drive-1st Avenue Access Mvita 8,880,040 8,420,727 94.8
Source: Mombasa County Treasury
3.28.7 Analysis of Recurrent ExpenditureThe total recurrent expenditure of Kshs.9.42 billion comprised of Kshs.5.19 billion (55.1 per cent) incurred on personnel emoluments and Kshs.4.24 billion (44.9 per cent) on operations and maintenance as shown in Figure 3.111 .

186
COUNTY GOVERNMENTS ANNUAL BUDGET IMPLEMENTATION REVIEW REPORT FOR FY 2018/19
Expenditure on personnel emoluments represented an increase of 13.7 per cent compared to FY 2017/18 when the County spent Kshs.4.56 billion and was 41.4 per cent of the total expenditure in FY 2018/19. Figure 3.112 shows a summary of operations and maintenance expenditure by major categories.
Figure 3.112: Mombasa County, Operations and Maintenance Expenditure by Major Categories in FY 2018/19
225
Expenditure on personnel emoluments represented an increase of 13.7 per cent compared to FY 2017/18 when the
County spent Kshs.4.56 billion and was 41.4 per cent of the total expenditure in FY 2018/19. Figure 3.112 shows a
summary of operations and maintenance expenditure by major categories.
Figure 3.112: Mombasa County, Operations and Maintenance Expenditure by Major Categories in FY 2018/19
Source: Mombasa County Treasury
The County spent Kshs.35.11 million on committee sitting allowances for the 43 MCAs and Speaker against the annual
budget allocation of Kshs.43.71 million. This represented an increase of 44.6 per cent compared to Kshs.24.28 million
spent in FY 2017/18. The average monthly sitting allowance translated to Kshs.68,061 per MCA against the SRC’s
recommended monthly ceiling of Kshs.124,800.
Expenditure on domestic and foreign travel amounted to Kshs.557.18 million, and comprised of Kshs.6.19 million spent
by the County Assembly and Kshs.550.98 million by the County Executive. This expenditure represented 5.9 per cent of
total recurrent expenditure and was an increase of 118.3 per cent compared to Kshs.255.18 million spent in FY 2017/18.
3.28.8 Budget Performance by County Department Table 3.82 shows a summary of the approved budget allocation and performance by department in FY 2018/19.
Table 3.82: Mombasa County, Budget Performance by Department in FY 2018/19
Department Annual Budget Allocation (Kshs. Exchequer Issues Expenditure (Kshs. Expenditure to
Exchequer Issues Absorption
677.35
333.32293.97
255.14223.75
145.19 143.74 128.9069.28 49.31
0
100
200
300
400
500
600
700
800
Ksh
s. M
illio
n
Major Categories of Operations & Maintenance
Source: Mombasa County Treasury
The County spent Kshs.35.11 million on committee sitting allowances for the 43 MCAs and Speaker against the annual budget allocation of Kshs.43.71 million. This represented an increase of 44.6 per cent compared to Kshs.24.28 million spent in FY 2017/18. The average monthly sitting allowance translated to Kshs.68,061 per MCA against the SRC’s recommended monthly ceiling of Kshs.124,800.
Expenditure on domestic and foreign travel amounted to Kshs.557.18 million, and comprised of Kshs.6.19 million spent by the County Assembly and Kshs.550.98 million by the County Executive. This expenditure represented 5.9 per cent of total recurrent expenditure and was an increase of 118.3 per cent compared to Kshs.255.18 million spent in FY 2017/18.
3.28.8 Budget Performance by County DepartmentTable 3.82 shows a summary of the approved budget allocation and performance by department in FY 2018/19.

187
COUNTY GOVERNMENTS ANNUAL BUDGET IMPLEMENTATION REVIEW REPORT FOR FY 2018/19
Table 3.82: Mombasa County, Budget Performance by Department in FY 2018/19
DepartmentAnnual Budget Allo-cation (Kshs. Million)
Exchequer Issues (Kshs. Million)
Expenditure (Kshs. Million)
Expenditure to Exchequer Issues
(%)Absorption Rate (%)
Rec Dev Rec Dev Rec Dev Rec Dev Rec Dev
County Executive 392.85 8.92 411.63 1.38 357.39 7.31 86.8 529.7 91 82
County Assembly 707.11 - 631.78 - 177.16 - 28 - 25.1 -
Public Service Board 97.28 4.51 103.22 75.89 4.29 73.5 - 78 95.1
Finance and Economic Planning 2,203.65 572.18 1,901.63 581.60 2,162.05 559.38 113.7 96.2 98.1 97.8
Energy, Environment and Waste Management 571.43 257.53 521.86 114.68 527.76 209.64 101.1 182.8 92.4 81.4
Education 477.62 97.24 403.11 30.53 380.17 54.12 94.3 177.3 79.6 55.7
Health 2,469.81 116.56 2,493.55 63.74 2,931.48 100.77 117.6 158.1 118.7 86.5
Water and Sanitation 69.28 600.00 82.44 35.96 52.73 15.56 64.0 43.3 76.1 2.6
Youth, Gender and Sports 203.33 147.48 169.6 188.29 184.98 92.45 109.1 49.1 91 62.7
Trade and Cooperative De-velopment 483.85 146.52 341.82 108.28 376.26 99.94 110.1 92.3 77.8 68.2
Lands, Housing and Physi-cal Planning 150.70 244.15 133.29 113.66 124.69 184.37 93.5 162.2 82.7 75.5
Transport and Infrastruc-ture Development 452.15 1,915.74 321.23 2,036.78 427.48 1,589.46 133. 78 94.5 83
Agriculture and Fisheries Development 208.84 172.55 189.39 130.36 190.93 132.81 100.8 101.9 91.4 77
Devolution 1,625.21 60.60 1,283.29 5.38 1,565.33 56.38 122.0 1,048 96.3 93
Total 10,113 4,344 8,988 3,411 9,534 3,106 104.8 91.1 94.3 71.5
Source: Mombasa County Treasury
Analysis of expenditure by department shows that the Department of Finance and Economic Planning recorded the highest absorption rate of development budget at 97.8 per cent while the department of Water and Sanitation recorded the lowest at 2.6 per cent. The Department of Health had the highest percentage of recurrent expenditure to recurrent budget at 118.7 per cent while the County Assembly had the lowest at 25.1 per cent.
3.28.9 Key Observations and RecommendationsThe County has made progress in addressing some of the challenges previously identified as affecting budget implementation. Some of the progress made included:
i. Establishment of the County Budget and Economic Forum (CBEF) in line with Section 137 of the PFM Act, 2012.
ii. Improvement in the administration and reporting on the established funds in line with Section 116 and 168 of the PFM Act, 2012.
Despite the above progress, the following challenges continued to hamper effective budget implementation;
1. A high wage bill that increased by 13.7 per cent from Kshs.4.56 billion in FY 2017/18 to Kshs.5.19 billion in the reporting period. The wage bill accounted for 41.4 per cent of total expenditure in the reporting period.
2. Delayed disbursement of the equitable share of revenue raised nationally by the National Treasury.3. High expenditure on foreign and domestic travel, which increased by118.3 per cent from Kshs.255.18
million in FY 2017/18 to Kshs.557.18 million in the reporting period.4. Inadequate budgetary control that resulted in expenditure above approved budget by the Department
of Health. This is contrary to Section 135 and 154 of PFM Act, 2012.

188
COUNTY GOVERNMENTS ANNUAL BUDGET IMPLEMENTATION REVIEW REPORT FOR FY 2018/19
The County should implement the following measures in order to improve budget execution;
1. The County Public Service Board should establish an optimal staffing structure in order to ensure a sustainable wage bill.
2. The County Treasury should liaise with the National Treasury to ensure that funds allocated to the County are released in a timely manner.
3. The County Treasury should ensure that expenditure on non-core budget items is rationalised to provide more resources for development projects.
4. The County Treasury should ensure expenditure is within the approved budget.
3.29 Murang’a County
3.29.1 Overview of the FY 2018/19 BudgetThe County’s FY 2018/19 Approved Supplementary Budget was Kshs.8.85 billion, comprising of Kshs.3.59 billion (40.5 per cent) and Kshs.5.26 billion (59.5 per cent) allocation for development and recurrent expenditure respectively.
To finance the budget, the County expects to receive Kshs.6.25 billion (70.6 per cent) as equitable share of the revenue raised nationally, Kshs.613.44 million ( 6.9 per cent) as total conditional grants, generate Kshs.1 billion (11.3 per cent) from own sources of revenue, and Kshs.750 million (8.5 per cent) cash balance from FY 2017/18. The County also budgeted to received Kshs.40 million as Ad Valorem Levy, and Kshs.13.15 million for Agricultural Sector Development Support which were not contained in CARA, 2018.
Figure 3.113: Murang’a County, Expected Sources of Budget Financing in FY 2018/19
227
2. The County Treasury should liaise with the National Treasury to ensure that funds allocated to the County are
released in a timely manner.
3. The County Treasury should ensure that expenditure on non-core budget items is rationalised to provide more
resources for development projects.
4. The County Treasury should ensure expenditure is within the approved budget.
3.29 Murang’a County
3.29.1 Overview of the FY 2018/19 Budget The County’s FY 2018/19 Approved Supplementary Budget was Kshs.8.85 billion, comprising of Kshs.3.59 billion
(40.5 per cent) and Kshs.5.26 billion (59.5 per cent) allocation for development and recurrent expenditure
respectively.
To finance the budget, the County expects to receive Kshs.6.25 billion (70.6 per cent) as equitable share of the revenue
raised nationally, Kshs.613.44 million ( 6.9 per cent) as total conditional grants, generate Kshs.1 billion (11.3 per
cent) from own sources of revenue, and Kshs.750 million (8.5 per cent) cash balance from FY 2017/18. The County
also budgeted to received Kshs.40 million as Ad Valorem Levy, and Kshs.13.15 million for Agricultural Sector
Development Support which were not contained in CARA, 2018.
Figure 3.113: Murang’a County, Expected Sources of Budget Financing in FY 2018/19
Source: Murang’a County Treasury
A breakdown of the conditional grants is provided in Table 3.83.
3.29.2 Revenue Analysis During FY 2018/19, the County had a total of Khs.8.37 billion available for budget implementation. This amount
consisted of Kshs.6.25 billion received as equitable share of the revenue raised nationally, Kshs.389.19 million as
conditional grants, Kshs.704.03 million generated from own sources of revenue, and a cash balance of Kshs.1.03 billion
from FY 2017/18.
Figure 3.114 shows the trend in annual own-source revenue collection from FY 2013/14 to FY 2018/19.
Cash Balance from FY 2017/18
8.5%
National Sharable Revenue70.6%
Total Conditional Allocations
6.9%
Own Source Revenue11.3% Other Revenues
Expected During the year2.7%
Source: Murang’a County Treasury
A breakdown of the conditional grants is provided in Table 3.83.
3.29.2 Revenue AnalysisDuring FY 2018/19, the County had a total of Khs.8.37 billion available for budget implementation. This amount consisted of Kshs.6.25 billion received as equitable share of the revenue raised nationally, Kshs.389.19 million as conditional grants, Kshs.704.03 million generated from own sources of revenue, and a cash balance of Kshs.1.03 billion from FY 2017/18.
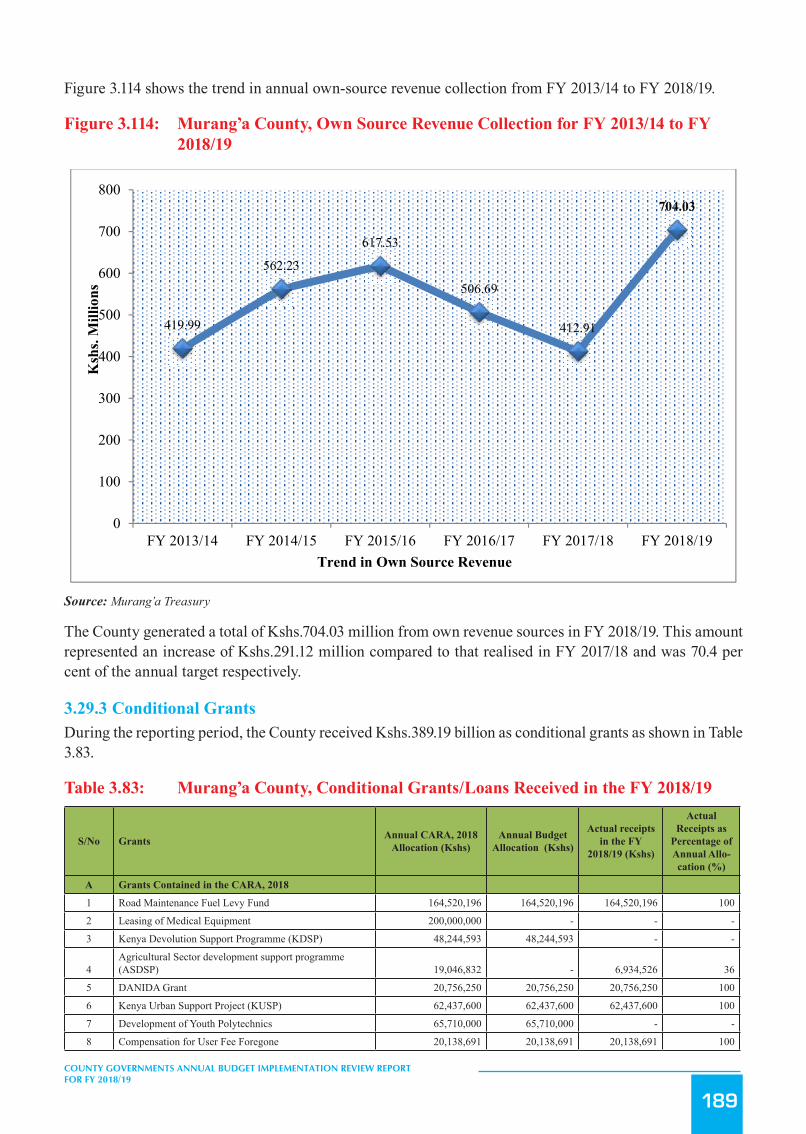
189
COUNTY GOVERNMENTS ANNUAL BUDGET IMPLEMENTATION REVIEW REPORT FOR FY 2018/19
Figure 3.114 shows the trend in annual own-source revenue collection from FY 2013/14 to FY 2018/19.
Figure 3.114: Murang’a County, Own Source Revenue Collection for FY 2013/14 to FY 2018/19
228
Figure 3.114: Murang’a County, Own Source Revenue Collection for FY 2013/14 to FY 2018/19
Source: Murang’a Treasury
The County generated a total of Kshs.704.03 million from own revenue sources in FY 2018/19. This amount
represented an increase of Kshs.291.12 million compared to that realised in FY 2017/18 and was 70.4 per cent of the
annual target respectively.
3.29.3 Conditional Grants During the reporting period, the County received Kshs.389.19 billion as conditional grants as shown in Table 3.83.
Table 3.83: Murang’a, County, Conditional Grants/Loans Received in the FY 2018/19
S/No Grants Annual CARA, 2018Allocation (Kshs)
Annual Budget Allocation
(Kshs)
Actual receipts in the FY 2018/19 (Kshs)
Actual Receipts as Percentage of Annual Allocation (%)
A Grants Contained in the CARA, 2018
1 Road Maintenance Fuel Levy Fund 164,520,196 164,520,196 164,520,196 100
2 Leasing of Medical Equipment 200,000,000 - - -
3 Kenya Devolution Support Programme (KDSP) 48,244,593 48,244,593 - -
4 Agricultural Sector development support programme (ASDSP) 19,046,832 - 6,934,526 36
5 DANIDA Grant 20,756,250 20,756,250 20,756,250 100
6 Kenya Urban Support Project (KUSP) 62,437,600 62,437,600 62,437,600 100
7 Development of Youth Polytechnics 65,710,000 65,710,000 - - 8 Compensation for User Fee Foregone 100
419.99
562.23
617.53
506.69
412.91
704.03
0
100
200
300
400
500
600
700
800
FY 2013/14 FY 2014/15 FY 2015/16 FY 2016/17 FY 2017/18 FY 2018/19
Ksh
s. M
illio
ns
Trend in Own Source Revenue
Source: Murang’a Treasury
The County generated a total of Kshs.704.03 million from own revenue sources in FY 2018/19. This amount represented an increase of Kshs.291.12 million compared to that realised in FY 2017/18 and was 70.4 per cent of the annual target respectively.
3.29.3 Conditional GrantsDuring the reporting period, the County received Kshs.389.19 billion as conditional grants as shown in Table 3.83.
Table 3.83: Murang’a County, Conditional Grants/Loans Received in the FY 2018/19
S/No Grants Annual CARA, 2018 Allocation (Kshs)
Annual Budget Allocation (Kshs)
Actual receipts in the FY
2018/19 (Kshs)
Actual Receipts as
Percentage of Annual Allo-cation (%)
A Grants Contained in the CARA, 2018
1 Road Maintenance Fuel Levy Fund 164,520,196 164,520,196 164,520,196 100
2 Leasing of Medical Equipment 200,000,000 - - -
3 Kenya Devolution Support Programme (KDSP) 48,244,593 48,244,593 - -
4Agricultural Sector development support programme (ASDSP) 19,046,832 - 6,934,526 36
5 DANIDA Grant 20,756,250 20,756,250 20,756,250 100
6 Kenya Urban Support Project (KUSP) 62,437,600 62,437,600 62,437,600 100
7 Development of Youth Polytechnics 65,710,000 65,710,000 - -
8 Compensation for User Fee Foregone 20,138,691 20,138,691 20,138,691 100
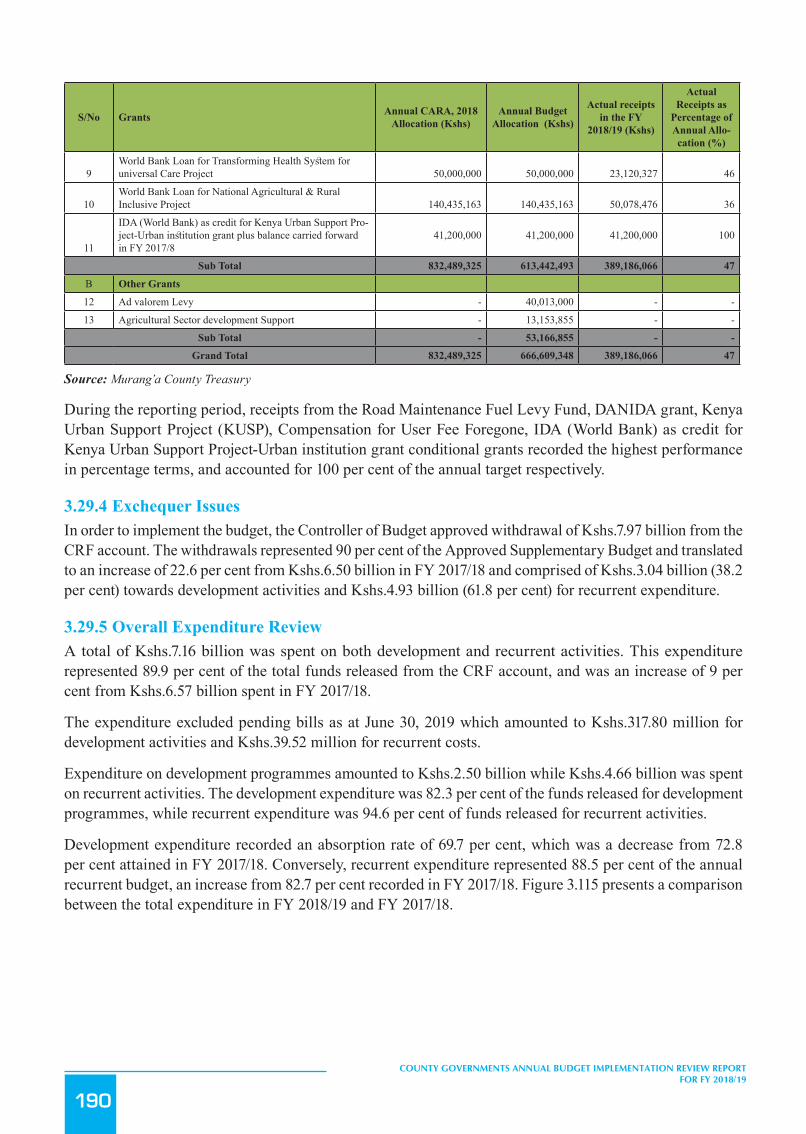
190
COUNTY GOVERNMENTS ANNUAL BUDGET IMPLEMENTATION REVIEW REPORT FOR FY 2018/19
S/No Grants Annual CARA, 2018 Allocation (Kshs)
Annual Budget Allocation (Kshs)
Actual receipts in the FY
2018/19 (Kshs)
Actual Receipts as
Percentage of Annual Allo-cation (%)
9World Bank Loan for Transforming Health System for universal Care Project 50,000,000 50,000,000 23,120,327 46
10World Bank Loan for National Agricultural & Rural Inclusive Project 140,435,163 140,435,163 50,078,476 36
11
IDA (World Bank) as credit for Kenya Urban Support Pro-ject-Urban institution grant plus balance carried forward in FY 2017/8
41,200,000 41,200,000 41,200,000 100
Sub Total 832,489,325 613,442,493 389,186,066 47
B Other Grants
12 Ad valorem Levy - 40,013,000 - -
13 Agricultural Sector development Support - 13,153,855 - -
Sub Total - 53,166,855 - -
Grand Total 832,489,325 666,609,348 389,186,066 47
Source: Murang’a County Treasury
During the reporting period, receipts from the Road Maintenance Fuel Levy Fund, DANIDA grant, Kenya Urban Support Project (KUSP), Compensation for User Fee Foregone, IDA (World Bank) as credit for Kenya Urban Support Project-Urban institution grant conditional grants recorded the highest performance in percentage terms, and accounted for 100 per cent of the annual target respectively.
3.29.4 Exchequer IssuesIn order to implement the budget, the Controller of Budget approved withdrawal of Kshs.7.97 billion from the CRF account. The withdrawals represented 90 per cent of the Approved Supplementary Budget and translated to an increase of 22.6 per cent from Kshs.6.50 billion in FY 2017/18 and comprised of Kshs.3.04 billion (38.2 per cent) towards development activities and Kshs.4.93 billion (61.8 per cent) for recurrent expenditure.
3.29.5 Overall Expenditure ReviewA total of Kshs.7.16 billion was spent on both development and recurrent activities. This expenditure represented 89.9 per cent of the total funds released from the CRF account, and was an increase of 9 per cent from Kshs.6.57 billion spent in FY 2017/18.
The expenditure excluded pending bills as at June 30, 2019 which amounted to Kshs.317.80 million for development activities and Kshs.39.52 million for recurrent costs.
Expenditure on development programmes amounted to Kshs.2.50 billion while Kshs.4.66 billion was spent on recurrent activities. The development expenditure was 82.3 per cent of the funds released for development programmes, while recurrent expenditure was 94.6 per cent of funds released for recurrent activities.
Development expenditure recorded an absorption rate of 69.7 per cent, which was a decrease from 72.8 per cent attained in FY 2017/18. Conversely, recurrent expenditure represented 88.5 per cent of the annual recurrent budget, an increase from 82.7 per cent recorded in FY 2017/18. Figure 3.115 presents a comparison between the total expenditure in FY 2018/19 and FY 2017/18.
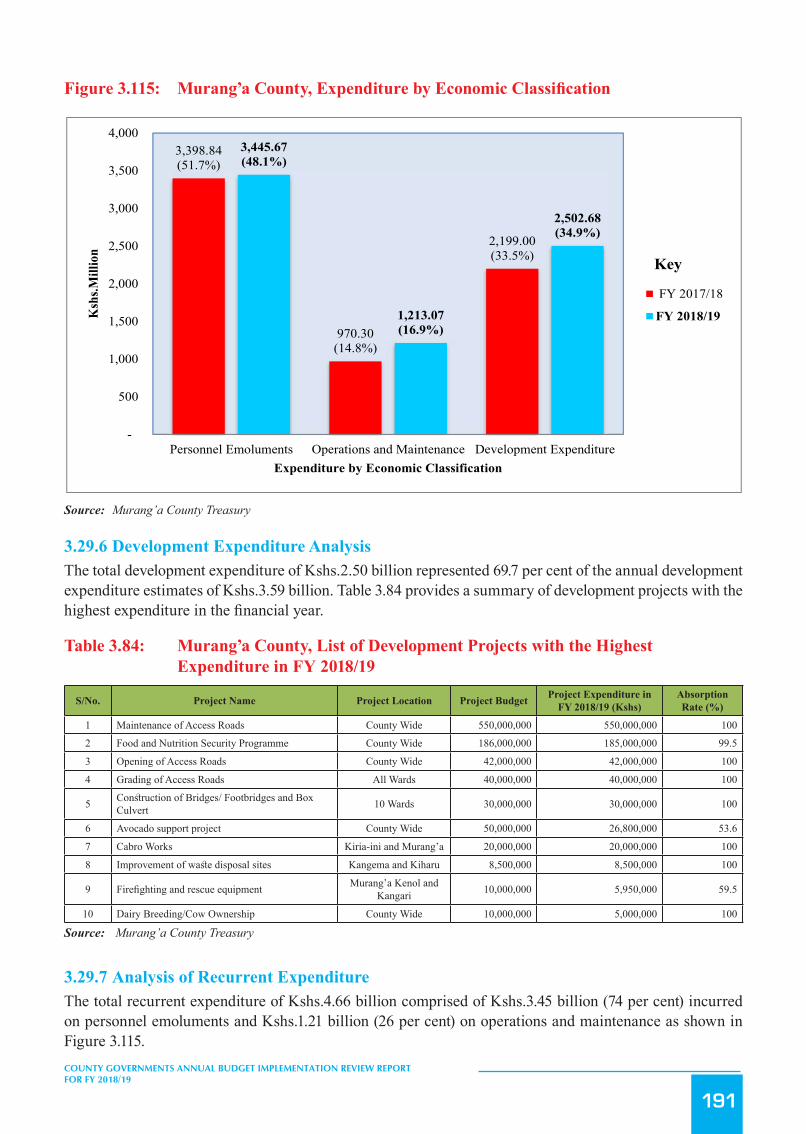
191
COUNTY GOVERNMENTS ANNUAL BUDGET IMPLEMENTATION REVIEW REPORT FOR FY 2018/19
Figure3.115: Murang’aCounty,ExpenditurebyEconomicClassification
230
Source: Murang’a County Treasury
3.29.6 Development Expenditure Analysis The total development expenditure of Kshs.2.50 billion represented 69.7 per cent of the annual development
expenditure estimates of Kshs.3.59 billion. Table 3.84 provides a summary of development projects with the highest
expenditure in the financial year.
Table 3.84: Murang’a County, List of Development Projects with the Highest Expenditure in FY 2018/19
S/No. Project Name Project Location Project Budget
Project Expenditure in FY 2018/19 (Kshs)
Absorption Rate (%)
1 Maintenance of Access Roads County Wide 550,000,000 550,000,000 100 2 Food and Nutrition Security Programme County Wide 186,000,000 185,000,000 99.5 3 Opening of Access Roads County Wide 42,000,000 42,000,000 100 4 Grading of Access Roads All Wards 40,000,000 40,000,000 100
5 Construction of Bridges/ Footbridges and Box Culvert 10 Wards 30,000,000 30,000,000 100
6 Avocado support project County Wide 50,000,000 26,800,000 53.6
7 Cabro Works Kiria-ini and Murang'a 20,000,000 20,000,000 100
8 Improvement of waste disposal sites Kangema and Kiharu 8,500,000 8,500,000 100
9 Firefighting and rescue equipment Murang'a Kenol and
Kangari 10,000,000 5,950,000 59.5 10 Dairy Breeding/Cow Ownership County Wide 10,000,000 5,000,000 100
Source: Murang’a County Treasury
3.29.7 Analysis of Recurrent Expenditure The total recurrent expenditure of Kshs.4.66 billion comprised of Kshs.3.45 billion (74 per cent) incurred on personnel
emoluments and Kshs.1.21 billion (26 per cent) on operations and maintenance as shown in Figure 3.115.
Expenditure on personnel emoluments represented an increase of 1.4 per cent compared to FY 2017/18 when the
County spent Kshs.3.40 billion and was 48.1 per cent of the total expenditure in FY 2018/19 Figure 3.116 shows a
summary of operations and maintenance expenditure by major categories.
3,398.84(51.7%)
970.30(14.8%)
2,199.00(33.5%)
3,445.67(48.1%)
1,213.07(16.9%)
2,502.68(34.9%)
-
500
1,000
1,500
2,000
2,500
3,000
3,500
4,000
Personnel Emoluments Operations and Maintenance Development Expenditure
Ksh
s.Mill
ion
Expenditure by Economic Classification
FY 2017/18
FY 2018/19
Key
Source: Murang’a County Treasury
3.29.6 Development Expenditure AnalysisThe total development expenditure of Kshs.2.50 billion represented 69.7 per cent of the annual development expenditure estimates of Kshs.3.59 billion. Table 3.84 provides a summary of development projects with the highest expenditure in the financial year.
Table 3.84: Murang’a County, List of Development Projects with the Highest Expenditure in FY 2018/19
S/No. Project Name Project Location Project Budget Project Expenditure in FY 2018/19 (Kshs)
Absorption Rate (%)
1 Maintenance of Access Roads County Wide 550,000,000 550,000,000 100
2 Food and Nutrition Security Programme County Wide 186,000,000 185,000,000 99.5
3 Opening of Access Roads County Wide 42,000,000 42,000,000 100
4 Grading of Access Roads All Wards 40,000,000 40,000,000 100
5 Construction of Bridges/ Footbridges and Box Culvert 10 Wards 30,000,000 30,000,000 100
6 Avocado support project County Wide 50,000,000 26,800,000 53.6
7 Cabro Works Kiria-ini and Murang’a 20,000,000 20,000,000 100
8 Improvement of waste disposal sites Kangema and Kiharu 8,500,000 8,500,000 100
9 Firefighting and rescue equipment Murang’a Kenol and Kangari 10,000,000 5,950,000 59.5
10 Dairy Breeding/Cow Ownership County Wide 10,000,000 5,000,000 100
Source: Murang’a County Treasury
3.29.7 Analysis of Recurrent ExpenditureThe total recurrent expenditure of Kshs.4.66 billion comprised of Kshs.3.45 billion (74 per cent) incurred on personnel emoluments and Kshs.1.21 billion (26 per cent) on operations and maintenance as shown in Figure 3.115.

192
COUNTY GOVERNMENTS ANNUAL BUDGET IMPLEMENTATION REVIEW REPORT FOR FY 2018/19
Expenditure on personnel emoluments represented an increase of 1.4 per cent compared to FY 2017/18 when the County spent Kshs.3.40 billion and was 48.1 per cent of the total expenditure in FY 2018/19 Figure 3.116 shows a summary of operations and maintenance expenditure by major categories.
Figure 3.116: Murang’a County, Operations and Maintenance Expenditure by Major Categories in FY 2018/19
231
Figure 3.116: Murang’a County, Operations and Maintenance Expenditure by Major Categories in FY 2018/19
Source: Murang’a County Treasury
The County spent Kshs.51.18 million on committee sitting allowances for the 54 MCAs and Speaker against the annual
budget allocation of Kshs.66.96 million. This represented an increase of 86.4 per cent compared to Kshs.27.46 million
spent in a similar period of FY 2017/18. The average monthly sitting allowance translated to Kshs.78,977 per MCA
against the SRC’s recommended monthly ceiling of Kshs.124,800.
Expenditure on domestic and foreign travel amounted to Kshs.292.06 million, and comprised of Kshs.170.17 million
spent by the County Assembly and Kshs.121.88 million by the County Executive. This expenditure represented 6.3 per
cent of total recurrent expenditure and was an increase of 36.6 per cent compared to Kshs.213.77 million spent in FY
2017/18.
3.29.8 Budget Performance by County Department Table 3.85 shows a summary of the approved budget allocation and performance by department in FY 2018/19.
Table 3.85: Murang’a County, Budget Performance by Department in FY 2018/19
Department Annual Budget Allocation in (Kshs. Million)
Exchequer Issues in (Kshs. Million)
Expenditure in (Kshs. Million)
Expenditure to Exchequer Issues (%)
Absorption Rate (%)
292.06
133.81
78.9561.11 54.93 51.18 46.85 37.63 33.28 28.89
0
50
100
150
200
250
300
350
Ksh
s. M
illio
n
Major Categories of Operations & Maintenance
Source: Murang’a County Treasury
The County spent Kshs.51.18 million on committee sitting allowances for the 54 MCAs and Speaker against the annual budget allocation of Kshs.66.96 million. This represented an increase of 86.4 per cent compared to Kshs.27.46 million spent in FY 2017/18. The average monthly sitting allowance translated to Kshs.78,977 per MCA against the SRC’s recommended monthly ceiling of Kshs.124,800.
Expenditure on domestic and foreign travel amounted to Kshs.292.06 million, and comprised of Kshs.170.17 million spent by the County Assembly and Kshs.121.88 million by the County Executive. This expenditure represented 6.3 per cent of total recurrent expenditure and was an increase of 36.6 per cent compared to Kshs.213.77 million spent in FY 2017/18.
3.29.8 Budget Performance by County DepartmentTable 3.85 shows a summary of the approved budget allocation and performance by department in FY 2018/19.

193
COUNTY GOVERNMENTS ANNUAL BUDGET IMPLEMENTATION REVIEW REPORT FOR FY 2018/19
Table 3.85: Murang’a County, Budget Performance by Department in FY 2018/19
DepartmentAnnual Budget Alloca-tion in (Kshs. Million)
Exchequer Issues in (Kshs. Million)
Expenditure in (Kshs. Million)
Expenditure to Exchequer Issues
(%)
Absorption Rate (%)
Rec Dev Rec Dev Rec Dev Rec Dev Rec Dev
County Assembly 786.38 50.00 595 32 643.79 22.81 108.2 71.3 81.9 45.6
Governorship, County Coordina-tion and Administration 367.78 - 341.92 - 305.09 - 89.2 - 83 -
Finance, Information Technol-ogy 247.30 19.16 188.45 2.01 178.76 7.41 94.9 369.4 72.3 38.7
Agriculture, Livestock and Fisheries 207.09 695.30 205.04 582.00 192.78 412.13 94 70.8 93.1 59.3
Energy, Transport and Infra-structure 98.44 1,104.06 98.24 966.74 82.35 955.74 83.8 98.9 83.7 86.6
Health and Sanitation 2,137.28 1,020.58 2,131.26 942.82 2,083.72 810.81 97.8 86 97.5 79.4
Commerce, Trade, Industry and Tourism 24.35 199.91 24.03 159.62 16.89 132.72 70.3 83.2 69.4 66.4
Lands, Housing and Physical Planning 60.56 102.94 20.26 69.11 21.36 2.89 105.4 4.2 35.3 2.8
Public Service Administration 885.09 - 884.09 - 725.19 - 82 - 81.9 -
Youth, Culture, Gender, Social Services & Cooperatives 103.19 90.35 102.03 27.02 85.26 64.75 83.6 239.6 82.6 71.7
Education and Technical Training 293.75 293.78 290.67 256.99 288.05 88.02 99.1 34.2 98.1 30
Environment & Natural Re-sources 17.70 12.50 17.50 4.40 10.36 5.40 59.2 122.7 58.5 43.2
Public Service Board 33.30 - 27.94 - 25.11 - 89.9 - 75.4 -
TOTAL 5,262.20 3,588.58 4,926.43 3,042.71 4,658.74 2,502.68 94.6 82.3 88.5 69.7
Source: Murang’a County Treasury
Analysis of expenditure by department shows that the Department of Energy, Transport and Infrastructure recorded the highest absorption rate of development budget at 86.6 per cent while the Department of Lands, Housing and Physical Planning recorded the lowest at 2.8 per cent. The Department of Education and Technical Training had the highest percentage of recurrent expenditure to recurrent budget at 98.1 per cent while the Department of Lands, Housing and Physical Planning had the lowest at 35.3 per cent.
3.29.9 Key Observations and RecommendationsThe County has made progress in addressing some of the challenges previously identified as affecting budget implementation. Some of the progress made included:
i. Improvement in own revenue collection by 170.5 per cent from Kshs.412.91 million in FY 2017/18 to Kshs.704.03 million in the reporting period.
Despite the above progress, the following challenges continued to hamper effective budget implementation;
1. A high wage bill that increased by 1.4 per cent from Kshs.3.40 billion in FY 2017/18 to Kshs.3.45 billion in the reporting period. The wage bill accounted for 48.1 per cent of total expenditure in the reporting period.
2. Delay in disbursement of the equitable share of revenue raised nationally by the National Treasury.3. Late submission of reports on financial and non-financial performance by the County Treasury, which
affected timely preparation of budget implementation report contrary to section 166 of the PFM Act, 2012.
4. Failure by the County to provide a comprehensive report on execution of development projects during the financial year. This is despite reporting development expenditure of Kshs.2.50 billion during the

194
COUNTY GOVERNMENTS ANNUAL BUDGET IMPLEMENTATION REVIEW REPORT FOR FY 2018/19
reporting period.
The County should implement the following measures in order to improve budget execution;
1. The County Public Service Board should develop an optimal staffing structure and devise strategies to contain expenditure on personnel costs within 35 per cent of County’s total revenue in line with Regulation 25(1) (b) of the PFM (County Governments) Regulations, 2015.
2. The County Treasury should liaise with the National Treasury to ensure that funds allocated to the County are released in a timely manner.
3. The County Treasury should ensure timely preparation and submission of reports on financial and non-financial performance in line with Section 166 of PFM Act, 2012.
4. The County Treasury should provide complete reports on status of implemented development projects in line with Section 166 of the PFM Act, 2012.
3.30 Nairobi City County
3.30.1 Overview of the FY 2018/19 BudgetThe County’s FY 2018/19 Supplementary Budget was Kshs.33.34 billion, comprising of Kshs.7.48 billion (22.4 per cent) and Kshs.25.87 billion (77.6 per cent) allocation for development and recurrent expenditure respectively.
To finance the budget, the County expects to receive Kshs.15.79 billion (46.2 per cent) as equitable share of the revenue raised nationally, Kshs.744.99 billion (2.8 per cent) as total conditional grants, generate Kshs.15.50 billion (47.1 per cent) from own sources of revenue, and Kshs.1.31 billion (3.9 per cent) cash balance from FY 2017/18.
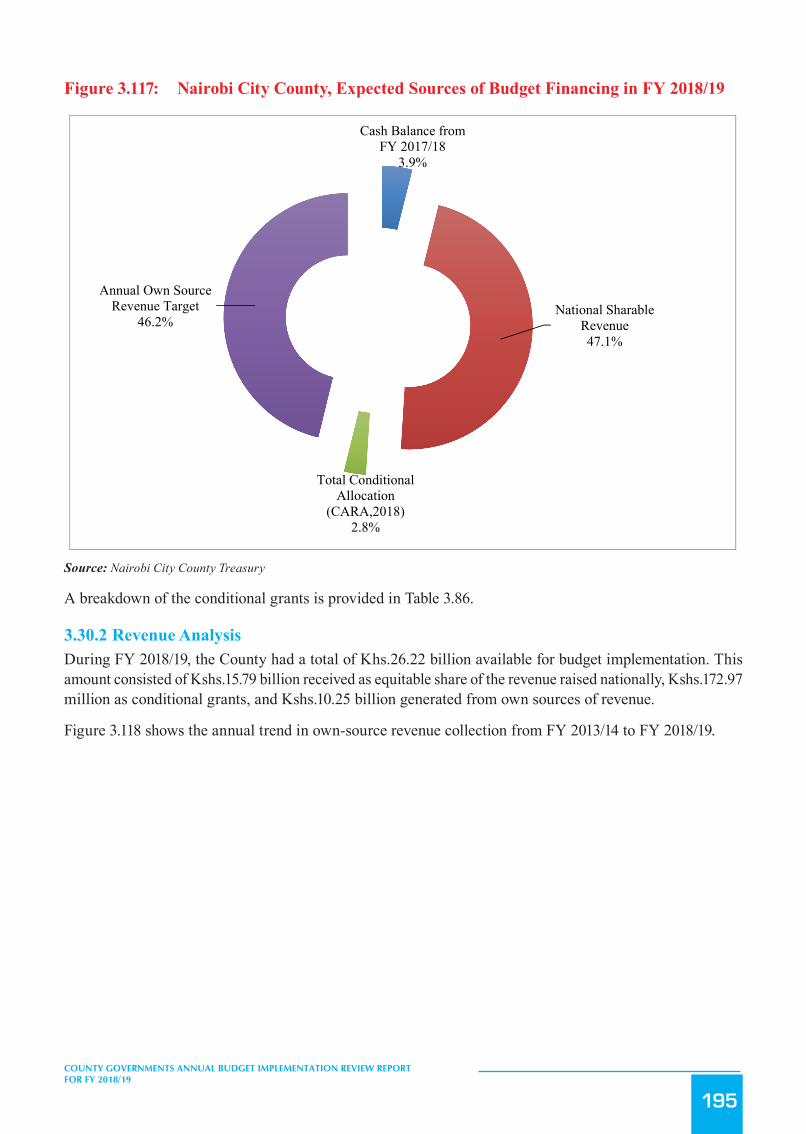
195
COUNTY GOVERNMENTS ANNUAL BUDGET IMPLEMENTATION REVIEW REPORT FOR FY 2018/19
Figure 3.117: Nairobi City County, Expected Sources of Budget Financing in FY 2018/19
233
1. The County Public Service Board should develop an optimal staffing structure and devise strategies to contain
expenditure on personnel costs within 35 per cent of County’s total revenue in line with Regulation 25(1) (b) of the
PFM (County Governments) Regulations, 2015.
2. The County Treasury should liaise with the National Treasury to ensure that funds allocated to the County are
released in a timely manner.
3. The County Treasury should ensure timely preparation and submission of reports on financial and non -financial
performance in line with Section 166 of PFM Act, 2012.
4. The County Treasury should provide complete reports on status of implemented development projects in line with
Section 166 of the PFM Act, 2012.
3.30 Nairobi City County
3.30.1 Overview of the FY 2018/19 Budget The County’s FY 2018/19 Supplementary Budget was Kshs.33.34 billion, comprising of Kshs.7.48 billion (22.4 per
cent) and Kshs.25.87 billion (77.6 per cent) allocation for development and recurrent expenditure respectively.
To finance the budget, the County expects to receive Kshs.15.79 billion (46.2 per cent) as equitable share of the
revenue raised nationally, Kshs.744.99 billion (2.8 per cent) as total conditional grants, generate Kshs.15.50 billion
(47.1 per cent) from own sources of revenue, and Kshs.1.31 billion (3.9 per cent) cash balance from FY 2017/18.
Figure 3.117: Nairobi City County Expected Sources of Budget Financing in FY 2018/19
Source: Nairobi City County Treasury
A breakdown of the conditional grants is provided in Table 3.83.
Cash Balance from FY 2017/18
3.9%
National Sharable Revenue47.1%
Total Conditional Allocation
(CARA,2018)2.8%
Annual Own Source Revenue Target
46.2%
Source: Nairobi City County Treasury
A breakdown of the conditional grants is provided in Table 3.86.
3.30.2 Revenue AnalysisDuring FY 2018/19, the County had a total of Khs.26.22 billion available for budget implementation. This amount consisted of Kshs.15.79 billion received as equitable share of the revenue raised nationally, Kshs.172.97 million as conditional grants, and Kshs.10.25 billion generated from own sources of revenue.
Figure 3.118 shows the annual trend in own-source revenue collection from FY 2013/14 to FY 2018/19.

196
COUNTY GOVERNMENTS ANNUAL BUDGET IMPLEMENTATION REVIEW REPORT FOR FY 2018/19
Figure 3.118: Nairobi City County, Own Source Revenue Collection for FY 2013/14 to FY 2018/19
234
3.30.2 Revenue Analysis During FY 2018/19, the County had a total of Khs.26.22 billion available for budget implementation. This amount
consisted of Kshs.15.79 billion received as equitable share of the revenue raised nationally, Kshs.172.97 million as
conditional grants, and Kshs.10.25 billion generated from own sources of revenue.
Figure 3.118 shows the annual trend in own-source revenue collection from FY 2013/14 to FY 2018/19.
Figure 3.118: Nairobi City County, Own Source Revenue Collection for FY 2013/14 to FY 2018/19
Source: Nairobi City County Treasury
The County generated a total of Kshs.10.25 billion from own revenue sources in FY 2018/19. This amount represented
an increase of Kshs.139.01 million compared to that realised in FY 2017/18 and was 66.1 per cent of the annual target.
3.30.3 Conditional Grants During the reporting period, the County received Kshs.172.97 million as conditional grants as shown in Table 3.86 .
Table 3.86: Nairobi City County, Conditional Grants/Loans Received in the FY 2018/19
S/No Grant Details
Annual Allocation-CAR
A, 2018)
(Kshs)
Annual Budget
Allocation
(Kshs)
Receipts in FY 2018/19
(Kshs)
Receipts as Percentage of Annual
Budget Allocation
(%)
1 Compensation for User Fee Foregone 79,423,251 79,423,251 79,423,251 100 2 Leasing of Medical Equipment 200,000,000 - - - 3 Road Maintenance Fuel Levy 415,847,530 415,847,530 - - 4 Rehabilitation of Village Polytechnics 34,570,000 34,570,000 - -
5 Transforming Health Systems for Universal Care Project (World Bank) 54,429,184 54,429,184 32,562,789 59.8
6 IDA (World Bank) Kenya Devolution Support Programme 83,424,144 83,424,144 - -
10,030.00
11,490.00
11,720.00
10,929.83
10,109.42
10,248.43
9,000
9,500
10,000
10,500
11,000
11,500
12,000
FY 2013/14 FY 2014/15 FY 2015/16 FY 2016/17 FY 2017/18 FY 2018/19
Ksh
s. M
illio
n
Source: Nairobi City County Treasury
The County generated a total of Kshs.10.25 billion from own revenue sources in FY 2018/19. This amount represented an increase of Kshs.139.01 million compared to that realised in FY 2017/18 and was 66.1 per cent of the annual target.
3.30.3 Conditional GrantsDuring the reporting period, the County received Kshs.172.97 million as conditional grants as shown in Table 3.86 .
Table 3.86: Nairobi City County, Conditional Grants/Loans Received in the FY 2018/19
S/No Grant DetailsAnnual Alloca-
tion-CARA, 2018)(Kshs)
Annual Budget Allocation
(Kshs)
Receipts in FY 2018/19 (Kshs)
Receipts as Percentage of
Annual Budget Allocation (%)
1 Compensation for User Fee Foregone 79,423,251 79,423,251 79,423,251 100
2 Leasing of Medical Equipment 200,000,000 - - -
3 Road Maintenance Fuel Levy 415,847,530 415,847,530 - -
4 Rehabilitation of Village Polytechnics 34,570,000 34,570,000 - -
5 Transforming Health Systems for Universal Care Project (World Bank) 54,429,184 54,429,184 32,562,789 59.8
6 IDA (World Bank) Kenya Devolution Support Programme “Lev-el 1 grant” 83,424,144 83,424,144 - -
7 DANIDA - Universal Healthcare in Devolved System Pro-gramme 51,637,500 51,637,500 51,637,500 100
8 Sweden - Agriculture Sector Development Support Programme (ASDSP) II + Bal C/F in FY 2017/18 25,659,140 25,659,140 9,341,920 36.4
Total 944,990,749 744,990,749 172,965,460 23.2
Source: Nairobi City County Treasury

197
COUNTY GOVERNMENTS ANNUAL BUDGET IMPLEMENTATION REVIEW REPORT FOR FY 2018/19
During the reporting period, receipts from the Compensation for User Fee Foregone and DANIDA recorded the highest performance in percentage terms, and accounted 100 per cent of their respective annual targets.
3.30.4 Exchequer IssuesIn order to implement the budget, the Controller of Budget approved withdrawal of Kshs.24.43 billion from the CRF account. The withdrawals represented 73.3 per cent of the Approved Supplementary Budget and translated to an increase of 15.6 per cent from Kshs.21.13 billion in FY 2017/18 and comprised of Kshs.3.55 billion (14.5 per cent) towards development activities and Kshs.20.88 billion (85.5 per cent) for recurrent expenditure.
3.30.5 Overall Expenditure ReviewA total of Kshs.29.40 billion was spent on both development and recurrent activities. This expenditure represented 120.3 per cent of the total funds released from the CRF account, and was an increase of 19.8 per cent from Kshs.24.54 billion spent in FY 2017/18.
Expenditure on development programmes amounted to Kshs.5.90 billion while Kshs.23.50 billion was spent on recurrent activities. The development expenditure was 166.1 per cent of the funds released for development programmes, while recurrent expenditure was 112.5 per cent of funds released for recurrent activities.
Development expenditure recorded an absorption rate of 78.9 per cent, which was an increase from 26.1per cent attained in FY 2017/18. Conversely, recurrent expenditure represented 90.8 per cent of the annual recurrent budget, an increase from 88.4 per cent recorded in FY 2017/18.
Figure 3.119 presents a comparison between the total expenditure in FY 2018/19 and FY 2017/18.
Figure3.119: NairobiCityCounty,ExpenditurebyEconomicClassification
236
Source: Nairobi City County Treasury
3.30.6 Development Expenditure Analysis The total development expenditure of Kshs.5.90 billion represented 78.9 per cent of the annual development
expenditure estimates of Kshs.7.48 billion. Table 3.87 provides a summary of development projects with the highest
expenditure in the financial year.
Table 3.87: Nairobi City County County, List of Development Projects with the Highest Expenditure in FY 2018/19
S/No. Project Name Project Location
Project Expenditure in FY 2018/19 (Kshs.)
1 Nairobi Regeneration Projects Countywide 800,000,000 2 Construction of Matopeni Estate Roads Matopeni 119,615,595 3 Construction of selected roads in Utawala Estate Utawala 70,116,749 4 Rehabilitation of Gathuru Road Kawangware 58,070,164 5 Construction of Perimeter Fence Wall at Highway Depot Highways 52,436,302 6 Supply of water tanks Citywide 51,775,862 7 Reconstruction of Jadongo Road Ngara 40,622,332 8 Construction of Plainview Likoni Link Road South B Ward 36,655,194 9 Construction of Kimondo Road Pipeline 33,000,000 10 Construction of Lumumba Drive Roysambu 22,000,000
Source: Nairobi City County Treasury
3.30.7 Analysis of Recurrent Expenditure The total recurrent expenditure of Kshs.23.50 billion comprised of Kshs.13.74 billion (58.5 per cent) incurred on
personnel emoluments and Kshs.9.75 billion (41.5 per cent) on operations and maintenance as shown in Figure 3.119.
14.98(60.5%)
7.53 (30.7%)
2.18(8.9%)
13.74(46.8%)
9.75(33.2%)
5.90(20.1%)
-
2,000
4,000
6,000
8,000
10,000
12,000
14,000
16,000
Personnel Emoluments Operations and Maintenance Development Expenditure
Ksh
s.Bill
ion
Expenditure by Economic Classification
FY 2017/18
FY 2018/19
Source: Nairobi City County Treasury

198
COUNTY GOVERNMENTS ANNUAL BUDGET IMPLEMENTATION REVIEW REPORT FOR FY 2018/19
3.30.6 Development Expenditure AnalysisThe total development expenditure of Kshs.5.90 billion represented 78.9 per cent of the annual development expenditure estimates of Kshs.7.48 billion. Table 3.87 provides a summary of development projects with the highest expenditure in the financial year.
Table 3.87: Nairobi City County, List of Development Projects with the Highest Expenditure in FY 2018/19
S/No. Project Name Project Location Project Expenditure in FY 2018/19 (Kshs.)
1 Nairobi Regeneration Projects Countywide 800,000,000
2 Construction of Matopeni Estate Roads Matopeni 119,615,595
3 Construction of selected roads in Utawala Estate Utawala 70,116,749
4 Rehabilitation of Gathuru Road Kawangware 58,070,164
5 Construction of Perimeter Fence Wall at Highway Depot Highways 52,436,302
6 Supply of water tanks Citywide 51,775,862
7 Reconstruction of Jadongo Road Ngara 40,622,332
8 Construction of Plainview Likoni Link Road South B Ward 36,655,194
9 Construction of Kimondo Road Pipeline 33,000,000
10 Construction of Lumumba Drive Roysambu 22,000,000
Source: Nairobi City County Treasury
3.30.7 Analysis of Recurrent ExpenditureThe total recurrent expenditure of Kshs.23.50 billion comprised of Kshs.13.74 billion (58.5 per cent) incurred on personnel emoluments and Kshs.9.75 billion (41.5 per cent) on operations and maintenance as shown in Figure 3.119.
Expenditure on personnel emoluments represented a decrease of 7.4 per cent compared to a similar period of FY 2017/18 when the County spent Kshs.14.84 billion and was 47.2 per cent of the total expenditure in FY 2018/19. Figure 3.120 shows a summary of operations and maintenance expenditure by major categories.
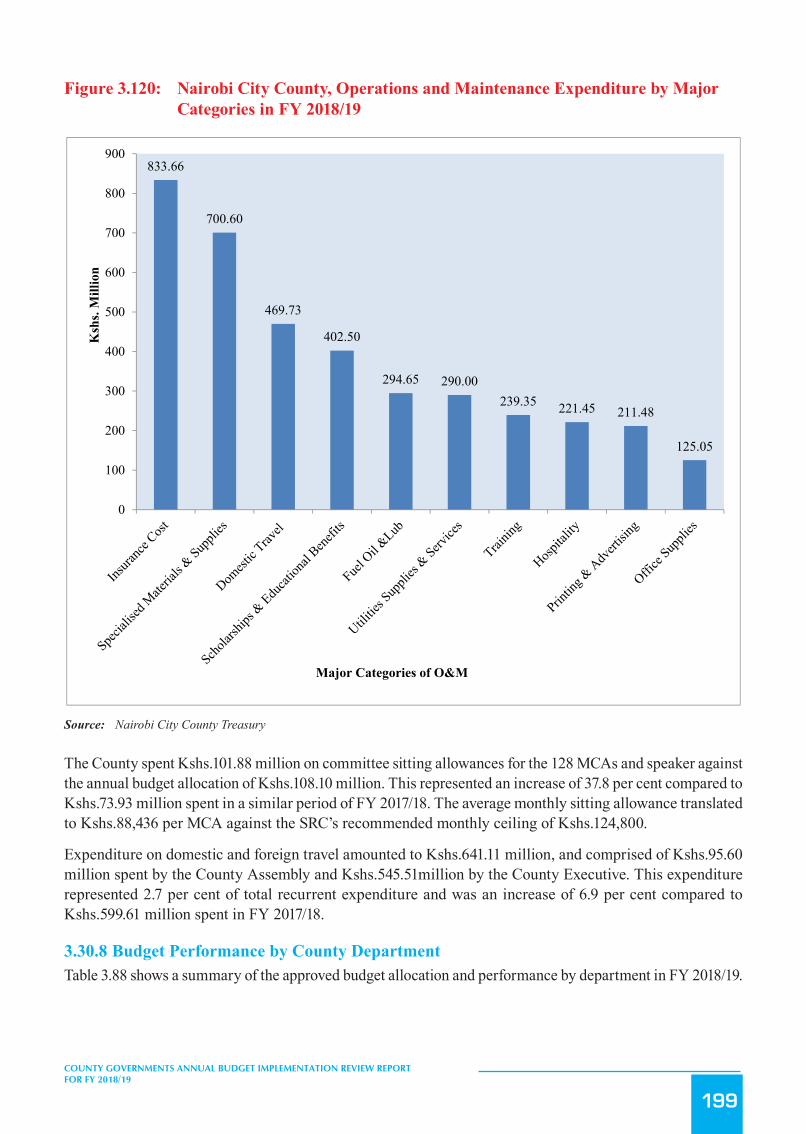
199
COUNTY GOVERNMENTS ANNUAL BUDGET IMPLEMENTATION REVIEW REPORT FOR FY 2018/19
Figure 3.120: Nairobi City County, Operations and Maintenance Expenditure by Major Categories in FY 2018/19
237
Expenditure on personnel emoluments represented a decrease of 7.4 per cent compared to a similar period of FY
2017/18 when the County spent Kshs.14.84 billion and was 47.2 per cent of the total expenditure in FY 2018/19.
Figure 3.120 shows a summary of operations and maintenance expenditure by major categories.
Figure 3.120: Nairobi City County, Operations and Maintenance Expenditure by Major Categories in FY 2018/19
Source: Nairobi City County Treasury
The County spent Kshs.101.88 million on committee sitting allowances for the 128 MCAs and speaker against the
annual budget allocation of Kshs.108.10 million. This represented an increase of 37.8 per cent compared to Kshs.73.93
million spent in a similar period of FY 2017/18. The average monthly sitting allowance translated to Kshs.88,436 per
MCA against the SRC’s recommended monthly ceiling of Kshs.124,800.
Expenditure on domestic and foreign travel amounted to Kshs.641.11 million, and comprised of Kshs.95.60 million
spent by the County Assembly and Kshs.545.51million by the County Executive. This expenditure represented 2.7 per
cent of total recurrent expenditure and was an increase of 6.9 per cent compared to Kshs.599.61 million spent in FY
2017/18.
3.30.8 Budget Performance by County Department
Table 3.88 shows a summary of the approved budget allocation and performance by department in FY 2018/19.
833.66
700.60
469.73
402.50
294.65 290.00239.35 221.45 211.48
125.05
0
100
200
300
400
500
600
700
800
900
Ksh
s. M
illio
n
Major Categories of O&M
Source: Nairobi City County Treasury
The County spent Kshs.101.88 million on committee sitting allowances for the 128 MCAs and speaker against the annual budget allocation of Kshs.108.10 million. This represented an increase of 37.8 per cent compared to Kshs.73.93 million spent in a similar period of FY 2017/18. The average monthly sitting allowance translated to Kshs.88,436 per MCA against the SRC’s recommended monthly ceiling of Kshs.124,800.
Expenditure on domestic and foreign travel amounted to Kshs.641.11 million, and comprised of Kshs.95.60 million spent by the County Assembly and Kshs.545.51million by the County Executive. This expenditure represented 2.7 per cent of total recurrent expenditure and was an increase of 6.9 per cent compared to Kshs.599.61 million spent in FY 2017/18.
3.30.8 Budget Performance by County DepartmentTable 3.88 shows a summary of the approved budget allocation and performance by department in FY 2018/19.
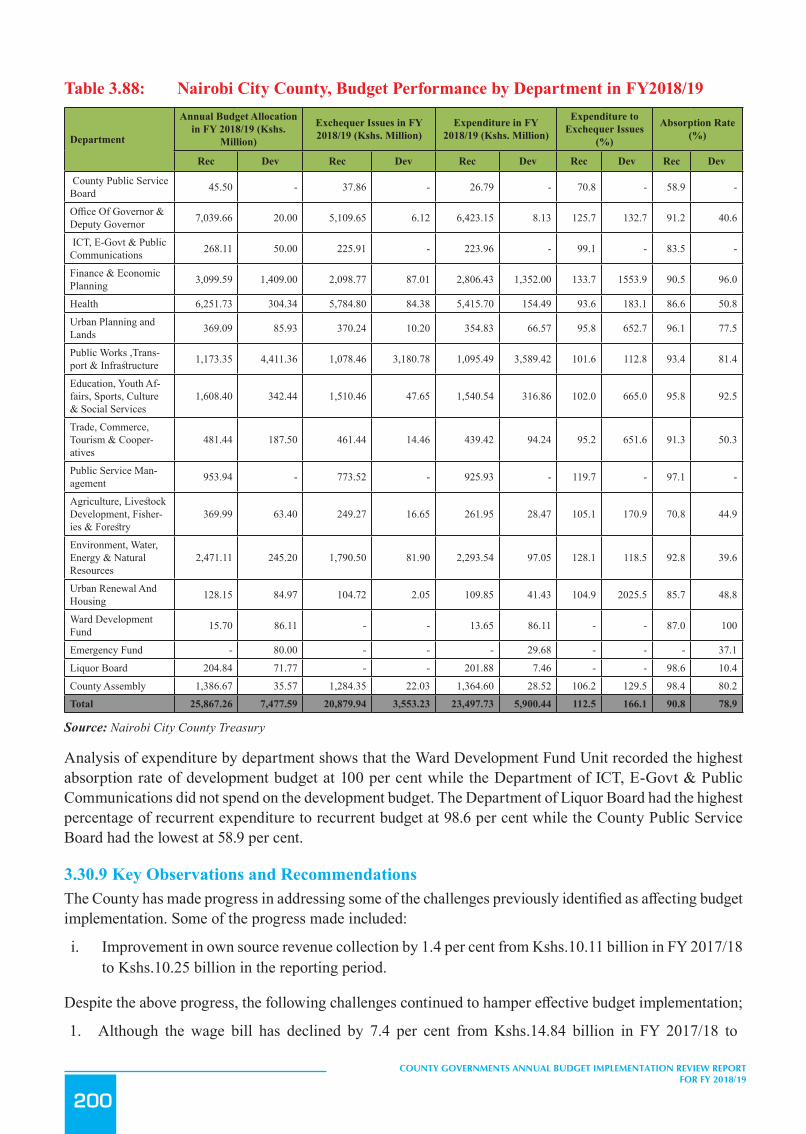
200
COUNTY GOVERNMENTS ANNUAL BUDGET IMPLEMENTATION REVIEW REPORT FOR FY 2018/19
Table 3.88: Nairobi City County, Budget Performance by Department in FY2018/19
Department
Annual Budget Allocation in FY 2018/19 (Kshs.
Million)
Exchequer Issues in FY 2018/19 (Kshs. Million)
Expenditure in FY 2018/19 (Kshs. Million)
Expenditure to Exchequer Issues
(%)
Absorption Rate (%)
Rec Dev Rec Dev Rec Dev Rec Dev Rec Dev
County Public Service Board 45.50 - 37.86 - 26.79 - 70.8 - 58.9 -
Office Of Governor & Deputy Governor 7,039.66 20.00 5,109.65 6.12 6,423.15 8.13 125.7 132.7 91.2 40.6
ICT, E-Govt & Public Communications 268.11 50.00 225.91 - 223.96 - 99.1 - 83.5 -
Finance & Economic Planning 3,099.59 1,409.00 2,098.77 87.01 2,806.43 1,352.00 133.7 1553.9 90.5 96.0
Health 6,251.73 304.34 5,784.80 84.38 5,415.70 154.49 93.6 183.1 86.6 50.8
Urban Planning and Lands 369.09 85.93 370.24 10.20 354.83 66.57 95.8 652.7 96.1 77.5
Public Works ,Trans-port & Infrastructure 1,173.35 4,411.36 1,078.46 3,180.78 1,095.49 3,589.42 101.6 112.8 93.4 81.4
Education, Youth Af-fairs, Sports, Culture & Social Services
1,608.40 342.44 1,510.46 47.65 1,540.54 316.86 102.0 665.0 95.8 92.5
Trade, Commerce, Tourism & Cooper-atives
481.44 187.50 461.44 14.46 439.42 94.24 95.2 651.6 91.3 50.3
Public Service Man-agement 953.94 - 773.52 - 925.93 - 119.7 - 97.1 -
Agriculture, Livestock Development, Fisher-ies & Forestry
369.99 63.40 249.27 16.65 261.95 28.47 105.1 170.9 70.8 44.9
Environment, Water, Energy & Natural Resources
2,471.11 245.20 1,790.50 81.90 2,293.54 97.05 128.1 118.5 92.8 39.6
Urban Renewal And Housing 128.15 84.97 104.72 2.05 109.85 41.43 104.9 2025.5 85.7 48.8
Ward Development Fund 15.70 86.11 - - 13.65 86.11 - - 87.0 100
Emergency Fund - 80.00 - - - 29.68 - - - 37.1
Liquor Board 204.84 71.77 - - 201.88 7.46 - - 98.6 10.4
County Assembly 1,386.67 35.57 1,284.35 22.03 1,364.60 28.52 106.2 129.5 98.4 80.2
Total 25,867.26 7,477.59 20,879.94 3,553.23 23,497.73 5,900.44 112.5 166.1 90.8 78.9
Source: Nairobi City County Treasury
Analysis of expenditure by department shows that the Ward Development Fund Unit recorded the highest absorption rate of development budget at 100 per cent while the Department of ICT, E-Govt & Public Communications did not spend on the development budget. The Department of Liquor Board had the highest percentage of recurrent expenditure to recurrent budget at 98.6 per cent while the County Public Service Board had the lowest at 58.9 per cent.
3.30.9 Key Observations and RecommendationsThe County has made progress in addressing some of the challenges previously identified as affecting budget implementation. Some of the progress made included:
i. Improvement in own source revenue collection by 1.4 per cent from Kshs.10.11 billion in FY 2017/18 to Kshs.10.25 billion in the reporting period.
Despite the above progress, the following challenges continued to hamper effective budget implementation;
1. Although the wage bill has declined by 7.4 per cent from Kshs.14.84 billion in FY 2017/18 to

201
COUNTY GOVERNMENTS ANNUAL BUDGET IMPLEMENTATION REVIEW REPORT FOR FY 2018/19
Kshs.13.74 billion FY 2018/19 the wage bill was high accounting for 46.8 per cent of total expenditure in the reporting period.
2. Late submission of reports on financial and non-financial performance by the County Treasury, which affected timely preparation of budget implementation report.
3. Failure by the County to provide a detailed report on pending bills as of the end of the financial year.
The County should implement the following measures in order to improve budget execution;
1. The County Public Service Board should develop an optimal staffing structure and devise strategies to contain expenditure on personnel costs within 35 per cent of County’s total revenue in line with Regulation 25(1) (b) of the PFM (County Governments) Regulations, 2015.
2. The County Treasury should ensure timely preparation and submission of reports on financial and non-financial performance in line with Section 166 of PFM Act, 2012.
3. The County Treasury should provide a report on status of pending bills as at 30th June, 2019 as requested by the Controller of Budget in line with COB Act, 2016.
3.31 Nakuru County
3.31.1 Overview of the FY 2018/19 BudgetThe County’s FY 2018/19 Supplementary Budget was Kshs.18.48 billion, comprising of Kshs.10.47 billion (57 per cent) and Kshs.8 billion (43 per cent) allocation for recurrent and development expenditure respectively.
To finance the budget, the County expects to receive Kshs.9.45 billion (51.2 per cent) as equitable share of the revenue raised nationally, Kshs.2.48 billion ( 13.5 per cent) as total conditional grants, generate Kshs.2.69 billion (14.5 per cent) from own sources of revenue, and Kshs.3.85 billion (20.8 per cent) cash balance from FY 2017/18.
Figure 3.121: Nakuru County, Expected Sources of Budget Financing in FY 2018/19
239
is above 35 per cent of the county’s revenue as required by Regulation 25(1) (b) of the PFM (County
Government) Regulations, 2015.
2. Late submission of reports on financial and non -financial performance by the County Treasury, which affected
timely preparation of budget implementation report.
3. Failure by the County to provide a detailed report on pending bills as of the end of the financial year.
The County should implement the following measures in order to improve budget execution;
1. The County Public Service Board should develop an optimal staffing structure and devise strategies to contain
expenditure on personnel costs within 35 per cent of County’s total revenue in line with Regulation 25(1) (b) of the
PFM (County Governments) Regulations, 2015.
2. The County Treasury should ensure timely preparation and submission of reports on financial and non -financial
performance in line with Section 166 of PFM Act, 2012.
3. The County Treasury should provide a report on status of pending bills as at 30th June, 2019 as requested by the
Controller of Budget in line with COB Act, 2016.
3.31 Nakuru County
3.31.1 Overview of the FY 2018/19 Budget The County’s FY 2018/19 Supplementary Budget was Kshs.18.48 billion, comprising of Kshs.10.47 billion (57 per
cent) and Kshs.8 billion (43 per cent) allocation for recurrent and development expenditure respectively.
To finance the budget, the County expects to receive Kshs.9.45 billion (51.2 per cent) as equitable share of the revenue
raised nationally, Kshs.2.48 billion ( 13.5 per cent) as total conditional grants, generate Kshs.2.69 billion (14.5 per
cent) from own sources of revenue, and Kshs.3.85 billion (20.8 per cent) cash balance from FY 2017/18.
Figure 3.121: Nakuru County, Expected Sources of Budget Financing in FY 2018/19
Source: Nakuru County Treasury
A breakdown of the conditional grants is provided in .
Cash Balance from FY 2017/18
20.8%
National Sharable Revenue51.2%
Total Conditional Allocations
13.5%
Own Source Revenue14.5%
Source: Nakuru County Treasury
A breakdown of the conditional grants is provided in Table 3.89.

202
COUNTY GOVERNMENTS ANNUAL BUDGET IMPLEMENTATION REVIEW REPORT FOR FY 2018/19
3.31.2 Revenue AnalysisDuring FY 2018/19, the County had a total of Khs.18.4 billion available for budget implementation. This amount consisted of Kshs.9.45 billion received as equitable share of the revenue raised nationally, Kshs.2.16 billion as conditional grants, Kshs.2.81 billion generated from own sources of revenue and a cash balance of Kshs.3.85 billion from FY 2017/18.
Figure 3.2 shows the annual trend in own-source revenue collection from FY 2013/14 to FY 2018/19.
Figure 3.122: Nakuru County, Own Source Revenue Collection for FY 2013/14 to FY 2018/19
240
3.31.2 Revenue Analysis During FY 2018/19, the County had a total of Khs.18.4 billion available for budget implementation. This amount
consisted of Kshs.9.45 billion received as equitable share of the revenue raised nationally, Kshs.2.16 billion as
conditional grants, Kshs.2.81 billion generated from own sources of revenue and a cash balance of Kshs.3.85 billion
from FY 2017/18.
Figure 3.2 shows the annual trend in own-source revenue collection from FY 2013/14 to FY 2018/19.
Figure 3.122: Nakuru County, Own Source Revenue Collection for FY 2013/14 to FY 2018/19
Source: Nakuru County Treasury
The County generated a total of Kshs.2.81 billion from own revenue sources in FY 2018/19. This amount represented an
increase of Kshs.545.56 million compared to that realised in FY 2017/18 and was 104.8 per cent of the annual target.
3.31.3 Conditional Grants During the reporting period, the County received Kshs.2.16 billion as conditional grants as shown in Table 3.89.
Table 3.89: Nakuru County, Conditional Grants/Loans Received in the FY 2018/19
S/No Grants Annual CARA, 2018 Allocation (in Kshs)
Annual Budget Allocation (in
Kshs)
Actual receipts in Year of FY 2018/19 (in Kshs.)
Actual Receipts as Percentage of Annual Allocation (%)
1. Kenya Urban Support Project (KUSP) 1,084,843,300 1,084,843,300 1,084,843,300 100
2. Conditional Grants to Level - 5 Hospital 373,872,832 373,872,832 373,872,833 100
3. Road Maintenance Fuel Levy 248,847,131 248,847,131 248,847,131 100 4. Leasing of Medical Equipment 200,000,000 200,000,000 - -
5. National Agricultural and Rural Inclusive Growth Project (NARIGP)
140,435,163 140,435,163 50,000,000 36
6. Health Grant from National Government 99,999,999 99,999,999 99,999,945 100
1,644.04
2,200.28 2,296.06
1,555.18
2,278.65
2,814.73
0
500
1,000
1,500
2,000
2,500
3,000
FY 2013/14 FY 2014/15 FY 2015/16 FY 2016/17 FY 2017/18 FY 2018/19
Ksh
s. M
illio
ns
Trend in Own Source Revenue
Source: Nakuru County TreasuryThe County generated a total of Kshs.2.81 billion from own revenue sources in FY 2018/19. This amount represented an increase of Kshs.545.56 million compared to that realised in FY 2017/18 and was 104.8 per cent of the annual target.
3.31.3 Conditional GrantsDuring the reporting period, the County received Kshs.2.16 billion as conditional grants as shown in Table 3.89.
Table 3.89: Nakuru County, Conditional Grants/Loans Received in the FY 2018/19
S/No Grants Annual CARA, 2018 Allocation (in Kshs)
Annual Budget Alloca-tion (in Kshs)
Actual receipts in Year of FY 2018/19 (in Kshs.)
Actual Receipts as Percentage of Annual Allo-cation (%)
1. Kenya Urban Support Project (KUSP) 1,084,843,300 1,084,843,300 1,084,843,300 100
2. Conditional Grants to Level - 5 Hospital 373,872,832 373,872,832 373,872,833 100
3. Road Maintenance Fuel Levy 248,847,131 248,847,131 248,847,131 100
4. Leasing of Medical Equipment 200,000,000 200,000,000 - -
5. National Agricultural and Rural Inclusive Growth Project (NARIGP) 140,435,163 140,435,163 50,000,000 36
6. Health Grant from National Government 99,999,999 99,999,999 99,999,945 100
7. Transforming Health Systems for Universal Care Project (WB) 95,036,352 95,036,351 - -

203
COUNTY GOVERNMENTS ANNUAL BUDGET IMPLEMENTATION REVIEW REPORT FOR FY 2018/19
S/No Grants Annual CARA, 2018 Allocation (in Kshs)
Annual Budget Alloca-tion (in Kshs)
Actual receipts in Year of FY 2018/19 (in Kshs.)
Actual Receipts as Percentage of Annual Allo-cation (%)
8. Kenya Devolution Sector support program (Level 1) 60,282,958 60,282,958 27,755,760 46
9. Rehabilitation of Village Polytechnics 47,800,000 47,800,000 36,089,000 76
10. Kenya Urban Support Program (KUSP) 41,200,000 41,200,000 41,200,000 100
11. Compensation for User Fee Foregone 38,723,265 38,723,265 38,723,265 100
12. DANIDA Grant 31,083,750 31,083,750 31,083,750 100
13. Agricultural Sector Support Program 21,983,635 21,983,635 - -
14. DANIDA Grant (Previous FY Balance) - - 27,755,760 -
15. Kenya Devolution Sector support program (Level 1) - - 100,974,396 -
Total 2,484,108,385 2,484,108,384 2,161,145,140 92
Source: Nakuru County Treasury
During the reporting period, receipts from the Road Maintenance, Level 5 Hospitals, Kenya Urban Support Project, grant to Nakuru Level-5 Hospital, Kenya Urban Support Program, Compensation for User Fee Foregone and DANIDA grant recorded the highest performance in percentage terms, and accounted for 100 per cent of the annual target respectively.
3.31.4 Exchequer IssuesIn order to implement the budget, the Controller of Budget approved withdrawal of Kshs.13.2 billion from the CRF account. The withdrawals represented 71.5 per cent of the Approved Supplementary Budget and translated to an increase of 44.3 per cent from Kshs.9.07 billion in FY 2017/18 and comprised of Kshs.4.14 billion (31.3 per cent) towards development activities and Kshs.9.07 billion (68.7 per cent) for recurrent expenditure.
3.31.5 Overall Expenditure ReviewA total of Kshs.10.14 billion was spent on both development and recurrent activities. This expenditure represented 76.7 per cent of the total funds released from the CRF account, and was decrease of 4.9 per cent from Kshs.10.66 billion spent in FY 2017/18.
The expenditure excluded pending bills as at June 30, 2019 which amounted to Kshs.52.47 million for development activities and Kshs.42 million for recurrent costs.
Expenditure on development programmes amounted to Kshs.1.48 billion while Kshs.8.66 billion was spent on recurrent activities. The development expenditure was 35.7 per cent of the funds released for development programmes, while recurrent expenditure was 95.5 per cent of funds released for recurrent activities.
Development expenditure recorded an absorption rate of 18.4 per cent, which was a decrease from 25.6 per cent attained in FY 2017/18. Conversely, recurrent expenditure represented 82.7 per cent of the annual recurrent budget, a decrease from 80.2 per cent recorded in FY 2017/18.

204
COUNTY GOVERNMENTS ANNUAL BUDGET IMPLEMENTATION REVIEW REPORT FOR FY 2018/19
Figure 3.123 presents a comparison between the total expenditure in FY 2018/19 and FY 2017/18.
Figure3.123: NakuruCounty,ExpenditurebyEconomicClassification
242
Figure 3.123: Nakuru County, Expenditure by Economic Classification
Source: Nakuru County Treasury
3.31.6 Development Expenditure Analysis
The total development expenditure of Kshs.1.48 billion represented 18.4 per cent of the annual development
expenditure estimates of Kshs.8.01 billion. Table 3.90 provides a summary of development projects with the highest
expenditure in the financial year.
Table 3.90: Nakuru County, List of Development Projects with the Highest Expenditure in FY 2018/19
S/No. Project Name Project Budget
(Kshs.)
FY2018/19 Project Expenditure (Kshs.)
Absorption rate (%)
1 Rehabilitation of Rural Road (Provision for purchase of Tippers 8No) 64,000,000 64,000,000 100
2 Provision for purchase of medical equipment (Conditional Fund for Level 5 Hospital (Nakuru PGH)) 70,000,000 60,000,000 86
3 Development of Revenue Management System 40,000,000 34,616,109 87
4 Purchase of Medical Equipment s& dental Equipment for various new health centres(HQ) 15,593,213 15,593,213 100
5 Routine Maintenance and Spot Improvement :Tarmacking and Extension of Menengai Climb Road to Capital Hill Hotel (0.5km )in Nakuru East Sub County
10,504,000 10,504,000 100
6 Supply and Installation of 34 No., 9m, 60W LED Solar lights in Nakuru County 9,860,000 9,860,000 100
7 Proposed Routine Maintenance and Periodic Improvement of Bus Park Tarmacking in Gilgil Sub County 9,454,080 9,454,080 100
8 Routine Maintenance and Spot Improvement of Gwa Kihanga-Magomano-Kwa Haji Road - IDP Road in Subukia Sub County
8,492,708 8,492,708 100
9 Construction of Bridge and Road Connecting Korao (Tinet) and Kiptagich Ward in Kuresoi South Sub County
8,487,400 8,487,400 100
10 Design and construction of administration block, polytechnic, and equipping of classrooms at Rhonda resource centre
7,000,000 6,982,588 100
Source: Nakuru County Treasury
5,166(48.4%)
3,447(32.3%)
2,050(19.2%)
5,918(58.4%)
2,742(27%)
1,478(14.6%)
-
1,000
2,000
3,000
4,000
5,000
6,000
7,000
Personnel Emoluments Operations and Maintenance Development Expenditure
Ksh
s.Mill
ion
Expenditure by Economic Classification
FY 2017/18
FY 2018/19
Key
Source: Nakuru County Treasury
3.31.6 Development Expenditure AnalysisThe total development expenditure of Kshs.1.48 billion represented 18.4 per cent of the annual development expenditure estimates of Kshs.8.01 billion. Table 3.90 provides a summary of development projects with the highest expenditure in the financial year.
Table 3.90: Nakuru County, List of Development Projects with the Highest Expenditure in FY 2018/19
S/No. Project Name Project Budget (Kshs.)
FY2018/19 Project Expenditure
(Kshs.)
Absorption rate (%)
1 Rehabilitation of Rural Road (Provision for purchase of Tippers 8No) 64,000,000 64,000,000 100
2 Provision for purchase of medical equipment (Conditional Fund for Level 5 Hospital (Nakuru PGH)) 70,000,000 60,000,000 86
3 Development of Revenue Management System 40,000,000 34,616,109 87
4 Purchase of Medical Equipment s& dental Equipment for various new health cen-tres(HQ) 15,593,213 15,593,213 100
5 Routine Maintenance and Spot Improvement :Tarmacking and Extension of Menengai Climb Road to Capital Hill Hotel (0.5km )in Nakuru East Sub County 10,504,000 10,504,000 100
6 Supply and Installation of 34 No., 9m, 60W LED Solar lights in Nakuru County 9,860,000 9,860,000 100
7 Proposed Routine Maintenance and Periodic Improvement of Bus Park Tarmacking in Gilgil Sub County 9,454,080 9,454,080 100
8 Routine Maintenance and Spot Improvement of Gwa Kihanga-Magomano-Kwa Haji Road - IDP Road in Subukia Sub County 8,492,708 8,492,708 100
9 Construction of Bridge and Road Connecting Korao (Tinet) and Kiptagich Ward in Kuresoi South Sub County 8,487,400 8,487,400 100
10 Design and construction of administration block, polytechnic, and equipping of class-rooms at Rhonda resource centre 7,000,000 6,982,588 100
Source: Nakuru County Treasury

205
COUNTY GOVERNMENTS ANNUAL BUDGET IMPLEMENTATION REVIEW REPORT FOR FY 2018/19
3.31.7 Analysis of Recurrent ExpenditureThe total recurrent expenditure comprised of Kshs.5.92 billion (68.3 per cent) incurred on personnel emoluments and Kshs.2.74 billion (31.7 per cent) on operations and maintenance as shown in Figure 3.123 .
Expenditure on personnel emoluments represented an increase of 14.6 per cent compared to FY 2017/18 when the County spent Kshs.5.17 billion and was 68.3 per cent of the total expenditure in FY 2018/19. Figure 3.124 shows a summary of operations and maintenance expenditure by major categories.
Figure 3.124: Nakuru County, Operations and Maintenance Expenditure by Major Categories in FY 2018/19
243
3.31.7 Analysis of Recurrent Expenditure The total recurrent expenditure comprised of Kshs.5.92 billion (68.3 per cent) incurred on personnel emoluments and
Kshs.2.74 billion (31.7 per cent) on operations and maintenance as shown in Figure 3.123 .
Expenditure on personnel emoluments represented an increase of 14.6 per cent compared to FY 2017/18 when the
County spent Kshs.5.17 billion and was 68.3 per cent of the total expenditure in FY 2018/19. Figure 3.124 shows a
summary of operations and maintenance expenditure by major categories.
Figure 3.124: Nakuru County, Operations and Maintenance Expenditure by Major Categories in FY 2018/19
Source: Nakuru County Treasury
The County spent Kshs.106.8 million on committee sitting allowances for the 79 MCAs and speaker against the annual
budget allocation of Kshs.106.8 million. This represented an increase of 124.6 per cent compared to Kshs.47.56 million
spent in FY 2017/18. The average monthly sitting allowance translated to Kshs.112,658 per MCA against the SRC’s
recommended monthly ceiling of Kshs.124,800.
Expenditure on domestic and foreign travel amounted to Kshs.377.58 million, and comprised of Kshs.167.7 million
spent by the County Assembly and Kshs.209.8 million by the County Executive. This expenditure represented 5.2 per
cent of total recurrent expenditure and was an increase of 45.6 per cent compared to Kshs.259.4 million spent in FY
2017/18.
3.31.8 Budget Performance by County Department Table 3.91 shows a summary of the approved budget allocation and performance by department in FY 2018/19.
Table 3.91:Nakuru County, Budget Performance by Department in FY 2018/19
Department Budget Allocation (Kshs. Million)
Exchequer Issues (Kshs. Million)
Expenditure (Kshs. Million)
Expenditure to
Absorption rate (%)
283.08 281.04
210.20
174.28152.51
101.24 96.96 94.50 82.23 75.49
0
50
100
150
200
250
300
Ksh
s. M
illio
n
Major Categories of Operations & Maintenance
Source: Nakuru County Treasury
The County spent Kshs.106.8 million on committee sitting allowances for the 79 MCAs and speaker against the annual budget allocation of Kshs.106.8 million. This represented an increase of 124.6 per cent compared to Kshs.47.56 million spent in FY 2017/18. The average monthly sitting allowance translated to Kshs.112,658 per MCA against the SRC’s recommended monthly ceiling of Kshs.124,800.
Expenditure on domestic and foreign travel amounted to Kshs.377.58 million, and comprised of Kshs.167.7 million spent by the County Assembly and Kshs.209.8 million by the County Executive. This expenditure represented 5.2 per cent of total recurrent expenditure and was an increase of 45.6 per cent compared to Kshs.259.4 million spent in FY 2017/18.
3.31.8 Budget Performance by County DepartmentTable 3.91 shows a summary of the approved budget allocation and performance by department in FY 2018/19.
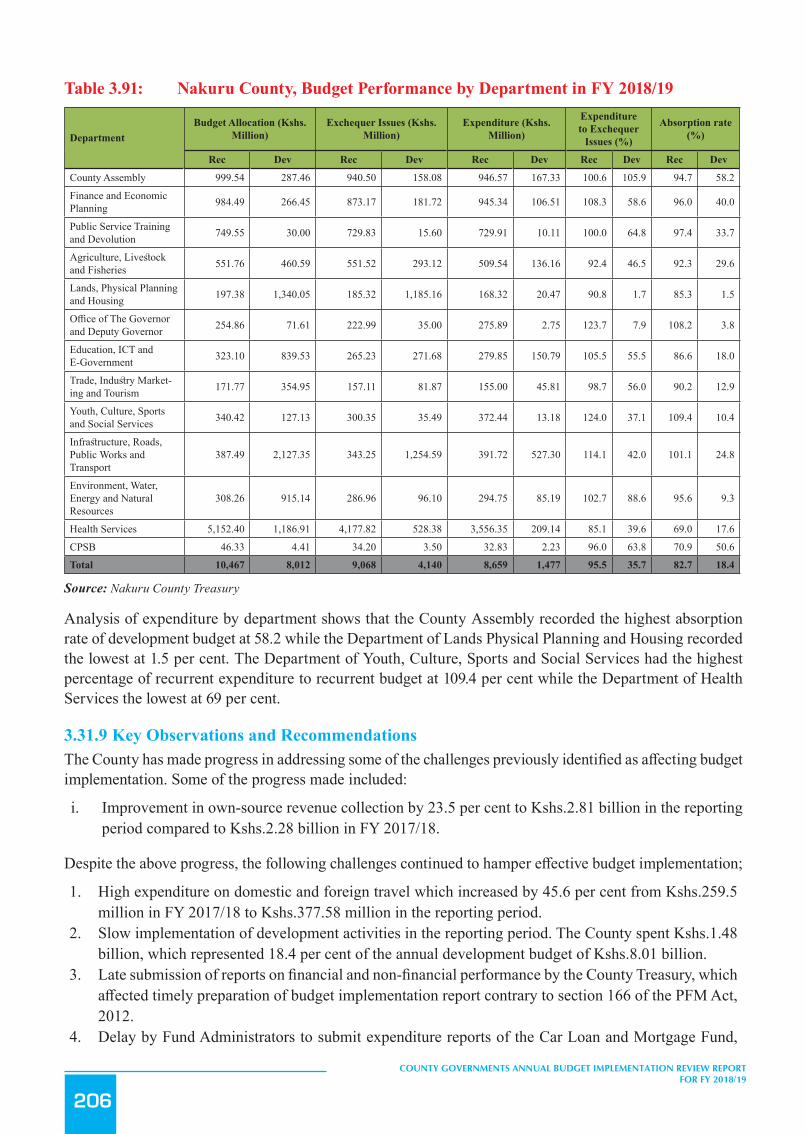
206
COUNTY GOVERNMENTS ANNUAL BUDGET IMPLEMENTATION REVIEW REPORT FOR FY 2018/19
Table 3.91: Nakuru County, Budget Performance by Department in FY 2018/19
DepartmentBudget Allocation (Kshs.
Million)Exchequer Issues (Kshs.
Million)Expenditure (Kshs.
Million)
Expenditure to Exchequer
Issues (%)
Absorption rate (%)
Rec Dev Rec Dev Rec Dev Rec Dev Rec Dev
County Assembly 999.54 287.46 940.50 158.08 946.57 167.33 100.6 105.9 94.7 58.2
Finance and Economic Planning 984.49 266.45 873.17 181.72 945.34 106.51 108.3 58.6 96.0 40.0
Public Service Training and Devolution 749.55 30.00 729.83 15.60 729.91 10.11 100.0 64.8 97.4 33.7
Agriculture, Livestock and Fisheries 551.76 460.59 551.52 293.12 509.54 136.16 92.4 46.5 92.3 29.6
Lands, Physical Planning and Housing 197.38 1,340.05 185.32 1,185.16 168.32 20.47 90.8 1.7 85.3 1.5
Office of The Governor and Deputy Governor 254.86 71.61 222.99 35.00 275.89 2.75 123.7 7.9 108.2 3.8
Education, ICT and E-Government 323.10 839.53 265.23 271.68 279.85 150.79 105.5 55.5 86.6 18.0
Trade, Industry Market-ing and Tourism 171.77 354.95 157.11 81.87 155.00 45.81 98.7 56.0 90.2 12.9
Youth, Culture, Sports and Social Services 340.42 127.13 300.35 35.49 372.44 13.18 124.0 37.1 109.4 10.4
Infrastructure, Roads, Public Works and Transport
387.49 2,127.35 343.25 1,254.59 391.72 527.30 114.1 42.0 101.1 24.8
Environment, Water, Energy and Natural Resources
308.26 915.14 286.96 96.10 294.75 85.19 102.7 88.6 95.6 9.3
Health Services 5,152.40 1,186.91 4,177.82 528.38 3,556.35 209.14 85.1 39.6 69.0 17.6
CPSB 46.33 4.41 34.20 3.50 32.83 2.23 96.0 63.8 70.9 50.6
Total 10,467 8,012 9,068 4,140 8,659 1,477 95.5 35.7 82.7 18.4
Source: Nakuru County Treasury
Analysis of expenditure by department shows that the County Assembly recorded the highest absorption rate of development budget at 58.2 while the Department of Lands Physical Planning and Housing recorded the lowest at 1.5 per cent. The Department of Youth, Culture, Sports and Social Services had the highest percentage of recurrent expenditure to recurrent budget at 109.4 per cent while the Department of Health Services the lowest at 69 per cent.
3.31.9 Key Observations and RecommendationsThe County has made progress in addressing some of the challenges previously identified as affecting budget implementation. Some of the progress made included:
i. Improvement in own-source revenue collection by 23.5 per cent to Kshs.2.81 billion in the reporting period compared to Kshs.2.28 billion in FY 2017/18.
Despite the above progress, the following challenges continued to hamper effective budget implementation;
1. High expenditure on domestic and foreign travel which increased by 45.6 per cent from Kshs.259.5 million in FY 2017/18 to Kshs.377.58 million in the reporting period.
2. Slow implementation of development activities in the reporting period. The County spent Kshs.1.48 billion, which represented 18.4 per cent of the annual development budget of Kshs.8.01 billion.
3. Late submission of reports on financial and non-financial performance by the County Treasury, which affected timely preparation of budget implementation report contrary to section 166 of the PFM Act, 2012.
4. Delay by Fund Administrators to submit expenditure reports of the Car Loan and Mortgage Fund,

207
COUNTY GOVERNMENTS ANNUAL BUDGET IMPLEMENTATION REVIEW REPORT FOR FY 2018/19
Emergency Fund, Bursary Fund and the Trade Enterprise Fund contrary to Section 168 of the PFM Act, 2012.
5. A high wage bill that increased by 14.6 per cent from Kshs.5.19 billion in FY 2017/18 to Kshs.5.92 billion in the reporting period. The wage bill accounted for 68.3 per cent of total expenditure in the reporting period.
The County should implement the following measures in order to improve budget execution;
1. The County Treasury should ensure that expenditure on non-core budget items is rationalised to provide more resources for development projects.
2. The County should identify and address issues that cause delays in the implementation of development projects.
3. The County Treasury should ensure timely preparation and submission of reports on financial and non-financial performance in line with Section 166 of PFM Act, 2012.
4. All Fund Administrators should ensure timely submission of expenditure reports on established Funds in line with Section 168 of PFM Act 2012.
5. The County Public Service Board should develop an optimal staffing structure and devise strategies to contain expenditure on personnel costs within 35 per cent of County’s total revenue in line with Regulation 25(1) (b) of the PFM (County Governments) Regulations, 2015.
3.32 Nandi County
3.32.1 Overview of the FY 2018/19 BudgetThe County’s FY 2018/19 Supplementary Budget was Kshs.8.43 billion, comprising of Kshs.5.21 billion (61.8 per cent) and Kshs.3.22 billion (38.2 per cent) allocation for recurrent and development expenditure respectively.
To finance the budget, the County expects to receive Kshs.5.37 billion (63.7 per cent) as equitable share of revenue raised nationally, Kshs.972.51 million (11.5 per cent) as total conditional grants, generate Kshs.459.29 million (5.5 per cent) from own-sources of revenue, Kshs.344 million (4.1 per cent) as other revenue expected and Kshs.1.36 billion (16.1 per cent) cash balance from FY 2017/18.

208
COUNTY GOVERNMENTS ANNUAL BUDGET IMPLEMENTATION REVIEW REPORT FOR FY 2018/19
Figure 3.125: Nandi County, Expected Sources of Budget Financing in FY 2018/19
246
Source: Nandi County Treasury
A breakdown of the conditional grants is provided in Table 3.92.
3.32.2 Revenue Analysis During FY 2018/19, the County had a total of Kshs.7.85 billion available for budget implementation. This amount
consisted of Kshs.5.37 billion received as equitable share of the revenue raised nationally, Kshs.530.44 million as
conditional grants, Kshs.286.33 million generated from own sources of revenue, Kshs.299 million as other revenue
sources and a cash balance of Kshs.1.36 billion from FY 2017/18. Figure 3.126 shows the trend in annual own-source
revenue collection from FY 2013/14 to FY 2018/19.
Figure 3.126: Nandi County, Own Source Revenue Collection for FY 2013/14 to FY 2018/19
Source: Nandi County Treasury
Cash Balance from FY 2017/1816.1%
National Sharable Revenue63.7%
Total Conditional Allocations
12.0%
Own Source Revenue5.5%
Other Revenues Expected During the
year4.1%
126.15
192.76
236.89 244.74
197.89
286.33
0
50
100
150
200
250
300
350
FY 2013/14 FY 2014/15 FY 2015/16 FY 2016/17 FY 2017/18 FY 2018/19
Ksh
s. M
illio
ns
Trend in Own Source Revenue
Source: Nandi County Treasury
A breakdown of the conditional grants is provided in Table 3.92.
3.32.2 Revenue AnalysisDuring FY 2018/19, the County had a total of Kshs.7.85 billion available for budget implementation. This amount consisted of Kshs.5.37 billion received as equitable share of the revenue raised nationally, Kshs.530.44 million as conditional grants, Kshs.286.33 million generated from own sources of revenue, Kshs.299 million as other revenue sources and a cash balance of Kshs.1.36 billion from FY 2017/18. Figure 3.126 shows the trend in annual own-source revenue collection from FY 2013/14 to FY 2018/19.

209
COUNTY GOVERNMENTS ANNUAL BUDGET IMPLEMENTATION REVIEW REPORT FOR FY 2018/19
Figure 3.126: Nandi County, Own Source Revenue Collection for FY 2013/14 to FY 2018/19
246
Source: Nandi County Treasury
A breakdown of the conditional grants is provided in Table 3.92.
3.32.2 Revenue Analysis During FY 2018/19, the County had a total of Kshs.7.85 billion available for budget implementation. This amount
consisted of Kshs.5.37 billion received as equitable share of the revenue raised nationally, Kshs.530.44 million as
conditional grants, Kshs.286.33 million generated from own sources of revenue, Kshs.299 million as other revenue
sources and a cash balance of Kshs.1.36 billion from FY 2017/18. Figure 3.126 shows the trend in annual own-source
revenue collection from FY 2013/14 to FY 2018/19.
Figure 3.126: Nandi County, Own Source Revenue Collection for FY 2013/14 to FY 2018/19
Source: Nandi County Treasury
Cash Balance from FY 2017/1816.1%
National Sharable Revenue63.7%
Total Conditional Allocations
12.0%
Own Source Revenue5.5%
Other Revenues Expected During the
year4.1%
126.15
192.76
236.89 244.74
197.89
286.33
0
50
100
150
200
250
300
350
FY 2013/14 FY 2014/15 FY 2015/16 FY 2016/17 FY 2017/18 FY 2018/19
Ksh
s. M
illio
ns
Trend in Own Source Revenue
Source: Nandi County Treasury
The County generated a total of Kshs.286.33 million from own revenue sources in FY 2018/19. This amount represented an increase of Kshs.88.43 million compared to that realised in FY 2017/18 and was 62.3 per cent of the annual target.
3.32.3 Conditional GrantsDuring the reporting period, the County received Kshs.530.44 million as conditional grants as shown in Table 3.92.
Table 3.92: Nandi County, Conditional Grants/Loans Received in the FY 2018/19
S/No. Grants/Loans Annual CARA, 2018 Allocation (Kshs)
Annual Budget Allocation (Kshs)
Actual Receipts (Kshs)
Actual Receipts as Percentage
of Annual Allo-cation (%)
A Grants Contained in the CARA, 2018
1 Compensation for User Fees Foregone 18,086,363 18,086,363 18,086,363 100.0
2 Leasing of Medical Equipment 200,000,000 200,000,000 - -
3 Road Maintenance Fuel Levy 141,371,626 141,371,626 218,431,700 154.5
4 Rehabilitation of Village Polytechnics 37,255,000 37,255,000 - -
5 Transforming Health Systems for Universal Care Pro-ject (World Bank) 97,229,498 97,229,498 42,496,971 43.7
6 IDA (World Bank) -National Agricultural and Rural In-clusive Growth Project (NARIGP) 140,435,163 140,435,163 50,078,476 35.7
7 IDA (World Bank) Kenya Devolution Support Pro-gramme “Level 1 grant” 44,551,044 44,551,044 - -
8 IDA (World Bank) -Kenya Urban Support Project (KUSP) 177,231,700 177,231,700 177,231,700 100.0
9 DANIDA - Universal Healthcare in Devolved System Programme 17,111,250 17,111,250 17,111,250 100.0
10 Sweden - Agriculture Sector Development Support Pro-gramme (ASDSP) II + Bal C/F in FY 2017/18 19,236,534 19,236,534 7,003,592 36.4
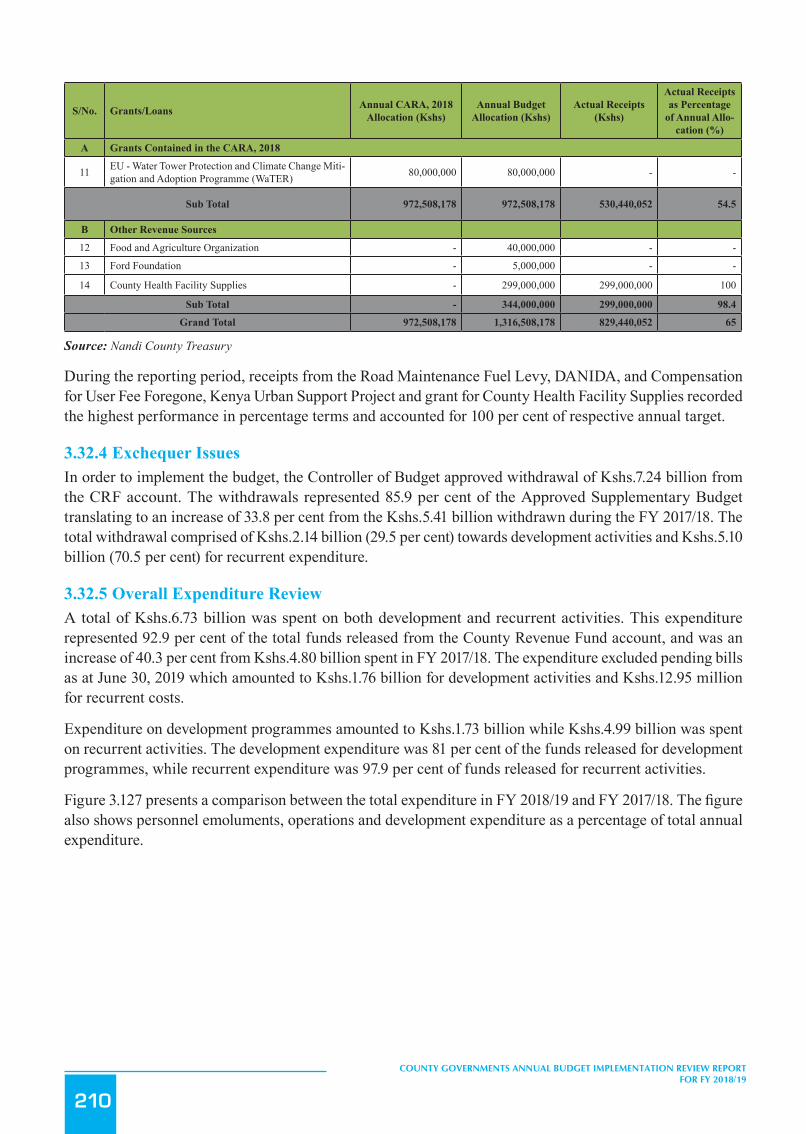
210
COUNTY GOVERNMENTS ANNUAL BUDGET IMPLEMENTATION REVIEW REPORT FOR FY 2018/19
S/No. Grants/Loans Annual CARA, 2018 Allocation (Kshs)
Annual Budget Allocation (Kshs)
Actual Receipts (Kshs)
Actual Receipts as Percentage
of Annual Allo-cation (%)
A Grants Contained in the CARA, 2018
11 EU - Water Tower Protection and Climate Change Miti-gation and Adoption Programme (WaTER) 80,000,000 80,000,000 - -
Sub Total 972,508,178 972,508,178 530,440,052 54.5
B Other Revenue Sources
12 Food and Agriculture Organization - 40,000,000 - -
13 Ford Foundation - 5,000,000 - -
14 County Health Facility Supplies - 299,000,000 299,000,000 100
Sub Total - 344,000,000 299,000,000 98.4
Grand Total 972,508,178 1,316,508,178 829,440,052 65
Source: Nandi County Treasury
During the reporting period, receipts from the Road Maintenance Fuel Levy, DANIDA, and Compensation for User Fee Foregone, Kenya Urban Support Project and grant for County Health Facility Supplies recorded the highest performance in percentage terms and accounted for 100 per cent of respective annual target.
3.32.4 Exchequer IssuesIn order to implement the budget, the Controller of Budget approved withdrawal of Kshs.7.24 billion from the CRF account. The withdrawals represented 85.9 per cent of the Approved Supplementary Budget translating to an increase of 33.8 per cent from the Kshs.5.41 billion withdrawn during the FY 2017/18. The total withdrawal comprised of Kshs.2.14 billion (29.5 per cent) towards development activities and Kshs.5.10 billion (70.5 per cent) for recurrent expenditure.
3.32.5 Overall Expenditure ReviewA total of Kshs.6.73 billion was spent on both development and recurrent activities. This expenditure represented 92.9 per cent of the total funds released from the County Revenue Fund account, and was an increase of 40.3 per cent from Kshs.4.80 billion spent in FY 2017/18. The expenditure excluded pending bills as at June 30, 2019 which amounted to Kshs.1.76 billion for development activities and Kshs.12.95 million for recurrent costs.
Expenditure on development programmes amounted to Kshs.1.73 billion while Kshs.4.99 billion was spent on recurrent activities. The development expenditure was 81 per cent of the funds released for development programmes, while recurrent expenditure was 97.9 per cent of funds released for recurrent activities.
Figure 3.127 presents a comparison between the total expenditure in FY 2018/19 and FY 2017/18. The figure also shows personnel emoluments, operations and development expenditure as a percentage of total annual expenditure.
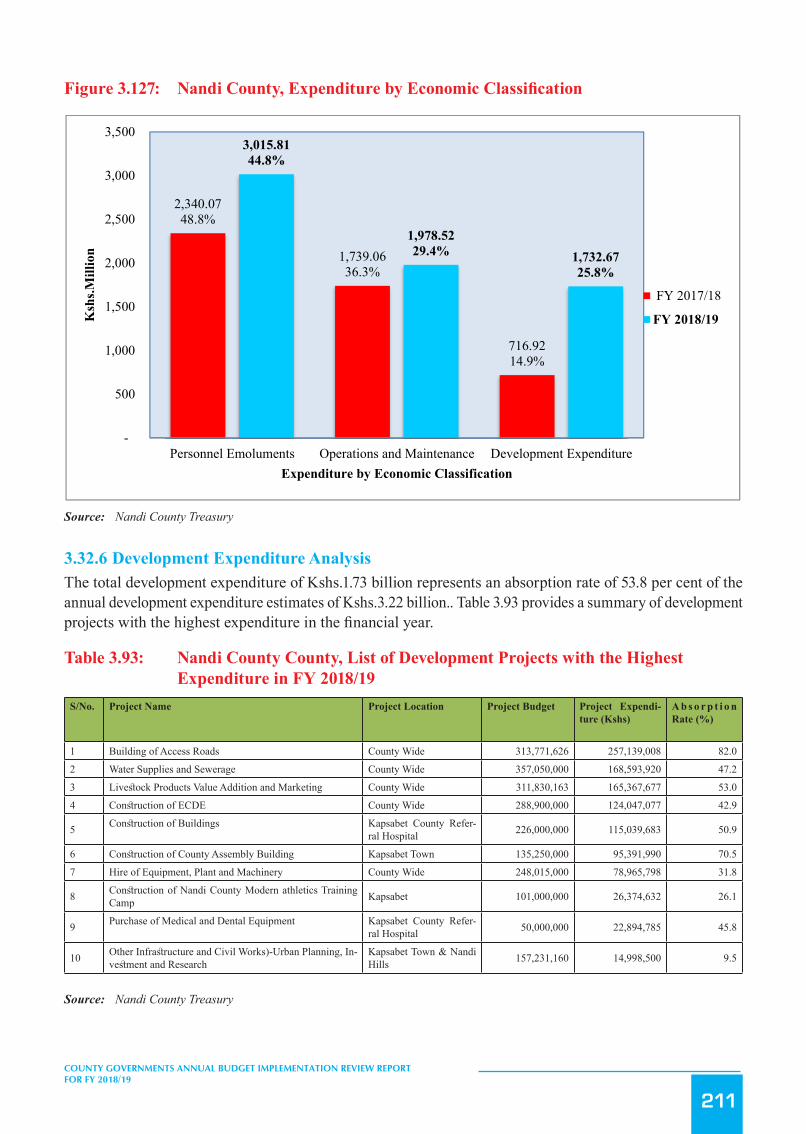
211
COUNTY GOVERNMENTS ANNUAL BUDGET IMPLEMENTATION REVIEW REPORT FOR FY 2018/19
Figure3.127: NandiCounty,ExpenditurebyEconomicClassification
248
33.8 per cent from the Kshs.5.41 billion withdrawn during the FY 2017/18. The total withdrawal comprised of
Kshs.2.14 billion (29.5 per cent) towards development activities and Kshs.5.10 billion (70.5 per cent) for recurrent
expenditure.
3.32.5 Overall Expenditure Review A total of Kshs.6.73 billion was spent on both development and recurrent activities. This expenditure represented 92.9
per cent of the total funds released from the County Revenue Fund account, and was an increase of 40.3 per cent from
Kshs.4.80 billion spent in FY 2017/18. The expenditure excluded pending bills as at June 30, 2019 which amounted to
Kshs.1.76 billion for development activities and Kshs.12.95 million for recurrent costs.
Expenditure on development programmes amounted to Kshs.1.73 billion while Kshs.4.99 billion was spent on recurrent
activities. The development expenditure was 81 per cent of the funds released for development programmes, while
recurrent expenditure was 97.9 per cent of funds released for recurrent activities.
Figure 3.127 presents a comparison between the total expenditure in FY 2018/19 and FY 2017/18. The figure also
shows personnel emoluments, operations and development expenditure as a percentage of total annual expenditure.
Figure 3.127: Nandi County, Expenditure by Economic Classification
Source: Nandi County Treasury
3.32.6 Development Expenditure Analysis The total development expenditure of Kshs.1.73 billion represents an absorption rate of 53.8 per cent of the annual
development expenditure estimates of Kshs.3.22 billion.. Table 3.93 provides a summary of development projects with
the highest expenditure in the financial year.
Table 3.93: Nandi County County, List of Development Projects with the Highest Expenditure in FY 2018/19
2,340.0748.8%
1,739.0636.3%
716.9214.9%
3,015.8144.8%
1,978.5229.4% 1,732.67
25.8%
-
500
1,000
1,500
2,000
2,500
3,000
3,500
Personnel Emoluments Operations and Maintenance Development Expenditure
Ksh
s.Mill
ion
Expenditure by Economic Classification
FY 2017/18
FY 2018/19
Source: Nandi County Treasury
3.32.6 Development Expenditure AnalysisThe total development expenditure of Kshs.1.73 billion represents an absorption rate of 53.8 per cent of the annual development expenditure estimates of Kshs.3.22 billion.. Table 3.93 provides a summary of development projects with the highest expenditure in the financial year.
Table 3.93: Nandi County County, List of Development Projects with the Highest Expenditure in FY 2018/19
S/No. Project Name Project Location Project Budget Project Expendi-ture (Kshs)
A b s o r p t i o n Rate (%)
1 Building of Access Roads County Wide 313,771,626 257,139,008 82.0
2 Water Supplies and Sewerage County Wide 357,050,000 168,593,920 47.2
3 Livestock Products Value Addition and Marketing County Wide 311,830,163 165,367,677 53.0
4 Construction of ECDE County Wide 288,900,000 124,047,077 42.9
5 Construction of Buildings Kapsabet County Refer-ral Hospital 226,000,000 115,039,683 50.9
6 Construction of County Assembly Building Kapsabet Town 135,250,000 95,391,990 70.5
7 Hire of Equipment, Plant and Machinery County Wide 248,015,000 78,965,798 31.8
8 Construction of Nandi County Modern athletics Training Camp Kapsabet 101,000,000 26,374,632 26.1
9 Purchase of Medical and Dental Equipment Kapsabet County Refer-ral Hospital 50,000,000 22,894,785 45.8
10 Other Infrastructure and Civil Works)-Urban Planning, In-vestment and Research
Kapsabet Town & Nandi Hills 157,231,160 14,998,500 9.5
Source: Nandi County Treasury

212
COUNTY GOVERNMENTS ANNUAL BUDGET IMPLEMENTATION REVIEW REPORT FOR FY 2018/19
3.32.7 Analysis of Recurrent ExpenditureThe total recurrent expenditure of Kshs.4.99 billion comprised of Kshs.3.02 billion (60.5 per cent) incurred on personnel emoluments and Kshs.1.97 billion (39.5 per cent) on operations and maintenance as shown in Figure 3.127.
Expenditure on personnel emoluments represented an increase of 28.9 per cent compared to FY 2017/18 when the County spent Kshs.2.34 billion and was 44.8 per cent of the total expenditure in FY 2018/19. Figure 3.128 shows a summary of operations and maintenance expenditure by major categories.
Figure 3.128: Nandi County, Operations and Maintenance Expenditure by Major Categories in FY 2018/19
249
S/No.
Project Name Project Location Project Budget Project Expenditure (Kshs)
Absorption Rate (%)
1 Building of Access Roads County Wide 313,771,626 257,139,008 82.0 2 Water Supplies and Sewerage County Wide 357,050,000 168,593,920 47.2 3 Livestock Products Value Addition and Marketing County Wide 311,830,163 165,367,677 53.0 4 Construction of ECDE County Wide 288,900,000 124,047,077 42.9
5 Construction of Buildings Kapsabet County Referral Hospital 226,000,000 115,039,683 50.9
6 Construction of County Assembly Building Kapsabet Town 135,250,000 95,391,990 70.5 7 Hire of Equipment, Plant and Machinery County Wide 248,015,000 78,965,798 31.8
8 Construction of Nandi County Modern athletics Training Camp Kapsabet 101,000,000 26,374,632 26.1
9 Purchase of Medical and Dental Equipment Kapsabet County Referral Hospital 50,000,000 22,894,785 45.8
10 Other Infrastructure and Civil Works)-Urban Planning, Investment and Research
Kapsabet Town & Nandi Hills 157,231,160 14,998,500 9.5
Source: Nandi County Treasury
3.32.7 Analysis of Recurrent Expenditure The total recurrent expenditure of Kshs.4.99 billion comprised of Kshs.3.02 billion (60.5 per cent) incurred on personnel
emoluments and Kshs.1.97 billion (39.5 per cent) on operations and maintenance as shown in Figure 3.127.
Expenditure on personnel emoluments represented an increase of 28.9 per cent compared to FY 2017/18 when the
County spent Kshs.2.34 billion and was 44.8 per cent of the total expenditure in FY 2018/19. Figure 3.128 shows a
summary of operations and maintenance expenditure by major categories.
Figure 3.128: Nandi County, Operations and Maintenance Expenditure by Major Categories in FY 2018/19
Source: Nandi County Treasury
334.70
203.70176.62
72.00 62 57.93 55.8335.97 35.00 28.17
0
50
100
150
200
250
300
350
400
Ksh
s. M
illio
n
Major Categories of Operations & Maintenance
Source: Nandi County Treasury
The County spent Kshs.35.97 million on committee sitting allowances for the 40 MCAs and speaker against the annual budget allocation of Kshs.38.10 million. This represented an increase of 63.6 per cent compared to Kshs.21.99 million spent in FY 2017/18. The average monthly sitting allowance translated to Kshs.74,948 per MCA against the SRC’s recommended monthly ceiling of Kshs.124,800.
Expenditure on domestic and foreign travel amounted to Kshs.232.45 million, and comprised of Kshs.69.66 million spent by the County Assembly and Kshs.162.80 million by the County Executive. This expenditure represented 3.5 per cent of total recurrent expenditure and was a decrease of 30.8 per cent compared to Kshs.255.10 million spent in FY 2017/18.
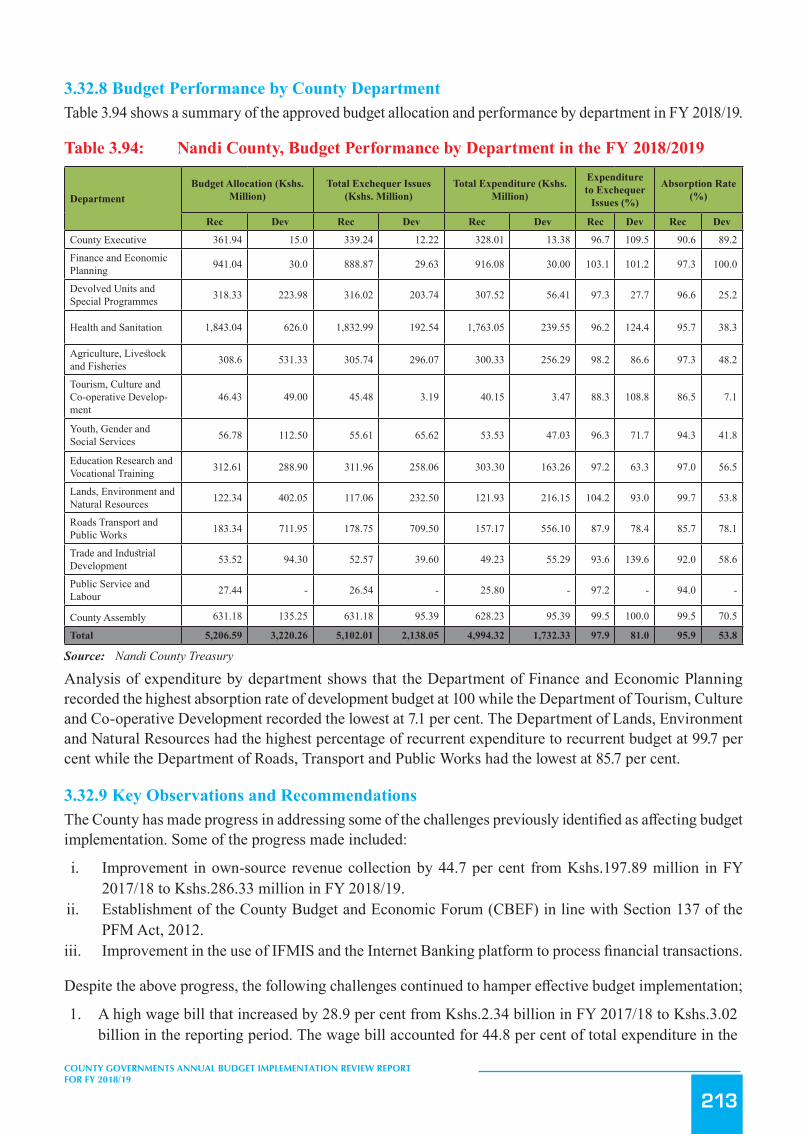
213
COUNTY GOVERNMENTS ANNUAL BUDGET IMPLEMENTATION REVIEW REPORT FOR FY 2018/19
3.32.8 Budget Performance by County DepartmentTable 3.94 shows a summary of the approved budget allocation and performance by department in FY 2018/19.
Table 3.94: Nandi County, Budget Performance by Department in the FY 2018/2019
DepartmentBudget Allocation (Kshs.
Million)Total Exchequer Issues
(Kshs. Million)Total Expenditure (Kshs.
Million)
Expenditure to Exchequer
Issues (%)
Absorption Rate (%)
Rec Dev Rec Dev Rec Dev Rec Dev Rec Dev
County Executive 361.94 15.0 339.24 12.22 328.01 13.38 96.7 109.5 90.6 89.2
Finance and Economic Planning 941.04 30.0 888.87 29.63 916.08 30.00 103.1 101.2 97.3 100.0
Devolved Units and Special Programmes 318.33 223.98 316.02 203.74 307.52 56.41 97.3 27.7 96.6 25.2
Health and Sanitation 1,843.04 626.0 1,832.99 192.54 1,763.05 239.55 96.2 124.4 95.7 38.3
Agriculture, Livestock and Fisheries 308.6 531.33 305.74 296.07 300.33 256.29 98.2 86.6 97.3 48.2
Tourism, Culture and Co-operative Develop-ment
46.43 49.00 45.48 3.19 40.15 3.47 88.3 108.8 86.5 7.1
Youth, Gender and Social Services 56.78 112.50 55.61 65.62 53.53 47.03 96.3 71.7 94.3 41.8
Education Research and Vocational Training 312.61 288.90 311.96 258.06 303.30 163.26 97.2 63.3 97.0 56.5
Lands, Environment and Natural Resources 122.34 402.05 117.06 232.50 121.93 216.15 104.2 93.0 99.7 53.8
Roads Transport and Public Works 183.34 711.95 178.75 709.50 157.17 556.10 87.9 78.4 85.7 78.1
Trade and Industrial Development 53.52 94.30 52.57 39.60 49.23 55.29 93.6 139.6 92.0 58.6
Public Service and Labour 27.44 - 26.54 - 25.80 - 97.2 - 94.0 -
County Assembly 631.18 135.25 631.18 95.39 628.23 95.39 99.5 100.0 99.5 70.5
Total 5,206.59 3,220.26 5,102.01 2,138.05 4,994.32 1,732.33 97.9 81.0 95.9 53.8
Source: Nandi County Treasury
Analysis of expenditure by department shows that the Department of Finance and Economic Planning recorded the highest absorption rate of development budget at 100 while the Department of Tourism, Culture and Co-operative Development recorded the lowest at 7.1 per cent. The Department of Lands, Environment and Natural Resources had the highest percentage of recurrent expenditure to recurrent budget at 99.7 per cent while the Department of Roads, Transport and Public Works had the lowest at 85.7 per cent.
3.32.9 Key Observations and RecommendationsThe County has made progress in addressing some of the challenges previously identified as affecting budget implementation. Some of the progress made included:
i. Improvement in own-source revenue collection by 44.7 per cent from Kshs.197.89 million in FY 2017/18 to Kshs.286.33 million in FY 2018/19.
ii. Establishment of the County Budget and Economic Forum (CBEF) in line with Section 137 of the PFM Act, 2012.
iii. Improvement in the use of IFMIS and the Internet Banking platform to process financial transactions.
Despite the above progress, the following challenges continued to hamper effective budget implementation;
1. A high wage bill that increased by 28.9 per cent from Kshs.2.34 billion in FY 2017/18 to Kshs.3.02 billion in the reporting period. The wage bill accounted for 44.8 per cent of total expenditure in the

214
COUNTY GOVERNMENTS ANNUAL BUDGET IMPLEMENTATION REVIEW REPORT FOR FY 2018/19
reporting period.2. Delay by Fund Administrators to submit expenditure reports of the Car Loan and Mortgage Fund,
Emergency Fund, and the Bursary Fund contrary to Section 168 of the PFM Act, 2012.3. Late submission of reports on financial and non-financial performance by the County Treasury to the
Controller of Budget, which affected timely preparation of budget implementation report contrary to Section 166 of the PFM Act, 2012.
The County should implement the following measures in order to improve budget execution;
1. The County Public Service Board should develop an optimal staffing structure and devise strategies to contain expenditure on personnel costs within 35 per cent of County’s total revenue in line with Regulation 25(1) (b) of the PFM (County Governments) Regulations, 2015.
2. All Fund Administrators should ensure timely submission of expenditure reports on established Funds in line with Section 168 of PFM Act 2012.
3. The County Treasury should ensure timely preparation and submission of reports on financial and non-financial performance in line with Section 166 of PFM Act, 2012.
3.33 Narok County
3.33.1 Overview of the FY 2018/19 BudgetThe County’s FY 2018/19 Approved Supplementary Budget was Kshs.10.19 billion, comprising of Kshs.7.04 billion (69.1 per cent) and Kshs.3.15 billion (30.9 per cent) allocation for recurrent and development expenditure respectively.
To finance the budget, the County expects to receive Kshs.6.37 billion (62.5 per cent) as equitable share of revenue raised nationally, Kshs.958.17 million (9.4 per cent) as total conditional grants, generate Kshs.2.86 billion (28.1 per cent) from own revenue sources, and a cash balance of Kshs.2.67 million (0.03 per cent) from FY 2017/2018.

215
COUNTY GOVERNMENTS ANNUAL BUDGET IMPLEMENTATION REVIEW REPORT FOR FY 2018/19
Figure 3.129: Narok County, Expected Sources of Budget Financing in FY 2018/19
252
Figure 3.129: Narok County, Expected Sources of Budget Financing in FY 2018/19
Source: Narok County Treasury
A breakdown of the conditional grants, as per CARA, 2018, is provided in Table 3.95 .
3.33.2 Revenue Analysis During FY 2018/19, the County had a total of Kshs.10.14 billion available for budget implementation. This amount
consisted of Kshs.6.37 billion received as equitable share of the revenue raised nationally, Kshs.631.15 million as
conditional grants, Kshs.2.92 billion generated from own sources of revenue, and a cash balance of Kshs.2.67 million
from the FY 2017/18.
Figure 3.130 shows the annual trend in own-source revenue collection from FY 2013/14 to FY 2018/19.
Figure 3.130: Narok County, Own Source Revenue Collection for FY 2013/14 to FY 2018/19
Cash Balance from FY 2017/18, 0.03%
National Sharable Revenue, 62.5%
Total Conditional Allocations , 9.4%
Own Source Revenue, 28.1%
Source: Narok County Treasury
A breakdown of the conditional grants, as per CARA, 2018, is provided in Table 3.95 .
3.33.2 Revenue AnalysisDuring FY 2018/19, the County had a total of Kshs.10.14 billion available for budget implementation. This amount consisted of Kshs.6.37 billion received as equitable share of the revenue raised nationally, Kshs.631.15 million as conditional grants, Kshs.2.92 billion generated from own sources of revenue, and a cash balance of Kshs.2.67 million from the FY 2017/18.
Figure 3.130 shows the annual trend in own-source revenue collection from FY 2013/14 to FY 2018/19.
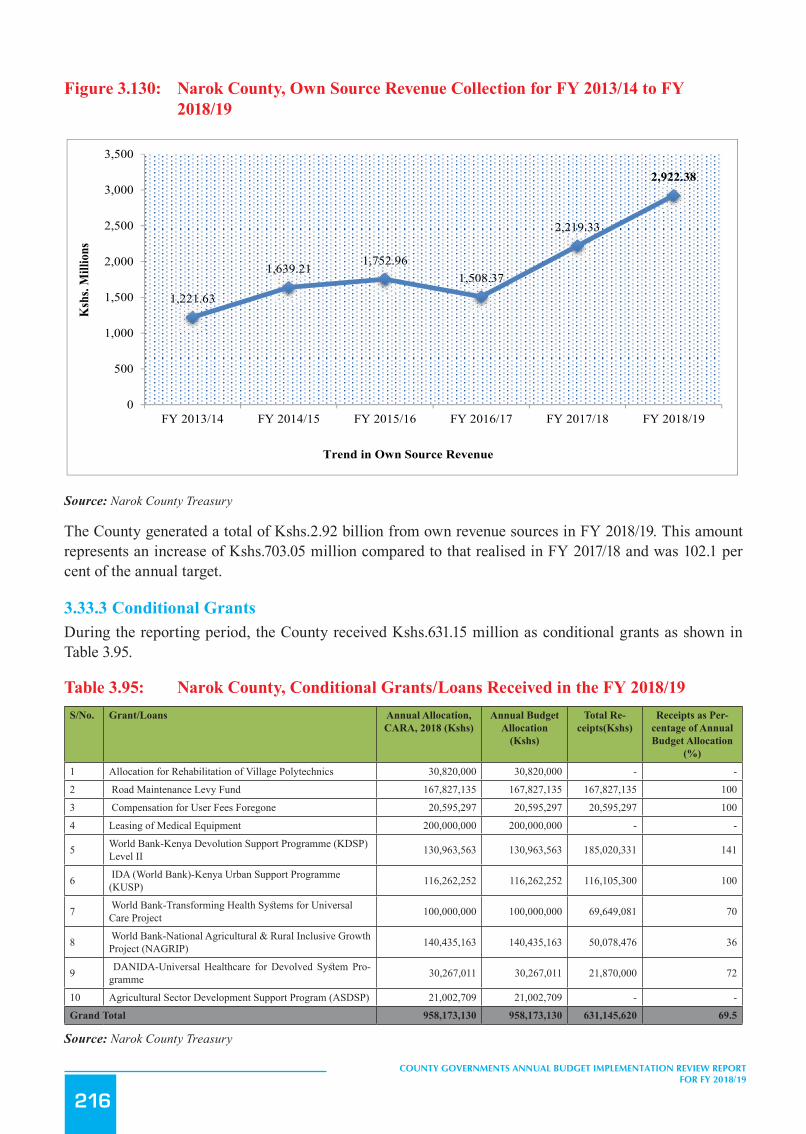
216
COUNTY GOVERNMENTS ANNUAL BUDGET IMPLEMENTATION REVIEW REPORT FOR FY 2018/19
Figure 3.130: Narok County, Own Source Revenue Collection for FY 2013/14 to FY 2018/19
253
Source: Narok County Treasury
The County generated a total of Kshs.2.92 billion from own revenue sources in FY 2018/19. This amount represents an
increase of Kshs.703.05 million compared to that realised in FY 2017/18 and was 102.1 per cent of the annual target.
3.33.3 Conditional Grants During the reporting period, the County received Kshs.631.15 million as conditional grants as shown in Table 3.95.
Table 3.95: Narok County, Conditional Grants/Loans Received in the FY 2018/19
S/No.
Grant/Loans Annual Allocation, CARA, 2018
(Kshs)
Annual Budget
Allocation (Kshs)
Total Receipts (Kshs)
Receipts as Percentage of
Annual Budget Allocation
(%)
1 Allocation for Rehabilitation of Village Polytechnics 30,820,000 30,820,000 - - 2 Road Maintenance Levy Fund 167,827,135 167,827,135 167,827,135 100 3 Compensation for User Fees Foregone 20,595,297 20,595,297 20,595,297 100 4 Leasing of Medical Equipment 200,000,000 200,000,000 - -
5 World Bank-Kenya Devolution Support Programme (KDSP) Level II 130,963,563 130,963,563 185,020,331 141
6 IDA (World Bank)-Kenya Urban Support Programme (KUSP) 116,262,252 116,262,252 116,105,300 100
7 World Bank-Transforming Health Systems for Universal Care Project 100,000,000 100,000,000 69,649,081 70
8 World Bank-National Agricultural & Rural Inclusive Growth Project (NAGRIP) 140,435,163 140,435,163 50,078,476 36
9 DANIDA-Universal Healthcare for Devolved System Programme 30,267,011 30,267,011 21,870,000 72
10 Agricultural Sector Development Support Program (ASDSP) 21,002,709 21,002,709 - -
Grand Total 958,173,130 958,173,130 631,145,620 69.5
Source: Narok County Treasury
During the reporting period, receipts from World Bank in support of the Kenya Devolution Support Programme Level
II recorded the highest performance accounting for 141 per cent of the annual target.
1,221.63
1,639.21 1,752.961,508.37
2,219.33
2,922.38
0
500
1,000
1,500
2,000
2,500
3,000
3,500
FY 2013/14 FY 2014/15 FY 2015/16 FY 2016/17 FY 2017/18 FY 2018/19
Ksh
s. M
illio
ns
Trend in Own Source Revenue
Source: Narok County Treasury
The County generated a total of Kshs.2.92 billion from own revenue sources in FY 2018/19. This amount represents an increase of Kshs.703.05 million compared to that realised in FY 2017/18 and was 102.1 per cent of the annual target.
3.33.3 Conditional GrantsDuring the reporting period, the County received Kshs.631.15 million as conditional grants as shown in Table 3.95.
Table 3.95: Narok County, Conditional Grants/Loans Received in the FY 2018/19S/No. Grant/Loans Annual Allocation,
CARA, 2018 (Kshs)Annual Budget
Allocation (Kshs)
Total Re-ceipts(Kshs)
Receipts as Per-centage of Annual Budget Allocation
(%)
1 Allocation for Rehabilitation of Village Polytechnics 30,820,000 30,820,000 - -
2 Road Maintenance Levy Fund 167,827,135 167,827,135 167,827,135 100
3 Compensation for User Fees Foregone 20,595,297 20,595,297 20,595,297 100
4 Leasing of Medical Equipment 200,000,000 200,000,000 - -
5 World Bank-Kenya Devolution Support Programme (KDSP) Level II 130,963,563 130,963,563 185,020,331 141
6 IDA (World Bank)-Kenya Urban Support Programme (KUSP) 116,262,252 116,262,252 116,105,300 100
7 World Bank-Transforming Health Systems for Universal Care Project 100,000,000 100,000,000 69,649,081 70
8 World Bank-National Agricultural & Rural Inclusive Growth Project (NAGRIP) 140,435,163 140,435,163 50,078,476 36
9 DANIDA-Universal Healthcare for Devolved System Pro-gramme 30,267,011 30,267,011 21,870,000 72
10 Agricultural Sector Development Support Program (ASDSP) 21,002,709 21,002,709 - -
Grand Total 958,173,130 958,173,130 631,145,620 69.5
Source: Narok County Treasury
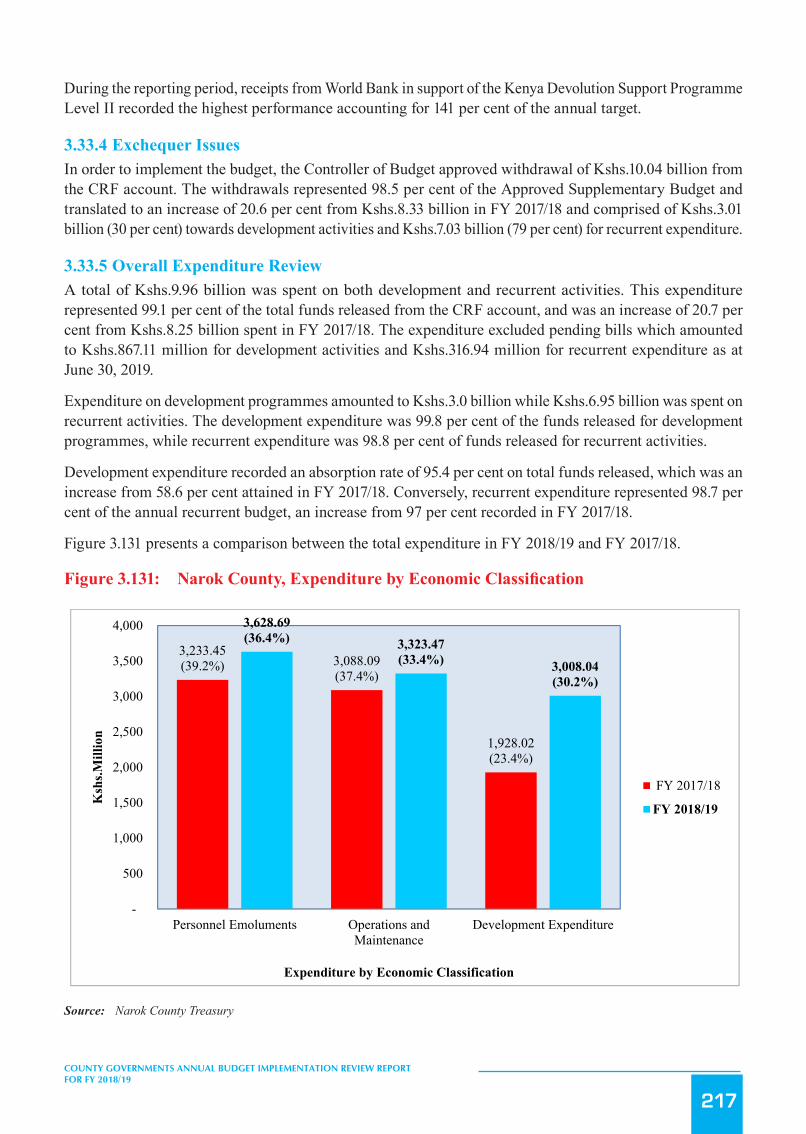
217
COUNTY GOVERNMENTS ANNUAL BUDGET IMPLEMENTATION REVIEW REPORT FOR FY 2018/19
During the reporting period, receipts from World Bank in support of the Kenya Devolution Support Programme Level II recorded the highest performance accounting for 141 per cent of the annual target.
3.33.4 Exchequer IssuesIn order to implement the budget, the Controller of Budget approved withdrawal of Kshs.10.04 billion from the CRF account. The withdrawals represented 98.5 per cent of the Approved Supplementary Budget and translated to an increase of 20.6 per cent from Kshs.8.33 billion in FY 2017/18 and comprised of Kshs.3.01 billion (30 per cent) towards development activities and Kshs.7.03 billion (79 per cent) for recurrent expenditure.
3.33.5 Overall Expenditure ReviewA total of Kshs.9.96 billion was spent on both development and recurrent activities. This expenditure represented 99.1 per cent of the total funds released from the CRF account, and was an increase of 20.7 per cent from Kshs.8.25 billion spent in FY 2017/18. The expenditure excluded pending bills which amounted to Kshs.867.11 million for development activities and Kshs.316.94 million for recurrent expenditure as at June 30, 2019.
Expenditure on development programmes amounted to Kshs.3.0 billion while Kshs.6.95 billion was spent on recurrent activities. The development expenditure was 99.8 per cent of the funds released for development programmes, while recurrent expenditure was 98.8 per cent of funds released for recurrent activities.
Development expenditure recorded an absorption rate of 95.4 per cent on total funds released, which was an increase from 58.6 per cent attained in FY 2017/18. Conversely, recurrent expenditure represented 98.7 per cent of the annual recurrent budget, an increase from 97 per cent recorded in FY 2017/18.
Figure 3.131 presents a comparison between the total expenditure in FY 2018/19 and FY 2017/18.
Figure3.131: NarokCounty,ExpenditurebyEconomicClassification
254
3.33.4 Exchequer Issues In order to implement the budget, the Controller of Budget approved withdrawal of Kshs.10.04 billion from the CRF
account. The withdrawals represented 98.5 per cent of the Approved Supplementary Budget and translated to an
increase of 20.6 per cent from Kshs.8.33 billion in FY 2017/18 and comprised of Kshs.3.01 billion (30 per cent) towards
development activities and Kshs.7.03 billion (79 per cent) for recurrent expenditure.
3.33.5 Overall Expenditure Review A total of Kshs.9.96 billion was spent on both development and recurrent activities. This expenditure represented 99.1
per cent of the total funds released from the CRF account, and was an increase of 20.7 per cent from Kshs.8.25 billion
spent in FY 2017/18. The expenditure excluded pending bills which amounted to Kshs.867.11 million for development
activities and Kshs.316.94 million for recurrent expenditure as at June 30, 2019.
Expenditure on development programmes amounted to Kshs.3.0 billion while Kshs.6.95 billion was spent on recurrent
activities. The development expenditure was 99.8 per cent of the funds released for development programmes, while
recurrent expenditure was 98.8 per cent of funds released for recurrent activities.
Development expenditure recorded an absorption rate of 95.4 per cent on total funds released, which was an increase
from 58.6 per cent attained in FY 2017/18. Conversely, recurrent expenditure represented 98.7 per cent of the annual
recurrent budget, an increase from 97 per cent recorded in FY 2017/18.
Figure 3.131 presents a comparison between the total expenditure in FY 2018/19 and FY 2017/18.
Figure 3.131: Narok County, Expenditure by Economic Classification
Source: Narok County Treasury
3,233.45(39.2%) 3,088.09
(37.4%)
1,928.02(23.4%)
3,628.69(36.4%) 3,323.47
(33.4%) 3,008.04(30.2%)
-
500
1,000
1,500
2,000
2,500
3,000
3,500
4,000
Personnel Emoluments Operations andMaintenance
Development Expenditure
Ksh
s.Mill
ion
Expenditure by Economic Classification
FY 2017/18
FY 2018/19
Source: Narok County Treasury

218
COUNTY GOVERNMENTS ANNUAL BUDGET IMPLEMENTATION REVIEW REPORT FOR FY 2018/19
3.33.6 Development Expenditure AnalysisThe total development expenditure of Kshs.3.0 billion represented 95.4 per cent of the annual development expenditure estimates of Kshs.3.15 billion. Table 3.96 provides a summary of development projects with the highest expenditure in the financial year.
Table 3.96: Narok County, List of Development Projects with the Highest Expenditure in FY 2018/19
S/No. Project Name Project Location Project Budget (Kshs)
Project Expendi-ture (Kshs)
Absorption Rate (%)
1 Roads Infrastructure Narok South, North, East, Kilgoris 976,147,135 976,810,921 100
2 Civil works and Infrastructure Narok South, North, East, Kilgoris 459,312,435 433,985,584 94
3 Acquisition of roads & civil works machines County Head Quarters 228,000,000 240,037,239 105
4 Buildings & Infrastructure Narok South, North, East, Kilgoris 352,799,000 352,272,650 100
5 Transfers to Bursary fund & Maasai Mara & Assembly
County Head Quarters 569,375,110 439,198,662 77
6 Rehabilitation of Mara & Markets yards Narok South, North, East, Kilgoris 130,000,000 129,623,208 100
7 Specialised Supplies & Services Health Facilities & Head Quarters 313,547,716 312,203,444 100
8 Hospital Equipment & Related Maintenance Health Facilities & Head Quarters 124,191,973 123,913,145 100
Source: Narok County Treasury
3.33.7 Analysis of Recurrent ExpenditureThe total recurrent expenditure of Kshs.6.95 billion comprised of Kshs.3.63 billion (52.2 per cent) incurred on personnel emoluments and Kshs.3.32 billion (47.8 per cent) on operations and maintenance as shown in Figure 3.131.
Expenditure on personnel emoluments represented an increase of 12.2 per cent compared to FY 2017/18 when the County spent Kshs.3.23 billion and was 36.4 per cent of the total expenditure in FY 2018/19. Figure 3.132 shows a summary of operations and maintenance expenditure by major categories.

219
COUNTY GOVERNMENTS ANNUAL BUDGET IMPLEMENTATION REVIEW REPORT FOR FY 2018/19
Figure 3.132: Narok County, Operations and Maintenance Expenditure by Major Categories in FY 2018/19
256
Source: Narok County Treasury
The County spent Kshs.63.74 million on committee sitting allowances for the 48 MCAs and Speaker against the annual
budget allocation of Kshs.63.81 million. This represents an increase of 99.5 per cent compared to Kshs.31.9 million
spent in FY 2017/18. The average monthly sitting allowance translated to Kshs.110,663 per MCA against the SRC’s
recommended monthly ceiling of Kshs.124,800.
Expenditure on domestic and foreign travel amounted to Kshs.478.57 million, and comprised of Kshs.256.88 million
spent by the County Assembly and Kshs.221.69 million by the County Executive. This expenditure represented 5.9 per
cent of total recurrent expenditure and was an increase of 187.4 million compared to Kshs.166.49 million spent in FY
2017/18.
3.33.8 Budget Performance by County Department Table 3.97 shows a summary of the approved budget allocation and performance by department in FY 2018/19.
Table 3.97: Narok County, Budget Performance by Department in the FY 2018/19
Department Annual Budget Allocation (Kshs. Million)
Exchequer Issues (Kshs. Million)
Total Expenditure (Kshs. Million)
Expenditure to Exchequer Issues (%)
Absorption Rate (%)
Rec Dev Rec Dev Rec Dev Rec Dev Rec Dev County Assembly 709.07 120.00 705.0 704.99 44.69 44.69 100 99.3 99.4 37.2 Office of the Governor 306.11 305.75 302.63 - - 99 - 98.9 -
Finance and Economic Planning 553.27 299.56 552.98 546.02 259.82 259.82 98.7 99.9 98.7 86.7
Roads, Transport and Public Works 233.47 922.14 233.32 231.35 899.51 899.51 99.2 99.8 99.1 97.5
Education, Youth, Sports, Culture & Social Services
917.51 394.93 917.22 902.01 394.32 394.32 98.3 99.8 98.3 99.8
449.74 445.23410.76 409.48 397.89 390.95 384.45
353.67
67.81
7.850
50
100
150
200
250
300
350
400
450
500
Ksh
s. M
illio
n
Major Categories of Operations & Maintenance
Source: Narok County Treasury
The County spent Kshs.63.74 million on committee sitting allowances for the 48 MCAs and Speaker against the annual budget allocation of Kshs.63.81 million. This represents an increase of 99.5 per cent compared to Kshs.31.9 million spent in FY 2017/18. The average monthly sitting allowance translated to Kshs.110,663 per MCA against the SRC’s recommended monthly ceiling of Kshs.124,800.
Expenditure on domestic and foreign travel amounted to Kshs.478.57 million, and comprised of Kshs.256.88 million spent by the County Assembly and Kshs.221.69 million by the County Executive. This expenditure represented 5.9 per cent of total recurrent expenditure and was an increase of 187.4 million compared to Kshs.166.49 million spent in FY 2017/18.
3.33.8 Budget Performance by County DepartmentTable 3.97 shows a summary of the approved budget allocation and performance by department in FY 2018/19.
Table 3.97: Narok County, Budget Performance by Department in the FY 2018/19Department Annual Budget Allocation
(Kshs. Million)Exchequer Issues (Kshs.
Million)Total Expenditure (Kshs.
Million)Expenditure to Exchequer
Issues (%)
Absorption Rate (%)
Rec Dev Rec Dev Rec Dev Rec Dev Rec Dev
County Assembly 709.07 120.00 705.0 704.99 44.69 44.69 100 99.3 99.4 37.2
Office of the Governor 306.11 305.75 302.63 - - 99 - 98.9 -
Finance and Economic Planning 553.27 299.56 552.98 546.02 259.82 259.82 98.7 99.9 98.7 86.7
Roads, Transport and Public Works 233.47 922.14 233.32 231.35 899.51 899.51 99.2 99.8 99.1 97.5

220
COUNTY GOVERNMENTS ANNUAL BUDGET IMPLEMENTATION REVIEW REPORT FOR FY 2018/19
Department Annual Budget Allocation (Kshs. Million)
Exchequer Issues (Kshs. Million)
Total Expenditure (Kshs. Million)
Expenditure to Exchequer
Issues (%)
Absorption Rate (%)
Rec Dev Rec Dev Rec Dev Rec Dev Rec Dev
Education, Youth, Sports, Culture & Social Services
917.51 394.93 917.22 902.01 394.32 394.32 98.3 99.8 98.3 99.8
Environment Protec-tion, Energy, Water and Natural Resources
89.35 315.04 89.31 88.12 314.07 314.07 98.7 99.7 98.6 99.7
County Public Service Board 71.45 - 71.35 70.85 - - 99.3 - 99.2 -
Agriculture, Livestock and Fisheries 350.71 516.37 350.70 344.31 513.66 513.66 98.2 99.9 98.2 99.5
Health and Sanitation 2,310.53 206.76 2,310.40 2,277.00 206.46 206.46 98.6 99.9 98.5 99.9
Lands, Housing, Physi-cal Planning and Urban Development
183.98 166.91 183.95 183.28 166.57 166.57 99.6 99.8 99.6 99.8
Tourism, Wildlife, Trade, Industry and Co-operative Development
103.36 131.86 103.19 96.33 174.19 174.19 93.4 100. 93.2 99.2
County Administra-tion and Public Service Management
1,125.36 35.55 1,123.27 1,125.13 34.76 34.76 100.2 98.5 100 97.8
Total 7,041.48 3,153.37 7,033.71 3,013.05 6,952.16 3,008.04 98.8 99.8 98.7 95.4
Source: Narok County Treasury
Analysis of expenditure by department shows that the Department of Health and Sanitation recorded the highest absorption rate of development budget at 99.9 while the County Assembly recorded the lowest at 37.2 per cent. The Department of County Administration and Public Service Management had the highest percentage of recurrent expenditure to recurrent budget at 100 per cent while the Department of Tourism, Wildlife, Trade, Industry and Cooperative Development had the lowest at 93.2 per cent.
3.33.9 Key Observations and RecommendationsThe County has made progress in addressing some of the challenges previously identified as affecting budget implementation. Some of the progress made included:
i. Automation of own source revenue collections which enabled the County to improve revenue collection by 31.7 per cent from Kshs.2.23 billion in FY 2017/18 to Kshs.2.92 billion in the reporting period.
ii. Improvement in the absorption of development budget from 58.6 per cent in FY 2017/18 to 95.4 per cent in FY 2018/19.
Despite the above progress, the following challenges continued to hamper effective budget implementation;
1. Delay by the National Treasury to disburse the equitable share of revenue to the County.2. IFMIS connectivity challenges which led to delays in the approval of procurement requests and
payment of suppliers.3. Inadequate budgetary control that resulted to high pending bills at the end of the financial year which
amounted to Kshs.1.19 billion.4. High expenditure on personnel emoluments which has increased by 12.2 per cent from Kshs.3.23
billion to Kshs.3.63 billion. The wage bill accounted for 36.4 per cent of total expenditure in the reporting period.
5. High expenditure on foreign and domestic travel, which increased by187.4 per cent from Kshs.166.49 million in FY 2017/18 to Kshs.478.57 million in the reporting period.
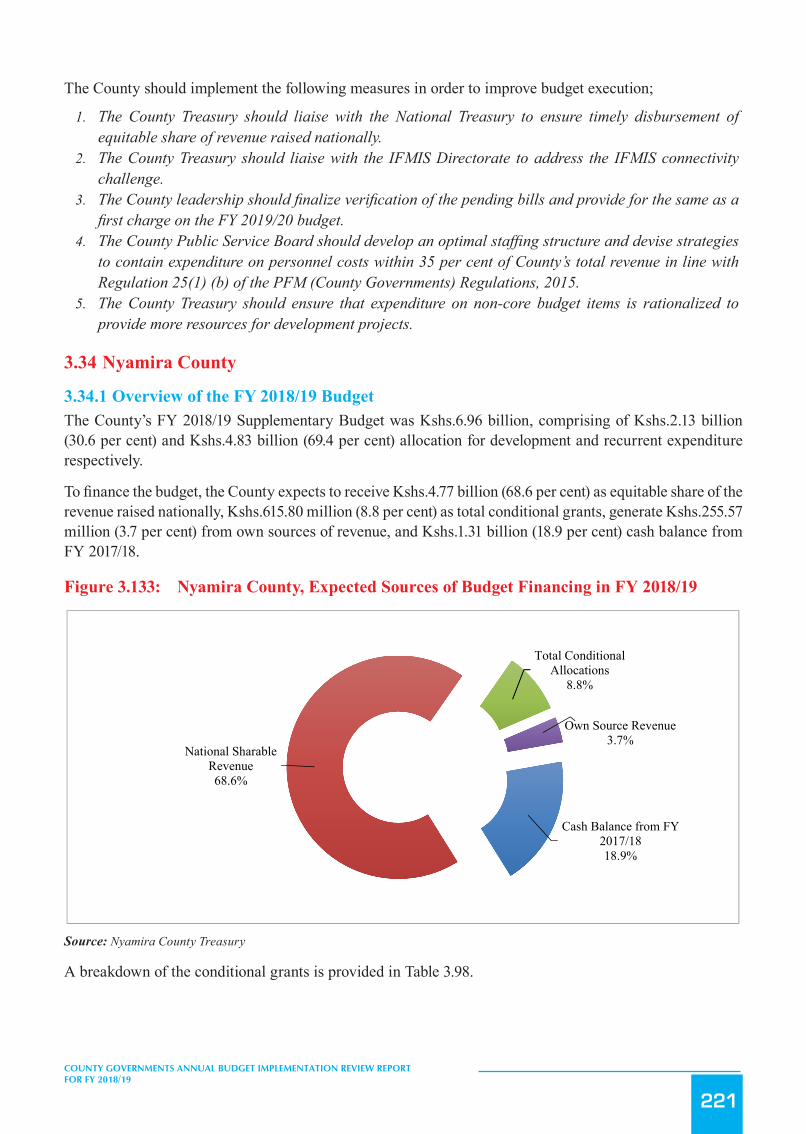
221
COUNTY GOVERNMENTS ANNUAL BUDGET IMPLEMENTATION REVIEW REPORT FOR FY 2018/19
The County should implement the following measures in order to improve budget execution;
1. The County Treasury should liaise with the National Treasury to ensure timely disbursement of equitable share of revenue raised nationally.
2. The County Treasury should liaise with the IFMIS Directorate to address the IFMIS connectivity challenge.
3. The County leadership should finalize verification of the pending bills and provide for the same as a first charge on the FY 2019/20 budget.
4. The County Public Service Board should develop an optimal staffing structure and devise strategies to contain expenditure on personnel costs within 35 per cent of County’s total revenue in line with Regulation 25(1) (b) of the PFM (County Governments) Regulations, 2015.
5. The County Treasury should ensure that expenditure on non-core budget items is rationalized to provide more resources for development projects.
3.34 Nyamira County
3.34.1 Overview of the FY 2018/19 BudgetThe County’s FY 2018/19 Supplementary Budget was Kshs.6.96 billion, comprising of Kshs.2.13 billion (30.6 per cent) and Kshs.4.83 billion (69.4 per cent) allocation for development and recurrent expenditure respectively.
To finance the budget, the County expects to receive Kshs.4.77 billion (68.6 per cent) as equitable share of the revenue raised nationally, Kshs.615.80 million (8.8 per cent) as total conditional grants, generate Kshs.255.57 million (3.7 per cent) from own sources of revenue, and Kshs.1.31 billion (18.9 per cent) cash balance from FY 2017/18.
Figure 3.133: Nyamira County, Expected Sources of Budget Financing in FY 2018/19
258
5. High expenditure on foreign and domestic travel, which increased by187.4 per cent from Kshs.166.49 million in
FY 2017/18 to Kshs.478.57 million in the reporting period.
The County should implement the following measures in order to improve budget execution; 1. The County Treasury should liaise with the National Treasury to ensure timely disbursement of equitable share of
revenue raised nationally.
2. The County Treasury should liaise with the IFMIS Directorate to address the IFMIS connectivity challenge.
3. The County leadership should finalize verification of the pending bills and provide for the same as a first charge
on the FY 2019/20 budget.
4. The County Public Service Board should develop an optimal staffing structure and devise strategies to contain
expenditure on personnel costs within 35 per cent of County’s total revenue in line with Regulation 25(1) (b) of the
PFM (County Governments) Regulations, 2015.
5. The County Treasury should ensure that expenditure on non-core budget items is rationalized to provide more
resources for development projects.
3.34 Nyamira County
3.34.1 Overview of the FY 2018/19 Budget The County’s FY 2018/19 Supplementary Budget was Kshs.6.96 billion, comprising of Kshs.2.13 billion (30.6 per
cent) and Kshs.4.83 billion (69.4 per cent) allocation for development and recurrent expenditure respectively.
To finance the budget, the County expects to receive Kshs.4.77 billion (68.6 per cent) as equitable share of the revenue
raised nationally, Kshs.615.80 million (8.8 per cent) as total conditional grants, generate Kshs.255.57 million (3.7 per
cent) from own sources of revenue, and Kshs.1.31 billion (18.9 per cent) cash balance from FY 2017/18.
Figure 3.133: Nyamira County, Expected Sources of Budget Financing in FY 2018/19
Source: Nyamira County Treasury
A breakdown of the conditional grants is provided in Table 3.98.
Cash Balance from FY 2017/1818.9%
National Sharable Revenue68.6%
Total Conditional Allocations
8.8%
Own Source Revenue3.7%
Source: Nyamira County Treasury
A breakdown of the conditional grants is provided in Table 3.98.
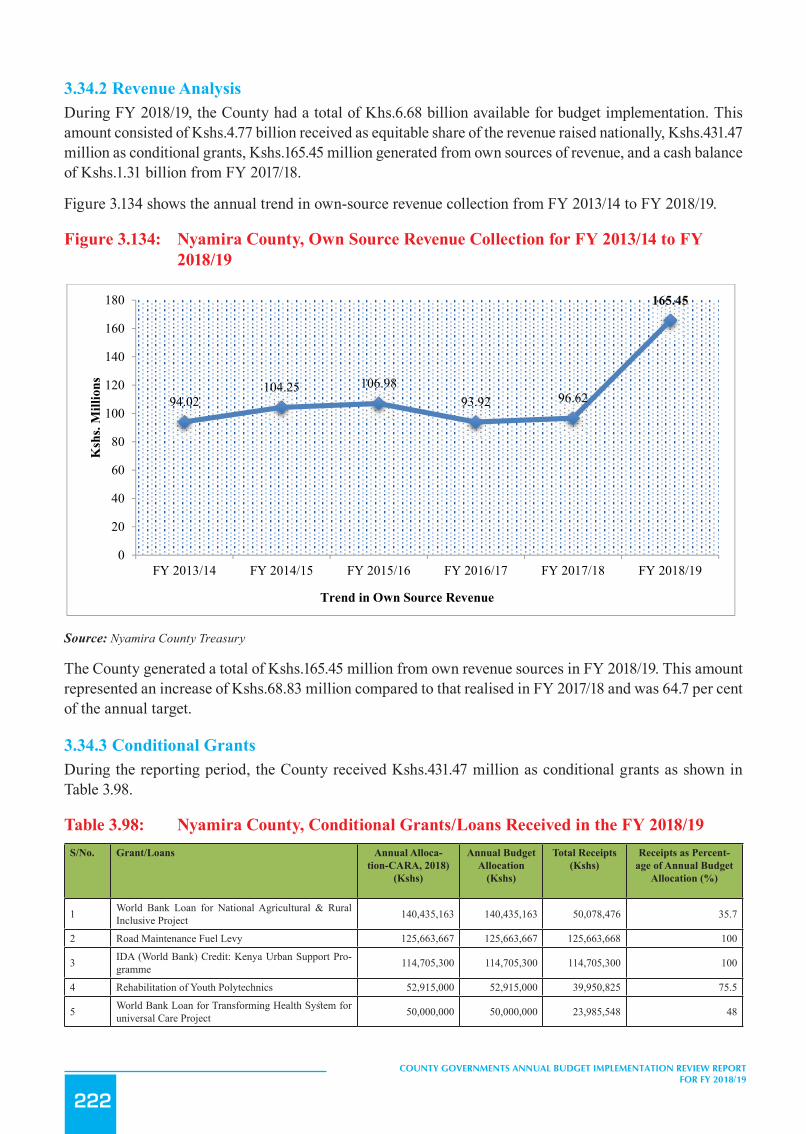
222
COUNTY GOVERNMENTS ANNUAL BUDGET IMPLEMENTATION REVIEW REPORT FOR FY 2018/19
3.34.2 Revenue AnalysisDuring FY 2018/19, the County had a total of Khs.6.68 billion available for budget implementation. This amount consisted of Kshs.4.77 billion received as equitable share of the revenue raised nationally, Kshs.431.47 million as conditional grants, Kshs.165.45 million generated from own sources of revenue, and a cash balance of Kshs.1.31 billion from FY 2017/18.
Figure 3.134 shows the annual trend in own-source revenue collection from FY 2013/14 to FY 2018/19.
Figure 3.134: Nyamira County, Own Source Revenue Collection for FY 2013/14 to FY 2018/19
259
3.34.2 Revenue Analysis During FY 2018/19, the County had a total of Khs.6.68 billion available for budget implementation. This amount
consisted of Kshs.4.77 billion received as equitable share of the revenue raised nationally, Kshs.431.47 million as
conditional grants, Kshs.165.45 million generated from own sources of revenue, and a cash balance of Kshs.1.31 billion
from FY 2017/18.
Figure 3.134 shows the annual trend in own-source revenue collection from FY 2013/14 to FY 2018/19.
Figure 3.134: Nyamira County, Own Source Revenue Collection for FY 2013/14 to FY 2018/19
Source: Nyamira County Treasury
The County generated a total of Kshs.165.45 million from own revenue sources in FY 2018/19. This amount
represented an increase of Kshs.68.83 million compared to that realised in FY 2017/18 and was 64.7 per cent of the
annual target.
3.34.3 Conditional Grants During the reporting period, the County received Kshs.431.47 million as conditional grants as shown in Table 3.98.
Table 3.98: Nyamira County, Conditional Grants/Loans Received in the FY 2018/19
S/No. Grant/Loans Annual Allocation-CARA, 2018) (Kshs)
Annual Budget Allocation (Kshs)
Total Receipts (Kshs)
Receipts as Percentage of Annual Budget Allocation (%)
1 World Bank Loan for National Agricultural & Rural Inclusive Project 140,435,163 140,435,163 50,078,476 35.7
2 Road Maintenance Fuel Levy 125,663,667 125,663,667 125,663,668 100
3 IDA (World Bank) Credit: Kenya Urban Support Programme 114,705,300 114,705,300 114,705,300 100
94.02104.25 106.98
93.92 96.62
165.45
0
20
40
60
80
100
120
140
160
180
FY 2013/14 FY 2014/15 FY 2015/16 FY 2016/17 FY 2017/18 FY 2018/19
Ksh
s. M
illio
ns
Trend in Own Source Revenue
Source: Nyamira County Treasury
The County generated a total of Kshs.165.45 million from own revenue sources in FY 2018/19. This amount represented an increase of Kshs.68.83 million compared to that realised in FY 2017/18 and was 64.7 per cent of the annual target.
3.34.3 Conditional GrantsDuring the reporting period, the County received Kshs.431.47 million as conditional grants as shown in Table 3.98.
Table 3.98: Nyamira County, Conditional Grants/Loans Received in the FY 2018/19S/No. Grant/Loans Annual Alloca-
tion-CARA, 2018)(Kshs)
Annual Budget Allocation
(Kshs)
Total Receipts (Kshs)
Receipts as Percent-age of Annual Budget
Allocation (%)
1 World Bank Loan for National Agricultural & Rural Inclusive Project 140,435,163 140,435,163 50,078,476 35.7
2 Road Maintenance Fuel Levy 125,663,667 125,663,667 125,663,668 100
3 IDA (World Bank) Credit: Kenya Urban Support Pro-gramme 114,705,300 114,705,300 114,705,300 100
4 Rehabilitation of Youth Polytechnics 52,915,000 52,915,000 39,950,825 75.5
5 World Bank Loan for Transforming Health System for universal Care Project 50,000,000 50,000,000 23,985,548 48
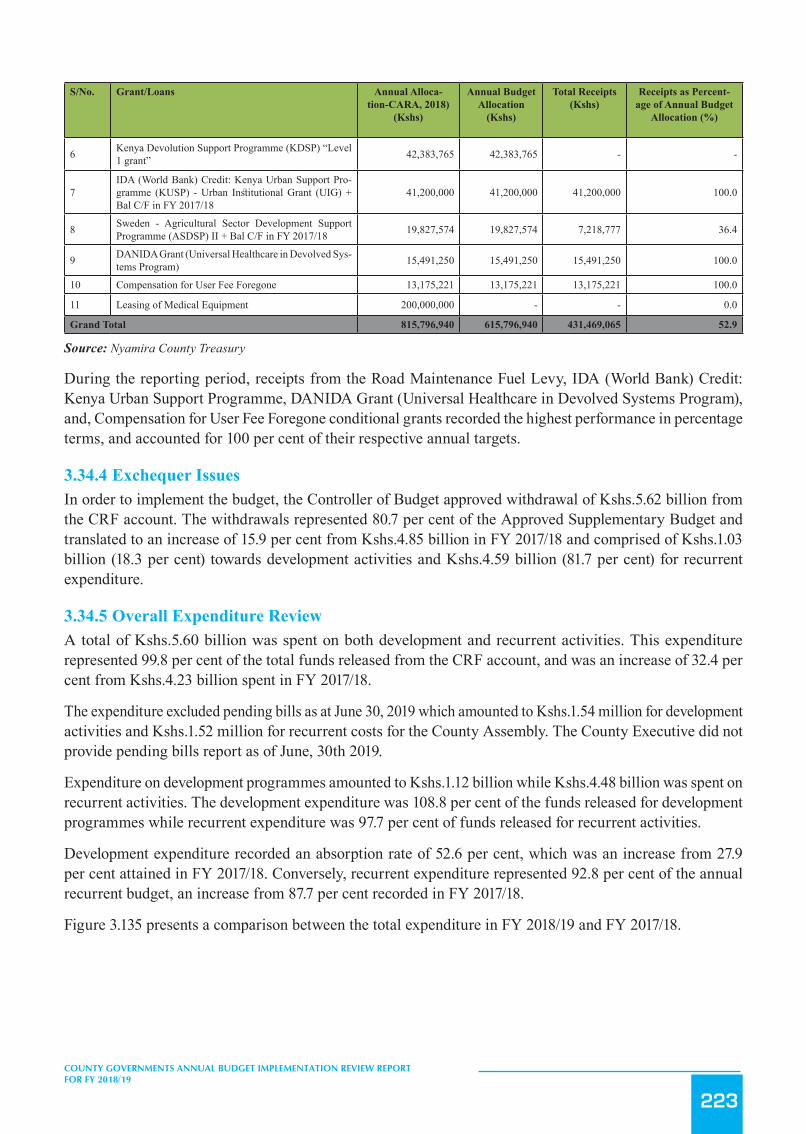
223
COUNTY GOVERNMENTS ANNUAL BUDGET IMPLEMENTATION REVIEW REPORT FOR FY 2018/19
S/No. Grant/Loans Annual Alloca-tion-CARA, 2018)
(Kshs)
Annual Budget Allocation
(Kshs)
Total Receipts (Kshs)
Receipts as Percent-age of Annual Budget
Allocation (%)
6 Kenya Devolution Support Programme (KDSP) “Level 1 grant” 42,383,765 42,383,765 - -
7IDA (World Bank) Credit: Kenya Urban Support Pro-gramme (KUSP) - Urban Institutional Grant (UIG) + Bal C/F in FY 2017/18
41,200,000 41,200,000 41,200,000 100.0
8 Sweden - Agricultural Sector Development Support Programme (ASDSP) II + Bal C/F in FY 2017/18 19,827,574 19,827,574 7,218,777 36.4
9 DANIDA Grant (Universal Healthcare in Devolved Sys-tems Program) 15,491,250 15,491,250 15,491,250 100.0
10 Compensation for User Fee Foregone 13,175,221 13,175,221 13,175,221 100.0
11 Leasing of Medical Equipment 200,000,000 - - 0.0
Grand Total 815,796,940 615,796,940 431,469,065 52.9
Source: Nyamira County Treasury
During the reporting period, receipts from the Road Maintenance Fuel Levy, IDA (World Bank) Credit: Kenya Urban Support Programme, DANIDA Grant (Universal Healthcare in Devolved Systems Program), and, Compensation for User Fee Foregone conditional grants recorded the highest performance in percentage terms, and accounted for 100 per cent of their respective annual targets.
3.34.4 Exchequer IssuesIn order to implement the budget, the Controller of Budget approved withdrawal of Kshs.5.62 billion from the CRF account. The withdrawals represented 80.7 per cent of the Approved Supplementary Budget and translated to an increase of 15.9 per cent from Kshs.4.85 billion in FY 2017/18 and comprised of Kshs.1.03 billion (18.3 per cent) towards development activities and Kshs.4.59 billion (81.7 per cent) for recurrent expenditure.
3.34.5 Overall Expenditure ReviewA total of Kshs.5.60 billion was spent on both development and recurrent activities. This expenditure represented 99.8 per cent of the total funds released from the CRF account, and was an increase of 32.4 per cent from Kshs.4.23 billion spent in FY 2017/18.
The expenditure excluded pending bills as at June 30, 2019 which amounted to Kshs.1.54 million for development activities and Kshs.1.52 million for recurrent costs for the County Assembly. The County Executive did not provide pending bills report as of June, 30th 2019.
Expenditure on development programmes amounted to Kshs.1.12 billion while Kshs.4.48 billion was spent on recurrent activities. The development expenditure was 108.8 per cent of the funds released for development programmes while recurrent expenditure was 97.7 per cent of funds released for recurrent activities.
Development expenditure recorded an absorption rate of 52.6 per cent, which was an increase from 27.9 per cent attained in FY 2017/18. Conversely, recurrent expenditure represented 92.8 per cent of the annual recurrent budget, an increase from 87.7 per cent recorded in FY 2017/18.
Figure 3.135 presents a comparison between the total expenditure in FY 2018/19 and FY 2017/18.

224
COUNTY GOVERNMENTS ANNUAL BUDGET IMPLEMENTATION REVIEW REPORT FOR FY 2018/19
Figure3.135: NyamiraCounty,ExpenditurebyEconomicClassification
261
Figure 3.135: Nyamira County, Expenditure by Economic Classification
Source: Nyamira County Treasury
3.34.6 Development Expenditure Analysis The total development expenditure of Kshs.1.12 billion represents 52.6 per cent of the annual development expenditure
estimates of Kshs.2.13 billion. Table 3.99 provides a summary of development projects with the highest expenditure in
the financial year.
Table 3.99: Nyamira County, List of Development Projects with the Highest Expenditure in FY 2018/19
S/No. Project Name Project Location Project Budget
Project Expenditure in FY 2018/19 (Kshs.)
Absorption Rate (%)
1 Proposed Construction and Completion of Nyamira County Head Quarters Township 382,970,401 32,600,000 8.5
2 Proposed Construction of Amenity Block with the Doctor's Plaza at Nyamira Referral (Female and Male Wards) Township 142,319,154 25,921,364 18.2
3 Hire of Equipment and Mechanical Services from the Mechanical Transport Fund for road construction across the County
County Wide 100,000,000 99,801,500 99.8
4 Youth Polytechnic Education Support Programme in Collaboration with the Ministry of Education (National Government)
County Wide 52,915,950 25,410,000 48
5 Supply, Delivery, Customization, Commissioning & Maintenance of Revenue Collection Automation in the County County wide 50,000,000 14,030,000 28.1
6 Construction of 6th Floor Office Block for MCAs and Staff Phase II
Nyamira Town HQs 47,092,269 44,091,179 93.6
7 Proposed Delivery, Installation, Testing and Commissioning of Medical Oxygen Generating Plant at Nyamira County Referral Hospital
Township 26,000,000 26,000,000 100
8 Proposed Construction and Completion of Kiabonyoru 1 Water Supply Kiabonyoru 22,181,629 15,583,978 70.3
9 Supply of Fuel for Roads Construction works across the County County Wide 16,110,000 13,530,000 84.0
10 Supply, Delivery, Installation, Commissioning, and Maintenance of Solar Powered Street Lighting within the County
County Wide 14,783,040 14,783,040 100
2,622.0462.0%
1,081.4225.6%
527.6612.5%
3,137.3456.0%
1,344.4424.0% 1,120.56
20.0%
-
500
1,000
1,500
2,000
2,500
3,000
3,500
Personnel Emoluments Operations and Maintenance Development Expenditure
Ksh
s.Mill
ion
Expenditure by Economic Classification
FY 2017/18
FY 2018/19
Source: Nyamira County Treasury
3.34.6 Development Expenditure AnalysisThe total development expenditure of Kshs.1.12 billion represents 52.6 per cent of the annual development expenditure estimates of Kshs.2.13 billion. Table 3.99 provides a summary of development projects with the highest expenditure in the financial year.
Table 3.99: Nyamira County, List of Development Projects with the Highest Expenditure in FY 2018/19
S/No. Project Name Project Location Project Budget
Project Ex-penditure in FY 2018/19 (Kshs.)
Absorption Rate (%)
1 Proposed Construction and Completion of Nyamira County Head Quarters Township 382,970,401 32,600,000 8.5
2 Proposed Construction of Amenity Block with the Doctor’s Pla-za at Nyamira Referral (Female and Male Wards) Township 142,319,154 25,921,364 18.2
3 Hire of Equipment and Mechanical Services from the Mechani-cal Transport Fund for road construction across the County County Wide 100,000,000 99,801,500 99.8
4 Youth Polytechnic Education Support Programme in Collabora-tion with the Ministry of Education (National Government) County Wide 52,915,950 25,410,000 48
5 Supply, Delivery, Customization, Commissioning & Mainte-nance of Revenue Collection Automation in the County County wide 50,000,000 14,030,000 28.1
6 Construction of 6th Floor Office Block for MCAs and Staff Phase II
Nyamira Town HQs 47,092,269 44,091,179 93.6
7Proposed Delivery, Installation, Testing and Commissioning of Medical Oxygen Generating Plant at Nyamira County Referral Hospital
Township 26,000,000 26,000,000 100
8 Proposed Construction and Completion of Kiabonyoru 1 Water Supply Kiabonyoru 22,181,629 15,583,978 70.3

225
COUNTY GOVERNMENTS ANNUAL BUDGET IMPLEMENTATION REVIEW REPORT FOR FY 2018/19
S/No. Project Name Project Location Project Budget
Project Ex-penditure in FY 2018/19 (Kshs.)
Absorption Rate (%)
9 Supply of Fuel for Roads Construction works across the County County Wide 16,110,000 13,530,000 84.0
10 Supply, Delivery, Installation, Commissioning, and Maintenance of Solar Powered Street Lighting within the County County Wide 14,783,040 14,783,040 100
Source: Nyamira County Treasury
3.34.7 Analysis of Recurrent ExpenditureThe total recurrent expenditure of Kshs.4.48 billion comprised of Kshs.3.14 billion (70 per cent) incurred on personnel emoluments and Kshs.1.34 billion (30 per cent) on operations and maintenance as shown Figure 3.135.
Expenditure on personnel emoluments represented an increase of 19.7 per cent compared to FY 2017/18 when the County spent Kshs.2.62 billion and was 56 per cent of the total expenditure in FY 2018/19. Figure 3.136 shows a summary of operations and maintenance expenditure by major categories.
Figure 3.136: Nyamira County, Operations and Maintenance Expenditure by Major Categories in FY 2018/19
262
Source: Nyamira County Treasury
3.34.7 Analysis of Recurrent Expenditure The total recurrent expenditure of Kshs.4.48 billion comprised of Kshs.3.14 billion (70 per cent) incurred on personnel
emoluments and Kshs.1.34 billion (30 per cent) on operations and maintenance as shown Figure 3.135.
Expenditure on personnel emoluments represented an increase of 19.7 per cent compared to FY 2017/18 when the
County spent Kshs.2.62 billion and was 56 per cent of the total expenditure in FY 2018/19. Figure 3.136 shows a
summary of operations and maintenance expenditure by major categories.
Figure 3.136: Nyamira County, Operations and Maintenance Expenditure by Major Categories in FY 2018/19
Source: Nyamira County Treasury
The County spent Kshs.66.64 million on committee sitting allowances for the 36 MCAs and Speaker against the annual
budget allocation of Kshs.66.64 million. This represented an increase of 109.6 per cent compared to Kshs.31.80 million
spent in FY 2017/18. The average monthly sitting allowance translated to Kshs.150,097 per MCA against the SRC’s
recommended monthly ceiling of Kshs.124,800.
Expenditure on domestic and foreign travel amounted to Kshs.391.37 million, and comprised of Kshs.147.61 million
spent by the County Assembly and Kshs.243.75 million by the County Executive. This expenditure represented 8.7 per
cent of total recurrent expenditure and was an increase of 40 per cent compared to Kshs.280.24 million spent in FY
2017/18.
330.38
184.15 184.02
131.50117.12 109.73
95.0066.64 64.90 60.98
0
50
100
150
200
250
300
350
Ksh
s. M
illio
n
Major Categories of Operations & Maintenance
Source: Nyamira County Treasury
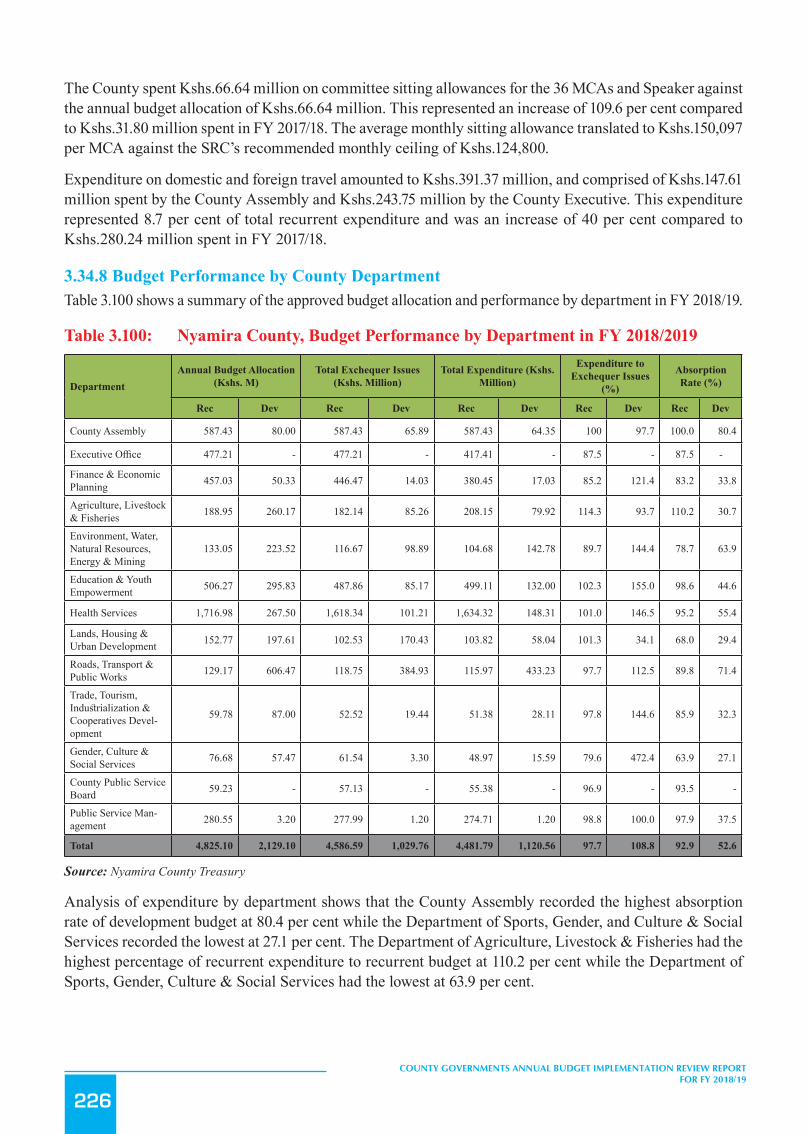
226
COUNTY GOVERNMENTS ANNUAL BUDGET IMPLEMENTATION REVIEW REPORT FOR FY 2018/19
The County spent Kshs.66.64 million on committee sitting allowances for the 36 MCAs and Speaker against the annual budget allocation of Kshs.66.64 million. This represented an increase of 109.6 per cent compared to Kshs.31.80 million spent in FY 2017/18. The average monthly sitting allowance translated to Kshs.150,097 per MCA against the SRC’s recommended monthly ceiling of Kshs.124,800.
Expenditure on domestic and foreign travel amounted to Kshs.391.37 million, and comprised of Kshs.147.61 million spent by the County Assembly and Kshs.243.75 million by the County Executive. This expenditure represented 8.7 per cent of total recurrent expenditure and was an increase of 40 per cent compared to Kshs.280.24 million spent in FY 2017/18.
3.34.8 Budget Performance by County DepartmentTable 3.100 shows a summary of the approved budget allocation and performance by department in FY 2018/19.
Table 3.100: Nyamira County, Budget Performance by Department in FY 2018/2019
DepartmentAnnual Budget Allocation
(Kshs. M)Total Exchequer Issues
(Kshs. Million)Total Expenditure (Kshs.
Million)
Expenditure to Exchequer Issues
(%)
Absorption Rate (%)
Rec Dev Rec Dev Rec Dev Rec Dev Rec Dev
County Assembly 587.43 80.00 587.43 65.89 587.43 64.35 100 97.7 100.0 80.4
Executive Office 477.21 - 477.21 - 417.41 - 87.5 - 87.5 -
Finance & Economic Planning 457.03 50.33 446.47 14.03 380.45 17.03 85.2 121.4 83.2 33.8
Agriculture, Livestock & Fisheries 188.95 260.17 182.14 85.26 208.15 79.92 114.3 93.7 110.2 30.7
Environment, Water, Natural Resources, Energy & Mining
133.05 223.52 116.67 98.89 104.68 142.78 89.7 144.4 78.7 63.9
Education & Youth Empowerment 506.27 295.83 487.86 85.17 499.11 132.00 102.3 155.0 98.6 44.6
Health Services 1,716.98 267.50 1,618.34 101.21 1,634.32 148.31 101.0 146.5 95.2 55.4
Lands, Housing & Urban Development 152.77 197.61 102.53 170.43 103.82 58.04 101.3 34.1 68.0 29.4
Roads, Transport & Public Works 129.17 606.47 118.75 384.93 115.97 433.23 97.7 112.5 89.8 71.4
Trade, Tourism, Industrialization & Cooperatives Devel-opment
59.78 87.00 52.52 19.44 51.38 28.11 97.8 144.6 85.9 32.3
Gender, Culture & Social Services 76.68 57.47 61.54 3.30 48.97 15.59 79.6 472.4 63.9 27.1
County Public Service Board 59.23 - 57.13 - 55.38 - 96.9 - 93.5 -
Public Service Man-agement 280.55 3.20 277.99 1.20 274.71 1.20 98.8 100.0 97.9 37.5
Total 4,825.10 2,129.10 4,586.59 1,029.76 4,481.79 1,120.56 97.7 108.8 92.9 52.6
Source: Nyamira County Treasury
Analysis of expenditure by department shows that the County Assembly recorded the highest absorption rate of development budget at 80.4 per cent while the Department of Sports, Gender, and Culture & Social Services recorded the lowest at 27.1 per cent. The Department of Agriculture, Livestock & Fisheries had the highest percentage of recurrent expenditure to recurrent budget at 110.2 per cent while the Department of Sports, Gender, Culture & Social Services had the lowest at 63.9 per cent.

227
COUNTY GOVERNMENTS ANNUAL BUDGET IMPLEMENTATION REVIEW REPORT FOR FY 2018/19
3.34.9 Key Observations and RecommendationsThe County has made progress in addressing some of the challenges previously identified as affecting budget implementation. Some of the progress made included:
i. Improvement in the performance of own-source revenue by 71.2 per cent when compared to Kshs.96.62 million realised in FY 2017/18.
ii. Improvement in the absorption of development budget by 112.4 per cent from Kshs.527.66 million in FY 2017/18 to Kshs.1.12 billion in the reporting period.
Despite the above progress, the following challenges continued to hamper effective budget implementation;
1. A high wage bill that increased by 19.7 per cent from Kshs.2.62 billion in FY 2017/18 to Kshs.3.14 billion in the reporting period. The wage bill accounted for 56 per cent of total expenditure in the reporting period.
2. The average monthly MCAs sitting allowance translated to Kshs.150,097 per MCA against the SRC’s recommended monthly ceiling of Kshs.124,800.
3. Delay in disbursement of the equitable share of revenue raised nationally by the National Treasury.4. IFMIS connectivity challenges, which slowed down approval of procurement requests and payment
to suppliers.5. Failure by the County to provide a detailed report on pending bills as of the end of the financial year.6. Inadequate budgetary control that resulted in expenditure above approved budget by the Department
of Agriculture, Livestock & Fisheries. This is contrary to Section 135 and 154 of PFM Act, 2012.
The County should implement the following measures in order to improve budget execution;
1. The County Public Service Board should develop an optimal staffing structure and devise strategies to contain expenditure on personnel costs within 35 per cent of County’s total revenue in line with Regulation 25(1) (b) of the PFM (County Governments) Regulations, 2015.
2. The County Assembly should ensure the MCAs sitting allowance is within the SRC set ceiling.3. The County Treasury should liaise with the National Treasury to ensure that funds are released in a
timely manner.4. The County Treasury should liaise with the IFMIS Directorate to address connectivity challenges.5. The County Treasury should provide a report on status of pending bills as at 30th June, 2019 as
requested by the Controller of Budget in line with COB Act, 2016.6. The County Treasury should ensure expenditure is within the approved budget.
3.35 Nyandarua County
3.35.1 Overview of the FY 2018/19 BudgetThe County’s FY 2018/19 Second Supplementary Budget was Kshs.7.67 billion, comprising of Kshs.3.17 billion (41.3 per cent) and Kshs.4.5 billion (58.7 per cent) allocation for development and recurrent expenditure respectively.
To finance the budget, the County expects to receive Kshs.4.93 billion (64.3 per cent) as equitable share of revenue raised nationally, Kshs.1.37 billion (17.2 per cent) as total conditional grants, generate Kshs.410 million (5.3 per cent) from own-source of revenue, Kshs.51.27 million (0.7 per cent) as other expected revenues, and Kshs.959.84 million (12.5 per cent) cash balance from FY 2017/18.

228
COUNTY GOVERNMENTS ANNUAL BUDGET IMPLEMENTATION REVIEW REPORT FOR FY 2018/19
Figure 3.137: Nyandarua County, Expected Sources of Budget Financing in FY 2018/19
265
Source: Nyandarua County Treasury
A breakdown of the conditional grants is provided in Table 3.101.
3.35.2 Revenue Analysis During FY 2018/19, the County had a total of Khs.7.01 billion available for budget implementation. This amount
consisted of Kshs.4.93 billion received as equitable share of the revenue raised nationally, Kshs.721.89 million as
conditional grants, Kshs.403.4 million generated from own sources of revenue, and a cash balance of Kshs.959.84
million from FY 2017/18.
Figure 3.138 shows the trend in annual own-source revenue collection from FY 2013/14 to FY 2018/19.
Figure 3.138: Nyandarua County, Own Source Revenue Collection for FY 2013/14 to FY 2018/19
Source: Nyandarua County Treasury
Cash Balance from FY 2017/1812.5%
National Sharable Revenue64.3%
Total Conditional Allocations
17.2%
Own Source Revenue5.3% Other Revenues
Expected During the year0.7%
138.44
240.63
279.23296.77
318.59
403.40
0
50
100
150
200
250
300
350
400
450
FY 2013/14 FY 2014/15 FY 2015/16 FY 2016/17 FY 2017/18 FY 2018/19
Ksh
s. M
illio
ns
Trend in Own Source Revenue
Source: Nyandarua County Treasury
A breakdown of the conditional grants is provided in Table 3.101.
3.35.2 Revenue AnalysisDuring FY 2018/19, the County had a total of Khs.7.01 billion available for budget implementation. This amount consisted of Kshs.4.93 billion received as equitable share of the revenue raised nationally, Kshs.721.89 million as conditional grants, Kshs.403.4 million generated from own sources of revenue, and a cash balance of Kshs.959.84 million from FY 2017/18.
Figure 3.138 shows the trend in annual own-source revenue collection from FY 2013/14 to FY 2018/19.

229
COUNTY GOVERNMENTS ANNUAL BUDGET IMPLEMENTATION REVIEW REPORT FOR FY 2018/19
Figure 3.138: Nyandarua County, Own Source Revenue Collection for FY 2013/14 to FY 2018/19
265
Source: Nyandarua County Treasury
A breakdown of the conditional grants is provided in Table 3.101.
3.35.2 Revenue Analysis During FY 2018/19, the County had a total of Khs.7.01 billion available for budget implementation. This amount
consisted of Kshs.4.93 billion received as equitable share of the revenue raised nationally, Kshs.721.89 million as
conditional grants, Kshs.403.4 million generated from own sources of revenue, and a cash balance of Kshs.959.84
million from FY 2017/18.
Figure 3.138 shows the trend in annual own-source revenue collection from FY 2013/14 to FY 2018/19.
Figure 3.138: Nyandarua County, Own Source Revenue Collection for FY 2013/14 to FY 2018/19
Source: Nyandarua County Treasury
Cash Balance from FY 2017/1812.5%
National Sharable Revenue64.3%
Total Conditional Allocations
17.2%
Own Source Revenue5.3% Other Revenues
Expected During the year0.7%
138.44
240.63
279.23296.77
318.59
403.40
0
50
100
150
200
250
300
350
400
450
FY 2013/14 FY 2014/15 FY 2015/16 FY 2016/17 FY 2017/18 FY 2018/19
Ksh
s. M
illio
ns
Trend in Own Source Revenue
Source: Nyandarua County Treasury
The County generated a total of Kshs.403.4 million from own revenue sources in FY 2018/19. This amount represented an increaseof Kshs.84.82 million compared to that realised in FY 2017/18 and was 98.4 per cent of the annual target.
3.35.3 Conditional GrantsDuring the reporting period, the County received Kshs.721.89 million as conditional grants as shown in Table 3.101.
Table 3.101: Nyandarua County, Conditional Grants/Loans Received in the FY 2018/19
S/No Grants
Annual CARA, 2018 Allocation
(in Kshs)
Annual Budget Allocation (in
Kshs)
Actual receipts in the FY
2018/19 (in Kshs.)
Actual Receipts as Percentage of
Annual Allocation (%)
A Grants Contained in the CARA, 2018
1 Supplement for Construction of County Headquarters 121,000,000 121,000,000 - -
2 Compensation for User Fee Foregone 12,735,922 12,735,922 12,735,922 100
3 Leasing of Medical Equipment 200,000,000 200,000,000 - -
4 Road Maintenance Fuel Levy Fund 129,797,341 129,797,341 129,797,341 100
5 Rehabilitation of Village Polytechnics 39,700,000 39,700,000 - -
6 Transforming Health Systems for Universal Care Project (World Bank) 50,000,000 50,000,000 17,501,836 35
7 IDA (World Bank) -Kenya Climate Smart Agriculture Project (KCSAP) 117,000,000 117,000,000 37,877,017 32
8 IDA (World Bank) Kenya Devolution Support Programme “Level 1 grant” 43,069,316 43,069,316 - -
9 IDA (World Bank) -Kenya Urban Support Project (KUSP) 135,543,400 135,543,400 135,543,400 100
10 DANIDA - Universal Healthcare in Devolved System Programme 15,997,500 15,997,500 15,997,500 100
11 EU Grant- Instruments for Devolution Advice and Support- IDEAS) 45,000,000 78,766,766 78,775,576 175
12Kenya Devolution Support Programme “Level 2 grant” Bal C/F in FY 2017/18 - 282,647,811 254,280,493 -
13Sweden - Agriculture Sector Development Support Programme (ASDSP) II + Bal C/F in FY 2017/18
18,522,640 18,522,640 6,743,680 36

230
COUNTY GOVERNMENTS ANNUAL BUDGET IMPLEMENTATION REVIEW REPORT FOR FY 2018/19
S/No Grants
Annual CARA, 2018 Allocation
(in Kshs)
Annual Budget Allocation (in
Kshs)
Actual receipts in the FY
2018/19 (in Kshs.)
Actual Receipts as Percentage of
Annual Allocation (%)
14IDA (World Bank) credit: Kenya Urban Support Project (KUSP) - Urban Institutional Grants (UIG) + Bal C/F in FY 2017/18
41,200,000 41,200,000 -
15 Road Maintenance Fuel Levy Bal C/F in FY 2017/18 - 32,641,949 32,641,949 -
Sub Total 969,566,119 1,318,622,645 721,894,714 74
B Other Grants
16 Rehabilitation of Village Polytechnics Bal C/F 2017/18 - 21,274,457 -
17 Linda Mama - 30,000,000 -
Sub Total - 51,274,457 - -
Grand Total 969,566,119.0 1,369,897,102.0 721,894,714.0 74
Source: Nyandarua County Treasury
During the reporting period, the County Government received a grant from the European Union towards the Instrument for Devolution Advice and Support project which recorded the highest performance in percentage terms accounting for 175 per cent of the annual target.
3.35.4 Exchequer IssuesIn order to implement the budget, the Controller of Budget approved withdrawal of Kshs.5.69 billion from the CRF account. The withdrawals represented 74.2 per cent of the Approved Supplementary Budget and translated to an increase of 18.3 per cent from Kshs.4.81 billion in FY 2017/18 and comprised of Kshs.1.68 billion (29.5 per cent) towards development activities and Kshs.4.01 billion (70.5 per cent) for recurrent expenditure.
3.35.5 Overall Expenditure ReviewA total of Kshs.5.48 billion was spent on both development and recurrent activities. This expenditure represented 96.2 per cent of the total funds released from the CRF account, and was an increase of 20.5 per cent from Kshs.4.54 billion spent in FY 2017/18.
The expenditure excluded pending bills as at June 30, 2019 which amounted to Kshs.718.07 million for development activities and Kshs.93.12 million for recurrent costs.
Expenditure on development programmes amounted to Kshs.1.58 billion while Kshs.3.89 billion was spent on recurrent activities. The development expenditure was 94.3 per cent of the funds released for development programmes, while recurrent expenditure was 97.0 per cent of funds released for recurrent activities.
Development expenditure recorded an absorption rate of 50 per cent, which was an increase from 44.2 per cent attained in FY 2017/18. Conversely, recurrent expenditure represented 86.5 per cent of the annual recurrent budget, a decrease from 89.4 per cent recorded in FY 2017/18.
Figure 3.139 presents a comparison between the total expenditure in FY 2018/19and FY 2017/18.

231
COUNTY GOVERNMENTS ANNUAL BUDGET IMPLEMENTATION REVIEW REPORT FOR FY 2018/19
Figure3.139: NyandaruaCounty,ExpenditurebyEconomicClassification
267
3.35.5 Overall Expenditure Review A total of Kshs.5.48 billion was spent on both development and recurrent activities. This expenditure represented 96.2
per cent of the total funds released from the CRF account, and was an increase of 20.5 per cent from Kshs.4.54 billion
spent in FY 2017/18.
The expenditure excluded pending bills as at June 30, 2019 which amounted to Kshs.718.07 million for development
activities and Kshs.93.12 million for recurrent costs.
Expenditure on development programmes amounted to Kshs.1.58 billion while Kshs.3.89 billion was spent on recurrent
activities. The development expenditure was 94.3 per cent of the funds released for development programmes, while
recurrent expenditure was 97.0 per cent of funds released for recurrent activities.
Development expenditure recorded an absorption rate of 50 per cent, which was an increase from 44.2 per cent attained
in FY 2017/18. Conversely, recurrent expenditure represented 86.5 per cent of the annual recurrent budget, a decrease
from 89.4 per cent recorded in FY 2017/18.
Figure 3.139 presents a comparison between the total expenditure in FY 2018/19and FY 2017/18.
Figure 3.139: Nyandarua County, Expenditure by Economic Classification
Source: Nyandarua County Treasury
3.35.6 Development Expenditure Analysis The total development expenditure of Kshs.1.58 billion represented 50 per cent of the annual development expenditure
estimates of Kshs.3.17 billion. Table 3.102 provides a summary of development projects with the highest expenditure in
the financial year.
2,146.22(47.2%)
1,503.12(33.1%)
895.38(19.7%)
2,046.55(37.4% 1,847.42
(33.7%)1,581.90(28.9%)
-
500
1,000
1,500
2,000
2,500
Personnel Emoluments Operations and Maintenance Development Expenditure
Ksh
s.Mill
ion
Expenditure by Economic Classification
FY 2017/18
FY 2018/19
Source: Nyandarua County Treasury
3.35.6 Development Expenditure AnalysisThe total development expenditure of Kshs.1.58 billion represented 50 per cent of the annual development expenditure estimates of Kshs.3.17 billion. Table 3.102 provides a summary of development projects with the highest expenditure in the financial year.
Table 3.102: Nyandarua County, List of Development Projects with the Highest Expenditure in FY 2018/19
S/No. Project Name Project budget (Kshs.)
Project Expendi-ture (Kshs.)
Absorption Rate (%)
1 Construction of an Office Block 186,100,000 119,241,819 64
2 Purchase of a Fire Truck 52,400,000 52,400,000 100
3 Construction of Bus Parks, Parking lots and Drainage 40,000,000 40,000,000 100
4 Other Infrastructure and Civil Works- (Climate Smart Agricultural Projects) 101,170,050 37,877,017 37
5 Upgrading of Olkalou markets and construction of new stalls 30,000,000 30,000,000 100
6 Construction of 20 kilometre Municipal Roads 26,543,400 26,543,400 100
7 Construction of street lighting of roads in Huruma, Jua Kali Estates and Housing Scheme Estates 20,000,000 20,000,000 100
8 Construction of Lands Office 20,000,000 19,724,032 99
9 Input subsidy (fertilizer and seeds) 21,000,000 18,210,000 87
10 County Spatial Plan 15,688,971 15,688,971 100
Source: Nyandarua County Treasury
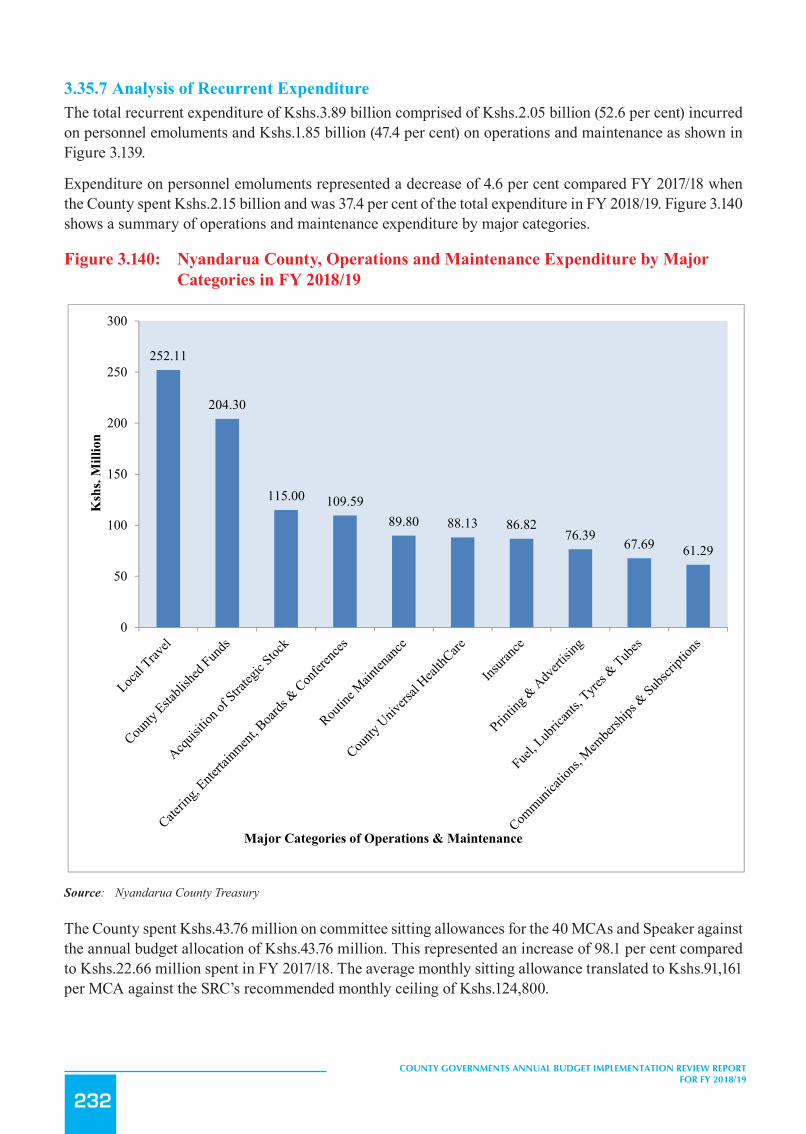
232
COUNTY GOVERNMENTS ANNUAL BUDGET IMPLEMENTATION REVIEW REPORT FOR FY 2018/19
3.35.7 Analysis of Recurrent ExpenditureThe total recurrent expenditure of Kshs.3.89 billion comprised of Kshs.2.05 billion (52.6 per cent) incurred on personnel emoluments and Kshs.1.85 billion (47.4 per cent) on operations and maintenance as shown in Figure 3.139.
Expenditure on personnel emoluments represented a decrease of 4.6 per cent compared FY 2017/18 when the County spent Kshs.2.15 billion and was 37.4 per cent of the total expenditure in FY 2018/19. Figure 3.140 shows a summary of operations and maintenance expenditure by major categories.
Figure 3.140: Nyandarua County, Operations and Maintenance Expenditure by Major Categories in FY 2018/19
269
Source: Nyandarua County Treasury
The County spent Kshs.43.76 million on committee sitting allowances for the 40 MCAs and Speaker against the annual
budget allocation of Kshs.43.76 million. This represented an increase of 98.1 per cent compared to Kshs.22.66 million
spent in FY 2017/18. The average monthly sitting allowance translated to Kshs.91,161 per MCA against the SRC’s
recommended monthly ceiling of Kshs.124,800.
Expenditure on domestic and foreign travel amounted to Kshs.292.1 million, and comprised of Kshs.97.51 million spent
by the County Assembly and Kshs.194.59 million by the County Executive. This expenditure represented 5.3 per cent of
total recurrent expenditure and was an increase of 48.1 per cent compared to Kshs.151.69 million spent in FY 2017/18.
3.35.8 Budget Performance by County Department Table 3.103 shows a summary of the approved budget allocation and performance by department in FY 2018/19.
Table 3.103: Nyandarua County, Budget Performance by Department in the FY 2018/19
Department Budget Allocation (Kshs. Million)
Exchequer Issues (Kshs. Million)
Total Expenditure (Kshs. Million)
Expenditure to Exchequer Issues (%)
Absorption Rate (%)
Rec Dev Rec Dev Rec Dev Rec Dev Rec Dev
252.11
204.30
115.00 109.5989.80 88.13 86.82
76.39 67.69 61.29
0
50
100
150
200
250
300
Ksh
s. M
illio
n
Major Categories of Operations & Maintenance
Source: Nyandarua County Treasury
The County spent Kshs.43.76 million on committee sitting allowances for the 40 MCAs and Speaker against the annual budget allocation of Kshs.43.76 million. This represented an increase of 98.1 per cent compared to Kshs.22.66 million spent in FY 2017/18. The average monthly sitting allowance translated to Kshs.91,161 per MCA against the SRC’s recommended monthly ceiling of Kshs.124,800.
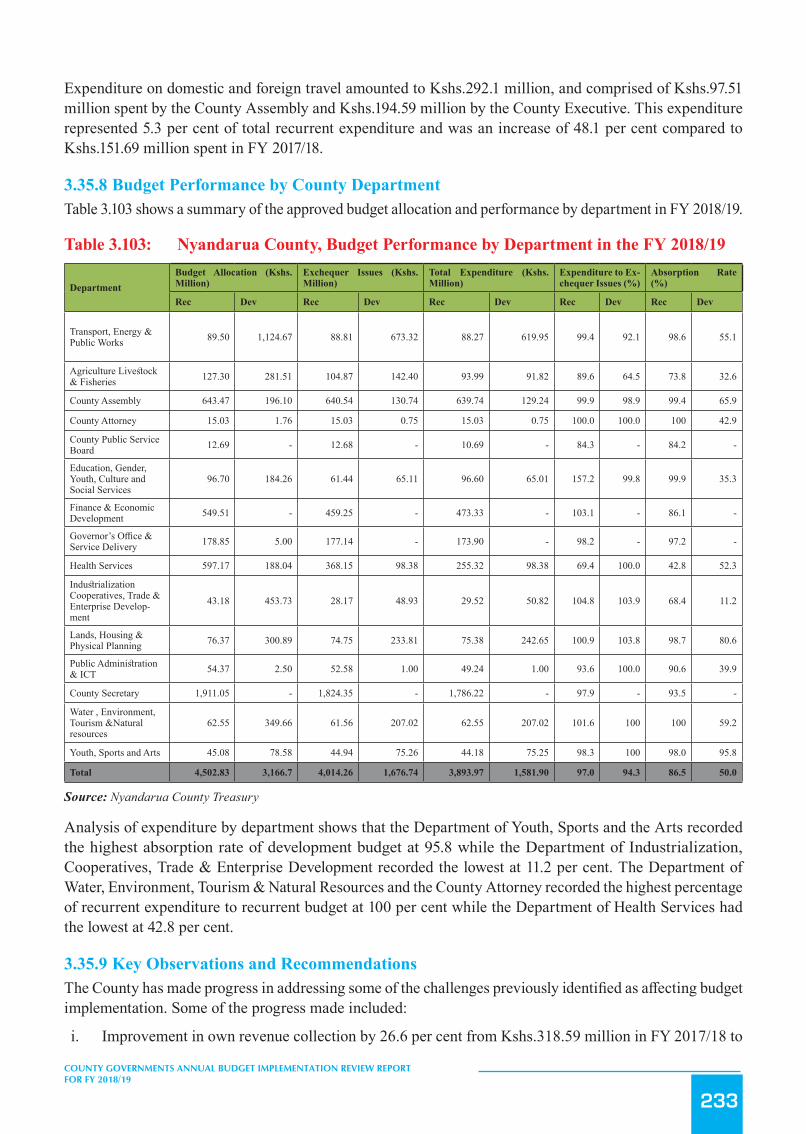
233
COUNTY GOVERNMENTS ANNUAL BUDGET IMPLEMENTATION REVIEW REPORT FOR FY 2018/19
Expenditure on domestic and foreign travel amounted to Kshs.292.1 million, and comprised of Kshs.97.51 million spent by the County Assembly and Kshs.194.59 million by the County Executive. This expenditure represented 5.3 per cent of total recurrent expenditure and was an increase of 48.1 per cent compared to Kshs.151.69 million spent in FY 2017/18.
3.35.8 Budget Performance by County DepartmentTable 3.103 shows a summary of the approved budget allocation and performance by department in FY 2018/19.
Table 3.103: Nyandarua County, Budget Performance by Department in the FY 2018/19
DepartmentBudget Allocation (Kshs. Million)
Exchequer Issues (Kshs. Million)
Total Expenditure (Kshs. Million)
Expenditure to Ex-chequer Issues (%)
Absorption Rate (%)
Rec Dev Rec Dev Rec Dev Rec Dev Rec Dev
Transport, Energy & Public Works 89.50 1,124.67 88.81 673.32 88.27 619.95 99.4 92.1 98.6 55.1
Agriculture Livestock & Fisheries 127.30 281.51 104.87 142.40 93.99 91.82 89.6 64.5 73.8 32.6
County Assembly 643.47 196.10 640.54 130.74 639.74 129.24 99.9 98.9 99.4 65.9
County Attorney 15.03 1.76 15.03 0.75 15.03 0.75 100.0 100.0 100 42.9
County Public Service Board 12.69 - 12.68 - 10.69 - 84.3 - 84.2 -
Education, Gender, Youth, Culture and Social Services
96.70 184.26 61.44 65.11 96.60 65.01 157.2 99.8 99.9 35.3
Finance & Economic Development 549.51 - 459.25 - 473.33 - 103.1 - 86.1 -
Governor’s Office & Service Delivery 178.85 5.00 177.14 - 173.90 - 98.2 - 97.2 -
Health Services 597.17 188.04 368.15 98.38 255.32 98.38 69.4 100.0 42.8 52.3
Industrialization Cooperatives, Trade & Enterprise Develop-ment
43.18 453.73 28.17 48.93 29.52 50.82 104.8 103.9 68.4 11.2
Lands, Housing & Physical Planning 76.37 300.89 74.75 233.81 75.38 242.65 100.9 103.8 98.7 80.6
Public Administration & ICT 54.37 2.50 52.58 1.00 49.24 1.00 93.6 100.0 90.6 39.9
County Secretary 1,911.05 - 1,824.35 - 1,786.22 - 97.9 - 93.5 -
Water , Environment, Tourism &Natural resources
62.55 349.66 61.56 207.02 62.55 207.02 101.6 100 100 59.2
Youth, Sports and Arts 45.08 78.58 44.94 75.26 44.18 75.25 98.3 100 98.0 95.8
Total 4,502.83 3,166.7 4,014.26 1,676.74 3,893.97 1,581.90 97.0 94.3 86.5 50.0
Source: Nyandarua County Treasury
Analysis of expenditure by department shows that the Department of Youth, Sports and the Arts recorded the highest absorption rate of development budget at 95.8 while the Department of Industrialization, Cooperatives, Trade & Enterprise Development recorded the lowest at 11.2 per cent. The Department of Water, Environment, Tourism & Natural Resources and the County Attorney recorded the highest percentage of recurrent expenditure to recurrent budget at 100 per cent while the Department of Health Services had the lowest at 42.8 per cent.
3.35.9 Key Observations and RecommendationsThe County has made progress in addressing some of the challenges previously identified as affecting budget implementation. Some of the progress made included:
i. Improvement in own revenue collection by 26.6 per cent from Kshs.318.59 million in FY 2017/18 to

234
COUNTY GOVERNMENTS ANNUAL BUDGET IMPLEMENTATION REVIEW REPORT FOR FY 2018/19
Kshs.403.4 million realised in the reporting period.
Despite the above progress, the following challenges continued to hamper effective budget implementation;
1. Delay in disbursement of the equitable share of revenue raised nationally by the National Treasury.2. High expenditure on foreign and domestic travel, which increased by 48.1 per cent from Kshs.151.69
million in FY 2017/18 to Kshs.292.1 million in the reporting period.3. Although the wage bill has declined by 4.6 per cent from Kshs.2.15 billion in FY 2017/18 to Kshs.2.05
billion in the reporting period.
The County should implement the following measures in order to improve budget execution;
1. The County Treasury should liaise with the National Treasury to ensure that funds allocated to the County are released in a timely manner.
2. The County Treasury should ensure that expenditure on non-core budget items is rationalised to provide more resources for development projects.
3. The County Public Service Board should develop an optimal staffing structure and devise strategies to contain expenditure on personnel costs within 35 per cent of County’s total revenue in line with Regulation 25(1) (b) of the PFM (County Governments) Regulations, 2015.
3.36 Nyeri County
3.36.1 Overview of the FY 2018/19 BudgetThe County’s FY 2018/19 Supplementary Budget was Kshs.8.84 billion, comprising of Kshs.2.86 billion (32.4 per cent) and Kshs.5.98 billion (67.6 per cent) allocation for development and recurrent expenditure respectively.
To finance the budget, the County expects to receive Kshs.5.02 billion (56.9 per cent) as equitable share of the revenue raised nationally, Kshs.1.43 billion (16.1 per cent) as total conditional grants, generate Kshs.1.0 billion (11.3 per cent) from own sources of revenue, and Kshs.1.39 billion (15.7 per cent) cash balance from FY 2017/18.
Figure 3.141: Nyeri County, Expected Sources of Budget Financing in FY 2018/19
271
2. High expenditure on foreign and domestic travel, which increased by 48.1 per cent from Kshs.151.69 million in
FY 2017/18 to Kshs.292.1 million in the reporting period.
3. Although the wage bill has declined by 4.6 per cent from Kshs.2.15 billion in FY 2017/18 to Kshs.2.05 billion in
the reporting period, the wage bill accounted for 37.4 per cent of total expenditure in the reporting period and is
above 35 per cent of the county’s revenue as required by Regulation 25(1) (b) of the PFM (County Government)
Regulations, 2015.
The County should implement the following measures in order to improve budget execution;
1. The County Treasury should liaise with the National Treasury to ensure that funds allocated to the County are
released in a timely manner.
2. The County Treasury should ensure that expenditure on non-core budget items is rationalised to provide more
resources for development projects.
3. The County Public Service Board should develop an optimal staffing structure and devise strategies to contain
expenditure on personnel costs within 35 per cent of County’s total revenue in line with Regulation 25(1) (b) of the
PFM (County Governments) Regulations, 2015.
3.36 Nyeri County
3.36.1 Overview of the FY 2018/19 Budget The County’s FY 2018/19 Supplementary Budget was Kshs.8.84 billion, comprising of Kshs.2.86 billion (32.4 per
cent) and Kshs.5.98 billion (67.6 per cent) allocation for development and recurrent expenditure respectively.
To finance the budget, the County expects to receive Kshs.5.02 billion (56.9 per cent) as equitable share of the revenue
raised nationally, Kshs.1.43 billion (16.1 per cent) as total conditional grants, generate Kshs.1.0 billion (11.3 per cent)
from own sources of revenue, and Kshs.1.39 billion (15.7 per cent) cash balance from FY 2017/18.
Figure 3.141: Nyeri County Expected Sources of Budget Financing in FY 2018/19
Source: Nyeri County Treasury
A breakdown of the conditional grants is provided in Table 3.104.
Cash Balance from FY 2017/1815.7%
National Sharable Revenue56.9%
Total Conditional Allocations
16.1%
Own Source Revenue11.3%
Source: Nyeri County Treasury

235
COUNTY GOVERNMENTS ANNUAL BUDGET IMPLEMENTATION REVIEW REPORT FOR FY 2018/19
A breakdown of the conditional grants is provided in Table 3.104.
3.36.2 Revenue AnalysisDuring the FY 2018/19, the County had a total of Khs.8.60 billion available for budget implementation. This amount consisted of Kshs.5.02 billion received as equitable share of the revenue raised nationally, Kshs.1.35 billion as conditional grants, Kshs.837.39 million generated from own sources of revenue, and a cash balance of Kshs.1.39 billion from FY 2017/18.
Figure 3.142 shows the trend in annual own-source revenue collection from FY 2013/14 to FY 2018/19.
Figure 3.142: Nyeri County, Own Source Revenue Collection for FY 2013/14 to FY 2018/19
272
3.36.2 Revenue Analysis During the FY 2018/19, the County had a total of Khs.8.60 billion available for budget implementation. This amount
consisted of Kshs.5.02 billion received as equitable share of the revenue raised nationally, Kshs.1.35 billion as
conditional grants, Kshs.837.39 million generated from own sources of revenue, and a cash balance of Kshs.1.39 billion
from FY 2017/18.
Figure 3.142 shows the trend in annual own-source revenue collection from FY 2013/14 to FY 2018/19.
Figure 3.142: Nyeri County, Own Source Revenue Collection for FY 2013/14 to FY 2018/19
Source: Nyeri County Treasury
The County generated a total of Kshs.837.39 million from own revenue sources in the FY 2018/19. This amount
represented an increase of Kshs.77.16 million compared to that realised in FY 2017/18 and was 83.7 per cent of the
annual target.
3.36.3 Conditional Grants During the reporting period, the County received Kshs.1.35 billion as conditional grants as shown in Table 3.104 .
Table 3.104: Nyeri County, Conditional Grants/Loans Received in the FY 2018/19
S/No.
Grant/Loans Annual Allocation CARA, 2018) (Kshs)
Annual Budget Allocation (Kshs)
Total Receipts (Kshs)
Receipts as Percentage of Annual Budget Allocation (%)
1 IDA (World Bank) -Kenya Urban Support Project (KUSP) 236,639,100 236,639,100 236,639,100 100
2 DANIDA - Universal Healthcare in Devolved System Programme 16,605,000 16,605,000 16,605,000 100
3 Transforming Health Systems for Universal Care Project (World Bank) 50,000,000 50,000,000 27,901,561 55.8
432.23
680.70 709.55643.14
760.23837.39
0
100
200
300
400
500
600
700
800
900
FY 2013/14 FY 2014/15 FY 2015/16 FY 2016/17 FY 2017/18 FY 2018/19
Kshs. M
illions
Trend in Own Source Revenue
Source: Nyeri County TreasuryThe County generated a total of Kshs.837.39 million from own revenue sources in the FY 2018/19. This amount represented an increase of Kshs.77.16 million compared to that realised in FY 2017/18 and was 83.7 per cent of the annual target.
3.36.3 Conditional GrantsDuring the reporting period, the County received Kshs.1.35 billion as conditional grants as shown in Table 3.104 .
Table 3.104: Nyeri County, Conditional Grants/Loans Received in the FY 2018/19S/No. Grant/Loans Annual Allocation
CARA, 2018) (Kshs)Annual Budget Al-location (Kshs)
Total Receipts (Kshs)
Receipts as Per-centage of Annu-al Budget Allo-cation (%)
1 IDA (World Bank) -Kenya Urban Support Project (KUSP) 236,639,100 236,639,100 236,639,100 100
2 DANIDA - Universal Healthcare in Devolved System Pro-gramme 16,605,000 16,605,000 16,605,000 100
3 Transforming Health Systems for Universal Care Project (World Bank) 50,000,000 50,000,000 27,901,561 55.8
4 Grants to Level- 5 Hospital 407,861,272 407,861,272 407,861,272 100
5 Sweden-Agriculture Sector Development Support Programme (ASDSP) II + Bal C/F in FY 2017/18 17,424,659 17,424,659 6,343,929 36.4
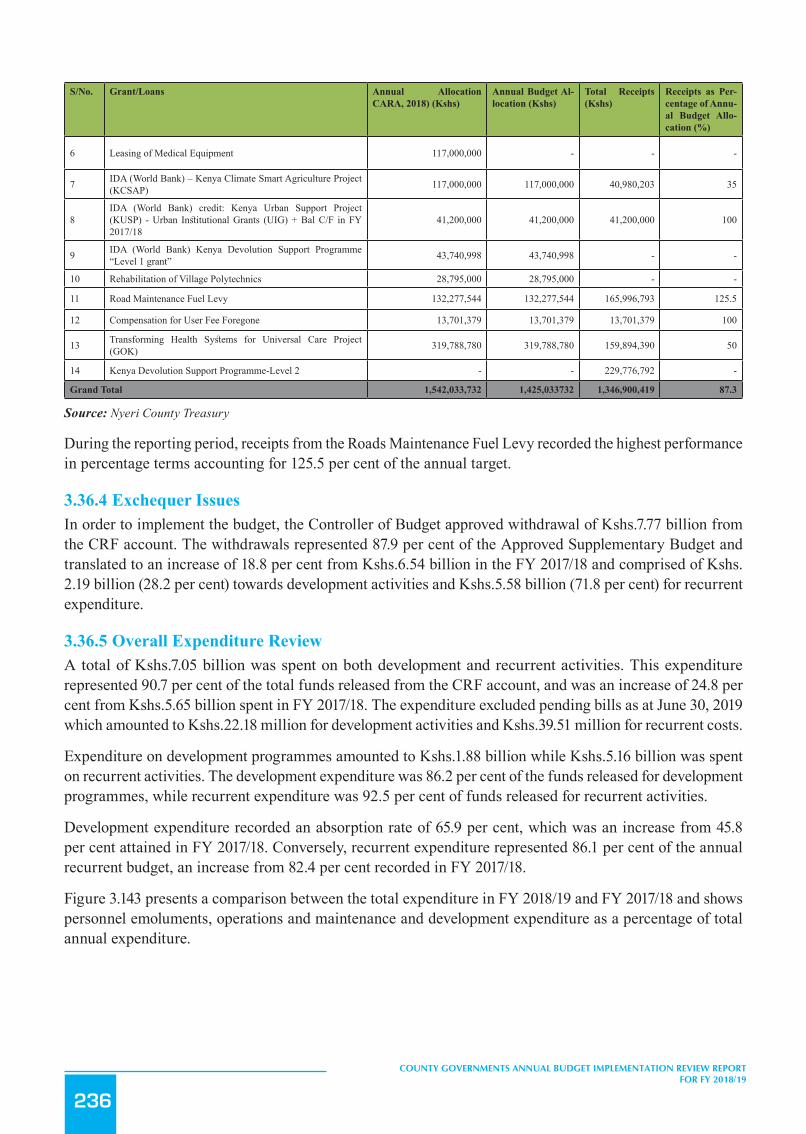
236
COUNTY GOVERNMENTS ANNUAL BUDGET IMPLEMENTATION REVIEW REPORT FOR FY 2018/19
S/No. Grant/Loans Annual Allocation CARA, 2018) (Kshs)
Annual Budget Al-location (Kshs)
Total Receipts (Kshs)
Receipts as Per-centage of Annu-al Budget Allo-cation (%)
6 Leasing of Medical Equipment 117,000,000 - - -
7 IDA (World Bank) – Kenya Climate Smart Agriculture Project (KCSAP) 117,000,000 117,000,000 40,980,203 35
8IDA (World Bank) credit: Kenya Urban Support Project (KUSP) - Urban Institutional Grants (UIG) + Bal C/F in FY 2017/18
41,200,000 41,200,000 41,200,000 100
9 IDA (World Bank) Kenya Devolution Support Programme “Level 1 grant” 43,740,998 43,740,998 - -
10 Rehabilitation of Village Polytechnics 28,795,000 28,795,000 - -
11 Road Maintenance Fuel Levy 132,277,544 132,277,544 165,996,793 125.5
12 Compensation for User Fee Foregone 13,701,379 13,701,379 13,701,379 100
13 Transforming Health Systems for Universal Care Project (GOK) 319,788,780 319,788,780 159,894,390 50
14 Kenya Devolution Support Programme-Level 2 - - 229,776,792 -
Grand Total 1,542,033,732 1,425,033732 1,346,900,419 87.3
Source: Nyeri County Treasury
During the reporting period, receipts from the Roads Maintenance Fuel Levy recorded the highest performance in percentage terms accounting for 125.5 per cent of the annual target.
3.36.4 Exchequer IssuesIn order to implement the budget, the Controller of Budget approved withdrawal of Kshs.7.77 billion from the CRF account. The withdrawals represented 87.9 per cent of the Approved Supplementary Budget and translated to an increase of 18.8 per cent from Kshs.6.54 billion in the FY 2017/18 and comprised of Kshs. 2.19 billion (28.2 per cent) towards development activities and Kshs.5.58 billion (71.8 per cent) for recurrent expenditure.
3.36.5 Overall Expenditure ReviewA total of Kshs.7.05 billion was spent on both development and recurrent activities. This expenditure represented 90.7 per cent of the total funds released from the CRF account, and was an increase of 24.8 per cent from Kshs.5.65 billion spent in FY 2017/18. The expenditure excluded pending bills as at June 30, 2019 which amounted to Kshs.22.18 million for development activities and Kshs.39.51 million for recurrent costs.
Expenditure on development programmes amounted to Kshs.1.88 billion while Kshs.5.16 billion was spent on recurrent activities. The development expenditure was 86.2 per cent of the funds released for development programmes, while recurrent expenditure was 92.5 per cent of funds released for recurrent activities.
Development expenditure recorded an absorption rate of 65.9 per cent, which was an increase from 45.8 per cent attained in FY 2017/18. Conversely, recurrent expenditure represented 86.1 per cent of the annual recurrent budget, an increase from 82.4 per cent recorded in FY 2017/18.
Figure 3.143 presents a comparison between the total expenditure in FY 2018/19 and FY 2017/18 and shows personnel emoluments, operations and maintenance and development expenditure as a percentage of total annual expenditure.
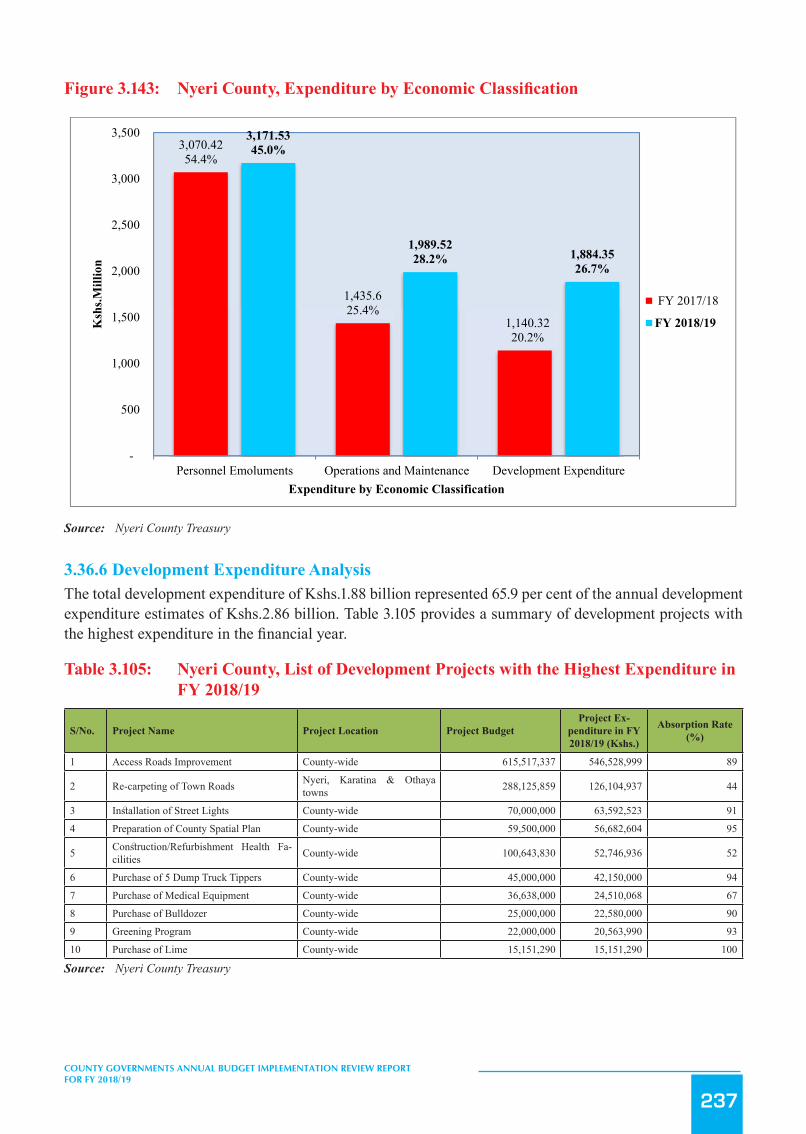
237
COUNTY GOVERNMENTS ANNUAL BUDGET IMPLEMENTATION REVIEW REPORT FOR FY 2018/19
Figure3.143: NyeriCounty,ExpenditurebyEconomicClassification
274
Figure 3.143: Nyeri County, Expenditure by Economic Classification
Source: Nyeri County Treasury
3.36.6 Development Expenditure Analysis The total development expenditure of Kshs.1.88 billion represented 65.9 per cent of the annual development
expenditure estimates of Kshs.2.86 billion. Table 3.105 provides a summary of development projects with the highest
expenditure in the financial year.
Table 3.105: Nyeri County, List of Development Projects with the Highest Expenditure in FY 2018/19
S/No. Project Name Project Location Project Budget
Project Expenditure in FY 2018/19 (Kshs.)
Absorption Rate (%)
1 Access Roads Improvement County-wide 615,517,337 546,528,999 89
2 Re-carpeting of Town Roads Nyeri, Karatina & Othaya towns 288,125,859 126,104,937 44
3 Installation of Street Lights County-wide 70,000,000 63,592,523 91 4 Preparation of County Spatial Plan County-wide 59,500,000 56,682,604 95
5 Construction/Refurbishment Health Facilities County-wide 100,643,830 52,746,936 52
6 Purchase of 5 Dump Truck Tippers County-wide 45,000,000 42,150,000 94 7 Purchase of Medical Equipment County-wide 36,638,000 24,510,068 67 8 Purchase of Bulldozer County-wide 25,000,000 22,580,000 90 9 Greening Program County-wide 22,000,000 20,563,990 93 10 Purchase of Lime County-wide 15,151,290 15,151,290 100
Source: Nyeri County Treasury
3.36.7 Analysis of Recurrent Expenditure The total recurrent expenditure of Kshs.5.16 billion comprised of Kshs.3.17 billion (61.4 per cent) incurred on personnel
emoluments and Kshs.1.99 billion (38.6 per cent) on operations and maintenance as shown in Figure 3.143 .
3,070.4254.4%
1,435.625.4%
1,140.3220.2%
3,171.5345.0%
1,989.5228.2% 1,884.35
26.7%
-
500
1,000
1,500
2,000
2,500
3,000
3,500
Personnel Emoluments Operations and Maintenance Development Expenditure
Ksh
s.Mill
ion
Expenditure by Economic Classification
FY 2017/18
FY 2018/19
Source: Nyeri County Treasury
3.36.6 Development Expenditure AnalysisThe total development expenditure of Kshs.1.88 billion represented 65.9 per cent of the annual development expenditure estimates of Kshs.2.86 billion. Table 3.105 provides a summary of development projects with the highest expenditure in the financial year.
Table 3.105: Nyeri County, List of Development Projects with the Highest Expenditure in FY 2018/19
S/No. Project Name Project Location Project BudgetProject Ex-
penditure in FY 2018/19 (Kshs.)
Absorption Rate (%)
1 Access Roads Improvement County-wide 615,517,337 546,528,999 89
2 Re-carpeting of Town Roads Nyeri, Karatina & Othaya towns 288,125,859 126,104,937 44
3 Installation of Street Lights County-wide 70,000,000 63,592,523 91
4 Preparation of County Spatial Plan County-wide 59,500,000 56,682,604 95
5 Construction/Refurbishment Health Fa-cilities County-wide 100,643,830 52,746,936 52
6 Purchase of 5 Dump Truck Tippers County-wide 45,000,000 42,150,000 94
7 Purchase of Medical Equipment County-wide 36,638,000 24,510,068 67
8 Purchase of Bulldozer County-wide 25,000,000 22,580,000 90
9 Greening Program County-wide 22,000,000 20,563,990 93
10 Purchase of Lime County-wide 15,151,290 15,151,290 100
Source: Nyeri County Treasury

238
COUNTY GOVERNMENTS ANNUAL BUDGET IMPLEMENTATION REVIEW REPORT FOR FY 2018/19
3.36.7 Analysis of Recurrent ExpenditureThe total recurrent expenditure of Kshs.5.16 billion comprised of Kshs.3.17 billion (61.4 per cent) incurred on personnel emoluments and Kshs.1.99 billion (38.6 per cent) on operations and maintenance as shown in Figure 3.143 .
Expenditure on personnel emoluments represented an increase of 3.3 per cent compared to FY 2017/18 when the County spent Kshs.3.07 billion and was 45 per cent of the total expenditure in FY 2018/19. Figure 3.144 shows a summary of operations and maintenance expenditure by major categories.
Figure 3.144: Nyeri County, Operations and Maintenance Expenditure by Major Categories in FY 2018/19
275
Expenditure on personnel emoluments represented an increase of 3.3 per cent compared to FY 2017/18 when the
County spent Kshs.3.07 billion and was 45 per cent of the total expenditure in FY 2018/19. Figure 3.144 shows a
summary of operations and maintenance expenditure by major categories.
Figure 3.144: Nyeri County, Operations and Maintenance Expenditure by Major Categories in FY 2018/19
Source: Nyeri County Treasury
The County spent Kshs.39.76 million on committee sitting allowances for the 44 MCAs and the Speaker against the
annual budget allocation of Kshs.79.16 million. This represented an increase of 93.1 per cent compared to Kshs.20.59
million spent in FY 2017/18. The average monthly sitting allowance translated to Kshs.73,633 per MCA against the
SRC’s recommended monthly ceiling of Kshs.124,800.
Expenditure on domestic and foreign travel amounted to Kshs.332.44 million. This amount comprised of Kshs.213.6
million and Kshs.118.84 million spent by the County Assembly and the County Executive respectively. This
expenditure represented 6.4 per cent of the total recurrent expenditure and was an increase of 60.4 per cent compared to
Kshs.200.86 million spent in FY 2017/18.
3.36.8 Budget Performance by County Department Table 3.106 shows a summary of the approved budget allocation and performance by department in FY 2018/19.
Table 3.106: Nyeri County, Budget Performance by Department in FY 2018/19
332.44
200.15 190.59170.64
140.72
100.0085.64 77.92 72.12
60.80
0
50
100
150
200
250
300
350
Ksh
s. M
illio
n
Major Categories of Operations & Maintenance
Source: Nyeri County Treasury
The County spent Kshs.39.76 million on committee sitting allowances for the 44 MCAs and the Speaker against the annual budget allocation of Kshs.79.16 million. This represented an increase of 93.1 per cent compared to Kshs.20.59 million spent in FY 2017/18. The average monthly sitting allowance translated to Kshs.73,633 per MCA against the SRC’s recommended monthly ceiling of Kshs.124,800.
Expenditure on domestic and foreign travel amounted to Kshs.332.44 million. This amount comprised of Kshs.213.6 million and Kshs.118.84 million spent by the County Assembly and the County Executive respectively. This expenditure represented 6.4 per cent of the total recurrent expenditure and was an increase of 60.4 per cent compared to Kshs.200.86 million spent in FY 2017/18.

239
COUNTY GOVERNMENTS ANNUAL BUDGET IMPLEMENTATION REVIEW REPORT FOR FY 2018/19
3.36.8 Budget Performance by County DepartmentTable 3.106 shows a summary of the approved budget allocation and performance by department in FY 2018/19.
Table 3.106: Nyeri County, Budget Performance by Department in FY 2018/19
DepartmentAnnual Budget Allocation
(Kshs. Million)Exchequer Issues (Kshs.
Million)Expenditure (Kshs.
Million)
Expenditure to Exchequer
Issues (%)
Absorption Rate (%)
Rec Dev Rec Dev Rec Dev Rec Dev Rec Dev
County Assembly 659.45 5.00 654.26 1.72 650.07 1.72 99.4 100.0 98.6 34.4
Office of the Governor & Deputy Governor 166.26 40.00 165.86 0.00 128.22 0.00 77.3 - 77.1 -
Office of the County Secretary 234.58 8.39 212.29 2.49 211.24 1.74 99.5 69.7 90.0 20.7
Finance and Economic Planning 557.99 311.19 488.16 259.66 455.03 271.49 93.2 104.6 81.5 87.2
Lands, Physical Planning, Housing and Urbanization
52.61 358.75 49.75 307.60 49.28 78.81 99.0 25.6 93.7 22.0
Health Services 2,809.43 244.55 2,616.54 158.58 2,315.09 105.75 88.5 66.7 82.4 43.2
Youth, Gender and Social Services 122.14 21.48 121.84 8.05 109.79 9.82 90.1 122.0 89.9 45.7
County Public Service & Administration 184.57 5.00 183.46 5.00 181.70 4.98 99.0 99.6 98.4 99.6
Agriculture, Livestock and Fisheries 372.34 216.09 315.89 159.25 333.44 109.12 105.6 68.5 89.6 50.5
Trade, Culture, Tour-ism & Cooperative Development
63.29 119.37 61.24 80.49 59.95 84.03 97.9 104.4 94.7 70.4
Education, Science and Technology 413.56 163.30 380.53 132.73 377.19 133.85 99.1 100.8 91.2 82.0
Water, Environment & Natural resources 139.55 320.31 129.00 227.01 119.38 241.22 92.5 106.3 85.5 75.3
County Public Service Board 43.22 - 42.02 - 39.15 - 93.2 - 90.6 -
Transport, Public Works & Infrastructure 156.86 1,047.26 156.66 847.17 131.52 841.81 84.0 99.4 83.8 80.4
Total 5,975.85 2,860.69 5,577.50 2,189.74 5,161.05 1,884.35 92.5 86.1 86.4 65.9
Source: Nyeri County Treasury
Analysis of expenditure by department shows that the Department of County Public Service & Administration had the highest absorption rate of development budget at 99.6 per cent while the Office of the Governor and Deputy Governor did not spend on development expenditure. The County Assembly had the highest percentage of recurrent expenditure to recurrent budget at 98.6 per cent while the Office of the Governor and Deputy Governor had the lowest at 77.1 per cent.
3.36.9 Key Observations and RecommendationsThe County has made progress in addressing some of the challenges previously identified as affecting budget implementation. Some of the progress made included:
i. Improvement in the own-source revenue performance by 10 per cent to Kshs.837.39 million, from Kshs.760.23 million in FY2017/18.
ii. Improvement in the absorption of the development budget to 65.9 per cent compared to 45.8 per cent in FY 2017/18.
Despite the above progress, the following challenges continued to hamper effective budget implementation;
1. A high wage bill that increased by 3.3 per cent from Kshs.3.07 billion in the FY 2017/18 to Kshs.3.17
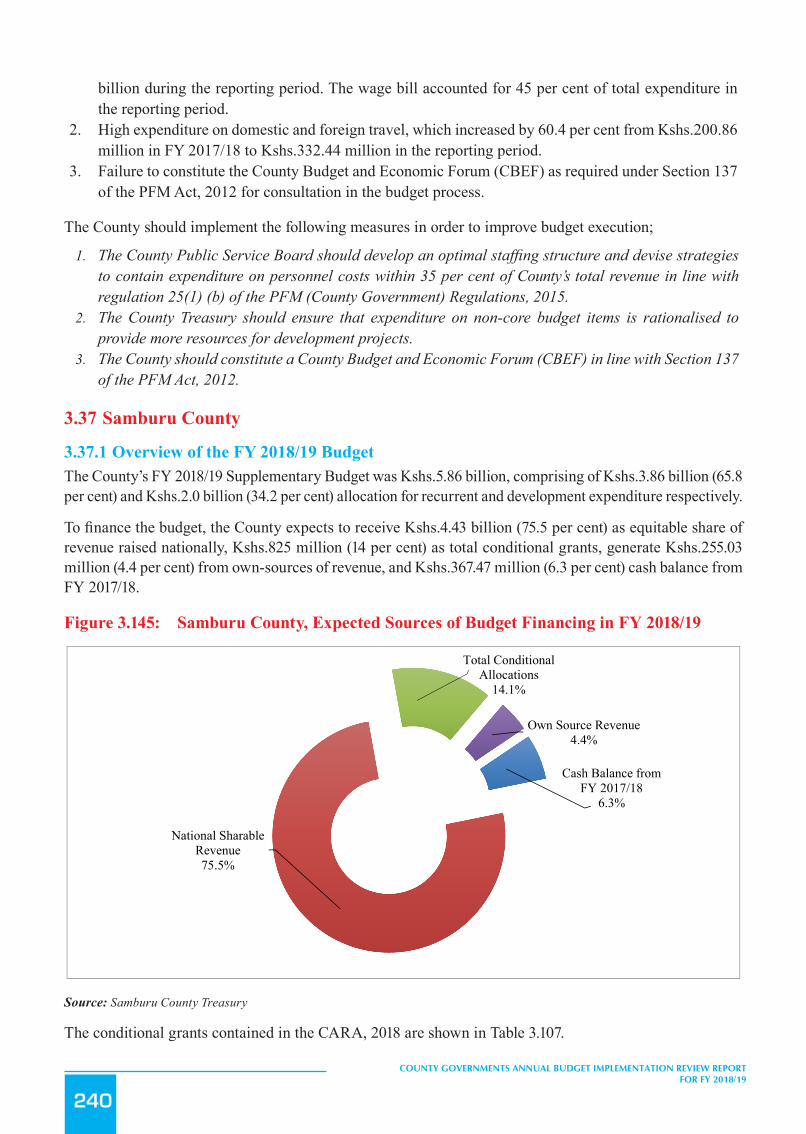
240
COUNTY GOVERNMENTS ANNUAL BUDGET IMPLEMENTATION REVIEW REPORT FOR FY 2018/19
billion during the reporting period. The wage bill accounted for 45 per cent of total expenditure in the reporting period.
2. High expenditure on domestic and foreign travel, which increased by 60.4 per cent from Kshs.200.86 million in FY 2017/18 to Kshs.332.44 million in the reporting period.
3. Failure to constitute the County Budget and Economic Forum (CBEF) as required under Section 137 of the PFM Act, 2012 for consultation in the budget process.
The County should implement the following measures in order to improve budget execution;
1. The County Public Service Board should develop an optimal staffing structure and devise strategies to contain expenditure on personnel costs within 35 per cent of County’s total revenue in line with regulation 25(1) (b) of the PFM (County Government) Regulations, 2015.
2. The County Treasury should ensure that expenditure on non-core budget items is rationalised to provide more resources for development projects.
3. The County should constitute a County Budget and Economic Forum (CBEF) in line with Section 137 of the PFM Act, 2012.
3.37 Samburu County
3.37.1 Overview of the FY 2018/19 BudgetThe County’s FY 2018/19 Supplementary Budget was Kshs.5.86 billion, comprising of Kshs.3.86 billion (65.8 per cent) and Kshs.2.0 billion (34.2 per cent) allocation for recurrent and development expenditure respectively.
To finance the budget, the County expects to receive Kshs.4.43 billion (75.5 per cent) as equitable share of revenue raised nationally, Kshs.825 million (14 per cent) as total conditional grants, generate Kshs.255.03 million (4.4 per cent) from own-sources of revenue, and Kshs.367.47 million (6.3 per cent) cash balance from FY 2017/18.
Figure 3.145: Samburu County, Expected Sources of Budget Financing in FY 2018/19
277
3. Failure to constitute the County Budget and Economic Forum (CBEF) as required under Section 137 of the PFM
Act, 2012 for consultation in the budget process.
The County should implement the following measures in order to improve budget execution;
1. The County Public Service Board should develop an optimal staffing structure and devise strategies to contain
expenditure on personnel costs within 35 per cent of County’s total revenue in line with regulation 25(1) (b) of the
PFM (County Government) Regulations, 2015.
2. The County Treasury should ensure that expenditure on non-core budget items is rationalised to provide more
resources for development projects.
3. The County should constitute a County Budget and Economic Forum (CBEF) in line with Section 137 of the PFM
Act, 2012.
3.37 Samburu County
3.37.1 Overview of the FY 2018/19 Budget The County’s FY 2018/19 Supplementary Budget was Kshs.5.86 billion, comprising of Kshs.3.86 billion (65.8 per
cent) and Kshs.2.0 billion (34.2 per cent) allocation for recurrent and development expenditure respectively.
To finance the budget, the County expects to receive Kshs.4.43 billion (75.5 per cent) as equitable share of revenue
raised nationally, Kshs.825 million (14 per cent) as total conditional grants, generate Kshs.255.03 million (4.4 per
cent) from own-sources of revenue, and Kshs.367.47 million (6.3 per cent) cash balance from FY 2017/18.
Figure 3.145: Samburu County, Expected Sources of Budget Financing in FY 2018/19
Source: Samburu County Treasury
The conditional grants contained in the CARA, 2018 are shown in Table 3.107.
3.37.2 Revenue Analysis During the FY 2018/19, the County received Kshs.4.43 billion as equitable share of the revenue raised nationally,
Kshs.350.76 million as total conditional grants, raised Kshs.243.89 million from own-sources of revenue, and had a
Cash Balance from FY 2017/18
6.3%
National Sharable Revenue75.5%
Total Conditional Allocations
14.1%
Own Source Revenue4.4%
Source: Samburu County Treasury
The conditional grants contained in the CARA, 2018 are shown in Table 3.107.

241
COUNTY GOVERNMENTS ANNUAL BUDGET IMPLEMENTATION REVIEW REPORT FOR FY 2018/19
3.37.2 Revenue AnalysisDuring the FY 2018/19, the County received Kshs.4.43 billion as equitable share of the revenue raised nationally, Kshs.350.76 million as total conditional grants, raised Kshs.243.89 million from own-sources of revenue, and had a cash balance of Kshs.367.47 million from FY 2017/18. The total funds available for budget implementation amounted to Kshs.5.39 billion.
Figure 3.146 shows the trend in annual own-source revenue collection from the FY 2013/14 to the FY 2018/19.
Figure 3.146: Samburu County, Own Source Revenue Collection from the FY 2013/14 to FY 2018/19
278
cash balance of Kshs.367.47 million from FY 2017/18. The total funds available for budget implementation amounted
to Kshs.5.39 billion.
Figure 3.146 shows the trend in annual own-source revenue collection from the FY 2013/14 to the FY 2018/19.
Figure 3.146: Samburu County, Own Source Revenue Collection from the FY 2013/14 to FY 2018/19
Source: Samburu County Treasury
The County generated a total of Kshs.243.89 million from own revenue sources during the FY 2018/19. This amount
represented a decrease of Kshs.13.4 million compared to that realised during a similar period of the FY 2017/18 and was
96 per cent of the annual target.
3.37.3 Conditional Grants The County received Kshs.350.76 million as conditional grants in the financial year 2018/19 as shown in Table 3.107.
Table 3.107: Samburu County, Conditional Grants/Loans Received in the FY 2018/19
S/No. Grants Annual CARA, 2018 Allocation (Kshs)
Annual Budget Allocation (Kshs)
Actual Receipts (Kshs.)
Actual Receipts as Percentage of Annual Allocation (%)
1 Agriculture Sector Development Support Programme (ASDSP) 22,652,198 22,652,198 - -
2 Compensation for User Fee Foregone 5,235,578 5,235,578 5,235,578 100 3 Leasing of Medical Equipment 200,000,000 200,000,000 - - 4 FAO Funds - 8,766,690 - - 5 Road Maintenance Fuel Levy 116,569,586 116,569,586 143,493,610 123 6 Rehabilitation of Village Polytechnics 20,905,000 20,905,000 -
7 Transforming Health Systems for Universal Care Project (WB) 97,143,610 97,143,610 47,993,129 49
8 National Agricultural and Rural Inclusive Growth Project (NARIGP) 140,435,163 140,435,163 50,078,476 36
9 EU Grant for Instrument for devolution advice and support (IDEAS) 70,000,000 70,000,000 - -
10 Kenya Devolution Support Project (KDSP) "Level 1 grant" 39,330,852 39,330,852 - -
201.00170.75 166.84
187.68
257.29 243.89
0
50
100
150
200
250
300
FY 2013/14 FY 2014/15 FY 2015/16 FY 2016/17 FY 2017/18 FY 2018/19
Kshs. M
illions
Trend in Own Source Revenue
Source: Samburu County Treasury
The County generated a total of Kshs.243.89 million from own revenue sources during the FY 2018/19. This amount represented a decrease of Kshs.13.4 million compared to that realised during a similar period of the FY 2017/18 and was 96 per cent of the annual target.
3.37.3 Conditional GrantsThe County received Kshs.350.76 million as conditional grants in the financial year 2018/19 as shown in Table 3.107.
Table 3.107: Samburu County, Conditional Grants/Loans Received in the FY 2018/19
S/No. Grants Annual CARA, 2018 Allocation (Kshs)
Annual Budget Allocation (Kshs)
Actual Receipts (Kshs.)
Actual Receipts as Percentage of Annual Alloca-
tion (%)
1 Agriculture Sector Development Support Programme (ASDSP) 22,652,198 22,652,198 - -
2 Compensation for User Fee Foregone 5,235,578 5,235,578 5,235,578 100
3 Leasing of Medical Equipment 200,000,000 200,000,000 - -
4 FAO Funds - 8,766,690 - -
5 Road Maintenance Fuel Levy 116,569,586 116,569,586 143,493,610 123
6 Rehabilitation of Village Polytechnics 20,905,000 20,905,000 -
7 Transforming Health Systems for Universal Care Project (WB) 97,143,610 97,143,610 47,993,129 49
8 National Agricultural and Rural Inclusive Growth Project (NARIGP) 140,435,163 140,435,163 50,078,476 36
9 EU Grant for Instrument for devolution advice and support (IDEAS) 70,000,000 70,000,000 - -
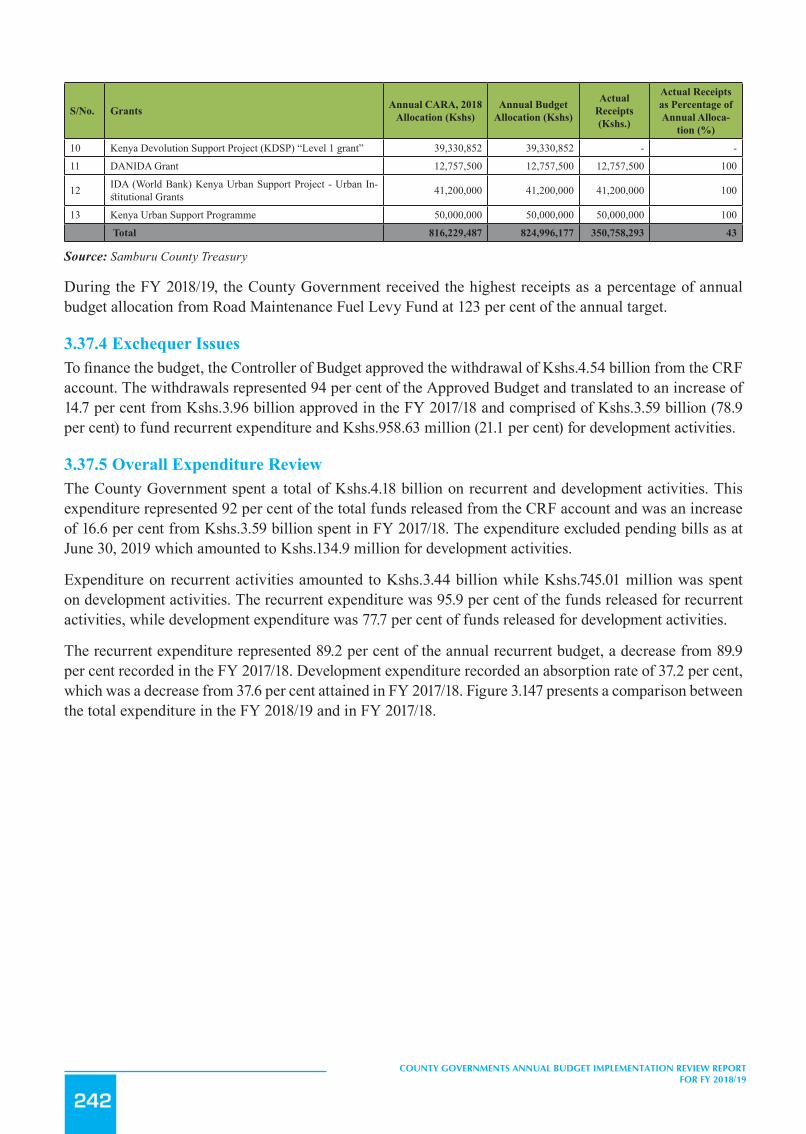
242
COUNTY GOVERNMENTS ANNUAL BUDGET IMPLEMENTATION REVIEW REPORT FOR FY 2018/19
S/No. Grants Annual CARA, 2018 Allocation (Kshs)
Annual Budget Allocation (Kshs)
Actual Receipts (Kshs.)
Actual Receipts as Percentage of Annual Alloca-
tion (%)
10 Kenya Devolution Support Project (KDSP) “Level 1 grant” 39,330,852 39,330,852 - -
11 DANIDA Grant 12,757,500 12,757,500 12,757,500 100
12 IDA (World Bank) Kenya Urban Support Project - Urban In-stitutional Grants 41,200,000 41,200,000 41,200,000 100
13 Kenya Urban Support Programme 50,000,000 50,000,000 50,000,000 100
Total 816,229,487 824,996,177 350,758,293 43
Source: Samburu County Treasury
During the FY 2018/19, the County Government received the highest receipts as a percentage of annual budget allocation from Road Maintenance Fuel Levy Fund at 123 per cent of the annual target.
3.37.4 Exchequer IssuesTo finance the budget, the Controller of Budget approved the withdrawal of Kshs.4.54 billion from the CRF account. The withdrawals represented 94 per cent of the Approved Budget and translated to an increase of 14.7 per cent from Kshs.3.96 billion approved in the FY 2017/18 and comprised of Kshs.3.59 billion (78.9 per cent) to fund recurrent expenditure and Kshs.958.63 million (21.1 per cent) for development activities.
3.37.5 Overall Expenditure ReviewThe County Government spent a total of Kshs.4.18 billion on recurrent and development activities. This expenditure represented 92 per cent of the total funds released from the CRF account and was an increase of 16.6 per cent from Kshs.3.59 billion spent in FY 2017/18. The expenditure excluded pending bills as at June 30, 2019 which amounted to Kshs.134.9 million for development activities.
Expenditure on recurrent activities amounted to Kshs.3.44 billion while Kshs.745.01 million was spent on development activities. The recurrent expenditure was 95.9 per cent of the funds released for recurrent activities, while development expenditure was 77.7 per cent of funds released for development activities.
The recurrent expenditure represented 89.2 per cent of the annual recurrent budget, a decrease from 89.9 per cent recorded in the FY 2017/18. Development expenditure recorded an absorption rate of 37.2 per cent, which was a decrease from 37.6 per cent attained in FY 2017/18. Figure 3.147 presents a comparison between the total expenditure in the FY 2018/19 and in FY 2017/18.

243
COUNTY GOVERNMENTS ANNUAL BUDGET IMPLEMENTATION REVIEW REPORT FOR FY 2018/19
Figure3.147: SamburuCounty,ExpenditurebyEconomicClassification
280
Source: Samburu County Treasury
3.37.6 Development Expenditure Analysis
The total development expenditure of Kshs.745.01 million represented 37.2 per cent of the annual development
expenditure budget of Kshs.2.0 billion. Table 3.108 provides a summary of development projects with the highest
expenditure in the financial year.
Table 3.108: Samburu County, List of Development Projects with the Highest Expenditure in FY 2018/19
S/No. Project Name Project Location Project Budget (Kshs.)
Project Expenditure (Kshs.)
1 Construction of County Headquarters Maralal Ward 1,041,603,768 49,461,530 2 Construction of Roads Waso Ward 27,783,000 14,879,049 3 Construction of borehole and piping system Loosuk,Suguta 8,918,003 8,918,003 4 Construction of Access Roads Poro Ward 19,179,060 8,486,000 5 Construction of Roads Wamba 20,345,880 9,310,000 6 Construction of Buildings Samburu North 25,811,498 8,073,089 7 Construction of Roads Ndoto Ward 21,966,300 7,550,000 8 Construction of cafeteria Malaso Ward 5,802,356 5,802,356
Source: Samburu County Treasury
3.37.7 Analysis of Recurrent Expenditure The total recurrent expenditure of Kshs.3.44 billion comprised of Kshs.1.98 billion (57.7 per cent) incurred on personnel
emoluments and Kshs.1.46 billion (42.3 per cent) on operations and maintenance as shown in Figure 3.147.
Expenditure on personnel emoluments represented an increase of 25.3 per cent compared to FY 2017/18 when the
County spent Kshs.1.58 billion and was 47.4 per cent of total expenditure in the FY 2018/19. Figure 3.148 shows a
summary of operations and maintenance expenditure by major categories.
Figure 3.148: Samburu County, Operations and Maintenance Expenditure by Major Categories in theFY 2018/19
1,581.38(44.1%) 1,456.62
(40.6%)
549.02(15.3%)
1,982.20(47.4%)
1,455.80(34.8%)
745.01(17.8%)
-
500
1,000
1,500
2,000
2,500
Personnel Emoluments Operations and Maintenance Development Expenditure
Ksh
s.Mill
ion
Expenditure by Economic Classification
FY 2017/18
FY 2018/19
Key
Source: Samburu County Treasury
3.37.6 Development Expenditure AnalysisThe total development expenditure of Kshs.745.01 million represented 37.2 per cent of the annual development expenditure budget of Kshs.2.0 billion. Table 3.108 provides a summary of development projects with the highest expenditure in the financial year.
Table 3.108: Samburu County, List of Development Projects with the Highest Expenditure in FY 2018/19
S/No. Project Name Project Location Project Budget (Kshs.) Project Expenditure (Kshs.)
1 Construction of County Headquarters Maralal Ward 1,041,603,768 49,461,530
2 Construction of Roads Waso Ward 27,783,000 14,879,049
3 Construction of borehole and piping system Loosuk,Suguta 8,918,003 8,918,003
4 Construction of Access Roads Poro Ward 19,179,060 8,486,000
5 Construction of Roads Wamba 20,345,880 9,310,000
6 Construction of Buildings Samburu North 25,811,498 8,073,089
7 Construction of Roads Ndoto Ward 21,966,300 7,550,000
8 Construction of cafeteria Malaso Ward 5,802,356 5,802,356
Source: Samburu County Treasury
3.37.7 Analysis of Recurrent ExpenditureThe total recurrent expenditure of Kshs.3.44 billion comprised of Kshs.1.98 billion (57.7 per cent) incurred on personnel emoluments and Kshs.1.46 billion (42.3 per cent) on operations and maintenance as shown in Figure 3.147.
Expenditure on personnel emoluments represented an increase of 25.3 per cent compared to FY 2017/18 when the County spent Kshs.1.58 billion and was 47.4 per cent of total expenditure in the FY 2018/19. Figure 3.148 shows a summary of operations and maintenance expenditure by major categories.

244
COUNTY GOVERNMENTS ANNUAL BUDGET IMPLEMENTATION REVIEW REPORT FOR FY 2018/19
Figure 3.148: Samburu County, Operations and Maintenance Expenditure by Major Categories in theFY 2018/19
281
Source: Samburu County Treasury
The County spent Kshs.29.02 million on committee sitting allowances for the 28 MCAs and Speaker against the annual
budget allocation of Kshs.29.02 million. This represented an increase of 159.3 per cent compared to Kshs.11.19 million
spent in FY 2017/18. The average monthly sitting allowance translated to Kshs.86,369 per MCA against the SRC’s
recommended monthly ceiling of Kshs.124,800.
Expenditure on domestic and foreign travel amounted to Kshs.116.93 million and comprised of Kshs.72.44 million
spent by the County Assembly and Kshs.44.49 million spent by the County Executive.
3.37.8 Budget Performance by County Department Table3.109 shows a summary of the approved budget allocation and performance by department in the FY 2018/19.
Table3.109: Samburu County, Budget Performance by Department in the FY 2018/2019
Department
Budget Allocation (Kshs. Million)
Exchequer Issues (Kshs. Million)
Total Expenditure (Kshs. Million)
Expenditure to Exchequer Issues (%)
Absorption Rate (%)
Rec. Dev. Rec. Dev. Rec. Dev. Rec. Dev. Rec. Dev.
County Executive 420.25 17.90 417.55 12.60 402.09 12.60 96.3 100.0 95.7 70.4 Finance & Economic planning 638.60 44.16 598.82 19.00 573.87 11.66 95.8 61.4 89.9 26.4
Agriculture, Livestock, Veterinary & Fisheries 327.73 278.83 279.42 51.69 267.80 36.23 95.8 70.1 81.7 13.0
593.23
394.65
155.00 145.90 127.80 116.9374.26 60.00 50.21 47.00
0
100
200
300
400
500
600
700
Ksh
s. M
illio
n
Major Categories of Operations & Maintenance
Source: Samburu County Treasury
The County spent Kshs.29.02 million on committee sitting allowances for the 28 MCAs and Speaker against the annual budget allocation of Kshs.29.02 million. This represented an increase of 159.3 per cent compared to Kshs.11.19 million spent in FY 2017/18. The average monthly sitting allowance translated to Kshs.86,369 per MCA against the SRC’s recommended monthly ceiling of Kshs.124,800.
Expenditure on domestic and foreign travel amounted to Kshs.116.93 million and comprised of Kshs.72.44 million spent by the County Assembly and Kshs.44.49 million spent by the County Executive.
3.37.8 Budget Performance by County DepartmentTable3.109 shows a summary of the approved budget allocation and performance by department in the FY 2018/19.
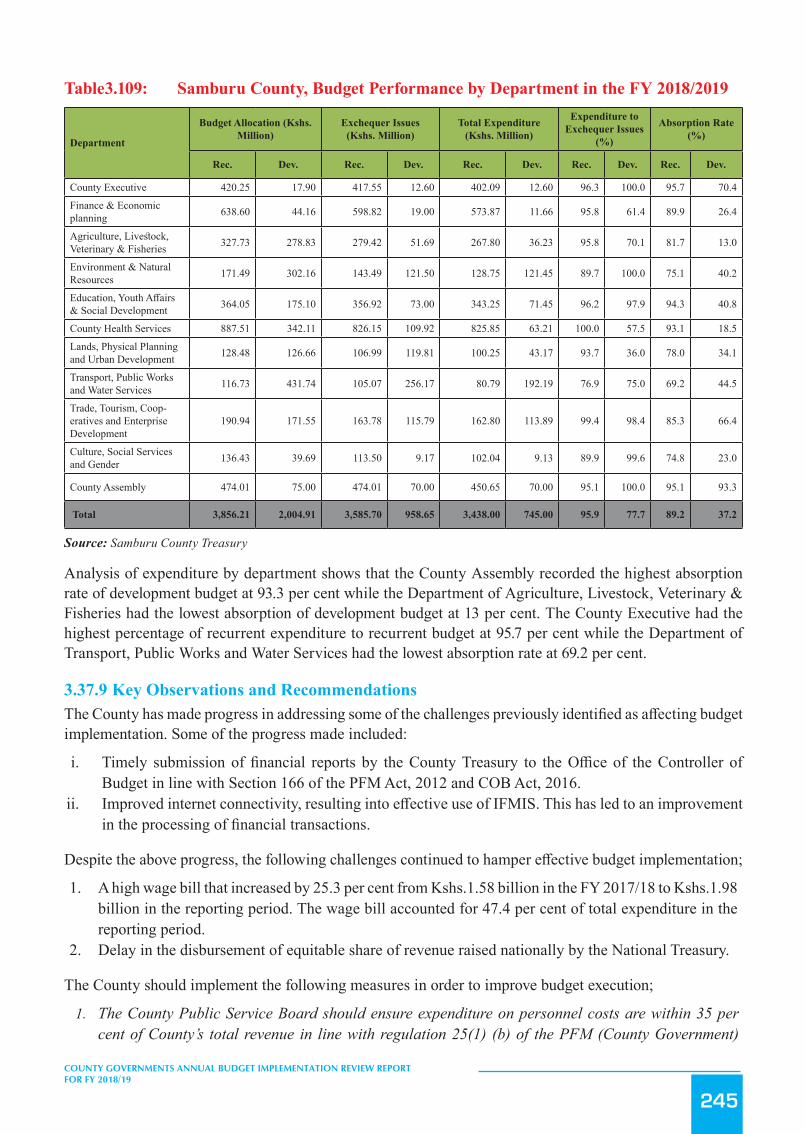
245
COUNTY GOVERNMENTS ANNUAL BUDGET IMPLEMENTATION REVIEW REPORT FOR FY 2018/19
Table3.109: Samburu County, Budget Performance by Department in the FY 2018/2019
Department
Budget Allocation (Kshs. Million)
Exchequer Issues (Kshs. Million)
Total Expenditure (Kshs. Million)
Expenditure to Exchequer Issues
(%)
Absorption Rate (%)
Rec. Dev. Rec. Dev. Rec. Dev. Rec. Dev. Rec. Dev.
County Executive 420.25 17.90 417.55 12.60 402.09 12.60 96.3 100.0 95.7 70.4
Finance & Economic planning 638.60 44.16 598.82 19.00 573.87 11.66 95.8 61.4 89.9 26.4
Agriculture, Livestock, Veterinary & Fisheries 327.73 278.83 279.42 51.69 267.80 36.23 95.8 70.1 81.7 13.0
Environment & Natural Resources 171.49 302.16 143.49 121.50 128.75 121.45 89.7 100.0 75.1 40.2
Education, Youth Affairs & Social Development 364.05 175.10 356.92 73.00 343.25 71.45 96.2 97.9 94.3 40.8
County Health Services 887.51 342.11 826.15 109.92 825.85 63.21 100.0 57.5 93.1 18.5
Lands, Physical Planning and Urban Development 128.48 126.66 106.99 119.81 100.25 43.17 93.7 36.0 78.0 34.1
Transport, Public Works and Water Services 116.73 431.74 105.07 256.17 80.79 192.19 76.9 75.0 69.2 44.5
Trade, Tourism, Coop-eratives and Enterprise Development
190.94 171.55 163.78 115.79 162.80 113.89 99.4 98.4 85.3 66.4
Culture, Social Services and Gender 136.43 39.69 113.50 9.17 102.04 9.13 89.9 99.6 74.8 23.0
County Assembly 474.01 75.00 474.01 70.00 450.65 70.00 95.1 100.0 95.1 93.3
Total 3,856.21 2,004.91 3,585.70 958.65 3,438.00 745.00 95.9 77.7 89.2 37.2
Source: Samburu County Treasury
Analysis of expenditure by department shows that the County Assembly recorded the highest absorption rate of development budget at 93.3 per cent while the Department of Agriculture, Livestock, Veterinary & Fisheries had the lowest absorption of development budget at 13 per cent. The County Executive had the highest percentage of recurrent expenditure to recurrent budget at 95.7 per cent while the Department of Transport, Public Works and Water Services had the lowest absorption rate at 69.2 per cent.
3.37.9 Key Observations and RecommendationsThe County has made progress in addressing some of the challenges previously identified as affecting budget implementation. Some of the progress made included:
i. Timely submission of financial reports by the County Treasury to the Office of the Controller of Budget in line with Section 166 of the PFM Act, 2012 and COB Act, 2016.
ii. Improved internet connectivity, resulting into effective use of IFMIS. This has led to an improvement in the processing of financial transactions.
Despite the above progress, the following challenges continued to hamper effective budget implementation;
1. A high wage bill that increased by 25.3 per cent from Kshs.1.58 billion in the FY 2017/18 to Kshs.1.98 billion in the reporting period. The wage bill accounted for 47.4 per cent of total expenditure in the reporting period.
2. Delay in the disbursement of equitable share of revenue raised nationally by the National Treasury.
The County should implement the following measures in order to improve budget execution;
1. The County Public Service Board should ensure expenditure on personnel costs are within 35 per cent of County’s total revenue in line with regulation 25(1) (b) of the PFM (County Government)
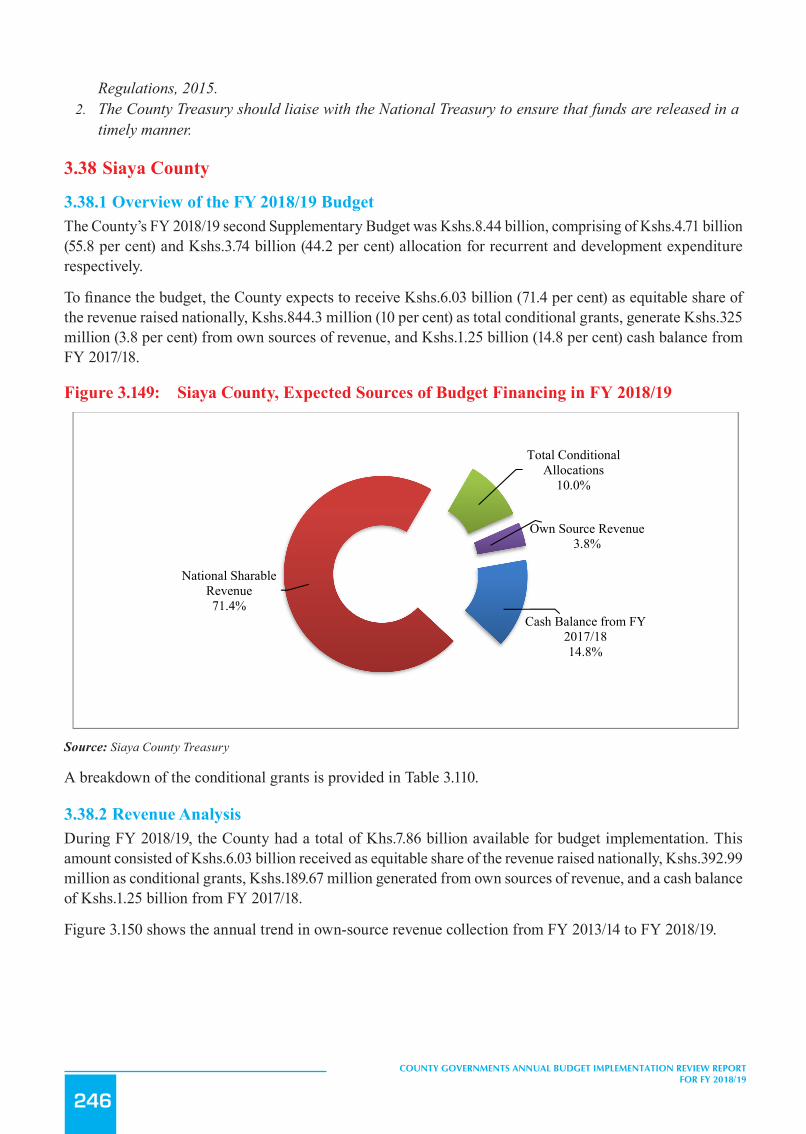
246
COUNTY GOVERNMENTS ANNUAL BUDGET IMPLEMENTATION REVIEW REPORT FOR FY 2018/19
Regulations, 2015.2. The County Treasury should liaise with the National Treasury to ensure that funds are released in a
timely manner.
3.38 Siaya County
3.38.1 Overview of the FY 2018/19 BudgetThe County’s FY 2018/19 second Supplementary Budget was Kshs.8.44 billion, comprising of Kshs.4.71 billion (55.8 per cent) and Kshs.3.74 billion (44.2 per cent) allocation for recurrent and development expenditure respectively.
To finance the budget, the County expects to receive Kshs.6.03 billion (71.4 per cent) as equitable share of the revenue raised nationally, Kshs.844.3 million (10 per cent) as total conditional grants, generate Kshs.325 million (3.8 per cent) from own sources of revenue, and Kshs.1.25 billion (14.8 per cent) cash balance from FY 2017/18.
Figure 3.149: Siaya County, Expected Sources of Budget Financing in FY 2018/19
283
3.38 Siaya County
3.38.1 Overview of the FY 2018/19 BudgetThe County’s FY 2018/19 second Supplementary Budget was Kshs.8.44 billion, comprising of Kshs.4.71 billion (55.8
per cent) and Kshs.3.74 billion (44.2 per cent) allocation for recurrent and development expenditure respectively.
To finance the budget, the County expects to receive Kshs.6.03 billion (71.4 per cent) as equitable share of the revenue
raised nationally, Kshs.844.3 million (10 per cent) as total conditional grants, generate Kshs.325 million (3.8 per cent)
from own sources of revenue, and Kshs.1.25 billion (14.8 per cent) cash balance from FY 2017/18.
Figure 3.149: Siaya County, Expected Sources of Budget Financing in FY 2018/19
Source: Siaya County Treasury
A breakdown of the conditional grants is provided in Table 3.110.
3.38.2 Revenue AnalysisDuring FY 2018/19, the County had a total of Khs.7.86 billion available for budget implementation. This amount
consisted of Kshs.6.03 billion received as equitable share of the revenue raised nationally, Kshs.392.99 million as
conditional grants, Kshs.189.67 million generated from own sources of revenue, and a cash balance of Kshs.1.25 billion
from FY 2017/18.
Figure 3.150 shows the annual trend in own-source revenue collection from FY 2013/14 to FY 2018/19.
Figure 3.150: Siaya County, Own Source Revenue Collection for FY 2013/14 to FY 2018/19
Cash Balance from FY 2017/1814.8%
National Sharable Revenue71.4%
Total Conditional Allocations
10.0%
Own Source Revenue3.8%
Source: Siaya County Treasury
A breakdown of the conditional grants is provided in Table 3.110.
3.38.2 Revenue AnalysisDuring FY 2018/19, the County had a total of Khs.7.86 billion available for budget implementation. This amount consisted of Kshs.6.03 billion received as equitable share of the revenue raised nationally, Kshs.392.99 million as conditional grants, Kshs.189.67 million generated from own sources of revenue, and a cash balance of Kshs.1.25 billion from FY 2017/18.
Figure 3.150 shows the annual trend in own-source revenue collection from FY 2013/14 to FY 2018/19.
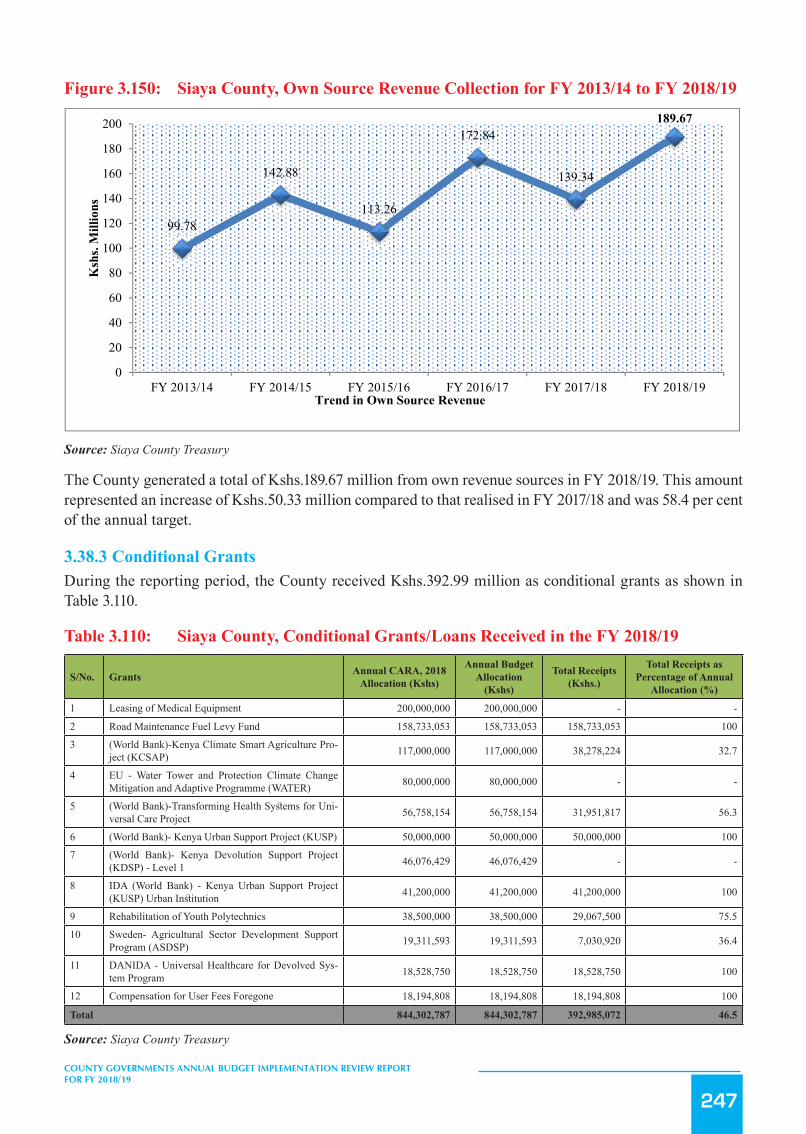
247
COUNTY GOVERNMENTS ANNUAL BUDGET IMPLEMENTATION REVIEW REPORT FOR FY 2018/19
Figure 3.150: Siaya County, Own Source Revenue Collection for FY 2013/14 to FY 2018/19
284
Source: Siaya County Treasury
The County generated a total of Kshs.189.67 million from own revenue sources in FY 2018/19. This amount
represented an increase of Kshs.50.33 million compared to that realised in FY 2017/18 and was 58.4 per cent of the
annual target.
3.38.3 Conditional Grants During the reporting period, the County received Kshs.392.99 million as conditional grants as shown in Table 3.110.
Table 3.110: Siaya County, Conditional Grants/Loans Received in the FY 2018/19
S/No. Grants Annual CARA, 2018
Allocation (Kshs)
Annual Budget Allocation (Kshs)
Total Receipts (Kshs.)
Total Receipts as Percentage of Annual Allocation (%)
1 Leasing of Medical Equipment 200,000,000 200,000,000 - - 2 Road Maintenance Fuel Levy Fund 158,733,053 158,733,053 158,733,053 100 3 (World Bank)-Kenya Climate Smart Agriculture
Project (KCSAP) 117,000,000 117,000,000 38,278,224 32.7
4 EU - Water Tower and Protection Climate Change Mitigation and Adaptive Programme (WATER) 80,000,000 80,000,000 - -
5 (World Bank)-Transforming Health Systems for Universal Care Project 56,758,154 56,758,154 31,951,817 56.3
6 (World Bank)- Kenya Urban Support Project (KUSP) 50,000,000 50,000,000 50,000,000 100
7 (World Bank)- Kenya Devolution Support Project (KDSP) - Level 1 46,076,429 46,076,429 - -
8 IDA (World Bank) - Kenya Urban Support Project (KUSP) Urban Institution 41,200,000 41,200,000 41,200,000 100
9 Rehabilitation of Youth Polytechnics 38,500,000 38,500,000 29,067,500 75.5 10 Sweden- Agricultural Sector Development Support
Program (ASDSP) 19,311,593 19,311,593 7,030,920 36.4
11 DANIDA - Universal Healthcare for Devolved System Program 18,528,750 18,528,750 18,528,750 100
12 Compensation for User Fees Foregone 18,194,808 18,194,808 18,194,808 100 Total 844,302,787 844,302,787 392,985,072 46.5
Source: Siaya County Treasury
99.78
142.88
113.26
172.84
139.34
189.67
0
20
40
60
80
100
120
140
160
180
200
FY 2013/14 FY 2014/15 FY 2015/16 FY 2016/17 FY 2017/18 FY 2018/19
Ksh
s. M
illio
ns
Trend in Own Source Revenue
Source: Siaya County Treasury
The County generated a total of Kshs.189.67 million from own revenue sources in FY 2018/19. This amount represented an increase of Kshs.50.33 million compared to that realised in FY 2017/18 and was 58.4 per cent of the annual target.
3.38.3 Conditional GrantsDuring the reporting period, the County received Kshs.392.99 million as conditional grants as shown in Table 3.110.
Table 3.110: Siaya County, Conditional Grants/Loans Received in the FY 2018/19
S/No. Grants Annual CARA, 2018 Allocation (Kshs)
Annual Budget Allocation
(Kshs)
Total Receipts (Kshs.)
Total Receipts as Percentage of Annual
Allocation (%)
1 Leasing of Medical Equipment 200,000,000 200,000,000 - -
2 Road Maintenance Fuel Levy Fund 158,733,053 158,733,053 158,733,053 100
3 (World Bank)-Kenya Climate Smart Agriculture Pro-ject (KCSAP) 117,000,000 117,000,000 38,278,224 32.7
4 EU - Water Tower and Protection Climate Change Mitigation and Adaptive Programme (WATER) 80,000,000 80,000,000 - -
5 (World Bank)-Transforming Health Systems for Uni-versal Care Project 56,758,154 56,758,154 31,951,817 56.3
6 (World Bank)- Kenya Urban Support Project (KUSP) 50,000,000 50,000,000 50,000,000 100
7 (World Bank)- Kenya Devolution Support Project (KDSP) - Level 1 46,076,429 46,076,429 - -
8 IDA (World Bank) - Kenya Urban Support Project (KUSP) Urban Institution 41,200,000 41,200,000 41,200,000 100
9 Rehabilitation of Youth Polytechnics 38,500,000 38,500,000 29,067,500 75.5
10 Sweden- Agricultural Sector Development Support Program (ASDSP) 19,311,593 19,311,593 7,030,920 36.4
11 DANIDA - Universal Healthcare for Devolved Sys-tem Program 18,528,750 18,528,750 18,528,750 100
12 Compensation for User Fees Foregone 18,194,808 18,194,808 18,194,808 100
Total 844,302,787 844,302,787 392,985,072 46.5
Source: Siaya County Treasury

248
COUNTY GOVERNMENTS ANNUAL BUDGET IMPLEMENTATION REVIEW REPORT FOR FY 2018/19
During the reporting period, receipts from the Road Maintenance Fuel Levy Fund, Kenya Urban Support Project, DANIDA, and Compensation for User Fees Foregone recorded the highest performance in percentage terms, accounting for 100 per cent of the respective annual target.
3.38.4 Exchequer IssuesIn order to implement the budget, the Controller of Budget approved withdrawal of Kshs.6.26 billion from the CRF account. The withdrawals represented 74.1 per cent of the Approved Supplementary Budget and translated to an increase of 15.1 per cent from Kshs.5.44 billion in FY 2017/18 and comprised of Kshs.4.53 billion (72.4 per cent) towards recurrent activities and Kshs.1.73 billion (27.6 per cent) for development expenditure.
3.38.5 Overall Expenditure ReviewA total of Kshs.5.7 billion was spent on both development and recurrent activities. This expenditure represented 91 per cent of the total funds released from the CRF account, and was an increase of 38.7 per cent from Kshs.4.11 billion spent in FY 2017/18.
The expenditure excluded pending bills as at June 30, 2019 which amounted to Kshs.187.42 million for development activities and Kshs.258.26 million for recurrent costs.
Expenditure on development programmes amounted to Kshs.1.18 billion while Kshs.4.53 billion was spent on recurrent activities. The development expenditure was 68.1 per cent of the funds released for development programmes, while recurrent expenditure was 99.9 per cent of funds released for recurrent activities.
Development expenditure recorded an absorption rate of 31.5 per cent, which was an increase from 30.5 per cent attained in FY 2017/18. Conversely, recurrent expenditure represented 96.1 per cent of the annual recurrent budget, an increase from 77.5 per cent recorded in FY 2017/18. Figure 3.151 presents a comparison between the total expenditure in FY 2018/19 and FY 2017/18.
Figure3.151: SiayaCounty,ExpenditurebyEconomicClassification
285
During the reporting period, receipts from the Road Maintenance Fuel Levy Fund, Kenya Urban Support Project,
DANIDA, and Compensation for User Fees Foregone recorded the highest performance in percentage terms,
accounting for 100 per cent of the respective annual target.
3.38.4 Exchequer Issues In order to implement the budget, the Controller of Budget approved withdrawal of Kshs.6.26 billion from the CRF
account. The withdrawals represented 74.1 per cent of the Approved Supplementary Budget and translated to an
increase of 15.1 per cent from Kshs.5.44 billion in FY 2017/18 and comprised of Kshs.4.53 billion (72.4 per cent)
towards recurrent activities and Kshs.1.73 billion (27.6 per cent) for development expenditure.
3.38.5 Overall Expenditure Review A total of Kshs.5.7 billion was spent on both development and recurrent activities. This expenditure represented 91 per
cent of the total funds released from the CRF account, and was an increase of 38.7 per cent from Kshs.4.11 billion spent
in FY 2017/18.
The expenditure excluded pending bills as at June 30, 2019 which amounted to Kshs.187.42 million for development
activities and Kshs.258.26 million for recurrent costs.
Expenditure on development programmes amounted to Kshs.1.18 billion while Kshs.4.53 billion was spent on recurrent
activities. The development expenditure was 68.1 per cent of the funds released for development programmes, while
recurrent expenditure was 99.9 per cent of funds released for recurrent activities.
Development expenditure recorded an absorption rate of 31.5 per cent, which was an increase from 30.5 per cent
attained in FY 2017/18. Conversely, recurrent expenditure represented 96.1 per cent of the annual recurrent budget, an
increase from 77.5 per cent recorded in FY 2017/18. Figure 3.151 presents a comparison between the total expenditure
in FY 2018/19 and FY 2017/18.
Figure 3.151: Siaya County, Expenditure by Economic Classification
2,397.3458.3%
936.1122.8% 777.57
18.9%
2,747.4748.2%
1,779.0631.2%
1,175.7120.6%
-
500
1,000
1,500
2,000
2,500
3,000
Personnel Emoluments Operations and Maintenance Development Expenditure
Ksh
s.Mill
ion
Expenditure by Economic Classification
FY 2017/18
FY 2018/19
Source: Siaya County Treasury

249
COUNTY GOVERNMENTS ANNUAL BUDGET IMPLEMENTATION REVIEW REPORT FOR FY 2018/19
3.38.6 Development Expenditure AnalysisThe total development expenditure of Kshs.1.18 billion represented 31.5 per cent of the annual development expenditure estimates of Kshs.3.74 billion. Table 3.111 provides a summary of development projects with the highest expenditure in the financial year.
Table 3.111: Siaya County, List of Development Projects with the Highest Expenditure in FY 2018/19
S/No. Project Name Project Location Project Budget (Kshs.)
Project Expend-iture (Kshs.)
Absorption Rate (%)
16. Construction of Siaya County Stadium Siaya town 180,000,000 85,303,489 47.4
17. Acquisition, Supervision and Installation of Hansard and Information Technology System Infrastructure and Equipment Development
County Assembly Cham-bers 60,735,050 32,897,056 54.2
18. Maintenance of River Yala and Lake Kanyaboli dykes Central Alego Ward 20,000,000 19,925,666 99.6
19. Preparation of Siaya County Spatial Plan County Headquarters 35,000,000 18,483,200 52.8
20. Provision of WAN and Internet services (Recurring de-velopment costs)
County Headquarters 18,000,000 18,000,000 100
21. Construction of County Annex Siaya County Headquarters 35,000,000 11,995,022 34.3
22. Development of East Uyoma Water Project (co-funding of the project)
East Uyoma Ward 10,000,000 9,915,691 99.2
23. Increasing access and quality of health care for the vul-nerable group through Universal Health Care
Spread across the entire County 20,000,000 9,000,000 45
24. Construction of Pap - Kodero Twin Box Culvert FL West Uyoma Ward 12,119,733 8,954,460 73.9
25. Routine Maintenance Of Ndai/Kanyaboli/Kubar Pr. Sch. /Obambo Pr. Sch. Road
Central Alego Ward 8,265,600 8,252,145 99.8
Source: Siaya County Treasury
3.38.7 Analysis of Recurrent ExpenditureThe total recurrent expenditure of Kshs.4.53 billion comprised of Kshs.2.75 billion (60.7 per cent) incurred on personnel emoluments and Kshs.1.78 billion (39.3 per cent) on operations and maintenance as shown in Figure 3.151.
Expenditure on personnel emoluments represented an increase of 14.6 per cent compared to FY 2017/18 when the County spent Kshs.2.40 billion and was 48.2 per cent of the total expenditure in FY 2018/19. Figure 3.152 shows a summary of operations and maintenance expenditure by major categories.

250
COUNTY GOVERNMENTS ANNUAL BUDGET IMPLEMENTATION REVIEW REPORT FOR FY 2018/19
Figure 3.152: Siaya County, Operations and Maintenance Expenditure by Major Categories in FY 2018/19
287
Source: Siaya County Treasury
The County spent Kshs.48.71 million on committee sitting allowances for the 43 MCAs and Speaker against the annual
budget allocation of Kshs.48.69 million. This represented an increase of 136 per cent compared to Kshs.20.64 million
spent in FY 2017/18. The average monthly sitting allowance translated to Kshs.94,395 per MCA against the SRC’s
recommended monthly ceiling of Kshs.124,800.
Expenditure on domestic and foreign travel amounted to Kshs.365.84 million, and comprised of Kshs.132.26 million
spent by the County Assembly and Kshs.233.58 million by the County Executive. This expenditure represented 6.9 per
cent of total recurrent expenditure and was an increase of 116.4 per cent compared to Kshs.169.02 million spent in FY
2017/18.
3.38.8 Budget Performance by County Department Table 3.112 shows a summary of the approved budget allocation and performance by department in FY 2018/19.
Table 3.112: Siaya County, Budget Performance by Department in the FY 2018/19
Department Budget Allocation (Kshs. Million)
Exchequer Issues (Kshs. Million)
Expenditure (Kshs. Million)
Expenditure to Exchequer Issues (%)
Absorption Rate (%)
Rec Dev Rec Dev Rec Dev Rec Dev Rec Dev Governance and Administration 571.08 39.77 571.08 19.34 569.47 12.00 99.7 62.0 99.7 30.2
Finance, and Economic Planning 640.30 13.94 585.22 8.54 640.16 7.90 109.
4 92.6 100.0 56.7
Agriculture, 282.06 264.30 269.78 103.70 281.17 41.06 104. 39.6 99.7 15.5
312.50
220.42
138.67
111.24 101.0275.57
53.34 48.71 43.98
0
50
100
150
200
250
300
350
Ksh
s. M
illio
n
Major Categories of Operations & Maintenance
Source: Siaya County Treasury
The County spent Kshs.48.71 million on committee sitting allowances for the 43 MCAs and Speaker against the annual budget allocation of Kshs.48.69 million. This represented an increase of 136 per cent compared to Kshs.20.64 million spent in FY 2017/18. The average monthly sitting allowance translated to Kshs.94,395 per MCA against the SRC’s recommended monthly ceiling of Kshs.124,800.
Expenditure on domestic and foreign travel amounted to Kshs.365.84 million, and comprised of Kshs.132.26 million spent by the County Assembly and Kshs.233.58 million by the County Executive. This expenditure represented 6.9 per cent of total recurrent expenditure and was an increase of 116.4 per cent compared to Kshs.169.02 million spent in FY 2017/18.
3.38.8 Budget Performance by County DepartmentTable 3.112 shows a summary of the approved budget allocation and performance by department in FY 2018/19.
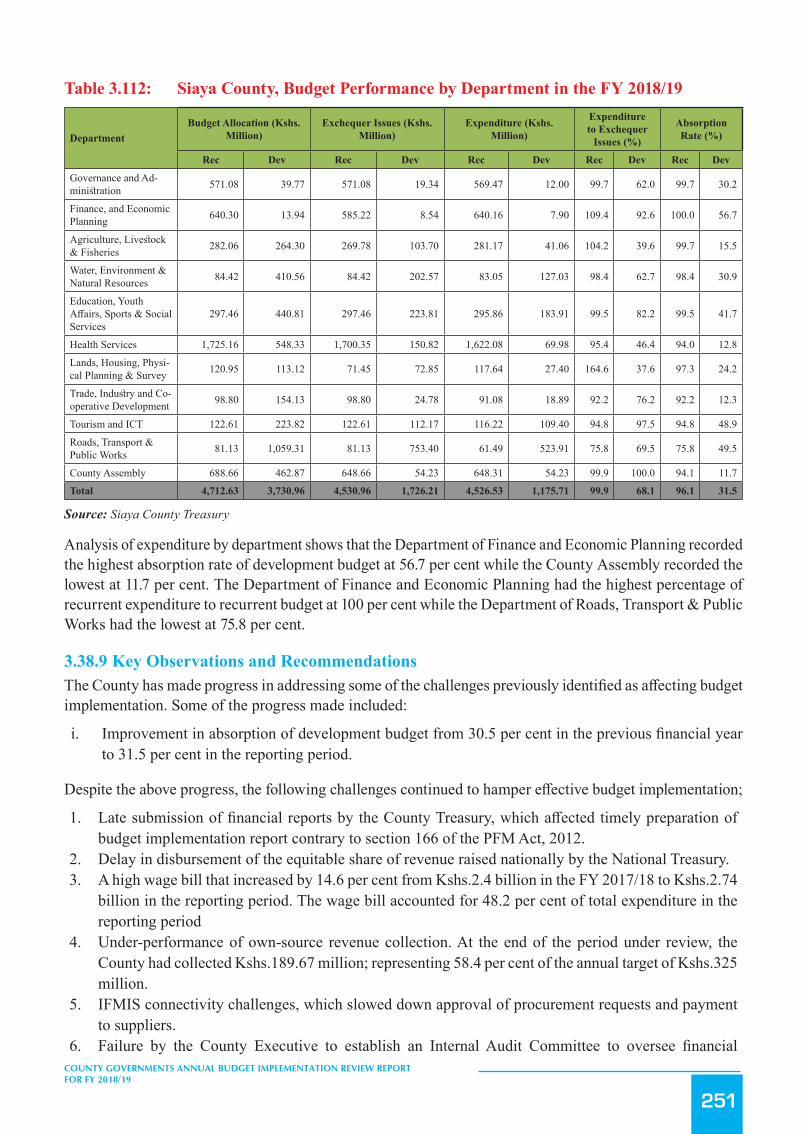
251
COUNTY GOVERNMENTS ANNUAL BUDGET IMPLEMENTATION REVIEW REPORT FOR FY 2018/19
Table 3.112: Siaya County, Budget Performance by Department in the FY 2018/19
DepartmentBudget Allocation (Kshs.
Million)Exchequer Issues (Kshs.
Million)Expenditure (Kshs.
Million)
Expenditure to Exchequer
Issues (%)
Absorption Rate (%)
Rec Dev Rec Dev Rec Dev Rec Dev Rec Dev
Governance and Ad-ministration 571.08 39.77 571.08 19.34 569.47 12.00 99.7 62.0 99.7 30.2
Finance, and Economic Planning 640.30 13.94 585.22 8.54 640.16 7.90 109.4 92.6 100.0 56.7
Agriculture, Livestock & Fisheries 282.06 264.30 269.78 103.70 281.17 41.06 104.2 39.6 99.7 15.5
Water, Environment & Natural Resources 84.42 410.56 84.42 202.57 83.05 127.03 98.4 62.7 98.4 30.9
Education, Youth Affairs, Sports & Social Services
297.46 440.81 297.46 223.81 295.86 183.91 99.5 82.2 99.5 41.7
Health Services 1,725.16 548.33 1,700.35 150.82 1,622.08 69.98 95.4 46.4 94.0 12.8
Lands, Housing, Physi-cal Planning & Survey 120.95 113.12 71.45 72.85 117.64 27.40 164.6 37.6 97.3 24.2
Trade, Industry and Co-operative Development 98.80 154.13 98.80 24.78 91.08 18.89 92.2 76.2 92.2 12.3
Tourism and ICT 122.61 223.82 122.61 112.17 116.22 109.40 94.8 97.5 94.8 48.9
Roads, Transport & Public Works 81.13 1,059.31 81.13 753.40 61.49 523.91 75.8 69.5 75.8 49.5
County Assembly 688.66 462.87 648.66 54.23 648.31 54.23 99.9 100.0 94.1 11.7
Total 4,712.63 3,730.96 4,530.96 1,726.21 4,526.53 1,175.71 99.9 68.1 96.1 31.5
Source: Siaya County Treasury
Analysis of expenditure by department shows that the Department of Finance and Economic Planning recorded the highest absorption rate of development budget at 56.7 per cent while the County Assembly recorded the lowest at 11.7 per cent. The Department of Finance and Economic Planning had the highest percentage of recurrent expenditure to recurrent budget at 100 per cent while the Department of Roads, Transport & Public Works had the lowest at 75.8 per cent.
3.38.9 Key Observations and RecommendationsThe County has made progress in addressing some of the challenges previously identified as affecting budget implementation. Some of the progress made included:
i. Improvement in absorption of development budget from 30.5 per cent in the previous financial year to 31.5 per cent in the reporting period.
Despite the above progress, the following challenges continued to hamper effective budget implementation;
1. Late submission of financial reports by the County Treasury, which affected timely preparation of budget implementation report contrary to section 166 of the PFM Act, 2012.
2. Delay in disbursement of the equitable share of revenue raised nationally by the National Treasury.3. A high wage bill that increased by 14.6 per cent from Kshs.2.4 billion in the FY 2017/18 to Kshs.2.74
billion in the reporting period. The wage bill accounted for 48.2 per cent of total expenditure in the reporting period
4. Under-performance of own-source revenue collection. At the end of the period under review, the County had collected Kshs.189.67 million; representing 58.4 per cent of the annual target of Kshs.325 million.
5. IFMIS connectivity challenges, which slowed down approval of procurement requests and payment to suppliers.
6. Failure by the County Executive to establish an Internal Audit Committee to oversee financial

252
COUNTY GOVERNMENTS ANNUAL BUDGET IMPLEMENTATION REVIEW REPORT FOR FY 2018/19
operations in the County contrary to Section 155 of the PFM Act, 2012.7. Delay by Fund Administrators to submit expenditure reports of the Car Loan and Mortgage Fund, and
Bursary Fund contrary to Section 168 of the PFM Act, 2012.8. Failure to constitute a County Budget and Economic Forum (CBEF) as per the requirement of Section
137 of the PFM Act, 2012 for consultation in the budget process.
The County should implement the following measures in order to improve budget execution;
1. The County Treasury should ensure timely preparation and submission of financial reports in line with Section 166 of PFM Act, 2012.
2. The County Treasury should liaise with the National Treasury to ensure that funds are released in a timely manner in line with the disbursement schedule.
3. The County Public Service Board should develop an optimal staffing structure and devise strategies to contain expenditure on personnel costs within 35 per cent of County’s total revenue in line with regulation 25(1) (b) of the PFM (County Government) Regulations, 2015.
4. The County Treasury should undertake a review aimed at enhancing own source revenue collection.5. The County should liaise with the IFMIS Directorate to address IFMIS connectivity issues.6. The County should establish an Internal Audit Committee and strengthen the internal audit function
in line with Section 155 of the PFM Act, 2012.7. All Fund Administrators should ensure timely submission of expenditure reports in line with Section
168 of the PFM Act, 2012.8. The County should constitute a County Budget and Economic Forum (CBEF) in line with Section 137
of the PFM Act, 2012.
3.39 Taita Taveta County
3.39.1 Overview of the FY 2018/19 BudgetThe County’s FY 2018/19 Supplementary Budget was Kshs.5.99 billion comprising of Kshs.3.96 billion (66.1 per cent) and Kshs.2.03 billion (33.9 per cent) allocation for recurrent and development expenditure respectively.
To finance the budget, the County expects to receive Kshs.4.05 billion (67.7 per cent) as equitable share of the revenue raised nationally, Kshs.1.28 billion (21.4 per cent) as total conditional grants, generate Kshs.300 million (5 per cent) from own sources of revenue, and Kshs.356.66 million (6 per cent) cash balance from FY 2017/18.
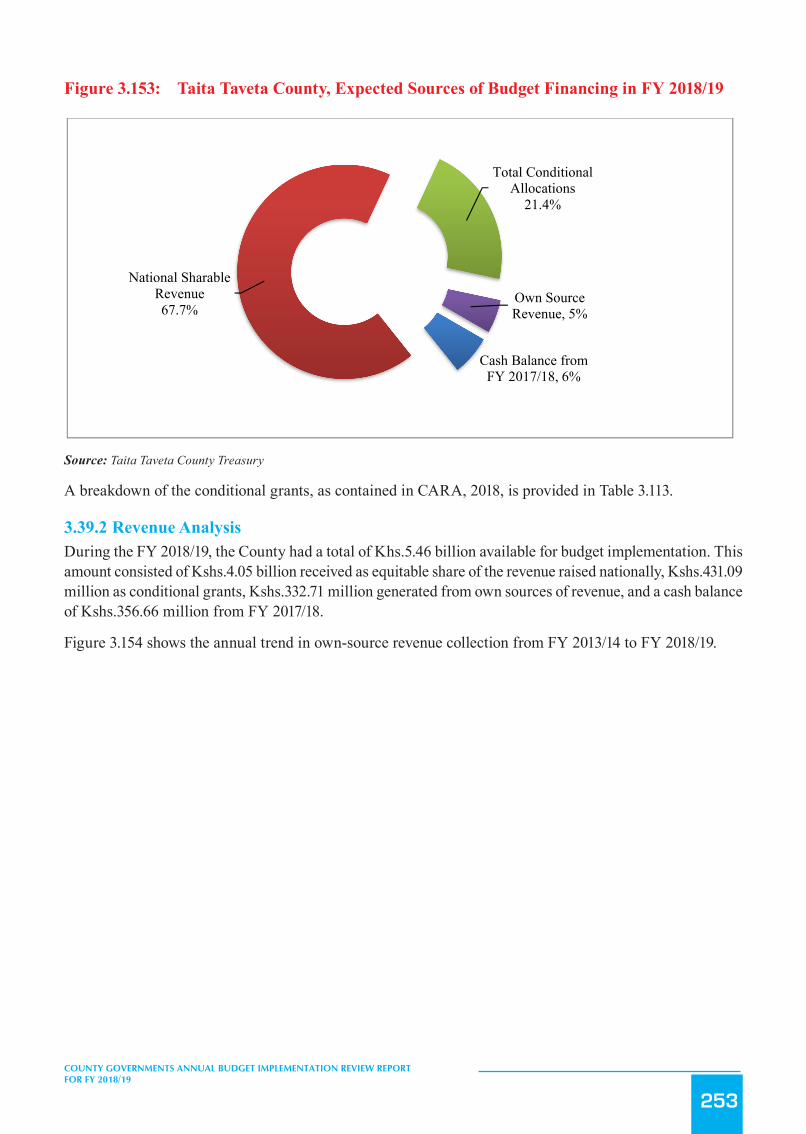
253
COUNTY GOVERNMENTS ANNUAL BUDGET IMPLEMENTATION REVIEW REPORT FOR FY 2018/19
Figure 3.153: Taita Taveta County, Expected Sources of Budget Financing in FY 2018/19
289
The County should implement the following measures in order to improve budget execution;
1. The County Treasury should ensure timely preparation and submission of financial reports in line with Section
166 of PFM Act, 2012.
2. The County Treasury should liaise with the National Treasury to ensure that funds are released in a timely
manner in line with the disbursement schedule.
3. The County Public Service Board should develop an optimal staffing structure and devise strategies to contain
expenditure on personnel costs within 35 per cent of County’s total revenue in line with regulation 25(1) (b) of the
PFM (County Government) Regulations, 2015.
4. The County Treasury should undertake a review aimed at enhancing own source revenue collection.
5. The County should liaise with the IFMIS Directorate to address IFMIS connectivity issues.
6. The County should establish an Internal Audit Committee and strengthen the internal audit function in line with
Section 155 of the PFM Act, 2012.
7. All Fund Administrators should ensure timely submission of expenditure reports in line with Section 168 of the
PFM Act, 2012.
8. The County should constitute a County Budget and Economic Forum (CBEF) in line with Section 137 of the PFM
Act, 2012.
3.39 Taita Taveta County
3.39.1 Overview of the FY 2018/19 Budget The County’s FY 2018/19 Supplementary Budget was Kshs.5.99 billion comprising of Kshs.3.96 billion (66.1 per cent)
and Kshs.2.03 billion (33.9 per cent) allocation for recurrent and development expenditure respectively.
To finance the budget, the County expects to receive Kshs.4.05 billion (67.7 per cent) as equitable share of the revenue
raised nationally, Kshs.1.28 billion (21.4 per cent) as total conditional grants, generate Kshs.300 million (5 per cent)
from own sources of revenue, and Kshs.356.66 million (6 per cent) cash balance from FY 2017/18.
Figure 3.153: Taita Taveta, County Expected Sources of Budget Financing in FY 2018/19
Source: Taita Taveta County Treasury
Cash Balance from FY 2017/18, 6%
National Sharable Revenue67.7%
Total Conditional Allocations
21.4%
Own Source Revenue, 5%
Source: Taita Taveta County Treasury
A breakdown of the conditional grants, as contained in CARA, 2018, is provided in Table 3.113.
3.39.2 Revenue AnalysisDuring the FY 2018/19, the County had a total of Khs.5.46 billion available for budget implementation. This amount consisted of Kshs.4.05 billion received as equitable share of the revenue raised nationally, Kshs.431.09 million as conditional grants, Kshs.332.71 million generated from own sources of revenue, and a cash balance of Kshs.356.66 million from FY 2017/18.
Figure 3.154 shows the annual trend in own-source revenue collection from FY 2013/14 to FY 2018/19.
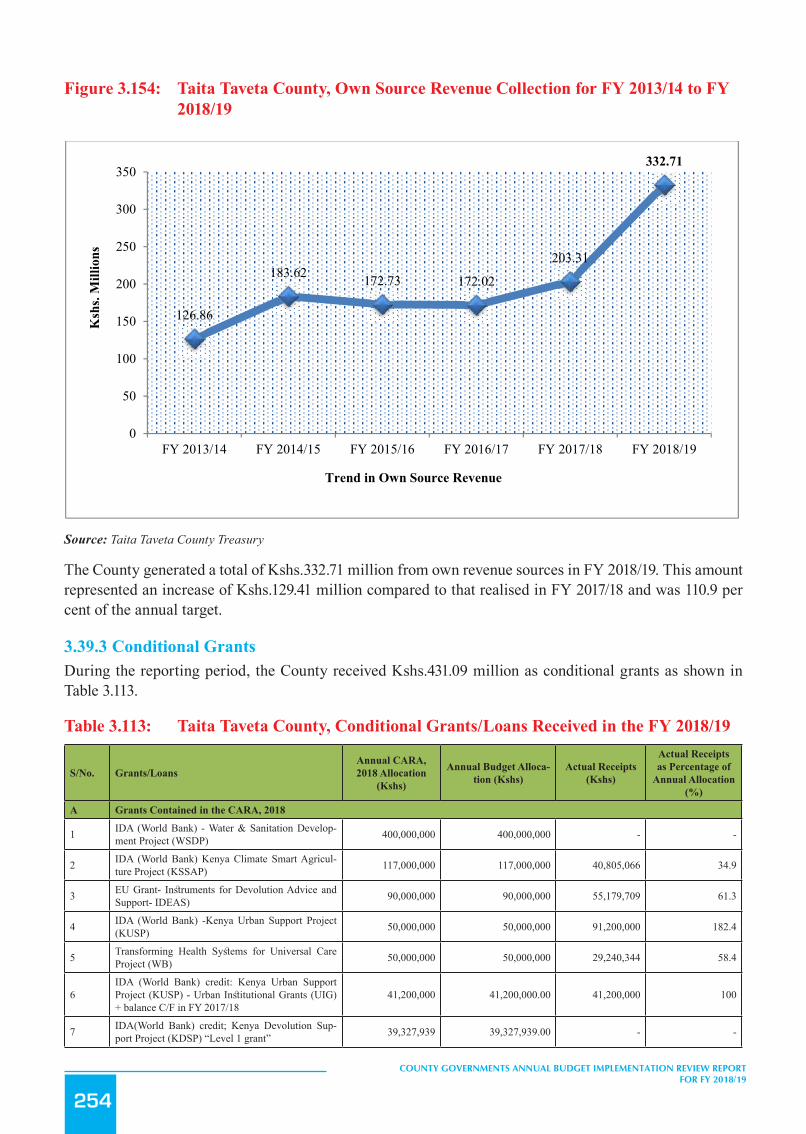
254
COUNTY GOVERNMENTS ANNUAL BUDGET IMPLEMENTATION REVIEW REPORT FOR FY 2018/19
Figure 3.154: Taita Taveta County, Own Source Revenue Collection for FY 2013/14 to FY 2018/19
290
A breakdown of the conditional grants, as contained in CARA, 2018, is provided in Table 3.113.
3.39.2 Revenue Analysis During the FY 2018/19, the County had a total of Khs.5.46 billion available for budget implementation. This amount
consisted of Kshs.4.05 billion received as equitable share of the revenue raised nationally, Kshs.431.09 million as
conditional grants, Kshs.332.71 million generated from own sources of revenue, and a cash balance of Kshs.356.66
million from FY 2017/18.
Figure 3.154 shows the annual trend in own-source revenue collection from FY 2013/14 to FY 2018/19.
Figure 3.154: Taita Taveta County, Own Source Revenue Collection for FY 2013/14 to FY 2018/19
Source: Taita Taveta County Treasury
The County generated a total of Kshs.332.71 million from own revenue sources in FY 2018/19. This amount
represented an increase of Kshs.129.41 million compared to that realised in FY 2017/18 and was 110.9 per cent of the
annual target.
3.39.3 Conditional Grants During the reporting period, the County received Kshs.431.09 million as conditional grants as shown in Table 3.113.
Table 3.113: Taita Taveta County, Conditional Grants/Loans Received in the FY 2018/19
S/No. Grants/Loans Annual CARA, 2018 Allocation (Kshs)
Annual Budget Allocation (Kshs)
Actual Receipts (Kshs)
Actual Receipts as Percentage of Annual Allocation (%)
A Grants Contained in the CARA, 2018
126.86
183.62 172.73 172.02
203.31
332.71
0
50
100
150
200
250
300
350
FY 2013/14 FY 2014/15 FY 2015/16 FY 2016/17 FY 2017/18 FY 2018/19
Ksh
s. M
illio
ns
Trend in Own Source Revenue
Source: Taita Taveta County Treasury
The County generated a total of Kshs.332.71 million from own revenue sources in FY 2018/19. This amount represented an increase of Kshs.129.41 million compared to that realised in FY 2017/18 and was 110.9 per cent of the annual target.
3.39.3 Conditional GrantsDuring the reporting period, the County received Kshs.431.09 million as conditional grants as shown in Table 3.113.
Table 3.113: Taita Taveta County, Conditional Grants/Loans Received in the FY 2018/19
S/No. Grants/LoansAnnual CARA, 2018 Allocation
(Kshs)
Annual Budget Alloca-tion (Kshs)
Actual Receipts (Kshs)
Actual Receipts as Percentage of
Annual Allocation (%)
A Grants Contained in the CARA, 2018
1 IDA (World Bank) - Water & Sanitation Develop-ment Project (WSDP) 400,000,000 400,000,000 - -
2 IDA (World Bank) Kenya Climate Smart Agricul-ture Project (KSSAP) 117,000,000 117,000,000 40,805,066 34.9
3 EU Grant- Instruments for Devolution Advice and Support- IDEAS) 90,000,000 90,000,000 55,179,709 61.3
4 IDA (World Bank) -Kenya Urban Support Project (KUSP) 50,000,000 50,000,000 91,200,000 182.4
5 Transforming Health Systems for Universal Care Project (WB) 50,000,000 50,000,000 29,240,344 58.4
6IDA (World Bank) credit: Kenya Urban Support Project (KUSP) - Urban Institutional Grants (UIG) + balance C/F in FY 2017/18
41,200,000 41,200,000.00 41,200,000 100
7 IDA(World Bank) credit; Kenya Devolution Sup-port Project (KDSP) “Level 1 grant” 39,327,939 39,327,939.00 - -
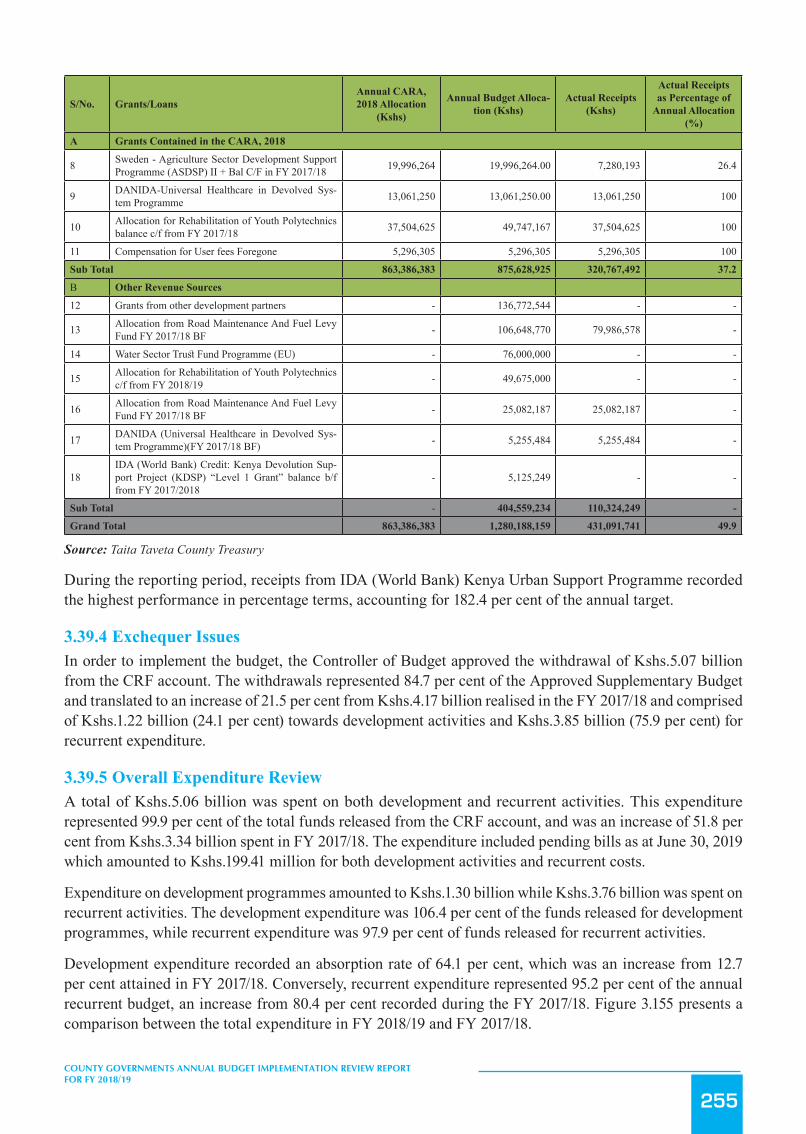
255
COUNTY GOVERNMENTS ANNUAL BUDGET IMPLEMENTATION REVIEW REPORT FOR FY 2018/19
S/No. Grants/LoansAnnual CARA, 2018 Allocation
(Kshs)
Annual Budget Alloca-tion (Kshs)
Actual Receipts (Kshs)
Actual Receipts as Percentage of
Annual Allocation (%)
A Grants Contained in the CARA, 2018
8 Sweden - Agriculture Sector Development Support Programme (ASDSP) II + Bal C/F in FY 2017/18 19,996,264 19,996,264.00 7,280,193 26.4
9 DANIDA-Universal Healthcare in Devolved Sys-tem Programme 13,061,250 13,061,250.00 13,061,250 100
10 Allocation for Rehabilitation of Youth Polytechnics balance c/f from FY 2017/18 37,504,625 49,747,167 37,504,625 100
11 Compensation for User fees Foregone 5,296,305 5,296,305 5,296,305 100
Sub Total 863,386,383 875,628,925 320,767,492 37.2
B Other Revenue Sources
12 Grants from other development partners - 136,772,544 - -
13 Allocation from Road Maintenance And Fuel Levy Fund FY 2017/18 BF - 106,648,770 79,986,578 -
14 Water Sector Trust Fund Programme (EU) - 76,000,000 - -
15 Allocation for Rehabilitation of Youth Polytechnics c/f from FY 2018/19 - 49,675,000 - -
16 Allocation from Road Maintenance And Fuel Levy Fund FY 2017/18 BF - 25,082,187 25,082,187 -
17 DANIDA (Universal Healthcare in Devolved Sys-tem Programme)(FY 2017/18 BF) - 5,255,484 5,255,484 -
18IDA (World Bank) Credit: Kenya Devolution Sup-port Project (KDSP) “Level 1 Grant” balance b/f from FY 2017/2018
- 5,125,249 - -
Sub Total - 404,559,234 110,324,249 -
Grand Total 863,386,383 1,280,188,159 431,091,741 49.9
Source: Taita Taveta County Treasury
During the reporting period, receipts from IDA (World Bank) Kenya Urban Support Programme recorded the highest performance in percentage terms, accounting for 182.4 per cent of the annual target.
3.39.4 Exchequer IssuesIn order to implement the budget, the Controller of Budget approved the withdrawal of Kshs.5.07 billion from the CRF account. The withdrawals represented 84.7 per cent of the Approved Supplementary Budget and translated to an increase of 21.5 per cent from Kshs.4.17 billion realised in the FY 2017/18 and comprised of Kshs.1.22 billion (24.1 per cent) towards development activities and Kshs.3.85 billion (75.9 per cent) for recurrent expenditure.
3.39.5 Overall Expenditure ReviewA total of Kshs.5.06 billion was spent on both development and recurrent activities. This expenditure represented 99.9 per cent of the total funds released from the CRF account, and was an increase of 51.8 per cent from Kshs.3.34 billion spent in FY 2017/18. The expenditure included pending bills as at June 30, 2019 which amounted to Kshs.199.41 million for both development activities and recurrent costs.
Expenditure on development programmes amounted to Kshs.1.30 billion while Kshs.3.76 billion was spent on recurrent activities. The development expenditure was 106.4 per cent of the funds released for development programmes, while recurrent expenditure was 97.9 per cent of funds released for recurrent activities.
Development expenditure recorded an absorption rate of 64.1 per cent, which was an increase from 12.7 per cent attained in FY 2017/18. Conversely, recurrent expenditure represented 95.2 per cent of the annual recurrent budget, an increase from 80.4 per cent recorded during the FY 2017/18. Figure 3.155 presents a comparison between the total expenditure in FY 2018/19 and FY 2017/18.

256
COUNTY GOVERNMENTS ANNUAL BUDGET IMPLEMENTATION REVIEW REPORT FOR FY 2018/19
Figure3.155: TaitaTavetaCounty,ExpenditurebyEconomicClassification
292
spent in FY 2017/18. The expenditure included pending bills as at June 30, 2019 which amounted to Kshs.199.41
million for both development activities and recurrent costs.
Expenditure on development programmes amounted to Kshs.1.30 billion while Kshs.3.76 billion was spent on recurrent
activities. The development expenditure was 106.4 per cent of the funds released for development programmes, while
recurrent expenditure was 97.9 per cent of funds released for recurrent activities.
Development expenditure recorded an absorption rate of 64.1 per cent, which was an increase from 12.7 per cent
attained in FY 2017/18. Conversely, recurrent expenditure represented 95.2 per cent of the annual recurrent budget, an
increase from 80.4 per cent recorded during the FY 2017/18. Figure 3.155 presents a comparison between the total
expenditure in FY 2018/19 and FY 2017/18.
Figure 3.155: Taita Taveta County, Expenditure by Economic Classification
Source: Taita Taveta County Treasury
3.39.6 Development Expenditure Analysis The total development expenditure of Kshs.1.30 billion represented 64.1 per cent of the annual development
expenditure budget of Kshs.2.03 billion. Table 3.114 provides a summary of development projects with the highest
expenditure in the financial year.
Table 3.114: Taita Taveta County, List of Development Projects with the Highest Expenditure
in FY 2018/19
S/No. Project Name Project Location Project Budget (Kshs.)
Project Expenditure (Kshs.)
Absorption Rate (%)
1 Construction of ECD Classrooms County Wide 89,023,868 86,296,719 97 2 Water Projects & Bore Hole County Wide 187,475,783 185,303,796 99 3 Construction and Maintenance of Access Roads County Wide 131,730,957 127,303,554 97
2,150.33(64.4%)
980.78(29.4%)
206.45(6.2%)
2,244.75(44.3%)
1,520.21(30.0%)
1,301.83(25.7%)
-
500
1,000
1,500
2,000
2,500
Personnel Emoluments Operations and Maintenance Development Expenditure
Ksh
s.Mill
ion
Expenditure by Economic Classification
FY 2017/18
FY 2018/19
Source: Taita Taveta County Treasury
3.39.6 Development Expenditure AnalysisThe total development expenditure of Kshs.1.30 billion represented 64.1 per cent of the annual development expenditure budget of Kshs.2.03 billion. Table 3.114 provides a summary of development projects with the highest expenditure in the financial year.
Table 3.114: Taita Taveta County, List of Development Projects with the Highest Expenditure in FY 2018/19
S/No. Project Name Project Location Project Budget (Kshs.)
Project Expendi-ture (Kshs.)
Absorption Rate (%)
1 Construction of ECD Classrooms County Wide 89,023,868 86,296,719 97
2 Water Projects & Bore Hole County Wide 187,475,783 185,303,796 99
3 Construction and Maintenance of Access Roads County Wide 131,730,957 127,303,554 97
4 Vocational Training Centre (VTC) Capitation & support programme County Wide 125,441,767 124,459,470 99
5 Completion and maintenance of access roads-Roads Levy County Wide 75,277,932 73,159,328 97
6 Construction of Mwatate Administration offices Pending Bill
Mwatate Administra-tion 23,300,000 22,090,388 95
7 Completion and renovation of various Medical centres, Equipping and Stocking of Medical drugs County Wide 74,874,999 67,902,308 91
8 Purchase of Artificial Insemination Semen Kit, Vaccines and Certified Crop Seed Headquarter 56,529,465 54,316,766 96
9 Refurbishment of County Assembly Headquarter Headquarter 65,000,000 30,309,437 47
10 Purchase of ICT Networking and Communication Equip-ment Headquarter 14,500,000 11,968,061 83
Source: Taita Taveta County Treasury

257
COUNTY GOVERNMENTS ANNUAL BUDGET IMPLEMENTATION REVIEW REPORT FOR FY 2018/19
3.39.7 Analysis of Recurrent ExpenditureThe total recurrent expenditure of Kshs.3.76 billion comprised of Kshs.2.24 billion (59.6 per cent) incurred on personnel emoluments and Kshs.1.52 billion (40.4 per cent) on operations and maintenance as shown in Figure 3.155.
Expenditure on personnel emoluments represented an increase of 4.4 per cent compared to FY 2017/18 when the County spent Kshs.2.15 billion and was 64.4 per cent of the total expenditure in FY 2018/19. Figure 3.156 shows a summary of operations and maintenance expenditure by major categories.
Figure 3.156: Taita Taveta County, Operations and Maintenance Expenditure by Major Categories in FY 2018/19
294
Source: Taita Taveta County Treasury
The County spent Kshs.20.65 million on committee sitting allowances for the 34 MCAs and Speaker against the annual
budget allocation of Kshs.23.95 million. This represented a decrease of 37.3 per cent compared to Kshs.32.95 million
spent in FY 2017/18. The average monthly sitting allowance translated to Kshs.50,620 per MCA against the SRC’s
recommended monthly ceiling of Kshs.124,800.
Expenditure on domestic and foreign travel amounted to Kshs.470.25 million and comprised of Kshs.188.77 million
spent by the County Assembly and Kshs.281.47 million by the County Executive.
3.39.8 Budget Performance by County Department Table 3.115 shows a summary of the approved budget allocation and performance by department in FY 2018/19.
Table 3.115: Taita Taveta County, Budget Performance by Department in the FY 2018/19
Department
Budget Allocation (Kshs. Million)
Exchequer Issues (Kshs. Million)
Total Expenditure (Kshs. Million)
Total Expenditure to Exchequer Issues (%)
Absorption Rate (%)
Rec Dev Rec Dev Rec Dev Rec Dev Rec Dev
374.75
135.00 130.30 129.51
95.48
58.28 52.50 51.15 47.5420.65
0
50
100
150
200
250
300
350
400
Kshs
. Mill
ion
Major Categories of Operations & Maintenance
Source: Taita Taveta County Treasury
The County spent Kshs.20.65 million on committee sitting allowances for the 34 MCAs and Speaker against the annual budget allocation of Kshs.23.95 million. This represented a decrease of 37.3 per cent compared to Kshs.32.95 million spent in FY 2017/18. The average monthly sitting allowance translated to Kshs.50,620 per MCA against the SRC’s recommended monthly ceiling of Kshs.124,800.
Expenditure on domestic and foreign travel amounted to Kshs.470.25 million and comprised of Kshs.188.77 million spent by the County Assembly and Kshs.281.47 million by the County Executive.
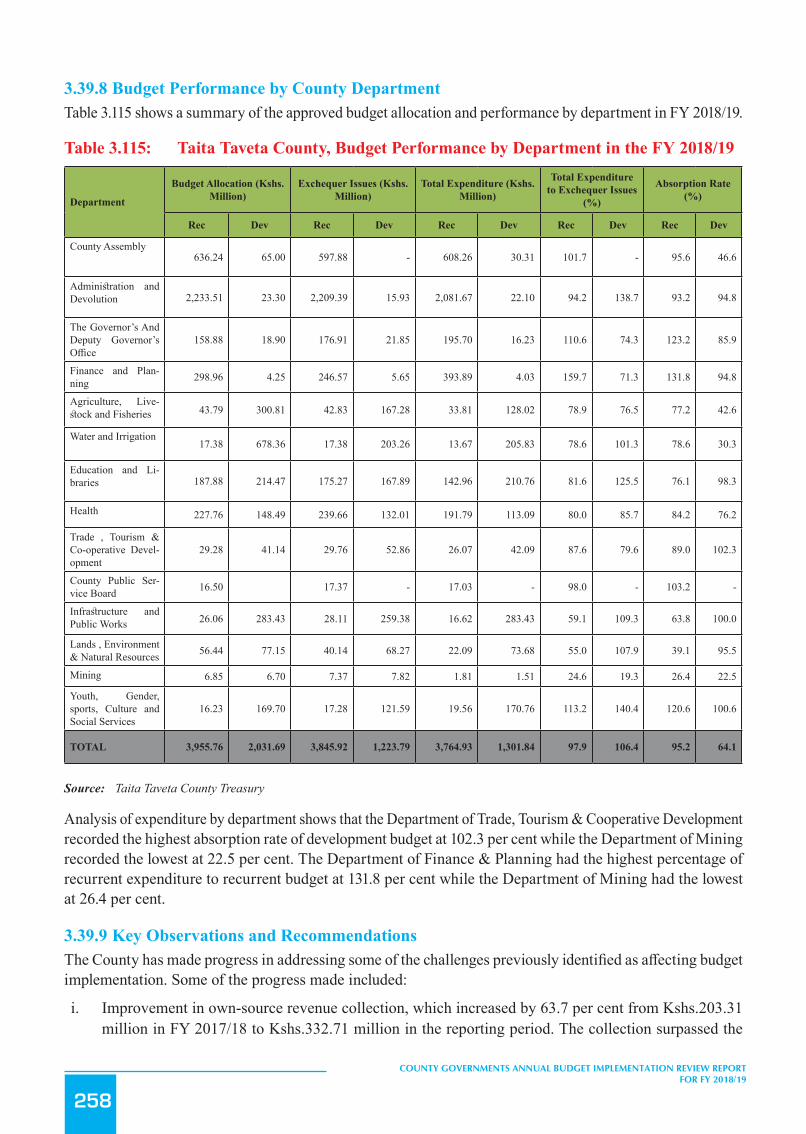
258
COUNTY GOVERNMENTS ANNUAL BUDGET IMPLEMENTATION REVIEW REPORT FOR FY 2018/19
3.39.8 Budget Performance by County DepartmentTable 3.115 shows a summary of the approved budget allocation and performance by department in FY 2018/19.
Table 3.115: Taita Taveta County, Budget Performance by Department in the FY 2018/19
Department
Budget Allocation (Kshs. Million)
Exchequer Issues (Kshs. Million)
Total Expenditure (Kshs. Million)
Total Expenditure to Exchequer Issues
(%)
Absorption Rate (%)
Rec Dev Rec Dev Rec Dev Rec Dev Rec Dev
County Assembly 636.24 65.00 597.88 - 608.26 30.31 101.7 - 95.6 46.6
Administration and Devolution 2,233.51 23.30 2,209.39 15.93 2,081.67 22.10 94.2 138.7 93.2 94.8
The Governor’s And Deputy Governor’s Office
158.88 18.90 176.91 21.85 195.70 16.23 110.6 74.3 123.2 85.9
Finance and Plan-ning 298.96 4.25 246.57 5.65 393.89 4.03 159.7 71.3 131.8 94.8
Agriculture, Live-stock and Fisheries 43.79 300.81 42.83 167.28 33.81 128.02 78.9 76.5 77.2 42.6
Water and Irrigation 17.38 678.36 17.38 203.26 13.67 205.83 78.6 101.3 78.6 30.3
Education and Li-braries 187.88 214.47 175.27 167.89 142.96 210.76 81.6 125.5 76.1 98.3
Health 227.76 148.49 239.66 132.01 191.79 113.09 80.0 85.7 84.2 76.2
Trade , Tourism & Co-operative Devel-opment
29.28 41.14 29.76 52.86 26.07 42.09 87.6 79.6 89.0 102.3
County Public Ser-vice Board 16.50 17.37 - 17.03 - 98.0 - 103.2 -
Infrastructure and Public Works 26.06 283.43 28.11 259.38 16.62 283.43 59.1 109.3 63.8 100.0
Lands , Environment & Natural Resources 56.44 77.15 40.14 68.27 22.09 73.68 55.0 107.9 39.1 95.5
Mining 6.85 6.70 7.37 7.82 1.81 1.51 24.6 19.3 26.4 22.5
Youth, Gender, sports, Culture and Social Services
16.23 169.70 17.28 121.59 19.56 170.76 113.2 140.4 120.6 100.6
TOTAL 3,955.76 2,031.69 3,845.92 1,223.79 3,764.93 1,301.84 97.9 106.4 95.2 64.1
Source: Taita Taveta County Treasury
Analysis of expenditure by department shows that the Department of Trade, Tourism & Cooperative Development recorded the highest absorption rate of development budget at 102.3 per cent while the Department of Mining recorded the lowest at 22.5 per cent. The Department of Finance & Planning had the highest percentage of recurrent expenditure to recurrent budget at 131.8 per cent while the Department of Mining had the lowest at 26.4 per cent.
3.39.9 Key Observations and RecommendationsThe County has made progress in addressing some of the challenges previously identified as affecting budget implementation. Some of the progress made included:
i. Improvement in own-source revenue collection, which increased by 63.7 per cent from Kshs.203.31 million in FY 2017/18 to Kshs.332.71 million in the reporting period. The collection surpassed the
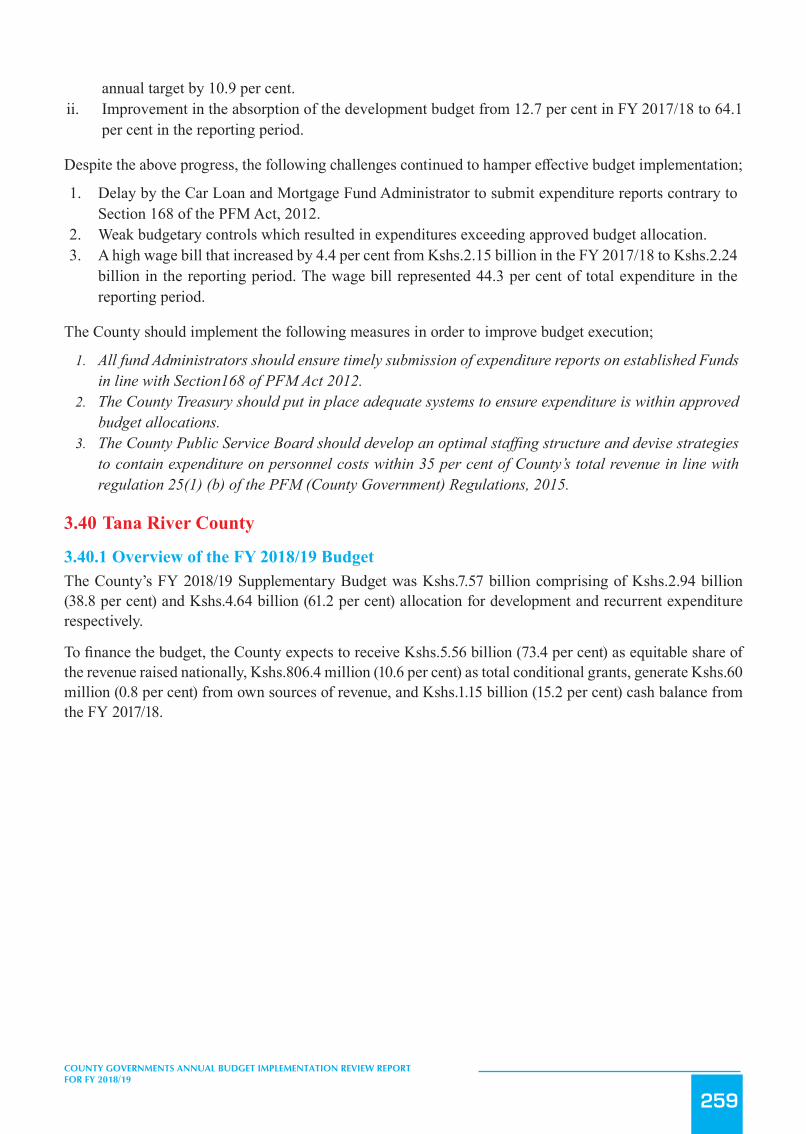
259
COUNTY GOVERNMENTS ANNUAL BUDGET IMPLEMENTATION REVIEW REPORT FOR FY 2018/19
annual target by 10.9 per cent.ii. Improvement in the absorption of the development budget from 12.7 per cent in FY 2017/18 to 64.1
per cent in the reporting period.
Despite the above progress, the following challenges continued to hamper effective budget implementation;
1. Delay by the Car Loan and Mortgage Fund Administrator to submit expenditure reports contrary to Section 168 of the PFM Act, 2012.
2. Weak budgetary controls which resulted in expenditures exceeding approved budget allocation.3. A high wage bill that increased by 4.4 per cent from Kshs.2.15 billion in the FY 2017/18 to Kshs.2.24
billion in the reporting period. The wage bill represented 44.3 per cent of total expenditure in the reporting period.
The County should implement the following measures in order to improve budget execution;
1. All fund Administrators should ensure timely submission of expenditure reports on established Funds in line with Section168 of PFM Act 2012.
2. The County Treasury should put in place adequate systems to ensure expenditure is within approved budget allocations.
3. The County Public Service Board should develop an optimal staffing structure and devise strategies to contain expenditure on personnel costs within 35 per cent of County’s total revenue in line with regulation 25(1) (b) of the PFM (County Government) Regulations, 2015.
3.40 Tana River County
3.40.1 Overview of the FY 2018/19 BudgetThe County’s FY 2018/19 Supplementary Budget was Kshs.7.57 billion comprising of Kshs.2.94 billion (38.8 per cent) and Kshs.4.64 billion (61.2 per cent) allocation for development and recurrent expenditure respectively.
To finance the budget, the County expects to receive Kshs.5.56 billion (73.4 per cent) as equitable share of the revenue raised nationally, Kshs.806.4 million (10.6 per cent) as total conditional grants, generate Kshs.60 million (0.8 per cent) from own sources of revenue, and Kshs.1.15 billion (15.2 per cent) cash balance from the FY 2017/18.

260
COUNTY GOVERNMENTS ANNUAL BUDGET IMPLEMENTATION REVIEW REPORT FOR FY 2018/19
Figure 3.157: Tana River County, Expected Sources of Budget Financing in FY 2018/19
297
Source: Tana River County Treasury
A breakdown of the conditional grants is provided in Table 3.116.
3.40.2 Revenue Analysis During the FY 2018/19, the County had a total of Khs.7.20 billion available for budget implementation. This amount
consisted of Kshs.5.56 billion received as equitable share of the revenue raised nationally, Kshs.430.57 million as
conditional grants, Kshs.63.56 million generated from own sources of revenue, and a cash balance of Kshs.1.15 billion
from FY 2017/18.
Figure 3.158 shows the annual trend in own-source revenue collection from FY 2013/14 to FY 2018/19.
Figure 3.158: Tana River County, Own Source Revenue Collection for FY 2013/14 to FY 2018/19
Cash Balance from FY 2017/18
15.2%
National Sharable Revenue73.4%
Total Conditional Allocations
10.6%Own Source
Revenue0.8%
Source: Tana River County Treasury
A breakdown of the conditional grants is provided in Table 3.116.
3.40.2 Revenue AnalysisDuring the FY 2018/19, the County had a total of Khs.7.20 billion available for budget implementation. This amount consisted of Kshs.5.56 billion received as equitable share of the revenue raised nationally, Kshs.430.57 million as conditional grants, Kshs.63.56 million generated from own sources of revenue, and a cash balance of Kshs.1.15 billion from FY 2017/18.
Figure 3.158 shows the annual trend in own-source revenue collection from FY 2013/14 to FY 2018/19.
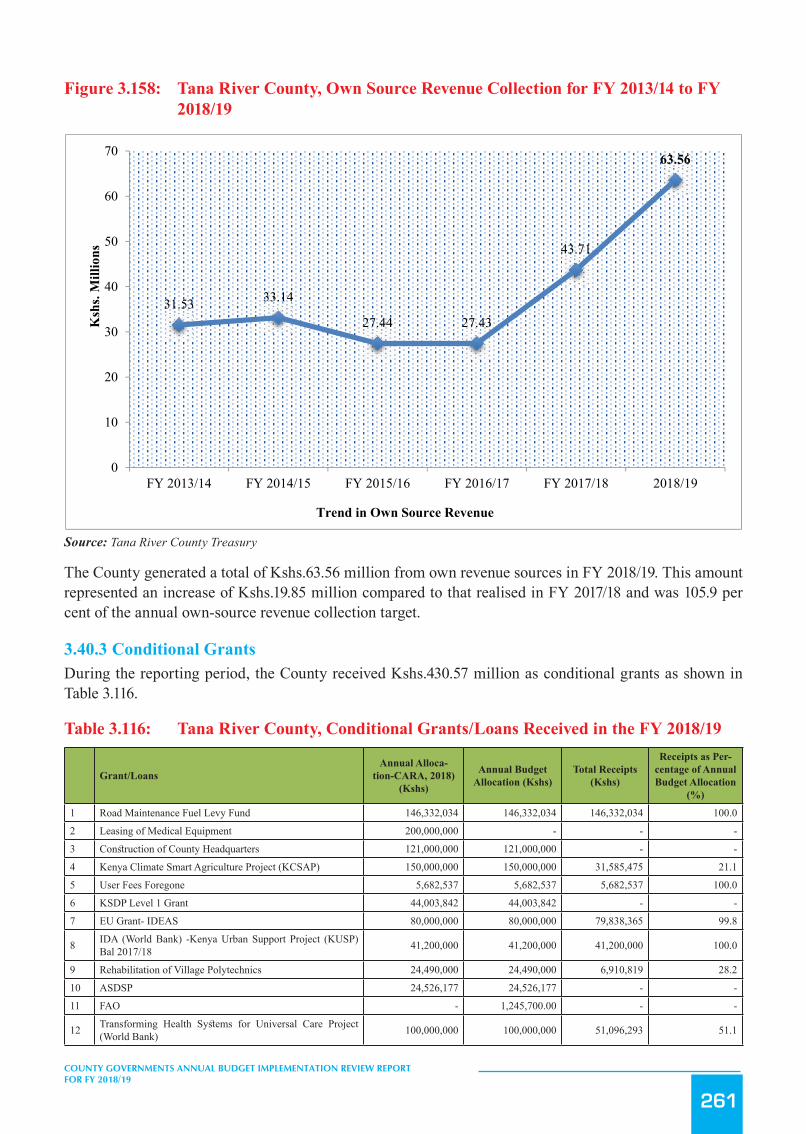
261
COUNTY GOVERNMENTS ANNUAL BUDGET IMPLEMENTATION REVIEW REPORT FOR FY 2018/19
Figure 3.158: Tana River County, Own Source Revenue Collection for FY 2013/14 to FY 2018/19
298
Source: Tana River County Treasury
The County generated a total of Kshs.63.56 million from own revenue sources in FY 2018/19. This amount represented
an increase of Kshs.19.85 million compared to that realised in FY 2017/18 and was 105.9 per cent of the annual
own-source revenue collection target.
3.40.3 Conditional Grants During the reporting period, the County received Kshs.430.57 million as conditional grants as shown in Table 3.116.
Table 3.116: Tana River County, Conditional Grants/Loans Received in the FY 2018/19
Grant/Loans Annual Allocation-CARA, 2018) (Kshs)
Annual Budget Allocation (Kshs)
Total Receipts (Kshs)
Receipts as Percentage of Annual Budget Allocation (%)
1 Road Maintenance Fuel Levy Fund 146,332,034 146,332,034 146,332,034 100.0 2 Leasing of Medical Equipment 200,000,000 - - - 3 Construction of County Headquarters 121,000,000 121,000,000 - -
4 Kenya Climate Smart Agriculture Project (KCSAP) 150,000,000 150,000,000 31,585,475
21.1
5 User Fees Foregone 5,682,537 5,682,537 5,682,537 100.0
6 KSDP Level 1 Grant 44,003,842 44,003,842 -
-
7 EU Grant- IDEAS 80,000,000 80,000,000 79,838,365 99.8
8 IDA (World Bank) -Kenya Urban Support Project (KUSP) Bal 2017/18 41,200,000 41,200,000 41,200,000 100.0
9 Rehabilitation of Village Polytechnics 24,490,000 24,490,000 6,910,819 28.2 10 ASDSP 24,526,177 24,526,177 - - 11 FAO - 1,245,700.00 - -
12 Transforming Health Systems for Universal Care Project (World Bank) 100,000,000 100,000,000 51,096,293 51.1
13 Kenya Urban Support Project (KUSP) 50,000,000 50,000,000 50,000,000 100.0
14 DANIDA - Universal Healthcare in Devolved System Programme 17,921,250 17,921,250 17,921,250 100.0
31.53 33.14
27.44 27.43
43.71
63.56
0
10
20
30
40
50
60
70
FY 2013/14 FY 2014/15 FY 2015/16 FY 2016/17 FY 2017/18 2018/19
Ksh
s. M
illio
ns
Trend in Own Source Revenue
Source: Tana River County Treasury
The County generated a total of Kshs.63.56 million from own revenue sources in FY 2018/19. This amount represented an increase of Kshs.19.85 million compared to that realised in FY 2017/18 and was 105.9 per cent of the annual own-source revenue collection target.
3.40.3 Conditional GrantsDuring the reporting period, the County received Kshs.430.57 million as conditional grants as shown in Table 3.116.
Table 3.116: Tana River County, Conditional Grants/Loans Received in the FY 2018/19
Grant/LoansAnnual Alloca-
tion-CARA, 2018)(Kshs)
Annual Budget Allocation (Kshs)
Total Receipts (Kshs)
Receipts as Per-centage of Annual Budget Allocation
(%)
1 Road Maintenance Fuel Levy Fund 146,332,034 146,332,034 146,332,034 100.0
2 Leasing of Medical Equipment 200,000,000 - - -
3 Construction of County Headquarters 121,000,000 121,000,000 - -
4 Kenya Climate Smart Agriculture Project (KCSAP) 150,000,000 150,000,000 31,585,475 21.1
5 User Fees Foregone 5,682,537 5,682,537 5,682,537 100.0
6 KSDP Level 1 Grant 44,003,842 44,003,842 - -
7 EU Grant- IDEAS 80,000,000 80,000,000 79,838,365 99.8
8 IDA (World Bank) -Kenya Urban Support Project (KUSP) Bal 2017/18 41,200,000 41,200,000 41,200,000 100.0
9 Rehabilitation of Village Polytechnics 24,490,000 24,490,000 6,910,819 28.2
10 ASDSP 24,526,177 24,526,177 - -
11 FAO - 1,245,700.00 - -
12 Transforming Health Systems for Universal Care Project (World Bank) 100,000,000 100,000,000 51,096,293 51.1

262
COUNTY GOVERNMENTS ANNUAL BUDGET IMPLEMENTATION REVIEW REPORT FOR FY 2018/19
Grant/LoansAnnual Alloca-
tion-CARA, 2018)(Kshs)
Annual Budget Allocation (Kshs)
Total Receipts (Kshs)
Receipts as Per-centage of Annual Budget Allocation
(%)
13 Kenya Urban Support Project (KUSP) 50,000,000 50,000,000 50,000,000 100.0
14 DANIDA - Universal Healthcare in Devolved System Pro-gramme 17,921,250 17,921,250 17,921,250 100.0
Total 1,005,155,840 806,401,540 430,566,773 42.8
Source: Tana River County Treasury
During the reporting period, receipts from the Road Maintenance Fuel Levy, User Fees Foregone, Kenya Urban Support Programmes and DANIDA conditional grants recorded the highest performance in percentage terms, and accounted for 100 per cent of the respective annual target.
3.40.4 Exchequer IssuesIn order to implement the budget, the Controller of Budget approved withdrawal of Kshs.6.08 billion from the CRF account. The withdrawals represented 80.2 per cent of the Approved Supplementary Budget and translated to an increase of 56 per cent from Kshs.3.90 billion in FY 2017/18 and comprised of Kshs.1.69 billion (27.8 per cent) towards development activities and Kshs.4.39 billion (72.2 per cent) for recurrent expenditure.
3.40.5 Overall Expenditure ReviewA total of Kshs.4.79 billion was spent on both development and recurrent activities. This expenditure represented 79.8 per cent of the total funds released from the CRF account, and was an increase of 50.8 per cent from Kshs.3.18 billion spent in the FY 2017/18.
The expenditure excluded pending bills as at June 30, 2019 which amounted to Kshs.891.60 million for development activities and Kshs.490.51 million for recurrent costs.
Expenditure on development programmes amounted to Kshs.1.59 billion while Kshs.3.20 billion was spent on recurrent activities. The development expenditure was 94 per cent of the funds released for development programmes, while recurrent expenditure was 73 per cent of funds released for recurrent activities.
Development expenditure recorded an absorption rate of 54.1 per cent, which was an increase from 37.4 per cent attained in FY 2017/18. Conversely, recurrent expenditure represented 69.1 per cent of the annual recurrent budget, an increase from 59.9 per cent recorded in FY 2017/18.
Figure 3.159 presents a comparison between the total expenditure in FY 2018/19 and FY 2017/18.

263
COUNTY GOVERNMENTS ANNUAL BUDGET IMPLEMENTATION REVIEW REPORT FOR FY 2018/19
Figure3.159: TanaRiverCounty,ExpenditurebyEconomicClassification
300
Source: Tana River County Treasury and IFMIS Data
3.40.6 Development Expenditure Analysis The total development expenditure of Kshs.1.59 billion represents 54.1 per cent of the annual development expenditure
estimates of Kshs.2.94 billion. Table 3.117 provides a summary of development projects with the highest expenditure in
the financial year.
Table 3.117: Tana River County, List of Development Projects with the Highest Expenditure in FY 2018/19
S/No. Project Name Project Location
Project Expenditure (Kshs.)
1 Bububu ECD Bububu Village 3,287,300
2 Water Supply- Renovation and Upgrading to Solar system of JICA 2 Borehole (Madogo) Madogo 6,806,996
3 Water Supply- Installation transformer and associated accessories for Emmaus Boreholes (Hola) Chewani 4,000,000
4 Construction of WC washrooms and murraming of the inlet road including installation of a standard gate at the entrance for the Water Department Offices Chewani 4,000,000
5 Water Supply-Rehabilitation of shallow wells in Garsen South Ward Garsen South 3,459,120
6 Water Supply- Drilling and Test pumping of 2No Boreholes in Kipini for the KIPWA group.
Kipini east
4,000,000
7 Water bowsers Chewani 34,509,400 8 Construction of a Fence at madogo polytechnic Madogo 4,000,000
Source: Tana River County Treasury
3.40.7 Analysis of Recurrent Expenditure The total recurrent expenditure of Kshs.3.20 billion comprised of Kshs.1.63 billion (50.9 per cent) incurred on personnel
emoluments and Kshs.1.57 billion (49.1 per cent) on operations and maintenance as shown in Figure 3.159 .
1,385.90(43.6%)
872.32(27.5%)
918.61(28.9%)
1,630.71(34%) 1,572.70
(32.8%)1,588.65(33.2%)
-
200
400
600
800
1,000
1,200
1,400
1,600
1,800
Personnel Emoluments Operations and Maintenance Development Expenditure
Ksh
s.Mill
ion
Expenditure by Economic Classification
FY 2017/18
FY 2018/19
Key
Source: Tana River County Treasury and IFMIS Data
3.40.6 Development Expenditure AnalysisThe total development expenditure of Kshs.1.59 billion represents 54.1 per cent of the annual development expenditure estimates of Kshs.2.94 billion. Table 3.117 provides a summary of development projects with the highest expenditure in the financial year.
Table 3.117: Tana River County, List of Development Projects with the Highest Expenditure in FY 2018/19
S/No. Project Name Project Location Project Expenditure (Kshs.)
1 Bububu ECD Bububu Village 3,287,300
2 Water Supply- Renovation and Upgrading to Solar system of JICA 2 Borehole (Madogo) Madogo 6,806,996
3 Water Supply- Installation transformer and associated accessories for Emmaus Bore-holes (Hola) Chewani 4,000,000
4 Construction of WC washrooms and murraming of the inlet road including installation of a standard gate at the entrance for the Water Department Offices Chewani 4,000,000
5 Water Supply-Rehabilitation of shallow wells in Garsen South Ward Garsen South 3,459,120
6 Water Supply- Drilling and Test pumping of 2No Boreholes in Kipini for the KIPWA group. Kipini east 4,000,000
7 Water bowsers Chewani 34,509,400
8 Construction of a Fence at madogo polytechnic Madogo 4,000,000
Source: Tana River County Treasury
3.40.7 Analysis of Recurrent ExpenditureThe total recurrent expenditure of Kshs.3.20 billion comprised of Kshs.1.63 billion (50.9 per cent) incurred on personnel emoluments and Kshs.1.57 billion (49.1 per cent) on operations and maintenance as shown in Figure 3.159 .
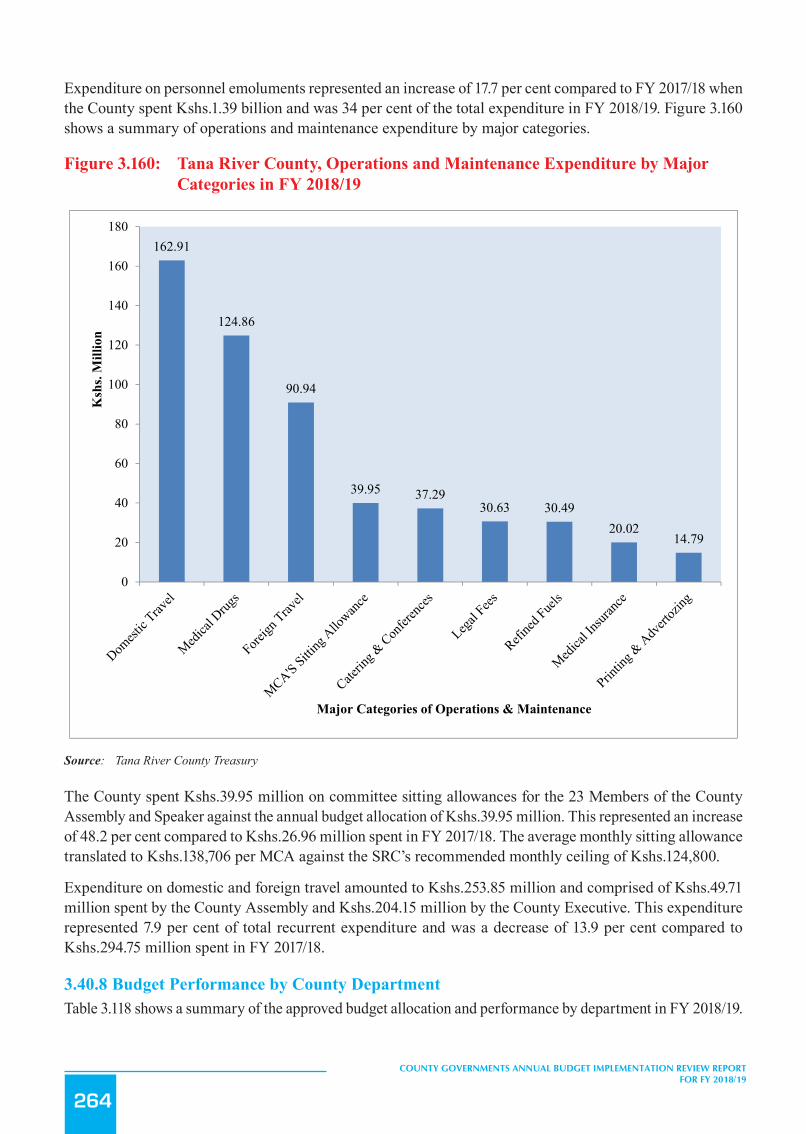
264
COUNTY GOVERNMENTS ANNUAL BUDGET IMPLEMENTATION REVIEW REPORT FOR FY 2018/19
Expenditure on personnel emoluments represented an increase of 17.7 per cent compared to FY 2017/18 when the County spent Kshs.1.39 billion and was 34 per cent of the total expenditure in FY 2018/19. Figure 3.160 shows a summary of operations and maintenance expenditure by major categories.
Figure 3.160: Tana River County, Operations and Maintenance Expenditure by Major Categories in FY 2018/19
301
Expenditure on personnel emoluments represented an increase of 17.7 per cent compared to FY 2017/18 when the
County spent Kshs.1.39 billion and was 34 per cent of the total expenditure in FY 2018/19. Figure 3.160 shows a
summary of operations and maintenance expenditure by major categories.
Figure 3.160: Tana River County, Operations and Maintenance Expenditure by Major Categories in FY 2018/19
Source: Tana River County Treasury
The County spent Kshs.39.95 million on committee sitting allowances for the 23 Members of the County Assembly and
Speaker against the annual budget allocation of Kshs.39.95 million. This represented an increase of 48.2 per cent
compared to Kshs.26.96 million spent in FY 2017/18. The average monthly sitting allowance translated to
Kshs.138,706 per MCA against the SRC’s recommended monthly ceiling of Kshs.124,800.
Expenditure on domestic and foreign travel amounted to Kshs.253.85 million and comprised of Kshs.49.71 million
spent by the County Assembly and Kshs.204.15 million by the County Executive. This expenditure represented 7.9 per
cent of total recurrent expenditure and was a decrease of 13.9 per cent compared to Kshs.294.75 million spent in FY
2017/18.
3.40.8 Budget Performance by County Department Table 3.118 shows a summary of the approved budget allocation and performance by department in FY 2018/19.
Table 3.118: Tana River County, Budget Performance by Department in FY 2018/2019
162.91
124.86
90.94
39.95 37.2930.63 30.49
20.0214.79
0
20
40
60
80
100
120
140
160
180
Ksh
s. M
illio
n
Major Categories of Operations & Maintenance
Source: Tana River County Treasury
The County spent Kshs.39.95 million on committee sitting allowances for the 23 Members of the County Assembly and Speaker against the annual budget allocation of Kshs.39.95 million. This represented an increase of 48.2 per cent compared to Kshs.26.96 million spent in FY 2017/18. The average monthly sitting allowance translated to Kshs.138,706 per MCA against the SRC’s recommended monthly ceiling of Kshs.124,800.
Expenditure on domestic and foreign travel amounted to Kshs.253.85 million and comprised of Kshs.49.71 million spent by the County Assembly and Kshs.204.15 million by the County Executive. This expenditure represented 7.9 per cent of total recurrent expenditure and was a decrease of 13.9 per cent compared to Kshs.294.75 million spent in FY 2017/18.
3.40.8 Budget Performance by County DepartmentTable 3.118 shows a summary of the approved budget allocation and performance by department in FY 2018/19.

265
COUNTY GOVERNMENTS ANNUAL BUDGET IMPLEMENTATION REVIEW REPORT FOR FY 2018/19
Table 3.118: Tana River County, Budget Performance by Department in FY 2018/2019
DepartmentAnnual Budget Allocation
Kshs. Million)Exchequer Issues (Kshs.
Million)Expenditure (Kshs.
Million)
Expenditure to Exchequer Issues
(%)
Absorption Rate (%)
Rec Dev Rec Dev Rec Dev Rec Dev Rec Dev
County Assembly 509.82 200.00 499.27 56.00 373.02 41.96 74.7 74.9 73.2 21.0
Office of the Gov-ernor 507.36 - 502.35 - 306.43 3.16 61.0 - 60.4 -
Finance & Planning 508.68 230.00 508.68 223.19 498.31 36.47 98.0 16.3 98.0 15.9
Trade, Tourism, Wildlife and Coop-erative Development
120.84 85.00 68.84 29.94 87.34 60.72 126.9 202.8 72.3 71.4
Agriculture and Rural Development 448.73 356.54 433.23 189.19 208.58 233.27 48.1 123.3 46.5 65.4
Gender, Culture & Services 83.80 92.50 81.56 28.06 47.51 37.96 58.3 135.3 56.7 41.0
Water, Health& Sanitation 1,185.31 161.00 1,115.24 107.93 326.26 78.01 29.3 72.3 27.5 48.5
Education, Voca-tional Training 368.71 226.83 345.60 78.94 273.77 66.90 79.2 84.7 74.2 29.5
Cohesion & Special Programmes 260.63 10.00 260.63 5.74 256.69 4.95 98.5 86.2 98.5 49.5
Roads, Transport, Public Works, Hous-ing and Urbanisation
160.52 1,191.29 152.88 808.47 348.52 798.00 228.0 98.7 217.1 67.0
Public Service, Administration and Citizen Participation
379.64 66.50 316.58 19.41 296.41 19.09 93.6 98.3 78.1 28.7
Environment and Natural Resources 103.26 316.40 103.26 142.41 180.58 208.17 174.9 146.2 174.9 65.8
Total 4,637.30 2,936.06 4,388.11 1,689.27 3,203.41 1,588.65 73.0 94.0 69.1 54.1
Source: Tana River County Treasury and IFMIS Data
Analysis of expenditure by department shows that the Department of Trade, Tourism and Industrialization recorded the highest absorption rate of development budget at 71.4 per cent while the Department of Finance & Planning recorded the lowest at 15.9 per cent.
3.40.9 Key Observations and RecommendationsThe County has made progress in addressing some of the challenges previously identified as affecting budget implementation. Some of the progress made included:
i. Improvement in own source revenue collection by 45.4 per cent from Kshs.43.71 million in FY 2017/18 to Kshs.63.56 million in the reporting period, and was 105.9 per cent of the annual target.
ii. Improvement in the absorption of the development budget to 54.1 per cent compared to 37.4 per cent attained in FY 2017/18.
Despite the above progress, the following challenges continued to hamper effective budget implementation;
1. A high wage bill that increased by 17.7 per cent from Kshs.1.39 billion in the FY 2017/18 to Kshs.1.63 billion in the reporting period.
2. Delay in disbursement of the equitable share of revenue raised nationally by the National Treasury.3. Late submission of financial reports by the County Treasury, which affected timely preparation of
budget implementation report contrary to section 166 of the PFM Act, 2012.4. Failure to establish an Internal Audit Committee to oversee financial operations in the County contrary
to the provisions of Section 155 of the PFM Act, 2012.5. Delay by the County to provide a report on execution of development projects during the financial

266
COUNTY GOVERNMENTS ANNUAL BUDGET IMPLEMENTATION REVIEW REPORT FOR FY 2018/19
year. This is despite reporting development expenditure of Kshs.1.59 billion during the reporting period.
The County should implement the following measures in order to improve budget execution;
1. The County Public Service Board should establish an optimal staffing structure in order to manage the wage bill.
2. The County Treasury should liaise with the National Treasury to ensure that funds are released in a timely manner.
3. The County Treasury should ensure timely preparation and submission of financial reports in line with Section 166 of PFM Act, 2012.
4. The County should establish an Internal Audit Committee in line with Section 155 of the PFM Act, 2012.
5. The County should provide complete financial reports in line with Section 166 of the PFM Act, 2012.
3.41 Tharaka Nithi County
3.41.1 Overview of the FY 2018/19 BudgetThe County’s FY 2018/19 Supplementary Budget was Kshs.5.72 billion, comprising of Kshs.2.17 billion (38.1 per cent) and Kshs.3.54 billion (61.9 per cent) allocation for development and recurrent expenditure respectively.
To finance the budget, the County expects to receive Kshs.3.64 billion (63.7 per cent) as equitable share of the revenue raised nationally, Kshs.1.03 billion (18 per cent) as total conditional grants, generate Kshs.300 million (5.2 per cent) from own sources of revenue, and Kshs.749.93 million (13.1 per cent) cash balance from the FY 2017/18.
Figure 3.161: Tharaka Nithi County, Expected Sources of Budget Financing in FY 2018/19
303
5. Delay by the County to provide a report on execution of development projects during the financial year. This is
despite reporting development expenditure of Kshs.1.59 billion during the reporting period.
The County should implement the following measures in order to improve budget execution;
1. The County Public Service Board should establish an optimal staffing structure in order to manage the wage bill.
2. The County Treasury should liaise with the National Treasury to ensure that funds are released in a timely manner.
3. The County Treasury should ensure timely preparation and submission of financial reports in line with Section
166 of PFM Act, 2012.
4. The County should establish an Internal Audit Committee in line with Section 155 of the PFM Act, 2012.
5. The County should provide complete financial reports in line with Section 166 of the PFM Act, 2012.
3.41 Tharaka Nithi County
3.41.1 Overview of the FY 2018/19 Budget The County’s FY 2018/19 Supplementary Budget was Kshs.5.72 billion, comprising of Kshs.2.17 billion (38.1 per
cent) and Kshs.3.54 billion (61.9 per cent) allocation for development and recurrent expenditure respectively.
To finance the budget, the County expects to receive Kshs.3.64 billion (63.7 per cent) as equitable share of the revenue
raised nationally, Kshs.1.03 billion (18 per cent) as total conditional grants, generate Kshs.300 million (5.2 per cent)
from own sources of revenue, and Kshs.749.93 million (13.1 per cent) cash balance from the FY 2017/18.
Figure 3.161: Tharaka Nithi County, Expected Sources of Budget Financing in FY 2018/19
Source: Tharaka Nithi County Treasury
A breakdown of the conditional grants is provided in Table 3.119.
3.41.2 Revenue Analysis During FY 2018/19, the County had a total of Kshs.4.90 billion available for budget implementation. This amount
consisted of Kshs.3.64 billion received as equitable share of the revenue raised nationally, Kshs.271.19 million as
Cash Balance from FY 2017/1813.1%
National Sharable Revenue63.7%
Total Conditional Allocations
18.0%
Own Source Revenue5.2%
Source: Tharaka Nithi County Treasury
A breakdown of the conditional grants is provided in Table 3.119.

267
COUNTY GOVERNMENTS ANNUAL BUDGET IMPLEMENTATION REVIEW REPORT FOR FY 2018/19
3.41.2 Revenue AnalysisDuring FY 2018/19, the County had a total of Kshs.4.90 billion available for budget implementation. This amount consisted of Kshs.3.64 billion received as equitable share of the revenue raised nationally, Kshs.271.19 million as conditional grants, Kshs.242.95 million generated from own sources of revenue, and a cash balance of Kshs.749.93 million from FY 2017/18.
Figure 3.162 shows the trend in annual own-source revenue collection from FY 2013/14 to FY 2018/19.
Figure 3.162: Tharaka Nithi County, Own Source Revenue Collection for FY 2013/14 to FY 2018/19
304
conditional grants, Kshs.242.95 million generated from own sources of revenue, and a cash balance of Kshs.749.93
million from FY 2017/18.
Figure 3.162 shows the trend in annual own-source revenue collection from FY 2013/14 to FY 2018/19.
Figure 3.162: Tharaka Nithi County, Own Source Revenue Collection for FY 2013/14 to FY 2018/19
Source: Tharaka Nithi County Treasury
The County generated a total of Kshs.242.95 million from own revenue sources in FY 2018/19. This amount
represented an increase of Kshs.116.35 million compared to that realised in FY 2017/18 and was 81 per cent of the
annual own revenue collection target.
3.41.3 Conditional Grants During the reporting period, the County received Kshs.271.19 million as conditional grants as shown in Table 3.119.
Table 3.119: Tharaka Nithi County, Conditional Grants/Loans Received in the FY 2018/19
S/No. Grants/Loans Annual CARA, 2018 Allocation (Kshs.)
Annual Budget Allocation (Kshs.)
Total Receipts (Kshs.)
Total Receipts as Percentage of Annual Budget Allocation (%)
1 Supplement for Construction of County Headquarters 121,000,000 - - - 2 Compensation for User Fee Foregone 8,218,119 8,218,119 8,218,119 100 3 Leasing of Medical Equipment 200,000,000 - - 4 Road Maintenance Fuel Levy 95,901,220 128,101,220 95,901,220 100 5 Rehabilitation of Village Polytechnics 40,090,000 78,211,638 - - 6 Transforming Health Systems for Universal Care Project
(World Bank) 50,000,000 50,000,000 17,451,240 34.9
7 IDA (World Bank) -National Agricultural and Rural Inclusive Growth Project (NARIGP) 117,000,000 - - -
8 IDA (World Bank) -Kenya Climate Smart Agriculture Project 117,000,000 117,000,000 39,557,498 33.8
9 IDA (World Bank) Kenya Devolution Support 38,536,081 77,072,162 - -
77.70
115.73139.13
78.57
126.61
242.95
0
50
100
150
200
250
300
FY 2013/14 FY 2014/15 FY 2015/16 FY 2016/17 FY 2017/18 FY 2018/19
Ksh
s. M
illio
ns
Trend in Own Source Revenue
Source: Tharaka Nithi County Treasury
The County generated a total of Kshs.242.95 million from own revenue sources in FY 2018/19. This amount represented an increase of Kshs.116.35 million compared to that realised in FY 2017/18 and was 81 per cent of the annual own revenue collection target.
3.41.3 Conditional GrantsDuring the reporting period, the County received Kshs.271.19 million as conditional grants as shown in Table 3.119.
Table 3.119: Tharaka Nithi County, Conditional Grants/Loans Received in the FY 2018/19
S/No. Grants/LoansAnnual CARA, 2018 Allocation (Kshs.)
Annual Budget Allocation (Kshs.)
Total Receipts (Kshs.)
Total Receipts as Percentage of Annual Budget Allocation (%)
1 Supplement for Construction of County Headquarters 121,000,000 - - -
2 Compensation for User Fee Foregone 8,218,119 8,218,119 8,218,119 100
3 Leasing of Medical Equipment 200,000,000 - -
4 Road Maintenance Fuel Levy 95,901,220 128,101,220 95,901,220 100
5 Rehabilitation of Village Polytechnics 40,090,000 78,211,638 - -

268
COUNTY GOVERNMENTS ANNUAL BUDGET IMPLEMENTATION REVIEW REPORT FOR FY 2018/19
S/No. Grants/LoansAnnual CARA, 2018 Allocation (Kshs.)
Annual Budget Allocation (Kshs.)
Total Receipts (Kshs.)
Total Receipts as Percentage of Annual Budget Allocation (%)
6 Transforming Health Systems for Universal Care Project (World Bank) 50,000,000 50,000,000 17,451,240 34.9
7 IDA (World Bank) -National Agricultural and Rural Inclu-sive Growth Project (NARIGP) 117,000,000 - - -
8 IDA (World Bank) -Kenya Climate Smart Agriculture Pro-ject 117,000,000 117,000,000 39,557,498 33.8
9 IDA (World Bank) Kenya Devolution Support Programme “Level 1 grant” 38,536,081 77,072,162 - -
10 IDA (World Bank) -Kenya Urban Support Project (KUSP) 50,000,000 92,000,000 91,200,000 182.4
11 DANIDA - Universal Healthcare in Devolved System Pro-gramme 12,352,500 12,352,500 12,352,500 100
12 Sweden - Agriculture Sector Development Support Pro-gramme (ASDSP) II + Bal C/F in FY 2017/18 12,352,500 12,352,500 6,509,045 52.7
13 Other Conditional Grants - 453,361,325 - -
Total 862,450,420 1,028,669,464 271,189,622 31.4
Source: Tharaka Nithi County Treasury
During the reporting period, receipts from IDA (World Bank) -Kenya Urban Support Project (KUSP) conditional grant recorded the highest performance in percentage terms, accounting for over 182 per cent of the respective annual budget allocation target.
3.41.4 Exchequer IssuesIn order to implement the County budget, the Controller of Budget approved the withdrawal of Kshs.4.72 billion from the County Revenue Fund (CRF) account. The withdrawals represented 82.7 per cent of the Approved Supplementary Budget translating to an increase of 25.1 per cent from Kshs.3.78 billion withdrawn during the FY 2017/18. The total withdrawal comprised of Kshs.1.39 billion (29.5 per cent) towards development activities and Kshs.3.33 billion (70.5 per cent) for recurrent expenditure.
3.41.5 Overall Expenditure ReviewA total of Kshs.4.60 billion was spent on both development and recurrent activities. This expenditure represented 97.3 per cent of the total funds released from the CRF account, and was an increase of 26.1 per cent from Kshs.3.65 billion spent in FY 2017/18.
The expenditure excluded pending bills as at June 30, 2019 which amounted to Kshs.143.6 million for development activities and Kshs.189.61 million for recurrent costs.
Expenditure on development programmes amounted to Kshs.1.4 billion while Kshs.3.21 billion was spent on recurrent activities. The development expenditure was 100 per cent of the funds released for development programmes, while recurrent expenditure was 96.2 per cent of funds released for recurrent activities.
Development expenditure recorded an absorption rate of 64.1 per cent, which was a decrease from 67.7 per cent attained in FY 2017/18. Conversely, recurrent expenditure represented 90.5 per cent of the annual recurrent budget, an increase from 84.7 per cent recorded in FY 2017/18.
Figure 3.163 presents a comparison between the total expenditure in FY 2018/19 and FY 2017/18 and shows personnel emoluments, operations and maintenance and development expenditure as a percentage of total expenditure.
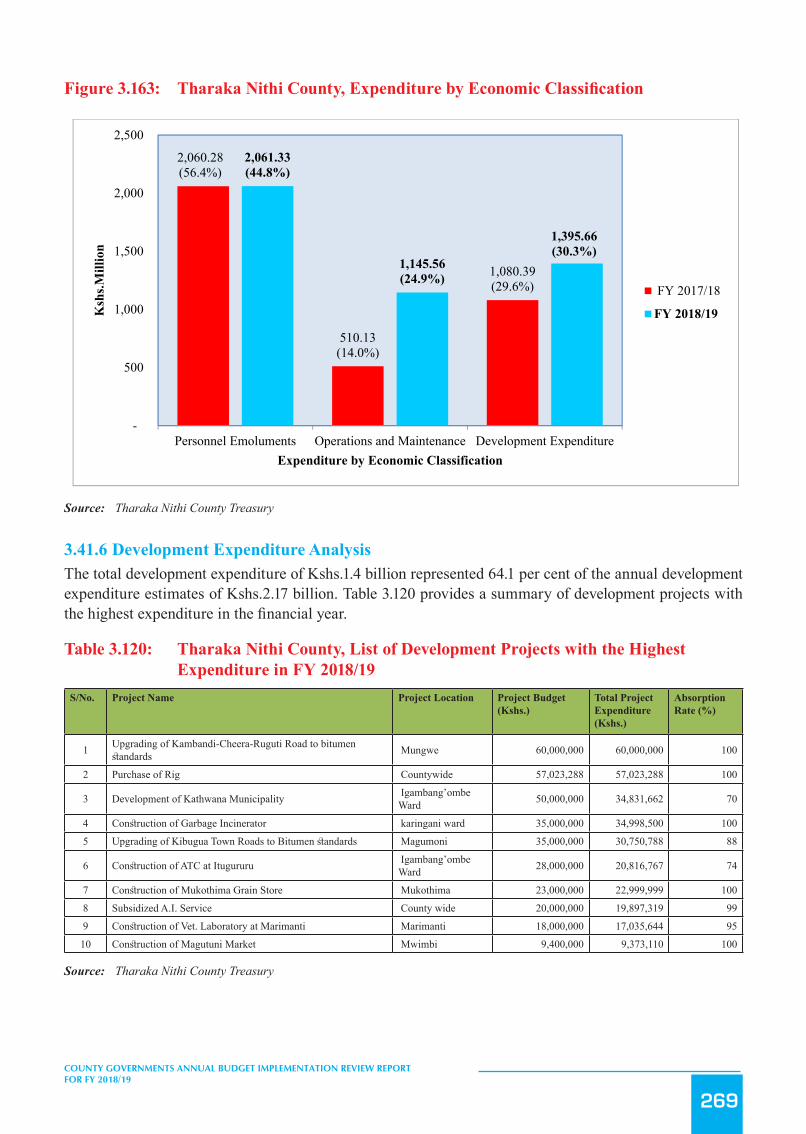
269
COUNTY GOVERNMENTS ANNUAL BUDGET IMPLEMENTATION REVIEW REPORT FOR FY 2018/19
Figure3.163: TharakaNithiCounty,ExpenditurebyEconomicClassification
306
Source: Tharaka Nithi County Treasury
3.41.6 Development Expenditure Analysis The total development expenditure of Kshs.1.4 billion represented 64.1 per cent of the annual development expenditure
estimates of Kshs.2.17 billion. Table 3.120 provides a summary of development projects with the highest expenditure in
the financial year.
Table 3.120: Tharaka Nithi County, List of Development Projects with the Highest Expenditure in FY 2018/19
S/No. Project Name Project Location Project Budget (Kshs.)
Total Project Expenditure (Kshs.)
Absorption Rate (%)
1 Upgrading of Kambandi-Cheera-Ruguti Road to bitumen standards Mungwe 60,000,000 60,000,000 100
2 Purchase of Rig Countywide 57,023,288 57,023,288 100
3 Development of Kathwana Municipality Igambang'ombe Ward 50,000,000 34,831,662 70
4 Construction of Garbage Incinerator karingani ward 35,000,000 34,998,500 100 5 Upgrading of Kibugua Town Roads to Bitumen standards Magumoni 35,000,000 30,750,788 88
6 Construction of ATC at Itugururu Igambang'ombe Ward 28,000,000 20,816,767 74
7 Construction of Mukothima Grain Store Mukothima 23,000,000 22,999,999 100 8 Subsidized A.I. Service County wide 20,000,000 19,897,319 99 9 Construction of Vet. Laboratory at Marimanti Marimanti 18,000,000 17,035,644 95 10 Construction of Magutuni Market Mwimbi 9,400,000 9,373,110 100
Source: Tharaka Nithi County Treasury
3.41.7 Analysis of Recurrent Expenditure The total recurrent expenditure of Kshs.3.21 billion comprised of Kshs.2.06 billion (64.3 per cent) incurred on personnel
emoluments and Kshs.1.14 billion (35.7 per cent) on operations and maintenance as shown in Figure 3.163.
Expenditure on personnel emoluments represented a decrease of 0.1 per cent compared to FY 2017/18 when the County
spent Kshs.2.06 billion and was 44.8 per cent of the total expenditure in FY 2018/19. Figure 3.164 shows a summary of
operations and maintenance expenditure by major categories.
2,060.28(56.4%)
510.13(14.0%)
1,080.39(29.6%)
2,061.33(44.8%)
1,145.56(24.9%)
1,395.66(30.3%)
-
500
1,000
1,500
2,000
2,500
Personnel Emoluments Operations and Maintenance Development Expenditure
Ksh
s.Mill
ion
Expenditure by Economic Classification
FY 2017/18
FY 2018/19
Source: Tharaka Nithi County Treasury
3.41.6 Development Expenditure AnalysisThe total development expenditure of Kshs.1.4 billion represented 64.1 per cent of the annual development expenditure estimates of Kshs.2.17 billion. Table 3.120 provides a summary of development projects with the highest expenditure in the financial year.
Table 3.120: Tharaka Nithi County, List of Development Projects with the Highest Expenditure in FY 2018/19
S/No. Project Name Project Location Project Budget (Kshs.)
Total Project Expenditure (Kshs.)
Absorption Rate (%)
1 Upgrading of Kambandi-Cheera-Ruguti Road to bitumen standards Mungwe 60,000,000 60,000,000 100
2 Purchase of Rig Countywide 57,023,288 57,023,288 100
3 Development of Kathwana Municipality Igambang’ombe Ward 50,000,000 34,831,662 70
4 Construction of Garbage Incinerator karingani ward 35,000,000 34,998,500 100
5 Upgrading of Kibugua Town Roads to Bitumen standards Magumoni 35,000,000 30,750,788 88
6 Construction of ATC at Itugururu Igambang’ombe Ward 28,000,000 20,816,767 74
7 Construction of Mukothima Grain Store Mukothima 23,000,000 22,999,999 100
8 Subsidized A.I. Service County wide 20,000,000 19,897,319 99
9 Construction of Vet. Laboratory at Marimanti Marimanti 18,000,000 17,035,644 95
10 Construction of Magutuni Market Mwimbi 9,400,000 9,373,110 100
Source: Tharaka Nithi County Treasury

270
COUNTY GOVERNMENTS ANNUAL BUDGET IMPLEMENTATION REVIEW REPORT FOR FY 2018/19
3.41.7 Analysis of Recurrent ExpenditureThe total recurrent expenditure of Kshs.3.21 billion comprised of Kshs.2.06 billion (64.3 per cent) incurred on personnel emoluments and Kshs.1.14 billion (35.7 per cent) on operations and maintenance as shown in Figure 3.163.
Expenditure on personnel emoluments represented a decrease of 0.1 per cent compared to FY 2017/18 when the County spent Kshs.2.06 billion and was 44.8 per cent of the total expenditure in FY 2018/19. Figure 3.164 shows a summary of operations and maintenance expenditure by major categories.
Figure 3.164: Tharaka Nithi County, Operations and Maintenance Expenditure by Major Categories in FY 2018/19
307
Figure 3.164: Tharaka Nithi County, Operations and Maintenance Expenditure by Major Categories in FY 2018/19
Source: Tharaka Nithi County Treasury
The County spent Kshs.20.17 million on committee sitting allowances for the 20 MCAs and Speaker against the annual
budget allocation of Kshs.28.37 million. This represented an increase of 238.9 per cent compared to Kshs.5.9 million
spent in FY 2017/18. The average monthly sitting allowance translated to Kshs.80,046 per MCA against the SRC’s
recommended monthly ceiling of Kshs.124,800.
Expenditure on domestic and foreign travel amounted to Kshs.197.11 million, and comprised of Kshs.97.49 million
spent by the County Assembly and Kshs.99.61 million by the County Executive. This expenditure represented 6.1 per
cent of total recurrent expenditure and was an increase of 70.9 per cent compared to Kshs.115.29 million spent in FY
2017/18.
3.41.8 Budget Performance by County Department Table 3.121 shows a summary of the approved budget allocation and performance by department in FY 2018/19.
Table 3.121: Tharaka Nithi County, Budget Performance by Department for the FY 2018/19
Department Budget Allocation (Kshs. Million)
Exchequer Issues (Kshs. Million)
Expenditure (Kshs. Million)
Expenditure to Exchequer Issues (%)
Absorption Rate (%)
Rec Dev Rec Dev Rec Dev Rec Dev Rec Dev County Assembly 352.0 17.0 352.00 - 351.07 - 99.7 - 99.7 -
197.11185.02
76.40 68.22 60.93 60.20 53.9945.30
34.5020.17
0
50
100
150
200
250
Ksh
s. M
illio
n
Major Categories of Operations & Maintenance
Source: Tharaka Nithi County Treasury
The County spent Kshs.20.17 million on committee sitting allowances for the 20 MCAs and Speaker against the annual budget allocation of Kshs.28.37 million. This represented an increase of 238.9 per cent compared to Kshs.5.9 million spent in FY 2017/18. The average monthly sitting allowance translated to Kshs.80,046 per MCA against the SRC’s recommended monthly ceiling of Kshs.124,800.
Expenditure on domestic and foreign travel amounted to Kshs.197.11 million, and comprised of Kshs.97.49 million spent by the County Assembly and Kshs.99.61 million by the County Executive. This expenditure represented 6.1 per cent of total recurrent expenditure and was an increase of 70.9 per cent compared to Kshs.115.29 million spent in FY 2017/18.

271
COUNTY GOVERNMENTS ANNUAL BUDGET IMPLEMENTATION REVIEW REPORT FOR FY 2018/19
3.41.8 Budget Performance by County DepartmentTable 3.121 shows a summary of the approved budget allocation and performance by department in FY 2018/19.
Table 3.121: Tharaka Nithi County, Budget Performance by Department for the FY 2018/19
DepartmentBudget Allocation (Kshs.
Million)Exchequer Issues (Kshs.
Million)Expenditure (Kshs.
Million)
Expenditure to Exchequer Issues
(%)
Absorption Rate (%)
Rec Dev Rec Dev Rec Dev Rec Dev Rec Dev
County Assembly 352.0 17.0 352.00 - 351.07 - 99.7 - 99.7 -
County Executive 161.2 - 159.25 - 150.38 - 94.4 - 93.3 -
Finance and Economic Planning 311.22 234.12 252.74 164.85 237.52 163.99 94.0 99.5 76.3 70
Agriculture 104.93 219.0 99.82 110.61 92.58 106.08 92.7 95.9 88.2 48.4
Environment and Natural Resources 99.0 35.0 0.74 35.0 0.72 35.00 97.0 100 72.3 100
Education, Cultur-al and Vocational Training
229.92 107.59 178.40 27.49 177.48 26.59 99.5 96.7 77.2 24.7
Medical Services 1,550.88 293.7 1,550.64 201.13 1,533.26 200.89 98.9 99.9 98.9 68.4
Physical Planning and Land 121.4 208.4 64.48 158.12 62.85 157.33 97.5 99.5 51.8 75.5
Roads, Transport, Housing, Public Works 49.89 783.25 43.44 528.86 42.16 528.38 97.1 99.9 84.5 67.5
Administration and Public Services 298.81 - 289.85 - 266.16 - 91.8 0.0 89.1 -
Trade, Industry and Cooperatives 94.20 - 88.94 - 92.05 - 103.5 - 97.7 -
Water Services and Irrigation 46.90 162.0 40.40 98.43 42.85 97.31 106.1 98.9 91.4 60.1
County Public Servic-es Board 12.28 - 12.28 - 2.59 - 21.1 - 21.1 -
Livestock, Veterinary and Fisheries Devel-opment
69.45 53.0 67.19 45.54 58.62 44.71 87.2 98.2 84.4 84.4
Public Health And Sanitation 54.24 - 52.24 - 24.62 - 47.1 - 45.4 -
Energy and ICT 32.31 24.00 32.31 13.35 31.72 23.95 98.2 179.3 98.2 99.8
Youth ,Culture, Sport And Tourism 52.32 41.00 47.61 12.76 40.27 11.45 84.6 89.7 77.0 27.9
Total 3,542.94 2,178.06 3,332.33 1,396.13 3,206.89 1,395.66 96.2 100 90.5 64.1
Source: Tharaka Nithi County Treasury
Analysis of expenditure by department shows that the Department of Environment and Natural Resources recorded the highest absorption rate of development budget at 100 per cent while the County Assembly did not spend on the development budget. The County Assembly had the highest percentage of recurrent expenditure to recurrent budget at 99.7 per cent while the County Public Service Board had the lowest at 21.1 per cent.
3.41.9 Key Observations and RecommendationsThe County has made progress in addressing some of the challenges previously identified as affecting budget implementation. Some of the progress made included:
i. Improvement in own source revenue collections by 91.9 per cent from Ksh.126.61 million in the FY 2017/18 to Ksh.242.95 million in the reporting period.
ii. Timely submission of financial reports to the Controller of Budget in line with Section 166 of the
272
COUNTY GOVERNMENTS ANNUAL BUDGET IMPLEMENTATION REVIEW REPORT FOR FY 2018/19
PFM Act, 2012.
Despite the above progress, the following challenges continued to hamper effective budget implementation;
1. Delay by the National Treasury to disburse the equitable share of revenue raised nationally.2. High expenditure on travel which increased by 70.9 per cent from Kshs.115.29 million in FY 2017/18
to Kshs.197.11 million in FY 2018/19.3. A high wage bill that accounted for 44.8 per cent of total expenditure in the reporting period and is
above 35 per cent of the county’s revenue as required by Regulation 25(1) (b) of the PFM (County Governments) Regulations, 2015.
The County should implement the following measures in order to improve budget execution;
1. The County Treasury should liaise with the National Treasury so as to ensure that funds allocated to the County are released in a timely manner.
2. The County should rationalize expenditure on non-core budget items to free up resources for development programmes.
3. The County Public Service Board should develop an optimal staffing structure and devise strategies to contain expenditure on personnel costs within 35 per cent of County’s total revenue in line with Regulation 25(1) (b) of the PFM (County Governments) Regulations, 2015.
3.42 Trans Nzoia County
3.42.1 Overview of the FY 2018/19 BudgetThe County’s FY 2018/19 Supplementary Budget was Kshs.8.04 billion, comprising of Kshs.4.87 billion (60.5 per cent) and Kshs.3.18 billion (39.5 per cent) allocation for recurrent and development expenditure respectively.
To finance the budget, the County expects to receive Kshs.5.62 billion (69.9 per cent) as equitable share of revenue raised nationally, Kshs.968.73 million (12.1 per cent) as total conditional grants, generate Kshs.500 million (6.2 per cent) from own-source of revenue, Kshs.250 million (3.1 per cent) as other grants and Kshs.703.23 million (8.7 per cent) cash balance from FY 2017/18.

273
COUNTY GOVERNMENTS ANNUAL BUDGET IMPLEMENTATION REVIEW REPORT FOR FY 2018/19
Figure 3.165: Trans Nzoia County, Expected Sources of Budget Financing in FY 2018/19
309
cent of the county’s revenue as required by Regulation 25(1) (b) of the PFM (County Governments) Regulations,
2015.
The County should implement the following measures in order to improve budget execution;
1. The County Treasury should liaise with the National Treasury so as to ensure that funds allocated to the County are
released in a timely manner.
2. The County should rationalize expenditure on non-core budget items to free up resources for development
programmes.
3. The County Public Service Board should develop an optimal staffing structure and devise strategies to contain
expenditure on personnel costs within 35 per cent of County’s total revenue in line with Regulation 25(1) (b) of the
PFM (County Governments) Regulations, 2015.
3.42 Trans Nzoia County
3.42.1 Overview of the FY 2018/19 Budget The County’s FY 2018/19 Supplementary Budget was Kshs.8.04 billion, comprising of Kshs.4.87 billion (60.5 per cent)
and Kshs.3.18 billion (39.5 per cent) allocation for recurrent and development expenditure respectively.
To finance the budget, the County expects to receive Kshs.5.62 billion (69.9 per cent) as equitable share of revenue
raised nationally, Kshs.968.73 million (12.1 per cent) as total conditional grants, generate Kshs.500 million (6.2 per
cent) from own-source of revenue, Kshs.250 million (3.1 per cent) as other grants and Kshs.703.23 million (8.7 per cent)
cash balance from FY 2017/18.
Figure 3.165: Trans Nzoia County, Expected Sources of Budget Financing in FY 2018/19
Source: Trans Nzoia County Treasury
A breakdown of the conditional grants is provided in Table 3.122.
Cash Balance from FY 2017/18
8.7%
National Sharable Revenue69.9%
Conditional Allocation (CARA,2018)
12%
Annual Own Source Revenue Target
6.2%Other Revenues
Expected During the Year3.1%
Source: Trans Nzoia County Treasury
A breakdown of the conditional grants is provided in Table 3.122.
3.42.2 Revenue AnalysisDuring FY 2018/19, the County had a total of Kshs.7.32 billion available for budget implementation. This amount consisted of Kshs.5.62 billion received as equitable share of the revenue raised nationally, Kshs.619.39 million as conditional grants, Kshs.372.56 million generated from own sources of revenue, and a cash balance of Kshs.703.23 million from FY 2017/18.
Figure 3.166 shows the trend in annual own-source revenue collection from FY 2013/14 to FY 2018/19.
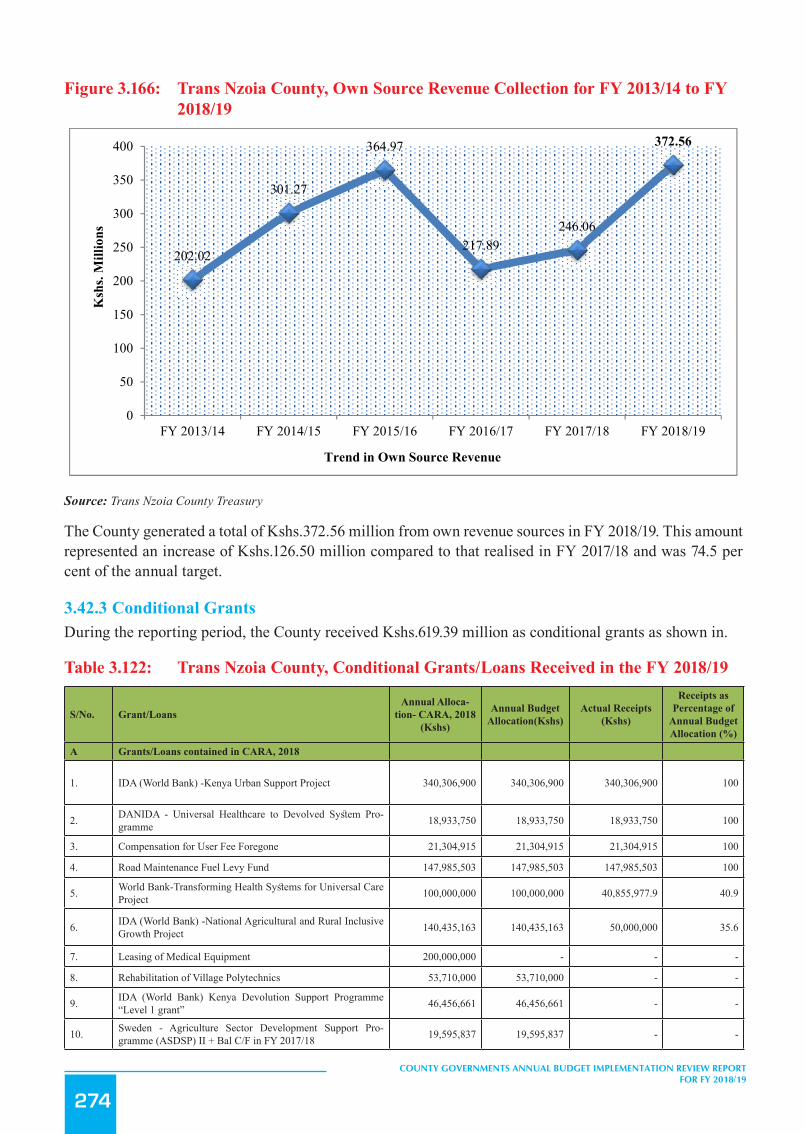
274
COUNTY GOVERNMENTS ANNUAL BUDGET IMPLEMENTATION REVIEW REPORT FOR FY 2018/19
Figure 3.166: Trans Nzoia County, Own Source Revenue Collection for FY 2013/14 to FY 2018/19
310
3.42.2 Revenue Analysis During FY 2018/19, the County had a total of Kshs.7.32 billion available for budget implementation. This amount
consisted of Kshs.5.62 billion received as equitable share of the revenue raised nationally, Kshs.619.39 million as
conditional grants, Kshs.372.56 million generated from own sources of revenue, and a cash balance of Kshs.703.23
million from FY 2017/18.
Figure 3.166 shows the trend in annual own-source revenue collection from FY 2013/14 to FY 2018/19.
Figure 3.166: Trans Nzoia County, Own Source Revenue Collection for FY 2013/14 to FY 2018/19
Source: Trans Nzoia County Treasury
The County generated a total of Kshs.372.56 million from own revenue sources in FY 2018/19. This amount
represented an increase of Kshs.126.50 million compared to that realised in FY 2017/18 and was 74.5 per cent of the
annual target.
3.42.3 Conditional Grants During the reporting period, the County received Kshs.619.39 million as conditional grants as shown in.
Table 3.122: Trans Nzoia County, Conditional Grants/Loans Received in the FY 2018/19
S/No. Grant/Loans Annual Allocation- CARA, 2018 (Kshs)
Annual Budget Allocation (Kshs)
Actual Receipts (Kshs)
Receipts as Percentage of Annual Budget Allocation (%)
A Grants/Loans contained in CARA, 2018
1 IDA (World Bank) -Kenya Urban Support Project 340,306,900 340,306,900 340,306,900
100
2 DANIDA - Universal Healthcare to Devolved System Programme 18,933,750
18,933,750 18,933,750 100
3 Compensation for User Fee Foregone 21,304,915 21,304,915 21,304,915 100
4 Road Maintenance Fuel Levy Fund 147,985,503 147,985,503 147,985,503 100
5 World Bank-Transforming Health Systems for Universal Care Project 100,000,000
100,000,000 40,855,977.9 40.9
202.02
301.27
364.97
217.89246.06
372.56
0
50
100
150
200
250
300
350
400
FY 2013/14 FY 2014/15 FY 2015/16 FY 2016/17 FY 2017/18 FY 2018/19
Ksh
s. M
illio
ns
Trend in Own Source Revenue
Source: Trans Nzoia County Treasury
The County generated a total of Kshs.372.56 million from own revenue sources in FY 2018/19. This amount represented an increase of Kshs.126.50 million compared to that realised in FY 2017/18 and was 74.5 per cent of the annual target.
3.42.3 Conditional GrantsDuring the reporting period, the County received Kshs.619.39 million as conditional grants as shown in.
Table 3.122: Trans Nzoia County, Conditional Grants/Loans Received in the FY 2018/19
S/No. Grant/LoansAnnual Alloca-
tion- CARA, 2018 (Kshs)
Annual Budget Allocation(Kshs)
Actual Receipts (Kshs)
Receipts as Percentage of
Annual Budget Allocation (%)
A Grants/Loans contained in CARA, 2018
1. IDA (World Bank) -Kenya Urban Support Project 340,306,900 340,306,900 340,306,900 100
2. DANIDA - Universal Healthcare to Devolved System Pro-gramme 18,933,750 18,933,750 18,933,750 100
3. Compensation for User Fee Foregone 21,304,915 21,304,915 21,304,915 100
4. Road Maintenance Fuel Levy Fund 147,985,503 147,985,503 147,985,503 100
5. World Bank-Transforming Health Systems for Universal Care Project 100,000,000 100,000,000 40,855,977.9 40.9
6. IDA (World Bank) -National Agricultural and Rural Inclusive Growth Project 140,435,163 140,435,163 50,000,000 35.6
7. Leasing of Medical Equipment 200,000,000 - - -
8. Rehabilitation of Village Polytechnics 53,710,000 53,710,000 - -
9. IDA (World Bank) Kenya Devolution Support Programme “Level 1 grant” 46,456,661 46,456,661 - -
10. Sweden - Agriculture Sector Development Support Pro-gramme (ASDSP) II + Bal C/F in FY 2017/18 19,595,837 19,595,837 - -
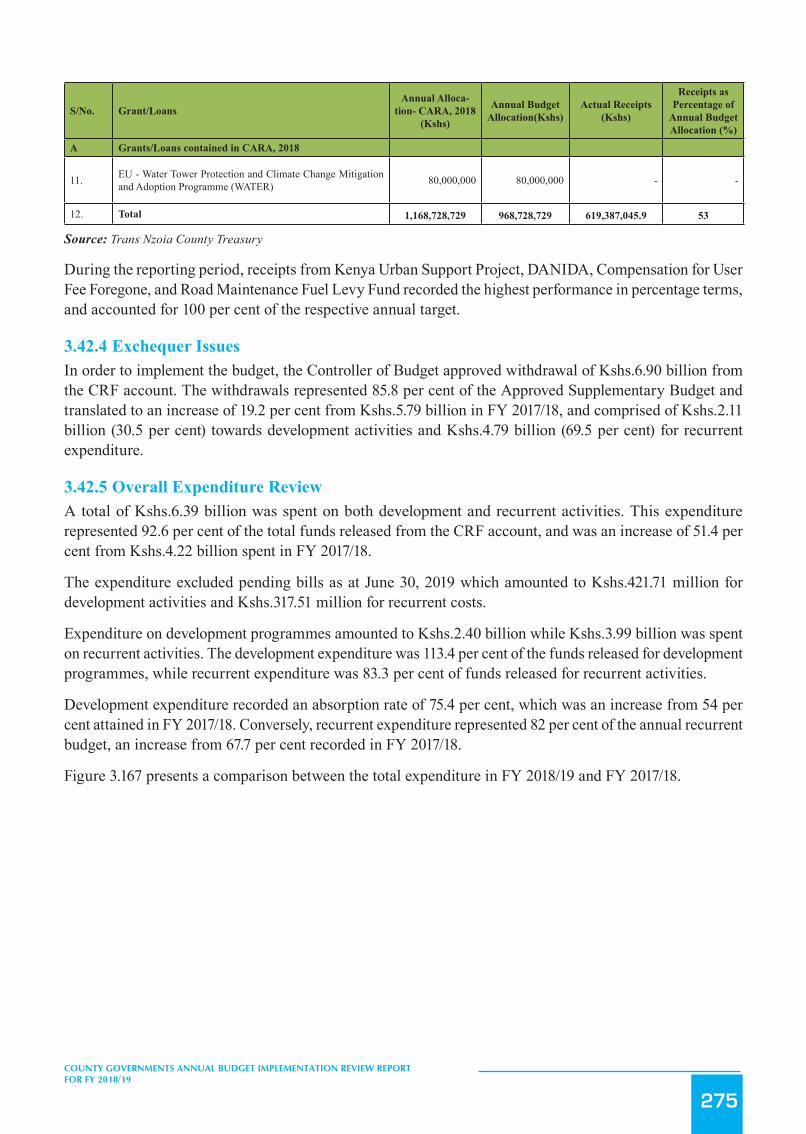
275
COUNTY GOVERNMENTS ANNUAL BUDGET IMPLEMENTATION REVIEW REPORT FOR FY 2018/19
S/No. Grant/LoansAnnual Alloca-
tion- CARA, 2018 (Kshs)
Annual Budget Allocation(Kshs)
Actual Receipts (Kshs)
Receipts as Percentage of
Annual Budget Allocation (%)
A Grants/Loans contained in CARA, 2018
11. EU - Water Tower Protection and Climate Change Mitigation and Adoption Programme (WATER) 80,000,000 80,000,000 - -
12. Total 1,168,728,729 968,728,729 619,387,045.9 53
Source: Trans Nzoia County Treasury
During the reporting period, receipts from Kenya Urban Support Project, DANIDA, Compensation for User Fee Foregone, and Road Maintenance Fuel Levy Fund recorded the highest performance in percentage terms, and accounted for 100 per cent of the respective annual target.
3.42.4 Exchequer IssuesIn order to implement the budget, the Controller of Budget approved withdrawal of Kshs.6.90 billion from the CRF account. The withdrawals represented 85.8 per cent of the Approved Supplementary Budget and translated to an increase of 19.2 per cent from Kshs.5.79 billion in FY 2017/18, and comprised of Kshs.2.11 billion (30.5 per cent) towards development activities and Kshs.4.79 billion (69.5 per cent) for recurrent expenditure.
3.42.5 Overall Expenditure ReviewA total of Kshs.6.39 billion was spent on both development and recurrent activities. This expenditure represented 92.6 per cent of the total funds released from the CRF account, and was an increase of 51.4 per cent from Kshs.4.22 billion spent in FY 2017/18.
The expenditure excluded pending bills as at June 30, 2019 which amounted to Kshs.421.71 million for development activities and Kshs.317.51 million for recurrent costs.
Expenditure on development programmes amounted to Kshs.2.40 billion while Kshs.3.99 billion was spent on recurrent activities. The development expenditure was 113.4 per cent of the funds released for development programmes, while recurrent expenditure was 83.3 per cent of funds released for recurrent activities.
Development expenditure recorded an absorption rate of 75.4 per cent, which was an increase from 54 per cent attained in FY 2017/18. Conversely, recurrent expenditure represented 82 per cent of the annual recurrent budget, an increase from 67.7 per cent recorded in FY 2017/18.
Figure 3.167 presents a comparison between the total expenditure in FY 2018/19 and FY 2017/18.
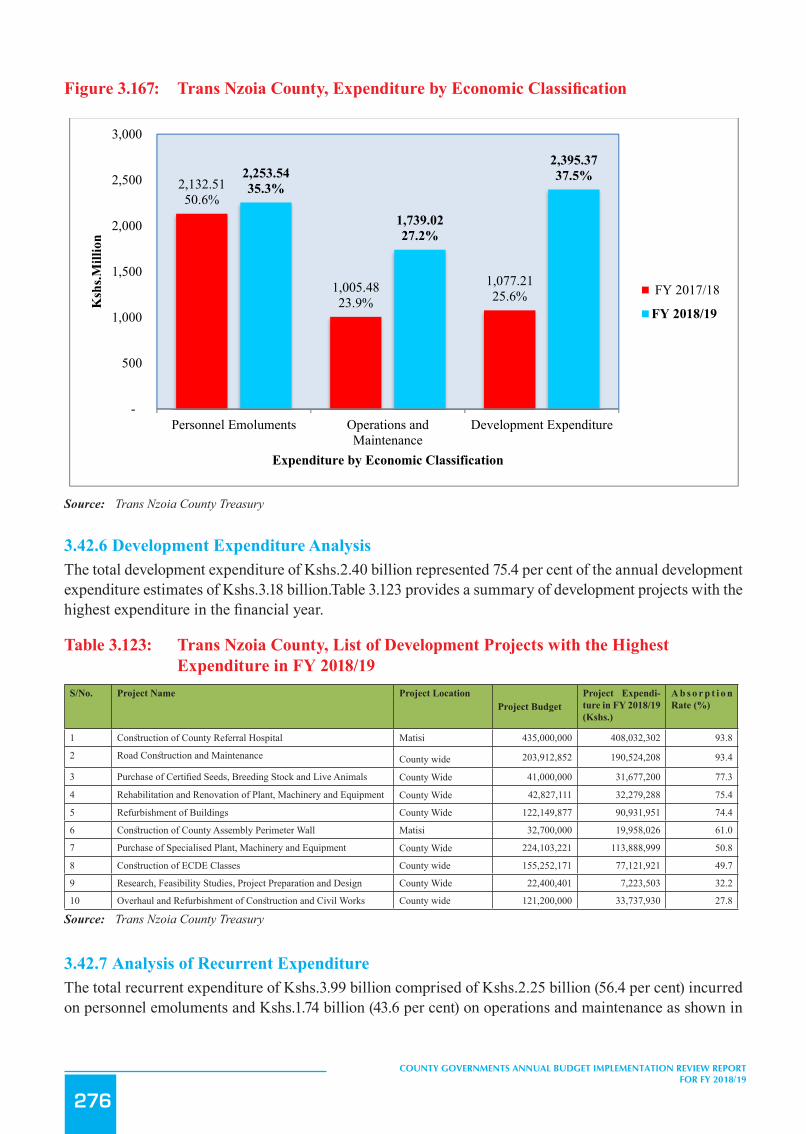
276
COUNTY GOVERNMENTS ANNUAL BUDGET IMPLEMENTATION REVIEW REPORT FOR FY 2018/19
Figure3.167: TransNzoiaCounty,ExpenditurebyEconomicClassification
312
Figure 3.167: Trans Nzoia County, Expenditure by Economic Classification
Source: Trans Nzoia County Treasury
3.42.6 Development Expenditure Analysis The total development expenditure of Kshs.2.40 billion represented 75.4 per cent of the annual development
expenditure estimates of Kshs.3.18 billion.Table 3.123 provides a summary of development projects with the highest
expenditure in the financial year.
Table 3.123: Trans Nzoia County, List of Development Projects with the Highest Expenditure in FY 2018/19
S/No. Project Name Project Location Project Budget
Project Expenditure in FY 2018/19 (Kshs.)
Absorption Rate (%)
1 Construction of County Referral Hospital Matisi 435,000,000 408,032,302 93.8
2 Road Construction and Maintenance County wide 203,912,852 190,524,208 93.4
3 Purchase of Certified Seeds, Breeding Stock and Live Animals County Wide 41,000,000 31,677,200 77.3
4 Rehabilitation and Renovation of Plant, Machinery and Equipment County Wide 42,827,111 32,279,288 75.4
5 Refurbishment of Buildings County Wide 122,149,877 90,931,951 74.4
6 Construction of County Assembly Perimeter Wall Matisi 32,700,000 19,958,026 61.0
7 Purchase of Specialised Plant, Machinery and Equipment County Wide 224,103,221 113,888,999 50.8
8 Construction of ECDE Classes County wide 155,252,171 77,121,921 49.7
9 Research, Feasibility Studies, Project Preparation and Design County Wide 22,400,401 7,223,503 32.2
10 Overhaul and Refurbishment of Construction and Civil Works County wide 121,200,000 33,737,930 27.8
Source: Trans Nzoia County Treasury
2,132.5150.6%
1,005.4823.9%
1,077.2125.6%
2,253.5435.3%
1,739.0227.2%
2,395.3737.5%
-
500
1,000
1,500
2,000
2,500
3,000
Personnel Emoluments Operations andMaintenance
Development Expenditure
Ksh
s.Mill
ion
Expenditure by Economic Classification
FY 2017/18
FY 2018/19
Source: Trans Nzoia County Treasury
3.42.6 Development Expenditure AnalysisThe total development expenditure of Kshs.2.40 billion represented 75.4 per cent of the annual development expenditure estimates of Kshs.3.18 billion.Table 3.123 provides a summary of development projects with the highest expenditure in the financial year.
Table 3.123: Trans Nzoia County, List of Development Projects with the Highest Expenditure in FY 2018/19
S/No. Project Name Project LocationProject Budget
Project Expendi-ture in FY 2018/19 (Kshs.)
A b s o r p t i o n Rate (%)
1 Construction of County Referral Hospital Matisi 435,000,000 408,032,302 93.8
2 Road Construction and Maintenance County wide 203,912,852 190,524,208 93.4
3 Purchase of Certified Seeds, Breeding Stock and Live Animals County Wide 41,000,000 31,677,200 77.3
4 Rehabilitation and Renovation of Plant, Machinery and Equipment County Wide 42,827,111 32,279,288 75.4
5 Refurbishment of Buildings County Wide 122,149,877 90,931,951 74.4
6 Construction of County Assembly Perimeter Wall Matisi 32,700,000 19,958,026 61.0
7 Purchase of Specialised Plant, Machinery and Equipment County Wide 224,103,221 113,888,999 50.8
8 Construction of ECDE Classes County wide 155,252,171 77,121,921 49.7
9 Research, Feasibility Studies, Project Preparation and Design County Wide 22,400,401 7,223,503 32.2
10 Overhaul and Refurbishment of Construction and Civil Works County wide 121,200,000 33,737,930 27.8
Source: Trans Nzoia County Treasury
3.42.7 Analysis of Recurrent ExpenditureThe total recurrent expenditure of Kshs.3.99 billion comprised of Kshs.2.25 billion (56.4 per cent) incurred on personnel emoluments and Kshs.1.74 billion (43.6 per cent) on operations and maintenance as shown in

277
COUNTY GOVERNMENTS ANNUAL BUDGET IMPLEMENTATION REVIEW REPORT FOR FY 2018/19
Figure 3.167. Expenditure on personnel emoluments represented an increase of 5.7 per cent compared to FY 2017/18 when the County spent Kshs.2.13 billion and was 35.3 per cent of the total expenditure in FY 2018/19.Figure 3.168 shows a summary of operations and maintenance expenditure by major categories.
Figure 3.168: Trans Nzoia County, Operations and Maintenance Expenditure by Major Categories in FY 2018/19
313
3.42.7 Analysis of Recurrent Expenditure The total recurrent expenditure of Kshs.3.99 billion comprised of Kshs.2.25 billion (56.4 per cent) incurred on personnel
emoluments and Kshs.1.74 billion (43.6 per cent) on operations and maintenance as shown in Figure 3.167 Expenditure
on personnel emoluments represented an increase of 5.7 per cent compared to FY 2017/18 when the County spent
Kshs.2.13 billion and was 35.3 per cent of the total expenditure in FY 2018/19.Figure 3.168 shows a summary of
operations and maintenance expenditure by major categories.
Figure 3.168: Trans Nzoia County, Operations and Maintenance Expenditure by Major Categories in FY 2018/19
Source: Trans Nzoia County Treasury
The County spent Kshs.31.49 million on committee sitting allowances for the 39 MCAs and Speaker against the annual
budget allocation of Kshs.69.30 million. This represented an increase of 114.4 per cent compared to Kshs.14.69 million
spent in FY 2017/18. The average monthly sitting allowance translated to Kshs.65,597 per MCA against the SRC’s
recommended monthly ceiling of Kshs.124,800.
Expenditure on domestic and foreign travel amounted to Kshs.185.74 million, and comprised of Kshs.132.77 million
spent by the County Assembly and Kshs.52.97 million by the County Executive.
3.42.8 Budget Performance by County Department Table3.124 shows a summary of the approved budget allocation and performance by department in FY 2018/19.
Table3.124: Trans Nzoia County, Budget Performance by Department in FY 2018/19
370.82
150.80133.97 123.74
87.31 77.66 73.9648.92 45.08 41.81
0
50
100
150
200
250
300
350
400
Ksh
s. M
illio
n
Major Categories of Operations & Maintenance
Source: Trans Nzoia County Treasury
The County spent Kshs.31.49 million on committee sitting allowances for the 39 MCAs and Speaker against the annual budget allocation of Kshs.69.30 million. This represented an increase of 114.4 per cent compared to Kshs.14.69 million spent in FY 2017/18. The average monthly sitting allowance translated to Kshs.65,597 per MCA against the SRC’s recommended monthly ceiling of Kshs.124,800.
Expenditure on domestic and foreign travel amounted to Kshs.185.74 million, and comprised of Kshs.132.77 million spent by the County Assembly and Kshs.52.97 million by the County Executive.
3.42.8 Budget Performance by County DepartmentTable 3.124 shows a summary of the approved budget allocation and performance by department in FY 2018/19.

278
COUNTY GOVERNMENTS ANNUAL BUDGET IMPLEMENTATION REVIEW REPORT FOR FY 2018/19
Table 3.124: Trans Nzoia County, Budget Performance by Department in FY 2018/19
DepartmentAnnual Budget Alloca-
tion (Kshs. Million)Exchequer Issues (Kshs.
Million)Expenditure (Kshs.
Million)
Expenditure to Exchequer Issues
(%)
Absorption Rate (%)
Rec Dev Rec Dev Rec Dev Rec Dev Rec Dev
Agriculture297.64 328.15 289.53 184.18 268.60 142.94 92.8 77.6 90.2 43.6
Livestock 16.27 90.30 10.34 19.76 16.27 65.97 157.4 333.9 100 73.1
Trade, Commerce and Industry 38.44 53.26 38.44 8.78 14.62 32.06 38.0 365.1 38.0 60.2
Water, Environment and Natural Resources 85.84 377.02 73.79 181.56 58.77 323.30 79.6 178.1 68.5 85.8
Public Works, Roads and Infrastructure
279.42 514.40 275.83 514.20 211.29 464.66 76.6 90.4 75.6 90.3
Health and Corporate Services
1,675.59 638.94 1,672.12 424.74 1,433.27 522.28 87.7 123.0 85.5 81.7
Lands, Housing and Urban Development 66.14 426.91 56.02 361.46 33.15 388.45 59.2 107.5 50.1 91.0
Gender, Youth, Sports, Culture, Social Services & Tourism
72.42 74.56 61.94 20.10 52.34 66.79 84.5 332.3 72.3 89.6
Governance and Public Service Management 598.39 42.00 588.97 12.95 480.82 11.20 81.6 86.5 80.4 26.7
County Public Service Board
32.26 27.35 26.78 0 23.39 4.69 87.3 0 72.5 17.1
Education and ICT 344.42 285.00 344.42 204.60 333.69 178.44 96.9 87.2 96.9 62.6
Finance 711.08 146.56 711.07 134.84 442.90 135.09 62.3 100.2 62.3 92.2
Economic Planning 35.15 30.97 27.68 10.40 9.54 24.91 34.5 239.5 27.1 80.4
County Assembly 614.08 140.00 614.08 34.60 613.92 34.60 100 100.0 100 24.7
TOTAL 4,867.14 3,175.42 4,791.0 2,112.16 3,992.57 2,395.37 83.3 113.4 82.0 75.4
Source: Trans Nzoia County Treasury
Analysis of expenditure by department shows that the Department of Finance recorded the highest absorption rate of development budget at 92.2 per cent while the Department of County Public Service Board recorded the lowest at 17.1 per cent. The Department of Livestock and the County Assembly had the highest percentage of recurrent expenditure to recurrent budget at 100 per cent respectively while the Department of Economic Planning had the lowest at 27.1per cent.
3.42.9 Key Observations and RecommendationsThe County has made progress in addressing some of the challenges previously identified as affecting budget implementation. Some of the progress made included:
i. Improvement in own source of revenue collection by 51.4 per cent from Kshs.246.06 million in the FY 2017/18 to Kshs.372.56 million in the reporting period.
ii. Improvement in the absorption of the development budget from 54 per cent in FY 2017/18 to 75.4 per cent in the reporting period.
Despite the above progress, the following challenges continued to hamper effective budget implementation;
1. A high wage bill that increased by 5.7 per cent from Kshs.2.13 billion in the FY 2017/18 to Kshs.2.25 billion in the reporting period. The wage bill accounted for 35.3 per cent of total expenditure in the reporting period.
2. Late submission of financial returns by the County Treasury, which affected timely preparation of

279
COUNTY GOVERNMENTS ANNUAL BUDGET IMPLEMENTATION REVIEW REPORT FOR FY 2018/19
budget implementation report by OCOB contrary to Section 166 of the PFM Act, 2012.3. Failure to establish an Internal Audit Committee to oversee financial operations in the County contrary
to the provisions of Section 155 of the PFM Act, 2012.
The County should implement the following measures in order to improve budget execution;
1. The County Public Service Board should put in place measures to ensure the wage bill does not increase above the legal limit in the medium term.
2. The County Treasury should ensure timely preparation and submission of financial reports to the Controller of Budget in line with Section 166 of PFM Act, 2012.
3. The County should establish an Internal Audit Committee in line with Section 155 of the PFM Act, 2012.
3.43 Turkana County
3.43.1 Overview of the FY 2018/19 BudgetThe County’s FY 2018/19 Supplementary Budget was Kshs.15.35 billion, comprising of Kshs.9.6 billion (62.5 per cent) and Kshs.5.75 billion (37.5 per cent) allocation for recurrent and development expenditure respectively.
To finance the budget, the County expects to receive Kshs.10.71 billion (69.8 per cent) as equitable share of revenue raised nationally, Kshs.1.02 billion (6.6 per cent) as total conditional grants, generate Kshs.250 million (1.6 per cent) from own-source of revenue, and Kshs.2.77 billion (18 per cent) cash balance from FY 2017/18.
Figure 3.169: Turkana County, Expected Sources of Budget Financing in FY 2018/19
315
1. A high wage bill that increased by 5.7 per cent from Kshs.2.13 billion in the FY 2017/18 to Kshs.2.25 billion in
the reporting period. The wage bill accounted for 35.3 per cent of total expenditure in the reporting period.
2. Late submission of financial returns by the County Treasury, which affected timely preparation of budget
implementation report by OCOB contrary to Section 166 of the PFM Act, 2012.
3. Failure to establish an Internal Audit Committee to oversee financial operations in the County contrary to the
provisions of Section 155 of the PFM Act, 2012.
The County should implement the following measures in order to improve budget execution;
1. The County Public Service Board should put in place measures to ensure the wage bill does not increase above the
legal limit in the medium term.
2. The County Treasury should ensure timely preparation and submission of financial reports to the Controller of
Budget in line with Section 166 of PFM Act, 2012.
3. The County should establish an Internal Audit Committee in line with Section 155 of the PFM Act, 2012.
3.43 Turkana County
3.43.1 Overview of the FY 2018/19 Budget The County’s FY 2018/19 Supplementary Budget was Kshs.15.35 billion, comprising of Kshs.9.6 billion
(62.5 per cent) and Kshs.5.75 billion (37.5 per cent) allocation for recurrent and development expenditure
respectively.
To finance the budget, the County expects to receive Kshs.10.71 billion (69.8 per cent) as equitable share of
revenue raised nationally, Kshs.1.02 billion (6.6 per cent) as total conditional grants, generate Kshs.250
million (1.6 per cent) from own-source of revenue, and Kshs.2.77 billion (18 per cent) cash balance from FY
2017/18.
Figure 3.169: Turkana County Expected Sources of Budget Financing in FY 2018/19
Source: Turkana County Treasury
The conditional grants contained in the CARA, 2018 are shown in Table 3.125 .
Cash Balance from FY 2017/18
19%National Sharable
Revenue72%
Total Conditional Allocations
7%
Own Source Revenue
2%
Source: Turkana County Treasury
The conditional grants contained in the CARA, 2018 are shown in Table 3.125 .

280
COUNTY GOVERNMENTS ANNUAL BUDGET IMPLEMENTATION REVIEW REPORT FOR FY 2018/19
3.43.2 Revenue AnalysisDuring the FY 2018/19, the County received Kshs.10.77 billion as equitable share of the revenue raised nationally, Kshs.588.43 million as total conditional grants, raised Kshs.175.03 million from own-source revenue, and had a cash balance of Kshs.2.77 billion from FY 2017/18. The total funds available for budget implementation amounted to Kshs. 14.3 billion.
Figure 3.170 shows the yearly trend in own-source revenue collection from the FY 2013/14 to the FY 2018/19.
Figure 3.170: Turkana County, Own Source Revenue Collection for the FY 2013/14 to FY 2018/19
316
3.43.2 Revenue Analysis During the FY 2018/19, the County received Kshs.10.77 billion as equitable share of the revenue raised
nationally, Kshs.588.43 million as total conditional grants, raised Kshs.175.03 million from own-source
revenue, and had a cash balance of Kshs.2.77 billion from FY 2017/18. The total funds available for budget
implementation amounted to Kshs. 14.3 billion.
Figure 3.170 shows the yearly trend in own-source revenue collection from the FY 2013/14 to the FY
2018/19.
Figure 3.170: Turkana County, Own Source Revenue Collection for the FY 2013/14 to FY 2018/19
Source: Turkana County Treasury
The County generated a total of Kshs.175.03 million from own revenue sources during the FY 2018/19. This
amount represented an increase of Kshs.31.13 million compared to that realised during a similar period of
FY 2017/18 and was 70 per cent of the annual target.
3.43.3 Conditional Grants The County received Kshs.588.43 million as conditional grants in the financial year 2018/19 as shown in
Table 3.125.
Table 3.125: Turkana County, Conditional Grants/Loans Received in the FY 2018/19
S/No Grants
Annual CARA, 2018 Allocation (in Kshs)
Annual Budget Allocation (in Kshs)
Actual receipts in the FY 2018/19 (in Kshs.)
Actual Receipts as Percentage of Annual Allocation (%)
129.66 133.28 134.02
186.32
143.90
175.03
020406080
100120140160180200
FY 2013/14 FY 2014/15 FY 2015/16 FY 2016/17 FY 2017/18 FY 2018/19
Kshs. M
illions
Trend in Own Source Revenue
Source: Turkana County Treasury
The County generated a total of Kshs.175.03 million from own revenue sources during the FY 2018/19. This amount represented an increase of Kshs.31.13 million compared to that realised during a similar period of FY 2017/18 and was 70 per cent of the annual target.
3.43.3 Conditional GrantsThe County received Kshs.588.43 million as conditional grants in the financial year 2018/19 as shown in Table 3.125.
Table 3.125: Turkana County, Conditional Grants/Loans Received in the FY 2018/19
S/No GrantsAnnual CARA,
2018 Allocation (in Kshs)
Annual Budget Allo-cation (in Kshs)
Actual receipts in the FY 2018/19 (in
Kshs.)
Actual Receipts as
Percentage of Annual Allo-cation (%)
1 Compensation for User Fee Foregone 25,634,941 25,634,941 25,634,941 100
2 Leasing of Medical Equipment 200,000,000 200,000,000 - -
3 Kenya Urban Support Programme Bal C/F 2017/18 41,200,000 41,200,000 41,200,000 100
4 Road Maintenance Fuel Levy 283,569,986 283,569,986 283,569,986 100
5 Rehabilitation of Village Polytechnics 25,285,000 25,285,000 26,258,855 -
6 Transforming Health Systems for Universal Care Project (WB) 100,000,000 100,000,000 48,512,781 49
7 National Agricultural and Rural Inclusive Growth Project (NARIGP) 140,435,163 140,435,163 50,078,476 36

281
COUNTY GOVERNMENTS ANNUAL BUDGET IMPLEMENTATION REVIEW REPORT FOR FY 2018/19
S/No GrantsAnnual CARA,
2018 Allocation (in Kshs)
Annual Budget Allo-cation (in Kshs)
Actual receipts in the FY 2018/19 (in
Kshs.)
Actual Receipts as
Percentage of Annual Allo-cation (%)
8 FAO-Vaccination Programmes for PPR, SGP and Disease Surveillance - 9,912,300 10,641,040 -
9 Kenya Devolution Support Project (KDSP) “Level 1 grant” 65,446,016 65,446,016 - -
10 Kenya Urban Support Project (KUSP) 95,023,200 95,023,200 95,023,200 100
11 DANIDA Grant 33,766,875 33,766,875 33,766,875 100
Total 1,010,361,181 1,020,273,481 588,427,299 58
Source: Turkana County Treasury
During the FY 2018/19, receipts from the Kenya Urban Support Project (KUSP), DANIDA grant, Road Maintenance Fuel Levy, and Compensation for User Fee Foregone received the highest receipts as percentage of annual budget allocation from conditional grant at 100 per cent of their respective annual allocation.
3.43.4 Exchequer IssuesTo finance the budget, the Controller of Budget approved the withdrawal of Kshs.11.7 billion from the CRF account. The withdrawals represented 72.8 per cent of the Approved Budget and translated to an increase of 32.3 per cent from Kshs.8.45 billion approved in the FY 2017/18 and comprised of Kshs.8.57 billion (76.7 per cent) to fund recurrent expenditure and Kshs.2.6 billion (23.3 per cent) for development activities.
3.43.5 Overall Expenditure ReviewThe County Government spent a total of Kshs.10.35 billion on recurrent and development activities. This expenditure represented 92.6 per cent of the total funds released from the CRF account and was an increase of 27.3 per cent from Kshs.8.13 billion spent in FY 2017/18.
The expenditure excluded pending bills as at June 30, 2019 which amounted to Kshs.1.9 billion for development activities and Kshs.345.07 million for recurrent costs.
Expenditure on recurrent activities amounted to Kshs.8.67 billion while Kshs.1.68 billion was spent on development activities. The recurrent expenditure was 101.2 per cent of the funds released for recurrent activities, while development expenditure was 64.4 per cent of funds released for development activities.
The recurrent expenditure represented 90.3 per cent of the annual recurrent budget, a decrease from 96.3 per cent recorded in FY 2017/18. Development expenditure recorded an absorption rate of 29.1 per cent, which was a decrease from 46.7 per cent attained in FY 2017/18. Figure 3.171 presents a comparison between the total expenditure in the FY 2018/19 and in FY 2017/18.
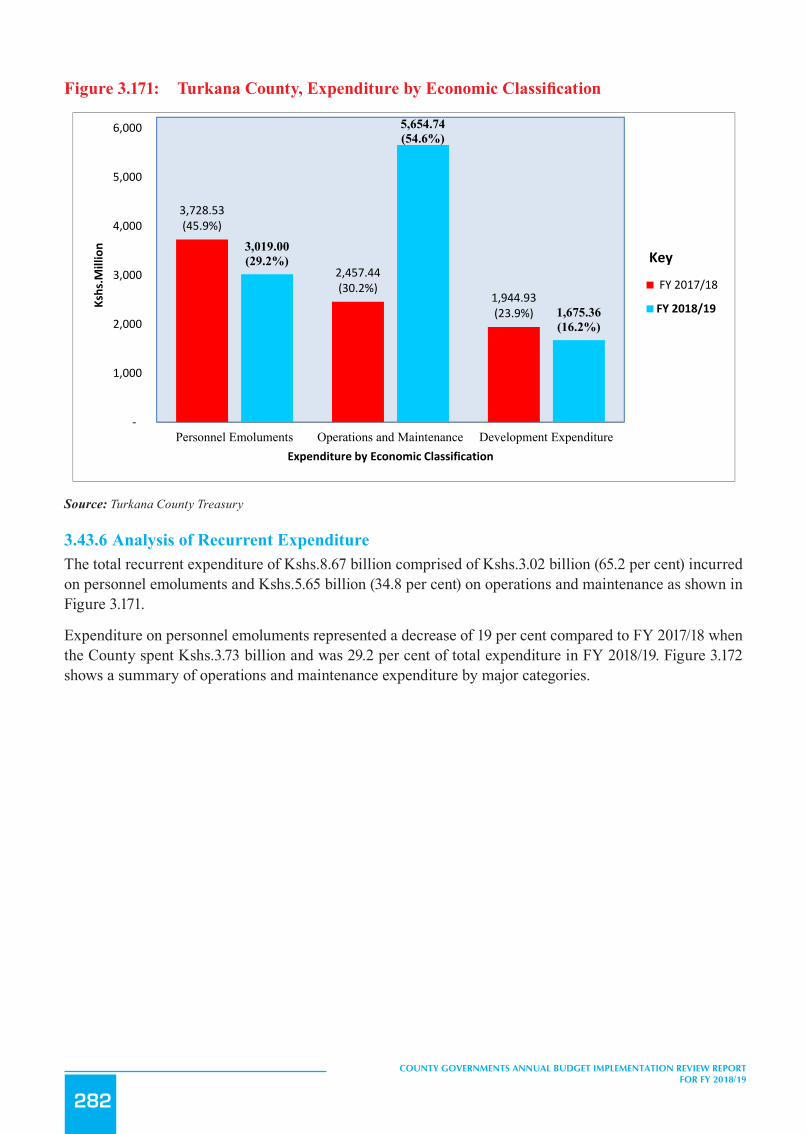
282
COUNTY GOVERNMENTS ANNUAL BUDGET IMPLEMENTATION REVIEW REPORT FOR FY 2018/19
Figure3.171: TurkanaCounty,ExpenditurebyEconomicClassification
318
The recurrent expenditure represented 90.3 per cent of the annual recurrent budget, a decrease from 96.3 per
cent recorded in FY 2017/18. Development expenditure recorded an absorption rate of 29.1 per cent, which
was a decrease from 46.7 per cent attained in FY 2017/18. Figure 3.171 presents a comparison between the
total expenditure in the FY 2018/19 and in FY 2017/18.
Figure 3.171: Turkana County, Expenditure by Economic Classification
Source: Turkana County Treasury
3.43.6 Analysis of Recurrent Expenditure The total recurrent expenditure of Kshs.8.67 billion comprised of Kshs.3.02 billion (65.2 per cent) incurred
on personnel emoluments and Kshs.5.65 billion (34.8 per cent) on operations and maintenance as shown in
Figure 3.171.
Expenditure on personnel emoluments represented a decrease of 19 per cent compared to FY 2017/18 when
the County spent Kshs.3.73 billion and was 29.2 per cent of total expenditure in FY 2018/19. Figure 3.172
shows a summary of operations and maintenance expenditure by major categories.
Figure 3.172: Turkana County, Operations and Maintenance Expenditure by Major Categories in the FY 2018/19
3,728.53(45.9%)
2,457.44(30.2%)
1,944.93(23.9%)
3,019.00(29.2%)
5,654.74(54.6%)
1,675.36(16.2%)
‐
1,000
2,000
3,000
4,000
5,000
6,000
Personnel Emoluments Operations and Maintenance Development Expenditure
Kshs.M
illion
Expenditure by Economic Classification
FY 2017/18
FY 2018/19
Key
Source: Turkana County Treasury
3.43.6 Analysis of Recurrent ExpenditureThe total recurrent expenditure of Kshs.8.67 billion comprised of Kshs.3.02 billion (65.2 per cent) incurred on personnel emoluments and Kshs.5.65 billion (34.8 per cent) on operations and maintenance as shown in Figure 3.171.
Expenditure on personnel emoluments represented a decrease of 19 per cent compared to FY 2017/18 when the County spent Kshs.3.73 billion and was 29.2 per cent of total expenditure in FY 2018/19. Figure 3.172 shows a summary of operations and maintenance expenditure by major categories.

283
COUNTY GOVERNMENTS ANNUAL BUDGET IMPLEMENTATION REVIEW REPORT FOR FY 2018/19
Figure 3.172: Turkana County, Operations and Maintenance Expenditure by Major Categories in the FY 2018/19
319
Source: Turkana County Treasury
The County spent Kshs.23.45 million on committee sitting allowances for the 48 MCAs and speaker against
the annual budget allocation of Kshs.81.76 million. This represented an increase of over 100 per cent
compared to Kshs.5.65 million spent in FY 2017/18. The average monthly sitting allowance translated to
Kshs.40,709 per MCA against the SRC’s recommended monthly ceiling of Kshs.124,800.
Expenditure on domestic and foreign travel amounted to Kshs.292.42 million and comprised of Kshs.207.04
million spent by the County Assembly and Kshs.85.38 million spent by the County Executive.
3.43.7 Development Expenditure Analysis The total development expenditure of Kshs.1.68 billion represented 29.1 per cent of the annual development
expenditure budget of Kshs.5.75 billion. Table 3.126 provides a summary of development projects with the
highest expenditure in the financial year.
Table 3.126: Turkana County County, List of Development Projects with the Highest Expenditure in FY 2018/19
S/No. Project Name Project Location Project Budget (Kshs.)
FY 2018/19 Project Expenditure (Kshs.)
688.04
373.25 353.18 344.94 344.02290
200 178.45 157.59
0
100
200
300
400
500
600
700
800
Ksh
s. M
illio
n
Major Categories of Operations & Maintenance
Source: Turkana County Treasury
The County spent Kshs.23.45 million on committee sitting allowances for the 48 MCAs and speaker against the annual budget allocation of Kshs.81.76 million. This represented an increase of over 100 per cent compared to Kshs.5.65 million spent in FY 2017/18. The average monthly sitting allowance translated to Kshs.40,709 per MCA against the SRC’s recommended monthly ceiling of Kshs.124,800.
Expenditure on domestic and foreign travel amounted to Kshs.292.42 million and comprised of Kshs.207.04 million spent by the County Assembly and Kshs.85.38 million spent by the County Executive.
3.43.7 Development Expenditure AnalysisThe total development expenditure of Kshs.1.68 billion represented 29.1 per cent of the annual development expenditure budget of Kshs.5.75 billion. Table 3.126 provides a summary of development projects with the highest expenditure in the financial year.
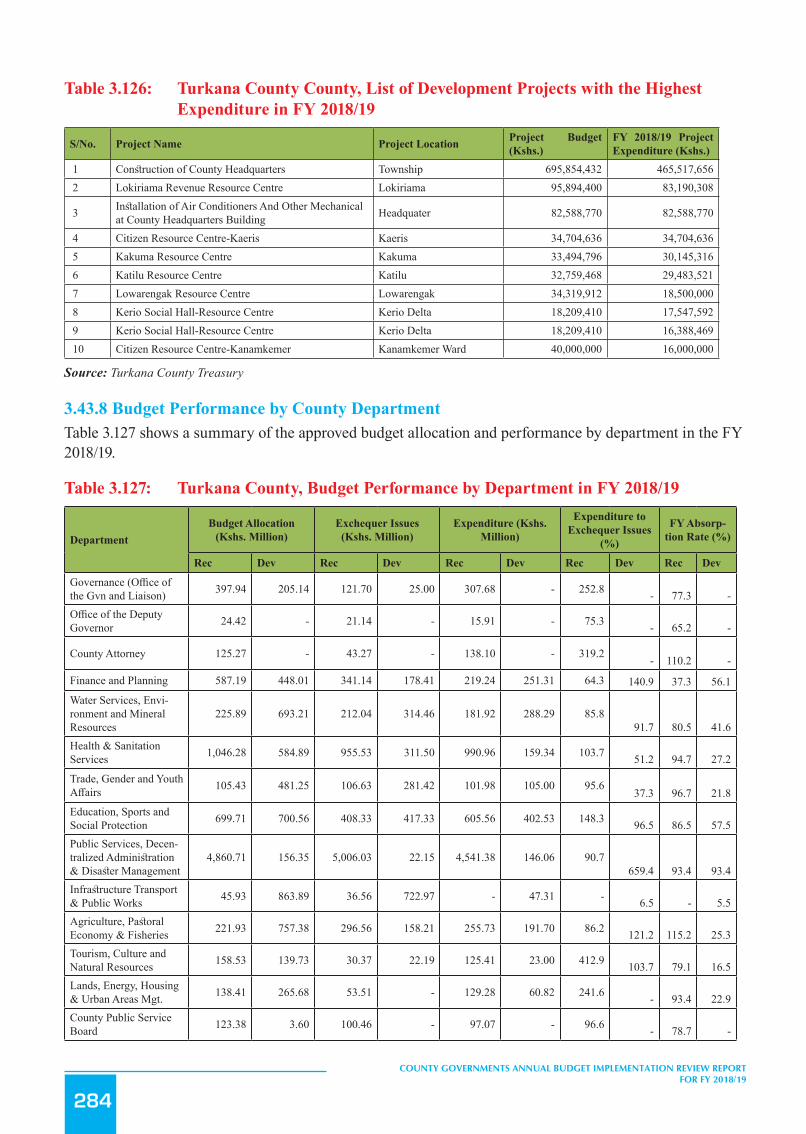
284
COUNTY GOVERNMENTS ANNUAL BUDGET IMPLEMENTATION REVIEW REPORT FOR FY 2018/19
Table 3.126: Turkana County County, List of Development Projects with the Highest Expenditure in FY 2018/19
S/No. Project Name Project Location Project Budget (Kshs.)
FY 2018/19 Project Expenditure (Kshs.)
1 Construction of County Headquarters Township 695,854,432 465,517,656 2 Lokiriama Revenue Resource Centre Lokiriama 95,894,400 83,190,308
3 Installation of Air Conditioners And Other Mechanical at County Headquarters Building Headquater 82,588,770 82,588,770
4 Citizen Resource Centre-Kaeris Kaeris 34,704,636 34,704,636 5 Kakuma Resource Centre Kakuma 33,494,796 30,145,316 6 Katilu Resource Centre Katilu 32,759,468 29,483,521 7 Lowarengak Resource Centre Lowarengak 34,319,912 18,500,000 8 Kerio Social Hall-Resource Centre Kerio Delta 18,209,410 17,547,592 9 Kerio Social Hall-Resource Centre Kerio Delta 18,209,410 16,388,469 10 Citizen Resource Centre-Kanamkemer Kanamkemer Ward 40,000,000 16,000,000
Source: Turkana County Treasury
3.43.8 Budget Performance by County DepartmentTable 3.127 shows a summary of the approved budget allocation and performance by department in the FY 2018/19.
Table 3.127: Turkana County, Budget Performance by Department in FY 2018/19
DepartmentBudget Allocation
(Kshs. Million)Exchequer Issues
(Kshs. Million)Expenditure (Kshs.
Million)
Expenditure to Exchequer Issues
(%)
FY Absorp-tion Rate (%)
Rec Dev Rec Dev Rec Dev Rec Dev Rec Dev
Governance (Office of the Gvn and Liaison) 397.94 205.14 121.70 25.00 307.68 - 252.8 - 77.3 -Office of the Deputy Governor 24.42 - 21.14 - 15.91 - 75.3 - 65.2 -
County Attorney 125.27 - 43.27 - 138.10 - 319.2 - 110.2 -
Finance and Planning 587.19 448.01 341.14 178.41 219.24 251.31 64.3 140.9 37.3 56.1Water Services, Envi-ronment and Mineral Resources
225.89 693.21 212.04 314.46 181.92 288.29 85.891.7 80.5 41.6
Health & Sanitation Services 1,046.28 584.89 955.53 311.50 990.96 159.34 103.7 51.2 94.7 27.2
Trade, Gender and Youth Affairs 105.43 481.25 106.63 281.42 101.98 105.00 95.6
37.3 96.7 21.8Education, Sports and Social Protection 699.71 700.56 408.33 417.33 605.56 402.53 148.3 96.5 86.5 57.5Public Services, Decen-tralized Administration & Disaster Management
4,860.71 156.35 5,006.03 22.15 4,541.38 146.06 90.7659.4 93.4 93.4
Infrastructure Transport & Public Works 45.93 863.89 36.56 722.97 - 47.31 - 6.5 - 5.5Agriculture, Pastoral Economy & Fisheries 221.93 757.38 296.56 158.21 255.73 191.70 86.2 121.2 115.2 25.3Tourism, Culture and Natural Resources 158.53 139.73 30.37 22.19 125.41 23.00 412.9 103.7 79.1 16.5Lands, Energy, Housing & Urban Areas Mgt. 138.41 265.68 53.51 - 129.28 60.82 241.6 - 93.4 22.9County Public Service Board 123.38 3.60 100.46 - 97.07 - 96.6 - 78.7 -

285
COUNTY GOVERNMENTS ANNUAL BUDGET IMPLEMENTATION REVIEW REPORT FOR FY 2018/19
DepartmentBudget Allocation
(Kshs. Million)Exchequer Issues
(Kshs. Million)Expenditure (Kshs.
Million)
Expenditure to Exchequer Issues
(%)
FY Absorp-tion Rate (%)
Rec Dev Rec Dev Rec Dev Rec Dev Rec Dev
County Assembly 839.30 452.28 839.00 298.86 785.49 298.86 93.6 100.0 93.6 66.1TOTAL 9,600.32 5,751.97 8,572.27 2,752.50 8,495.71 1,974.22 99.1 71.7 88.5 34.3
Source: Turkana County Treasury
Analysis of expenditure by department shows that the Department of Water Services, Environment and Mineral Resources recorded the highest absorption rate of development budget at 74.9 while the County Public Service Board and Lands, Energy, Housing & Urban Areas Management did not incur any development expenditure. The Department of Agriculture, Pastoral Economy & Fisheries had the highest percentage of recurrent expenditure to its recurrent budget at 115.2 per cent while the Department of Public Services, Decentralized Administration & Disaster Management had the lowest at 0.9 per cent.
3.43.9 Key Observations and RecommendationsThe County has made progress in addressing some of the challenges previously identified as affecting budget implementation. Some of the progress made included:
Improvement in own-source revenue collection by 21.6 per cent from Kshs.143.9 million generated in FY 2017/18 to Kshs.175.03 million in FY 2018/19.
i. Improved internet connectivity, resulting into effective use of IFMIS to process financial transactions.
Despite the above progress, the following challenges continued to hamper effective budget implementation;
1. Delay in disbursement of the equitable share of revenue raised nationally by the National Treasury.2. Failure to constitute the County Budget and Economic Forum (CBEF) as per the requirement of
Section 137 of the PFM Act, 2012 for consultation in the budget process.3. Late submission of reports on financial and non-financial performance by the County Treasury to the
Controller of Budget, which affected timely preparation of budget implementation report contrary to Section 166 of the PFM Act, 2012. Further, the Office noted inconsistencies in development expenditure from the financial reports submitted by the County Treasury.
4. Inadequate budgetary control that resulted in expenditure above approved budget by the Department of Agriculture, Pastoral Economy & Fisheries and the Office of the County Attorney. This is contrary to Section 135 and 154 of PFM Act, 2012.
The County should implement the following recommendations in order to improve budget execution;
1. The County Treasury should liaise with the National Treasury to ensure that funds are released in a timely manner.
2. The County should constitute a County Budget and Economic Forum (CBEF) in line with Section 137 of the PFM Act, 2012.
3. The County Treasury should ensure timely preparation and submission of reports on financial and non-financial performance in line with Section 166 of PFM Act, 2012. The County Treasury should further put in place mechanisms to ensure that the financial reports are reviewed and authenticated before submission to oversight institutions.
4. The County Treasury should ensure expenditure is within the approved budget.
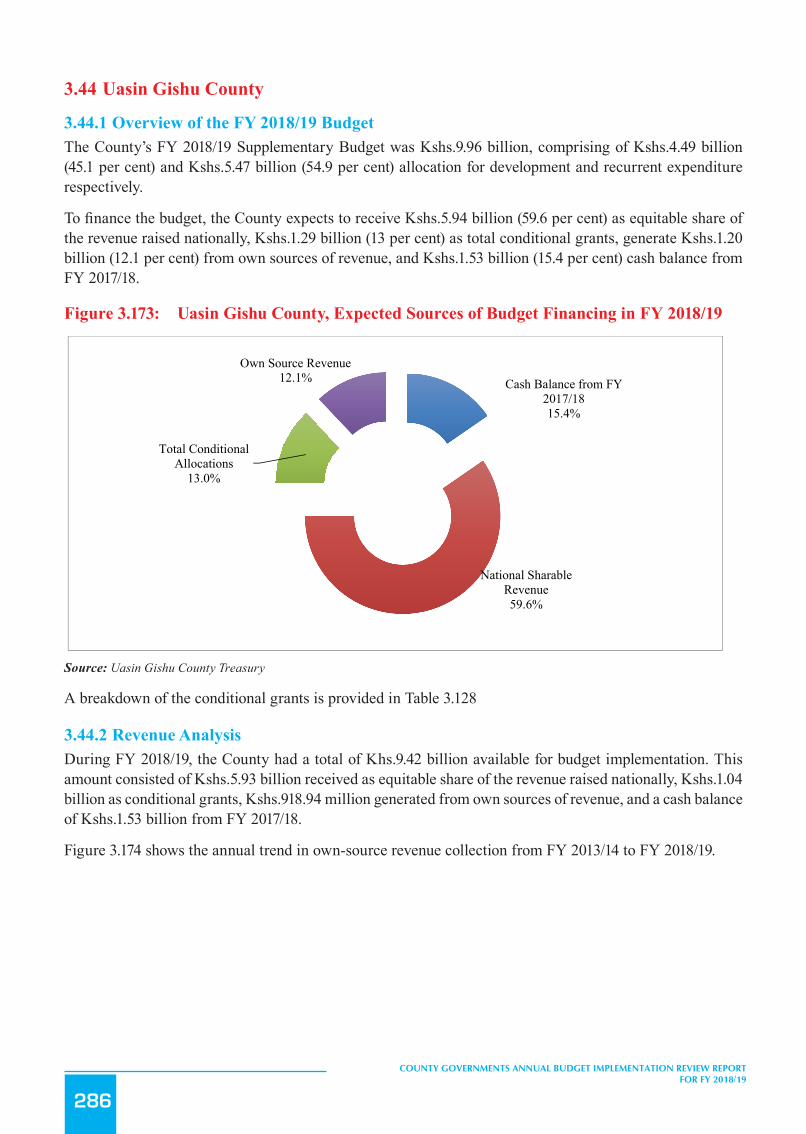
286
COUNTY GOVERNMENTS ANNUAL BUDGET IMPLEMENTATION REVIEW REPORT FOR FY 2018/19
3.44 Uasin Gishu County
3.44.1 Overview of the FY 2018/19 BudgetThe County’s FY 2018/19 Supplementary Budget was Kshs.9.96 billion, comprising of Kshs.4.49 billion (45.1 per cent) and Kshs.5.47 billion (54.9 per cent) allocation for development and recurrent expenditure respectively.
To finance the budget, the County expects to receive Kshs.5.94 billion (59.6 per cent) as equitable share of the revenue raised nationally, Kshs.1.29 billion (13 per cent) as total conditional grants, generate Kshs.1.20 billion (12.1 per cent) from own sources of revenue, and Kshs.1.53 billion (15.4 per cent) cash balance from FY 2017/18.
Figure 3.173: Uasin Gishu County, Expected Sources of Budget Financing in FY 2018/19
322
1. The County Treasury should liaise with the National Treasury to ensure that funds are released in a
timely manner.
2. The County should constitute a County Budget and Economic Forum (CBEF) in line with Section
137 of the PFM Act, 2012.
3. The County Treasury should ensure timely preparation and submission of reports on financial and
non -financial performance in line with Section 166 of PFM Act, 2012. The County Treasury should
further put in place mechanisms to ensure that the financial reports are reviewed and authenticated
before submission to oversight institutions.
4. The County Treasury should ensure expenditure is within the approved budget.
3.44 Uasin Gishu County
3.44.1 Overview of the FY 2018/19 Budget The County’s FY 2018/19 Supplementary Budget was Kshs.9.96 billion, comprising of Kshs.4.49 billion (45.1 per cent)
and Kshs.5.47 billion (54.9 per cent) allocation for development and recurrent expenditure respectively.
To finance the budget, the County expects to receive Kshs.5.94 billion (59.6 per cent) as equitable share of the revenue
raised nationally, Kshs.1.29 billion (13 per cent) as total conditional grants, generate Kshs.1.20 billion (12.1 per cent)
from own sources of revenue, and Kshs.1.53 billion (15.4 per cent) cash balance from FY 2017/18.
Figure 3.173: Uasin Gishu County, Expected Sources of Budget Financing in FY 2018/19
Source: Uasin Gishu County Treasury
A breakdown of the conditional grants is provided in Table 3.128
3.44.2 Revenue Analysis During FY 2018/19, the County had a total of Khs.9.42 billion available for budget implementation. This amount
consisted of Kshs.5.93 billion received as equitable share of the revenue raised nationally, Kshs.1.04 billion as
conditional grants, Kshs.918.94 million generated from own sources of revenue, and a cash balance of Kshs.1.53 billion
from FY 2017/18.
Cash Balance from FY 2017/1815.4%
National Sharable Revenue59.6%
Total Conditional Allocations
13.0%
Own Source Revenue12.1%
Source: Uasin Gishu County Treasury
A breakdown of the conditional grants is provided in Table 3.128
3.44.2 Revenue AnalysisDuring FY 2018/19, the County had a total of Khs.9.42 billion available for budget implementation. This amount consisted of Kshs.5.93 billion received as equitable share of the revenue raised nationally, Kshs.1.04 billion as conditional grants, Kshs.918.94 million generated from own sources of revenue, and a cash balance of Kshs.1.53 billion from FY 2017/18.
Figure 3.174 shows the annual trend in own-source revenue collection from FY 2013/14 to FY 2018/19.
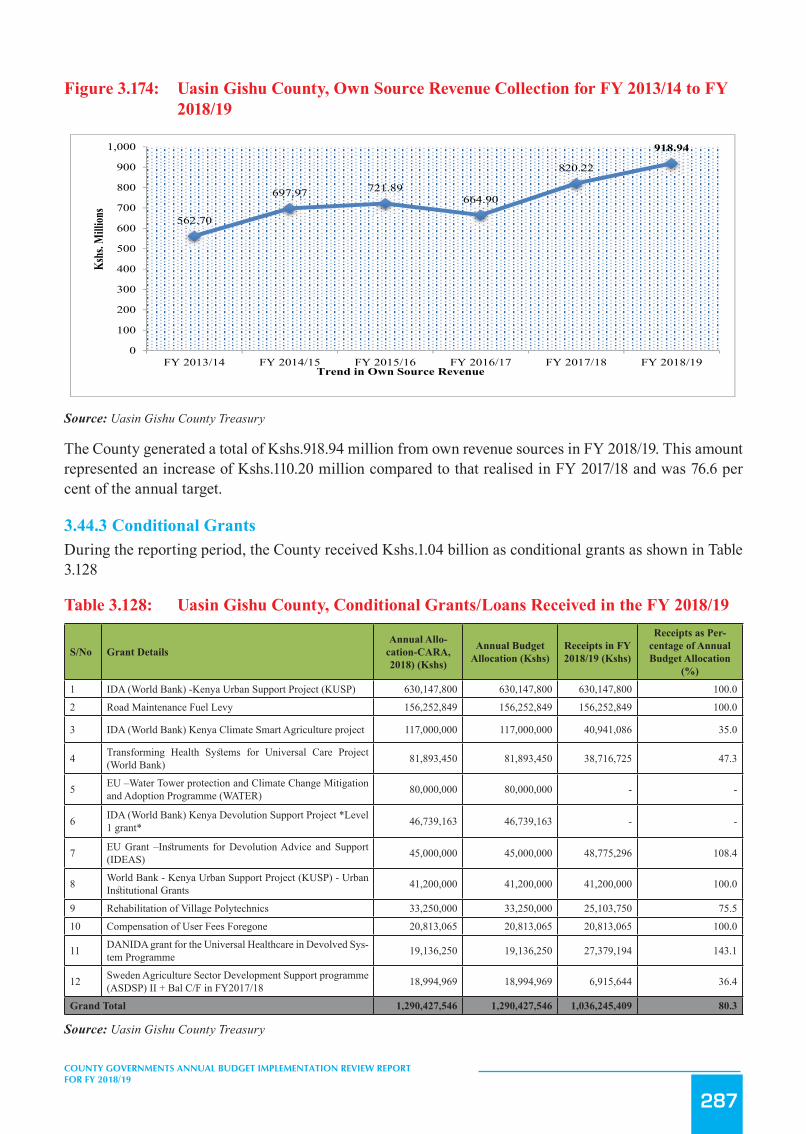
287
COUNTY GOVERNMENTS ANNUAL BUDGET IMPLEMENTATION REVIEW REPORT FOR FY 2018/19
Figure 3.174: Uasin Gishu County, Own Source Revenue Collection for FY 2013/14 to FY 2018/19
323
Figure 3.174 shows the annual trend in own-source revenue collection from FY 2013/14 to FY 2018/19.
Figure 3.174: Uasin Gishu County, Own Source Revenue Collection for FY 2013/14 to FY 2018/19
Source: Uasin Gishu County Treasury
The County generated a total of Kshs.918.94 million from own revenue sources in FY 2018/19. This amount
represented an increase of Kshs.110.20 million compared to that realised in FY 2017/18 and was 76.6 per cent of the
annual target.
3.44.3 Conditional Grants During the reporting period, the County received Kshs.1.04 billion as conditional grants as shown in Table 3.128
Table 3.128: Uasin Gishu County, Conditional Grants/Loans Received in the FY 2018/19
S/No Grant Details
Annual Allocation-CARA, 2018) (Kshs)
Annual Budget Allocation (Kshs)
Receipts in FY 2018/19 (Kshs)
Receipts as Percentage of Annual Budget Allocation (%)
1 IDA (World Bank) -Kenya Urban Support Project (KUSP) 630,147,800 630,147,800 630,147,800 100.0
2 Road Maintenance Fuel Levy 156,252,849 156,252,849 156,252,849 100.0
3 IDA (World Bank) Kenya Climate Smart Agriculture project 117,000,000 117,000,000 40,941,086 35.0
4 Transforming Health Systems for Universal Care Project (World Bank) 81,893,450 81,893,450 38,716,725 47.3
5 EU –Water Tower protection and Climate Change Mitigation and Adoption Programme (WATER) 80,000,000 80,000,000 - -
6 IDA (World Bank) Kenya Devolution Support Project *Level 1 grant* 46,739,163 46,739,163 - -
7 EU Grant –Instruments for Devolution Advice and Support (IDEAS) 45,000,000 45,000,000 48,775,296 108.4
562.70
697.97 721.89664.90
820.22
918.94
0
100
200
300
400
500
600
700
800
900
1,000
FY 2013/14 FY 2014/15 FY 2015/16 FY 2016/17 FY 2017/18 FY 2018/19
Kshs
. Milli
ons
Trend in Own Source Revenue
Source: Uasin Gishu County Treasury
The County generated a total of Kshs.918.94 million from own revenue sources in FY 2018/19. This amount represented an increase of Kshs.110.20 million compared to that realised in FY 2017/18 and was 76.6 per cent of the annual target.
3.44.3 Conditional GrantsDuring the reporting period, the County received Kshs.1.04 billion as conditional grants as shown in Table 3.128
Table 3.128: Uasin Gishu County, Conditional Grants/Loans Received in the FY 2018/19
S/No Grant DetailsAnnual Allo-
cation-CARA, 2018) (Kshs)
Annual Budget Allocation (Kshs)
Receipts in FY 2018/19 (Kshs)
Receipts as Per-centage of Annual Budget Allocation
(%)
1 IDA (World Bank) -Kenya Urban Support Project (KUSP) 630,147,800 630,147,800 630,147,800 100.0
2 Road Maintenance Fuel Levy 156,252,849 156,252,849 156,252,849 100.0
3 IDA (World Bank) Kenya Climate Smart Agriculture project 117,000,000 117,000,000 40,941,086 35.0
4 Transforming Health Systems for Universal Care Project (World Bank) 81,893,450 81,893,450 38,716,725 47.3
5 EU –Water Tower protection and Climate Change Mitigation and Adoption Programme (WATER) 80,000,000 80,000,000 - -
6 IDA (World Bank) Kenya Devolution Support Project *Level 1 grant* 46,739,163 46,739,163 - -
7 EU Grant –Instruments for Devolution Advice and Support (IDEAS) 45,000,000 45,000,000 48,775,296 108.4
8 World Bank - Kenya Urban Support Project (KUSP) - Urban Institutional Grants 41,200,000 41,200,000 41,200,000 100.0
9 Rehabilitation of Village Polytechnics 33,250,000 33,250,000 25,103,750 75.5
10 Compensation of User Fees Foregone 20,813,065 20,813,065 20,813,065 100.0
11 DANIDA grant for the Universal Healthcare in Devolved Sys-tem Programme 19,136,250 19,136,250 27,379,194 143.1
12 Sweden Agriculture Sector Development Support programme (ASDSP) II + Bal C/F in FY2017/18 18,994,969 18,994,969 6,915,644 36.4
Grand Total 1,290,427,546 1,290,427,546 1,036,245,409 80.3
Source: Uasin Gishu County Treasury
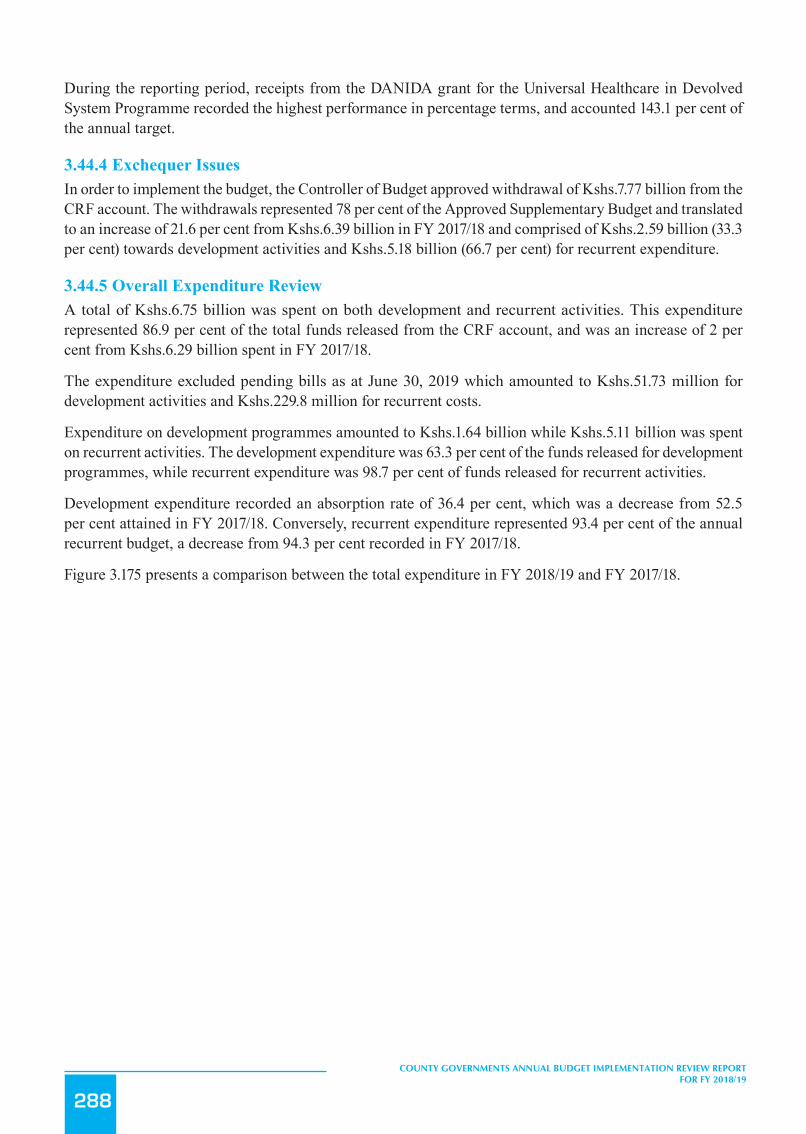
288
COUNTY GOVERNMENTS ANNUAL BUDGET IMPLEMENTATION REVIEW REPORT FOR FY 2018/19
During the reporting period, receipts from the DANIDA grant for the Universal Healthcare in Devolved System Programme recorded the highest performance in percentage terms, and accounted 143.1 per cent of the annual target.
3.44.4 Exchequer IssuesIn order to implement the budget, the Controller of Budget approved withdrawal of Kshs.7.77 billion from the CRF account. The withdrawals represented 78 per cent of the Approved Supplementary Budget and translated to an increase of 21.6 per cent from Kshs.6.39 billion in FY 2017/18 and comprised of Kshs.2.59 billion (33.3 per cent) towards development activities and Kshs.5.18 billion (66.7 per cent) for recurrent expenditure.
3.44.5 Overall Expenditure ReviewA total of Kshs.6.75 billion was spent on both development and recurrent activities. This expenditure represented 86.9 per cent of the total funds released from the CRF account, and was an increase of 2 per cent from Kshs.6.29 billion spent in FY 2017/18.
The expenditure excluded pending bills as at June 30, 2019 which amounted to Kshs.51.73 million for development activities and Kshs.229.8 million for recurrent costs.
Expenditure on development programmes amounted to Kshs.1.64 billion while Kshs.5.11 billion was spent on recurrent activities. The development expenditure was 63.3 per cent of the funds released for development programmes, while recurrent expenditure was 98.7 per cent of funds released for recurrent activities.
Development expenditure recorded an absorption rate of 36.4 per cent, which was a decrease from 52.5 per cent attained in FY 2017/18. Conversely, recurrent expenditure represented 93.4 per cent of the annual recurrent budget, a decrease from 94.3 per cent recorded in FY 2017/18.
Figure 3.175 presents a comparison between the total expenditure in FY 2018/19 and FY 2017/18.

289
COUNTY GOVERNMENTS ANNUAL BUDGET IMPLEMENTATION REVIEW REPORT FOR FY 2018/19
Figure3.175: UasinGishuCounty,ExpenditurebyEconomicClassification
325
Source: Uasin Gishu County Treasury
3.44.6 Development Expenditure Analysis The total development expenditure of Kshs.1.64 billion represented 36.4 per cent of the annual development
expenditure estimates of Kshs.4.49 billion. Table 3.129 provides a summary of development projects with the highest
expenditure in the financial year.
Table 3.129: Uasin Gishu County, List of Development Projects with the Highest Expenditure in FY 2018/19
S/No. Project Name Project Location Project Budget
ProjectExpenditure in FY 2018/19(Kshs.)
AbsorptionRate (%)
1
Supply and Delivery of assorted water Equipment and machinery (4No. Long Arm Excavators, 3No. Crawler Excavators, 6No. Large Tippers, 3No. Dozers, 2No. Fuel Tankers, 2No. Wheel Loaders and 2No. Back Hoe Loaders
Headquarters 459,847,523 450,988,000 98.1
2 Construction of Ward Offices Countywide 181,782,096 158,589,524 87.2
3 Supply, Delivery, Installation, Testing and Commissioning of 32No. Boreholes Countywide 123,500,000 131,129,519 106.2
4 Construction of Nyengilel VCT Centre Nyengilel Ward 65,000,000 34,693,015 53.4
5 Renovation and Extension of Eldoret CBD WholesaleMarket Eldoret CBD 25,000,000 33,670,998 134.7
6 Supply and Delivery of Mouldboard Plough, Tipper and Double Cab
AMS Station –Chebororwa 62,703,802 32,286,000 51.5
7 Construction of Milk Coolers Generator Houses Countywide 29,851,500 26,517,335 88.8
8 Supply of ECDE Teachers and Learning Materials Countywide 21,029,360 21,966,208 104.5
9 Design Plans and BQs for 64 Stadium Eldoret CBD 30,000,000 17,458,452 58.2
10 Supply of FMD Deseal Vaccine Countywide 15,666,125 15,310,475 97.7
2,963.15(47.1%)
1,769.06(28.1%) 1,557.04
(24.8%)
3,281.56(48.6%)
1,828.27(27.1%) 1,635.43
(24.2%)
-
500
1,000
1,500
2,000
2,500
3,000
3,500
Personnel Emoluments Operations and Maintenance Development Expenditure
Ksh
s.Mill
ion
Expenditure by Economic Classification
FY 2017/18
FY 2018/19
Key
Source: Uasin Gishu County Treasury
3.44.6 Development Expenditure AnalysisThe total development expenditure of Kshs.1.64 billion represented 36.4 per cent of the annual development expenditure estimates of Kshs.4.49 billion. Table 3.129 provides a summary of development projects with the highest expenditure in the financial year.
Table 3.129: Uasin Gishu County, List of Development Projects with the Highest Expenditure in FY 2018/19
S/No. Project Name Project Location Project BudgetProject Ex-penditure in FY 2018/19 (Kshs.)
Absorption Rate (%)
1
Supply and Delivery of assorted water Equipment and ma-chinery (4No. Long Arm Excavators, 3No. Crawler Excava-tors, 6No. Large Tippers, 3No. Dozers, 2No. Fuel Tankers, 2No. Wheel Loaders and 2No. Back Hoe Loaders
Headquarters 459,847,523 450,988,000 98.1
2 Construction of Ward Offices Countywide 181,782,096 158,589,524 87.2
3 Supply, Delivery, Installation, Testing and Commissioning of 32No. Boreholes Countywide 123,500,000 131,129,519 106.2
4 Construction of Nyengilel VCT Centre Nyengilel Ward 65,000,000 34,693,015 53.4
5 Renovation and Extension of Eldoret CBD Wholesale Mar-ket Eldoret CBD 25,000,000 33,670,998 134.7
6 Supply and Delivery of Mouldboard Plough, Tipper and Double Cab
AMS Station –Che-bororwa 62,703,802 32,286,000 51.5
7 Construction of Milk Coolers Generator Houses Countywide 29,851,500 26,517,335 88.8
8 Supply of ECDE Teachers and Learning Materials Countywide 21,029,360 21,966,208 104.5
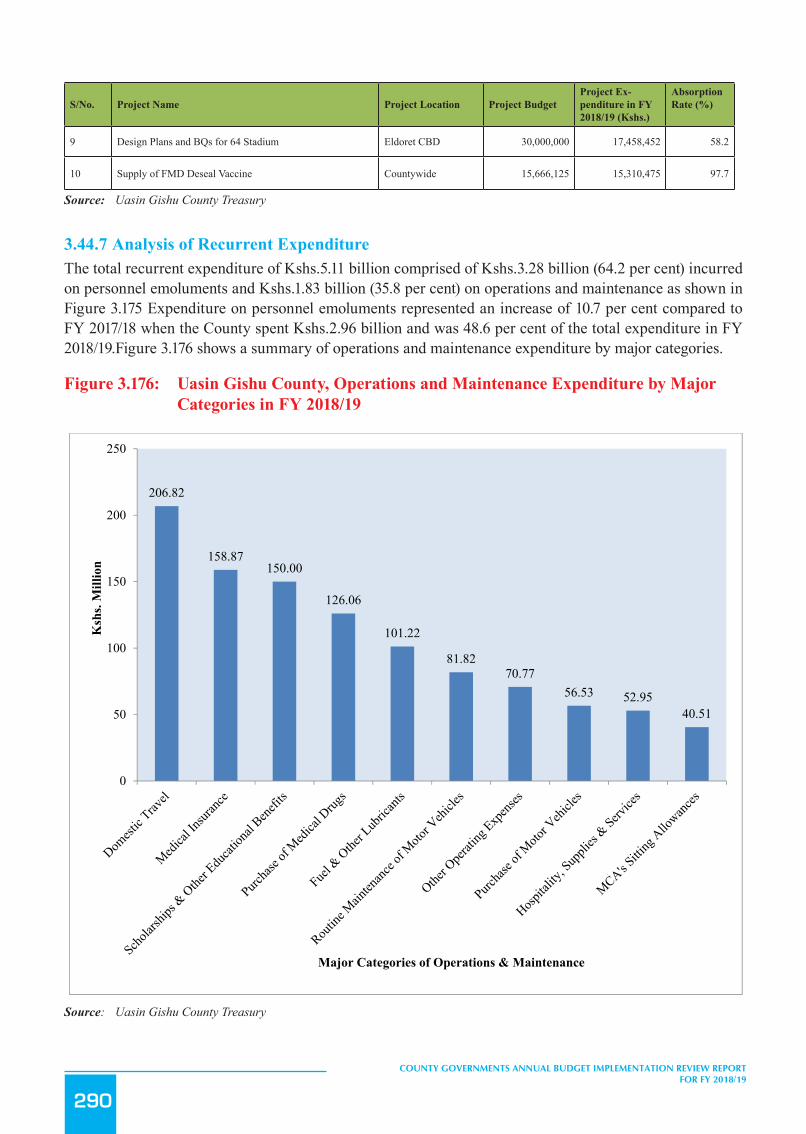
290
COUNTY GOVERNMENTS ANNUAL BUDGET IMPLEMENTATION REVIEW REPORT FOR FY 2018/19
S/No. Project Name Project Location Project BudgetProject Ex-penditure in FY 2018/19 (Kshs.)
Absorption Rate (%)
9 Design Plans and BQs for 64 Stadium Eldoret CBD 30,000,000 17,458,452 58.2
10 Supply of FMD Deseal Vaccine Countywide 15,666,125 15,310,475 97.7
Source: Uasin Gishu County Treasury
3.44.7 Analysis of Recurrent ExpenditureThe total recurrent expenditure of Kshs.5.11 billion comprised of Kshs.3.28 billion (64.2 per cent) incurred on personnel emoluments and Kshs.1.83 billion (35.8 per cent) on operations and maintenance as shown in Figure 3.175 Expenditure on personnel emoluments represented an increase of 10.7 per cent compared to FY 2017/18 when the County spent Kshs.2.96 billion and was 48.6 per cent of the total expenditure in FY 2018/19.Figure 3.176 shows a summary of operations and maintenance expenditure by major categories.
Figure 3.176: Uasin Gishu County, Operations and Maintenance Expenditure by Major Categories in FY 2018/19
326
Source: Uasin Gishu County Treasury
3.44.7 Analysis of Recurrent Expenditure The total recurrent expenditure of Kshs.5.11 billion comprised of Kshs.3.28 billion (64.2 per cent) incurred on personnel
emoluments and Kshs.1.83 billion (35.8 per cent) on operations and maintenance as shown in Figure 3.175 Expenditure
on personnel emoluments represented an increase of 10.7 per cent compared to FY 2017/18 when the County spent
Kshs.2.96 billion and was 48.6 per cent of the total expenditure in FY 2018/19.Figure 3.176 shows a summary of
operations and maintenance expenditure by major categories.
Figure 3.176: Uasin Gishu County, Operations and Maintenance Expenditure by Major Categories in FY 2018/19
Source: Uasin Gishu County Treasury
The County spent Kshs.40.51 million on committee sitting allowances for the 47 MCAs and Speaker against the annual
budget allocation of Kshs.40.51 million. This represented an increase of 35.9 per cent compared to Kshs.29.81 million
spent in FY 2017/18. The average monthly sitting allowance translated to Kshs.70,329 per MCA against the SRC’s
recommended monthly ceiling of Kshs.124,800.
Expenditure on domestic and foreign travel amounted to Kshs.267.38 million, and comprised of Kshs.142.54 million
spent by the County Assembly and Kshs.124.84 million by the County Executive.
206.82
158.87150.00
126.06
101.22
81.8270.77
56.53 52.9540.51
0
50
100
150
200
250
Ksh
s. M
illio
n
Major Categories of Operations & Maintenance
Source: Uasin Gishu County Treasury

291
COUNTY GOVERNMENTS ANNUAL BUDGET IMPLEMENTATION REVIEW REPORT FOR FY 2018/19
The County spent Kshs.40.51 million on committee sitting allowances for the 47 MCAs and Speaker against the annual budget allocation of Kshs.40.51 million. This represented an increase of 35.9 per cent compared to Kshs.29.81 million spent in FY 2017/18. The average monthly sitting allowance translated to Kshs.70,329 per MCA against the SRC’s recommended monthly ceiling of Kshs.124,800.
Expenditure on domestic and foreign travel amounted to Kshs.267.38 million, and comprised of Kshs.142.54 million spent by the County Assembly and Kshs.124.84 million by the County Executive.
3.44.8 Budget Performance by County DepartmentTable 3.130 shows a summary of the approved budget allocation and performance by department in FY 2018/19.
Table 3.130: Uasin Gishu County, Budget Performance by Department in FY 2018/19
DepartmentAnnual Budget Allocation
(Kshs. Million)Exchequer Issues FY
2018/19 (Kshs. Million)Expenditure (Kshs.
Million)
Expenditure to Exchequer Issues
(%)
Absorption Rate (%)
Rec Dev Rec Dev Rec Dev Rec Dev Rec Dev
Office of the Gov-ernor 115.94 - 114.90 - 115.33 - 100.4 - 99.5 -
Finance 407.64 - 357.11 - 353.55 - 99.0 - 86.7 -
Public Service Man-agement 579.57 20.27 574.18 0.11 563.10 2.39 98.1 2,172.7 97.2 11.8
ICT & E-Govern-ment 36.96 47.14 35.91 13.14 35.75 13.15 99.5 100.1 96.7 27.9
Roads, Transport, Energy and Public Works
438.31 643.93 435.95 541.28 427.21 374.23 98.0 69.1 97.5 58.1
Land and Housing 59.51 519.97 56.94 41.12 54.26 41.32 95.3 100.5 91.2 7.9
Water, Environ-ment, Natural resources, Tourism and Wildlife
138.09 888.49 132.85 728.08 117.91 649.78 88.8 89.2 85.4 73.1
Health Services 1,966.37 258.53 1,866.66 41.64 1,884.62 46.49 101.0 111.6 95.8 18.0
Agriculture 247.40 349.29 230.59 111.87 225.48 74.06 97.8 66.2 91.1 21.2
Trade, Investment and Industrialization 38.70 222.64 38.13 117.74 36.20 54.28 94.9 46.1 93.5 24.4
Education, culture and Social Services 382.12 110.21 381.09 91.90 380.90 92.86 100.0 101.0 99.7 84.3
County Public Service Board 32.85 - 31.59 - 28.19 - 89.2 - 85.8 -
County Assembly 671.97 100.80 671.48 - 670.94 - 99.9 - 99.8 -
Budget and Eco-nomic Planning 82.69 - 79.58 - 56.59 - 71.1 - 68.4 -
Devolution and Public Administra-tion
38.37 192.85 31.67 75.26 27.75 92.57 87.6 123.0 72.3 48.0
Youth, Affairs, Gender and Sports Development
89.58 178.52 88.67 85.99 88.61 64.37 99.9 74.9 98.9 36.1
Cooperatives and Enterprise Devel-opment
72.12 10.67 24.99 4.57 19.22 9.09 76.9 198.9 26.7 85.1
Physical Planning and Urban Devel-opment
57.39 750.05 14.33 671.26 10.88 79.73 75.9 11.9 18.9 10.6
Livestock Develop-ment and Fisheries 13.93 195.19 11.35 67.20 13.35 41.11 117.6 61.2 95.8 21.1
TOTAL 5,469.52 4,488.54 5,177.97 2,591.16 5,109.83 1,635.43 98.7 63.1 93.4 36.4
Source: Uasin Gishu County Treasury

292
COUNTY GOVERNMENTS ANNUAL BUDGET IMPLEMENTATION REVIEW REPORT FOR FY 2018/19
Analysis of expenditure by department shows that the Department of Cooperatives and Enterprise Development recorded the highest absorption rate of development budget at 85.1 while the County Assembly did not implement its development budget. The County Assembly had the highest percentage of recurrent expenditure to recurrent budget at 99.8 per cent while the Department of Physical Planning and Urban Development had the lowest at 18.9 per cent.
3.44.9 Key Observations and RecommendationsThe County has made progress in addressing some of the challenges previously identified as affecting budget implementation. Some of the progress made included:
i. Improvement in the own source revenue collection by 13.6 per cent to Kshs.918.94 million compared to Kshs.820.22 million raised in FY 2017/18.
ii. Improvement in the use of E-procurement, IFMIS and Internet Banking.
Despite the above progress, the following challenges continued to hamper effective budget implementation;
1. Slow implementation of development activities during FY 2018/19. The County spent Kshs.1.64 billion, which represented 36.4 per cent of the annual development budget of Kshs.4.49 billion. This was a decline from an absorption rate of 52.5 per cent reported in FY 2017/18.
2. Delays by the County to provide quarterly reports on the execution of development projects during the financial year.
3. A high wage bill that increased by10.7 per cent from Kshs.2.96 billion in the FY 2017/18 to Kshs.3.28 billion in the reporting period. The wage bill accounted for 48.6 per cent of total expenditure in the reporting period.
The County should implement the following measures in order to improve budget execution;
1. The County should identify and address issues that cause delays in the implementation of development projects.
2. The County should provide complete financial reports in line with Section 166 of the PFM Act, 2012.3. The County Public Service Board should develop an optimal staffing structure and devise strategies
to contain expenditure on personnel costs within 35 per cent of County’s total revenue in line with Regulation 25(1) (b) of the PFM (County Government) Regulations, 2015.
3.45 Vihiga County
3.45.1 Overview of the FY 2018/19 BudgetThe County’s FY 2018/19 Supplementary Budget was Kshs.7.00 billion, comprising of Kshs.4.51 billion (64.5 per cent) and Kshs.2.49 billion (35.5 per cent) allocation for recurrent and development expenditure respectively.
To finance the budget, the County expects to receive Kshs.4.56 billion (63.7 per cent) as equitable share of the revenue raised nationally, Kshs.1.06 billion ( 19.1 per cent) as total conditional grants, generate Kshs.153.67 million (2.1 per cent) from own sources of revenue, and Kshs.1.33 billion (15.1 per cent) cash balance from FY 2017/18.

293
COUNTY GOVERNMENTS ANNUAL BUDGET IMPLEMENTATION REVIEW REPORT FOR FY 2018/19
Figure 3.177: Vihiga County, Expected Sources of Budget Financing in FY 2018/19
329
Source: Vihiga County Treasury
A breakdown of the conditional grants is provided in Table 3.131.
3.45.2 Revenue AnalysisDuring FY 2018/19, the County had a total of Khs.6.58 billion available for budget implementation. This amount
consisted of Kshs.4.56 billion received as equitable share of the revenue raised nationally, Kshs.604.8 million as
conditional grants, Kshs.177.23 million generated from own sources of revenue, and a cash balance of Kshs.1.33 billion
from FY 2017/18.
Figure 3.178 shows the annual trend in own-source revenue collection from FY 2013/14 to FY 2018/19.
Figure 3.178: Vihiga County, Own Source Revenue Collection for FY 2013/14 to FY 2018/19
Source: Vihiga County Treasury
19.1%
63.7%
15.1%2.2%
Cash Balance from FY 2017/18
National Sharable Revenue
Total Conditional Allocations
Own Source Revenue
Other Revenues Expected During the year
106.33116.04
125.12
96.95
143.53
177.23
0
20
40
60
80
100
120
140
160
180
200
FY 2013/14 FY 2014/15 FY 2015/16 FY 2016/17 FY 2017/18 FY 2018/19
Kshs. M
illions
Trend in Own Source Revenue
Source: Vihiga County Treasury
A breakdown of the conditional grants is provided in Table 3.131.
3.45.2 Revenue AnalysisDuring FY 2018/19, the County had a total of Khs.6.58 billion available for budget implementation. This amount consisted of Kshs.4.56 billion received as equitable share of the revenue raised nationally, Kshs.604.8 million as conditional grants, Kshs.177.23 million generated from own sources of revenue, and a cash balance of Kshs.1.33 billion from FY 2017/18.
Figure 3.178 shows the annual trend in own-source revenue collection from FY 2013/14 to FY 2018/19.
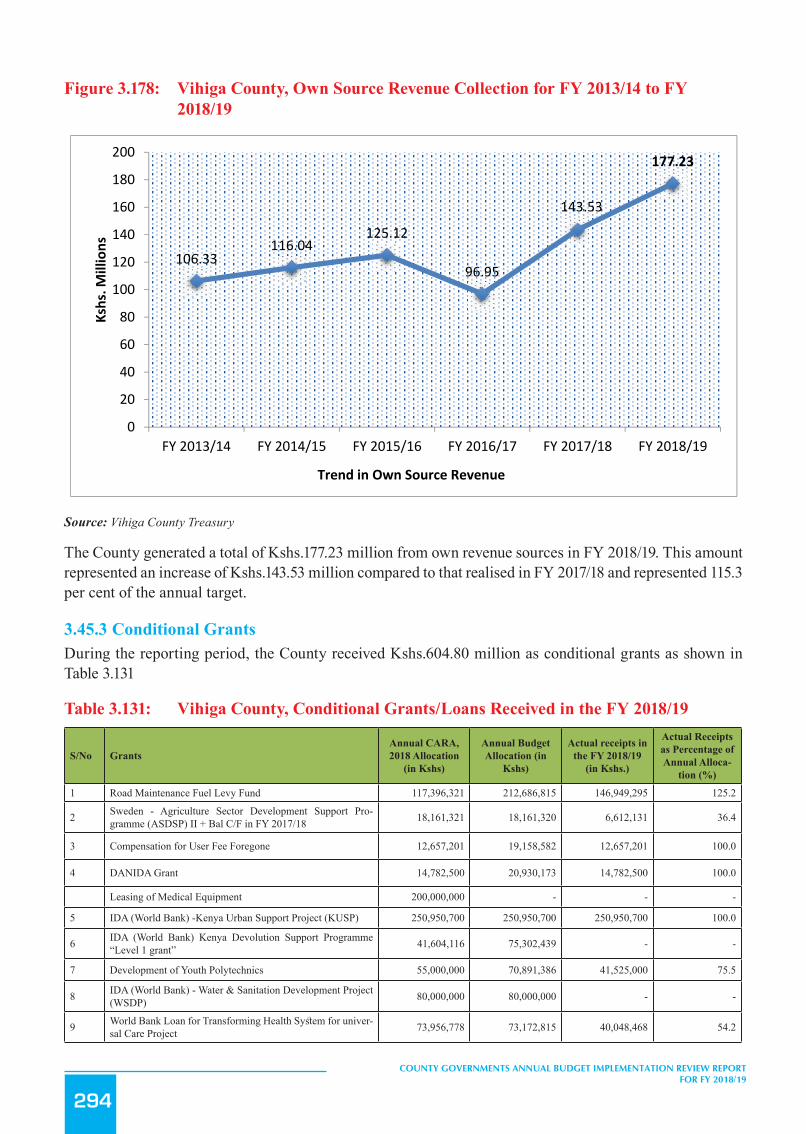
294
COUNTY GOVERNMENTS ANNUAL BUDGET IMPLEMENTATION REVIEW REPORT FOR FY 2018/19
Figure 3.178: Vihiga County, Own Source Revenue Collection for FY 2013/14 to FY 2018/19
329
Source: Vihiga County Treasury
A breakdown of the conditional grants is provided in Table 3.131.
3.45.2 Revenue AnalysisDuring FY 2018/19, the County had a total of Khs.6.58 billion available for budget implementation. This amount
consisted of Kshs.4.56 billion received as equitable share of the revenue raised nationally, Kshs.604.8 million as
conditional grants, Kshs.177.23 million generated from own sources of revenue, and a cash balance of Kshs.1.33 billion
from FY 2017/18.
Figure 3.178 shows the annual trend in own-source revenue collection from FY 2013/14 to FY 2018/19.
Figure 3.178: Vihiga County, Own Source Revenue Collection for FY 2013/14 to FY 2018/19
Source: Vihiga County Treasury
19.1%
63.7%
15.1%2.2%
Cash Balance from FY 2017/18
National Sharable Revenue
Total Conditional Allocations
Own Source Revenue
Other Revenues Expected During the year
106.33116.04
125.12
96.95
143.53
177.23
0
20
40
60
80
100
120
140
160
180
200
FY 2013/14 FY 2014/15 FY 2015/16 FY 2016/17 FY 2017/18 FY 2018/19
Kshs. M
illions
Trend in Own Source Revenue
Source: Vihiga County Treasury
The County generated a total of Kshs.177.23 million from own revenue sources in FY 2018/19. This amount represented an increase of Kshs.143.53 million compared to that realised in FY 2017/18 and represented 115.3 per cent of the annual target.
3.45.3 Conditional GrantsDuring the reporting period, the County received Kshs.604.80 million as conditional grants as shown in Table 3.131
Table 3.131: Vihiga County, Conditional Grants/Loans Received in the FY 2018/19
S/No GrantsAnnual CARA, 2018 Allocation
(in Kshs)
Annual Budget Allocation (in
Kshs)
Actual receipts in the FY 2018/19
(in Kshs.)
Actual Receipts as Percentage of Annual Alloca-
tion (%)
1 Road Maintenance Fuel Levy Fund 117,396,321 212,686,815 146,949,295 125.2
2 Sweden - Agriculture Sector Development Support Pro-gramme (ASDSP) II + Bal C/F in FY 2017/18 18,161,321 18,161,320 6,612,131 36.4
3 Compensation for User Fee Foregone 12,657,201 19,158,582 12,657,201 100.0
4 DANIDA Grant 14,782,500 20,930,173 14,782,500 100.0
Leasing of Medical Equipment 200,000,000 - - -
5 IDA (World Bank) -Kenya Urban Support Project (KUSP) 250,950,700 250,950,700 250,950,700 100.0
6 IDA (World Bank) Kenya Devolution Support Programme “Level 1 grant” 41,604,116 75,302,439 - -
7 Development of Youth Polytechnics 55,000,000 70,891,386 41,525,000 75.5
8 IDA (World Bank) - Water & Sanitation Development Project (WSDP) 80,000,000 80,000,000 - -
9 World Bank Loan for Transforming Health System for univer-sal Care Project 73,956,778 73,172,815 40,048,468 54.2
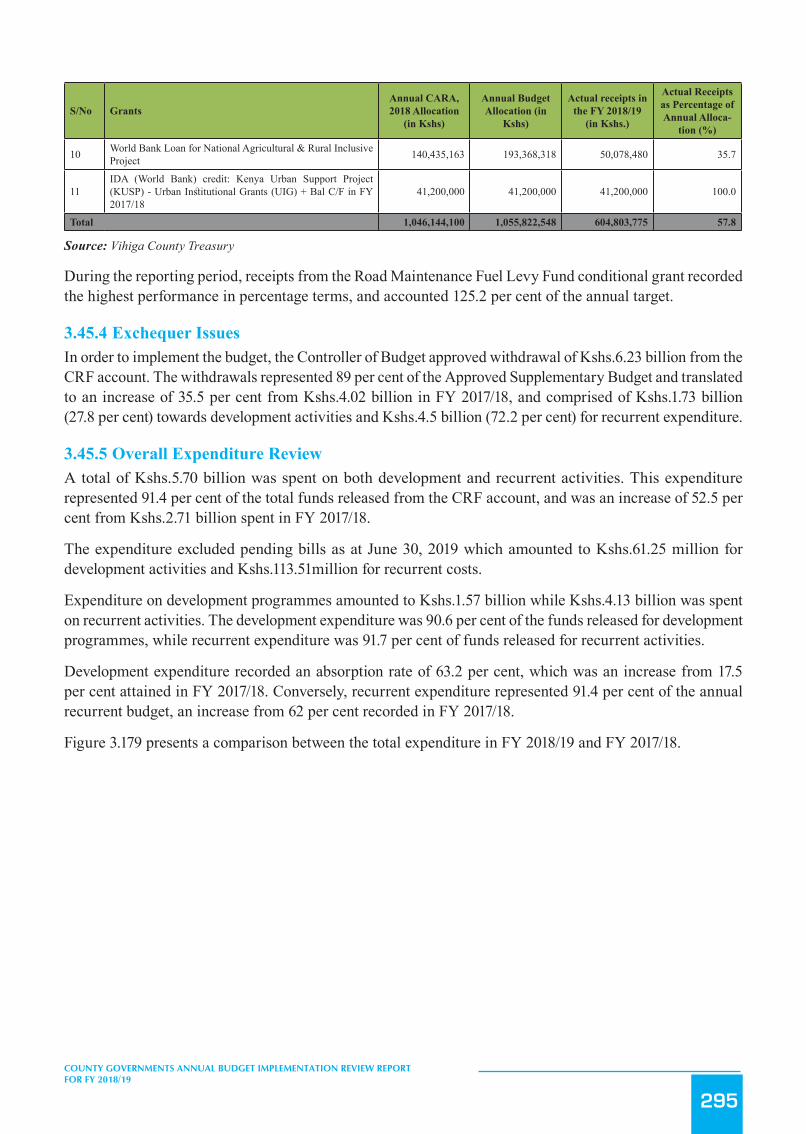
295
COUNTY GOVERNMENTS ANNUAL BUDGET IMPLEMENTATION REVIEW REPORT FOR FY 2018/19
S/No GrantsAnnual CARA, 2018 Allocation
(in Kshs)
Annual Budget Allocation (in
Kshs)
Actual receipts in the FY 2018/19
(in Kshs.)
Actual Receipts as Percentage of Annual Alloca-
tion (%)
10 World Bank Loan for National Agricultural & Rural Inclusive Project 140,435,163 193,368,318 50,078,480 35.7
11IDA (World Bank) credit: Kenya Urban Support Project (KUSP) - Urban Institutional Grants (UIG) + Bal C/F in FY 2017/18
41,200,000 41,200,000 41,200,000 100.0
Total 1,046,144,100 1,055,822,548 604,803,775 57.8
Source: Vihiga County Treasury
During the reporting period, receipts from the Road Maintenance Fuel Levy Fund conditional grant recorded the highest performance in percentage terms, and accounted 125.2 per cent of the annual target.
3.45.4 Exchequer IssuesIn order to implement the budget, the Controller of Budget approved withdrawal of Kshs.6.23 billion from the CRF account. The withdrawals represented 89 per cent of the Approved Supplementary Budget and translated to an increase of 35.5 per cent from Kshs.4.02 billion in FY 2017/18, and comprised of Kshs.1.73 billion (27.8 per cent) towards development activities and Kshs.4.5 billion (72.2 per cent) for recurrent expenditure.
3.45.5 Overall Expenditure ReviewA total of Kshs.5.70 billion was spent on both development and recurrent activities. This expenditure represented 91.4 per cent of the total funds released from the CRF account, and was an increase of 52.5 per cent from Kshs.2.71 billion spent in FY 2017/18.
The expenditure excluded pending bills as at June 30, 2019 which amounted to Kshs.61.25 million for development activities and Kshs.113.51million for recurrent costs.
Expenditure on development programmes amounted to Kshs.1.57 billion while Kshs.4.13 billion was spent on recurrent activities. The development expenditure was 90.6 per cent of the funds released for development programmes, while recurrent expenditure was 91.7 per cent of funds released for recurrent activities.
Development expenditure recorded an absorption rate of 63.2 per cent, which was an increase from 17.5 per cent attained in FY 2017/18. Conversely, recurrent expenditure represented 91.4 per cent of the annual recurrent budget, an increase from 62 per cent recorded in FY 2017/18.
Figure 3.179 presents a comparison between the total expenditure in FY 2018/19 and FY 2017/18.
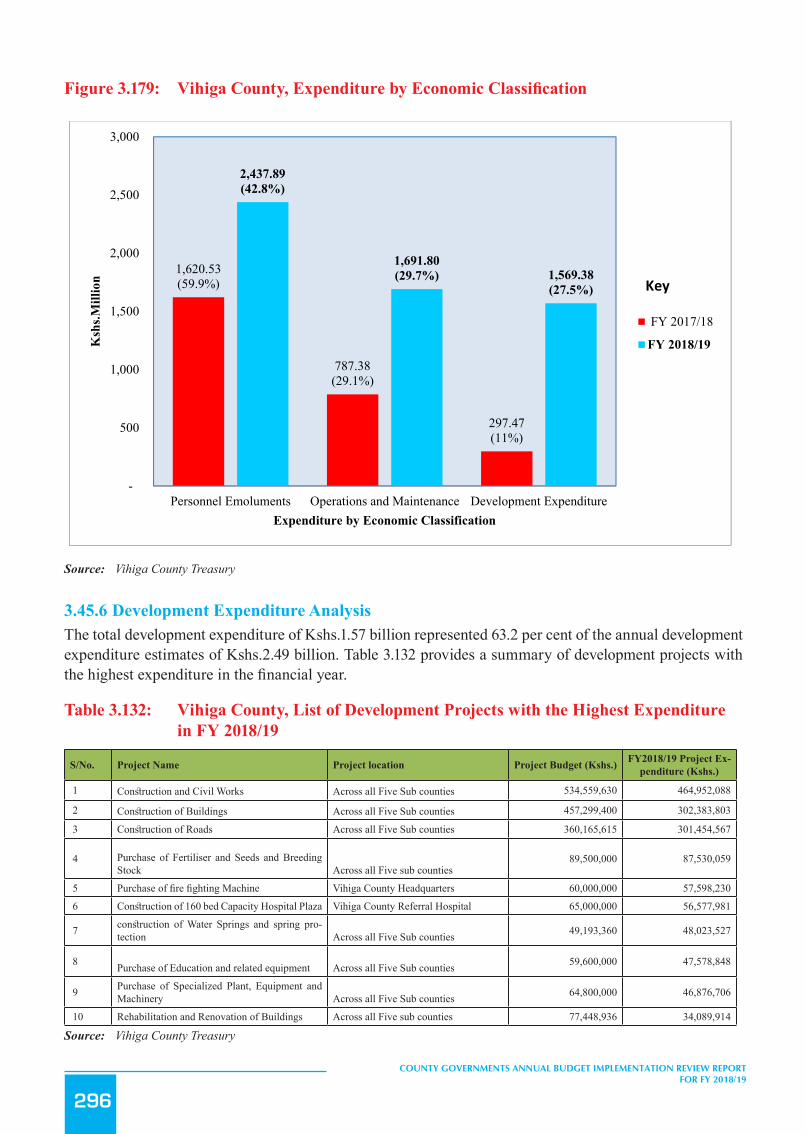
296
COUNTY GOVERNMENTS ANNUAL BUDGET IMPLEMENTATION REVIEW REPORT FOR FY 2018/19
Figure3.179: VihigaCounty,ExpenditurebyEconomicClassification
331
The expenditure excluded pending bills as at June 30, 2019 which amounted to Kshs.61.25 million for development
activities and Kshs.113.51million for recurrent costs.
Expenditure on development programmes amounted to Kshs.1.57 billion while Kshs.4.13 billion was spent on recurrent
activities. The development expenditure was 90.6 per cent of the funds released for development programmes, while
recurrent expenditure was 91.7 per cent of funds released for recurrent activities.
Development expenditure recorded an absorption rate of 63.2 per cent, which was an increase from 17.5 per cent
attained in FY 2017/18. Conversely, recurrent expenditure represented 91.4 per cent of the annual recurrent budget, an
increase from 62 per cent recorded in FY 2017/18.
Figure 3.179 presents a comparison between the total expenditure in FY 2018/19 and FY 2017/18.
Figure 3.179: Vihiga County, Expenditure by Economic Classification
Source: Vihiga County Treasury
3.45.6 Development Expenditure Analysis
The total development expenditure of Kshs.1.57 billion represented 63.2 per cent of the annual development
expenditure estimates of Kshs.2.49 billion. Table 3.132 provides a summary of development projects with the highest
expenditure in the financial year.
Table 3.132:Vihiga County, List of Development Projects with the Highest Expenditure in FY 2018/19
S/No. Project Name Project location Project Budget (Kshs.)
FY2018/19 Project Expenditure (Kshs.)
1 Construction and Civil Works Across all Five Sub counties 534,559,630 464,952,088
1,620.53(59.9%)
787.38(29.1%)
297.47(11%)
2,437.89(42.8%)
1,691.80(29.7%) 1,569.38
(27.5%)
-
500
1,000
1,500
2,000
2,500
3,000
Personnel Emoluments Operations and Maintenance Development Expenditure
Ksh
s.Mill
ion
Expenditure by Economic Classification
FY 2017/18
FY 2018/19
Key
Source: Vihiga County Treasury
3.45.6 Development Expenditure AnalysisThe total development expenditure of Kshs.1.57 billion represented 63.2 per cent of the annual development expenditure estimates of Kshs.2.49 billion. Table 3.132 provides a summary of development projects with the highest expenditure in the financial year.
Table 3.132: Vihiga County, List of Development Projects with the Highest Expenditure in FY 2018/19
S/No. Project Name Project location Project Budget (Kshs.) FY2018/19 Project Ex-penditure (Kshs.)
1 Construction and Civil Works Across all Five Sub counties 534,559,630 464,952,088
2 Construction of Buildings Across all Five Sub counties 457,299,400 302,383,803
3 Construction of Roads Across all Five Sub counties 360,165,615 301,454,567
4 Purchase of Fertiliser and Seeds and Breeding Stock Across all Five sub counties
89,500,000 87,530,059
5 Purchase of fire fighting Machine Vihiga County Headquarters 60,000,000 57,598,230
6 Construction of 160 bed Capacity Hospital Plaza Vihiga County Referral Hospital 65,000,000 56,577,981
7 construction of Water Springs and spring pro-tection Across all Five Sub counties 49,193,360 48,023,527
8 Purchase of Education and related equipment Across all Five Sub counties 59,600,000 47,578,848
9 Purchase of Specialized Plant, Equipment and Machinery Across all Five Sub counties 64,800,000 46,876,706
10 Rehabilitation and Renovation of Buildings Across all Five sub counties 77,448,936 34,089,914
Source: Vihiga County Treasury

297
COUNTY GOVERNMENTS ANNUAL BUDGET IMPLEMENTATION REVIEW REPORT FOR FY 2018/19
3.45.7 Analysis of Recurrent ExpenditureThe total recurrent expenditure of Kshs.4.13 billion comprised of Kshs.2.44 billion (59.1 per cent) incurred on personnel emoluments and Kshs.1.69 billion (40.9 per cent) on operations and maintenance as shown in Figure 3.179
Expenditure on personnel emoluments represented an increase of Kshs.817.36 million compared FY 2017/18 when the County spent Kshs.1.62 billion of the total expenditure in FY 2018/19. Figure 3.180 shows a summary of operations and maintenance expenditure by major categories.
Figure 3.180: Vihiga County, Operations and Maintenance Expenditure by Major Categories in FY 2018/19
333
Source: Vihiga County Treasury
The County spent Kshs.38.14 million on committee sitting allowances for the 39 MCAs and Speaker against the annual
budget allocation of Kshs.44.68 million. This represented a decrease of 4.9 per cent compared to Kshs.39.99 million
spent in FY 2017/18. The average monthly sitting allowance translated to Kshs.81,493 per MCA against the SRC’s
recommended monthly ceiling of Kshs.124,800.
Expenditure on domestic and foreign travel amounted to Kshs.302.15 million, and comprised of Kshs.99.65 million
spent by the County Assembly and Kshs.202.50 million by the County Executive.
3.45.8 Budget Performance by County Department Table 3.133 shows a summary of the approved budget allocation and performance by department in FY 2018/19.
Table 3.133: Vihiga County, Budget Performance by Department in FY 2018/19
Department Budget Allocation (Kshs.Million)
Exchequer Issues (Kshs.Million)
Expenditure (Kshs.Million)
Expenditure to Exchequer Issues (%)
Absorption rate (%)
Rec Dev Rec Dev Rec Dev Rec Dev Rec Dev
Office of the Governor 427.58 22.50 424.58 19.10 318.13 19.10 74.9 100.0 74.4 84.9
302.15
176.17
140.40120.21
109.47
70.57 65.72 57.06 56.93
0
50
100
150
200
250
300
350
Ksh
s. M
illio
n
Major Categories of Operations & Maintenance
Source: Vihiga County Treasury
The County spent Kshs.38.14 million on committee sitting allowances for the 39 MCAs and Speaker against the annual budget allocation of Kshs.44.68 million. This represented a decrease of 4.9 per cent compared to Kshs.39.99 million spent in FY 2017/18. The average monthly sitting allowance translated to Kshs.81,493 per MCA against the SRC’s recommended monthly ceiling of Kshs.124,800.
Expenditure on domestic and foreign travel amounted to Kshs.302.15 million, and comprised of Kshs.99.65 million spent by the County Assembly and Kshs.202.50 million by the County Executive.
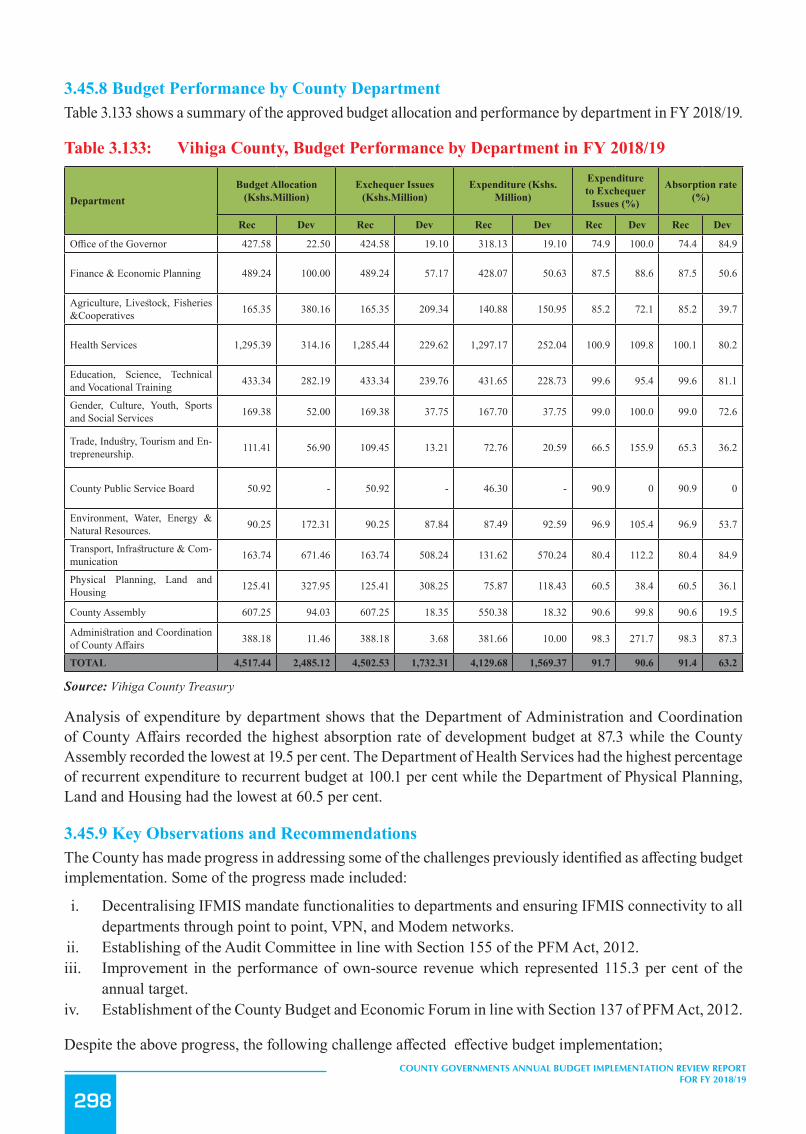
298
COUNTY GOVERNMENTS ANNUAL BUDGET IMPLEMENTATION REVIEW REPORT FOR FY 2018/19
3.45.8 Budget Performance by County DepartmentTable 3.133 shows a summary of the approved budget allocation and performance by department in FY 2018/19.
Table 3.133: Vihiga County, Budget Performance by Department in FY 2018/19
DepartmentBudget Allocation
(Kshs.Million)Exchequer Issues
(Kshs.Million)Expenditure (Kshs.
Million)
Expenditure to Exchequer
Issues (%)
Absorption rate (%)
Rec Dev Rec Dev Rec Dev Rec Dev Rec Dev
Office of the Governor 427.58 22.50 424.58 19.10 318.13 19.10 74.9 100.0 74.4 84.9
Finance & Economic Planning 489.24 100.00 489.24 57.17 428.07 50.63 87.5 88.6 87.5 50.6
Agriculture, Livestock, Fisheries &Cooperatives 165.35 380.16 165.35 209.34 140.88 150.95 85.2 72.1 85.2 39.7
Health Services 1,295.39 314.16 1,285.44 229.62 1,297.17 252.04 100.9 109.8 100.1 80.2
Education, Science, Technical and Vocational Training 433.34 282.19 433.34 239.76 431.65 228.73 99.6 95.4 99.6 81.1
Gender, Culture, Youth, Sports and Social Services 169.38 52.00 169.38 37.75 167.70 37.75 99.0 100.0 99.0 72.6
Trade, Industry, Tourism and En-trepreneurship. 111.41 56.90 109.45 13.21 72.76 20.59 66.5 155.9 65.3 36.2
County Public Service Board 50.92 - 50.92 - 46.30 - 90.9 0 90.9 0
Environment, Water, Energy & Natural Resources. 90.25 172.31 90.25 87.84 87.49 92.59 96.9 105.4 96.9 53.7
Transport, Infrastructure & Com-munication 163.74 671.46 163.74 508.24 131.62 570.24 80.4 112.2 80.4 84.9
Physical Planning, Land and Housing 125.41 327.95 125.41 308.25 75.87 118.43 60.5 38.4 60.5 36.1
County Assembly 607.25 94.03 607.25 18.35 550.38 18.32 90.6 99.8 90.6 19.5
Administration and Coordination of County Affairs 388.18 11.46 388.18 3.68 381.66 10.00 98.3 271.7 98.3 87.3
TOTAL 4,517.44 2,485.12 4,502.53 1,732.31 4,129.68 1,569.37 91.7 90.6 91.4 63.2
Source: Vihiga County Treasury
Analysis of expenditure by department shows that the Department of Administration and Coordination of County Affairs recorded the highest absorption rate of development budget at 87.3 while the County Assembly recorded the lowest at 19.5 per cent. The Department of Health Services had the highest percentage of recurrent expenditure to recurrent budget at 100.1 per cent while the Department of Physical Planning, Land and Housing had the lowest at 60.5 per cent.
3.45.9 Key Observations and RecommendationsThe County has made progress in addressing some of the challenges previously identified as affecting budget implementation. Some of the progress made included:
i. Decentralising IFMIS mandate functionalities to departments and ensuring IFMIS connectivity to all departments through point to point, VPN, and Modem networks.
ii. Establishing of the Audit Committee in line with Section 155 of the PFM Act, 2012.iii. Improvement in the performance of own-source revenue which represented 115.3 per cent of the
annual target.iv. Establishment of the County Budget and Economic Forum in line with Section 137 of PFM Act, 2012.
Despite the above progress, the following challenge affected effective budget implementation;

299
COUNTY GOVERNMENTS ANNUAL BUDGET IMPLEMENTATION REVIEW REPORT FOR FY 2018/19
1. A high wage bill that increased by 50.4 per cent from Kshs.1.62 billion in the FY 2017/18 to Kshs.2.44 billion in the reporting period. The wage bill accounted for 42.8 per cent of total expenditure in the reporting period.
The Department will continue to implement the following measures in order to improve budget execution;
1. The County Public Service Board should develop an optimal staffing structure and devise strategies to address the escalating wage bill.
3.46 Wajir County
3.46.1 Overview of the FY 2018/19 BudgetThe County’s FY 2018/19 Supplementary Budget was Kshs.13.18 billion, comprising of Kshs.6.76 billion (51.3 per cent) and Kshs.6.42 billion (48.7 per cent) allocation for development and recurrent expenditure respectively.
To finance the budget, the County expects to receive Kshs.8.48 billion (64.3 per cent) as equitable share of revenue raised nationally, Kshs.1.88 billion (14.3 per cent) as total conditional grants, generate Kshs.200 million (1.5 per cent) from own revenue sources, and Kshs.2.62 billion (19.9 per cent) cash balance from FY 2017/18.
Figure 3.181: Wajir County, Expected Sources of Budget Financing in FY 2018/19
335
The Department will continue to implement the following measures in order to improve budget execution;
1. The County Public Service Board should develop an optimal staffing structure and devise strategies to address the
escalating wage bill.
3.46 Wajir County
3.46.1 Overview of the FY 2018/19 Budget The County’s FY 2018/19 Supplementary Budget was Kshs.13.18 billion, comprising of Kshs.6.76 billion (51.3 per
cent) and Kshs.6.42 billion (48.7 per cent) allocation for development and recurrent expenditure respectively.
To finance the budget, the County expects to receive Kshs.8.48 billion (64.3 per cent) as equitable share of revenue
raised nationally, Kshs.1.88 billion (14.3 per cent) as total conditional grants, generate Kshs.200 million (1.5 per cent)
from own revenue sources, and Kshs.2.62 billion (19.9 per cent) cash balance from FY 2017/18.
Figure 3.181: Wajir County, Expected Sources of Budget Financing in FY 2018/19
Source: Wajir County Treasury
3.46.2 Revenue Analysis During the FY 2018/19, the County received Kshs.8.48 billion received as equitable share of the revenue raised
nationally, Kshs.642.71 million as total conditional grants, Kshs.60.12 million from own sources of revenue, and had a
cash balance of Kshs.1.53 billion from FY 2017/18. The total funds available for budget implementation amounted to
Kshs.10.71 billion.
Figure 3.182 shows the yearly trend in own-source revenue collection from FY 2013/14 to FY 2018/19.
Figure 3.182: Wajir County, Own Source Revenue Collection for FY 2013/14 to FY 2018/19
Cash Balance from FY 2017/18
20%
National Sharable Revenue
64%
Total Conditional Allocations
14%
Own Source Revenue2%
Source: Wajir County Treasury
3.46.2 Revenue AnalysisDuring the FY 2018/19, the County received Kshs.8.48 billion received as equitable share of the revenue raised nationally, Kshs.642.71 million as total conditional grants, Kshs.60.12 million from own sources of revenue, and had a cash balance of Kshs.1.53 billion from FY 2017/18. The total funds available for budget implementation amounted to Kshs.10.71 billion.
Figure 3.182 shows the yearly trend in own-source revenue collection from FY 2013/14 to FY 2018/19.
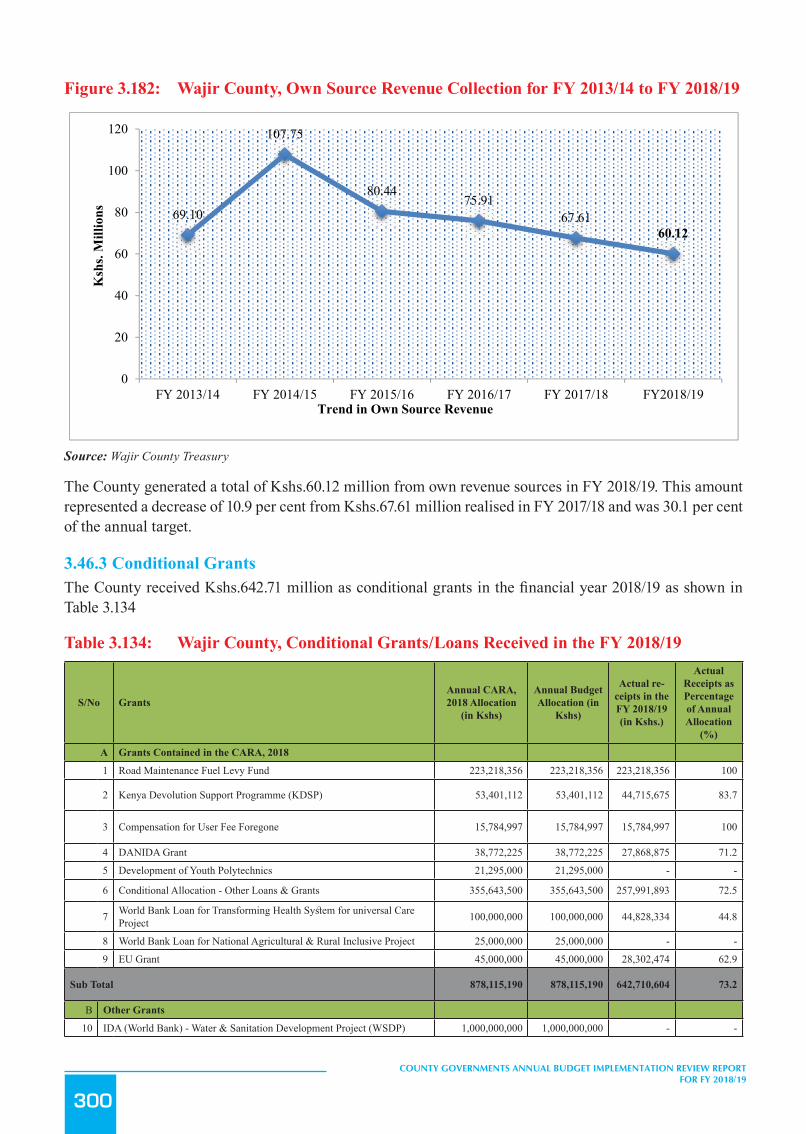
300
COUNTY GOVERNMENTS ANNUAL BUDGET IMPLEMENTATION REVIEW REPORT FOR FY 2018/19
Figure 3.182: Wajir County, Own Source Revenue Collection for FY 2013/14 to FY 2018/19
336
Source: Wajir County Treasury
The County generated a total of Kshs.60.12 million from own revenue sources in FY 2018/19. This amount represented
a decrease of 10.9 per cent from Kshs.67.61 million realised in FY 2017/18 and was 30.1 per cent of the annual target.
3.46.3 Conditional Grants The County received Kshs.642.71 million as conditional grants in the financial year 2018/19 as shown in Table 3.134
Table 3.134: Wajir County, Conditional Grants/Loans Received in the FY 2018/19
S/No Grants Annual CARA, 2018 Allocation
(in Kshs)
Annual Budget Allocation (in
Kshs)
Actual receipts in the FY 2018/19 (in Kshs.)
Actual Receipts as Percentage of Annual Allocation (%)
A Grants Contained in the CARA, 2018 1 Road Maintenance Fuel Levy Fund 223,218,356 223,218,356 223,218,356 100
2 Kenya Devolution Support Programme (KDSP) 53,401,112 53,401,112 44,715,675 83.7
3 Compensation for User Fee Foregone 15,784,997 15,784,997 15,784,997 100
4 DANIDA Grant 38,772,225 38,772,225 27,868,875 71.2
5 Development of Youth Polytechnics 21,295,000 21,295,000 - -
6 Conditional Allocation - Other Loans & Grants 355,643,500 355,643,500 257,991,893 72.5
7 World Bank Loan for Transforming Health System for universal Care Project 100,000,000 100,000,000 44,828,334 44.8
69.10
107.75
80.4475.91
67.6160.12
0
20
40
60
80
100
120
FY 2013/14 FY 2014/15 FY 2015/16 FY 2016/17 FY 2017/18 FY2018/19
Ksh
s. M
illio
ns
Trend in Own Source Revenue
Source: Wajir County Treasury
The County generated a total of Kshs.60.12 million from own revenue sources in FY 2018/19. This amount represented a decrease of 10.9 per cent from Kshs.67.61 million realised in FY 2017/18 and was 30.1 per cent of the annual target.
3.46.3 Conditional GrantsThe County received Kshs.642.71 million as conditional grants in the financial year 2018/19 as shown in Table 3.134
Table 3.134: Wajir County, Conditional Grants/Loans Received in the FY 2018/19
S/No GrantsAnnual CARA, 2018 Allocation
(in Kshs)
Annual Budget Allocation (in
Kshs)
Actual re-ceipts in the FY 2018/19 (in Kshs.)
Actual Receipts as Percentage of Annual Allocation
(%)
A Grants Contained in the CARA, 2018
1 Road Maintenance Fuel Levy Fund 223,218,356 223,218,356 223,218,356 100
2 Kenya Devolution Support Programme (KDSP) 53,401,112 53,401,112 44,715,675 83.7
3 Compensation for User Fee Foregone 15,784,997 15,784,997 15,784,997 100
4 DANIDA Grant 38,772,225 38,772,225 27,868,875 71.2
5 Development of Youth Polytechnics 21,295,000 21,295,000 - -
6 Conditional Allocation - Other Loans & Grants 355,643,500 355,643,500 257,991,893 72.5
7 World Bank Loan for Transforming Health System for universal Care Project 100,000,000 100,000,000 44,828,334 44.8
8 World Bank Loan for National Agricultural & Rural Inclusive Project 25,000,000 25,000,000 - -
9 EU Grant 45,000,000 45,000,000 28,302,474 62.9
Sub Total 878,115,190 878,115,190 642,710,604 73.2
B Other Grants
10 IDA (World Bank) - Water & Sanitation Development Project (WSDP) 1,000,000,000 1,000,000,000 - -

301
COUNTY GOVERNMENTS ANNUAL BUDGET IMPLEMENTATION REVIEW REPORT FOR FY 2018/19
S/No GrantsAnnual CARA, 2018 Allocation
(in Kshs)
Annual Budget Allocation (in
Kshs)
Actual re-ceipts in the FY 2018/19 (in Kshs.)
Actual Receipts as Percentage of Annual Allocation
(%)
Sub Total 1,000,000,000 1,000,000,000 - -
Grand Total 1,878,115,190 1,878,115,190 642,710,604 31.2
Source: Wajir County Treasury
During the FY 2018/19, the County Government received the highest receipt as percentage of annual budget allocation from the Compensation for User Fee Foregone and the Road Maintenance Fuel Levy Fund at 100 per cent of their respective annual targets.
3.46.4 Exchequer IssuesTo finance the budget, the Controller of Budget approved withdrawal of Kshs.10.61 billion from the CRF account. The withdrawals represented 80.5 per cent of the Approved Supplementary Budget and translated to an increase of 62 per cent from Kshs.6.5 billion in FY 2017/18 and comprised of and Kshs.6.05 billion (57 per cent) for recurrent expenditure and Kshs.4.56 billion (43 per cent) for development activities .
3.46.5 Overall Expenditure ReviewThe County Government spent a total of Kshs.10.38 billion on recurrent and development activities. This expenditure represented 97.8 per cent of the total funds released from the CRF account, and was an increase of 61.8 per cent from Kshs.6.4 billion spent in FY 2017/18. The expenditure excluded pending bills as at June 30, 2019 which amounted to Kshs.40 million for development activities and Kshs.188.45 million for recurrent costs.
Expenditure on recurrent activities amounted to Kshs.5.86 billion while Kshs.4.52 billion was spent on development activities. The recurrent expenditure was 96.9 per cent of funds released for recurrent activities while development expenditure represented 99.1 per cent of the funds released for development activities.
The recurrent expenditure represented 91.3 per cent of the annual recurrent budget, a decrease from 97.9 per cent recorded in FY 2017/18. Development expenditure recorded an absorption rate of 66.9 per cent, which was an increase from 22.9 per cent attained in FY 2017/18.Figure 3.183 presents a comparison between the total expenditure in the FY 2018/19 and a similar period in FY 2017/18.
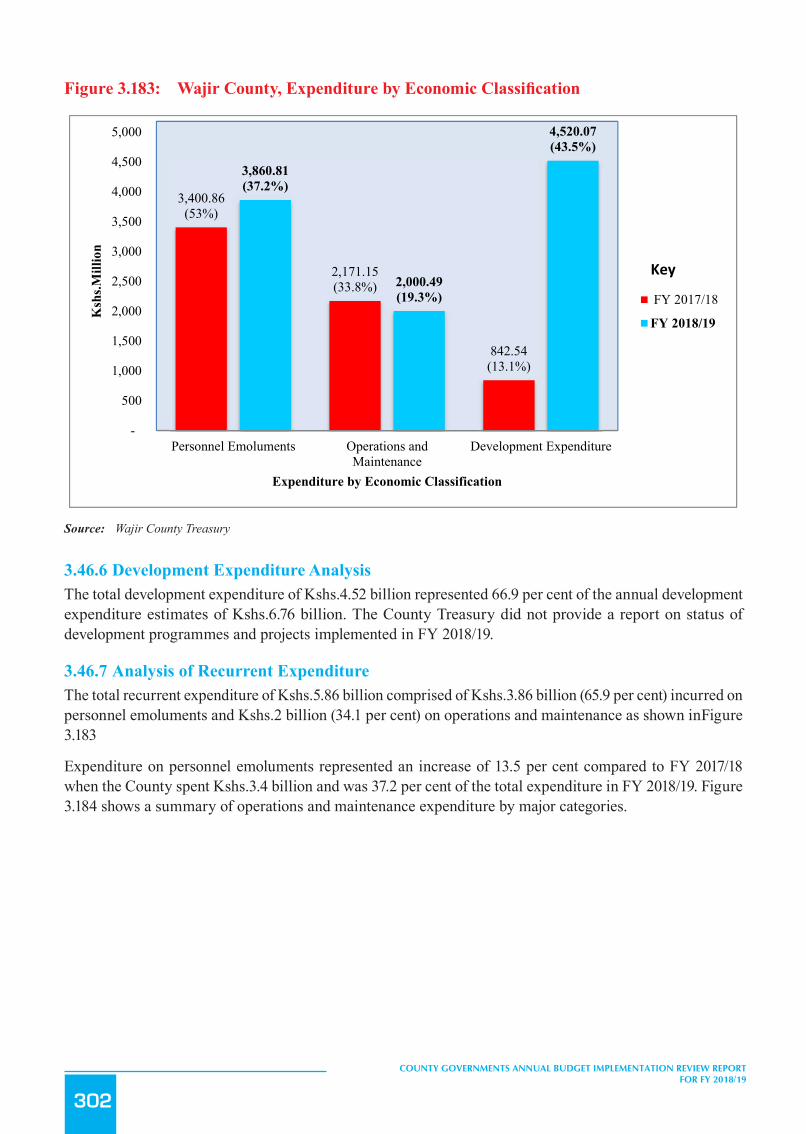
302
COUNTY GOVERNMENTS ANNUAL BUDGET IMPLEMENTATION REVIEW REPORT FOR FY 2018/19
Figure3.183: WajirCounty,ExpenditurebyEconomicClassification
338
Source: Wajir County Treasury
3.46.6 Development Expenditure Analysis The total development expenditure of Kshs.4.52 billion represented 66.9 per cent of the annual development
expenditure estimates of Kshs.6.76 billion. The County Treasury did not provide a report on status of development
programmes and projects implemented in FY 2018/19.
3.46.7 Analysis of Recurrent Expenditure The total recurrent expenditure of Kshs.5.86 billion comprised of Kshs.3.86 billion (65.9 per cent) incurred on personnel
emoluments and Kshs.2 billion (34.1 per cent) on operations and maintenance as shown inFigure 3.183
Expenditure on personnel emoluments represented an increase of 13.5 per cent compared to FY 2017/18 when the
County spent Kshs.3.4 billion and was 37.2 per cent of the total expenditure in FY 2018/19. Figure 3.184 shows a
summary of operations and maintenance expenditure by major categories.
Figure 3.184: Wajir County, Operations and Maintenance Expenditure by Major Categories in FY 2018/19
3,400.86(53%)
2,171.15(33.8%)
842.54(13.1%)
3,860.81(37.2%)
2,000.49(19.3%)
4,520.07(43.5%)
-
500
1,000
1,500
2,000
2,500
3,000
3,500
4,000
4,500
5,000
Personnel Emoluments Operations andMaintenance
Development Expenditure
Ksh
s.Mill
ion
Expenditure by Economic Classification
FY 2017/18
FY 2018/19
Key
Source: Wajir County Treasury
3.46.6 Development Expenditure AnalysisThe total development expenditure of Kshs.4.52 billion represented 66.9 per cent of the annual development expenditure estimates of Kshs.6.76 billion. The County Treasury did not provide a report on status of development programmes and projects implemented in FY 2018/19.
3.46.7 Analysis of Recurrent ExpenditureThe total recurrent expenditure of Kshs.5.86 billion comprised of Kshs.3.86 billion (65.9 per cent) incurred on personnel emoluments and Kshs.2 billion (34.1 per cent) on operations and maintenance as shown inFigure 3.183
Expenditure on personnel emoluments represented an increase of 13.5 per cent compared to FY 2017/18 when the County spent Kshs.3.4 billion and was 37.2 per cent of the total expenditure in FY 2018/19. Figure 3.184 shows a summary of operations and maintenance expenditure by major categories.
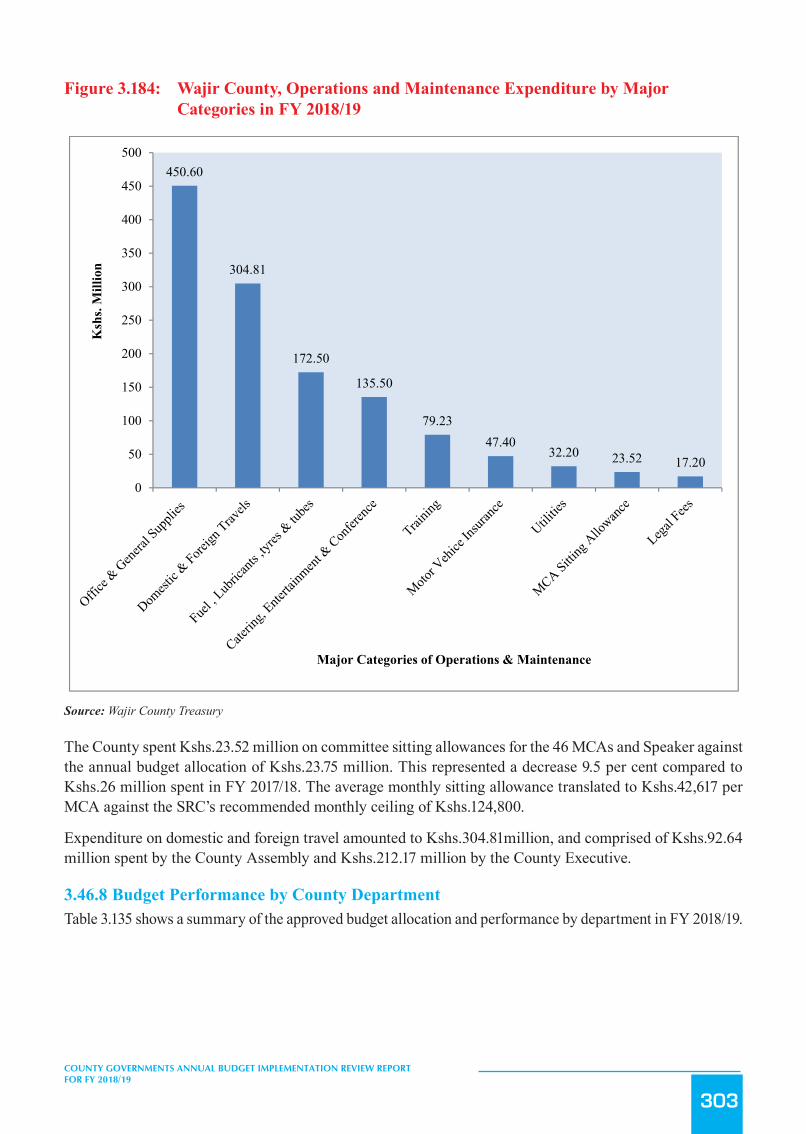
303
COUNTY GOVERNMENTS ANNUAL BUDGET IMPLEMENTATION REVIEW REPORT FOR FY 2018/19
Figure 3.184: Wajir County, Operations and Maintenance Expenditure by Major Categories in FY 2018/19
339
Source: Wajir County Treasury
The County spent Kshs.23.52 million on committee sitting allowances for the 46 MCAs and Speaker against the annual
budget allocation of Kshs.23.75 million. This represented a decrease 9.5 per cent compared to Kshs.26 million spent in
FY 2017/18. The average monthly sitting allowance translated to Kshs.42,617 per MCA against the SRC’s
recommended monthly ceiling of Kshs.124,800.
Expenditure on domestic and foreign travel amounted to Kshs.304.81million, and comprised of Kshs.92.64 million
spent by the County Assembly and Kshs.212.17 million by the County Executive.
3.46.8 Budget Performance by County Department Table 3.135 shows a summary of the approved budget allocation and performance by department in FY 2018/19.
Table 3.135: Wajir County, Budget Performance by Department in FY 2018/19
Department Budget Allocation
(Kshs. Million) Exchequer Issues (Kshs. Million)
Expenditure (Kshs. Million)
Expenditure to Exchequer Issues (%)
Absorption rate (%)
Rec Dev Rec Dev Rec Dev Rec Dev Rec Dev Office of the Governor 503.40 - 452.80 - 452.8 - 100 - 89.9 - Finance and Economic Planning 654.90 4.00 584.30 - 584.3 - 100 - 89.2 -
Agriculture and Livestock 230.30 683.60 232.90 300.50 232.9 300.50 100 100. 100 44.0
450.60
304.81
172.50
135.50
79.2347.40
32.20 23.52 17.20
0
50
100
150
200
250
300
350
400
450
500
Ksh
s. M
illio
n
Major Categories of Operations & Maintenance
Source: Wajir County Treasury
The County spent Kshs.23.52 million on committee sitting allowances for the 46 MCAs and Speaker against the annual budget allocation of Kshs.23.75 million. This represented a decrease 9.5 per cent compared to Kshs.26 million spent in FY 2017/18. The average monthly sitting allowance translated to Kshs.42,617 per MCA against the SRC’s recommended monthly ceiling of Kshs.124,800.
Expenditure on domestic and foreign travel amounted to Kshs.304.81million, and comprised of Kshs.92.64 million spent by the County Assembly and Kshs.212.17 million by the County Executive.
3.46.8 Budget Performance by County DepartmentTable 3.135 shows a summary of the approved budget allocation and performance by department in FY 2018/19.
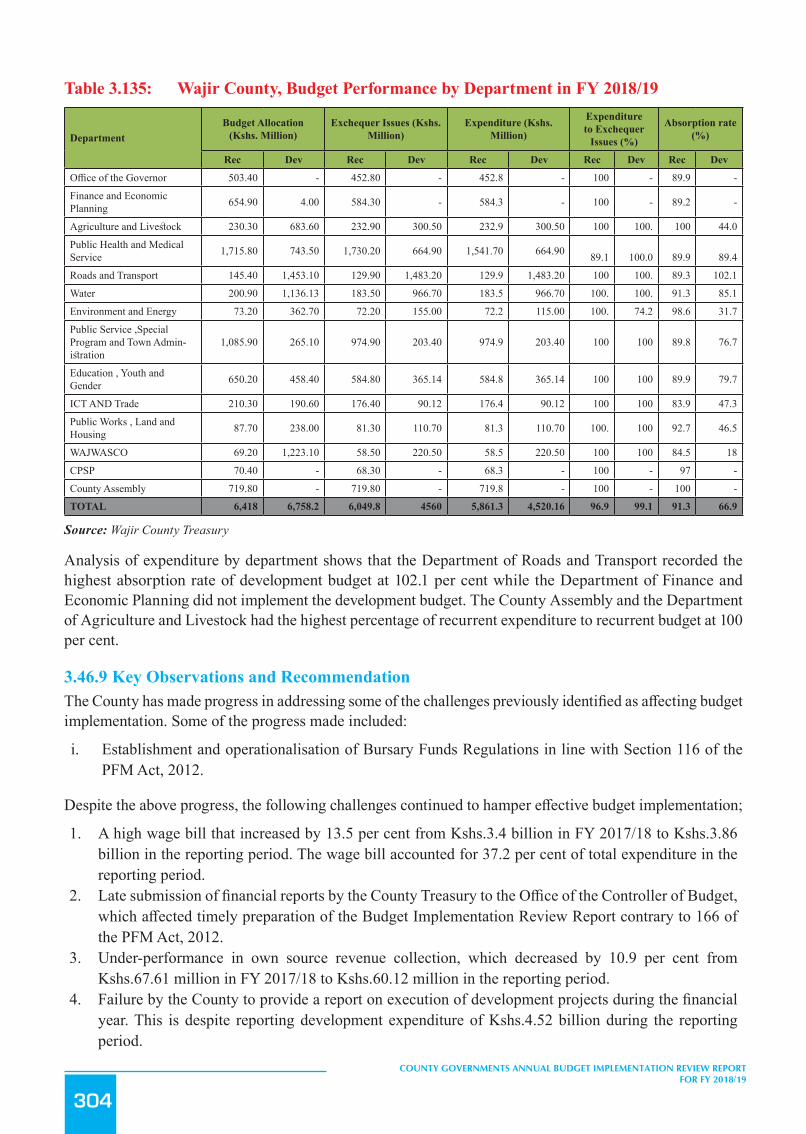
304
COUNTY GOVERNMENTS ANNUAL BUDGET IMPLEMENTATION REVIEW REPORT FOR FY 2018/19
Table 3.135: Wajir County, Budget Performance by Department in FY 2018/19
DepartmentBudget Allocation
(Kshs. Million)Exchequer Issues (Kshs.
Million)Expenditure (Kshs.
Million)
Expenditure to Exchequer
Issues (%)
Absorption rate (%)
Rec Dev Rec Dev Rec Dev Rec Dev Rec Dev
Office of the Governor 503.40 - 452.80 - 452.8 - 100 - 89.9 -
Finance and Economic Planning 654.90 4.00 584.30 - 584.3 - 100 - 89.2 -
Agriculture and Livestock 230.30 683.60 232.90 300.50 232.9 300.50 100 100. 100 44.0
Public Health and Medical Service 1,715.80 743.50 1,730.20 664.90 1,541.70 664.90 89.1 100.0 89.9 89.4
Roads and Transport 145.40 1,453.10 129.90 1,483.20 129.9 1,483.20 100 100. 89.3 102.1
Water 200.90 1,136.13 183.50 966.70 183.5 966.70 100. 100. 91.3 85.1
Environment and Energy 73.20 362.70 72.20 155.00 72.2 115.00 100. 74.2 98.6 31.7
Public Service ,Special Program and Town Admin-istration
1,085.90 265.10 974.90 203.40 974.9 203.40 100 100 89.8 76.7
Education , Youth and Gender 650.20 458.40 584.80 365.14 584.8 365.14 100 100 89.9 79.7
ICT AND Trade 210.30 190.60 176.40 90.12 176.4 90.12 100 100 83.9 47.3
Public Works , Land and Housing 87.70 238.00 81.30 110.70 81.3 110.70 100. 100 92.7 46.5
WAJWASCO 69.20 1,223.10 58.50 220.50 58.5 220.50 100 100 84.5 18
CPSP 70.40 - 68.30 - 68.3 - 100 - 97 -
County Assembly 719.80 - 719.80 - 719.8 - 100 - 100 -
TOTAL 6,418 6,758.2 6,049.8 4560 5,861.3 4,520.16 96.9 99.1 91.3 66.9
Source: Wajir County Treasury
Analysis of expenditure by department shows that the Department of Roads and Transport recorded the highest absorption rate of development budget at 102.1 per cent while the Department of Finance and Economic Planning did not implement the development budget. The County Assembly and the Department of Agriculture and Livestock had the highest percentage of recurrent expenditure to recurrent budget at 100 per cent.
3.46.9 Key Observations and RecommendationThe County has made progress in addressing some of the challenges previously identified as affecting budget implementation. Some of the progress made included:
i. Establishment and operationalisation of Bursary Funds Regulations in line with Section 116 of the PFM Act, 2012.
Despite the above progress, the following challenges continued to hamper effective budget implementation;
1. A high wage bill that increased by 13.5 per cent from Kshs.3.4 billion in FY 2017/18 to Kshs.3.86 billion in the reporting period. The wage bill accounted for 37.2 per cent of total expenditure in the reporting period.
2. Late submission of financial reports by the County Treasury to the Office of the Controller of Budget, which affected timely preparation of the Budget Implementation Review Report contrary to 166 of the PFM Act, 2012.
3. Under-performance in own source revenue collection, which decreased by 10.9 per cent from Kshs.67.61 million in FY 2017/18 to Kshs.60.12 million in the reporting period.
4. Failure by the County to provide a report on execution of development projects during the financial year. This is despite reporting development expenditure of Kshs.4.52 billion during the reporting period.

305
COUNTY GOVERNMENTS ANNUAL BUDGET IMPLEMENTATION REVIEW REPORT FOR FY 2018/19
The County should implement the following measures in order to improve budget execution;
1. The County Public Service Board should develop an optimal staffing structure and devise strategies to contain expenditure on personnel costs within 35 per cent of County’s total revenue in line with regulation 25(1) (b) of the PFM (County Government) Regulations, 2015.
2. The County Treasury should ensure timely preparation and submission of financial reports in line with Section 166 of PFM Act, 2012
3. The County Treasury should formulate policy and strategize on improvement of its own source revenue collection.
4. The County should provide complete financial reports in line with Section 166 of the PFM Act, 2012.
3.47 West Pokot County
3.47.1 Overview of the FY 2018/19 BudgetThe County’s FY 2018/19 Supplementary Budget was Kshs.6.37 billion, comprising of Kshs.4.14 billion (65 per cent) and Kshs.2.23 billion (35 per cent) allocation for recurrent and development expenditure respectively.
To finance the budget, the County expects to receive Kshs.4.93 billion (77.4 per cent) as equitable share of the revenue raised nationally, Kshs.740.81 million ( 11.6 per cent) as total conditional grants, generate Kshs.122.37 million (1.9 per cent) from own sources of revenue, and Kshs.574.97 million (9per cent) cash balance from FY 2017/18.
Figure 3.185: West Pokot County, Expected Sources of Budget Financing in FY 2018/19
341
4. The County should provide complete financial reports in line with Section 166 of the PFM Act, 2012.
3.47 West Pokot County
3.47.1 Overview of the FY 2018/19 Budget The County’s FY 2018/19 Supplementary Budget was Kshs.6.37 billion, comprising of Kshs.4.14 billion (65 per cent)
and Kshs.2.23 billion (35 per cent) allocation for recurrent and development expenditure respectively.
To finance the budget, the County expects to receive Kshs.4.93 billion (77.4 per cent) as equitable share of the revenue
raised nationally, Kshs.740.81 million ( 11.6 per cent) as total conditional grants, generate Kshs.122.37 million (1.9 per
cent) from own sources of revenue, and Kshs.574.97 million (9per cent) cash balance from FY 2017/18.
Figure 3.185: West Pokot County Expected Sources of Budget Financing in FY 2018/19
Source: West County Treasury
A breakdown of the conditional grants is provided inTable 3.136.
3.47.2 Revenue Analysis During FY 2018/19, the County had a total of Khs.6.02 billion available for budget implementation. This amount
consisted of Kshs.4.93 billion received as equitable share of the revenue raised nationally, Kshs.397.08 million as
conditional grants, Kshs.118.83 million generated from own sources of revenue, and a cash balance of Kshs.574.94
million from FY 2017/18.
Figure 3.186 shows the annual trend in own-source revenue collection from FY 2013/14 to FY 2018/19.
Figure 3.186: West Pokot County, Own Source Revenue Collection for FY 2013/14 to FY 2018/19
Cash Balance from FY 2017/18
9.0%
National Sharable Revenue77.4%
Total Conditional Allocations
11.6%
Own Source Revenue1.9%
Source: West County Treasury
A breakdown of the conditional grants is provided inTable 3.136.
3.47.2 Revenue AnalysisDuring FY 2018/19, the County had a total of Khs.6.02 billion available for budget implementation. This amount consisted of Kshs.4.93 billion received as equitable share of the revenue raised nationally, Kshs.397.08 million as conditional grants, Kshs.118.83 million generated from own sources of revenue, and a cash balance of Kshs.574.94 million from FY 2017/18.
Figure 3.186 shows the annual trend in own-source revenue collection from FY 2013/14 to FY 2018/19.
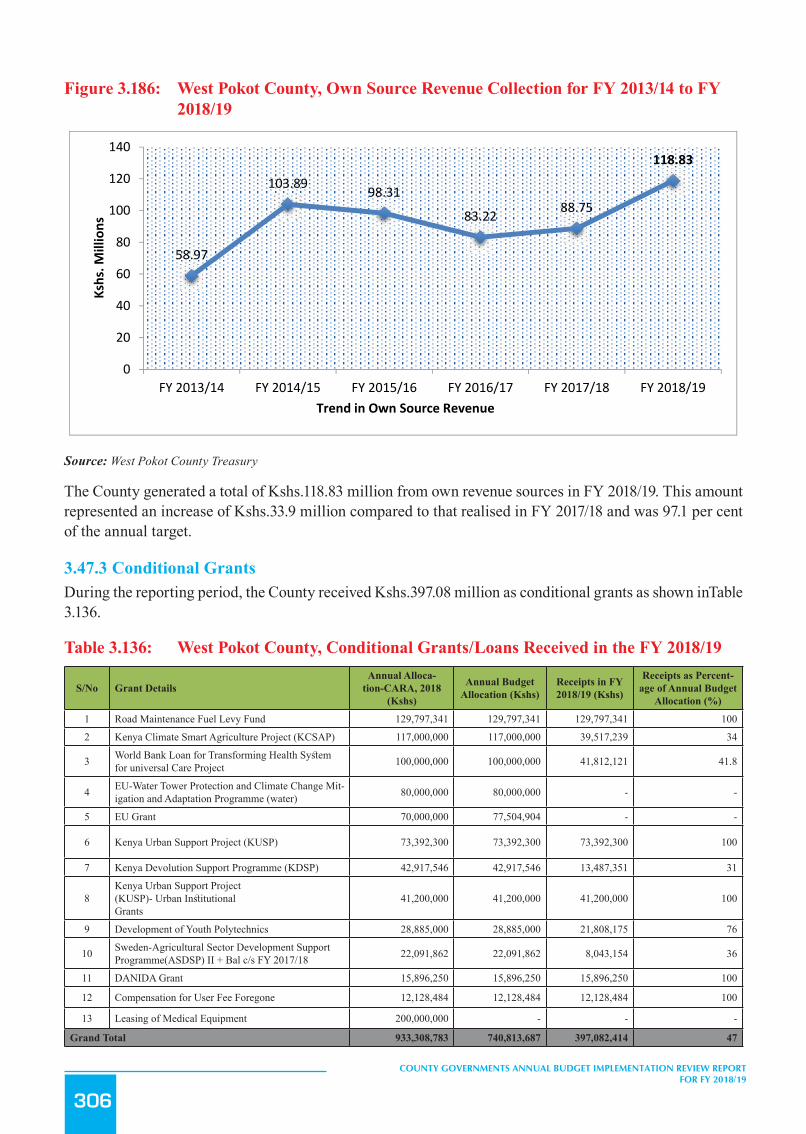
306
COUNTY GOVERNMENTS ANNUAL BUDGET IMPLEMENTATION REVIEW REPORT FOR FY 2018/19
Figure 3.186: West Pokot County, Own Source Revenue Collection for FY 2013/14 to FY 2018/19
342
Source: West Pokot County Treasury
The County generated a total of Kshs.118.83 million from own revenue sources in FY 2018/19. This amount
represented an increase of Kshs.33.9 million compared to that realised in FY 2017/18 and was 97.1 per cent of the
annual target.
3.47.3 Conditional Grants During the reporting period, the County received Kshs.397.08 million as conditional grants as shown inTable 3.136.
Table 3.136: West Pokot County, Conditional Grants/Loans Received in the FY 2018/19
S/No Grant Details
Annual Allocation-CAR
A, 2018
(Kshs)
Annual Budget Allocation
(Kshs)
Receipts in FY 2018/19
(Kshs)
Receipts as Percentage of
Annual Budget Allocation
(%)
1 Road Maintenance Fuel Levy Fund 129,797,341
129,797,341
129,797,341 100
2 Kenya Climate Smart Agriculture Project (KCSAP)
117,000,000
117,000,000
39,517,239 34
3 World Bank Loan for Transforming Health System for universal Care Project
100,000,000
100,000,000
41,812,121 41.8
4 EU-Water Tower Protection and Climate Change Mitigation and Adaptation Programme (water)
80,000,000
80,000,000 - -
5 EU Grant 70,000,000
77,504,904 - -
6 Kenya Urban Support Project (KUSP) 73,392,300
73,392,300
73,392,300 100
7 Kenya Devolution Support Programme (KDSP) 42,917,546
42,917,546
13,487,351 31
8 Kenya Urban Support Project (KUSP)- Urban Institutional Grants
41,200,000
41,200,000
41,200,000 100
9 Development of Youth Polytechnics 28,885,000
28,885,000
21,808,175 76
10 Sweden-Agricultural Sector Development Support Programme(ASDSP) II + Bal c/s FY 2017/18
22,091,862
22,091,862
8,043,154 36
58.97
103.89 98.31
83.22 88.75
118.83
0
20
40
60
80
100
120
140
FY 2013/14 FY 2014/15 FY 2015/16 FY 2016/17 FY 2017/18 FY 2018/19
Kshs. M
illions
Trend in Own Source Revenue
Source: West Pokot County Treasury
The County generated a total of Kshs.118.83 million from own revenue sources in FY 2018/19. This amount represented an increase of Kshs.33.9 million compared to that realised in FY 2017/18 and was 97.1 per cent of the annual target.
3.47.3 Conditional GrantsDuring the reporting period, the County received Kshs.397.08 million as conditional grants as shown inTable 3.136.
Table 3.136: West Pokot County, Conditional Grants/Loans Received in the FY 2018/19
S/No Grant DetailsAnnual Alloca-
tion-CARA, 2018 (Kshs)
Annual Budget Allocation (Kshs)
Receipts in FY 2018/19 (Kshs)
Receipts as Percent-age of Annual Budget
Allocation (%)
1 Road Maintenance Fuel Levy Fund 129,797,341 129,797,341 129,797,341 100
2 Kenya Climate Smart Agriculture Project (KCSAP) 117,000,000 117,000,000 39,517,239 34
3 World Bank Loan for Transforming Health System for universal Care Project 100,000,000 100,000,000 41,812,121 41.8
4 EU-Water Tower Protection and Climate Change Mit-igation and Adaptation Programme (water) 80,000,000 80,000,000 - -
5 EU Grant 70,000,000 77,504,904 - -
6 Kenya Urban Support Project (KUSP) 73,392,300 73,392,300 73,392,300 100
7 Kenya Devolution Support Programme (KDSP) 42,917,546 42,917,546 13,487,351 31
8Kenya Urban Support Project (KUSP)- Urban Institutional Grants
41,200,000 41,200,000 41,200,000 100
9 Development of Youth Polytechnics 28,885,000 28,885,000 21,808,175 76
10 Sweden-Agricultural Sector Development Support Programme(ASDSP) II + Bal c/s FY 2017/18 22,091,862 22,091,862 8,043,154 36
11 DANIDA Grant 15,896,250 15,896,250 15,896,250 100
12 Compensation for User Fee Foregone 12,128,484 12,128,484 12,128,484 100
13 Leasing of Medical Equipment 200,000,000 - - -
Grand Total 933,308,783 740,813,687 397,082,414 47
307
COUNTY GOVERNMENTS ANNUAL BUDGET IMPLEMENTATION REVIEW REPORT FOR FY 2018/19
Source: West Pokot County Treasury
During the reporting period, receipts from the Road Maintenance Fuel Levy, DANIDA, Kenya Urban Support Project (KUSP)- Urban Institutional Grants, Compensation for User Fee Foregone and IDA (World Bank) Kenya Urban Support Project (KUSP) conditional grant recorded the highest performance in percentage terms, and accounted 100 percent of the annual target respectively.
3.47.4 Exchequer IssuesIn order to implement the budget, the Controller of Budget approved withdrawal of Kshs.5.64 billion from the CRF account. The withdrawals represented 88.5 per cent of the Approved Supplementary Budget and translated to an increase of 11.8 per cent from Kshs.5.04 billion in FY 2017/18 and comprised of Kshs.1.50 billion (26.6 per cent) towards development activities and Kshs.4.14 billion (73.4 per cent) for recurrent expenditure.
3.47.5 Overall Expenditure ReviewA total of Kshs.5.52 billion was spent on both development and recurrent activities. This expenditure represented 97.9 per cent of the total funds released from the CRF account, and was an increase of 25.2 per cent from Kshs.4.41 billion spent in FY 2017/18. The expenditure excluded pending bills as at June 30, 2019 which was not provided.
Expenditure on development programmes amounted to Kshs.1.62 billion while Kshs.3.90 billion was spent on recurrent activities. The development expenditure was 109 per cent of the funds released for development programmes, while recurrent expenditure was 94.2 per cent of funds released for recurrent activities.
Development expenditure recorded an absorption rate of 69.5 per cent, which was an increase from 57.2 per cent attained in FY 2017/18. Conversely, recurrent expenditure represented 94.2 per cent of the annual recurrent budget, an increase from 87.2 per cent recorded in FY 2017/18.
Figure 3.187 presents a comparison between the total expenditure in FY 2018/19 and FY 2017/18.

308
COUNTY GOVERNMENTS ANNUAL BUDGET IMPLEMENTATION REVIEW REPORT FOR FY 2018/19
Figure3.187: WestPokotCounty,ExpenditurebyEconomicClassification
344
Source: West Pokot County Treasury
3.47.6 Development Expenditure Analysis The total development expenditure of Kshs.1.62 billion represented 69.5 per cent of the annual development
expenditure estimates of Kshs.2.23 billion. Table 3.137 provides a summary of development projects with the highest
expenditure in the financial year.
Table 3.137: West Pokot County, List of Development Projects with the Highest Expenditure in FY 2018/19
S/No. Project Name Project Location Project Budget
Project Expenditurein FY 2018/19
(Kshs.)
1 Consolidated KRB Roads Countywide - 125,006,731
2 Nasukuta 77,503,804 77,503,804
3 Labour Based Projects Countywide - 57,594,126
4 Major Roads KUSP Countywide 52,645,949 52,645,949
5 World Bank Results Based Financing RBS Countywide 100,000,000 45,126,898
6 Purchase of Certified Seeds Countywide 50,586,339 45,092,305
7 Construction of County Assembly Kapenguria 80,000,000 41,550,000
8 Transforming Health Systems Universal Healthcare THS-UHC PROJECT Countywide 50,378,964 33,108,023
9 Construction of Speakers Residence Countywide 55,450,000 32,634,187
10 Supply of Lightening Arrestors Countywide 30,000,000 30,000,000
Source: West Pokot County Treasury
2,019.17(45.8%)
1,407.40(31.9%)
983.31(22.3%)
2,336.22(42.3%)
1,563.28(28.3%)
1,619.91(29.3%)
-
500
1,000
1,500
2,000
2,500
Personnel Emoluments Operations and Maintenance Development Expenditure
Ksh
s.Mill
ion
Expenditure by Economic Classification
FY 2017/18
FY 2018/19
Key
Source: West Pokot County Treasury
3.47.6 Development Expenditure AnalysisThe total development expenditure of Kshs.1.62 billion represented 69.5 per cent of the annual development expenditure estimates of Kshs.2.23 billion. Table 3.137 provides a summary of development projects with the highest expenditure in the financial year.
Table 3.137: West Pokot County, List of Development Projects with the Highest Expenditure in FY 2018/19
S/No. Project Name Project Location Project Budget Project Expenditure in FY 2018/19 (Kshs.)
1 Consolidated KRB Roads Countywide - 125,006,731
2 Nasukuta 77,503,804 77,503,804
3 Labour Based Projects Countywide - 57,594,126
4 Major Roads KUSP Countywide 52,645,949 52,645,949
5 World Bank Results Based Financing RBS Countywide 100,000,000 45,126,898
6 Purchase of Certified Seeds Countywide 50,586,339 45,092,305
7 Construction of County Assembly Kapenguria 80,000,000 41,550,000
8 Transforming Health Systems Universal Healthcare THS-UHC PROJECT Countywide 50,378,964 33,108,023
9 Construction of Speakers Residence Countywide 55,450,000 32,634,187
10 Supply of Lightening Arrestors Countywide 30,000,000 30,000,000
Source: West Pokot County Treasury

309
COUNTY GOVERNMENTS ANNUAL BUDGET IMPLEMENTATION REVIEW REPORT FOR FY 2018/19
3.47.7 Analysis of Recurrent ExpenditureThe total recurrent expenditure of Kshs.3.90 billion comprised of Kshs.2.34 billion (59.9 per cent) incurred on personnel emoluments and Kshs.1.56 billion (40.1 per cent) on operations and maintenance as shown inFigure 3.187.
Expenditure on personnel emoluments represented an increase of 15.7 per cent compared to a similar period of FY 2017/18 when the County spent Kshs.2.02 billion and was 42.4 per cent of the total expenditure in FY 2018/19 Figure 3.188 shows a summary of operations and maintenance expenditure by major categories.
Figure 3.188: West Pokot County, Operations and Maintenance Expenditure by Major Categories in FY 2018/19
345
3.47.7 Analysis of Recurrent Expenditure The total recurrent expenditure of Kshs.3.90 billion comprised of Kshs.2.34 billion (59.9 per cent) incurred on personnel
emoluments and Kshs.1.56 billion (40.1 per cent) on operations and maintenance as shown inFigure 3.187.
Expenditure on personnel emoluments represented an increase of 15.7 per cent compared to a similar period of FY
2017/18 when the County spent Kshs.2.02 billion and was 42.4 per cent of the total expenditure in FY 2018/19 Figure
3.188 shows a summary of operations and maintenance expenditure by major categories.
Figure 3.188: West Pokot County, Operations and Maintenance Expenditure by Major Categories in FY 2018/19
Source: West Pokot County Treasury
The County spent Kshs.17.85 million on committee sitting allowances for the 34 MCAs and speaker against the annual
budget allocation of Kshs.21.16 million. This represented a decrease of 8.6 per cent compared to Kshs.19.52 million
spent in a similar period of FY 2017/18. The average monthly sitting allowance translated to Kshs.43,751 per MCA
against the SRC’s recommended monthly ceiling of Kshs.124,800.
Expenditure on domestic and foreign travel amounted to Kshs.405.8 million, and comprised of Kshs.155.70 million
spent by the County Assembly and Kshs.250.10 million by the County Executive. This expenditure represented 7.3 per
cent of total recurrent expenditure and was an increase of 28.4 per cent compared to Kshs.315.96 million spent in FY
2017/18.
346.43
300.00
167.90
69.85 67.69 59.37 52.49 52.33 48.42
0
50
100
150
200
250
300
350
400
Ksh
s. M
illio
n
Major Categories of Operations & Maintenance
Source: West Pokot County Treasury
The County spent Kshs.17.85 million on committee sitting allowances for the 34 MCAs and speaker against the annual budget allocation of Kshs.21.16 million. This represented a decrease of 8.6 per cent compared to Kshs.19.52 million spent in a similar period of FY 2017/18. The average monthly sitting allowance translated to Kshs.43,751 per MCA against the SRC’s recommended monthly ceiling of Kshs.124,800.

310
COUNTY GOVERNMENTS ANNUAL BUDGET IMPLEMENTATION REVIEW REPORT FOR FY 2018/19
Expenditure on domestic and foreign travel amounted to Kshs.405.8 million, and comprised of Kshs.155.70 million spent by the County Assembly and Kshs.250.10 million by the County Executive. This expenditure represented 7.3 per cent of total recurrent expenditure and was an increase of 28.4 per cent compared to Kshs.315.96 million spent in FY 2017/18.
3.47.8 Budget Performance by County DepartmentTable 3.138 shows a summary of the approved budget allocation and performance by department in FY 2018/19.
Table 3.138: West Pokot County, Budget Performance by Department in FY 2018/19
DepartmentAnnual Budget Alloca-
tion (Kshs. Million)Exchequer Issues (Kshs.
Million)Expenditure (Kshs.
Million)
Expenditure to Exchequer ((%)
Issues (%)
Absorption Rate (%)
Rec Dev Rec Dev Rec Dev Rec Dev Rec Dev
County Executive 444.03 51.62 434.80 20.35 426.08 49.21 98.0 241.8 96.0 95.3
Finance and Economic Planning 283.61 - 277.63 - 265.05 - 95.5 - 93.5 -
Public Works, Transport and Infrastructure 79.14 400.29 117.59 376.39 71.79 333.16 61.0 88.5 90.7 83.2
Health, Sanitation and Emer-gencies 1,265.03 493.70 1,269.64 348.63 1,254.51 363.47 98.8 104.3 99.2 73.6
Education and Technical Training 659.98 195.80 640.52 195.81 568.79 188.58 88.8 96.3 86.2 96.3
Agriculture and Irrigation 116.41 198.31 115.77 95.42 113.99 85.05 98.5 89.1 97.9 42.9
Pastoral Economy 107.93 211.77 106.98 165.89 100.23 177.11 93.7 106.8 92.9 83.6
Trade, Industrialization, Investment and Cooperative Development
58.24 33.73 57.91 10.99 54.52 20.71 94.2 188.5 93.6 61.4
Land, Housing, Physical Planning and Urban Devel-opment
80.10 134.84 78.41 83.39 77.39 71.19 98.7 85.4 96.6 52.8
Water Development, Environ-ment and Natural Resources 90.81 220.67 113.22 29.75 79.87 95.25 70.5 320.2 88.0 43.2
Youth, Sports, Tourism, Gen-der and Social Services 71.31 59.45 69.47 22.60 68.18 51.68 98.1 228.7 95.6 86.9
Public Service, ICT and Decentralised Units 204.45 22.10 202.16 20.00 196.35 20.00 97.1 100.0 96.0 90.5
Special Programmes and Directorates 104.74 65.00 94.18 53.50 90.37 47.30 96.0 88.4 86.3 72.8
County Assembly 573.46 143.00 559.79 78.97 532.39 117.18 95.1 148.4 92.8 81.9
Total 4,139.23 2,330.28 4,138.07 1,501.68 3,899.50 1,619.91 94.2 107.9 94.2 69.5
Source: West Pokot County Treasury
Analysis of expenditure by department shows that the Department of Education and Technical Training recorded the highest absorption rate of development budget at 96.3 per cent while the Department of Agriculture and Irrigation recorded the lowest 42.9 per cent. The Department of Health, Sanitation and Emergencies had the highest percentage of recurrent expenditure to recurrent budget at 99.2 per cent while the Department of Education and Technical Training had the lowest at 86.2 per cent.
3.47.9 Key Observations and RecommendationsThe County has made progress in addressing some of the challenges previously identified as affecting budget implementation. Some of the progress made included:
i. Improvement of own source revenue by 33.9 per cent from Kshs.88.75 million in FY 2017/18 to Kshs.118.83 million in FY 2018/19.

311
COUNTY GOVERNMENTS ANNUAL BUDGET IMPLEMENTATION REVIEW REPORT FOR FY 2018/19
Despite the above progress, the following challenges continued to hamper effective budget implementation;
1. Delay in submission of financial reports by the County Treasury, which affected timely preparation of budget implementation report.
2. The County’s wage bill has remained high, having increased by 15.7 per cent from Kshs.2.02 billion in FY 2017/18 to Kshs.2.35 billion in the period under review. Increase in wage bill may affect implementation of development projects.
3. Failure by the County to provide a detailed report on pending bills as of the end of the financial year.
The County should implement the following measures in order to improve budget execution;
1. The County Treasury should ensure timely preparation and submission of financial reports in line with Section 166 of PFM Act, 2012.
2. The County Public Service Board should establish and adopt an optimal staffing structure in order to ensure a sustainable wage bill.
3. The County Treasury should provide a report on status of pending bills as at 30th June, 2019 as requested by the Controller of Budget in line with COB Act, 2016.

312
COUNTY GOVERNMENTS ANNUAL BUDGET IMPLEMENTATION REVIEW REPORT FOR FY 2018/19
4 KEY CHALLENGES AND RECOMMENDATIONS
This section highlights cross-cutting issues that affected budget implementation in the FY 2018/19 and makes appropriate recommendations aimed at addressing the challenges in order to enhance smooth budget execution. The cross-cutting challenges included:
4.1 High Expenditure on Personnel EmolumentsThe County Governments spent Kshs.162.77 billion on personnel emoluments (PE), which accounted for 43.2 per cent of the total expenditure for the period. This expenditure represented an increase of 7.7 per cent from Kshs.151.09 billion incurred in FY 2017/18 where the personnel expenditure translated to 49.7 per cent of the total expenditure. Only five counties: namely Tana River, Marsabit, Turkana, Mandera and Kilifi reported expenditure on personnel emoluments that was within the maximum allowed limit of 35 per cent of their total expenditure in FY 2018/19 at 34 per cent, 32.7 per cent, 29.2 per cent, 24.2 per cent and 21.1 per cent respectively. The increase in wage bill is unsustainable and will crowd out spending on key development activities.
Regulation 25 (1) (b) of the Public Finance Management (County Governments) Regulations, 2015 sets a limit of the County Government’s expenditure on wages and benefits at 35 per cent of the County’s total revenue.
The Office recommends that expenditure on personnel emoluments be contained at sustainable levels in compliance with Regulation 25 (1) (b) of the Public Finance Management (County Governments) Regulations, 2015.
4.2 Delays in Submission of Financial Reports to the Controller of BudgetDuring the period under review, the Office noted delays in submission of quarterly financial reports by County Treasuries, which led to late preparation of the County Budget Implementation Review Report (CBIRR), thereby affecting monitoring of budget implementation.
County Treasuries are required to prepare and submit quarterly financial reports in line with Section 166 (4) and 168 (3) of the PFM Act, 2012 not later than one month after the end of each quarter. The quarterly financial reports should be prepared in compliance with templates as prescribed by the Public Sector Accounting Standards Board and the templates provided by the Controller of Budget in line with the COB Act, 2016.
The Office recommends that County Treasuries should ensure timely preparation and submission of financial reports in line with Section 166 (4) and 168 (3) of the PFM Act, 2012 and Section 16 of the Controller of Budget Act, 2016.
4.3 High Expenditure on Travel CostsThe County Governments incurred Kshs.16.2 billion on domestic and foreign travel which was 4.3 per cent of total expenditure in the reporting period. This amount comprised of Kshs.13.44 billion on domestic travel and Kshs.2.75 billion on foreign travel. Expenditure on travel increased by 42.5 per cent from Kshs.11.36 billion incurred in FY 2017/18. The high expenditure on travel, which is a non-core activity, may lead to reduced expenditure on key development programmes.

313
COUNTY GOVERNMENTS ANNUAL BUDGET IMPLEMENTATION REVIEW REPORT FOR FY 2018/19
High expenditure on non-core activity is contrary to the requirements of Article 201 of the Constitution which requires public money to be used in a prudent and responsible way. The Office recommends that expenditure on non-core activities, such as travelling, should be rationalised in order to free fund for implementation of key development programmes.
4.4 Failure to Establish County Budget and Economic Forums(CBEF) As at June 2019 some County Governments had not constituted County Budget and Economic forums in line with section 137 of PFM Act, 2012.
To improve planning, budgeting, and execution framework in the County Government, the Office recommends that counties prioritize establishment of these forums to encourage public participation in the budget process.
4.5 Failure to Establish Internal Audit Committees Some County Government had not established internal Audit Committees in contrary to the provision in Section 155 (5) of the PFM Act, 2012 to oversee financial operations and management in their respective Counties.
The Office recommends that Counties which have not yet constituted Internal Audit Committees prioritise their establishment as per the law and to improve oversight in the use of public funds by the County Governments..
314
COUNTY GOVERNMENTS ANNUAL BUDGET IMPLEMENTATION REVIEW REPORT FOR FY 2018/19
5 CONCLUSION
This report sought to provide information on the status of budget implementation by County Governments in the FY 2018/19. It is prepared in fulfilment of Article 228(6) of the Constitution of Kenya, 2010 and Section 9 of the Controller of Budget Act, 2016.
The aggregate budget estimates for the 47 County Governments amounted to Kshs.483.47 billion and comprised of Kshs.297.71 billion (61.6 per cent) allocation for recurrent expenditure and Kshs.185.76 billion (38.4 per cent) for development expenditure. The aggregate development expenditure allocation conforms to Section 107 (2(b)) of the PFM Act, 2012, which requires that at least 30 per cent of budget shall be allocated to development expenditure.
The County Governments spent a total of Kshs.376.43 billion which translated to an absorption rate of 77.9 per cent, and was an increase from 74 per cent attained in FY 2017/18. A total of Kshs.269 billion was spent on recurrent expenditure while Kshs.107.44 billion was spent on development expenditure. The expenditure translated to an absorption rate of 90.4 per cent and 57.8 per cent for recurrent and development expenditure respectively. The Office noted an improvement in performance of own sources of revenue collections, which increased by 24 per cent to Kshs.40.30 billion from Kshs.32.49 billion in FY 2017/18.
This report has also identified the key challenges that hampered effective budget execution during the reporting period. They included; high expenditure on Personnel Emoluments, late submission of quarterly financial reports to the Controller of Budget, and high expenditure on travel costs. The report has provided appropriate recommendations on how to address the identified challenges in order to enhance smooth execution of the budget.
The OCOB is committed on ensuring there is prudent and effective use of public resources by County Governments and implores accounting officers and institutions to implement the recommendations contained in this report.

COUNTY GOVERNMENTS BUDGET IMPLEMENTATION REVIEW REPORT, HALF YEAR, FY 2016/17
COUNTY GOVERNMENTSANNUAL BUDGET IMPLEMENTATION REVIEW
REPORT
FY 2018/19
AUGUST, 2019
Related Documents