i REPUBLIC OF KENYA MARCH, 2016 FIRST HALF FY 2015/16 OFFICE OF THE CONTROLLER OF BUDGET COUNTY GOVERNMENTS BUDGET IMPLEMENTATION REVIEW REPORT

Welcome message from author
This document is posted to help you gain knowledge. Please leave a comment to let me know what you think about it! Share it to your friends and learn new things together.
Transcript

COUNTY GOVERNMENTS BUDGET IMPLEMENTATION REVIEW REPORT FIRST HALF FY, 2015/16 i
Bima House, 12th FloorHarambee AvenueP. O. Box 35616 - 00100 Nairobi, KenyaTel: +254 (0) 20 318939, 2211056Fax: +254 (0) 20 2211920Email: [email protected]: www.cob.go.ke
REPUBLIC OF KENYA
MARCH, 2016
FIRST HALF
FY 2015/16
OFFICE OF THE CONTROLLER OF BUDGET
COUNTY GOVERNMENTSBUDGET IMPLEMENTATION REVIEW REPORT

COUNTY GOVERNMENTS BUDGET IMPLEMENTATION REVIEW REPORT FIRST HALF FY, 2015/16 i
REPUBLIC OF KENYA
OFFICE OF THE CONTROLLER OF BUDGET
COUNTY GOVERNMENTS
BUDGET IMPLEMENTATION REVIEW REPORT
FIRST HALF
FY 2015/16
MARCH 2016

COUNTY GOVERNMENTS BUDGET IMPLEMENTATION REVIEW REPORT FIRST HALF FY, 2015/16ii
PREFACE
It is with great pleasure that the Office of the Controller of Budget (OCOB) presents the County
Governments Budget Implementation Review Report (CBIRR) for the first half of FY 2015/16.
The report covers the July to December, 2015 period and is part of a series of quarterly reports
prepared by the OCOB. The report is prepared in line with Article 228 (6) of the Constitution of
Kenya, 2010 which requires the Controller to submit to each House of Parliament a report on the
implementation of the budgets of both the national and county governments.
This is the second report for the FY 2015/16, and it presents the status of budget implementation
by the County Governments, and analyzes both revenue and expenditure performance. The
analysis is largely based on financial reports submitted by County Treasuries and data generated
from the Integrated Financial Management Information System (IFMIS). The Office also relied
on insights and information gathered during regular monitoring and evaluation activities in the
Counties in preparing this report.
The OCOB commends the County Treasuries and the Budget Implementation Directorate
team who were very instrumental in the preparation and finalization of this report. The County
Treasuries worked assiduously to ensure timely submission of expenditure returns while the staff
in the Budget Implementation Directorate analyzed the returns and drafted this report.
The OCOB will continue to publish quarterly budget implementation review reports in order to
provide information to stakeholders and the citizens on public financial management and budget
implementation. The public is encouraged to read this report, interrogate the County Budgets and
actively participate in forums on public financial management in their respective counties. It is
through participation that citizens can contribute in identifying key county priorities for planning
and budgeting and also ensures that county governments deliver on their promises to the public.
Mrs. Agnes OdhiamboController of Budget

COUNTY GOVERNMENTS BUDGET IMPLEMENTATION REVIEW REPORT FIRST HALF FY, 2015/16 iii
TABLE OF CONTENT
PREFACE ...............................................................................................................................................................ii
TABLE OF CONTENT ........................................................................................................................................iii
LIST OF FIGURES .............................................................................................................................................. V
LIST OF TABLES ................................................................................................................................................xii
LIST OF ABBREVIATIONS/ACRONYMS .....................................................................................................xv
EXECUTIVE SUMMARY .................................................................................................................................xvi
KEY HIGHLIGHTS ...........................................................................................................................................xix
1.0 INTRODUCTION ...............................................................................................................................1
2.0 FINANCIAL ANALYSIS OF COUNTY BUDGET IMPLEMENTATION IN
FIRST HALF OF FY 2015/16 .............................................................................................................2
2.1 Introduction ............................................................................................................................................2
2.2 Revenue Analysis ...................................................................................................................................5
2.3 Funds Released to the Counties .............................................................................................................5
2.4 Expenditure Analysis ...........................................................................................................................13
2.5 Analysis of MCAs Sitting Allowances ................................................................................................19
2.6 Analysis of Expenditure on Domestic and Foreign Travels ................................................................21
2.7 Expenditure on Debt Repayment .........................................................................................................23
3.0 INDIVIDUAL COUNTY BUDGET PERFORMANCE .................................................................25
3.1 Baringo County ....................................................................................................................................25
3.2 Bomet County ......................................................................................................................................32
3.3 Bungoma County .................................................................................................................................38
3.4 Busia County ........................................................................................................................................44
3.5 Elgeyo Marakwet County ....................................................................................................................52
3.6 Embu County .......................................................................................................................................58
3.7 Garissa County .....................................................................................................................................65
3.8 Homa Bay County ................................................................................................................................70
3.9 Isiolo County ........................................................................................................................................77
3.10 Kajiado County ....................................................................................................................................83
3.11 Kakamega County ................................................................................................................................90
3.12 Kericho County ....................................................................................................................................96
3.13 Kiambu County ..................................................................................................................................103
3.14 Kilifi County ......................................................................................................................................109
3.15 Kirinyaga County ............................................................................................................................... 116
3.16 Kisii County .......................................................................................................................................123
3.17 Kisumu County ..................................................................................................................................130
3.18 Kitui County.......................................................................................................................................137
3.19 Kwale County ....................................................................................................................................144

COUNTY GOVERNMENTS BUDGET IMPLEMENTATION REVIEW REPORT FIRST HALF FY, 2015/16iv
3.20 Laikipia County .................................................................................................................................150
3.21 Lamu County .....................................................................................................................................157
3.22 Machakos County ..............................................................................................................................164
3.23 Makueni County .................................................................................................................................170
3.24 Mandera County .................................................................................................................................177
3.25 Marsabit County .................................................................................................................................184
3.26 Meru County ......................................................................................................................................189
3.27 Migori County ....................................................................................................................................196
3.28 Mombasa County ...............................................................................................................................202
3.29 Murang’a County ...............................................................................................................................209
3.30 Nairobi City County ...........................................................................................................................216
3.31 Nakuru County ...................................................................................................................................222
3.32 Nandi County .....................................................................................................................................229
3.33 Narok County .....................................................................................................................................235
3.34 Nyamira County .................................................................................................................................242
3.35 Nyandarua County .............................................................................................................................249
3.36 Nyeri County ......................................................................................................................................255
3.37 Samburu County ................................................................................................................................263
3.38 Siaya County ......................................................................................................................................268
3.39 Taita Taveta County ...........................................................................................................................274
3.40 Tana River County .............................................................................................................................280
3.41 Tharaka Nithi County ........................................................................................................................286
3.42 Trans Nzoia County ...........................................................................................................................293
3.43 Turkana County ..................................................................................................................................299
3.44 Uasin Gishu County ...........................................................................................................................306
3.45 Vihiga County ....................................................................................................................................313
3.46 Wajir County ......................................................................................................................................319
3.47 West Pokot County.............................................................................................................................326
4.0 KEY CHALLENGES AND RECOMMENDATIONS .................................................................334
4.1 Unprocedural Borrowing by the Counties .........................................................................................334
4.2 Inadequate Administration and Reporting on Public Funds Established by the Counties .................334
4.3 Low Local Revenue Collection by the Counties ...............................................................................334
4.4 Persistent Use of Locally Generated Revenue at Source ...................................................................335
4.5 Inadequate monitoring of development projects ................................................................................335
4.6 Revenue not captured in County Budgets ..........................................................................................335
4.7 Inadequate Internal Audit Function and Audit Committees ..............................................................336
5.0 CONCLUSION ................................................................................................................................337

COUNTY GOVERNMENTS BUDGET IMPLEMENTATION REVIEW REPORT FIRST HALF FY, 2015/16 v
LIST OF FIGURES
Figure 2.1: Monthly Local Revenue for the First Half of FY 2014/15 and First Half of FY 2015/16 (Kshs.Billions) ..........................3
Figure 3.1: Baringo County, Trend in Local Revenue Collection by Quarter from FY 2013/14 to the
second quarter of FY 2015/16 ............................................................................................................................................26
Figure 3.2: Baringo County, Expenditure by Economic Classification for first half of FY 2014/15 and
first half of FY 2015/16 ......................................................................................................................................................28
Figure 3.3: Baringo County, Operations and Maintenance Expenditure for the first half of FY 2015/16 ............................................29
Figure 3.4: Baringo County, Summary of Development Expenditure for the First Half of FY 2015/16 .............................................29
Figure 3.5: Bomet County, Trend in Local Revenue Collection by Quarter from the FY 2013/14 to the
second quarter of FY 2015/16 ............................................................................................................................................33
Figure 3.6: Bomet County, Expenditure by Economic Classification for first half of FY 2014/15 and FY 2015/16 ..........................34
Figure 3.7: Bomet County, Operations and Maintenance Expenditure for the first half of FY 2015/16 ..............................................35
Figure 3.8: Bomet County, Summary of Development Expenditure for the First Half of FY 2015/16................................................36
Figure 3.9 Bungoma County, Trend in Local Revenue Collection by Quarter from the FY 2013/14 to the
second quarter of FY 2015/16 ............................................................................................................................................39
Figure 3.10: Bungoma County, Expenditure by Economic Classification for First Half of FY 2014/15 and
First Half of FY 2015/16 ....................................................................................................................................................41
Figure 3.11: Bungoma County, Operations and Maintenance Expenditure for the first half of FY 2015/16 .........................................42
Figure 3.12: Bungoma County, Summary of Development Expenditure for the first half of FY 2015/16 .............................................42
Figure 3.13 Busia County, Trend in Local Revenue Collection by Quarter from the FY 2013/14 to the
second quarter of FY 2015/16 ............................................................................................................................................45
Figure 3.14: Busia County, Expenditure by Economic Classification for the first half of FY 2014/15 and for
first half of FY 2015/16 ......................................................................................................................................................47
Figure 3.15: Busia County, Operations and Maintenance Expenditure for the First Half of FY 2015/16..............................................48
Figure 3.16: Busia County, Summary of Development Expenditure for the First Half of FY 2015/16 ................................................49
Figure 3.17: Elgeyo Marakwet County, Trend in Local Revenue Collection by Quarter from the FY 2013/14
to the second quarter of FY 2015/16 ..................................................................................................................................52
Figure 3.18: Elgeyo Marakwet County, Expenditure by Economic Classification for first half of FY 2014/15
and first half of FY 2015/16 ...............................................................................................................................................54
Figure 3.19: Elgeyo Marakwet County, Operations and Maintenance Expenditure for the first half of FY 2015/16 ............................55
Figure 3.20: Elgeyo Marakwet County, Summary of Development Expenditure for the First Half of FY 2015/16 ..............................56
Figure 3.21: Embu County, Trend in Local Revenue Collection by Quarter from the FY 2013/14 to the second
quarter of FY 2015/16 ........................................................................................................................................................59
Figure 3.22: Embu County, Expenditure by Economic Classification for First Half of FY 2014/15 and First Half
of FY 2015/16 .....................................................................................................................................................................61
Figure 3.23: Embu County, Operations and Maintenance Expenditure for the first half of FY 2015/16 ...............................................62
Figure 3.24: Embu County, Summary of Development Expenditure for the first half of FY 2015/16 ...................................................62
Figure 3.25: Garissa County, Trend in Local Revenue Collection by Quarter from the FY 2013/14 to the
second quarter of FY 2015/16 ............................................................................................................................................65
Figure 3.26: Garissa County, Expenditure by Economic Classification for First Half of FY 2014/15 and

COUNTY GOVERNMENTS BUDGET IMPLEMENTATION REVIEW REPORT FIRST HALF FY, 2015/16vi
FY 2015/16 .........................................................................................................................................................................67
Figure 3.27: Garissa County, Operations and Maintenance Expenditure for the First Half of FY 2015/16 ........................................68
Figure 3.28: Garissa County, Summary of Development Expenditure for the first half of FY 2015/16 ................................................68
Figure 3.29: Homa Bay County, Trend in Local Revenue Collection by Quarter from the FY 2013/14 to the
second quarter of FY 2015/16 ............................................................................................................................................71
Figure 3.30: Homa Bay County, Expenditure by Economic Classification for First Half of FY 2014/15 and
First Half of FY 2015/16 ....................................................................................................................................................73
Figure 3.31: Homa Bay County, Operations and Maintenance Expenditure for the first half of FY 2015/16 .......................................74
Figure 3.32: Homa Bay County, Summary of Development Expenditure for the First Half of FY 2015/16 .........................................74
Figure 3.33: Isiolo County, Trend in Local Revenue Collection by Quarter from the FY 2013/14 to the
second quarter of FY 2015/16 ............................................................................................................................................77
Figure 3.34 Isiolo County, Expenditure by Economic Classification for First Half of FY 2014/15 and
First Half of FY 2015/16 ....................................................................................................................................................79
Figure 3.35: Isiolo County, Operations and Maintenance Expenditure for the First Half of FY 2015/16...........................................80
Figure 3.36: Isiolo County, Summary of Development Expenditure for the First Half of FY 2015/16 .................................................81
Figure 3.37: Kajiado County, Trend in Local Revenue Collection by Quarter from the FY 2013/14 to the
second quarter of FY 2015/16 ............................................................................................................................................84
Figure 3.38: Kajiado County, Expenditure by Economic Classification for First Half of FY 2014/15 and for
First Half of FY 2015/16 ....................................................................................................................................................86
Figure 3.39: Kajiado County, Operations and Maintenance Expenditure for the First Half of FY 2015/16 .......................................87
Figure 3.40: Kajiado County, Summary of Development Expenditure for the First Half of FY 2015/16..............................................87
Figure 3.41: Kakamega County, Trend in Local Revenue Collection by Quarter from the FY 2013/14 to the second ............................ quarter of FY 2015/16 ........................................................................................................................................................91
Figure 3.42: Kakamega County, Expenditure by Economic Classification for First Half of FY 2014/15 and
First Half of FY 2015/16 ....................................................................................................................................................92
Figure 3.43: Kakamega County, Operations and Maintenance Expenditure for the First Half of FY 2015/16 ......................................93
Figure 3.44: Kakamega County, Summary of Development Expenditure for the First Half of FY 2015/16 .........................................94
Figure 3.45: Kericho County, Trend in Local Revenue Collection by Quarters from the FY 2013/14 to the
second quarter of FY 2015/16 .......................................................................................................................................97
Figure 3.46: Kericho County, Expenditure by Economic Classification for first half of FY 2014/15 and
First Half of FY 2015/16 ....................................................................................................................................................99
Figure 3.47: Kericho County, Operations and Maintenance Expenditure for the first half of FY 2015/16 ..........................................100
Figure 3.48: Kericho County, Summary of Development Expenditure for the first half of FY 2015/16 .............................................100
Figure 3.49: Kiambu County, Trend in Local Revenue Collection by Quarter from the FY 2013/14 to the
second quarter of FY 2015/16 ..........................................................................................................................................104
Figure 3.50: Kiambu County, Expenditure by Economic Classification for First Half of FY 2014/15 and
First Half of FY 2015/16 ..................................................................................................................................................106
Figure 3.51: Kiambu County, Operations and Maintenance Expenditure for the First Half of FY 2015/16 ........................................106
Figure 3.52: Kiambu County, Summary of Development Expenditure for the First Half of FY 2015/16 ...........................................107
Figure 3.53: Kilifi County, Trend in Local Revenue Collection by Quarter from the first quarter of
FY 2013/14 to the second half of FY 2015/16 ................................................................................................................. 110
Figure 3.54: Kilifi County, Expenditure by Economic Classification for First Half of FY 2014/15 and

COUNTY GOVERNMENTS BUDGET IMPLEMENTATION REVIEW REPORT FIRST HALF FY, 2015/16 vii
First Half of FY 2015/16 .................................................................................................................................................. 112
Figure 3.55: Kilifi County, Operations and Maintenance Expenditure for the First Half of FY 2015/16 ............................................ 113
Figure 3.56: Kilifi County, Summary of Development Expenditure for the First Half of FY 2015/16 ................................................ 114
Figure 3.57: Kirinyaga County, Trend in Local Revenue Collection by Quarter from the FY 2013/14 to
the second quarter of FY 2015/16 .................................................................................................................................... 117
Figure 3.58: Kirinyaga County, Expenditure by Economic Classification for First Half of FY 2014/15 and
First Half of FY 2015/16 .................................................................................................................................................. 119
Figure 3.59: Kirinyaga County, Operations and Maintenance Expenditure for the First Half of FY 2015/16 ..................................120
Figure 3.60: Kirinyaga County, Summary of Development Expenditure for the First Half of FY 2015/16 ........................................120
Figure 3.61: Kisii County, Trend in Local Revenue Collection by Quarter from the FY 2013/14 to the
second quarter of FY 2015/16 ..........................................................................................................................................124
Figure 3.62: Kisii County, Expenditure by Economic Classification for First Half of FY 2014/15 and
First Half of FY 2015/16 ..................................................................................................................................................126
Figure 3.63: Kisii County, Operations and Maintenance Expenditure for the First Half of FY 2015/16 .............................................127
Figure 3.64: Kisii County, Summary of Development Expenditure for the First Half of FY 2015/16 ................................................127
Figure 3.65: Kisumu County, Trend in Local Revenue Collection by Quarter from the first quarter of
FY 2013/14 to the second quarter of FY 2015/16 ............................................................................................................131
Figure 3.66: Kisumu County, Expenditure by Economic Classification for First Half of FY 2014/15 and
First Half of FY 2015/16 ..................................................................................................................................................133
Figure 3.67: Kisumu County, Operations and Maintenance Expenditure for the hirst half of FY 2015/16 .........................................134
Figure 3.68: Kisumu County, Summary of Development Expenditure for the First Half of FY 2015/16............................................134
Figure 3.69: Kitui County, Trend in Local Revenue Collection by Quarter from the first quarter of
FY 2013/14 to the second quarter of FY 2015/16 ............................................................................................................138
Figure 3.70: Kitui County, Expenditure by Economic Classification for First Half of FY 2014/15 and
First Half of FY 2015/16 ..................................................................................................................................................140
Figure 3.71: Kitui County, Operations and Maintenance Expenditure for the First Half of FY 2015/16 ............................................141
Figure 3.72: Kitui County, Summary of Development Expenditure for the First Half of FY 2015/16 ................................................141
Figure 3.73: Kwale County, Trend in Local Revenue Collection by Quarter from the FY 2013/14 to the
second quarter of FY 2015/16 ..........................................................................................................................................145
Figure 3.74: Kwale County, Expenditure by Economic Classification for First Half of FY 2014/15 and
First Half of FY 2015/16 ..................................................................................................................................................146
Figure 3.75: Kwale County, Operations and Maintenance Expenditure for the First Half of FY 2015/16 .......................................147
Figure 3.76: Kwale County, Summary of Development Expenditure for the first half of FY 2015/16 ................................................148
Figure 3.77: Laikipia County, Trend in Local Revenue Collection by Quarter from the FY 2013/14 to the
second quarter of FY 2015/16 ..........................................................................................................................................151
Figure 3.78: Laikipia County, Expenditure by Economic Classification for First Half of FY 2014/15 and
First Half of FY 2015/16 ..................................................................................................................................................153
Figure 3.79: Laikipia County, Operations and Maintenance Expenditure for the First Half of FY 2015/16 ....................................154
Figure 3.80: Laikipia County, Summary of Development Expenditure for the First Half of FY 2015/16 ...........................................155
Figure 3.81: Lamu County, Trend in Local Revenue Collection by Quarter from the FY 2013/14 to the
second quarter of FY 2015/16 ..........................................................................................................................................158
Figure 3.82: Lamu County, Expenditure by Economic Classification for First Half of FY 2014/15 and

COUNTY GOVERNMENTS BUDGET IMPLEMENTATION REVIEW REPORT FIRST HALF FY, 2015/16viii
First Half of FY 2015/16 ..................................................................................................................................................160
Figure 3.83: Lamu County, Operations and Maintenance Expenditure for the First Half of FY 2015/16 ........................................161
Figure 3.84: Lamu County, Summary of Development Expenditure for the First Half of FY 2015/16 ...............................................161
Figure 3.85: Machakos County, Trend in Local Revenue Collection by Quarter from FY 2013/14 to the
second quarter of FY 2015/16. .........................................................................................................................................165
Figure 3.86: Machakos County, Expenditure by Economic Classification for first half, FY 2014/15 and
FY 2015/16 .......................................................................................................................................................................167
Figure 3.87: Machakos County, Operations and Maintenance Expenditure for the first half, FY 2015/16..........................................167
Figure 3.88: Machakos County, Summary of Development Expenditure for the first half, FY 2015/16 .............................................168
Figure 3.89: Makueni County, Trend in Local Revenue Collection by Quarter from the FY 2013/14 to the
second quarter of FY 2015/16 ..........................................................................................................................................171
Figure 3.90: Makueni County, Expenditure by Economic Classification for first half of FY 2014/15 and for
first half of FY 2015/16 ....................................................................................................................................................173
Figure 3.91: Makueni County, Operations and Maintenance Expenditure for the First Half of FY 2015/16 ......................................174
Figure 3.92: Makueni County, Summary of Development Expenditure for the First Half of FY 2015/16 ..........................................174
Figure 3.93: Mandera County, Trend in Local Revenue Collection by Quarter from the FY 2013/14 to the
second quarter of FY 2015/16 ..........................................................................................................................................178
Figure 3.94: Mandera County, Expenditure by Economic Classification for First Half of FY 2014/15 and
First Half of FY 2015/16 ..................................................................................................................................................180
Figure 3.95: Mandera County, Operations and Maintenance Expenditure for the First Half of FY 2015/16 ...................................181
Figure 3.96: Mandera County, Summary of Development Expenditure for the first half of FY 2015/16 ............................................181
Figure 3.97: Marsabit County, Trend in Local Revenue Collection by Quarter from the FY 2013/14 to the
second quarter of FY 2015/16 ..........................................................................................................................................184
Figure 3.98: Marsabit County, Expenditure by Economic Classification for First Half of FY 2014/15 and
First Half of FY 2015/16 ..................................................................................................................................................186
Figure 3.99: Marsabit County, Operations and Maintenance Expenditure for the First Half of FY 2015/16 ...................................187
Figure 3.100: Marsabit County, Summary of Development Expenditure for the First Half of FY 2015/16 ..........................................187
Figure 3.101: Meru County, Trend in Local Revenue Collection by Quarter from the FY 2013/14 to the
second quarter of FY 2015/16 ..........................................................................................................................................190
Figure 3.102: Meru County, Expenditure by Economic Classification for First Half of FY 2014/15 and
First Half of FY 2015/16 ..................................................................................................................................................192
Figure 3.103: Meru County, Operations and Maintenance Expenditure for the First Half of FY 2015/16 ............................................193
Figure 3.104: Meru County, Summary of Development Expenditure for the First Half of FY 2015/16................................................193
Figure 3.105: Migori County, Trend in Local Revenue Collection by Quarter from the FY 2013/14 to the
second quarter of FY 2015/16 ..........................................................................................................................................196
Figure 3.106: Migori County, Expenditure by Economic Classification for First Half of FY 2014/15 and
First Half of FY 2015/16 ..................................................................................................................................................198
Figure 3.107: Migori County, Operations and Maintenance Expenditure for the First Half of FY 2015/16..........................................199
Figure 3.108: Migori County, Summary of Development Expenditure for the First Half of FY 2015/16 .............................................200
Figure 3.109: Mombasa County, Trend in Local Revenue Collection by Quarter from the FY 2013/14 to the
second quarter of FY 2015/16 ..........................................................................................................................................203
Figure 3.110: Mombasa County, Expenditure by Economic Classification for First Half of FY 2014/15 and for

COUNTY GOVERNMENTS BUDGET IMPLEMENTATION REVIEW REPORT FIRST HALF FY, 2015/16 ix
First Half of FY 2015/16 ..................................................................................................................................................205
Figure 3.111: Mombasa County, Operations and Maintenance Expenditure for the first half of FY 2015/16 .......................................206
Figure 3.112: Mombasa County, Summary of Development Expenditure for the first half of FY 2015/16 ..........................................206
Figure 3.113: Murang’a County, Trend in Local Revenue Collection by Quarter from the FY2013/14 to the
second quarter of FY 2015/16 ..........................................................................................................................................210
Figure 3.114: Murang’a County, Expenditure by Economic Classification for First Half of FY 2014/15 and for
First Half of FY 2015/16 ..................................................................................................................................................212
Figure 3.115: Murang’a County, Operations and Maintenance Expenditure for the first half of FY 2015/16 .......................................213
Figure 3.116: Murang’a County, Summary of Development Expenditure for the first half of FY 2015/16 ..........................................214
Figure 3.117: Nairobi County, Trend in Local Revenue collection by Quarter from FY 2013/14 to first quarter,
FY 2015/16 .......................................................................................................................................................................217
Figure 3.118: Nairobi City County, Expenditure by Economic Classification for FY 2014/15 and 1st Quarter,
FY 2015/16. ......................................................................................................................................................................219
Figure 3.119: Nairobi City County, Operations and Maintenance Expenditure for the first half of FY 2015/16...................................220
Figure 3.120: Nairobi City County, Summary of Development Expenditure for the First Half of FY 2015/16 ....................................220
Figure 3.121: Nakuru County, Trend in Local Revenue Collection by Quarter from the FY 2013/14 to the
second quarter of FY 2015/16 ..........................................................................................................................................223
Figure 3.122: Nakuru County, Expenditure by Economic Classification for the First Half of FY 2014/15 and the
First Half of FY 2015/16 ..................................................................................................................................................225
Figure 3.123: Nakuru County, Operations and Maintenance Expenditure for the first half of FY 2015/16 ...........................................226
Figure 3.124: Nakuru County, Summary of Development Expenditure for the first half of FY 2015/16 ..............................................226
Figure 3.125: Nandi County, Trend in Local Revenue Collection by Quarter from the FY 2013/14 to the
second quarter of FY 2015/16 ..........................................................................................................................................230
Figure 3.126: Nandi County, Expenditure by Economic Classification for first half of FY 2014/15 and
first half of FY 2015/16 ....................................................................................................................................................231
Figure 3.127: Nandi County, Operations and Maintenance Expenditure for the first half of FY 2015/16 .............................................232
Figure 3.128: Nandi County, Summary of Development Expenditure for the First Half of FY 2015/16 ..............................................233
Figure 3.129: Narok County, Trend in Local Revenue Collection by Quarter from the FY 2013/14 to the
second quarter of FY 2015/16 ..........................................................................................................................................236
Figure 3.130: Narok County, Expenditure by Economic Classification for first half of FY 2014/15 and
FY 2015/16 .......................................................................................................................................................................238
Figure 3.131: Narok County, Major Operations and Maintenance Expenditure for the first half of FY 2015/16 ..................................239
Figure 3.132: Narok County, Summary of Development Expenditure for the first half of FY 2015/16 ................................................240
Figure 3.133: Nyamira County, Trend in Local Revenue Collection by Quarter from the FY 2013/14 to the
second quarter of FY 2015/16 ..........................................................................................................................................243
Figure 3.134: Nyamira County, Expenditure by Economic Classification for First Half of FY 2014/15 and for
First Half of FY 2015/16 ..................................................................................................................................................245
Figure 3.135: Nyamira County, Operations and Maintenance Expenditure for the First Half of FY 2015/16 ....................................246
Figure 3.136: Nyamira County, Summary of Development Expenditure for the First Half of FY 2015/16 ..........................................246
Figure 3.137: Nyandarua County, Trend in Local Revenue collection by Quarter since FY 2013/14 to
first half of FY 2015/16 .................................................................................................................................................250
Figure 3.138: Nyandarua County, Expenditure by Economic Classification for the first half of FY 2014/15 and

COUNTY GOVERNMENTS BUDGET IMPLEMENTATION REVIEW REPORT FIRST HALF FY, 2015/16x
first half of FY 2015/16 ..................................................................................................................................................251
Figure 3.139: Nyandarua County, Operations and Maintenance Expenditure for the First Half of FY 2015/16 ...................................252
Figure 3.140: Nyandarua County, Analysis of Development Expenditure for the first half of FY 2015/16 ..........................................253
Figure 3.141: Nyeri County, Trend in Local Revenue Collection by Quarter from the FY 2013/14 to the
second quarter of FY 2015/16 ..........................................................................................................................................256
Figure 3.142: Nyeri County, Expenditure by Economic Classification for First Half of FY 2014/15 and
First Half of FY 2015/16 ..................................................................................................................................................258
Figure 3.143: Nyeri County, Operations and Maintenance Expenditure for the First Half of FY 2015/16............................................259
Figure 3.144: Nyeri County, Summary of Development Expenditure for the First Half of FY 2015/16 ...............................................259
Figure 3.145: Samburu County, Trend in Local Revenue Collection by Quarter from the FY 2013/14 to the
second quarter of FY 2015/16 ..........................................................................................................................................262
Figure 3.146: Samburu County, Expenditure by Economic Classification for First Half of FY 2014/15 and
First Half of FY 2015/16 ..................................................................................................................................................264
Figure 3.147: Samburu County, Operations and Maintenance Expenditure for the First Half of FY 2015/16 ......................................265
Figure 3.148: Samburu County, Summary of Development Expenditure for the First Half of FY 2015/16 ..........................................266
Figure 3.149: Siaya County, Trend in Local Revenue Collection by Quarter from the FY 2013/14 to the
second quarter of FY 2015/16 ..........................................................................................................................................269
Figure 3.150: Siaya County, Expenditure by Economic Classification for First Half of FY 2014/15 and
First Half of FY 2015/16 ..................................................................................................................................................271
Figure 3.151: Siaya County, Operations and Maintenance Expenditure for the First Half of FY 2015/16 ............................................272
Figure 3.152: Siaya County, Summary of Development Expenditure for the First Half of FY 2015/16 ...............................................272
Figure 3.153: Taita Taveta County, Trend in Local Revenue Collection by Quarter from the first quarter of
FY 2013/14 to the second quarter of FY 2015/16 ............................................................................................................275
Figure 3.154: Taita Taveta County, Expenditure by Economic Classification for First Half of FY 2014/15
and First Half of FY 2015/16 ...........................................................................................................................................277
Figure 3.155: Taita Taveta County, Operations and Maintenance Expenditure for the First Half of FY 2015/16 .................................278
Figure 3.156: Tana River County, Trend in Local Revenue Collection by Quarter from the FY 2013/14 to
the second quarter of FY 2015/16 ....................................................................................................................................281
Figure 3.157: Tana River County, Expenditure by Economic Classification for First Half of FY 2014/15 and
First Half of FY 2015/16 ..................................................................................................................................................283
Figure 3.158: Tana River County, Operations and Maintenance Expenditure for the First Half of FY 2015/16 ...................................284
Figure 3.159: Tana River County, Summary of Development Expenditure for the First Half of FY 2015/16 .......................................284
Figure 3.160: Tharaka Nithi County, Trend in Local Revenue Collection by Quarter from the FY 2013/14 to
the second quarter of FY 2015/16 ....................................................................................................................................287
Figure 3.161: Tharaka Nithi County, Expenditure by Economic Classification for First Half of FY 2014/15 and
First Half of FY 2015/16 ..................................................................................................................................................289
Figure 3.162: Tharaka Nithi County, Operations and Maintenance Expenditure for the first-half of FY 2015/16 ................................290
Figure 3.163: Tharaka Nithi County, Summary of Development Expenditure for the First Half of FY 2015/16 ..................................291
Figure 3.164: Trans Nzoia County, Trend in Local Revenue Collection by Quarter from the FY 2013/14 to the
second quarter of FY 2015/16 ..........................................................................................................................................294
Figure 3.165: Trans Nzoia County, Expenditure by Economic Classification for First Half of FY 2014/15 and
First Half of FY 2015/16 ..................................................................................................................................................296

COUNTY GOVERNMENTS BUDGET IMPLEMENTATION REVIEW REPORT FIRST HALF FY, 2015/16 xi
Figure 3.166: Trans Nzoia County, Operations and Maintenance Expenditure for the First Half of FY 2015/16 ..............................297
Figure 3.167: Trans Nzoia County, Summary of Development Expenditure for the First Half of FY 2015/16 .....................................297
Figure 3.168: Turkana County, Trend in Local Revenue Collection by Quarter from the FY 2013/14 to the
second quarter of FY 2015/16 ..........................................................................................................................................300
Figure 3.169: Turkana County, Expenditure by Economic Classification for First Half of FY 2014/15 and
FY 2015/16 .......................................................................................................................................................................302
Figure 3.170: Turkana County, Operations and Maintenance Expenditure for the First Half of FY 2015/16 .......................................303
Figure 3.171: Turkana County, Summary of Development Expenditure for the First Half of FY 2015/16 ...........................................304
Figure 3.172: Uasin Gishu County, Trend in Local Revenue Collection by Quarter from the FY 2013/14 to
the second quarter of FY 2015/16 ....................................................................................................................................307
Figure 3.173: Uasin Gishu County, Expenditure by Economic Classification for First Half of FY 2014/15 and
First Half of FY 2015/16 ..................................................................................................................................................309
Figure 3.174: Uasin Gishu County, Operations and Maintenance Expenditure for the First Half of FY 2015/16 ..............................310
Figure 3.175: Uasin Gishu County, Summary of Development Expenditure for the First Half of FY 2015/16 ....................................310
Figure 3.176: Vihiga County, Trend in Local Revenue collection by Quarter from FY 2013/14 to the second
Quarter, FY 2015/16 .........................................................................................................................................................314
Figure 3.177: Vihiga County, Expenditure by Economic Classification for the First Half of FY 2014/15 and
for the First Half of FY 2015/16 .......................................................................................................................................316
Figure 3.178: Vihiga County, Operations and Maintenance Expenditure for the First Half of FY 2015/16 ..........................................317
Figure 3.179: VihigaCounty, FY 2015/16 Development Expenditure for the first half, FY 2015/16 .....................................................317
Figure 3.180: Wajir County, Trend in Local Revenue Collection by Quarter from FY 2013/14 to the second
quarter of FY 2015/16 ......................................................................................................................................................320
Figure 3.181: Wajir County, Expenditure by Economic Classification for First Half of FY 2014/15 and
First Half of FY 2015/16 ..................................................................................................................................................322
Figure 3.182: Wajir County, Operations and Maintenance Expenditure for the First Half of FY 2015/16 ............................................323
Figure 3.183: Wajir County, Summary of Development Expenditure for the first half of FY 2015/16 .................................................324
Figure 3.184: West Pokot County, Trend in Local Revenue Collection by Quarter from the FY 2013/14 to
the second quarter of FY 2015/16 ....................................................................................................................................327
Figure 3.185: West Pokot County, Expenditure by Economic Classification for First Half of FY 2014/15
and FY 2015/16 ................................................................................................................................................................329
Figure 3.186: West Pokot County, Operations and Maintenance Expenditure for the first half of FY 2015/16 ....................................330
Figure 3.187: West Pokot County, Summary of Development Expenditure for the first half of FY 2015/16 ........................................330

COUNTY GOVERNMENTS BUDGET IMPLEMENTATION REVIEW REPORT FIRST HALF FY, 2015/16xii
LIST OF TABLES
Table 2.1: Monthly local revenue collection for the period July – December 2015 .............................................................................4
Table 2.2: Disbursement of equitable share of revenue raised nationally .............................................................................................6
Table 2.3: Transfer of conditional allocations in the first half of FY 2015/16 ......................................................................................8
Table 2.4: The exchequer issues to the County Assembly and the County Executive for the first half of FY 2015/16 ..................... 11
Table 2.5: Expenditure by Economic Classification for the first half of FY 2015/16 .........................................................................13
Table 2.6: County budget allocation, expenditure and absorption rate for the first Half of FY 2015/16 ............................................17
Table 2.7: Budget allocation and the expenditures for MCAs’ sitting allowances for the first half of
FY 2015/16 .........................................................................................................................................................................20
Table 2.8: Expenditures on domestic and foreign travels by the County Assembly and the County
Executive for the first Half of FY 2015/16 (Kshs.million) .................................................................................................22
Table 3.1: Baringo County analysis of revenue collection by stream for the first half of FY 2015/16 ...............................................26
Table 3.2: Baringo County, Annual Budget and First Half of FY 2015/16 Budget Performance by Department ..............................30
Table 3.3: Bomet County, Analysis of revenue collection by stream for the first half of FY 2015/16 ...............................................33
Table 3.4: Bomet County, Annual Budget and First Half of FY 2015/16 Budget Performance by Department ................................37
Table 3.5: Bungoma County Analysis of revenue collection by stream for the first half of FY 2015/16 ...........................................39
Table 3.6: Bungoma County, Annual Budget and First Half of FY 2015/16 Budget Performance by Department ...........................43
Table 3.7: Busia County, Analysis of revenue collection per stream for the first half of FY 2015/16 ................................................46
Table 3.8: Busia County, Annual Budget and First Half of FY 2015/16 Budget Performance by Department ..................................50
Table 3.9: Elgeyo Marakwet County, Analysis of Revenue collection by stream for the First Half of FY2015/16 ...........................53
Table 3.10: Elgeyo Marakwet County, Annual Budget and First Half of FY 2015/16 Budget Performance
by Department ....................................................................................................................................................................57
Table 3.11: Embu County, Analysis of revenue collection per stream for the first half of FY 2015/16 ...............................................60
Table 3.12: Embu County, Annual Budget and First Half of FY 2015/16 Budget Performance by Department .................................63
Table 3.13: Garissa County, Analysis of revenue collection by stream for the first half of FY 2015/16 ............................................66
Table 3.14: Garissa County, Annual Budget and First Half of FY 2015/16 Budget Performance by Department ...............................69
Table 3.15: Homa Bay County, Analysis of revenue collection by stream for the first half of FY 2015/16 .........................................72
Table 3.16: Homa Bay County, Annual Budget and First Half of FY 2015/16 Budget Performance by
Department .........................................................................................................................................................................75
Table 3.17: Isiolo County, Analysis of revenue collection by stream for the first half of FY 2015/16 .................................................78
Table 3.18: Isiolo County, Annual Budget and First Half of FY 2015/16 Budget Performance by Department ..................................81
Table 3.19: Kajiado County, Analysis of revenue collection by stream for the first half of FY 2015/16 .............................................84
Table 3.20: Kajiado County, Annual Budget and First Half of FY 2015/16 Budget Performance by Department ..............................88
Table 3.21: Kakamega County, Analysis of revenue collection by stream for the first half of FY 2015/16 .........................................91
Table 3.22: Kakamega County, Annual Budget and First Half of FY 2015/16 Budget Performance by
Department .........................................................................................................................................................................94
Table 3.23: Kericho County, Analysis of Revenue Collection by stream for the first half of FY 2015/16 ...........................................97
Table 3.24: Kericho County, Annual Budget and First Half of FY 2015/16 Budget performance by department .............................101
Table 3.25: Kiambu County, Analysis of revenue collection by stream for the first half of FY 2015/16 ...........................................104
Table 3.26: Kiambu County, Annual Budget and First Half of FY 2015/16 Budget Performance by Department ............................108

COUNTY GOVERNMENTS BUDGET IMPLEMENTATION REVIEW REPORT FIRST HALF FY, 2015/16 xiii
Table 3.27: Kilifi County, Analysis of revenue collection by stream for the first half of FY 2015/16................................................ 111
Table 3.28: Kilifi County, Annual Budget and First Half of FY 2015/16 Budget Performance by Department................................. 115
Table 3.29: Kirinyaga County, Analysis of revenue collection by stream for the first half of FY 2015/16 ........................................ 118
Table 3.30: Kirinyaga County, Annual Budget and First Half of FY 2015/16 Budget Performance by Department .........................121
Table 3.31: Kisii County, Analysis of revenue collection by stream for the first half of FY 2015/16 ................................................124
Table 3.32: Kisii County, Annual Budget and First Half of FY 2015/16 Budget Performance by Department .................................128
Table 3.33: Kisumu County, Analysis of revenue collection by stream for the first half of FY 2015/16 ...........................................131
Table 3.34: Kisumu County, Annual Budget and First Half of FY 2015/16 Budget Performance by Department ............................135
Table 3.35: Kitui County, Analysis of revenue collection by stream for the first half of FY 2015/16 ................................................138
Table 3.36: Kitui County, Annual Budget and First Half of FY 2015/16 Budget Performance by Department ...............................142
Table 3.37: Kwale County Local Revenue Performance for the First Half of FY 2015/16 ................................................................145
Table 3.38: Kwale County, Annual Budget and First Half of FY 2015/16 Budget Performance by Department...............................149
Table 3.39: Laikipia County, Analysis of revenue collection by stream for the first half of FY 2015/16 ...........................................152
Table 3.40: Laikipia County, Annual Budget and First Half of FYB 2015/16 Budget Performance by Department .........................155
Table 3.41: Lamu County, Analysis of revenue collection by stream for the first half of FY2015/16 ...............................................158
Table 3.42: Lamu County, Annual Budget and First Half of FY 2015/16 Budget Performance by Department ................................160
Table 3.43: Machakos County, Analysis of revenue collection by stream for the first half of FY 2015/16.......................................163
Table 3.44: Machakos County, FY 2015/16 Annual Budget and First Quarter, FY 2015/16 budget
performance by Department .............................................................................................................................................169
Table 3.45: Makueni County, Analysis of revenue collection by stream for the first half of FY 2015/16 ..........................................172
Table 3.46: Makueni County, Annual Budget and First Half of FY 2015/16 Budget Performance by Department ...........................178
Table 3.47: Mandera County, Analysis of revenue collection by stream for the first half of FY 2015/16 .........................................178
Table 3.48: Mandera County, Annual Budget and First Half of FY 2015/16 Budget Performance by Department ...........................182
Table 3.49: Marsabit County, Analysis of revenue collection by stream for the first half of FY 2015/16 ..........................................185
Table 3.50: Marsabit County, Annual Budget and First Half of FY 2015/16 Budget Performance by Department ...........................188
Table 3.51: Meru County, Analysis of revenue collection by stream for the first half of FY 2015/16 ...............................................191
Table 3.52: Meru County, Annual Budget and First Half of FY 2015/16 Budget Performance by Department ................................194
Table 3.53: Migori County, Analysis of revenue collection by stream for the first half of FY 2015/16 ............................................197
Table 3.54: Migori County, Annual Budget and First Half of FY 2015/16 Budget Performance by Department ..............................201
Table 3.55: Mombasa County, Analysis of revenue collection per stream for the first half of FY 2015/16 .......................................204
Table 3.56: Mombasa County, Annual Budget and First Half of FY 2015/16 Budget Performance by Department .........................207
Table 3.57: Muranga County, Analysis of revenue collection per stream for the first half of FY 2015/16 ........................................210
Table 3.58: Murang’a County, Annual Budget and First Half of FY 2015/16 Budget Performance by Department .........................215
Table 3.59: Nairobi City County, Analysis of revenue collection per stream for the first half of FY 2015/16 ...................................218
Table 3.60: Nairobi City County, Annual Budget and First Half of FY 2015/16 Budget Performance by
Department .......................................................................................................................................................................221
Table 3.61: Nakuru County, Analysis of revenue collection per stream for the first half of FY 2015/16 ...........................................224
Table 3.62: Nakuru County, Annual Budget and First Half of FY 2015/16 Budget Performance by Department .............................227
Table 3.63: Nandi County, Analysis of revenue collection per stream for the first half of FY 2015/16 .............................................230
Table 3.64: Nandi County, Annual Budget and First Half of FY 2015/16 Budget Performance by Department ...............................233
Table 3.65: Narok County, Analysis of revenue collection by stream for the first half of FY 2015/16 ..............................................239
Table 3.66: Narok County, Annual Budget and First Half of FY 2015/16 Budget Performance by Department ...............................240
COUNTY GOVERNMENTS BUDGET IMPLEMENTATION REVIEW REPORT FIRST HALF FY, 2015/16xiv
Table 3.67: Nyamira County, Analysis of revenue collection by stream for the first half of FY 2015/16 ..........................................244
Table 3.68: Nyamira County, Annual Budget and First Half of FY 2015/16 Budget Performance by Department ...........................247
Table 3.69: Nyandarua County, Analysis of revenue collection per stream for the first half of FY 2015/16 .....................................250
Table 3.70: Nyandarua County, FY 2015/16 Annual Budget and First Half of FY 2015/16 Budget
Performance by Department .............................................................................................................................................254
Table 3.71: Nyeri County, Analysis of revenue collection per stream for the first half of FY 2015/16 ..............................................257
Table 3.72: Nyeri County, Annual Budget and First Half of FY 2015/16 Budget Performance by Department ................................260
Table 3.73: Samburu County, Analysis of revenue collection by stream for the first half of FY 2015/16..........................................263
Table 3.74: Samburu County, Annual Budget and First Half of FY 2015/16 Budget Performance by Department...........................266
Table 3.75: Siaya County, Analysis of revenue collection per stream for the first half of FY 2015/16 ..............................................270
Table 3.76: Siaya County, Annual Budget and First Half of FY 2015/16 Budget Performance by Department ................................273
Table 3.77: Taita Taveta County, Analysis of revenue collection by stream for the first half of FY 2015/16.....................................276
Table 3.78: Taita Taveta County, Annual Budget and First Half of FY 2015/16 Budget Performance by
Department .......................................................................................................................................................................279
Table 3.79: Tana River County, Analysis of revenue collection by stream for the first half of FY 2015/16 ......................................281
Table 3.80: Tana River County, Annual Budget and First Half of FY 2015/16 Budget Performance by
Department .......................................................................................................................................................................285
Table 3.81: Tharaka Nithi County, Analysis of revenue collection per stream for the first half of FY 2015/16.................................288
Table 3.82: Tharaka Nithi County, Annual Budget and First Half of FY 2015/16 Budget Performance by
Department .......................................................................................................................................................................291
Table 3.83: Trans Nzoia County, Analysis of revenue collection per stream for the first half of FY 2015/16 ...................................294
Table 3.84: Trans Nzoia County, Annual Budget and First Half of FY 2015/16 Budget Performance by
Department .......................................................................................................................................................................298
Table 3.85: Turkana County, Analysis of revenue collection by stream for the first half of FY 2015/16 ...........................................301
Table 3.86: Turkana County, Annual Budget and First Half of FY 2015/16 Budget Performance by
Department .......................................................................................................................................................................304
Table 3.87: Uasin Gishu County, Analysis of revenue collection by stream for the first half of FY 2015/16 ....................................308
Table 3.88: Uasin Gishu County, Annual Budget and First Half of FY 2015/16 Budget Performance by
Department ....................................................................................................................................................................... 311
Table 3.89: Vihiga County, Analysis of revenue collection by stream for the first half of FY 2015/16 .............................................314
Table 3.90: Vihiga County, Annual Budget and First Half of FY 2015/16 Budget Performance by Department ..............................318
Table 3.91: Wajir County, Analysis of revenue collection per stream for the first half of FY 2015/16 ..............................................321
Table 3.92: Wajir County Annual Budget and First Half of FY 2015/16 Budget performance by Department .................................325
Table 3.93: West Pokot County, Analysis of revenue collection per stream for the first half of FY 2015/16 .....................................328
Table 3.94: West Pokot County, Annual Budget and First Half of FY 2015/16 Budget Performance by
Department .......................................................................................................................................................................331

COUNTY GOVERNMENTS BUDGET IMPLEMENTATION REVIEW REPORT FIRST HALF FY, 2015/16 xv
LIST OF ABBREVIATIONS/ACRONYMS
ADP Annual Development PlanBQ Bills of QuantitiesBROP Budget Review and Outlook PaperCA County AssemblyCE County ExecutiveCARPS Capacity Assessment and Rationalization of the Public ServiceCBEF County Budget and Economic ForumCBK Central Bank of KenyaCBROP County Budget Review and Outlook PaperCEC County Executive CommitteeCECM-F County Executive Committee Member for FinanceCFSP County Fiscal Strategy PaperCILOR Contribution In Lieu of RatesCOB Controller of BudgetCRA Commission on Revenue AllocationCRF County Revenue FundDANIDA Danish International Development AgencyE-G Electronic GovernanceFY Financial YearGoK Government of KenyaG-PAY Government Payment SystemHSSF Health Sector Services FundICT Information Communication TechnologyIFMIS Integrated Financial Management SystemKRB Kenya Roads BoardMCA Member of County AssemblyMTEF Medium Term Expenditure FrameworkM&E Monitoring and EvaluationO&M Operations and MaintenanceOCOB Office of the Controller of BudgetPE Personnel EmolumentsPFM Act Public Finance Management Act, 2012SMEs Small and Medium Enterprises

COUNTY GOVERNMENTS BUDGET IMPLEMENTATION REVIEW REPORT FIRST HALF FY, 2015/16xvi
EXECUTIVE SUMMARY
This report has been prepared in fulfillment of Article 228(6) of the Constitution of Kenya, 2010. It covers the July to December 2015 period, and presents budget implementation status for the 47 County Governments. County revenue is analyzed by stream and compared to target while expenditure performance is analyzed by the economic classification of personnel emoluments, operations and maintenance, and development expenditure. Expenditure is also compared to target and is further disaggregated by department. The report also highlights the key challenges that faced Counties in budget implementation and includes appropriate recommendations.
The FY 2015/16 aggregate approved Budget estimates for the County governments amounted to Kshs.362.76 billion and comprised of Kshs.200.57 billion (55.3 per cent) allocation for recurrent expenditure and Kshs.162.19 billion (44.7 per cent) for development expenditure. Allocation to development activities conforms to the public finance requirement that at least 30 per cent of budget be allocated for development programs.
In order to finance the FY 2015/16 budget, counties expect to receive Kshs.259.77 billion from the National Government as equitable share of revenue raised nationally, Kshs.3.60 billion as conditional allocation for Level 5 Hospitals, collect Kshs.56.65 billion from local sources, and utilize the cash balances carried forward from FY 2013/14 of Kshs.31.53 billion. Counties also expect to receive Kshs.844.71 million from the Government of Denmark through the Danish International Development Agency (DANIDA) as conditional allocation to the Health Sector, Kshs.4.30 billion as conditional allocation for free maternal healthcare, Kshs.4.50 billion as conditional allocation for leasing of medical equipment, Kshs.3.30 billion as conditional allocation from the road maintenance fuel levy fund, Kshs.900 million as conditional allocation for compensation for forgone user fees, and Kshs.9.32 billion as conditional allocation for other loans and grants.
During the first half of FY 2015/16, County Governments received Kshs.99.19 billion as equitable share of revenue from the National Government, Kshs.1.36 billion as conditional allocation for Level 5 Hospitals, Kshs.1.63 billion as conditional allocation for free maternal health care, Kshs.219.17 million as conditional allocation for compensation for forgone user fees, Kshs.1.67 billion from the Road Maintenance Fuel Levy Fund, Kshs.99.92 million from DANIDA as conditional allocation to supplement financing for county health facilities, and raised Kshs.13.92 billion from local sources. The local revenue was 24.6 per cent of the annual target of Kshs.56.65 billion and is an increase from Kshs.13.08 billion generated in a similar period of FY 2014/15.

COUNTY GOVERNMENTS BUDGET IMPLEMENTATION REVIEW REPORT FIRST HALF FY, 2015/16 xvii
Analysis of local revenue collection indicates that Nairobi City, Kiambu, Narok, and Nakuru Counties posted the highest absolute collections of Kshs.4.97 billion, Kshs.1.05 billion, Kshs.1.04 billion and Kshs.830.96 million respectively. Conversely, Wajir, Mandera, Nyamira, Lamu and Tana River Counties recorded the lowest local revenue of Kshs.41.93 million, Kshs.38.19 million, Kshs.26.33 million, Kshs.20.62 million and Kshs.10.93 million respectively.
During the reporting period, the Controller of Budget authorized withdrawal of Kshs.127.10 billion from the County Revenue Fund (CRF) accounts representing 35.0 per cent of the total approved Budgets for FY 2015/16. These withdrawals consisted of Kshs.89.44 billion (70.4 per cent) for recurrent activities and Kshs.37.66 billion (29.6 per cent) for development activities.
The Counties spent a total of Kshs.113.43 billion which was 89.2 per cent of the funds released for operations. This expenditure consisted of Kshs.81.08 billion for recurrent activities (71.5 per cent of the total expenditure) and Kshs.32.35 billion (28.5 per cent of the total expenditure) for development projects. The aggregate expenditure represented an absorption rate of 31.3 per cent of the annual Budget. Absorption rate is calculated as a percentage of actual expenditure to the annual Budget. Counties that recorded the highest aggregate absorption rates were Bomet, Homa Bay, Murang’a and Kericho at 47.4 per cent, 45.5 per cent, 42.3 per cent, and 40.7 per cent respectively. Those with the lowest rates were Makueni, Meru, Tana River, and Mandera Counties at 22.1 per cent, 20.9 per cent, 18.9 per cent, and 18.4 per cent respectively.
The combined development expenditure was Kshs.32.35 billion translating to an absorption rate of 19.9 per cent of the annual development budget, a decrease from 21.9 per cent recorded in the first half of FY 2014/15 when expenditure was Kshs.30.55 billion. Analysis of the development budget indicates that Bomet, Kericho and Murang’a County had the highest absorption rates of their respective development budgets at 51.2 per cent, 39.8 per cent and 38.3 per cent respectively. Those with the lowest absorption rate were Nyeri, Meru and Taita Taveta at 5.5 per cent, 1.4 per cent and 0.1 per cent respectively.
On recurrent expenditure, the counties spent a total of Kshs.81.08 billion, representing 40.4 per cent of the annual recurrent budget, which is similar to that recorded in first half of FY 2014/15 when aggregate expenditure was Kshs.73.15 billion. The Counties spent a total of Kshs.3.84 billion on debt repayment and pending bills, which is an increase from Kshs.1.72 billion incurred in a similar period of FY 2014/15 and represented 3.4 per cent of the aggregate expenditure.
County governments faced various challenges in budget execution during the first half of FY 2015/16. The challenges included: (i) borrowing from commercial banks without guarantee of

COUNTY GOVERNMENTS BUDGET IMPLEMENTATION REVIEW REPORT FIRST HALF FY, 2015/16xviii
the National Government or approval by the County Assembly, (ii) inadequate administration and reporting on County established Funds, (iii) underperformance in local revenue collection, (iv) use of locally generated revenue at source, and (iv) inadequate internal audit arrangements.
The OCOB recommends the following to address the identified challenges: (i) County Treasuries should ensure all borrowing in line with Article 212 of the Constitution and Section 58 of the PFM Act, 2012, (ii) Fund administrators to ensure the established County Funds are appropriately managed and quarterly reports are prepared in line with Section 168 of the PFM Act, 2012, (iii) County Treasuries should devise strategies to enhance the local revenue collection, (iv) All locally generated revenue should be deposited into the County Revenue Fund accounts maintained at the Central Bank of Kenya in line with Article 207 of the Constitution, and (v) County Treasuries should ensure compliance with Section 155 of the PFM Act, 2012 on establishment of internal audit units.

COUNTY GOVERNMENTS BUDGET IMPLEMENTATION REVIEW REPORT FIRST HALF FY, 2015/16 xix
KEY HIGHLIGHTS

COUNTY GOVERNMENTS BUDGET IMPLEMENTATION REVIEW REPORT FIRST HALF FY, 2015/16xx
RecurrentKshs.200.57 billion
(55.3 per cent)
DevelopmentKshs.162.19 billion (44.7 per cent)
FY 2015/16 County Governments' Budget estimates
Total Budget
Kshs.362.76 billion
(100 per cent)
0
10
20
30
40
50
60
70
Turk
ana
Man
dera
Kw
ale
Tana
Riv
erW
ajir
Kitu
iM
akue
niM
acha
kos
Kili
fiK
akam
ega
Nan
diM
uran
g'a
Mar
sabi
tN
yam
ira
Busia
Gar
issa
Tran
s Nzo
iaM
igor
iIs
iolo
Bom
etLa
ikip
iaN
arok
Lam
uK
irin
yaga
Bung
oma
Vih
iga
Thar
aka
-Nith
iBa
ring
oK
isii
Kisu
mu
Kaj
iado
Sam
buru
Siay
aM
eru
Nak
uru
Uas
in G
ishu
Mom
basa
Wes
t Pok
otH
oma
Bay
Nai
robi
City
Ker
icho
Nya
ndar
uaK
iam
buEm
buN
yeri
Elge
yo/M
arak
wet
Taita
/Tav
eta
%
County
FY 2015/16 County Governments' Development Budget Allocation as % of Total Budget
44.7 % Average
30 % PFM Act, 2012 required threshhold

COUNTY GOVERNMENTS BUDGET IMPLEMENTATION REVIEW REPORT FIRST HALF FY, 2015/16 xxi
Balance carried forward from FY 2014/15, Kshs.33.46 billion
Equitable share of revenue, Kshs.99.19 billion
Locally generated revenue, Kshs.13.92
billion
Conditional grants, Kshs.3.52 billion
Total revenue available in the first half of FY 2015/16
Total revenue Kshs.150.10
billion
Recurrent, Kshs.89.44 billion (70.4 per cent)
Development, Kshs.37.66 billion (29.6 per cent)
First half of FY 2015/16 Exchequer Issues
Total ExchequerIssues Kshs.127.10
billion (100 per cent)

COUNTY GOVERNMENTS BUDGET IMPLEMENTATION REVIEW REPORT FIRST HALF FY, 2015/16xxii
Personal emoluments, Kshs.56.33 billion, 49.7 %
Development activities, Kshs.29.58 billion, 26.1 %
Operations and Maintenance, Kshs.23.68 billion, 20.8 %
Debt repayment, Kshs.3.84 million, 3.4 %
First Half of FY 2015/16 Expenditure by Economic Classification
Total Expenditure:Kshs.113.37 billion
61.5
52.6
51.8
47.9
43.9
43.8
39.5
37.5
37.1
36.9
34.9
34.3
33.4
32.8
32.1
30.3
29.7
29.2
28.7
28.3
27.8
27.7
27.0
26.2
26.2
26.1
25.6
25.5
25.2
23.8
22.5
22.3
21.5
21.4
21.1
21.1
20.5
20.0
19.4
19.0
19.0
18.3
17.8
14.5
6.4
2.6
0.1
0
10
20
30
40
50
60
70
Kw
ale
Tur
kana
Waj
irB
omet
Mur
ang'
aK
itui
Man
dera
Mar
sabi
tM
igor
iW
est P
okot
Ker
icho
Uas
in G
ishu
Kak
ameg
aB
usia
Vih
iga
Kaj
iado
Sam
buru
Lam
uN
arok
Isio
loG
aris
saH
oma
Bay
Lai
kipi
aK
isii
Kia
mbu
Siay
aM
omba
saT
ana
Riv
erB
ungo
ma
Nya
mir
aK
ilifi
Bar
ingo
Nya
ndar
uaN
andi
Mac
hako
sK
isum
uT
hara
ka -N
ithi
Nai
robi
City
Nak
uru
Tra
ns N
zoia
Kir
inya
gaM
akue
niE
lgey
o/M
arak
wet
Em
buN
yeri
Mer
uT
aita
/Tav
eta
%
County
First Half of FY 2015/16 County Development Spending as % of total expenditure
28.0% Average
Total expenditure: Kshs.113.43 billion

COUNTY GOVERNMENTS BUDGET IMPLEMENTATION REVIEW REPORT FIRST HALF FY, 2015/16 1
1.0 INTRODUCTION
The Office of the Controller of Budget (OCOB) is an oversight institution established under Article 228 of the Constitution to oversee and report on implementation of the budgets of the National and County Governments. As part of its oversight mandate, the Controller of Budget (COB) is required to submit to each House of Parliament a report on budget implementation every four months. This is the eleventh County Budget Implementation Review Report by the OCOB prepared in fulfilment of Article 228 (6) of the Constitution.
The report provides a review of in-year budget execution by the County Governments for the first six months of Financial Year (FY) 2015/16. It presents information on the budget implementation status, which is useful to the Senate, County Assemblies and the public. The executive arm of county governments will also find this CBIRR useful in evaluating their achievements against targets made in the annual budgets as well as benchmarking performance with other counties. In addition, learning institutions and researchers on public finance will find information contained in this report very useful.
The rest of the report is organized as follows: Chapter two provides financial analysis of aggregated County Government budget implementation status for FY 2015/16. It reviews aggregate revenue and expenditure performance. Revenue performance is analysed by stream, namely; equitable shareable revenue, conditional grants from the National Government, conditional grants from development partners, and County Governments’ own local revenue collection against their annual targets. On the other hand, expenditure is disaggregated by development and recurrent expenditure. Economic classification of Personnel Emoluments (PE), and Operations and Maintenance (O&M) is further used to analyse recurrent expenditure. Chapter three presents overview of individual county revenue and expenditure performance and is compared with annual targets. The challenges that faced budget implementation in each county are identified and appropriate recommendations proposed. The cross-cutting challenges that affected budget implementation during the reporting period are presented in chapter four. The report also contains recommendations aimed at addressing the identified challenges. All recommendations are anchored on the Constitution of Kenya, the Public Finance Management Act 2012, and other relevant legislations. Chapter five provides the conclusion.
The information used in writing this report is derived from the Conditional Allocation of Revenue Act (CARA), 2015 disbursement schedule; the FY 2015/16 approved County Government budgets, expenditure returns submitted by the County Treasuries, and financial data from the Integrated Financial Management Information System (IFMIS).

COUNTY GOVERNMENTS BUDGET IMPLEMENTATION REVIEW REPORT FIRST HALF FY, 2015/162
2.0 FINANCIAL ANALYSIS OF COUNTY BUDGET IMPLEMENTATION IN FIRST HALF OF FY 2015/16
2.1 Introduction
This chapter presents the financial analysis of aggregated county budget implementation for the first half of FY 2015/16.
2.2 Revenue Analysis
In FY 2015/16, the combined county governments’ budget estimates approved by the County Assemblies amounted to Kshs.362.76 billion1. This comprised of Kshs.200.57 billion (55.3 per cent) for recurrent expenditure and Kshs.162.19 billion (44.7 per cent) for development expenditure.
In order to finance the budgets, county governments expect to receive transfers from the National Government and Conditional allocations from development partners amounting to Kshs.287.04 billion; generate revenue from local sources of Kshs.56.65 billion and utilize projected cash balances brought forward from FY 2014/15, which amounted to Kshs.31.53 billion. The total funds that were available to the County Governments in the first half of FY 2015/16 amounted to Kshs.150.10 billion. This amount consisted of Kshs.102.71 billion (68.4 per cent of the total available revenue) as transfers from the National Government and conditional allocations from development partners, Kshs.13.92 billion (9.3 per cent) as revenue raised from local sources, and Kshs.33.46 billion (22.3 per cent) as cash balance brought forward from the FY 2014/15.
2.2.1 Transfers from the National Government and Conditional allocations from Development Partners
According to the County Allocation of Revenue Act (CARA), 2015, transfers from the National Government are expected to amount to Kshs.276.37 billion by close of FY 2015/16 .This amount consists of Kshs.259.77 billion as equitable share of revenue raised nationally; Kshs.3.60 billion as conditional allocations for Level 5 Hospitals; Kshs.4.30 billion as conditional allocations for Free Maternal Health Care (upon confirmation that the County Government provided maternal health care services in their health facilities); Kshs.900 million as conditional allocations for compensation to the county health facilities for forgone user fees; Kshs.4.50 billion as conditional allocation for leasing of specialised medical equipment and Kshs.3.30 billion as conditional
1 Amount differs from the Kshs.361.12 billion published in the First Quarter of FY 2015/16 as a result of Supplementary budgets passed by some counties.

COUNTY GOVERNMENTS BUDGET IMPLEMENTATION REVIEW REPORT FIRST HALF FY, 2015/16 3
allocation from the Road Maintenance Fuel Levy Fund.
On the other hand, the conditional allocations from Development Partners in FY 2015/16 are expected to be Kshs.10.67 billion, consisting of Kshs.508.25 million from the World Bank to supplement financing of county health facilities; a grant of Kshs.844.71 million from DANIDA to supplement financing for county health facilities, and Kshs.9.32 billion as conditional allocation from other loans and grants.
2.2.2 Locally Collected Revenue
The aggregate annual local revenue target for the counties in FY 2015/16 is Kshs.56.65 billion. During the reporting period, county governments generated a total of Kshs.13.92 billion, which was 24.6 per cent of the annual target. This achievement was an improvement as compared to Kshs.13.08 billion (21.0 per cent of the FY 2014/15 annual revenue target) generated in a similar period in FY 2014/15. The monthly local revenue collection during the first half of FY 2014/15 and the first half of FY 2015/16 is shown in figure 2.1.
Figure 2.1: Monthly Local Revenue for the First Half of FY 2014/15 and First Half of FY 2015/16 (Kshs.Billions)
2.182.24
2.10
2.262.15
2.42.34
2.25
2.392.32
1.96
2.66
1.801.902.002.102.202.302.402.502.602.70
July August September October November December
Ksh
s.b
illi
on
Reporting Period1st Half of FY 2014/15 1st Half of FY 2015/16
Source: County Treasuries
The monthly local revenue collection for the period July-December 2015 is shown in table 2.1

COUNTY GOVERNMENTS BUDGET IMPLEMENTATION REVIEW REPORT FIRST HALF FY, 2015/164
Table 2.1: Monthly local revenue collection for the period July – December 2015
First half of FY 2015/16 locally generated revenue (in Kshs.million)Local revenue
target for FY 2015/16
(Kshs.mi-llion)
% of total revenue to the annual reve-nue targets
County Jul Aug Sept Oct Nov Dec
Total local revenue for the half year of FY
2015/16
Column A Column B
Column C
Column D
Column E Column F
Column G
Column I
Column J = * 100
Baringo 26.66 30.93 19.74 19.6 16.08 16.68 129.68 300.00 43.2
Bomet 8.95 6.41 11.59 17.47 6.87 6.06 57.34 230.33 24.9
Bungoma 40.47 29.11 33.04 32.59 24.94 24.17 184.32 819.94 22.5
Busia 29.63 52.64 26.53 25.26 21.77 20.97 176.81 543.04 32.6
Elgeyo/Marak-wet 9.54 7.44 7.22 6.95 5.84 6.93 43.92 149.98 29.3
Embu 29.13 32.42 26.15 22.88 23.19 25.62 159.38 630.76 25.3
Garissa 7.29 11.52 5.95 6.84 6.92 7.08 45.6 500.00 9.1
Homa Bay 14.89 12.87 15.72 13.81 13.96 12.13 83.38 181.73 45.9
Isiolo 11.53 11.64 12.29 10.29 6.69 4.26 56.69 360.00 15.7
Kajiado 50.04 62.88 46.29 43.22 44.8 43.52 290.75 1,134.88 25.6
Kakamega 42.6 29.16 38.44 38.69 33.97 34.65 217.5 1,000.00 21.7
Kericho 20.1 12.89 10.74 40.39 16.21 14.96 115.29 553.40 20.8
Kiambu 180.22 147.25 163.91 175.88 121.74 264.72 1,053.72 3,683.08 28.6
Kilifi 27.2 23.06 23.13 32.69 37.06 25.84 168.99 1,499.01 11.3
Kirinyaga 31.17 20.43 13.45 18.28 20.59 14.15 118.07 500.00 23.6
Kisii 25.39 12.93 19.47 14.98 20.52 11.57 104.86 700.00 15
Kisumu 60.45 83.18 61.06 58.76 58.63 84.15 406.23 1,868.59 21.7
Kitui 35.86 25.77 33.22 23.25 14.44 22.5 155.03 608.2 25.5
Kwale 14.59 10.04 16.02 17.57 18.29 13.48 89.98 300.00 30
Laikipia 41.31 26.38 69.08 36.85 24.18 33.22 231.02 500.00 46.2
Lamu 2.86 2.55 2.28 3.14 5.78 4.01 20.62 107.00 19.3
Machakos 69.19 61.73 70.77 64.88 55.91 75.80 398.28 2,371.63 16.8
Makueni 17.89 11.56 10.85 17.01 15.47 14.48 87.26 400.00 21.8
Mandera 4 4.92 9.54 8.52 6.04 5.18 38.19 199.24 19.2
Marsabit 11.28 7.75 7.42 9.36 9.54 8.68 54.02 130.00 41.6
Meru 43.72 42.19 29.25 35.47 26.55 30.77 207.95 997.93 20.8
Migori 37.25 23.87 25.76 24.37 22.23 18.09 151.56 400.00 37.9
Mombasa 138.89 121.87 123.41 115.7 122.06 115.34 737.27 5,181.67 14.2
Murang’a 40.3 32.24 37.19 41.14 30.19 39.11 220.17 850.00 25.9
Nairobi City 662.47 660.16 905.38 760.85 770.36 1,206.56 4,965.78 17,528.00 28.3
Nakuru 206.42 115.01 114.75 130.83 110.39 153.56 830.96 2,911.15 28.5
Nandi 18.09 17.91 11.6 23.32 29.04 11.06 111.03 255.76 43.4
Narok 115.64 303.48 198.08 228.15 56.26 134.12 1,035.73 3,507.10 29.5
Nyamira 6.23 5.93 5.02 3.55 3.43 2.17 26.33 240.96 10.9
Nyandarua 21.43 14.06 13.64 14.58 11.51 12.43 87.64 235.55 37.2
Nyeri 47.96 54.05 39.9 26.17 29.32 28.1 225.5 1,488.36 15.2
Samburu 13.97 14.72 22.14 13.64 13.97 6.55 84.99 356.59 23.8
Siaya 9.38 11.47 8.32 7.94 7.66 7.65 52.42 343.31 15.3

COUNTY GOVERNMENTS BUDGET IMPLEMENTATION REVIEW REPORT FIRST HALF FY, 2015/16 5
First half of FY 2015/16 locally generated revenue (in Kshs.million)Local revenue
target for FY 2015/16
(Kshs.mi-llion)
% of total revenue to the annual reve-nue targets
County Jul Aug Sept Oct Nov Dec
Total local revenue for the half year of FY
2015/16
Column A Column B
Column C
Column D
Column E Column F
Column G
Column I
Column J = * 100
Taita/
Taveta17.71 14.75 12.26 9.3 8.02 9.89 71.93 310.41 23.2
Tana River 1.88 0.32 1.19 3.73 0.92 2.9 10.93 120.00 9.1
Tharaka Nithi 22.15 6.42 8.11 12.32 6.06 4.50 59.57 248.05 24.0
Trans Nzoia 27.72 12.08 11.18 16.68 10.84 13.1 91.61 389.03 23.5
Turkana 2.76 3.88 3.56 15.6 18.59 6.08 50.47 200.00 25.2
Uasin Gishu 61.61 34.01 39.79 60.94 32.92 33.68 262.95 1,037.22 25.4
Vihiga 15.87 10.87 8.15 7.14 9.68 10.56 62.28 352.16 17.7
Wajir 8.01 7.28 7.03 6.11 8.29 5.21 41.93 200.00 21
West Pokot 8.27 7.01 6.37 7.71 6.12 11.75 47.23 227.31 20.8
Total 2,339.95 2,251.02 2,385.97 2,324.40 1,963.85 2,657.98 13,923.17 56,651.37 24.6
Source: County Treasuries
During the period under review, the Nairobi City County generated the highest amount of local revenue at Kshs.4.97 billion, followed by Kiambu County and Narok County at Kshs.1.05 billion and Kshs.1.04 billion respectively. The Counties that generated the lowest amount were Nyamira, Lamu and Tana River at Kshs.26.33 million, Kshs.20.62 million and Kshs.10.93 million respectively.
Analysis of local revenue as a proportion of the annual revenue target indicates that Laikipia County attained the highest proportion at 46.2 per cent followed by Homa Bay and Nandi Counties at 45.9 per cent and 43.4 per cent respectively. Conversely, counties that recorded the lowest proportion of local revenue against annual targets were Nyamira County at 10.9 per cent, Tana River County at 9.11 per cent and Garrisa County at 9.12 per cent, and
2.3 Funds Released to the Counties
2.3.1 Funds released to the counties from the Consolidated Fund
In the first half of FY 2015/16, the Controller of Budget (COB) approved transfers of Kshs.99.19 billion from the Consolidated Fund to the various County Revenue Funds (CRFs) in accordance with Article 206(4) of the Constitution. The transfers were as follows; Kshs.97.74 billion as equitable share of revenue raised nationally; Kshs.1.36 billion as conditional allocations from the National Government to Level 5 hospitals, and Kshs.99.92 million as conditional grant from DANIDA to supplement financing of county health facilities.
During the same period, the counties also received Kshs.1.63 billion as conditional allocations

COUNTY GOVERNMENTS BUDGET IMPLEMENTATION REVIEW REPORT FIRST HALF FY, 2015/166
for Free Maternal Health Care; Kshs.219.17 million as conditional allocations for forgone user fees and Kshs.1.67 billion as a conditional allocation from the Road Maintenance Fuel Levy Fund.
2.3.2 Equitable transfers from the National Government
In the first half of the FY 2015/16, the actual disbursement of the equitable revenue transfers amounted toKshs.97.74 billion, representing 74.5 per cent of the total disbursement of Kshs.131.19 billion scheduled to be transferred to the County Governments in the over the same period. The National Government has attributed low transfer of the equitable share for the period to underperformance in revenue collection by the National Government. Table 2.2 shows the expected equitable share disbursement to each county and the actual amount disbursed during the reporting period.
Table 2.2: Disbursement of equitable share of revenue raised nationally
County Expected disbursements of equitable share of revenue
raised nationally
Actual disbursements of equi-table share of revenue raised
nationally
% of actual disbursements to expected disbursements (%)
Column A Column B Column C = *100
Baringo 2,242,490,893 1,487,592,969 66.3
Bomet 2,376,981,115 2,376,981,115 100.0
Bungoma 3,876,242,116 2,508,411,533 64.7
Busia 2,747,325,212 2,375,062,377 86.4
Elgeyo /Marakwet 1,651,572,568 1,095,597,645 66.3
Embu 1,938,159,619 1,285,709,846 66.3
Garissa 2,914,703,151 1,933,515,952 66.3
Homa Bay 2,845,654,817 2,394,858,015 84.2
Isiolo 1,543,565,595 1,283,757,524 83.2
Kajiado 2,228,376,029 1,478,229,643 66.3
Kakamega 4,498,655,907 2,984,256,889 66.3
Kericho 2,275,057,339 1,914,652,216 84.2
Kiambu 3,769,088,603 3,172,005,260 84.2
Kilifi 3,757,814,406 2,492,807,577 66.3
Kirinyaga 1,786,799,901 1,185,302,905 66.3
Kisii 3,582,281,895 3,014,791,693 84.2
Kisumu 2,869,039,112 1,903,223,966 66.3
Kitui 3,669,972,897 2,434,536,476 66.3

COUNTY GOVERNMENTS BUDGET IMPLEMENTATION REVIEW REPORT FIRST HALF FY, 2015/16 7
County Expected disbursements of equitable share of revenue
raised nationally
Actual disbursements of equi-table share of revenue raised
nationally
% of actual disbursements to expected disbursements (%)
Column A Column B Column C = *100
Kwale 2,588,477,269 1,717,108,683 66.3
Laikipia 1,742,022,191 1,466,058,280 84.2
Lamu 1,036,201,292 687,381,055 66.3
Machakos 3,418,170,001 3,418,170,001 100.0
Makueni 3,014,684,047 1,999,839,911 66.3
Mandera 4,522,630,424 3,000,160,777 66.3
Marsabit 2,620,678,276 1,738,469,748 66.3
Meru 3,279,269,406 2,175,356,933 66.3
Migori 2,947,610,324 2,480,662,154 84.2
Mombasa 2,624,936,459 2,209,104,941 84.2
Murang’a 2,704,778,641 2,276,298,857 84.2
Nairobi 6,563,287,524 6,563,287,524 100.0
Nakuru 4,098,747,126 2,718,970,866 66.3
Nandi 2,401,328,463 1,592,960,465 66.3
Narok 2,670,390,075 2,247,357,984 84.2
Nyamira 2,098,041,700 1,391,770,238 66.3
Nyandarua 2,175,070,770 1,442,868,728 66.3
Nyeri 2,246,855,922 1,490,488,582 66.3
Samburu 1,793,902,379 1,190,014,449 66.3
Siaya 2,522,625,855 1,673,425,072 66.3
Taita Taveta 1,671,331,936 1,406,566,481 84.2
Tana River 2,012,207,835 1,334,830,941 66.3
Tharaka Nithi 1,584,471,167 1,333,465,834 84.2
Trans-Nzoia 2,575,304,414 1,708,370,255 66.3
Turkana 5,291,911,880 3,510,476,198 66.3
Uasin Gishu 2,621,394,384 1,738,944,789 66.3
Vihiga 1,955,063,040 1,645,350,083 84.2
Wajir 3,652,533,861 2,422,968,007 66.3
West Pokot 2,178,414,664 1,833,319,272 84.2
Total 131,186,122,498 97,735,340,709 74.5
Source: Office of the Controller of Budget
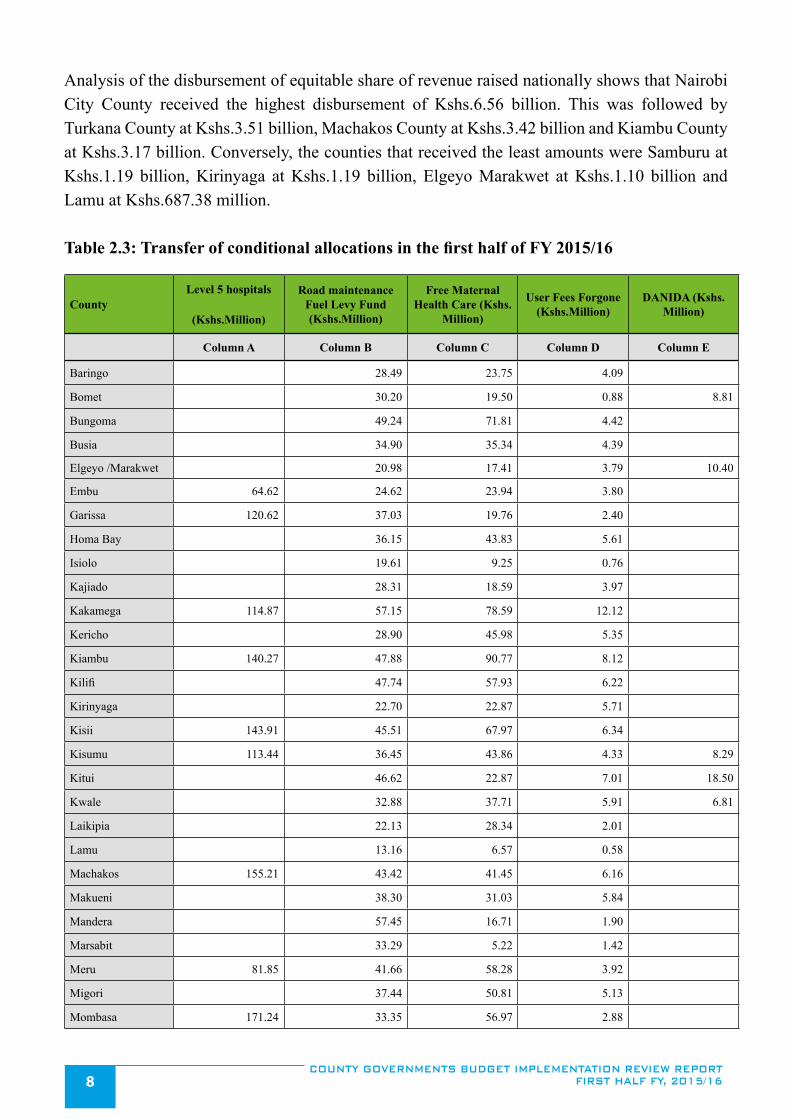
COUNTY GOVERNMENTS BUDGET IMPLEMENTATION REVIEW REPORT FIRST HALF FY, 2015/168
Analysis of the disbursement of equitable share of revenue raised nationally shows that Nairobi City County received the highest disbursement of Kshs.6.56 billion. This was followed by Turkana County at Kshs.3.51 billion, Machakos County at Kshs.3.42 billion and Kiambu County at Kshs.3.17 billion. Conversely, the counties that received the least amounts were Samburu at Kshs.1.19 billion, Kirinyaga at Kshs.1.19 billion, Elgeyo Marakwet at Kshs.1.10 billion and Lamu at Kshs.687.38 million.
Table 2.3: Transfer of conditional allocations in the first half of FY 2015/16
CountyLevel 5 hospitals
(Kshs.Million)
Road maintenance Fuel Levy Fund (Kshs.Million)
Free Maternal Health Care (Kshs.
Million)
User Fees Forgone (Kshs.Million)
DANIDA (Kshs.Million)
Column A Column B Column C Column D Column E
Baringo 28.49 23.75 4.09
Bomet 30.20 19.50 0.88 8.81
Bungoma 49.24 71.81 4.42
Busia 34.90 35.34 4.39
Elgeyo /Marakwet 20.98 17.41 3.79 10.40
Embu 64.62 24.62 23.94 3.80
Garissa 120.62 37.03 19.76 2.40
Homa Bay 36.15 43.83 5.61
Isiolo 19.61 9.25 0.76
Kajiado 28.31 18.59 3.97
Kakamega 114.87 57.15 78.59 12.12
Kericho 28.90 45.98 5.35
Kiambu 140.27 47.88 90.77 8.12
Kilifi 47.74 57.93 6.22
Kirinyaga 22.70 22.87 5.71
Kisii 143.91 45.51 67.97 6.34
Kisumu 113.44 36.45 43.86 4.33 8.29
Kitui 46.62 22.87 7.01 18.50
Kwale 32.88 37.71 5.91 6.81
Laikipia 22.13 28.34 2.01
Lamu 13.16 6.57 0.58
Machakos 155.21 43.42 41.45 6.16
Makueni 38.30 31.03 5.84
Mandera 57.45 16.71 1.90
Marsabit 33.29 5.22 1.42
Meru 81.85 41.66 58.28 3.92
Migori 37.44 50.81 5.13
Mombasa 171.24 33.35 56.97 2.88

COUNTY GOVERNMENTS BUDGET IMPLEMENTATION REVIEW REPORT FIRST HALF FY, 2015/16 9
CountyLevel 5 hospitals
(Kshs.Million)
Road maintenance Fuel Levy Fund (Kshs.Million)
Free Maternal Health Care (Kshs.
Million)
User Fees Forgone (Kshs.Million)
DANIDA (Kshs.Million)
Column A Column B Column C Column D Column E
Murang’a 34.36 32.75 8.21 12.41
Nairobi 83.38 140.52 6.75
Nakuru 126.36 52.07 93.54 9.34
Nandi 30.50 25.13 12.76 9.16
Narok 33.92 22.78 4.06
Nyamira 26.65 31.96 4.36
Nyandarua 27.63 14.98 5.12 9.32
Nyeri 123.49 28.54 37.00 6.36
Samburu 22.79 5.23 1.94 5.50
Siaya 32.05 42.64 5.67
Taita Taveta 21.23 16.81 2.01
Tana River 25.56 5.02 1.15 4.65
Tharaka Nithi 20.13 14.51 2.59
Trans-Nzoia 32.71 29.39 3.68
Turkana 67.22 8.61 1.58
Uasin Gishu 33.30 10.97 8.66
Vihiga 24.84 20.70 4.85
Wajir 46.40 14.24 2.55
West Pokot 27.67 18.26 2.47 6.09
Total 1,355.86 1,666.50 1,632.06 219.17 99.92
Source: OCOB; Ministry of Health; KRB
During the same period, the National Government through the Kenya Roads Board (KRB) transferred Kshs.1.67 billion as conditional allocation from the Road Maintenance Fuel Levy Fund. Further, the National Government through the Ministry of Health transferred Kshs.1.63 billion2 as conditional allocations for free maternal healthcare and Kshs.219.17 million as conditional allocations for compensation for forgone user fees by the county health facilities.
Further analysis shows that Mombasa County received the highest disbursement of the conditional grants to Level 5 Hospitals at Kshs.171.24 million, followed by Machakos County at 155.21 million and Kisii County at 143.91 million. Kisumu, Meru and Embu counties received the lowest disbursement at Kshs.113.44 million, Kshs.81.85 million and Kshs.64.62 million, respectively.
2 The conditional allocations for Free Maternal Health Care relates to FY 2014/15. The National Government is yet to disburse conditional allocations provided for in CARA, 2015.

COUNTY GOVERNMENTS BUDGET IMPLEMENTATION REVIEW REPORT FIRST HALF FY, 2015/1610
Analysis of the conditional allocation from the Road Maintenance Fuel Levy Fund indicated that, Nairobi City County received the highest disbursement at Kshs.83.38 million, followed by Turkana County at Kshs.67.22 million and Mandera County at Kshs.57.45 million. Tharaka Nithi, Isiolo and Lamu counties received the lowest disbursements at Kshs.20.13 million, Kshs.19.61 million and Kshs.13.16 million respectively.
2.3.3 Transfer of Conditional Allocations from Development Partners
A total of Kshs.99.92 million was transferred into the CRFs as DANIDA grant for eleven (11) Counties as shown in Table 2.3. These were the counties that had fulfilled the mutually agreed upon conditions, namely; use of IFMIS in disbursing funds to health facilities bank accounts, and full accounting of the previous DANIDA grant disbursed in FY 2014/15.
From the Counties that received funding from the DANIDA grant, Kitui County received the highest disbursement at Kshs.18.50 million followed by Murang’a County at Kshs.12.41 million and Elgeyo/Marakwet County at Kshs.10.40 million.
There were no disbursements of the World Bank and the conditional allocations from other loans and grants during the reporting period.
2.3.4 Funds Released to the County Operational Accounts
During the reporting period, the COB authorised withdrawals of Kshs.127.10 billion from the County Revenue Funds to County Operational Accounts of the County Governments. The transfers comprised of Kshs.89.44 billion (70.4 per cent of total funds released) for recurrent expenditure and Kshs.37.66 billion (29.6 per cent of total funds released) for development expenditure.
Out of Kshs.89.44 billion released for recurrent activities, Kshs.77.19 billion went to the County Executive while Kshs.12.62 billion was for the Legislative arm (County Assemblies). On the other hand, out of Kshs.37.66 billion released towards development expenditure, the County Executive and the County Assemblies received Kshs.36.76 billion and Kshs.898.63 million, respectively.
The exchequer issues to the County Assembly and the County Executive for the first half of FY 2015/16 are shown in table 2.4.

COUNTY GOVERNMENTS BUDGET IMPLEMENTATION REVIEW REPORT FIRST HALF FY, 2015/16 11
Table 2.4: The exchequer issues to the County Assembly and the County Executive for the first half of FY 2015/16
Exchequer Releases from CRFs to County Operations Accounts in the first Half of FY 2015/16 (Kshs. Million)
County County Assembly County Executive Combined Exchequer Issues
Rec Dev Total Rec Dev Total Rec Dev Total
Column
A
Column B
Column C=A+B
Column D
Column E
Column F=D+E
Column G=A+D
Column H=B+E
Column I=G+H
Baringo 269.75 14.00 283.75 1,527.92 633.42 2,161.34 1,797.67 647.42 2,445.10
Bomet 247.5 0.00 247.5 1,059.97 1,181.69 2,241.65 1,307.47 1,181.69 2,489.15
Bungoma 299.34 0.00 299.34 2,213.21 1,162.44 3,375.66 2,512.56 1,162.44 3,675.00
Busia 244.87 10.00 254.87 1,717.13 1,085.00 2,802.13 1,962.00 1,095.00 3,057.00
Elgeyo/Ma-rakwet 164.71 13.82 178.53 955.07 316.18 1,271.25 1,119.77 330.00 1,449.77
Embu 225.35 0.00 225.35 1,289.01 257.50 1,546.51 1,514.36 257.50 1,771.86
Garissa 240.00 0.00 240 1,353.00 606.00 1,959.00 1,593.00 606.00 2,199.00
Homa Bay 463.00 33.00 496 1,610.60 887.00 2,497.60 2,073.60 920.00 2,993.60
Isiolo 203.4 25.00 228.4 889.6 275.00 1,164.60 1,093.00 300.00 1,393.00
Kajiado 237.82 10.00 247.82 1,467.81 740.00 2,207.81 1,705.63 750.00 2,455.63
Kakamega 346.86 0.00 346.86 2,790.35 1,881.78 4,672.13 3,137.21 1,881.78 5,018.99
Kericho 242.5 0.00 242.5 1,339.83 832.83 2,172.66 1,582.33 832.83 2,415.16
Kiambu 262.82 0.00 262.82 3,301.50 889.05 4,190.55 3,564.33 889.05 4,453.37
Kilifi 360.00 70.00 430 2,227.08 1,366.15 3,593.23 2,587.08 1,436.15 4,023.23
Kirinyaga 226.16 0.00 226.16 1,115.24 550.60 1,665.84 1,341.40 550.60 1,892.00
Kisii 360.78 0.00 360.78 2,392.12 1,106.09 3,498.22 2,752.91 1,106.09 3,859.00
Kisumu 245.29 0.00 245.29 2,430.63 754.42 3,185.05 2,675.92 754.42 3,430.34
Kitui 260.66 0.00 260.66 1,883.48 1,209.36 3,092.84 2,144.14 1,209.36 3,353.50
Kwale 246.33 185.00 431.33 1,203.67 1,515.00 2,718.67 1,450.00 1,700.00 3,150.00
Laikipia 188.00 10.00 198 1,041.32 497.92 1,539.24 1,229.32 507.92 1,737.24
Lamu 192.07 0.00 192.07 580.53 336.50 917.03 772.60 336.50 1,109.10
Machakos 369.85 61.50 431.35 2,969.21 3,037.79 1,033.58 4,071.37 3,037.79 4,132.87
Makueni 340.44 38.37 378.8 1,747.61 905.67 2,653.28 2,088.04 944.04 3,032.08
Mandera 158.10 27.75 185.85 1,122.74 812.52 1,935.25 1,280.83 840.27 2,121.10
Marsabit 169.14 0.00 169.14 1,163.41 815.00 1,978.41 1,332.55 815.00 2,147.55
Meru 437.84 32.03 469.88 1,801.78 173.97 1,975.75 2,239.63 206.00 2,445.63
Migori 281.42 42.65 324.07 1,529.58 877.35 2,406.93 1,811.00 920.00 2,731.00

COUNTY GOVERNMENTS BUDGET IMPLEMENTATION REVIEW REPORT FIRST HALF FY, 2015/1612
Exchequer Releases from CRFs to County Operations Accounts in the first Half of FY 2015/16 (Kshs. Million)
County County Assembly County Executive Combined Exchequer Issues
Rec Dev Total Rec Dev Total Rec Dev Total
Column
A
Column B
Column C=A+B
Column D
Column E
Column F=D+E
Column G=A+D
Column H=B+E
Column I=G+H
Mombasa 211.38 0.00 211.38 2,400.22 763.78 3,163.99 2,611.60 763.78 3,375.38
Murang’a 201.84 0.00 201.84 1,450.60 1,297.10 2,747.70 1,652.44 1,297.10 2,949.54
Nairobi City 672.00 80.00 752 6,175.02 0.00 6,175.02 6,847.02 80.00 6,927.02
Nakuru 505.08 0.00 505.08 3,519.27 1,006.28 4,525.55 4,024.35 1,006.28 5,030.63
Nandi 264.07 0.00 264.07 1,175.78 664.00 1,839.78 1,439.85 664.00 2,103.85
Narok 287.00 18.00 305 1,934.37 847.00 2,781.37 2,221.37 865.00 3,086.37
Nyamira 145.00 0.00 145 1,138.00 515.16 1,653.16 1,283.00 515.16 1,798.16
Nyandarua 250.21 45.00 295.21 1,236.23 534.36 1,770.59 1,486.44 579.36 2,065.80
Nyeri 227.09 0.00 227.09 1,603.77 114.50 1,718.27 1,830.86 114.50 1,945.36
Samburu 170.02 0.00 170.02 951.58 498.86 1,450.45 1,121.61 498.86 1,620.47
Siaya 253.00 16.06 269.06 1,058.00 365.94 1,423.94 1,311.00 382.00 1,693.00
Taita/Taveta 252.57 7.00 259.57 864.62 108.78 973.40 1,117.19 115.78 1,232.97
Tana River 173.18 39.75 212.93 549.65 1,000.42 1,550.07 722.83 1,040.17 1,763.00
Tharaka Nithi 149.75 0.00 149.75 841.74 419.64 1,261.37 991.49 419.64 1,411.13
Trans Nzoia 165.13 0.00 165.13 1,175.72 524.10 1,699.81 1,340.85 524.10 1,864.95
Turkana 488.95 79.70 568.65 1,513.56 2,416.46 3,930.02 2,002.51 2,496.15 4,498.67
Uasin Gishu 288.51 0.00 288.51 1,641.96 690.33 2,332.29 1,930.47 690.33 2,620.80
Vihiga 248.8 0.00 248.8 936.72 200.00 1,136.72 1,185.52 200.00 1,385.52
Wajir 214.93 0.00 214.93 1,262.66 1,583.94 2,846.59 1,477.58 1,583.94 3,061.52
West Pokot 165.05 40.00 205.05 969.95 510.00 1,479.95 1,135.00 550.00 1,685.00
Total 12,617.58 898.63 13,516.20 77,190.97 36,762.66 113,953.63 89,438.70 37,661.29 127,099.99
Source: County Treasuries and OCOB
Nairobi City County received the highest disbursement of funds from its CRF to the operational accounts at Kshs.6.93 billion followed by Nakuru County and Kakamega County at Kshs.5.03 billion and Kshs.5.02 billion respectively. Counties that received the lowest disbursement were; Vihiga at Kshs.1.39 billion; Taita Taveta at Kshs.1.23 billion and Lamu County at Kshs.1.11 billion.

COUNTY GOVERNMENTS BUDGET IMPLEMENTATION REVIEW REPORT FIRST HALF FY, 2015/16 13
From the funds released for recurrent activities, the Nairobi City County, Machakos County and Nakuru County received the highest amounts at Kshs.6.85 billion; Kshs.4.07billion and Kshs.4.02 billion respectively. Conversely, Tharaka Nithi, Lamu and Tana River Counties received the lowest amounts at Kshs.991.49 million, Kshs.772.60 million, Kshs.722.83 million respectively.
The funds released for development activities indicate that Machakos county, Turkana County, Kakamega County received the highest amount of funds at Kshs.3.04billion, Kshs.2.50 billion and Kshs.1.88 billion respectively. Counties that received the least amount for development expenditure were Taita Taveta at Kshs.115.78 million, Nyeri at Kshs.114.50 million and Nairobi City at Kshs.80 million.
2.4 Expenditure Analysis
During the reporting period, Counties incurred expenditure amounting to Kshs.113.43 billion representing an absorption rate of 31.3 per cent of the total annual County Governments’ budgets. This was a decline from an absorption rate of 32.4 per cent reported in a similar period of FY 2014/15.
Recurrent expenditure was Kshs.83.85 billion, representing 40.4 per cent of the annual recurrent budget. The percentage recurrent expenditure outturn was similar to that attained in the similar period of FY 2014/15. On the other hand, development expenditure amounted to Kshs.29.58 billion, representing an absorption rate of 19.9 per cent and a decline from an absorption rate of 21.9 per cent reported in a similar period of FY 2014/15.
Table 2.5: Expenditure by Economic Classification for the first half of FY 2015/16
County Title Personnel Emolu-ments (Kshs)
Operations & Maintenance
(Kshs)
Debt Repayment (Kshs)
Development Expendi-ture (Kshs)
Total Expenditure (Kshs)
Column A Column B Column C Column D Column E=A+B+C+D
Baringo 1,265,264,107 458,373,200 494,018,657 2,217,655,964
Bomet 940,670,000 273,820,000 1,116,050,000 2,330,540,000
Bungoma 1,449,959,900 876,611,387 781,932,713 3,108,504,000
Busia 1,027,920,569 432,182,754 711,250,387 2,171,353,710
Elgeyo/Marakwet 839,507,605 112,418,909 205,994,277 1,157,920,791
Embu 848,175,450 185,169,228 175,720,660 1,209,065,338
Garissa 1,066,200,358 488,819,642 600,000,000 2,155,020,000
Homa Bay 1,347,138,739 681,413,526 777,560,379 2,806,112,644

COUNTY GOVERNMENTS BUDGET IMPLEMENTATION REVIEW REPORT FIRST HALF FY, 2015/1614
County Title Personnel Emolu-ments (Kshs)
Operations & Maintenance
(Kshs)
Debt Repayment (Kshs)
Development Expendi-ture (Kshs)
Total Expenditure (Kshs)
Column A Column B Column C Column D Column E=A+B+C+D
Isiolo 391,238,134 291,908,842 269,994,004 953,140,980
Kajiado 833,342,093 465,281,925 22,486,906 573,115,718 1,894,226,642
Kakamega 1,992,574,991 742,237,687 1,369,384,005 4,104,196,683
Kericho 887,699,359 458,076,857 722,524,493 2,068,300,709
Kiambu 1,835,085,217 914,568,593 975,869,817 3,725,523,627
Kilifi 1,294,466,369 856,525,104 625,251,614 2,776,243,087
Kirinyaga 968,790,036 328,670,710 303,369,983 1,600,830,729
Kisii 1,927,168,942 703,744,076 934,039,305 3,564,952,323
Kisumu 1,631,525,276 361,060,566 772,262,268 76,990,591 2,841,838,701
Kitui 1,260,566,566 375,084,665 1,274,325,147 2,909,976,378
Kwale 641,749,125 133,101,010 1,239,554,313 2,014,404,448
Laikipia 884,982,220 272,933,434 427,776,138 1,585,691,792
Lamu 349,132,348 149,215,993 206,002,209 704,350,550
Machakos 2,012,793,851 893,299,988 778,738,816 3,684,832,655
Makueni 1,056,322,603 649,523,153 381,682,085 2,087,527,841
Mandera 559,062,233 721,429,876 835,100,120 2,115,592,229
Marsabit 548,688,503 342,424,084 238,437,515 296,955,952 1,426,506,054
Meru 1,504,150,375 217,497,593 53,339,423 - 1,774,987,391
Migori 1,126,268,100 522,290,529 974,050,575 2,622,609,204
Mombasa 2,057,723,251 415,681,305 852,362,859 3,325,767,415
Murang’a 1,312,210,615 323,376,944 1,282,406,504 2,917,994,062
Nairobi City 6,676,069,932 1,830,506,736 653,507,415 2,287,232,233 11,447,316,316
Nakuru 2,378,599,373 1,453,126,937 921,413,541 4,753,139,851
Nandi 920,422,322 464,618,835 377,179,016 1,762,220,173
Narok 1,219,100,699 856,552,967 68,542,000 861,551,561 3,005,747,227
Nyamira 835,747,087 386,845,383 381,757,324 1,604,349,794

COUNTY GOVERNMENTS BUDGET IMPLEMENTATION REVIEW REPORT FIRST HALF FY, 2015/16 15
County Title Personnel Emolu-ments (Kshs)
Operations & Maintenance
(Kshs)
Debt Repayment (Kshs)
Development Expendi-ture (Kshs)
Total Expenditure (Kshs)
Column A Column B Column C Column D Column E=A+B+C+D
Nyandarua 813,606,903 529,934,977 367,453,621 1,710,995,501
Nyeri 1,281,865,110 307,187,302 109,412,251 1,698,464,663
Samburu 528,752,481 377,554,858 383,651,480 1,289,958,819
Siaya 818,084,112 388,157,148 426,162,343 1,632,403,603
Taita/Taveta 520,641,784 513,738,079 1,344,611 1,035,724,474
Tana River 418,800,000 185,730,000 206,860,000 811,390,000
Tharaka -Nithi 721,349,138 138,483,642 221,196,363 1,081,029,143
Trans Nzoia 822,194,103 548,634,275 322,450,642 1,693,279,020
Turkana 1,361,291,570 537,429,254 2,104,026,806 4,002,747,630
Uasin Gishu 1,011,311,019 241,545,051 115,588,281 638,455,638 2,006,899,989
Vihiga 616,909,589 259,870,048 328,827,601 85,174,200 1,290,781,438
Wajir 801,106,489 673,253,885 1,582,646,060 - 3,057,006,434
West Pokot 724,747,240 342,276,069 624,556,516 1,691,579,825
Total 56,330,975,886 23,682,187,026 3,835,637,469 29,581,899,467 113,430,699,847
Source: OCOB and County Treasuries
The Counties that attained the highest total expenditure were; Nairobi City at Kshs.11.45 billion, Nakuru at Kshs.4.75 billion, Kakamega at Kshs.4.10 billion and Turkana at Kshs.4.00 billion. On the other hand, Taita Taveta, Isiolo, Tana River and Lamu reported the least total expenditure at Kshs.1.04 billion, Kshs.953.14 million, Kshs.811.39 million, and Kshs.704.35 million respectively.
Analysis of total expenditure as a percentage of the total funds authorized for withdrawal by the COB indicated that Nairobi City and West Pokot Counties incurred expenditure in excess of the funds released by 165.3 per cent and 100.4 per cent respectively. Those that had the least percentage of expenditure to total funds released included; Kwale County at 63.9 per cent, Lamu County at 63.5 per cent and Tana River County at 46.0 per cent.
Analysis of total expenditure to the approved County Government budget indicates that Bomet County attained the highest absorption rate of its annual approved budget at 47.4 per cent followed by Homa Bay County at 45.5 per cent, and Murang’a County at 42.3 per cent. Conversely, Meru,

COUNTY GOVERNMENTS BUDGET IMPLEMENTATION REVIEW REPORT FIRST HALF FY, 2015/1616
Tana River and Mandera counties had the lowest absorption at 20.9 per cent, 18.9 per cent and 18.4 per cent respectively.
A review of county expenditure by economic classification showed that Kshs.56.33 billion (49.7 per cent of the total expenditure) was spent on personnel emoluments, Kshs.29.58 billion (26.1 per cent of the total expenditure) on development activities, Kshs.23.68 billion (20.9 per cent of the total expenditure) on operations and maintenance and Kshs.3.84 billion (3.4 per cent of the total expenditure) on was incurred on debt repayment. Out of Kshs.3.84 billion incurred on debt repayment, Kshs.2.77 billion related to development activities while Kshs.1.07 billion to recurrent activities.
2.4.1 Development Expenditure
In the first half of FY 2015/16, the county governments spent of Kshs.29.58 billion on development activities translating to 26.08 per cent of total expenditure. This expenditure included Kshs.2.77 billion on debt repayments related to activities from prior financial periods.
The Nairobi City County reported the highest absolute expenditure on development activities at Kshs.2.29 billion. Other counties that recorded high expenditure were Turkana, 3 Kakamega and Murang’a at Kshs.2.10 billion, Kshs.1.34billion and Kshs.1.28billion respectively. Those that reported the lowest absolute expenditure included, Embu at Kshs.175.72 million, Nyeri at Kshs.109.41 million, Vihiga at Kshs.85.17 million, Kisumu at Kshs. 76.99 million and Taita Taveta at Kshs.1.34 million. Meru county and Wajir county did not record any development expenditure.Analysis of the development expenditure as a percentage of development funds authorized for withdrawal by COB indicates that Nairobi City County incurred expenditure in excess of the amount authorised for withdrawal by 2,859.0 per cent. This contravenes the provisions of the Constitution of Kenya 2010 and the PFM Act 2012. Other Counties that incurred expenditure in excess of the amount approved for withdrawal were; Vihiga at 207.0 per cent, West Pokot at 113.6 per cent, Mombasa at 111.6 per cent, Siaya at 111.6 per cent, Kiambu at 109.8 per cent, Bomet at 109.6 per cent, Migori at 105.9 per cent and Kitui at 105.4 per cent.
An analysis of county budgets and expenditure for the first half of FY 2015/16 is provided in table 2.6
3 The Development expenditure for Wajir County relates to debt repayment for development activities from prior periods.

COUNTY GOVERNMENTS BUDGET IMPLEMENTATION REVIEW REPORT FIRST HALF FY, 2015/16 17
Table 2.6: County budget allocation, expenditure and absorption rate for the first Half of FY 2015/16
County NameBudget Estimates (Kshs.million)
Expenditure (Kshs.million)
Recurr Ab-sor-ption rate (%)
Dev Ab-sor-ption rate (%)
Rec Dev Total Rec Dev TotalBaringo 3,430.01 2,414.02 5,844.03 1,723.64 494.02 2,217.66 50.3 20.5
Bomet 2,739.01 2,181.55 4,920.57 1,214.49 1,116.05 2,330.54 44.3 51.2
Bungoma 5,779.81 4,192.47 9,972.28 2,326.57 781.93 3,108.50 40.3 18.7
Busia 3,311.80 2,958.30 6,270.09 1,460.10 711.25 2,171.35 44.1 24
Elgeyo/Marakwet 2,519.93 1,145.52 3,665.45 951.93 205.99 1,157.92 37.8 18
Embu 3,301.10 1,574.61 4,875.71 1,033.34 175.72 1,209.07 31.3 11.2
Garissa 3,917.72 3,443.87 7,361.59 1,555.02 600 2,155.02 39.7 17.4
Homa Bay 3,949.72 2,212.63 6,162.35 2,028.55 777.56 2,806.11 51.4 35.1
Isiolo 2,115.00 1,685.83 3,800.82 683.15 269.99 953.14 32.3 16
Kajiado 3,927.42 2,661.37 6,588.79 1,321.11 573.12 1,894.23 33.6 21.5
Kakamega 6,275.62 6,054.12 12,329.74 2,734.81 1,369.38 4,104.20 43.6 22.6
Kericho 3,266.58 1,814.48 5,081.06 1,345.78 722.52 2,068.30 41.2 39.8
Kiambu 7,980.22 3,968.83 11,949.05 2,749.65 975.87 3,725.52 34.5 24.6
Kilifi 5,588.38 5,931.81 11,520.19 2,150.99 625.25 2,776.24 38.5 10.5
Kirinyaga 3,066.08 2,255.24 5,321.31 1,297.46 303.37 1,600.83 42.3 13.5
Kisii 5,301.30 3,663.58 8,964.88 2,630.91 934.04 3,564.95 49.6 25.5
Kisumu 5,706.95 3,930.67 9,637.62 2,242.67 599.16 2,841.84 39.3 15.2
Kitui 4,790.95 5,434.84 10,225.79 1,635.65 1,274.33 2,909.98 34.1 23.4
Kwale 2,834.28 4,777.20 7,611.48 774.85 1,239.55 2,014.40 27.3 25.9
Laikipia 2,859.31 2,273.07 5,132.38 1,157.92 427.78 1,585.69 40.5 18.8
Lamu 1,757.12 1,323.11 3,080.23 498.35 206 704.35 28.4 15.6
Machakos 5,250.49 5,694.13 10,944.61 2,906.09 778.74 3,684.83 55.3 13.7
Makueni 4,477.68 4,972.25 9,449.93 1,705.85 381.68 2,087.53 38.1 7.7
Mandera 4,216.87 7,284.54 11,501.42 1,280.49 835.1 2,115.59 30.4 11.5
Marsabit 3,027.76 2,807.05 5,834.81 891.11 535.39 1,426.51 29.4 19.1
Meru 5,107.16 3,387.99 8,495.15 1,728.53 46.46 1,774.99 33.8 1.4
Migori 3,581.28 2,925.64 6,506.93 1,648.56 974.05 2,622.61 46 33.3
Mombasa 6,751.95 4,165.51 10,917.46 2,473.40 852.36 3,325.77 36.6 20.5
Murang’a 3,548.44 3,351.84 6,900.28 1,635.59 1,282.41 2,917.99 46.1 38.3
Nairobi City 19,819.26 11,009.43 30,828.69 9,160.08 2,287.23 11,447.32 46.2 20.8
Nakuru 8,356.67 5,375.41 13,732.08 3,831.73 921.41 4,753.14 45.9 17.1
Nandi 2,770.60 2,672.58 5,443.18 1,385.04 377.18 1,762.22 50 14.1
Narok 5,061.18 3,938.16 8,999.35 2,144.20 861.55 3,005.75 42.4 21.9
Nyamira 2,904.50 2,639.68 5,544.18 1,222.59 381.76 1,604.35 42.1 14.5
Nyandarua 2,804.39 1,475.81 4,280.20 1,343.54 367.45 1,711.00 47.9 24.9
Nyeri 4,286.75 1,997.46 6,284.21 1,589.05 109.41 1,698.46 37.1 5.5
Samburu 2,592.91 1,747.79 4,340.70 906.31 383.65 1,289.96 35 22
Siaya 3,746.47 2,511.51 6,257.97 1,206.24 426.16 1,632.40 32.2 17
Taita/Taveta 2,697.44 1,188.53 3,885.97 1,034.38 1.34 1,035.72 38.3 0.1
Tana River 1,767.50 2,526.16 4,293.66 604.53 206.86 811.39 34.2 8.2
Tharaka Nithi 2,082.20 1,471.44 3,553.64 859.83 221.2 1,081.03 41.3 15
Trans Nzoia 3,364.16 2,928.21 6,292.37 1,370.83 322.45 1,693.28 40.7 11
Turkana 4,131.75 9,251.56 13,383.31 1,898.72 2,104.03 4,002.75 46 22.7
Uasin Gishu 4,593.80 2,948.83 7,542.63 1,319.17 687.73 2,006.90 28.7 23.3

COUNTY GOVERNMENTS BUDGET IMPLEMENTATION REVIEW REPORT FIRST HALF FY, 2015/1618
County NameBudget Estimates (Kshs.million)
Expenditure (Kshs.million)
Recurr Ab-sor-ption rate (%)
Dev Ab-sor-ption rate (%)
Rec Dev Total Rec Dev TotalVihiga 2,536.18 1,831.58 4,367.76 876.78 414 1,290.78 34.6 22.6
Wajir 3,728.66 4,411.04 8,139.71 1,474.36 1,582.65 3,057.01 39.5 35.9
West Pokot 2,946.00 1,781.60 4,727.60 1,067.02 624.56 1,691.58 36.2 35.1
Total 200,570.38 162,192.82 362,763.20 81,080.99 32,349.71 113,430.70 40.4 19.9
Source: OCOB and County Treasuries.
The analysis of development expenditure as a proportion of approved annual development budget reveals that Bomet County attained the highest absorption rate at 51.2 per cent, followed by Kericho and Murang’a Counties at 39.8 per cent and 38.3 per cent respectively. Nyeri County, Meru County and Taita Taveta County reported the least absorption rates at 5.5 per cent, 1.4 per cent and 0.1 per cent respectively. A summary of development projects undertaken by counties is provided in chapter three under each county summary report.
2.4.2 Recurrent Expenditure
County Governments spent an aggregate of Kshs.81.08 billion on recurrent activities. This expenditure includes Kshs.1.07 billion on debt repayments related to recurrent activities from prior periods. The total recurrent expenditure was 71.5 per cent of the total expenditure and represents 40.4 per cent of the approved annual County Governments’ budget for recurrent activities. This is an increase from 18.6 per cent recorded in a similar period of FY 2014/15.
The Nairobi City County reported the highest expenditure on recurrent activities in the period under review at Kshs.9.16 billion followed by Nakuru and Machakos Counties at Kshs.3.83 billion and Kshs.2.91 billion respectively. Isiolo County, Tana River County and Lamu County reported the least expenditure at Kshs.683.15 million, Kshs.604.53 million and Kshs.498.35 million respectively.
Analysis of recurrent expenditure as a percentage of the funds released for recurrent expenditure by the COB indicates that the Nairobi City County and Trans Nzoia County incurred expenditure in excess of the authorised withdrawals by 133.8 per cent and 102.2 per cent, respectively.
Machakos County reported the highest recurrent expenditure as a proportion of its approved annual recurrent budget at 55.3 per cent followed by Homa Bay County at 51.4 per cent and Baringo County at 50.3 per cent. The counties that registered the lowest expenditure to their respective approved annual budget were Uasin Gishu at 28.7 per cent, Lamu at 28.4 per cent and Kwale at 27.3 per cent.

COUNTY GOVERNMENTS BUDGET IMPLEMENTATION REVIEW REPORT FIRST HALF FY, 2015/16 19
2.4.3 Personnel Emoluments
During the reporting period, the Counties spent Kshs.56.33 billion on personnel emoluments, translating to 49.7 per cent of total County Governments’ expenditure compared to 46.8 per cent spent in a similar period of FY 2014/15. Nairobi City County reported the highest expenditure on personnel emoluments at Kshs.6.68 billion followed by Nakuru County at Kshs.2.38 billion and Mombasa County at Kshs.2.06 billion. The Tana River, Isiolo and Lamu Counties incurred the lowest expenditure on personnel emoluments at Kshs.418.80 million, Kshs.391.24 million and Kshs.349.13 million respectively.Analysis of personnel emoluments as a proportion of the total expenditure showed that Meru County recorded the highest proportion at 84.7 per cent followed by Nyeri County at 75.5 per cent and Elgeyo/Marakwet County at 72.5 per cent. Kwale, Mandera and Wajir Counties reported the least proportion of their personnel emoluments to their total expenditure at 31.9 per cent, 26.4 per cent and 26.2 per cent respectively.
2.4.4 Operations and Maintenance
On aggregate, the Counties spent a total of Kshs.23.68 billion on operations and maintenance, which translated to 20.8 per cent of the total expenditure during the period under review. Nairobi City County reported the highest expenditure on operations and maintenance at Kshs.1.83 billion followed by Nakuru County at Kshs.1.45 million, and Kiambu County at Kshs.914.57 million. On the other hand, Tharaka Nithi, Kwale and Elgeyo/Marakwet reported the lowest expenditure at Kshs.138.48 million, Kshs.133.10 million and Kshs.112.42 million respectively.
Analysis of expenditure on operations and maintenance as a proportion of the total County Governments expenditure for the period under review indicated that Taita Taveta County attained the highest percentage at 49.6 per cent followed by Mandera County at 34.1 per cent and Trans Nzoia County at 32.4 per cent. The Counties that attained the least percentage of operations and maintenance to their total expenditure were; Murang’a at 11.1 per cent, Elgeyo/Marakwet at 9.7 per cent, and Kwale at 6.6 per cent.
2.5 Analysis of MCAs Sitting Allowances
During the period July to December 2015, the County Assemblies spent a total of Kshs.1.37 billion on MCAs’ sitting allowances translating to 38.2 per cent of the approved annual budget allocation compared to 18.4 per cent attained in the similar period of FY 2014/15. Table 2.7 shows the budgetary allocation and the expenditure on MCAs’ and Speakers’ sitting allowances during the period under review.

COUNTY GOVERNMENTS BUDGET IMPLEMENTATION REVIEW REPORT FIRST HALF FY, 2015/1620
Table 2.7: Budget allocation and the expenditures for MCAs’ sitting allowances for the first half of FY 2015/16
County Name
MCAs & Speaker Sitting Allowances for the first half of FY 2015/16
FY 2015/16 Budget Alloca-
tion (Kshs)
Half Year Expenditure
(Kshs)
Absorption rate (%)
No. of MCAs including the
Speaker
Expenditure relative to the
No. of MCAs & Speakers (Kshs)
Average monthly sitting allowance Per MCA (Kshs)
Baringo 52,000,000 14,712,169 28.3 49 300,248 50,041
Bomet 56,634,400 15,769,190 27.8 35 450,548 75,091
Bungoma 105,705,600 42,776,000 40.5 64 668,375 111,396
Busia 114,816,000 25,317,784 22.1 54 468,848 78,141
Elgeyo/Marakwet 41,496,000 19,074,823 46.0 31 615,317 102,553
Embu 49,931,209 16,587,599 33.2 34 487,871 81,312
Garissa 80,906,400 33,478,456 41.4 49 683,234 113,872
Homa Bay 129,322,306 56,908,800 44.0 64 889,200 148,200
Isiolo 29,438,400 8,384,336 28.5 21 399,254 66,542
Kajiado 66,326,400 19,204,900 29.0 42 457,260 76,210
Kakamega 142,485,600 54,931,612 38.6 88 624,223 104,037
Kericho 79,597,230 36,506,500 45.9 48 760,552 126,759
Kiambu 100,000,000 53,228,245 53.2 88 604,866 100,811
Kilifi 83,194,800 35,996,700 43.3 54 666,606 111,101
Kirinyaga 61,526,400 20,200,800 32.8 30 673,360 112,227
Kisii 90,411,955 60,332,100 66.7 72 837,946 139,658
Kisumu 113,808,000 43,226,697 38.0 50 864,534 144,089
Kitui 74,626,000 29,226,600 39.2 57 512,747 85,458
Kwale 59,404,800 13,706,941 23.1 34 403,145 67,191
Laikipia 35,984,000 17,200,300 47.8 24 716,679 119,447
Lamu 37,102,400 10,620,800 28.6 21 505,752 84,292
Machakos 75,000,000 30,198,500 40.3 59 511,839 85,306
Makueni 47,000,000 32,689,430 69.6 48 681,030 113,505
Mandera 50,000,000 22,022,500 44.0 49 449,439 74,906
Marsabit 80,000,000 36,441,600 45.6 34 1,071,812 178,635
Meru 120,199,600 51,671,900 43.0 70 738,170 123,028
Migori 126,883,200 62,266,809 49.1 63 988,362 164,729
Mombasa 97,843,200 34,973,900 35.7 43 813,347 135,558
Murang’a 117,734,000 14,160,522 12.0 50 283,210 47,202
Nairobi City 207,246,000 66,779,700 32.2 128 521,716 86,953
Nakuru 110,000,000 34,223,040 31.1 75 456,307 76,051
Nandi 73,840,000 34,734,200 47.0 49 708,861 118,144
Narok 60,000,000 23,828,768 39.7 48 496,433 82,739
Nyamira 65,784,000 20,522,600 31.2 33 621,897 103,649
Nyandarua 68,414,000 27,905,360 40.8 42 664,413 110,736
Nyeri 107,857,600 38,678,300 35.9 48 805,798 134,300
Samburu 45,534,160 25,462,520 55.9 26 979,328 163,221

COUNTY GOVERNMENTS BUDGET IMPLEMENTATION REVIEW REPORT FIRST HALF FY, 2015/16 21
County Name
MCAs & Speaker Sitting Allowances for the first half of FY 2015/16
FY 2015/16 Budget Alloca-
tion (Kshs)
Half Year Expenditure
(Kshs)
Absorption rate (%)
No. of MCAs including the
Speaker
Expenditure relative to the
No. of MCAs & Speakers (Kshs)
Average monthly sitting allowance Per MCA (Kshs)
Siaya 43,180,800 24,045,100 55.7 49 490,716 81,786
Taita/Taveta 58,060,800 25,030,400 43.1 36 695,289 115,881
Tana River 55,702,400 11,123,700 20.0 27 411,989 68,665
Tharaka –Nithi 34,923,600 6,136,472 17.6 25 245,459 40,910
Trans Nzoia 78,124,800 33,880,000 43.4 40 847,000 141,167
Turkana 64,911,200 20,567,300 31.7 47 437,602 72,934
Uasin Gishu 56,160,000 17,088,000 30.4 45 379,733 63,289
Vihiga 14,568,000 4,383,200 30.1 40 109,580 18,263
Wajir 60,224,000 15,780,700 26.20 45 350,682 116,894
West Pokot 54,288,628 26,628,461 49.0 33 806,923 134,487
Total 3,578,197,888 1,368,614,334 38.2 2,259 605,850 Source: OCOB and County Treasuries
The County Assemblies that reported the highest expenditure on sitting allowances relative to the number of MCAs and the Speaker were; Marsabit County Assembly at Kshs.1.07 million followed by Migori County Assembly at Kshs.988,362 and Samburu County Assembly at Kshs.979,328. Those that reported the least expenditure were Baringo at Kshs.300,248, Tharaka Nithi at Kshs.245,459 and Vihiga at Kshs.109,580.
Further analysis indicated that the County Assemblies that reported the highest proportion of expenditure on MCAs’ sitting allowances to the annual budget allocation were; Makueni at 69.6 per cent, Kisii at 66.7 per cent and Samburu at 55.9 per cent. Those with the lowest proportions were; Tana River at 20.0 per cent, Tharaka Nithi at 17.6 per cent and Murang’a at 12.0 per cent. Twelve County Assemblies exceeded the recommended SRC’s maximum monthly sitting allowance of Kshs.124,800. These were Homa Bay, Kakamega, Kericho, Kisii, Kisumu, Marsabit, Migori, Mombasa, Nyeri, Samburu, Trans Nzoia and West Pokot County Assemblies
2.6 Analysis of Expenditure on Domestic and Foreign Travels
The Counties’ aggregate expenditure on domestic and foreign travel was Kshs.4.58 billion against an approved annual budget of Kshs.10.55 billion4. This represents an absorption rate of 43.5 per cent of the annual budget, a marginal decrease from 43.7 per cent attained in the first half of FY 2014/15. The expenditure on domestic and foreign travels by the County Assembly and the County Executive is presented in Table 2.8.
4 The approved annual budget for Domestic and Foreign travel differ from Kshs.9.72 billion published in the First Quarter of FY 2015/16 since most Counties revised their budgets.

COUNTY GOVERNMENTS BUDGET IMPLEMENTATION REVIEW REPORT FIRST HALF FY, 2015/1622
Table 2.8: Expenditures on domestic and foreign travels by the County Assembly and the County Executive for the first Half of FY 2015/16 (Kshs.million)
County County Assembly County Executive Total Expenditure
Budget Expen-di-ture
Perfo-rmance Budget Expen-di-
turePerfo-
rmance Budget Expen-di-ture
Perfo-rmance
A B C= *100 D E F= *100 G H I = *100
Baringo 83.15 18.45 22.2 71.88 54.65 76.0 155.03 73.10 47.2
Bomet 47.18 59.36 125.8 30.40 24.09 79.2 77.58 83.45 107.6
Bungoma 23.35 12.53 53.7 198.34 176.46 89.0 221.69 188.99 85.2
Busia 55.35 30.85 55.7 238.01 97.45 40.9 293.36 128.30 43.7
Elgeyo/Ma-rakwet 49.50 31.56 63.8 24.11 9.17 38.0 73.61 40.73 55.3
Embu 68.90 31.60 45.9 34.46 7.80 22.6 103.36 39.39 38.1
Garissa 46.03 23.13 50.3 90.09 23.43 26.0 136.12 46.56 34.2
Homa Bay 35.13 51.74 147.3 95.40 70.57 74.0 130.53 122.31 93.7
Isiolo 31.54 19.14 60.7 97.59 49.57 50.8 129.13 68.71 53.2
Kajiado 151.70 43.12 28.4 284.89 42.48 14.9 436.59 85.60 19.6
Kakamega 150.00 72.32 48.2 230.44 62.09 26.9 380.44 134.41 35.3
Kericho 63.53 36.11 56.8 94.39 52.36 55.5 157.92 88.47 56.0
Kiambu 162.50 61.05 37.6 223.24 70.86 31.7 385.74 131.91 34.2
Kilifi 140.00 96.48 68.9 130.89 74.60 57.0 270.89 171.09 63.2
Kirinyaga 101.00 70.73 70.0 67.07 31.79 47.4 168.07 102.52 61.0
Kisii 95.38 67.67 70.9 243.73 102.45 42.0 339.12 170.12 50.2
Kisumu 86.32 18.78 21.8 209.27 43.90 21.0 295.59 62.68 21.2
Kitui 95.68 29.57 30.9 205.80 63.25 30.7 301.48 92.82 30.8
Kwale 103.06 9.63 9.3 103.06 78.90 2.83 3.6 12.46 6.8
Laikipia 52.50 22.03 42.0 81.80 41.55 50.8 134.30 63.59 47.3
Lamu 72.68 5.02 6.9 83.83 37.62 44.9 156.51 42.64 27.2
Machakos 118.50 99.00 83.5 103.74 49.62 47.8 222.24 148.62 66.9
Makueni 47.42 46.28 97.6 112.39 67.66 60.2 159.82 113.94 71.3
Mandera 103.06 9.63 9.3 139.91 23.54 16.8 242.97 33.14 13.6
Marsabit 100.00 39.26 39.3 135.24 58.30 43.1 235.24 97.56 41.5
Meru 62.53 64.47 103.1 115.84 24.38 21.0 178.37 88.85 49.8
Migori 86.84 56.65 65.2 330.89 100.43 30.4 417.73 157.08 37.6
Mombasa 42.40 3.78 8.9 223.69 42.54 19.0 266.09 46.32 17.4
Murang’a 95.63 30.83 22.4 87.10 57.25 65.7 182.73 88.04 48.2
Nairobi City 209.97 133.65 63.7 279.20 153.34 54.9 489.17 286.99 58.7
Nakuru 72.50 51.42 70.9 208.69 145.88 69.9 281.19 197.30 70.2
Nandi 72.88 35.99 49.4 144.24 65.54 45.4 217.13 101.53 46.8
Narok 14.51 7.55 52.0 13.00 7.42 57.1 27.51 14.97 54.4
Nyamira 93.10 63.38 68.1 132.30 57.68 43.6 225.40 121.06 53.7
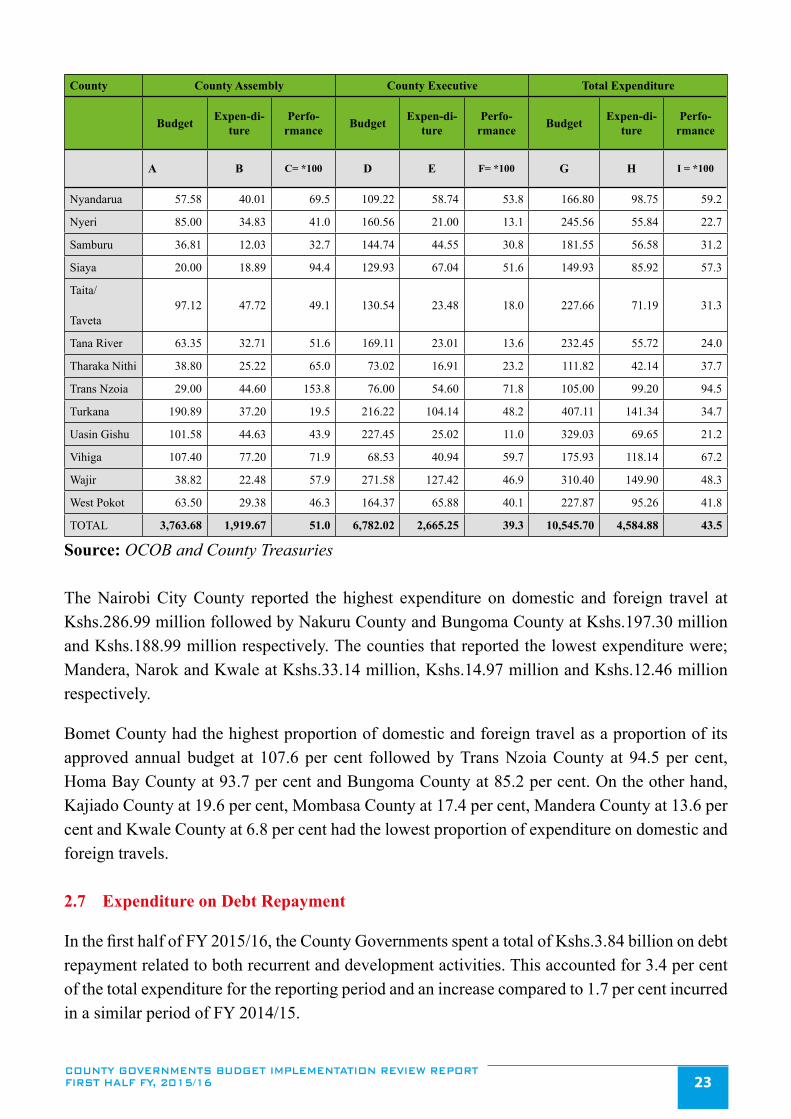
COUNTY GOVERNMENTS BUDGET IMPLEMENTATION REVIEW REPORT FIRST HALF FY, 2015/16 23
County County Assembly County Executive Total Expenditure
Budget Expen-di-ture
Perfo-rmance Budget Expen-di-
turePerfo-
rmance Budget Expen-di-ture
Perfo-rmance
A B C= *100 D E F= *100 G H I = *100
Nyandarua 57.58 40.01 69.5 109.22 58.74 53.8 166.80 98.75 59.2
Nyeri 85.00 34.83 41.0 160.56 21.00 13.1 245.56 55.84 22.7
Samburu 36.81 12.03 32.7 144.74 44.55 30.8 181.55 56.58 31.2
Siaya 20.00 18.89 94.4 129.93 67.04 51.6 149.93 85.92 57.3
Taita/
Taveta97.12 47.72 49.1 130.54 23.48 18.0 227.66 71.19 31.3
Tana River 63.35 32.71 51.6 169.11 23.01 13.6 232.45 55.72 24.0
Tharaka Nithi 38.80 25.22 65.0 73.02 16.91 23.2 111.82 42.14 37.7
Trans Nzoia 29.00 44.60 153.8 76.00 54.60 71.8 105.00 99.20 94.5
Turkana 190.89 37.20 19.5 216.22 104.14 48.2 407.11 141.34 34.7
Uasin Gishu 101.58 44.63 43.9 227.45 25.02 11.0 329.03 69.65 21.2
Vihiga 107.40 77.20 71.9 68.53 40.94 59.7 175.93 118.14 67.2
Wajir 38.82 22.48 57.9 271.58 127.42 46.9 310.40 149.90 48.3
West Pokot 63.50 29.38 46.3 164.37 65.88 40.1 227.87 95.26 41.8
TOTAL 3,763.68 1,919.67 51.0 6,782.02 2,665.25 39.3 10,545.70 4,584.88 43.5
Source: OCOB and County Treasuries
The Nairobi City County reported the highest expenditure on domestic and foreign travel at Kshs.286.99 million followed by Nakuru County and Bungoma County at Kshs.197.30 million and Kshs.188.99 million respectively. The counties that reported the lowest expenditure were; Mandera, Narok and Kwale at Kshs.33.14 million, Kshs.14.97 million and Kshs.12.46 million respectively.
Bomet County had the highest proportion of domestic and foreign travel as a proportion of its approved annual budget at 107.6 per cent followed by Trans Nzoia County at 94.5 per cent, Homa Bay County at 93.7 per cent and Bungoma County at 85.2 per cent. On the other hand, Kajiado County at 19.6 per cent, Mombasa County at 17.4 per cent, Mandera County at 13.6 per cent and Kwale County at 6.8 per cent had the lowest proportion of expenditure on domestic and foreign travels.
2.7 Expenditure on Debt Repayment
In the first half of FY 2015/16, the County Governments spent a total of Kshs.3.84 billion on debt repayment related to both recurrent and development activities. This accounted for 3.4 per cent of the total expenditure for the reporting period and an increase compared to 1.7 per cent incurred in a similar period of FY 2014/15.

COUNTY GOVERNMENTS BUDGET IMPLEMENTATION REVIEW REPORT FIRST HALF FY, 2015/1624
Wajir County incurred the highest expenditure on debt repayment at Kshs.1.58 billion followed by Kisumu County at Kshs.772.26 million and Nairobi City County at Kshs.653.51 million as shown in table 2.5.
Analysis of the expenditure on debt repayment as a percentage of the total expenditure incurred in the reporting period indicated that Wajir County reported the highest percentage at 51.8 per cent followed by Kisumu County at 27.2 per cent and Vihiga County at 25.5 per cent. Out of the nine (9) counties that incurred expenditure on debt repayment, Meru, Narok and Kajiado Counties had the least percentage of expenditure on debt repayment to their total expenditure at 3.0 per cent, 2.3 per cent and 1.2 per cent respectively.

COUNTY GOVERNMENTS BUDGET IMPLEMENTATION REVIEW REPORT FIRST HALF FY, 2015/16 25
3.0 INDIVIDUAL COUNTY BUDGET PERFORMANCE
This chapter provides individual County budget performance for the first half of FY 2015/16. The 47 counties are presented in alphabetical order.
3.1 Baringo County
3.1.1 Overview of the FY 2015/16 Budget
The FY 2015/16 approved budget for Baringo County was Kshs.5.84 billion. It comprised of Kshs.3.43 billion (58.7 per cent) allocated to recurrent expenditure and Kshs.2.41 billion (41.3 per cent) to development expenditure.
In order to finance the budget, the county expects to receive Kshs.4.44 billion (76.0 per cent) as transfers from the National Government, generate Kshs.300 million (5.1 per cent) from local sources, receive Kshs.95.74 million (1.6 per cent) for Leasing of Medical Equipment, Kshs.65.75 million (1.1 per cent) for Maternal Healthcare, Kshs.56.41 million (1.0 per cent) from the Roads Maintenance Fuel Levy Fund, Kshs.17.22 million (0.3 per cent) as World Bank grant to support health facilities, Kshs.25.97 million (0.4 per cent) as a conditional grant from DANIDA, and Kshs.831.91 million (14.2 per cent) as projected cash balance from FY 2014/15.
3.1.2 Revenue Analysis
In the first half of FY 2015/16, the County received Kshs.1.49 billion from the National Government as equitable share, Kshs.28.49 million as conditional allocation from the road maintenance fuel levy fund, Kshs.23.75 million as conditional allocation for free maternal health care, Kshs.4.09 million as conditional allocations for forgone user fees, raised Kshs.129.69 million from local sources, and had a cash balance of Kshs.831.91 million brought forward from FY 2014/15.
The quarterly trend in local revenue collection from FY 2013/14 to the second quarter of FY 2015/16 is shown in figure 3.1.

COUNTY GOVERNMENTS BUDGET IMPLEMENTATION REVIEW REPORT FIRST HALF FY, 2015/1626
Figure 3.1: Baringo County, Trend in Local Revenue Collection by Quarter from FY 2013/14 to the second quarter of FY 2015/16
64.55 63.03
52.36
0
10
20
30
40
50
60
70
80
90
Ksh
s.mill
ions
Reporting Period
Source: Baringo County Treasury
The local revenue consisted of Kshs.77.33 million and 52.36 million raised in the first quarter and second quarter of the FY 2015/16 respectively. The local revenue raised in the first half of FY 2015/16 was Kshs.129.68 million (43.2 per cent of the annual local revenue target), and an improvement from Kshs.118.22 million collected in a similar period of FY 2014/15.
Further analysis of local revenue for the first half of FY 2015/16 by stream is shown in Table 3.1.
Table 3.1: Baringo County analysis of revenue collection by stream for the first half of FY 2015/16
No Revenue Stream Annual Targeted Reve-nue (Kshs.)
6 Months Actual Rev-enue
Revenue Performance (%)
A B C D=*1001 Produce & Other Cess 26,754,431.28 20,205,285.00 75.5
2 Market Fees 28,871,413.05 17,545,808.00 60.8
3 Animal Stock Sale Fees 14,269,644.46 7,553,695.00 52.9
4 Game Park Fees 65,378,063.83 32,941,970.00 50.4
5 Hospital Revenue 65,182,560.00 32,295,772.00 49.5
6 Koibatek ATC 6,000,000.00 1,307,079.00 21.8
7 Plot Rent/ Rates 29,476,585.69 6,254,379.00 21.2
7 Single Business Permit 44,430,982.05 8,775,609.00 19.8
9 Veterinary 8,522,700.00 1,706,452.00 20.0
10 Public Health Licenses 5,113,620.00 894,050.00 17.5
11 Marigat AMS 6,000,000.00 203,277.00 3.4
TOTAL 300,000,000.36 129,683,376.00 43.2
Source: Baringo County Treasury

COUNTY GOVERNMENTS BUDGET IMPLEMENTATION REVIEW REPORT FIRST HALF FY, 2015/16 27
Analysis of revenue by stream indicates that produce and other cess recorded the highest performance against annual target at 75.5 per cent. This was closely followed by market fees at 60.8 per cent.
3.1.3 Banking of Local Revenue
In the first half of FY 2015/16, the County banked all the locally generated revenue intact into the CRF. This conforms to Article 207 of the Constitution and Section 109 of the PFM Act 2012, which stipulates that all funds raised or received by or on behalf of the County Governments should be deposited into the CRF account, unless excluded by an Act of Parliament.
3.1.4 Exchequer Issues
During the period under review, the COB authorised withdrawal of Kshs.2.45 billion from the CRF account, which was 41.8 per cent of the approved budget. The amount represented an increase of 4.6 per cent from Kshs.1.99 billion authorized in a similar period of FY 2014/15 and consisted of Kshs.1.80 billion (73.5 per cent) for recurrent expenditure and Kshs.647.42 million (26.5 per cent) for development activities.
3.1.5 Overall Expenditure Review
The County spent a total of Kshs.2.22 billion during the first half of FY 2015/16 which was 90.7 per cent of the total funds released for operations. This was a decline from the Kshs.1.89 billion spent in a similar period of FY 2014/15. A total of Kshs.1.72 billion was spent on recurrent activities and Kshs.494.01 million on development activities. Recurrent expenditure was 95.9 per cent of the funds released for recurrent activities while development expenditure accounted for 76.3 per cent of the funds released for development activities. The expenditure excludes commitments as of 31st December, 2015 that amounted to Kshs.36.65 million for development and Kshs.27.34 million for recurrent expenditure.
Recurrent expenditure for the period under review represented 50.3 per cent of the approved annual recurrent budget, an increase from 44.4 per cent spent in a similar period of FY 2014/15. On the other hand, development expenditure recorded an absorption rate of 20.5 per cent, a decrease from 24.3 per cent spent in a similar period of FY 2014/15. A comparison of the total expenditure in the first half of FY 2014/15 and the first half of FY 2015/16 is shown in Figure 3.2.

COUNTY GOVERNMENTS BUDGET IMPLEMENTATION REVIEW REPORT FIRST HALF FY, 2015/1628
Figure 3.2: Baringo County, Expenditure by Economic Classification for first half of FY 2014/15 and first half of FY 2015/16
780.77
528.86580.21
1,265.26
458.37 494.02
0
200
400
600
800
1000
1200
1400
Personnel Emoluments Operations & Maintenance Development
Ksh
s. M
illio
ns
Expenditure by Economic Classification
1st Half, FY 2014/151st Half, FY 2015/16
Source: Baringo County Treasury
3.1.6 Recurrent Expenditure Analysis
The total recurrent expenditure for the reporting period was Kshs.1.72 billion against an annual recurrent budget of Kshs.3.43 billion. This represents 50.3 per cent of the annual recurrent budget. The County spent Kshs.1.27 billion (73.4 per cent) on personnel emoluments and Kshs.458.37 million (26.6 per cent) on operations and maintenance as shown in Figure 3.2.
Expenditure on personnel emoluments amounted to Kshs.1.27 billion accounting for 57.7 per cent of the total expenditure and has increased significantly in the first half of FY 2015/16 as compared to a similar period in FY 2014/15 when the County spent Kshs.780.77 million. The increase is attributed to erroneous charging of personnel expenditure to operating and maintenance during the half year of FY 2014/15. This error was corrected in FY 2015/16.
The County spent Kshs.14.71 million on sitting allowances to the49 MCAs and the Speaker against an annual budget of Kshs.52 million. This represents a decrease from Kshs.9.66 million recorded in a similar period of FY 2014/15. The average monthly sitting allowance per MCA was Kshs.50,041 compared to SRC’s recommended monthly ceiling of Kshs.124, 800.
The aggregate expenditure on domestic and foreign travel was Kshs.73.10 million compared to Kshs.30.38 million incurred in a similar period of FY 2014/15, representing a significant increase of 140.6 per cent. A breakdown of the operations and maintenance expenditure for the reporting period is shown in Figure 3.3.

COUNTY GOVERNMENTS BUDGET IMPLEMENTATION REVIEW REPORT FIRST HALF FY, 2015/16 29
Figure 3.3: Baringo County, Operations and Maintenance Expenditure for the first half of FY 2015/16
119.11
49.23
23.87 23.52 22.10 18.00 17.12 16.33 14.09 12.99
-
20.00
40.00
60.00
80.00
100.00
120.00
140.00
Med
ical
Dru
gs
Trav
el C
osts
and
Subs
isten
ceA
llow
.(airl
ine,
Bus)
Trav
el C
osts
(airl
ines
, bus
,ra
ilway
, etc
.)
Petro
l and
oil
Elec
trici
ty E
xpen
ses
Emer
genc
y Fu
nd(D
isaste
rFu
nd)
Purc
hase
of W
eigh
ts an
dM
easu
res E
quip
men
ts
Boar
d, P
lena
ry an
dCo
mm
ittee
s Sitt
ings
Fiel
d O
pera
tiona
l(Bud
get
Proc
ess
and
Fina
nce
Bill)
New
s Pap
ers
Ksh
s. M
illio
ns
Major Categories of O &M Expenditure
Source: Baringo County Treasury
3.1.7 Development Expenditure Analysis
A summary of development expenditure during the first half of FY 2015/16 is provided in figure 3.4.
Figure 3.4: Baringo County, Summary of Development Expenditure for the First Half of FY 2015/16
188.84
95.58 95.2967.84
37.3 29.25 26.917.56 7.12 4.69 2.95
020406080
100120140160180200
Cons
tructi
on an
d Re
habi
litati
onof
Roa
ds an
d Ci
vic W
orks
Cons
tructi
on an
d M
aintai
nanc
eof
Wate
r Sup
ply
and
Irrig
ation
Cons
tructi
on o
f Hea
lth F
acili
ties
Cons
tructi
on o
f ECD
Cen
ters
and
Yout
h Po
lytec
hnics
Deve
lopm
ent o
f Mar
kets
and
Tour
ism F
acili
ties
Cons
tructi
on an
d Re
habi
litati
onof
Catt
le Di
ps an
d Ab
bato
irs
Reno
vatio
n of
Hou
sing
and
Urba
n Fa
ciliti
es
Cons
tructi
on o
f Ass
embl
yOf
fices
Reha
bilit
ation
of F
ores
t Cov
eran
d Re
sour
ce M
appi
ng
Deve
lopm
ent o
f Spo
rting
and
Socil
a Fac
ilitie
s
Cons
tructi
on o
f Adm
inist
ratio
nOf
fices
Ksh
s. M
illio
ns
Major Categories of Development Expenditure
Source: Baringo County Treasury

COUNTY GOVERNMENTS BUDGET IMPLEMENTATION REVIEW REPORT FIRST HALF FY, 2015/1630
Analysis of the development expenditure of Kshs.494.02 million incurred in the first half of FY 2015/16 indicates that the highest expenditure of Kshs.222.17 million was spent by the Roads Department on development and maintenance of access roads and purchase of a garbage truck. A total of 261 kilometres of roads were maintained across the 45 wards. The second highest expenditure of Kshs.26.37 million was incurred by the Health Department on construction of health facilities. The Department of Land, Physical Planning and Urban Development incurred Kshs.21.40 million on installation of street lights while the Department of Agriculture incurred Kshs.14.44 million on Artificial Insemination Programme.
3.1.8 Annual Budget and Budget Performance Analysis by department for the First Half of FY 2015/16
A summary of FY 2015/16 annual budget estimates and budget performance for the first half by department is shown in Table 3.2.
Table 3.2: Baringo County, Annual Budget and First Half of FY 2015/16 Budget Performance by Department
Department Annual Budget Allo-cation (Kshs.Million)
6 Months Exche-quer Issues (Kshs.
Million)
6 Months Expendi-ture (Kshs.Million)
Expenditure to Exchequer Issues
(%)
Absorption rate (%)
Rec Dev Rec Dev Rec Dev Rec Dev Rec Dev
County Assembly 506.46 79.41 269.75 14.00 154.34 7.56 57.2 54.0 30.5 9.5
Governor/County Exec-utive services 328.25 83.18 130.43 - 126.75 2.95 97.2 - 38.6 3.5
County Treasury Services 343.32 53.36 165.29 0.50 114.93 0.69 69.5 138.4 33.5 1.3
Transport and Infra-structure 53.55 516.99 29.85 152.65 25.29 118.84 84.7 77.8 47.2 23.0
Industrialization, Com-merce and Tourism 96.97 113.24 60.51 51.35 36.63 37.30 60.5 72.6 37.8 32.9
Education, Sports, Culture & Art 268.05 221.57 117.90 57.62 116.19 67.84 98.6 117.7 43.3 30.6
Health 1,375.05 427.17 794.20 147.80 941.42 95.29 118.5 64.5 68.5 22.3
Housing & Urban Development 82.71 116.37 40.83 22.50 38.87 26.91 95.2 119.6 47.0 23.1
Agriculture, Livestock, Fisheries & Marketing 210.65 235.49 115.93 51.50 96.39 29.25 83.1 56.8 45.8 12.4
Youth, Gender & Social Security Services 48.35 104.98 15.32 15.50 16.68 4.69 108.9 30.3 34.5 4.5
Water & Irrigation 88.33 414.02 45.79 128.00 39.06 95.58 85.3 74.7 44.2 23.1
Environment & Natural Resources 28.31 48.23 11.86 6.00 17.07 7.12 143.9 118.7 60.3 14.8
Total 3,430.01 2,414.02 1,797.67 647.42 1,723.64 494.02 95.9 76.3 50.3 20.5
Source: Baringo County Treasury

COUNTY GOVERNMENTS BUDGET IMPLEMENTATION REVIEW REPORT FIRST HALF FY, 2015/16 31
Analysis of budget performance by department shows that the Department of Trade and Industrialization reported the highest absorption rate for development expenditure at 32.9 per cent while the County Treasury registered the lowest at 1.3 per cent. On the other hand, the Health Department had the highest percentage of its recurrent expenditure to annual recurrent budget at 68.5 per cent while the County Assembly had the lowest at 30.5 per cent.
3.1.9 Borrowing by the County Government
Article 212 of the Constitution requires a county government to borrow with approval from the County Assembly, and only if the national government guarantees the loan. Further, Section 58 of the PFM Act 2012 gives the Cabinet Secretary of the National Treasury powers to guarantee loans subject to approval by Parliament. During the period under review, the County did not report any borrowing.
3.1.10 Observations and Recommendations
The County has made progress in addressing the challenges previously identified as affecting budget implementation. Some of the progress made include:
i. Establishment of an Internal Audit Committee and strengthened internal audit function.
ii. Establishment of an enforcement unit to strengthen revenue collection efforts.
iii. Stoppage of irregular payments of allowances not awarded by the Salaries and Remuneration Commission to County staff. However, the irregularly paid allowances are yet to be recovered.
iv. Improvement of working relationship between the County Executive and the County Assembly.
Despite the progress made, the following observations continued to hamper effective budget implementation in the county;
1. Infrastructural challenges in the implementation of the E-Procurement module.
2. Failure to develop guidelines and regulations to operationalize the County established Funds.
3. Failure to observe key budgetary timelines.
The County should therefore implement the following recommendations in order to improve budget execution
1. The County Treasury should liaise with the IFMIS Directorate to ensure smooth implementation of the E-Procurement module.
2. The County Treasury should develop regulations for approval by the County Assembly to operationalize the County established Funds in line with Section 116 of the PFM Act 2012.

COUNTY GOVERNMENTS BUDGET IMPLEMENTATION REVIEW REPORT FIRST HALF FY, 2015/1632
3. The County Government should adhere to budget timelines as outlined in the PFM Act 2012.
3.2 Bomet County
3.2.1 Overview of the FY 2015/16 Budget
The FY 2015/16 approved budget for the County was Kshs.4.92 billion. It comprised of Kshs.2.74 billion (55.5 per cent) allocated to recurrent expenditure and Kshs.2.18 billion (44.5 per cent) to development expenditure.
In order to finance the budget, the County expects to receive Kshs.4.67 billion (94.9 per cent) as equitable share from the National Government, collect Kshs.230.33 million (4.6 per cent) from local sources and receive a conditional grant of Kshs.15.35 million (0.3 per cent) from DANIDA.
While reviewing the approved budget, the OCOB noted that the County had under budgeted for the equitable share by Kshs.32.01 million. In addition, the County did not budget for the conditional grants contained in the CARA 2015, which included; Kshs.16.88 million for compensation of forgone user fees, Kshs.95.74 million for leasing of medical equipment, Kshs.59.79 million from the Road Maintenance Fuel Levy Fund, Kshs.58.45 million for Maternal Health care, and Kshs.26.75 million as balance brought forward from FY 2014/15.
3.2.2 Revenue Analysis
During the first half of FY 2015/16, the County received Kshs.2.38 billion from the National Government as equitable share, Kshs.30.20 million from the Road Maintenance Fuel Levy Fund, Kshs.8.81 million from DANIDA, Kshs.19.50 million as conditional allocation for free maternal health care, Kshs.0.88 million as conditional allocation for forgone user fees, generated Kshs.57.34 million from local sources, and had Kshs.26.74 million cash balance brought forward from FY 2014/15. The local revenue consisted of Kshs.26.95 million raised in the first quarter and Kshs.30.40 million in the second quarter of FY 2015/16.
The total local revenue raised in the first half of the FY 2015/16 was Kshs.57.34 million (24.9 per cent of the annual local revenue target) and a decrease from Kshs.62.21 million collected in the first half of FY 2014/15. The quarterly trend in local revenue collection by quarter from the first quarter of FY 2013/14 to the second quarter of FY 2014/15 is shown in figure 3.5.

COUNTY GOVERNMENTS BUDGET IMPLEMENTATION REVIEW REPORT FIRST HALF FY, 2015/16 33
Figure 3.5: Bomet County, Trend in Local Revenue Collection by Quarter from the FY 2013/14 to the second quarter of FY 2015/16
76.00 75.14
30.40
0
10
20
30
40
50
60
70
80
Ksh
s. M
illio
ns
Reporting Period
Source: Bomet County Treasury
The analysis of local revenue realized in the first half of FY 2015/16 by stream is shown in
Table 3.3.
Table 3.3: Bomet County, Analysis of revenue collection by stream for the first half of FY 2015/16
No. Revenue Stream Annual Targeted Revenue (Kshs.)
Six Months Actual Revenue (Kshs.)
Revenue Performance (%)
A B C D=*100
1 Embomos Tea Farm 11,132,950 9,846,540 88.4
2 Rental Income 4,455,120 2,276,477 51.1
3 Cess Collections 4,967,682 2,027,410 40.8
4 Parking Charges 17,412,621 6,388,660 36.7
5 Markets & Slaughter 17,473,131 5,798,784 33.2
6 Hospitals/Dispensaries/Health Cen-tres (HSSF) 64,380,392 19,386,637 30.1
7 Business Permits 49,476,215 4,848,925 9.8
8 Property Rates 97,549,815 2,708,596 2.8
9 Misclellaneous revenue streams 23,800,207 28,110,386 118.1
Total 290,648,134 57,343,563 19.7
Source: Bomet County Treasury
The analysis of revenue by stream indicates that misclellaneous revenue recorded the highest performance against the annual local revenue target at 118.1 percent followed by Embomos Tea Farm at 88.4 per cent. In addition, the revenue target by stream of Kshs.290.6 million varies from the revenue target contained in the approved budget of Kshs.230.33 million.

COUNTY GOVERNMENTS BUDGET IMPLEMENTATION REVIEW REPORT FIRST HALF FY, 2015/1634
3.2.3 Banking of local revenue
A review of the bank statements for the revenue collection account indicates that all locally generated revenue was deposited into the CRF during the period under review. This conforms to Article 207 of the Constitution and Section 109 of the PFM Act 2012, which stipulates that all funds raised or received by or on behalf of the County Government should be deposited into the CRF account, unless excluded by an Act of Parliament.
3.2.4 Exchequer Issues
The COB authorized withdrawal of Kshs.2.49 billion from the CRF, which represented 50.6 per cent of the approved budget. The amount was an increase of 19.1 per cent from Kshs.2.09 billion authorized in a similar period of FY 2014/15 and consisted of Kshs.1.31 billion (52.5 per cent) for recurrent expenditure and Kshs.1.18 million (47.5 per cent) for development activities.
3.2.5 Overall Expenditure Review
The County spent a total of Kshs.2.33 billion during the first half of FY 2015/16 which was 93.6 per cent of the total funds released for both recurrent and development expenditure. This is an increase from the Kshs.1.84 billion spent in a similar period of FY 2014/15. A total of Kshs.1.21 billion was spent on recurrent activities and Kshs.1.12 billion on development activities. Recurrent expenditure was 92.9 per cent of the funds released for recurrent activities while development expenditure accounted for 94.9 per cent of the funds released for development activities. The expenditure excludes commitments as of 31st December, 2015 that amounted to Kshs.170 million for development and Kshs.68 million for recurrent expenditure.
Recurrent expenditure for the period under review represented 44.3 per cent of the approved annual recurrent budget, a decrease from 54.8 per cent spent in a similar period of FY 2014/15. On the other hand, development expenditure recorded an absorption rate of 51.2 per cent, an improvement from 29.4 per cent spent in a similar period of FY 2014/15. A comparison of the total expenditure in the first half of FY 2014/15 and the first half of FY 2015/16 is shown in Figure 3.6.
Figure 3.6: Bomet County, Expenditure by Economic Classification for first half of FY 2014/15 and FY 2015/16
783.02
259.10
795.15
940.67
273.82
1,116.05
-
200.00
400.00
600.00
800.00
1,000.00
1,200.00
Personnel Emoluments Operation and Maintenance Development
Kshs
.mill
ions
Expenditure by Economic Classification
1st Half of FY 2014/15
1st Half of FY 2015/16
Source: Bomet County Treasury

COUNTY GOVERNMENTS BUDGET IMPLEMENTATION REVIEW REPORT FIRST HALF FY, 2015/16 35
3.2.6 Recurrent Expenditure Analysis
The total recurrent expenditure for the reporting period was Kshs.1.21 billion against an annual recurrent budget of Kshs.2.74 billion. This represents 44.3 per cent of the annual recurrent budget. The County spent Kshs.940.67 million (77.5 per cent) on personnel emoluments and Kshs.273.82 million (22.5 per cent) on operations and maintenance as shown in Figure 3.6. Expenditure on personnel emoluments accounted for 40.4 per cent of total expenditure and has increased significantly in the first half of FY 2015/16 as compared to a similar period in FY 2014/15 when the County spent Kshs.783.02 million. The increase is attributed to continuous recruitment of staff.
The County spent Kshs.15.77 million on sitting allowances to the 35 MCAs and the Speaker against an annual budget of Kshs.56.63 million. This is a marginal increase from Kshs.23.25 million recorded in a similar period of FY 2014/15. The average monthly sitting allowance per MCA was Kshs.75,091 compared to SRC’s recommended monthly ceiling of Kshs.124,800.
A breakdown of the operations and maintenance expenditure is shown in Figure 3.7.
Figure 3.7: Bomet County, Operations and Maintenance Expenditure for the first half of FY 2015/16
59.36
24.09 20.39 18.39 18.24 15.77 13.488.40 8.17 5.86 5.61 5.51
0.0010.0020.0030.0040.0050.0060.0070.00
Dom
estic
and
Fore
ign
Trav
el- C
ount
y A
ssem
bly
Dom
estic
and
Fore
ign
Trav
el- C
ount
y Ex
ecut
ive
Mai
nten
ance
of P
lant
s
Fue
ls an
d Lu
bric
ants
Oth
er O
pera
ting
Expe
nses
MCA
-Sitt
ing
Allo
wan
ce
Cate
ring
Serv
ices
Pur
chas
e of M
otor
Veh
icle
s
Coun
ty A
ssem
bly
Trai
ning
Costs
Ren
t & R
ates
- R
esid
entia
l
Sub
scrip
tions
to N
ewsp
aper
s
MCA
-Mile
age a
llow
ance
s
Ksh
s. M
illio
ns
Major Categoris of O & M Expenditure
Source: Bomet County Treasury
The aggregate expenditure on domestic and foreign travel was Kshs.83.45 million as compared to Kshs.46.9 million incurred in a similar period of FY 2014/15, representing an increase of 77.9 per cent. This expenditure comprised of Kshs.24.09 million spent by the County Executive and Kshs.59.36 million by the County Assembly.

COUNTY GOVERNMENTS BUDGET IMPLEMENTATION REVIEW REPORT FIRST HALF FY, 2015/1636
3.2.7 Development Expenditure Analysis
The summary of development expenditure during the first half of FY 2015/16 is provided in figure 3.8.
Figure 3.8: Bomet County, Summary of Development Expenditure for the First Half of FY 2015/16
202.77
134.96 117.27
92.03 72.68
48.07 43.02 40.06 31.31 29.92 21.83 20.32 20.24
-
50.00
100.00
150.00
200.00
250.00
Cons
truct
ion
of R
oads
Capi
tal T
rans
fers
to in
divi
dual
san
d H
ouse
hold
s-O
ld ag
e
Cons
truct
ion
of E
CD C
lass
room
s
Cap
ital G
rant
s to
Sem
i-A
uton
omou
s Gov
ernm
ent…
Cash
Tra
nsfe
rs to
Hea
lthFa
cilit
ies
Purc
hase
of M
edic
al D
rugs
Ove
rhau
l of O
ther
Infra
struc
ture
and
Civi
l Wor
ks
Wat
er S
uppl
ies a
nd S
ewer
age
Non
Res
iden
tialB
uild
ings
-O
ffice
s
Infra
struc
ture
Dev
elop
men
t and
Expa
nsio
n
Burs
arie
s and
Sup
port
Serv
ices
Purc
hase
of M
edic
al an
d D
enta
lEq
uipm
et
Oth
er In
frastr
uctu
re an
d Ci
vil
Wor
ks
Ksh
s. M
illio
n
Major Categories of Development Expenditure
Source: Bomet County Treasury
Analysis of the development expenditure of Kshs.1.12 billion incurred in the first half of FY 2015/16 indicates that the Roads Department reported the highest expenditure at Kshs.202.77 million which was spent on development and maintenance of access roads. A total of 223 kilometers of roads were maintained across the 45 wards. The second highest category of development expenditure was Kshs.134.96 million, which was spent on capital transfers to individuals. The Department of Education and vocational training incurred Kshs.117.27 million on building of ECD classrooms while Kshs.92.03 million was spent on capital grants to Semi-Autonomous Government Agencies.
3.2.8 Annual Budget and Budget Performance Analysis by department for the First Half of FY 2015/16
A summary of the FY 2015/16 annual budget estimates and budget performance for the first half of FY 2015/16 by department is shown in Table 3.4.

COUNTY GOVERNMENTS BUDGET IMPLEMENTATION REVIEW REPORT FIRST HALF FY, 2015/16 37
Table 3.4: Bomet County, Annual Budget and First Half of FY 2015/16 Budget Performance by Department
Department Annual Budget Allo-cation (Kshs)
Six Months Exchequer Issues (Kshs)
Six Months Expendi-ture (Kshs)
Six Months Expenditure to Exchequer
issues (%)
Expenditure to Annual Budget (Absorption %)
Rec Dev Rec Dev Rec Dev Rec Dev Rec Dev
County Assembly 489.4 10 247.5 - 161.85 - 65.4 - 33.1 -
County Executive & Administration 719.7 70 339.3 25.1 331.82 31.31 97.8 124.7 46.1 44.7
Agri Business & Mar-keting 161.4 239.1 77.3 96.6 96.34 48.14 124.6 49.8 59.7 20.1
Social Services 53.8 399.2 22 246.7 22.14 183.73 100.6 74.5 41.2 46Public Health & Envi-ronment 113.9 41.58 48.3 12.4 49 - 101.4 - 43 -
Finance & Economic Planning 314.4 25.7 145.6 11.1 142.43 2.83 97.8 25.5 45.3 11
Water and Irrigation 39 290.3 22.2 153.8 20.32 172.6 91.5 112.2 52.1 59.5
Land, Housing and Urban Planning 63.3 63 30 27.5 30.8 43.85 102.7 159.5 48.7 69.6
Education And Vocation-al Training 178 296.7 81.5 128.6 82.19 180.84 100.8 140.6 46.2 61
Roads And Public Works 157.2 309.23 65.3 242 47.82 227.7 73.2 94.1 30.4 73.6
Medical Services 432.2 378 221 228.2 224.18 203.55 101.4 89.2 51.9 53.8
Trade Energy, Tourism & Industrialization 17 59 7.13 9.5 5.6 21.5 78.5 226.3 32.9 36.4
TOTAL 2,739.30 2,181.81 1,307.13 1,181.50 1,214.49 1,116.05 92.9 94.5 44.3 51.2
Source: Bomet County Treasury
Analysis of budget performance by department shows that the Department of Roads and Public Works reported the highest absorption rate of its development budget at 73.6 per cent while the Department of Public Health and Environment, and the County Assembly did not report any development expenditure. Conversely, the Department of Agri-Business and Marketing had the highest percentage of its recurrent budget at 59.69 per cent while the Roads and Public Works Department had the lowest percentage at 30.43 per cent.
3.2.9 Borrowing by the County Government
Article 212 of the Constitution requires a county government to borrow with approval from the County Assembly, and only if the national government guarantees the loan. Further, Section 58 of the PFM Act 2012 gives the Cabinet Secretary to the National Treasury the powers to guarantee loans subject to approval by Parliament. During the period under review, the County did not report any borrowing.

COUNTY GOVERNMENTS BUDGET IMPLEMENTATION REVIEW REPORT FIRST HALF FY, 2015/1638
3.2.10 Observations and Recommendations
The County has made progress in addressing the challenges previously identified as affecting budget implementation. Some of the progresses made by the county include:
i. Improvement in absorption of development funds from 23.08 per cent reported in the first half of FY 2014/15 to 51.15 per cent in the period under review.
ii. Improvement in local revenue collection from 16.3 per cent of the annual revenue target in the first half of FY 2014/15 to 24.9 per cent in the similar period of FY 2015/16.
Despite the progress made, low local revenue collection continued to hamper effective budget implementation. During the reporting period, the County collected a total of Kshs.57.34 million which accounted for 24.9 per cent of the of the annual revenue target in FY 2015/16 against an expected outturn of 50 per cent.
1. The County Treasury should come up with strategies to enhance local revenue collection. This will enable the County to implement the planned activities.
3.3 Bungoma County
3.3.1 Overview of the FY 2015/16 Budget
The FY 2015/16 approved Supplementary Budget for Bungoma County amounted to Kshs.9.97 billion. It comprised of Kshs.5.78 billion (58.0 per cent) allocated for recurrent expenditure and Kshs.4.19 billion (42.0 per cent) for development expenditure.
In order to finance the budget, the County expects to receive Kshs.7.77 billion (78.0 per cent) as transfers from the National Government, collect Kshs.819.94 million (8.0 per cent) from local sources, receive a conditional grant of Kshs.14.75 million (0.2 per cent) from DANIDA and, Kshs.1.37 billion (13.8 per cent) opening cash balance brought forward from FY 2014/15. However, the County did not budget for the additional conditional grants of Kshs.401.90 million from the National Government as contained in CARA, 2015 for free Maternal health care, compensation of forgone user fees, leasing of medical equipment and the road maintenance fuel levy fund.
3.3.2 Revenue Analysis
In the first half of FY 2015/16, the County received Kshs.2.51 billion from the National Government as equitable share, Kshs.49.24 million as conditional allocations from the road maintenance fuel levy fund, Kshs.71.81 million as conditional allocation for free maternal health care, Kshs.4.42 million as conditional allocations for forgone user fees, raised Kshs.184.32 million from local sources, and had a cash balance of Kshs.1.37 billion brought forward from FY 2014/15..The quarterly trend in local revenue collection from the FY 2013/14 to the second quarter of FY 2015/16 is shown in figure 3.9.

COUNTY GOVERNMENTS BUDGET IMPLEMENTATION REVIEW REPORT FIRST HALF FY, 2015/16 39
Figure 3.9: Bungoma County, Trend in Local Revenue Collection by Quarter from the FY 2013/14 to the second quarter of FY 2015/16
60.3775.81
156.88
199.92
81.7
0
50
100
150
200
250
Ksh
s.Mill
ion
Reporting period
Source: Bungoma County Treasury
The local revenue consisted of Kshs.102.62 million raised in the first quarter and Kshs.81.70 million in the second quarter.
The local revenue raised in the first half of the FY 2015/16 was Kshs.184.32 million (22.5 per cent of the annual local revenue target), and an improvement from Kshs.147.82 million collected in a similar period of FY 2014/15
The analysis of local revenue for the first half of FY 2015/16 by stream is shown in Table 3.5.
Table 3.5: Bungoma County Analysis of revenue collection by stream for the first half of FY 2015/16
No. Revenue Stream Annual Targeted Revenue (Kshs.)
6 Months Actual Revenue (Kshs.) Revenue Performance (%)
A B C D=*100
1 Enclosed Bus Park Fee 25,605,158 23,114,750 90.3
2 Market Fees 23,101,432 19,740,055 85.4
3 Single Business Permits 15,658,213 11,473,710 73.3
4 Cess 22,127,758 15,330,456 69.3
5 AIA 145,344,141 77,685,834 53.4
6 Other sources 588,104,636 36,979,210 6.3
TOTAL 819,941,338 184,324,015 22.5
Source: Bungoma County Treasury
The analysis of revenue by stream indicates that bus park fees recorded the highest performance against annual target at 90.3 per cent followed by market fees at 85.5 per cent.

COUNTY GOVERNMENTS BUDGET IMPLEMENTATION REVIEW REPORT FIRST HALF FY, 2015/1640
3.3.3 Banking of Local Revenue
A review of the bank statements for the revenue collection accounts indicates that the County did not bank all the locally generated revenue into the CRF. The Department of Health did not sweep its revenue to the CRF account maintained at CBK. This contravenes Article 207 of the Constitution and Section 109 of the PFM Act 2012, which stipulates that all funds raised or received by or on behalf of the County Government should be deposited into the CRF account, unless excluded by an Act of Parliament.
3.3.4 Exchequer Issues
During the period under review, the COB authorised withdrawal of Kshs.3.67 billion from the CRF account, which represented 36.9 per cent of the approved budget. The withdrawn amount represented an increase from Kshs.3.45 billion authorized in a similar period of FY 2014/15 and consisted of Kshs.2.51 billion (68.4 per cent) for recurrent expenditure and Kshs.1.16 billion (31.6 per cent) for development activities.
3.3.5 Overall Expenditure Review
The County spent a total of Kshs.3.11 billion during the first half of FY 2015/16 which was 84.6 per cent of the funds released for operations. This was an increase from the Kshs.2.85 billion spent in a similar period of FY 2014/15. A total of Kshs.2.33 billion was spent on recurrent activities and Kshs.781.93 million on development activities. Recurrent expenditure was 92.6 per cent of the funds released for recurrent activities while development expenditure accounted for 67.3 per cent of the funds released for development activities. The expenditure excludes commitments as of 31st December, 2015 that amounted to Kshs.343.19 million for recurrent expenditure. The County Treasury did not provide for the outstanding commitments for development expenditure.
Recurrent expenditure for the period under review represented 40.3 per cent of the approved annual recurrent budget, a decrease from 43.3 per cent spent in a similar period of FY 2014/15. Development expenditure recorded an absorption rate of 18.7 per cent, an improvement from 12.0 per cent spent in a similar period of FY 2014/15.
A comparison of the total expenditure between the first half of FY 2014/15 and the first half of FY 2015/16 is shown in Figure 3.10.

COUNTY GOVERNMENTS BUDGET IMPLEMENTATION REVIEW REPORT FIRST HALF FY, 2015/16 41
Figure 3.10: Bungoma County, Expenditure by Economic Classification for First Half of FY 2014/15 and First Half of FY 2015/16
1449.96
876.6781.93
893.79 889.291,068.10
0
200
400
600
800
1000
1200
1400
1600
Personnel Emoluments Operations & Maintenance Development
Ksh
s. M
illi
ons
Expenditure by Economic Classification
1st Half, FY 2015/16
1st Half, FY 2014/15
Source: Bungoma County Treasury
3.3.6 Recurrent Expenditure Analysis
The total recurrent expenditure for the reporting period was Kshs.2.33 billion against an annual recurrent budget of Kshs.5.78 billion. This represents 40.3 per cent of the annual recurrent budget. The County spent Kshs.1.45 billion (62.2 per cent) on personnel emoluments and Kshs.876.6 million (37.8 per cent) on operations and maintenance as shown in Figure 3.10. Expenditure on personnel emoluments accounted for 46.6 per cent of total expenditure and has increased significantly in the first half of FY 2015/16 as compared to the similar period in FY 2014/15 when the County spent Kshs.893.79 million.
The County spent Kshs.42.78 million on sitting allowances to the 64 MCAs and the Speaker against an annual budget of Kshs.105.71 million. This is an increase from Kshs.59.40 million recorded in a similar period of FY 2014/15. The average monthly sitting allowance per MCA was Kshs.111, 396 compared to SRC’s recommended monthly ceiling of Kshs.124, 800.
A breakdown of the operations and maintenance expenditure is shown in Figure 3.11.

COUNTY GOVERNMENTS BUDGET IMPLEMENTATION REVIEW REPORT FIRST HALF FY, 2015/1642
Figure 3.11: Bungoma County, Operations and Maintenance Expenditure for the first half of FY 2015/16
189.30 188.99
134.48 133.25
37.00 25.91 18.42 12.24 12.14 9.24 6.50 6.43 4.91 2.600
20406080
100120140160180200
Fuel
, oil
& lu
brica
nts
Dom
estic
& F
oreig
n tra
vel
Supp
liers
cred
it
Othe
r ope
ratin
g co
sts
Train
ing
Hosp
italit
y &
Con
fere
nces
Gene
ral s
uppl
ies
Emer
genc
y fu
nd
Insu
ranc
e cos
ts
Prin
ting
& A
dver
tisin
g
Rout
ine m
ainten
ance
( oth
eras
sets)
Rout
ine m
ainten
ance
( mot
orve
hicle
)
Utili
ties
Com
mun
icatio
n se
rvic
es
Ksh
s. M
illio
ns
Major Categories of O & M Expenditure
Source: Bungoma County Treasury
The aggregate expenditure on domestic and foreign travel was Kshs.188.99 million as compared to Kshs.73.00 million incurred in a similar period of FY 2014/15, representing an increase of 158.9 per cent. This expenditure comprised of Kshs.176.46 million spent by the County Executive and Kshs.12.53 million by the County Assembly.
3.3.7 Development Expenditure AnalysisDetails of development expenditure during the first half of FY 2015/16 are provided in figure 3.2.
Figure 3.12: Bungoma County, Summary of Development Expenditure for the first half of FY 2015/16
207.64186.33
64.548.38 45.00 42.67 41.40 39.05 37.39 32.31
15.56 7.15 5.00 3.15 2.84 2.280
50
100
150
200
250
Over
haul
of ot
her i
nfras
tructu
re
Over
haul
of R
oads
and B
ridge
s
Acqu
isitio
n of s
trateg
ic sto
ck
Purc
hase
of A
gricu
ltura
l Mac
hine
ry
Scho
larsh
ip an
d oth
er Ed
ucati
onal
bene
fits
Othe
r Inf
rastr
uctu
re an
d oth
er C
ivil
work
s
Purc
hase
of IC
T ne
twor
ks
Purc
hase
of li
ghtin
g Equ
ipm
ent a
ndco
ntra
cted t
echn
icals
Wate
r and
Sew
erag
e
Purc
hase
of A
gricu
ltura
l equ
ipm
ent
and C
ertif
ied C
rops
Non-
resid
entia
l bui
ldin
gs
Purc
hase
of m
edica
l and
lab i
tems
Micr
o Fin
ance
You
th P
rogr
amm
e
Engi
neer
ing a
nd D
esig
n
Coun
ty R
esou
rce M
appi
ng
Acqu
isitio
n of l
and
Ksh
s.Mill
ions
Major Categories of Development Expenditure
Source: Bungoma County Treasury
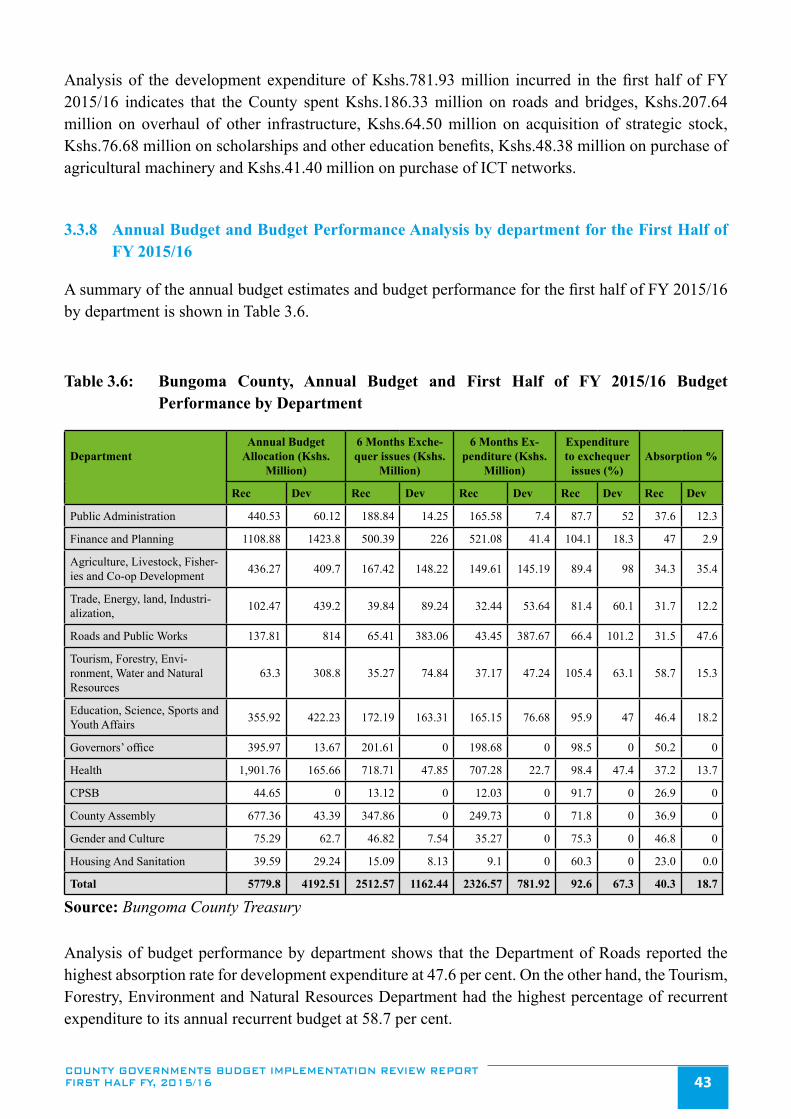
COUNTY GOVERNMENTS BUDGET IMPLEMENTATION REVIEW REPORT FIRST HALF FY, 2015/16 43
Analysis of the development expenditure of Kshs.781.93 million incurred in the first half of FY 2015/16 indicates that the County spent Kshs.186.33 million on roads and bridges, Kshs.207.64 million on overhaul of other infrastructure, Kshs.64.50 million on acquisition of strategic stock, Kshs.76.68 million on scholarships and other education benefits, Kshs.48.38 million on purchase of agricultural machinery and Kshs.41.40 million on purchase of ICT networks.
3.3.8 Annual Budget and Budget Performance Analysis by department for the First Half of FY 2015/16
A summary of the annual budget estimates and budget performance for the first half of FY 2015/16 by department is shown in Table 3.6.
Table 3.6: Bungoma County, Annual Budget and First Half of FY 2015/16 Budget Performance by Department
DepartmentAnnual Budget
Allocation (Kshs. Million)
6 Months Exche-quer issues (Kshs.
Million)
6 Months Ex-penditure (Kshs.
Million)
Expenditure to exchequer
issues (%)Absorption %
Rec Dev Rec Dev Rec Dev Rec Dev Rec Dev
Public Administration 440.53 60.12 188.84 14.25 165.58 7.4 87.7 52 37.6 12.3
Finance and Planning 1108.88 1423.8 500.39 226 521.08 41.4 104.1 18.3 47 2.9
Agriculture, Livestock, Fisher-ies and Co-op Development 436.27 409.7 167.42 148.22 149.61 145.19 89.4 98 34.3 35.4
Trade, Energy, land, Industri-alization, 102.47 439.2 39.84 89.24 32.44 53.64 81.4 60.1 31.7 12.2
Roads and Public Works 137.81 814 65.41 383.06 43.45 387.67 66.4 101.2 31.5 47.6
Tourism, Forestry, Envi-ronment, Water and Natural Resources
63.3 308.8 35.27 74.84 37.17 47.24 105.4 63.1 58.7 15.3
Education, Science, Sports and Youth Affairs 355.92 422.23 172.19 163.31 165.15 76.68 95.9 47 46.4 18.2
Governors’ office 395.97 13.67 201.61 0 198.68 0 98.5 0 50.2 0
Health 1,901.76 165.66 718.71 47.85 707.28 22.7 98.4 47.4 37.2 13.7
CPSB 44.65 0 13.12 0 12.03 0 91.7 0 26.9 0
County Assembly 677.36 43.39 347.86 0 249.73 0 71.8 0 36.9 0
Gender and Culture 75.29 62.7 46.82 7.54 35.27 0 75.3 0 46.8 0
Housing And Sanitation 39.59 29.24 15.09 8.13 9.1 0 60.3 0 23.0 0.0
Total 5779.8 4192.51 2512.57 1162.44 2326.57 781.92 92.6 67.3 40.3 18.7
Source: Bungoma County Treasury
Analysis of budget performance by department shows that the Department of Roads reported the highest absorption rate for development expenditure at 47.6 per cent. On the other hand, the Tourism, Forestry, Environment and Natural Resources Department had the highest percentage of recurrent expenditure to its annual recurrent budget at 58.7 per cent.

COUNTY GOVERNMENTS BUDGET IMPLEMENTATION REVIEW REPORT FIRST HALF FY, 2015/1644
3.3.9 Borrowing by the County Government
Article 212 of the Constitution requires a county government to borrow with approval from the County Assembly, and only if the national government guarantees the loan. Further, Section 58 of the PFM Act 2012 gives the Cabinet Secretary to the National Treasury the powers to guarantee loans subject to approval by Parliament. During the period under review, the County did not borrow any funds.
3.3.10 Observations and RecommendationsThe County has made progress in addressing the challenges previously identified as affecting budget implementation. The County has:
i. Fully embraced the IFMIS system in processing financial transactions.
ii. Improved its staff capacity through training.
Despite the progresses made, the following challenges continued to hamper effective budget implementation;
1. Late submission of financial reports by the County Treasury contrary to Section 168 and 166 of the PFM Act 2012.
2. Failure to establish an Internal Audit Committee in line with Section 155 of the PFM Act 2012.
3. A high wage bill, which increased from Kshs.893.79 million in the first half year of FY 2014/15 to Kshs.1,449.96 million in the first half of FY 2015/16.
4. Failure to budget for all the conditional allocations as contained in CARA 2015.
The County should implement the following recommendations in order to improve budget execution;
1. The County Treasury should ensure timely preparation and submission of financial reports.
2. The County Treasury should establish an internal audit committee to oversee operations of the Internal Audit Department.
3. The County should review its payroll costs and devise strategies to ensure sustainability.
4. The County Treasury should prepare a Supplementary Budget to include the conditional allocations contained in the CARA, 2015.
3.4 Busia County
3.4.1 Overview of the FY 2015/16 Budget
The FY 2015/16 approved budget for Busia County amounts to Kshs.6.27 billion. It Comprised of Kshs.3.31 billion (52.8 per cent) allocated for recurrent expenditure and Kshs.2.96 billion (47.2 per

COUNTY GOVERNMENTS BUDGET IMPLEMENTATION REVIEW REPORT FIRST HALF FY, 2015/16 45
cent) for development expenditure.
In order to finance the budget, the County expected to receive Kshs.5.44 billion (86.8 per cent) as transfers from the National Government, collect Kshs.543.04 million (8.7 per cent) from local sources, and receive a conditional grant of Kshs.12.99 million (0.20 per cent) from DANIDA. However, Kshs.469.12 million representing the opening cash balance from FY 2014/15 was not factored in the FY 2015/16 budget. Further, the County under budgeted the additional conditional grants amounting to Kshs.275.94 million from the National Government as contained in CARA, 2015 for free maternal care, compensation of forgone user fees, leasing of medical equipment and road maintenance fuel levy fund.
3.4.2 Revenue Analysis
In the first half of FY 2015/16, the County received Kshs.2.38 billion from the National Government as equitable share, Kshs.34.90 million as conditional allocation from the road maintenance fuel levy fund, Kshs.35.34 million as conditional allocations for free maternal health care, Kshs.4.39 million as conditional allocation for forgone user fees, raised Kshs.176.81 million from local sources, and had a cash balance of Kshs.469.12 million brought forward from FY 2014/15.
The quarterly trend in local revenue collection from FY 2013/14 to the second quarter of FY 2015/16 is shown in figure 3.13.
Figure 3.13: Busia County, Trend in Local Revenue Collection by Quarter from the FY 2013/14 to the second quarter of FY 2015/16
74.40
108.80
40
50
60
70
80
90
100
110
120
KSh
s. m
illio
n
Reporting Period
Source: Busia County Treasury
The local revenue consisted of Kshs.108.80 million raised in the first quarter and Kshs.68.01 million in the second quarter. The local revenue raised in the first half of the FY 2015/16 was Kshs.176.81 million (32.6 per cent of the annual local revenue target), an improvement from Kshs.136 million collected in a similar period of FY 2014/15.

COUNTY GOVERNMENTS BUDGET IMPLEMENTATION REVIEW REPORT FIRST HALF FY, 2015/1646
The analysis of local revenue realized in the first half of FY 2015/16 by stream is shown in Table 3.7.
Table 3.7: Busia County, Analysis of revenue collection per stream for the first half of FY 2015/16
No. Revenue Stream Annual Targeted Revenue (Kshs.)
Six Months Actual Revenue (Kshs.)
Revenue Performance (%)
A B C D=*100
1 Tobacco Cess 2,456,521 2,122,027 86.4
2 Hospital Users Fees 69,000,000 42,093,658 61.0
3 Fish Cess 3,105,000 1,461,928 47.1
4 Trailer Parking Fees 126,500,000 58,195,370 46
5 Transit Produce Cess 28,750,000 12,655,257 44
6 Stock Sale 4,140,000 1,687,400 40.8
7 Bus Parking Fees 40,250,000 14,905,060 37
8 Market Fees 32,200,000 11,442,280 35.5
9 Single Business Permit 43,700,000 6,678,200 15.3
10 Other Sources 175,715,406 24,829,660 14.1
11 Sugar Cane Cess 17,250,000 741,602 4.3
TOTAL 543,066,927 176,812,442 32.6
Source: Busia County Treasury
Analysis of revenue by stream indicates that tobacco cess recorded the highest performance against the annual at 86.4 per cent followed by hospital user fees at 61.0 per cent.
3.4.3 Banking of local revenue
In the first half of FY 2015/16, the County banked all the locally generated revenue intact into the CRF. This conforms to Article 207 of the Constitution and Section 109 of the PFM Act 2012, stipulate that all funds raised or received by or on behalf of the County Government should be deposited into the CRF account, unless excluded by an Act of Parliament.
3.4.4 Exchequer Releases
The Controller of Budget authorised withdrawal of Kshs.3.06 billion from the CRF account, which was 48.8 per cent of the approved budget. The amount represented an increase of 52.2 per cent from Kshs.2.01 billion authorized in a similar period of FY 2014/15 and consisted of Kshs.1.96 billion (64.1 per cent) for recurrent expenditure and Kshs.1.10 billion (35.9 per cent) for development activities.
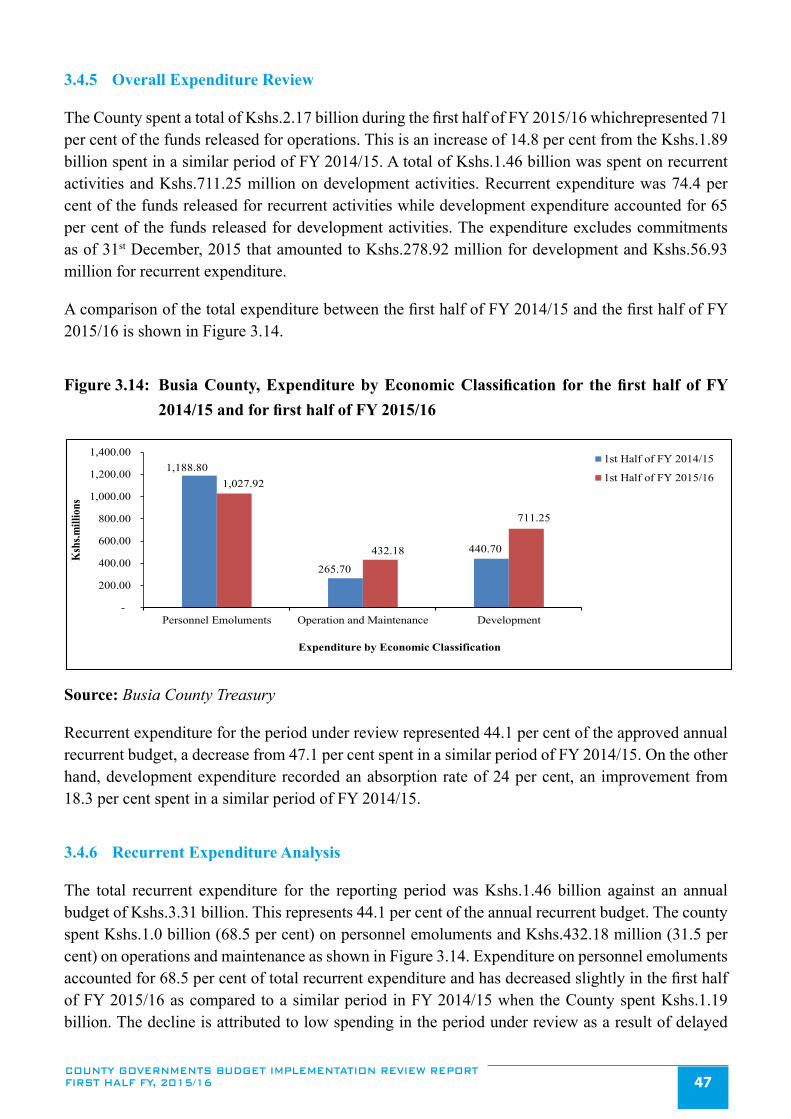
COUNTY GOVERNMENTS BUDGET IMPLEMENTATION REVIEW REPORT FIRST HALF FY, 2015/16 47
3.4.5 Overall Expenditure Review
The County spent a total of Kshs.2.17 billion during the first half of FY 2015/16 whichrepresented 71 per cent of the funds released for operations. This is an increase of 14.8 per cent from the Kshs.1.89 billion spent in a similar period of FY 2014/15. A total of Kshs.1.46 billion was spent on recurrent activities and Kshs.711.25 million on development activities. Recurrent expenditure was 74.4 per cent of the funds released for recurrent activities while development expenditure accounted for 65 per cent of the funds released for development activities. The expenditure excludes commitments as of 31st December, 2015 that amounted to Kshs.278.92 million for development and Kshs.56.93 million for recurrent expenditure.
A comparison of the total expenditure between the first half of FY 2014/15 and the first half of FY 2015/16 is shown in Figure 3.14.
Figure 3.14: Busia County, Expenditure by Economic Classification for the first half of FY 2014/15 and for first half of FY 2015/16
1,188.80
265.70
440.70
1,027.92
432.18
711.25
-
200.00
400.00
600.00
800.00
1,000.00
1,200.00
1,400.00
Personnel Emoluments Operation and Maintenance Development
Ksh
s.mill
ions
Expenditure by Economic Classification
1st Half of FY 2014/15
1st Half of FY 2015/16
Source: Busia County Treasury
Recurrent expenditure for the period under review represented 44.1 per cent of the approved annual recurrent budget, a decrease from 47.1 per cent spent in a similar period of FY 2014/15. On the other hand, development expenditure recorded an absorption rate of 24 per cent, an improvement from 18.3 per cent spent in a similar period of FY 2014/15.
3.4.6 Recurrent Expenditure Analysis
The total recurrent expenditure for the reporting period was Kshs.1.46 billion against an annual budget of Kshs.3.31 billion. This represents 44.1 per cent of the annual recurrent budget. The county spent Kshs.1.0 billion (68.5 per cent) on personnel emoluments and Kshs.432.18 million (31.5 per cent) on operations and maintenance as shown in Figure 3.14. Expenditure on personnel emoluments accounted for 68.5 per cent of total recurrent expenditure and has decreased slightly in the first half of FY 2015/16 as compared to a similar period in FY 2014/15 when the County spent Kshs.1.19 billion. The decline is attributed to low spending in the period under review as a result of delayed

COUNTY GOVERNMENTS BUDGET IMPLEMENTATION REVIEW REPORT FIRST HALF FY, 2015/1648
disbursement of funds by the National Treasury.
The county spent Kshs.25.32 million on sitting allowances to the 54 MCAs and the Speaker against an annual budget of Kshs.114.82 million. This was a marginal increase from Kshs.23 million recorded in a similar period of FY 2014/15. The average monthly sitting allowance per MCA was Kshs.78,141 compared to SRC recommended monthly ceiling of Kshs.124,800.
A breakdown of the operations and maintenance expenditure is shown in Figure 3.15.
Figure 3.15: Busia County, Operations and Maintenance Expenditure for the First Half of FY 2015/16
97.45
30.85
10.98 6.83 6.12 5.86 5.03 4.95 4.240
20
40
60
80
100
120
Dom
esti
c an
d Fo
reig
n T
rave
l-C
ount
y E
xecu
tive
Dom
esti
c an
d Fo
reig
n T
rave
l-C
ount
y A
ssem
bly
Spec
ializ
ed m
ater
ials
& s
uppl
ies
Prin
ting
& a
dver
tisi
ng s
ervi
ces
Ren
tal o
f Pr
oduc
ed A
sset
s
Hos
pita
lity
Sup
plie
s an
d Se
rvic
es
Fuel
, Oil
and
Lub
rica
nts
Tra
inin
g E
xpen
ses
Util
ity S
uppl
ies
and
Serv
ices
Ksh
s.m
illi
ons
Categories of O & M Expeniture
Source: Busia County Treasury
The aggregate expenditure on domestic and foreign travel was Kshs.128.30 million compared to Kshs.64.19 million incurred in a similar period of FY 2014/15, representing an increase of 99.9 per cent. This expenditure comprised of Kshs.97.45 million spent by the County Executive and Kshs.30.85 million by the County Assembly.
3.4.7 Development Expenditure Analysis
A summary of development expenditure during the first half of FY 2015/16 is provided in figure 3.16.
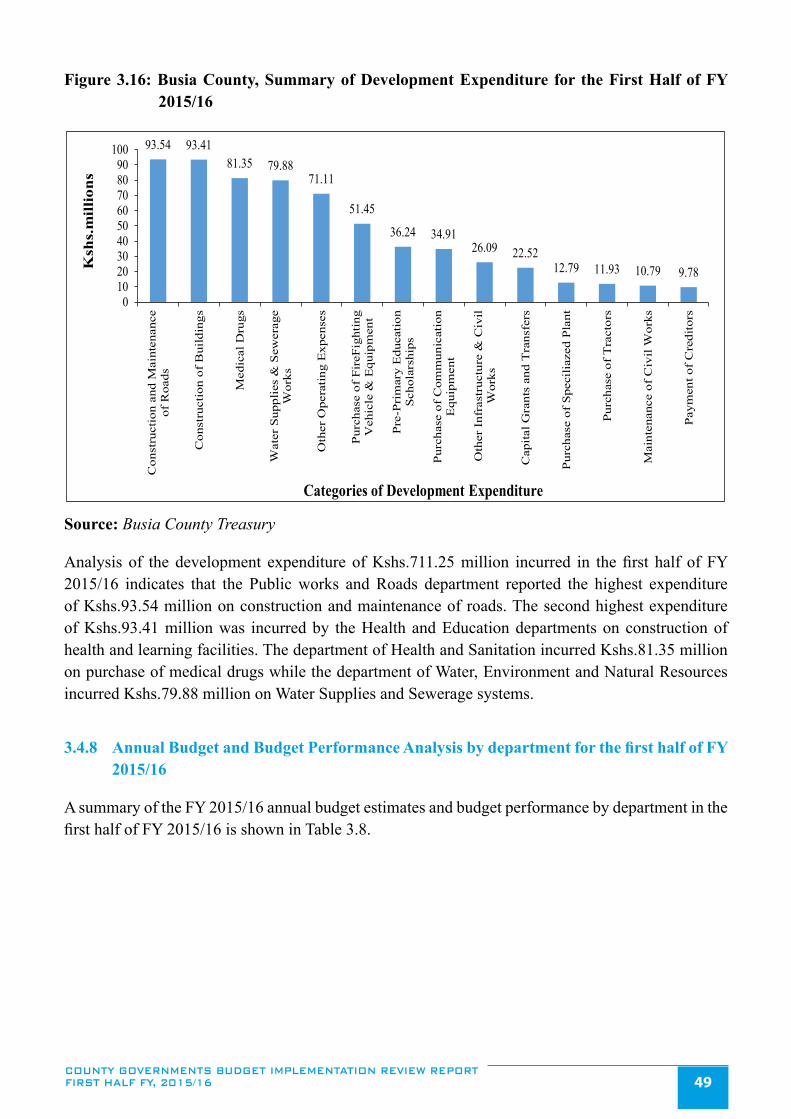
COUNTY GOVERNMENTS BUDGET IMPLEMENTATION REVIEW REPORT FIRST HALF FY, 2015/16 49
Figure 3.16: Busia County, Summary of Development Expenditure for the First Half of FY 2015/16
93.54 93.4181.35 79.88
71.11
51.45
36.24 34.9126.09 22.52
12.79 11.93 10.79 9.78
0102030405060708090
100C
onst
ruct
ion
and
Mai
nten
ance
of R
oads
Con
stru
ctio
n of
Bui
ldin
gs
Med
ical
Dru
gs
Wat
er S
uppl
ies
& S
ewer
age
Wor
ks
Oth
er O
pera
ting
Exp
ense
s
Pur
chas
e of
Fir
eFig
htin
gV
ehic
le &
Equ
ipm
ent
Pre
-Pri
mar
y E
duca
tion
Sch
olar
ship
s
Pur
chas
e of
Com
mun
icat
ion
Equ
ipm
ent
Oth
er I
nfra
stru
ctur
e &
Civ
ilW
orks
Cap
ital
Gra
nts
and
Tra
nsfe
rs
Pur
chas
e of
Spe
cili
azed
Pla
nt
Pur
chas
e of
Tra
ctor
s
Mai
nten
ance
of
Civ
il W
orks
Pay
men
t of
Cre
dito
rs
Ksh
s.m
illio
ns
Categories of Development Expenditure
Source: Busia County Treasury
Analysis of the development expenditure of Kshs.711.25 million incurred in the first half of FY 2015/16 indicates that the Public works and Roads department reported the highest expenditure of Kshs.93.54 million on construction and maintenance of roads. The second highest expenditure of Kshs.93.41 million was incurred by the Health and Education departments on construction of health and learning facilities. The department of Health and Sanitation incurred Kshs.81.35 million on purchase of medical drugs while the department of Water, Environment and Natural Resources incurred Kshs.79.88 million on Water Supplies and Sewerage systems.
3.4.8 Annual Budget and Budget Performance Analysis by department for the first half of FY 2015/16
A summary of the FY 2015/16 annual budget estimates and budget performance by department in the first half of FY 2015/16 is shown in Table 3.8.

COUNTY GOVERNMENTS BUDGET IMPLEMENTATION REVIEW REPORT FIRST HALF FY, 2015/1650
Table 3.8: Busia County, Annual Budget and First Half of FY 2015/16 Budget Performance by Department
DepartmentAnnual Budget
Allocation (Kshs.Millions)
6 Months Exche-quer Issues (Kshs.
Millions)
6 Months Expen-diture (Kshs.
Millions)
6 Months Expenditure to Exchequer
issues (%)
Absorption rate (%)
REC DEV REC DEV REC DEV REC DEV REC DEV
Agriculture and Animal Resources 214.91 215.90 136.69 144.70 91.70 32.66 67.1 22.6 42.7 15.1
Trade, Cooperative, Tourism and Industry 40.97 94.65 22.42 72.90 23.50 15.96 104.8 21.9 57.4 16.9
Education and Vocational Training 194.99 270.32 121.67 159.00 74.19 100.60 61.0 63.3 38.0 37.2
Finance and Economic Planning 567.91 903.92 339.74 72.19 357.62 45.18 105.3 62.6 63.0 5.0
Community Gender, Culture & Social Services 62.92 149.00 46.38 80.45 24.91 26.61 53.7 33.1 39.6 17.9
Public Works, Transport and Disaster Management 70.66 163.00 42.19 108.00 22.27 159.01 52.8 147.2 31.5 97.6
Labour, public Service, ICT and Intergovernmental relations
333.34 65.04 169.21 47.41 67.17 38.55 39.7 81.3 20.2 59.3
Lands, Housing & Urban development 28.96 177.90 21.34 93.45 10.45 15.06 49.0 16.1 36.1 8.5
Water, Environment & natu-ral resources 68.71 224.53 53.68 148.50 21.61 108.10 40.3 72.8 31.5 48.1
Health and Sanitation 938.87 505.73 620.78 151.40 451.88 164.12 72.8 108.4 48.1 32.5
County Public Service Board 31.95 0.00 18.18 0.00 12.18 0.00 67.0 0.0 38.1 0.0
Office of the Governor 114.16 10.00 64.98 7.00 44.71 2.89 68.8 41.3 39.2 29.0
Office of the Deputy Gov-ernor 28.69 0.00 19.18 0.00 6.06 0.00 31.6 0.0 21.1 0.0
County Executive Adminis-tration (County Secretary) 60.44 0.00 40.69 0.00 29.93 0.00 73.6 0.0 49.5 0.0
County Assembly 554.32 178.31 244.87 10.00 221.92 2.51 90.6 21.5 40.0 1.4
Total 3311.80 2958.30 1962.00 1095.00 1460.10 711.25 74.4 65.0 44.1 24.0
Source: Busia County Treasury
Analysis of budget performance by department shows that the Department of Public Works reported the highest absorption rate of its development budget at 97.6 per cent while the County Assembly registered the lowest rate at 1.4 per cent. Conversely, the Department of Finance and Economic Planning had the highest percentage of recurrent expenditure to its recurrent budget at 63 per cent while the department of Labour, Public Service, ICT and Intergovernmental Relations had the lowest at 20.2 per cent.

COUNTY GOVERNMENTS BUDGET IMPLEMENTATION REVIEW REPORT FIRST HALF FY, 2015/16 51
3.4.9 Borrowing by the County Government
Article 212 of the Constitution requires a county government to borrow with approval from the County Assembly, and only if the national government guarantees the loan. Further, Section 58 of the PFM Act 2012 gives the Cabinet Secretary to the National Treasury the powers to guarantee loans subject to approval by Parliament. During the period under review, the County utilized its equitable share and local revenue collection deposited into the County Revenue Fund account maintained at Central Bank of Kenya and did not borrow any funds.
3.4.10 Observations and Recommendations
The County has made progress in addressing the challenges previously identified as affecting budget implementation. The County has:
i. Registered improvement in absorption of development funds from 18.3 per cent attained in the first half of FY 2014/15 to 24 per cent reported in the period under review.
ii. Improved in local revenue collection from Kshs.136 million (equivalent to 17.7 per cent of the annual target for FY 2014/15) collected in the first half of FY 2014/15 to Kshs.176.81 million (equivalent to 32.6 per cent of the annual revenue target for FY 2015/16).
Despite the progress made, the following challenges continued to hamper effective budget implementation;
1. Delay in revision and approval of the supplementary budget and other budget policy documents such as the CBROP, ADP and CFSP which affected implementation of the budget.
2. Failure to establishing an internal audit committee to oversee operations of the Internal Audit Department.
3. Delay in submitting the quarterly financial reports.
The County should implement the following recommendations in order to improve budget execution;
1. The County should observe the budget timelines stipulated in law while developing budget policy documents. This will facilitate smooth implementation of the budget.
2. The County should establish an Internal Audit Committee and also strengthen the internal audit function in line with Section 155 of the PFM Act 2012.
3. The County Treasury and County Assembly should observe timelines in submitting quarterly financial reports to the OCOB in line with Section 166 of the PFM Act 2012.

COUNTY GOVERNMENTS BUDGET IMPLEMENTATION REVIEW REPORT FIRST HALF FY, 2015/1652
3.5 Elgeyo Marakwet County
3.5.1 Overview of the FY 2015/16 Budget
The FY 2015/16 approved budget for Elgeyo Marakwet County amounts to Kshs.3.67 billion. It comprised of Kshs.2.52 billion (68.7 per cent) allocated for recurrent expenditure and Kshs.1.15 billion (31.3 per cent) for development expenditure.
In order to finance the budget, the County expects to receive Kshs.3.19 billion (87.1 per cent) as transfers from the National Government, collect Kshs.149.98 million (4.1 per cent) from local sources, and receive a conditional grant (DANIDA and World Bank) of Kshs.40.98 million (1.1 per cent), receive government grants (Road maintenance fuel levy, maternal healthcare and forgone user fees) of Kshs.93.58 million (2.6 per cent), and Kshs.292.59 million (8.0 per cent) as projected cash balance from FY 2014/15. However, the composition of revenue sources for the County does not tally with the amounts contained in CARA, 2015 while the opening cash balance was not re-voted in the approved budget.
3.5.2 Revenue Analysis
In the first half of FY 2015/16, the County received Kshs.1.10 billion from the National Government as equitable share, Kshs.10.40 million as DANIDA grant, Kshs.20.98 million as conditional allocation from the road maintenance fuel levy fund, Kshs.17.41 million as conditional allocation for free maternal health care, received Kshs.3.79 million as conditional allocation for forgone user fees, Kshs.43.92 million from local sources, and had a cash balance of Kshs.292.59 million brought forward from FY 2014/15. The quarterly trend in local revenue collection from FY 2013/14 to the second quarter of FY 2015/16 is shown in figure 3.17.
Figure 3.17: Elgeyo Marakwet County, Trend in Local Revenue Collection by Quarter from the FY 2013/14 to the second quarter of FY 2015/16
10.40
53.49
19.72
0
10
20
30
40
50
60
Ksh
s. M
illio
ns
Reporting Period
Source: Elgeyo Marakwet County Treasury

COUNTY GOVERNMENTS BUDGET IMPLEMENTATION REVIEW REPORT FIRST HALF FY, 2015/16 53
The local revenue consisted of Kshs.24.20 million raised in the first quarter and Kshs.19.72 million in the second quarter. The local revenue raised in the first half of the FY 2015/16 was Kshs.43.92 million (29.3 per cent of the annual local revenue target), a decline from Kshs.48.00 million collected in a similar period of FY 2014/15.
The analysis of local revenue for the first half of FY2015/16 by stream in shown in Table 3.9.
Table 3.9: Elgeyo Marakwet County, Analysis of Revenue collection by stream for the First Half of FY2015/16
Revenue Stream Annual Targeted Revenue (Kshs.)
Six Months Actual Reve-nue (Kshs.)
Revenue Performance (%)
A B C D=*100
Market Fees 3,660,103 2,114,445 57.8
Produce and other Cess 33,007,390 12,440,573 37.7
Public Health, Medical Levies and Hospi-tal Fees 63,951,209 16,729,896 26.2
Business Permits 14,438,797 2,152,665 14.9
Rent Income on Residential/ Commercial Buildings 4,722,871 460,320 9.8
Other Sources 30,199,630 10,025,934 33.2
TOTAL 149,980,000 43,923,833 29.3
Source: Elgeyo Marakwet County Treasury
The analysis of revenue by stream indicates that market fees generated the highest percentage of revenue against annual target at 57.8 per cent followed by produce & other cess at 37.7 per cent.
3.5.3 Banking of Local Revenue
A review of the bank statements for the revenue collection account indicates that all locally generated revenue was deposited into the CRF during the period under review. This conforms to Article 207 of the Constitution and Section 109 of the PFM Act 2012, which stipulates that all funds raised or received by or on behalf of the County Government should be deposited into the CRF account, unless excluded by an Act of Parliament.
3.5.4 Exchequer Issues
During the period under review the COB authorized withdrawal of Kshs.1.45 billion from the CRF account, which was 39.6 per cent of the approved budget. The amount represented an increase of 34.3 per cent from Kshs.1.08 billion authorized in a similar period of FY 2014/15 and consisted of Kshs.1.12 billion (77.2 per cent) for recurrent expenditure and Kshs.330.00 million (22.8 per cent) for development activities.

COUNTY GOVERNMENTS BUDGET IMPLEMENTATION REVIEW REPORT FIRST HALF FY, 2015/1654
3.5.5 Overall Expenditure Review
The County spent a total of Kshs.1.15 billion during the first half of FY 2015/16 which was 79.9 per cent of the funds released for operations. This was a reduction from the Kshs.1.36 billion spent in a similar period of FY 2014/15. A total of Kshs.951.93 million was spent on recurrent activities and Kshs.205.99 million on development activities. Recurrent expenditure was 85.0 per cent of the funds released for recurrent activities while development expenditure accounted for 62.4 per cent of the funds released for development activities. The expenditure excludes commitments as of 31st December, 2015 that amounted to Kshs.324.75 million for development expenditure and Kshs.11.42 million for recurrent expenditure.
Recurrent expenditure for the period under review represented 37.8 per cent of the Approved annual recurrent budget, a decrease from 42.1 per cent spent in a similar period of FY 2014/15. On the other hand, development expenditure recorded an absorption rate of 18.0 per cent, a decrease from 26.7 per cent spent in a similar period of FY 2014/15. A comparison of the total expenditure in the first half of FY 2014/15 and in the first half of FY 2015/16 is shown in Figure 3.18.
Figure 3.18: Elgeyo Marakwet County, Expenditure by Economic Classification for first half of FY 2014/15 and first half of FY 2015/16
687.4
231.15
437.19
839.51
112.42205.99
0100200300400500600700800900
Personnel Emoluments Operation and Maintenance Development
Ksh
s.mill
ions
Expenditure by Economic Classification
1st Half of FY 2014/151st Half of FY 2015/16
Source: Elgeyo Marakwet County Treasury
3.5.6 Recurrent Expenditure Analysis
The total recurrent expenditure for the reporting period was Kshs.951.93 million against an annual recurrent budget of Kshs.2.52 billion. This represents 37.8 per cent of the annual recurrent budget. The County spent Kshs.839.51 million (88.2 per cent) on personnel emoluments and Kshs.112.42 million (11.8 per cent) on operations and maintenance as shown in Figure 3.18. Expenditure on personnel emoluments accounted for 72.5 per cent of total expenditure and has increased significantly in the first half of FY 2015/16 as compared to a similar period in FY 2014/15 when the County spent Kshs.687.40 million. The increase is attributed to the recruitment of additional medical personnel, annual increase in staff salaries, staff promotions in the Health and Agriculture Departments and

COUNTY GOVERNMENTS BUDGET IMPLEMENTATION REVIEW REPORT FIRST HALF FY, 2015/16 55
payment of annual leave allowance to all staff.
The County spent Kshs.19.07 million on sitting allowances to the 30 MCAs and the Speaker against an annual budget of Kshs.41.50 million. This is a significant increase from Kshs.18.99 million recorded in a similar period of FY 2014/15. The average monthly sitting allowance per MCA was Kshs.102,553 compared to SRC’s recommended monthly ceiling of Kshs.124,800.
A breakdown of the operations and maintenance expenditure is shown in Figure 3.19.
Figure 3.19: Elgeyo Marakwet County, Operations and Maintenance Expenditure for the first half of FY 2015/16
40.73
20.49 19.17
7.15 5.26 5.17 3.07 3.03 2.2 2.12 1.56 1.31 1.1605
1015202530354045
Fore
ign a
nd L
oca
l T
ravel
Med
ical
Dru
gs
Off
ice
Uti
liti
es
Oth
er O
& M
Fuel
& L
ubri
cants
Tra
inin
g
Mai
nte
nan
ce o
f M
oto
rV
ehic
les
Co
mm
unic
atio
n
Hosp
ital
ity
Pri
nti
ng a
nd A
dver
tisi
ng
Sch
ola
rship
s &
Bu
rsar
ies
Gen
eral
Off
ice
Supp
lies
Sub
scri
pti
ons
to N
ewsp
aper
s&
Mag
azin
es
Ksh
s. M
illi
on
s
Major Categories of O&M Expenditure
Source: Elgeyo Marakwet County Treasury
The aggregate expenditure on domestic and foreign travel was Kshs.40.73 million compared to Kshs.32.6 million incurred in a similar period of FY 2014/15, representing an increase of 24.9 per cent. This expenditure comprised of Kshs.9.17 million spent by the County Executive and Kshs.31.56 million by the County Assembly.
3.5.7 Development Expenditure Analysis
A summary of development expenditure during the first half of FY 2015/16 is shown in figure 3.20.

COUNTY GOVERNMENTS BUDGET IMPLEMENTATION REVIEW REPORT FIRST HALF FY, 2015/1656
Figure 3.20: Elgeyo Marakwet County, Summary of Development Expenditure for the First Half of FY 2015/16
27.63 27.3125.08 24.13
9.64
4.53 3.94 3.6 3.41 2.26 1.30
5
10
15
20
25
30M
aint
enan
ce o
f Acc
ess
Roa
ds -
Oth
er
Con
stru
ctio
n of
EC
DE
Cla
ssro
oms
Con
stru
ctio
n an
d Im
prov
emen
tof
Hea
lth F
acili
ties
Wat
er S
uppl
ies
and
Sew
erag
e
Con
stru
ctio
n of
Cou
nty
Ass
embl
y R
esta
uran
t and
Oth
ers
Purc
hase
of T
ree
Seed
s an
dSe
edlin
gs
Purc
hase
of V
eter
inar
y Su
pplie
san
d La
bora
tory
Mat
eria
ls
Con
stru
ctio
n of
Kar
aria
Brid
ge
Purc
hase
of E
duca
tiona
l Aid
s &
rela
ted
Equi
pmen
t
Con
stru
ctio
n of
Mar
ket S
talls
Purc
hase
of L
ives
tock
Vac
cine
s
Ksh
s. M
illio
ns
Major Categories of Development Expenditure
Source: Elgeyo Marakwet County Treasury
Analysis of the development expenditure of Kshs.205.99 million incurred in the first half of FY 2015/16 indicates that the Roads Department incurred the highest expenditure at Kshs.27.63 million on development and maintenance of access roads. A total of 76 kilometers of roads were maintained across the 20 wards. The second highest expenditure of Kshs.27.31 million was incurred by the Education and Technical Training Department on construction of ECDE classrooms. The department of Health incurred Kshs.25.08 million on construction and improvement of health facilities while the Department of Water, Land, Housing and Physical Planning incurred Kshs.24.13 million on water supplies and sewerage systems.
3.5.8 Annual Budget and Budget Performance Analysis by Department for the First Half of FY 2015/16
A summary of the FY 2015/16 annual budget estimates and budget performance for the first half of the year is shown in Table 3.10.

COUNTY GOVERNMENTS BUDGET IMPLEMENTATION REVIEW REPORT FIRST HALF FY, 2015/16 57
Table 3.10: Elgeyo Marakwet County, Annual Budget and First Half of FY 2015/16 Budget Performance by Department
DepartmentAnnual Budget
Allocation (Kshs.Million)
6 Months Exchequer Issues (Kshs.Million)
6 Months Expenditure (Kshs.Million)
6 Months Expendi-ture to Exchequer
Issues (%)Absorption rate (%)
Rec Dev Rec Dev Rec Dev Rec Dev Rec Dev
Office of the Gover-nor 70.00 13.00 33.60 6.40 31.00 4.90 92.30 76.6 44.3 37.7
Administration 21.60 - 10.60 - 9.40 - 88.70 - 43.5 -County Assembly 399.00 30.00 164.70 13.80 150.00 9.30 91.10 67.4 37.6 31.0Finance and Econom-ic Planning 244.30 30.00 73.50 7.40 70.00 5.40 95.20 73.0 28.7 18.0
Roads, Public Works and Transport 58.60 266.30 27.60 42.00 24.80 37.60 89.90 89.5 42.3 14.1
Youth Affairs, Cul-ture, Children and So-cial Services
24.80 71.00 11.10 18.70 10.10 8.20 91.00 43.9 40.7 11.5
Education and Techni-cal Training 160.70 151.70 63.70 72.70 49.00 28.20 76.90 38.8 30.5 18.6
Health Services 1134.80 156.30 543.20 57.60 447.20 32.00 82.30 55.6 39.4 20.5Water, Lands, Hous-ing and Physical Plan-ning
66.50 205.50 32.90 41.60 28.30 21.40 86.00 51.4 42.6 10.4
Trade, Tourism, Co-operatives and Wild-life
41.40 50.40 19.30 14.10 18.20 11.40 94.30 80.9 44.0 22.6
Agriculture 184.90 122.90 90.70 33.40 72.30 26.70 79.70 79.9 39.1 21.7ICT and Public Ser-vice 87.10 46.00 36.30 21.40 30.20 21.00 83.20 98.1 34.7 45.7
County Public Service Board 26.30 2.50 12.60 0.70 11.50 0.00 91.30 0.0 43.7 0.0
Total 2519.90 1145.50 1119.80 329.80 952.00 206.10 85.00 62.4 37.8 18.0
Source: Elgeyo Marakwet County Treasury
Analysis of budget performance by department shows that the Department of ICT and Public Service reported the highest absorption of its development budget at 45.7 per cent while the County Public Service Board did not implement its development budget. On the other hand, the Office of the Governor had the highest percentage of recurrent expenditure to recurrent budget at 44.3 per cent while Finance & Economic Planning Department had the lowest percentage of its recurrent expenditure to recurrent budget at 28.7 per cent.
3.5.9 Borrowing by the County Government
Article 212 of the Constitution requires a county government to borrow with approval from the County Assembly, and only if the national government guarantees the loan. Further, Section 58 of the PFM Act 2012, gives the Cabinet Secretary to the National Treasury the powers to guarantee loans subject to approval by Parliament. During the period under review, the County utilized its equitable share and local revenue collection deposited into the County Revenue Fund account maintained at the Central Bank of Kenya and did not borrow any funds.

COUNTY GOVERNMENTS BUDGET IMPLEMENTATION REVIEW REPORT FIRST HALF FY, 2015/1658
3.5.10 Observations and Recommendations
The County has made progress in addressing the challenges previously identified as affecting budget implementation. The County has:
i. Addressed the capacity challenges encountered in implementing the E-procurement module in consultation with the IFMIS Directorate at the National Treasury.
Despite the progress made, the following challenges continued to hamper effective budget implementation;
1. Delay in formulation and approval of a supplementary budget to capture cash balances brought forward from FY 2014/15 and pending bills that were not included in the approved budget, which led to delay in implementation of some activities.
2. Low absorption of development budget which stood at 18.0 per cent of the development budget compared to 26.7 per cent in a similar period of FY 2014/15. The Low absorption of the development budget was mainly attributed to procurement challenges, among other factors.
3. Low local revenue collection in the reporting period which amounted to Kshs.43.92 million, representing 29.3 per cent of the annual local revenue target.
The County should implement the following recommendations in order to improve budget execution:
1. The County should fast track formulation and approval of the supplementary budget to include pending bills and cash balances from FY 2014/15. This will enhance smooth implementation of the planned activities.
2. The County Treasury should develop capacity of the procurement department to facilitate absorption of development funds.
3. The County Treasury should review the local revenue collection strategies with a view to enhance revenue collection.
3.6 Embu County
3.6.1 Overview of the FY 2015/16 Budget
The FY 2015/16 approved budget for Embu County is Kshs.4.87 billion. It comprised of Kshs.3.30 billion (67.7 per cent) allocated for recurrent expenditure and Kshs.1.57 billion (32.3 per cent) for development expenditure.
In order to finance the budget, the County expected to receive Kshs.4.26 billion (87.3 per cent) as transfers from the National Government, this amount was composed of Kshs.3.84 billion for equitable share, Kshs.192.88 million conditional allocation for Level Five Hospital, Kshs.95.74 million conditional allocation for leasing of medical equipment, Kshs.57.59 million conditional

COUNTY GOVERNMENTS BUDGET IMPLEMENTATION REVIEW REPORT FIRST HALF FY, 2015/16 59
allocation for free maternal health care, Kshs.12.03 million conditional allocation for compensation of forgone user fees and Kshs.48.75 million as conditional allocation from Road Maintenance Fuel Levy Fund. In addition to the transfer from the National Government the County expects to collect Kshs.630.76 million (12.9 per cent) from local sources. However, Kshs.842.88 million representing the opening cash balance from FY 2014/15 was not factored in the FY 2015/16 budget. Further, the County did not budget for additional conditional grant of Kshs.13.75 million from DANIDA.
3.6.2 Revenue Analysis
In the first half of FY 2015/16, the County received Kshs.1.37 billion from the National Government as a direct transfer to the CRF account, raised Kshs.159.38 million from local sources, and had a cash balance of Kshs.842.88 million brought forward from FY 2014/15.
Direct transfer from National Government composed of equitable share of Kshs.1.29 billion, Kshs.64.62 million as conditional allocation for the Embu Level 5 hospital, Kshs.24.62 million from the road maintenance fuel levy fund, Kshs.23.94 million as conditional allocation for free maternal health care and Kshs.3.80 million as conditional allocation for forgone user fees. The quarterly trend in local revenue collection from FY 2013/14 to the second quarter of FY 2015/16 is shown in table 3.21.
Figure 3.21: Embu County, Trend in Local Revenue Collection by Quarter from the FY 2013/14 to the second quarter of FY 2015/16
10
30
50
70
90
110
130
150
Ksh
s. M
illio
ns
Reporting Period
Source: Embu County Treasury
The local revenue consisted of Kshs.87.69 million raised in the first quarter and Kshs.71.69 million in the second quarter. The local revenue raised in the first half of the FY 2015/16 was Kshs.159.38 million (25.3 per cent of the annual local revenue target), an improvement from Kshs.149.86 million collected in a similar period of FY 2014/15.

COUNTY GOVERNMENTS BUDGET IMPLEMENTATION REVIEW REPORT FIRST HALF FY, 2015/1660
The analysis of local revenue for the first half of FY 2015/16 by stream is shown in Table 3.11.
Table 3.11: Embu County, Analysis of revenue collection per stream for the first half of FY 2015/16
No. Revenue Stream Annual Targeted Revenue (Kshs.)
Six Months Actual Revenue (Kshs.)
Revenue Performance (%)
A B C D=*100
1 Medical Levies and Hospital Fees - 74,989,473 -
2 Produce Cess - 22,815,415 -
3 Parking Fees - 16,122,055 -
4 Property Rent & Rates - 11,597,937 -
5 Market Fees - 11,451,899 -
6 Single Business Permits - 6,987,893 -
7 Buildings Approvals - 2,441,631 -
8 Other Sources - 12,978,508 -
Total - 159,384,811 -
Source: Embu County Treasury
The analysis of revenue by stream indicates that medical levies generated the highest amount at Kshs.74.99 million followed by produce cess at Kshs.22.82 million.
3.6.3 Banking of local revenue
In the first half of FY 2015/16, the County banked all the locally generated revenue into the CRF. This conforms to Article 207 of the Constitution and Section 109 of the PFM Act 2012, which stipulates that all funds raised or received by or on behalf of the County Government should be deposited into the CRF account, unless excluded by an Act of Parliament.
3.6.4 Exchequer Issues
The Controller of Budget authorised withdrawal of Kshs.1.77 billion from the CRF account, which was 36.3 per cent of the approved budget. The amount was the same as the Kshs.1.77 billion authorized in a similar period of FY 2014/15 and consisted of Kshs.1.51 billion (85.5 per cent) for recurrent expenditure and Kshs.257.50 million (14.5 per cent) for development activities.
3.6.5 Overall Expenditure Review
The County spent a total of Kshs.1.21 billion during the first half of FY 2015/16 which was 68.2 per cent of the funds released for operations. This is a reduction from the Kshs.1.57 billion spent in a similar period of FY 2014/15. A total of Kshs.1.03 billion was spent on recurrent activities and Kshs.175.72 million on development activities. Recurrent expenditure was 68.2 per cent of the funds released for recurrent activities while development expenditure accounted for 68.2 per cent of the funds released for development activities. The expenditure excludes commitments as of 31st December, 2015 that amounted to Kshs.263.76 million for development and Kshs.138.12 million for

COUNTY GOVERNMENTS BUDGET IMPLEMENTATION REVIEW REPORT FIRST HALF FY, 2015/16 61
recurrent expenditure.
Recurrent expenditure for the period under review represented 31.3 per cent of the approved annual recurrent budget, a decrease from 48.6 per cent spent in a similar period of FY 2014/15. On the other hand, development expenditure recorded an absorption rate of 11.2 per cent, a decrease from 16.7 per cent spent in a similar period of FY 2014/15. A comparison of the total expenditure for the first half of FY 2014/15 and the first half of FY 20151/16 is shown in Figure 3.22.
Figure 3.22: Embu County, Expenditure by Economic Classification for First Half of FY 2014/15 and First Half of FY 2015/16
1,036.71
328.71201.68
848.17
185.17 175.72
0.00
200.00
400.00
600.00
800.00
1,000.00
1,200.00
Personnel Emoluments Operation and Maintenance Development
Ksh
s.mill
ions
Expenditure by Economic Classification
1st Half of FY 2014/151st Half of FY 2015/16
Source: Embu County Treasury
3.6.6 Recurrent Expenditure Analysis
The total recurrent expenditure for the reporting period was Kshs.1.03 billion against an annual recurrent budget of Kshs.3.30 billion. This represents 31.3 per cent of the annual recurrent budget. The County spent Kshs.848.17 million (82.1 per cent) on personnel emoluments and Kshs.185.17 million (17.9 per cent) on operations and maintenance as shown in Figure 3.22. Expenditure on personnel emoluments accounted for 70.1 per cent of total expenditure and has decreased significantly in the first half of FY 2015/16 as compared to a similar period in FY 2014/15 when the County spent Kshs.1.04 billion. The decline is mainly attributed to December, 2015 salaries and allowances which were paid in January, 2016.
The County spent Kshs.16.59 million on sitting allowances to the 34 MCAs and the Speaker against an annual budget of Kshs.49.93 million. This is an increase from Kshs.14.03 million recorded in a similar period of FY 2014/15. The average monthly sitting allowance per MCA was Kshs.81,312 compared to the SRC’s recommended monthly ceiling of Kshs.124,800.
A breakdown of the operations and maintenance expenditure for the reporting period is shown in Figure 3.23.
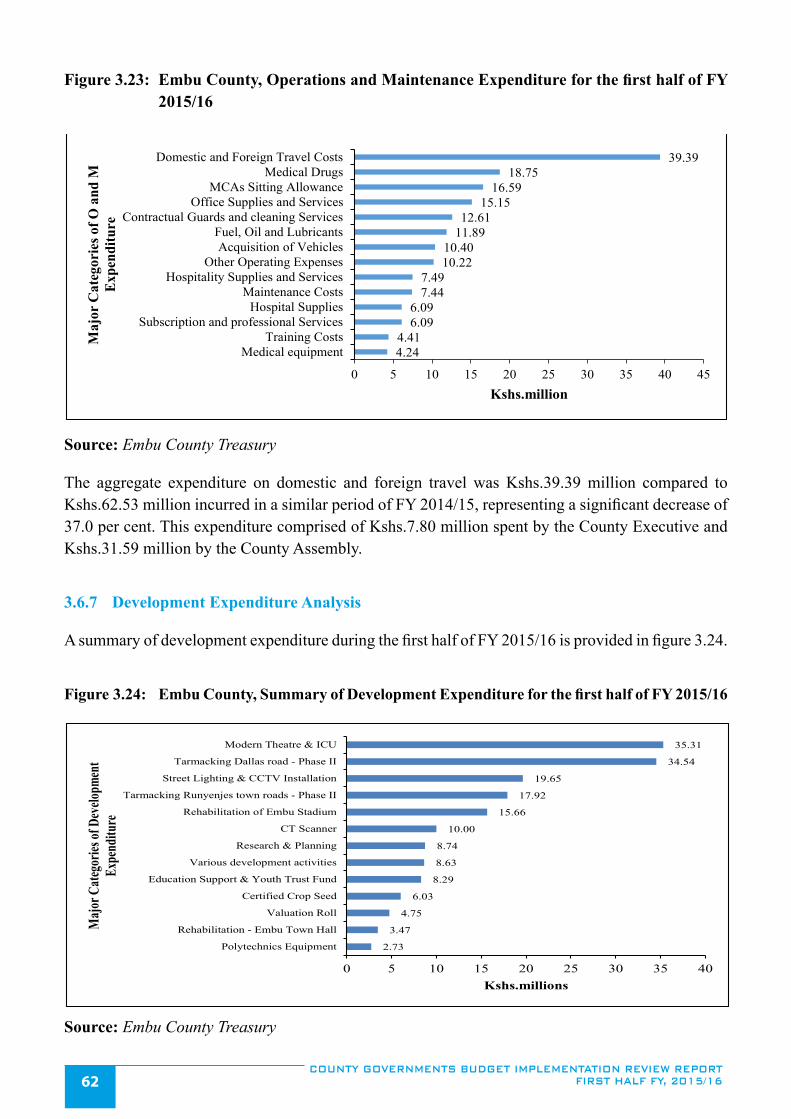
COUNTY GOVERNMENTS BUDGET IMPLEMENTATION REVIEW REPORT FIRST HALF FY, 2015/1662
Figure 3.23: Embu County, Operations and Maintenance Expenditure for the first half of FY 2015/16
4.244.41
6.096.09
7.447.49
10.2210.40
11.8912.61
15.1516.59
18.7539.39
0 5 10 15 20 25 30 35 40 45
Medical equipmentTraining Costs
Subscription and professional ServicesHospital Supplies
Maintenance CostsHospitality Supplies and Services
Other Operating ExpensesAcquisition of Vehicles
Fuel, Oil and LubricantsContractual Guards and cleaning Services
Office Supplies and ServicesMCAs Sitting Allowance
Medical DrugsDomestic and Foreign Travel Costs
Kshs.million
Maj
or C
ateg
orie
s of O
and
M
Expe
nditu
re
Source: Embu County Treasury
The aggregate expenditure on domestic and foreign travel was Kshs.39.39 million compared to Kshs.62.53 million incurred in a similar period of FY 2014/15, representing a significant decrease of 37.0 per cent. This expenditure comprised of Kshs.7.80 million spent by the County Executive and Kshs.31.59 million by the County Assembly.
3.6.7 Development Expenditure Analysis
A summary of development expenditure during the first half of FY 2015/16 is provided in figure 3.24.
Figure 3.24: Embu County, Summary of Development Expenditure for the first half of FY 2015/16
2.73
3.47
4.75
6.03
8.29
8.63
8.74
10.00
15.66
17.92
19.65
34.54
35.31
0 5 10 15 20 25 30 35 40
Polytechnics Equipment
Rehabilitation - Embu Town Hall
Valuation Roll
Certified Crop Seed
Education Support & Youth Trust Fund
Various development activities
Research & Planning
CT Scanner
Rehabilitation of Embu Stadium
Tarmacking Runyenjes town roads - Phase II
Street Lighting & CCTV Installation
Tarmacking Dallas road - Phase II
Modern Theatre & ICU
Kshs.millions
Majo
r Cate
gorie
s of D
evelo
pmen
t Ex
pend
iture
Source: Embu County Treasury
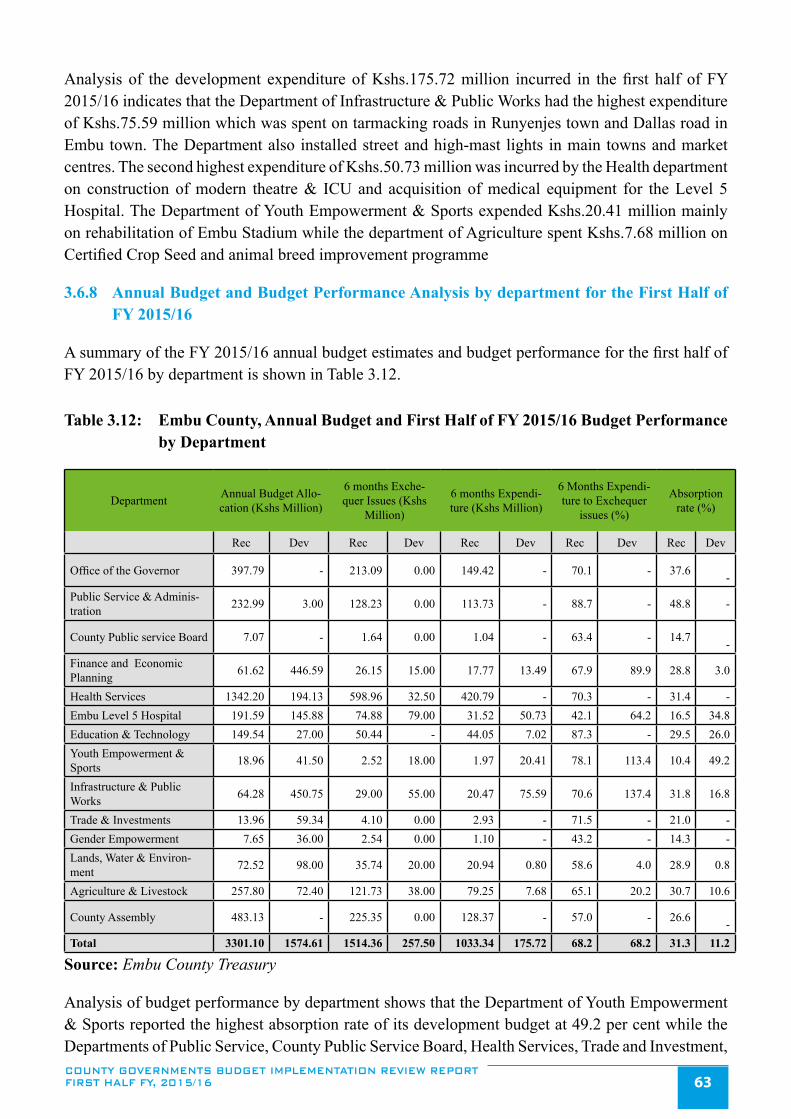
COUNTY GOVERNMENTS BUDGET IMPLEMENTATION REVIEW REPORT FIRST HALF FY, 2015/16 63
Analysis of the development expenditure of Kshs.175.72 million incurred in the first half of FY 2015/16 indicates that the Department of Infrastructure & Public Works had the highest expenditure of Kshs.75.59 million which was spent on tarmacking roads in Runyenjes town and Dallas road in Embu town. The Department also installed street and high-mast lights in main towns and market centres. The second highest expenditure of Kshs.50.73 million was incurred by the Health department on construction of modern theatre & ICU and acquisition of medical equipment for the Level 5 Hospital. The Department of Youth Empowerment & Sports expended Kshs.20.41 million mainly on rehabilitation of Embu Stadium while the department of Agriculture spent Kshs.7.68 million on Certified Crop Seed and animal breed improvement programme
3.6.8 Annual Budget and Budget Performance Analysis by department for the First Half of FY 2015/16
A summary of the FY 2015/16 annual budget estimates and budget performance for the first half of FY 2015/16 by department is shown in Table 3.12.
Table 3.12: Embu County, Annual Budget and First Half of FY 2015/16 Budget Performance by Department
Department Annual Budget Allo-cation (Kshs Million)
6 months Exche-quer Issues (Kshs
Million)
6 months Expendi-ture (Kshs Million)
6 Months Expendi-ture to Exchequer
issues (%)
Absorption rate (%)
Rec Dev Rec Dev Rec Dev Rec Dev Rec Dev
Office of the Governor 397.79 - 213.09 0.00 149.42 - 70.1 - 37.6 -
Public Service & Adminis-tration 232.99 3.00 128.23 0.00 113.73 - 88.7 - 48.8 -
County Public service Board 7.07 - 1.64 0.00 1.04 - 63.4 - 14.7 -
Finance and Economic Planning 61.62 446.59 26.15 15.00 17.77 13.49 67.9 89.9 28.8 3.0
Health Services 1342.20 194.13 598.96 32.50 420.79 - 70.3 - 31.4 -Embu Level 5 Hospital 191.59 145.88 74.88 79.00 31.52 50.73 42.1 64.2 16.5 34.8Education & Technology 149.54 27.00 50.44 - 44.05 7.02 87.3 - 29.5 26.0Youth Empowerment & Sports 18.96 41.50 2.52 18.00 1.97 20.41 78.1 113.4 10.4 49.2
Infrastructure & Public Works 64.28 450.75 29.00 55.00 20.47 75.59 70.6 137.4 31.8 16.8
Trade & Investments 13.96 59.34 4.10 0.00 2.93 - 71.5 - 21.0 -Gender Empowerment 7.65 36.00 2.54 0.00 1.10 - 43.2 - 14.3 -Lands, Water & Environ-ment 72.52 98.00 35.74 20.00 20.94 0.80 58.6 4.0 28.9 0.8
Agriculture & Livestock 257.80 72.40 121.73 38.00 79.25 7.68 65.1 20.2 30.7 10.6
County Assembly 483.13 - 225.35 0.00 128.37 - 57.0 - 26.6 -
Total 3301.10 1574.61 1514.36 257.50 1033.34 175.72 68.2 68.2 31.3 11.2
Source: Embu County Treasury
Analysis of budget performance by department shows that the Department of Youth Empowerment & Sports reported the highest absorption rate of its development budget at 49.2 per cent while the Departments of Public Service, County Public Service Board, Health Services, Trade and Investment,
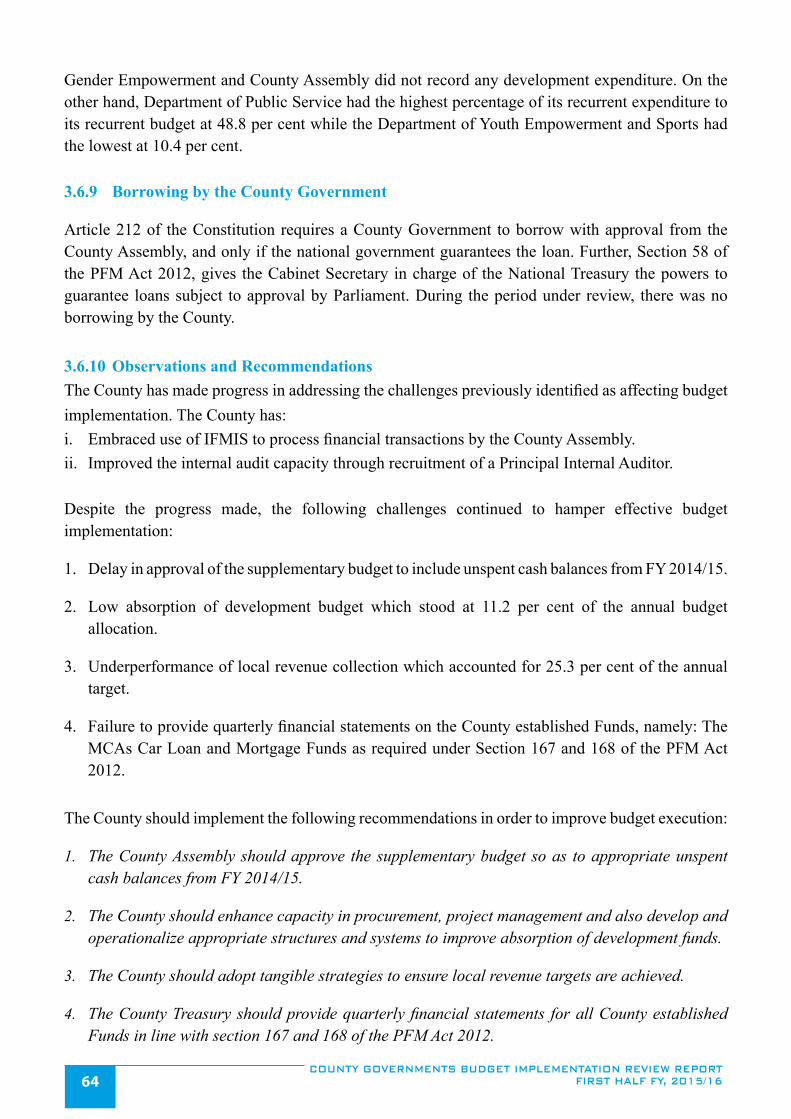
COUNTY GOVERNMENTS BUDGET IMPLEMENTATION REVIEW REPORT FIRST HALF FY, 2015/1664
Gender Empowerment and County Assembly did not record any development expenditure. On the other hand, Department of Public Service had the highest percentage of its recurrent expenditure to its recurrent budget at 48.8 per cent while the Department of Youth Empowerment and Sports had the lowest at 10.4 per cent.
3.6.9 Borrowing by the County Government
Article 212 of the Constitution requires a County Government to borrow with approval from the County Assembly, and only if the national government guarantees the loan. Further, Section 58 of the PFM Act 2012, gives the Cabinet Secretary in charge of the National Treasury the powers to guarantee loans subject to approval by Parliament. During the period under review, there was no borrowing by the County.
3.6.10 Observations and RecommendationsThe County has made progress in addressing the challenges previously identified as affecting budget implementation. The County has:i. Embraced use of IFMIS to process financial transactions by the County Assembly.ii. Improved the internal audit capacity through recruitment of a Principal Internal Auditor.
Despite the progress made, the following challenges continued to hamper effective budget implementation:
1. Delay in approval of the supplementary budget to include unspent cash balances from FY 2014/15.
2. Low absorption of development budget which stood at 11.2 per cent of the annual budget allocation.
3. Underperformance of local revenue collection which accounted for 25.3 per cent of the annual target.
4. Failure to provide quarterly financial statements on the County established Funds, namely: The MCAs Car Loan and Mortgage Funds as required under Section 167 and 168 of the PFM Act 2012.
The County should implement the following recommendations in order to improve budget execution:
1. The County Assembly should approve the supplementary budget so as to appropriate unspent cash balances from FY 2014/15.
2. The County should enhance capacity in procurement, project management and also develop and operationalize appropriate structures and systems to improve absorption of development funds.
3. The County should adopt tangible strategies to ensure local revenue targets are achieved.
4. The County Treasury should provide quarterly financial statements for all County established Funds in line with section 167 and 168 of the PFM Act 2012.

COUNTY GOVERNMENTS BUDGET IMPLEMENTATION REVIEW REPORT FIRST HALF FY, 2015/16 65
3.7 Garissa County
3.7.1 Overview of the FY 2015/16 Budget
The FY 2015/16 approved budget for Garissa County amounts to Kshs.7.36 billion. It comprised of Kshs.3.92 billion (53.3 per cent) allocated to recurrent expenditure and Kshs.3.44 billion (46.7 per cent) for development expenditure.
In order to finance the budget, the County expects to receive Kshs.5.77 billion (78.4 per cent) as transfers from the National Government, generate Kshs.500 million (6.8 per cent) from local sources, receive a conditional grant of Kshs.17.94 million (0.2 per cent) from DANIDA, Kshs.463 million (6.3 per cent) as projected cash balance from FY 2014/15 and additional conditional grants of Kshs.593.92 million (8.1 per cent) from the National Government as contained in CARA, 2015. The additional Kshs.593.92 million conditional grant comprises of Kshs.360.05 million for Level 5 Hospitals, Kshs.50.29 million for Free Maternal Health Care, Kshs.14.52 million for Compensation for Forgone User Fees, Kshs.95.74 million for Leasing of Medical Equipment, and Kshs.73.32 million from Road Maintenance Fuel Levy Fund.
3.7.2 Revenue Analysis
In the first half of FY 2015/16, the County received Kshs.1.93 billion revenue from the National Government as equitable share, Kshs.120.62 million as conditional allocations for Garissa Level 5 Hospital, Kshs.37.03 million as conditional allocations from the road maintenance fuel levy fund, Kshs.19.76 million as conditional allocations for free maternal health care, Kshs.2.40 million as conditional allocations for forgone user fees, raised Kshs.45.60 million from local sources, and had a cash balance of Kshs.463 million brought forward from FY 2014/15.
The quarterly trend in local revenue collection from the FY 2013/14 to the second quarter of FY 2015/16 is shown in figure 3.25.
Figure 3.25: Garissa County, Trend in Local Revenue Collection by Quarter from the FY 2013/14 to the second quarter of FY 2015/16
7.209.50 10.00 9.10
26.10
42.50
24.7620.84
0
5
10
15
20
25
30
35
40
45
50
Kshs
.mill
ion
Reporting period
Source: Garissa County Treasury

COUNTY GOVERNMENTS BUDGET IMPLEMENTATION REVIEW REPORT FIRST HALF FY, 2015/1666
The local revenue consisted of Kshs.24.76 million raised in the first quarter and Kshs.20.84 million in the second quarter. The local revenue raised in the first half of the FY 2015/16 was Kshs.45.60 million (9.1 per cent of the annual local revenue target) and a decrease from Kshs.68.6 million collected in a similar period of FY 2014/15.
The Analysis of local revenue for the first half of FY 2015/16 by stream is shown in Table 3.13.
Table 3.13: Garissa County, Analysis of revenue collection by stream for the first half of FY 2015/16
No. Revenue Stream Annual Targeted Reve-nue (Kshs.)
6 Months Actual Reve-nue (Kshs.) Revenue Performance (%)
A B C D=C/B*100
1 Stock Auction Fees (Cattle) 39,477,200 4,120,320 10.4
2 Market Fresh Produce Fees 34,888,000 3,488,800 10.0
3 Single Business Permits 45,974,680 4,597,468 10.0
4 Building Materials 36,996,000 3,700,600 10.0
5 Land Rates 43,309,560 4,230,965 9.8
6 PG Hospital Revenues 120,463,400 9,935,340 8.2
7 Others 178,891,160 15,601,534 8.7
TOTAL 500,000,000 45,675,027 9.1
Source: Garissa County Treasury
The analysis of revenue by stream indicates that the stock auction fees generated the highest percentage of revenue against annual target at 10.4 per cent, followed by single business permit, market produce fees and building materials fees at 10.0 per cent. The referral hospital fees reported the lowest collection against the expected target at 8.2 per cent.
3.7.3 Banking of local revenue
A review of the bank statements for the revenue collection account indicates that all locally generated revenue was deposited into the CRF during the period under review. This is in conformity with Article 207 of the Constitution and Section 109 of the PFM Act 2012, which stipulates that all funds raised or received by or on behalf of the County Government should be deposited into the CRF account, unless excluded by an Act of Parliament.
3.7.4 Exchequer Releases
During the period under review, the COB authorised withdrawal of Kshs.2.20 billion from the CRF account, which was 29.9 per cent of the approved budget. The withdrawal represented a decline of 27.6 per cent from Kshs.3.04 billion authorized in a similar period of FY 2014/15 and consisted of Kshs.1.59 million (72.4 per cent) for recurrent expenditure and Kshs.606 million (27.6 per cent) for development activities.

COUNTY GOVERNMENTS BUDGET IMPLEMENTATION REVIEW REPORT FIRST HALF FY, 2015/16 67
3.7.5 Overall Expenditure Review
The County spent a total of Kshs.2.16 billion during the first half of FY 2015/16 which was 98 per cent of the funds released for operations. This is a significant reduction from the Kshs.3.01 billion spent in a similar period of FY 2014/15. A total of Kshs.1.55 billion was spent on recurrent activities and Kshs.600 million on development activities. Recurrent expenditure was 97.6 per cent of the funds released for recurrent activities while development expenditure accounted for 99 per cent of the funds released for development activities.
Recurrent expenditure for the period under review represented 39.7 per cent of the approved annual recurrent budget, a decrease from 47.9 per cent spent in a similar period of FY 2014/15. On the hand, development expenditure recorded an absorption rate of 17.4 per cent, a decrease from 34.8 per cent spent in a similar period of FY 2014/15. A comparison of the total expenditure in the first half of FY 2014/15 and the first half of FY 2015/16 is shown in Figure 3.26.
Figure 3.26: Garissa County, Expenditure by Economic Classification for First Half of FY 2014/15 and FY 2015/16
922
617.5
1520
1066
488.8600.00
0200400600800
1000120014001600
Personnel Emoluments Operations & Maintenance Development
Ksh
s. M
illio
ns
Expenditure by Economic Classification
1st Half, FY 2014/15
1st Half, FY 2015/16
Source: Garissa County Treasury
3.7.6 Recurrent Expenditure Analysis
The total recurrent expenditure was Kshs.1.56 billion against an annual recurrent budget of Kshs.3.92 billion. This represents 39.7 per cent of the annual recurrent budget. The County spent Kshs.1,066.2 million (68.6 per cent) on personnel emoluments and Kshs.488.8 million (31.4 per cent) on operations and maintenance as shown in Figure 3.26. Expenditure on personnel emoluments accounted for 49.5 per cent of total expenditure and has increased significantly in FY 2015/16 as compared to the similar period in FY 2014/15 when the County spent Kshs.922 million.
The county spent Kshs.33.48 million on sitting allowances to the 49 MCAs and the Speaker against an annual budget of Kshs.80.9 million. This was an increase from Kshs.28.8 million recorded in a similar period of FY 2014/15. The average monthly sitting allowance per MCA was Kshs.113,872 compared to SRC’s recommended monthly ceiling of Kshs.124,800.
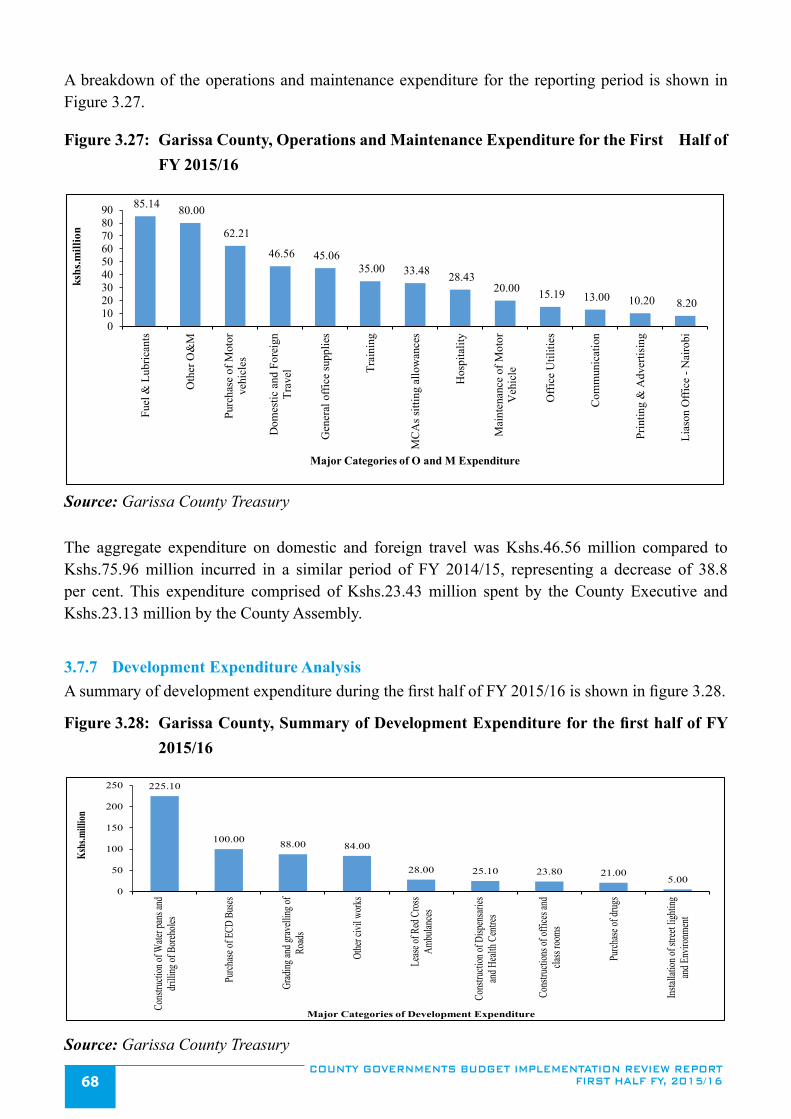
COUNTY GOVERNMENTS BUDGET IMPLEMENTATION REVIEW REPORT FIRST HALF FY, 2015/1668
A breakdown of the operations and maintenance expenditure for the reporting period is shown in Figure 3.27.
Figure 3.27: Garissa County, Operations and Maintenance Expenditure for the First Half of FY 2015/16
85.14 80.00
62.21
46.56 45.06 35.00 33.48 28.43
20.00 15.19 13.00 10.20 8.20
0102030405060708090
Fuel
& L
ubric
ants
Oth
er O
&M
Purc
hase
of M
otor
vehi
cles
Dom
estic
and
For
eign
Trav
el
Gen
eral
offi
ce su
pplie
s
Trai
ning
MC
As s
ittin
g al
low
ance
s
Hos
pita
lity
Mai
nten
ance
of M
otor
Veh
icle
Off
ice
Util
ities
Com
mun
icat
ion
Prin
ting
& A
dver
tisin
g
Lias
on O
ffic
e - N
airo
bi
kshs
.mill
ion
Major Categories of O and M Expenditure
Source: Garissa County Treasury
The aggregate expenditure on domestic and foreign travel was Kshs.46.56 million compared to Kshs.75.96 million incurred in a similar period of FY 2014/15, representing a decrease of 38.8 per cent. This expenditure comprised of Kshs.23.43 million spent by the County Executive and Kshs.23.13 million by the County Assembly.
3.7.7 Development Expenditure AnalysisA summary of development expenditure during the first half of FY 2015/16 is shown in figure 3.28.
Figure 3.28: Garissa County, Summary of Development Expenditure for the first half of FY 2015/16
225.10
100.00 88.00 84.00
28.00 25.10 23.80 21.005.00
0
50
100
150
200
250
Cons
tructi
on of
Wate
r pan
s and
drillin
g of B
oreho
les
Purch
ase of
ECD
Bus
es
Grad
ing an
d grav
elling
ofRo
ads
Othe
r civi
l work
s
Lease
of R
ed C
ross
Ambu
lance
s
Cons
tructi
on of
Disp
ensar
iesan
d Hea
lth C
entre
s
Cons
tructi
ons o
f offi
ces a
ndcla
ss roo
ms
Purch
ase of
drug
s
Instal
lation
of st
reet li
ghtin
gan
d Env
ironm
ent
Kshs
.mill
ion
Major Categories of Development Expenditure
Source: Garissa County Treasury

COUNTY GOVERNMENTS BUDGET IMPLEMENTATION REVIEW REPORT FIRST HALF FY, 2015/16 69
Analysis of the development expenditure of Kshs.600 million in the first half of FY 2015/16 indicates that the Water Department reported the highest expenditure of Kshs.225.10 million which was spent on construction of water pans, dam and drilling of boreholes. The second highest expenditure of Kshs.100 million was utilized on purchase of seven buses for the Early Childhood Development (ECD) program. The third highest expenditure of Kshs.88 million was incurred by the Roads Department on construction of feeder roads to ease transportation in rural areas.
3.7.8 Annual Budget and Budget Performance Analysis by department for the First Half of FY 2015/16
A summary of the FY 2015/16 annual budget estimates and budget performance for the first half by department is shown in Table 3.14.
Table 3.14: Garissa County, Annual Budget and First Half of FY 2015/16 Budget Performance by Department
Department Annual Budget Alloca-tion (Kshs.Millions)
6 Months Exchequer Issues (Kshs.Millions)
6 Months Expenditure (Kshs.Millions)
Expenditure to Ex-chequer Issues (%)
A b s o r p t i o n rate (%)
Rec Dev Rec Dev Rec Dev Rec Dev Rec Dev
Agriculture ,Irriga-tion Services and Fisheries
106.36 115 43.8 - 42.5 - 97.0 - 40.0 -
Culture 34.43 70 9.65 11.4 9.36 11.3 97.0 99.1 27.2 16.1
Public Works, Roads, and Physical Planning
86.93 864.2 28.8 88 27.9 88.0 96.9 100.0 32.1 10.2
Education 143.4 334 55.2 133.3 53.5 132.0 96.9 99.0 37.3 39.5
Finance & Econom-ic Planning 1294 482 531.5 56 514.8 56 96.9 100.0 39.8 11.6
Health and Sani-tation 1124.2 303 540.7 49.3 527.2 49.3 97.5 100.0 46.9 16.3
Livestock 79.52 88.57 26.3 0 25.6 0 97.3 - 32.2 0.0
Trade, Youth and Sport 76.87 235.34 25.6 0 24.96 0 97.5 - 32.5 0.0
Environment 30.32 163 10 0 9.75 0 97.5 - 32.2 0.0
Water 108.6 788 35.6 268 34.71 264 97.5 98.5 32.0 33.5
County Executive 148.2 0 45.8 0 44.7 0 97.6 - 30.2 -
County Assembly 684 0 240 0 240 0 100.0 - 35.1 -
Total 3,917 3,443 1,593 606 1,555 600 97.6 99 39.7 17.4
Source: Garissa County Treasury
Analysis of budget performance by department shows that the Department of Education reported the highest absorption rate for development expenditure at 39.5 per cent. On the other hand, the Health Department and Sanitation had the highest percentage of recurrent expenditure to annual recurrent budget at 46.9 per cent.
COUNTY GOVERNMENTS BUDGET IMPLEMENTATION REVIEW REPORT FIRST HALF FY, 2015/1670
3.7.9 Borrowing by the County Government
Article 212 of the Constitution requires a county government to borrow with approval from the County Assembly, and only if the national government guarantees the loan. Further, Section 58 of the PFM Act 2012 gives the Cabinet Secretary to the National Treasury the powers to guarantee loans subject to approval by Parliament. During the period under review, the County utilized its equitable share and local revenue collection deposited into the CRF and did not borrow.
3.7.10 Observations and Recommendations
The County has made progress in addressing some of the challenges previously identified as affecting budget implementation. The County has:
i. Embraced use of IFMIS in processing financial transactions.
The following challenges raised in the previous CBIRRs continue to hamper effective budget implementation in the County;
1. Decline in local revenue collection against annual target from 13.6 per cent in a similar period of FY 2014/15 to 9.1 per cent in the reporting period.
2. Inadequate internal audit mechanism to ensure effective financial management.
3. Absence of designated administrators for established County established Funds thus rendering administration and accounting for the Funds difficult.
The County should implement the following recommendations in order to improve budget execution:
1. The County should put in place proper revenue collection mechanisms to maximize revenue collection.
2. Strengthen the internal audit department.
3. For each public fund, the County Executive Member for Finance should designate a person responsible for administering the fund in line with the requirements of section 116 of the PFM Act 2012.
3.8 Homa Bay County
3.8.1 Overview of the FY 2015/16 Budget
The FY 2015/16 approved budget for Homa Bay County is Kshs.6.16 billion. It comprised of Kshs.3.95 billion (64.1 per cent) allocated for recurrent expenditure and Kshs.2.21 billion (35.9 per cent) for development expenditure.
In order to finance the budget, the County is expected to receive Kshs.5.63 billion (91.3 per cent) as

COUNTY GOVERNMENTS BUDGET IMPLEMENTATION REVIEW REPORT FIRST HALF FY, 2015/16 71
equitable share from the national government, collect Kshs.181.73 million (2.9 per cent) from local revenue sources, receive a conditional grant of Kshs.24.77 million (0.40 per cent) from DANIDA, Kshs.6.99 million (0.1 per cent) being balance brought forward from FY 2014/15, additional conditional grants of Kshs.320.89 million (5.3 per cent)from the National Government as contained in CARA, 2015 for free maternal care, leasing of medical equipment, compensation for user fees forgone, and Road Maintenance Fuel Levy Fund. However, the approved budget did not include additional conditional grants of Kshs.320.89 million of which Kshs.131.09 million was for free maternal health care, Kshs.22.47 million for compensation of forgone user fees, Kshs.95.75 million for leasing of medical equipment, and Kshs.71.58 million from Road Maintenance Fuel Levy Fund.
3.8.2 Revenue Analysis
During the second quarter of FY 2015/16, the County received Kshs.2.39 billion from the National Government as equitable share to the CRF account, Kshs.43.83 million for free maternal health care allocation, Kshs.5.61 million for compensation of forgone user fees, Kshs.36.15 million from the road maintenance fuel levy fund, raised Kshs.83.38 million from local sources, and had a cash balance of Kshs.6.99 million brought forward from FY 2014/15.
The quarterly trend in local revenue collection from FY 2013/14 to the second quarter of FY 2015/16 is shown in figure 3.29.
Figure 3.29: Homa Bay County, Trend in Local Revenue Collection by Quarter from the FY 2013/14 to the second quarter of FY 2015/16
31.2628.24
39.3736.12
31.89
48.7244.15 43.49
39.90
1015202530354045505560
Ksh
s. M
illio
ns
Reporting Period
Source: Homa Bay County Treasury
The local revenue consisted of Kshs.43.49 million raised in the first quarter and Kshs.39.90 million in the second quarter. The local revenue raised in the first half of the FY 2015/16 was Kshs.83.38 million (45.9 per cent of the annual local revenue target), an improvement from Kshs.64.99 million collected in a similar period of FY 2014/15.
The analysis of local revenue for the first half of FY 2015/16 by stream is shown in Table 3.15.

COUNTY GOVERNMENTS BUDGET IMPLEMENTATION REVIEW REPORT FIRST HALF FY, 2015/1672
Table 3.15: Homa Bay County, Analysis of revenue collection by stream for the first half of FY 2015/16
No. Revenue Streams Annual Targeted Reve-nue (Kshs.)
Six Months Actual Reve-nue (Kshs.)
Revenue Performance (%)
A B C D=*100
1 Health Sector 1,464,636 6,465,550 441.44
2 Motorbike Fees 2,601,226 3,403,060 130.83
3 Cess (Wheat, Maize, Sugarcane) 10,196,804 7,573,969 74.28
4 Enclosed Bus Park 14,830,031 8,979,720 60.55
5 Market Dues 40,574,064 17,611,945 43.41
6 Land Rates 2,513,660 881792 35.08
7 Urban Planning Fees 3,180,241 613,500 19.29
8 Sign Boards & Advert Fees 883,387 81,160 9.19
9 Single Business Permits 24,270,229 2,112,091 8.7
10 House Management Unit 8,584,906 217,400 2.53
11 Other revenue streams 72,634,483 35,444,415 48.8
Total 181,733,667 83,384,602 45.9
Source: Homa Bay County Treasury
Analysis of revenue by stream indicates that the Health Department generated the highest performance of revenue against annual target at 441.4 per cent followed by Motorbike Fee at 130.8 per cent. House management unit reported the lowest collection against annual target at 2.5 per cent.
3.8.3 Banking of local revenue
A review of the bank statements for the revenue collection account indicates that the County did not bank Kshs.21.88 million from locally generated revenue into the CRF during the period under review. This does not conform to Article 207 of the Constitution and Section 109 of the PFM Act 2012, which stipulates that all funds raised or received by or on behalf of the County Government should be deposited into the CRF account, unless excluded by an Act of Parliament.
3.8.4 Exchequer Issues
The Controller of Budget authorised withdrawal of Kshs.2.99 billion from the CRF account, which was 48.6 per cent of the approved budget. This represented an increase of 55.7 per cent from Kshs.1.92 billion authorized in a similar period of FY 2014/15 and consisted of Kshs.2.07 billion (69.3 per cent) for recurrent expenditure and Kshs.920 million (30.7 per cent) for development activities.
3.8.5 Overall Expenditure Review
The County spent a total of Kshs.2.81 billion during the first half of FY 2015/16 which was 93.7 per cent of the total funds released for both recurrent and development expenditure. This is an increase from the Kshs.2.66 billion spent in a similar period of FY 2014/15. A total of Kshs.2.03 billion was spent on recurrent activities and Kshs.777.56 million on development activities. Recurrent

COUNTY GOVERNMENTS BUDGET IMPLEMENTATION REVIEW REPORT FIRST HALF FY, 2015/16 73
expenditure was 97.8 per cent of the funds released for recurrent activities while development expenditure accounted for 84.5 per cent of the funds released for development activities. The expenditure does not include pending bills as at 31st December, 2015 that amounted to Kshs.688.56 million for development expenditure and Kshs.151.97 million for recurrent activities.
Recurrent expenditure for the period under review represented 51.3 per cent of the approved annual recurrent budget, a decrease from 82.7 per cent spent in a similar period of FY 2014/15. On the other hand, development expenditure recorded an absorption rate of 35.1 per cent, an improvement from 27.3 per cent spent in a similar period of FY 2014/15. A comparison of the total expenditure in the first half of FY 2014/15 and in the first half of FY 20151/16 is shown in Figure 3.30.
Figure 3.30: Homa Bay County, Expenditure by Economic Classification for First Half of FY 2014/15 and First Half of FY 2015/16
1,444.30
755.3
460.9
1,347.10
681.4777.60
0.00200.00400.00600.00800.00
1,000.001,200.001,400.001,600.00
Personnel Emoluments Operations & Maintenance Development
Ksh
s. M
illio
ns
Expenditure by Economic Classification
1st Half, FY 2014/15
1st Half, FY 2015/16
Source: Home Bay County Treasury
3.8.6 Recurrent Expenditure Analysis
The total recurrent expenditure for the reporting period was Kshs.2.03 billion against an annual recurrent budget of Kshs.3.95 billion. This represents 51.4 per cent of the annual recurrent budget. The County spent Kshs.1.35 billion (66.5 per cent) on personnel emoluments and Kshs.681.4 million (33.6 per cent) on operations and maintenance as shown in Figure 3.30. Expenditure on personnel emoluments accounted for 48.0 per cent of total expenditure, a significant decrease compared to a similar period of FY 2014/15 when the County spent Kshs.1.44 billion.
The County spent Kshs.56.91 million on sitting allowances to the 64 MCAs against an annual budget of Kshs.129.32 million. This is a decrease from Kshs.63.41 million recorded in a similar period of FY 2014/15. The average monthly sitting allowance per MCA was Kshs.148,200 compared to SRC’s recommended monthly ceiling of Kshs.124,800.
A breakdown of the operations and maintenance expenditure for the reporting period is shown in Figure 3.31.

COUNTY GOVERNMENTS BUDGET IMPLEMENTATION REVIEW REPORT FIRST HALF FY, 2015/1674
Figure 3.31: Homa Bay County, Operations and Maintenance Expenditure for the first half of FY 2015/16
122.31109.99
85.18 75.64 73.77
40.00 32.94 29.70 25.84 22.75 18.65 15.62 13.63 9.00 6.390
20406080
100120140
Dom
estic
& F
orei
gnTr
avel
Oth
er O
& M
Sitti
ng A
llow
ance
s
Adm
inist
ratio
nA
llow
ance
Dai
ly S
ubsis
tenc
e
Tran
sfer
s
Acc
omod
atio
nA
llow
ance
Gen
eral
Offi
ce S
uppl
ies
Conf
eren
ce &
Hos
pita
lity
Trai
ning
Exp
ense
s
Cont
ribut
ion
to P
ensio
nSc
hem
e
Repo
rt W
ritin
g
Mem
bers
Med
ical
Sche
me
Cons
truct
ion
& B
uild
ing
Publ
ic P
artic
ipat
ion
Ksh
s. M
illio
ns
Major Categories of O & M Expenditure
Source: Home Bay County Treasury
The aggregate expenditure on domestic and foreign travel was Kshs.122.31 million compared to Kshs.112.1 million incurred in a similar period of FY 2014/15, representing an increase of 19.1 per cent. This expenditure comprised of Kshs.70.57 million spent by the County Executive and Kshs.51.74 million by the County Assembly.
3.8.7 Development Expenditure Analysis
A summary of development expenditure during the first half of FY 2015/16 is provided in figure 3.32.
Figure 3.32: Homa Bay County, Summary of Development Expenditure for the First Half of FY 2015/16
211.65
96.21 78.89 69.50 54.69 42.90 38.24 36.03 33.29 27.67 26.29 19.53
0
50
100
150
200
250
Dev
elop
men
t of m
ajor
&ac
cess
road
s
Civ
il W
orks
Con
stru
ctio
n of
Wat
erSu
pplie
s
Tran
sfer
to F
inan
ceD
epar
tmen
t
Con
stru
ctio
n &
Bui
ldin
g
Med
ical
Dru
gs
Oth
er C
ivil
Wor
ks
Off
ice
Furn
iture
Wat
er &
Sew
erag
e
Tran
sfer
to O
ther
Dep
artm
ents
Con
stru
ctio
n of
New
Roa
ds
Ren
ovat
ion
of 1
0C
omm
ittee
Roo
ms
Ksh
s. M
illio
ns
Major Categories of Development Expenditure
Source: Homa Bay County Treasury

COUNTY GOVERNMENTS BUDGET IMPLEMENTATION REVIEW REPORT FIRST HALF FY, 2015/16 75
Analysis of the development expenditure of Kshs.777.56 million in the first half of FY 2015/16 indicates that the Roads Department reported the highest expenditure of Kshs.211.65 million which was spent on development of major and access roads. A total of 290 kilometers of roads were maintained across the 40 wards. The second highest expenditure of Kshs.96.21 million was incurred by the Trade and Industry Department on structural engineering. The Department of Water and Environment incurred Kshs.78.89 million on construction of water supplies while the Department of Finance and Planning made some transfers amounting to Kshs.69.50 million. The County however did not provide detailed information on the transfers.
3.8.8 Annual Budget and Budget Performance Analysis by Department for the First Half of FY 2015/16
The summary of the FY 2015/16 annual budget estimates and budget performance for the first half is shown in Table 3.16.
Table 3.16: Homa Bay County, Annual Budget and First Half of FY 2015/16 Budget Performance by Department
Department Annual Budget Alloca-tion (Kshs. Million)
6 Months Exche-quer Issues (Kshs.
Million)
6 Months Expendi-ture (Kshs. Million)
6 Months Expenditure to Exchequer
Issues (%)
Absorption rate (%)
Rec Dev Rec Dev Rec Dev Rec Dev Rec Dev
Office of the Governor 464.13 - 277.50 - 502.67 6.52 181.1 - 108.3 -
Finance & Economic Planning 479.95 417.95 186.50 - 338.87 95.80 181.7 - 70.6 22.9
Tourism, Culture, Youth and Sports 38.49 64.31 18.00 13.00 9.30 7.88 51.7 60.6 24.2 12.3
Health and Medical Services 1017.78 461.00 485.10 288.00 436.26 101.21 89.9 35.1 42.9 22.0
Education and ICT 355.01 33.89 236.50 23.00 141.74 30.70 59.9 133.5 39.9 90.6
Transport and Infrastruc-ture 67.10 499.00 38.50 177.00 19.13 334.62 49.7 189.1 28.5 67.1
County Assembly 880.12 70.00 463.00 48.00 338.87 19.53 73.2 40.7 38.5 27.9
Lands, Housing & Phys-ical planning 58.61 80.95 33.00 20.00 18.56 72.96 56.2 364.8 31.7 90.1
Trade, Industry, Co-op-eratives and Investments 132.53 117.83 90.00 51.00 18.62 14.32 20.7 28.1 14.0 12.2
Energy and Natural Resources 32.32 72.00 14.50 45.00 13.17 5.65 90.8 12.6 40.8 7.9
Agriculture, Livestock and Fisheries Services 213.20 156.20 149.00 94.00 67.62 9.48 45.4 10.1 31.7 6.1
Water Services and Environment 115.90 240.00 67.00 161.00 75.83 78.89 113.2 49.0 65.4 32.9
County Public Service Board 94.57 - 15.00 0.00 47.91 - 319.4 - 50.7 -
Total 3949.71 2213.13 2073.60 920.00 2028.55 777.56 97.8 84.5 51.4 35.1
Source: Homa Bay County Treasury

COUNTY GOVERNMENTS BUDGET IMPLEMENTATION REVIEW REPORT FIRST HALF FY, 2015/1676
Analysis of budget performance by department shows that the Department of Education and ICT reported the highest absorption rate of its development budget at 90.6 per cent while the Department of Agriculture, Livestock and Fisheries Services registered the lowest absorption rate at 6.1 per cent. On the other hand, Office of the Governor attained the highest percentage of its recurrent expenditure to its recurrent budget at 108.3 per cent while Trade, Industry, Cooperative Development and Investment Department had the lowest percentage at 14.0 per cent.
3.8.9 Borrowing by the County Government
Article 212 of the Constitution requires a county government to borrow with approval from the County Assembly, and only if the national government guarantees the loan. Further, Section 58 of the PFM Act 2012 gives the Cabinet Secretary to the National Treasury the powers to guarantee loans subject to approval by Parliament. During the period under review, the County utilized its equitable share and local revenue collection deposited at the County Revenue Fund account maintained at the Central Bank of Kenya and did not borrow any funds.
3.8.10 Observations and Recommendations
The County has made progress in addressing some of the challenges previously identified as affecting budget implementation. The County has:
ii. Improved local revenue collection from Kshs.64.99 million in the first half of FY 2014/15 to Kshs.83.38 million in first half of FY 2015/16.
iii. Developed and approved regulations to operationalize the County Assembly Members Car Loan and Mortgage Fund and the County Bursary Fund.
Despite the progress made, the following challenges continued to hamper effective budget implementation;
1. Delay in submission of expenditure reports contrary to Section 166 of the PFM Act 2012.
2. Some departments have not fully embraced use of IFMIS in processing financial transactions. Instead, the departments use both IFMIS and manual systems, which is prone to manipulation.
3. The Department of Health spent locally generated revenue at source in contravention of section 109 of the PMF Act 2012.
The County should implement the following recommendations in order to improve budget execution
1. The County Treasury should submit expenditure reports according to the set timelines.
2. All the County entities should fully adopt IFMIS in processing financial transactions.
3. The County Treasury should ensure that all revenue collected locally is deposited into the CRF in line with section 109 of the PFM Act 2012.

COUNTY GOVERNMENTS BUDGET IMPLEMENTATION REVIEW REPORT FIRST HALF FY, 2015/16 77
3.9 Isiolo County3.9.1 Overview of the FY 2015/16 Budget
The FY 2015/16 approved budget for Isiolo County amounts to Kshs.3.80 billion. It comprised of Kshs.2.11 billion (55.6 per cent) for recurrent expenditure and Kshs.1.69 billion (44.4 per cent) for development expenditure.
In order to finance the budget, the County expected to receive Kshs.3.06 billion (80.4 per cent) as transfers from the National Government, collect Kshs.360 million (9.5 per cent) from local sources, and receive a conditional grant of Kshs.8.73 million ( 0.2 per cent) from World Bank loan to supplement financing of county health facilities, and Kshs.7.97 million ( 0.2 per cent) from DANIDA grant to supplement financing for county health facilities, Kshs.254.70 million as conditional grant from national government, Kshs.112.80 million as appropriations in aid. The County did not include in the budget Kshs.24.68 million as opening balance brought forward from FY 2014/15.The conditional grants as per the County Allocation of Revenue Act, 2015 were Kshs.161.12 million, however what was included in the budget amounts to Kshs.254.70 million, depicting a shortfall of Kshs.93.62 million. The Kshs.161.12 million conditional grant comprises of Kshs.95.74 million for leasing of medical equipment, Kshs.38.83 million from the road maintenance fuel levy fund, Kshs.23.21 million for free maternal health care, Kshs.3.34 million for compensation of forgone user fees.
3.9.2 Revenue Analysis
In the first half of FY 2015/16, the County received Kshs.1.28 billion from the National Government as equitable share, raised Kshs.57.32 million from local sources, Kshs.9.25 million as conditional allocation for free maternal healthcare, Kshs.0.76 million as conditional allocations for forgone user fees and Kshs.19.61 million as conditional allocation from the fuel levy fund. The county did not budget Kshs.24.65 million reported as the cash balance brought forward from FY 2014/15.
The quarterly trend in local revenue collection from the FY 2013/14 to the second quarter of FY 2015/16 is shown in table 3.33.
Figure 3.33: Isiolo County, Trend in Local Revenue Collection by Quarter from the FY 2013/14 to the second quarter of FY 2015/16
47.55
28.00
49.90
28.8725.21
35.45
0
10
20
30
40
50
60
Kshs
. Mill
ions
Reporting period
Source: Isiolo County Treasury

COUNTY GOVERNMENTS BUDGET IMPLEMENTATION REVIEW REPORT FIRST HALF FY, 2015/1678
The local revenue consisted of Kshs.35.45 million raised in the first quarter and Kshs.21.87 million in the second quarter. The local revenue raised in the first half of the FY 2015/16 was Kshs.57.32 million (15.75 per cent of the annual local revenue target), a decline from Kshs.79.62 million collected in a similar period of FY 2014/15.
The analysis of local revenue for the first half of FY 2015/16 by stream is shown in Table 3.17.
Table 3.17: Isiolo County, Analysis of revenue collection by stream for the first half of FY 2015/16
No. Revenue Stream Annual Targeted Revenue (Kshs.)
Six Months Actual Reve-nue (Kshs.)
Revenue Performance (%)
A B C D=*100
1Plot Transfer/Subdivision/
Registration/Approval Fees2,000,000 1,666,500 83.3
2 Slaughter Fee 1,500,000 1,010,425 67.4
3 Liquor Application 3,000,000 1,799,000 60.0
4 Parking Fee 6,000,000 2,727,730 45.5
5 Hospital Charges 15,000,000 1,799,000 12
6 Livestock Cess 6,000,000 1,975,950 32.9
7 Miraa Cess 5,000,000 1,253,464 25.1
8 Sand Cess 10,200,000 2,271,400 22.3
9 Water Levies 3,000,000 508,564 17
10 Promotions Fee 6,500,000 1,070,055 16.5
11 Game Parks Entry Charges 210,000,000 28,151,462 13.4
12 Land Rates & Rents 70,200,000 5,933,816 8.45
13 Planning & Survey Fee 8,500,000 10,000 0.12
14 Other revenue streams 13,100,000 6,509,140 49.6
TOTAL 360,000,000 56,686,506 15.75
Source: Isiolo County Treasury
The analysis of revenue by stream indicates that Plot Transfer Fees and Slaughter House Fees were the best performing revenue streams achieving 83.30 per cent and 67.4 per cent against their annual targets respectively.
3.9.3 Banking of local revenue
A review of bank statements of the revenue collection account indicated that all locally generated revenue was deposited into the CRF during the period under review. This conforms to Article 207 of the Constitution and Section 109 of the PFM Act 2012, which stipulates that all funds raised or received by or on behalf of the County Government shall be deposited into the CRF account unless excluded by an Act of Parliament.
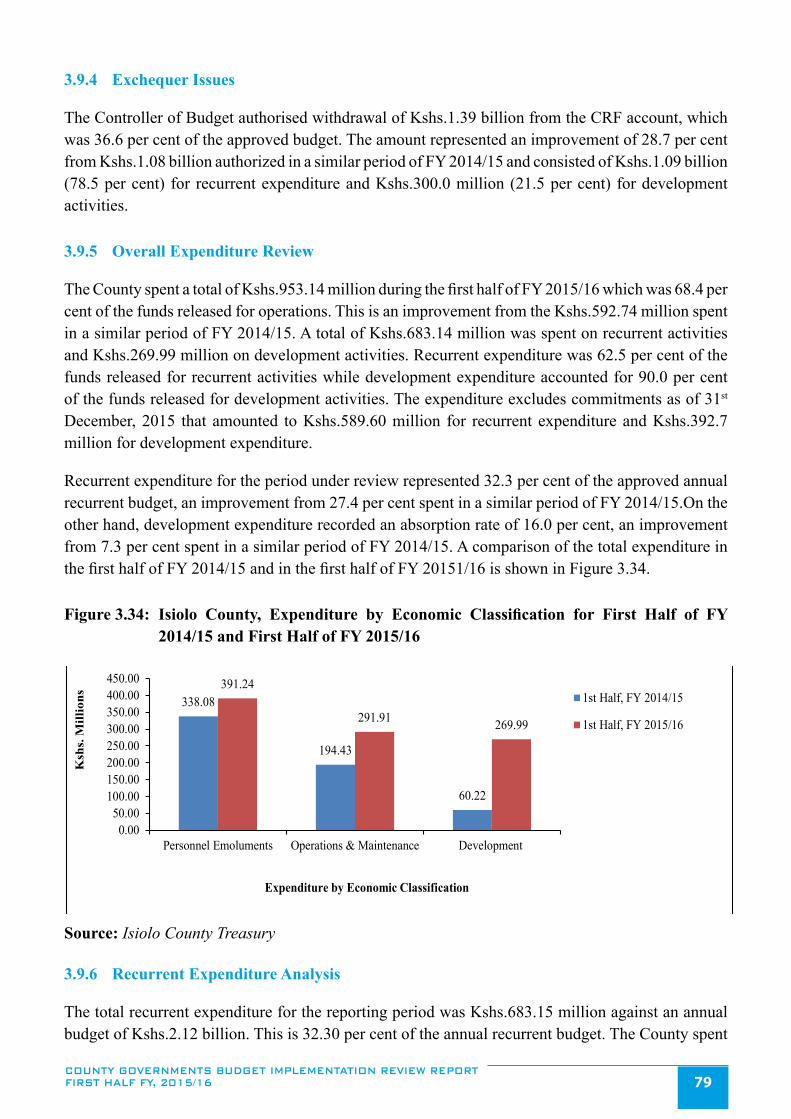
COUNTY GOVERNMENTS BUDGET IMPLEMENTATION REVIEW REPORT FIRST HALF FY, 2015/16 79
3.9.4 Exchequer Issues
The Controller of Budget authorised withdrawal of Kshs.1.39 billion from the CRF account, which was 36.6 per cent of the approved budget. The amount represented an improvement of 28.7 per cent from Kshs.1.08 billion authorized in a similar period of FY 2014/15 and consisted of Kshs.1.09 billion (78.5 per cent) for recurrent expenditure and Kshs.300.0 million (21.5 per cent) for development activities.
3.9.5 Overall Expenditure Review
The County spent a total of Kshs.953.14 million during the first half of FY 2015/16 which was 68.4 per cent of the funds released for operations. This is an improvement from the Kshs.592.74 million spent in a similar period of FY 2014/15. A total of Kshs.683.14 million was spent on recurrent activities and Kshs.269.99 million on development activities. Recurrent expenditure was 62.5 per cent of the funds released for recurrent activities while development expenditure accounted for 90.0 per cent of the funds released for development activities. The expenditure excludes commitments as of 31st December, 2015 that amounted to Kshs.589.60 million for recurrent expenditure and Kshs.392.7 million for development expenditure.
Recurrent expenditure for the period under review represented 32.3 per cent of the approved annual recurrent budget, an improvement from 27.4 per cent spent in a similar period of FY 2014/15.On the other hand, development expenditure recorded an absorption rate of 16.0 per cent, an improvement from 7.3 per cent spent in a similar period of FY 2014/15. A comparison of the total expenditure in the first half of FY 2014/15 and in the first half of FY 20151/16 is shown in Figure 3.34.
Figure 3.34: Isiolo County, Expenditure by Economic Classification for First Half of FY 2014/15 and First Half of FY 2015/16
338.08
194.43
60.22
391.24
291.91 269.99
0.0050.00
100.00150.00200.00250.00300.00350.00400.00450.00
Personnel Emoluments Operations & Maintenance Development
Ksh
s. M
illio
ns
Expenditure by Economic Classification
1st Half, FY 2014/15
1st Half, FY 2015/16
Source: Isiolo County Treasury
3.9.6 Recurrent Expenditure Analysis
The total recurrent expenditure for the reporting period was Kshs.683.15 million against an annual budget of Kshs.2.12 billion. This is 32.30 per cent of the annual recurrent budget. The County spent

COUNTY GOVERNMENTS BUDGET IMPLEMENTATION REVIEW REPORT FIRST HALF FY, 2015/1680
Kshs.391.24 million (57.3 per cent) on personnel emoluments and Kshs.291.91 million (42.7 per cent) on operations and maintenance as shown in Figure 3.34. Expenditure on personnel emoluments accounted for 41.4 per cent of total expenditure and has increased in FY 2015/16 as compared to a similar period of FY 2014/15 when the County spent Kshs.338.08 million.
The County spent Kshs.8.38 million on sitting allowances to the 21 MCAs and the Speaker against an annual budget of Kshs.29.44 million. This is an increase as compared to a similar period of FY2014/15. The average monthly sitting allowance per MCA was Kshs.66,542 compared to SRC’s recommended monthly ceiling of Kshs.124,800.
A breakdown of the operations and maintenance expenditure for the reporting period is shown in Figure 3.35.
Figure 3.35: Isiolo County, Operations and Maintenance Expenditure for the First Half of FY 2015/16
61.45
19.10 18.94 17.12 13.19 12.00 11.30 8.23 7.01 5.73 -
10.00 20.00 30.00 40.00 50.00 60.00 70.00
Dom
esti
c an
dF
orei
gn T
rave
l
Leg
al F
ees
Med
ical
Dru
gs
Fue
l
Boa
rds
&C
onfe
renc
es
Gro
up I
nsur
ance
Fur
nitu
re a
ndfi
ttin
gs
Con
trac
ted
Tec
hnic
alS
ervi
ces
Cat
erin
g S
ervi
ces
Mai
nten
ance
Exp
ense
s
Ksh
s M
illi
ons
Major Categories of O & M expenditure
Source: Isiolo county Treasury
The aggregate expenditure on domestic and foreign travel was Kshs.68.71 million compared to Kshs.50.0 million incurred in a similar period of FY 2014/15, representing an increase of 36.2 per cent. This expenditure comprised of Kshs.49.57 million spent by the County Executive and Kshs.19.14 million by the County Assembly.
3.9.7 Development Expenditure Analysis
A summary of development expenditure during the first half of FY 2015/16 is shown in figure 3.36.

COUNTY GOVERNMENTS BUDGET IMPLEMENTATION REVIEW REPORT FIRST HALF FY, 2015/16 81
Figure 3.36: Isiolo County, Summary of Development Expenditure for the First Half of FY 2015/16
93.99
25.73 17.50 17.26
9.00 6.52 4.49 4.11 3.90 3.53 1.19 0
102030405060708090
100Em
erge
ncy
Rel
ief
Con
sulta
ncy
serv
ices
Feas
ibili
ty st
udie
s
Publ
ic P
atic
ipat
ion
foru
m
Con
stru
ctio
n of
War
dO
ffic
es- A
ssem
bly
Con
stru
ctio
n of
Bui
ldin
gs
Agr
icul
tura
l sup
plie
s
Secu
rity
Ope
ratio
ns
Educ
atio
nal A
ids
Med
ical
Equ
ipm
ents
Upg
rade
of R
oads
Ksh
s. M
illio
ns
Major categories of Development expenditure
Source: Isiolo County Treasury
Analysis of the development expenditure of Kshs.269.99 million incurred in the first half of FY 2015/16 indicates that the Office of the Governor reported the highest expenditure of Kshs.80.50 million which was spent on delivery of relief supplies. The second highest expenditure of Kshs.30.90 million was incurred by the Department of Cohesion and Intergovernmental relations on famine relief and feasibility studies. The Department of Land, Physical Planning and Urban Development incurred Kshs.17.30 million for public participation forums on land issues and peace building initiatives while the Department of Agriculture incurred Kshs.4.5 million on Agricultural supplies. The office has noted that the provided list of development projects should have been classified as recurrent expenditure.
3.9.8 Annual Budget and Budget Performance Analysis by department for the First Half of FY 2015/16
A summary of the FY 2015/16 annual budget estimates and budget performance for the first half by department is shown in Table 3.18.
Table 3.18: Isiolo County, Annual Budget and First Half of FY 2015/16 Budget Performance by Department
Department
Annual Bud-get Allocation
( Kshs. Millions)
6 Months Ex-chequer Issues
( Kshs. Millions)
6 Month Expen-diture ( Kshs. Millions)
6 Month Expen-diture to Exche-quer Issues (%)
Absorption rate (%)
Rec Dev Rec Dev Rec Dev Rec Dev Rec Dev
County Assembly 380.93 70.00 203.40 25.00 162.18 9.00 79.7 36.0 42.6 12.9
Office of the Governor 258.77 108.00 123.41 10.00 106.59 85.05 86.4 850.5 41.2 78.8
Finance and planning 314.71 211.50 139.68 50.00 96.62 37.53 69.2 75.1 30.7 17.7
Lands and Planning 53.93 343.85 30.98 75.00 7.77 19.23 25.1 25.6 14.4 5.6

COUNTY GOVERNMENTS BUDGET IMPLEMENTATION REVIEW REPORT FIRST HALF FY, 2015/1682
Department
Annual Bud-get Allocation
( Kshs. Millions)
6 Months Ex-chequer Issues
( Kshs. Millions)
6 Month Expen-diture ( Kshs. Millions)
6 Month Expen-diture to Exche-quer Issues (%)
Absorption rate (%)
Rec Dev Rec Dev Rec Dev Rec Dev Rec Dev
Agriculture, Livestock 117.57 192.00 69.76 10.00 40.93 8.49 58.7 84.9 34.8 4.4 Cohesion and Intergovern-mental Relations 13.23 68.18 5.67 15.00 1.13 30.91 19.9 206.0 8.5 45.3
Education 150.04 95.00 75.93 14.00 9.55 24.49 12.6 175.0 6.4 25.8
Tourism and Culture 45.98 122.50 19.87 15.00 6.76 17.83 34.0 118.8 14.7 14.6 Public Service Manage-ment 70.09 9.10 31.23 - 16.91 1.77 54.1 0.0 24.1 19.5
Water and Irrigation 101.10 243.33 56.83 50.00 20.91 9.07 36.8 18.1 20.7 3.7
Health Services 567.56 157.37 325.03 30.00 205.15 7.11 63.1 23.7 36.1 4.5
Trade and cooperatives 27.00 40.00 5.10 5.00 5.23 3.62 102.5 72.4 19.4 9.0
Town Administration 14.10 25.00 6.12 1.00 3.89 15.89 63.6 1589.2 27.6 63.6
TOTAL 2115.00 1685.83 1093.00 300.00 683.62 269.99 62.5 90.0 32.3 16.0
Source: Isiolo County Treasury
Analysis of budget performance by department shows that the Office of the Governor had the highest absorption of its development budget at 78.8 per cent, The Department of Water and Irrigation the lowest absorption at 3.7 per cent. On the other hand, the County Assembly had the highest percentage of its recurrent expenditure to its recurrent budget at 42.6 per cent while Education and Sports Department had the lowest percentage at 6.4 per cent.
3.9.9 Borrowing by the County Government
Article 212 of the Constitution requires a county government to borrow with approval from the County Assembly, and only if the national government guarantees the loan. Further, Section 58 of the PFM Act 2012 gives the Cabinet Secretary to the National Treasury the powers to guarantee loans subject to approval by Parliament. During the period under review, the County utilized its equitable share and local revenue collections deposited into the County revenue fund account maintained at CBK and did not borrow any funds.
3.9.10 Observations and Recommendations
The County has made significant progress in addressing the challenges previously identified as affecting budget implementation. The County has:
i. Improved capacity of the County Assembly technical staff through training.
ii. Procured an automated local revenue collection system.
iii. Adopted use of IFMIS and internet banking in the processing of financial transactions.

COUNTY GOVERNMENTS BUDGET IMPLEMENTATION REVIEW REPORT FIRST HALF FY, 2015/16 83
Despite the progress made, the following challenges continued to hamper effective budget implementation:
1. High wage bill due to recruitment of additional staff.
2. Delay in submission of financial reports as well as failure to submit quarterly financial reports for the County Assembly Car Loan Fund.
3. Delay in approval of Emergency Fund and Bursary Fund regulations by the County Assembly. This has led to difficulties in administration, reporting and accounting for these funds.
The County should implement the following recommendations in order to improve budget execution:
1. The County Treasury should liaise with the County Public Service Board to review the wage bill and staff establishment for sustainability.
2. The County Treasury should put in place mechanisms that will enable production of financial reports in a timely basis. In addition, administrators of the established County Funds should submit Fund reports as required by Section 168 of the PFM Act 2012.
3. The County Assembly should fast track approval of the regulations to operationalize the Emergency Fund and the Bursary Fund.
3.10 Kajiado County
3.10.1 Overview of the FY 2015/16 Budget
The FY 2015/16 approved budget for Kajiado County is Kshs.6.59 billion. It comprised of Kshs.3.93 billion (59.6 per cent) for recurrent expenditure and Kshs.2.66 billion (40.4 per cent) for development expenditure.
In order to finance the budget, the County expects to receive Kshs.4.41 billion (67 per cent) as transfers from the National Government, collect Kshs.1.13 billion (17.2 per cent) from local sources, receive a conditional grant of Kshs.15.51 million (0.2 per cent) from DANIDA, Kshs.41.33 million as free maternal health care fund (0.6 per cent) and Kshs.984.80 million (14.9 per cent) as cash balance brought forward from FY 2014/15. However, the County did not budget for the additional conditional grants of Kshs.176.35 million from the National Government as contained in CARA, 2015 for compensation of forgone user fees, leasing of medical equipment and road maintenance fuel levy fund. The allocation for free maternal health care was under budgeted by Kshs.8.53 million.
3.10.2 Revenue Analysis
During the first half of FY 2015/16, the County received Kshs.1.48 billion from the National Government as equitable share, Kshs.28.31 million as conditional allocations from the Roads Maintenance Fuel Levy Fund, Kshs.18.59 million as conditional allocation for free maternal health care, Kshs.3.97 million as conditional allocations for forgone user fees, raised Kshs.290.75 million from local sources, and had a cash balance of Kshs.984.80 million brought forward from FY 2014/15. The quarterly trend in local revenue collection from FY 2013/14 to the second quarter of FY 2015/16

COUNTY GOVERNMENTS BUDGET IMPLEMENTATION REVIEW REPORT FIRST HALF FY, 2015/1684
is shown in figure 3.37.
Figure 3.37: Kajiado County, Trend in Local Revenue Collection by Quarter from the FY 2013/14 to the second quarter of FY 2015/16
316.49
0.00
50.00
100.00
150.00
200.00
250.00
300.00
350.00
Ksh
s.mill
ion
Reporting period
Source: Kajiado County Treasury
The local revenue consisted of Kshs.159.21 million raised in the first quarter and Kshs.131.54 million in the second quarter. The local revenue raised in the first half of the FY 2015/16 was Kshs.290.75 million (25.6 per cent of the annual local revenue target), an improvement from Kshs.236.42 million collected in a similar period of FY 2014/15.
The analysis of local revenue for the first half of FY 2015/16 by stream is shown in Table 3.19.
Table 3.19: Kajiado County, Analysis of revenue collection by stream for the first half of FY 2015/16
No. Revenue Stream Annual Targeted Reve-nue (Kshs.)
Six Months Actual Reve-nue (Kshs.)
Revenue Perfor-mance (%)
A B C D=*100
1 Sand Cess 176,253,516 77,128,680 43.8
2 Market Fees 77,702,142 40,756,095 52.5
3 Land Rates 104,166,738 37,666,790 36.2
4 Building Plan Approval 125,500,000 28,082,091 22.4
5 Public Health, Medical Levies and Hospital Fees 95,288,578 27,205,156 28.6
6 Royalties/Ballast Cess 74,658,134 26,272,444 35.2
7 Livestock Cess 27,950,000 15,672,413 56.1
8 Single Business Permit 192,542,098 13,790,635 7.2
9 Parking Fees 70,479,332 12,559,215 17.8
10 Market Levy 77,702,142 10,645,496 13.7
11 Other Sources 112,640,698 969,822 0.9
TOTAL 1,134,883,378 290,748,837 25.6
Source: Kajiado County Treasury

COUNTY GOVERNMENTS BUDGET IMPLEMENTATION REVIEW REPORT FIRST HALF FY, 2015/16 85
The analysis of revenue by stream indicates that Livestock Cess recorded the highest performance against the annual target at 56.1 per cent followed by Market Fees at 52.5 per cent.
3.10.3 Banking of local revenue
A review of the bank statements for the revenue collection account indicates that all locally generated revenue was deposited into the CRF during the period under review. This conforms to Article 207 of the Constitution and Section 109 of the PFM Act 2012, which stipulates that all funds raised or received by or on behalf of the County Government shall be deposited into the CRF account unless excluded by an Act of Parliament.
3.10.4 Exchequer Issues
The Controller of Budget authorised withdrawal of Kshs.2.46 billion from the CRF account, which was 37.3 per cent of the approved budget. The exchequer releases consisted of Kshs.1.71 billion (69.5 per cent) for recurrent expenditure and Kshs.750 million (30.5 per cent) for development activities. The amount depicted a decline of 11.9 per cent from Kshs.2.20 billion authorized in a similar period of FY 2014/15.
3.10.5 Overall Expenditure Review
The County spent a total of Kshs.1.89 billion during the first half of FY 2015/16 which was 76.8 per cent of the funds released for both recurrent and development expenditure. This is a slight increase from the Kshs.1.86 billion spent in a similar period of FY 2014/15. A total of Kshs.1.32 billion was spent on recurrent activities and Kshs.573.12 million on development activities. Recurrent expenditure was 77.5 per cent of the funds released for recurrent activities while development expenditure accounted for 76.4 per cent of the funds released for development activities. The expenditure excludes commitments as of 31st December, 2015 that amounted to Kshs.1.42 billion for development and Kshs.360.48 million for recurrent expenditure.
Recurrent expenditure for the period under review represented 33.6 per cent of the approved annual recurrent budget, a decrease from 36.6 per cent spent in a similar period of FY 2014/15. On the other hand, development expenditure recorded an absorption rate of 21.5 per cent, a decrease from 22 per cent spent in a similar period of FY 2014/15. A comparison of the total expenditure in the first half of FY 2014/15 and in the first half of FY 2015/16 is shown in Figure 3.38.

COUNTY GOVERNMENTS BUDGET IMPLEMENTATION REVIEW REPORT FIRST HALF FY, 2015/1686
Figure 3.38: Kajiado County, Expenditure by Economic Classification for First Half of FY 2014/15 and for First Half of FY 2015/16
605
845
410
833.34
487.77573.12
0100200300400500600700800900
Personnel Emoluments Operations & Maintenance Development
Ksh
s. M
illi
on
s
Expenditure by Economic Classification
1st Half, FY 2014/15
1st Half, FY 2015/16
Source: Kajiado County Treasury
3.10.6 Recurrent Expenditure Analysis
The total recurrent expenditure for the reporting period was Kshs.1.32 billion against an annual recurrent budget of Kshs.3.93 billion. This represents 33.6 per cent of the annual recurrent budget. The County spent Kshs.833.34 million (63.1 per cent) on personnel emoluments and Kshs.487.77 million (36.9 per cent) on operations and maintenance as shown in Figure 3.38. Expenditure on personnel emoluments accounted for 63.1 per cent of total recurrent expenditure and has increased significantly in the first half of FY 2015/16 as compared to a similar period of FY 2014/15 when the County spent Kshs.605 million. The increase is attributed to recruitment of new staff and annual staff salary increment.
The County spent Kshs.19.20 million on sitting allowances to the 42 MCAs including the Speaker against an annual budget of Kshs.66.32 million. This is a significant increase from Kshs.7.74 million spent in a similar period of FY 2014/15. The average monthly sitting allowance per MCA was Kshs.76,210 compared to SRC’s recommended monthly ceiling of Kshs.124,800.
A breakdown of the operations and maintenance expenditure for the reporting period is shown in Figure 3.39.

COUNTY GOVERNMENTS BUDGET IMPLEMENTATION REVIEW REPORT FIRST HALF FY, 2015/16 87
Figure 3.39: Kajiado County, Operations and Maintenance Expenditure for the First Half of FY 2015/16
120.37
81.3261.24
34.3124.11 22.49 13.55 12.04 11.40 10.78 10.56 7.13 4.33
020406080
100120140
Spec
ialis
ed M
ater
ials
Dom
estic
and
For
eign
Trav
el
Oth
er O
pera
ting
Cos
ts
Prin
ting
and
Adv
ertis
ing
Fuel
and
Lub
rican
ts
Loan
s and
Oth
erIn
stru
men
ts
Trai
ning
Gen
eral
Off
ice
Supp
lies
Mot
or V
ehic
leM
aint
enan
ce
Off
ice
Util
ities
Purc
hase
of O
ffic
eFu
rnitu
re a
nd G
ener
alEq
uipm
ent
Com
mun
icat
ion
Hos
pita
lity
Ksh
s. M
illio
ns
Major Categories of O & M Expenditure
Source: Kajiado County Treasury
The aggregate expenditure on domestic and foreign travel was Kshs.81.32 million compared to Kshs.127.59 million incurred in a similar period of FY 2014/15, representing a decrease of 36.3 per cent. This expenditure comprised of Kshs.38.20 million spent by the County Executive and Kshs.43.12 million by the County Assembly.
3.10.7 Development Expenditure AnalysisA summary of development expenditure during the first half of FY 2015/16 is provided in figure 3.40.
Figure 3.40: Kajiado County, Summary of Development Expenditure for the First Half of FY 2015/16
139.23 117.77
80.97
48.68 39.39 15.73 15.00 10.00 8.83
020406080
100120140160
EC
D C
lass
room
s &
Poly
tech
nics
Roa
ds &
Oth
er C
ivil
Wor
ks
Wat
er S
uppl
ies,
Sew
erag
eSy
stem
s &
Irr
igat
ion
Sche
mes
Con
stru
ctio
n/ R
enov
atio
nof
Mar
kets
Con
stru
ctio
n of
hea
lthfa
cilit
ies
Con
stru
ctio
n of
Wat
erC
anal
s
Dev
elop
men
t of
Val
uatio
nR
oll o
n Pl
ots
Inst
alla
tion
of L
AN
Ref
urbi
shm
ent/
Ren
ovat
ion
of O
ffic
es
Ksh
s.m
illio
n
Major Categories of Development Expenditure
Source: Kajiado County Treasury

COUNTY GOVERNMENTS BUDGET IMPLEMENTATION REVIEW REPORT FIRST HALF FY, 2015/1688
Analysis of the development expenditure of Kshs.573.12 million incurred in the first half of FY 2015/16 indicates that the Education Sector reported the highest expenditure of Kshs.139.23 million on construction of classrooms and polytechnics. The second highest expenditure of Kshs.117.77 million was incurred by the Roads department on construction and rehabilitation of roads. The department of Water and Irrigation incurred Kshs.80.97 million on construction and maintenance of water supplies and sewerage systems while the department of Trade incurred Kshs.48.66 million on construction and renovation of markets.
3.10.8 Annual Budget and Budget Performance Analysis by department for the First Half of FY 2015/16
A summary of the FY 2015/16 annual budget estimates and budget performance for the first half by department is shown in Table 3.20.
Table 3.20: Kajiado County, Annual Budget and First Half of FY 2015/16 Budget Performance by Department
Department Annual Budget Alloca-tion (Kshs. Millions)
Six Months Exche-quer Issues (Kshs.
Millions)
Six Months Ex-penditure (Kshs.
Millions)
Six Months Expenditure to
Exchequer Issues (%)
Absorption rate (%)
Rec Dev Rec Dev Rec Dev Rec Dev Rec Dev
Office of the Governor/
D/Governor167.87
- 68.11 - 50.52
- 74.2 - 30.1
-
County Public Service Board 86.30
- 42.35 - 34.85
- 82.3 - 40.4
-
Education 286.68 636.84 58.37 149.00 74.50 107.79 127.6 72.3 26.0 16.9
Health 1244.26 276.43 583.46 140.00 486.15 62.30 83.3 44.5 39.1 22.5
Information & Citizen Participation 47.70 89.59 20.50 62.00 13.66 48.52 66.6 78.3 28.6 54.2
Agriculture 241.97 36.50 98.10 26.50 74.47 - 75.9
- 30.8 -
Water & Irrigation 92.61 359.24 31.71 62.00 24.02 61.61 75.8 99.4 25.9 17.2
Public Works & Roads 94.85 673.03 42.94 138.00 30.57 208.68 71.2 151.2 32.2 31.0
Finance and Economic Planning 445.30 59.03 236.61 15.00 135.75 20.80 57.4
138.7 30.5 35.2
Industrialization 87.01 268.23 41.34 105.00 29.15 51.31 70.5 48.9 33.5 19.1
Lands & Physical Planning 133.13 137.95 62.30 42.50 41.17 5.57 66.1 13.1 30.9 4.0
County Assembly 513.88 124.52 237.82 10.00 201.49 6.55 84.7 65.5 39.2 5.3
County Public Service and E-government 485.86
- 182.01 - 124.81
- 68.6 - 25.7
-
TOTAL 3927.42 2661.37 1705.63 750.00 1321.11 573.12 77.5 76.4 33.6 21.5
Source: Kajiado County Treasury
Analysis of budget performance by department shows that the Department of Information and Citizen Participation reported the highest absorption rate of its development budget at 54.2 per cent while the Department of Agriculture did not incur any development expenditure during the reporting period. On the other hand, the County Public Service Board had the highest percentage of its expenditure

COUNTY GOVERNMENTS BUDGET IMPLEMENTATION REVIEW REPORT FIRST HALF FY, 2015/16 89
against its recurrent budget at 40.4 per cent while the Public Service and E-government Department had the lowest percentage at 25.7 per cent.
3.10.9 Borrowing by the County Government
Article 212 of the Constitution requires a county government to borrow with approval from the County Assembly, and only if the national government guarantees the loan. Further, Section 58 of the PFM Act 2012 gives the Cabinet Secretary to the National Treasury the powers to guarantee loans subject to approval by Parliament. During the period under review, the County utilized its equitable share and local revenue collection deposited into the County Revenue Fund account maintained at the Central Bank of Kenya and did not borrow any funds.
3.10.10 Observations and Recommendations
The County has made progress in addressing the challenges previously identified as affecting budget implementation. The County has:
i. Registered notable improvement in local revenue collection from 12.8 per cent in first half of FY 2014/15 to 25.6 per cent in the first half of FY 2015/16.
ii. Fully implemented Internet banking in payment processing.
iii. Cleared pending bills from the previous financial year hence enabling initiation of new projects.
Despite the progress made, the following challenges continued to hamper effective budget implementation;
1. Delay in disbursement of funds by the National Treasury which affected budget implementation.
2. Large outstanding commitments amounting to Kshs.1.78 billion which may result in large pending bills at end of FY 2015/16.
3. Lack of a County project database which makes it difficult to monitor and track status of development expenditure.
4. Delays in submission of revenue and expenditure reports by both the County Assembly and County Executive to the Office of the Controller of Budget.
5. The County did not budget for the additional conditional grants of Kshs.176.35 million as contained in the CARA, 2015 for compensation of user fees forgone, leasing of medical equipment and Road Maintenance Fuel Levy Fund.
The County should implement the following recommendations in order to improve budget execution;
1. The County Treasury should liaise with the National Treasury to ensure timely disbursement of funds as per the disbursement schedule approved by Senate.
2. The County Treasury should ensure that budget commitments are in line with the cash flow

COUNTY GOVERNMENTS BUDGET IMPLEMENTATION REVIEW REPORT FIRST HALF FY, 2015/1690
projections and the exchequer issues in order to minimize pending bills at the end of FY 2015/16.
3. The county should develop a project database to enhance efficiency in monitoring their implementation as well as reporting on projects.
4. The County should ensure timely submission of reports in line with Section 166 of the PFM Act 2012.
5. The County Treasury should develop a supplementary budget for approval by the County Assembly for approval to capture the additional conditional grants of Kshs.176.35 million.
3.11 Kakamega County
3.11.1 Overview of the FY 2015/16 Budget
The FY 2015/16 approved budget estimates for Kakamega County amounts to Kshs.12.33 billion. It comprised of Kshs.6.28 billion (50.9 per cent) allocated to recurrent expenditure and Kshs.6.05 billion (49.1 per cent) to development expenditure.
In order to finance the budget, the County expects to receive Kshs.8.91 billion (72.2 per cent) as equitable share from the National Government, collect Kshs.1.0 billion (8.1 per cent) from local sources, receive a conditional grant of Kshs.23.5 million (0.02 per cent) from DANIDA, Kshs.709.67 million (5.7 per cent) as conditional grants from the National Government as per CARA 2015, and Kshs.1.69 billion (13.7 per cent) as projected cash balance from FY 2014/15. The Kshs.709.67 million conditional grants from the National Government comprises of Kshs.38.71 million for compensation of forgone user fees, Kshs.342.9 million for level 5 Hospital, Kshs.113.16 million from Road Maintenance Fuel Levy Fund, and Kshs.214.9 million for free medical maternal healthcare.
3.11.2 Revenue Analysis
During the first half of FY 2015/16, the County received from the National Government Kshs.2.98 billion as equitable share, Kshs.114.87 million as conditional allocation for Level 5 hospital and Kshs.57.15 million from the Road Maintenance Fuel Levy Fund, Kshs.78.59 million as conditional allocations for free maternal health care and Kshs.12.12 million as conditional allocations for forgone user fees. In addition to the National Government transfers, the County raised Kshs.217.50 million from local sources, and had an actual cash balance of Kshs.1.69 billion brought forward from FY 2014/15.
The quarterly trend in local revenue collection from FY 2013/14 to the second quarter of FY 2015/16 is shown in figure 3.41.

COUNTY GOVERNMENTS BUDGET IMPLEMENTATION REVIEW REPORT FIRST HALF FY, 2015/16 91
Figure 3.41: Kakamega County, Trend in Local Revenue Collection by Quarter from the FY 2013/14 to the second quarter of FY 2015/16
80.80 75.70 74.6094.10
144.83
102.90
126.21142.94
110.19 107.31
40
60
80
100
120
140
160
Kshs
. Mill
ions
Reporting Period
Source: Kakamega County Treasury
The local revenue consisted of Kshs.110.19 million raised in the first quarter and Kshs.107.31 million in the second quarter. The local revenue raised in the first half of the FY 2015/16 was Kshs.217.50 million (21.7 per cent of the annual local revenue target), a decrease from Kshs.242.44 million collected in a similar period of FY 2014/15.
The analysis of local revenue for the first half of FY 2015/16 by stream is shown in Table 3.21.
Table 3.21: Kakamega County, Analysis of revenue collection by stream for the first half of FY 2015/16
No. Revenue Stream Annual Targeted Revenue (Kshs.)
Six Months Actual Reve-nue (Kshs.)
Revenue Performance (%)
A B C D=*1001 Hospitals 275,100,000 94,938,258 34.5
2 Bus Park 48,285,392 24,687,465 51.1
3 Devolved Units and others 21,000,000 23,497,531 111.9
4 Barter Markets 39,361,412 22,965,070 58.3
5 Cess 241,500,000 22,266,875 9.2
6 Business Permits 123,160,304 13,979,904 11.4
7 Machinery Hire 6,112,848 5,754,214 94.1
8 Property Rates 47,250,000 4,995,187 10.6
9 Parking Fees 48,668,340 4,476,820 9.2
10 Housing /Stall Rent 4,011,672 2,389,424 59.6
11 Liquor Licensing 38,331,879 1,958,700 5.1
12 Kiosks 12,945,954 1,682,440 13
13 Slaughter House 7,128,534 516,690 7.2
TOTAL 1,000,000,000 217,539,850 21.8
Source: Kakamega County Treasury
Analysis of revenue by stream indicates that Devolved Units generated the highest percentage of revenue against annual target at 111.9 per cent followed by Hire of Machinery at 94.1 per cent.

COUNTY GOVERNMENTS BUDGET IMPLEMENTATION REVIEW REPORT FIRST HALF FY, 2015/1692
3.11.3 Banking of Local Revenue
A review of the bank statements for the revenue collection account indicates that all locally generated revenue was deposited into the CRF during the period under review. This conforms to Article 207 of the Constitution and Section 109 of the PFM Act 2012, which stipulates that all funds raised or received by or on behalf of the County Government, should be deposited into the CRF account, unless excluded by an Act of Parliament.
3.11.4 Exchequer Issues
During the period under review, the Controller of Budget authorized withdrawal of Kshs.5.02 billion from the CRF, which was 40.7 per cent of the approved budget. The amount represented an increase of 10.6 per cent from Kshs.4.54 billion authorized in a similar period of FY 2014/15 and consisted of Kshs.3.14 billion (62.5 per cent) for recurrent expenditure, and Kshs.1.88 billion (37.5 per cent) for development activities.
3.11.5 Overall Expenditure Review
The County spent a total of Kshs.4.1 billion during the first half of FY 2015/16 which was 81.8 per cent of the funds released for both recurrent and development expenditure. This is an increase from the Kshs.3.5 billion spent in a similar period of FY 2014/15. A total of Kshs.2.73 billion was spent on recurrent activities and Kshs.1.37 billion on development activities. Recurrent expenditure was 87.2 per cent of the funds released for recurrent activities while development expenditure accounted for 72.8 per cent of the funds released for development activities. The expenditure excludes commitments as of 31st December, 2015 that amounted to Kshs.285.70 million for development and Kshs.134.33 million for recurrent expenditure.
Recurrent expenditure for the period under review represented 43.6 per cent of the approved annual recurrent budget, an improvement from 38.4 per cent spent in a similar period of FY 2014/15. On the other hand, development expenditure recorded an absorption rate of 22.6 per cent, an improvement from 16.2 per cent spent in a similar period of FY 2014/15. A comparison of the total expenditure in the first half of FY 2014/15 and in the first half of FY 20151/16 is shown in Figure 3.42.
Figure 3.42: Kakamega County, Expenditure by Economic Classification for First Half of FY 2014/15 and First Half of FY 2015/16
1544.00
578.84
1316.00
1992.57
742.24
1369.00
0.00
500.00
1000.00
1500.00
2000.00
2500.00
Personnel Emoluments Operations & Maintenance Development
Kshs
. Mill
ions
Expenditure by Economic Classification
1st Half, FY 2014/15
1st Half, FY 2015/16
Source: Kakamega County Treasury

COUNTY GOVERNMENTS BUDGET IMPLEMENTATION REVIEW REPORT FIRST HALF FY, 2015/16 93
3.11.6 Recurrent Expenditure Analysis
The total recurrent expenditure for the reporting period was Kshs.2.73 billion against an annual recurrent budget of Kshs.6.28 billion. This represents 43.6 per cent of the annual recurrent budget. The County spent Kshs.1.99 billion (72.9 per cent) on personnel emoluments and Kshs.742.24 million (27.1 per cent) on operations and maintenance as shown in Figure 3.42. Expenditure on personnel emoluments accounted for 48.5 per cent of total expenditure and has increased in FY 2015/16 as compared to a similar period of FY 2014/15 when the County spent Kshs.1.6 billion. The increase has been attributed to continued recruitment of staff by both the Executive and the Assembly.
The County spent Kshs.54.93 million on sitting allowances to the 88 MCAs and the Speaker against an annual budget of Kshs.142.49 million. This is a decrease from Kshs.70.31 million recorded in a similar period of FY 2014/15. The average monthly sitting allowance per MCA was Kshs.104,037 compared to SRC’s recommended monthly ceiling of Kshs.124,800.
A breakdown of the operations and maintenance expenditure for the reporting period is shown in Figure 3.43.
Figure 3.43: Kakamega County, Operations and Maintenance Expenditure for the First Half of FY 2015/16
195.42
139.21
74.3353.85 50.76 38.16 33.40 31.27 29.99 24.25 15.16 12.33
0.00
50.00
100.00
150.00
200.00
250.00
Spec
ialis
ed M
ater
ials
Dom
estic
Tra
vel ,
Subs
iste
nce
and
Oth
erT
rans
port
atio
n C
osts
Purc
hase
of V
ehic
les
and
Oth
er T
rans
port
Equ
ipm
ent
Ren
tals
of P
rodu
ced
Ass
ets
Res
earc
h, F
easi
bilit
ySt
udie
s, p
roje
ct P
repa
ratio
nan
d D
esig
n
Prin
ting,
Adv
erst
isin
g an
dIn
form
atio
n Su
pplie
s an
dSe
rvic
es
Insu
ranc
e C
osts
Hos
pita
lity
Supp
lies
and
Serv
ices
Oth
er O
pera
ting
Expe
nses
Tra
inin
g E
xpen
ses
Purc
hase
of O
ffic
e fu
rnitu
rean
d G
ener
al E
quip
men
ts
Off
ice
and
Gen
eral
Sup
plie
s&
Ser
vice
s
Ksh
s. M
illio
ns
Major Categories of O & M Expenditure
Source: Kakamega County Treasury
The aggregate expenditure on domestic and foreign travel was Kshs.139.21 million compared to Kshs.93.74 million incurred in a similar period of FY 2014/15, representing an increase of 48.5 per cent. This expenditure comprised of Kshs.62.09 million spent by the County Executive and Kshs.72.32 million by the County Assembly.

COUNTY GOVERNMENTS BUDGET IMPLEMENTATION REVIEW REPORT FIRST HALF FY, 2015/1694
3.11.7 Development Expenditure Analysis
A summary of development expenditure during the first half of FY 2015/16 is provided in figure 3.44.
Figure 3.44: Kakamega County, Summary of Development Expenditure for the First Half of FY 2015/16
269.65
180.00 144.93
93.30 66.60 62.29 44.30 40.03 39.98
050
100150200250300
Road
Con
struc
tion
(Urb
an-B
itum
en
stds)
War
d Ba
sed
Proj
ects
Cons
truct
ion
of
ECD
Cen
tres
Upg
radi
ng o
f CG
H
Dai
ry C
attle
Val
ue
Chai
n D
evel
opm
ent
Dev
elop
men
t of
Mod
ern
Mar
kets
Expa
nsio
n of
Ex
istin
g Fa
cilit
ies
to H
ospi
tals
Maj
or R
oads
-Co
nstru
ctio
n of
G
rave
l Roa
ds
Bukh
ungu
St
adiu
m
Reha
bilit
atio
n
Ksh
s.mill
ion
Major Categories of Development Expenditure
Source: Kakamega County Treasury
Analysis of the development expenditure of Kshs.1.37 billion incurred in the first half of FY 2015/16 indicates that the highest expenditure of Kshs.403.04 million was spent by the Education, Science & Technology Department on scholarships and construction of buildings and ECDs. The second highest expenditure of Kshs.398.32 million was incurred by the Transport, Infrastructure & Public Works Department on construction of roads.
3.11.8 Annual Budget and Budget Performance Analysis by department for the First Half of FY 2015/16
A summary of the FY 2015/16 annual budget estimates and budget performance for the first half by department is shown in Table 3.22.
Table 3.22: Kakamega County, Annual Budget and First Half of FY 2015/16 Budget Performance by Department
DepartmentAnnual Budget
Allocation (Kshs. Million)
Six Months Exche-quer Issues (Kshs.
Million)
Six Months Ex-penditure (Kshs.
Million)
Six Months Expenditure to Exchequer
Issues (%)
Absorption rate %
Rec Dev Rec Dev Rec Dev Rec Dev Rec Dev
Office of the Governor 318.6 308 157.56 18.2 57.99 4.84 36.8 26.6 18.2 1.6
Public Service and Administration 1721.15 259.4 975.27 62 1547.95 38.73 158.7 62.5 89.9 14.9
County Treasury and Economic Planning 250.64 140 134.2 61.5 101.4 17.77 75.6 28.9 40.5 12.7
Environment, Natural Resource, Water and Forestry 98.06 224.1 40.86 81.25 6.32 54.08 15.5 66.6 6.4 24.1
Labour, Social Services, Youth & Sports 56.78 360.25 23.51 101 5.5 49.11 23.4 48.6 9.7 13.6

COUNTY GOVERNMENTS BUDGET IMPLEMENTATION REVIEW REPORT FIRST HALF FY, 2015/16 95
DepartmentAnnual Budget
Allocation (Kshs. Million)
Six Months Exche-quer Issues (Kshs.
Million)
Six Months Ex-penditure (Kshs.
Million)
Six Months Expenditure to Exchequer
Issues (%)
Absorption rate %
Rec Dev Rec Dev Rec Dev Rec Dev Rec Dev
Transport, Infrastructure & Public Works 63.79 1678.65 26.58 618.64 4.83 398.32 18.2 64.4 7.6 23.7
Lands, Housing, Urban Areas & Physical planning 84.06 212 35.03 86 6.3 46.59 18 54.2 7.5 22
Health Services 2127.79 1045.77 1003.67 375.66 784.75 137.6 78.2 36.6 36.9 13.2
Agriculture, Livestock, Fisheries & Co-operatives 364.86 575 187.98 149.65 16.54 129.5 8.8 86.5 4.5 22.5
Industrialization, Trade & Tourism 47.66 403.96 19.86 133.86 4.59 89.82 23.1 67.1 9.6 22.2
Education, Science & Technology 269.59 747 155.34 194.02 6.06 403.04 3.9 207.7 2.2 54
County Public Service Board 85.8 - 30.5 0 65.64 - 215.2 76.5 -
County Assembly 786.85 100 346.86 0 126.93 - 36.6 16.1 -
TOTAL 6275.63 6054.13 3137.21 1881.78 2734.81 1369.38 87.2 72.8 43.6 22.6
Source: Kakamega County Treasury
Analysis of budget performance by department shows that the Department of Education, Science & Technology reported the highest absorption rate of its development budget at 54.0 per cent while the County Assembly did not incur any development expenditure during the reporting period. On the other hand, the Department of County Public Service had the highest percentage of its expenditure to its recurrent budget at 76.5 per cent while the Education, Science & Technology Department had the lowest percentage at 2.2 per cent.
3.11.9 Borrowing by the County Government
Article 212 of the Constitution requires a county government to borrow with approval from the County Assembly, and only if the national government guarantees the loan. Further, Section 58 of the PFM Act, 2012 gives the Cabinet Secretary to the National Treasury the powers to guarantee loans subject to approval by Parliament. During the period under review, the County utilized its equitable share and local revenue collection deposited into the County Revenue Fund account maintained at the Central Bank of Kenya and did not borrow any funds.
3.11.10 Observations and Recommendations
The County has made progress in addressing one of the challenges previously identified as affecting budget implementation. The County has;
(i) Established a functional audit committee as stipulated by section 155(5) of the PFM Act 2012, and Part XIII (167) of the Public Finance Management (County Governments) Regulations, 2015.
Despite the progress made, the following challenges continued to hamper effective budget implementation;
1. High wage bill which has constrained funding to key development projects.

COUNTY GOVERNMENTS BUDGET IMPLEMENTATION REVIEW REPORT FIRST HALF FY, 2015/1696
2. Failure to budget for some non-discretionary items such as MCA sitting allowances.
3. Failure by some MCAs to regularly repay the car and mortgage loans advanced to them by the County Government.
The County should implement the following recommendations in order to improve budget execution
1. The County should liaise with the National Government to evaluate its staff levels under the CARPS programme.
2. All non-discretionary expenditure items must be appropriately budgeted for in the supplementary budget.
3. The Administrator of the County Assembly car loan and mortgage fund should ensure all disbursed loans are repaid. Further, the County Treasury should ensure financial reports on the Funds are regularly prepared and audited.
3.12 Kericho County
3.12.1 Overview of the FY 2015/16 Budget Estimates
The FY 2015/16 approved budget for Kericho County was Kshs.5.08 billion. It comprised of Kshs.3.27 billion (64.3 per cent) allocated for recurrent expenditure and Kshs.1.81 billion (35.7 per cent) for development expenditure.
In order to finance the budget, the County expected to receive Kshs.4.51 billion (88.7 per cent) as equitable share from the National Government, collect Kshs.553.40 million (10.9 per cent) from local sources, and receive a conditional grant of Kshs.22.60 million (0.40 per cent) from DANIDA. However, Kshs.425.18 million representing unspent cash balances from FY 2014/15 was not budgeted for in the FY 2015/16 budget. Similarly, the County did not include an additional conditional grants totaling to Kshs.269.50 million from the National Government as contained in CARA, 2015 for free maternal care, compensation of forgone user fees, leasing of medical equipment and Road Maintenance Fuel Levy Fund.
3.12.2 Revenue Analysis
In the first half of FY 2015/16, the County received Kshs.1.99 billion from the National Government as a direct transfer to the CRF account comprising of Kshs.1.91 billion as equitable share, Kshs.45.98 million for free maternal care, Kshs.28.90 million from Road Maintenance Fuel Levy Fund, and Kshs.5.35 million for compensation of forgone user fees. The County also raised Kshs.115.29 million from local sources, and had a cash balance of Kshs.425.18 million brought forward from FY 2014/15.
The quarterly trend in local revenue collection from FY 2013/14 to the second quarter of FY2015/16 is shown in figure 3.45.

COUNTY GOVERNMENTS BUDGET IMPLEMENTATION REVIEW REPORT FIRST HALF FY, 2015/16 97
Figure 3.45: Kericho County, Trend in Local Revenue Collection by Quarters from the FY 2013/14 to the second quarter of FY 2015/16
145.69
71.57
20406080
100120140160
Ksh
s.mill
ions
Reporting Period
Source: Kericho County Treasury
The local revenue comprised of Kshs.43.72 million generated in the first quarter and Kshs.71.57 million in the second quarter. The local revenue raised in the first half of the FY 2015/16 was Kshs.115.29 million (20.8 per cent of the annual local revenue target), a decline from Kshs.135.72 million collected in a similar period of FY 2014/15.
The analysis of local revenue for the first half of FY 2015/16 by stream is shown in Table 3.23.
Table 3.23: Kericho County, Analysis of Revenue Collection by stream for the first half of FY 2015/16
No. Revenue Stream Annual Targeted Reve-nue (Kshs.)
Six Months Actual Revenue
(Kshs.)
Revenue Perfor-mance (%)
A B C D=*100
1 Health Services-F.I.F 167,400,000 45,649,754 27.3
2 Bus Park Fees 44,077,650 12,904,439 29.3
3 Market /Trade Fees 34,423,402 12,025,010 34.9
4 Car Parking Fees 19,383,534 5,620,600 29
5 Land Rates/ Plot Rents 102,203,218 5,426,614 5.3
6 Single Business Permit 63,290,265 5,424,983 8.6
7 House /Kiosk & Stall Rents 15,360,064 5,077,100 33.1
14 Stock Sales/ Livestock 3,211,076 1,562,110 48.6
15 Slaughter Fees 4,114,481 1,549,690 37.7
17 Sub-County Public Health Inspection 7,529,004 999,785 13.3
18 Weight and Measures 1,467,736 662,340 45.1
19 Produce Cess 53,163,285 2,305,718 4.3
20 Others Sources-Assorted 397,571,761 94,596,707 23.8
TOTAL 553,400,000 115,286,079 20.8
Source: Kericho County Treasury

COUNTY GOVERNMENTS BUDGET IMPLEMENTATION REVIEW REPORT FIRST HALF FY, 2015/1698
Analysis of revenue by stream indicates that Stock /Livestock Sales generated the highest percentage of revenue against annual local revenue target at 48.6 per cent, followed by Weight and Measures at 45.1 per cent. Similarly, the Slaughter Fees achieved 37.7 per cent of its forecast while the Market Fees registered 34.9 per cent.
3.12.3 Banking of Local Revenues
Analysis of the County’s Revenue Collection statement in the first half of FY2015/16 indicates that Kshs.122.09 million was deposited into the CRF Account against Kshs.115.29 million generated during the period under review. This conforms to Article 207 of the Constitution and Section 109 of the PFM Act 2012, which stipulates that all funds raised or received by or on behalf of the County Governments, should be deposited into the CRF account, unless excluded by an Act of Parliament.
3.12.4 Exchequer Issues
During the period under review, the Controller of Budget authorized withdrawal of Kshs.2.42 billion from the CRF, which was 47.5 per cent of the approved budget estimates. The amount represented a significant increase of 21.6 per cent from Kshs.1.99 billion approved in a similar period of FY 2014/15 consisting of Kshs.1.58 billion (65.5 per cent) for recurrent expenditure and Kshs.832.83 million (34.5 per cent) for development activities.
3.12.5 Overall Expenditure Review
The County spent a total of Kshs.2.07 billion during the first half of FY 2015/16 which was 85.6 per cent of the funds released for both recurrent and development expenditure. This is an increase from Kshs.1.79 billion incurred in a similar period of FY 2014/15. A total of Kshs.1.35 billion was spent on recurrent activities and Kshs.722.52 million on development activities. The recurrent expenditure was 85.1 per cent of the funds released for recurrent activities while development expenditure accounted for 86.8 per cent of the funds released for development activities. The expenditure excludes commitments as of 31st December, 2015 that amounted to Kshs.239.85 million for development and Kshs.129.59 million for recurrent expenditure.
Recurrent expenditure for the period under review represented 41.2 per cent of the approved annual recurrent budget and was a decrease from 47.2 per cent recorded in a similar period of FY 2014/15. On the other hand, development expenditure recorded an absorption rate of 39.8 per cent, an improvement from 23.2 per cent achieved in a similar period of FY 2014/15. A comparison of the total expenditure in the first half of FY 2014/15 and in the first half of FY 2015/16 is shown in Figure 3.46.

COUNTY GOVERNMENTS BUDGET IMPLEMENTATION REVIEW REPORT FIRST HALF FY, 2015/16 99
Figure 3.46: Kericho County, Expenditure by Economic Classification for first half of FY 2014/15 and First Half of FY 2015/16
887.70
458.08
- -
722.52
931.88
399.69
21.00 108.80
336.07
- 100.00 200.00 300.00 400.00 500.00 600.00 700.00 800.00 900.00
1,000.00
PersonelEmoluments
Operations &Maintainance
Bursary funds MCAs Car &House Loans
DevelopmentExpenditure
Ksh
s. M
illi
ons
Expenditure by Economic Classification
1st Half, FY 2015/16
1st Half, FY 2014/15
Source: Kericho County Treasury
3.12.6 Recurrent Expenditure Analysis
The total recurrent expenditure for the reporting period was Kshs.1.35 billion against an annual recurrent budget of Kshs.3.27 billion. This represents 41.2 per cent of the annual recurrent budget. The County spent Kshs.887.70 million (65.66.0 per cent) on personnel emoluments and Kshs.458.08 million (34.0 per cent) on operations and maintenance as shown in Figure 3.46. Expenditure on personnel emoluments accounted for 42.9 per cent of total expenditure and has slightly decreased in FY 2015/16 as compared to a similar period of FY 2014/15 when the County spent Kshs.931.88 million. However, Kshs.146.32 million relating to Executive salaries and allowances for December, 2015 were committed in the same month and paid in early January, 2016 signifying an upward shift compared to the same period in FY2014/15.
The County spent Kshs.36.51 million on sitting allowances to the 47 MCAs and the Speaker against an annual budget of Kshs.79.60 million. This is an increase from Kshs.26.56 million recorded in a similar period of FY 2014/15. The average monthly sitting allowance per MCA was Kshs.126,759 compared to SRC’s recommended monthly ceiling of Kshs.124,800.
A breakdown of the operations and maintenance expenditure for the reporting period is shown in Figure 3.47.

COUNTY GOVERNMENTS BUDGET IMPLEMENTATION REVIEW REPORT FIRST HALF FY, 2015/16100
Figure 3.47: Kericho County, Operations and Maintenance Expenditure for the first half of FY 2015/16
115.12
72.24 66.85
33.4221.48 16.75 16.23 15.76 15.08 14.31 13.66 10.00 8.52 7.10 7.02 5.04
0.0010.0020.0030.0040.0050.0060.0070.0080.0090.00
100.00110.00120.00
Spec
ialise
d Mate
rials
Dome
stic T
ravel
Cos
ts
Contr
acted
Pro
fessio
nal
Serv
ices
Insu
rance
Cos
ts
Pen
sion &
Reti
remen
tbe
nefit
s
Hosp
italit
y Sup
plies
Forei
gn T
ravel
costs
Utili
ties &
Sup
plies
ing &
Adv
ertisi
ng
Fuels
,Oils
& Lu
brica
nts
Train
ing &
capa
city c
osts
Debt
Reso
lution
Main
tenan
ce of
Asse
ts
Ope
rating
expe
nses
Contr
acted
guard
s & se
rvice
s
Offic
e & G
enera
l sup
plies
Kshs
.Mill
ions
Major Selected Categories of O & M Expenditure
Source: Kericho County Treasury
The aggregate expenditure on domestic and foreign travel was Kshs.88.47 million compared to Kshs.83.78 million incurred in a similar period of FY 2014/15, representing an increase of 5.8 per cent. This expenditure comprised of Kshs.52.36 million spent by the County Executive and Kshs.36.11 million by the County Assembly.
3.12.7 Development Expenditure Analysis
A summary of development expenditure during the first half of the FY 2015/16 is provided in figure 3.48.
Figure 3.48: Kericho County, Summary of Development Expenditure for the first half of FY 2015/16
422.67
65.17 59.72 39.90 23.17 20.20 15.79 10.68 9.60 9.38 7.75 7.16 7.02 5.76 3.77 3.270
50100150200250300350400450
Cons
tructi
on &
com
pletio
n of
270K
m st
retch
of ro
ads
Asse
ssme
nt, D
esig
n &Co
nstru
ction
of w
ater w
orks
Cons
tructi
on of
build
ing f
orBu
rns u
nit,
Med
ical s
tore
s
Desig
n & co
nstru
ction
of B
ridge
s,cu
lver
ts &
othe
r civi
l wor
ks
Refu
rbish
men
t of N
on-re
siden
tial
build
ings
in H
ealth
Cen
tres
Purc
hase
of m
edica
l & de
ntal
equi
pmen
t
Cont
rol o
f liv
estoc
k pes
ts &
dise
ases
Refu
rbish
men
t of n
on-re
siden
tial
build
ings
Expa
nsio
n of I
CT In
frustr
uctu
re &
civil
work
s
Road
s main
taina
nce &
emer
genc
ywo
rks
Live
stock
Bre
edin
g Pro
gram
s
Indu
strial
crop
s pro
ducti
on
Refu
rbish
ed of
20 no
n- re
siden
tial
build
ings
in A
inam
oi
Reva
mpi
ng &
mod
erni
zatio
n of
Soin
ATC
Cons
tructi
on of
mar
ket s
talls
&In
stalla
tion o
f catt
le we
ighin
g…
Agric
ultu
ral M
echa
niza
tion
Tech
nolo
gy P
rojec
t
Ksh
s.mill
ions
Major Categories of Development Expenditure
Source: Kericho County Treasury

COUNTY GOVERNMENTS BUDGET IMPLEMENTATION REVIEW REPORT FIRST HALF FY, 2015/16 101
Analysis of development expenditure of Kshs.722.52 million incurred in the first half of FY 2015/16 indicates that the Department of Public Works reported the highest expenditure of Kshs.422.67 million which was incurred on opening up of new access roads in 29 wards. A total of 270 kilometers of new roads were graveled. The second highest expenditure amounting to Kshs.65.17 million was incurred by the Department of Water, Energy, Natural Resources, and Environment and was utilized in design assessment & construction of water supply works to benefit areas not covered by KEWASCO within the County. The third highest expenditure of Kshs.59.72 million was incurred the Health Department in construction of burns unit, medical stores, operating theatre, surgical unit & comprehensive care extension at Kericho District Hospital. Furthermore, the Department of Public Works incurred Kshs.39.90 million in design and construction of 18 box culverts and 4 bridges across the County.
3.12.8 Annual budget and Budget performance analysis by department for the First half of FY 2015/16
A summary of the FY 2015/16 annual budget estimates and budget performance for the first half by department for Kericho County is shown in Table 3.24.
Table 3.24: Kericho County, Annual Budget and First Half of FY 2015/16 Budget performance by department
Department 6 Budget Allocation (Kshs. Million)
6 Months Exche-quer Issues (Kshs.
Million)
6 Months Expendi-ture (Kshs. Million)
6 Months Expenditure to Exchequer
Issues (%)
Absorption rate %
Rec Dev Rec Dev Rec Dev Rec Dev Rec Dev
County Assembly Services 538.04 20.00 242.50 - 216.19 - 89.2 0.0 40.2 0.0Public Service & Adminis-tration 277.36 10.27 131.39 - 120.70 0.12 91.9 0.0 43.5 1.2
Office of the Governor & Deputy Governor 144.45 - 83.57 - 100.02 - 119.7 0.0 69.2 0.0
County Public Service Board 43.03 - 27.49 - 18.68 - 67.9 0.0 43.4 0.0Finance & Economic Plan-ning 299.94 44.39 98.85 14.39 103.73 - 104.9 0.0 34.6 0.0
Agriculture, Livestock & Fisheries Development 159.60 165.77 77.62 70.00 65.95 41.72 85.0 59.6 41.3 25.2
Water, Environment, Energy & Natural Resources 69.32 140.56 26.09 73.95 25.33 65.17 97.1 88.1 36.5 46.4
Education ,Youth, Culture & Social services 202.64 284.10 97.80 64.90 76.00 2.79 77.7 4.3 37.5 1.0
Health Services 1330.47 172.83 700.69 122.00 545.52 106.01 77.9 86.9 41.0 61.3Land, Housing & Physical Planning 43.78 74.24 17.53 16.00 12.18 17.71 69.5 110.7 27.8 23.8
Public Works, Roads & Transport 54.93 747.81 30.98 420.50 29.73 471.94 96.0 112.2 54.1 63.1
ICT & E-Government 24.21 67.81 11.97 18.00 7.49 11.82 62.5 65.7 30.9 17.4Trade, Industrialization, Tour-ism, Wildlife & Cooperative Development
78.81 86.70 35.82 33.10 24.26 5.24 67.7 15.8 30.8 6.0
TOTAL 3266.58 1814.48 1582.33 832.83 1345.78 722.52 85.1 86.8 41.2 39.8
Source: Kericho County Treasury

COUNTY GOVERNMENTS BUDGET IMPLEMENTATION REVIEW REPORT FIRST HALF FY, 2015/16102
Analysis of budget performance by department shows that the Department of Public Works recorded the highest absorption rate of its development budget at 63.1 per cent while the County Assembly and Finance and Economic Planning Department did not incur any development expenditure during the reporting period. On the other hand, the Office of the Governor and Deputy Governor had the highest percentage of its recurrent expenditure to its recurrent budget at 69.2 per cent while the Lands, Housing and Physical Planning Department had the lowest percentage at 27.8 per cent.
3.12.9 Borrowing by the County Government
Article 212(a) of the Constitution requires that a county government should seek a guarantee from the National Government and approval of the County Assembly for any loan or credit. Similarly, Section 58 of the PFM Act, 2012 gives the Cabinet Secretary to the National Treasury the powers to guarantee loans subject to approval by Parliament. During the period under review, the County utilized its equitable share and local revenue collection deposited into the County Revenue Fund account maintained at the Central Bank of Kenya and did not borrow any funds.
3.12.10 Observations and Recommendations
The county has made some progress in addressing challenges previously identified as affecting budget implementation. These included;
i. Full adoption of the E-procurement module in procurement of goods and services and internet banking for payment of goods and services.
ii. Establishment of an Internal Audit Committee as required under Section 155(5) of the PFM Act 2012. This enhances oversight and improves internal controls.
Despite the progress made, the following challenges continued to hamper effective budget implementation;
1. A significant decline in local revenue performance by 15.1 per cent from Kshs.135.72 million recorded in the first half of FY 2014/15 to Kshs.115.29 million collected in the reporting period. This has been attributed to inadequate revenue collection systems.
2. Inadequate staff capacity in the use of the E-procurement module and the internet banking system.
3. Delays in finalization and approval of the first Supplementary budget for the FY 2015/16 to include other additional grants of Kshs.269.50 million contained in CARA, 2015 and pending bills from FY 2014/15 of Kshs.859.56 million.
4. Failure by the National Treasury to disburse funds in a timely manner as outlined in the CARA (2015) disbursement schedule. This adversely affected implementation of development activities.
The County should implement the following recommendations in order to improve budget execution;
1. The County Treasury should enhance revenue collection strategies by mapping out its revenue

COUNTY GOVERNMENTS BUDGET IMPLEMENTATION REVIEW REPORT FIRST HALF FY, 2015/16 103
sources and automating revenue collection. In addition, the County should enhance local revenue enforcement measures.
2. The County Treasury should liaise with the IFMIS directorate and the CBK for staff training and technical support in the use of the E-procurement module and Internet Banking.
3. The County Treasury should expedite preparation of a supplementary budget and submit it to the County Assembly for approval.
4. The County Treasury should liaise with the National Treasury to ensure timely disbursement of funds as per the disbursement schedule approved by the Senate.
3.13 Kiambu County
3.13.1 Overview of the FY 2015/16 Budget
The FY 2015/16 approved budget for Kiambu County was Kshs.11.95 billion. It comprised Kshs.7.98 billion (66.8 per cent) for recurrent expenditure and Kshs.3.97 billion (33.2 per cent) to development expenditure.
In order to finance the budget, the County expected to receive Kshs.7.46 billion (62.4 per cent) as equitable transfer from the National Government, collect Kshs.3.68 billion (30.8 per cent) from local sources, and receive a conditional grant of Kshs.19.20 million (0.2 per cent) from DANIDA and other conditional grants of Kshs.783.21 million (6.7 per cent). The conditional grants comprised of Kshs.330.04 million for Thika Level 5 hospital; Kshs.224.78 million for maternal health care; Kshs.95.74 million for leasing of medical equipment; Kshs.94.81 million for Road Maintenance Fuel Levy Fund; Kshs.37.84 million for compensation of forgone user fees. The County government did not budget Kshs.2.59 million brought forward from the FY 2014/15.
3.13.2 Revenue Analysis
During the first half of FY 2015/16, the County received Kshs.3.17 billion revenue from the National Government as equitable share to the CRF account, Kshs.140.27 million as conditional allocations for Thika Level 5 Hospital, Kshs.47.88 million as conditional allocations from the Road Maintenance Fuel Levy Fund, Kshs.90.77 million as conditional allocations for free maternal health care and Kshs.8.12 million as conditional allocations for forgone user fees. The County raised Kshs.1.05 billion from local sources, and had a cash balance of Kshs.2.59 million brought forward from FY 2014/15.
The quarterly trend in local revenue collection from first quarter of the FY 2013/14 to the second quarter of FY 2015/16 is shown in figure 3.49.

COUNTY GOVERNMENTS BUDGET IMPLEMENTATION REVIEW REPORT FIRST HALF FY, 2015/16104
Figure 3.49: Kiambu County, Trend in Local Revenue Collection by Quarter from the FY 2013/14 to the second quarter of FY 2015/16
204.44
483.05
376.30407.20
681.10
562.34
150.00
250.00
350.00
450.00
550.00
650.00
750.00
Ksh
s. M
illio
ns
Reporting Period
Source: Kiambu County Treasury
The local revenue consisted of Kshs.491.39 million raised in the first quarter and Kshs.562.34 million in the second quarter. The total local revenue generated in the first half of the FY 2015/16 of Kshs.1.05 billion (28.6 per cent of the annual local revenue target) was an improvement from Kshs.783.18 collected in a similar period of FY 2014/15.
The Office noted that the revenue reported by County Treasury during the first quarter of FY 2015/16 had been overstated by Kshs.2.96 million. Actual revenue collected was Kshs.491.39 million and not Kshs.493.35 million as reported in the first quarter of FY 2015/16. The analysis of local revenue for the first half of FY 2015/16 by stream is shown in Table 3.25.
Table 3.25: Kiambu County, Analysis of revenue collection by stream for the first half of FY 2015/16
No. Revenue Stream Annual Targeted Revenue (Kshs.)
Six Months Actual Revenue
(Kshs.)
Revenue Per-formance (%)
A B C D=*100
1 Health Services Management fees 430,000,000 263,158,648 61.2
2 Physical Planning Management Unit 548,444,874 208,973,260 38.1
3 Parking fees 440,000,000 125,449,708 28.5
4 Land Rates Management Unit 545,131,996 93,954,522 17.2
5 Business Permit 389,026,913 56,433,490 14.5
6 Other revenue stream 1,330,478,848 305,753,966 23
TOTAL 3,683,082,631 1,053,723,594 28.6
Source: Kiambu County Treasury

COUNTY GOVERNMENTS BUDGET IMPLEMENTATION REVIEW REPORT FIRST HALF FY, 2015/16 105
The analysis of revenue by stream indicates that Health Services fees had the highest revenue performance against annual target at 61.2 per cent followed by Physical Planning Management Unit fees at 38.1 per cent. Health Services fees includes facility improvement fees and public health facility improvement fees while Physical Planning Management fees includes change of user fees, building inspection fees, signboard and advertisement fees among other revenue streams.
3.13.3 Banking of local revenue
A review of the bank statements for the revenue collection account during the first half of FY 2015/16 indicates that the County did not bank all the locally generated revenue intact into the CRF. This does not conform to Article 207 of the Constitution and Section 109 of the PFM Act 2012, which stipulates that all funds raised or received by or on behalf of the County Government should be deposited into the CRF account, unless excluded by an Act of Parliament.
3.13.4 Exchequer Issues
The Controller of Budget authorised withdrawal of Kshs.4.45 billion from the CRF, which was 37.3 per cent of the approved budget. The amount represented an increase of 9.3 per cent from Kshs.4.07 billion authorized in a similar period of FY 2014/15, and consisted of Kshs.3.56 billion (80.0 per cent) for recurrent expenditure and Kshs.889.05 million (20.0 per cent) for development activities.
3.13.5 Overall Expenditure Review
The County spent a total of Kshs.3.73 billion during the first half of FY 2015/16 which was 83.7 per cent of the funds released for operations. This is an improvement from the Kshs.3.31 billion spent in a similar period of FY 2014/15. A total of Kshs.2.75 billion was spent on recurrent activities and Kshs.975.87 million on development activities. Recurrent expenditure was 77.2 per cent of the funds released for recurrent activities while development expenditure accounted for 109.9 per cent of the funds released for development activities. The expenditure excludes commitments as of 31st December, 2015 that amounted to Kshs.676.2 million for development and Kshs.173.5 million for recurrent expenditure.
Recurrent expenditure for the period under review represented 34.5 per cent of the approved annual recurrent budget, a decrease from 39 per cent spent in a similar period of FY 2014/15. On the other hand development expenditure recorded an absorption rate of 24.5 per cent, an improvement from 15 per cent spent in a similar period of FY 2014/15. A comparison of the total expenditure in the first half of FY 2014/15 and the first half of FY 2015/16 is shown in Figure 3.50.

COUNTY GOVERNMENTS BUDGET IMPLEMENTATION REVIEW REPORT FIRST HALF FY, 2015/16106
Figure 3.50: Kiambu County, Expenditure by Economic Classification for First Half of FY 2014/15 and First Half of FY 2015/16
1,800.00
975.00
530.00
1,835.09
914.57 975.87
0.00200.00400.00600.00800.00
1,000.001,200.001,400.001,600.001,800.002,000.00
Personnel Emoluments Operation and Maintenance Development
Ksh
s.mill
ions
Expenditure by Economic Classification
1st Half of FY 2014/151st Half of FY 2015/16
Source: Kiambu County Treasury
3.13.6 Recurrent Expenditure Analysis
The total recurrent expenditure for the reporting period was Kshs.2.75 billion against a budget of Kshs.7.98 billion. This represents 34.5 per cent of the annual recurrent budget. The County spent Kshs.1.84 billion (66.7 per cent) on personnel emoluments and Kshs.914.56 million (33.3 per cent) on operations and maintenance as shown in Figure 3.50. Expenditure on personnel emoluments accounted for 49.3 per cent of total expenditure and has increased in first half of FY 2015/16 compared to a similar period in FY 2014/15 when it accounted for Kshs.1.8 billion (65 per cent).
The County spent Kshs.53.22 million on sitting allowances to the 87 MCAs and the Speaker against budget of Kshs.100.0 million. This is a marginal decrease from Kshs.54.85 million recorded in a similar period of FY 2014/15. The average monthly sitting allowance per MCA was Kshs.100,811 compared to SRCs recommended monthly ceiling of Kshs.124,800.
A breakdown of the operations and maintenance expenditure for the reporting period is shown in Figure 3.51.
Figure 3.51: Kiambu County, Operations and Maintenance Expenditure for the First Half of FY 2015/16
131.91
64.99 61.2938.06 34.17 31.69 31.33 26.00 23.40 18.10 17.93
020406080
100120140
Trav
el (D
omes
tic &
Fore
ign)
Gene
ral o
ffice
supp
lies &
serv
ices
Insu
ranc
e
Fuel,
Oil
and
Lubr
icant
s
Prin
ting
and
Adve
rtisin
g
Hosp
italit
y an
dCa
terin
g
Train
ing
Cont
racte
dpr
ofes
siona
l ser
vice
s
Utili
ties
Com
mun
icatio
n
Purc
hase
of O
ffice
furn
iture
Ksh
s.mill
ions
Major Categories of O & M Expenditure
Source: Kiambu County Treasury

COUNTY GOVERNMENTS BUDGET IMPLEMENTATION REVIEW REPORT FIRST HALF FY, 2015/16 107
The aggregate expenditure on domestic and foreign travel was Kshs.131.91 million compared to Kshs.80.50 million incurred in a similar period of FY 2014/15, representing a significant increase of 63.9 per cent. This expenditure comprised of Kshs.70.86 million spent by the County Executive and Kshs.61.05 million by the County Assembly.
3.13.7 Development Expenditure Analysis A summary of development expenditure during the first half of FY 2015/16 is provided in figure 3.52.
Figure 3.52: Kiambu County, Summary of Development Expenditure for the First Half of FY 2015/16
270.24 236.70
151.14 129.09 98.89 61.02
28.15 27.5 8.55 -
50.00 100.00 150.00 200.00 250.00 300.00
Con
stru
ctio
n of
min
or r
oads
Ref
urbi
shm
ent
of B
uild
ings
Con
stru
ctio
n of
maj
or r
oads
Oth
erIn
fras
truc
ture
and
Civ
ilW
orks
Oth
erde
velo
pmen
tac
tivi
ties
Pur
chas
e of
mot
or v
ehic
les
Con
stru
ctio
n of
buil
ding
s
Cap
ital
gra
nts
and
Cas
htr
ansf
ers
Em
erge
ncy
Exp
endi
ture
Ksh
s.m
illi
ons
Major Categories of Development Expenditure
Source: Kiambu County Treasury
Analysis of the development expenditure of Kshs.975.87 million indicates that the highest expenditure of Kshs.270.23 million was incurred on construction of minor roads while Kshs.236.7 million was spent on refurbishment of buildings. Kshs.151.13 million was incurred on construction of major roads while Kshs.129.08 million was incurred on other infrastructure and civil works. Kshs.61.02 million was used to purchase motor vehicles and Kshs.24.5 million on cash transfer to the Department of Health.
3.13.8 Annual Budget and Budget Performance Analysis by department for the First Half of FY 2015/16
A summary of the FY 2015/16 annual budget estimates and budget performance for the first half by department is shown in Table 3.26.

COUNTY GOVERNMENTS BUDGET IMPLEMENTATION REVIEW REPORT FIRST HALF FY, 2015/16108
Table 3.26: Kiambu County, Annual Budget and First Half of FY 2015/16 Budget Performance by Department
Department Annual Budget Alloca-tion (Kshs.Million)
6 months Exche-quer Issues (Kshs.
Million)
6 months Expendi-ture (Kshs.Million)
Expenditure to Exchequer
Issues (%)
Expenditure to Annual
Budget rate (%)
Rec Dev Rec Dev Rec Dev Rec Dev Rec Dev
County Assembly 828 44.80 262.80 0.10 335.90 0.18 127.8 180.0 40.6 0.4
County Executive 382 7.20 136.80 0.10
107.30 0.58 78.4 580.0 28.1 8.1
County Public Service Board 63 0 19.00 0.01 16.00 0 84.2 0.0 25.4
Finance and Econ. Planning 1,374 85.30 453.00 5.00 383.30 - 32.00 84.6 -640.0 27.9 -37.5
Administrative & Public Service 486 208.60 302.50 17.00 209.60 58.40 69.3 343.5 43.1 28.0
Agriculture, Livestock & Fisheries 375 262.50 181.00 27.60 146.80 88.20 81.1 319.6 39.1 33.6
Water, Environment & Natural Resources 201 281.50 116.60 93.60 86.20 71.20 73.9 76.1 42.9 25.3
Health Services 2,864 1,027.00 1,508.00 250.50 1,105.60 177.70 73.3 70.9 38.6 17.3
Education, Culture, ICT & Social Services 526 375.60 160.50 66.00 103.80 -9.80 64.7 -14.8 19.7 -2.6
Youth, Sports & Commu-nications 146 370.00 54.50 21.00 44.00 70.90 80.7 337.6 30.1 19.2
Lands, Physical Planning & Housing 136 180.00 68.40 30.00 46.70 35.60 68.3 118.7 34.3 19.8
Trade, Tourism, Industry & Cooperative 167 227.50 75.60 12.00 61.90 17.40 81.9 145.0 37.1 7.6
Roads, Transport & Public Works 433 898.00 225.00 365.40 102.70 497.60 45.6 136.2 23.7 55.4
Total 7,979.80 3,968.00 3,563.70 888.31 2,749.80 975.96 77.2 109.9 34.5 24.6
Source: Kiambu County Treasury
Analysis of budget performance by department shows that the Roads, Transport and Public Works Department reported the highest absorption rate of its development budget at 55.4 per cent while the Department of Agriculture, Livestock and Fisheries absorbed 33.6 per cent of its development budget. County Assembly registered the lowest absorption rate at 0.4 per cent during the reporting period under review. On the other hand, the Water, Environment and Natural Resources Department and Administration and Public Service had the highest percentage of its expenditure to the recurrent budget at 43 per cent while the Education, Culture, ICT and Social Services Department had the lowest percentage at 19.8 per cent.

COUNTY GOVERNMENTS BUDGET IMPLEMENTATION REVIEW REPORT FIRST HALF FY, 2015/16 109
3.13.9 Borrowing by the County Government
Article 212 of the Constitution requires a county government to borrow with approval from the County Assembly, and only if the national government guarantees the loan. Further, Section 58 of the PFM Act 2012 gives the Cabinet Secretary to the National Treasury the powers to guarantee loans subject to approval by Parliament. During the period under review, the County utilized equitable share and local revenue collection deposited into County Revenue Fund account maintained at the Central Bank of Kenya and did not borrow any funds.
3.13.10 Observations and Recommendations
The County has made progress in addressing the challenges previously identified as affecting budget implementation. The County has;
i. Disbursed the Biashara funds. The delay in disbursement of these funds had been observed in first quarter, CBIRR.
Despite the progress made, the following challenges raised in the previous CBIRRs continue to hamper effective budget implementation;
1. Lack of Internal Audit committee as specified in Part XIII (167) of the Public Finance Management (County Governments) Regulations, 2015.
2. Manual financial operations at the County Assembly which are prone to errors, inefficiencies and manipulation.
3. Failure to bank all revenue collected into the CRF account. Revenue collected from liquor license was not deposited into the CRF account during the reporting period.
The County should implement the following recommendations in order to improve budget execution
1. The County Treasury should establish an Internal Audit Committee to enhance management controls.
2. The County Assembly should adopt the IFMIS system in its financial operations as required by National Treasury.
3. The County Treasury should ensure that all locally collected revenue is banked intact and transferred to CRF account.
3.14 Kilifi County
3.14.1 Overview of the FY 2015/16 Budget
The FY 2015/16 Supplementary Budget for Kilifi County was Kshs.11.52 billion. It comprised of Kshs.5.59 billion (48.5 per cent) allocated for recurrent expenditure and Kshs.5.93 billion (51.5 per cent) for development expenditure.
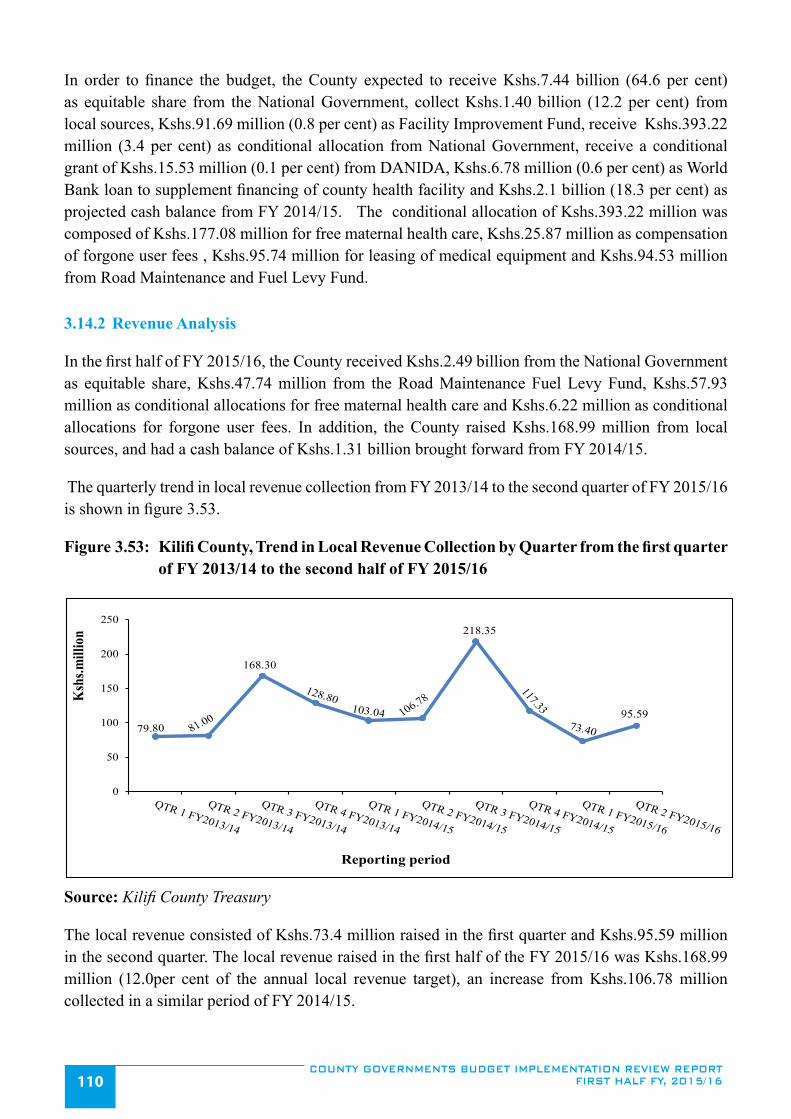
COUNTY GOVERNMENTS BUDGET IMPLEMENTATION REVIEW REPORT FIRST HALF FY, 2015/16110
In order to finance the budget, the County expected to receive Kshs.7.44 billion (64.6 per cent) as equitable share from the National Government, collect Kshs.1.40 billion (12.2 per cent) from local sources, Kshs.91.69 million (0.8 per cent) as Facility Improvement Fund, receive Kshs.393.22 million (3.4 per cent) as conditional allocation from National Government, receive a conditional grant of Kshs.15.53 million (0.1 per cent) from DANIDA, Kshs.6.78 million (0.6 per cent) as World Bank loan to supplement financing of county health facility and Kshs.2.1 billion (18.3 per cent) as projected cash balance from FY 2014/15. The conditional allocation of Kshs.393.22 million was composed of Kshs.177.08 million for free maternal health care, Kshs.25.87 million as compensation of forgone user fees , Kshs.95.74 million for leasing of medical equipment and Kshs.94.53 million from Road Maintenance and Fuel Levy Fund.
3.14.2 Revenue Analysis
In the first half of FY 2015/16, the County received Kshs.2.49 billion from the National Government as equitable share, Kshs.47.74 million from the Road Maintenance Fuel Levy Fund, Kshs.57.93 million as conditional allocations for free maternal health care and Kshs.6.22 million as conditional allocations for forgone user fees. In addition, the County raised Kshs.168.99 million from local sources, and had a cash balance of Kshs.1.31 billion brought forward from FY 2014/15.
The quarterly trend in local revenue collection from FY 2013/14 to the second quarter of FY 2015/16 is shown in figure 3.53.
Figure 3.53: Kilifi County, Trend in Local Revenue Collection by Quarter from the first quarter of FY 2013/14 to the second half of FY 2015/16
168.30
218.35
95.59
0
50
100
150
200
250
Ksh
s.mill
ion
Reporting period
Source: Kilifi County Treasury
The local revenue consisted of Kshs.73.4 million raised in the first quarter and Kshs.95.59 million in the second quarter. The local revenue raised in the first half of the FY 2015/16 was Kshs.168.99 million (12.0per cent of the annual local revenue target), an increase from Kshs.106.78 million collected in a similar period of FY 2014/15.

COUNTY GOVERNMENTS BUDGET IMPLEMENTATION REVIEW REPORT FIRST HALF FY, 2015/16 111
The analysis of local revenue for the first half of FY 2015/16 by stream is shown in Table 3.27.
Table 3.27: Kilifi County, Analysis of revenue collection by stream for the first half of FY 2015/16
No. Revenue Stream Annual Targeted Reve-nue (Kshs.)
Six Months Actual Revenue (Kshs.)
Revenue Performance (%)
A B C D=*100
1 CESS on Natural Resources 165,753,979 90,588,447 54.7
2 Slaughter House and Livestock Sale Yards 7,847,665 1,628,665 20.8
3 Rent/ Stall Rents 25,829,842 2,667,090 10.3
4 Market Fees 100,139,093 9,058,407 9.0
5 Other revenue streams 53,008,337 4,020,899 7.6
6 Land Rates and Other Land Revenue 421,012,611 31,466,152 7.5
7 Business Permits 155,441,695 10,355,234 6.7
8 Survey Fees and Plot Rents 23,589,887 1,479,210 6.3
9 House Rent 16,219,038 820,000 5.1
10 Bill Boards and Signage 76,486,673 3,740,243 4.9
11 Building Plan Approval and Inspection 61,905,431 2,868,454 4.6
12 Parking Fees 237,885,561 9,100,565 3.8
13 Refuse Collection 15,648,297 576,114 3.7
14 Food Hygiene Fees 11,096,950 247,000 2.2
15 Sale of Tender Documents 18,194,400 113,000 0.6
16 Plot Ground Rent 17,259,003 0 0.0
TOTAL 1,407,318,463 168,990,480 12.0
Source: Kilifi County Treasury
Analysis of revenue by stream indicates that CESS on Natural Resources had the highest performance against the annual target at 54.7 per cent followed by Slaughter House and Livestock Sale Yards with a performance of 20.8 per cent.
3.14.3 Banking of Local Revenue
A review of the bank statements for the revenue collection account indicates that all locally generated revenue was deposited into the CRF during the period under review. This conforms to Article 207 of the Constitution and Section 109 of the PFM Act 2012, which stipulates that all funds raised or received by or on behalf of the County Government, should be deposited into the CRF account, unless excluded by an Act of Parliament.

COUNTY GOVERNMENTS BUDGET IMPLEMENTATION REVIEW REPORT FIRST HALF FY, 2015/16112
3.14.4 Exchequer Issues
The Controller of Budget authorised withdrawal of Kshs.4.02 billion from the CRF, which was 34.9 per cent of the approved budget. The amount represented an improvement of 24.8 per cent from Kshs.3.22 billion authorized in a similar period of FY 2014/15 and consisted of Kshs.2.59 billion (64.3 per cent) for recurrent expenditure and Kshs.1.44 billion (35.7 per cent) for development activities.
3.14.5 Overall Expenditure Review
The County spent a total of Kshs.2.78 billion during the first half of FY 2015/16 which was 69.0 per cent of the funds released for both recurrent and development expenditure. This is a slight increase from the Kshs.2.35 billion spent in a similar period of FY 2014/15. A total of Kshs.2.15 billion was spent on recurrent activities and Kshs.625.25 million on development activities. Recurrent expenditure was 83.1 per cent of the funds released for recurrent activities while development expenditure accounted for 43.5 per cent of the funds released for development activities.
Recurrent expenditure for the period under review represented 38.5 per cent of the approved annual recurrent budget, an improvement from 31.2 per cent spent in a similar period of FY 2014/15. On the other hand, development expenditure recorded an absorption rate of 10.5 per cent, a decline from 23.6 per cent spent in a similar period of FY 2014/15.This was as a result of the challenges associated with implementation of the new E-procurement process.
A comparison of the total expenditure between the second quarter of FY 2014/15 and FY 2015/16 is shown in Figure 3.54.
Figure 3.54: Kilifi County, Expenditure by Economic Classification for First Half of FY 2014/15 and First Half of FY 2015/16
694.66785.26
869.5
1294.47
856.53
625.25
0200400600800
100012001400
Personnel Emoluments Operations & Maintenance Development
Ksh
s. M
illio
ns
Expenditure by Economic Classification
1st Half, FY 2014/15
1st Half, FY 2015/16
Source: Kilifi County Treasury

COUNTY GOVERNMENTS BUDGET IMPLEMENTATION REVIEW REPORT FIRST HALF FY, 2015/16 113
3.14.6 Recurrent Expenditure Analysis
The total recurrent expenditure for the reporting period was Kshs.2.15 billion against an annual recurrent budget of Kshs.5.59 billion. This represents 38.5 per cent of the annual recurrent budget. The County spent Kshs.1.29 billion (60.2 per cent) on personnel emoluments, and Kshs.856.53 million (39.8 per cent) on operations and maintenance (includes Kshs.19.13 million expenditure on County Emergency Fund) as shown in Figure 3.54. Expenditure on personnel emoluments accounted for 46.6 per cent of total expenditure and has increased significantly in the first half of FY 2015/16 as compared to a similar period of FY 2014/15 when the County spent Kshs.694.66 million. The increase is attributed to recruitment of new staff.
The County spent Kshs.36 million on sitting allowances to the 54 MCAs and the Speaker against an annual budget of Kshs.83.19 million. This is a slight increase from Kshs.35.08 million recorded in a similar period of FY 2014/15. The average monthly sitting allowance per MCA was Kshs.111,101 compared to SRC’s recommended monthly ceiling of Kshs.124,800.
A breakdown of the operations and maintenance expenditure for the reporting period is shown in Figure 3.55.
Figure 3.55: Kilifi County, Operations and Maintenance Expenditure for the First Half of FY 2015/16
171.09
115.93 103.07 93.37 91.45
54.48 54.43 40.26 35.84 34.69 32.91 28.99
20 40 60 80
100 120 140 160 180
Dom
estic
and
Fore
ign
Trav
el
Oth
er E
xpen
ses
Dre
ssin
gs an
d N
on-
Phar
mac
eutic
al…
Insu
aran
ce
Rent
al, U
tiliti
es &
Offi
ce S
uppl
ies
Spec
ialis
ed M
ater
ials
Purc
hase
of V
ehic
les
and
Oth
er T
rans
port…
Hos
pita
lity
Mai
nten
ance
Fuel
Com
mun
icat
ion,
Prin
ting
&…
Trai
ning
Ksh
s. M
illio
ns
Major Categories of O & M Expenditure
Source: Kilifi County Treasury
The aggregate expenditure on domestic and foreign travel was Kshs.171.09 million compared to Kshs.77.94 million incurred in a similar period of FY 2014/15, representing a significant increase of 119.5 per cent. This expenditure comprised of Kshs.74.6 million spent by the County Executive and Kshs.96.48 million by the County Assembly.

COUNTY GOVERNMENTS BUDGET IMPLEMENTATION REVIEW REPORT FIRST HALF FY, 2015/16114
3.14.7 Development Expenditure Analysis
A summary of development expenditure during the first half of FY 2015/16 is provided in figure 3.56.
Figure 3.56: Kilifi County, Summary of Development Expenditure for the First Half of FY 2015/16
193.49
72.16 65.83 59.47 54.51 47.34 46.64 32.82 28.07 24.93
20 40 60 80
100 120 140 160 180 200 220
Cons
tructi
on &
Reh
abili
tatio
n of
Road
s
Cons
tructi
on o
f Hea
lth F
acili
ties
Cons
tructi
on &
main
tenan
ce o
f wate
rsu
pplie
s & se
wera
ge
Refu
rbish
men
t/ Re
nova
tion
ofCh
ambe
rs
Regi
strati
on o
f Lan
d
Othe
r Inf
rastr
uctu
re an
d Ci
vil W
orks
Non-
Resid
entia
l Bui
ldin
gs
Refu
rbish
men
t/ Re
nova
tion
ofOf
fices
Othe
r Dev
elopm
ent E
xpen
ses
Cons
tructi
on o
f ECD
Ksh
s Mill
ion
Major Categories of Development Expenditure
Source: Kilifi County Treasury
Analysis of the development expenditure of Kshs.625.25 million indicates that the Roads Department reported the highest expenditure of Kshs.193.49 million which was spent on development and maintenance of access roads. The second highest expenditure amounting to Kshs.72.16 million was incurred by the Health Department on construction of health facilities. The Department of Water, Environment and Natural Resources incurred Kshs.65.83 million on construction and maintenance of water supplies & sewerage system, County Assembly spent Kshs.59.47 million on refurbishment and renovation of the Assembly chambers while the Department of Lands, Physical Planning, Housing and Energy incurred Kshs.54.51 million on registration of land programme.
3.14.8 Annual Budget and Budget Performance Analysis by department for the First Half of FY 2015/16
A summary of the FY 2015/16 annual budget estimates and budget performance for the first half by department is shown in Table 3.28.

COUNTY GOVERNMENTS BUDGET IMPLEMENTATION REVIEW REPORT FIRST HALF FY, 2015/16 115
Table 3.28: Kilifi County, Annual Budget and First Half of FY 2015/16 Budget Performance by Department
DepartmentAnnual Budget
allocation (Kshs. Million)
Six Months Exche-quer Issues (Kshs.
Million)
Six Months Ex-penditure (Kshs.
Million)
Six Months Expenditure to Exchequer
Issues (%)
Expenditure to Annual
Budget (%)
Rec Dev Rec Dev Rec Dev Rec Dev Rec Dev
County Assembly 802.82 276.82 360.00 70.00 324.04 92.11 90.0 131.6 40.4 33.3
County Executive 376.23 - 141.63 - 140.77 - 99.4 - 37.4 -
Finance and Economic Plan-ning 564.97 581.50 243.90 25.50 139.26 - 57.1 0.0 24.6 -
Agriculture 297.04 514.70 139.06 148.56 125.02 32.75 89.9 22.0 42.1 6.4
Environment and Natural Resources 167.62 789.76 88.15 124.69 79.39 68.34 90.1 54.8 47.4 8.7
Education, Sports and Youth Affairs 462.62 1191.43 230.75 343.67 95.29 24.93 41.3 7.3 20.6 2.1
County Health Services 1935.16 818.81 869.56 287.06 924.59 74.78 106.3 26.0 47.8 9.1
Lands, Physical Planning, Housing and Energy 103.85 277.76 51.93 9.31 54.11 55.01 104.2 591.1 52.1 19.8
Public Works and Services 213.82 987.03 84.53 358.97 36.56 241.84 43.3 67.4 17.1 24.5
ICT, E-Government, Culture and Social Services 86.07 97.49 43.03 43.70 33.44 7.22 77.7 16.5 38.9 7.4
Trade Development and Regulation 105.01 289.30 49.27 24.70 27.11 13.31 55.0 53.9 25.8 4.6
Public Service Board 48.27 - 24.16 - 7.88 32.6 - 16.3 -
Public Service Management 424.90 107.20 261.11 - 163.53 14.97 62.6 - 38.5 14.0
Total 5588.38 5931.81 2587.08 1436.15 2150.99 625.25 83.1 43.5 38.5 10.5
Source: Kilifi County Treasury
Analysis of budget performance by department shows that the Department of County Assembly reported the highest absorption rate of its development budget at 33.3 per cent while the Department of Finance and Economic Planning did not incur any development expenditure during the reporting period. On the other hand, the Department of Lands, Physical Planning, Housing and Energy services had the highest percentage of its expenditure to its recurrent budget at 52.1 per cent while the Public Service Board had the lowest percentage at 16.3 per cent.
3.14.9 Borrowing by the County Government
Article 212 of the Constitution requires a county government to borrow with approval from the County Assembly, and only if the national government guarantees the loan. Further, Section 58 of the PFM Act 2012, gives the Cabinet Secretary to the National Treasury the powers to guarantee loans subject to approval by Parliament. During the period under review, the County utilized its equitable share and local revenue collections deposited into the County Revenue Fund account maintained at the Central Bank of Kenya and did not borrow any funds.

COUNTY GOVERNMENTS BUDGET IMPLEMENTATION REVIEW REPORT FIRST HALF FY, 2015/16116
3.14.10 Observations and Recommendations
The County has made progress in addressing the challenges previously identified as affecting budget implementation. The County has:
i. Prepared regulations for the Scholarship Fund and designated a Fund Administrator in line with the requirements of section 116 of the PFM Act 2012, on County Funds.
ii. Restructured the Accounts Department and ensured close supervision of officers handling IFMIS transactions.
Despite the progress made, the following challenges continue to hamper effective budget implementation;
1. Delayed disbursement of funds by the National Treasury which affected implementation of budgeted activities.
2. Inadequate staff capacity to use IFMIS by the county departments.
The County should implement the following recommendations in order to improve budget execution;
1. The County Treasury should liaise with the National Treasury to ensure timely disbursements of funds as per the disbursement schedule approved by senate.
2. The County Treasury should liaise with the IFMIS Directorate to address the challenges faced in use of IFMIS.
3.15 Kirinyaga County
3.15.1 Overview of the FY 2015/16 Budget
The FY 2015/16 approved budget for Kirinyaga County was Kshs.5.32 billion. It comprised of Kshs.3.07 billion (57.6 per cent) allocated for recurrent expenditure and Kshs.2.26 billion (42.4 per cent) for development expenditure.
In order to finance the budget, the County expects to receive Kshs.3.54 billion (66.5 per cent) as equitable share from the National Government, collect Kshs.500.00 million (9.3 per cent) from local sources, and receive a conditional grant of Kshs.12.77 million (0.2 per cent) from DANIDA, and Kshs.618.53 million (11.6 per cent) representing the opening cash balance from FY 2014/15 was factored in FY 2015/16 budget. Further, the County budgeted for the additional conditional grants of Kshs.203.72 million (3.8 per cent) from the National Government as contained in CARA, 2015. This amount of Kshs.203.72 million was composed of Kshs.50.72 million for free maternal care, Kshs.12.31 million for compensation of forgone user fees, Kshs.95.74 million for leasing of medical equipment, and Kshs.44.95 million from Road Maintenance Fuel Levy Fund. The revenue from the various sources in 2015/16 financial year do not adequately meet the budget requirement, therefore FY 2015/16 County budget has a deficit of Kshs.543.82 million.

COUNTY GOVERNMENTS BUDGET IMPLEMENTATION REVIEW REPORT FIRST HALF FY, 2015/16 117
The County has however finalized a supplementary budget to correct this budget deficit.
3.15.2 Revenue Analysis
In the first half of FY 2015/16, the County received Kshs.1.19 billion from the National Government as equitable share, Kshs.22.70 million from Road Maintenance Fuel Levy Fund, Kshs.22.87 million as conditional allocations for free maternal health care, Kshs.5.71 million as conditional allocations for forgone user fees, had a cash balance of Kshs.618.53 million brought forward from FY 2014/15, and raised Kshs.118.07 million from local sources.
The quarterly trend in local revenue from FY 2013/14 to the second quarter of FY 2015/16 is shown in figure 3.57.
Figure 3.57: Kirinyaga County, Trend in Local Revenue Collection by Quarter from the FY 2013/14 to the second quarter of FY 2015/16
29.58 22.60
93.89
54.30 49.5164.78
124.32
73.02 65.0553.02
020406080
100120140160180
Ksh
s.m
illio
n
Reporting Period
Source: Kirinyaga County Treasury
The local revenue consisted of Kshs.65.05 million raised in the first quarter and Kshs.53.02 million in the second quarter. The local revenue raised in the first half of the FY 2015/16 was Kshs.118.07 million (23.6 per cent of the annual local revenue target), a slight improvement from Kshs.114.43 million collected in a similar period of FY 2014/15.
Analysis of local the revenue by stream is shown in Table 3.29.
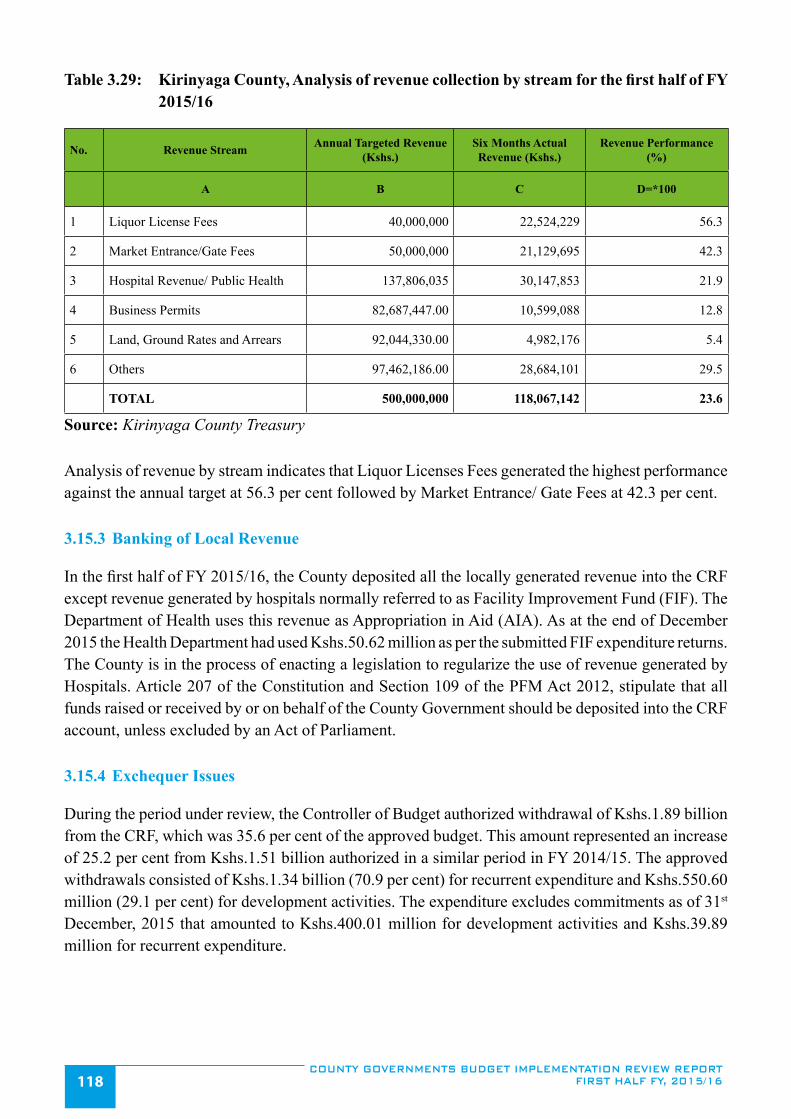
COUNTY GOVERNMENTS BUDGET IMPLEMENTATION REVIEW REPORT FIRST HALF FY, 2015/16118
Table 3.29: Kirinyaga County, Analysis of revenue collection by stream for the first half of FY 2015/16
No. Revenue Stream Annual Targeted Revenue (Kshs.)
Six Months Actual Revenue (Kshs.)
Revenue Performance (%)
A B C D=*100
1 Liquor License Fees 40,000,000 22,524,229 56.3
2 Market Entrance/Gate Fees 50,000,000 21,129,695 42.3
3 Hospital Revenue/ Public Health 137,806,035 30,147,853 21.9
4 Business Permits 82,687,447.00 10,599,088 12.8
5 Land, Ground Rates and Arrears 92,044,330.00 4,982,176 5.4
6 Others 97,462,186.00 28,684,101 29.5
TOTAL 500,000,000 118,067,142 23.6
Source: Kirinyaga County Treasury
Analysis of revenue by stream indicates that Liquor Licenses Fees generated the highest performance against the annual target at 56.3 per cent followed by Market Entrance/ Gate Fees at 42.3 per cent.
3.15.3 Banking of Local Revenue
In the first half of FY 2015/16, the County deposited all the locally generated revenue into the CRF except revenue generated by hospitals normally referred to as Facility Improvement Fund (FIF). The Department of Health uses this revenue as Appropriation in Aid (AIA). As at the end of December 2015 the Health Department had used Kshs.50.62 million as per the submitted FIF expenditure returns. The County is in the process of enacting a legislation to regularize the use of revenue generated by Hospitals. Article 207 of the Constitution and Section 109 of the PFM Act 2012, stipulate that all funds raised or received by or on behalf of the County Government should be deposited into the CRF account, unless excluded by an Act of Parliament.
3.15.4 Exchequer Issues
During the period under review, the Controller of Budget authorized withdrawal of Kshs.1.89 billion from the CRF, which was 35.6 per cent of the approved budget. This amount represented an increase of 25.2 per cent from Kshs.1.51 billion authorized in a similar period in FY 2014/15. The approved withdrawals consisted of Kshs.1.34 billion (70.9 per cent) for recurrent expenditure and Kshs.550.60 million (29.1 per cent) for development activities. The expenditure excludes commitments as of 31st December, 2015 that amounted to Kshs.400.01 million for development activities and Kshs.39.89 million for recurrent expenditure.
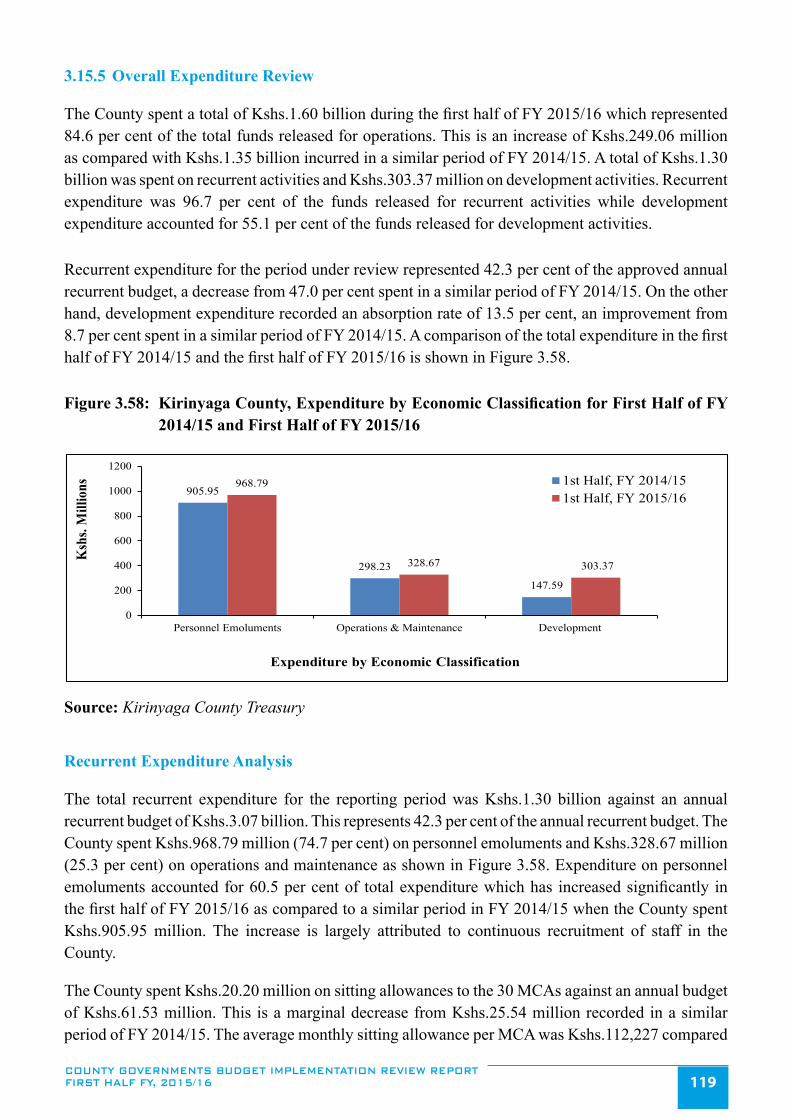
COUNTY GOVERNMENTS BUDGET IMPLEMENTATION REVIEW REPORT FIRST HALF FY, 2015/16 119
3.15.5 Overall Expenditure Review
The County spent a total of Kshs.1.60 billion during the first half of FY 2015/16 which represented 84.6 per cent of the total funds released for operations. This is an increase of Kshs.249.06 million as compared with Kshs.1.35 billion incurred in a similar period of FY 2014/15. A total of Kshs.1.30 billion was spent on recurrent activities and Kshs.303.37 million on development activities. Recurrent expenditure was 96.7 per cent of the funds released for recurrent activities while development expenditure accounted for 55.1 per cent of the funds released for development activities.
Recurrent expenditure for the period under review represented 42.3 per cent of the approved annual recurrent budget, a decrease from 47.0 per cent spent in a similar period of FY 2014/15. On the other hand, development expenditure recorded an absorption rate of 13.5 per cent, an improvement from 8.7 per cent spent in a similar period of FY 2014/15. A comparison of the total expenditure in the first half of FY 2014/15 and the first half of FY 2015/16 is shown in Figure 3.58.
Figure 3.58: Kirinyaga County, Expenditure by Economic Classification for First Half of FY 2014/15 and First Half of FY 2015/16
905.95
298.23
147.59
968.79
328.67 303.37
0
200
400
600
800
1000
1200
Personnel Emoluments Operations & Maintenance Development
Ksh
s. M
illio
ns
Expenditure by Economic Classification
1st Half, FY 2014/151st Half, FY 2015/16
Source: Kirinyaga County Treasury
Recurrent Expenditure Analysis
The total recurrent expenditure for the reporting period was Kshs.1.30 billion against an annual recurrent budget of Kshs.3.07 billion. This represents 42.3 per cent of the annual recurrent budget. The County spent Kshs.968.79 million (74.7 per cent) on personnel emoluments and Kshs.328.67 million (25.3 per cent) on operations and maintenance as shown in Figure 3.58. Expenditure on personnel emoluments accounted for 60.5 per cent of total expenditure which has increased significantly in the first half of FY 2015/16 as compared to a similar period in FY 2014/15 when the County spent Kshs.905.95 million. The increase is largely attributed to continuous recruitment of staff in the County.
The County spent Kshs.20.20 million on sitting allowances to the 30 MCAs against an annual budget of Kshs.61.53 million. This is a marginal decrease from Kshs.25.54 million recorded in a similar period of FY 2014/15. The average monthly sitting allowance per MCA was Kshs.112,227 compared

COUNTY GOVERNMENTS BUDGET IMPLEMENTATION REVIEW REPORT FIRST HALF FY, 2015/16120
to SRC’s recommended monthly ceiling of Kshs.124,800.
A breakdown of the operations and maintenance expenditure during the reporting period is shown in Figure 3.59.
Figure 3.59: Kirinyaga County, Operations and Maintenance Expenditure for the First Half of FY 2015/16
102.52
47.7936.85
23.26 20.37 19.37 18.35 16.39 12.89 10.34 10.05 9.91
0
20
40
60
80
100
120
Dome
stic a
nd Fo
reign
Trav
el
Med
ical D
rugs
Insura
nce e
xpen
ses
ing an
d Adv
ertisi
ng
Contr
acted
Servi
ces F
ees
& Su
bscri
ption
s
Fuel
Oil &
Lubri
cant,
Oxyg
en &
Othe
r Gase
s
Othe
r exp
enses
Hosp
itality
Offic
e & G
enera
l Sup
ply
Train
ing ex
pens
es
Utilit
ies
Comm
unica
tion
News
pape
rs &
Comp
uters
Kshs
.milli
ons
Major Categories of O & M Expenditure
Source: Kirinyaga County Treasury
The aggregate expenditure on domestic and foreign travel was Kshs.102.52 million compared to Kshs.34.79 million incurred in a similar period of FY 2014/15, representing an increase of 194.7 per cent. This expenditure comprised of Kshs.31.79 million spent by the County Executive and Kshs.70.73 million by the County Assembly.Development Expenditure Analysis
An overview of development expenditure during the first half of FY 2015/16 is provided in figure 3.60.
Figure 3.60: Kirinyaga County, Summary of Development Expenditure for the First Half of FY 2015/16
57.86 51.05
44.48 42.76
29.82 26.01 21.28
6.14 5.42 3.88
0
10
20
30
40
50
60
70
Cons
tructi
on &
Main
tenan
ce of
Wate
r Sup
plies
& S
ewer
age
Syste
m
Othe
r Inf
rastr
uctu
re &
Civ
ilW
orks
Cons
tructi
on of
Hea
lthfa
ciliti
es
Acce
ss R
oads
& B
ridge
s
Cons
tructi
on of
Cou
nty
Head
quar
ters
Purc
hase
of L
ight
ing
Equi
pmen
ts
Cons
tructi
on an
d Reh
abili
tatio
nof
Mar
kets
Stor
m W
ater M
anag
emen
t
Yout
h Dev
elopm
ent
Purc
hase
of G
ener
ators
Ksh
s.mill
ion
Major Categories of Development Expenditure
Source: Kirinyaga County Treasury

COUNTY GOVERNMENTS BUDGET IMPLEMENTATION REVIEW REPORT FIRST HALF FY, 2015/16 121
Analysis of the development expenditure of Kshs.303.37 million incurred in the first half of FY 2015/16 indicates that the Environment and Natural Resources Department reported the highest expenditure of Kshs.83.47 million which was spent on water supplies and sewerage and purchase of lighting equipment. The second highest expenditure of Kshs.60.74 million was incurred by the Health Department on construction of health facilities and purchase of generators. The Department of Transport incurred Kshs.56.90 million on access roads and bridges. The Land, Physical Planning & Urban Development Department had the lowest development expenditure of Kshs.6.65 million on storm water management.
3.15.6 Annual Budget and Budget Performance Analysis by department for the First Half of FY 2015/16
A summary of the FY 2015/16 annual budget estimates and budget performance for the first half by department is shown in Table 3.30.
Table 3.30: Kirinyaga County, Annual Budget and First Half of FY 2015/16 Budget Performance by Department
Department Annual Budget Alloca-tion (Kshs. Million)
Six Months Exche-quer Issues (Kshs.
Million)
Six Months Ex-penditure (Kshs.
Million)
Six Months Expenditure to
Exchequer Issues (%)
Absorption rate (%)
Rec Dev Rec Dev Rec Dev Rec Dev Rec Dev
County Assembly 506.14 82.69 226.16 - 219.51 - 97.1 - 43.4 -
County Executive Services 345.38 155 163.4 52.97 144.7 29.62 88.6 55.9 41.9 19.1
Finance and Eco-nomic Planning 426.01 86.97 198.31 16.88 183.43 - 92.5 - 43.1 -
Medical Services 1,133.10 385.48 510.08 83.69 548.11 60.74 107.5 72.6 48.4 15.8
Education 184.15 149.13 49.89 31.15 42.3 17.4 84.8 55.9 23 11.7
Agriculture 223.09 133.3 95.64 28.5 86.94 6.83 90.9 24 39 5.1
Gender/Culture & Social Services 66.75 91.28 22.16 24.83 20.69 18.54 93.3 74.7 31.0 20.3
Trade & Co-opera-tive Development 32.6 132.47 11.47 36.46 7.53 23.21 65.7 63.7 23.1 17.5
Environment and Natural Resources 61.67 483.48 30.08 132.55 18.67 83.47 62.1 63.0 30.3 17.3
Physical Planning and Housing 29.33 119.15 9.74 27.21 8.07 6.65 82.9 24.5 27.5 5.6
Transport and Infra-structure 57.86 436.29 24.48 116.35 17.52 56.9 71.6 48.9 30.3 13
TOTAL 3,066.08 2,255.24 1,341.40 550.6 1,297.46 303.37 96.7 55.1 42.3 13.5
Source: Kirinyaga County Treasury
Analysis of budget performance by department shows that the Department of Gender, Culture and Social Services reported the highest absorption rate of its development budget at 20.3 per cent, followed by the County Executive with an absorption rate of 19.1 per cent. On the other hand, the Health and Medical Services Department had the highest percentage of its recurrent expenditure to

COUNTY GOVERNMENTS BUDGET IMPLEMENTATION REVIEW REPORT FIRST HALF FY, 2015/16122
its recurrent budget at 48.4 per cent, he County Assembly was the second being at 43.4 per cent.
3.15.7 Borrowing by the County Government
Article 212 of the Constitution requires a county government to borrow with approval from the County Assembly, and only if the national government guarantees the loan. Further, Section 58 of the PFM Act 2012, gives the Cabinet Secretary to the National Treasury the powers to guarantee loans subject to approval by Parliament. During the period under review, the County utilized its equitable share and local revenue collection deposited into the County Revenue Fund account maintained at the Central Bank of Kenya and did not borrow any funds.
3.15.8 Observations and Recommendations
The County has made progress in addressing the challenges previously identified as affecting budget implementation. The County has:
i. Improved in absorption of development funds from 8.7 per cent in the first half of FY 2014/15 to 13.5 per cent in the first half of FY 2015/16.
ii. Separated the County Assembly payroll from the County Executive payroll. This has enhanced effectiveness and independence in financial operations.
Despite the progress made, the following challenges continued to hamper effective budget implementation;
1. High wage bill which had deprived funding of development activities. During the period under review compensation of employee was 60.5 per cent of the total expenditure.
2. Use of local revenue from the Facility Improvement Fund at source instead of depositing the collections into the CRF account at CBK as per Article 207 of the Constitution and Section 109 of the PFM Act 2012.
3. Use of Manual system (manual vote book) alongside IFMIS by County Treasury which give inaccurate expenditure returns that vary from IFMIS reports. Further, the County Assembly is yet to adopted IFMIS and internet banking.
4. Low local revenue performance due to weak regulatory and enforcement framework. The County is yet to automate local revenue collection.
5. Delay in the disbursement of funds by the National Treasury.
The County should implement the following recommendations in order to improve budget execution.
1. The County should address the huge wage bill in consultation with the National Government.
2. The County Treasury should deposit all locally generated revenue into the CRF account in

COUNTY GOVERNMENTS BUDGET IMPLEMENTATION REVIEW REPORT FIRST HALF FY, 2015/16 123
line with provision of the Constitution and Section 109 of the PFM Act 2012.
3. The County Treasury should enhance local revenue collection efforts in order to increase revenue yields through automation of revenue collection and improved enforcement frameworks.
4. The County Treasury should liaise with the National Treasury to ensure timely disbursement of funds as per the disbursement schedule approved by Senate.
3.16 Kisii County
3.16.1 Overview of the FY 2015/16 Budget
The FY 2015/16 approved budget for Kisii County was Kshs.8.96 billion. It comprised of Kshs.5.30 billion (59.1 per cent) allocated for recurrent expenditure and Kshs.3.66 billion (40.9 per cent) for development expenditure.
In order to finance the budget, the County expected to receive Kshs.7.62 billion (85.0 per cent) as transfers from the National Government, collect Kshs.700 million (7.8 per cent) from local sources, and receive a conditional grant of Kshs.22.95 million (0.3 per cent) from DANIDA and Kshs.617.47 million (6.9 per cent) as projected cash balance from FY 2014/15. However, the County did not budget for the additional conditional grants of Kshs.215.53 million from the National Government as contained in CARA, 2015 for compensation of forgone user fees and Road Maintenance Fuel Levy Fund. Funds for free maternal care and leasing of medical equipment was under budgeted by Kshs.56.88 million and Kshs.41.68 million respectively.
3.16.2 Revenue Analysis
During the first half of FY 2015/16, the County received Kshs.3.01 billion revenue from the National Government as equitable share, Kshs.143.91 million as conditional allocations for Kisii Level 5 Hospital, Kshs.6.34 million as conditional allocations for forgone user fees, Kshs.67.97 million as conditional allocations for free maternal health care, Kshs.45.51 million as conditional allocations for fuel levy fund, raised Kshs.104.86 million from local sources, and had a cash balance of Kshs.611.86 million brought forward from FY 2014/15.
The quarterly trend in local revenue collection from the FY 2013/14 to the second quarter of FY 2015/16 is shown in figure 3.61.

COUNTY GOVERNMENTS BUDGET IMPLEMENTATION REVIEW REPORT FIRST HALF FY, 2015/16124
Figure 3.61: Kisii County, Trend in Local Revenue Collection by Quarter from the FY 2013/14 to the second quarter of FY 2015/16
43.9
87.33
99.34
2030405060708090
100110
Ksh
s.mill
ion
Reporting period
Source: Kisii County Treasury
The local revenue consisted of Kshs.57.79 million raised in the first quarter and Kshs.47.07 million in the second quarter. The local revenue raised in the first half of the FY 2015/16 was Kshs.104.86 million (15.0 per cent of the annual local revenue target), a decline from Kshs.127.79 million collected in a similar period of FY 2014/15.
Analysis of the local revenue realized by stream is shown in Table 3.31.
Table 3.31: Kisii County, Analysis of revenue collection by stream for the first half of FY 2015/16
No. Revenue Stream Annual Targeted Reve-nue (Kshs.)
Six Months Actual Revenue (Kshs.)
Revenue Performance (%)
A B C D=*100
1 Bus park & Other Parking Fees 73,500,000 42,335,169 57.6
2 Market Entrance Fees 54,100,000 30,078,340 55.6
3 Buildings Plan Approval Fees 30,000,000 3,713,951 12.4
4 Property Rates & Rent 110,500,000 9,127,216 8.3
5 Single Business Permits 127,000,000 7,614,505 6
6 Others Sources 304,900,000 11,987,395 3.9
TOTAL 700,000,000 104,856,576 15
Source: Kisii County Treasury
Analysis of locally generated revenue collection by stream indicates that Bus Park and Other Parking Fees generated the highest percentage of revenue against target at 57.6 per cent followed by Market Entrance Fees at 55.6 per cent. Other Sources of revenue reported the lowest percentage

COUNTY GOVERNMENTS BUDGET IMPLEMENTATION REVIEW REPORT FIRST HALF FY, 2015/16 125
of revenue against target at 3.9 per cent.
3.16.3 Banking of Local Revenue
A review of the revenue collection accounts bank statements indicates that the County did not bank all the locally generated revenue into the CRF during the period under review. This was specifically in regard to the revenue raised by the Health Services Department which is in contravention of Article 207 of the Constitution and Section 109 of the PFM Act 2012, which stipulate that all funds raised or received by or on behalf of the County Government should be deposited into the CRF account, unless excluded by an Act of Parliament.
3.16.4 Exchequer Issues
During the period under review, the Controller of Budget authorized withdrawal of Kshs.3.86 billion al from the CRF, which was 43.0 per cent of the approved budget. The amount represented an improvement of 28.6 per cent from Kshs.3.00 billion authorized in a similar period of FY 2014/15 and consisted of Kshs.2.75 billion (71.3 per cent) for recurrent expenditure and Kshs.1.11 billion (28.7 per cent) for development activities.
3.16.5 Overall Expenditure Review
The County spent a total of Kshs.3.86billion during the first half of FY 2015/16 which was 92.4 per cent of the funds released for both recurrent and development expenditure. This is a significant increase from the Kshs.2.98 billion spent in a similar period of FY 2014/15. A total of Kshs.2.63 billion was spent on recurrent activities and Kshs.934.04 million was spent on development activities. Recurrent expenditure was 95.6 per cent of the funds released for recurrent activities while development expenditure accounted for 84.4 per cent of the funds released for development activities. The expenditure excludes commitments as of 31st December, 2015 that amounted to Kshs.333.94 million for development expenditure and Kshs.62.43 million for recurrent expenditure.
Recurrent expenditure for the period under review represented 49.6 per cent of the approved annual recurrent budget, an improvement from 43.6 per cent spent in a similar period of FY 2014/15. On the other hand, development expenditure represented an absorption rate of 25.5 per cent, a decrease from 30.2 per cent spent in a similar period of FY 2014/15.
A comparison of the total expenditure between the first half of FY 2014/15 and first half of FY 2015/16 is shown in Figure 3.62.

COUNTY GOVERNMENTS BUDGET IMPLEMENTATION REVIEW REPORT FIRST HALF FY, 2015/16126
Figure 3.62: Kisii County, Expenditure by Economic Classification for First Half of FY 2014/15 and First Half of FY 2015/16
1,483.89
537.00
956.36
1,927.17
703.74 934.04
-
500.00
1,000.00
1,500.00
2,000.00
2,500.00
Personnel Emoluments Operations & Maintenance Development
Ksh
s. M
illi
ons
Expenditure by Economic Classification
1st Half, FY 2014/15
1st Half, FY 2015/16
Source: Kisii County Treasury
3.16.6 Recurrent Expenditure Analysis
The total recurrent expenditure for the reporting period was Kshs.2.63 billion against an annual recurrent budget of Kshs.5.30 billion. This represents 49.6 per cent of the annual recurrent budget. The County spent Kshs.1.93 billion (73.3 per cent) on personnel emoluments and Kshs.703.74 million (26.7 per cent) on operations and maintenance as shown in Figure 3.62. Expenditure on personnel emoluments accounted for 54.1 per cent of total expenditure and has increased significantly in the first half of FY 2015/16 as compared to a similar period in FY 2014/15 when the County spent Kshs.1.48 billion. The increase can be attributed to employment and promotion of health workers, employment of ECD teachers and absorption of youth polytechnic instructors.
The County spent Kshs.60.33 million on sitting allowances to the 71 MCAs and the Speaker against an annual budget of Kshs.90.41 million. This represents a marginal decrease from Kshs.64.24 million incurred in a similar period of FY 2014/15. The average monthly sitting allowance per MCA was Kshs.139,658 compared to SRC’s recommended monthly ceiling of Kshs.124,800.
A breakdown of the operations and maintenance expenditure for the reporting period is shown in Figure 3.63.

COUNTY GOVERNMENTS BUDGET IMPLEMENTATION REVIEW REPORT FIRST HALF FY, 2015/16 127
Figure 3.63: Kisii County, Operations and Maintenance Expenditure for the First Half of FY 2015/16
170.12
83.7069.71
57.56 49.72 44.24 41.15 38.29 35.72 34.89 25.10 19.06
020406080
100120140160180
Trav
ellin
g ex
pens
es
Purc
hase
of m
edica
l dru
gs
Othe
r ope
ratin
g ex
pens
es
Insu
ranc
e cos
ts
Cont
ract
ed p
rofe
ssio
nal
serv
ices
Hosp
italit
y su
pplie
s and
serv
ices
Fuel
, oil
and
lubr
icant
s
Rout
ine m
anten
ance
Offic
e gen
eral
supp
lies
Prin
ting
& ad
verti
sing
Serv
ices
Hire
of A
mbu
lance
s
Train
ing
expe
nses
Ksh
s.mill
ions
Major categories of O & M expenditure
Source: Kisii County Treasury
The aggregate expenditure on domestic and foreign travel was Kshs.170.12 million compared to Kshs.111.09 million incurred in a similar period of FY 2014/15, representing an increase of 53.1 per cent. This expenditure comprised of Kshs.102.45 million spent by the County Executive and Kshs.67.67 million by the County Assembly.
3.16.7 Development Expenditure Analysis
A summary of development expenditure during the first half of FY 2015/16 is provide in figure 3.64.
Figure 3.64: Kisii County, Summary of Development Expenditure for the First Half of FY 2015/16
408.54
196.57
50.19 47.5 25 21.4 19 17.5 15.6 11.850
50100150200250300350400450
Cons
truct
ion
of R
oads
Cons
truct
ion
of H
ealth
faci
litie
s
Wat
er S
prin
g pr
otec
tion
and
Dril
ling
of b
oreh
oles
Purc
hase
of A
mbu
lanc
es
Emer
genc
y Fu
nd
Insta
llatio
n of
Stre
et L
ight
ing
Reve
nue c
olle
ctio
n an
dM
anag
emen
t Sys
tem
Purc
hase
of g
arba
ge tr
uck
Mar
ket D
evel
opm
ent
Com
plet
ion
of G
usii
Stad
ium
Ksh
s.Mill
ions
Major Categories of Development Expenditure
Source: Kisii County Treasury
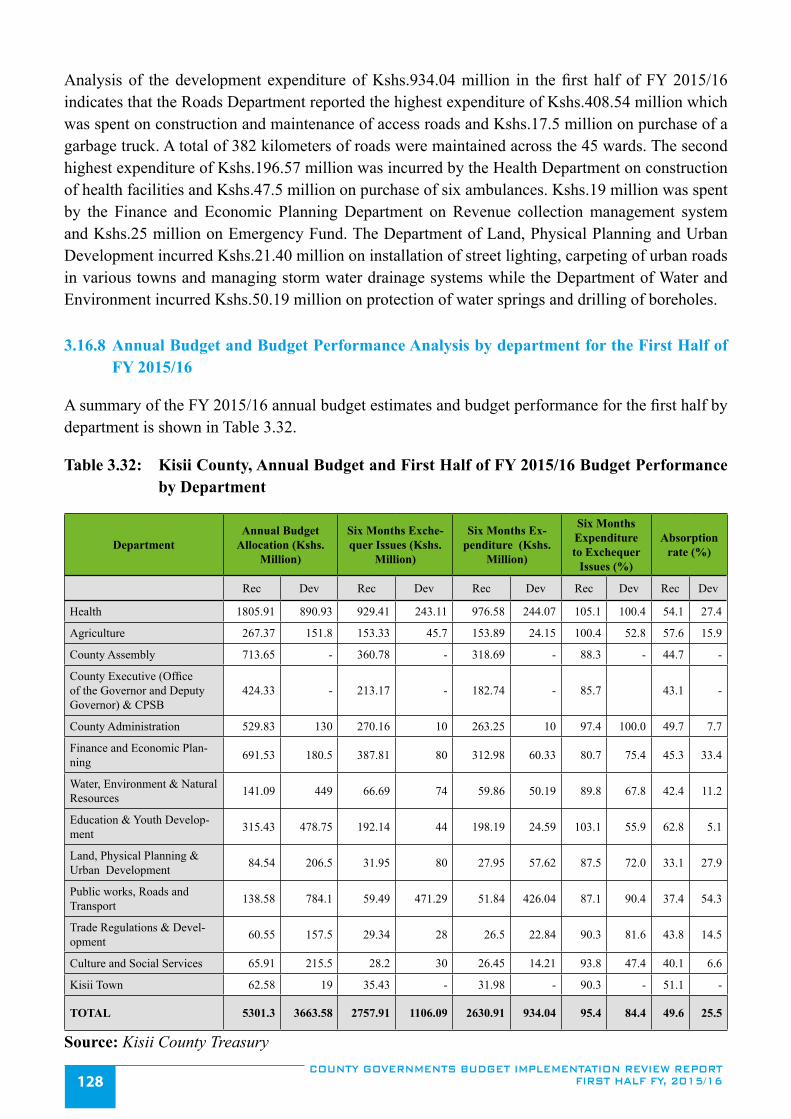
COUNTY GOVERNMENTS BUDGET IMPLEMENTATION REVIEW REPORT FIRST HALF FY, 2015/16128
Analysis of the development expenditure of Kshs.934.04 million in the first half of FY 2015/16 indicates that the Roads Department reported the highest expenditure of Kshs.408.54 million which was spent on construction and maintenance of access roads and Kshs.17.5 million on purchase of a garbage truck. A total of 382 kilometers of roads were maintained across the 45 wards. The second highest expenditure of Kshs.196.57 million was incurred by the Health Department on construction of health facilities and Kshs.47.5 million on purchase of six ambulances. Kshs.19 million was spent by the Finance and Economic Planning Department on Revenue collection management system and Kshs.25 million on Emergency Fund. The Department of Land, Physical Planning and Urban Development incurred Kshs.21.40 million on installation of street lighting, carpeting of urban roads in various towns and managing storm water drainage systems while the Department of Water and Environment incurred Kshs.50.19 million on protection of water springs and drilling of boreholes.
3.16.8 Annual Budget and Budget Performance Analysis by department for the First Half of FY 2015/16
A summary of the FY 2015/16 annual budget estimates and budget performance for the first half by department is shown in Table 3.32.
Table 3.32: Kisii County, Annual Budget and First Half of FY 2015/16 Budget Performance by Department
DepartmentAnnual Budget
Allocation (Kshs. Million)
Six Months Exche-quer Issues (Kshs.
Million)
Six Months Ex-penditure (Kshs.
Million)
Six Months Expenditure to Exchequer
Issues (%)
Absorption rate (%)
Rec Dev Rec Dev Rec Dev Rec Dev Rec Dev
Health 1805.91 890.93 929.41 243.11 976.58 244.07 105.1 100.4 54.1 27.4
Agriculture 267.37 151.8 153.33 45.7 153.89 24.15 100.4 52.8 57.6 15.9
County Assembly 713.65 - 360.78 - 318.69 - 88.3 - 44.7 -
County Executive (Office of the Governor and Deputy Governor) & CPSB
424.33 - 213.17 - 182.74 - 85.7 43.1 -
County Administration 529.83 130 270.16 10 263.25 10 97.4 100.0 49.7 7.7
Finance and Economic Plan-ning 691.53 180.5 387.81 80 312.98 60.33 80.7 75.4 45.3 33.4
Water, Environment & Natural Resources 141.09 449 66.69 74 59.86 50.19 89.8 67.8 42.4 11.2
Education & Youth Develop-ment 315.43 478.75 192.14 44 198.19 24.59 103.1 55.9 62.8 5.1
Land, Physical Planning & Urban Development 84.54 206.5 31.95 80 27.95 57.62 87.5 72.0 33.1 27.9
Public works, Roads and Transport 138.58 784.1 59.49 471.29 51.84 426.04 87.1 90.4 37.4 54.3
Trade Regulations & Devel-opment 60.55 157.5 29.34 28 26.5 22.84 90.3 81.6 43.8 14.5
Culture and Social Services 65.91 215.5 28.2 30 26.45 14.21 93.8 47.4 40.1 6.6
Kisii Town 62.58 19 35.43 - 31.98 - 90.3 - 51.1 -
TOTAL 5301.3 3663.58 2757.91 1106.09 2630.91 934.04 95.4 84.4 49.6 25.5
Source: Kisii County Treasury

COUNTY GOVERNMENTS BUDGET IMPLEMENTATION REVIEW REPORT FIRST HALF FY, 2015/16 129
Analysis of budget performance by department shows that the Department of Public Works, Roads and Transport reported the highest absorption rate of its development budget at 54.3 per cent while the Department of Education and Youth Development registered the lowest absorption rate at 5.1 per cent. On the other hand, the Department of Education and Youth Development had the highest percentage of its recurrent budget expenditure to its recurrent budget at 62.8 per cent while the Department of Lands, Physical Planning and Urban Development had the lowest percentage of its recurrent expenditure to its recurrent budget at 33.1 per cent.
3.16.9 Borrowing by the County Government
Article 212 of the Constitution requires a county government to borrow with approval from the County Assembly, and only if the national government guarantees the loan. Further, Section 58 of the PFM Act 2012 gives the Cabinet Secretary to the National Treasury the powers to guarantee loans subject to approval by Parliament. During the period under review, the County utilized its equitable share and local revenue collection deposited into the County Revenue Fund account maintained at the Central Bank of Kenya and did not borrow any funds.
3.16.10 Observations and Recommendations
The County has made progress in addressing the challenges previously identified as affecting budget implementation. The County has:i Designated accounting officers in all departments.ii Improved its human capacity through training and recruitment of qualified staff. iii Complied with budgetary timelines.iv Established an Internal Audit Committee.
Despite the progress made, the following challenges continued to hamper effective budget implementation;
1. Low local revenue collection which stood at 15.0 per cent of the projected revenue for FY 2015/16.
2. Health Department did not report/account for local revenue collected in contravention of Section 109 (2) of the PFM Act 2012.
3. There are no designated fund administrators for established funds such as the County Assembly Mortgages and Car loan Fund, Bursary Fund and Emergency Fund. This has led to difficulties in the administration, accounting and reporting of these funds.
4. High expenditure on personnel emoluments which stood at 73.3 per cent of the total recurrent budget and 54.1 per cent of the total expenditure.
5. The additional conditional grants of Kshs.215.53 million for compensation of user fees foregone and Road Maintenance Fuel Levy Fund were not budgeted for by the County Government.

COUNTY GOVERNMENTS BUDGET IMPLEMENTATION REVIEW REPORT FIRST HALF FY, 2015/16130
The County should implement the following recommendations in order to improve budget execution
1. The County should develop strategies to enhance local revenue collection.
2. All revenue collected should be reported and properly accounted for in accordance with Section 109(2) of the PFM Act 2012.
3. All County public funds should have designated fund administrators and separate bank accounts so as to comply with the accounting and reporting requirements envisaged in Section 168 of the PFM Act 2012.
4. The County Treasury should ensure that Personnel Emoluments are sustainable.
5. The County should develop a Supplementary Budget to include the additional conditional grants of Kshs.215.53 million (for compensation of forgone user fees and Road Maintenance Fuel Levy Fund). Further, the under-budgeted grants for free maternal care and leasing of medical equipment by Kshs.56.88 million and Kshs.41.68 million respectively shoukld be corrected.
3.17 Kisumu County
3.17.1 Overview of the FY 2015/16 Budget
The FY 2015/16 approved budget for Kisumu County was Kshs.9.64 billion. It comprised Kshs.5.71 billion (59.2 per cent) for recurrent expenditure and Kshs.3.93 billion (40.8 per cent) for development expenditure.
In order to finance the budget, the County expects to receive Kshs.6.38 billion (66.2 per cent) as transfers from the National Government, collect Kshs.1.87 billion (19.4 per cent) from local sources, receive a conditional grant of Kshs.16.58 million (0.2 per cent) from DANIDA and Kshs.1.37 billion (14.2 per cent) as projected cash balance from FY 2014/15.
3.17.2 Revenue Analysis
During the first half of FY 2015/16, the County received Kshs.2.06 billion from the National Government as a direct transfer to the CRF account, this amount comprised of Kshs.1.90 billion as equitable share of revenue, Kshs.113.44 million as conditional allocation for Level 5 Hospital, Kshs.8.29 million as DANIDA grant, Kshs.43.86 million as conditional allocations for free maternal health care, Kshs.4.33 million as conditional allocations for forgone user fees, Kshs.36.45 million as conditional allocation from the Road Maintenance Fuel Levy Fund, raised Kshs.406.23 million from local sources, and a balance of Kshs.1.02 billion brought forward from FY 2014/15.
The trend of local revenue collection from first quarter of the FY 2013/14 to the second quarter of FY 2015/16 is shown in figure 3.65.
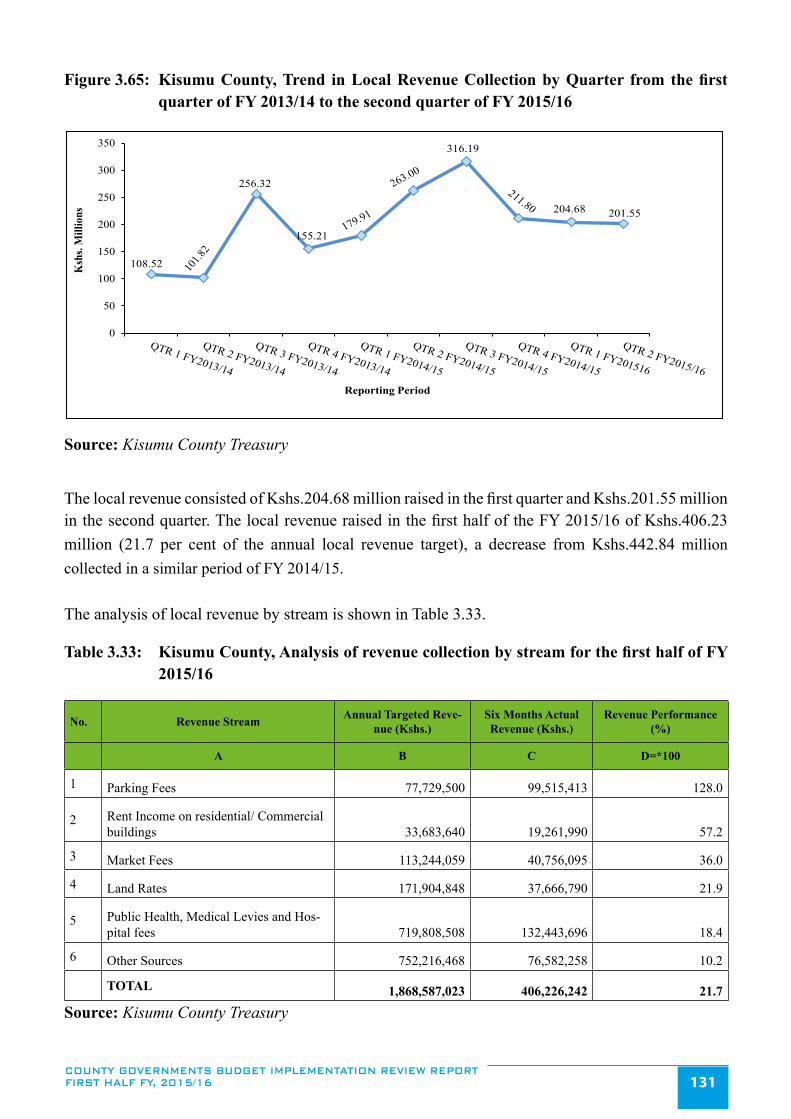
COUNTY GOVERNMENTS BUDGET IMPLEMENTATION REVIEW REPORT FIRST HALF FY, 2015/16 131
Figure 3.65: Kisumu County, Trend in Local Revenue Collection by Quarter from the first quarter of FY 2013/14 to the second quarter of FY 2015/16
108.52
256.32
155.21
316.19
204.68 201.55
0
50
100
150
200
250
300
350
Ksh
s. M
illio
ns
Reporting Period
Source: Kisumu County Treasury
The local revenue consisted of Kshs.204.68 million raised in the first quarter and Kshs.201.55 million in the second quarter. The local revenue raised in the first half of the FY 2015/16 of Kshs.406.23 million (21.7 per cent of the annual local revenue target), a decrease from Kshs.442.84 million collected in a similar period of FY 2014/15.
The analysis of local revenue by stream is shown in Table 3.33.
Table 3.33: Kisumu County, Analysis of revenue collection by stream for the first half of FY 2015/16
No. Revenue Stream Annual Targeted Reve-nue (Kshs.)
Six Months Actual Revenue (Kshs.)
Revenue Performance (%)
A B C D=*100
1 Parking Fees 77,729,500 99,515,413 128.0
2 Rent Income on residential/ Commercial buildings 33,683,640 19,261,990 57.2
3 Market Fees 113,244,059 40,756,095 36.0
4 Land Rates 171,904,848 37,666,790 21.9
5 Public Health, Medical Levies and Hos-pital fees 719,808,508 132,443,696 18.4
6 Other Sources 752,216,468 76,582,258 10.2
TOTAL 1,868,587,023 406,226,242 21.7
Source: Kisumu County Treasury

COUNTY GOVERNMENTS BUDGET IMPLEMENTATION REVIEW REPORT FIRST HALF FY, 2015/16132
The analysis of revenue by stream indicates that parking fees generated the highest percentage of revenue against the annual target at 128.0 per cent followed by Rent income on residential/commercial buildings at 57.2 per cent.
3.17.3 Banking of Local Revenue
A review of the bank statements for the revenue collection account indicates that all locally generated revenue was deposited into the CRF during the period under review. This conforms to Article 207 of the Constitution and Section 109 of the PFM Act 2012, which stipulates that all funds raised or received by or on behalf of the County Government shall be deposited into the CRF account unless excluded by an Act of Parliament.
3.17.4 Exchequer Issues
During the period under review, Kshs.3.43 billion was available for use in the operations accounts, which was 35.6 per cent of the approved budget. This amount comprised of Kshs.3.20 billion authorized for withdrawal by the Controller of Budget from the CRF and unspent cash balances from FY 2014/15 of Kshs.235.11 million held in Health Department operations accounts which was not paid to the CRF as per the requirement of Section 136 of the PFM Act 2012. The amount represented an increase of 17.1 per cent from Kshs.2.93 billion authorized in a similar period of FY 2014/15 and consisted of Kshs.2.68 billion (78.1 per cent) for recurrent expenditure and Kshs.754.42 million (21.9 per cent) for development activities.
3.17.5 Overall Expenditure Review
The County spent a total of Kshs.2.84 billion during the first half of FY 2015/16 which was 82.8 per cent of the total funds released for both development and recurrent expenditure. This is a significant improvement from the Kshs.1.13 billion spent in a similar period of FY 2014/15. A total of Kshs.2.24 billion was spent on recurrent activities and Kshs.599.16 million on development activities. Recurrent expenditure was 83.8 per cent of the funds released for recurrent activities while development expenditure accounted for 79.4 per cent of the funds released for development activities. The expenditure excludes commitments as of 31st December, 2015 that amounted to Kshs.1.48 billion for development expenditure and Kshs.344.09 million for recurrent expenditure.
Recurrent expenditure for the period under review represented 39.3 per cent of the approved annual recurrent budget, an increase from 10.9 per cent spent in a similar period of FY 2014/15. On the other hand, development expenditure recorded an absorption rate of 15.2 per cent, an improvement from 8.9 per cent spent in a similar period of FY 2014/15.
A comparison of the total expenditure between the first half of FY 2014/15 and the first half of FY 2015/16 is shown in Figure 3.66.

COUNTY GOVERNMENTS BUDGET IMPLEMENTATION REVIEW REPORT FIRST HALF FY, 2015/16 133
Figure 3.66: Kisumu County, Expenditure by Economic Classification for First Half of FY 2014/15 and First Half of FY 2015/16
292.90 321.08 519.97
1,631.53
611.15 599.16
0
500
1,000
1,500
2,000
Personnel Emoluments Operations & Maintenance Development
Ksh
s. M
illi
on
s
Expenditure by Economic Classification
1st Half, FY 2014/15
1st Half, FY 2015/16
Source: Kisumu County Treasury
3.17.6 Recurrent Expenditure Analysis
The total recurrent expenditure for the reporting period was Kshs.2.24 billion against an annual budget of Kshs.5.71 billion. This represents 39.2 per cent of the annual recurrent budget. The County spent Kshs.1.63 billion (72.8 per cent) on personnel emoluments and Kshs.611.15 million (27.2 per cent) on operations and maintenance as shown in Figure 3.66. Expenditure on personnel emoluments accounted for 57.4 per cent of total expenditure and has increased enormously in first half of FY 2015/16 as compared to a similar period in FY 2014/15 when the County spent Kshs.321.08 million. The increase is attributed to incomplete reporting of expenditure for first half of FY 2014/15 which did not include expenditure processed through below the line IFMIS codes, and unremitted payroll deductions in the first half of FY 2014/15.
The County spent Kshs.43.22 million on sitting allowances to the 50 MCAs and the Speaker against a budget of Kshs.113.81 million. This is a significant increase from Kshs.11.42 million recorded in a similar period of FY 2014/15. The average monthly sitting allowance per MCA was Kshs.144,089 compared to SRCs recommended monthly ceiling of Kshs.124,800.
A breakdown of the operations and maintenance expenditure for the reporting period is shown in Figure 3.67.

COUNTY GOVERNMENTS BUDGET IMPLEMENTATION REVIEW REPORT FIRST HALF FY, 2015/16134
Figure 3.67: Kisumu County, Operations and Maintenance Expenditure for the hirst half of FY 2015/16
250.09
91.5662.68
46.43 43.22 21.17 20.82 19.71 16.56 14.96 12.06 11.89
-
50
100
150
200
250
300Pe
ndin
g bi
lls
Oth
er O
&M
Dom
estic
& fo
reig
n tr
avel
Insu
ranc
e Co
sts
CA S
ittin
g Al
low
ance
Conf
eren
ce &
Hos
pita
lity
Trai
ning
Util
ities
Rent
al o
f pro
duce
d as
sets
Spec
ialis
ed m
ater
ial &
sup
ply
Rout
ine
Mai
nten
ance
Fuel
& L
ubric
ants
Kshs
. Mill
ions
Major Categories of O&M Expenditure
Source: Kisumu County Treasury
The aggregate expenditure on domestic and foreign travel was Kshs.62.68 million compared to Kshs.40.85 million incurred in a similar period of FY 2014/15, representing a significant increase of 53.4 per cent. This expenditure comprised of Kshs.43.90 million spent by the County Executive and Kshs.18.78 million by the County Assembly.
3.17.7 Development Expenditure Analysis
A summary of development expenditure during the first half of FY 2015/16 is provided in figure 3.68.
Figure 3.68: Kisumu County, Summary of Development Expenditure for the First Half of FY 2015/16
287.83
68.27 65.49 53.70 35.70 22.80 25.93 13.67 8.72 6.34 6.04 4.67 0
50
100
150
200
250
300
350
Cons
truct
ion
and
Reha
bilit
atio
n of
Roa
ds &
othe
r Civi
l wor
ks
Cons
truct
ion/
Ren
ovat
ion
ofHe
alth
facil
ities
Othe
r Dev
elop
men
t Exp
ense
s
Cons
t. an
d m
aint
. of W
ater
supp
lies
De-s
iltin
g of R
ivers
Cons
truct
ion
of E
CDCl
assr
oom
s & p
olyt
echn
ics
Refu
rbish
men
t/ R
enov
atio
nof
Offi
ces
Stre
et/ S
olar
Ligh
ting
Cons
truct
ion/
Ren
ovat
ion
ofM
arke
t Sha
des
Cons
truct
ion
of C
omm
unity
Halls
& R
esou
rce
Cent
res
Reve
nue
Auto
mat
ion
Supp
ort t
o Pr
imar
y/Se
cond
ary S
choo
ls
Kshs
. Miil
lions
Major Categories of Development Expenditure
Source: Kisumu County Treasury

COUNTY GOVERNMENTS BUDGET IMPLEMENTATION REVIEW REPORT FIRST HALF FY, 2015/16 135
Analysis of the development expenditure of Kshs.599.16 million incurred in the first half of FY 2015/16 indicates that the Finance and Economic Planning Department reported the highest expenditure of Kshs.522.17 million which was incurred on pending bills. Breakdown of the expenditure on pending bills shows that the highest expenditure of Kshs.287.83 million was incurred on development and maintenance of access roads and bridges. The second highest expenditure at Kshs.68.27 million was incurred on construction and renovation of health facilities including dispensaries, staff houses and wards while drilling of boreholes, extension and rehabilitation of water supplies, renovation of drainage systems and protection of springs stood at Kshs.53.70 million. Office of Governor incurred the second highest expenditure of Kshs.35.70 million on Special Programmes to de-silt rivers.
3.17.8 Annual Budget and Budget Performance Analysis by department for the First Half of FY 2015/16
A summary of the FY 2015/16 annual budget estimates and budget performance for the first half by department is shown in Table 3.34.
Table 3.34: Kisumu County, Annual Budget and First Half of FY 2015/16 Budget Performance by Department
Department Annual Budget Allo-cation (Kshs. Million)
Six Months Exchequer Issues
(Kshs. Million)
Six Months Ex-penditure (Kshs.
Million)
Six Months Expenditure to Exchequer
Issues (%)
Absorption rate (%)
Rec Dev Rec Dev Rec Dev Rec Dev Rec Dev
County Assembly Services 533.90 - 245.29 - 142.58 - 58.1 - 26.7 -City of Kisumu 851.23 90.00 346.03 - 45.47 - 13.1 - 5.3 -Office of the Governor & County Administration 391.16 150.00 150.72 - 1,575.04 69.55 1,045 - 402.7 46.4
County Public Service Board 65.00 - 31.43 - 7.75 - 24.6 - 11.9 -
Finance & Economic Planning 808.33 1,577.26 455.29 754.42 318.60 522.17 70.0 69.2 39.4 33.1
Agriculture, Livestock & Fisheries Development 307.08 180.01 135.60 - 9.48 - 7.0 - 3.1 -
Water ,Environment & Natural Resources 95.26 210.02 52.20 - 11.61 - 22.2 - 12.2 -
Education, Youth, Culture & Social services 152.23 371.00 67.95 - 44.79 7.44 65.9 - 29.4 2.0
Health Services 2,127.99 241.71 1,016.43 - 58.05 - 5.7 - 2.7 -Land, Housing & Physical Planning 31.41 234.30 13.14 - 1.61 - 12.3 - 5.1 -
Roads Public Works & Transport 120.16 414.37 59.16 - 4.26 - 7.2 - 3.5 -
Communication and Infor-mation Technology 72.43 100.00 30.89 - 7.02 - 22.7 - 9.7 -
Trade, Tourism & Heritage 68.75 130.00 31.86 - 3.92 - 12.3 - 5.7 -Industrialization, Enterprise Development, Energy & Mining
82.02 232.00 39.93 - 10.22 - 25.6 - 12.5 -
TOTAL 5,706.95 3,930.67 2,675.92 754.42 2,240.41 599.16 83.7 79.4 39.3 15.2
Source: Kisumu County Treasury

COUNTY GOVERNMENTS BUDGET IMPLEMENTATION REVIEW REPORT FIRST HALF FY, 2015/16136
Analysis of budget performance by department shows that the Office of the Governor and County Administration reported the highest absorption rate of its development budget at 46.4 per cent followed by Department of Finance and Economic Planning at 33.1 per cent and Department of Education, Youth, Culture & Social services at 2.0 per cent while the rest of departments did not incur any development expenditure during the reporting period. On the other hand, the Office of the Governor and County Administration had its recurrent expenditure exceeding the department’s recurrent budgetary allocation by 402.7 per cent. This was occasioned by use of below the line IFMIS item codes to pay personnel emoluments without taking into account the budget allocation to personnel emoluments for the department. Besides, the Department of Health Services spent the lowest percentage of its recurrent budget to recurrent budget at 2.7 per cent.
3.17.9 Borrowing by the County Government
During the period under review, the County accessed an overdraft facility of Kshs.11.00 million from Kenya Commercial Bank. This borrowing was in line with Article 212 of the Constitution and Section 107 of the PFM Act 2012.
3.17.10 Observations and Recommendations
The County has made progress in addressing the challenges previously identified as affecting budget implementation. The County has:
i. Registered improvement in absorption of development funds from 8.9 per cent in the first half of FY 2014/15 to 15.2 per cent during the reporting period.
ii. Ensured remittance of local revenue collection by devolved entities into the County Revenue Fund (CRF) account.
Despite the progress made, the following challenges continued to hamper effective budget implementation;
1. Decline in local revenue collection by 8.3 per cent from Kshs.442.84 million achieved during the first half of FY 2014/15 to Kshs.406.23 million in the first half of FY 2015/16.
2. Failure to deposit unspent cash balance of Kshs.235.11 million held in Health Operations Accounts into the CRF at the close of FY 2014/15 in contravention of Section 136 of the PFM Act 2012.
The County should implement the following recommendations in order to improve budget execution
1. The County should innovatively expand its revenue base and improve collection on the existing revenue streams through automation.
2. The County Treasury should enhance its monitoring role over the management of financial resources and as well as ensure that no County Government entity holds unspent funds after

COUNTY GOVERNMENTS BUDGET IMPLEMENTATION REVIEW REPORT FIRST HALF FY, 2015/16 137
the close of a financial year.
3.18 Kitui County
3.18.1 Overview of the FY 2015/16 Budget
The FY 2015/16 approved budget for Kitui County was Kshs.10.23 billion. It comprised Kshs.4.79 billion (46.9 per cent) for recurrent expenditure and Kshs.5.43 billion (53.1 per cent) for development expenditure.
In order to finance the budget, the County expects to receive Kshs.7.27 billion (71.1 per cent) as equitable share from the National Government, collect Kshs.608.20 million (5.9 per cent) from local sources, have Kshs.2.07 billion (20.2 per cent) as projected cash balance from FY 2014/15, and receive Kshs.283.52 million (2.8 per cent) as conditional grant. The conditional grant as per the County Allocation of Revenue Act, 2015 was Kshs.359.27 million, which is more than the amount budgeted in the approved budget of Kshs.283.52 million. The Kshs.359.27 million conditional grant comprises of Kshs.95.74 million for leasing of medical equipment, Kshs.92.32 million from Road Maintenance Fuel Levy Fund, Kshs.63.61 million for free maternal health care, Kshs.23.61 million for compensation of forgone user fees, Kshs.47.0 million from World Bank loan to supplement financing of county health facilities, and Kshs.36.99 million from DANIDA grant to supplement financing for county health facilities. The County did not budget for Kshs.95.74 million for leasing of medical equipment, but had an additional budget estimate of a grant from UNDP of Kshs.20.00 million.
3.18.2 Revenue Analysis
In the first half of FY 2015/16, the County received Kshs.2.52 billion from the National Government as direct transfer to the CRF account. This amount comprised of Kshs.2.43 billion for equitable share, Kshs.46.64 million for conditional allocation from Road Maintenance Fuel Levy Fund, Kshs.18.50 million from DANIDA grant meant to supplement financing for county health facilities, Kshs.22.87 million for conditional allocation for free maternal health care allocation, and Kshs.7.01 million for conditional allocation for compensation for user fees forgone. In addition to the direct transfer from national government, the County raised Kshs.155.03 million from local sources, and had a cash balance of Kshs.1.86 billion brought forward from FY 2014/15. The quarterly trend in local revenue collection from first quarter of the FY 2013/14 to the second quarter of FY 2015/16 is shown in figure 3.69.

COUNTY GOVERNMENTS BUDGET IMPLEMENTATION REVIEW REPORT FIRST HALF FY, 2015/16138
Figure 3.69: Kitui County, Trend in Local Revenue Collection by Quarter from the first quarter of FY 2013/14 to the second quarter of FY 2015/16
63.47
110.23
-
20
40
60
80
100
120
Ksh
s.Mill
ions
Reporting period
Source: Kitui County Treasury
The local revenue consisted of Kshs.94.84 million raised in the first quarter and Kshs.60.19 million in the second quarter. The local revenue raised in the first half of the FY 2015/16 of Kshs.155.03 million (25.5 per cent of the annual local revenue target), an improvement from Kshs.135.58 million collected in a similar period of FY 2014/15.
Analysis of local revenue by stream is shown in Table 3.35.
Table 3.35: Kitui County, Analysis of revenue collection by stream for the first half of FY 2015/16
No. Revenue Stream Annual Targeted Revenue (Kshs.)
Six Months Actual Revenue (Kshs.)
Revenue Performance (%)
A B C D=*100
1 Market Fees 70,708,904 21,737,270 30.72 Single Business Permits 33,453,125 15,363,356 45.93 Cess 79,852,810 11,440,460 14.34 Enclosed Parking 26,313,400 8,206,750 31.2
5Non Agricultural Work Dry Rate - Earth movement in cubic meters (M3) (sand harvesting)
12,700,000 6,672,691 52.5
6 Land rates 45,809,370 5,533,567 12.1
7 Alcoholic Drinks License applica-tion/Renewal 5,159,300 -
8 Sale of Tender Documents 10,800,000 4,770,000 44.29 Signboard & Advertising 7,387,701 4,292,895 58.110 Street Parking 25,017,000 3,158,760 12.611 Other Revenue streams 296,157,690 68,692,193 23.2 TOTAL 608,200,000 155,027,242 25.49
Source: Kitui County Treasury

COUNTY GOVERNMENTS BUDGET IMPLEMENTATION REVIEW REPORT FIRST HALF FY, 2015/16 139
The analysis of revenue by stream indicates that signboard advertsing generated the highest percentage of revenue against annual target at 58.1 percent, followed by sand harvesting fees at 52.5 per cent. In absolute terms, market fees generated the highest amount of Kshs.21.74 million, representing a performance of 30.7 per cent, followed by Single Business Permits at Kshs.15.36 million, representing a 45.9 performance of the annual target.
3.18.3 Banking of Local Revenue
A review of the bank statements for the revenue collection account indicates that all locally generated revenue was deposited into the CRF during the period under review; however the Department of Health and Sanitation did not deposit collections from some sub-county hospitals to the CRF on a regular basis. The Office requests the County Treasury to ensure that local is regularly deposited into the CRF account in line with Article 207 of the Constitution and Section 109 of the PFM Act 2012, which stipulates that all funds raised or received by or on behalf of the County Government should be deposited into the CRF account, unless excluded by an Act of Parliament.
3.18.4 Exchequer Issues
The Controller of Budget authorised withdrawal of Kshs.3.35 billion from the CRF, which was 32.8 per cent of the approved budget. The amount represented an increase of 4.4 per cent from Kshs.3.21 billion authorized in a similar period of FY 2014/15 and consisted of Kshs.2.14 billion (63.9 per cent) for recurrent expenditure and Kshs.1.21 billion (36.1 per cent) for development activities.
3.18.5 Overall Expenditure Review
The County spent a total of Kshs.2.91 billion during the first half of FY 2015/16 which was 86.8 per cent of the funds released for both recurrent and development expenditure. This is a slight increase from the Kshs.2.54 billion spent in a similar period of FY 2014/15. A total of Kshs.1.64 billion was spent on recurrent activities and Kshs.1.27 billion on development activities. Recurrent expenditure was 76.3 per cent of the funds released for recurrent activities while development expenditure accounted for 105.4 per cent of the funds released for development activities. The expenditure excludes commitments as of 31st December, 2015 that amounted to Kshs.835.26 million for development expenditure and Kshs.105.44 million for recurrent expenditure.
Recurrent expenditure for the period under review represented 34.1 per cent of the approved annual recurrent budget, a slight decrease from 35.6 per cent spent in a similar period of FY 2014/15.On the other hand, development expenditure recorded an absorption rate of 23.4 per cent, an improvement from 18.4 per cent spent in a similar period of FY 2014/15. A comparison of the total expenditure in the first half of FY 2014/15 and the first half of 2015/16 is shown in Figure 3.70.

COUNTY GOVERNMENTS BUDGET IMPLEMENTATION REVIEW REPORT FIRST HALF FY, 2015/16140
Figure 3.70: Kitui County, Expenditure by Economic Classification for First Half of FY 2014/15 and First Half of FY 2015/16
1,038.59
558.32
938.65
1,260.57
375.08
1,274.33
0
200
400
600
800
1000
1200
1400
Personnel Emoluments Operations & Maintenance Development
Ksh
s. M
illi
on
s
Expenditure by Economic Classification
1st Half, FY 2014/15
1st Half, FY 2015/16
Source: Kitui County Treasury
3.18.6 Recurrent Expenditure Analysis
The total recurrent expenditure for the reporting period was Kshs.1.64 billion against an annual recurrent budget of Kshs.4.79 billion. This represents 34.1 per cent of the annual recurrent budget. The County spent Kshs.1.26 billion (76.8per cent) on personnel emoluments and Kshs.375.08 million (22.9 per cent) on operations and maintenance as shown in Figure 3.70. Expenditure on personnel emoluments accounted for 43.3 per cent of total expenditure and has increased in the first half of FY 2015/16 as compared to a similar period in FY 2014/15 when the County spent Kshs.1.04 billion.
The County spent Kshs.29.23 million on sitting allowances to the 56 MCAs and the Speaker against a budget of Kshs.74.63 million. This is a marginal increase from Kshs.27.23 million recorded in a similar period of FY 2014/15. The average monthly sitting allowance per MCA was Kshs.85,458 compared to SRCs recommended monthly ceiling of Kshs.124,800.
A breakdown of the operations and maintenance expenditure for the reporting period is shown in Figure 3.71
.

COUNTY GOVERNMENTS BUDGET IMPLEMENTATION REVIEW REPORT FIRST HALF FY, 2015/16 141
Figure 3.71: Kitui County, Operations and Maintenance Expenditure for the First Half of FY 2015/16
92.82
70.6659.65
32.80 28.23 22.95 21.29 20.81 17.618.26
0102030405060708090
100
Dom
estic
and
Fore
ign
Trav
el
Spec
ialise
d M
ateria
ls an
dSu
pplie
s
Othe
r Ope
ratin
g Ex
pens
es
Hosp
italit
y Su
pplie
s and
Serv
ices
Prin
ting,
Adv
ertis
ing
and
Info
rmati
on S
uppl
ies an
dSe
rvice
s
Rout
ine M
ainten
ance
Fuel
Oil
and
Lubr
icant
s
Train
ing
Expe
nses
(inc
ludi
ngca
pacit
y bu
ildin
g)
Utili
ties,
Supp
lies a
nd S
ervi
ces
Insu
ranc
e Cos
ts
Ksh
s. M
illio
ns
Major Categories of O&M Expenditure
Source: Kitui County Treasury
The aggregate expenditure on domestic and foreign travel was Kshs.92.82 million compared to Kshs.77.32 million incurred in a similar period of FY 2014/15, representing an increase of 20.1 per cent. This expenditure comprises of Kshs.63.25 million spent by the County Executive and Kshs.29.57 million by the County Assembly.
3.18.7 Development Expenditure AnalysisDetails of development expenditure during the first half of FY 2015/16 are provide in figure 3.72.
Figure 3.72: Kitui County, Summary of Development Expenditure for the First Half of FY 2015/16
399.28
262.59231.91
128.3186.65
58.77 41.41 27.07 20.47 17.87 -
50.00 100.00 150.00 200.00 250.00 300.00 350.00 400.00 450.00
Cons
tructi
on &
Civi
l Wor
ks
Cons
tructi
on &
Refu
rbish
ment
ofBu
ilding
s
CLID
P - C
ommu
nity L
evel
Infra
struc
ture D
evelo
pmen
tPr
ogram
me
Cons
tructi
on of
Roa
ds
Rese
arch,
Feas
ibilit
y Stud
ies,
Proje
ct Pr
epara
tion a
nd D
esign
,Pr
oject
Supe
rvisi
on
Othe
r Dev
elopm
ent A
ctivit
ies
Purch
ase o
f Spe
cialis
ed Pl
ant,
Equip
ment
& M
ach.
Pro-
Poor
Dev
elopm
ent
Prog
ramme
Spec
ialise
d Mate
rials
and
Supp
lies
Reha
bilita
tion o
f Civi
l Wor
ks
Kshs
. Mill
ions
Major Categories of Development Expenditure
Source: Kitui County Treasury

COUNTY GOVERNMENTS BUDGET IMPLEMENTATION REVIEW REPORT FIRST HALF FY, 2015/16142
Analysis of the development expenditure of Kshs.1.27 billion incurred in the first half of FY 2015/16 indicates that the Office of the Governor reported the highest expenditure of Kshs.327.58 million out of which Kshs.231.91 million was spent on Community Level Infrastructure Development Programme (CLIDP) and Kshs.27.07 million was spent on the Pro-Poor Programme. Some of the CLIDP projects included construction of pit latrine at Kavasya, construction of ECDE classrooms at Masambo Primary, pipeline extension from Kandwia Secondary to Kandwia Primary and Rehabilitation of Kyanika Cattle dip among others.
The second highest expenditure at Kshs.269.87 million was incurred by the Land Infrastructure and Urban Development out of which Kshs.128.31 million was used for construction of roads such as construction of K.E.A to Kamandio road and construction of Kiseveni drift along Nyingi - Mikwakwani road.
3.18.8 Annual Budget and Budget Performance Analysis by department for the First Half of FY 2015/16
A summary of the FY 2015/16 annual budget estimates and budget performance for the first half by department is shown in Table 3.36.
Table 3.36: Kitui County, Annual Budget and First Half of FY 2015/16 Budget Performance by Department
Department Annual Budget Alloca-tion (Kshs. Million)
6 months Exchequer Issues (Kshs. Million)
6 months Expenditure (Kshs. Million)
6 months expen-diture to exche-quer issues (%)
Expenditure to Annual Bud-get (Absorp-tion rate %)
Rec Dev Rec Dev Rec Dev Rec Dev Rec DevOffice Of The Governor 434.33 1,193.51 195.67 205.79 144.93 327.58 74.1 159.2 33.4 27.4
Administration & Coordination 496.09 238.89 201.72 38.61 127.72 30.16 63.3 78.1 25.7 12.6
Agriculture, Water & Irrigation 390.82 887.29 215.23 252.05 169.91 262.26 78.9 104 43.5 29.6
Basic Education, Training, & Skills Development
362.65 262.25 130.01 113.24 164.71 36.73 126.7 32.4 45.4 14
Land, Infrastruc-ture & Urban Development
253.43 711.59 147.71 391.02 87.77 269.87 59.4 69 34.6 37.9
Health & Sanita-tion 1,565.12 739.11 695.29 100.15 540.88 108.12 77.8 108 34.6 14.6
Trade, Industry & Cooperatives 61.49 272.37 33.36 28.46 23.71 61.09 71.1 214.7 38.6 22.4
Culture, Youth, Sports & Social Services
61.84 218.73 31.69 3.08 20.27 42.15 64 1368.5 32.8 19.3
Environment, Energy & Minerals Investment Devel-opment
40.63 280.53 20.29 69.97 10.53 69.77 51.9 99.7 25.9 24.9
Natural Resources & Tourism 44.53 93.52 24.33 5.97 17.95 5.47 73.8 91.6 40.3 5.8

COUNTY GOVERNMENTS BUDGET IMPLEMENTATION REVIEW REPORT FIRST HALF FY, 2015/16 143
Department Annual Budget Alloca-tion (Kshs. Million)
6 months Exchequer Issues (Kshs. Million)
6 months Expenditure (Kshs. Million)
6 months expen-diture to exche-quer issues (%)
Expenditure to Annual Bud-get (Absorp-tion rate %)
Rec Dev Rec Dev Rec Dev Rec Dev Rec DevFinance & Eco-nomic Planning 256.12 64.77 114.54 - 99.23 15.58 86.6 ∞ 38.7 24.1
County Public Service Board 60.65 0 32.9 - 25.14 - 76.4 ∞ 41.5 -
County Assembly 678.24 179.56 260.66 - 189.7 45.06 72.8 ∞ 28 25.1
Kitui Town Ad-ministration 50.63 192.91 24.05 1.02 8.84 0.48 36.8 47 17.5 0.2
Mwingi Town Administration 34.38 99.8 16.7 - 4.36 - 26.1 ∞ 12.7 0
Total 4,790.95 5,434.83 2144.14 1209.36 1,635.65 1,274.32 76.3 105.4 34.1 23.4
Source: Kitui County Treasury
Analysis of budget performance by department shows that the Department of Land, Infrastructure & Urban Development had the highest absorption rate of its development budget at 37.9 per cent while the Department of Mwingi Town Administration did not incur any development expenditure during the reporting period under review. On the other hand, the Department of Basic Education, Training, & Skills Development reported the highest percentage of recurrent expenditure to its recurrent budget at 45.4 per cent while the Department of Mwingi Town Administration registered the lowest percentage at 12.7 per cent.
3.18.9 Borrowing by the County Government
Article 212 of the Constitution requires a county government to borrow with approval from the County Assembly, and only if the national government guarantees the loan. Further, Section 58 of the PFM Act 2012 gives the Cabinet Secretary to the National Treasury the powers to guarantee loans subject to approval by Parliament. During the period under review, the County utilized equitable share and local revenue collection deposited into the County Revenue Fund maintained at the Central Bank of Kenya and did not borrow any funds.
3.18.10 Observations and Recommendations
The County has made progress in addressing the challenges previously identified as affecting budget implementation. The County has:
i. Registered improvement on absorption of development funds from 18.4 per cent in the first half of FY 2014/15 to 23.4 per cent in the first half of FY 2015/16.
ii. Improved in local revenue collection from Kshs.135.58 million (20.9 per cent of the annual local revenue target in FY 2014/15) during the first half of FY 2014/15 to Kshs.155.03 million (25.5 per cent of the annual local revenue target in FY 2015/16) during the first half of FY 2015/16.

COUNTY GOVERNMENTS BUDGET IMPLEMENTATION REVIEW REPORT FIRST HALF FY, 2015/16144
Despite the progress made, the following challenges continued to hamper effective budget implementation;
1. Delay in reporting on the various County Funds established in line with section 168(3) of the PFM Act 2012.
2. Failure to establish an Audit Committee as required by Section 155(5) of the PFM Act 2012, and Part XIII (167) of the Public Finance Management (County Governments) Regulations, 2015.
The County should implement the following recommendations in order to improve budget execution.
1. The County should ensure timely submission of reports on established County Funds in line with section 168 of the PFM Act 2012.
2. The County Government should establish an Internal Audit Committee. A functional Audit Committee will enhance management controls and governance among others.
3.19 Kwale County
3.19.1 Overview of the FY 2015/16 Budget
The FY 2015/16 approved budget for Kwale County was Kshs.7.61 billion. It comprised Kshs.2.83 billion (37.2 per cent) allocated for recurrent expenditure and Kshs.4.78 billion (62.8 per cent) for development expenditure.
In order to finance the budget, the County expects to receive Kshs.5.12 billion (67.3 per cent) in transfers from the National Government, collect Kshs.300.00 million (3.9 per cent) from local sources, conditional grants of Kshs.339.81 million (4.5 per cent) and Kshs.1.84 billion (24.3 per cent) as projected cash balance from FY 2014/15. The conditional grants are contained in the National Government CARA, 2015 for DANIDA Health Sector Services Fund (HSSF), free maternal care, compensation of forgone user fees, leasing of medical equipment and road maintenance fuel levy fund.
3.19.2 Revenue Analysis
In the first half of FY 2015/16, the County received Kshs.1.72 billion revenue from the National Government as equitable share, Kshs.6.81 million as DANIDA grant, Kshs.32.88 million as conditional allocations from the Roads Maintenance Fuel Levy Fund, Kshs.37.71 million as conditional allocations for free maternal health care, Kshs.5.91 million as conditional allocations for forgone user fees, raised Kshs.89.98 million from local sources, and had an actual cash balance of Kshs.1.42 billion brought forward from FY 2014/15. The quarterly trend in local revenue collection from first quarter of the FY 2013/14 to the second quarter of FY 2015/16 is shown in figure 3.73.
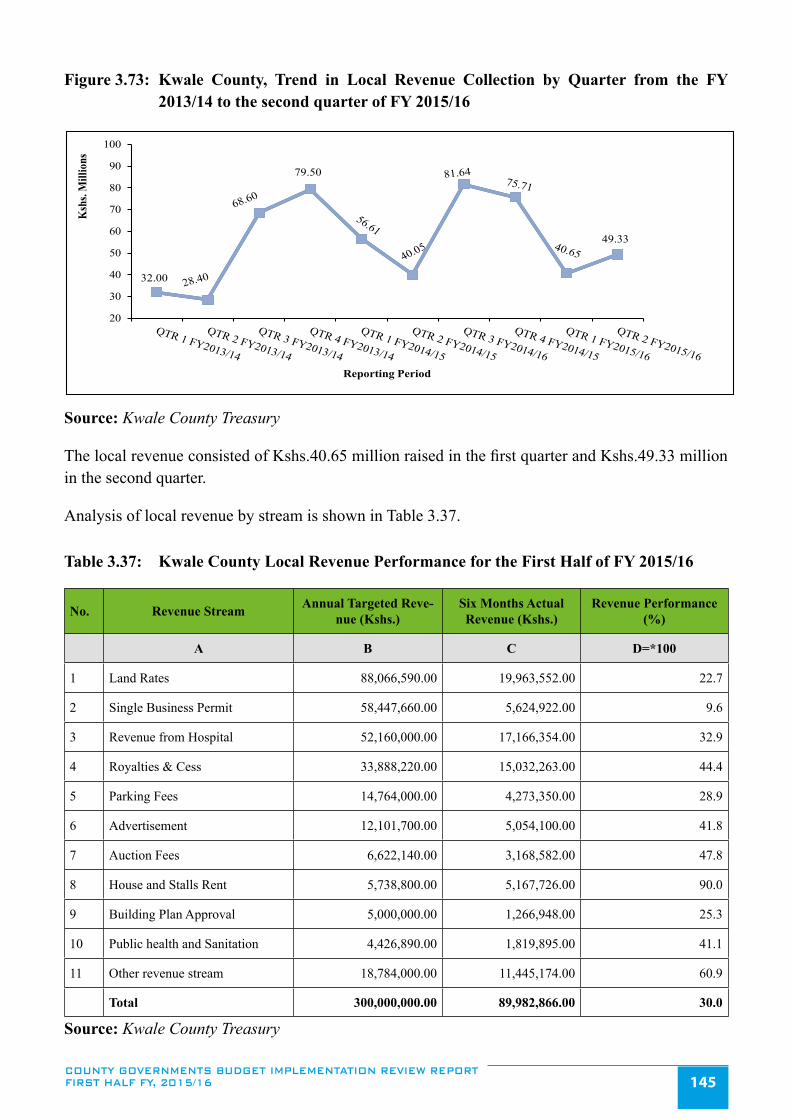
COUNTY GOVERNMENTS BUDGET IMPLEMENTATION REVIEW REPORT FIRST HALF FY, 2015/16 145
Figure 3.73: Kwale County, Trend in Local Revenue Collection by Quarter from the FY 2013/14 to the second quarter of FY 2015/16
32.00
79.50
49.33
20
30
40
50
60
70
80
90
100
Ksh
s. M
illio
ns
Reporting Period
Source: Kwale County Treasury
The local revenue consisted of Kshs.40.65 million raised in the first quarter and Kshs.49.33 million in the second quarter.
Analysis of local revenue by stream is shown in Table 3.37.
Table 3.37: Kwale County Local Revenue Performance for the First Half of FY 2015/16
No. Revenue Stream Annual Targeted Reve-nue (Kshs.)
Six Months Actual Revenue (Kshs.)
Revenue Performance (%)
A B C D=*100
1 Land Rates 88,066,590.00 19,963,552.00 22.7
2 Single Business Permit 58,447,660.00 5,624,922.00 9.6
3 Revenue from Hospital 52,160,000.00 17,166,354.00 32.9
4 Royalties & Cess 33,888,220.00 15,032,263.00 44.4
5 Parking Fees 14,764,000.00 4,273,350.00 28.9
6 Advertisement 12,101,700.00 5,054,100.00 41.8
7 Auction Fees 6,622,140.00 3,168,582.00 47.8
8 House and Stalls Rent 5,738,800.00 5,167,726.00 90.0
9 Building Plan Approval 5,000,000.00 1,266,948.00 25.3
10 Public health and Sanitation 4,426,890.00 1,819,895.00 41.1
11 Other revenue stream 18,784,000.00 11,445,174.00 60.9
Total 300,000,000.00 89,982,866.00 30.0
Source: Kwale County Treasury

COUNTY GOVERNMENTS BUDGET IMPLEMENTATION REVIEW REPORT FIRST HALF FY, 2015/16146
3.19.3 Banking of Local Revenue
A review of the bank statements for the revenue collection account indicates that all locally collected revenue was deposited into the CRF during the period under review. This conforms to Article 207 of the Constitution and Section 109 of the PFM Act 2012, which stipulates that all funds raised or received by or on behalf of the County Government, should be deposited into the CRF account, unless excluded by an Act of Parliament.
3.19.4 Exchequer Releases
During the period under review, the Controller of Budget authorized withdrawal of Kshs.3.15 billion from the CRF account, which was 41.4 per cent of the approved budget. The amount represented an increase of 41.3 per cent from Kshs.2.23 billion authorized in a similar period of FY 2014/15 and consisted of Kshs.1.45 billion (46.0 per cent) was for recurrent expenditure and Kshs.1.70 billion (54.0 per cent) was for development activities.
3.19.5 Overall Expenditure Review
The County spent a total of Kshs.2.01 billion during the first half of FY 2015/16 which was 63.9 per cent of the funds released. This is an improvement from the Kshs.1.72 billion spent in a similar period of FY 2014/15. A total of Kshs.774.85 million was spent on recurrent activities and Kshs.1.24 billion on development activities. Recurrent expenditure was 53.4 per cent of the funds released for recurrent activities while development expenditure accounted for 72.9 per cent of the funds released for development activities. The expenditure excludes commitments as of 31st December, 2015 that amounted to Kshs.899.48 million for development and Kshs.129.43 million for recurrent expenditure.
Recurrent expenditure for the period under review represented 27.3 per cent of the approved annual recurrent budget, a decrease from 41.6 per cent spent in a similar period of FY 2014/15. On the other hand, development expenditure recorded an absorption rate of 25.9 per cent, an improvement from 19.7 per cent spent in a similar period of FY 2014/15. A comparison of the total expenditure in the first half of FY 2014/15 and the first half of FY 2015/16 is shown in Figure 3.74.
Figure 3.74: Kwale County, Expenditure by Economic Classification for First Half of FY 2014/15 and First Half of FY 2015/16
581.69 557.34 576.87641.75
133.10
1,239.55
0
200
400
600
800
1000
1200
1400
Personnel Emoluments Operations & Maintenance Development
Kshs
. Mill
ions
Expenditure by Economic Classification
1st Half, FY 2014/15
1st Half, FY 2015/16
Source: Kwale County Treasury

COUNTY GOVERNMENTS BUDGET IMPLEMENTATION REVIEW REPORT FIRST HALF FY, 2015/16 147
3.19.6 Recurrent Expenditure Analysis
The total recurrent expenditure for the reporting period was Kshs.774.85 million against an annual recurrent budget of Kshs.2.83 billion. This represents 27.3 per cent of the annual recurrent budget. The County spent Kshs.641.75 million (82.8 per cent) on personnel emoluments and Kshs.133.10 million (17.2 per cent) on operations and maintenance as shown in Figure 3.73. Expenditure on personnel emoluments accounted for 31.9 per cent of total expenditure and has slightly increased in the first half of FY 2015/16 as compared to a similar period of FY 2014/15 when the County spent Kshs.581.69 million. The increase is attributed to annual salary increments and hiring of new staff in the health, education and public administration departments.
The County spent Kshs.13.71 million on sitting allowances to the 33 MCAs and the Speaker against a budget of Kshs.59.40 million, representing a decrease from Kshs.25.00 million recorded in a similar period of FY 2014/15. The average monthly sitting allowance per MCA was Kshs.67,191 compared to SRCs recommended monthly ceiling of Kshs.124,800.
A breakdown of the operations and maintenance expenditure for the reporting period is shown in Figure 3.75.
Figure 3.75: Kwale County, Operations and Maintenance Expenditure for the First Half of FY 2015/16
56.36
16.82 14.478.38 7.66 7.58 7.29 5.34 5.26 2.27 1.67
0.00
10.00
20.00
30.00
40.00
50.00
60.00
Trav
el &
fuel
expe
nses
Cater
ing
& C
onfe
renc
es
Gene
ral S
uppl
ies
Train
ing
Com
mun
icatio
n
Insu
ranc
e
Main
tenan
ce ex
pens
es
Utili
ties
Othe
r Ope
ratin
g Ex
pens
es
Prin
ting
&pu
blish
ing
Lega
l fee
s
Ksh
s. M
illio
n
Major Categories of O & M Expenditure
Source: Kwale County Treasury
The aggregate expenditure on domestic and foreign travel was Kshs.56.36 million compared to Kshs.108.70 million incurred in a similar period of FY 2014/15, representing a marginal decrease of 48.2 per cent. This expenditure comprised of Kshs.21.83 million spent by the County Executive and Kshs.34.52 million by the County Assembly.

COUNTY GOVERNMENTS BUDGET IMPLEMENTATION REVIEW REPORT FIRST HALF FY, 2015/16148
3.19.7 Development Expenditure Analysis
Details of leading departmental development expenditure during the first half of FY 2015/16 are provided in figure 3.76.
Figure 3.76: Kwale County, Summary of Development Expenditure for the first half of FY 2015/16
248.03
209.99 176.64
119.17 115.24 115.00 89.97
64.51 44.98
24.80
0
50
100
150
200
250
300
Bui
ldin
g of
Hea
lth fa
cilit
ies
&Pu
rcha
se o
f dru
gs &
Am
bula
nces
Bui
ldin
g C
ount
y H
Q
Bui
ldin
g of
EC
Ds,
Pol
ytec
hnic
s &
esse
ntia
l sup
plie
s
Fina
ncin
g of
Soc
ial a
men
ities
&ac
tiviti
es
Wat
er p
ipin
g &
bor
ehol
esde
velo
pmen
t
Cou
nty
Ass
embl
y pr
ojec
ts
Pur
chas
e of
Equ
ipm
ent &
Con
stru
ctio
n of
Roa
ds
Bui
ldin
g A
gric
ultu
ral F
acili
ties
and
Purc
hase
of T
ract
ors
Bui
ldin
g of
Tra
de M
arke
ts &
She
ds
Bui
ldin
g of
Adm
inis
trativ
e U
nits
Ksh
s.m
illio
n
Major Categories of Development Expenditure
Source: Kwale County Treasury
Analysis of the development expenditure of Kshs.1.24 billion incurred in the first half of FY 2015/16 indicates that the Health Department had the highest expenditure at Kshs.248.03 million which was spent construction of new health facilities like maternities, dispensaries, staff houses, Msambweni Hospital renal unit, purchase of drugs, ambulances and health equipment’s. The second highest expenditure was Kshs.209.99 million for construction of the County Head Quarters in Kwale town is underway. The Department of Education comes third in development expenditure at Kshs.176.64 million in building polytechnics and ECDs while at the same time equipping the facilities.
3.19.8 Annual Budget and Budget Performance Analysis by department for the First Half of FY 2015/16
A summary of the FY 2015/16 annual budget estimates and budget performance for the first half by department is shown in Table 3.38.

COUNTY GOVERNMENTS BUDGET IMPLEMENTATION REVIEW REPORT FIRST HALF FY, 2015/16 149
Table 3.38: Kwale County, Annual Budget and First Half of FY 2015/16 Budget Performance by Department
DepartmentAnnual Budget
Allocation (Kshs. Million)
6 months Exche-quer Issues (Kshs.
Million)
6 months Expen-diture (Kshs.
Million)
6 months expenditure to exchequer issues (%)
Absorption rate (%)
Rec Dev Rec Dev Rec Dev Rec Dev Rec Dev
Finance and Economic Planning 286.25 80.00 171.79 56.25 59.01 17.35 34.4 30.8 20.6 21.7
Agriculture, Livestock &Fisheries 172.12 318.36 86.07 122.75 60.69 65.61 70.5 53.5 35.3 20.6
Lands, Housing & Physical planning 62.18 113.05 31.18 64.50 12.18 28.26 39.1 43.8 19.6 25.0
Medical & Public Health Services 949.37 798.40 474.75 165.00 322.00 234.02 67.8 141.8 33.9 29.3
County Assembly 470.73 501.03 246.42 185.00 129.68 66.60 52.6 36.0 27.5 13.3
Industry, Trade & Investment 56.65 252.35 28.32 87.50 8.39 62.21 29.6 71.1 14.8 24.7
Community, Culture & Talent Management 73.63 306.26 36.82 95.25 20.94 103.43 56.9 108.6 28.4 33.8
Office of the Governor & CPSB 142.77 120.00 75.29 49.50 30.69 50.00 40.8 101.0 21.5 41.7
Education, Research & Human Resources 192.75 1133.98 96.41 423.00 75.93 316.40 78.8 74.8 39.4 27.9
Water Services 57.63 516.28 28.81 150.00 5.82 125.03 20.2 83.4 10.1 24.2
Infrastructure & Public Works 128.53 370.23 64.27 125.75 19.03 89.83 29.6 71.4 14.8 24.3
Tourism and ICT 46.64 162.22 23.32 77.25 7.33 34.91 31.4 45.2 15.7 21.5
Public Service & Administration 173.10 126.97 86.55 98.25 23.16 45.90 26.8 46.7 13.4 36.2
TOTAL 2812.35 4799.13 1450.00 1700.00 774.85 1239.55 53.4 72.9 27.6 25.9
Source: Kwale County Treasury
Analysis of budget performance by department shows that the Office of the Governor reported the highest absorption rate of its development budget at 41.7 per cent while the County Assembly registered the lowest absorption rate at 13.3 per cent during the reporting period. On the other hand, Department of Education had the highest percentage of its recurrent expenditure to its recurrent budget at 39.4 per cent while Water Services Department had the lowest percentage at 10.1 per cent.
3.19.9 Borrowing by the County Government
Article 212 of the Constitution requires a county government to borrow with approval from the County Assembly, and only if the national government guarantees the loan. Further, Section 58 of the PFM Act 2012, gives the Cabinet Secretary to the National Treasury the powers to guarantee loans subject to approval by Parliament. During the period under review, the County utilized its equitable share and local revenue collection deposited into County Revenue Fund account maintained at the Central Bank of Kenya and did not borrow any funds.

COUNTY GOVERNMENTS BUDGET IMPLEMENTATION REVIEW REPORT FIRST HALF FY, 2015/16150
3.19.10 Observations and Recommendations
The County has made progress in addressing the challenges previously identified as affecting budget implementation. The County has:
i. Registered improvement in absorption of development funds from 19.7 per cent in the first half of FY 2014/15 to 25.9 per cent in the reporting period.
ii. Registered a remarkable decrease in operations and maintenance expenditure from Kshs.557.34 million in the first half of FY 2014/15 to Kshs.133.10 million in the reporting period.
Despite the progress made, the following challenges continued to hamper effective budget implementation;
1. Difference between the IFMIS generated financial reports on development expenditure of Kshs.1.24 billion and the actual development projects reported separately, which amounted to Kshs.1.43 billion. This may indicate capacity challenges in the use of IFMIS.
2. Lack of regulations to operationalize established County Funds as required in Section 116 of the PFM Act 2012. The Kwale County Bursary Fund Act, 2014 violated the principle of the separation of powers and multiplicity of committees as envisioned in Article 175(a) of the Constitution and Sections 9(2) and 13(2) of the County Government Act, 2012.
The County should implement the following recommendations in order to improve budget execution
1. The County Treasury should liaise with the IFMIS Directorate to address staff capacity challenges in the use of IFMIS.
2. The County should develop and approve regulations to operationalize all established County Funds in line with Section 116 of the PFM Act 2012.
3.20 Laikipia County
3.20.1 Overview of the FY 2015/16 Budget
The FY 2015/16 approved budget for Laikipia County was Kshs.5.13 billion, with Kshs.2.86 billion (55.7 per cent) allocated for recurrent expenditure and Kshs.2.27 billion (44.3 per cent) for development expenditure.
In order to finance the budget, the County expected to receive Kshs.3.45 billion (67.3 per cent) as transfers from the National Government, collect Kshs.500.00 million (9.7per cent) from local sources, receive a conditional grant of Kshs.11.53 million (0.2 per cent) from DANIDA and additional conditional grants of Kshs.834.12 million (16.2 per cent) from the National Government as contained in CARA, 2015 for free maternal care, compensation for forgone user fees, leasing of medical equipment and Road Maintenance Fuel Levy Fund. However, Kshs.334.21 million

COUNTY GOVERNMENTS BUDGET IMPLEMENTATION REVIEW REPORT FIRST HALF FY, 2015/16 151
representing the opening cash balance from FY 2014/15 was not factored in the FY 2015/16 budget.
3.20.2 Revenue Analysis
In the first half of FY 2015/16, the County received Kshs.1.47 billion revenue from the National Government as direct transfer to the CRF account, received Kshs.2.01 million as conditional allocations for forgone user fees from the National Government, received Kshs.28.34 million as conditional allocations for free maternal health care, received Kshs.22.13 million as conditional allocations for Road Maintenance Levy Fund, raised Kshs.231.02 million from local sources, and had a cash balance of Kshs.334.21 million brought forward from FY 2014/15.
The quarterly trend in local revenue collection from the FY 2013/14 to the second quarter of FY 2015/16 is shown in figure 3.77.
Figure 3.77: Laikipia County, Trend in Local Revenue Collection by Quarter from the FY 2013/14 to the second quarter of FY 2015/16
53.2
168.29178.04
20406080
100120140160180
Ksh
s. M
illi
on
s
Reporting Period
Source: Laikipia County Treasury
The local revenue consisted of Kshs.136.77 million raised in the first quarter and Kshs.94.25 million in the second quarter. The local revenue raised in the first half of the FY 2015/16 was Kshs.231.02 million (46.2 per cent of the annual local revenue target), a significant improvement from Kshs.100.82 million collected in a similar period of FY 2014/15.
Analysis of local revenue realized by stream is shown in Table 3.39.

COUNTY GOVERNMENTS BUDGET IMPLEMENTATION REVIEW REPORT FIRST HALF FY, 2015/16152
Table 3.39: Laikipia County, Analysis of revenue collection by stream for the first half of FY 2015/16
No. Revenue Stream Annual Targeted Reve-nue (Kshs.)
Six Months Actual Rev-enue (Kshs.)
Revenue Performance (%)
A B C D=*100
1 Land Rates 110,500,000 50,192,860 45.4
2 Business Permits 95,400,000 10,277,787 10.8
3 Cess 59,670,000 9,765,312 16.4
4 Plot rent 17,500,000 14,830,518 84.7
5 Councils’ Natural Resources and Exploration 35,620,000 18,340,654 51.5
6 Market/Trade centre Fees 17,000,000 12,390,470 72.9
7 Vehicle Parking Fees 35,200,000 17,669,785 50.2
8 Housing and Social Premises use fees 26,100,000 5,894,585 22.6
9 Public health and Sanitation services fee 14,775,000 4,351,350 29.5
10 Technical Assistance fees 29,300,000 4,646,715 15.9
11 Other Local revenue Sources 58,935,000 6,229,620 10.6
12 Hospital Collections fees 0 76,428,839 0
TOTAL 500,000,000 231,018,495 46.2
Source: Laikipia County Treasury
A review of locally generated revenue collection by stream indicates that the Plot Rent generated the highest percentage of revenue against actual target at 84.7 per cent followed by Market/Trade Centre Fees at 72.9 per cent. Other Sources of revenue streams reported the lowest percentage of revenue performance against annual target at 10.6 per cent. The Hospital Collection Fees were not budgeted for by the County Government.
3.20.3 Banking of local revenue
A review of the bank statements for the revenue collection accounts indicate that all locally generated revenue was deposited into the CRF during the period under review. This conforms to Article 207 of the Constitution and Section 109 of the PFM Act 2012, which stipulates that all funds raised or received by or on behalf of the County Government, should be deposited into the CRF account, unless excluded by an Act of Parliament.
3.20.4 Exchequer Issues
During the period under review, the Controller of Budget authorized withdrawal of Kshs.1.74 billion from the CRF, which was 33.9 per cent of the approved budget. The amount represented a significant increase of 28.9per cent from Kshs.1.35 billion authorized in a similar period of FY 2014/15 and consisted of Kshs.1.23 billion (70.8 per cent) for recurrent expenditure and Kshs.507.92 million (29.2 per cent) for development activities.

COUNTY GOVERNMENTS BUDGET IMPLEMENTATION REVIEW REPORT FIRST HALF FY, 2015/16 153
3.20.5 Overall Expenditure Review
The County spent a total of Kshs.1.59 billion during the first half of FY 2015/16 which was 91.3 per cent of the funds released for both recurrent and development expenditure. This is a slight improvement from the Kshs.1.35 billion spent in a similar period of FY 2014/15. A total of Kshs.1.16 billion was spent on recurrent activities and Kshs.427.78 million on development activities. Recurrent expenditure was 94.2 per cent of the funds released for recurrent activities while development expenditure accounted for 84.2 per cent of the funds released for development activities. The expenditure excludes commitments as of 31st December, 2015 that amounted to Kshs.300.69 million for development and Kshs.16.91 million for recurrent expenditure.
Recurrent expenditure for the period under review represented 40.5 per cent of the approved annual recurrent budget, a decrease from 43.5 per cent spent in a similar period of FY 2014/15. On the other hand, development expenditure recorded an absorption rate of 18.8 per cent, a significant decrease from 29.1 per cent spent in a similar period of FY 2014/15. A comparison of the total expenditure in the first half of FY 2014/15 and the first half of FY 2015/16 is shown in Figure 3.78.
Figure 3.78: Laikipia County, Expenditure by Economic Classification for First Half of FY 2014/15 and First Half of FY 2015/16
869.20
192.20292.10
884.98
272.93
427.78
150.00250.00350.00450.00550.00650.00750.00850.00950.00
Personnel Emoluments Operation and Maintenance Development
Ksh
s.mill
ions
Expenditure by Economic Classification
1st Half of FY 2014/151st Half of FY 2015/16
Source: Laikipia County Treasury
3.20.6 Recurrent Expenditure Analysis
The total recurrent expenditure for the reporting period was Kshs.1.16 billion against an annual recurrent budget of Kshs.2.86 billion. This represents 40.5 per cent of the annual recurrent budget. The County spent Kshs.884.98 million (76.4 per cent) on personnel emoluments and Kshs.272.93 million (23.6 per cent) on operations and maintenance as shown in Figure 3.78. Expenditure on personnel emoluments accounted for 55.8 per cent of total expenditure and has increased marginally in the first half of FY 2015/16 as compared to a similar period of FY 2014/15 when the County spent Kshs.869.20 million. The increase is attributed to employment of the County Departmental directors and CEO’s in other County entities such as the Ward Development Fund, Enterprise Fund, County Development Authority and the Revenue Board among others.

COUNTY GOVERNMENTS BUDGET IMPLEMENTATION REVIEW REPORT FIRST HALF FY, 2015/16154
The County spent Kshs.17.20 million on sitting allowances to the 24 MCAs and the Speaker against an annual budget of Kshs.35.98 million. This is a significant increase from Kshs.4.84 million recorded in a similar period of FY 2014/15. The average monthly sitting allowance per MCA was Kshs.119, 447.00 compared to SRC’s recommended monthly ceiling of Kshs.124,800.
A breakdown of the operations and maintenance expenditure for the reporting period is shown in Figure 3.79.
Figure 3.79: Laikipia County, Operations and Maintenance Expenditure for the First Half of FY 2015/16
78.13
63.59
22.74 17.20 16.48 14.29 11.26 10.49 7.93 7.10 7.04 6.95 4.97 4.79
- 10 20 30 40 50 60 70 80 90
Oth
er O
pera
ting
Expe
nses
Dom
estic
& F
orei
gn T
rave
l and
Subs
iste
nce
Spec
ialis
ed M
ater
ials
and
Sup
plie
s
Sitti
ng A
llow
ance
s & o
ther
allo
wan
ces
Hos
pita
lity
Supp
lies a
nd S
ervi
ces
Fuel
Oil
and
Lubr
ican
ts
Util
ities
supp
lies &
serv
ices
Off
ice
and
Gen
eral
Sup
plie
s and
Serv
ices
Insu
ranc
e C
osts
Civ
il C
ontin
genc
y &
Bud
geta
ryre
serv
es
Prin
ting
, Adv
ertis
ing
and
Info
rmat
ion
Supp
lies a
nd S
ervi
ces
Rou
tine
Mai
nten
ance
- V
ehic
les
Rou
tine
Mai
nten
ance
- O
ther
Ass
ets
Com
mun
icat
ion,
Sup
plie
s and
Serv
ices
Ksh
s Mill
ions
Major Categories of O&M Expenditure
Source: Laikipia County Treasury
The aggregate expenditure on domestic and foreign travel was Kshs.63.59 million compared to Kshs.48.83 million incurred in a similar period of FY 2014/15, representing a significant increase of 30.2 per cent. This expenditure comprised of Kshs.41.56 million spent by the County Executive and Kshs.22.03 million by the County Assembly.
3.20.7 Development Expenditure Analysis
A summary of development expenditure during the first half of FY 2015/16 is provided in figure 3.80.

COUNTY GOVERNMENTS BUDGET IMPLEMENTATION REVIEW REPORT FIRST HALF FY, 2015/16 155
Figure 3.80: Laikipia County, Summary of Development Expenditure for the First Half of FY 2015/16
153.60
85.80
42.90 31.78 24.30 23.50 19.87 13.20 10.30 9.51 6.80 6.20 0.78 -
20 40 60 80
100 120 140 160 180
Othe
r dev
elopm
ent A
ctivi
ties
Cons
ructi
on o
f roa
ds
Impr
ovem
ent o
f wate
rsu
pplie
s
Insta
llatio
n of
Flo
od li
ghts
Impr
ovem
ent o
fed
ucati
on(C
lassro
oms)
Cons
ructi
on o
f cou
nty
build
ings
Othe
r Inf
rastr
uctu
re an
d Ci
vil
Wor
ks
Healt
h su
pplie
s and
Equi
pmen
t
Impr
ovem
et of
Mar
kets
Curre
nt G
rant
s to
SAGA
Cham
ber C
onfig
urati
on
Spec
ialise
d M
ateria
ls - O
ther
Labo
rato
ry m
ateria
ls, su
pplie
san
d sm
all eq
uipm
ent
Ksh
s. M
illio
ns
Major Categories of Development Expenditure
Source: Laikipia County Treasury
Analysis of the development expenditure of Kshs.427.78 million in the first half of FY 2015/16 indicates that the highest expenditure of Kshs.85.80 million was on construction of roads followed by Kshs.42.9 million on improvements of water supplies.
3.20.8 Annual Budget and Budget Performance Analysis by department for the First Half of FY 2015/16
A summary of the FY 2015/16 annual budget estimates and budget performance for the first half by department is shown in Table 3.40.
Table 3.40: Laikipia County, Annual Budget and First Half of FY 2015/16 Budget Performance by Department
Department Annual Budget Allo-cation (Kshs. Million)
6 months Exche-quer Issues (Kshs.
Million)
6 months Expen-diture (Kshs.
Million)
6 months expenditure to exchequer issues (%)
Absorption rate (%)
Rec Dev Rec Dev Rec Dev Rec Dev Rec Dev
Agriculture 17.17 104.06 8.59 10 7.76 0.78 90.3 7.8 45.2 0.7Education, Gender Sports Culture & Social Services 15.5 99.6 7.75 7.25 93.5 46.8 0.0
County Administration 2,181.34 283.78 875.22 845.71 96.6 38.8 0.0Public Works, Transport and Infrastructure 11.5 305.82 5.75 32.13 5.28 19.87 91.8 61.8 45.9 6.5Finance and Economic Plan-ning 82 864 36 386.24 33.62 385.02 93.4 99.7 41.0 44.6Trade, Industrialization, Cooperative Development and Tourism 10 68.7 5 10.5 4.63 5.78 92.6 55.0 46.3 8.4

COUNTY GOVERNMENTS BUDGET IMPLEMENTATION REVIEW REPORT FIRST HALF FY, 2015/16156
Department Annual Budget Allo-cation (Kshs. Million)
6 months Exche-quer Issues (Kshs.
Million)
6 months Expen-diture (Kshs.
Million)
6 months expenditure to exchequer issues (%)
Absorption rate (%)
Rec Dev Rec Dev Rec Dev Rec Dev Rec Dev
Health 151 391.11 97.89 59.05 84.01 9.51 85.8 16.1 55.6 2.4Water, Environment, Forestry & Natural Resources 10.24 122 5.12 3.93 76.8 38.4 0.0County Assembly 380.56 31 188 10 165.72 6.81 88.1 68.1 43.5 22.0
Total 2,859.31 2,270.07 1,229.32 507.92 1,157.91 427.77 94.2 84.2 40.5 18.8
Source: Laikipia County Treasury
A breakdown of budget performance by department shows that the Department of Finance and Economic Planning reported the highest absorption rate of its development budget at 44.6 per cent while the Department of Education, Gender Sports and Culture; County Administration, and Water, Environment Forestry and Natural Resources did not incur any expenditure. On the other hand, the Department of Health had the highest percentage of its recurrent expenditure to its recurrent budget at 55.6 per cent while the Department of Water, Environment, Forestry and Natural Resources had the lowest percentage at 38.4 per cent.
3.20.9 Borrowing by the County Government
Article 212 of the Constitution requires a county government to borrow with approval from the County Assembly, and only if the national government guarantees the loan. Further, Section 58 of the PFM Act 2012 gives the Cabinet Secretary to the National Treasury the powers to guarantee loans subject to approval by Parliament. During the period under review, the County utilized its equitable share and local revenue collection deposited into the County Revenue Fund account maintained at the Central Bank of Kenya and did not borrow any funds.
3.20.10 Observations and Recommendations
The County has made progress in addressing the challenges previously identified as affecting budget implementation. The County has:
i. Initiated monitoring of the budget implementation at vote level, thus ensuring that Departmental expenditure is within approved estimates.
ii. Improved its local revenue collection from Kshs.100.82 million in the first half of FY 2014/15 to Kshs.231.02 million in the reporting period.
Despite the progress made, the following challenges continued to hamper effective budget implementation;
1. Delayed disbursement of funds by the National Treasury which affected budget implementation.
2. Lack of Internal Audit Committee contrary to Section 155(5) of the PFM Act, 2012.

COUNTY GOVERNMENTS BUDGET IMPLEMENTATION REVIEW REPORT FIRST HALF FY, 2015/16 157
3. Late submission of expenditure returns to OCOB leading to delays in preparation of statutory reports on budget implementation.
The County should implement the following recommendations in order to improve budget execution
1. The County Treasury should liaise with National Treasury to ensure timely transfer of funds to the CRF account in line with the approved disbursement schedule to facilitate smooth budget implementation.
2. Establish an Internal Audit Committee as per section 155(5) of the PFM Act 2012 to enhance oversight in financial management.
3. The County Treasury should ensure timely submission of expenditure reports in line with Section 166 of the PFM Act 2012, to facilitate timely reporting on budget implementation.
3.21 Lamu County
3.21.1 Overview of the FY 2015/16 Budget
The FY 2015/16 Approved Supplementary Budget for Lamu County was Kshs.3.08 billion. It comprised Kshs.1.76 billion (57.0 per cent) for recurrent expenditure and Kshs.1.32 billion (43.0 per cent) for development expenditure.
In order to finance the budget, the County expects to receive Kshs.2.05 billion (66.6 per cent) as transfers from the National Government, collect Kshs.107 million (3.5 per cent) from local sources, Kshs.826.60 million (26.9 per cent) as projected cash balance from FY 2014/15, receive a conditional grant of Kshs.7.64 million (0.3 per cent) from DANIDA, Other conditional grants include; Compensation of forgone user fees of Kshs.2.37 million (0.08 per cent), World bank grant of Kshs.14.91 million (0.5 per cent), Kshs.16.76 million (0.5 per cent) for Maternal health care and road maintenance fuel levy fund of Kshs.26.07 million (0.8 per cent).
3.21.2 Revenue Analysis
In the first half of FY 2015/16, the County received Kshs.687.38 million revenue from the National Government as equitable share, Kshs.13.16 million as conditional allocations from the Road Maintenance Fuel Levy Fund, received Kshs.6.57 million as conditional allocations for free maternal health care, Kshs.0.58 million as conditional allocations for forgone user fees, raised Kshs.20.62 million from local sources, and a cash balance of Kshs.828.60 million brought forward from FY 2014/15.
The quarterly trend in local revenue collection from first quarter of the FY 2013/14 to the second quarter of FY 2015/16 is shown in figure 3.81.

COUNTY GOVERNMENTS BUDGET IMPLEMENTATION REVIEW REPORT FIRST HALF FY, 2015/16158
Figure 3.81: Lamu County, Trend in Local Revenue Collection by Quarter from the FY 2013/14 to the second quarter of FY 2015/16
28.82
12.93
-
5.00
10.00
15.00
20.00
25.00
30.00
35.00
Ksh
s.mill
ion
Reporting period
Source: Lamu County Treasury
The local revenue consisted of Kshs.7.70 million raised in the first quarter and Kshs.12.93 million in the second quarter. The local revenue raised in the first half of the FY 2015/16 was Kshs.20.62 million (17.6per cent of the annual local revenue target), an improvement from Kshs.14.75 million collected in a similar period of FY 2014/15.
The analysis of local revenue by stream for the first half of FY 2015/16 is shown in Table 3.41.
Table 3.41: Lamu County, Analysis of revenue collection by stream for the first half of FY2015/16
No. Revenue Stream Annual Targeted Revenue (Kshs.)
Six Months Actual Revenue (Kshs.)
Revenue Per-formance (%)
A B C D=*100
1 M.ATDC/AMS(Agriculture department) - 6,958,385 -
2 Single Business Permit 20,400,000 2,267,520 11.1
3 Donations for cultural festivals 10,000,000 2,000,000 20
4 Property rates 51,000,000 1,812,032 3.6
5 Cess collection 5,160,000 1,736,047 33.6
6 Public Health, Medical Levies and Hospital fees 15,200,000 1,407,235 9.3
7 Market fees 5,257,600 1,193,920 22.7
8 Local quarry 1,000,000 841,214 84.1
9 Building & plan approval fees 480,000 564,316 117.6
10 Fisheries 600,000 300,450 50.1
11 Other revenue streams 7,902,400 1,542,935 19.5
TOTAL 117,000,000 20,624,054 17.6
Source: Lamu County Treasury

COUNTY GOVERNMENTS BUDGET IMPLEMENTATION REVIEW REPORT FIRST HALF FY, 2015/16 159
The analysis of revenue by stream indicates that building and plan approval fees generated the highest percentage of revenue against annual target at 117.6 per cent. In absolute terms, the M.ATDC/AMS revenue stream under the Department of Agricultural generated the highest revenue at Kshs.6.96 million followed by single business permit at Kshs.2.27 million.
3.21.3 Banking of local revenue
A review of the bank statements for the revenue collection account indicates that all locally generated revenue was deposited into the CRF account during the period under review. This conforms to Article 207 of the Constitution and Section 109 of the PFM Act 2012, which stipulates that all funds raised or received by or on behalf of the County Government, shall be deposited into the CRF account, unless excluded by an Act of Parliament.
3.21.4 Exchequer Issues
During the period under review, the Controller of Budget authorized withdrawal of Kshs.1.11 billion from the CRF, which was 36.0 per cent of the approved budget. The amount represented a decline of 3.5 per cent from Kshs.1.15 billion authorized in a similar period of FY 2014/15 and consisted of Kshs.772.60 million (69.7 per cent) for recurrent expenditure and Kshs.336.50 million (30.3 per cent) for development activities.
3.21.5 Overall Expenditure Review
The County spent a total of Kshs.704.35 million during the first half of FY 2015/16 which was 63.5 per cent of the funds released for both recurrent and development expenditure. This is significant increase from the Kshs.479.94 million spent in a similar period of FY 2014/15. A total of Kshs.498.35 million was spent on recurrent activities and Kshs.206.00 million on development activities. Recurrent expenditure was 64.5 per cent of the funds released for recurrent activities while development expenditure accounted for 61.2 per cent of the funds released for development activities. The expenditure excludes commitments as of 31st December, 2015 that amounted to Kshs.88.31 million for development and Kshs.40.72 million for recurrent expenditure.
Recurrent expenditure for the period under review represented 28.4 per cent of the approved annual recurrent budget, a decrease from 30.8 per cent spent in a similar period of FY 2014/15. On the hand, development expenditure recorded an absorption rate of 15.6 per cent, an improvement from 13.5 per cent spent in a similar period of FY 2014/15. A comparison of the total expenditure between the first half of FY 2014/15 and the first half of FY 2015/16 is shown in Figure 3.82.

COUNTY GOVERNMENTS BUDGET IMPLEMENTATION REVIEW REPORT FIRST HALF FY, 2015/16160
Figure 3.82: Lamu County, Expenditure by Economic Classification for First Half of FY 2014/15 and First Half of FY 2015/16
274.8
108.1 96.6
349.13
149.22
206.00
0
50
100
150
200
250
300
350
400
Personnel Emoluments Operations & Maintenance Development
Ksh
s. M
illi
ons
Expenditure by Economic Classification
1st Half, FY 2014/15
1st Half, FY 2015/16
Source: Lamu County Treasury
3.21.6 Recurrent Expenditure Analysis
The total recurrent expenditure for the reporting period was Kshs.498.35 million against an annual budget of Kshs.1.76 billion. This represents 28.4 per cent of the annual recurrent budget. The County spent Kshs.349.13 million (70.1 per cent) on personnel emoluments and Kshs.149.22 million (29.9 per cent) on operations and maintenance as shown in Figure 3.82. Expenditure on personnel emoluments accounted for 49.6 per cent of total expenditure and has increased significantly in the first half of FY 2015/16 as compared to a similar period of FY 2014/15 when the County spent Kshs.274.84 million. The increase is attributed to employment of more staff by the County government.
The County spent Kshs.10.62 million on sitting allowances to the 20 MCAs and the Speaker against a budget of Kshs.37.10 million. This is a marginal decrease from Kshs.10.90 million recorded in a similar period of FY 2014/15. The average monthly sitting allowance per MCA was Kshs.84, 392 compared to SRCs recommended monthly ceiling of Kshs.124, 800.
A breakdown of the operations and maintenance expenditure for the reporting period is shown in Figure 3.83.

COUNTY GOVERNMENTS BUDGET IMPLEMENTATION REVIEW REPORT FIRST HALF FY, 2015/16 161
Figure 3.83: Lamu County, Operations and Maintenance Expenditure for the First Half of FY 2015/16
34.49
15.14 12.73 11.43 9.81 9.13 8.33 8.26 8.14 6.49 4.85 4.74 4.69 4.36 4.10 2.54
- 5.00
10.00 15.00 20.00 25.00 30.00 35.00 40.00
Dome
stic t
ravel
Chem
icals
and…
Resid
entia
l buil
dings
…
Othe
rs
Train
ing
Refin
ed fu
el,oil
and…
Cater
ing
Main
tenan
ce E
xpen
ses
Forei
gn T
ravel
Rent
and R
ates
Comm
unica
tion
Utilit
ies
Publi
shing
and p
rintin
g
Purch
ase of
offic
e…
Gene
ral O
ffice
Supp
lies
Drou
ght…
Kshs
.milli
on
Major categories of O &M Expenditure
Source: Lamu County Treasury
The aggregate expenditure on domestic and foreign travel was Kshs.42.64 million compared to Kshs.19.80 million incurred in a similar period of FY 2014/15, representing an increase of 115.4 per cent. This expenditure comprised of Kshs.37.62 million spent by the County Executive and Kshs.5.02 million by the County Assembly.
3.21.7 Development Expenditure Analysis
Details of development expenditure during the first quarter of FY 2015/16 are provided in figure 3.84.
Figure 3.84: Lamu County, Summary of Development Expenditure for the First Half of FY 2015/16
111.49
22.55 12.19 11.01 10.88 10.06 6.78 6.10 5.00 1.78
0
20
40
60
80
100
120
Cons
tructi
on of
Non
Res
identi
al
Build
ings
Othe
r Inf
rastru
cture
and C
ivil W
orks
Reha
bilita
tion a
nd R
enov
ation
Overh
aul o
f Othe
r Inf
rastru
cture
and
civil
work
s
Purch
ase o
f ligh
ting e
quipm
ents
Refu
rbish
ment
of no
n res
identi
al
Build
ings
Cons
tructi
on of
road
s
Drou
ght C
ontig
ency
Othe
r cur
rent tr
ansfe
rs
Purch
ase o
f edu
catio
nal a
ids an
d
relate
d equ
ipmen
ts
Kshs
.mill
ion
Major Categories of Development Expenditure
Source: Lamu County Treasury

COUNTY GOVERNMENTS BUDGET IMPLEMENTATION REVIEW REPORT FIRST HALF FY, 2015/16162
Analysis of the development expenditure of Kshs.206.00 million incurred in the first half of FY 2015/16 indicates that the Health and Sanitation Department reported the highest expenditure at Kshs.34.94 million on refurbishment/construction of non-residential buildings and other infrastructure and civil works. A perimeter wall at the King Fahad Hospital was constructed. There is an ongoing renovation of King Fahad Hospital and four other health facilities namely Pate, Siyu, Witu and Kiunga, and construction of Mpeketoni Mortuary. The second highest expenditure at Kshs.31.18 million was incurred by the Department of Land, Physical Planning, Urban Development, Infrastructure, Water and Natural Resources on purchase of lighting equipment’s, construction of roads, rehabilitation and renovation and other current transfers. Seventy five pieces of solar street lights were installed and commissioned within Lamu County; Cabro paving of Riyadh Mosque and maintenance of roadworks in Mpeketoni.
3.21.8 Annual Budget and Budget Performance Analysis by department for the First Half of FY 2015/16
A summary of the FY 2015/16 annual budget estimates and budget performance for the first half by department is shown in Table 3.42.
Table 3.42: Lamu County, Annual Budget and First Half of FY 2015/16 Budget Performance by Department
Department Annual Budget Alloca-tion (Kshs. Million)
6 months Exche-quer Issues (Kshs.
Million)
6 months Expen-diture (Kshs.
Million)
6 months Expendi-ture to Exchequer
Issues (% )
Absorption rate %
Rec Dev Rec Dev Rec Dev Rec Dev Rec Dev
County Assembly Services
404.78 105.92
192.07
- 68.77
1.74 35.8 - 17.0 1.6
County Executive Service
376.58 195.08
150.78 39.00
105.44
90.12 69.9 231.1 28.0 46.2
Finance & Economic Planning
97.84 26.33
27.07
15.00
31.38
6.10 115.9 40.7 32.1 23.2
County Public Service Board
45.06 -
22.18 -
16.36
- 73.8 - 36.3 -
Agriculture and Irrigation 67.73 54.56
27.11
24.20
20.43
0.74 75.4 3.1 30.2 1.4
Land, Physical Planning, Infrastructure, Water, Urban Development and Natural Resources
53.01 298.41
22.47
91.45
17.57
31.18 78.2 34.1 33.1 10.4
Education, Gender, Sports, Youth & Social services
54.48 234.40
22.11
49.60
17.54
27.22 79.3 54.9 32.2 11.6
Health & Sanitation
522.49 266.56
250.98 69.60
178.24
34.94 71.0 50.2 34.1 13.1
Trade, Culture, Tourism& Investment development
35.67 47.23
8.95
17.50
4.78
2.72 53.4 15.5 13.4 5.8
Fisheries, Livestock, Veterinary & Co-operative Development
68.67 78.78
33.73
26.90
27.45
10.02 81.4 37.2 40.0 12.7
ICT & E-Government and Public Participation
30.78 15.83
15.16
3.25
10.38
1.22 68.5 37.5 33.7 7.7
TOTAL
1,757.09 1,323.10
772.61
336.50
498.34
206.00 64.5 61.2 28.4 15.6
Source: Lamu County Treasury

COUNTY GOVERNMENTS BUDGET IMPLEMENTATION REVIEW REPORT FIRST HALF FY, 2015/16 163
Analysis of budget performance by department shows that the Department of County Executive reported the highest absorption rate of its development budget at 46.2 per cent while the Department of Agriculture and Irrigation registered the lowest absorption rate at 1.36 per cent during the reporting period under review. On the other hand, the Fisheries, Livestock, and Co-operative Development Department had the highest percentage for recurrent expenditure at 40.0 per cent while the Department of Trade, Culture, Tourism and Investment Development Department had the lowest percentage at 13.4 per cent.
3.21.9 Borrowing by the County Government
Article 212 of the Constitution requires a county government to borrow with approval from the County Assembly, and only if the national government guarantees the loan. Further, Section 58 of the PFM Act 2012, gives the Cabinet Secretary to the National Treasury the powers to guarantee loans subject to approval by Parliament. During the period under review, the County utilized its equitable share and local revenue collection deposited into County Revenue Fund account maintained at the Central Bank of Kenya and did not borrow any funds.
3.21.10 Observations and Recommendations
The County has made progress in addressing the challenges previously identified as affecting budget implementation. The County has:
i. Registered improvement in local revenue collection from Kshs.14.75 million during the first half of FY 2014/15 to Kshs.20.62 million in the first half of FY 2015/16.
ii. Fully adopted use of IFMIS in processsing financial transactions.
iii. Improved staff capacity through recruitment and training.
Despite the progress made, the following challenges continue to hamper effective budget implementation;
1. Inconsistencies between the IFMIS generated report on development expenditure of Kshs.206.00 million and the actual development projects reported separately by the County Treasury that amounted to Kshs.169.11 million. This indicated staff capacity challenges in the use of IFMIS.
2. Lack of Internal Audit Committee contrary to Section 155(5) of the PFMA, 2012.
3. Failure to institute monitoring and evaluation teams to oversee implementation of development projects.
4. Delay in disbursement of funds by the National Treasury.
The County should implement the following recommendations in order to improve budget execution
1. The County Treasury should liaise with the IFMIS Directorate to build staff capacity in operating

COUNTY GOVERNMENTS BUDGET IMPLEMENTATION REVIEW REPORT FIRST HALF FY, 2015/16164
the accounting system. Further, regular reconciliations of IFMIS data should be undertaken.
2. The County should establish an Internal Audit Committee as per section 155(5) of the PFM Act 2012, to enhance oversight in public financial management.
3. The County should establish a monitoring and evaluation unit to oversee implementation of development project.
4. The County Treasury should liaise with the National Treasury to ensure disbursement of the equitable share to the County Revenue Fund is done in line with the approved disbursement schedule.
3.22 Machakos County3.22.1 Overview of the Budget
The FY 2015/16 approved budget for Machakos County was Kshs.10.94 billion. It comprised Kshs.5.25 billion (48 per cent) for recurrent expenditure and Kshs.5.69 billion (52 per cent) for development expenditure.
In order to finance the budget, the County expects to receive Kshs.6.77 billion (61.9 per cent) as transfers from the National Government, conditional grant in support of water programme of Kshs.1.26 billion (11.5 per cent), Level 5 Hospital allocation of Kshs.304.3 million (2.8 per cent), conditional grant from DANIDA of Kshs.26.7 million (0.3 per cent), raise Kshs.2.37 billion (21.6 per cent) from local sources, and other conditional grants from the National Government of Kshs.208.7 million (1.9 per cent). However, the County did not budget for the opening cash balance of Kshs.538 million from FY 2014/15 and Kshs.180 million as conditional allocation (other loans and grants) from Development Partners as contained in CARA, 2015.
3.22.2 Revenue Analysis
In the first half of FY 2015/16, the County received Kshs.3.42 billion from the National Government as equitable, Kshs.155.21 million as conditional allocations for Machakos Level 5 Hospital, Kshs.43.42 million as conditional allocations from the road maintenance fuel levy fund, received Kshs.41.45 million as conditional allocations for free maternal health care, Kshs.6.16 million as conditional allocations for forgone user fees, raised Kshs.395.56 million from local sources, and had Kshs.538.12 million as cash balance brought forward from FY 2014/15.
The quarterly trend in local revenue collection from the FY 2013/14 to the second quarter of FY 2015/16 is shown in figure 3.85.

COUNTY GOVERNMENTS BUDGET IMPLEMENTATION REVIEW REPORT FIRST HALF FY, 2015/16 165
Figure 3.85: Machakos County, Trend in Local Revenue Collection by Quarter from FY 2013/14 to the second quarter of FY 2015/16.
454.00
309.00353.46
261.00
441.35
176.07
100
150
200
250
300
350
400
450
500
Kshs
. mill
ion
Reporting period
Source: Machakos County Treasury
The local revenue consisted of Kshs.219.48 million raised in the first quarter and Kshs.176.07 million in the second quarter. The local revenue raised in the first half of FY 2015/16 was Kshs.398.28 million (16.7 per cent of the annual local revenue target), a decline from Kshs.614.0 million collected in a similar period of FY 2014/15.
The analysis of local revenue by stream is shown in Table 3.43.
Table 3.43: Machakos County, Analysis of revenue collection by stream for the first half of FY 2015/16
No. Revenue Streams Annual Targeted Reve-nue (Kshs.)
Six Months Actual Revenue (Kshs.)
Revenue Perfor-mance (%)
A B C D=*1001 Cess Receipts 51,881,288 2,345,920 4.52 Property Rates - Local Authority Revenue 389,415,731 122,369,973 31.43 Liquor Licenses 107,739,304 21,826,670 20.34 Royalties on Extraction of Minerals 244,173,538 75,092,338 30.85 Receipts from Royalties Other (Sand Harvesting) 335,643,994 42,258,782 12.66 House Rents -Local Authority Revenue 33,511,236 1,208,471 3.67 Rents - Other (Budget) 202,732 6,103,450 3010.68 Receipts from Administrative Fees and Charges 321,850,218 8,550,355 2.79 Game Park Fees - Local Authority Revenue 8,197,272 1,776,360 21.710 Single Business Licenses - Local Authority 282,239,362 37,627,243 13.3
11 Water And Sewerage Rates – Local Authority Revenue 1,387,064 376,035 27.1
12 Parking Fees - Local Authority Revenue 132,768,350 47,264,043 35.613 Market Fees-Local Authority Revenue 78,923,070 20,446,942 25.914 Sale Of Tender Documents 3,270,310 443,000 13.5
15 Receipts From Fines, Penalties, Forfeitures and other Charges 8,277,913 861,089 10.4
16 Sundry Revenues 6,539,868 6,651,723 101.717 Miscellaneous Receipts 2,124,402 2,260,716 106.418 Other stream revenue 363,487,926 9,367,269 2.6
TOTAL 2,371,633,578 398,280,024 16.7
Source: Machakos County Treasury

COUNTY GOVERNMENTS BUDGET IMPLEMENTATION REVIEW REPORT FIRST HALF FY, 2015/16166
A review of locally generated revenue collection by stream indicates that rents-others generated the highest percentage of revenue against actual target at 3,010.6 per cent followed by miscellaneous receipts at 106.4 per cent. Receipts from Administrative Fees and Charges recorded the lowest percentage of revenue against actual target at 2.7 per cent.
The office observed that while Kshs.395.56 million was deposited into the county revenue collection account during the reporting period, the analysis of revenue by stream indicates that a total of Kshs.398.28 million was realized. There is therefore, need to reconcile the two amounts.
3.22.3 Banking of Local Revenue
A review of the bank statements for the revenue collection account indicates that all locally generated revenue was deposited into the CRF during the period under review. This conforms to Article 207 of the Constitution and Section 109 of the PFM Act 2012, which stipulates that all funds raised or received by or on behalf of the County Government should be deposited into the CRF account, unless excluded by an Act of Parliament.
3.22.4 Exchequer Issues
During the period under review the Controller of Budget approved withdrawal of Kshs.4.50 billion from the CRF by Controller of budget, which was 41.1 per cent of the approved annual budget. The amount represented a significant increase of 55.2 per cent from Kshs.2.90 billion authorised in a similar period of FY2014/15 and consisted of Kshs.3.40 billion (75.6 per cent) for recurrent expenditure and Kshs.1.10 billion (24.4 per cent) for development activities.
3.22.5 Overall Expenditure Review
The County spent a total of Kshs.3.68 billion during the first half of FY 2015/16 which was 83.1 per cent of the funds released for both recurrent and development expenditure. This is an improvement from Kshs.3.08 billion spent in the similar period of FY 2014/15. A total of Kshs.2.90 billion (78.9 per cent) was spent on recurrent activities and Kshs.778.7 million (21.1 per cent) was spent on development activities. The recurrent expenditure was 85.3 per cent of the funds released for recurrent activities while development expenditure accounted for 71.1 per cent of the funds released for development activities. This expenditure does not include outstanding commitments as at 31st December, 2015 which was not provided by the County.
Recurrent expenditure for the period under review represented 55.3 per cent of the approved annual recurrent budget, an improvement from 48.0 per cent realized in the first half of FY 2014/15. On the other hand, development expenditure recorded an absorption rate of 13.7 per cent, a decrease from 18.1 per cent realized in a similar period of FY 2014/15. A comparison of the total expenditure between the first half of FY 2014/15 and first half of FY 2015/16 is shown in Figure 3.86.

COUNTY GOVERNMENTS BUDGET IMPLEMENTATION REVIEW REPORT FIRST HALF FY, 2015/16 167
Figure 3.86: Machakos County, Expenditure by Economic Classification for first half, FY 2014/15 and FY 2015/16
1,812.66
546.39719.90
2,012.79
893.30 778.70
0.00
500.00
1,000.00
1,500.00
2,000.00
2,500.00
Personnel Emoluments Operation and Maintenance Development
Ksh
s.mill
ions
Expenditure by Economic Classification
1st Half of FY 2014/151st Half of FY 2015/16
Source: Machakos County Treasury
3.22.6 Recurrent Expenditure Analysis
The total recurrent expenditure for the reporting period was Kshs.2.90 billion against an annual recurrent budget of Kshs.5.25 billion. This represents 55.2 per cent of the annual recurrent budget. The County spent Kshs.2.01 billion (69.3 per cent) on personnel emoluments and Kshs.893.30 million (30.7 per cent) on operations and maintenance as shown in Figure 3.86. Expenditure on personnel emoluments accounted for 54.7 per cent of total expenditure and has increased significantly in the first half of FY 2015/16 as compared to a similar period of FY 2014/15 when the County spent Kshs.1.81 billion.
The County spent Kshs.30.20 million on payment of sitting allowances to the 60 MCAs including the Speaker against the annual budget of Kshs.75.0 million. This is a marginal decline from the Kshs.31.75 million spent in a similar period of FY 2014/15. The average monthly allowance per MCA was Kshs.85,306 compared to the SRC’s recommended amount of Kshs.124, 800.
A breakdown of operations and maintenance expenditure for the first half of FY 2015/16 is shown in Figure 3.87.
Figure 3.87: Machakos County, Operations and Maintenance Expenditure for the first half, FY 2015/16
220.26184.54
149.92
106.46
41.35 38.85 32.36 30.01 29.19 19.30 14.19 12.22 5.60 3.93 3.82 1.300
50
100
150
200
250
Med
ical d
rugs
& ot
her
Non-
pharm
aceu
ticals
Othe
r ope
rating
costs
Dom
estic
& Fo
reign
trave
l
Curre
nt tra
nsfer
s
Utili
ties
ing &
Adv
ertisi
ng
Insu
rance
Fuel,
oil &
lubr
icants
Contr
actua
lPr
ofes
siona
l/Leg
al…
Hosp
italit
y &Co
nfere
nces
Train
ing
Gene
ral su
pplie
s
Comm
unica
tion
serv
ices/s
uppli
es
M&E
- Pu
blic
Parti
cipati
on…
Routi
ne m
ainten
ance
Rent
& Ra
tes -
Non-
reside
ntials
Kshs
.mill
ion
Major categories of O & M Expenditure
Source: Machakos County Treasury

COUNTY GOVERNMENTS BUDGET IMPLEMENTATION REVIEW REPORT FIRST HALF FY, 2015/16168
The total expenditure on domestic and foreign travel in the first half of FY 2015/16 was Kshs.148.62 million compared to Kshs.129.08 million incurred in a similar period of FY 2014/15, representing an increase of 15.1 per cent. This expenditure comprised of Kshs.49.62 million by the County Executive and Kshs.99.0 million by the County Assembly.
3.22.7 Development Expenditure Analysis
A summary of development expenditure during the first half period of FY 2015/16 is provided in figure 3.88.
Figure 3.88: Machakos County, Summary of Development Expenditure for the first half, FY 2015/16
321.64
166.51
69.27 60.87 56.56 40.58 27.54 14.34 10.97 10.40 -
50.00
100.00
150.00
200.00
250.00
300.00
350.00
Cons
tructi
on of
Bui
lding
s
Cons
tructi
on &
grad
ing o
f roa
ds
Purc
hase
of sp
ecial
ised p
lant &
mac
hine
ry
Fuel
& L
ubric
ants
Cons
tructi
on an
d Civi
l wor
ks
Othe
r dev
elopm
ent a
ctivi
ties
Refu
rbish
men
t of B
uildi
ngs
Offic
e fur
nitur
es &
Equ
ipm
ent
Mot
or ve
hicle
purc
hase
s
Capi
tal gr
ants
Ksh
s. M
ilion
s
Major Categories of Development Expenditure
Source: Machakos County Treasury
Analysis of the development expenditure of Kshs.778.7 million incurred in the first half of FY 2015/2016 shows that the County spent Kshs.321.64 million on construction of buildings; Kshs.166.5 million on construction and grading of access roads; Kshs.69.27 million on purchase of specialized plant, machinery and equipment; Kshs.60.87 million on fuel and lubricants; Kshs.56.56 million on construction and civil works; Kshs.17.10 million on overhaul and refurbishment of buildings; Kshs.10.4 million on Capital grants; and Kshs.14.34 million on purchase of office furniture and equipment.
3.22.8 Annual Budget and Budget Performance Analysis by department for the First Half of FY 2015/16
A summary of the FY 2015/16 annual budget estimates and budget performance for the first half by department is as shown in Table 3.44.

COUNTY GOVERNMENTS BUDGET IMPLEMENTATION REVIEW REPORT FIRST HALF FY, 2015/16 169
Table 3.44: Machakos County, FY 2015/16 Annual Budget and First Quarter, FY 2015/16 budget performance by Department
Department Annual Budget Alloca-tion (Kshs. Millions)
6-Months Exchequer Issues (Kshs. Millions)
6-Months Expendi-ture (Kshs. Millions)
6-Months Expenditure to Exchequer
Issues
Absorption Rate (%)
Rec. Dev. Rec Dev. Rec Dev Rec. Dev. Rec. Dev.
County Executive 431.32 51.00 277.67 24.38 278.31 14.15 100.2 58.0 64.5 27.7
PS, Labor & ICT 254.23 330.94 170.87 52.70 47.30 42.70 27.7 81.0 18.6 12.9
Trade, Investment & Eco. Planning 56.78 336.96 39.42 112.65 22.64 39.95 57.4 35.5 39.9 11.9
Finance & Revenue 331.94 851.02 151.79 26.34 143.49 0.20 94.5 0.8 43.2 -
Decentralized Units, County Admin.
559.95 82.20 390.41 28.25 343.16 28.84 87.9 102.1 61.3 35.1
Agri., Lands & Livestock 341.82 175.78 238.28 64.36 211.81 19.17 88.9 29.8 62.0 10.9
Health, Environ-ment & Emergency 1,947.06 267.70 1,283.50 108.99 1,225.64 66.40 95.5 60.9 62.9 24.8
Transport, Roads & Housing 262.27 665.52 183.30 275.80 117.10 260.13 63.9 94.3 44.6 39.1
Education, Youth & Social 186.51 54.82 129.59 14.70 58.10 11.52 44.8 78.4 31.2 21.0
Water & Irrigation 92.46 2,405.74 64.50 261.10 66.99 266.56 103.9 102.1 72.5 11.1
Tourism, Sports and Culture 90.13 290.14 62.86 56.50 68.38 18.42 108.8 32.6 75.9 6.3
County Public Service Board 65.75 14.27 45.55 7.80 21.02 - 46.1 - 32.0 -
County Assembly 630.23 168.00 369.85 61.50 302.12 10.56 81.7 17.2 47.9 6.3
TOTAL 5,250.45 5,694.09 3,407.59 1,095.07 2,906.06 778.60 85.3 71.1 55.3 13.7
Source: Machakos County Treasury
Analysis of budget performance by department shows that the Department of Transport, Roads and Housing reported the highest absorption rate of its development budget at 39.1 per cent while the Department of Finance and Revenue, and the County Public Service Board did not incur any development expenditure. On the other hand, the Department of Tourism, Sports and Culture had the highest percentage of its recurrent expenditure to its recurrent budget at 75.9 per cent while the Department of Public Service, Labour and ICT had the lowest percentage at 18.6 per cent.
3.22.9 Borrowing by the County Government
During the period under review, the County accessed a bank overdraft facility of Kshs.170.0 million. While this borrowing was approved by the County Assembly, it was not guaranteed by the National Government. Article 212 of the Constitution requires a county government to borrow with approval from the County Assembly, and only if the national government guarantees the loan.

COUNTY GOVERNMENTS BUDGET IMPLEMENTATION REVIEW REPORT FIRST HALF FY, 2015/16170
3.22.10 Observations and Recommendations
The County has made progress in addressing some of the challenges previously identified as affected budget implementation. The County has;
i. Embraced use of IFMIS in processing financial transactions.
ii. Build staff capacity through training.
The challenges that continued to hamper effective budget implementation in were;
1. Underperformance of local revenue collection, which stood at Kshs.398.28 million (16.7 per cent of the annual target) and was a decline from Kshs.614 million generated in a similar period of FY 2014/15. Underperformance of local revenue implies that some budgeted activities may not be implemented due to inadequate funding.
2. An increasing wage bill due to continuous staff recruitment which may result in unsustainable salary costs.
3. Lack of Internal Audit Committee contrary to Section 155(5) of the PFMA, 2012.
4. The County did not budget for the opening cash balance amounting to Kshs.538 million from FY 2014/15 and Kshs.180 million as conditional allocation from National Government and Development Partners as contained in CARA, 2015
The County should implement the following recommendation in order to improve budget execution:
1. The County should devise workable strategies to improve revenue collection.
2. The County should urgently liaise with the National Government to address the huge wage bill.
3. The County Treasury should establish an Internal Audit Committee in line with Section 155(5) of the PFM Act 2012. This will improve oversight in public financial management.
4. The County Treasury should prepare a Supplementary Budget that includes the opening cash balance amounting to Kshs.538 million from FY 2014/15 and Kshs.180 million as conditional allocation from National Government and Development Partners as contained in CARA, 2015 for approval by the County Assembly.
3.23 Makueni County
3.23.1 Overview of the FY 2015/16 Budget
The FY 2015/16 approved budget for Makueni County was Kshs.9.44 billion. This comprised of Kshs.4.47 billion (47.4 per cent) for recurrent expenditure and Kshs.4.97 billion (52.6 per cent) for development expenditure.
In order to finance this budget, the County expects to receive Kshs.5.96 billion (63 per cent) as

COUNTY GOVERNMENTS BUDGET IMPLEMENTATION REVIEW REPORT FIRST HALF FY, 2015/16 171
transfers from the National Government, collect Kshs.400 million (4.2 per cent) from local sources, and a conditional grant of Kshs.24.13 million (0.3 per cent) from DANIDA. The County also expected to receive additional conditional grant of Kshs.20.61 million (0.2 per cent) as compensation for forgone user fees, Kshs.75.83 million (0.8 per cent) from the road maintenance fuel levy fund, Kshs.80.80 million (0.9 per cent) for free maternal health care, Kshs.95.74 million (1 per cent) for leasing of medical equipment, Kshs.220.0 million (2.3 per cent) as conditional allocation for other loans/grants, Kshs.51.02 million (0.5 per cent) as World bank funding for rural health, Kshs.89.08 million as FIF for Hospitals (0.9 per cent) and Kshs.2.42 billion (25.6 per cent) as balance brought forward from FY 2014/15.
3.23.2 Revenue Analysis
During the first half of FY 2015/16, the County received Kshs.2.00 billion revenue from the National Government as equitable share, Kshs.38.30 million as conditional allocations from the road maintenance fuel levy fund, Kshs.31.03 million as conditional allocations for free maternal health care, Kshs.5.84 million as conditional allocations for forgone user fees, raised Kshs.87.25 million from local sources, and a cash balance of Kshs.2.42 billion brought forward from FY 2014/15.
The quarterly trend in local revenue collection from the first quarter of the FY 2013/14 to the second quarter of FY 2015/16 is shown in figure 3.89.
Figure 3.89: Makueni County, Trend in Local Revenue Collection by Quarter from the FY 2013/14 to the second quarter of FY 2015/16
39.35
24.58
72.61
46.96
20
30
40
50
60
70
80
Ksh
s. M
illio
ns
Reporting period
Source: Makueni County Treasury
The local revenue consisted of Kshs.40.29 million raised in the first quarter and Kshs.46.96 million in the second quarter. The local revenue raised in the first half of the FY 2015/16 was Kshs.87.25 (21.8 per cent of the annual local revenue target), a marginal improvement from Kshs.86.79 million collected in a similar period of FY 2014/15.
Analysis of local revenue for the first half of FY 2015/16 by stream is shown in Table 3.45.

COUNTY GOVERNMENTS BUDGET IMPLEMENTATION REVIEW REPORT FIRST HALF FY, 2015/16172
Table 3.45: Makueni County, Analysis of revenue collection by stream for the first half of FY 2015/16
No. Revenue StreamAnnual Targeted Reve-
nue (Kshs.)**Six Months Actual Revenue (Kshs.)
Revenue Performance (%)
A B C D=*100
1 Market Entrance Fees - 13,143,485 -
2 Conservancy Fees - 1,028,305 -
3 Parking Fees - 11,755,315 -
4 Plot rent Fees - 4,448,860 -
5 Permits - 10,891,851 -
6 Penalty Fees - 898,146 -
7 Stock Market Fees - 4,530,395 -
8 Plan approval fees - 2,603,730 -
9 Cess - 5,297,694 -
10 Kiosk renewal fees - 558,690 -
11 Other Plot Dues - 2,001,338 -
12 Other Sources - 5,078,259 -
13 Stock Movement Fees - 823,735 -
14 Sand Cess local - 1,900,960
20 Liquor license Fees - 22,296,690 -
TOTAL - 87,257,453 -
Source: Makueni County Treasury
** The County did not provide a schedule of annual revenue target by stream.
Analysis of revenue by stream indicates that Liquor license fees generated the highest revenue of Kshs.22.29 million (25.6 per cent) of total local revenue followed by Market entrance fees at Kshs.13.14 million (15.1 per cent) and Parking fees at kshs.11.75 million (13.5 per cent of the total revenue generated).
3.23.3 Banking of local revenue
A review of the bank statements for the revenue collection account indicates that all locally collected revenue was deposited into the CRF account during the period under review. This conforms to Article 207 of the Constitution and Section 109 of the PFM Act 2012, which stipulates that all funds raised or received by or on behalf of the County Government should be deposited into the CRF account, unless excluded by an Act of Parliament.
3.23.4 Exchequer Issues
During the period under review, the Controller of Budget approved withdrawal of Kshs.3.03 billion from the CRF by the Controller of Budget, which was 32.1 per cent of the approved budget. The amount represented an increase of 23.1 per cent from Kshs.2.46 billion authorized in a similar period of FY 2014/15 and consisted of Kshs.2.08 billion (68.9 per cent) for recurrent expenditure and Kshs.944.03 million (31.1 per cent) for development activities.

COUNTY GOVERNMENTS BUDGET IMPLEMENTATION REVIEW REPORT FIRST HALF FY, 2015/16 173
3.23.5 Overall Expenditure Review
The County spent a total of Kshs.2.08 billion during the first half of FY 2015/16 which was 68.8 per cent of the funds released for operations. This is a slight reduction from the Kshs.2.13 billion spent in a similar period of FY 2014/15. A total of Kshs.1.70 billion was spent on recurrent activities and Kshs.381.68 million on development activities. Recurrent expenditure was 81.7 per cent of the funds released for recurrent activities while development expenditure accounted for 40.4 per cent of the funds released for development activities.
Recurrent expenditure for the period under review represented 38.1 per cent of the approved annual recurrent budget, a decrease from 39.4 per cent spent in a similar period of FY 2014/15. On the other hand development expenditure recorded an absorption rate of 7.7 per cent, a decline from 35.9 per cent spent in a similar period of FY 2014/15. A comparison of the total expenditure in the first half of FY 2014/15 and the first half of FY 2015/16 is shown in Figure 3.90.
Figure 3.90: Makueni County, Expenditure by Economic Classification for first half of FY 2014/15 and for first half of FY 2015/16
938.43
475.94
722.20
1,056.30
649.52
778.70
0.00
200.00
400.00
600.00
800.00
1,000.00
1,200.00
Personnel Emoluments Operation and Maintenance Development
Ksh
s.mill
ions
Expenditure by Economic Classification
1st Half of FY 2014/15
1st Half of FY 2015/16
Source: Makueni County Treasury
3.23.6 Recurrent Expenditure Analysis
The total recurrent expenditure for the reporting period was Kshs.1.70 billion against an annual recurrent budget of Kshs.4.47 billion. This represents 38.1 per cent of the annual recurrent budget. The County spent Kshs.1.05 billion (61.9 per cent) on personnel emoluments and Kshs.649.52 million (38.1 per cent) on operations and maintenance as shown in Figure 3.90. Expenditure on personnel emoluments accounted for 50.6 per cent of total expenditure and has increased in the first half of FY 2015/16 as compared to a similar period in FY 2014/15 when the County spent Kshs.938.43 million.
The County spent Kshs.32.68 million on sitting allowances to the 47 MCAs and the Speaker against a budget of Kshs.47 million. This is a significant increase from Kshs.11.84 million recorded in a similar period of FY 2014/15. The average monthly sitting allowance per MCA was Kshs.113,505 compared to SRCs recommended amount of Kshs.124,800.

COUNTY GOVERNMENTS BUDGET IMPLEMENTATION REVIEW REPORT FIRST HALF FY, 2015/16174
A breakdown of the operations and maintenance expenditure for the reporting period is shown in Figure 3.91.
Figure 3.91: Makueni County, Operations and Maintenance Expenditure for the First Half of FY 2015/16
4.79
5.69
7.57
12.59
14.29
19.13
22.88
30.49
32.68
38.63
109.66
113.94
117.02
120.16
- 20.00 40.00 60.00 80.00 100.00 120.00 140.00
Communication
Printing & Stationary
Utilities
Gen Supplies & Services
Training
Routine Maintenance
Conferences
Fuel Oil & lubricants
MCAs sitting allowance
Insurance
Legal fees
Travel (Domestic & Foreign)
Other O & M
Specialised materials & Drugs
Kshs.million
Major
Categ
ories
of O
& M
Expen
diture
Source: Makueni County Treasury
The aggregate expenditure on domestic and foreign travel was Kshs.113.94 million compared to Kshs.88.04 million incurred in a similar period of FY 2014/15, representing a significant increase of 29.4 per cent. This expenditure comprised of Kshs.67.66 million spent by the County Executive and Kshs.46.27 million by the County Assembly.
3.23.7 Development Expenditure AnalysisThe details of development expenditure during the first half of FY 2015/16 are provided in figure 3.92.Figure 3.92: Makueni County, Summary of Development Expenditure for the First Half of FY 2015/16
8.82
11.00
12.36
13.20
13.44
13.76
16.51
21.73
24.92
26.00
35.94
45.16
51.32
87.52
- 10.00 20.00 30.00 40.00 50.00 60.00 70.00 80.00 90.00 100.00
Planning &Tittle deed issuance
Access Roads
County Exams
Construction of ECDE,&CTTIs
support to Farmers
Emergency fund
Water supplies and sewerage
County Sports
Promotion of Micro Finance
Purchase of Tippers &Excavator
Construction of buidings
Other Development Expenditures
Ward based Upgrading of dispensaries
Medical equipments
Kshs. Millions
Majo
r Cate
gorie
s of D
evelo
pmen
t Exp
endit
ure
Source: Makueni County Treasury

COUNTY GOVERNMENTS BUDGET IMPLEMENTATION REVIEW REPORT FIRST HALF FY, 2015/16 175
Analysis of the development expenditure of Kshs.381.68 million incurred in the first half of FY 2015/16 indicates that the Health Department reported the highest expenditure at Kshs.146.83 million which was spent on purchase of medical equipment such as X-rays machines and theatres to hospitals, construction of maternity wing at the Makueni County Referral Hospital and Ward based upgrading & renovation of dispensaries. The second highest expenditure at Kshs.42.56 million was incurred by the Water Department on construction of water supplies and sewerage such as sand dams and earth dams. The Department of Transport incurred Kshs.34.58 million on construction of office block, Governors and Deputy Governor’s residence and installation of street lighting & upgrading of access roads. Department of Trade incurred Kshs.31.65 million on promotion of micro finance, tourism and cooperatives while the Department of Education incurred Kshs.28.28 million on construction of ECDEs and CTTIs and support to education.
3.23.8 Annual Budget and Budget Performance Analysis by department for the First Half of FY 2015/16
A summary of the FY 2015/16 annual budget estimates and budget performance for the first half by department is as shown in Table 3.46.
Table 3.46: Makueni County, Annual Budget and First Half of FY 2015/16 Budget Performance by Department
Department Annual Budget Alloca-tion (Kshs. Million)
6 months Exchequer Issues (Kshs. Million)
6 months Expendi-ture (Kshs. Million)
6 months expenditure to exchequer issues (%)
Absorption rate (%)
Rec Dev Rec Dev Rec Dev Rec Dev Rec DevCounty Attor-ney’s Office 87.57 - 33.30 - 54.76 - 164.4 - 62.5 -
County Public service board 65.31 - 29.48 - 19.19 - 65.1 - 29.4 -
Department of Land and Plan-ning
37.37 190.75 16.37 52.15 11.88 9.77 72.6 18.7 31.8 5.1
Office of Gov-ernor 179.55 - 83.48 - 75 - 89.8 - 41.8
-Department of Trade and Coop-eratives
57.02 359.53 25.67 115.56 16.2 31.66 63.1 27.4 28.4 8.8
Department of Gender 73.69 369.21 33.94 92.53 19.8 37.53 58.3 40.6 26.9 10.2
County Public Service 114.6 - 55.71 - 35.42 - 63.6 - 30.9 -
Department of Finance 553.19 263 266.81 13.0 138.95 13.75 52.1 105.8 25.1 5.2
Department of Education & ICT 224.43 437.89 106.67 72.48 85.66 28.29 80.3 39.0 38.2 6.5
Department of Transport & Infrastructure
167.16 707.45 78.83 89.05 45.71 34.58 58.0 38.8 27.3 4.9
Department of Agriculture 227.73 433.4 104.15 73.25 86.72 17.72 83.3 24.2 38.1 4.1
County Assem-bly 611.87 92.37 340.44 38.36 310.11 12.35 91.1 32.2 50.7 13.4

COUNTY GOVERNMENTS BUDGET IMPLEMENTATION REVIEW REPORT FIRST HALF FY, 2015/16176
Department Annual Budget Alloca-tion (Kshs. Million)
6 months Exchequer Issues (Kshs. Million)
6 months Expendi-ture (Kshs. Million)
6 months expenditure to exchequer issues (%)
Absorption rate (%)
Rec Dev Rec Dev Rec Dev Rec Dev Rec Dev
Department of Water 170.83 1,250.26 76.31 225.36 54.52 42.57 71.4 18.9 31.9 3.4
Department of Health 1,671.30 794.68 729.48 165.29 674.16 146.83 92.4 88.8 40.3 18.5
Department of Devolution & Public Service
236.06 73.70 107.40 7.0 77.76 6.63 72.4 94.7 32.9 9.0
TOTAL 4,477.68 4,972.25 2,088.04 944.03 1,705.84 381.68 81.7 40.4 38.1 7.7
Source: Makueni County Treasury
Analysis of budget performance by department shows that the Department of Health reported the highest absorption rate of its development budget at 18.5 per cent while the Department of Water registered the lowest absorption rate at 3.4 per cent during the period under review. On the other hand, the Department of County Attorney had the highest percentage of its recurrent expenditure to its recurrent budget at 62.5 per cent while Finance and Socio Economic Planning Department had the lowest percentage at 25.1 per cent.
3.23.9 Borrowing by the County Government
Article 212 of the Constitution requires a county government to borrow with approval from the County Assembly, and only if the national government guarantees the loan. Further, Section 58 of the PFM Act 2012 gives the Cabinet Secretary to the National Treasury the powers to guarantee loans subject to approval by Parliament. During the period under review, the County utilized its equitable share and local revenue collection deposited into County Revenue Fund account maintained at the Central Bank of Kenya and did not borrow any funds.
3.23.10 Observations and Recommendations
The County has made progress in addressing the challenges previously identified as affecting budget implementation. The County has;
i. Prepared and passed the Annual Development Plans for the FY 2013/14, FY 2014/15, FY 2015/16 and FY 2016/17.
ii. Prepared and passed regulations to operationalize various established County Funds.
iii. Improved working relations between the County Executive and the County Assembly.
Despite the progress made, the following challenges continued to hamper effective budget implementation;

COUNTY GOVERNMENTS BUDGET IMPLEMENTATION REVIEW REPORT FIRST HALF FY, 2015/16 177
1. Delay in the enactment of the Finance Bill, which provides a framework for local revenue collection.
2. Failure to submit quarterly financial statements on established County Funds. The County has established various funds in line with section 116 of the PFM Act 2012. However, by the end of the first half of FY 2015/16, no financial reports on these funds had been submitted to the COB.
The County should implement the following recommendations in order to improve budget execution
1. The County Treasury should ensure the Finance Bill is prepared in good time and submitted to the County Assembly for approval.
2. The County Treasury should ensure financial statements for the County funds established under Section 116 of the PFM Act 2012 are prepared and submitted to the relevant offices in line with sections 167 and 168 of the PFM Act 2012.
3.24 Mandera County
3.24.1 Overview of the FY 2015/16 Budget
The FY 2015/16 approved Supplementary Budget for Mandera County was Kshs.11.50 billion. It comprised of Kshs.4.22 billion (36.7 per cent) allocated for recurrent expenditure and Kshs.7.28 billion (63.3 per cent) for development expenditure.
In order to finance the budget, the County expected to receive Kshs.8.96 billion (78 per cent) as transfers from the National Government, collect Kshs.199.20 million (1.7 per cent) from local sources, and receive a conditional grant of Kshs.14.60 million (0.1 per cent) from DANIDA and Kshs.2.12 billion(18.5 per cent) as projected cash balance from FY 2014/15. Further, the County budgeted for the additional conditional grants of Kshs.209.50 million (1.8 per cent) from the National Government as contained in CARA, 2015, Kshs.46.42 million (0.4 per cent) for free maternal care, Kshs.23.9 million (0.2) for compensation of forgone user fees, Kshs.25.4 million (0.2 per cent) from the World Bank Funding as support for the Health sector, and Kshs.113.77 million (1 per cent) from road maintenance fuel levy fund.
3.24.2 Revenue Analysis
In the first half of FY 2015/16, the County received Kshs.3.00 billion from the National Government as equitable share, Kshs.57.45 million as conditional allocations from the road maintenance fuel levy fund, Kshs.16.71 million as conditional allocations for free maternal health care, Kshs.1.90 million as conditional allocations for forgone user fees, raised Kshs.38.20 million from local sources, and a cash balance of Kshs.2.12 billion brought forward from FY 2014/15.
Figure 3.93 shows the quarterly trend in local revenue collection from first quarter of the FY 2013/14 to the second quarter of FY 2015/16.

COUNTY GOVERNMENTS BUDGET IMPLEMENTATION REVIEW REPORT FIRST HALF FY, 2015/16178
Figure 3.93: Mandera County, Trend in Local Revenue Collection by Quarter from the FY 2013/14 to the second quarter of FY 2015/16
11.10
34.8032.56
18.46 19.74
5
10
15
20
25
30
35
40
Ksh
s. M
illi
ons
Reporting period
Source: Mandera County Treasury
The analysis of local revenue by stream is shown in Table 3.47.
The local revenue consisted of Kshs.18.46 million raised in the first quarter and Kshs.19.74 million in the second quarter. The local revenue raised in the first half of the FY 2015/16 of Kshs.38.20 million (19.2 per cent of the annual local revenue target), an increase from Kshs.37.9 million collected in a similar period of FY 2014/15.
Table 3.47: Mandera County, Analysis of revenue collection by stream for the first half of FY 2015/16
Revenue Stream Annual Targeted Reve-nue (Kshs.)
Six Months Actual Revenue (Kshs.)
Revenue Perfor-mance (%)
A B C D=*100
Land rents 25,586,653 10,045,965 39.30
Plot Transfers/Sub-Divisions/Application Fees 12,200,000 1,259,000 10.30
Miraa Movements 17,137,280 2,689,300 15.70
Single Business Permit 19,680,924 1,496,700 7.60
Livestock Markets 10,278,887 2,297,253 22.30
Livestock Movement 7,538,916 113,000 1.50
Slaughter fees and Charges 9,265,687 1,896,711 20.50
Markets stalls/Gates 8,684,321 2,698,000 31.10
Stores 7,261,954 177,036 2.40
Bus park/Taxis/Matatu 2,645,321 1,671,400 63.20
Produce Cess 3,347,182 1,235,220 36.90

COUNTY GOVERNMENTS BUDGET IMPLEMENTATION REVIEW REPORT FIRST HALF FY, 2015/16 179
Revenue Stream Annual Targeted Reve-nue (Kshs.)
Six Months Actual Revenue (Kshs.)
Revenue Perfor-mance (%)
A B C D=*100
Income from Sale of Tenders documents 5,437,744 1,000 0.00
Public Health 11,600,000 12,900 0.10
Hospital collection 7,040,000 1,605,700 22.80
Agriculture Mechanization/Hire of Equipment. 10,000,000 1,192,230 11.90
Income from Water Management 18,452,034 120,900 0.70
Income from Quarries 7,427,516 7,375,006 99.30
Building plan 1,539,432 61,000 4.00
Barriers 4,214,210 1,894,655 45.00
Other revenue streams 47,686,407 350,421 0.70
TOTAL 199,237,815 38,193,397 19.20
Source: Mandera County Treasury
The analysis of revenue by stream indicates that income from quarries recorded the highest performance against the annual target at 99.3 per cent followed by Bus park/matatu fees at 63.2 per cent.
3.24.3 Banking of Local Revenue
A review of the bank statements for the revenue collection account during the first half of FY 2015/16 indicates that the County did not bank all the locally generated revenue intact into the CRF. This does not conform to Article 207 of the Constitution and Section 109 of the PFM Act 2012, which stipulates that all funds raised or received by or on behalf of the County Government should be deposited into the CRF account, unless excluded by an Act of Parliament.
3.24.4 Exchequer Issues
During the period under review, the CoB authorized withdrawal of Kshs.2.12 billion from the CRF, which was 18.5 per cent of the approved budget. The amount represented a decline of 54.9 per cent from Kshs.4.7 billion authorized in a similar period of FY 2014/15 and consisted of Kshs.1.28 billion (60.4 per cent) for recurrent expenditure and Kshs.840.3 million (39.6 per cent) for development activities.
3.24.5 Overall Expenditure Review
The County spent a total of Kshs.2.12 billion during the first half of FY 2015/16 which was 99.8 per cent of the funds released for both recurrent and development expenditure. This is a significant reduction from the Kshs.4.69 billion spent in a similar period of FY 2014/15. A total of Kshs.1.28 billion was spent on recurrent activities and Kshs.835.10 million on development activities. Recurrent expenditure was 100 per cent of the funds released for recurrent activities while development expenditure accounted for 99.4 per cent of the funds released for development activities. The expenditure excludes commitments as of 31st December; 2015.The County did not submit a report on outstanding commitment to OCOB.

COUNTY GOVERNMENTS BUDGET IMPLEMENTATION REVIEW REPORT FIRST HALF FY, 2015/16180
Recurrent expenditure for the period under review represented 30.4 per cent of the approved annual recurrent budget, a decrease from 46.2 per cent spent in a similar period of FY 2014/15. On the other hand, development expenditure recorded an absorption rate of 11.5 per cent, a decrease from 36.8 per cent spent in a similar period of FY 2014/15. A comparison of the total expenditure in the first half of FY 2014/15 and the first half of FY 20151/16 is shown in Figure 3.94.
Figure 3.94: Mandera County, Expenditure by Economic Classification for First Half of FY 2014/15 and First Half of FY 2015/16
628.01
1,496.71
2,566.40
559.06 721.43 835.10
-
500.00
1,000.00
1,500.00
2,000.00
2,500.00
3,000.00
Personnel Emoluments Operations & Maintenance Development
Ksh
s. M
illi
ons
Expenditure by Economic Classification
1st Half, FY 2014/15
1st Half, FY 2015/16
Source: Mandera County Treasury
3.24.6 Recurrent Expenditure Analysis
The total recurrent expenditure for the reporting period was Kshs.1.28 billion against an annual recurrent budget of Kshs.4.22 billion. This represents 30.4 per cent of the annual recurrent budget. The County spent Kshs.559.06 million (43.7 per cent) on personnel emoluments and Kshs.721.43 million (56.3 per cent) on operations and maintenance as shown in Figure 3.94. Expenditure on personnel emoluments accounted for 26.4 per cent of total expenditure and has decreased in the first half of FY 2015/16 as compared to a similar period in FY 2014/15 when the County spent Kshs.628.01 million. The decline is attributed to December, 2015 salaries and allowances paid in January, 2016 as a result of delayed approval of supplementary budget.
The County spent Kshs.22.02 million on sitting allowances to the 48 MCAs and the Speaker against a budget of Kshs.50.0 million. This is a marginal decrease from Kshs.24.23 million recorded in a similar period of FY 2014/15. The average monthly sitting allowance per MCA was Kshs.74,906 compared to SRCs recommended monthly ceiling of Kshs.124,800.
A breakdown of the operations and maintenance expenditure for the reporting period is shown in Figure 3.95.

COUNTY GOVERNMENTS BUDGET IMPLEMENTATION REVIEW REPORT FIRST HALF FY, 2015/16 181
Figure 3.95: Mandera County, Operations and Maintenance Expenditure for the First Half of FY 2015/16
Source: Mandera County Treasury
The aggregate expenditure on domestic and foreign travel was Kshs.33.14 million compared to Kshs.38.41 million incurred in a similar period of FY 2014/15, representing a decline of 13.7 per cent. This expenditure comprised of Kshs.23.54 million spent by the County Executive and Kshs.9.63 million by the County Assembly.
3.24.7 Development Expenditure Analysis
A summary of development expenditure during the first half of FY 2015/16 is provided in table 3.96.
Figure 3.96: Mandera County, Summary of Development Expenditure for the first half of FY 2015/16
160.11 150.00 150.00
107.41
80.00 60.00
46.55 30.00 22.58 20.00
020406080
100120140160180
Tarm
ackin
g M
ande
ra To
wn R
oad
(On g
oing w
ork)
Appro
ved v
ariati
ons f
or 16
Roa
dsroa
d (73
8km)
work
s
On go
ing W
ater P
rojec
ts
Solar
stree
t ligh
ting (
Phase
I -In
allthe
six S
ub-C
ounti
es)
Build
ing pr
ojects
-coun
tyhe
adqu
aters,
gove
rnor's
reside
nce,c
ounty
rest
hous
e
Addit
ional
Alloc
ation
s (Co
nstru
ction
of int
er-wa
rd roa
ds (P
hase
2)Ban
isa-
Ey m
ole, b
anisa
-Dom
al, K
iliwe h
eri-
terka
le,laf
et-wa
ranqa
ra,ku
tulo-E
l…
On go
ing co
nstru
ction
s of E
lwak
Airst
rips
Supe
rvisio
n work
s(Tarm
ackin
g of
mand
era ro
ads a
nd bu
ilding
work
s
Cons
tructi
on of
Cou
nty A
ssemb
lyHe
ad qu
arter
Cons
tructi
ons o
f Cen
tral P
rocure
ment
Stores
at co
unty
Head
quart
er (O
ngo
ing pr
oject)
Kshs
.milli
on
Major Categories of Development Expenditure
Source: Mandera County Treasury

COUNTY GOVERNMENTS BUDGET IMPLEMENTATION REVIEW REPORT FIRST HALF FY, 2015/16182
Analysis of the development expenditure of Ksh.840.27 million incurred in the first half of FY 2015/16 indicates that the Roads Department reported the highest expenditure at Kshs.535.11 million on construction and maintenance of access roads and construction of County e headquarters, governor’s residence and rest house. The second highest expenditure at Kshs.257.41 million was incurred by the Water, Energy Environment and Natural Resources Department on On-going Water Projects and Solar street lighting (Phase I -In all the six Sub-Counties). The Department of Finance incurred Kshs.20 million on constructions of central procurement stores at county headquarter (On-going project) while the County Assembly incurred Kshs.22.58 million on construction of County Assembly headquarter.
3.24.8 Annual Budget and Budget Performance Analysis by department for the First Half of FY 2015/16
A summary of the FY 2015/16 annual budget estimates and budget performance for the first half by department is shown in Table 3.48.
Table 3.48: Mandera County, Annual Budget and First Half of FY 2015/16 Budget Performance by Department
Department Annual Budget Allo-cation (Kshs. Million)
6 months Ex-chequer Issues (Kshs. Million)
6 months Expen-diture (Kshs.
Million)
Expenditure to exchequer issues (%)
Expenditure to Annual Budget
(%)
Rec Dev Rec Dev Rec Dev Rec Dev Rec Dev
Ministry of Agriculture Livestock and Fisheries 161.24 404.59 46.06
- 39.99 - 86.8 - 24.8 -
Ministry of Education, Culture and Sports 333.09 597.26 79.65
- 77.04 - 96.7 - 23.1 -
Ministry of Gender, Youth and Social Service 24.55 74.07 13.16
- 12.81 - 97.3 - 52.2 -
Ministry of Finance 514.38 1,142.50 47.49 20 40.84 20 86.0 100.0 7.9 1.8
Ministry of Health Services 1,001.44 596.18 301.37 - 292.42
- 97.0 - 29.2 -
Ministry of Trade, Investments Industrializations and Coopera-tive Development
32.45 402.05 15.37 - 14
- 91.1 - 43.1 -
County Assembly 631.98 169.5 158.1 27.75 155.1 22.58 98.1 81.4 24.5 13.3
Lands, Housing and Physical Planning 50.27 91.7 10.18
- 9.4 - 92.3 - 18.7 -
Office of the Governor and Depu-ty Governor 456.69
- 296.6 - 396.01
- 133.5 - 86.7 -
County Public Service Board 50.21 - 17.49
- 13.58 - 77.6 - 27.0 -
Ministry of Public Service, Man-agement and Devolved Unit 638.1 148.75 169.36
- 125.73 - 74.2 - 19.7 -
Public Works Roads and Trans-port 97.27 2,098.95 33.29 535.11 25.22 535.11 75.8 100.0 25.9 25.5
Water, Energy Environment and Natural Resources 225.19 1,559.00 92.72 257.41 78.35 257.41 84.5 100.0 34.8 16.5
TOTAL 4,216.87 7,284.54 1,280.83 840.27 1,280.49 835.1 100.0 99.4 30.4 11.5
Source: Mandera County Treasury

COUNTY GOVERNMENTS BUDGET IMPLEMENTATION REVIEW REPORT FIRST HALF FY, 2015/16 183
Analysis of budget performance by department shows that the Department of Public Works, Roads and Transport reported the highest absorption rate of its development budget at 25.5 per cent while the Ministry of Finance had the lowest at 1.8 per cent. On the other hand, the Office of the Governor and the Deputy Governerhad the highest percentage of recurrent expenditure to its recurrent budget at 86.7per cent while Finance Department had the lowest percentage at 7.9 per cent.
3.24.9 Borrowing by the County Government
Article 212 of the Constitution requires a county government to borrow with approval from the County Assembly, and only if the national government guarantees the loan. Further, Section 58 of the PFM Act 2012 gives the Cabinet Secretary to the National Treasury the powers to guarantee loans subject to approval by Parliament. During the period under review, the County utilized its equitable share and local revenue collection deposited into County Revenue Fund account maintained at the Central Bank of Kenya and did not borrow any funds.
3.24.10 Observations and Recommendations
In the period under review, the County made progress in addressing the challenges previously identified as affecting budget implementation. The County has;
i. Ensured that expenditure returns by both arms of the County government are submitted to the OCOB in a timely manner.
ii. Enacted regulations to operationaloze the Bursary Fund as required by Section 116 of the PFM Act 2012.
iii. Factored pending bills from FY 2014/15 in the approved supplementary budget.
Despite the progress made, the following challenges continued to hamper effective budget implementation;
1. Delay in approval of the Annual Development Plan for the FY 2015/16 thereby, affecting implementation of planned activities.
2. Poor IFMIS connectivity, which affected processing of financial transactions thus resulting in low absorption of development funds.
The County should implement the following recommendations in order to improve budget execution;
1. The County should ensure that the ADP is approved on time to ensure smooth implementation of planned activity.
2. The County should liaise with the National Treasury to ensure seamless IFMIS connectivity.

COUNTY GOVERNMENTS BUDGET IMPLEMENTATION REVIEW REPORT FIRST HALF FY, 2015/16184
3.25 Marsabit County
3.25.1 Overview of the FY 2015/16 Budget
The FY 2015/16 approved budget for Marsabit County was Kshs.5.83 billion. It comprised of Kshs. 3.03 billion (51.9 per cent) allocated for recurrent expenditure, Kshs.2.81 billion (48.1 per cent) for development expenditure.
In order to finance the budget, the County expected to receive Kshs 5.1 billion (87.9 per cent) from the National Government, collects Kshs.130 million (2.2 per cent) from local revenue sources, a conditional grant of Kshs.15.35 million (0.26 per cent) from DANIDA, and Kshs.0.5 billion (8.62 per cent) as projected cash balance brought forward from FY 2014/15. Further, the County did not budget for the additional conditional grants of Kshs.197.88 million from the National Government as contained in CARA, 2015 for free maternal care, compensation for forgone user fees, leasing of medical equipment and from the road maintenance fuel levy fund.
3.25.2 Revenue Analysis
In the first half of FY 2015/16, the County received Kshs.1.74 billion from the National Government as equitable share, Kshs.33.29 million as conditional allocations from the road maintenance fuel levy fund, Kshs.5.22 million as conditional allocations for free maternal health care, Kshs.1.42 million as conditional allocations for forgone user fees, raised Kshs.54.01 million from local sources, and had a cash balance of Kshs.813.18 million brought forward from FY 2014/15. The local revenue consisted of Kshs.26.44 million raised in the first quarter and Kshs.27.57 million in the second quarter.
The quarterly trend in local revenue collection from the FY 2013/14 to the second quarter of FY 2015/16 is shown in Figure 3.97.
Figure 3.97: Marsabit County, Trend in Local Revenue Collection by Quarter from the FY 2013/14 to the second quarter of FY 2015/16
8.7612.29
22.89
28.94 27.57
0
5
10
15
20
25
30
35
Ksh
s.m
illio
ns
Reporting Period
Source: Marsabit County Treasury

COUNTY GOVERNMENTS BUDGET IMPLEMENTATION REVIEW REPORT FIRST HALF FY, 2015/16 185
The local revenue raised in the first half of the FY 2015/16 was Kshs.54.01 million (41.6 per cent of the annual local revenue target), an improvement from Kshs.42.30 million collected in a similar period of FY 2014/15.
Analysis of local revenue realized by stream is shown in Table 3.49.
Table 3.49: Marsabit County, Analysis of revenue collection by stream for the first half of FY 2015/16
No. Revenue Stream Annual Targeted Reve-nue (Kshs.)
Six Months Actual Revenue (Kshs.)
Revenue Perfor-mance (%)
A B C D=*100
1 Land Transaction Charges 6,395,229 8,505,524 133.0
2 Lease Rentals 3,660,000 3,000,000 82.0
3 Produce 23,569,423 11,521,895 48.9
4 Livestock Charges 20,460,015 9,831,010 48.0
5 Public Health Charges 5,322,738 2,447,850 46.0
6 Hosp. Collections 15,976,417 6,200,230 38.8
7 Other Sources 12,319,639 4,643,848 37.7
8 Market Charges 3,243,468 984,430 30.4
9 Cement 3,198,269 615,650 19.2
10 Single business permit 20,901,598 3,675,645 17.6
11 Royalties 14,953,205 2,591,530 17.3
TOTAL 130,000,000 54,017,612 41.6
Source: Marsabit County Treasury
Analysis of revenue collection by stream indicates that Land Transaction Charges recorded the highest percentage of revenue performance against annual target at 133.0 per cent followed by Lease Rentals at 82.0 per cent. On the other hand, Royalties reported the lowest percentage of revenue performance against annual target at 17.3 per cent.
3.25.3 Banking of Local Revenue
A review of the bank statements for the revenue collection accounts indicate that all locally generated revenue was deposited into the CRF during the period under review. This conforms to Article 207 of the Constitution and Section 109 of the PFM Act 2012, which stipulates that all funds raised or received by or on behalf of the County Government should be deposited into the CRF account, unless excluded by an Act of Parliament.
3.25.4 Exchequer Issues
The Controller of Budget authorised withdrawal of Kshs.2.15 billion from the CRF, which was 36.8 per cent of the approved budget. The amount represented a decline of 12.2 per cent from Kshs.2.45 billion authorized in a similar period of FY 2014/15 and consisted of Kshs.1.33 billion (61.8 per cent) for recurrent expenditure and Kshs.815 million (38.2 per cent) for development activities.

COUNTY GOVERNMENTS BUDGET IMPLEMENTATION REVIEW REPORT FIRST HALF FY, 2015/16186
3.25.5 Overall Expenditure Review
The County spent a total of Kshs.1.43 billion during the first half of FY 2015/16 which was 66.4 per cent of the funds released for both recurrent and development expenditure. This is a slight increase from the Kshs.1.39 billion spent in a similar period of FY 2014/15. A total of Kshs.891.11 million was spent on recurrent activities and Kshs.535.39 million on development activities. Recurrent expenditure was 66.9 per cent of the funds released for recurrent activities while development expenditure accounted for 65.7 per cent of the funds released for development activities. The expenditure excludes commitments as of 31st December, 2015 that amounted to Kshs.490.27 million for development and Kshs.152.23 million for recurrent expenditure.
Recurrent expenditure for the period under review represented 29.4 per cent of the approved annual recurrent budget, with similar expenditure (29.4 per cent) reported in a similar period of FY 2014/15. On the other hand, development expenditure recorded an absorption rate of 19.1 per cent, a marginal decrease from 22.2 per cent spent in a similar period of FY 2014/15. A comparison of the total expenditure in the first half of FY 2014/15 and the first half of FY 2015/16 is shown in Figure 3.98.
Figure 3.98: Marsabit County, Expenditure by Economic Classification for First Half of FY 2014/15 and First Half of FY 2015/16
411.4
278.5
648.7
548.60
342.42
535.30
0
100
200
300
400
500
600
700
Personel Emoluments Operation and Maintainance Development
Kshs
.milli
on
Expenditure by Economic Classification
1st half FY2014/2015
1st Half FY2015/2016
Source: Marsabit County Treasury
3.25.6 Recurrent Expenditure Analysis
The total recurrent expenditure for the reporting period was Kshs.891.11 million against a total of budget of Kshs.5.83 billion representing an absorption rate of 15.2 per cent. The County spent Kshs.548.6 million (61.6 per cent) on personnel emoluments and Kshs.342.42 million (38.4 per cent) on operations and maintenance as shown in Figure 3.98. Expenditure on personnel emoluments accounted for 38.4 per cent of total expenditure and has increased significantly in the first half of FY 2015/16 as compared to a similar period in FY 2014/15 when the County spent Kshs.411.4 million. The increase is attributed to recruitment of new staffs across the various departments.
The County spent Kshs.36.44 million on sitting allowances to the 33 MCAs and the Speaker against an annual budget of Kshs.80.0 million. This represent a significant increase from Kshs.11.34 million recorded in a similar period of FY 2014/15. The average monthly sitting allowance per MCA was

COUNTY GOVERNMENTS BUDGET IMPLEMENTATION REVIEW REPORT FIRST HALF FY, 2015/16 187
Kshs.178,635 compared to SRC’s recommended monthly ceiling of Kshs.124,800.
A breakdown of the operations and maintenance expenditure for the reporting period is shown in Figure 3.99.
Figure 3.99: Marsabit County, Operations and Maintenance Expenditure for the First Half of FY 2015/16
97.5688.49
40.05 35.22 29.8220.83 16.71
6.23 4.78 3.39 2.710
20
40
60
80
100
120
Trav
el (D
omest
ic &
Forei
gn)
Fuel,
oil a
nd lu
brica
nts
Routi
ne M
ainten
ance
Gene
ral of
fice s
uppli
es &
servic
es
Med
ical d
rugs
Emerg
ency
Reli
ef
Train
ing
Gran
ts to
semi-a
utono
mous
coun
ty ag
encie
s
ing an
d adv
ertisi
ng
Utilit
ies
Food
and r
ation
s
Kshs
.milli
ons
Major Categories of O & M Expenditure
Source: Marsabit County Treasury
The aggregate expenditure on domestic and foreign travel was Kshs.97.56 million compared to Kshs.35.74 million incurred in a similar period of FY 2014/15, representing a substantial increase of 173.0 per cent. This expenditure comprised of Kshs.58.30 million spent by the County Executive and Kshs.39.26 million by the County Assembly.
3.25.7 Development Expenditure AnalysisFigure 3.100 provides the details of development expenditure during the first half of FY 2015/16.
Figure 3.100: Marsabit County, Summary of Development Expenditure for the First Half of FY 2015/16
32.99 32.96
27.97
20.00
4.76 4.37 4.20 3.46
0
5
10
15
20
25
30
35
Construction ofBongole Resort
Construction ofSasala water
pan
Constructionof executive
office
Constructionmodern market
Spotimprovement
works BorSomare
Completion ofObbu YouthPolytechnic
Solid wastemanagement
Construction ofHealth Centre
Ksh
s.mill
ions
Major Categories of Development Expenditure
Source: Marsabit County Treasury

COUNTY GOVERNMENTS BUDGET IMPLEMENTATION REVIEW REPORT FIRST HALF FY, 2015/16188
Analysis of the development expenditure of Kshs.535.39 million in the first half of FY 2015/16 indicates that the Finance and Economic Planning Department had the highest expenditure at Kshs.238.34 million which was spent on development across several flagship projects that were carried forward from the previous year (pending bills). The second highest expenditure at Kshs.178.25 million was incurred by the Water Department on construction of water infrastructural works like dams, pans and piping of water to residents across the vast county. The Department of Tourism, Culture and Social Services incurred Kshs.35.99 million on construction of a resort while the Department of Health incurred Kshs.14.44 million on artificial insemination programme.
3.25.8 Annual Budget and Budget Performance Analysis by Department for the First Half of FY 2015/16
A summary of the FY 2015/16 annual budget estimates and budget performance for the first half by department is as shown in Table 3.50.
Table 3.50: Marsabit County, Annual Budget and First Half of FY 2015/16 Budget Performance by Department
Department
Annual Budget Allo-cation
(Kshs. Million)
6 months Exchequer Issues (Kshs. Million)
6 months Expen-diture
(Kshs. Million)
6 months Expenditure to Exchequer Issues (% )
Absorption rate %
Rec Dev Rec Dev Rec Dev Rec Dev Rec Dev
County Assembly 496 30 169.14 - 168.54 0 99.6 34.0 0.0
Public Service & Admin-istration 188.78 25 71.52 9 41.82 0 58.5 0.0 22.2 0.0
Office of the Governor & Deputy Governor 383.58 134 179.41 55 111.34 27.97 62.1 50.9 29.0 20.9
County Public Service Board 54.37 5 24.62 5 14.33 0 58.2 0.0 26.4 0.0
Finance & Economic Planning 426.26 560 253.65 260 66.35 238.4 26.2 91.7 15.6 42.6
Agriculture, Livestock & Fisheries Development 169.73 143.89 69.92 15 51.35 0 73.4 0.0 30.3 0.0
Water, Environment& Natural Resources 147.65 605.25 70.38 210 32.84 178.3 46.7 84.9 22.2 29.5
Education, Youth, Culture & Social Services 110.85 153.17 45.25 30 33.69 13 74.5 43.3 30.4 8.5
Health Services 750.3 316.59 303.67 40 295.58 27.48 97.3 68.7 39.4 8.7
Energy Land, Housing & Physical Planning 83.94 133.1 40.35 35 32.07 4.87 79.5 13.9 38.2 3.7
Public Works, Roads & Transport 104.29 445.32 51.38 10 11.4 9.36 22.2 93.6 10.9 2.1
Trade, Industrialization & Cooperative Development 55.23 73.8 25.93 54 14.48 0 55.8 0.0 26.2 0.0
Tourism, Wildlife & Cul-ture & Social Services 56.72 181.9 27.31 92 17.27 35.99 63.2 39.1 30.4 19.8
TOTAL 3,027.70 2,807.02 1,332.53 815.00 891.11 535.39 66.9 65.7 29.4 19.1
Source: Marsabit County Treasury

COUNTY GOVERNMENTS BUDGET IMPLEMENTATION REVIEW REPORT FIRST HALF FY, 2015/16 189
Analysis of budget performance by department shows that the Department of Finance and Planning reported the highest absorption rate of its development budget at 42.6 per cent. On the other hand, the Department of Health Services had the highest percentage of its recurrent expenditure to its recurrent budget at 39.4 per cent while the Department of Public Works, Roads and Transport had the lowest percentage of its recurrent expenditure to its recurrent budget at 10.9 per cent.
3.25.9 Borrowing by the County Government
Article 212 of the Constitution requires a county government to borrow with approval from the County Assembly, and only if the national government guarantees the loan. Further, Section 58 of the PFM Act 2012 gives the Cabinet Secretary to the National Treasury the powers to guarantee loans subject to approval by Parliament. During the period under review, the County utilized its equitable share and local revenue collection deposited into the County Revenue Fund account maintained at the Central Bank of Kenya and did not borrow any funds.
3.25.10 Observations and Recommendations
The county has made progress in addressing the challenges previously identified as affecting budget implementation. The County has:
i. Registered improvement in absorption of development funds from 3.4 per cent in the first half of FY 2014/15 to 19.1 per cent in the period under review.
ii. Improvement in local revenue collection from Kshs.42.3 million in the first half of FY 2014/15 to Kshs.54.01 million in the period under review.
Despite the progress made, the following challenge continued to hamper effective budget implementation;
1. Failure to budget for some conditional grants as per CARA 2015, which includes free maternal health care, Road Maintenance Fuel Levy Fund, leasing of medical equipment and an overstated Level 5 Hospitals grant.
The County should implement the following recommendation in order to improve budget execution;
1. The County should prepare a supplementary budget to include the conditional grants as per CARA, 2015. The grants include; free maternal health care, Road Maintenance Fuel Levy Fund, leasing of medical equipment, and a correction of the overstated Level 5 Hospitals grant.
3.26 Meru County
3.26.1 Overview of the FY 2015/16 Budget
The FY 2015/16 Approved Supplementary Budget for Meru County was Kshs.8.50 billion. It comprised of Kshs.5.11 billion (60.1 per cent) allocated for recurrent expenditure and Kshs.3.39 billion (39.9 per cent) for development expenditure.

COUNTY GOVERNMENTS BUDGET IMPLEMENTATION REVIEW REPORT FIRST HALF FY, 2015/16190
In order to finance the budget, the County expected to receive Kshs.6.49 billion (76.4 per cent) as transfers from the National Government, Kshs.82.49 million (1.0 per cent) from the Road Maintenance Fuel Levy Fund, collect Kshs.997.93 million (11.7 per cent) from local sources, a Kshs.244.32 million (2.9 per cent) as level 5 hospital funds, a conditional grant of Kshs.20.59 million (0.20 per cent) from DANIDA and Kshs.656.22 million (7.7 per cent) representing the opening cash balance from FY 2014/15.
3.26.2 Revenue Analysis
In the first half of FY 2015/16, the County received Kshs.2.18 billion from the National Government as equitable share to the CRF account, Kshs.81.85 million as conditional allocations for Level 5 Hospital, Kshs.41.66 million as conditional allocations from the road maintenance fuel levy fund, Kshs.58.28 million as conditional allocations for free maternal health care, Kshs.3.92 million as conditional allocations for forgone user fees, raised Kshs.207.95 million from local sources, and had a cash balance of Kshs.649.94 million brought forward from FY 2014/15.
The quarterly trend in local revenue collection from the FY 2013/14 to the second quarter of FY 2015/16 is shown in figure 3.101.
Figure 3.101: Meru County, Trend in Local Revenue Collection by Quarter from the FY 2013/14 to the second quarter of FY 2015/16
56.69
131.78
106.01
188.60
92.80
30
60
90
120
150
180
210
Ksh
s.m
illio
n
Reporting Period
Source: Meru County Treasury
The local revenue consisted of Kshs.115.15 million raised in the first quarter and Kshs.92.80 million in the second quarter. The local revenue raised in the first half of the FY 2015/16 was Kshs.207.95 million (20.8 per cent of the annual local revenue target), an improvement from Kshs.196.33 collected in a similar period of FY 2014/15.
Analysis of local revenue realized by stream is shown in Table 3.51.

COUNTY GOVERNMENTS BUDGET IMPLEMENTATION REVIEW REPORT FIRST HALF FY, 2015/16 191
Table 3.51: Meru County, Analysis of revenue collection by stream for the first half of FY 2015/16
NO. Revenue Stream Annual Targeted Revenue (Kshs.) 6-Month Actual Revenue (Kshs.) Revenue Performance (%)
A B C D=*100
1 Liquor License 20,000,000 13,316,800 66.6
2 Hospital FIF 160,000,000 67,848,405 42.4
3 Market Fee 98,032,833 23,589,471 24.1
4 Cess 83,832,188 20,103,614 24.0
5 Parking Fees 137,912,425 26,709,700 19.4
6 Others Sources 498,150,636 56,377,337 11.3
TOTAL 997,928,083 207,945,328 20.8
Source: Meru County Treasury
Analysis of revenue collection by stream indicates that Liquor License recorded the highest percentage of revenue performance against annual target at 66.6 per cent followed by hospital FIF fees at at 42.4 per cent.
3.26.3 Banking of Local Revenue
A review of the bank statements for the revenue collection accounts indicated that the County did not bank all the locally generated revenue intact into the CRF during the period under review. Collections from liquor license and Hospital Facility Improvement Fund (FIF) amounting to Kshs.13.4 million and Kshs.67.85 million respectively were not banked into the CRF even though these amounts were included in the revenue returns. This is in contravention to Article 207 of the Constitution and Section 109 of the PFM Act 2012, which stipulates that all funds raised or received by or on behalf of the County Government should be deposited into the CRF account, unless excluded by an Act of Parliament.
3.26.4 Exchequer Issues
During the period under review, the COB authorized for withdrawal of Kshs.2.45 billion from the CRF account, which was 28.8 per cent of the approved supplementary budget. The amount represented an increase of 6.5 per cent from Kshs.2.3 billion authorized in a similar period of FY 2014/15 and consisted of Kshs.2.24 billion (91.6 per cent) for recurrent expenditure and Kshs.206.0 million (8.4 per cent) for development activities.
3.26.5 Overall Expenditure Review
The County spent a total of Kshs.1.77 billion during the first half of FY 2015/16 which was 72.6 per cent of the funds released for both recurrent and development expenditure. This is a reduction from Kshs.2.33 billion spent in a similar period of FY 2014/15. A total of Kshs.1.73 billion was spent on recurrent activities and Kshs.46.46 million on development activities. Recurrent expenditure was

COUNTY GOVERNMENTS BUDGET IMPLEMENTATION REVIEW REPORT FIRST HALF FY, 2015/16192
77.2 per cent of the funds released for recurrent activities while development expenditure accounted for 22.6 per cent of the funds released for development activities. The expenditure excludes commitments as of 31st December, 2015 that amounted to Kshs.76.0 million for development and Kshs.403.70 million for recurrent expenditure.
Recurrent expenditure for the period under review represented 33.8 per cent of the approved annual recurrent budget, a decrease from 45.1 per cent spent in a similar period of FY 2014/15. On the other hand, development expenditure recorded an absorption rate of 1.4 per cent, a decrease from 25.1 per cent spent in a similar period of FY 2014/15. The low spending on development projects is attributed to the slow pace at which the County addressed the budget issues which led delay in release of development expenditure funds. A comparison of the total expenditure between the first half of FY 2014/15 and first half of FY 2015/16 is shown in Figure 3.102.
Figure 3.102: Meru County, Expenditure by Economic Classification for First Half of FY 2014/15 and First Half of FY 2015/16
1,333.71
405.95588.01
1,504.15
224.3846.46
0.00
200.00
400.00
600.00
800.00
1,000.00
1,200.00
1,400.00
1,600.00
Personnel Emoluments Operations and Maintenance Development
Ksh
s.m
illio
n
Expenditure by Economic Classification
1st half of FY 2014/15
1st half of FY 2015/16
Source: Meru County Treasury
3.26.6 Recurrent Expenditure Analysis
The total recurrent expenditure for the reporting period was Kshs.1.73 million against an annual recurrent budget of Kshs.5.11 billion. This represents 33.8 per cent of the annual recurrent budget. The County spent Kshs.1,504.15 million (87.0 per cent) on personnel emoluments and Kshs.224.38 million (13 per cent) on operations and maintenance as shown in Figure 3.102. Expenditure on personnel emoluments accounted for 84.7 per cent of total expenditure and has increased significantly in the half year of FY 2015/16 as compared to a similar period in FY 2014/15 when the County spent Kshs.1.33 billion. The increase is attributed to the increasing county wage bill.
The County spent Kshs.51.67 million on sitting allowances to the 69 MCAs and the Speaker against an annual budget of Kshs.120.20 million. This is a marginal decrease from Kshs.51.66 million recorded in a similar period of FY 2014/15. The average monthly sitting allowance per MCA was Kshs.123,028 compared to SRC’s recommended monthly ceiling of Kshs.124,800.

COUNTY GOVERNMENTS BUDGET IMPLEMENTATION REVIEW REPORT FIRST HALF FY, 2015/16 193
A breakdown of the operations and maintenance expenditure for the reporting period is shown in Figure 3.103.
Figure 3.103: Meru County, Operations and Maintenance Expenditure for the First Half of FY 2015/16
88.85
33.08 31.8824.29
12.52 8.50 6.88 6.66 6.48 2.49 1.69 1.06 - 10 20 30 40 50 60 70 80 90
100
Trav
el Co
sts
Othe
r Ope
ratin
g Exp
ense
s
Hosp
italit
y & S
uppl
ies
Insu
ranc
e Cos
ts
Prin
ting,
Adve
rtisin
g and
publ
icity
Utili
ties a
nd su
pplie
s
Paya
bles f
rom
Pre
viou
sFi
nanc
ial P
erio
d
Fuel
oil a
nd L
ubric
ants
Train
ing E
xpen
ses
Offic
e and
Gen
eral
Supp
lies
Rent
als of
Pro
duce
d Ass
ets
Rout
ine M
ainten
ance
Ksh
s. M
illio
ns
Major Categories of O&M Expenditure
Source: Meru County Treasury
The aggregate expenditure on domestic and foreign travel was Kshs.88.85 million compared to Kshs.105.0 million incurred in a similar period of FY 2014/15, representing a decrease of 15.4 per cent. This expenditure comprised of Kshs.24.38 million spent by the County Executive and Kshs.64.47 million by the County Assembly.
3.26.7 Development Expenditure Analysis
A summary of development expenditure during the first half of FY 2015/16 is provided in figure 3.104.
Figure 3.104: Meru County, Summary of Development Expenditure for the First Half of FY 2015/16
36.46
8.002.00
- 5
10 15 20 25 30 35 40
Cham
ber R
econ
figur
ation
&m
oder
niza
tion
of C
AOf
fices
Supp
ly, D
eliv
ery,
Insta
llatio
n, T
estin
g an
dCo
mm
issio
ning
of H
ansa
rdEq
uipm
ent
Arch
itectu
ral C
onsu
ltanc
yon
Cha
mbe
rRe
conf
igur
ation
CA
Offi
ces
Ksh
s.mill
ions
Major Categories of Development Expenditure
Source: Meru County Treasury

COUNTY GOVERNMENTS BUDGET IMPLEMENTATION REVIEW REPORT FIRST HALF FY, 2015/16194
Analysis of the development expenditure of Kshs.46.46 million in the first half of FY 2015/16 indicates that Kshs.36.46 million was spent on Chamber reconfiguration and modernization of County Assembly offices; Kshs.8 million was spent on supply, delivery, installation, testing and commissioning of Hansard equipment while Kshs.2 million was spent on architectural consultancy on chamber reconfiguration and modernization of County Assembly offices.
3.26.8 Annual Budget and Budget Performance Analysis by department for the First Half of FY 2015/16
A summary of the FY 2015/16 annual budget estimates and budget performance for the first half by department for Meru County is as shown in Table 3.52.
Table 3.52: Meru County, Annual Budget and First Half of FY 2015/16 Budget Performance by Department
Department Annual Budget Allo-cation (Kshs.Million)
6-Months Exche-quer Issues (Kshs.
Million)
6-Months Expendi-ture (Kshs.Million)
6-Months Expenditure to Exchequer
Issues (%)
Absorption rate (%)
Rec Dev Rec Dev Rec Dev Rec Dev Rec Dev
County Assembly 792.12 114.07 437.84 32.03 345.4 46.46 78.9 145.1 43.6 40.7
Office of the Governor 268.22 - 79.99 - 39.4 - 49.3 14.7
County Treasury 511.29 202.39 173.56 - 130.73 - 75.3 25.6 0.0
Agriculture, Fishery and Livestock 329.68 235.22 138.18 - 118.95 - 86.1 36.1 0.0
Water, Environment and Natural Resources 110.86 720.36 50.48 18.82 38.71 - 76.7 0.0 34.9 0.0
Education 466.96 244.28 146.92 6.14 133.17 - 90.6 0.0 28.5 0.0
Health 1,620.19 341.7 670.23 7.78 673.42 - 100.5 0.0 41.6 0.0
Lands, Housing, Physical and Economic Planning 95.66 164.95 48.41 8.04 33.6 - 69.4 0.0 35.1 0.0
Public Service and Admin-istration 621.94 9.95 356.5 - 137.52 - 38.6 22.1 0.0
Transport and Infrastruc-ture 104.35 858.59 45.55 22 32.04 - 70.3 0.0 30.7 0.0
Cooperative, Tourism and Enterprise Development 87.6 282.55 36.9 55 25.32 - 68.6 0.0 28.9 0.0
Culture, Gender and Sports 59.17 211.44 30.91 56.19 16.64 - 53.8 0.0 28.1 0.0
County Public Service Board 14.62 - 10.33 - 1.75 - 16.9 12.0
Town Administration 24.53 2.5 13.82 - 1.89 - 13.7 7.7 0.0
TOTAL 5,107.16 3,388.99 2,240.63 206 1,729.53 46.46 77.2 22.6 33.9 1.4
Source: Meru County Treasury
A breakdown of budget performance by department shows that the County Assembly reported the highest percentage of its recurrent expenditure to its recurrent budget at 43.6 per cent, followed by the Department of Health at 41.6 per cent. The Department of Town Administration recorded the lowest percentage of its recurrent expenditure to its recurrent budget at 7.7 per cent. It is worth noting
COUNTY GOVERNMENTS BUDGET IMPLEMENTATION REVIEW REPORT FIRST HALF FY, 2015/16 195
that only the County Assembly incurred development expenditure during the period which was more than the funds released (145.1 per cent) for development activities.
3.26.9 Borrowing by the County Government
Article 212 of the Constitution requires a county government to borrow with approval from the County Assembly, and only if the national government guarantees the loan. Further, Section 58 of the PFM Act 2012, gives the Cabinet Secretary to the National Treasury the powers to guarantee loans subject to approval by Parliament. During the period under review, the County utilized its equitable share and local revenue collection deposited into the County Revenue Fund account maintained at the Central Bank of Kenya and did not borrow any funds.
3.26.10 Observations and Recommendations
The County has made progress in addressing some of the challenges previously identified as affecting budget implementation. The County has;
i. Registered improvement in revenue collection from Kshs.196.33 million in the first half of FY 2014/15 to Kshs.207.95 million.
During the first half of FY 2015/16, the County experienced some challenges that affected budget implementation. They included:
1. Failure to remit all locally collected revenue into the CRF account as stipulated in Section 109(2) of the Public Finance Management Act, 2012.
2. Failure to submit financial reports for the Hospital FIF, Alcohol Board, Meru Microfinance Corporation and Meru Investment and Development Corporation.
3. Discrepancies between the development budget estimates uploaded into the IFMIS and the approved Supplementary budget, which indicate staff capacity challenges in the use of IFMIS.
4. High turnover of key staff in the County Treasury which might result in reporting and accountability problems.
The County should implement the following recommendations in order to improve budget execution:1. All local revenue should be deposited into the CRF account as stipulated in Section 109(2) of
the PFM Act 2012.
2. The County should ensure timely submission of expenditure reports to the Controller of Budget.
3. The County Treasury should liaise with the IFMIS Directorate to train staff in the use of IFMIS. In addition, regular reconciliation should be undertaken to ensure the budget uploaded in the IFMIS system tallies with that approved by the County Assembly.
4. The County Treasury should address the high staff turnover in the department.

COUNTY GOVERNMENTS BUDGET IMPLEMENTATION REVIEW REPORT FIRST HALF FY, 2015/16196
3.27 Migori County
3.27.1 Overview of the FY 2015/16 Budget
The FY 2015/16 approved budget for Migori County for FY 2015/16 was Kshs.6.51 billion. It comprised of Kshs.3.58 billion (55.0 per cent) allocated for recurrent expenditure and Kshs.2.93 billion (45.0 per cent) for development expenditure.
In order to finance the budget, the County expected to receive Kshs.5.70 billion (87.54 per cent) as transfers from the National Government, collect Kshs.400 million (6.15 per cent) from local sources, a conditional grant of Kshs.20.44 million (0.31 per cent) from DANIDA, Kshs.162.10 million (2.49 per cent) as other conditional grants, Kshs.109.70 million (1.69 per cent) as free maternal health care, Kshs.44.49 million (0.68 per cent) for leasing of medical equipment and Kshs.74.15 million from Road Maintenance Fuel Levy Fund. However, County did not budget for forgone user fees of Kshs.21.38 million, opening cash balance amounting to Kshs.538.74 million, donors fund from UNFPA amounting to Kshs.15.13 million, and under-budgeted for free maternal health care by Kshs.55.34 million.
3.27.2 Revenue Analysis
In the first half of FY 2015/16, the County received Kshs.2.48 billion from the National Government as a direct transfer to the CRF account, Kshs.5.13 million as conditional allocations for forgone user fees, Kshs.50.81 million as conditional allocations for free maternal health care, Kshs.37.44 million as conditional allocations from the road maintenance fuel levy fund, raised Kshs.151.56 million from local sources, and had a cash balance of Kshs.538.74 million brought forward from FY 2014/15.
The quarterly trend in local revenue collection from FY 2013/14 to the second quarter of FY 2015/16 is shown in figure 3.105.
Figure 3.105: Migori County, Trend in Local Revenue Collection by Quarter from the FY 2013/14 to the second quarter of FY 2015/16
54.13
86.59
126.17
20
40
60
80
100
120
140
Ksh
s.mill
ion
Reporting period
Source: Migori County Treasury

COUNTY GOVERNMENTS BUDGET IMPLEMENTATION REVIEW REPORT FIRST HALF FY, 2015/16 197
The local revenue consisted of Kshs.86.87 billion raised in the first quarter and Kshs.64.70 million in the second quarter. The local revenue raised in the first half of the FY 2015/16 was Kshs.151.56 million (37.9 per cent of the annual local revenue target), an improvement from Kshs.140.24 million collected in a similar period of FY 2014/15.
Analysis of local revenue realized by stream is shown in Table 3.53.
Table 3.53: Migori County, Analysis of revenue collection by stream for the first half of FY 2015/16
No. Revenue Stream Annual Targeted Rev-enue (Kshs.)
Six Months Actual Revenue (Kshs.)
Revenue Perfor-mance (%)
A B C D=*100
1 Parking- Bus Park 60,000,000 26,897,900 44.8
2 Market Dues 50,000,000 23,705,740 47.4
3 Ministry of Health 45,000,000 18,801,955 41.8
4 Tobacco Cess 40,000,000 11,668,343 29.2
5 Moto cycles- Parking Fee 22,000,000 11,379,980 51.7
6 Sugar Cane- Cess 40,000,000 10,236,640 25.6
7 C/A,C/F,S.H.FEES 19,000,000 8,721,200 45.9
8 Maize/Potatoes-Cess 11,000,000 7,693,200 69.9
9 S.B.P./Applications 50,000,000 7,089,920 14.2
10 Copper-Cess 4,000,000 2,116,586 52.9
11 Other Revenue streams 59,000,000 23,248,296 39.4
Total 400,000,000 151,559,760 37.9
Source: Migori County Treasury
A review of locally generated revenue collection by stream indicates that Maize/Potato Cess generated the highest percentage of revenue against actual target at 69.9 per cent followed by Copper Cess and Motor Cycles Parking Fees 52.9 per cent and 51.7 per cent respectively. The Single Business Permit had the lowest percentage of revenue against actual target at 14.2 per cent.
3.27.3 Banking of Local Revenue
A review of the bank statements for the revenue collection account indicates that all locally generated revenue was deposited into the CRF during the period under review. This conforms to Article 207 of the Constitution and Section 109 of the PFM Act 2012, which stipulates that all funds raised or received by or on behalf of the County Government should be deposited into the CRF account, unless excluded by an Act of Parliament.

COUNTY GOVERNMENTS BUDGET IMPLEMENTATION REVIEW REPORT FIRST HALF FY, 2015/16198
3.27.4 Exchequer Issues
During the period under review, the COB authorized for withdrawal of Kshs.2.73 billion from the CRF, which was 42.0 per cent of the approved budget. The amount represented an improvement of 33.2 per cent from Kshs.2.05 billion authorized in a similar period of FY 2014/15 and consisted of Kshs.1.81 billion (66.3 per cent) for recurrent expenditure and Kshs.920 million (33.7 per cent) for development activities.
3.27.5 Overall Expenditure Review
The County spent a total of Kshs.2.62 billion during the first half of FY 2015/16 which was 96.0 per cent of the funds released for both recurrent and development expenditure. This is an increase from the Kshs.2.04 billion spent in a similar period of FY 2014/15. A total of Kshs.1.65 billion was spent on recurrent activities and Kshs.974.05 million on development activities. Recurrent expenditure was 91.0 per cent of the funds released for recurrent activities while development expenditure accounted for 105.9 per cent of the funds released for development activities.
Recurrent expenditure for the period under review represented 46.0 per cent of the approved annual recurrent budget, a slight decrease from 47.5 per cent spent in a similar period of FY 2014/15. On the other hand, development expenditure recorded an absorption rate of 33.3 per cent, an improvement from 27.5 per cent spent in a similar period of FY 2014/15. A comparison of the total expenditure between the first half of FY 2014/15 and the first half of FY 2015/16 is shown in Figure 3.106.
Figure 3.106: Migori County, Expenditure by Economic Classification for First Half of FY 2014/15 and First Half of FY 2015/16
825
568.05642.32
1126.28
522.29
974.05
0
200
400
600
800
1000
1200
Personnel Emoluments Operations & Maintenance Development
Ksh
s. M
illio
ns
Expenditure by Economic Classification
1st Half, FY 2014/15
1st Half, FY 2015/16
Source: Migori County Treasury
3.27.6 Recurrent Expenditure Analysis
The total recurrent expenditure for the reporting period was Kshs.1.65 billion against an annual recurrent budget of Kshs.3.58 billion. This represents 46.0 per cent of the annual recurrent budget. The County spent Kshs.1.13 billion (68.3 per cent) on personnel emoluments and Kshs.522.29 million (31.7 per cent) on operations and maintenance as shown in Figure 3.106. Expenditure on personnel emoluments accounted for 43.1 per cent of total expenditure and has increased significantly

COUNTY GOVERNMENTS BUDGET IMPLEMENTATION REVIEW REPORT FIRST HALF FY, 2015/16 199
in first half of FY 2015/16 as compared to a similar period in FY 2014/15 when the County spent Kshs.825.00 million.
The County spent Kshs.62.27 million on sitting allowances to the 63 MCAs and the Speaker against an annual budget of Kshs.126.88 million. This is a marginal decrease from Kshs.68 million recorded in a similar period of FY 2014/15. The average monthly sitting allowance per MCA was Kshs.164,729 compared to SRC’s recommended monthly ceiling of Kshs.124,800.
A breakdown of the operations and maintenance expenditure for the reporting period is shown in Figure 3.107.
Figure 3.107: Migori County, Operations and Maintenance Expenditure for the First Half of FY 2015/16
157.08
66.85
40.86 34.5427.40
14.06 13.22 12.68 12.10 8.63
0.00
20.00
40.00
60.00
80.00
100.00
120.00
140.00
160.00
180.00
Dom
estic
and
For
eign
Tra
vel
Mai
ntei
nanc
e Ex
pens
es -
Mot
or V
ehic
les
War
d O
pera
tions
Gene
ral O
ffice
Sup
plie
s(pa
pers
, pen
cils,
form
s, sm
all o
ffice
equ
ip e
tc)
Bank
Int
eres
t
Cate
ring
Serv
ices
(rec
eptio
ns),
Acco
mod
atio
ns, G
ifts,
Foo
d an
d Dr
inks
Refin
ed F
uels
and
Lubr
ican
ts fo
rTr
ansp
ort
Adve
rtisi
ng, A
war
enes
s and
Pub
licity
Cam
paig
ns
Boar
ds, C
omm
ittee
s, C
onfe
renc
es a
ndSe
min
ars
Cont
acte
d Pr
ofes
siona
l Ser
vice
s
Kshs
. Mill
ions
Major Categories of O & M Expenditure
Source: Migori County Treasury
The aggregate expenditure on domestic and foreign travel was Kshs.157.08 million an increase of 156.24 per cent compared to Kshs.61.30 million incurred in a similar period of FY 2014/15. This expenditure comprised of Kshs.100.43 million spent by the County Executive and Kshs.56.65 million by the County Assembly.
3.27.7 Development Expenditure Analysis
A summary of development expenditure during the first half of FY 2015/16 is provided in figure 3.108.

COUNTY GOVERNMENTS BUDGET IMPLEMENTATION REVIEW REPORT FIRST HALF FY, 2015/16200
Figure 3.108: Migori County, Summary of Development Expenditure for the First Half of FY 2015/16
102.48
66.55
25.50 24.63 18.32 15.77 15.60 12.50 12.11 10.31
0
20
40
60
80
100
120M
edic
al D
rugs
Sup
ply
Ins
talla
tion
of S
olar
str
eet l
ight
ing
Car
& M
ortg
age
Loa
n
Con
stru
ctio
n of
Kir
ingi
Bri
dge
A1
-Acc
ess
to C
ount
y G
over
nmen
tof
fice
s-O
mbo
A1
Loo
p R
oad
Mai
nten
ance
if I
CT
Equ
ipm
ent
Inst
alla
tion,
Con
figu
ratio
n &
Com
mis
sion
ing
of H
ardw
are
&So
ftw
ares
Con
stru
ctio
nof
Min
istr
y of
Lan
ds,H
ousi
ng a
nd P
hysi
cal P
lann
ing
offi
ces
Prop
osed
con
stru
ctio
n of
Sia
la B
oxcu
lver
t
Gov
erno
r's S
chol
arsh
ip
Ksh
s.m
illio
n
Major Categories of Development Expenditure
Source: Migori County Treasury
Analysis of the development expenditure of Ksh.974.05 million in the first half of FY 2015/16 indicates that Health Department reported the highest expenditure of Kshs.102.48 million which was spent on purchase of medical drugs. The second highest expenditure at Kshs.66.55 million was incurred by the Energy Department on installation of solar street lightening, Further, the County spent Kshs.25.50 million on Car and Mortgage Loan Scheme (although this expenditure is recurrent expenditure in nature). The Department of Roads incurred Kshs.24.63 million on construction of Kiringi Bridge and Kshs.18.32 million on construction of the A1-acces to county government offices and the Ombo A1-loop road. Expenditure on medical drugs and the Car and Mortgage Loan Scheme should be reclassified as recurrent expenditure.
3.27.8 Annual Budget and Budget Performance Analysis by department for the First Half of FY 2015/16
A summary of the FY 2015/16 annual budget estimates and budget performance for the first half by department is as shown in Table 3.54.

COUNTY GOVERNMENTS BUDGET IMPLEMENTATION REVIEW REPORT FIRST HALF FY, 2015/16 201
Table 3.54: Migori County, Annual Budget and First Half of FY 2015/16 Budget Performance by Department
Department Annual Budget Allo-cation (Kshs.Million)
6-Months Ex-chequer Issues (Kshs.Million)
6-Months Ex-penditure (Kshs.
Million)
Expenditure to Exchequer
Issues (%)
Absorption rate (%)
Rec Dev Rec Dev Rec Dev Rec Dev Rec Dev
County Assembly Services 652.3 145.3 281.42 42.65 301.08 41.97 107.0 98.4 46.2 28.9
Public Service Management 742.47 185.54 380.46 64.9 505.23 152.37 132.8 234.8 68.0 82.1
Office of the Governor & Deputy Governor 445.09 121 248.98 37.48 231.45 20.31 93.0 54.2 52.0 16.8
Finance & Economic Planning 340.68 495 169.26 58.64 138.49 57.89 81.8 98.7 40.7 11.7
Agriculture, Livestock & Fisheries Development 184.47 478.23 96.01 118.81 80.1 50.63 83.4 42.6 43.4 10.6
Health Services 909.33 224.28 471.68 95.58 291.03 139.56 61.7 146.0 32.0 62.2
Education, Youth, Sports and Culture 134.03 104.73 76.12 107.07 48.33 26.63 63.5 24.9 36.1 25.4
Environment and Disaster Management 34.35 100.06 18.08 21.48 19.1 36.03 105.6 167.7 55.6 36.0
Land, Housing & Physical Planning 39.31 94.19 18.24 29.28 7.55 55.52 41.4 189.6 19.2 58.9
Public Works, Roads , Transport and Energy 43.21 900 22.75 320.33 15.36 366.46 67.5 114.4 35.5 40.7
Trade, Industrialization, Tourism, Wild-life & Cooperative Development 56.04 77.31 28 23.78 10.84 26.68 38.7 112.2 19.3 34.5
Total 3,581.28 2,925.64 1,811.00 920 1,648.56 974.05 91.0 105.9 46.0 33.3
Source: Migori County Treasury
Analysis of budget performance by department shows that the Department of Public Service Management reported the highest absorption rate of its development budget at 82.1 per cent while the Department of Agriculture, Livestock & Fisheries Development registered the lowest absorption rate at 10.6 per cent. On the other hand, Department of Public Service Management had the highest percentage of the recurrent expenditure at 68.0 per cent while the Department of Land, Housing & Physical Planning had the lowest at 19.2 per cent.
3.27.9 Borrowing by the County Government
Article 212 of the Constitution requires a county government to borrow with approval from the County Assembly, and only if the National Government guarantees the loan. Further, Section 58 of the PFM Act 2012 gives the Cabinet Secretary to the National Treasury the powers to guarantee loans subject to approval by Parliament. During the period under review, the County utilized its equitable share and local revenue collection deposited into the County Revenue Fund account maintained at the Central Bank of Kenya and did not borrow any funds.
3.27.10 Observations and Recommendations
The County has made progress in addressing the challenges previously identified as affecting budget implementation. The County has:

COUNTY GOVERNMENTS BUDGET IMPLEMENTATION REVIEW REPORT FIRST HALF FY, 2015/16202
i Registered improvement in absorption of development funds from 27.5 per cent in the first half of FY 2014/15 to 33.3 per cent in the reporting period.
ii Improved in local revenue collection from Kshs.140.24 million in the first half of FY 2014/15 to Kshs.151.56 million in the reporting period.
Despite the progress made, the following challenges continued to hamper effective budget implementation;
1. Lack of Internal Audit Committee contrary to Section 155(5) of PFM Act 2012.
2. Manual collection and reporting of local revenue.
3. Use of manual system to process financial transactions by the County Assembly
4. Failure to budget for the forgone user fees of Kshs.21.38 million, opening cash balances amounting to Kshs.538.74 million, donors fund from UNFPA amounting to Kshs.15.13 million, and under-budgeting for free maternal health care by Kshs.55.34 million.
The County should implement the following recommendations in order to improve budget execution
1. The County should establish an Internal Audit Committee as per section 155(5) of the PFM Act 2012, to enhance oversight in public finance management.
2. The County Treasury should automate revenue collection to improve local revenue performance and reporting.
3. The County Assembly should adopt IFMIS in order to improve on financial management and comply with the law.
4. The County should formulate a supplementary budget to include the under-budgeted conditional grant of Kshs.55.34 million in respect of free maternal health care, Kshs. 21.38 million for forgone user fees, opening cash balance of Kshs.538.74 million and donor funds of Ksh.15.13 million.
3.28 Mombasa County
3.28.1 Overview of the FY 2015/16 Budget
The FY 2015/16 approved budget for Mombasa County was Kshs.10.92 billion. It comprised of Kshs.6.75 billion (61.8 per cent) allocated for recurrent expenditure and Kshs.4.16 billion (38.2 per cent) for development expenditure.
In order to finance the budget, the County expected to receive Kshs.5.16 billion (47.3 per cent) as transfers from the National Government, collect Kshs.5.18 billion (47.4 per cent) from local sources, a conditional grant of Kshs.573.24 million (5.3 per cent) from development partners and the National Government. However, the County did not budget for some conditional grants as per

COUNTY GOVERNMENTS BUDGET IMPLEMENTATION REVIEW REPORT FIRST HALF FY, 2015/16 203
CARA, 2015 which include; Kshs.136.25 million for free maternal health care, Kshs.21.89 million for compensation of forgone user fees, Road Maintenance Fuel Levy Fund amounting to Kshs.66.03 million and allocation for leasing of medical equipment amounting to Kshs.95.74 million. Further, the conditional allocation to level 5 hospitals was overstated in the budget by Kshs.88.30 million.
3.28.2 Revenue Analysis
In the first half of FY 2015/16, the County received Kshs.2.21 billion from the National Government as direct transfers, Kshs.171.24 million as conditional allocations for the Mombasa Level 5 Hospital, Kshs.33.35 million from the Road Maintenance Fuel Levy Fund, Kshs.2.88 million as compensation for forgone User Fees, Kshs.56.97 million for Free Maternal Health Care, and raised Kshs.737.27 million from local sources.
The quarterly trend in local revenue collection from the FY 2013/14 to the second quarter of FY 2015/16 is shown in figure 3.109.
Figure 3.109: Mombasa County, Trend in Local Revenue Collection by Quarter from the FY 2013/14 to the second quarter of FY 2015/16
9721093.66
353.1
0
200
400
600
800
1000
1200
Ksh
s.m
illi
on
Reporting period
Source: Mombasa County Treasury
The local revenue consisted of Kshs.384.17 million raised in the first quarter and Kshs.353.10 million in the second quarter. The local revenue raised in the first half of the FY 2015/16 was Kshs.737.27 million (14.5 per cent of the annual local revenue target), an improvement from Kshs.718 million collected in a similar period of FY 2014/15.
Analysis of local revenue realized by stream is shown inTable 3.55.
Table 3.55: Mombasa County, Analysis of revenue collection per stream for the first half of

COUNTY GOVERNMENTS BUDGET IMPLEMENTATION REVIEW REPORT FIRST HALF FY, 2015/16204
FY 2015/16
No. Revenue Stream Annual Targeted Reve-nue (Kshs.)
Six Months Actual Rev-enue (Kshs.)
Revenue Performance (%)
A B C D=*100
1 Transport and Infrastructure Fees 719,507,283 246,778,645 34.3
2 Land Rates 780,946,232 151,519,390 19.4
3 Sand and Ballast Extraction Fees 1,115,629,733 172,004,244 15.4
4 Market Rates 435,028,481 41,538,036 9.5
5 Housing Rent 236,285,486 17,764,865 7.5
6 Water Natural Resources Advertisement Fees 350,408,100 24,364,283 7.0
7 Business Permits 367,377,412 23,744,540 6.5
8 County Planning Control Income 309,431,107 20,359,203 6.6
9 Other Revenue Streams 631,307,423 38,367,264 6.1
10 Clinic Cost Sharing Fees 140,245,768 833,783 0.6
Total 5,086,177,025 737,274,253 14.5
Source: Mombasa County Treasury
Analysis of revenue collection by stream indicates that Transport and Infrastructure Levy Fees recorded the highest percentage of performance against annual target at 34.3 per cent followed by land rates at 19.4 per cent. Clinic Cost Sharing Fees recorded the lowest percentage of performance against annual target at 0.6 per cent.
3.28.3 Banking of local revenue
A review of the bank statements for the revenue collection accounts indicate that all locally generated revenue was deposited into the CRF during the period under review. This conforms to Article 207 of the Constitution and Section 109 of the PFM Act 2012, which stipulates that all funds raised or received by or on behalf of the County Government should be deposited into the CRF account, unless excluded by an Act of Parliament.
3.28.4 Exchequer Issues
The Controller of Budget authorised withdrawal of Kshs.3.38 billion from the CRF, which was 30.9 per cent of the approved budget. The amount represented an increase of 19.9 per cent from Kshs.2.82 billion authorized in a similar period of FY 2014/15 and consisted of Kshs.2.61 billion (77.2 per cent) for recurrent expenditure and Kshs.763.78 million (22.8 per cent) for development activities.
3.28.5 Overall Expenditure Review
The County spent a total of Kshs.3.33 billion during the first half of FY 2015/16 which was 98.5 per cent of the funds released for both recurrent and development expenditure. This is an increase from the Kshs.2.82 million spent in a similar period of FY 2014/15. A total of Kshs.2.47 billion was spent on recurrent activities and Kshs.852.36 million on development activities. Recurrent expenditure was

COUNTY GOVERNMENTS BUDGET IMPLEMENTATION REVIEW REPORT FIRST HALF FY, 2015/16 205
94.7 per cent of the funds released for recurrent activities while development expenditure accounted for 111.6 per cent of the funds released for development activities. The expenditure excludes commitments as of 31st December, 2015 that amounted to Kshs.363.45 million for development and Kshs.557.93 million for recurrent expenditure.
The recurrent expenditure for the period under review represented 36.6 per cent of the approved annual recurrent budget, an increase from 32.2 per cent spent in a similar period of FY 2014/15. On the other hand, development expenditure recorded an absorption rate of 20.5 per cent, an improvement from 4.6 per cent spent in a similar period of FY 2014/15. A comparison of the total expenditure between the half year of FY 2014/15 and half year of FY 2015/16 is shown in Figure 3.110.
Figure 3.110: Mombasa County, Expenditure by Economic Classification for First Half of FY 2014/15 and for First Half of FY 2015/16
1,969.27
654.72795.2
2,057.71
415.68
852.36
0.00
500.00
1,000.00
1,500.00
2,000.00
2,500.00
Personnel Emoluments Operations & Maintenance Development
Ksh
s. M
illio
ns
Expenditure by Economic Classification
1st Half, FY 2014/15
1st Half, FY 2015/16
Source: Mombasa County Treasury
3.28.6 Recurrent Expenditure Analysis
The total recurrent expenditure for the reporting period was Kshs.2.47 billion against an annual recurrent budget of Kshs.6.75 billion. This represents an expenditure of 36.6 per cent of the annual recurrent budget. The County spent Kshs.2.06 billion (83.4 per cent) on personnel emoluments and Kshs.415.68 million (16.8 per cent) on operations and maintenance as shown in Figure 3.110. Expenditure on personnel emoluments accounted for 61.9 per cent of total expenditure and has increased significantly in the first half of FY 2015/16 as compared to a similar period of FY 2014/15 when the County spent Kshs.1.97 billion.
The County spent Kshs.34.97 million on sitting allowances to the 43 MCAs and the Speaker against an annual budget of Kshs.97.84 million. This is an increase from Kshs.28.28 million recorded in a similar period of FY 2014/15. The average monthly sitting allowance per MCA was Kshs.135,558 compared to SRC recommended monthly ceiling of Kshs.124,800.
A breakdown of the operations and maintenance expenditure for the reporting period is shown in Figure 3.111.

COUNTY GOVERNMENTS BUDGET IMPLEMENTATION REVIEW REPORT FIRST HALF FY, 2015/16206
Figure 3.111: Mombasa County, Operations and Maintenance Expenditure for the first half of FY 2015/16
204.62
46.63 46.3229.79 23.97 19.91 14.99 13.53 7.68 4.46 3.75
0
50
100
150
200
250De
bt re
paym
ent
Hosp
italit
y an
d su
pplie
s
Dom
estic
and
fore
ign
trave
l
Utili
ties a
nd su
pplie
s
Othe
r ope
ratin
g ex
pens
es
Insu
ranc
e cos
ts
Spec
ialise
d m
ateria
lssu
pplie
s
Fuel
and
lubr
icant
s
Rent
als o
f pro
duce
d as
sets
Prin
ting
and
adve
rtisin
g
Offic
e and
gen
eral
supp
lies
Ksh
s.mill
ions
Major Categories of O and M Expenditure
Source: Mombasa County Treasury
The aggregate expenditure on domestic and foreign travel was Kshs.46.32 million compared to Kshs.9.05 million incurred in a similar period of FY 2014/15, representing a significant increase of 411.8per cent. This expenditure comprised of Kshs.42.54 million spent by the County Executive and Kshs.3.78 million by the County Assembly.
3.28.7 Development Expenditure Analysis
The details of development expenditure during the first half of FY 2015/16 are provided in figure 3.112.
Figure 3.112: Mombasa County, Summary of Development Expenditure for the first half of FY 2015/16
364.43
186.15
69.34 61.11 48.24 31.48 24.32 22.64 21.48 15.14 4.21 3.82
0.00
50.00
100.00
150.00
200.00
250.00
300.00
350.00
400.00
Const
ructio
n and
main
tenan
ce of
roads
Civil
work
s
Lighti
ng eq
uipme
nt
sanita
tion w
orks
Purch
ase of
furni
ture
land a
nd ho
using
Educ
ation
al aid
es eq
uipme
nts
Purch
ase of
polic
e and
secu
rityeq
uipme
nt
Purch
ase of
moto
r veh
icles
Agric
ultura
l mate
rials
Touri
sm de
velop
ment
Sport
s fac
ility
Kshs
.Milli
ons
Major Categories Of Development Expenditure
Source: Mombasa County Treasury

COUNTY GOVERNMENTS BUDGET IMPLEMENTATION REVIEW REPORT FIRST HALF FY, 2015/16 207
Analysis of the development expenditure of Kshs.852.36 million in the first half of FY 2015/16 indicates that the Roads and Public Works department had the highest expenditure of Kshs.364.43 million which was spent on construction and rehabilitation of roads. The second highest expenditure was incurred by the ministry of roads and public works where Kshs.232.18 million was spend under various civil works. The third highest expenditure amounting to Kshs.69.34 million was incurred under the Ministry of Environment, Water and Natural Resources during the street lightning projects. The fourth highest expenditure amounting to Kshs.61.11 million was incurred by the ministry of environment, water and natural resources on various sanitation works. The office of the governor incurred Kshs.48.24 million on purchase of office related equipment.
3.28.8 Annual Budget and Budget Performance Analysis by department for the first half of FY 2015/16
A summary of the FY 2015/16 annual budget estimates and budget performance for the first half by Department is as shown in Table 3.56.
Table 3.56: Mombasa County, Annual Budget and First Half of FY 2015/16 Budget Performance by Department
DepartmentAnnual Budget
Allocation (Kshs.Million)
6-Months Exche-quer Issues (Kshs.
Million)
6-Months Ex-penditure (Kshs.
Million)
Expenditure to Exchequer issues
(%)
Absorption rate (%)
Rec Dev Rec Dev Rec Dev Rec Dev Rec Dev
County Assembly 683.77 35.00 211.38 0.00 227.96 0.00 107.8 33.3 0.0
County Executive 878.25 273.00 311.22 33.00 313.77 49.60 100.8 150.3 35.7 18.2
Public Service Board 68.70 21.20 25.13 0.50 21.06 0.00 83.8 0.0 30.7 0.0
Agriculture 202.18 114.69 72.21 17.30 52.44 13.82 72.6 79.9 25.9 12.0
Lands, Housing & Physi-cal Planning 217.98 100.50 71.08 9.00 76.99 5.12 108.3 56.9 35.3 5.1
Water, Environment & Natural Resources 442.42 327.70 186.17 30.00 223.69 12.00 120.2 40.0 50.6 3.7
Trade, 381.58 247.82 156.09 21.00 116.21 0.00 74.5 0.0 30.5 0.0
Education 249.79 431.79 110.10 63.98 90.69 33.94 82.4 53.0 36.3 7.9
Health Services 2241.13 503.52 953.81 109.34 780.46 3.55 81.8 3.2 34.8 0.7
Finance and Economic Planning 630.72 657.48 220.95 189.47 346.17 455.19 156.7 240.2 54.9 69.2
Youth, Gender and Sports 130.84 599.69 40.63 105.00 43.15 10.60 106.2 10.1 33.0 1.8
Transport and Infrastruc-ture 521.22 718.20 222.41 173.67 162.34 268.52 73.0 154.6 31.1 37.4
Tourism and Betting Control 103.31 134.87 30.36 11.50 18.43 0.00 60.7 0.0 17.8 0.0
Total 6751.95 4165.51 2611.54 763.76 2473.36 852.34 94.7 111.6 36.6 20.5
Source: Mombasa County Treasury
COUNTY GOVERNMENTS BUDGET IMPLEMENTATION REVIEW REPORT FIRST HALF FY, 2015/16208
Analysis of budget performance by Department shows that the Department of Finance and Economic Planning reported the highest absorption rate of its development budget at 69.2 per cent while the Department of Health Services registered the lowest absorption rate at 0.7 per cent. On the other hand, the Department of Tourism and Betting Control, Trade and Public Service Board did not incur any expenditure even though they requisitioned funds for development activities. The Finance and Economic Planning had the highest percentage of recurrent expenditure to its recurrent budget at 54.9 per cent while the department of Tourism and betting control had the lowest percentage at 17.8 per cent.
3.28.9 Borrowing by the County Government
Article 212 of the Constitution requires a county government to borrow with approval from the County Assembly, and only if the national government guarantees the loan. Further, Section 58 of the PFM Act 2012 gives the Cabinet Secretary to the National Treasury the powers to guarantee loans subject to approval by Parliament. During the period under review, the County utilized its equitable share and local revenue collection deposited into the County Revenue Fund account maintained at the Central Bank of Kenya and did not borrow any funds.
3.28.10 Observations and Recommendations
The County has made progress in addressing the challenges previously identified as affecting budget implementation. The County has:
i. Registered an improvement in absorption of development funds from 4.6 per cent in the first half of FY 2014/15 to 20.5 per cent in the first half of FY 2015/16.
ii. Embraced use of IFMIS to process financial transactions and enhanced user capacity for effective application of the system.
iii. Adhered to the budgeting and planning timelines as provided for in the PFM Act 2012.
Despite the progress made, the following challenges continued to hamper effective budget implementation;
1. Low local revenue collection against annual targets. The local collections accounted for 14.5 per cent of annual target. This implies that some planned activities may not be undertaken due to lack of funding.
2. Delay in disbursement of funds by the National Treasury which led to inability to pay suppliers in time.
3. The County did not factor into the budget all conditional grants as provided for in the CARA 2015. The grants included; free maternal health care and Road Maintenance Fuel Levy Fund.

COUNTY GOVERNMENTS BUDGET IMPLEMENTATION REVIEW REPORT FIRST HALF FY, 2015/16 209
The County should implement the following recommendations in order to improve budget execution:
1. The County Treasury should review its revenue collection measures to enhance revenue collection.
2. The County should liaise with the National Treasury to ensure that the County’s equitable share is disbursed in line with CARA 2015 disbursement schedule.
3. The County Treasury should prepare and submit to the County Assembly a Supplementary Budget for approval factoring in the conditional grants as per CARA, 2015.
3.29 Murang’a County
3.29.1 Overview of the FY 2015/16 Budget
The FY 2015/16 first Supplementary Budget for Murang’a County amounted to Kshs.6.90 billion, with Kshs.3.55 billion (51.4 per cent) allocated for recurrent expenditure and Kshs.3.35 billion (48.6 per cent) for development expenditure.
In order to finance the budget, the County expected to receive Kshs.5.36 billion (77.3 per cent) as transfers from the National Government, collect Kshs.850.0 million (12.3 per cent) from local sources, Kshs.432.99 million (6.2 per cent) as projected cash balance from FY 2014/15, receive a conditional grant of Kshs.24.81 million (0.4 per cent) from DANIDA, and receive a conditional grant of Kshs.266.56 million (3.8 per cent) from the National Government as contained in CARA, 2015, to cater for; forgone user fees, compensation for user fees forgone, leasing of medical equipment and road maintenance fuel levy fund.
3.29.2 Revenue Analysis
In the first half of FY 2015/16, the County received Kshs.2.28 billion revenue from the National Government as equitable, Kshs.12.41 million as DANIDA grant, Kshs.34.36 million as conditional allocations for fuel levy fund, Kshs.32.75 million as conditional allocations for free maternal health care, Kshs.8.21 million as conditional allocations for forgone user fees, raised Kshs.220.17 million from local sources, and had an actual cash balance of Kshs.432.99 million brought forward from FY 2014/15.
The trend of local revenue collection from FY 2013/14 to the second quarter of FY 2015/16 is shown in figure 3.113.

COUNTY GOVERNMENTS BUDGET IMPLEMENTATION REVIEW REPORT FIRST HALF FY, 2015/16210
Figure 3.113: Murang’a County, Trend in Local Revenue Collection by Quarter from the FY2013/14 to the second quarter of FY 2015/16
0
50
100
150
200
250
Qrt 1 Qrt 2 Qrt 3 Qrt 4 Qrt 1 Qrt 2 Qrt 3 Qrt 4 Qrt 1 Qrt 2
FY2013/14 FY2014/15 FY2015/16
Ksh
s. M
illio
ns
Reporting Period
Source: Murang’a County Treasury
The local revenue consisted of Kshs.109.73 million raised in the first quarter and Kshs.110.44 million in the second quarter. The local revenue raised in the first half of the FY 2015/16 was Kshs.220.33 representing 25.9 per cent of the annual local revenue target, an improvement from Kshs.206.09 million collected in a similar period of FY 2014/15.
The analysis of local revenue by stream is shown in Table 3.57.
Table 3.57: Muranga County, Analysis of revenue collection per stream for the first half of FY 2015/16
No. Revenue Stream Annual Targeted Revenue (Kshs.)
Six Months Actual Revenue
(Kshs.)
Revenue Per-formance (%)
A B C D=*100
Defunct Local Authority Sources 1. Plan Approval 13,798,813 7,712,493 55.92. Land Sub Division/Transfer 10,530,000 5,585,400 53.0
3. Finance Income (Coffee/Tea Cess, penalties, etc.) 37,064,691 18,178,106 49.0
4. Parking/Bus Park Fee 74,089,114 25,982,320 35.15. Liquor Licences 35,773,200 12,571,300 35.16. Barter Market Fee 72,211,245 24,994,810 34.67. Building Materials & Other Cess 103,214,900 34,631,330 33.68. Motor Bikes 13,612,140 4,549,320 33.49. Other revenue streams 94,528,210 14,348,223 15.210. Land Rate 72,905,120 8,359,009 11.511. Single Business Permit 138,000,000 11,304,345 8.2Sub-Total for Defunct Local Authorities Sources 665,727,433 168,216,656 25.3

COUNTY GOVERNMENTS BUDGET IMPLEMENTATION REVIEW REPORT FIRST HALF FY, 2015/16 211
No. Revenue Stream Annual Targeted Revenue (Kshs.)
Six Months Actual Revenue
(Kshs.)
Revenue Per-formance (%)
A B C D=*100Devolved Units Sources 1. Water 232,450 391,903 168.62. Trade-Weight & Measures 1,250,740 596,200 47.73. Fisheries 187,034 79,880 42.74. Meat Inspection 14,355,305 5,139,730 35.85. Hospitals /H.C 119,470,312 36,139,556 30.26. Public Health 20,511,324 6,029,390 29.47. Education & Polytechnics 1,368,450 343,950 25.18. Livestock(A.I) 15,402,748 2,171,710 14.19. Land Housing & Physical Planning 5,005,115 616,456 12.310. Veterinary & Clinical Services 4,848,859 544,570 11.211. Cooperatives (Audit) 1,640,230 57,060 3.5
Sub-Total for Devolved Units 184,272,567 52,110,405 28.3
Grand Total Revenue 850,000,000 220,327,061 25.9Source: Murang’a County Treasury
The analysis of revenue by stream indicates that plans approval generated the highest per cent of revenue against target at 55.9 per cent followed by land sub-division and transfers at 53.0 per cent for the revenue streams adopted from defunct local authorities. Water as a revenue stream generated the highest percentage of revenue against target at 168.6 per cent followed by Trade-Weight & Measures at 47.7 per cent for the streams adopted from the devolved units. The analysis reveals that only 25.9 per cent of local revenue target has been achieved as at 31st December, 2015 where the worst performing revenue streams are Single Business Permit at 8.5 per cent and cooperative (audit) at 3.5 per cent.
3.29.3 Banking of local revenue
In the first half of FY 2015/16, the County banked all the locally generated revenue intact into the CRF. This conforms to Article 207 of the Constitution and Section 109 of the PFM Act 2012, which stipulate that all funds raised or received by or on behalf of the County Government should be deposited into the CRF account, unless excluded by an Act of Parliament.
3.29.4 Exchequer Issues
The Controller of Budget authorised withdrawal of Kshs.2.95 billion from the CRF account, which was 42.7 per cent of the approved budget. The amount represented a slight increase of 0.02 per cent from Kshs.2.85 billion authorized in a similar period of FY 2014/15 and consisted of Kshs.1.65 billion (56.0 per cent) for recurrent expenditure and Kshs.1.30 billion (44.0 per cent) for development activities.

COUNTY GOVERNMENTS BUDGET IMPLEMENTATION REVIEW REPORT FIRST HALF FY, 2015/16212
3.29.5 Overall Expenditure Review
The County spent a total of Kshs.2.92 billion during the first half of FY 2015/16 which was 98.9 per cent of the released for operations. This was an improvement from the Kshs.2.58 billion spent in a similar period of FY 2014/15. A total of Kshs.1.64 billion was spent on recurrent activities and Kshs.1.28 billion on development activities. Recurrent expenditure was 99 per cent of the funds released for recurrent activities while development expenditure accounted for 98.9 per cent of the funds released for development activities. The expenditure excludes commitments as of 31st December, 2015 that amounted to Kshs.1.08 billion for development and Kshs.30.67 million for recurrent expenditure as per the IFMIS reports.
Recurrent expenditure for the period under review represented 46.1 per cent of the approved annual recurrent budget, a decrease from 49.8 per cent spent in a similar period of FY 2014/15. On the other hand Development expenditure recorded an absorption rate of 38.3 per cent, an improvement from 28.4 per cent spent in a similar period of FY 2014/15. A comparison of the total expenditure in the first of FY 2014/15 and the first of FY 2015/16 is shown in Figure 3.114.
Figure 3.114: Murang’a County, Expenditure by Economic Classification for First Half of FY 2014/15 and for First Half of FY 2015/16
1,060.12
534.72
980.41
1,312.21
323.38
1,282.41
0
200
400
600
800
1,000
1,200
1,400
Personnel Emoluments Operations & Maintenance Development Expenditure
Ksh
s. M
illi
ons
Expenditure by Economic Classification
1st Half of FY 2014/15
1st Half of FY 2015/16
Source: Murang’a County Treasury
3.29.6 Recurrent Expenditure Analysis
The total recurrent expenditure was Kshs.1.64 billion against a total of budget of Kshs.3.55 billion representing an absorption rate of 46.1 per cent. The County spent Kshs.1.31 billion (79.9per cent) on personnel emoluments and Kshs.323.38 million (19.8 per cent) on operations and maintenance as shown in Figure 3.114. Expenditure on personnel emoluments accounted for 56.2per cent of total expenditure and has increased significantly in the first half of FY 2015/16

COUNTY GOVERNMENTS BUDGET IMPLEMENTATION REVIEW REPORT FIRST HALF FY, 2015/16 213
as compared to a similar period of FY 2014/15 when the County spent Kshs.1.06 billion. The increase is attributed to employment of health personnel under the Economic Stimulus Program (ESP) strike, adoption of personnel in Youth ministry ESP who were previously in National government payroll, and appointments of various officers and casuals to support coffee program, milk value chain including those working in coolers and alcohol directorate and anti-alcohol campaigns.
The County spent Kshs.14.16 million on sitting allowances to the 49 MCAs and the Speaker against an annual budget of Kshs.117.73 million. This was a decrease from Kshs.36.34 million recorded in a similar period of FY 2014/15. The average monthly sitting allowance per MCA was Kshs.47,202 compared to SRC’s recommended monthly ceiling of Kshs.124, 800.
A breakdown of the operations and maintenance expenditure for the reporting period is shown in Figure 3.115.
Figure 3.115: Murang’a County, Operations and Maintenance Expenditure for the first half of FY 2015/16
88.04
62.46 56.1439.66
32.66 26.5417.04
0.84 - 10 20 30 40 50 60 70 80 90
100
Loc
al &
Inte
rnat
iona
lT
rave
ls
Off
ice
Util
ities
&G
ener
al S
uppl
y
Oth
er O
ffic
eO
pera
tions
Hos
pita
lity
and
Tra
inin
gs
Publ
icat
ions
, Pri
ntin
g &
Adv
ertis
men
ts
Rou
tine
Mai
nten
ance
and
Insu
ranc
e
Fees
, int
eres
ts &
Cha
rges R
enta
l
Source: Murang’a County Treasury
The aggregate expenditure on domestic and foreign travel was Kshs.88.04 million compared to Kshs.68.25 million incurred in a similar period of FY 2014/15, representing a marginal decrease of 29.0 per cent. This expenditure comprised of Kshs.57.25 million spent by the County Executive and Kshs.30.38 million by the County Assembly.
3.29.7 Development Expenditure Analysis
The details of development expenditure during the first half of FY 2015/16 are provided in figure 3.116.

COUNTY GOVERNMENTS BUDGET IMPLEMENTATION REVIEW REPORT FIRST HALF FY, 2015/16214
Figure 3.116: Murang’a County, Summary of Development Expenditure for the first half of FY 2015/16
163.60155.59
136.18 128.82120.00 118.41 117.38
101.99
58.47 51.3635.29 26.92 23.36 23.23 19.30
2.51 - 20 40 60 80
100 120 140 160 180
Cur
ativ
e, P
reve
ntiv
e, P
rom
otiv
eH
ealth
Pro
gram
s &
Hea
lth…
Milk
Val
ue C
hain
Pro
gram
Phar
ms,
Non
-Pha
rms
and
Rel
ated
Cov
erG
rave
lling
Wor
ks a
nd g
radi
ngof
acc
ess
road
s
Rep
aym
ent o
f B
ank
Ove
rdra
ft
Stud
ent S
chol
arsh
ip a
nd C
ount
yE
xam
sC
omm
unity
wat
er p
roje
cts
/wat
er d
istr
ibut
ion
Roa
ds, W
ater
and
Mar
ket
Impr
ovem
ent P
roje
cts
Oth
ers
Dev
elop
men
t act
iviti
es
Cas
h cr
ops
& F
ood
Secu
rity
prog
ram
s (S
uppo
rt to
…C
ultu
re, Y
outh
& S
port
spr
ogra
ms
Agr
ibus
ines
s, T
rade
and
Tou
rsim
Pro
ject
s R
efer
ral a
nd a
mbu
lanc
ese
rvic
es
Agr
o in
dust
rial
par
k
Liv
esto
ck D
evel
opm
ent
Prog
ram
s H
ortic
ultu
re C
rops
(A
voca
do,
Fren
ch B
eans
and
Man
goes
)…
Ksh
s.m
illio
n
Major Categories of Development Expenditure
Source: Murang’a County Treasury
Analysis of the development expenditure of Kshs.1.28 billion incurred in the first half of FY 2015/16 indicates that the Energy, Transport, Water and Infrastructure department had the highest expenditure of Kshs.347.75 million which was spent on development and maintenance of access roads, markets and water related projects. The second highest expenditure of Kshs.312.45 million was incurred by the Health department; out of which Kshs.246.7 million was spent on curative health services. The department of Youth, Culture, Social Services and Cooperatives incurred Kshs.155.59 million on the milk value chain development program while the department of Finance and Planning spent Kshs.120 million on repayment of a bank overdraft facility that was classified as a development item.
3.29.8 Annual Budget and Budget Performance Analysis by department for the First Half of FY 2015/16
A summary of the FY 2015/16 annual budget estimates and budget performance for the first half by department is as shown in Table 3.58.

COUNTY GOVERNMENTS BUDGET IMPLEMENTATION REVIEW REPORT FIRST HALF FY, 2015/16 215
Table 3.58: Murang’a County, Annual Budget and First Half of FY 2015/16 Budget Performance by Department
Department
Annual Budget Allocation (Kshs.
Millions)6 Months Exche-
quer Issues (Kshs. Millions)
6 Months Expen-diture (Kshs.
Million)
% of Expendi-ture to Exche-
quer Issues
Absorption rate (%)
Rec Dev Rec Dev Rec Dev Rec Dev Rec Dev
Finance, ICT and Economic Planning 276.20 140.70 117.30 41.00 108.70 127.00 92.7 309.8 39.4 90.3
Education and Technical Train-ing 172.80 167.70 73.10 12.00 81.40 130.50 111.4 1087.6 47.1 77.8
Commerce, Trade Industry and Tourism 6.10 95.00 3.20 74.00 0.50 58.60 15.6 79.2 8.2 61.7
Health and Sanitation 1252.20 631.50 617.30 319.10 781.60 312.50 126.6 97.9 62.4 49.5
Agriculture, Livestock and Fisheries 141.30 136.50 76.40 54.70 36.70 60.30 48.0 110.2 26.0 44.2
Youth, Culture, Gender, Social & Cooperative 49.70 610.10 20.40 247.80 19.20 244.80 94.1 98.8 38.6 40.1
Energy, Transport and Infra-structure 54.70 1215.70 25.60 484.30 12.10 347.80 47.3 71.8 22.1 28.6
Lands, Housing and Physical Planning 11.30 33.30 5.30 32.20 2.50 1.00 47.2 3.1 22.1 3.0
Office of the Governor and Deputy Governor 218.40 6.10 99.90 0.00 80.30 - 80.4 - 36.8 -
Public Service and Adminis-tration 727.60 24.30 387.90 5.00 295.20 - 76.1 - 40.6 -
County Assembly 589.00 255.60 201.80 0.00 207.00 - 102.6 - 35.1 -
County Public Service Board 40.00 5.50 20.70 0.00 6.00 29.0 15.0
Environment and Natural Resources 9.10 29.90 3.70 27.00 4.60 - 124.3 - 50.5 -
Total 3548.40 3351.80 1652.40 1297.10 1635.60 1282.40 99.0 98.9 46.1 38.3
Source: Murang’a County Treasury
An analysis of budget performance by department shows that the Department of Finance, IT and Economic Planning reported the highest absorption rate of its development budget at 90.3 per cent while the Office of the Governor and Deputy Governor, Environment and Natural Resources, Public Service and Administration, County Public Service Board and County Assembly did not incur any expenditure. On the other hand, the Health and Sanitation department had the highest percentage of its recurrent expenditure to its recurrent budget at 62.4 per cent while the department of Environment and Natural Resources had the lowest percentage at 8.2 per cent.
The County spent funds on votes that they had not received exchequer approval by COB. This is depicted by expenditure to exchequer releases of over 100 per cent. As shown in Table 3.58, the department of Finance, ICT and planning spent 309.8 per cent, Education and Technical Training department at 111.4 per cent and 1087.6 per cent for recurrent and development votes respectively.

COUNTY GOVERNMENTS BUDGET IMPLEMENTATION REVIEW REPORT FIRST HALF FY, 2015/16216
3.29.9 Borrowing by the County Government
During the period under review, the County did not borrow but had an outstanding bank overdraft facility of Kshs.200 million in Kenya Commercial Bank. This borrowing was not in line with Section 107 (3) of the PFM Act 2012, on short term borrowing. The County did not pay back the overdraft within the stipulated time, but subsequently repaid Kshs.120 million in the second quarter of FY 2015/16.
3.29.10 Observations and Recommendations
The county has made progress in addressing the challenges previously identified as affecting budget implementation. The County has:
i. Registered improvement in absorption of development funds from 28.4 per cent in the first half of FY2014/15 to 38.3 per cent in the first half of FY 2015/16.
Despite the progress made, the following challenges continued to hamper effective budget implementation;
1. Underperformance of local revenue against set target. The County raised Kshs.220.17 million against an annual target of Kshs.850 million.
2. Delay in the enactment of the finance bill, which may affect the realization of the local revenue target.
3. Transfer of funds to commercial banks by the County Assembly that has enabled use of manual system to process financial transactions. This is prone to abuse and is against the set government standards of processing financial transactions.
The County should implement the following recommendations in order to improve budget execution
1. The County Treasury should devise strategies to enhance local revenue collection.
2. The County Treasury should fast track enactment of the finance bill to provide the requisite framework for revenue collection.
3. The County Assembly should adopt the IFMIS spending framework as spelt out in the PFM Act 2012 in order to enhance transparency and accountability on the use of public funds.
3.30 Nairobi City County
3.30.1 Overview of the FY 2015/16 Budget
The FY 2015/16, the approved budget for Nairobi City County amounted to Kshs.30.83 billion, with Kshs.19.82 billion (64.3 per cent) allocated to recurrent expenditure and Kshs.11.01 billion (35.7 per

COUNTY GOVERNMENTS BUDGET IMPLEMENTATION REVIEW REPORT FIRST HALF FY, 2015/16 217
cent) to development expenditure.
In order to finance the budget, the County expect to receive Kshs.13.77 billion (44.7 per cent) as transfers from the National Government, collect Kshs.17.53 billion (56.9 per cent) from local sources. The County did not budget for the additional conditional allocations from the National Government and from the Development Partners as provided for in CARA, 2015. The allocations include a conditional grant of Kshs.27.80 million from DANIDA, additional conditional grants of Kshs.636.58 million from the National Government for free maternal care, compensation for user fees forgone, and Road Maintenance Fuel Levy Fund.
3.30.2 Revenue Analysis
In the period July 2015 to December 2015, the County received Kshs.6.56 billion from the National Government as equitable, Kshs.6.75 million as conditional allocations for forgone user fees, Kshs.140.52 million as conditional allocations for free maternal health care, Kshs.83.38 million as conditional allocations from the road maintenance fuel levy fund, and raised Kshs.4.97 billion from local sources. The trend of local revenue collection by quarter from FY 2013/14 to the first half of FY 2015/16.
Figure 3.117: Nairobi County, Trend in Local Revenue collection by Quarter from FY 2013/14 to first quarter, FY 2015/16
4.414.88
0
0.5
1
1.5
2
2.5
3
3.5
4
4.5
5
Ksh
s.b
illio
n
Reporting period
Source: Nairobi City County
The local revenue raised in the half quarter was Kshs.4. 97 billion which is an increase from Kshs.4.32 billion collected during a similar period in FY 2014/15. The local revenue raised in the period under review accounted for 28.3 per cent of the annual local revenue target.
The summary of local revenue realized by stream is shown in Table 3.59.

COUNTY GOVERNMENTS BUDGET IMPLEMENTATION REVIEW REPORT FIRST HALF FY, 2015/16218
Table 3.59: Nairobi City County, Analysis of revenue collection per stream for the first half of FY 2015/16
No. Revenue Stream Annual Targeted Revenue (Kshs.)
6 months Actual Revenue (Kshs.)
Revenue Per-formance (%)
A B C D=C/B*100
1 Rates 3,400,000,000 1,016,997,463 29.9
2 Parking Fees 3,400,000,000 1,016,642,235 29.9
3 Buildings Permits (1.25 per cent of const. Cost) 1,850,000,000 648,293,803 35.0
4 Single Business Permits 2,870,000,000 584,912,225 20.4
5 Billboards & Adverts 1,300,000,000 270,220,322 20.8
6 Rents 374,000,000 149,451,375 40.0
7 Eastlands 330,000,000 140,741,921 42.6
8 Decentralization-wards 237,000,000 106,045,785 44.7
9 Regulation of buildings /Change 150,000,000 71,089,700 47.4
10 Liquor Licenses 650,000,000 68,663,690 10.6
11 Other markets 187,000,000 61,860,476 33.1
12 Wakulima Market 165,000,000 59,024,950 35.8
13 Fire inspection Certificate 154,000,000 57,289,998 37.2
14 Lease fees – NWSC 224,000,000 32,936,834 14.7
15 Pumwani Maternity Hospital 154,000,000 3,887,264 2.5
16 Co-operative Development 215,000,000 2,167,290 1.01
17 Food Handlers Certificate 163,000,000 18,000 0.01
18 other Revenue streams 1,705,000,000 675,535,896 39.6
Total 17,528,000,000 4,965,779,227 28.3
Source: Nairobi City County Treasury
The breakdown of revenue per stream indicates that Regulation of building/Change recorded the highest percentage at 47.4 followed by Decentralization-wards at 44.7 per cent
3.30.3 Banking of local revenue
A review of the bank statements for the revenue collection accounts indicates that the County did not bank all the locally generated revenue intact into the CRF during the period under review. This is in contravention to Article 207 of the Constitution and Section 109 of the PFM Act 2012, which stipulates that all funds raised or received by or on behalf of the County Government should be deposited into the CRF account, unless excluded by an Act of Parliament.
3.30.4 Exchequer Issues
During the reporting period, the County accessed Kshs.6.93 billion from the CRF, which was 22.5 per cent of the annual budget, an increase from 0.92 per cent as compared to a similar period of FY 2014/15. This amount consisted of Kshs.6.85 billion (98.8 per cent) for recurrent expenditure and Kshs.80 million (1.2 per cent) for development activities.

COUNTY GOVERNMENTS BUDGET IMPLEMENTATION REVIEW REPORT FIRST HALF FY, 2015/16 219
3.30.5 Overall Expenditure Review
The County spent a total of Kshs.11.45 billion in the period under review which was 165.3 per cent of the total funds released for operations, an increase from Kshs.2.21 billion spent in a similar period in FY 2014/15. A total of Kshs.9.16 billion (80.0 per cent) was spent on recurrent activities while Kshs.2.29 billion (20.0 per cent) on development activities. Recurrent expenditure was 133.8 per cent of the funds released for recurrent activities while development expenditure accounted for 2859.0 per cent of the funds released for development activities.
The recurrent expenditure for the period under review represented an absorption rate of 46.2 per cent, a marginal increase from an absorption rate of 1.4 per cent realized in similar period FY 2014/15 while development expenditure recorded an absorption rate of 20.8 per cent, increase an absorption rate of 14.4 per cent realized in the half quarter FY 2014/15. A comparison of the total expenditure between the FY 2014/15 and first half quarter of FY 2015/16 is shown in Figure 3.118.
Figure 3.118: Nairobi City County, Expenditure by Economic Classification for FY 2014/15 and 1st Quarter, FY 2015/16.
6.90
1.380.57 0.39
6.68
1.832.29
0.65
0.001.002.003.004.005.006.007.008.00
Personnel Emolument Operation &Maintenance
Development Debt Repayment
Kshs
.bill
ion
Expenditure by Economic Classification
1st Half of FY 2014/15
1st Half of FY 2015/16
Source: Nairobi City County Treasury
3.30.6 Recurrent Expenditure Analysis
Analysis of the recurrent expenditure of Kshs.9.16 billion shows that the County spent Kshs.6.68 billion (72.9 per cent) on personnel emoluments and Kshs.2.29 billion (25.0 per cent) on operations and maintenance and Kshs.653.51 million (7.1 per cent) on debt repayment as shown in Figure 3.118. Expenditure on personnel emoluments accounted for 58.3 per cent of total expenditure and has decreased significantly from 79.6 per cent reported in a similar period in in FY 2014/15.
The County spent Kshs.66.78 million on sitting allowances to 127 MCAs and the Speaker against the annual MCAs sitting allowance budget of Kshs.207.24 million, a decline from Kshs.22.45 million spent in a similar period of FY 2014/15. The average monthly sitting allowance per MCA was Kshs.86,953 compared to SRC recommended monthly ceiling of Kshs.124, 800.
A breakdown of operations and maintenance expenditure for the first quarter FY 2014/15 is shown in Figure 3.119.

COUNTY GOVERNMENTS BUDGET IMPLEMENTATION REVIEW REPORT FIRST HALF FY, 2015/16220
Figure 3.119: Nairobi City County, Operations and Maintenance Expenditure for the first half of FY 2015/16
Source: Nairobi County Treasury
Total expenditure on domestic and foreign travel was Kshs.286.99 million compared to Kshs.173.67 million in similar period in FY 2014/15, representing an increase of 65.3 per cent. The expenditure comprised of Kshs.153.34 million spent by the County Executive and Kshs.133.65 million by the County Assembly.
3.30.7 Development Expenditure AnalysisDetails of development expenditure during the first half of FY 2015/16 are provided in figure 3.120.
Figure 3.120: Nairobi City County, Summary of Development Expenditure for the First Half of FY 2015/16
Source: Nairobi County Treasury
Analysis of the development expenditure of Kshs.2.29 billion incurred in the period under review indicates that the County incurred the highest expenditure of Kshs.852.99 million on construction and maintenance of Roads and drainage works. The second highest expenditure of Kshs.449.96 million was incurred on refurbishment of Health Centres in the County.
852.99
449.96
199.80 180.85 142.80 131.07 104.18 76.98 69.42 44.53 34.680.0
150.0300.0450.0600.0750.0900.0
Road
s an
ddr
aina
ges
Refu
rbish
men
t of
Hea
lth c
entre
s
Purc
hase
of M
otor
Veh
icle
s and
tract
ers
Oth
er In
frastr
uctu
rean
d Ci
vil W
orks
othe
r pro
ject
City
con
struc
tion
ofop
en st
alls
Coun
ty A
ssem
bly
Reha
bilia
ttion
of
mar
kets
Reco
nstru
ctio
n of
City
par
k ha
wke
rsm
arke
t
Purc
hase
of m
edic
dent
al e
quip
men
ttru
ck a
nd tr
aile
rs
Stru
ctur
ed c
ablin
g
Ksh
s.mill
ions
Major Categories of Development Expenditure
Major Categories of O & M Expenditure

COUNTY GOVERNMENTS BUDGET IMPLEMENTATION REVIEW REPORT FIRST HALF FY, 2015/16 221
3.30.8 Annual Budget and Budget Performance Analysis by department for the First Half of FY 2015/16
A summary of the FY 2015/16 annual budget estimates and budget performance for the first half by department is shown in Table 3.60.
Table 3.60: Nairobi City County, Annual Budget and First Half of FY 2015/16 Budget Performance by Department
Department Annual Budget Allocation (Kshs.Million)
6-Months Exche-quer Issues (Kshs.
Million)
6-Months Expenditure (Kshs.Million)
6-Months Expen-diture to Exche-quer Issues (%)
Absorption rate (%)
Rec Dev Rec Dev Rec Rec Dev Rec Dev
County Public Ser-vice Board 80.00 20.00 14.99 0.00 22.29 0.00 148.7 27.9 0.0
Governor’s Office 4,488.72 379.00 1,839.75 0.00 2,211.96 31.84 120.2 49.3 8.4
ICT,E-Government & Public Communi-cations
144.00 150.00 36.73 0.00 54.20 42.64 147.6 37.6 28.4
Finance & Econom-ic Planning 2,773.39 127.00 622.70 0.00 1,329.33 9.39 213.5 47.9 7.4
Health 5,038.00 1,760.00 1,913.52 0.00 2,149.49 413.79 112.3 42.7 23.5
Physical Planning, Lands & Housing 375.00 320.00 153.76 0.00 178.91 87.49 116.4 47.7 27.3
Public Works & Infrastructure 1,355.00 6,205.00 464.24 0.00 535.30 853.00 115.3 39.5 13.7
Education ,Youth Af-fairs Social Services 1,534.00 436.00 572.12 0.00 673.10 58.54 117.6 43.9 13.4
Trade Cooperative, Industrialization 278.89 700.00 87.31 0.00 160.50 319.01 183.8 57.5 45.6
Public Service Management 1,016.92 30.00 117.50 0.00 320.54 0.00 272.8 31.5 0.0
Agriculture, Live-stock & Fisheries Development
288.00 50.00 91.51 0.00 123.26 21.89 134.7 42.8 43.8
Water, Energy, Envi-ronment Forestry & Natural Resources
893.78 688.00 260.89 0.00 713.37 345.45 273.4 79.8 50.2
County Assembly 1,553.56 144.43 672.00 80.00 687.83 104.18 102.4 130.2 44.3 72.1
TOTAL 19,819.26 11,009.43 6,847.02 80.00 9,160.08
2,287.23 133.8 2859.0 46.2 20.8
Source: Nairobi County Treasury
A breakdown of expenditure by department shows that the County Assembly recorded the highest absorption rate of its development budget at 72.1 per cent followed by the Department of Finance and Economic Planning had the lowest absorption rate of 7.4 per cent. On the other hand, the department of Water, Energy, Environment, and Forestry and Natural Resources highest percentage of its recurrent expenditure to its recurrent budget at 79.8 per cent while the County Public Service Board the lowest percentage of the recurrent expenditure to its recurrent budget at 27.9 per cent.

COUNTY GOVERNMENTS BUDGET IMPLEMENTATION REVIEW REPORT FIRST HALF FY, 2015/16222
3.30.9 Borrowing by the County Government
During the period under review, the County accessed a bank overdraft facility of Kshs.848.12 million without guarantee from National Government and approval from the County Assembly as stipulated in Article 212 of the Constitution and Section 58 of the PFM Act 2012. The County has however, repaid the overdraft.
3.30.10 Observations and Recommendations
In the period under review, the County made some progress in addressing challenges that affected budget implementation in the previous periods. The County has:
i. Embraced use of IFMIS to process financial transactions.
ii. Improved on local revenue collection in the reporting period compared to a similar period of FY 2014/15.
Despite the progress made, the following challenges continued to hamper effective budget implementation;
1. The County has persistently utilized locally collected revenue at source contrary to Article 207 of the Constitution and Section109 of the PFM Act 2012, which stipulates that all funds raised or collected on behalf of the County Government should be deposited into the CRF account.
2. The County Assembly has not fully adopted IFMIS in processing financial transactions. Some transactions are generated manually, which can lead to inaccurate reporting.
3. Low absorption development funds and slowed implementation of development activities.
The County should implement the following recommendation in order to improve budget execution:
1. The County Treasury should ensure that all local revenue collected is deposited into the County Revenue fund as stipulated in Section 109 of the PFM Act 2012.
2. The County Assembly should embrace use of IFMIS and Internet Banking Platform to process all their financial transactions as required in by the law for accuracy and transparency.
3. The County should come up with measures to address the low absorption of development funds.
3.31 Nakuru County
3.31.1 Overview of the FY 2015/16 Budget
The FY 2015/16 approved Supplementary Budget was Kshs.13.73 billion. It comprised of Kshs.8.36 billion (60.9 per cent) allocated for recurrent expenditure and Kshs. 5.38 billion (39.1 per cent) for development expenditure.

COUNTY GOVERNMENTS BUDGET IMPLEMENTATION REVIEW REPORT FIRST HALF FY, 2015/16 223
In order to finance the budget, the County expects to receive Kshs.8.12 billion (59.1 per cent) from the national equitable share, Kshs.95.74 million (0.7 per cent) from leasing of medical equipment, Kshs.103.1 million (0.8 per cent) being conditional allocation for fuel levy fund, Kshs.219.63 million (1.6 per cent) conditional allocation for maternal health care, Kshs.37.37 million (0.3 per cent) conditional allocation of forgone user fees, Kshs.25.26 million (0.2 per cent) conditional allocation for health facility DANIDA program, Kshs.377.19 million (2.7 per cent) conditional allocations for Level five (5) Hospital, Kshs.1.85 billion (13.5 per cent) being balance brought forward from FY 2014/15, and Kshs.2.91 billion (21.2 per cent) local revenue targets for FY 2015/16.
3.31.2 Revenue Analysis
In the first half of FY 2015/16, the County received Kshs.2.72 billion revenue from the National Government as equitable share, Kshs.126.36 million as conditional allocations for Nakuru Level 5 Hospital, Kshs.52.07 million as conditional allocations from the road maintenance fuel levy fund, Kshs.93.54 million as conditional allocations for free maternal health care, Kshs.9.34 million as conditional allocations for forgone user fees, raised Kshs.830.96 million from local sources, and had an actual cash balance of Kshs.1.85 billion brought forward from FY 2014/15.
The trend of local revenue collection from FY 2013/14 to the second quarter of FY 2015/16 is shown in figure 3.121.
Figure 3.121: Nakuru County, Trend in Local Revenue Collection by Quarter from the FY 2013/14 to the second quarter of FY 2015/16
293.50
394.78
200
300
400
500
600
700
Ksh
s.mill
ions
Reporting Period
Source: Nakuru County Treasury
The local revenue consisted of Kshs.436.18 million raised in the first quarter and Kshs.394.78 million in the second quarter. The local revenue raised in the first half of FY 2015/16 was Kshs.830.96 million representing 28.5 per cent of the annual local revenue target, a decline from Kshs.895.57 million collected in a similar period of FY 2014/15.
The analysis of local revenue by stream is shown in Table 3.61.

COUNTY GOVERNMENTS BUDGET IMPLEMENTATION REVIEW REPORT FIRST HALF FY, 2015/16224
Table 3.61: Nakuru County, Analysis of revenue collection per stream for the first half of FY 2015/16
Revenue Stream Annual Targeted Revenue (Kshs.)
Six Months Actual Revenue (Kshs.)
Revenue Perfor-mance (%)
A B C D=*100
Land Rates 110,000,000 93,074,756 84.6
Royalties 103,092,000 63,707,147 61.8
House Rent 50,000,000 23,458,090 46.9
Facility Improvement Fund 550,000,000 242,195,596 44.0
Enclosed Bus park fees 150,000,001 63,770,410 42.5
Signboards/signage/street names 50,000,000 16,839,753 33.7
Market Fee 105,000,000 30,540,290 29.1
Approval for Building plans 80,325,850 20,565,285 25.6
Daily Street Parking fee 265,000,000 66,148,520 25.0
Other sources 899,441,837 143,023,083 15.9
Single Business Permit 420,000,000 53,646,130 12.8
Agriculture Produce Cess 125,910,000 13,992,764 11.1
TOTAL 2,908,769,688 830,961,824 28.6
Source: Nakuru County Treasury
Analysis of revenue by stream indicates that Land Rates had the highest percentage of revenue collection against target at 84.6 per cent followed by Royalties at 61.8 per cent.
3.31.3 Banking of Local Revenue
A review of the bank statements for the revenue collection account indicated that all locally generated revenues were deposited into the CRF during the period under review. This conforms to Article 207 of the Constitution and Section 109 of the PFM Act 2012, which stipulates that all funds raised or received by or on behalf of the County Government shall be deposited into the CRF account unless excluded by an Act of Parliament.
3.31.4 Exchequer Issues
The COB authorised withdrawal of Kshs.5.03 billion from the CRF account, which was 36.6 per cent of the approved supplementary budget. The amount represented an increase of 20.05 per cent from Kshs.4.19 billion authorized in a similar period of FY 2014/15, and consisted of Kshs.4.02 billion (80.0 per cent) for recurrent expenditure and Kshs.1.01 billion (20.0 per cent) for development activities.

COUNTY GOVERNMENTS BUDGET IMPLEMENTATION REVIEW REPORT FIRST HALF FY, 2015/16 225
3.31.5 Overall Expenditure Review
The County spent a total of Kshs.4.75 billion during the first half of FY 2015/16 which was 94.5 per cent of the released for operations. This is a reduction from the Kshs.3.83 billion spent in a similar period of FY 2014/15. A total of Kshs.3.83 billion was spent on recurrent activities and Kshs.921.41 million on development activities. Recurrent expenditure was 95.2 per cent of the funds released for recurrent activities while development expenditure accounted for 91.6 per cent of the funds released for development activities.
Recurrent expenditure for the period under review represented 45.9 per cent of the annual recurrent budget, a slight decrease from 44.5 per cent spent in a similar period of FY 2014/15. On the other hand Development expenditure recorded an absorption rate of 17.1 per cent, a decrease from 19.6 per cent spent in a similar period of FY 2014/15. A comparison of the total expenditure in the first half of FY 2014/15 and the first half of FY 2015/16 is shown in Figure 3.122.
Figure 3.122: Nakuru County, Expenditure by Economic Classification for the First Half of FY 2014/15 and the First Half of FY 2015/16
1,183.74
351.14 370.43
2,378.60
1,453.13
921.41
-
500
1,000
1,500
2,000
2,500
Personnel Emoluments Operations & Maintenance Development Expenditure
Kshs
.mill
ions
Expenditure by Economic Classification
1st Half, FY 2014/15
1st Half, FY 2015/16
Source: Nakuru County Treasury
3.31.6 Recurrent Expenditure Analysis
The total recurrent expenditure was Kshs.3.83 billion against a total recurrent budget of Kshs.8.36 billion representing an absorption rate of 45.9 per cent of the recurrent budget. The County spent Kshs.2.38 billion (62.1 per cent) on personnel emoluments and Kshs.1.45 billion (37.9 per cent) on operations and maintenance as shown in Figure 3.122. Expenditure on personnel emoluments accounted for 50.0 per cent of total expenditure and has increased significantly in the first half of FY 2015/16 as compared to a similar period in FY 2014/15 when the County spent Kshs.1.18 billion. The increase is attributed to payment of salary arrears to the defunct local authorities’ staff and also employment of addition staff.
The County spent Kshs.34.23 million on sitting allowances to the 75 MCAs including the Speaker against an annual budget of Kshs.110.0 million, representing a marginal decrease from Kshs.36.50 million recorded in a similar period of FY 2014/15. The average monthly sitting allowance per MCA was Kshs.76,051 compared to SRC’s recommended monthly ceiling of Kshs.124,800.

COUNTY GOVERNMENTS BUDGET IMPLEMENTATION REVIEW REPORT FIRST HALF FY, 2015/16226
A breakdown of the operations and maintenance expenditure items for the reporting period is shown in Figure 3.123.
Figure 3.123: Nakuru County, Operations and Maintenance Expenditure for the first half of FY 2015/16
161.16 154.12
91.8076.93 72.66 70.73 62.61 58.07 50.50
37.5026.99 25.95 17.97 14.11
020406080
100120140160180
Dome
stic T
ravel
Drug
s and
Vac
cines
Non-P
ham
Items
DANI
DA
Train
ing C
ourse
s and
Exam
s
Comm
ittee M
eetin
gs
Lega
l Fee
s
Occa
siona
l Work
ers
Temp
orary
Comm
ittee
Forei
gn T
ravel
Enter
tainm
ent &
Cate
ring
Rent
& Ra
tes
Insura
nce-
Moto
r Veh
icles
Insura
nce-M
edica
l
Kshs
. Milli
on
Major Catergories of O&M Expenditure
Source: Nakuru County Treasury
The aggregate expenditure on domestic and foreign travel was Kshs.197.30 million compared to Kshs.146.94 million incurred in a similar period of FY 2014/15, representing an increase of 34.3 per cent. This expenditure comprised of Kshs.145.88 million spent by the County Executive and Kshs.51.82 million by the County Assembly.
3.31.7 Development Expenditure Analysis
A summary of development expenditure during the first half of FY 2015/16 is provided in figure 3.124.
Figure 3.124: Nakuru County, Summary of Development Expenditure for the first half of FY 2015/16
20.00 16.70
13.28 12.87 10.37 9.53 9.48 8.85 7.41
4.96 4.59 4.37 4.36 4.23
-
5.00
10.00
15.00
20.00
25.00
Supp
ly of
vacc
ines
Purch
ase o
f Doz
er
Reve
nue A
utoma
tion
Eletr
ifica
tions
Cons
tructi
on of
Nas
haM
arket
Shad
es
Cons
tructi
ons o
f Haw
kers
comp
lex
Supp
ly of
Fish
pond
liners
Patro
l Boa
ts
Purch
ase o
f Grad
ers
Cons
tructi
on of
Rive
r brid
ge
Spot
Impr
ovem
ent S
olai
Ward
Maw
aleno
wate
r pro
ject
Grad
ing m
arish
oni w
ard
Reno
vatio
n Res
identi
al
Kshs
. Mill
ions
Major Categories of Development Expenditure
Source: Nakuru County Treasury

COUNTY GOVERNMENTS BUDGET IMPLEMENTATION REVIEW REPORT FIRST HALF FY, 2015/16 227
Analysis of the development expenditure for the period under review shows that the County spent Kshs.20.0 million on purchase of vaccines, Kshs.16.70 million on purchase of bull dozer, Kshs.13.28 million on automation of revenue collection, Kshs.12.87 million on erection of high mask flood lighting, Kshs.10.37 million on construction of Nasha market shades, Kshs.9.53 million on construction of hawker’s complex at Biashara Nakuru East.
3.31.8 Annual Budget and Budget Performance Analysis by department for the first half of FY 2015/16
A summary of the FY 2015/16 annual budget estimates and budget performance for the first half by department is as shown in Table 3.62.
Table 3.62: Nakuru County, Annual Budget and First Half of FY 2015/16 Budget Performance by Department
DepartmentAnnual Budget
Allocation (Kshs. Millions)
6 Months Exchequer Issues (Kshs. Mil-
lions)
6 Months Expendi-ture (Kshs.Million)
% of Expendi-ture to Exche-
quer Issues
Absorption rate (%)
Rec Dev Rec Dev Rec Dev Rec Dev Rec Dev
Office of the Governor 228.81 57.55 125.65 4.00 153.61 4.36 122.2 109.1 67.1 7.6
County Assembly 792.84 284.59 505.08 - 327.7 - 64.9 - 41.3 -
Finance and Economic Planning 710.44 508.4 406.9 167 470.39 26.81 115.6 16.1 66.2 5.3
Public Service Manage-ment 880.93 88.65 434.15 - 384.39 4.18 88.5 - 43.6 4.7
Education, Sport, Youth & culture 660.93 777.07 189.92 147.51 171.64 94.2 90.4 63.9 26.0 12.1
ICT & E-Government 36.67 72.21 21.35 13.37 15.98 12.67 74.8 94.7 43.6 17.5
Health and Sanitation 3,575.73 755.07 1,628.49 158.96 1,691.26 133.94 103.9 84.3 47.3 17.7
Roads and Public Works 285.54 1,511.39 140.7 265.32 131.09 357.22 93.2 134.6 45.9 23.6
Lands, Housing & Physi-cal Planning 111.14 230.43 52.69 55.92 41.04 40.93 77.9 73.2 36.9 17.8
Public Service Board 80.25 5.39 45.23 5.39 44.81 - 99.1 - 55.8 -
Trade, Energy, Industrial-ization and Tourism 123.2 286.36 68.28 30.92 46.93 61.27 68.7 198.2 38.1 21.4
Environment and Natural Resources 326.85 568.75 181.69 108.16 145.83 112.61 80.3 104.1 44.6 19.8
Agriculture livestock & Fisheries 543.35 229.53 224.22 49.72 207.05 73.22 92.3 147.3 38.1 31.9
Total 8,356.67 5,375.41 4,024.35 1,006.28 3,831.73 921.41 95.2 91.6 45.9 17.1
Source: Nakuru County Treasury

COUNTY GOVERNMENTS BUDGET IMPLEMENTATION REVIEW REPORT FIRST HALF FY, 2015/16228
Analysis of budget performance by Department shows that the Department of Agriculture, Livestock and Fisheries reported the highest absorption rate of its development budget at 31.9 per cent while Public Service Board and County Assembly did not spend on development expenditure. On the other hand, the Office of the Governor and Deputy Governor and Department of Finance had the highest of their recurrent expenditure to their recurrent budgets at 67.1 per cent and 66.2 per cent respectively while the Department of Education, Sports, Youth & Culture had the lowest absorption rate for its recurrent budget at 26.0 per cent.
3.31.9 Borrowing by the County Government
During the period under review, the County did not borrow or seek a loan from any commercial bank or development partners. Article 212 of the Constitution requires a county government to borrow with approval from the County Assembly, and only if the national government guarantees the loan. Similarly, Section 58 of the PFM Act 2012, gives the Cabinet Secretary to the National Treasury the powers to guarantee loans subject to approval by Parliament. The County utilized its equitable share and local revenue collection deposited into the County Revenue Fund account maintained at the Central Bank of Kenya.
3.31.10 Observations and Recommendations
The County has made progress in addressing the challenges previously identified as affecting budget implementation. The County government has improved efficiency in revenue administration through automation of revenue collection.
Despite the progress made, the following challenges continued to hamper effective budget implementation;
1. Decline in absorption of development funds from 18.9 per cent achieved in a similar period of FY 2014/15 to 17.1 per cent achieved in the reporting period.
2. Continued increase in the debt level. The debt has increased from Kshs.2.05 billion reported at the end of FY 2014/15 to Kshs.3.95 billion as at the end of the first half of FY 2015/16.
3. High personnel emolument costs that constituted 50 per cent of the total expenditure.
4. Differences between the IFMIS generated report on development expenditure of Kshs.1.32 billion and the actual development projects reported separately by the County that summed up to Kshs.921.41 million. This may indicate capacity challenges in the use of IFMIS.
The County should implement the following recommendations in order to improve budget execution
1. The County should develop strategies to address the low absorption of development funds and ensure timely implementation of development projects.
2. The County public debt and obligations should be maintained at 20 per cent of the total budget as envisaged in section 107 (5) of PFM Act 2012. The current debt stands at 28.8 per cent of the

COUNTY GOVERNMENTS BUDGET IMPLEMENTATION REVIEW REPORT FIRST HALF FY, 2015/16 229
total budget.
3. The County Government’s wages and benefits to public officers should be contained at a sustainable level.
4. The County Treasury should liaise with the IFMIS Directorate to build capacity in the use of the system. In addition, the County Treasury should undertake reconciliations of the vouchers to IFMIS reports.
3.32 Nandi County
3.32.1 Overview of the FY 2015/16 Budget
The FY 2015/16 approved budget for Nandi County for FY 2015/16 amounted to Kshs.5.44 billion. It comprised of Kshs.2.78 billion (51.1 per cent) allocated for recurrent expenditure and Kshs.2.67 billion (48.9 per cent) for development expenditure.
In order to finance the budget, the County expected to receive Kshs.4.76 billion (87.5 per cent) as transfers from the National Government, collect Kshs.255.76 million (4.7 per cent) from local sources, and receive a conditional grant of Kshs.18.31 million (0.3 per cent) from DANIDA. However, Kshs.432.30 million representing the opening cash balance from FY 2014/15 which was factored in the FY 2015/16 budget. Further, the County did not budget for the additional conditional grants of Kshs.240.75 million from the National Government as contained in CARA, 2015 for free maternal care, compensation of forgone user fees, leasing of medical equipment and road maintenance fuel levy fund. The County should review its budget through a supplementary budget so as to reflect the updated revenue levels.
3.32.2 Revenue Analysis
In the first half of FY 2015/16, the County received Kshs.1.59 billion revenue from the National Government as equitable share, Kshs.9.16 million as DANIDA grant, Kshs.30.50 million as conditional allocations for fuel levy fund, Kshs.25.13 million as conditional allocations for free maternal health care, Kshs.12.76 million as conditional allocations for forgone user fees, raised Kshs.111.35 million from local sources, and had an actual cash balance of Kshs.432.30 million brought forward from FY 2014/15. The local revenue consisted of Kshs.47.60 million raised in the first quarter and Kshs.63.75 million in the second quarter.
The trend of local revenue collection from first quarter FY 2013/14 to the second quarter of FY 2015/16 is presented in Figure 3.125.

COUNTY GOVERNMENTS BUDGET IMPLEMENTATION REVIEW REPORT FIRST HALF FY, 2015/16230
Figure 3.125: Nandi County, Trend in Local Revenue Collection by Quarter from the FY 2013/14 to the second quarter of FY 2015/16
29.41 27.71
47.8643.48
57.7763.42
10
20
30
40
50
60
70
Ksh
s.mill
ions
Reporting Period
Source: Nandi County Treasury
The local revenue raised in the first half of the FY 2015/16 was 42.0 per cent of the annual local revenue target, an improvement from Kshs.73.6 collected in a similar period of FY 2014/15.
The summary of local revenue realized in the first half of FY 2015/16 per stream is shown in Table 3.63.
Table 3.63: Nandi County, Analysis of revenue collection per stream for the first half of FY 2015/16
No. Revenue Stream Annual Targeted Revenue (Kshs.)
Six Months Actual Revenue (Kshs.)
Revenue Performance (%)
A B C D=*100
1 (FIF)Maternity, inpatient 30,000,000 26,327,755 87.8
2 Parking Fees 33,642,700 16,850,587 50.1
3 Health and Sanitation 50,530,000 13,473,874 26.7
4 Land Rates 31,537,953 8,818,060 28
5 Kiborgok Tea Proceeds 20,100,000 7,785,000 38.7
6 Market Fees 11,300,000 5,751,892 50.9
7 Cess 13,800,000 2,141,868 15.5
8 Other Sources 64,854,300 29,876,348 46.1
Total 255,764,953 111,025,384 43.4
Source: Nandi County Treasury
(FIF)Maternity, inpatient recorded the highest percentage at 87.8 per cent followed by market fees at 50.9 per cent.

COUNTY GOVERNMENTS BUDGET IMPLEMENTATION REVIEW REPORT FIRST HALF FY, 2015/16 231
3.32.3 Banking of local revenue
A review of the bank statement for the first half of FY 2015/16, the County did bank all the locally generated revenue intact into the CRF. This conforms to Article 207 of the Constitution and Section 109 of the PFM Act 2012, which stipulates that all funds raised or received by or on behalf of the County Government should be deposited into the CRF account, unless excluded by an Act of Parliament.
3.32.4 Exchequer issues
The Controller of Budget authorised withdrawal of Kshs.2.10 billion from the CRF account, which was 38.6 per cent of the approved budget. The amount represented a decline of 11.0 per cent from Kshs.2.36 billion authorized in a similar period of FY 2014/15 and consisted of Kshs.1.44 billion (68.4 per cent) for recurrent expenditure and Kshs.664.0 million (31.6 per cent) for development activities.
3.32.5 Overall Expenditure Review
The County spent a total of Kshs.1.76 billion during the first half of FY 2015/16 which was 83.8 per cent of the released for operations. This was a slight reduction from the Kshs.2.25 billion spent in a similar period of FY 2014/15. A total of Kshs.1.39 billion was spent on recurrent activities and Kshs.377.18 million on development activities. Recurrent expenditure was 96.2 per cent of the funds released for recurrent activities while development expenditure accounted for 56.8 per cent of the funds released for development activities. The expenditure excludes commitments as of 31st December, 2015 that amounted to Kshs.470.08 million for development and Kshs.39.29 million for recurrent expenditure.
Recurrent expenditure for the period under review represented 50.0 per cent of the approved annual recurrent budget, an increase by 12.1 per cent spent in a similar period of FY 2014/15. On the other hand Development expenditure recorded an absorption rate of 14.1 per cent, a decrease from 46.5 per cent spent in a similar period of FY 2014/15. A comparison of the total expenditure in the first half of FY 2014/15 and the first half of FY 2015/16 is shown in Figure 3.126.
Figure 3.126: Nandi County, Expenditure by Economic Classification for first half of FY 2014/15 and first half of FY 2015/16
713.54
430.24
1103.81920.42
464.62 377.18
0.00200.00400.00600.00800.00
1,000.001,200.00
Personnel Emoluments Operation and Maintenance Development
Ksh
s.mill
ions
Expenditure by Economic Classification
1st Half of FY 2014/151st Half of FY 2015/16
Source: Nandi County Treasury

COUNTY GOVERNMENTS BUDGET IMPLEMENTATION REVIEW REPORT FIRST HALF FY, 2015/16232
3.32.6 Recurrent Expenditure Analysis
The total recurrent expenditure for the reporting period was Kshs.1.39 billion against a total of budget of Kshs.5.44 billion representing an absorption rate of 25.6 per cent of annual recurrent budget. The County spent Kshs.920.42 million (66.2 per cent) on personnel emoluments and Kshs.464.62 million (33.4 per cent) on operations and maintenance as shown in Figure 3.126. Expenditure on personnel emoluments accounted for 52.3 per cent of total expenditure and has increased significantly in the first half of FY 2015/16 as compared to a similar period of FY 2014/15 when the County spent Kshs.713.54 million. The increase is attributed to new recruitments in the health department and annual salary increments.
The County spent Kshs.34.73 million on sitting allowances to the 48 MCAs and the Speaker against an annual sitting allowance budget of Kshs.73.84 million, representing a marginal increase from Kshs.19.44 million recorded in a similar period of FY 2014/15. The average monthly per MCA was Kshs.118,144 compared to SRC recommended monthly ceiling of Kshs.124,800.
A breakdown of the operations and maintenance expenditure for the reporting period is shown in Figure 3.127.
Figure 3.127: Nandi County, Operations and Maintenance Expenditure for the first half of FY 2015/16
118.66 101.53
59.61 34.73 26.99 19.10 15.64 15.31 14.45 14.34 14.01 13.26 7.97 6.01 3.01
- 20.00 40.00 60.00 80.00
100.00 120.00 140.00
Oth
er O
&M
Cos
ts
Dom
estic
and
For
eign
Trav
el
Trai
ning
Exp
ense
Sitti
ng A
llow
ance
Mot
or V
ehic
leIn
sura
nce
Sani
tary
and
Cle
anin
gM
ater
ials
Trad
e Sh
ows a
ndEx
hibi
tions
Cat
erin
g Se
rvic
es
Util
ity su
pplie
s and
serv
ices
Rou
tine
Mai
ntai
nanc
e
Fuel
and
Lub
rican
ts
Con
tract
ed P
roff
essi
onal
Serv
ices
Prin
ting
& A
dver
tisin
gSe
rvic
e
Off
ice
and
Gen
eral
Supp
lies
Com
mun
icat
ion
Supp
lies a
nd S
ervi
ces
Ksh
s.mill
ions
Major Categories of O and M Expenditure
Source: Nandi County Treasury
The aggregate expenditure on domestic and foreign travel was Kshs.101.53 million compared to Kshs.38.41 million incurred in a similar period of FY 2014/15, representing a marginal increase of 164.3 per cent. This expenditure comprised of Kshs.65.53 million spent by the County Executive and Kshs.36.00 million by the County Assembly.Development Expenditure Analysis
A summary of development expenditure during the first half of FY 2015/16 is provided in figure 3.128.

COUNTY GOVERNMENTS BUDGET IMPLEMENTATION REVIEW REPORT FIRST HALF FY, 2015/16 233
Figure 3.128: Nandi County, Summary of Development Expenditure for the First Half of FY 2015/16
138.77 132.81
58.54 37.83
4.50 2.54 2.18 -
20.00 40.00 60.00 80.00
100.00 120.00 140.00 160.00
Wate
r Sup
plies
and
Sewa
rages
Med
ical D
rugs
Acce
ss Ro
ads a
nd ot
her C
ivil
Work
s
Othe
r Infr
astruc
ture a
ndCi
vil W
ork
Cons
tructi
on of
ECD
Class
rooms
Purch
ase of
labo
ratory
Equip
ment
Purch
ase of
Spec
ial Pl
ant
Kshs
.milli
on
Major Categories of Development Expenditure
Source: Nandi County Treasury
Analysis of the development expenditure of Kshs.377.18 million had incurred in the first half of FY 2015/16 indicates that the Water department had the highest expenditure at Kshs.138.77 million which was spent on water projects. The second highest expenditure at Kshs.132.81 million was incurred by the Health department on Purchase of drugs for the health facilities. The department of Roads development incurred Kshs.58.54 million on development and maintenance of access roads. A total of 178 kilometers of roads were maintained across the 30 wards while the department of agriculture incurred Kshs.2.18 million on purchase of special plant.
3.32.7 Annual Budget and Budget Performance Analysis by department for the First Half of FY 2015/16
A summary of the FY 2015/16 annual budget estimates and budget performance for the first half by department is as shown in Table 3.64.
Table 3.64: Nandi County, Annual Budget and First Half of FY 2015/16 Budget Performance by Department
Department Annual Budget Alloca-tion (Kshs. Millions)
6 Months Exche-quer Issues (Kshs.
Millions)
6 Months Expendi-ture (Kshs.Million)
% of Expendi-ture to Exche-
quer Issues
Absorption rate (%)
Rec Dev Rec Dev Rec Rec Dev Rec DevOffice of the Governor & Deputy Governor 373.00 78.00 218.50 165.30 2.60 75.7 0.0 44.3 3.4
Finance & Economic Planning 437.50 748.00 209.60 187.00 89.3 0.0 42.8 0.0
Education, Youth, Cul-ture & Social services 184.00 161.00 105.30 40.00 84.00 10.00 79.6 25.0 45.5 6.2
Health Services 754.50 417.90 395.60 235.00 562.00 152.50 142.2 64.9 74.5 36.5
Gender, Culture & So-cial Development 36.60 130.80 15.00 13.00 9.00 59.8 0.0 24.5 0.0
Public Works, Roads and Transport 87.30 441.40 50.20 138.00 29.00 58.60 57.8 42.5 33.2 13.3

COUNTY GOVERNMENTS BUDGET IMPLEMENTATION REVIEW REPORT FIRST HALF FY, 2015/16234
Department Annual Budget Alloca-tion (Kshs. Millions)
6 Months Exche-quer Issues (Kshs.
Millions)
6 Months Expendi-ture (Kshs.Million)
% of Expendi-ture to Exche-
quer Issues
Absorption rate (%)
Rec Dev Rec Dev Rec Rec Dev Rec Dev
County Assembly Services 524.20 110.60 264.10 196.90 74.6 0.0 37.6 0.0
Public Service & Ad-ministration 56.00 147.00 25.30 50.00 25.00 98.8 0.0 44.6 0.0
Trade, Industrialization, Tourism, Wildlife & Co-operative Development
72.00 57.60 29.60 15.00 23.10 1.70 78.1 11.3 32.1 2.9
County Public Service Board 36.50
- 16.90 10.00 59.2 0.0 27.4 0.0
Agriculture, Livestock & Fisheries Develop-ment
172.90 43.80 95.20 40.00 81.00 6.70 85.3 16.8 46.8 15.4
Water, Environment, Energy & Natural Re-sources
36.00 336.50 14.70 133.00 12.00 145.00 81.6 109.0 33.3 43.1
TOTAL 2770.60 2672.60 1439.90 664.00 1385.00 377.20 96.2 56.8 50.0 14.1
Source: Nandi County Treasury
Analysis of budget performance by department shows that the Department of Water & Natural Resources reported the highest absorption rate of its development budget at 43.1 per cent while the County Assembly, Finance & Economic Planning, Public Service Administration and Culture & Social services departments registered the lowest absorption rate at 0.0 per cent. On the other hand, the Office of the Health and Sanitation had the highest percentage of its recurrent expenditure to its recurrent budget at 74.5 per cent while the department of Gender, Culture & Social Development had the lowest percentage at 24.5 per cent.
3.32.8 Borrowing by the County Government
During the period under review, the County Assembly approved borrowing of Kshs.696.5 million for purchase of road construction equipment. This borrowing was in contravention of Article 212 of the Constitution, which requires a county government to borrow with approval from the County Assembly, and only if the national government guarantees the loan. Further, Section 58 of the PFM Act 2012 gives the Cabinet Secretary to the National Treasury the powers to guarantee loans subject to approval by Parliament.
3.32.9 Observations and Recommendations
The County has made progress in addressing the challenges previously identified as affecting budget implementation. The County has:
i. Set up realistic revenue targets in FY 2015/16.
ii. Embraced use of IFMIS in process financial transactions for both the County Assembly and the County Executive.

COUNTY GOVERNMENTS BUDGET IMPLEMENTATION REVIEW REPORT FIRST HALF FY, 2015/16 235
iii. Designated departmental accounting officers in line with section 148 of the PFM Act 2012.
iv. Build capacity of staff in the Finance and Procurement departments.
Despite the progress made, the following challenges continued to hamper effective budget implementation;
1. The County wage bill has risen from Kshs.713.58 million in the first half of FY 2014/15 to Kshs.920.42 million in the first half of FY 2015/16 as shown in Figure 3.126.
2. Accumulated huge Pending bills in the department of Roads and Infrastructure amounting to Kshs.395.87 million.
3. Failure by the County to designate administrators for the established County Funds such as the Bursary Funds thereby rendering the process of accounting and reporting of funds difficult.
The County should implement the following recommendations in order to improve budget execution;
1. The County should conduct a staff rationalization exercise based on merit to tame the rising wage bill.
2. The County should expedite the payment of pending bills to avoid accumulation of large debt.
3. The County Executive Member for Finance should designate an officer to administer each established fund in accordance with section 116 of the PFM Act 2012.
3.33 Narok County
3.33.1 Overview of the FY 2015/16 Budget
The FY 2015/16 approved budget for Narok County was Kshs.9.00 billion. It comprised of Kshs.5.06 billion (56.2 per cent) allocated for recurrent expenditure and Kshs.3.94 billion (43.8 per cent) for development expenditure.
In order to finance the budget, the County expects to receive Kshs.5.29 billion (58.8 per cent) as transfers from the National Government, collect Kshs.3.51 billion (39.0 per cent) from local sources, receive a conditional grant of Kshs.56.03 million (0.6 per cent) from DANIDA, additional conditional grant of Kshs.67.17 million (0.7) from Roads Maintenance Fuel Levy Fund, and Kshs.56.30 million (0.6 per cent) for free maternal health care. However, Kshs.95 million and Kshs.419.68 million representing the conditional allocation for leasing of medical equipment and opening cash balance from FY 2014/15 respectively was not factored in the FY 2015/16 budget as contained in CARA, 2015.

COUNTY GOVERNMENTS BUDGET IMPLEMENTATION REVIEW REPORT FIRST HALF FY, 2015/16236
3.33.2 Revenue Analysis
In the first half of FY 2015/16, the County received Kshs.2.25 billion revenue from the National Government as equitable share, Kshs.33.92 million as conditional allocations from the road maintenance fuel levy fund, received Kshs.22.78 million as conditional allocations for free maternal health care, Kshs.4.06 million as conditional allocations for forgone user fees, raised Kshs.1.04 billion from local sources, and had a cash balance of Kshs.419.68 million brought forward from FY 2014/15.
The quarterly trend in local revenue collection from the FY 2013/14 to the second quarter of FY 2015/16 is shown in figure 3.129.
Figure 3.129: Narok County, Trend in Local Revenue Collection by Quarter from the FY 2013/14 to the second quarter of FY 2015/16
754.72
172.43
725.95 617.19
418.53
100
200
300
400
500
600
700
800
Ksh
s. M
illi
ons
Reporting Period
Source: Narok County Treasury
The local revenue consisted of Kshs.617.20 million raised in the first quarter and Kshs.418.53 million in the second quarter. The local revenue raised in the first half of the FY 2015/16 was Kshs.1.04 billion (27.6 per cent of the annual local revenue target), and a reduction from Kshs.1.22 billion collected in a similar period of FY 2014/15.
Analysis of the local revenue realized by stream is shown in Table 3.65.

COUNTY GOVERNMENTS BUDGET IMPLEMENTATION REVIEW REPORT FIRST HALF FY, 2015/16 237
Table 3.65: Narok County, Analysis of revenue collection by stream for the first half of FY 2015/16
No. Revenue StreamAnnual Targeted Revenue
(Kshs.)6-Month Actual Revenue
(Kshs.)Revenue Performance
(%)
A B C D=C/B*100
1 Cess Revenue 57,000,000 49,417,873 86.7
2 Mara Game Reserve 1,900,000,000 858,850,226 45.2
3 Miscellaneous Income 675,804,596 93,705,442 13.9
4 Vehicle Parking 40,000,000 2,449,480 6.1
5 Single Business Permits 99,000,000 4,507,696 4.6
6 Market & Slaughter fees 190,400,000 6,701,213 3.5
7 Plot Rent 352,900,000 8,767,887 2.5
8 House Rents 53,000,000 417,550 0.8
9 Conservancy & Solid Waste 69,500,000 23,800 0.03
10 Other sources 310,000,000 10,867,710 3.5
Total 3,747,604,596 1,035,708,877 27.6
Source: Narok County Treasury
The analysis of revenue collection by stream indicates that Cess Revenue recorded the highest percentage of revenue performance against annual target at 86.7 per cent followed by Park Entry Fees (Mara Game Reserve) at 45.2 per cent. Conservancy & Solid Waste Disposal revenue streams reported the lowest percentage of revenue performance against annual target at 0.03 per cent. The office has noted that while the annual local revenue target in the Approved Budget is Kshs.3,507.1 million, the annual targets by streams amounts to Kshs.3,747.6 million. The County Treasury should reconcile the two revenue targets.
3.33.3 Banking of Local Revenue
A review of the bank statements for the revenue collection accounts indicates that all locally generated revenue was deposited into the CRF during the period under review. This conforms to Article 207 of the Constitution and Section 109 of the PFM Act 2012, which stipulates that all funds raised or received by or on behalf of the County Government should be deposited into the CRF account, unless excluded by an Act of Parliament.
3.33.4 Exchequer Issues
During the period under review, the COB authorised withdrawal of Kshs.3.09 billion from the CRF account, which was 34.3 per cent of the annual approved budget. The withdrawn amount represents a decline from Kshs.3.15 billion authorized in a similar period of FY 2014/15, and consists of Kshs.2.22 billion (72 per cent) for recurrent expenditure and Kshs.865.0 billion (28 per cent) for development activities.

COUNTY GOVERNMENTS BUDGET IMPLEMENTATION REVIEW REPORT FIRST HALF FY, 2015/16238
3.33.5 Overall Expenditure Review
The County spent a total of Kshs.3.01 billion during the first half of FY 2015/16 which was 97.4 per cent of the total funds released for both recurrent and development expenditure. This is a slight reduction from the Kshs.2.99 billion spent in a similar period of FY 2014/15. A total of Kshs.2.14 billion was spent on recurrent activities and Kshs.861.55 million on development activities. Recurrent expenditure was 96.5 per cent of the funds released for recurrent activities while development expenditure accounted for 99.6 per cent of the funds released for development activities. The expenditure excludes commitments as of 31st December, 2015 that amounted to Kshs.0.86 billion for development and Kshs.2.14 billion for recurrent expenditure.
Recurrent expenditure for the period under review represented 42.4 per cent of the approved annual recurrent budget, an increase from 40.8 per cent spent in a similar period of FY 2014/15. On the other hand, development expenditure recorded an absorption rate of 21.9 per cent, a decrease from 29.4 per cent spent in a similar period of FY 2014/15. A comparison of the total expenditure between the second quarter of FY 2014/15 and FY 20151/16 is shown in Figure 3.130.
Figure 3.130: Narok County, Expenditure by Economic Classification for first half of FY 2014/15 and FY 2015/16
1033.5
794.6
1162.71219.1
925.1 861.55
0
200
400
600
800
1000
1200
1400
Personnel Emoluments Operations & Maintenance Development
Ksh
s. M
illi
ons
Expenditure by Economic Classification
1st Half, FY 2014/15
1st Half, FY 2015/16
Source: Narok County Treasury
3.33.6 Recurrent Expenditure Analysis
The total recurrent expenditure for the reporting period was Kshs.2.14 billion against an annual recurrent budget of Kshs.5.06 billion. This represents an absorption rate of 42.4 per cent. The County spent Kshs.1,219.1 million (56.9 per cent) on personnel emoluments and Kshs.925.10 million (43.1 per cent) on operations and maintenance as shown in Figure 3.130. Expenditure on personnel emoluments accounted for 40.6 per cent of total expenditure and has increased in

COUNTY GOVERNMENTS BUDGET IMPLEMENTATION REVIEW REPORT FIRST HALF FY, 2015/16 239
FY 2015/16 as compared to a similar period in FY 2014/15 when the County spent Kshs.1.033 billion. The increase is attributed to the annual increment on employees’ basic salaries and as a result of continuous recruitment of staff.
The County spent Kshs.23.83 million on sitting allowances to the 48 MCAs and the Speaker against an annual budget of Kshs.60.0 million. This represents a marginal decrease from Kshs.24.8 million recorded in a similar period of FY 2014/15. The average monthly sitting allowance per MCA was Kshs.82,739 compared to SRC’s recommended monthly ceiling of Kshs.124,800.
A breakdown of the operations and maintenance expenditure for the reporting period is shown in Figure 3.131.
Figure 3.131: Narok County, Major Operations and Maintenance Expenditure for the first half of FY 2015/16
82.2 82.173.7 71.9
48.9
36.531.55
20.3 18.9 14.97 14.55 13.5 12.5 9.7 9.4
0
10
20
30
40
50
60
70
80
90
Lega
l Fee
s
Hire
of t
rans
port
Util
ities
sup
plie
s &
ser
vice
s
Cont
ract
ed P
rofe
ssio
nal S
ervi
ces
Off
ice
Gen
eral
Sup
plie
s
Hos
pita
lity
Trai
ning
Gua
rds
& c
lean
ing
serv
ices
Fuel
s &
Lub
rican
ts
Trav
el (F
orei
gn &
dom
estic
)
Dru
gs &
med
ical
exp
ense
s
Purc
hase
of o
ffic
e fu
rnitu
re a
ndeq
uipm
ent
Prin
ting
Man
agem
ent F
ees
Inte
rnet
con
nect
ions
Kshs
. Mill
ions
Major Categories of O&M Expenditure
Source: Narok County Treasury
The aggregate expenditure on domestic and foreign travel was Kshs.14.97 million compared to Kshs.33.50 million incurred in a similar period of FY 2014/15, representing a decrease of 55.3 per cent. This expenditure comprised of Kshs.7.42 million spent by the County Executive and Kshs.7.55 million by the County Assembly.
3.33.7 Development Expenditure Analysis
Details of development expenditure during the first half of FY 2015/16 are provided in table 3.132.

COUNTY GOVERNMENTS BUDGET IMPLEMENTATION REVIEW REPORT FIRST HALF FY, 2015/16240
Figure 3.132: Narok County, Summary of Development Expenditure for the first half of FY 2015/16
503.00
270.00
50.00 16.10 11.40 6.10 3.00 2.00
0
100
200
300
400
500
600
Cons
tructi
on &
Reh
abili
tatio
n of
Road
s & o
ther
Civ
il wo
rks
Cons
tructi
on o
f Edu
catio
nal
facil
ities
Purc
hase
& In
stalla
tion
of M
ilkCo
olin
g Pl
ant
Cons
tructi
on o
f Com
mitt
ee R
oom
san
d Pe
rimete
r wall
Reha
bilit
ation
of w
ater
infra
struc
ture
Expa
nsio
n of
Nar
ok T
own
drain
s
Reha
bilit
ation
of m
arke
t
Reha
bilit
ation
of H
ospi
tal
Ksh
s.Mill
ion
Major Categories of Development Expenditure
Source: Narok County Treasury
Analysis of the development expenditure of Kshs.861.55 million in the first half of FY 2015/16 indicates that the highest expenditure at Kshs.503.0 million was spent on construction and maintenance of access roads by the Roads Department. A total of 208.5 kilometers of roads were rehabilitated across the 30 wards. The second highest expenditure at Kshs.270.0 million was incurred by the Education Department on construction of educational facilities. The Department of Agriculture, Livestock and Fisheries incurred Kshs.50.0 million on purchase and installation of milk cooling plant.
3.33.8 Annual Budget and Budget Performance Analysis by department for the First Half of FY 2015/16
A summary of FY 2015/16 annual budget estimates and budget performance for the first half by department is as shown in Table 3.66.
Table 3.66: Narok County, Annual Budget and First Half of FY 2015/16 Budget Performance by Department
Department Annual Budget Alloca-tion (Kshs. Millions)
6-Months Exche-quer Issues (Kshs.
Millions)
6-Months Ex-penditure (Kshs.
Millions)
6-Months Expenditure to Exchequer
Issues (%)
Absorption rate (%)
Rec Dev Rec Dev Rec Dev Rec Dev Rec Dev
County Assembly 533.00 187.81 287.00 18.00 210.67 16.07 73.4 89.3 39.5 8.6
Governor’s Office 1,823.86 60.00 1,031.39 - 1,030.54 - 99.9 - 56.5 -
Finance and Economic Planning 506.56 363.00 144.80 50.00 144.80 50.00 100.0 100.0 28.6 13.8
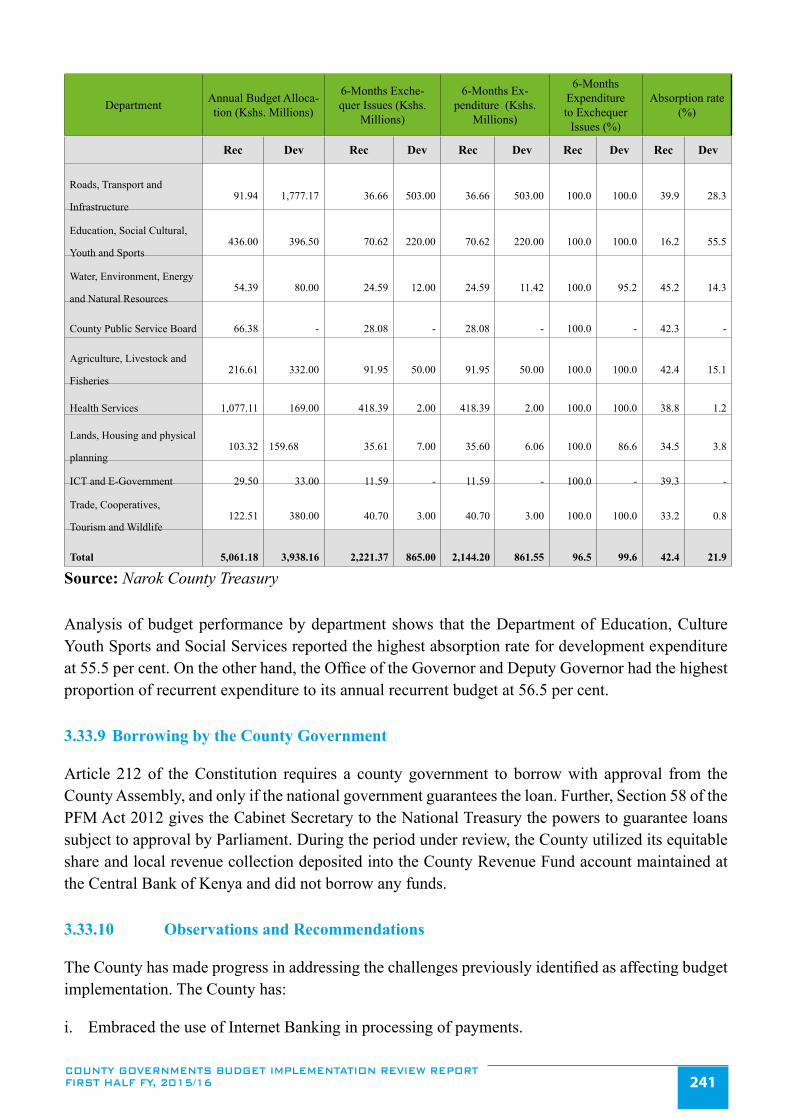
COUNTY GOVERNMENTS BUDGET IMPLEMENTATION REVIEW REPORT FIRST HALF FY, 2015/16 241
Department Annual Budget Alloca-tion (Kshs. Millions)
6-Months Exche-quer Issues (Kshs.
Millions)
6-Months Ex-penditure (Kshs.
Millions)
6-Months Expenditure to Exchequer
Issues (%)
Absorption rate (%)
Rec Dev Rec Dev Rec Dev Rec Dev Rec Dev
Roads, Transport and
Infrastructure91.94 1,777.17 36.66 503.00 36.66 503.00 100.0 100.0 39.9 28.3
Education, Social Cultural,
Youth and Sports436.00 396.50 70.62 220.00 70.62 220.00 100.0 100.0 16.2 55.5
Water, Environment, Energy
and Natural Resources54.39 80.00 24.59 12.00 24.59 11.42 100.0 95.2 45.2 14.3
County Public Service Board 66.38 - 28.08 - 28.08 - 100.0 - 42.3 -
Agriculture, Livestock and
Fisheries216.61 332.00 91.95 50.00 91.95 50.00 100.0 100.0 42.4 15.1
Health Services 1,077.11 169.00 418.39 2.00 418.39 2.00 100.0 100.0 38.8 1.2
Lands, Housing and physical
planning103.32 159.68 35.61 7.00 35.60 6.06 100.0 86.6 34.5 3.8
ICT and E-Government 29.50 33.00 11.59 - 11.59 - 100.0 - 39.3 -
Trade, Cooperatives,
Tourism and Wildlife122.51 380.00 40.70 3.00 40.70 3.00 100.0 100.0 33.2 0.8
Total 5,061.18 3,938.16 2,221.37 865.00 2,144.20 861.55 96.5 99.6 42.4 21.9
Source: Narok County Treasury
Analysis of budget performance by department shows that the Department of Education, Culture Youth Sports and Social Services reported the highest absorption rate for development expenditure at 55.5 per cent. On the other hand, the Office of the Governor and Deputy Governor had the highest proportion of recurrent expenditure to its annual recurrent budget at 56.5 per cent.
3.33.9 Borrowing by the County Government
Article 212 of the Constitution requires a county government to borrow with approval from the County Assembly, and only if the national government guarantees the loan. Further, Section 58 of the PFM Act 2012 gives the Cabinet Secretary to the National Treasury the powers to guarantee loans subject to approval by Parliament. During the period under review, the County utilized its equitable share and local revenue collection deposited into the County Revenue Fund account maintained at the Central Bank of Kenya and did not borrow any funds.
3.33.10 Observations and Recommendations
The County has made progress in addressing the challenges previously identified as affecting budget implementation. The County has:
i. Embraced the use of Internet Banking in processing of payments.

COUNTY GOVERNMENTS BUDGET IMPLEMENTATION REVIEW REPORT FIRST HALF FY, 2015/16242
ii. Embraced the use of IFMIS in processing of financial transactions. However, the system faces connectivity challenges which should be addressed.
Despite the progress made, the following challenges continued to hamper effective budget implementation;
1. Delayed disbursement of funds by the National Treasury affected execution of development projects.
2. Late submission of quarterly reports to the OCOB contrary to Section 166 of the PFM Act 2012.
3. Continued operationalization of the Bursary Fund despite advice by the COB to amend the County Bursary Act, 2013 so as to comply with law. The County paid out Kshs.40 million from the Bursary Fund without approval by the COB.
The County should implement the following recommendations in order to improve budget execution
1. The County Treasury should liaise with the National Treasury to ensure timely release of funds as provided for in CARA, 2015.
2. The County Treasury should ensure timely submission of financial reports in line with Section 166 and 168 of the PFM Act 2012.
3. The County should fast track amendment of the Narok County Bursary Fund Act, 2013 as advised by the COB to ensure compliance with the law.
3.34 Nyamira County
3.34.1 Overview of the FY 2015/16 Budget
The FY 2015/16 approved budget for Nyamira County amounted to Kshs.5.54 billion, it comprised of Kshs.2.90 billion (52.3 per cent) allocated to recurrent expenditure and Kshs.2.64 billion (47.7 per cent) to development expenditure.
In order to finance the budget, the County expected to receive Kshs.4.15 billion (74.9 per cent) as equitable share from the National Government, collect Kshs.240.96 million (4.4 per cent) from local sources, receive a conditional grant of Kshs.23.92 million (0.4 per cent) from DANIDA, Kshs.788.73 million (14.2 per cent) as projected cash balance from FY 2014/15 and Kshs.336 million (6.1 per cent) as additional conditional allocation. The additional conditional allocation comprised of: Kshs.79.94 million for free maternal healthcare, Kshs.13.95 million as conditional allocation for compensation for user fees forgone, Kshs.95.74 million for leasing of medical equipment, Kshs.52.78 million as conditional allocation from the road maintenance fuel levy fund and Kshs.93.62 million as county emergency fund. However according to CARA 2015 the County emergency fund of Kshs.93.62 million was not included as one of the conditional allocation from the national government, hence a budget deficit of Kshs.93.62 million

COUNTY GOVERNMENTS BUDGET IMPLEMENTATION REVIEW REPORT FIRST HALF FY, 2015/16 243
3.34.2 Revenue Analysis
In the first half of FY 2015/16, the County received Kshs.1.44 billion from the National Government as direct transfers to the CRF account. This amount comprised of Kshs.1.39 billion as equitable share, Kshs.31.96 million as conditional allocations for free maternal health care, Kshs.4.36 million as conditional allocations for forgone user fees and Kshs.26.65 million as conditional allocation from fuel levy fund. In addition to the National Government direct transfer, the County raised Kshs.26.33 million from local sources, and had an actual cash balance of Kshs.726.76 million brought forward from FY 2014/15.
The trend in local revenue collection for from FY 2013/14 to the second quarter of FY 2015/16 is shown in figure 3.133.
Figure 3.133: Nyamira County, Trend in Local Revenue Collection by Quarter from the FY 2013/14 to the second quarter of FY 2015/16
13.33 10.41
57.42
23.24 27.73 23.1530.13
9.15
010203040506070
Ksh
s. i
n M
illi
on
s
Reporting Period
Source: Nyamira County Treasury
The local revenue consisted of Kshs.17.18 million raised in the first quarter and Kshs.9.15 million in the second quarter. The local revenue raised in the first half of the FY 2015/16 of Kshs.26.33 million was 10.1 per cent of the annual local revenue target, a decline from Kshs.50.98 million collected in a similar period of FY 2014/15.
The analysis of local revenue by stream is shown in Table 3.67.

COUNTY GOVERNMENTS BUDGET IMPLEMENTATION REVIEW REPORT FIRST HALF FY, 2015/16244
Table 3.67: Nyamira County, Analysis of revenue collection by stream for the first half of FY 2015/16
No. Revenue Stream Annual Targeted Revenue (Kshs.)
Six Months Actual Revenue
(Kshs.)
Revenue Perfor-mance (%)
A B C D=*100
1 Matatu Parking Charges 37,381,261 5,858,510 15.7
2 Single Business Permit 47,571,157 5,410,560 11.4
3 Market Dues 44,327,473 4,753,640 10.7
4 Agricultural Toll/ Cess 20,577,612 1,184,710 5.8
5 Veterinary Charges 7,296,951 1,128,570 15.5
6 Building Plan Application Fees 2,709,771 1,086,715 40.1
7 Other revenue sources 101,672,299 6,905,954 6.8
Total 261,536,524 26,328,659 10.1
Source: Nyamira County Treasury
The analysis of revenue by stream indicates that Building Plan Application Fee recorded the highest revenue performance at 40.1 per cent, followed by Matatu Parking Charges at 15.7 per cent.
3.34.3 Banking of local revenue
A review of the bank statement for the revenue collection in the first half of FY 2015/16, the County did not bank all the locally generated revenue into the CRF. A total of Kshs.35 million is held in two commercial bank accounts at Kenya Commercial Bank and Cooperative Bank, contrary to Article 207 of the Constitution and Section 109 of the PFM Act 2012, which stipulates that all funds raised or received by or on behalf of the County Government should be deposited into the CRF account, unless excluded by an Act of Parliament.
3.34.4 Exchequer issues
The Controller of Budget authorised withdrawal of Kshs.1.80 billion from the CRF account, which was 32.4 per cent of the approved budget. The amount represented a decline of 2.7 per cent from Kshs.1.85 billion authorized in a similar period of FY 2014/15 and consisted of Kshs.1.28 billion (71.4 per cent) for recurrent expenditure and Kshs.515.16 million (28.6 per cent) for development activities. The expenditure excludes commitments as of 31st December, 2015 that amounted to Kshs.727.25 million for development and Kshs.197.21 million for recurrent expenditure.
3.34.5 Overall Expenditure Review
The County spent a total of Kshs.1.60 billion during the first half of FY 2015/16 which was 89.2 per cent of the released for operations expenditure. This is a slight increase from the Kshs.1.08 billion spent in a similar period of FY 2014/15. A total of Kshs.1.22 billion was spent on recurrent activities and Kshs.381.76 million on development activities. Recurrent expenditure was 95.3 per cent of the funds released for recurrent activities while development expenditure accounted for 74.1 per cent of

COUNTY GOVERNMENTS BUDGET IMPLEMENTATION REVIEW REPORT FIRST HALF FY, 2015/16 245
the funds released for development activities.
Recurrent expenditure for the period under review represented 42.1 per cent of the approved annual recurrent budget, an improvement from 25.8 per cent spent in a similar period of FY 2014/15. On the other hand Development expenditure recorded an absorption rate of 14.5 per cent, a decrease from 19.8 per cent spent in a similar period of FY 2014/15. A comparison of the total expenditure between the second quarter of FY 2014/15 and FY 2015/16 is shown in Figure 3.134.
Figure 3.134: Nyamira County, Expenditure by Economic Classification for First Half of FY 2014/15 and for First Half of FY 2015/16
411.41
195.76
475.02381.76 386.85
835.75
0.00100.00200.00300.00400.00500.00600.00700.00800.00900.00
Personnel Emoluments Operation and Maintenance Development
Ksh
s.mill
ions
Expenditure by Economic Classification
1st Half of FY 2014/15
1st Half of FY 2015/16
Source: Nyamira County Treasury
3.34.6 Recurrent Expenditure Analysis
The total recurrent expenditure for the reporting period was Kshs.1.22 billion against annual total recurrent budget of Kshs.2.90 billion. This represents 42.1 per cent of the annual recurrent budget. The County spent Kshs.835.75 million (68.4 per cent) on personnel emoluments and Kshs.386.85 million (31.6 per cent) on operations and maintenance as shown in Figure 3.134. Expenditure on personnel emoluments accounted for 52.1 per cent of total expenditure and has increased significantly in the first half of FY 2015/16 as compared to a similar period of FY 2014/15 when the county spent Kshs.475.02 million.
The County spent Kshs.20.52 million on sitting allowances to the 34 MCAs including the Speaker against an annual budget of Kshs.65.78 million. This represented a marginal decrease from Kshs.24.80 million recorded in a similar period of FY 2014/15. The average monthly sitting allowance per MCA was Kshs.103,649 compared to SRC’s recommended monthly ceiling of Kshs.124,800.
A breakdown of the operations and maintenance expenditure for the reporting period is shown in Figure 3.135.

COUNTY GOVERNMENTS BUDGET IMPLEMENTATION REVIEW REPORT FIRST HALF FY, 2015/16246
Figure 3.135: Nyamira County, Operations and Maintenance Expenditure for the First Half of FY 2015/16
126.20 121.06
24.14 23.02 13.92 12.56 11.96 11.84 9.89 8.13 8.07 6.97 6.17 2.90
- 20.00 40.00 60.00 80.00
100.00 120.00 140.00
Hosp
ital S
uppl
ies
Dom
estic
and
Fore
gnTr
avel
Train
ing
Expe
nses
Hosp
italit
y Su
pplie
s &Se
rvice
s
Cont
ract
ed P
rofe
ssio
nal
Serv
ices &
Mem
bersh
ipfe
es
Gene
ral O
ffice
Sup
plies
Fuel
and
Lubr
icant
s
Prin
ting,
Adv
ertis
ing
and
Publ
icity
Main
tenan
ce E
xpen
ses
Othe
r Exp
ense
s
Hire
of e
quip
men
ts, R
ents
& R
ates
Utili
ty S
uppl
ies a
ndSe
rvice
s
Purc
hase
of f
urni
ture
,Co
mpu
ters &
Offi
ceEq
uipm
ents
Insu
ranc
e Cos
t
Ksh
s. M
illio
ns
Major Categories of O & M Expenditure
Source: Nyamira County Treasury
The aggregate expenditure on domestic and foreign travel was Kshs.121.06 million compared to Kshs.33.50 million incurred in a similar period of FY 2014/15, representing a significant increase of 261.4 per cent. This expenditure comprised of Kshs.57.68 million spent by the County Executive and Kshs.63.38 million by the County Assembly.
3.34.7 Development Expenditure AnalysisDetails of development expenditure during the first quarter of FY 2015/16 are provided in figure 3.136.
Figure 3.136: Nyamira County, Summary of Development Expenditure for the First Half of FY 2015/16
110.30
73.86
56.2943.71
24.44 23.3412.61 10.12 7.70 6.64 5.18 5.17 2.40
0.00
20.00
40.00
60.00
80.00
100.00
120.00
Othe
r Inf
rastru
cture
& Ci
vilwo
rks,
Wate
r Sup
plies
&Se
werag
e
Fund
s
Purch
ase o
f Moto
r Veh
icles
Cons
tructi
on of
Acc
ess R
oads
&Br
idges
Agric
ultur
al Su
pplie
s
Cons
tructi
on of
Buil
ding
Main
tenan
ce E
xpen
ses-C
ivil
work
s,Buil
dings
, Equ
ipmets
,M
otor v
ehicl
es
Fuel
& Su
pplie
s for
prod
uctio
n
Purch
ase o
f Med
ical E
quipm
ent
Equip
ment,
Furn
iture&
Comp
uters
Contr
acted
Prof
essio
nal &
Tech
nical
Serv
ices
Purch
ase o
f Sof
tware
Trav
el co
sts, S
ubsis
tence
&Tr
aining
expe
nses
Kshs
. Mill
ions
Major Categories of Development Expenditure
Source: Nyamira County Treasury

COUNTY GOVERNMENTS BUDGET IMPLEMENTATION REVIEW REPORT FIRST HALF FY, 2015/16 247
Analysis of the development expenditure of Kshs.381.76 million incurred in the first half of FY 2015/16 indicates that the Roads department had the highest expenditure of Kshs.145.22 million which was spent mostly on Other Infrastructure & Civil works, Water Supplies & Sewerage, and Construction of Access Roads. The second highest expenditure of Kshs.78.47 million was incurred by the Finance & Economic Planning department mostly on Executives Car loans & Mortgage Fund, and Research and Feasibility studies. County Executive Office incurred Kshs.36.6 million on purchase of motor vehicles, department of Agriculture incurred Kshs.22.21million on Agricultural Materials, department of Environment, Energy, Natural Resources and Mining spent Kshs.21.96 million on Water Supplies and Sewerage Supplies and Small Equipment, while the department of Health incurred Kshs.18.5 million on Other Infrastructure and Civil Works.
3.34.8 Annual Budget and Budget Performance Analysis by department for the First Half of FY 2015/16
A summary of the FY 2015/16 annual budget estimates and budget performance for the first half by department is as shown in Table 3.68.
Table 3.68: Nyamira County, Annual Budget and First Half of FY 2015/16 Budget Performance by Department
DepartmentAnnual Budget
Allocation (Kshs.Million)
6 Months Exche-quer Issues (Kshs.
Million)
6 Months Ex-penditure (Kshs.
Million)
% Of Expenditure To Exchequer
IssuesAbsorption (%)
REC DEV REC DEV REC DEV REC DEV REC DEV
Agriculture, Livestock and Fisheries 158.87 154.21 69 50.77 73.01 28.23 105.8 55.6 46 18.3
County Assembly 428.74 175.9 145 - 180.09
- 124.2 - 42 -
County Executive Office 386.62 171.15 169 10 147.71 39.68 87.4 396.8 38.2 23.2
County Public Service Board 35.49 0 15.5 - 14.14
- 91.2 - 39.8 0
Education and ICT 235.95 254.22 102 17.97 95.08 17.06 93.2 94.9 40.3 6.7
Environment, Water and Natural Resources 82.43 233.03 35 93.8 37.68 27.14 107.7 28.9 45.7 11.6
**Finance and Economic Plan-ning 197.22 218.7 151 7.32 97.05 78.47 64.3 1,072.00 49.2 35.9
Health Services 1,075.12 515.32 465 167.62 476.92 38.35 102.6 22.9 44.4 7.4
Lands, Housing & Physical Planning 41.78 174.98 18 1.5 10.37 6.13 57.6 408.4 24.8 3.5
Public Administration & Coordi-nation of Devolved Unit 109.83 12.9 48
- 35.72 - 74.4 - 32.5
Roads, Transport and Public Works 53.7 589.15 23 146.33 21.51 145.22 93.5 99.2 40 24.6
Trade, Tourism, Industrialization & Cooperative Development 39.05 132.17 17 17.36 17.09 1.49 100.5 8.6 43.8 1.1
Youth, Sports, Gender, Culture and Social Services 59.7 7.95 25.5 2.5 16.23
- 63.7 27.2
Total 2,904.50 2,639.68 1,283.00 515.16 1,222.59 381.76 95.3 74.1 42.1 14.5
Source: Nyamira County Treasury

COUNTY GOVERNMENTS BUDGET IMPLEMENTATION REVIEW REPORT FIRST HALF FY, 2015/16248
**Recurrent exchequer release for Department of Finance and Economic Planning includes Kshs.65 million budgeted for in Development Estimates as mortgage and car loan for executive.
An analysis of budget performance by department shows that the Department of Finance and Economic Planning reported the highest percentage of its recurrent expenditure to its recurrent budget at 49.2 per cent while the Department of Lands, Housing and Physical Planning registered the lowest absorption rate at 24.8 per cent of the reporting period. On the other hand, Department of Finance and Economic Planning had the highest absorption rate of its development budget at 35.9 per cent while the department of Trade, Tourism, Industrialization and Cooperative Development had the lowest absorption rate of its development budget at 1.1 per cent. County Assembly, Department of Youth, Sports, Gender, Culture and Social Services, as well as Department of Public Administration did not incur any development expenditure despite having a development budget allocation.
3.34.9 Borrowing by the County Government
During the period under review, the County did not borrow any money. Article 212 of the Constitution requires a county government to borrow with approval from the County Assembly, and only if the national government guarantees the loan. Further, Section 58 of the PFM Act 2012 gives the Cabinet Secretary to the National Treasury the powers to guarantee loans subject to approval by Parliament.
3.34.10 Observations and Recommendations
The County has made progress in addressing the challenges previously identified as affecting budget implementation. The County has:
i. Recruited additional staff for both County Executive and County Assembly in the finance docket which will address the staffing challenge that existed.
ii. Embraced internet banking while making payments to vendors.
Despite the progress made, the following challenges continued to hamper effective budget implementation;
1. Delay in submission of financial returns for established County Funds to the OCOB as required by Section 168 of the PFM Act 2012.
2. Failure by the County Assembly to fully adopt IFMIS.
3. The County is yet to establish an audit committee.
4. Failure to report all locally generated revenue especially from the department of Health services as well as failure to deposit local revenue sinto CRF account as required by Article 207 of constitution and Section 109 of PFM Act 2012.
5. Decline in local revenue from Kshs.50.98 million in the first half of FY 2014/15 to Kshs.26.33 million in the first half of FY 2015/16.
COUNTY GOVERNMENTS BUDGET IMPLEMENTATION REVIEW REPORT FIRST HALF FY, 2015/16 249
The County should implement the following recommendations in order to improve budget execution;
1. The county should ensure mechanisms are in place to submit financial reports and returns in time. Timely and quality reporting will be beneficial to county itself as it will aid planning and will also be beneficial to other stakeholders.
2. The County Assembly should adopt IFMIS in processing all their payments. This will reduce bank charges from commercial banks as well as ensuring that public funds are utilized in a transparent and prudent manner.
3. The County should establish an Internal Audit Committee in line with Section 155 of the PFM Act 2012.
4. All revenue collected locally by the county should be banked to CRF regularly as stipulated by the Constitution and the PFM Act 2012.
5. The County should develop strategies to enhance local revenue collection.
3.35 Nyandarua County
3.35.1 Overview of the FY 2015/16 Budget
The FY 2015/16 approved budget estimates for Nyandarua County amounted to Kshs.4.28 billion. It comprised of Kshs.2.80 billion (65.5 per cent) allocated to recurrent expenditure and Kshs.1.47 billion (34.5 per cent) to development expenditure.
In order to finance the budget, the County expected to receive Kshs.3.983 billion (93.1 per cent) as transfers from the National Government, collect Kshs.235.5 million (5.5 per cent) from local sources, receive DANIDA conditional grant of Kshs.18.86 million (0.4 per cent) and Kshs.42 million (1 per cent) as F.I.F. However, the County did not budget for balance brought forward from FY 2014/2015 amounting to Kshs.591.03 million and additional grants as provided for in CARA, 2015 this includes Kshs.13.94 million as compensation for user fees forgone Kshs.54.71 million for the road maintenance levy, Kshs.50.71 million of forgone user fees, Kshs.95.74 million for leasing of medical equipment and Kshs.73 million as other conditional loans/grants. The equitable share was under budgeted by Kshs.323.27 million indicating that the County had a surplus budget. The County should revise the budget to correct under budgeting of the equitable share of revenue.
3.35.2 Revenue Analysis
In the first quarter of FY 2015/16, the County received Kshs.1.44 billion revenue from the National Government as direct transfer to the CRF account, Kshs.9.32 million as DANIDA grant to supplement financing for county health facilities, Kshs.14.98 million as conditional allocation for free maternal healthcare, Kshs.5.12 million as conditional allocation for forgone user fees, Kshs.27.63 million as conditional allocation from the road maintenance fuel levy fund, raised Kshs.87.64 million from local sources, and had Kshs.591.03 million as actual cash balance brought forward from FY 2014/15.
The trend in local revenue collection from FY 2013/14 to first half of FY 2015/16 is shown in figure 3.137.

COUNTY GOVERNMENTS BUDGET IMPLEMENTATION REVIEW REPORT FIRST HALF FY, 2015/16250
Figure 3.137: Nyandarua County, Trend in Local Revenue collection by Quarter since FY 2013/14 to first half of FY 2015/16
22.71 19.89
100.70
38.51
-
20
40
60
80
100
120
Ksh
s.Mill
ions
Source: Nyandarua County Treasury
The local revenue raised in the period under review consisted of Kshs.49.12 million in the first quarter and Kshs.38.51 million in the second quarter. The total local revenue raised in the first half of the year of the FY 2015/16 Kshs.49.12 million which is 37.2 per cent of the annual local revenue target, an improvement from Kshs.51.87 million collected in a similar period of FY 2014/15.
Table 3.69 below provides an analysis of local revenue by stream for the first half of FY 2015/16.
Table 3.69: Nyandarua County, Analysis of revenue collection per stream for the first half of FY 2015/16
No. Revenue Stream Annual Targeted Revenue (Kshs.)
Six Months Actual Reve-nue (Kshs.)
Revenue Perfor-mance (%)
A B C D=*100
1 Meat Inspection 307,872 1,506,987 489.52 Transfer Fees 1,002,319 1,706,320 170.23 Impounded Fees 1,009,335 1,234,475 122.34 Produce Cess and Royalties 26,935,944 20,094,530 74.65 Other sources 46,341,732 18,577,877 40.16 Open Air Market Fees 11,088,180 5,155,052 46.57 Bus and Matatu Fees 15,652,096 6,739,070 43.18 Single Business Permits 53,212,954 10,919,818 20.59 Liquor License 80,000,000 7,110,500 8.910 J. M. Hospital 10,013,530 0.011 Public Health Fees 2,649,825 0.012 Motor Cycle Fees (Parking) 1,935,150 0.0
TOTAL 235,550,432 87,643,134 37.2
Source: Nyandarua County Treasury
The analysis of own revenue collection by stream indicates that meat inspection generated the highest percentage of revenue against target at 489.5 per cent followed by transfer fees at 170.2 per cent.

COUNTY GOVERNMENTS BUDGET IMPLEMENTATION REVIEW REPORT FIRST HALF FY, 2015/16 251
3.35.3 Banking of Local Revenue
A review of the bank statements for the revenue collection account indicated that all locally generated revenues was deposited into the CRF during the period under review even though in a regular basis. This conforms to Article 207 of the Constitution and Section 109 of the PFM Act 2012, stipulate that all funds raised or received by or on behalf of the County Government shall be deposited into the CRF account unless excluded by an Act of Parliament.
3.35.4 Exchequer issues
During the reporting period, the CoB authorised withdrawal of Kshs.2.06 billion from the CRF acount, which was 48.3 per cent of the approved budget estimates, an improvement of 31.2 per cent as compared to a similar period of FY 2014/15. This amount consisted of Kshs.1.48 billion (72 per cent) for recurrent expenditure and Kshs.579.35 million (28 per cent) for development activities.
3.35.5 Overall Expenditure Review
The County spent a total of Kshs.1.71 billion in the first quarter of FY 2015/16, which was 82.8 per cent of the released. This was an increase from Kshs.1.08 billion spent in a similar period of FY 2014/15. A total of Kshs.1.34 billion (78.5 per cent) was spent on recurrent activities while Kshs.367.45 million (21.5 per cent) on development activities. Recurrent expenditure was 90.4 per cent of the funds released for recurrent activities while development expenditure accounted for 63.4 per cent of the funds released for development activities. The County did not provide outstanding commitments as of 31st December, 2015.
Recurrent expenditure for the period under review represented an absorption rate of 47.9 per cent, an increase from 36.4 per cent realized in a similar period of FY 2014/15. On the other hand Development expenditure recorded an absorption rate of 24.9 per cent, an improvement from 6.1 per cent realized in a similar period of FY 2014/15 of the total approved budget estimates. Figure 3.138 shows a comparison of the total expenditure between the first half of FY 2014/15 and first half of FY 2015/16.
Figure 3.138: Nyandarua County, Expenditure by Economic Classification for the first half of FY 2014/15 and first half of FY 2015/16
589.60
376.10
112.2
813.60
529.93
367.45
-
100.00
200.00
300.00
400.00
500.00
600.00
700.00
800.00
900.00
Personnel Emoluments Operations & Maintainance Development Expenditure
Kshs
. Milli
ons
Expenditure by Economic Classification
1st Half of FY 2014/15
1st half of FY 2015/16
Source: Nyandarua County Treasury

COUNTY GOVERNMENTS BUDGET IMPLEMENTATION REVIEW REPORT FIRST HALF FY, 2015/16252
3.35.6 Recurrent Expenditure Analysis
Analysis of the annual recurrent expenditure of Kshs. 1.34 billion for the reporting period indicates that Kshs.813.6 million (60.6 per cent) on personnel emoluments and Kshs.529.93 million (39.4 per cent) on operations and maintenance as shown in Figure 3.138. Expenditure on personnel emoluments accounted for 47.6 per cent of total expenditure and has increased in the reporting period as compared to a similar period of FY 2014/15 when the County spent Kshs.589.6 million. In the FY 2014/15 Annual County Governments Budget Implementation Review Report, it was reported that FY 2013/14 personnel emoluments was Kshs.44.7 million instead of Kshs.1.29 billion. This inadvertent error has been clarified and corrected.
The County spent Kshs.27.9 million on sitting allowances to the 42 MCAs which is inclusive of the County Assembly Service Board, against the annual MCAs budget of Kshs.68.41 million, a decrease from Kshs.31.81 million spent in a similar period of FY 2014/15. The average monthly sitting allowance per MCA was Kshs.110, 736 compared to the SRC’s recommended amount of Kshs.124, 800.
A breakdown of the operations and maintenance expenditure in the reporting period is shown in Figure 3.139.
Figure 3.139: Nyandarua County, Operations and Maintenance Expenditure for the First Half of FY 2015/16
98.75
40.98 37.93 34.48 32.28 27.91 21.61 21.04 18.07 17.33 14.24 9.38 9.22 4.640.00
20.00
40.00
60.00
80.00
100.00
120.00
Tra
vel &
Sub
sistan
ce al
lowa
nces
Insu
aran
ce
Cons
ultan
cy an
d St
aff C
apac
itybu
ildin
g
Hosp
ital t
rans
fers
Othe
r O &
M
Sitti
ng A
llowa
nce
Med
icine
(hea
lth p
rodu
cts)
Com
mun
icatio
n, m
embe
rship
s,su
bscr
iptio
n to
new
spap
ers j
orna
l and
perio
dica
ls
Fuel
& L
urica
nts,
Tyre
s & T
ubes
Cater
ing
boar
ds C
onfe
renc
es an
dse
min
ars
Prin
ting
and
gene
ral o
ffice
supp
lies
statio
nery
Rout
ine M
ainten
ance
Adve
rtisin
g an
d pu
blic
awar
enee
cam
paig
ns
Unifo
rms,
Utili
ties,
sani
tary
and
clean
ing
mat
erial
s
Ksh
s.Mill
ions
Major Categories of O and M Expenditure
Source: Nyandarua County Treasury
The total expenditure on domestic and foreign travel was Kshs.98.74 million compared to Kshs.82.33 million in a similar period of FY 2014/15, representing an increase of 19.9 per cent. This expenditure comprised of Kshs.58.73 million by the County Executive and Kshs.40 million by the County Assembly.

COUNTY GOVERNMENTS BUDGET IMPLEMENTATION REVIEW REPORT FIRST HALF FY, 2015/16 253
3.35.7 Development Expenditure Analysis
A summary of development expenditure in the first half of FY 2015/16 is provided in figure 3.140.
Figure 3.140: Nyandarua County, Analysis of Development Expenditure for the first half of FY 2015/16
102.22
54.05 42.89 37.59
24.45 20.97 11.28 10.59 8.01 7.04 5.62 4.57 4.14 3.96 2.68
-
20.00
40.00
60.00
80.00
100.00
120.00
Con
stru
ctio
n of
road
s
Wat
er P
roje
cts
Upg
radi
ng a
nd e
quip
ing
of J
M H
ospi
tal
Com
plet
ion
of C
ount
y A
ssem
bly
Cha
mbe
rs
Gen
eral
road
s m
aint
enan
ce
Con
stru
ctio
n of
mar
kets
she
ds- a
tG
atha
ra,M
agum
u,K
arau
and
…
Ferti
lizer
sub
sidy
Upg
radi
ng o
f Mar
ket
Con
stru
ctio
n of
KM
TC c
lass
es
Con
stru
ctio
n of
bui
ldin
gs a
nd o
ther
s(E
CD
)
Acq
uisi
tion
of L
and
- Oth
er (s
ocia
lam
eniti
es)
Reh
abili
tatio
n of
cat
tle D
ips
Trad
e D
evel
opm
ent F
und
Oth
er In
fras
truct
ure
and
Civ
il W
orks
(Fen
cing
& u
rban
bea
utifi
catio
n)
Mik
eu D
ispe
nsar
y
Ksh
s.m
illio
n
Major categories of Development Expenditure
Source: Nyandarua County Treasury
Analysis of the development expenditure for the period under review of Kshs.367.45 million incurred in the first half of FY 2015/16 indicates that the Roads department had the highest expenditure of Kshs.126.66 million which was incurred on grading and gravelling of roads across the 25 wards. The second highest expenditure of Kshs.54.05 million was incurred on water projects by the Department of Water & Environment. The department for County Attorney, E-Government & Intergovernmental Relations, and the Gubernatorial Office did not report expenditure on development programmes.
3.35.8 Annual Budget and Budget Performance Analysis for the First Half of FY 2015/16 budget performance by Department
A summary of FY 2015/16 annual budget and budget performance by department for the first half of FY 2015/16 is shown in table 3.70.

COUNTY GOVERNMENTS BUDGET IMPLEMENTATION REVIEW REPORT FIRST HALF FY, 2015/16254
Table 3.70: Nyandarua County, FY 2015/16 Annual Budget and First Half of FY 2015/16 Budget Performance by Department
DepartmentBudget Allocation
(Kshs. Million)
6 Months Exche-quer Issues (Kshs.
Million)
6 Months Expen-diture (Kshs.
Million)
Expenditure to exchequer
issues (%)
Absorption rate (%)
Rec Dev Rec Dev Rec Dev Rec Dev Rec Dev
Gubernatorial Office 193.88 0.03 103.41 - 66.52 - 64.3 0.0 34.3 0.0
County Attorney, E-Govern-ment & Intergovernmental Relations
59.67 11 31.43 7 7.07 - 22.5 0.0 11.8 0.0
Finance & Economic Planning 412.32 297.5 271.38 27.2 279.82 35.7 103.1 131.3 67.9 12.0
Agriculture Livestock & Fisheries 245.41 109.55 128.01 48.56 116.2 28.23 90.8 58.1 47.3 25.8
Lands, Housing & Physical Planning 51.3 77.5 24.53 27 7.69 13.03 31.3 48.3 15.0 16.8
Roads Transport & Public Works 109.78 455.36 55.09 197.58 9.9 126.67 18.0 64.1 9.0 27.8
Health Services 869.73 95.09 457.01 55.48 516.45 58.66 113.0 105.7 59.4 61.7
Education, Gender, Youth, Culture and Social Services 209.59 112 95.04 33 75.22 7.04 79.1 21.3 35.9 6.3
Tourism, Wildlife and Sports 25.46 20.41 11.01 14.09 1.51 1.21 13.7 8.6 5.9 5.9
Industrialization Coop, trade and Enterprise Development 48.87 44.37 24.86 22.46 11.96 5.26 48.1 23.4 24.5 11.9
Water & Environment 77.43 184 34.45 102 5.99 54.05 17.4 53.0 7.7 29.4
County Assembly 501 69 250.21 45 245.21 37.59 98.0 83.5 48.9 54.5
TOTAL 2,804.42 1,475.81 1,486.44 579.36 1,343.54 367.45 90.4 63.4 47.9 24.9
Source: Nyandarua County Treasury
Analysis of expenditure by department shows that the Health Services Department attained the highest absorption rate of its annual development budget at 61.7 per cent while the Gubernatorial office, County Attorney E-Government & Intergovernmental Relations and Education Gender Youth Culture Social Services departments did not incur development expenditure during the period under review. On the other hand the Finance and Economic Planning department had the highest percentage of its recurrent expenditure to its recurrent budget at67.9 per cent while the department of Tourism, Wildlife and Sports had the lowest absorption rate of annual recurrent budget at 5.9 per cent in the period under review.
3.35.9 Borrowing by the County Government
Article 212 of the Constitution requires a county government to borrow with approval from the County Assembly, and only if the national government guarantees the loan. Further, Section 58 of the PFM Act 2012 gives the Cabinet Secretary to the National Treasury the powers to guarantee loans subject to approval by Parliament. During the period under review, the County utilized its equitable share and local revenue collections deposited into the County Revenue Fund account maintained at Central Bank of Kenya and did not borrow any funds.

COUNTY GOVERNMENTS BUDGET IMPLEMENTATION REVIEW REPORT FIRST HALF FY, 2015/16 255
3.35.10 Observations & Recommendations
The County has made progress in addressing challenges previously identified as affecting budget implementation. The County has:
(i) Improved local revenue collection which accounted for 37.2 per cent of the annual revenue target up from 24 per cent realised in a similar period of FY 2014/15.
(ii) Improved the absorption of development funds which stood at 24.9 per cent from 6.1 per cent registered in a similar period of FY 2014/15.
However, the following challenges continued to hamper effective budget implementation:
1. Delay in disbursement of funds by the National Treasury.
2. Lack of an Internal Audit Committee contrary to Section 155(5) of the PFMA, 2012.
3. The County wage bill has risen drastically over the last two years.
4. The County did not budget for the funds brought forward from FY 2014/15 and used a lower figure of equitable share than that contained in the CARA, 2015.
The County should implement the following recommendations in order to improve budget execution:
1. The National Treasury should ensure funds allocated to counties are released in a timely manner in line with the CARA 2015 disbursement schedule.
2. The County Treasury should establish an Internal Audit Committee as per Section 155(5) of the PFM Act 2012, in order to enhance public financial management oversight.
3. The County should conduct a staff rationalization exercise based on merit to tame the rising wage bill.
4. The County should develop a supplementary budget to program for the funds brought forward from FY 2015/16 and the correct equitable amount based on the CARA 2015.
3.36 Nyeri County
3.36.1 Overview of the FY 2015/16 Budget
The FY 2015/16 approved budget for Nyeri County amounted to Kshs.6.28 billion, with Kshs.4.28 billion (68.2 per cent) allocated to recurrent expenditure and Kshs.1.99 billion (31.8 per cent) to development expenditure.
It comprises of Kshs.4.34 billion (69.1 per cent) equitable shares from the National Government, Kshs.453.96 million (7.2 per cent) conditional grants and Kshs.1.48 billion (23.7 per cent) local revenue. However, the County under budgeted for equitable shares and conditional grants by Kshs.107.33 million and Kshs.165.18 million respectively as compared to the provisions of CARA 2015. Further, Kshs.22.93 million donor funds from DANIDA were not factored in the FY 2015/16

COUNTY GOVERNMENTS BUDGET IMPLEMENTATION REVIEW REPORT FIRST HALF FY, 2015/16256
budget. The County should review its budget through a supplementary budget so as to reflect the updated revenue levels.
3.36.2 Revenue Analysis
During the first half of FY 2015/16, the County received Kshs.1.68 billion from the National Government as fiscal transfers, raised Kshs.225.50 million from local sources, and had an actual cash balance of Kshs.205.66 million brought forward from FY 2014/15. The fiscal transfers received from the National Government, which represented 33.9 per cent of annual county allocations, included Kshs.1.49 billion as equitable shares, Kshs.123.49 million conditional allocations to Nyeri County referral hospital, Kshs.28.54 million conditional grants for maintenance of county roads, Kshs.37.00 million for free maternal health care and Kshs.6.36 million for user fees forgone by health facilities.
The trend in local revenue collection from FY 2013/14 to the second quarter of FY 2015/16 is shown in figure 3.141.
Figure 3.141: Nyeri County, Trend in Local Revenue Collection by Quarter from the FY 2013/14 to the second quarter of FY 2015/16
138.49
208.25 204.31
0
50
100
150
200
250
Ksh
s.m
illio
n
Reporting period
Source: Nyeri County Treasury
The local revenue consisted of Kshs.141.91 million raised in the first quarter and Kshs.83.59 million in the second quarter. The local revenue raised in the first half of the FY 2015/16 was Kshs.225.50 million which is 15.2 per cent of the annual local revenue target, and represented a considerable decline from Kshs.268.14 million collected in a similar period of FY 2014/15. The decline in local revenue collection, which fell by 15.9 per cent, was attributable to a slump in the performance of some main revenue streams such as parking fees and refuse collection fees.
The analysis of local revenue by stream is shown in Table 3.71.

COUNTY GOVERNMENTS BUDGET IMPLEMENTATION REVIEW REPORT FIRST HALF FY, 2015/16 257
Table 3.71: Nyeri County, Analysis of revenue collection per stream for the first half of FY 2015/16
No. Revenue StreamAnnual Revenue Target (Kshs.)
6 Months Actual Revenue (Kshs.)
6 Months Revenue Performance (%)
A B C D=C/B*100
1Hospital services
258,859,938 40,793,080 15.8
2 Parking Fees 143,436,072 38,592,365 26.9
3 Liquor License 7,889,046 29,203,050 370.2
4 Market Fees 77,721,130 17,741,543 22.8
5Business Permits
151,954,610 14,377,179 9.5
6 Others Sources 848,497,340 84,789,561 10.0
TOTAL 1,488,358,136 225,496,778 15.2
Source: Nyeri County Treasury
The analysis of revenue by stream indicates that the main source of revenue in the county was hospital services fees at Kshs.40.79 million, Parking fees and Liquor licenses were the second and third highest contributors to local revenue at Kshs.38.59 million and Kshs.29.20 million respectively. Further analysis shows that the top 5 revenue streams contributed up to about 62.4 per cent of total local revenue collected during the reporting period.
3.36.3 Banking of local revenue
In the first half of FY 2015/16, the County banked all the locally generated revenue intact into the revenue be deposited to the CRF. This confirms to Article 207 of the Constitution and Section 109 of the PFM Act 2012, which stipulates that all funds raised or received by or on behalf of the County Government should be deposited into the CRF account, unless excluded by an Act of Parliament.
3.36.4 Exchequer issues
The Controller of Budget authorised withdrawal of Kshs.1.95 billion from the CRF account, which was 31.0 per cent of the approved budget. The amount consisted of Kshs.1.83 billion (94.1 per cent) for recurrent expenditure and Kshs.114.50 million (5.9 per cent) for development activities, and represented a decline of 8.5 per cent from Kshs.2.12 billion authorized in a similar period of FY 2014/15.
3.36.5 Overall Expenditure Review
The County spent a total of Kshs.1.69 billion during the first half of FY 2015/16 which was 87.3 per cent of the funds released for operations. This is a reduction from the Kshs.1.98 billion spent in a similar period of FY 2014/15. A total of Kshs.1.59 billion was spent on recurrent activities and Kshs.109.41 million on development activities. Recurrent expenditure was 86.8 per cent of the funds released for recurrent activities while development expenditure accounted for 95.6 per cent of the funds released for development activities. The expenditure excludes commitments as of 31st

COUNTY GOVERNMENTS BUDGET IMPLEMENTATION REVIEW REPORT FIRST HALF FY, 2015/16258
December, 2015 that amounted to Kshs.56.65 million for development and Kshs.182.48 million for recurrent expenditure.
Recurrent expenditure for the period under review represented 37.1 per cent of the approved annual recurrent budget, a decrease from 44.5 per cent spent in a similar period of FY 2014/15. On the other hand Development expenditure recorded an absorption rate of 5.5 per cent, a significant decrease from 17.6 per cent realized in a similar period of FY 2014/15. A comparison of the total expenditure between the second quarter of FY 2014/15 and FY 2015/16 is shown in Figure 3.142.
Figure 3.142: Nyeri County, Expenditure by Economic Classification for First Half of FY 2014/15 and First Half of FY 2015/16
1,269.61
423.95 287.37
1,281.86
307.19 109.41
-
200
400
600
800
1,000
1,200
1,400
Personnel Emoluments Operations & Maintenance Development
Ksh
s. M
illio
ns
Expenditure by Economic Classification
1st Half, FY 2014/15
1st Half, FY 2015/16
Source: Nyeri County Treasury
3.36.6 Recurrent Expenditure Analysis
The total recurrent expenditure for the reporting period was Kshs.1.59 billion against an annual total of budget of Kshs.4.28 billion. This represents 37.1 per cent of annual recurrent budget. The County spent Kshs.1.28 billion (80.7 per cent) on personnel emoluments and Kshs.307.19 million (19.3 per cent) on operations and maintenance as shown in Figure 3.142. Expenditure on personnel emoluments accounted for 75.5 per cent of total expenditure and has slightly increased in FY 2015/16 as compared to a similar period in FY 2014/15 when the County spent Kshs.1.27 billion.
The County spent Kshs.38.68 million on sitting allowances to the 47 MCAs and the Speaker against an annual budget of Kshs.107.86 million. This was a marginal decrease from Kshs.41.28 million recorded in a similar period of FY 2014/15. The average monthly sitting allowance per MCA was Kshs.134,300 compared to SRC’s recommended monthly ceiling of Kshs.124,800.
A breakdown of the operations and maintenance expenditure for the reporting period is shown in Figure 3.143.

COUNTY GOVERNMENTS BUDGET IMPLEMENTATION REVIEW REPORT FIRST HALF FY, 2015/16 259
Figure 3.143: Nyeri County, Operations and Maintenance Expenditure for the First Half of FY 2015/16
57.40 55.8446.97 46.10
23.2116.47 15.92 14.75 11.09 8.11 5.16 3.88 2.28
0
10
20
30
40
50
60
70
Hosp
italit
y an
d Ca
terin
g
Dom
estic
& F
orei
gn T
rave
l
Utili
ties
Med
ical s
uppl
ies
Othe
r O &
M
Prin
ting
and
Adve
rtisin
g
Train
ing
Insu
ranc
e
Fuel
, oil
and
lubr
icant
s
Gene
ral s
uppl
ies
Rout
ine m
ainten
ance
Gratu
ity-c
ivil
serv
ants
Com
mun
icatio
n se
rvic
es
Ksh
s. M
illio
ns
Major Categories of O&m Expenditure
Source: Nyeri County Treasury
The aggregate expenditure on domestic and foreign travel was Kshs.55.83 million compared to Kshs.54.14 million incurred in a similar period of FY 2014/15, representing a marginal increase of 3.1 per cent. This expenditure comprised of Kshs.21.00 million spent by the County Executive and Kshs.34.83 million by the County Assembly.
3.36.7 Development Expenditure Analysis
A summary of development expenditure during the first half of FY 2015/16 is provided in figure 3.144.
Figure 3.144: Nyeri County, Summary of Development Expenditure for the First Half of FY 2015/16
27.25 26.05 26.04
7.63 6.294.23 3.26 2.90 2.84 2.54
0
5
10
15
20
25
30
Refu
rbish
ment
of of
fices
Mur
raming
of ac
cess
roads
Stree
t ligh
ting a
nd hi
gh m
ast li
ghts
Wate
r sup
plies
Purch
ase of
med
ical e
quipm
ent
Purch
ase of
comp
uters
and o
ffice
equip
ment
Cons
tructi
on of
bridg
es
Irriga
tion w
orks
Equip
ping o
f vill
age p
olytec
hnics
Othe
r proj
ects
Kshs
. Mill
ions
Major Categories of Development Expenditure
Source: Nyeri County Treasury

COUNTY GOVERNMENTS BUDGET IMPLEMENTATION REVIEW REPORT FIRST HALF FY, 2015/16260
Analysis of the development expenditure of Ksh.109.41 million incurred in the first half of FY 2015/16 indicates that the Lands and Infrastructure department had the highest expenditure of Kshs.31.76 million, which was spent on grading of access roads and construction of bridges. The Energy department recorded the second highest expenditure of Kshs.26.04 million incurred on erection of street lights and high mast lights. The County Assembly spent Kshs.15.15 million on construction of a boundary wall and refurbishment of parking while the department of Water and Natural resources incurred Kshs.10.64 million on water supplies and irrigation works.
3.36.8 Annual Budget and Budget Performance Analysis by department for the First Half of FY 2015/16
A summary of the FY 2015/16 annual budget estimates and budget performance for the first half by department is as shown in Table 3.72.
Table 3.72: Nyeri County, Annual Budget and First Half of FY 2015/16 Budget Performance by Department
DepartmentBudget Allocation
(Kshs.Million)
6 Months Exche-quer Issues (Kshs.
Million)
6 Months Expen-diture (Kshs.
Million)
Expenditure to exchequer
issues (%)
Absorption rate (%)
Rec Dev Rec Dev Rec Dev Rec Dev Rec Dev
Office of the Governor 81.07 0 36.03 0.0 30.43 0.0 84.5 37.5
Office of County Secretary 110.81 0 59.09 0.0 7.48 0.0 12.7 6.8
Finance and Economic Planning 262.01 210.88 123.99 0.0 67.51 0.0 54.4 25.8 0.0
Education & ICT 54.09 138.77 21.11 10.00 17.10 2.89 81.0 28.9 31.6 2.1
Health Services 2,014.30 281.49 860.97 10.00 824.88 6.59 95.8 65.9 41.0 2.3
Special Programmes 71.22 40.44 34.99 5.00 6.99 1.93 20.0 38.6 9.8 4.8
Lands and Infrastructure 107.55 599.85 49.32 40.00 56.95 31.76 115.5 79.4 53.0 5.3
County Assembly 547.58 155 227.09 0.0 208.39 15.15 91.8 38.1 9.8
Public administration, Information and Communication
416.34 43 168.01 5.00 165.26 10.52 98.4 210.4 39.7 24.5
Trade, Industrialisation and Tourism 75.28 164.6 29.86 10.00 9.89 1.23 33.1 12.3 13.1 0.7
County Public Service Board 34.36 5 15.92 0.0 11.89 0.0 74.7 34.6 0.0
Agriculture 296.49 111.67 115.94 9.50 113.13 2.66 97.6 28.0 38.2 2.4
Water, sanitation & Natural Re-sources
136.8 146.66 55.36 10.00 43.33 10.64 78.3 106.4 31.7 7.3
Energy 78.85 100.09 33.18 15.00 25.80 26.04 77.8 173.6 32.7 26.0
Total4,286.75 1,997.46 1,830.86 114.50 1,589.05 109.41 86.8 95.6 37.1 5.5
Source: Nyeri County Treasury
An analysis of budget performance by department shows that the Department of Energy reported the highest absorption rate of its development budget at 26.0 per cent while the Department of Finance and Economic Planning, and the County Public Service Board did not implement their development budgets. On the other hand, the Department of Lands and Infrastructure development had the highest
COUNTY GOVERNMENTS BUDGET IMPLEMENTATION REVIEW REPORT FIRST HALF FY, 2015/16 261
percentage of its recurrent expenditure to its recurrent budget at 52.9 per cent while the Office of the County Secretary achieved the lowest percentage of its recurrent expenditure to its recurrent budget at 6.8 per cent.
3.36.9 Borrowing by the County Government
During the reporting period, the County did not borrow any funds. Article 212 of the Constitution requires a county government to borrow with approval from the County Assembly, and only if the national government guarantees the loan. Further, Section 58 of the PFM Act 2012 gives the Cabinet Secretary to the National Treasury the powers to guarantee loans subject to approval by Parliament.
3.36.10 Observations and Recommendations
The County has made progress in addressing the challenges previously identified as affecting budget implementation. The County has:
i. Developed a framework for public participation to guide public engagement and consultation. However, the County Budget and Economic Forum is yet to be established as required under Section 137 of the PFM Act 2012.
ii. Adhered to the legal timelines in the formulation of budget documents.
Despite the progress made, the following challenges continued to hamper effective budget implementation;
1. Slow implementation of the development budget which recorded an absorption rate of 5.5 per cent during the period under review.
2. Underperformance of local revenue collection which dropped by 15.9 per cent as compared to a similar period of FY 2014/15.
3. The County did not budget for some conditional allocations under the CARA 2015 amounting to Kshs.22.93 million.
The County should implement the following recommendations in order to improve budget execution;
1. Departments should enhance implementation of planned programmes through proper planning and timely execution of projects.
2. The County Treasury should enhance revenue mobilization efforts and also institute strong controls to curb loss of revenue through leakages.
3. The county needs to formulate a supplementary budget so as to include the additional amounts to be received under CARA, 2015.

COUNTY GOVERNMENTS BUDGET IMPLEMENTATION REVIEW REPORT FIRST HALF FY, 2015/16262
3.37 Samburu County
3.37.1 Overview of the FY 2015/16 BudgetThe FY 2015/16 approved budget for Samburu County was Kshs.4.34 billion. It comprised of Kshs.2.59 billion (59.7 per cent) allocated for recurrent expenditure and Kshs.1.75 billion (40.3 per cent) for development expenditure.
In order to finance the budget, the County expected to receive Kshs.3.53 billion (81.3 per cent) as transfers from the National Government, collect Kshs.356.59 million (8.2 per cent) from local sources, and receive a conditional grant of Kshs.10.99 million (0.25 per cent) from DANIDA. Other conditional grants include; the road maintenance levy fund of Kshs.45.13 million (1.03 per cent), compensation of forgone user fees of Kshs.5.22 million (0.12 per cent), free maternal healthcare of Kshs.14.18 million (0.33 per cent), Conditional Health allocation of Kshs.91.8 million (2.12 per cent) and World Bank grant of Kshs.8.67 million (1.99 per cent). The County Treasury included in the supplementary budget Kshs.280 million (6.4 per cent) as balance brought forward from FY 2014/15 instead of the actual amount of Kshs.355.38 million. Treasury has however acknowledged the anomaly and plans are underway to pass a supplementary to correct it.
3.37.2 Revenue Analysis
In the first half of FY 2015/16, the County received Kshs.1.19 million from the National Government as equitable share to the CRF account, raised Kshs.84.99 million from local sources, and had an actual cash balance of Kshs.355.38 million brought forward from FY 2014/15 though the County Treasury reported a figure of Kshs.280 million. In addition, the County received Kshs.5.50 million from DANIDA, Kshs.5.23 million as conditional allocation for free maternal health care, Kshs.1.94 million as conditional allocation for compensation for forgone user fees, and Kshs.22.79 million from the Road Maintenance Fuel Levy Fund.
The quarterly trend in local revenue collection from FY 2013/14 to the second quarter of FY 2015/16 is shown in figure 3.145.
Figure 3.145: Samburu County, Trend in Local Revenue Collection by Quarter from the FY 2013/14 to the second quarter of FY 2015/16
65.14
48.52
56.34
20
30
40
50
60
70
80
Kshs
.Milli
ons
Reporting period
Source: Samburu County Treasury

COUNTY GOVERNMENTS BUDGET IMPLEMENTATION REVIEW REPORT FIRST HALF FY, 2015/16 263
The local revenue consisted of Kshs.56.34 million raised in the first quarter and Kshs.28.64 million in the second quarter. The local revenue raised in the first half of the FY 2015/16 was Kshs.84.99 million (23.8 per cent of the annual local revenue target), a decline from Kshs.120.64 million collected in a similar period of FY 2014/15.An analysis of local revenue by stream for the first half of FY 2015/16 is provided in table 3.73.
Table 3.73: Samburu County, Analysis of revenue collection by stream for the first half of FY 2015/16
No. Revenue Stream Annual Targeted Revenue (Kshs.)
Six Months Actual Revenue (Kshs.)
Revenue Perfor-mance (%)
A B C D=*100
1 Health Department 9,450,000 3,385,201 35.8
2 Samburu National Reserve 210,000,000 57,195,966 27.2
3 Others Sources 50,830,640 12,529,511 24.6
4 Cess Receipts 32,285,000 5,583,955 17.3
5 Single Business Permits 18,470,000 2,517,600 13.6
6 Land Rates 25,500,000 3,333,270 13.1
7 Agricultural Machinery Services 10,050,000 443,732 4.4
TOTAL 356,585,640 84,989,235 23.8
Source: Samburu County Treasury
The analysis of local revenue collection by stream indicates that Health Department recorded the highest performance against the annual target at 35.8 per cent followed Samburu National Reserve at 27.2 per cent.
3.37.3 Banking of local revenue
In the first half of FY 2015/16, the County did not bank all the locally generated revenue into the CRF. Revenue from the Samburu National Reserve is held in a dollar account at KCB-Maralal and as per banking arrangements between the County Treasury and the bank, the dollar account balance converted to Kenya Shillings and deposited in the CRF at the end of each quarter. As at the time of writing this report, USD.17,530 had not been deposited in the CRF. Article 207 of the Constitution and Section 109 of the PFM Act 2012, stipulate that all funds raised or received by or on behalf of the County Government should be deposited into the CRF account, unless excluded by an Act of Parliament.
3.37.4 Exchequer Issues
The Controller of Budget authorised withdrawal of Kshs.1.62 billion from the CRF account, which was 37.3 per cent of the approved budget. The amount represented an increase of 12.5 per cent from

COUNTY GOVERNMENTS BUDGET IMPLEMENTATION REVIEW REPORT FIRST HALF FY, 2015/16264
Kshs.1.44 billion authorized in a similar period of FY 2014/15 and consisted of Kshs.1.12 billion (69.2 per cent) for recurrent expenditure and Kshs.498.8 million (30.8 per cent) for development activities. The expenditure excludes commitments as of 31st December, 2015 that amounted to Kshs.529.6 million for development and Kshs.205.6 million for recurrent expenditure.
3.37.5 Overall Expenditure Review
The County spent a total of Kshs.1.29 billion during the first half of FY 2015/16 which was 79.6 per cent of the funds released for both recurrent and development expenditure. This is a slight decrease from the Kshs.1.36 billion spent in a similar period of FY 2014/15. A total of Kshs.906.31 million was spent on recurrent activities and Kshs.383.65 million on development activities. Recurrent expenditure was 80.9 per cent of the funds released for recurrent activities while development expenditure accounted for 76.3 per cent of the funds released for development activities.
Recurrent expenditure for the period under review represented 34.9 per cent of the approved annual recurrent budget, an increase from 25.6 per cent spent in a similar period of FY 2014/15. On the other hand, development expenditure recorded an absorption rate of 21.9 per cent, an improvement from 37.8 per cent spent in a similar period of FY 2014/15. A comparison of the total expenditure between the second quarter of FY 2014/15 and FY 2015/16 is shown in Figure 3.146.
Figure 3.146: Samburu County, Expenditure by Economic Classification for First Half of FY 2014/15 and First Half of FY 2015/16
433.12
199.99
580.45528.75
345.42
32.14
383.65
0
100
200
300
400
500
600
700
Personnel Emoluments Operations &Maintenance
County Funds Development
Ksh
s. M
illio
ns
Expenditure by Economic classification
1st Half of FY 2014/15
1st Half of FY 2015/16
Source: Samburu County Treasury
3.37.6 Recurrent Expenditure Analysis
The total recurrent expenditure for the reporting period was Kshs.906.31 million against an annual budget of Kshs.2.59 billion. This represents 34.9 per cent of the annual recurrent budget. The County spent Kshs.528.75 million (58.3 per cent) on personnel emoluments, Kshs.345.42 million (38.1 per cent) on operations and maintenance and Kshs.32.14 million (3.5 per cent) on County Funds as shown in Figure 3.146. Expenditure on personnel emoluments accounted for 40.9 per cent of total expenditure and has increased significantly in the first half of FY 2015/16 as compared to a similar

COUNTY GOVERNMENTS BUDGET IMPLEMENTATION REVIEW REPORT FIRST HALF FY, 2015/16 265
period of FY 2014/15 when the County spent Kshs.433.12 million. The increase is attributed to continued recruitment by the County Public Service Board.
The County spent Kshs.25.46 million on sitting allowances to the 26 MCAs and the Speaker against an annual budget of Kshs.45.53 million, representing a significant increase from Kshs.14.52 million recorded in a similar period of FY 2014/15. The average monthly sitting allowance per MCA was Kshs.163,221 compared to SRC’s recommended monthly ceiling of Kshs.124,800.
A breakdown of the operations and maintenance expenditure for the reporting period is shown in Figure 3.147.
Figure 3.147: Samburu County, Operations and Maintenance Expenditure for the First Half of FY 2015/16
56.58 53.51
27.14 25.46 21.56 19.52 19.02
10.77 9.77 9.27 6.22 5.48 5.45 5.10 2.76
-
10.00
20.00
30.00
40.00
50.00
60.00
Dom
estic
& F
orei
gn T
rave
l
Gratu
ity
Gran
ts
Sitti
ng A
llowa
nce
Fuel
, Oil
& L
ubric
ants
Food
Rati
ons
Med
ical D
rugs
Main
tenan
ce
Train
ing
Cater
ing
Serv
ices
Utili
ties
Com
mun
icatio
n Se
rvice
s
Lega
l
Insu
ranc
e
Publ
ishin
g &
Adv
ertis
ing
Ksh
s. M
illio
ns
Major Categories of O & M Expenditure
Source: Samburu County Treasury
The aggregate expenditure on domestic and foreign travel was Kshs.56.58 million compared to Kshs.65.36 million incurred in a similar period of FY 2014/15, representing a decrease of 13.4 per cent. This expenditure comprised of Kshs.44.55 million spent by the County Executive and Kshs.12.02 million by the County Assembly.
3.37.7 Development Expenditure Analysis
A summary of development expenditure during the first half of FY 2015/16 is provided in figure 3.148.

COUNTY GOVERNMENTS BUDGET IMPLEMENTATION REVIEW REPORT FIRST HALF FY, 2015/16266
Figure 3.148: Samburu County, Summary of Development Expenditure for the First Half of FY 2015/16
51.77
38.36 38.36
29.29 26.321.74 19.99
10.815.88
0
10
20
30
40
50
60Co
nstru
ctio
n of
acce
ssro
ads
Com
mun
ity C
onse
rvan
cies
Oth
er In
frastr
uctu
re &
Wor
ks
Wat
er su
pplie
s
Cons
truct
ion
of E
CDs
Cons
truct
ion
of H
ealth
Faci
litie
s
Cons
truct
ion
of B
ridge
s
Purc
hase
of C
ertif
ied
seed
s
Purc
hase
of B
reed
ing
stcok
Ksh
s. M
illio
n
Major Categories of Development Expenditure
Source: Samburu County Treasury
Analysis of the development expenditure of Kshs.383.65 million incurred in the first half of FY 2015/16 indicates that the Roads Department reported the highest expenditure of Kshs.51.77 million which was spent on development and maintenance of access roads, construction of bridges and feasibility and project appraisal studies. The second highest expenditure of Kshs.38.36 million was incurred by Trade and Tourism Department on community conservancies and capacity building under its development programmes. The Department of Agriculture, Livestock and Fisheries incurred Kshs.16.69 million on breeding stock and certified seeds.
3.37.8 Annual Budget and Budget Performance Analysis by department for the First Half of FY 2015/16
A summary of the FY 2015/16 annual budget estimates and budget performance for the first half by department is shown in Table 3.74.
Table 3.74: Samburu County, Annual Budget and First Half of FY 2015/16 Budget Performance by Department
DepartmentBudget Allocation
(Kshs. Million)
6 Months Exche-quer Issues (Kshs.
Million)
6 Months Expenditure
(Kshs. Million)
Expenditure to exchequer
issues (%)
Absorption rate (%)
Rec Dev Rec Dev Rec Dev Rec Dev Rec Dev
County Assembly 431.46 50 170.02 - 196.07 - 115.3 - 45.4 -
County Executive & CPSB 338.85 23 155.68 - 130.81 1.45 84 - 38.6 6.3
Finance & Economic Planning 304.43 45.5 113.24 1.26 106.51 - 94.1 - 35 -

COUNTY GOVERNMENTS BUDGET IMPLEMENTATION REVIEW REPORT FIRST HALF FY, 2015/16 267
DepartmentBudget Allocation
(Kshs. Million)
6 Months Exche-quer Issues (Kshs.
Million)
6 Months Expenditure
(Kshs. Million)
Expenditure to exchequer
issues (%)
Absorption rate (%)
Rec Dev Rec Dev Rec Dev Rec Dev Rec Dev
Agriculture, Livestock & Fisheries 154.85 202.24 60.06 45.55 47 39.99 78.3 87.8 30.4 19.8
Environment & Natural Resources 49.53 66.51 22.93 12.96 11.47 7.97 50 61.5 23.2 12
Education, Youth Affairs & Sports 284 179.88 124.01 37.11 84 40.57 67.7 109.3 29.6 22.6
Health services 546.21 214.31 259.27 65.43 192.96 22.28 74.4 34.1 35.3 10.4
Physical planning, Housing and Urban Development 86.18 133.94 41.81 27 20.27 3.1 48.5 11.5 23.5 2.3
Public Works, County Roads & Water 190.52 654.5 81.9 234.52 62.13 215.09 75.9 91.7 32.6 32.9
Trade, Tourism & Cooperative De-velopment 131.23 141.6 62.26 66.52 36.92 53.2 59.3 80 28.1 37.6
Gender, Culture and Social Services 75.66 36.3 30.43 8.52 18.16 - 59.7 - 24 -
Total 2,592.91 1,747.78 1,121.61 498.87 906.3 383.65 80.9 76.9 35.0 21.9
Source: Samburu County Treasury
Analysis of budget performance by department shows that the Department of Trade, Tourism & Cooperative Development reported the highest absorption rate of its development budget at 37.6 per cent while Finance & Economic Planning and County Assembly did not incur any development expenditure during the reporting period. The County Executive spent Kshs.1.45 million though the department did not request any funds for development activities from COB during the reporting period. On the other hand, the Office of the Governor and CPSB had the highest percentage of its recurrent expenditure to its recurrent budget at 45.4 per cent while the Environment & Natural Resources Department had the lowest percentage of its recurrent expenditure to its recurrent budget at 23.2 per cent.
3.37.9 Borrowing by the County Government
Article 212 of the Constitution requires a county government to borrow with approval from the County Assembly, and only if the national government guarantees the loan. Further, Section 58 of the PFM Act 2012 gives the Cabinet Secretary to the National Treasury the powers to guarantee loans subject to approval by Parliament. During the period under review, the County did not borrow money for its operations. To finance its budget for the half year period, the County relied on transfers from the national government, local revenues and balance brought forward from FY 2014/15.

COUNTY GOVERNMENTS BUDGET IMPLEMENTATION REVIEW REPORT FIRST HALF FY, 2015/16268
3.37.10 Observations and Recommendations
The County has made progress in addressing the challenges previously identified as affecting budget implementation. The County has:
i. Instituted a Monitoring and Evaluation Committee.
ii. Established an Internal Audit Committee as specified in section 155(5) of the PFM Act 2012. The two committees are critical in enhancing transparency and accountability in the management of public resources.
Despite the progress made, the following challenges continued to hamper effective budget implementation;
1. Underperformance in local revenue collection whereby Kshs.84.99 million was collected in the reporting period compared to Kshs.120.64 million collected in a similar period of FY 2014/15.
2. Accumulation of huge amounts of imprest by officers. As at the end of the reporting period, Kshs.89.77 million was outstanding.
3. Failure to develop regulations to operationalize the County Executive and County Assembly Car Loan & Mortgage Funds.
The County should implement the following recommendations in order to improve budget execution:
1. The County Treasury should put in place mechanisms that will improve revenue collection in the remaining half of the year.
2. The County Treasury should ensure close supervision of officers handling imprest management.
3. The County Treasury should ensure that all establish County Funds are operationalized by approved regulations as required by the PFM Act 2012.
3.38 Siaya County
3.38.1 Overview of the FY 2015/16 Budget
The FY 2015/16 approved budget for Siaya County amounted to Kshs.6.26 billion. It comprised Kshs.3.75 billion (59.9 per cent) allocated for recurrent expenditure and Kshs.2.51 billion (40.1 per cent) for development expenditure.
In order to finance the budget, the County expects to receive Kshs5.00 billion (79.8 per cent) as transfers from the National Government, collect Kshs343.31 million (5.5 per cent) from local sources, and receive conditional grants totalling Kshs119.03 million (1.9 per cent) comprising Kshs.91.50 million from the World Bank and Kshs.27.53 million from DANIDA and Kshs1.09 billion as cash balance brought forward from FY 2014/15

COUNTY GOVERNMENTS BUDGET IMPLEMENTATION REVIEW REPORT FIRST HALF FY, 2015/16 269
However, only Kshs.800.34 million of the opening balance was factored in the 2015-16 budget, the balance of Kshs.287.61 million was not. Further, the County did not budget for the additional conditional grants of Kshs.306.92 million from the National Government as contained in CARA, 2015 for free maternal healthcare, compensation for forgone user fees, leasing of medical equipment and road maintenance fuel levy fund.
3.38.2 Revenue Analysis
During the first half of FY 2015/16, the County received Kshs.1.67 billion from the National Government as equitable share, Kshs.42.64 million for Free Maternal Healthcare, Kshs.32.05 million from the road maintenance fuel levy fund and Kshs.5.76 million as forgone user fees allocation to the CRF account, raised Kshs.52.42 million from local sources, and had a cash balance of Kshs.1.09 billion brought forward from FY 2014/15. The quarterly trend in local revenue collection from the FY 2013/14 to the second quarter of FY 2015/16 is shown in figure 3.149.
Figure 3.149: Siaya County, Trend in Local Revenue Collection by Quarter from the FY 2013/14 to the second quarter of FY 2015/16
33.50
26.10
10
15
20
25
30
35
40
45
Ksh
s.m
illi
on
Reporting Period
Source: Siaya County Treasury
The local revenue consisted of Kshs.29.17 million raised in the first quarter and Kshs.23.25 million in the second quarter. The local revenue raised in the first half of the FY 2015/16 was Kshs.52.42 million (15.3 per cent of the annual local revenue target), and a decrease from Kshs.60.74 million collected in a similar period of FY 2014/15.An analysis of local revenue mobilized through various revenue streams in the first half of FY 2015/16 is provided in table 3.75.

COUNTY GOVERNMENTS BUDGET IMPLEMENTATION REVIEW REPORT FIRST HALF FY, 2015/16270
Table 3.75: Siaya County, Analysis of revenue collection per stream for the first half of FY 2015/16
NO. Revenue Stream Annual Revenue Target 6 Months Actual Reve-nue Collection Revenue Performance (%)
A B C D=C/B*100
1 Trade (Weights and Measures) 550,000 256,950 46.7
2 Bus Park Fees 12,000,000 5,501,880 45.8
3 Health Department 45,500,000 19,848,873 43.6
4 Slaughter Fees 896,500 321,810 35.9
5 Fish Cess 6,500,000 2,024,680 31.1
6 Others Sources 164,548,500 24,442,841 14.9
TOTAL 343,309,926 52,397,034 15.3
Source: Siaya County Treasury
The analysis of revenue by stream indicates that Weights and Measures generated the highest percentage of revenue against target at 46.7 per cent followed by Bus Park Fees 45.8 per cent. However, this analysis does not agree with the total of Kshs.54.43 million indicated as having been banked into the CRF account.
3.38.3 Banking of local revenue
A review of the bank statements for the revenue collection account indicates that all locally collected revenue was deposited into the CRF during the period under review. This conforms to Article 207 of the Constitution and Section 109 of the PFM Act 2012, which stipulates that all funds raised or received by or on behalf of the County Government should be deposited into the CRF account, unless excluded by an Act of Parliament.
3.38.4 Exchequer Releases
The Controller of Budget authorised withdrawal of Kshs.1.69 billion from the CRF account, which was 27.0 per cent of the approved budget. The amount represented a decline of 29.0 per cent from Kshs.2.38 billion authorized in a similar period of FY 2014/15 and consisted of Kshs.1.31 billion (77.5 per cent) for recurrent expenditure and Kshs.382 million (22.5 per cent) for development activities.
3.38.5 Overall Expenditure Review
The County spent a total of Kshs.1.63 billion during the first half of FY 2015/16 which was 96.4 per cent of the total funds released for both recurrent and development expenditure. This is an improvement from the Kshs.1.55 billion spent in a similar period of FY 2014/15. A total of Kshs.1.21

COUNTY GOVERNMENTS BUDGET IMPLEMENTATION REVIEW REPORT FIRST HALF FY, 2015/16 271
billion was spent on recurrent activities and Kshs.426.16 million on development activities. Recurrent expenditure was 92.0 per cent of the funds released for recurrent activities while development expenditure accounted for 111.5 per cent of the funds released for development activities. The expenditure excludes commitments as of 31st December, 2015 that amounted to Kshs.219.44 million for development and Kshs.91.5 million for recurrent expenditure.
Recurrent expenditure for the period under review represented 32.2 per cent of the approved annual recurrent budget, a decline from 34.6 per cent achieved in a similar period of FY 2014/15. On the other hand, development expenditure recorded an absorption rate of 17.0 per cent, an improvement from 14.8 per cent spent in a similar period of FY 2014/15. A comparison of the total expenditure in the first half of FY 2014/15 and the first half of FY 2015/16 is shown in Figure 3.150.
Figure 3.150: Siaya County, Expenditure by Economic Classification for First Half of FY 2014/15 and First Half of FY 2015/16
862.00
325.30362.70
818.09
388.16426.16
200
300
400
500
600
700
800
900
Personnel Emoluments Operation and Maintenance Development
Ksh
s.mill
ions
Expenditure by Economic Classification
1st Half of FY 2014/151st Half of FY 2015/16
Source: Siaya County Treasury
3.38.6 Recurrent Expenditure Analysis
The total recurrent expenditure for the reporting period was Kshs.1.21 billion against an annual budget of Kshs.3.75 billion. This represents 32.2 per cent of the annual recurrent budget. The County spent Kshs.818.09 million (67.8 per cent) on personnel emoluments and Kshs.388.16 million (32.2 per cent) on operations and maintenance as shown in Figure 3.150. Expenditure on personnel emoluments accounted for 50.1 per cent of total expenditure and has marginally decreased in the first half ofFigure 3.150 FY 2015/16 as compared to a similar period of FY 2014/15 when the County spent Kshs.862.0 million. The decline is attributed to a reduction of casual workers by the County.
The County spent Kshs.24.05 million on sitting allowances to the 48 MCAs and the Speaker against an annual budget of Kshs.43.18 million. This is a decrease from Kshs.42.04 million recorded in a similar period of FY 2014/15. The average monthly sitting allowance per MCA was Kshs.81,786 compared to SRC’s recommended monthly ceiling of Kshs.124,800.
A breakdown of the operations and maintenance expenditure for the reporting period is shown in Figure 3.151.

COUNTY GOVERNMENTS BUDGET IMPLEMENTATION REVIEW REPORT FIRST HALF FY, 2015/16272
Figure 3.151: Siaya County, Operations and Maintenance Expenditure for the First Half of FY 2015/16
85.90 75.50
42.2037.00
27.70 23.30 23.20 23.0015.70 15.50 13.80 11.30
-10.0 20.0 30.0 40.0 50.0 60.0 70.0 80.0 90.0
100.0 D
omes
tic a
nd F
orei
gn
Trav
el
Spec
ialis
ed M
ater
ails
Oth
er O
& M
Oth
er o
pera
ting
Expe
nses
Util
ities
Hos
pita
lity
Supp
lies
Insu
ranc
e ex
pens
es
Trai
ning
exp
ense
s
Fuel
& L
ubric
ants
Oth
er C
redi
tors
Mot
or V
ehcl
e Pu
rcha
se
Prin
ting
& In
form
atio
n
Ksh
s.mill
ions
Major Categories of O & M Expenditures
Source: Siaya County Treasury
The aggregate expenditure on domestic and foreign travel was Kshs.85.92 million compared to Kshs.98.0 million incurred in a similar period of FY 2014/15, representing a decrease of Kshs.12.08 million (12.3 per cent). This expenditure comprised of Kshs.67.04 million spent by the County Executive and Kshs.18.89 million by the County Assembly.
3.38.7 Development Expenditure Analysis
The details of development expenditure during the first half of FY 2015/16 are provided in figure 3.152.
Figure 3.152: Siaya County, Summary of Development Expenditure for the First Half of FY 2015/16
185.20
122.20
81.70
19.20 10.70 3.65 2.50 0.70020406080
100120140160180200
Cons
truct
ion
of R
oads
Cons
truct
ion
and
Civi
lW
orks
Cons
truct
ion
of B
uild
ing
Oth
er D
evel
opm
ent
Expe
nditu
re
Purc
hase
of C
ertif
ied
Seed
s, Br
eedi
ng S
tock
and
Live
Ani
mal
s
Emer
genc
y Re
lief
Coop
Soc
ietie
s
Acq
uisit
ion
of L
and
Ksh
s.mill
ion
Major Categories of Development Expenditure
Source: Siaya County Treasury

COUNTY GOVERNMENTS BUDGET IMPLEMENTATION REVIEW REPORT FIRST HALF FY, 2015/16 273
Analysis of the development expenditure of Kshs.426.16 million incurred in the first half of FY 2015/16 indicates that the Roads department registered the highest expenditure of Kshs.185.20 million which was spent on development and maintenance of road infrastructure across the County. Kshs.122.20 million was incurred on construction and other civil works which included construction of bridges, water supplies, sewerage plants and other infrastructure and civil works across the 30 wards in the County. Kshs.81.72 million was incurred on construction and refurbishment of buildings.
3.38.8 Annual Budget and Budget Performance Analysis by department for the First Half of FY 2015/16
A summary of the FY 2015/16 annual budget estimates and budget performance for the first half by department is shown in Table 3.76.
Table 3.76: Siaya County, Annual Budget and First Half of FY 2015/16 Budget Performance by Department
DepartmentBudget Allocation
(Kshs. Million)
6 Months Ex-chequer Issues (Kshs. Million)
6 Months Expen-diture (Kshs.
Million)
Expenditure to exchequer
issues (%)
Absorption rate (%)
Rec Dev Rec Dev Rec Dev Rec Dev Rec Dev
County Assembly 594.03 89.06 253.00 16.06 174.30 8.40 68.9 52.3 29.3 9.4
County Executive 469.26 44.48 174.08 - 188.50 4.80 108.3 - 40.2 10.8
Finance and Economic Planning 456.95 38.00 98.35 10.05 152.00 12.30 154.6 122.4 33.3 32.4
Agriculture 231.84 224.43 96.34 31.62 38.60 66.60 40.1 210.6 16.6 29.7
Water, Environment and Natural Resources 104.60 261.00 45.67 29.19 35.60 28.60 78.0 98.0 34.0 11.0
Education 166.75 613.29 38.43 175.60 8.10 58.20 21.1 33.1 4.9 9.5
Health 1,540.23 386.59 547.41 81.67 577.30 28.70 105.5 35.1 37.5 7.4
Physical Planning, Lands and Housing 49.81 84.71 15.96 9.50 7.20 6.30 45.1 66.3 14.5 7.4
Transport/Roads 42.89 671.04 15.82 15.91 10.50 209.90 66.4 1319.5 24.5 31.3
Trade Development 45.23 47.42 15.09 12.40 7.90 2.30 52.4 18.5 17.5 4.9
ICT Tourism and Wildlife 44.89 51.50 10.87 - 6.40 - 58.9 - 14.3 -
TOTAL 3,746.47 2,511.52 1,311.02 382.00 1,206.40 426.10 92.0 111.5 32.2 17.0
Source: Siaya County Treasury
Analysis of budget performance by Department shows that the Finance Department reported the highest absorption rate of its development budget at 32.4 per cent while the Department of Tourism and ICT did not incur expenditure on development activities. On the other hand, County Executive had the highest percentage of its recurrent expenditure to its recurrent budget at 40.2 per cent while the Department of Education had the lowest percentage at 4.9 per cent.
COUNTY GOVERNMENTS BUDGET IMPLEMENTATION REVIEW REPORT FIRST HALF FY, 2015/16274
3.38.9 Borrowing by the County Government
Article 212 of the Constitution requires a county government to borrow with approval from the County Assembly, and only if the National Government guarantees the loan. Further, Section 58 of the PFM Act 2012 gives the Cabinet Secretary to the National Treasury the powers to guarantee loans subject to approval by Parliament. During the period under review, the County utilized its equitable share and local revenue collection deposited into the County Revenue Fund account maintained at the Central Bank of Kenya and did not borrow any funds.
3.38.10 Observations and Recommendations
The County has made progress in addressing one challenge that previously affected budget implementation, which is, opening of separate operational bank accounts for the County Assembly. This has enabled the County Assembly to smoothly implement budgeted activities.
Despite the progress made, the following challenge continued to hamper effective budget implementation;
1. Low local revenue collection. The County managed to collect Kshs.52 million against an annual local revenue target of Kshs.343 million representing 15.3 per cent of the annual local revenue target.
The County should implement the following recommendation in order to improve budget execution
1. The County Treasury should devise strategies to mobilise local revenue to ensure smooth implementation of the budget.
3.39 Taita Taveta County
3.39.1 Overview of the FY 2015/16 Budget
The FY 2016/16 approved budget for Taita Taveta County was Kshs.3.89 billion. It comprised of Kshs.2.70 billion (69.4 per cent) allocated for recurrent expenditure and Kshs.1.19 billion (30.6 per cent) for development expenditure.
In order to finance the budget, the County expects to receive Kshs.3.31 billion (85.1 per cent) from the National equitable share, Kshs.310.41 million (8.0 per cent) from local revenue sources, Kshs.42.04 million as conditional allocation from the Road Maintenance Fuel Levy Fund (1.1 per cent), Kshs.14.81 million (9.4 per cent) from DANIDA, Kshs.95.74 million for leasing of medical equipment (2.4 per cent), Kshs.42.12 million (1.1 per cent) as conditional allocation for free maternal health care, Kshs.17.24 million(0.4 per cent) as H.S.S.F from the World Bank, Kshs.6.64 million (0.2 per cent) for compensation of forgone user fees, and Kshs.42.96 million (1.1 per cent) being balance brought forward from FY 2014/15.

COUNTY GOVERNMENTS BUDGET IMPLEMENTATION REVIEW REPORT FIRST HALF FY, 2015/16 275
3.39.2 Revenue Analysis
In the first half of FY 2015/16, the County received Kshs.1.41 billion from the National Government as equitable share, Kshs.21.23 million as conditional allocations for fuel levy fund, Kshs.16.81 million as conditional allocations for free maternal health care, Kshs.2.01 million as conditional allocations for forgone user fees, raised Kshs.71.93 million from local sources, and had a cash balance of Kshs.42.96 million brought forward from FY 2014/15.
The quarterly trend in local revenue collection from FY 2013/14 to the second quarter of FY 2015/16 is shown in figure 3.153.
Figure 3.153: Taita Taveta County, Trend in Local Revenue Collection by Quarter from the first quarter of FY 2013/14 to the second quarter of FY 2015/16
30.6323.05
56.02
36.66
71.67
01020304050607080
Ksh
s.M
illi
on
Reporting Period
Source: Taita Taveta County Treasury
Note: The Office has noted that the County Treasury revised the local revenue collection for the first quarter, FY 2015/16 from Kshs.54.37 million to Kshs.44.72 million.
The local revenue consisted of Kshs.44.72 million raised in the first quarter and Kshs.27.21 million in the second quarter. The local revenue collected in the first half of FY 2015/16 of Kshs.71.93 million (23.2 per cent of the annual local revenue target) was a decline from Kshs.92.68 million collected in a similar period of FY 2014/15.
The analysis of local revenue by stream is shown in Table 3.77.

COUNTY GOVERNMENTS BUDGET IMPLEMENTATION REVIEW REPORT FIRST HALF FY, 2015/16276
Table 3.77: Taita Taveta County, Analysis of revenue collection by stream for the first half of FY 2015/16
No. Revenue Stream Annual Targeted Revenue (Kshs.)
Six Months Actual Revenue (Kshs.)
Revenue Performance (%)
A B C D=*100
1 Bus Park Fee 16,784,225 7,846,111 46.7
2 Market Fee 15,684,306 5,921,351 37.8
3 Other Local Levies 18,283,891 6,321,983 34.6
4 Single Business Permit 31,661,326 8,822,720 27.9
5 Land Rates 34,503,486 7,714,491 22.4
6 General Cess 30,195,035 6,276,961 20.8
7 Devolved Functions 87,873,960 17,922,922 20.4
8 Other revenue streams 75,419,097 11,104,415 14.72
Total 310,405,326 71,930,954 23.2
Source: Taita Taveta County Treasury
Analysis of revenue by stream indicates that Bus Park Fee had the highest performance against the annual local revenue target at 46.7 per cent followed by Market Fees at 37.8 per cent.
3.39.3 Banking of Local Revenue
A review of the bank statements for the revenue collection account indicates that all locally generated revenue was deposited into the CRF during the period under review. This conforms to Article 207 of the Constitution and Section 109 of the PFM Act 2012, which stipulates that all funds raised or received by or on behalf of the County Government shall be deposited into the CRF account unless excluded by an Act of Parliament.
3.39.4 Exchequer Issues
The Controller of Budget authorised withdrawal of Kshs.1.23 billion from the CRF account, which was 31.7 per cent of the approved budget. The amount represented a decline of 17.4 per cent from Kshs.1.49 billion authorized in a similar period of FY 2014/15 and consisted of Kshs.1.12 billion (90.6 per cent) for recurrent expenditure and Kshs.115.78 million (9.4 per cent) for development activities.
3.39.5 Overall Expenditure Review
The County spent a total of Kshs.1.03 billion during the first half of FY 2015/16 which was 83.9 per cent of the funds released for operations. This was a reduction from the Kshs.1.45 billion spent in a similar period of FY 2014/15. A total of Kshs.1.03 billion was spent on recurrent activities and Kshs.1.34 million on development activities. Recurrent expenditure was 92.6 per cent of the funds released for recurrent activities while development expenditure accounted for 1.2 per cent

COUNTY GOVERNMENTS BUDGET IMPLEMENTATION REVIEW REPORT FIRST HALF FY, 2015/16 277
of the funds released for development expenditure. The expenditure excludes commitments as of 31st December, 2015 that amounted to Kshs.63.62 million for recurrent and Kshs.3.78 million for development.
Recurrent expenditure for the period under review represented 38.3 per cent of the approved annual recurrent budget, a decline from 41.8 per cent spent in a similar period of FY 2014/15. On the other hand, development expenditure recorded an absorption rate of 0.52 per cent, a decline from 24.7 per cent spent in a similar period of FY 2014/15. A comparison of the total expenditure in the first half of FY 2014/15 and the first half of FY 2015/16 is shown in Figure 3.154.
Figure 3.154: Taita Taveta County, Expenditure by Economic Classification for First Half of FY 2014/15 and First Half of FY 2015/16
721.42
394.60 369.56
520.64464.28
1.340
100
200
300
400
500
600
700
800
Personnel Emoluments Operations & Maintenance Development
Ksh
s.M
illio
n
Expenditure by Economic Classification
1st Half of FY 2014/15
1st Half of FY 2015/16
Source: Taita Taveta County Treasury
3.39.6 Recurrent Expenditure Analysis
The total recurrent expenditure for the reporting period was Kshs.1.03 billion against an annual recurrent budget of Kshs.2.70 billion. This represents 38.3 per cent of the annual recurrent budget. The County spent Kshs.520.64 million (50.3 per cent) on personnel emoluments and Kshs.464.28 million (44.9 per cent) on operations and maintenance as shown in Figure 3.154. Expenditure on personnel emoluments accounted for 50.3 per cent of total expenditure and has decreased significantly in FY 2015/16 as compared to a similar period in FY 2014/15 when the County spent Kshs.721.42 million. The County should reconcile its payroll expenditure to establish the cause of this sharp decline in personnel emoluments costs.
The County spent Kshs.25.03 million on sitting allowances to the 36 MCAs including the Speaker against an annual budget of Kshs.58.06 million. This was an increase from Kshs.3.00 million recorded in a similar period of FY 2014/15. The average monthly sitting allowance per MCA was Kshs.115,881 compared to SRC’s recommended monthly ceiling of Kshs.124,800.

COUNTY GOVERNMENTS BUDGET IMPLEMENTATION REVIEW REPORT FIRST HALF FY, 2015/16278
A breakdown of the operations and maintenance expenditure for the reporting period is shown in Figure 3.155.
Figure 3.155: Taita Taveta County, Operations and Maintenance Expenditure for the First Half of FY 2015/16
71.19
56.19
40.00 36.49 35.01
24.1915.00
10.23 9.12 7.83 6.92 4.03 3.91 2.530
10
20
30
40
50
60
70
80
Tra
vel (
Dom
estic
&Fo
reig
n)
Rou
tine
Mai
nten
ance
Mor
tgag
e
Oth
er c
urre
nt tr
ansf
ers
Prin
ting
and
Stat
ione
ry
Tra
inin
g
Gra
tuity
Com
mun
icat
ion
Con
fere
nce
& H
ospi
talit
y
Fuel
& L
ubri
cant
s
Bus
ary
Util
ities
Gen
eral
sup
plie
s
Em
erge
ncy
Fund
Ksh
s. M
illio
ns
Major Categories of O&M Expenditure
Source: Taita Taveta County Treasury
The aggregate expenditure on domestic and foreign travel was Kshs.71.19 million compared to Kshs.90.6 million incurred in a similar period of FY 2014/15, representing a marginal decrease of 21.4 per cent. This expenditure comprised of Kshs.23.48 million spent by the County Executive and Kshs.47.72 million by the County Assembly.
3.39.7 Development Expenditure Analysis
Analysis of development expenditure of Kshs.1.34 million incurred in the first half of FY 2015/16 indicates that entire amount was used to pay casual employees undertaking development activities.
3.39.8 Annual Budget and Budget Performance Analysis by department for the first half of FY 2015/16
A summary of the FY 2015/16 annual budget estimates and budget performance for the first half by department is shown in Table 3.78.

COUNTY GOVERNMENTS BUDGET IMPLEMENTATION REVIEW REPORT FIRST HALF FY, 2015/16 279
Table 3.78: Taita Taveta County, Annual Budget and First Half of FY 2015/16 Budget Performance by Department
DepartmentBudget Allocation
(Kshs. Million)
6 Months Exche-quer Issues (Kshs.
Million)
6 Months Expenditure
(Kshs. Million)
Expenditure to exchequer
issues (%)
Absorption rate (%)
Rec Dev Rec Dev Rec Dev Rec Dev Rec Dev
County Assembly 550.38 12.10 252.57 7.00 257.10 0.00 101.8 0.0 46.7 0.0
Administration & Devolution 227.28 19.76 88.78 15.00 82.04 0.00 92.4 0.0 36.1 0.0
Water & Irrigation 21.47 281.72 13.91 0.00 7.01 0.00 50.4 - 32.7 0.0
Health 890.20 177.83 381.15 26.43 354.77 0.10 93.1 0.4 39.9 0.1
County Treasury 336.44 10.07 128.98 6.85 111.89 0.00 86.7 0.0 33.3 0.0
Education 241.17 202.92 73.06 1.22 77.21 1.14 105.7 93.4 32.0 0.6
Governor & Deputy Governor 156.44 2.50 37.19 2.50 47.69 0.10 128.2 4.0 30.5 4.0
Agriculture, Fisheries &Veteri-nary 75.53 59.54 59.29 5.10 30.31 0.00 51.1 0.0 40.1 0.0
Trade & Community Affairs 58.21 144.17 21.08 34.13 18.02 0.00 85.5 0.0 31.0 0.0
Land & Physical Planning 12.45 32.50 4.71 0.00 2.37 0.00 50.3 - 19.1 0.0
County Public Service Board 43.81 0.00 17.15 0.00 15.61 0.00 91.0 - 35.6 -
Infrastructure, Public Works 30.35 238.22 10.25 17.55 8.06 0.00 78.6 0.0 26.6 0.0
Tourism, Environment & Natural Resources 53.73 7.21 29.09 0.00 22.29 0.00 76.6 - 41.5 0.0
TOTAL 2,697.46 1,188.54 1117.21 115.78 1034.37 1.34 92.6 1.2 38.3 0.1
Source: Taita Taveta County Treasury
Analysis of budget performance by department shows that the County Assembly had the highest percentage of recurrent expenditure to the annual recurrent budget at 46.7 per cent while the Department of Land and Physical Planning had the lowest percentage at 19.1 per cent. On the other hand, the office of the Governor and Deputy Governor recorded the highest percentage of development expenditure at 4.0 per cent. While
3.39.9 Borrowing by the County Government
During the period under review, the County borrowed Kshs.185 million from Kenya Commercial Bank. This borrowing was neither guaranteed by the National Government nor approved by the County Assembly as required by Article 212 of the Constitution and Section 58 of the PFM Act 2012.
3.39.10 Observations and Recommendations
The County has made progress in addressing the challenges previously identified as affecting budget implementation. The County has:
i. Embraced use of internet banking to process payments.
ii. Developed staff capacity through training.
COUNTY GOVERNMENTS BUDGET IMPLEMENTATION REVIEW REPORT FIRST HALF FY, 2015/16280
Despite the progress made, the following challenges continued to hamper effective budget implementation;
1. Underperformance in local revenue collection. The County collected Kshs.71.93 million against an annual target of Kshs.310.41 million, which is 23.2 per cent of the annual target compared to a target of 50 per cent at half year.
2. Low absorption of development expenditure.
3. Unexplained decline in personnel costs during the reporting period compared to a similar period of FY 2014/15. Personnel costs declined from Kshs.721.42 million to Kshs.520.64 million.
The County should implement the following recommendations in order to improve budget execution
1. County should re-double revenue raising efforts with a view to growing the overall resource basket.
2. The County should identify the factors that contribute to the low absorption of development expenditure and come up with corrective measures that will ensure effective execution of development budget. An appropriate framework for monitoring and implementing development activities may be necessary to enhance development expenditure.
3. The County should review its payroll expenditure to establish the cause of the decline in personnel emoluments costs.
3.40 Tana River County
3.40.1 Overview of the FY 2015/16 Budget
The FY 2015/16 approved budget for Tana River County was Kshs.4.29 billion. It comprised Kshs.1.76 billion (41.2 per cent) allocated to recurrent expenditure and Kshs.2.53 billion (58.8 per cent) to development expenditure.
In order to finance the budget, the County expected to receive Kshs.3.98 billion (92.9 per cent) as transfers from the National Government, collect Kshs.120.00 million (2.8 per cent) from local sources, Kshs.13.38 million (0.31 per cent) as projected cash balance from FY 2014/15, a conditional grant of Kshs.9.29 million (0.2 per cent) from DANIDA, and additional conditional grants of Kshs.171.30 million (4.0 per cent) from the National Government as contained in CARA, 2015 for free maternal care, compensation of forgone user fees, and the road maintenance fuel levy fund. However, Kshs.13.38 million representing the opening cash balance from FY 2014/15 was not factored in the FY 2015/16.
3.40.2 Revenue Analysis
In the first half of FY 2015/16, the County received Kshs.1.33 billion from the National Government as equitable share to the CRF account, Kshs.4.65 million as DANIDA grant, Kshs.25.56 million as

COUNTY GOVERNMENTS BUDGET IMPLEMENTATION REVIEW REPORT FIRST HALF FY, 2015/16 281
conditional allocations from the road maintenance fuel levy fund, Kshs.5.02 million as conditional allocations for free maternal health care, Kshs.1.15 million as conditional allocations for forgone user fees, raised Kshs.10.93 million from local sources, and a cash balance of Kshs.13.38 million brought forward from FY 2014/15.
The quarterly trend in local revenue collection from first quarter of the FY 2013/14 to the second quarter of FY 2015/16 is shown in figure 3.156.
Figure 3.156: Tana River County, Trend in Local Revenue Collection by Quarter from the FY 2013/14 to the second quarter of FY 2015/16
8.27.2
13.03
7.54
2
4
6
8
10
12
14
Ksh
s. M
illio
ns
Reporting Period
Source: Tana River County Treasury
The local revenue consisted of Kshs.3.39 million raised in the first quarter and Kshs.7.54 million in the second quarter. The local revenue generated in the first half of the FY 2015/16 of Kshs.10.93 million (9.1 per cent of the annual local revenue target), an improvement from Kshs.8.9 million collected in a similar period of FY 2014/15.
The analysis of local revenue by stream is shown in Table 3.79.
Table 3.79: Tana River County, Analysis of revenue collection by stream for the first half of FY 2015/16
No. Revenue Stream Annual Targeted Revenue (Kshs.)
Six Months Actual Reve-nue (Kshs.) Revenue Performance (%)
A B C D=*100
1 Single Business Permits 12,169,500 1,064,850 8.8
2 Land Rates 16,748,858 126,532 0.8
3 Mango Cess 3,400,000 1,330,392 39.1
4 Motor cycle licensee 3,400,000 419,600 12.3
5 Gypsum 15,350,500 1,881,000 12.3
6 Export fees 3,956,177 1,182,960 29.9
7 Charcoal 11,113,000 1,753,016 15.8
8 Auction 4,677,500 1,529,330 32.7
9 Toll Charges 3,000,000 66,150 2.2

COUNTY GOVERNMENTS BUDGET IMPLEMENTATION REVIEW REPORT FIRST HALF FY, 2015/16282
No. Revenue Stream Annual Targeted Revenue (Kshs.)
Six Months Actual Reve-nue (Kshs.) Revenue Performance (%)
A B C D=*100
10 Miraa 2,331,000 370,000 15.9
11 Grazing Fees 3,522,767 45,000 1.3
12 Slaughter fees 2,730,000 75,000 2.7
13 Tenders 8,000,000 26,000 0.3
14 House Rent 4,400,000 97,200 2.2
15 Sand cess 2,400,000 444,000 18.5
16 Other revenue streams 22,800,698 516,464 2.3
TOTAL 120,000,000 10,927,494 9.1
Source: Tana River County Treasury
The analysis of revenue by stream indicates that Mango Cess generated the highest percentage of revenue against the annual local target at 39.1 per cent followed by Auction fees at 32.7 per cent. Tender fees reported the lowest collection against its annual target at 0.3 per cent.
3.40.3 Banking of Local Revenue
A review of the bank statements for the revenue collection account during the first half of FY 2015/16 indicates that the County did not bank all the locally generated revenue intact into the CRF. This does not conform to Article 207 of the Constitution and Section 109 of the PFM Act 2012, which stipulates that all funds raised or received by or on behalf of the County Government should be deposited into the CRF account, unless excluded by an Act of Parliament.
3.40.4 Exchequer Issues
The Controller of Budget authorised withdrawal of Kshs.1.76 billion from the CRF account, which was 41.1 per cent of the approved budget. The amount represented an improvement from Kshs.743 million from the Kshs.1.01 billion authorized in a similar period of FY 2014/15 and consisted of Kshs.722.83 million (41 per cent) for recurrent expenditure and Kshs.1.04 billion (59 per cent) for development activities.
3.40.5 Overall Expenditure Review
The County spent a total of Kshs.811.39 million during the first half of FY 2015/16 which was 46.0 per cent of the funds released for operations. This is a significant reduction from the Kshs.1.61 billion spent in a similar period of FY 2014/15. A total of Kshs.604.53 million was spent on recurrent activities and Kshs.206.86 million on development activities. Recurrent expenditure was 83.6 per cent of the funds released for recurrent activities while development expenditure accounted for 19.9 per cent of the funds released for development activities.
Recurrent expenditure for the period under review represented 34.2 per cent of the approved annual recurrent budget, a decrease from 55.7 per cent spent in a similar period of FY 2014/15. On the other

COUNTY GOVERNMENTS BUDGET IMPLEMENTATION REVIEW REPORT FIRST HALF FY, 2015/16 283
hand, development expenditure recorded an absorption rate of 8.2 per cent, a decline from the 33.9 per cent spent in a similar period of FY 2014/15. A comparison of the total expenditure in the first half of FY 2014/15 and the first half of FY 2015/16 is shown in Figure 3.157.
Figure 3.157: Tana River County, Expenditure by Economic Classification for First Half of FY 2014/15 and First Half of FY 2015/16
394.50
609.30 602.50
418.80
185.70 206.86
0
100
200
300
400
500
600
700
Personel Emoluments Operation & Maintenance Development
Ksh
s.M
illio
n
Expenditure by Economic classification
1st Half of FY 2014/15
1st Half of FY 2015/16
Source: Tana River County Treasury
3.40.6 Recurrent Expenditure Analysis
The total recurrent expenditure for the reporting period was Kshs.604.53 million against an annual recurrent of budget of Kshs.1.76 billion. This represents 34.2 per cent of the annual recurrent budget. The County spent Kshs.418.8 million (69.3 per cent) on personnel emoluments and Kshs.185.7 million (30.7 per cent) on operations and maintenance as shown in Figure 3.157. Expenditure on personnel emoluments accounted for 51.6 per cent of total expenditure and has increased in the first half of FY 2015/16 as compared to a similar period of FY 2014/15 when the County spent Kshs.394.5 million.
The County spent Kshs.11.12 million on sitting allowances to the 26 MCAs and the Speaker against a budget of Kshs.55.70 million. This is an increase from Kshs.9.5 million recorded in a similar period of FY 2014/15. The average monthly sitting allowance per MCA was Kshs.68,665 compared to SRCs recommended monthly ceiling of Kshs.124,800.
A breakdown of the operations and maintenance expenditure for the reporting period is shown in Figure 3.158.
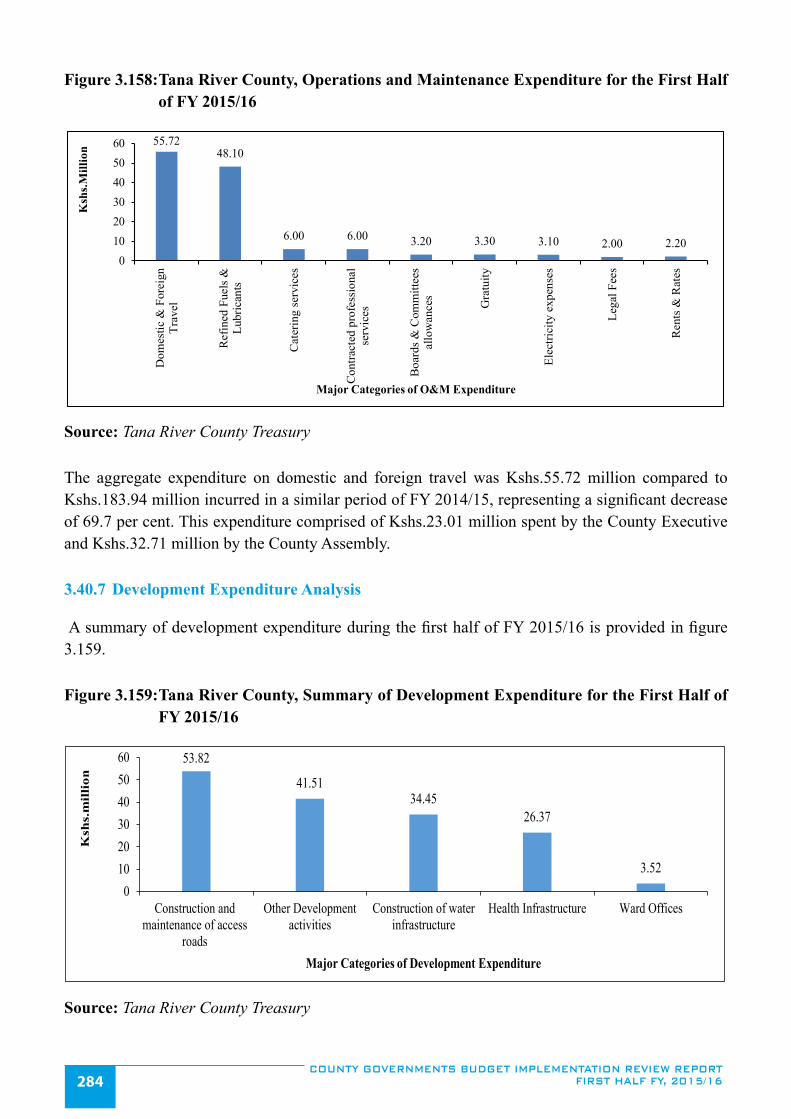
COUNTY GOVERNMENTS BUDGET IMPLEMENTATION REVIEW REPORT FIRST HALF FY, 2015/16284
Figure 3.158: Tana River County, Operations and Maintenance Expenditure for the First Half of FY 2015/16
55.7248.10
6.00 6.00 3.20 3.30 3.10 2.00 2.200
102030405060
Dom
estic
& F
orei
gnTr
avel
Ref
ined
Fue
ls &
Lubr
ican
ts
Cat
erin
g se
rvic
es
Con
tract
ed p
rofe
ssio
nal
serv
ices
Boa
rds
& C
omm
ittee
sal
low
ance
s
Gra
tuity
Elec
trici
ty e
xpen
ses
Lega
l Fee
s
Ren
ts &
Rat
es
Ksh
s.Mill
ion
Major Categories of O&M Expenditure
Source: Tana River County Treasury
The aggregate expenditure on domestic and foreign travel was Kshs.55.72 million compared to Kshs.183.94 million incurred in a similar period of FY 2014/15, representing a significant decrease of 69.7 per cent. This expenditure comprised of Kshs.23.01 million spent by the County Executive and Kshs.32.71 million by the County Assembly.
3.40.7 Development Expenditure Analysis
A summary of development expenditure during the first half of FY 2015/16 is provided in figure 3.159.
Figure 3.159: Tana River County, Summary of Development Expenditure for the First Half of FY 2015/16
53.82
41.5134.45
26.37
3.520
102030405060
Construction andmaintenance of access
roads
Other Developmentactivities
Construction of waterinfrastructure
Health Infrastructure Ward Offices
Ksh
s.m
illi
on
Major Categories of Development Expenditure
Source: Tana River County Treasury

COUNTY GOVERNMENTS BUDGET IMPLEMENTATION REVIEW REPORT FIRST HALF FY, 2015/16 285
Analysis of the development expenditure of Kshs.206.86 million incurred in the first half of FY 2015/16 indicates that the Roads and Public Works Department reported the highest expenditure at Kshs.53.82 million on construction and maintenance of access roads and renovation of buildings. A total of 800 kilometers of roads were maintained across the 15 wards. The second highest expenditure of Kshs.34.45 million was incurred by the Water Department on construction of water infrastructure. The third highest expenditure of Kshs.26.37 million was incurred by the Health Department for the construction and maintenance of health facilities. A total expenditure of Kshs.41.51 million was spent on other on-going development projects.
3.40.8 Annual Budget and Budget Performance Analysis by department for the First Half of FY 2015/16
The summary of the FY 2015/16 annual budget estimates and budget performance for the first half by department is shown in Table 3.80.
Table 3.80: Tana River County, Annual Budget and First Half of FY 2015/16 Budget Performance by Department
DepartmentBudget Allocation
(Kshs. Million)6 Months Exchequer Issues (Kshs. Million)
6 Months Expen-diture (Kshs.
Million)
Expenditure to exchequer
issues (%)
Absorption rate (%)
Rec Dev Rec Dev Rec Dev Rec Dev Rec Dev
County Assembly 423.5 96.54 173.2 39.75 165.28 14.1 95.4 35.5 39.0 14.6
Office of the Gover-nor & Deputy 403.42 98.1 164.98 41.4 135.87 16.5 82.4 39.9 33.7 16.8
Finance & Planning 138.9 60.14 56.79 24.76 53.61 - 94.4 38.6
Water & Environment 71.5 425.53 29.3 175.21 9.33 - 31.8 13.0
Education 53.2 304.16 21.76 125.24 13.84 1.87 63.6 1.5 26.0 0.6
Health 339.2 382.45 138.73 127.47 137.6 71.66 99.2 56.2 40.6 18.7
Agriculture 156.92 371.05 60.18 248.42 31.48 - 52.3 20.1
Cohesion & Special Programmes 25.13 146.6 10.27 60.37 9.07 - 88.3 36.1
Gender, Culture & Social Services 29.8 63.97 12.6 26.34 9.87 8.51 78.3 32.3 33.1 13.3
Trade, Tourism &Coop 42.86 205.45 17.48 84.6 12.09 35 69.2 41.4 28.2 17.0
Roads & Public Works 36.72 372.2 15.02 153.26 13.26 59.16 88.3 38.6 36.1 15.9
County Public Ser-vice Board 46.5 19 12.9 67.9 27.7
Total 1,767.65 2,526.19 722.83 1,040.17 604.53 206.86 83.6 19.9 34.2 8.2
Source: Tana River County Treasury
Analysis of budget performance by department shows that the Health Department reported the highest absorption rate of its development budget at 18.7 per cent while the Department of Finance & Planning; Water & Environment; County Public Service Board; Cohesion & Special Programmes and Agriculture did not incur any development expenditure. On the other hand, Health Department

COUNTY GOVERNMENTS BUDGET IMPLEMENTATION REVIEW REPORT FIRST HALF FY, 2015/16286
had the highest percentage of its recurrent budget at 40.6 per cent while Water & Environment Department had the lowest percentage at 13.1 per cent.
3.40.9 Borrowing by the County Government
Article 212 of the Constitution requires a county government to borrow with approval from the County Assembly, and only if the national government guarantees the loan. Further, Section 58 of the PFM Act 2012 gives the Cabinet Secretary to the National Treasury the powers to guarantee loans subject to approval by Parliament. During the period under review, the County utilized its equitable share and local revenue collection deposited into County Revenue Fund account maintained at the Central Bank of Kenya and did not borrow any funds.
3.40.10 Observations and Recommendations
The County has made progress in addressing the challenges previously identified as affecting budget implementation. The County has:
i. Acquired prefabricated offices to accommodate staff who can now discharge their duties effectively.
ii. Made significant improvement in staff capacity building through training.
iii. Operationalized IFMIS and trained staff in the Finance and Planning Department on IFMIS, e-procurement and e-banking.
iv. The County has operationalized the audit department.
Despite the progress made, the following challenge continued to hamper effective budget implementation;
1. Underperformance of local revenue collection against annual target. The County realized 9.1 per cent of the annual local revenue target in the reporting period.
The County should implement the following recommendation in order to improve budget execution
1. The County Treasury should develop strategies to enhance local revenue collection.
3.41 Tharaka Nithi County
3.41.1 Overview of the FY 2015/16 Budget
The FY 2015/16 approved budget for Tharaka Nithi County amounted to Kshs.3.55 billion. It comprised of Kshs.2.08 billion (58.6 per cent) for recurrent expenditure and Kshs.1.47 billion (41.4 per cent) for development expenditure.
In order to finance the budget, the County expects to receive Kshs.3.12 billion (87.6 per cent) as equitable share from the National Government, collect Kshs.248.05 million (7.0 per cent)

COUNTY GOVERNMENTS BUDGET IMPLEMENTATION REVIEW REPORT FIRST HALF FY, 2015/16 287
from local sources, a conditional grant of Kshs.10.00 million (0.3 per cent) from DANIDA, and additional conditional grants of Kshs.179.36 million (5.1 per cent) from national government. The Kshs.179.36 million additional conditional grants comprises of Kshs.35.24 million for Free Maternal Health Care, Kshs.8.52 million as compensation of forgone user fees, Kshs.95.74 million for leasing of medical equipment, and Kshs.39.86 million from Road Maintenance Fuel Levy Fund.
However, Kshs.278.71 million representing the opening cash balance from FY 2014/15 was not appropriated in the approved budget while the equitable share and DANIDA grant were under budgeted by Kshs.21.34 million and Kshs.2.33 million respectively. Further, the County did not budget for the additional conditional grants and loan of Kshs.313.90 million as contained in CARA, 2015. The Kshs.313.90 million additional grants comprises of Kshs.13.90 million from the World Bank to supplement financing of county facilities, and Kshs.300 million from conditional allocation on other loan and grants.
3.41.2 Revenue Analysis
In the first half of FY 2015/16, the County received equitable share of Kshs.1.33 billion from the National Government, Kshs.20.13 million as conditional allocations from the road maintenance fuel levy fund, Kshs.14.51 million as conditional allocation for free maternal health care, Kshs.2.59 million as conditional allocation for forgone user fees, raised Kshs.96.80 million from local sources, and had a cash balance of Kshs.278.71 million brought forward from FY 2014/15.
The quarterly trend in local revenue collection from the FY 2013/14 to the second quarter of FY 2015/16 is shown in figure 3.160.
Figure 3.160: Tharaka Nithi County, Trend in Local Revenue Collection by Quarter from the FY 2013/14 to the second quarter of FY 2015/16
24.515.9 12.6
24.7 30.8 26.9 26.0
0.00
10.00
20.00
30.00
40.00
50.00
60.00
70.00
Ksh
s.Mill
ions
Reporting period
Source: Tharaka Nithi County Treasury
The local revenue consisted of Kshs.36.68 million raised in the first quarter and Kshs.60.12 million in the second quarter. The local revenue raised in the first half of the FY 2015/16 was Kshs.96.80 million (39.0 per cent of the annual local revenue target), an improvement from Kshs.57.71 million

COUNTY GOVERNMENTS BUDGET IMPLEMENTATION REVIEW REPORT FIRST HALF FY, 2015/16288
collected in a similar period of FY 2014/15.
The analysis of local revenue by stream is shown in Table 3.81.
Table 3.81: Tharaka Nithi County, Analysis of revenue collection per stream for the first half of FY 2015/16
No. Revenue Stream Annual Targeted Revenue (Kshs.)
Six Months Actual Revenue (Kshs.)
Revenue Performance (%)
A B C D=*100
1 Hospital Revenue/ Public health 63,630,000 58,210,000 91.5
2 Cess fees 40,000,000 11,700,000 29.3
3 Market and Slaughter fee 32,000,000 9,373,810 29.3
3 Vehicle Parking 32,000,000 5,925,070 18.5
4 Single Business permit 40,000,000 4,208,739 10.5
5 Others 40,420,000 7,380,921 18.3
TOTAL 248,050,000 96,798,540 39.0
Source: Tharaka Nithi County Treasury
Analysis of revenue by stream indicates that Hospital revenues recorded the highest performance against the annual target at 91.5 per cent followed by Cess Fees and Market/Slaughter Fees at 29.3 per cent.
3.41.3 Exchequer Issues
During the period under review, Kshs.1.41 billion was authorized for withdrawal from the CRF by the Controller of Budget, which was 39.7 per cent of the approved budget. The amount represented an improvement of 28.2 per cent from Kshs.1.10 billion authorized in a similar period of FY 2014/15 and consisted of Kshs.991.49 million (70.3 per cent) for recurrent expenditure and Kshs.419.64 million (29.7 per cent) for development activities.
3.41.4 Banking of local revenue
A review of the bank statements for the revenue collection account indicates that the County did not bank all the locally generated revenue intact into the CRF. The Department of Health, especially the Veterinary unit did not deposit its revenue collection into the CRF account. This is contrary to the provisions of Article 207 of the Constitution and Section 109 of the PFM Act 2012, which stipulates that all funds raised or received by or on behalf of the County Government should be deposited into the CRF account, unless excluded by an Act of Parliament.

COUNTY GOVERNMENTS BUDGET IMPLEMENTATION REVIEW REPORT FIRST HALF FY, 2015/16 289
3.41.5 Overall Expenditure Review
The County spent a total of Kshs.1.08 billion during the first half of FY 2015/16 which was 76.6 per cent of the funds released for operations. This is an increase from the Kshs.974.92 million spent in a similar period of FY 2014/15. A total of Kshs.859.33 million was spent on recurrent activities and Kshs.221.20 million on development activities. Recurrent expenditure was 86.7 per cent of the funds released for recurrent activities while development expenditure accounted for 52.7 per cent of the funds released for development activities. The expenditure excludes commitments as of 31st December, 2015 that amounted to Kshs.59.45 million for development activities and Kshs.12.43 million for recurrent expenditure.
Recurrent expenditure for the period under review represented 41.3 per cent of the approved annual recurrent budget, a decrease from 43.9 per cent spent in a similar period of FY 2014/15. On the other hand, development expenditure recorded an absorption rate of 15.0 per cent, an improvement from 9.1 per cent spent in a similar period of FY 2014/15. A comparison of the total expenditure in the first half of FY 2014/15 and the first half of FY 2015/16 is shown in Figure 3.161.
Figure 3.161: Tharaka Nithi County, Expenditure by Economic Classification for First Half of FY 2014/15 and First Half of FY 2015/16
623.98
179.56 171.38
721.35
138.48
221.20
0
100
200
300
400
500
600
700
800
Personnel Emoluments Operations & Maintenance Development
Ksh
s.mill
ion
Expenditure by Economic Classification
1st Half, FY 2014/15 1st Half, FY 2015/16
Source: Tharaka Nithi County Treasury
3.41.6 Recurrent Expenditure Analysis
The total recurrent expenditure for the reporting period was Kshs.859.83 million against a total of budget of Kshs.2.08 billion. This represents 41.3 per cent of the annual recurrent budget. The County spent Kshs.721.35 million (83.9 per cent) on personnel emoluments and Kshs.138.48 million (16.1 per cent) on operations and maintenance as shown in Figure 3.161. Expenditure on personnel emoluments accounted for 83.9 per cent of total expenditure and has increased significantly in the first half of FY 2015/16 as compared to a similar period of FY 2014/15 when the County spent Kshs.623.98 million. The increase is attributed to the continuous staff recruitment and annual salary increment.

COUNTY GOVERNMENTS BUDGET IMPLEMENTATION REVIEW REPORT FIRST HALF FY, 2015/16290
The County spent Kshs.6.14 million on sitting allowances to the 25 MCAs and the Speaker against an annual sitting allowance budget of Kshs.34.92 million. This is a slight increase from Kshs.6.10 million recorded in a similar period of FY 2014/15. The average monthly sitting allowance per MCA was Kshs.40, 910 compared to SRC recommended monthly ceiling of Kshs.124, 800.
A breakdown of the operations and maintenance expenditure for the reporting period is shown in Figure 3.162.
Figure 3.162: Tharaka Nithi County, Operations and Maintenance Expenditure for the first-half of FY 2015/16
42.14
24.2618.84
13.028.23 6.97 6.48 5.10 4.35 3.76
05
1015202530354045
Dom
estic
/For
eign
trav
el
Spec
ialis
ed m
ater
ials
/sup
plie
s
Oth
er o
pera
ting
expe
nses
Hos
pita
lity
Prin
ting
and
adve
rtisi
ng e
xpen
ses
Insu
ranc
es
Fuel
, Oil
and
Lubr
ican
t
Trai
ning
exp
ense
s
Util
ities
Rou
tine
mai
nten
ces
Ksh
s.M
illio
ns
Major Categories of Recurrent Expenditure
Source: Tharaka Nithi County Treasury
The aggregate expenditure on domestic and foreign travel was Kshs.42.14 million compared to Kshs.41.5 million incurred in a similar period of FY 2014/15, representing a slight increase of 1.5 per cent. This expenditure comprised of Kshs.16.91 million spent by the County Executive and Kshs.25.22 million by the County Assembly.
3.41.7 Development Expenditure Analysis
A summary of development expenditure during the first half of FY 2015/16 is provided in figure 3.163.

COUNTY GOVERNMENTS BUDGET IMPLEMENTATION REVIEW REPORT FIRST HALF FY, 2015/16 291
Figure 3.163: Tharaka Nithi County, Summary of Development Expenditure for the First Half of FY 2015/16
67.32 63.80
45.36
25.74
12.05 9.80 9.38 5.45 5.00 4.48
0.0010.0020.0030.0040.0050.0060.0070.0080.00
Cons
tructi
on an
d Re
habi
litati
on o
fRo
ads &
oth
er C
ivil
work
s
Cons
tructi
on o
f bui
ldin
g
Othe
r inf
rastr
uctu
re &
Civ
ilW
orks
Cons
tructi
on a
nd m
ainten
ance
s of
water
,supp
lies a
nd se
wer
age
Purc
hase
d o
f cer
tified
seed
s
Civi
l co
nti g
ency
res
erve
s
Othe
r cur
rent
tran
sfers
Purc
hase
d of
agrim
achi
nery
/equi
pmen
t
Pre f
easib
ilty/
appr
aisal
study
Purc
hase
of b
eddi
ng an
d lin
en
Ksh
s.Mill
ions
Major Categories of Development Expenditure
Source: Tharaka Nithi County Treasury
Analysis of the development expenditure of Ksh.221.20 million incurred in the first half of FY 2015/16 indicates that the Roads Department reported the highest expenditure at Kshs.67.32 million which was spent on development and maintenance of access roads. The second highest expenditure at Kshs.63.80 million was incurred by the Health Department on construction of health facilities. The Department of Tourism, Environment, Water and Natural resources incurred Kshs.25.74 million on construction and maintenances of water, supplies and sewerage while the Department of Agriculture incurred Kshs.12.05 million on purchase of certified seeds.
3.41.8 Annual Budget and Budget Performance Analysis by department for the First Half of FY 2015/16
A summary of the FY 2015/16 annual budget estimates and budget performance for the first half by department is shown in Table 3.82.
Table 3.82: Tharaka Nithi County, Annual Budget and First Half of FY 2015/16 Budget Performance by Department
DepartmentBudget Allocation
(Kshs. Million)
6 Months Exche-quer Issues (Kshs.
Million)
6 Months Expen-diture (Kshs.
Million)
Expenditure to exchequer
issues (%)
Absorption rate (%)
Rec Dev Rec Dev Rec Dev Rec Dev Rec Dev
County Assembly 359.41 69.59 149.75 - 125.38 - 83.7 - 34.9 -Office of the Governor & Deputy Governor 142.09 - 60.72 - 61.89 - 101.9 - 43.6 -County Public Service Board 23.04 - 11.61 - 14.20 - 122.3 - 61.6 -Finance & Economic Plan-ning 133.50 80.00 67.14 27.00 66.52 20.10 99.1 74.4 49.8 25.1

COUNTY GOVERNMENTS BUDGET IMPLEMENTATION REVIEW REPORT FIRST HALF FY, 2015/16292
DepartmentBudget Allocation
(Kshs. Million)
6 Months Exche-quer Issues (Kshs.
Million)
6 Months Expen-diture (Kshs.
Million)
Expenditure to exchequer
issues (%)
Absorption rate (%)
Rec Dev Rec Dev Rec Dev Rec Dev Rec Dev
Agriculture, Livestock & Fisheries Development 183.18 123.80 92.13 40.66 89.43 29.81 97.1 73.3 48.8 24.1Tourism, Environment, Wa-ter and Natural resources 53.71 145.65 27.69 39.04 19.92 37.01 71.9 94.8 37.1 25.4Education, Youth, Gender & Social services 107.88 189.9 53.49 50.35 17.70 3.82 33.1 7.6 16.4 2.0
Health Services 790.09 152.45 394.39 30.00 382.09 19.82 96.9 66.1 48.4 13Physical Planning, Land, Housing, Energy & ICT 70.37 65.60 27.92 8.00 9.76 - 35 - 13.9 -Labour and Urban Develop-ment 117.65 72.90 56.17 17.00 42.65 1.74 75.9 10.2 36.3 2.4Road, Transport, Public works and Legal affairs 53.25 538.90 26.23 204.29 17.20 97.51 65.6 47.7 32.3 18.1Trade, Industry & Coopera-tive Development 48.03 32.65 24.25 3.30 13.09 11.40 54 345.5 27.3 34.9
Total 2082.20 1471.44 991.49 419.64 859.83 221.20 86.7 52.7 41.3 15.0
Source: Tharaka Nithi County Treasury
Analysis of budget performance by department shows that the Department of Trade, Industry and Co-operative Development reported the highest absorption rate of its development budget at 34.9 per cent while the Department of Physical Planning, Land, Housing, Energy and ICT, and the County Assembly did not spend on development expenditure during the period under review. On the other hand the Public Service Board had the highest percentage of its recurrent expenditure to its recurrent budget at 61.1 per cent while the Department of Physical Planning, Land, Housing, Energy and ICT Development had the lowest percentage at 13.9 per cent.
3.41.9 Borrowing by the County Government
During the period under review, the County Executive borrowed Kshs.85 million from Co-operative Bank of Kenya, Chuka Branch. This borrowing was in contravention of Article 212 of the Constitution which requires a county government to seek approval from the County Assembly, and a guarantee by the National Government for any loan. Further, Section 58 of the PFM Act 2012 gives the Cabinet Secretary to the National Treasury the powers to guarantee loans subject to approval by Parliament.
3.41.10 Observations and Recommendations
The County has made progress in addressing the challenges previously identified as affecting budget implementation. The County has:
i. Improved in local revenue collection from 23.1 per cent of the annual revenue target in the first half of FY 2014/15 to 39 per cent in the reporting period.
ii. Registered improvement in absorption of development funds from 9.1 per cent in the first half of FY 2014/15 to 15 per cent in the first half of FY 2015/16.

COUNTY GOVERNMENTS BUDGET IMPLEMENTATION REVIEW REPORT FIRST HALF FY, 2015/16 293
Despite the progress made, the following challenges continued to hamper effective budget implementation;
1. The County Assembly has not fully embraced the use of IFMIS in its financial operations.
2. High wage bill, which may not be sustainable.
3. Failure to deposit locally generated revenue into CRF by the Health Department (Veterinary Services). This is contrary to Section 109(2) of PFM Act 2012.
4. Irregular borrowing by the County government.
The County should implement the following recommendations in order to improve budget execution
1. The County Assembly should embrace use of IFMIS system to facilitate smooth budget implementation and reporting.
2. The County should liaise with National Government to address the rising wage bill.
3. The County Treasury should ensure that all money raised on behalf of the County Government is paid into the CRF account as per Section 109(2) of PFM Act 2012.
4. The County should ensure that borrowing is in line with provisions of Article 212 of the Constitution.
3.42 Trans Nzoia County
3.42.1 Overview of the FY 2015/16 Budget
The FY 2015/16 approved budget for Trans Nzoia County amounted to Kshs.6.29 billion, with Kshs.3.36 billion (53.5 per cent) allocated for recurrent expenditure and Kshs.2.93 billion (46.5 per cent) for development expenditure.
In order to finance the budget, the County expects to receive Kshs.5.10 billion (81.1. per cent) as equitable share from the National Government, collect Kshs.389.03 million (6.3 per cent) from local sources, a conditional grant of Kshs.11.33 million (0.2 per cent) from DANIDA, Kshs.19.09 million (0.3 per cent) for user forgone user fees, Kshs.67.91 million (1.0 per cent) for free maternal care, Kshs.95.74 million (1.5 per cent) for leasing of medical equipment, Kshs.64.78 million (1.4 per cent) from the road maintenance fuel levy fund and Kshs.451.26 million (7.3 per cent) as projected cash balance from FY 2014/15.
3.42.2 Revenue Analysis
In the first half of FY 2015/16, the County received Kshs.1.71 billion from the National Government as equitable share, raised Kshs.91.62 million from local sources, Kshs.32.71 million from the road maintenance fuel levy fund, received Kshs.29.39 million as conditional allocations for free maternal health care, Kshs.3.68 million as conditional allocations for forgone user fees and had a cash balance

COUNTY GOVERNMENTS BUDGET IMPLEMENTATION REVIEW REPORT FIRST HALF FY, 2015/16294
of Kshs.451.26 million brought forward from FY 2014/15.
The quarterly trend in local revenue collection from the FY 2013/14 to the second quarter of FY 2015/16 is shown in figure 3.164.
Figure 3.164: Trans Nzoia County, Trend in Local Revenue Collection by Quarter from the FY 2013/14 to the second quarter of FY 2015/16
75.18
139.44
40.63
020406080
100120140160
Kshs
.Mill
ions
Reporting period
Source: Trans Nzoia County Treasury
The local revenue consisted of Kshs.50.99 million raised in the first quarter and Kshs.40.63 million in the second quarter. The local revenue raised in the first half of the FY 2015/16 was Kshs.91.61 million (23.6 per cent of the annual local revenue target), an improvement from Kshs.62.06 million collected in a similar period of FY 2014/15.
The analysis of local revenue by stream is shown in Table 3.83.
Table 3.83: Trans Nzoia County, Analysis of revenue collection per stream for the first half of FY 2015/16
No. Revenue Stream Annual Targeted Revenue (Kshs.)
Six Months Actual Revenue (Kshs.)
Revenue Perfor-mance (%)
A B C D=*100
1 Other Sources 52,239,407 31,144,416 59.6
2 Market Fees 52,238,206 16,012,640 30.7
3 Parking Fees 54,822,388 15,322,974 28.0
4 Public Health, Medical Levies and Hospital fees 119,000,000 12,327,665 10.4
5 Single Business Permits 43,562,333 8,462,480 19.4
6 Land Rates 67,164,179 8,344,365 12.4
TOTAL 389,026,913 91,614,540 23.6
Source: Trans Nzoia County Treasury

COUNTY GOVERNMENTS BUDGET IMPLEMENTATION REVIEW REPORT FIRST HALF FY, 2015/16 295
The analysis of revenue by stream indicates that Market fees had the highest revenue performance against the annual target at 30.7 per cent followed by Parking Fees at 28.0 per cent.
3.42.3 Exchequer Issues
During the period under review, Kshs.1.86 billion was authorized for withdrawal from the CRF by the Controller of Budget, which was 29.6 per cent of the approved budget. The amount represented an decline of 3.3 per cent from Kshs.1.8 billion authorized in a similar period of FY 2014/15 and consisted of Kshs.1.34 billion (71.9 per cent) for recurrent expenditure and Kshs.524.1 million (28.1 per cent) for development activities.
3.42.4 Banking of local revenue
A review of the bank statements for the revenue collection account indicates that all locally generated revenue was deposited into the CRF during the period under review. This conforms to Article 207 of the Constitution and Section 109 of the PFM Act 2012, which stipulates that all funds raised or received by or on behalf of the County Government should be deposited into the CRF account, unless excluded by an Act of Parliament.
3.42.5 Overall Expenditure Review
The County spent a total of Kshs.1.69 billion during the first half of FY 2015/16 which was 90.8 per cent of the funds released for operations and a slight decrease from the Kshs.1.83 billion spent in a similar period of FY 2014/15. A total of Kshs.1.37 billion was spent on recurrent activities and Kshs.322.45 million on development activities. Recurrent expenditure was 102.2 per cent of the funds released for recurrent activities while development expenditure accounted for 61.5 per cent of the funds released for development activities. The expenditure excludes commitments as of 31st December, 2015 that amounted to Kshs.216.18 million for development and Kshs.118.74 million for recurrent expenditure.
Recurrent expenditure for the period under review represented 40.7 per cent of the approved annual recurrent budget, a decrease from 51.5 per cent spent in a similar period of FY 2014/15. On the other hand, development expenditure recorded an absorption rate of 11.0 per cent, a decrease from 19.1 per cent spent in a similar period of FY 2014/15. A comparison of the total expenditure between the second quarter of FY 2014/15 and FY 2015/16 is shown in Figure 3.165.

COUNTY GOVERNMENTS BUDGET IMPLEMENTATION REVIEW REPORT FIRST HALF FY, 2015/16296
Figure 3.165: Trans Nzoia County, Expenditure by Economic Classification for First Half of FY 2014/15 and First Half of FY 2015/16
842.06
545.49444.14
822.19
548.68
322.45
0100200300400500600700800900
Personnel Emoluments Operations & Maintenance Development
Ksh
s. M
illi
on
s
Expenditure by Economic Classification
1st Half, FY 2014/15
1st Half, FY 2015/16
Source: Trans Nzoia County Treasury
3.42.6 Recurrent Expenditure Analysis
The total recurrent expenditure for the reporting period was Kshs.1.37 billion against an annual f budget of Kshs.3.36 billion. This represents 40.7 per cent of the recurrent budget. The County spent Kshs.822.19 million (60.0 per cent) on personnel emoluments and Kshs.548.68 million (40.0 per cent) on operations and maintenance as shown in Figure 3.165. Expenditure on personnel emoluments accounted for 48.6 per cent of total expenditure and has decreased in FY 2015/16 as compared to a similar period of FY 2014/15 when the County spent Kshs.842.06 million.
The County spent Kshs.33.88 million on sitting allowances to the 40 MCAs including the Speaker against an annual budget of Kshs.78.12 million. This represents a decrease from Kshs.40.62 million recorded in a similar period of FY 2014/15. The average monthly sitting allowance per MCA was Kshs.141,167 compared to SRC’s recommended monthly ceiling of Kshs.124,800.
A breakdown of the operations and maintenance expenditure for the reporting period is shown in Figure 3.166.

COUNTY GOVERNMENTS BUDGET IMPLEMENTATION REVIEW REPORT FIRST HALF FY, 2015/16 297
Figure 3.166: Trans Nzoia County, Operations and Maintenance Expenditure for the First Half of FY 2015/16
112.18 99.20
71.48
35.60 30.44 21.36 19.27
8.51 5.66 4.84 -
20.00
40.00
60.00
80.00
100.00
120.00
Spec
ialise
d Mate
. & Su
pplie
s
Dome
stic &
forei
gn tr
avel
Train
ing ex
pens
es
Fuel
& Lu
brica
nts
Hosp
italit
y Sup
plies
Serv
ices
Insu
rance
costs
Routi
ne M
aint. v
ehicl
es
ing, A
dvert
iseme
ntSe
rvice
s
Utili
ties S
uppli
es &
serv
ices
Routi
ne M
aint.0
ther a
ssets
Kshs
. Mill
ions
Major Categories of O and M expenditure
Source: Trans Nzoia County Treasury
The aggregate expenditure on domestic and foreign travel was Kshs.99.20 million compared to Kshs.97.85 million incurred in a similar period of FY 2014/15, representing a marginal decrease of 1.4 per cent. This expenditure comprised of Kshs.54.60 million spent by the County Executive and Kshs.44.60 million by the County Assembly.
3.42.7 Development Expenditure Analysis
Details of development expenditure during the first half of FY 2015/16 are provided in figure 3.167.
Figure 3.167: Trans Nzoia County, Summary of Development Expenditure for the First Half of FY 2015/16
144.47
54.0339.61
25.6919.38 15.12
10.56 8.96 4.63
0.00
20.00
40.00
60.00
80.00
100.00
120.00
140.00
160.00
Cons
t. of R
eferra
l Hos
p. an
dren
ovati
on of
Hea
lth fa
cilitie
s
Cons
t. of B
us Pa
rk &
Road
Main
tanan
ce
Agric
ulture
and r
elated
proje
cts
ECD,
Polyt
echn
ic Co
nstru
ction
s
Prom
otion
of C
ulture
and S
ports
Cons
tructi
on of
Mod
ern M
arkets
Drilli
ng of
Bore
holes
and W
ater
relate
d proj
ects
Surve
y Exe
rcise
Othe
r Infr
astruc
ture a
nd C
ivil
Work
s
Kshs
.Milli
ons
Major Categories of Dvelopment Expenditure
Source: Trans Nzoia County Treasury

COUNTY GOVERNMENTS BUDGET IMPLEMENTATION REVIEW REPORT FIRST HALF FY, 2015/16298
Analysis of the development expenditure of Kshs.322.45 million incurred in the first half of FY 2015/16 indicates that the Health Department reported the highest expenditure at Kshs.144.47 million which was spent on construction of referral hospital and renovation works at the County health facilities. The second highest expenditure at Kshs.54.03 million was incurred by the Public Works Department on construction of Bus Park, street lighting and culvert installation. The Department of Agriculture, Fisheries and Livestock Development incurred Kshs.39.61 million on renovation works at the showground and agriculture related projects. Education Department incurred Kshs.25.69 million on construction of ECD classrooms and other educational programmes. Gender Department spent Kshs.19.38 on promotion of culture and sports programmes. The Department of Economic Planning incurred Kshs.15.12 million on construction of modern markets while the Department of Water and Environment incurred Kshs.10.56 million on drilling of boreholes and protection of water springs and water related projects.
3.42.8 Annual Budget and Budget Performance Analysis by department for the First Half of FY 2015/16
A summary of the FY 2015/16 annual budget estimates and budget performance for the first half by department is shown in Table 3.84.
Table 3.84: Trans Nzoia County, Annual Budget and First Half of FY 2015/16 Budget Performance by Department
DepartmentBudget Allocation
(Kshs. Million)
6 Months Ex-chequer Issues (Kshs. Million)
6 Months Expen-diture (Kshs.
Million)
Expenditure to exchequer
issues (%)
Absorption rate (%)
Rec Dev Rec Dev Rec Dev Rec Dev Rec Dev
Health 1,205.39 339.83 518.78 221.82 514.21 144.47 99.1 65.1 43 42.5
Agriculture, Livestock and Fisheries 269.22 204.8 129.02 62.56 138.38 39.61 107.3 63.3 51.4 19.3
Water, Energy, Environment, Forestry & Natural Resources 51.43 175.86 24 22.56 25.19 10.56 105 46.8 49 6
Education 70.06 248.35 33.24 47.6 37.27 25.69 112.1 54 53.2 10.3
Public Works, Transport & Infra-structure 212.25 520.82 93.19 45.32 97.86 54.03 105 119.2 46.1 10.4
Lands, Housing & Physical Planning 33.78 135.7 15.74 67.5 21.88 8.96 139 13.3 64.8 6.6
Finance 548.53 65.7 154.57 5 125.3 0.35 81.1 7 22.8 0.5
Economic Planning, commerce & industry 30.66 203.66 15.4 10.16 17.34 15.12 112.6 148.8 56.6 7.4
Governance and Public Service Management 389.47 91.99 165.29 21.76 196.73 4.28 119 19.7 50.5 4.7
County Assembly 498.4 777.33 165.13 0 173.84 0 105.3 0 34.9 0
Gender, Youth, sports, culture & Tourism 54.96 164.18 26.47 19.8 22.88 19.38 86.4 97.9 41.6 11.8
Total 3,364.16 2,928.21 1,340.85 524.1 1,370.88 322.45 102.2 61.5 40.7 11
Source: Trans Nzoia County Treasury

COUNTY GOVERNMENTS BUDGET IMPLEMENTATION REVIEW REPORT FIRST HALF FY, 2015/16 299
An analysis of budget performance by department shows that the Department of Health reported the highest absorption rate of its development budget at 42.5 per cent while the County Assembly did not incur any development expenditure. On the other hand, the Department of Lands, Housing and Physical Planning had the highest percentage of its recurrent expenditure to its recurrent budget at 64.8 per cent while the Department of Finance had the lowest percentage of its recurrent expenditure to its recurrent budget at 22.8 per cent.
3.42.9 Borrowing by the County Government
During the period under review, the County received an overdraft facility of Kshs.30 million from a commercial bank. This borrowing was in contravention of Article 212 of the Constitution which requires a county government to borrow with approval from the County Assembly, and only if the National Government guarantees the loan. Further, Section 58 of the PFM Act 2012, gives the Cabinet Secretary to the National Treasury the powers to guarantee loans subject to approval by Parliament.
3.42.10 Observations and Recommendations
The County has made progress in addressing the challenges previously identified as affecting budget implementation. The County has:
i. Improved local revenue collection from 9.3 per cent of the annual local revenue target in the first half of FY 2014/15 to 23.6 per cent in the reporting period.
Despite the progress made, the following challenges continued to hamper effective budget implementation;
1. Intermittent use of the IFMIS and manual system in processing of financial transactions.
2. Low absorption of development funds, which was 11 per cent of the annual development budget compared to a half year target of 50 per cent.
3. Delay in submission of financial reports to the OCOB contrary to Section 166 of the PFM Act 2012.
The County should implement the following recommendations in order to improve budget execution;
1. The County should adopt IFMIS in processing all financial transactions.
2. The County should come up with measures to address the low absorption of development funds.
3. The County Treasury should ensure that financial reports are submitted in a timely manner.
3.43 Turkana County
3.43.1 Overview of the FY 2015/16 Budget
The FY 2015/16 approved budget for Turkana County amounted to Kshs.13.38 billion. It comprised of Kshs.4.13 billion (30.9 per cent) allocated to recurrent expenditure and Kshs.9.25 billion (69.1 per

COUNTY GOVERNMENTS BUDGET IMPLEMENTATION REVIEW REPORT FIRST HALF FY, 2015/16300
cent) to development expenditure.
In order to finance the budget, the County expects to receive Kshs.10.23 billion (76.4 per cent) as transfers from the National Government, collect Kshs.200 million (1.49 per cent) from local sources, a conditional grant of Kshs.78 million (0.6 per cent) from DANIDA, Kshs.344.55 million (2.6 per cent) as conditional grants from the National Government, and Kshs.2.45 billion (18.51 per cent) as projected cash balance brought forward from FY 2014/15. However, the office has noted that the revenue budgeted as equitable share and conditional grants by the County differ with the amounts in the CARA, 2015. The amounts in CARA, 2015 are Kshs.10.48 billion as equitable share of revenue, Kshs.272.01 million as National Government conditional grant, Kshs.12.07 million as DANIDA grant, and Kshs.20.49 million as loan from the World Bank. The Kshs.272.01 million conditional allocation includes Kshs.23.21 million for free maternal healthcare, Kshs.19.94 million for forgone user fees, Kshs.95.74 million for leasing of medical equipment, and Kshs.133.12 million from the road maintenance fuel levy.
3.43.2 Revenue Analysis
In the first half of FY 2015/16, the County received Kshs.3.51 billion revenue from the National Government as equitable share, Kshs.67.22 million as conditional allocations from the fuel levy fund, Kshs.8.61 million as conditional allocation for free maternal health care, Kshs.1.58 million as conditional allocation for forgone user fees, raised Kshs.50.48 million from local sources, and had a cash balance of Kshs.2.44 million brought forward from FY 2014/15.
The quarterly trend in local revenue collection from the FY 2013/14 to the second quarter of FY 2015/16 is shown in figure 3.168.
Figure 3.168: Turkana County, Trend in Local Revenue Collection by Quarter from the FY 2013/14 to the second quarter of FY 2015/16
26.79
14.96
54.23
33.68 33.68 34.1529.73
35.72
10.21
40.27
0
10
20
30
40
50
60
70
80
Ksh
s. M
illio
ns
Reporting period
Source: Turkana County Treasury

COUNTY GOVERNMENTS BUDGET IMPLEMENTATION REVIEW REPORT FIRST HALF FY, 2015/16 301
The local revenue consisted of Kshs.10.21 million raised in the first quarter and Kshs.40.27 million in the second quarter. The local revenue raised in the first half of the FY 2015/16 was Kshs.50.48 million (25.2 per cent of the annual local revenue target), and a decline from Kshs.67.83 million collected in a similar period of FY 2014/15.
In the analysis of revenue returns, the Office noted that the revenue reported during the first quarter of FY 2015/16 had been overstated by the County Treasury by Kshs.12.9 million. The actual revenue collected in the same period was Kshs.10.21 million and not Kshs.23.11 million.
The analysis of local revenue by stream is shown in Table 3.85.
Table 3.85: Turkana County, Analysis of revenue collection by stream for the first half of FY 2015/16
No. Revenue Stream Annual Targeted Receipts Six Months Actual Receipts Revenue Perfor-mance (%)
A B C D=C/B*100
1 Lorry Parking Fee 200,000 219,100 109.6
2 Direct Deposit 27,156,000 18,970,690 69.9
3 Matatu Fee 423,500 262,300 61.9
4 Bus Park Fee 500,000 293,500 58.7
5 Land Cruiser Fee 257,000 151,500 58.9
6 Fish Market Fee 523,000 278,570 53.3
7 Single Business Permit 4,530,650 1,944,240 42.9
8 Miscellaneous Receipt 135,679,350 27,152,408 20
9 Small Animals Auction Fee 320,000 35,030 10.9
10 Small Animals Slaughter Fee 5,350,000 404,300 7.6
11 Other revenue streams 25,060,500 761,120 3
TOTAL 200,000,000 50,472,758 25.2
Source: Turkana County Treasury
The analysis of revenue by stream indicated that revenue from Lorry Parking Fees recorded the highest revenue performance at 109.6 per cent. Other high performances were recorded by Direct Deposits and Matatu Fees at 69.9 per cent and 61.9 per cent respectively. Direct Deposits should be correctly classified by the County Treasury.
3.43.3 Banking of Local Revenue
During the period under review, the Departments of Health and Sanitation, and Roads and Public Works did not bank all its local revenue collections intact into the County Revenue Fund as per Article 207 of the Constitution. This contravenes Article 207 of the Constitution and Section 109 of the PFM Act 2012, which stipulates that all funds raised or received by or on behalf of the County Government should be deposited into the CRF account unless excluded by an Act of Parliament.

COUNTY GOVERNMENTS BUDGET IMPLEMENTATION REVIEW REPORT FIRST HALF FY, 2015/16302
3.43.4 Exchequer Issues
During the period under review, the COB authorised withdrawal of Kshs.4.50 billion from the CRF account, which was 33.6 per cent of the approved budget. The exchequer releases consisted of Kshs.2.0 billion (44.5 per cent) for recurrent expenditure and Kshs.2.5 billion (55.5 per cent) for development activities. The withdrawn amount represented a decline from Kshs.6.34 billion authorized in a similar period of FY 2014/15.
3.43.5 Overall Expenditure Review
The County spent a total of Kshs.4.0 billion during the first half of FY 2015/16 which was 89 per cent of the funds released for operations. This is an increase from the Kshs.2.76 billion spent in a similar period of FY 2014/15. A total of Kshs.1.90 billion was spent on recurrent activities and Kshs.2.10 billion on development activities. Recurrent expenditure was 94.8 per cent of the funds released for recurrent activities while development expenditure accounted for 84.3 per cent of the funds released for development activities.
Recurrent expenditure for the period under review represented 46.0 per cent of the approved annual recurrent budget, an improvement from 37.5 per cent spent in a similar period of FY 2014/15. On the other hand, development expenditure recorded an absorption rate of 22.7 per cent, an improvement from 13.9 per cent spent in a similar period of FY 2014/15. A comparison of the total expenditure in the first half of FY 2014/15 and the first half of FY 2015/16 is shown in Figure 3.169.
Figure 3.169: Turkana County, Expenditure by Economic Classification for First Half of FY 2014/15 and FY 2015/16
615.50 900.30
1,245.50 1,361.29
537.43
2,104.03
-
500.00
1,000.00
1,500.00
2,000.00
2,500.00
Personnel Emoluments Operations & Maintenance Development
Ksh
s. M
illio
ns
Expenditure by Economic Classification
1st Half, FY 2014/15
1st Half, FY 2015/16
Source: Turkana County Treasury
3.43.6 Recurrent Expenditure Analysis
The total recurrent expenditure for the reporting period was Kshs.1.90 billion against an annual recurrent budget of Kshs.4.13 billion. This represents 46.0 per cent of the annual recurrent budget. The County spent Kshs.1.36 billion (72.3 per cent) on personnel emoluments and Kshs.537.43 million (28.2 per cent) on operations and maintenance as shown in Figure 3.169. Expenditure on personnel

COUNTY GOVERNMENTS BUDGET IMPLEMENTATION REVIEW REPORT FIRST HALF FY, 2015/16 303
emoluments accounted for 34 per cent of total expenditure and has increased significantly in FY 2015/16 as compared to a similar period in FY 2014/15 when the County spent Kshs.615.50 million. The increase is attributable to increase in the number of staff recruited and yearly salary increments.
The County spent Kshs.20.57 million on sitting allowances to the 47 MCAs and the Speaker against an annual budget of Kshs.64.91 million. This represents a decrease from Kshs.41.39 million recorded in a similar period of FY 2014/15. The average monthly sitting allowance per MCA was Kshs.72,934 compared to SRC’s recommended monthly ceiling of Kshs.124, 800.
A breakdown of the operations and maintenance expenditure for the reporting period is shown in Figure 3.170.
Figure 3.170: Turkana County, Operations and Maintenance Expenditure for the First Half of FY 2015/16
141.34
56.63 50.93 40.86 35.5121.33 17.50 11.86 10.84 6.22 5.79 1.36
0.00
20.00
40.00
60.00
80.00
100.00
120.00
140.00
160.00
Dom
estic
,For
eign
Tra
vel
and
Subs
iste
nce
Insu
ranc
e Se
rvic
es
Mai
nten
ance
Pla
nt b
uild
ing
and
equi
pmen
t
Gen
eral
Off
ice
Supp
lies
Fuel
& L
ubric
ants
Trai
ning
Prin
ting
Serv
ices
Off
ice
Util
ities
Hos
pita
lity
Com
mun
icat
ion
Off
ice
Furn
iture
and
Fitti
ngs
Adv
ertis
ing
Publ
icity
and
Aw
aren
ess
Ksh
s. M
illio
ns
Major Categories of O and M
Source: Turkana County Treasury
The aggregate expenditure on domestic and foreign travel was Kshs.141.34 million compared to Kshs.241.87 million incurred in a similar period of FY 2014/15, representing a decline of 41.6 per cent. This expenditure comprised of Kshs.104.14 million spent by the County Executive and Kshs.37.20 million by the County Assembly.
3.43.7 Development Expenditure Analysis
A summary of development expenditure during the first half of FY 2015/16 is provided in figure 3.171.

COUNTY GOVERNMENTS BUDGET IMPLEMENTATION REVIEW REPORT FIRST HALF FY, 2015/16304
Figure 3.171: Turkana County, Summary of Development Expenditure for the First Half of FY 2015/16
310.55
245.85
178.19159.70 149.42
110.2185.72
67.67 60.61 55.11 53.80 51.81
0
50
100
150
200
250
300
350Co
unty
Roa
ds
Wat
er D
evelo
pmen
t Pro
gram
Healt
h In
frastr
uctu
re D
evelo
pmen
t
Secu
rity a
nd P
eace
Bui
ldin
g
Acce
ss fo
r Edu
catio
n Pr
ogra
m
Disa
ster M
anag
emen
t Pro
gram
Dece
ntra
lized
Pro
gram
m Se
rvice
s
Ener
gy an
d En
viron
men
t
Lives
tock
and
Verti
nary
Serv
ices
Coun
ty R
even
ue P
rogr
am
Coun
ty P
lanni
ng Se
rvice
s
Cons
truct
ion
Wor
ks
Kshs
. Milli
ons
Major Categories of Development Expenditure
Source: Turkana County Treasury
Analysis of the development expenditure of Kshs.2.1 billion in the first half of FY 2015/16 indicates that the Roads and Public Works Department reported the highest expenditure at Kshs.310.55 million which was spent on construction and maintenance of county roads. The second highest expenditure at Kshs.245.85 million was spent on water development programs by Water Services, Irrigation and Agriculture Department.
3.43.8 Annual Budget and Budget Performance Analysis by department for the First Half of FY 2015/16
The summary of the FY 2015/16 annual budget estimates and budget performance for the first half by department is shown in Table 3.86.
Table 3.86: Turkana County, Annual Budget and First Half of FY 2015/16 Budget Performance by Department
DepartmentAnnual Budget
Allocation (Kshs.Million)
6 Months Exchequer Issues (Kshs.Million)
6 Months Expendi-ture (Kshs.Million)
Expenditure to Exchequer Issues
(%)
Expenditure to Annual Budget
(%)Rec Dev Rec Dev Rec Dev Rec Dev Rec Dev
Governor 147.68 545.81 66.68 147.42 94.60 221.36 141.9 150.2 64.1 40.6
Deputy Governor 29.54 - 17.62 - 7.54 - 42.8 0 25.5 0
Finance And Planning 146.65 841.09 69.47 357.41 59.42 200.88 85.5 56.2 40.5 23.9
Water Services, Irriga-tion And Agriculture
43.75 1,232.08 20.81 332.78 8.16 318.89 39.2 95.8 18.7 25.9
Health And Sanitation 155.60 1,025.28 75.08 276.92 63.96 250.42 85.2 90.4 41.1 24.4

COUNTY GOVERNMENTS BUDGET IMPLEMENTATION REVIEW REPORT FIRST HALF FY, 2015/16 305
DepartmentAnnual Budget
Allocation (Kshs.Million)
6 Months Exchequer Issues (Kshs.Million)
6 Months Expendi-ture (Kshs.Million)
Expenditure to Exchequer Issues
(%)
Expenditure to Annual Budget
(%)Rec Dev Rec Dev Rec Dev Rec Dev Rec Dev
Tourism Trade Culture 47.68 396.59 20.68 82.53 27.17 79.24 131.4 96.0 57.0 20.0
Education And Social Services
33.93 1,748.49 16.14 386.91 10.16 208.81 62.9 54.0 29.9 11.9
PSDM 2,268.04 699.84 1,093.87 189.02 1,158.29 286.54 105.9 151.6 51.1 40.9
Transport Roads 68.44 1,145.43 32.55 309.37 16.37 358.55 50.3 115.9 23.9 31.3
Pastoral Economy 50.61 328.55 24.07 88.74 23.37 60.61 97.1 68.3 46.2 18.4
Energy Environment 45.05 278.73 20.99 78.26 20.65 67.67 98.4 86.5 45.8 24.3
Lands, Physical Plan-ning
53.16 591.38 25.29 159.73 47.56 45.41 188.1 28.4 89.5 7.7
County Assembly 977.90 390.98 488.95 79.70 350.95 - 71.8 0.0 35.9 0.0
County Public Service Board
63.73 27.31 30.31 7.38 10.53 5.66 34.7 76.7 16.5 20.7
Total 4,131.76 9,251.56 2,002.51 2,496.17 1,898.73 2,104.04 94.8 84.3 46.0 22.7
Source: Turkana County Treasury
The analysis of budget performance by department shows that the Public Service and Disaster Management (PSDM) Department registered the highest absorption rate at 40.9 per cent while the County Assembly did not spend on development despite having a budget allocation of Kshs.390.98 million. On the other hand, the Department of Lands, Physical Planning and Housing reported the highest proportion of recurrent expenditure to its annual recurrent budget at 89.5 per cent while the County Public Service Board had the lowest proportion at 16.5 per cent.
3.43.9 Borrowing by the County Government
Article 212 of the Constitution requires a county government to borrow with approval from the County Assembly, and only if the national government guarantees the loan. Further, Section 58 of the PFM Act 2012 gives the Cabinet Secretary to the National Treasury the powers to guarantee loans subject to approval by parliament. During the period under review, the County utilized its equitable share and local revenue collection deposited into the County Revenue Fund account maintained at the Central Bank of Kenya and did not borrow any funds.
3.43.10 Observations and Recommendations
The County has made progress in addressing the challenges previously identified as affecting budget implementation. The County has:
i. Registered improvement in absorption of development funds from 13.9 per cent in the first half of FY 2014/15 to 22.7 per cent in the period under review.
ii. Improved in the submission of quarterly expenditure reports as required by Section 166 of the

COUNTY GOVERNMENTS BUDGET IMPLEMENTATION REVIEW REPORT FIRST HALF FY, 2015/16306
PFM Act 2012.
Despite the progress made, the following challenges continued to hamper effective budget implementation;
1. Under performance of local revenue collection. The local revenue declined from Kshs.67.83 million in the first half of FY 2014/15 to Kshs.50.48 million in the period under review.
2. Non-compliance with Article 207 of the Constitution. During the period under review, the Departments of Health and Sanitation, and Roads and Public Works spent revenue collection at source despite being advised appropriately.
3. Failure to budget for the additional conditional grants contained in CARA 2015. Where conditional grants were included in the budget, the amounts varied from those contained in the CARA 2015.
The County should implement the following recommendations in order to improve budget execution.
1. The County Treasury should review its revenue raising measures in order to establish and address the reasons that caused underperformance.
2. The County Treasury should ensure that all revenue raised or received by or on behalf of the County is paid into County Revenue Fund as per Section 109 (2) of the PFM Act 2012. In addition, regular reconciliation of the revenue receipts should be undertaken.
3. The County should prepare a Supplementary Budget to include all conditional grants and correct the conditioned grants amounts to agree with CARA, 2015.
3.44 Uasin Gishu County
3.44.1 Overview of the FY 2015/16 Budget
The FY 2015/16 Supplementary Budget for Uasin Gishu County amounted to Kshs.7.54 billion, with Kshs.4.59 billion (60.9 per cent) allocated for recurrent expenditure and Kshs.2.95 billion (39.1 per cent) for development expenditure. The Supplementary budget was prepared to cater for vote re-allocations or readjustments where no or little budgetary provisions were provided. The overall budget changed from Kshs.7.52 billion to Kshs.7.54 billion, an increment of Kshs.21.87 million being the balance in the local revenue collection accounts at the close of the FY 2014/15.
In order to finance the budget, the County expects to receive Kshs.5.19 billion (68.0 per cent) as transfers from the National Government, collect Kshs.1.04 billion (13.6 per cent) from local sources, Kshs.1.09 billion (14.3 per cent) as projected cash balance from FY 2014/15, a conditional grant of Kshs.17.32 million (0.2 per cent) from DANIDA, additional conditional grants as contained in CARA, 2015; Kshs.117.3 million (1.5 per cent) for free maternal care, Kshs.20.8 million (0.3 per cent) for compensation for forgone user fees, and Kshs.65.9 million (0.9 per cent) from the road maintenance fuel levy fund. However, the County did not budget for the conditional grant of Kshs.95.74 million (1.2 per cent) for the leasing of medical equipment

COUNTY GOVERNMENTS BUDGET IMPLEMENTATION REVIEW REPORT FIRST HALF FY, 2015/16 307
as contained in CARA, 2015.
3.44.2 Revenue Analysis
In the first half of FY 2015/16, the County received Kshs.1.74 billion from the National Government as equitable share, Kshs.33.30 million from Road Maintenance Fuel Levy Fund, Kshs.10.97 million as conditional allocation for free maternal health care, Kshs.8.66 million as conditional allocation for forgone user fees, raised Kshs.262.95 million from local sources, and had a cash balance of Kshs.1.09 billion brought forward from FY 2014/15.
The quarterly trend in local revenue collection from FY 2013/14 to the second quarter of FY 2015/16 is shown in figure 3.172.
Figure 3.172: Uasin Gishu County, Trend in Local Revenue Collection by Quarter from the FY 2013/14 to the second quarter of FY 2015/16
76.8 72.4
266.9
180.86
318.81
127.53
0
50
100
150
200
250
300
350
Ksh
s.m
illio
n
Reporting Period
Source: Uasin Gishu County Treasury
The local revenue consisted of Kshs.135.42 million raised in the first quarter and Kshs.127.53 million in the second quarter. The local revenue raised in the first half of the FY 2015/16 was Kshs.263.95 million (25.4 per cent of the annual local revenue target), and a decline from Kshs.293.54 million collected in a similar period of FY 2014/15.
Analysis of local revenue by stream is shown in Table 3.87.

COUNTY GOVERNMENTS BUDGET IMPLEMENTATION REVIEW REPORT FIRST HALF FY, 2015/16308
Table 3.87: Uasin Gishu County, Analysis of revenue collection by stream for the first half of FY 2015/16
No. Revenue Stream Annual Targeted Revenue (Kshs.)
Six Months Actual Revenue (Kshs.)
Revenue Perfor-mance (%)
A B C D=*100
3 Enclosed Bus Park 105,000,000 50,901,753 48.5
4 Street Parking 90,000,000 34,376,850 38.2
2 Land Rates 237,217,425 30,392,313 12.8
1 Single Business Permits 200,000,000 20,386,678 10.2
7 Sign Boards & Advert Fees 40,000,000 14,294,455 35.7
5 House Management Unit 79,000,000 13,271,635 16.8
8 Urban Planning Fees 60,000,000 9,636,420 16.1
6 Cess (Wheat, Maize, Sugarcane) 50,000,000 2,442,220 4.9
9 Other revenue streams 176,000,000 87,246,179 49.6
10 TOTAL 1,037,217,425 262,948,503 25.4
Source: Uasin Gishu County Treasury
The breakdown of revenue by stream indicates that enclosed bus park generated the highest percentage of revenue against its annual target at 48.5 per cent followed by street parking at 38.2 per cent. The agricultural cess reported the lowest local collection against target at 4.9 per cent.
3.44.3 Exchequer Issues
The Controller of Budget authorised withdrawal of Kshs.2.62 billion from the CRF account, which was 34.7 per cent of the approved supplementary budget. The amount represented a decline of 0.4 per cent from Kshs.2.63 billion authorized in a similar period of FY 2014/15 and consisted of Kshs.1.93 billion (73.7 per cent) for recurrent expenditure and Kshs.690.33 million (26.3 per cent) for development activities.
3.44.4 Banking of local revenue
A review of the bank statements of the revenue collection account indicates that all locally generated revenue was deposited into the CRF during the period under review. This conforms to Article 207 of the Constitution and Section 109 of the PFM Act 2012, which stipulates that all funds raised or received by or on behalf of the County Government should be deposited into the CRF account, unless excluded by an Act of Parliament.
3.44.5 Overall Expenditure Review
The County spent a total of Kshs.2.01 billion during the first half of FY 2015/16 which was 76.6 per cent of the funds released for operations. This is an increase from the Kshs.1.79 billion spent in a similar period of FY 2014/15. A total of Kshs.1.32 billion was spent on recurrent activities and Kshs.687.73 million on development activities. Recurrent expenditure was 68.3 per cent of the

COUNTY GOVERNMENTS BUDGET IMPLEMENTATION REVIEW REPORT FIRST HALF FY, 2015/16 309
funds released for recurrent activities while development expenditure accounted for 99.6 per cent of the funds released for development activities. The expenditure excludes commitments as of 31st December, 2015 that amounted to Kshs.197.96 million for development and Kshs.463.46 million for recurrent expenditure.
Recurrent expenditure for the period under review represented 28.7 per cent of the supplementary recurrent budget, a decrease from 35.1 per cent spent in a similar period of FY 2014/15. On the other hand Development expenditure recorded an absorption rate of 23.3 per cent, an improvement from 14.3 per cent spent in a similar period of FY 2014/15. A comparison of the total expenditure between the second quarter of FY 2014/15 and FY 2015/16 is shown in Figure 3.173.
Figure 3.173: Uasin Gishu County, Expenditure by Economic Classification for First Half of FY 2014/15 and First Half of FY 2015/16
906.7
393.4487.6
1,011.30
307.9
687.70
0
200
400
600
800
1000
1200
Personnel Emoluments Operations & Maintenance Development
Ksh
s. M
illio
ns
Expenditure by Economic Classification
1st Half, FY 2014/15
1st Half, FY 2015/16
Source: Uasin Gishu County Treasury
3.44.6 Recurrent Expenditure Analysis
The total recurrent expenditure for the reporting period was Kshs.1.32 billion against an annual budget of Kshs.4.59 billion. This represents 28.7 per cent of the annual recurrent budget. The County spent Kshs.1.01 billion (76.7 per cent) on personnel emoluments and Kshs.307.86 million (23.3 per cent) on operations and maintenance as shown in Figure 3.173. Expenditure on personnel emoluments accounted for 50.3 per cent of total expenditure and has increased significantly in the first half of FY 2015/16 as compared to a similar period of FY 2014/15 when the County spent Kshs.906.7 million. The increase is attributed to the recruitment of the healthcare staff and other regular staff by the County.
The County spent Kshs.17.09 million on sitting allowances to the 45 MCAs and the Speaker against an annual budget of Kshs.56.16 million. This is a significant decrease from Kshs.84.33 million recorded in a similar period of FY 2014/15. The average monthly sitting allowance per MCA was Kshs.63,289 compared to SRC recommended monthly ceiling of Kshs.124,800.
A breakdown of the operations and maintenance expenditure for the reporting period is shown in Figure 3.174.

COUNTY GOVERNMENTS BUDGET IMPLEMENTATION REVIEW REPORT FIRST HALF FY, 2015/16310
Figure 3.174: Uasin Gishu County, Operations and Maintenance Expenditure for the First Half of FY 2015/16
69.66 66.32
41.93
27.1518.58 18.15 17.45 14.78 12.34
6.39 6.33 4.6 4.18
01020304050607080
Dom
estic
& F
orei
gn T
rave
l
Pend
ing
Bills
Spec
ializ
ed M
ater
ials
Othe
r Exp
ense
s
Rout
ine
Man
tain
ence
Insu
ranc
e
Fuel
Oil
& Lu
brica
nts
Prin
ting
& A
dver
tisin
g
Trai
ning
Exp
ense
s
Utili
ties
Hosp
italit
y
Offic
e &
Gene
ral S
uppl
ies
Com
mun
icatio
n
Kshs
. Mill
ions
Major Categories of O&M Expenditure
Source: Uasin Gishu County Treasury
The aggregate expenditure on domestic and foreign travel was Kshs.69.66 million compared to Kshs.67.62 million incurred in a similar period of FY 2014/15, representing an increase of 3.02 per cent. This expenditure comprised of Kshs.25.03 million spent by the County Executive and Kshs.44.63 million by the County Assembly.
3.44.7 Development Expenditure Analysis
A summary of development expenditure during the first half of FY 2015/16 is provided in figure 3.175.
Figure 3.175: Uasin Gishu County, Summary of Development Expenditure for the First Half of FY 2015/16
409.40
77.93 65.58 49.27 24.62 19.49 15.70 10.95 5.89 3.61 2.46 1.93 0.90
- 50.00
100.00 150.00 200.00 250.00 300.00 350.00 400.00 450.00
Cons
truct
ion of
Roa
ds
Cons
truct
ion of
Non
-resid
entia
lbu
ilding
s
Purc
hase
of eq
uipm
ents
&m
achi
nery
Publi
c Ent
repr
ises
Othe
r Inf
rastr
uctu
ral W
orks
Pre-
feas
ilibilit
y Stu
dies
Purc
hase
of so
ftwar
e
Over
haul
of w
ater
supp
lies
Cont
rate
d Pro
fess
iona
l Ser
vices
Purc
hase
of IC
T Net
work
ing
Supp
lies o
f Bro
adca
sting
Serv
ices
Refu
rbish
men
t of B
uildi
ngs
Purc
hase
of Se
edlin
gs &
Bree
ding S
tock
Kshs
. Milli
ons
Major Categories of Development Expenditure
Source: Uasin Gishu County Treasury

COUNTY GOVERNMENTS BUDGET IMPLEMENTATION REVIEW REPORT FIRST HALF FY, 2015/16 311
Analysis of the development expenditure of Kshs.687.73 million incurred in the first half of FY 2015/16 indicates that the Roads and Public Works Department reported the highest expenditure at Kshs.474 million which was spent on construction and maintenance of access roads and bridges, purchase of specialized plant and other infrastructural works. During the period, a total of 297.7 kilometres of roads were graded, 3.1 kilometres gravelled and 28.1 kilometres of new roads opened up. The second highest expenditure was at Kshs.49.27 million incurred by the department of Finance and Economic Planning on payment of pending bills related to ward intervention projects namely construction of ECDEs, dispensaries, culverts, cattle dips, boreholes etc. The Department of Health Services incurred Kshs.33.73 million on construction of health facilities whereas the Department of Physical Planning, Lands and Housing incurred Kshs.28.15 million on pre-feasibility and appraisal studies, contracted professional services and other civil works.
The Department of Trade, Tourism, Industry and Co-operative Development incurred Kshs.26.67 million on construction of non-residential buildings and other infrastructural works. The Department of Education, Social, Culture, Youth and Sports had the lowest expenditure at Kshs.2.58 million for the construction of buildings. However, the County Assembly Services and County Public Service Board did not spent on development projects despite having a development expenditure allocation.
3.44.8 Annual Budget and Budget Performance Analysis by department for the First Half of FY 2015/16
A summary of FY 2015/16 annual budget estimates and budget performance for the first half of FY 2015/16 by department is shown in Table 3.88.
Table 3.88: Uasin Gishu County, Annual Budget and First Half of FY 2015/16 Budget Performance by Department
DepartmentBudget Allocation
(Kshs. Million)
6 Months Exche-quer Issues (Kshs.
Million)
6 Months Expen-diture (Kshs.
Million)
Expen-diture to
exchequer issues (%)
Absorption rate (%)
Rec Dev Rec Dev Rec Dev Rec Dev Rec Dev
County Assembly Services 502.45 24.65 288.51 - 192.2 - 66.6 - 38.3 0
Public Service Management 649.42 79.44 204.78 15 162.41 15.09 79.3 100.6 25 19
Office of the Governor 113.55 10 45.69 5 18 3.66 39.4 73.2 15.9 36.6
County Public Service Board 45.36 3.73 21.63 3.73 9.8 0 45.3 0 21.6 0
Finance & Economic Planning 739.13 113.09 198.17 52.21 132.34 49.27 66.8 94.4 17.9 43.6
Agriculture, Livestock & Fisheries Development 240.55 420.63 116.94 26.83 66.12 11.74 56.5 43.8 27.5 2.8
Water, Environment, Energy & Natural Resources 139.23 267.66 66.93 40.3 47.3 23.02 70.7 57.1 34 8.6
Education, Youth, Culture & Social services 306.05 401.31 149.96 12.35 88.75 2.58 59.2 20.9 29 0.6
Health Services 1,226.90 293.4 531.95 30 456.35 33.73 85.8 112.4 37.2 11.5

COUNTY GOVERNMENTS BUDGET IMPLEMENTATION REVIEW REPORT FIRST HALF FY, 2015/16312
DepartmentBudget Allocation
(Kshs. Million)
6 Months Exche-quer Issues (Kshs.
Million)
6 Months Expen-diture (Kshs.
Million)
Expen-diture to
exchequer issues (%)
Absorption rate (%)
Rec Dev Rec Dev Rec Dev Rec Dev Rec Dev
Land, Housing & Physical Planning 69.9 168.46 32.3 41.12 18.22 28.15 56.4 68.5 26.1 16.7
Roads & Public Works 398.87 858.84 165.13 355.4 104.41 474.52 63.2 133.5 26.2 55.3
ICT & E-Government 32.09 72.46 13.83 25.58 5.7 19.3 41.2 75.4 17.8 26.6
Trade, Industria-lization, Tourism & Cooperative Development 130.3 235.15 94.64 82.81 17.57 26.67 18.6 32.2 13.5 11.3
Total 4,593.80 2,948.82 1,930.46 690.33 1,319.17 687.73 68.3 99.6 28.7 23.3
Source: Uasin Gishu County Treasury
An analysis of budget performance by department shows that the Department of Roads and Public Works reported the highest absorption rate of its development budget at 55.3 per cent while the County Public Service Board and the County Assembly did not absorb their development budget. On the other hand, the County Assembly Services had the highest percentage of its recurrent expenditure to its recurrent budget at 38.3 per cent while Trade, Industrialization, Tourism & Cooperative Development had the lowest percentage of its recurrent expenditure to its recurrent budget at 13.5 per cent.
3.44.9 Borrowing by the County Government
Article 212 of the Constitution requires a county government to borrow with approval from the County Assembly, and only if the national government guarantees the loan. Further, Section 58 of the PFM, Act, 2012 gives the Cabinet secretary to the National Treasury the powers to guarantee loans subject to approval by Parliament. During the period under review, the County utilized its equitable share and own local revenue collection deposited into the CRF account maintained at the Central bank of Kenya and did not borrow any funds.
3.44.10 Observations and Recommendations
The County has made progress in addressing the challenges previously identified as affecting budget implementation. The County has:
i. Registered improvement in absorption of development funds from 14.3 per cent in the first half of FY 2014/15 to 23.3 per cent in the first half of FY 2015/16.
ii. Rolled out IFMIS usage in the County Assembly as required by law.
iii. Improved the capacity of procurement personnel in use of the E-procurement system thereby resulting in increased absorption of development funds.
Despite the progress made, the following challenges continued to hamper effective budget implementation;

COUNTY GOVERNMENTS BUDGET IMPLEMENTATION REVIEW REPORT FIRST HALF FY, 2015/16 313
1. Low revenue collection which stood at 25.4 per cent of the annual local revenue target.
2. Late submission of quarterly reports for the County established funds namely the County Bursary and Skills Development Support Fund, County Education Revolving Fund, Car Loans and Mortgages Fund and County Corporative Enterprise Development Fund.
The County should implement the following recommendations in order to improve budget execution;
1. The County Treasury should ensure strict compliance with the laws and regulations governing budgeting principles on reallocation of appropriated funds in line with the PFM Act 2012.
2. The County Treasury should strengthen revenue mobilization and collection strategies by fully automating the revenue collection systems.
3. The County Treasury through the fund administrators should ensure timely submission of quarterly reports for the County established funds to the oversight institutions in line with Section 168 of the PFM Act 2012.
3.45 Vihiga County
3.45.1 Overview of the FY 2015/16 Budget
The FY 2015/16 Approved Supplementary Budget for Vihiga County was Kshs.4.37 billion. It comprised of Kshs.2.54 billion (58.1 per cent) allocated to recurrent expenditure and Kshs.1.83 billion (41.9 per cent) to development expenditure.
In order to finance the budget, the County expects to receive Kshs.3.87 billion (88.6 per cent) as equitable share from the National Government, collect Kshs.352.16 million (8.1 per cent) from local sources, a conditional grant of Kshs.130.02 million (3.0 per cent), and Kshs.14.17 million (0.3 per cent) from DANIDA. The conditional grant of Kshs.130.02 million is composed of Kshs.49.18 million from Road Maintenance Fuel Levy Fund, Kshs.67.91 million for maternal health care, Kshs.12.93 million for user fees forgone. Kshs.95.74 million for leasing of medical equipment was not budgeted for by the County.
3.45.2 Revenue Analysis
In the first half of FY 2015/16, the County received Kshs.1.65 billion from the National Government as equitable share, Kshs.20.70 million conditional allocation for free maternal health, Kshs.4.85 million conditional allocation for forgone user fees, Kshs.24.84 million conditional allocation from Road Maintenance Fuel Levy Fund, raised Kshs.62.27 million from local sources, and had Kshs.4.33 million cash balance brought forward from FY 2014/15. The quarterly trend in local revenue collection from FY 2013/14 to the second quarter of FY 2015/16 is shown in figure 3.176.

COUNTY GOVERNMENTS BUDGET IMPLEMENTATION REVIEW REPORT FIRST HALF FY, 2015/16314
Figure 3.176: Vihiga County, Trend in Local Revenue collection by Quarter from FY 2013/14 to the second Quarter, FY 2015/16
18.80
45.80
23.10
37.90
27.80
15
20
25
30
35
40
45
50
Ksh
s in
Mill
ions
Reporting Period
Source: Vihiga County Treasury
The local revenue raised in the first quarter was Kshs.34.89 million and in the second quarter was Kshs.27.38 million.
The total revenue for first half of FY 2015/16 was Kshs.62.27 million and an increase from Kshs.48.7 million collected in a similar period of FY 2014/15. The total local revenue raised in the first half of FY 2015/16 accounted for 17.7 per cent of the annual local revenue target.
The analysis of local revenue by stream is shown in Table 3.89.
Table 3.89: Vihiga County, Analysis of revenue collection by stream for the first half of FY 2015/16
NO. Revenue StreamAnnual Targeted Revenue
(Kshs.)
6 Months Actual Revenue
(Kshs.)
Revenue Performance (%)
A B C D=C/B*10
1 Clothes (other fees) 786,040 529,040 67.3
2 Bus Park 44,873,915 19,610,750 43.7
3 Market Fees 18,500,000 6,618,465 35.8
4 Rent (office, stall & plots) 3,847,416 1,169,408 30.4
5 Land Rates 4,026,585 324,862 8.1
6 Single Business Permits 53,104,577 4,224,222 8.0
7 Motor Bikes Fees 3,000,000 224,100 7.5
8 Advertisements 2,000,000 67,120 3.4
9 Other revenue streams 222,020,348 29,506,161 13.3
TOTAL 352,158,881 62,274,128 17.7
Source: Vihiga County Treasury

COUNTY GOVERNMENTS BUDGET IMPLEMENTATION REVIEW REPORT FIRST HALF FY, 2015/16 315
The analysis of revenue by stream shows that Clothes Fees recorded the highest performance against the annual target at 67.3 per cent followed by Bus Park Fees at 43.7 per cent and Market Fees at 35.8 per cent. Advertisement recorded the lowest performance at 3.4 per cent followed by Motor Bikes Fees at 7.5 per cent and Single Business Permits at 8.0 per cent.
3.45.3 Exchequer Issues
In the period under review, the COB authorised withdrawal of Kshs.1.39 billion from the CRF account, which is 31.7 per cent of the approved supplementary budget. The exchequer release consisted of Kshs.1.19 billion (85.6 per cent) for recurrent activities and Kshs.200.00 million (14.4 per cent) for development activities.
3.45.4 Banking of Local Revenue
A review of the bank statements in the first half of FY 2015/16 shows that the County did not bank Kshs.4.27 million of the locally generated revenue into the CRF. This revenue was spent at source by the Department of County Health Services in contravention of Article 207 of the Constitution and Section 109 of the PFM Act 2012. The law stipulates that all funds raised or received by or on behalf of the County Government should be deposited into the CRF account, unless excluded by an Act of Parliament.
3.45.5 Overall Expenditure Review
The County spent a total of Kshs.1.29 billion during the first half of FY 2015/16 which was 93.2 per cent of the funds released for operations. This is an increase from the Kshs.915.99 million spent in a similar period in FY 2014/15. A total of Kshs.876.78 million (67.9 per cent) was spent on recurrent activities while Kshs.414.0 million (32.1 per cent) on development activities. Recurrent expenditure was 74.0 per cent of the funds released for recurrent activities while development expenditure accounted for 207.0 per cent of the funds released. The expenditure does not include outstanding commitments as of 31st December, 2015 that amounted to Kshs.610.77 million for development expenditure and Kshs.224.9 million for recurrent expenditure.
Recurrent expenditure for the period under review represented 34.6 per cent of the annual recurrent budget, an increase from 21.9 per cent realized in a similar period of FY2014/15. On the other hand development expenditure was 22.6 per cent of the annual development budget an increase from 16.2 per cent spent in a similar period of FY 2014/15. A comparison of the total expenditure between the first half of FY 2014/15 and the first half of FY 2015/16 is shown in Figure 3.177.

COUNTY GOVERNMENTS BUDGET IMPLEMENTATION REVIEW REPORT FIRST HALF FY, 2015/16316
Figure 3.177: Vihiga County, Expenditure by Economic Classification for the First Half of FY 2014/15 and for the First Half of FY 2015/16
400.30358.79
616.91
259.87
414.00
200250300350400450500550600650
Personnel Emoluments Operation and Maintenance Development
Ksh
s.m
illi
on
s
Expenditure by Economic Classification
1st Half of FY 2014/15
1st Half of FY 2015/16
Source: Vihiga County Treasury
3.45.6 Recurrent Expenditure Analysis
Analysis of the recurrent expenditure for the reporting period of Kshs.876.78 million shows that the County spent Kshs.616.91 million (70.4 per cent) on personnel emoluments and Kshs.259.87 million (29.6 per cent) on operations and maintenance expenditure as shown in Figure 3.177. Expenditure on personnel emoluments accounted for 47.8 per cent of total expenditure and has increased in FY 2015/16 as compared to a similar period in FY 2014/15 when the County spent Kshs.400.3 million. The increase is due to continuous recruitment of staff and promotion of staff.
The County spent Kshs.4.38 million on sitting allowances to the 39 MCAs and the Speaker against an annual budget of Kshs.14.57 million. This is an increase from Kshs.2.93 million recorded in a similar period of FY 2014/15. The average monthly sitting allowance per MCA was Kshs.18, 263 compared to SRC’s recommended monthly ceiling of Kshs.124, 800.
A breakdown of operations and maintenance expenditure for the reporting period of FY 2015/16 is shown in Figure 3.178.

COUNTY GOVERNMENTS BUDGET IMPLEMENTATION REVIEW REPORT FIRST HALF FY, 2015/16 317
Figure 3.178: Vihiga County, Operations and Maintenance Expenditure for the First Half of FY 2015/16
149.05137.83
79.18
39.21 38.29 33.14 33.01 30.00 28.94 28.62 24.88 22.91 19.76 14.57 10.00
0.0020.0040.0060.0080.00
100.00120.00140.00160.00
Spec
ialis
ed m
ater
ial-N
on-
phar
mac
eutic
al M
edic
al…
Emer
genc
y R
elie
f and
Ref
ugee
Ass
ista
nts
Oth
er O
& M
Exp
ense
s
Off
ice
utili
ties
Trai
ning
and
Sem
inar
s
Dom
estic
and
For
eign
Trav
el
Wat
er tr
ucki
ng(b
oreh
oles
,dam
s)
Insu
ranc
e
Off
ice
runi
ng c
ost/e
xpen
se
Mai
nten
ance
and
Ren
ovat
ions
Com
mun
icat
ion
and
prin
ting
serv
ices
Ren
t exp
ense
s
Lega
l and
oth
er C
ontra
cted
Serv
ices H
ospi
talit
y
Purc
hase
of m
otor
veh
icle
Ksh
s. M
illio
ns
Major categories of O & M Expenditure
Source: Vihiga County Treasury
The aggregate expenditure on domestic and foreign travel was Kshs.118.14 million compared to Kshs.49.36 million incurred in a similar period of FY 2014/15, representing a significant increase of 139.4 per cent. The expenditure consisted of Kshs.40.94 million spent by County Executive and Kshs.77.2 million for County Assembly.
3.45.7 Development Expenditure Analysis
A summary of development expenditure during the first half of FY 2015/16 is provided in figure 3.179.
Figure 3.179: VihigaCounty, FY 2015/16 Development Expenditure for the first half, FY 2015/16
223.27
169.87
14.65 6.140
50
100
150
200
250
Other infrastructure & civilworks
Access roads Others Other capital grants andtransfers
Ksh
s. M
illio
ns
Major Categories of Development Expenditure
Source: Vihiga County Treasury

COUNTY GOVERNMENTS BUDGET IMPLEMENTATION REVIEW REPORT FIRST HALF FY, 2015/16318
Analysis of the development expenditure in the period under review indicates that Kshs.223.27 million was spent on infrastructural developments and other civil works and Kshs.169.87 million on access roads.
3.45.8 Annual Budget and Budget Performance Analysis by department for the First Half of FY 2015/16
A summary of the FY 2015/16 annual budget estimates and budget performance for the first half by department is shown in Table 3.90.
Table 3.90: Vihiga County, Annual Budget and First Half of FY 2015/16 Budget Performance by Department
DepartmentAnnual Budget
Allocation (Kshs.Million)
6 Months Ex-chequer Issues (Kshs.Million)
6 Months Expenditure
(Kshs.Million)
Expenditure to Exchequer
Issues (%)
Expenditure to Annual Budget
(%)
Rec Dev Rev Dev Rec Dev Rev Dev Rev Dev
Agriculture, Livestock, Fisheries& Cooperative Development 130.13 29.25 64.3
- 43.23 - 67.2 - 33.2 -
Lands, Housing & Physical Planning 28.33 34.05 14.27 - 5.08 - 35.6 - 17.9 -
Transport & Infrastructure 55.88 251.08 29.92 - 12.91 169.87 43.1 - 23.1 67.7
Industrialization, Trade & Tourism 25.7 66.4 12.94 - 3.53
3.89 27.3 - 13.7 5.9
Health Services 738.67 381.21 370.41 - 235.49
5.00 63.6 - 31.9 1.3
Education, Science & Technology 114.13 288.8 57.14 - 5.29
50.08 9.3 - 4.6 17.3
County Executive 242.09 50.0 120.44 - 132.96 2.56 110.4 - 54.9 5.1
County Assembly 669.13 103 248.8 - 262.42
9.0 105.5 - 39.2 8.7
County Treasury 129.54 509.89 65.13 200 66.08 158.96 101.5 79.5 51.0 31.2
Public Service Board 54.32 0 27.34 - 10.25 - 37.5 - 18.9 -
Public Service & Administration 225.19 6.4 113.03 - 78.23 - 69.2 - 34.7 -
Gender, Culture, Youth & Sport 49.7 70.9 25.02 - 13.71 14.64 54.8 - 27.6 20.6
Environment, Natural Resources, Water & Forestry 73.37 40.6 36.78
- 7.61 - 20.7 - 10.4 -
Total 2,536.18 1,831.58 1,185.52 200 876.78 414.01 74.0 207.0 34.6 22.6
Source: Vihiga County Treasury
Analysis of expenditure by department shows that the County Executive attained the highest absorption rate for recurrent expenditure at 54.9 per cent while the Department of Education, Science and Technology recorded the lowest at 4.9 per cent. On the other hand, Transport & Infrastructure reported the highest absorption rate for development activities at 67.6 per cent.

COUNTY GOVERNMENTS BUDGET IMPLEMENTATION REVIEW REPORT FIRST HALF FY, 2015/16 319
3.45.9 Borrowing by the County Government
Article 212 of the Constitution requires a county government to borrow with approval from the County Assembly, and only if the national government guarantees the loan. Further, Section 58 of the PFM Act 2012, gives the Cabinet Secretary to the National Treasury the powers to guarantee loans subject to approval by Parliament. During the period under review, the County utilized equitable share and local revenue collection deposited into the County Revenue Fund maintained at the Central Bank of Kenya and did not borrow any funds.
1.1.9 Observations and Recommendations
During the period under review, the County has made progress in addressing challenges previously identified as affecting budget implementation. The County has;
i. Factored pending bills in the supplementary budget.
ii. Adopted of E-procurement system in processing and procurement of county’s goods and services.
Despite the progress made, the following challenge continued to hamper effective budget implementation:
1. Spending of local revenue at source in contravention of the Constitution.
The County should implement the following recommendation in order to improve budget execution.
1. The County should comply with Article 207 of the Constitution and Section 109 of the PFM Act 2012 on banking of locally generated revenue.
3.46 Wajir County
3.46.1 Overview of the FY 2015/16 Budget
The FY 2015/16 Supplementary budget for Wajir County was Kshs.8.14 billion with Kshs.3.73 billion (45.8 per cent) allocated for recurrent expenditure and Kshs.4.41 billion (54.2 per cent) for development expenditure.
To finance the budget, the County expects to receive Kshs.7.23 billion (88.8 per cent) as transfers from the National Government, Kshs.200.00 million (2.4 per cent) from local revenue sources, a conditional grant of Kshs.20.09 million (0.2 per cent) from DANIDA, Kshs.16.37 million (0.19 per cent) million from World Bank, and Kshs.670.51 million (8.2per cent) as cash balance brought forward from FY 2014/15.The County did not budget for the additional conditional grants comprising of Kshs.50.29 million for Free maternal Health care, Kshs.15.43 million for Compensation for user fees forgone, Kshs.95.75 million for Leasing of Medical Equipment and Kshs.54.80 million from the road maintenance fuel levy fund.
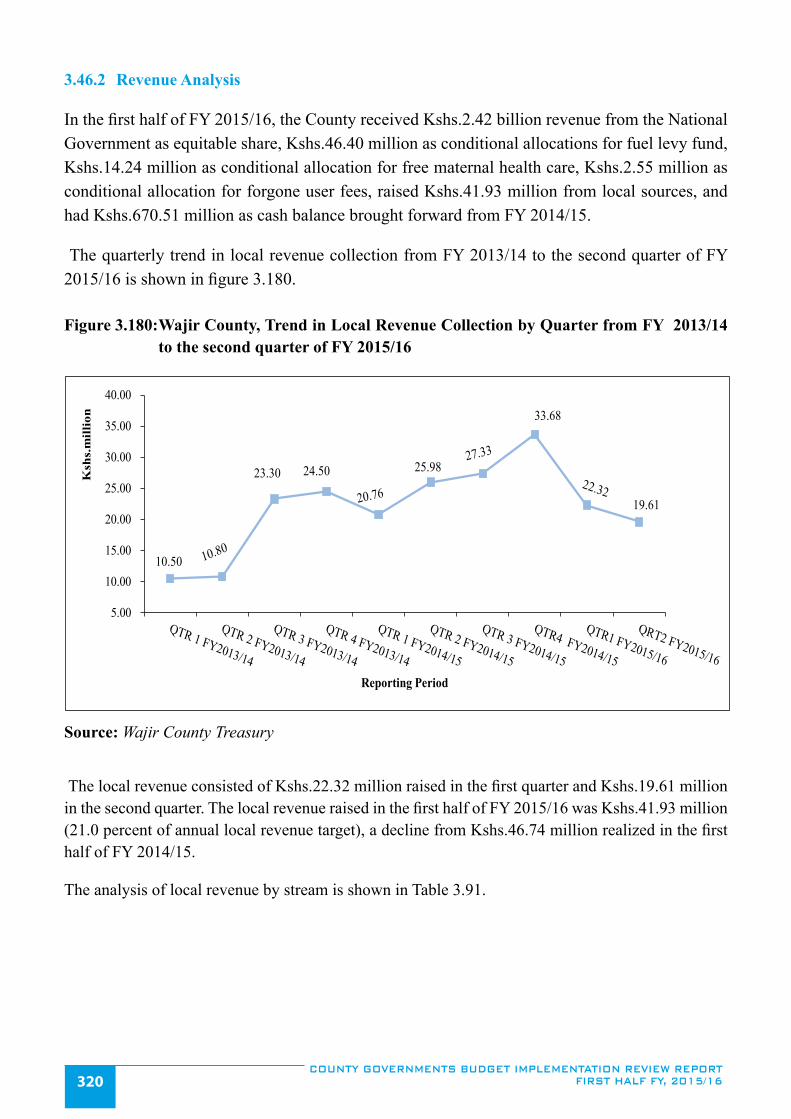
COUNTY GOVERNMENTS BUDGET IMPLEMENTATION REVIEW REPORT FIRST HALF FY, 2015/16320
3.46.2 Revenue Analysis
In the first half of FY 2015/16, the County received Kshs.2.42 billion revenue from the National Government as equitable share, Kshs.46.40 million as conditional allocations for fuel levy fund, Kshs.14.24 million as conditional allocation for free maternal health care, Kshs.2.55 million as conditional allocation for forgone user fees, raised Kshs.41.93 million from local sources, and had Kshs.670.51 million as cash balance brought forward from FY 2014/15.
The quarterly trend in local revenue collection from FY 2013/14 to the second quarter of FY 2015/16 is shown in figure 3.180.
Figure 3.180: Wajir County, Trend in Local Revenue Collection by Quarter from FY 2013/14 to the second quarter of FY 2015/16
10.50
23.30 24.50 25.98
33.68
19.61
5.00
10.00
15.00
20.00
25.00
30.00
35.00
40.00
Ksh
s.m
illio
n
Reporting Period
Source: Wajir County Treasury
The local revenue consisted of Kshs.22.32 million raised in the first quarter and Kshs.19.61 million in the second quarter. The local revenue raised in the first half of FY 2015/16 was Kshs.41.93 million (21.0 percent of annual local revenue target), a decline from Kshs.46.74 million realized in the first half of FY 2014/15.
The analysis of local revenue by stream is shown in Table 3.91.

COUNTY GOVERNMENTS BUDGET IMPLEMENTATION REVIEW REPORT FIRST HALF FY, 2015/16 321
Table 3.91: Wajir County, Analysis of revenue collection per stream for the first half of FY 2015/16
No. Revenue Stream Six Months Actual Revenue (Kshs.) Revenue Performance (%)
A B C=*100
1 Miraa cess 10,085,550, 24.05
2 Hire of County Asset 5,984,200 14.27
3 Stock Auction 5,371,100 12.81
4 Cost sharing 5,067,597 12.08
5 Building Material 3,270,370 7.8
6 Single Business permit 1,916,600 4.57
7 Cereals 1,798,825 4.29
8 Water 1,555,000 3.71
9 Stock Export 1,370,810 3.26
10 Land Rent 1,256,400, 2.99
11 Septic Tank 1,005,120 2.39
12 Other source 3,246,118 7.74
Total 41,927,690 21.00
Source: Wajir County Treasury
Note: The County did not set revenue target by stream and hence the percentage of revenue stream is on the total revenue collected.
The analysis of revenue by stream indicates that Miraa Cess registered the highest performance against the total revenue collected at 24.05 per cent, followed by Hire of County asset at 14.27 per cent.
3.46.3 Exchequer Issues
During the period under review, the COB authorises withdrawal of Kshs.3.06 billion from the CRF account, which was 37.59 per cent of the approved Supplementary Budget, an increase from Kshs.2.83 billion authorised in the same period of FY 2014/15 depicting an increase of 8.1 per cent. The amount consisted of Kshs.1.47 billion (48.0 per cent) for recurrent expenditure and Kshs.1.58 million (52.0 per cent) for development activities.
3.46.4 Banking of local revenue
A review of the bank statements for the revenue collection account indicates that all locally generated revenue was deposited into the CRF during the period under review. This conforms to Article 207 of the Constitution and Section 109 of the PFM Act 2012, which stipulates depositing into the CRF account all funds raised or received by or on behalf of the County Government, unless excluded by an Act of Parliament.

COUNTY GOVERNMENTS BUDGET IMPLEMENTATION REVIEW REPORT FIRST HALF FY, 2015/16322
3.46.5 Overall Expenditure Review
The County spent a total of Kshs.3.05 billion during the period under review which translates to 99.9 per cent of the funds released for operations. This is an improvement from the Kshs.2.19 billion spent in a similar period of FY 2014/15.A total of Kshs.1.47 billion (48.2 per cent) was spent on recurrent activities and Kshs.1.58 billion (51.8 per cent) on development activities. The expenditure on recurrent includes Kshs.70.1 million spent on the Bursary fund. Recurrent expenditure was 99.8 per cent of the funds released for recurrent activities while development expenditure accounted for 99.9 per cent of the fund released for development activities. The expenditure does not include commitments as at 31st December 2015 that amounted to Kshs.207.79 million for recurrent expenditure and Kshs.26.92 million for development activities.
Recurrent expenditure for the period under review represented an absorption rate of 39.5 per cent of annual recurrent budget an increase from 27.0 per cent incurred in the similar period of FY2014/15. On the other hand, development expenditure recorded an absorption rate of 35.9 per cent of annual development budget, an improvement from an absorption rate of 9.1 per cent realized in the same period of FY 2014/15.A comparison of the total expenditure between the second half of FY 2014/15 and that of FY 2015/16 is shown in Figure 3.181.
Figure 3.181: Wajir County, Expenditure by Economic Classification for First Half of FY 2014/15 and First Half of FY 2015/16
559.64403.33
1,189.10
801.11 743.25
1,582.65
0200400600800
1,0001,2001,4001,6001,800
Personnel Emoluments Operations & Maintenance Development
Ksh
s.m
illi
on
Expenditure by Economic Classification1st Half of FY 2014/15
1st Half of FY 2015/16
Source: Wajir County Treasury
3.46.6 Recurrent Expenditure Analysis
The total recurrent expenditure for the reporting period was Kshs. 1.47 billion against an annual recurrent budget of Kshs.3.73 billion. This represents 39.5 per cent of the recurrent budget. The

COUNTY GOVERNMENTS BUDGET IMPLEMENTATION REVIEW REPORT FIRST HALF FY, 2015/16 323
County spent Kshs.801.12 million (54.5 per cent) on personnel emoluments and Kshs.743.25 million (50.6 per cent) on operations and maintenance expenditure as shown in Figure 3.181. Expenditure on personnel emoluments accounted for 26.3 per cent of total expenditure and has increased significantly in half year of FY 2015/16 as compared to the similar period of FY 2014/15 when the County spent Kshs.599.6 million. The increase is attributed to annual increment of staff salary and also due to new recruitment of staff.
The County spent Kshs.15.78 million on payment of sitting allowances to the 46 MCAs plus the Speaker against an annual budget of Kshs.60.22 million. This represents an absorption rate of 26.2 per cent of the annual County Assembly sitting allowance budget, a decrease from Kshs.35.04 million spent in the similar period of FY 2014/15. The average monthly sitting allowance per MCA was Kshs.116,894 compared to SRC recommended amount of Kshs.124,800.
A breakdown of operations and maintenance expenditure for first quarter of FY 2015/16 is shown in Figure 3.182.
Figure 3.182: Wajir County, Operations and Maintenance Expenditure for the First Half of FY 2015/16
149.93
115.71
82.60 76.65
35.4426.55
17.95 16.45 16.09 15.99 14.77 12.47 10.76 8.03
020406080
100120140160
Dom
esti
c an
d F
orei
gnT
rave
l
Acq
uist
ion
of
Ass
ets
Sec
urit
y E
xpen
ses
Fue
l,oil
and
lubr
ican
ts
Mot
or v
ehic
lem
aint
enan
ce
Em
egen
cy
Cat
erin
g
Tra
inin
g
Mai
nten
ance
of
Bui
ldin
gs Ren
t
Gen
eral
sup
plie
s
Adv
erti
sing
Boa
rds
and
Com
mit
tee
Pro
fess
iona
l fee
s
Ksh
s.m
illi
on
Major Categories of O and M expenditure
Source: Wajir County Treasury
The total expenditure on domestic and foreign travel was Kshs.149.9 million compared to Kshs.88.52 million incurred over the same period of FY 2014/15 and represents an increase of 69.3 per cent. This expenditure comprised of Kshs.127.42 million for the County Executive and Kshs.22.47 million by the County Assembly.

COUNTY GOVERNMENTS BUDGET IMPLEMENTATION REVIEW REPORT FIRST HALF FY, 2015/16324
3.46.7 Development Expenditure Analysis
The details of development expenditure during the first half of FY 2015/16 are provided in figure 3.183.
Figure 3.183: Wajir County, Summary of Development Expenditure for the first half of FY 2015/16
288.41
104.5676.86 72.93 58.00 49.76 32.20 26.46 25.41 17.80
050
100150200250300350
Tar
mac
kin
g of
Waj
ir T
own
road
s
Pur
chas
e o
f bo
reho
leeq
uipm
ent
Gra
ding
and
Gra
vell
ing
ofac
cess
roa
ds
Dri
llin
g of
bo
reho
les
Fir
e E
ngin
e
Pur
chas
e o
f m
edic
al D
rugs
Co
mpl
etio
n of
Abb
atoi
r
Co
nstr
ucti
on o
f M
ega
dam
s
Pur
chas
e o
f m
edic
alE
quip
men
t
Co
nstr
ucti
on o
f C
ount
yH
ead
quar
ters
Ksh
s.m
illi
on
Major Categories of Development Expenditure
Source: Wajir County Treasury
Analysis of the development expenditure of Kshs.1.58 billion incurred in the first half of FY 2015/16 indicates that the Roads Department reported the highest expenditure of Kshs.288.41 million which was spent on tarmacking of Wajir Town roads. The Department also incurred Kshs.54.00 million on gravelling, grading and maintenance of access roads The Department of Water incurred Kshs.104.56 million on supply of borehole equipment, and Kshs.72.93 million on drilling of boreholes. Further, the County incurred Kshs.58 million on purchase of a fire engine; Kshs.32.2 million on completion of Abbatour at Elnoor; Kshs.26.46 million on construction of 3 mega dams and Kshs.17.80 million on construction of county headquarters.
3.46.8 Annual Budget and Budget Performance Analysis by department for the First Half of FY 2015/16
A summary of the FY 2015/16 annual budget estimates and budget performance for the first half by department is shown in Table 3.92.

COUNTY GOVERNMENTS BUDGET IMPLEMENTATION REVIEW REPORT FIRST HALF FY, 2015/16 325
Table 3.92: Wajir County Annual Budget and First Half of FY 2015/16 Budget performance by Department
DepartmentBudget Allocation
(Kshs. Million)
6 Months Exche-quer Issues (Kshs.
Million)
6 Months Expen-diture (Kshs.
Million)
Expenditure to exchequer
issues (%)
Absorption rate (%)
Rec Dev Rec Dev Rec Dev Rec Dev Rec Dev
Office of the Governor 414.15 0 201.3 0 215.34 0 107.0 52.0 0
Finance and Economic Planning 354.95 21.66 113.76 12 179.98 0.98 158.2 8.2 50.7 4.5
Sport & ICT 102.19 85.34 34.33 10.8 27.92 0.18 81.3 1.7 27.3 0.2
Health Services 681.25 961.59 336.08 296.66 345.67 268.5 102.9 90.5 50.7 27.9
Public Works, Roads and Transport 129.75 1177.54 35.68 686.97 51.95 743.52 145.6 108.2 40.0 63.1
County Assembly 560.33 0 214.93 0 150.51 0 70.0 26.9 0
Lands, Housing & Physi-cal planning 105.75 534.47 33.85 136 17.78 60.37 52.5 44.4 16.8 11.3
Education, Culture and Youth 223.43 325.57 79.66 74.97 39.1 99.12 49.1 132.2 17.5 30.4
WAJWASCO 54.5 71.46 21.12 0 24.88 15.99 117.8 45.7 22.4
Public Services and De-centralised Function 602.94 21 228.33 0 243.74 0 106.7 40.4 0
Trade, Industrialisation and Tourism 57.81 246.54 19.29 0 7.39 10.22 38.3 12.8 4.1
Agriculture 169.24 265.08 60.47 85.95 48.4 26.76 80.0 31.1 28.6 10.1
Energy and Environment 91.93 239.08 38.52 0 35.32 27.77 91.7 38.4 11.6
Water, sanitation & Natu-ral Resources 147.58 1132.24 48.43 280.6 75.63 355.21 156.2 126.6 51.2 31.4
County Public Services 32.9 0 11.83 0 10.74 0 90.8 32.6
Total 3728.66 4411.04 1477.58 1583.94 1474.36 1582.65 99.8 99.9 39.5 35.9
Source: Wajir County Treasury
Analysis of expenditure by departments shows that the Department of Public Works, Roads and Transport had highest absorption rate of its annual development budget at 63.1 per cent, while the Public Services and Decentralised Functions Department did not incur any development expenditure. The Office of the Governor recorded the highest percentage of its recurrent expenditure to its recurrent budget at 52.0 per cent while the Department of Trade, Industrialisation and Tourism had the lowest percentage of its recurrent expenditure to its recurrent budget at 12.8 per cent.

COUNTY GOVERNMENTS BUDGET IMPLEMENTATION REVIEW REPORT FIRST HALF FY, 2015/16326
3.46.9 Borrowing by the County Government
Article 212 of the Constitution requires a county government to borrow with approval from the County Assembly, and only if the national government guarantees the loan. Further, Section 58 of the PFM Act 2012, gives the Cabinet Secretary to the National Treasury the powers to guarantee loans subject to approval of parliament. During the period under review, the County utilized its equitable share and own local revenue collection deposited into the County Revenue Fund account maintained at the Central Bank of Kenya and did not borrow any funds.
3.46.10 Observations and Recommendations
The County has made progress in addressing the challenges previously identified as affecting budget implementation. The County has:
i. Ensured timely submission of financial reports.
Despite the progress made, the following challenge continued to hamper effective budget implementation;
1. Delay in disbursement of funds from the National Treasury which affected implementation of budgeted activities.
The County should implement the following recommendation in order to improve budget execution;
1. The County Treasury should liaise with the National Treasury to ensure disbursement of the equitable share to the County Revenue Fund is in line with the approved disbursement schedule.
3.47 West Pokot County
3.47.1 Overview of the FY 2015/16 Budget
The FY 2015/16 approved budget for West Pokot County amounted to Kshs.4.73 billion. It comprised of Kshs.2.95 billion (62.3 per cent) allocated to recurrent expenditure and Kshs.1.78 billion (37.7 per cent) to development expenditure.
In order to finance the budget, the County expects to receive Kshs.4.28 billion (90.6 per cent) as transfers from the National Government, collect Kshs.227.31 million (4.8 per cent) from local sources, receive conditional grant of Kshs.12.18 million (0.3 per cent) from DANIDA and conditional allocations of Kshs.203.75 million (4.3 per cent) from the National Government which include Kshs.41.26 million for Free Maternal Health Care, Kshs.11.95 million for Compensation for Forgone user fees, Kshs.95.74 million for Leasing of Medical Equipment and Kshs.54.8 million from the road maintenance fuel levy. However, the County did not factor in the FY 2015/16 budget opening cash balance from FY 2014/15 amounting to Kshs.200.93 million. Further, the County did not budget for the additional conditional grants of Kshs.15.8 million from the World Bank as contained in CARA, 2015.

COUNTY GOVERNMENTS BUDGET IMPLEMENTATION REVIEW REPORT FIRST HALF FY, 2015/16 327
3.47.2 Revenue Analysis
In the first half of FY 2015/16, the County received Kshs.1.83 billion from the National Government as equitable share, Kshs.6.09 million as conditional grant from DANIDA, Kshs.2.47 million as conditional allocation for forgone user fees, Kshs.18.26 million as conditional allocations for free maternal healthcare, Kshs.27.67 million as conditional allocations from the road maintenance fuel levy fund, raised Kshs.47.23 million from local sources, and had a cash balance of Kshs.200.93 million brought forward from FY 2014/15.
The quarterly trend in local revenue collection from the FY 2013/14 to the second quarter of FY 2015/16 is shown in figure 3.184.
Figure 3.184: West Pokot County, Trend in Local Revenue Collection by Quarter from the FY 2013/14 to the second quarter of FY 2015/16
12.817.82
29.5122.31
30.14
21.6525.58
0
5
10
15
20
25
30
35
Ksh
s.M
illio
n
Reporting Period
Source: West Pokot County Treasury
The local revenue consisted of Kshs.21.65 million raised in the first quarter and Kshs.25.58 million in the second quarter. The local revenue raised in the first half of the FY 2015/16 was Kshs.47.23 million (25.3 per cent of the annual local revenue target), and a marginal decline from Kshs.48.18 million collected in a similar period of FY 2014/15.
Table 3.93 provides analysis of the local revenue by stream.

COUNTY GOVERNMENTS BUDGET IMPLEMENTATION REVIEW REPORT FIRST HALF FY, 2015/16328
Table 3.93: West Pokot County, Analysis of revenue collection per stream for the first half of FY 2015/16
NO. Revenue Stream Annual Targeted Receipts
Six Months
Actual Revenue KshsRevenue Performance (%)
A B C D=C/B*100
1 Royalties 30,000,000 14,248,410 47.5
2 Livestock Cess 12,000,000 4,108,330 34.2
3 Other Cess 8,000,000 2,465,875 30.8
4 Health (cost sharing) 40,000,000 10,398,975 26.0
5 Single business permits 16,000,000 1,152,250 7.2
6 Lands rates 80,908,244 314,750 0.4
7 Other fees/ charges 40,400,000 14,541,251 36.0
TOTAL 186,908,244 47,229,841 25.3
Source: West Pokot County Treasury
Analysis of revenue by stream indicates that Royalties generated the highest performance of revenue against annual target at 47.5 per cent followed by stock at 34.2 per cent.
3.47.3 Exchequer Issues
During the period under review, the COB authorized withdrawal of Kshs.1.69 billion from the CRF account, which was 35.6 per cent of the approved budget. The amount represented a decline of 10.1 per cent from Kshs.1.88 billion authorized in a similar period of FY 2014/15 and consisted of Kshs.1.14 billion (67.4 per cent) for recurrent expenditure and Kshs.555 million (32.6 per cent) for development activities.
3.47.4 Banking of local revenue
A review of the bank statements of the revenue collection account indicates that all locally generated revenue was deposited into the CRF during the period under review. This conforms to Article 207 of the Constitution and Section 109 of the PFM Act 2012, which stipulates that all funds raised or received by or on behalf of the County Government shall be deposited into the CRF account unless excluded by an Act of Parliament.
3.47.5 Overall Expenditure Review
The County spent a total of Kshs.1.69 billion during the first half of FY 2015/16 which was 100.4 per cent of the funds released for recurrent and development expenditure. This is a reduction from the Kshs.1.80 billion spent in a similar period of FY 2014/15. A total of Kshs.1.07 billion was spent on recurrent activities and Kshs.624.56 million on development activities. Recurrent expenditure was 94.0 per cent of the funds released for recurrent activities while development expenditure accounted

COUNTY GOVERNMENTS BUDGET IMPLEMENTATION REVIEW REPORT FIRST HALF FY, 2015/16 329
for 113.6 per cent of the funds released for development activities. The expenditure excludes commitments as of 31st December, 2015 that amounted to Kshs.241.94 million for development expenditure and Kshs.59.36 million for recurrent expenditure.
Recurrent expenditure for the period under review represented 36.2 per cent of the approved annual recurrent budget, a decrease from 45 per cent spent in a similar period of FY 2014/15. On the other hand, development expenditure recorded an absorption rate of 35.1 per cent, a decrease from 39.1 per cent spent in a similar period of FY 2014/15. A comparison of the total expenditure between the first half of FY 2014/15 and first half of FY 2015/16 is shown in Figure 3.185.
Figure 3.185: West Pokot County, Expenditure by Economic Classification for First Half of FY 2014/15 and FY 2015/16
661.20
415.20
721.50 724.75
342.28
624.56
200.00
300.00
400.00
500.00
600.00
700.00
800.00
Personnel Emoluments Operations and Maintenance Development expenditure
Ksh
s.Mill
ion
Expenditure by Economic Classification
1st half of FY 2014/15
1st half of FY 2015/16
Source: West Pokot County Treasury
3.47.6 Recurrent Expenditure Analysis
The total recurrent expenditure for the reporting period was Kshs.1.07 billion against an annual recurrent budget of Kshs.2.95 billion. This represents 36.2 per cent of the annual recurrent budget. The County spent Kshs.724.75 million (67.9 per cent) on personnel emoluments and Kshs.342.28 million (32.1 per cent) on operations and maintenance as shown in Figure 3.185. Expenditure on personnel emoluments accounted for 42.8 per cent of total expenditure and has increased significantly in the first half of FY 2015/16 as compared to a similar period of FY 2014/15 when the County spent Kshs.661.2 million.
The County spent Kshs.26.63 million on sitting allowances to the 32 MCAs and the Speaker against an annual budget of Kshs.54.29 million. This represents an increase from Kshs.23.21 million recorded in a similar period of FY 2014/15. The average monthly sitting allowance per MCA was Kshs.134,487 compared to SRC’s recommended monthly ceiling of Kshs.124,800.
A breakdown of the operations and maintenance expenditure for the reporting period is shown in Figure 3.186.

COUNTY GOVERNMENTS BUDGET IMPLEMENTATION REVIEW REPORT FIRST HALF FY, 2015/16330
Figure 3.186: West Pokot County, Operations and Maintenance Expenditure for the first half of FY 2015/16
95.26
45.3527.68 26.63 21.91 20.78 20.00 18.26 18.06 15.66 9.68 7.85 7.80 7.02
0.00
20.00
40.00
60.00
80.00
100.00
120.00
Dom
estic
& F
orei
gn T
rave
l
Spec
ialis
ed M
ater
ials
&Su
pply
Fuel
,Oil
& L
ubric
ants
MCA
Sitt
ing
Allo
wan
ces
Oth
er O
pera
ting
Expe
nses
Disa
ster M
anag
emen
t Fun
d
Burs
eryF
und
Hos
pita
lity
Supp
lies &
Serv
ices
Trai
ning
Exp
ense
s
Oth
ers
Rout
ine m
aint.
Of m
/veh
icle
s
Inte
r/Int
ra G
over
nmen
tal
Coor
dina
tion
Prin
ting
& A
dver
tisin
g
Gen
eral
Offi
ce S
uppl
ies
Ksh
s. M
illio
ns
Major categories of O & M expenditure
Source: West Pokot County Treasury
The aggregate expenditure on domestic and foreign travel was Kshs.95.26 million compared to Kshs.72.85 million incurred in a similar period of FY 2014/15, representing an increase of 30.8 per cent. This expenditure comprised of Kshs.65.88 million spent by the County Executive and Kshs.29.38 million by the County Assembly.
3.47.7 Development Expenditure Analysis
A summary of development expenditure during the first half of FY 2015/16 is provided in figure 3.187.
Figure 3.187: West Pokot County, Summary of Development Expenditure for the first half of FY 2015/16
325.15
96.51 86.2559.02
19.29 14.86 9.79 6.12 2.71 2.59 2.260.00
50.00100.00150.00200.00250.00300.00350.00
Cons
tructi
on of
Non
-resid
entia
lbu
ilding
s
Othe
r infra
strac
ture
Cons
tructi
on of
Majo
r roa
ds
Cons
tructi
on of
Acc
ess ro
ads
Purch
ase of
spec
ilised
plan
t
Cons
tructi
on of
Resi
denti
albu
ilding
s
Wate
r Sup
plies
& Se
werag
e
Cons
tructi
on of
Brid
ges
Refur
bishm
ent o
f Non
-resid
entia
lbu
ilding
s
Land
acqu
isitio
n
Reha
bilita
tion a
nd R
enov
ation
ofbu
ilding
s
Kshs
.Milli
ons
Major Categories of Development Expenditure
Source: West Pokot County Treasury

COUNTY GOVERNMENTS BUDGET IMPLEMENTATION REVIEW REPORT FIRST HALF FY, 2015/16 331
Analysis of the development expenditure in the period under review indicates that the County incurred the highest expenditure of Kshs.325.15 million on construction of non-residential buildings. This amount was spent on completion of construction of 12 units of Doctor’s flats at Kapenguria Referral Hospital; completion of construction of staff houses at various dispensaries; construction of cattle dips, completion of construction of ICU and the Casualty Wing at Kapenguria County Referral Hospital. The second highest expenditure of Kshs.96.51 million was incurred on the construction of other infrastructure which included the completion of construction of County Treasury offices; completion of construction of County Land’s offices; construction of market stalls at Bendera; construction of market shades and stalls at Makutano and Mnagei; construction of Lomut mango store; construction of Kenyao fresh produce market among others. The lowest expenditure of Kshs.2.26 million was incurred on rehabilitation and renovation of buildings.
3.47.8 Annual Budget and Budget Performance Analysis by department for the First Half of FY 2015/16
A summary of the FY 2015/16 annual budget estimates and budget performance for the first half by department is shown in Table 3.94.
Table 3.94: West Pokot County, Annual Budget and First Half of FY 2015/16 Budget Performance by Department
DepartmentBudget Allocation
(Kshs. Million)
6 Months Exche-quer Issues (Kshs.
Million)
6 Months Expen-diture (Kshs.
Million)
Expenditure to exchequer
issues (%)
Absorption rate (%)
Rec Dev Rec Dev Rec Rec Dev Rec Dev
Office of the Governor 403.78 70 141.55 40 182.8 37.66 129.1 94.2 45.3 53.8Finance and Economic Plan-ning 103.26 66.35 31.94 29.15 23.91 21.21 74.9 72.8 23.2 32
Roads, Public Works and Transport 110.86 388.89 44.08 152.15 20.54 150.69 46.6 99.0 18.5 38.7
Health and Sanitation 924.72 356.26 379.81 70 377.59 76.93 99.4 109.9 40.8 21.6Education, Communication and ICT 327.6 229.1 95.2 21.5 78.47 36.65 82.4 170.5 24 16
Agriculture and Irrigation 102.18 151.01 49.36 43 44.05 105.24 89.2 244.7 43.1 69.7Livestock, Fisheries and Veter-inary Services 113.08 107.88 43.43 49 38.97 40.64 89.7 82.9 34.5 37.7
Trade, Industry and Cooper-atives 44.35 61 18.06 18 15.44 27.03 85.5 150.2 34.8 44.3
Land, Physical Planning and Urban Development 80.18 52.07 34.11 30 24.71 12.2 72.4 40.7 30.8 23.4
Water development, Environ-ment & Natural Resources 65.03 150.05 26.77 5 21.09 44.31 78.8 886.2 32.4 29.5
Tourism, Culture, Sports, Youth and Gender Develop-ment
47.94 44 20.88 22.2 12.84 37.17 61.5 167.4 26.8 84.5
County Public Service Man-agement 208.35 30 84.76 30 55.38 65.3 0.0 26.6
- County Assembly 414.67 75 165.05 40 171.2 34.83 103.7 87.1 41.3 46.4
TOTAL 2,946.00 1,781.60 1,135.00 550 1,066.99 624.56 94.0 113.6 36.2 35.1
Source: West Pokot County Treasury

COUNTY GOVERNMENTS BUDGET IMPLEMENTATION REVIEW REPORT FIRST HALF FY, 2015/16332
Analysis of budget performance by department shows that the Department of Tourism, Culture, Sports, Youth and Gender Development reported the highest absorption rate of its development budget at 84.5 per cent while the County Public Service Management department did not incur any development expenditure. County Public Service Management did not record any absorption. On the other hand, the Office of the Governor had the highest percentage of its recurrent expenditure to its recurrent budget at 45.3 per cent while the Department of Roads, Public Works and Transport had the lowest at 18.5 per cent.
3.47.9 Borrowing by the County Government
Article 212 of the Constitution requires a county government to borrow with approval from the County Assembly, and only if the national government guarantees the loan. Further, Section 58 of the PFM Act 2012 gives the Cabinet Secretary to the National Treasury the powers to guarantee loans subject to approval by Parliament. During the period under review, the County utilized its equitable share and own local revenue collection deposited into the County Revenue Fund account maintained at the Central Bank of Kenya
3.47.10 Observations and Recommendations
The County has made progress in addressing the challenges previously identified as affecting budget implementation. The County has:
i. Enacted revenue bills to facilitate smooth revenue collection.
ii. Built the capacity of technical staff through training.
iii. Fully embraced the use of IFMIS in processing financial transactions.
iv. Embraced the use of E-procurement to facilitate procurement of goods and services.
Despite the progress made, the following challenges continued to hamper effective budget implementation;
1. Low revenue collection, which stood at 25.3 per cent of the annual local revenue target. Property rates as a revenue source generated a paltry Kshs.0.31 million against an annual target of Kshs.80.91 million.
2. Although the County established various County Public Funds in line with Section 116 of the PFM Act 2012, it failed to provide financial statements of the same on a quarterly basis as required by Section 167 and 168 of the PFM Act 2012.
3. The County incurred an expenditure of Kshs.20.78 million with commitments of Kshs.4.08 million on the Disaster Fund and Kshs.20 million on Bursary Fund without enacting regulations to operationalize the Funds.
4. Inconsistencies between the IFMIS generated expenditure returns report on Personnel Emoluments

COUNTY GOVERNMENTS BUDGET IMPLEMENTATION REVIEW REPORT FIRST HALF FY, 2015/16 333
(PE) and the actual payroll. IFMIS report indicated PE of Kshs.724.64 million while the actual payroll indicated Kshs.666.27 million. On the other hand, IFMIS generated expenditure returns report on MCAs Sitting Allowances indicated Kshs.26.62 million while the actual listing of MCAs sitting allowances indicated Kshs.24.95 million.
The County should implement the following recommendations in order to improve budget execution;
1. The County Treasury should come up with measures to improve local revenue performance.
2. The County should provide financial statements of County Established Funds on a quarterly basis in line with section 168 of the PFM Act 2012.
3. The County Treasury should ensure that regulations for administering the Disaster Fund and any other fund established by the County are prepared and approved by the County Assembly.
4. The County should ensure that reconciliation of the returns generated from IFMIS is undertaken regularly.

COUNTY GOVERNMENTS BUDGET IMPLEMENTATION REVIEW REPORT FIRST HALF FY, 2015/16334
4.0 KEY CHALLENGES AND RECOMMENDATIONS
During the first half of FY 2015/16, budget implementation by the counties was faced by a number of challenges. This section highlights the pertinent challenges that negatively affected budget implementation. Recommendations aimed at addressing the issues and ultimately improving budget implementation by the County Governments are also provided.
4.1 Unprocedural Borrowing by the Counties
The Constitution of Kenya, 2010 grants revenue raising powers to Counties, which include borrowing. Article 212 requires a county government to borrow with approval from the County Assembly, and only if the national government guarantees the loan.
During the reporting period, it was noted that some Counties borrowed from commercial banks without guarantee from the National Treasury. There were also instances where, some counties borrowed without obtaining approval from the County Assembly.
It is recommended that Counties should regularize the current levels of borrowing by obtaining approval from the County Assemblies and guarantee from the National Treasury as necessary. All future borrowing must adhere to the provisions of Article 212 of the Constitution and Section 58 of the PFM Act 2012.
4.2 Inadequate Administration and Reporting on Public Funds Established by the Counties
Section 116 of the PFM, Act, 2012 provides for the establishment of County Public Funds. Each Fund should be managed by an administrator, who is required to submit quarterly financial reports to the County Treasury and the Controller of Budget in line with Section 168 of the PFM Act, 2012.
During the reporting period, the office noted that some counties had not designated administrators for established public funds rendering operationalization, administration and accounting for the funds difficult. Besides, some counties had not delinked Fund operations from their main county operations while others delayed or did not submit quarterly financial reports as required by Section 168 of the PFM Act, 2012.
It is recommended that all established county public funds be managed by a designated administrator who should prepare quarterly financial reports in line with Section 168 of the PFM Act, 2012.
4.3 Low Local Revenue Collection by the Counties
Article 209(3) of the Constitution grants powers to County Governments to impose taxes and charges, which include; property rates, entertainment taxes and any other tax that is authorized by an Act of

COUNTY GOVERNMENTS BUDGET IMPLEMENTATION REVIEW REPORT FIRST HALF FY, 2015/16 335
Parliament. In FY 2015/16 the Counties estimated to generate Kshs.56.65 billion.
During the first half of FY 2015/16 the counties generated a total of Kshs.13.92 billion, which was 24.6 per cent of the annual target against an expected performance of 50 per cent for the half year. Most counties reported decline in revenue collection for the first half of FY 2015/16 as compared to a similar period in FY 2014/15. This implied that counties experienced delay in implementing budgeted activities due to lack of funds while others continued to accumulate pending bills.
We recommend that the Counties should develop strategies to enhance local revenue collection.
4.4 Persistent Use of Locally Generated Revenue at Source
Article 209(3) of the Constitution grants powers to County governments to impose taxes and charges, which include; property rates, entertainment taxes and any other tax that is authorized by an Act of Parliament. The County governments are required by Article 207 of the Constitution to deposit all money raised or received by or on behalf of the County government into the County Revenue Fund except money reasonably excluded by an Act of Parliament.
During the reporting period, the Office noted that a number of County governments have continued to violate the requirement to deposit all locally generated revenue into the County Revenue Fund. Instead, they have been spending the revenue at source.
All Counties should deposit all locally generated revenue into the County Revenue Fund Account as required by Article 207 of the Constitution.
4.5 Inadequate monitoring of development projects
A number of County Governments have not established a development projects database to effectively monitor development projects. Some Counties are yet to develop and implement effective M&E frameworks which are key in ensuring effective implementation of development projects.
In order to ensure that Counties achieve their developmental goals, we recommend that they develop and implement robust M&E frameworks in order to monitor development projects.
4.6 Revenue not captured in County Budgets
During the period under review, some Counties had not budgeted for all the conditional grants as contained in the CARA 2015. This includes the World Bank loan and grants, compensation for forgone user fees, allocations for free maternal health care and conditional allocation from the Road Maintenance Fuel Levy Fund. This is partly due to the delay in the enactment of the CARA, 2015 and the inability of Counties to make supplementary budgets in timely manner.
It is recommended that counties should pass supplementary budgets to capture all revenue for compensation for forgone user fees, allocations for free maternal health care, conditional allocation from the Road Maintenance Fuel Levy Fund as provided for in CARA, 2015.

COUNTY GOVERNMENTS BUDGET IMPLEMENTATION REVIEW REPORT FIRST HALF FY, 2015/16336
4.7 Inadequate Internal Audit Function and Audit Committees
Section 155 of the PFM Act 2012, requires that each County Government establishes an internal audit arrangement including the establishment of an internal audit committee. This is intended to enhance management controls, and, transparency and accountability in the management of public resources.
The OCOB continues to note that this issue has not been fully addressed by all counties despite having been raised in previous reports. It is therefore recommended that the Counties should ensure compliance with Section 155 of the PFMA Act 2012, which provides for the establishment of an internal audit function.

COUNTY GOVERNMENTS BUDGET IMPLEMENTATION REVIEW REPORT FIRST HALF FY, 2015/16 337
5.0 CONCLUSION
This report is part of the series of Budget Implementation Review Reports issued by the Office of the Controller of Budget on a quarterly basis. It provides an overview of the revenue and expenditure performance in the counties and the challenges facing budget implementation during the period between July to December 2015. The report has noted the progress made by the Counties in budget implementation and also identified the challenges that faced budget implementation.
During the first six months of FY 2015/16, local revenue collection improved marginally to Kshs.13.92 billion (24.6 per cent of annual target) from Kshs.13.08 billion (21.0 per cent of the annual target) reported in a similar period in FY 2014/15. This improvement has been attributable to automation of revenue collection and enhanced capacity of the revenue collection staff, but still remains below the expected half year target of 50 per cent. Overall revenue performance, including National Government transfers was Kshs.150.10 billion (41.3 per cent of the annual target) as compared to Kshs.136.96 billion (42.8 per cent of annual target) in the first half of FY 2014/15.
The aggregate expenditure by the counties was Kshs.113.43 billion which represents an absorption rate of 31.3 per cent of the total annual county governments’ budget. This was a decline in performance as compared to a similar period in FY 2014/15 when the absorption rate was 32.4 per cent or an aggregate expenditure of Kshs.103.70 billion. Recurrent expenditure was Kshs.81.08 billion, representing a performance of 40.4 per cent of the annual recurrent budget, which was similar to the first half performance in FY 2014/15 performance. On the other hand, aggregate development expenditure was Kshs.32.35 billion, representing an absorption rate of 19.9 per cent, a decline from 21.9 per cent attained in a similar period of FY 2014/15.
The report identifies the challenges that affected budget implementation during the reporting period. They included; unprocedural borrowing by the counties, inadequate administration and reporting on public funds established by the counties, low local revenue collection, persistent use of local revenue at source, inadequate monitoring of development projects, revenue not capture in budget and inadequate internal audit arrangements. Appropriate recommendations have been made to address the challenges. We encourage the relevant officers at the Counties to implement the recommendations so as to ensure effective budget implementation in the future.
COUNTY GOVERNMENTS BUDGET IMPLEMENTATION REVIEW REPORT FIRST HALF FY, 2015/16338
NOTES
Bima House, 12th FloorHarambee AvenueP. O. Box 35616 - 00100 Nairobi, KenyaTel: +254 (0) 20 318939, 2211056Fax: +254 (0) 20 2211920Email: [email protected]: www.cob.go.ke
REPUBLIC OF KENYA
MARCH, 2016
FIRST HALF
FY 2015/16
OFFICE OF THE CONTROLLER OF BUDGET
COUNTY GOVERNMENTSBUDGET IMPLEMENTATION REVIEW REPORT

COUNTY GOVERNMENTS BUDGET IMPLEMENTATION REVIEW REPORT FIRST HALF FY, 2015/16 339
Bima House, 12th FloorHarambee AvenueP. O. Box 35616 - 00100 Nairobi, KenyaTel: +254 (0) 20 318939, 2211056Fax: +254 (0) 20 2211920Email: [email protected]: www.cob.go.ke
REPUBLIC OF KENYA
MARCH, 2016
FIRST HALF
FY 2015/16
OFFICE OF THE CONTROLLER OF BUDGET
COUNTY GOVERNMENTSBUDGET IMPLEMENTATION REVIEW REPORT
Related Documents