Cortical atrophy patterns associated to cognitive impairment in Parkinson’s disease Carme Uribe Codesal Aquesta tesi doctoral està subjecta a la llicència Reconeixement- NoComercial – SenseObraDerivada 4.0. Espanya de Creative Commons. Esta tesis doctoral está sujeta a la licencia Reconocimiento - NoComercial – SinObraDerivada 4.0. España de Creative Commons. This doctoral thesis is licensed under the Creative Commons Attribution-NonCommercial- NoDerivs 4.0. Spain License.

Welcome message from author
This document is posted to help you gain knowledge. Please leave a comment to let me know what you think about it! Share it to your friends and learn new things together.
Transcript

Cortical atrophy patterns associated to cognitive
impairment in Parkinson’s disease
Carme Uribe Codesal
Aquesta tesi doctoral està subjecta a la llicència Reconeixement- NoComercial – SenseObraDerivada 4.0. Espanya de Creative Commons. Esta tesis doctoral está sujeta a la licencia Reconocimiento - NoComercial – SinObraDerivada 4.0. España de Creative Commons. This doctoral thesis is licensed under the Creative Commons Attribution-NonCommercial-NoDerivs 4.0. Spain License.

Cortical atrophy patterns
associated to cognitive impairment
in Parkinson’s disease
Carme Uribe Codesal
Unitat de Psicologia Mèdica. Departament de Medicina
Facultat de Medicina i Ciències de la Salut
Universitat de Barcelona
2019

Cortical atrophy patterns associated to cognitive
impairment in Parkinson’s disease
Thesis presented by
Carme Uribe Codesal
To obtain the degree of doctor from the University of Barcelona in
accordance with the requirements of the International PhD diploma
Supervised by
Dr Carme Junqué Plaja and Dr Bàrbara Segura Fàbregas
Faculty of Medicine and Health Sciences, University of Barcelona
Medicine and Translational Research Doctoral Program
2019


[…] Tenim a penes
el que tenim i prou: l'espai d'història
concreta que ens pertoca, i un minúscul
territori per viure-la. Posem-nos
dempeus altra vegada i que se senti
la veu de tots solemnement i clara.
Cridem qui som i que tothom ho escolti.
I en acabat, que cadascú es vesteixi
com bonament li plagui, i via fora!,
que tot està per fer i tot és possible.
Miquel Martí i Pol, Ara mateix
Als Jordis, la Carme, la Dolors, el
Josep, el Joaquim, el Raül, l’Oriol, la
Meritxell i el Carles. També als que
estan a l’exili, el MHP C. Puigdemont,
la Meritxell, la Clara, el Toni i el Lluis.


Al meu pare, per ser-hi sempre encara
que faci tant que no hi és


Barcelona, 1st March 2019
Dr Carme Junqué Plaja and Dr Bàrbara Segura Fàbregas, professors at the
University of Barcelona,
CERTIFY that they have guided and supervised the doctoral thesis entitled ‘Cortical
atrophy patterns associated to cognitive impairment in Parkinson’s disease’
presented by Carme Uribe Codesal. They hereby assert that this thesis fulfils the
requirements to present her defense to be awarded the title of doctor.
Signatures,
Dr Carme Junqué Plaja Dr Bàrbara Segura Fàbregas


This thesis has been undertaken at the CJNeurolab, Neuropsicologia team. Institut
d'Investigacions Biomèdiques August Pi i Sunyer (IDIBAPS).
The present work has been financially supported by a PhD training scholarship from
the Spanish Ministry of Economy and Competitiveness and cofinanced by the
European Social Fund (BES-2014-068173). In addition, the studies were sponsored
by the Spanish Ministry of Economy and Competitiveness (PSI2013-41393-P), by
the Generalitat de Catalunya (2014SGR98, 2017SGR748) and by the Fundació La
Marató de TV3 in Catalunya (20142310).


Table of Contents
Panels, Tables and Figures......................................................................................... 15
Abbreviations ................................................................................................................ 17
Foreword ....................................................................................................................... 19
Related Academic Work .......................................................................................... 19
Introduction ................................................................................................................... 23
Distinct motor subtypes or a temporal continuum? ............................................ 24
Age of disease onset ................................................................................................ 32
Visual hallucinations ................................................................................................. 34
Cognition in PD ......................................................................................................... 37
Cognitive deficits related to PD ........................................................................... 37
Progression of cognitive decline ......................................................................... 40
PD-MCI diagnosis .................................................................................................. 42
PDD diagnosis ........................................................................................................ 44
Neuropathology of cognition in PD ..................................................................... 47
Structural MRI correlates ..................................................................................... 49
Cluster analysis techniques for the identification of PD subtypes ..................... 53
Machine learning techniques: cluster analysis ................................................. 54
Multidimensional subtypes in PD based on clinical data ................................. 58
Cluster analysis from objective MRI measurements ........................................ 70
From the case studies to big data ....................................................................... 70
Objectives and hypotheses ........................................................................................ 73
Specific objectives .................................................................................................... 73
Specific hypotheses ................................................................................................. 73
Methods ......................................................................................................................... 75
Study Samples ............................................................................................................. 75
Medicated PD sample ................................................................................................. 75
Participants at baseline (Study 1) ........................................................................... 75
Participants of the longitudinal sample over 4-years (Study 3) ......................... 76
Clinical and neuropsychological assessments. .................................................... 77
Clinical instruments to assess PD patients’ evolution ......................................... 78
MRI acquisition .......................................................................................................... 79
de novo PD sample (Study 2) .................................................................................... 79
Participants ................................................................................................................ 79
Clinical and neuropsychological assessments ..................................................... 80
MRI acquisition .......................................................................................................... 81
MCI definition ................................................................................................................ 81
For the medicated PD sample ................................................................................ 82
For the de novo PD sample ..................................................................................... 82
MRI techniques ............................................................................................................. 82
Cortical thickness preprocessing ........................................................................... 82
Longitudinal preprocessing of cortical thickness ................................................. 82
Parcellations of the cortical mantle ........................................................................ 83
Hierarchical cluster analyses ...................................................................................... 84
Statistical analysis ........................................................................................................ 84
Cortical thickness ..................................................................................................... 84
Longitudinal cortical thickness................................................................................ 85
Study 1 ....................................................................................................................... 85
Demographical and clinical measurements ...................................................... 85
Cluster evaluation .................................................................................................. 85
Study 2 ....................................................................................................................... 86
Demographical and clinical measurements ...................................................... 86
Cluster evaluation .................................................................................................. 86
Study 3 ....................................................................................................................... 86
Cross-sectional analysis of clinical measures ................................................... 86
Repeated measures analyses .............................................................................. 86
Results ........................................................................................................................... 89
Study 1 ....................................................................................................................... 89
Study 2 ..................................................................................................................... 113
Study 3 ..................................................................................................................... 131
Discussion ................................................................................................................... 169
PD cortical atrophy patterns ................................................................................. 169
PD de novo regional patterns ............................................................................ 170
PD medicated regional patterns ........................................................................ 170
Clinical manifestations underlying neuroanatomical correlates ...................... 173

Clinical progression of the patterns .................................................................. 176
Heterogeneity in PD: a matter of time or distinct symptomatologic entities? 176
Methodological implications in cluster analysis ................................................. 178
Final remarks ........................................................................................................... 179
Conclusions ................................................................................................................ 181
Abstract ....................................................................................................................... 183
Resum .......................................................................................................................... 185
Agraïments .................................................................................................................. 187
References .................................................................................................................. 189


15
Panels, Tables and Figures Panel 1.1 page 28
Panel 1.2 page 29
Panel 1.3 page 30
Panel 2 page 32
Panel 3 page 34
Panel 4 page 39
Panel 5 page 44
Panel 6 page 46
Panel 7 page 47
Panel 8 page 56
Table 1 page 31
Table 2 page 41
Table 3 page 58
Table 4 page 62
Table 5 page 78
Table 6 page 81
Figure 1 page 29
Figure 2 page 39
Figure 3 page 48
Figure 4 page 54
Figure 5 page 55
Figure 6 page 57
Figure 7 page 77
Figure 8 page 80
Figure 9 page 83

16

17
Abbreviations
AD Alzheimer’s disease
ADL activities of the daily living
ANOVA analysis of variance
APOE apoliprotein E
ASL arterial spin labeling
BDNF brain derived neurotrophic
factor
BNT Boston naming test
COMT catechol-O-
methyltransferase
CSF cerebrospinal fluid
CTh cortical thickness
CVLT California verbal learning test
DaTSCAN dopamine transporter
imaging
DRS dementia rating scale
DTI diffusion tensor imaging
ESS Epworth’s sleepiness scale
FA fractional anisotropy
FAB frontal assessment battery
FDG fluorodeoxyglucose
FWHM full width half maximum
GBA glucocerebrosidase
GBS Gottfries-Brane-Steen scale
GDS geriatric depression scale
GM gray matter
H&Y Hoehn and Yahr
HADS hospital anxiety and
depression scale
HC healthy control
HCP-MMP1.0 Human Connectome
Project multimodal parcellation
version 1.0
HVLT-R Hopkins verbal learning test
revised
ICA independent component
analysis
IQ intelligence quotient
JLO judgement of line orientation
L-DOPA levodopa, in mg/day
LEDD L-DOPA daily dose, in mg/day
MADRS Montgomery-Asberg
depression rating scale
MAO monoamine oxidase
MAPT microtubule associated
protein tau
MCI mild cognitive impairment
MD mean diffusivity
MMSE mini-mental status
examination
MoCA Montréal Cognitive
Assessment
MDS Movement Disorders Society
MRI magnetic resonance imaging
NMS non-motor symptoms scale
PCA principal component analysis
PD Parkinson’s disease

18
PDD Parkinson’s disease dementia
PET positron emission tomography
PiB Pittsburgh compound b
PIGD postural instability and gait
difficulty
PPMI Parkinson Progression Markers
Initiative
PRM pattern recognition memory
QSM quantitative susceptibility
mapping
QUIP questionnaire for impulsive-
compulsive disorder in Parkinson’s
disease
RAVLT Rey’s auditory verbal
learning test
RBDQS REM sleep behavior
questionnaire score
RD radial diffusivity
REM rapid eye movement
ROC receiver operating
characteristic
ROI region of interest
SCOPA scales for outcomes in
Parkinson’s disease
SDMT symbol digits modalities test
SNCA α-synuclein gene
SPECT single photon emission
computed tomography
STAI state-trait anxiety inventory
TBSS tract-based spatial statistics
TMT trail making test
TOL tower of London
UPDRS Unified Parkinson’s disease
rating scale
UPSIT University of Pennsylvania
smell identification test
VBM voxel-based morphometry
VDF visual form discrimination test
WM white matter
WMS Weschler memory scale

19
Foreword This thesis is presented as a compendium of three articles to obtain the degree
of Doctor by the University of Barcelona. It is part of the results of five-years work
at the Medical Psychology Unit of the Department of Medicine, Faculty of
Medicine and Health Sciences. Two of the papers have been published in peer-
reviewed journals and the third study is currently under review:
1. Uribe, C.*, Segura, B.*, Baggio, H. C., Abos, A., Marti, M. J., Valldeoriola, F.,
Compta, Y., Bargallo, N., Junque, C. (2016). Patterns of cortical thinning in
nondemented Parkinson’s disease patients. Movement Disorders, 31(5), 699–
708. https://doi.org/10.1002/mds.26590.
IF(2016): 7.072. Q1 in Clinical Neurology.
2. Uribe, C., Segura, B., Baggio, H. C., Abos, A., Garcia-Diaz, A. I., Campabadal,
A., Marti, M.J., Valldeoriola, F., Compta, C., Tolosa, E., Junque, C. (2018). Cortical
atrophy patterns in early Parkinson’s disease patients using hierarchical cluster
analysis. Parkinsonism and Related Disorders, 50, 3–9.
https://doi.org/10.1016/j.parkreldis.2018.02.006.
IF(2017): 4.721. Q1 in Clinical Neurology.
3. Uribe, C.*, Segura, B.*, Baggio, H. C., Abos, A., Garcia-Diaz, A.I., Campabadal,
A., Marti, M. J., Valldeoriola, F., Compta, Y., Bargallo, N., Junque, C. Progression
of Parkinson’s disease patients subtypes based on cortical thinning: 4-year follow-
up. Under review.
Related Academic Work
List of additional publications of the candidate that are not included in the thesis.
These papers are the result of the work in the Parkinson's disease project and
other collaborative work during the period of pre-doctoral research position.
Campabadal, A.*, Uribe, C.*, Segura, B., Baggio, H. C., Abos, A., Garcia-Diaz, A.
I., Marti, M.J., Valldeoriola, F., Compta, Y., Bargallo, N., Junque, C. (2017). Brain
correlates of progressive olfactory loss in Parkinson’s disease. Park. Relat. Disord.
41, 44–50. https://doi.org/10.1016/j.parkreldis.2017.05.005.
Uribe, C., Segura, B., Baggio, H. C., Abos, A., Garcia-Diaz, A. I., Campabadal, A.,
Marti, M.J., Valldeoriola, F., Compta, Y., Bargallo, N., Junque, C. (2018).
Gray/White matter contrast in Parkinson’s disease. Frontiers in Aging
Neuroscience, 10, 89. https://doi.org/10.3389/fnagi.2018.00089.
Uribe, C., Segura, B., Baggio, H. C., Campabadal, A., Abos, A., Compta, Y., Marti,
M.J., Valldeoriola, F., Bargallo, N., Junque, C. (2018). Differential Progression of
Regional Hippocampal Atrophy in Aging and Parkinson’s Disease. Frontiers in
Aging Neuroscience, 10, 325. https://doi.org/10.3389/fnagi.2018.00325.

20
Uribe, C.*, Puig-Davi, A.*, Abos, A., Baggio, H. C., Junque, C., Segura, B. (2019).
Neuroanatomical and functional correlates of cognitive and affective empathy in
young healthy adults. Frontiers in Behavioral Neuroscience.
https://doi.org/10.3389/fnbeh.2019.00085.
Uribe, C., Junque, C., Gomez-Gil, E., Abos, A., Mueller, S. C., Guillamon, A.
(2019). Brain network interactions in transgender persons. Under review.
Garcia-Diaz, A. I., Segura, B., Baggio, H. C., Marti, M. J., Valldeoriola, F., Compta,
Y., Bargallo, N., Uribe, C., Campabadal, A., Abos, A., Junque, C. (2017).
Structural brain correlations of visuospatial and visuoperceptual tests in
Parkinson’s disease. J. Int. Neuropsychol. Soc. 17, 1–12.
https://doi.org/10.1017/S1355617717000583.
Garcia-Diaz, A. I., Segura, B., Baggio, H. C., Uribe, C., Campabadal, A., Abos, A.,
Marti, M.J., Valldeoriola, F., Compta, Y., Bargallo, N., Junque, C. (2018). Cortical
thinning correlates of changes in visuospatial and visuoperceptual performance
in Parkinson’s disease: A 4-year follow-up. Parkinsonism and Related Disorders,
46, 62–68. https://doi.org/10.1016/j.parkreldis.2017.11.003.
Campabadal, A., Segura, B., Baggio, H. C., Abos, A., Uribe, C., Garcia-Diaz, A. I.,
Marti, M.J., Valldeoriola, F., Compta, Y., Bargallo, N., Junque, C. (2018).
Diagnostic Accuracy, Item Analysis and Age Effects of the UPSIT Spanish Version
in Parkinson’s Disease. Arch. Clin. Neuropsychol.
https://doi.org/10.1093/arclin/acy053.
Baggio, H. C.*, Abos, A.*, Segura, B., Campabadal, A., Garcia-Diaz, A., Uribe, C.,
Compta, Y., Marti M.J., Valldeoriola, F., Junque, C. (2018). Statistical inference in
brain graphs using threshold-free network-based statistics. Hum. Brain Mapp. 39,
2289–2302. https://doi.org/10.1002/hbm.24007.
Baggio, H.C.*, Abos, A.*, Segura, B., Campabadal, A., Uribe, C., Giraldo, D.,
Perez-Soriano, A., Munoz, E., Compta, Y., Junque, C., Marti, M.J. (2019)
Cerebellar resting-state functional connectivity in Parkinson's disease and
multiple system atrophy: characterization of abnormalities and potential for
differential diagnosis at the single-patient level. Neuroimage Clinical. 22, 101720.
https://doi.org/10.1016/j.nicl.2019.101720.
Abos, A., Baggio, H.C., Segura, B., Campabadal, A., Uribe, C., Giraldo, D., Perez-
Soriano, A., Munoz, E., Compta, Y., Junque, C., Marti, M.J. (2019) Probabilistic
tractography for the characterization of white matter abnormalities and
discrimination of multiple system atrophy from Parkinson’s disease. Under review.
Campabadal, A., Segura, B., Junque, C., Serradell, M., Abos, A., Uribe, C.,
Baggio, H.C., Gaig, C., Santamaria, J., Compta, Y., Bargallo, N., Iranzo, A. (2019)
Cortical gray matter and hippocampal atrophy in idiopathic Rapid Eye Movement
sleep behavior disorder. Frontiers in Neurology.

21
https://doi.org/10.3389/fneur.2019.00312.
Campabadal, A., Segura, B., Junque, C., Serradell, M., Abos, A., Uribe, C.,
Baggio, H.C., Gaig, C., Santamaria, J., Bargallo, N., Iranzo, A. (2019) Comparing
the accuracy and neuroanatomical correlates of the UPSIT-40 and the Sniffin'
Sticks test in REM sleep behavior disorder. Under review.
Abos, A., Segura, B., Baggio, H.C., Campabadal, A., Uribe, C., Garrido, A.,
Camara, A., Muñoz, E., Valldeoriola, F., Marti, M.J., Junque, C., Compta, Y. (2019).
Disrupted structural connectivity of fronto-deep gray matter pathways in
Progressive Supranuclear Palsy. Under review.
Campabadal, A., Junque, C., Dominguez, P., Baggio, H.C., Abos, A., Uribe, C.,
Marti, M.J., Compta, Y., Valldeoriola, F., Bargallo, N., Segura, B. (2019). Brain
atrophy and cognitive dysfunction-related quality of life in Parkinson’s disease.
Under review.
* These authors contributed equally to the work.

22

23
Chapter 1
Introduction It’s been 200 years since James Parkinson published “An essay on the shaking
palsy” in 1817 and more than 100 years ago Fritz Heinrich Lewy described
inclusions located outside the substantia nigra (Goedert et al., 2013). Nowadays,
Parkinson’s disease (PD) is the second most prevalent neurodegenerative
disease and its etiology remains still unknown (Ascherio and Schwarzschild,
2016; Kalia and Lang, 2015). During the past decades, PD diagnosis has been
improved thanks to the emergence of neuroimaging techniques. Since 2011, the
FDA introduced the dopamine transporter imaging (DaTSCAN) as a diagnostic
tool for PD (Seifert and Wiener, 2013). In addition, a bunch of MRI techniques
have contributed to the elucidation of the neuroanatomical and neurofunctional
bases of clinical manifestations in PD such as cognitive impairment (Politis, 2014;
Svenningsson et al., 2012).
Classically, α-synuclein aggregates in neurons of the nigrostriatal dopaminergic
system are described as the pathological hallmark of PD. Synaptic dysfunction
would be caused by a vicious cycle of accumulating α-synuclein and dopamine
dysregulation that finally results in neurodegeneration (Dickson et al., 2009;
Goedert, 2015; Kalia and Lang, 2015); albeit this conception has revealed
insufficient. PD can no longer be considered a mono-systemic disease (Goedert
et al., 2013). As PD definition evolves to conceive the disease as multisystemic
(Thenganatt and Jankovic, 2014) with widespread brain degeneration, the study
of nonmotor symptoms has raised interest, since they are even present before
motor diagnosis (Tolosa et al., 2009, 2007).
Inasmuch as Parkinson’s disease cannot be considered a homogeneous single
entity, distinct subtypes would compose this neurodegenerative disorder (Kalia
and Lang, 2015; Thenganatt and Jankovic, 2014). Indeed, phenotypes
characterization are a matter of debate to improve PD clinical management.
Nowadays, the highest priority in the international scientific community with
respect to PD is articulated in 3 main areas: clinical research, translational and
basic research according to the National Institute of Neurological Disorders and
Stroke (Sieber et al., 2014). Translational research recommendations include the
development of patient stratification tools aiming to define disease signatures and
to obtain homogeneous cohorts from such heterogeneous diagnostic entity. The
present thesis is conceptualized in this framework.
Fifty years after James Parkinson’s essay, JM Charcot in the Salpêtrière Hospital
already suggested two different prototypes of the disease based on motor

24
characteristics: the tremor and the rigid/akinetic form (Goetz et al., 2001).
Empirical research on motor subtypes has been very prolific and motor
manifestations have been systematically reported as clinical variables in most PD
studies. An early study in the 90s followed one of the first large PD cohorts called
the DATATOP database where 800 early-untreated PD patients were enrolled
and evaluated over 2 years (Parkinson Study Group, 1989). The authors reported
two clinical disease progressions based on their motor manifestations, the tremor-
dominant subtype and the postural instability and gait difficulty (PIGD) subtype
(Jankovic et al. 1990). Another classical PD subdivision is based on the age of
disease onset and some authors even proposed that it was “the major
determinant” for disease prognosis (Hely et al., 1995). In the DATATOP cohort
data, slower disease progression was found in early-onset PD (≤ 40 years) when
compared with late-onset PD (≥ 70 years,Jankovic et al., 1990). The same authors
later reported similar findings between two groups (≤ 57 and > 57 years) in a
sample followed-up approximately over 6 years (Jankovic and Kapadia, 2001).
The interest in dividing PD patients into homogeneous groups also included the
characterization of non-motor manifestations as mild cognitive impairment (MCI,
Pagonabarraga and Kulisevsky, 2012), presence or absence of anosmia (Doty,
2012), and presence of REM disorders (St Louis et al., 2017) among others
(Schapira et al., 2017).
In the next sections, a review on PD patients’ clinical subtypes can be found.
Firstly, motor subtypes, and early- and late-onset PD characterization will be
reviewed. Thirdly, PD subtypes based on non-motor clinical manifestations will be
introduced (e.g., PD with visual hallucinations and MCI), and finally, clinical
phenotypes identified via cluster analysis techniques. In the present thesis, the
study of PD is tackled from a magnetic resonance imaging (MRI) perspective that
offers the opportunity to study both structural and functional brain changes.
Distinct motor subtypes or a temporal continuum?
The clinical diagnosis of PD requires the presence of motor cardinal signs: tremor,
rigidity, akinesia, bradykinesia or postural imbalance (Hughes et al., 1992).
Tremor can be postural, akinetic or it can be present at rest. Tremor at rest is the
most common form in PD that helps differentiate from essential tremor (Moustafa
et al., 2016). On the other hand, there is the PIGD disorder that can be
accompanied by bradykinesia and rigidity, and sometimes it is referred to as the
non-tremor phenotype (Nutt, 2016). Tremor-dominant, PIGD-dominant or
undetermined motor subtypes (Jankovic et al., 1990; Stebbins et al., 2013) can
be identified from the Unified Parkinson’s Disease Rating Scale (UPDRS) section
III (Fahn and Elton, 1987) and also from its revised version (Movement Disorder
Society Task Force on Rating Scales for Parkinson’s Disease., 2003) published
by the Movement Disorders Society (MDS).
25
The first study that subtyped 800 unmedicated PD patients from the UPDRS-III
scores was performed in the large DATATOP cohort. Jankovic et al. concluded
that patients with PIGD subtype had “malignant-PD” with a more rapid rate of
disease progression and a late-onset of the disease (Jankovic et al., 1990). PIGD
subtype has also been related to the presence of more depression symptoms
(Burn et al., 2012) and dementia (Alves et al., 2006). More interestingly, patients
with initial tremor-dominant subtype that changed to PIGD over the course of PD
were finally diagnosed with PD dementia (PDD, Alves et al., 2006).
On the other hand, tremor-dominant motor subtype has usually been reported as
a marker of slower progression (Jankovic and Kapadia 2001) and less frequency
of cognitive decline (Jankovic et al., 1990). Tremoric patients usually respond
better to L-DOPA treatment (Fishman, 2008) probably by potentiating inhibition
of the thalamus on the cerebello-thalamic-cerebral network (Dirkx et al., 2017). In
fact, Hallet in a short communication pointed out that it is rather important the
involvement of basal ganglia and cerebellar circuits in the management of resting
tremor than the dopaminergic depletion into resting tremor (Hallett, 2012). In the
same line, even when patients with resting tremor showed dopaminergic deficits
in the DaTSCAN, the severity of the tremor did not correlate with dopamine
depletion (Fishman, 2008).
A subtype called benign tremulous parkinsonism has been posteriorly proposed
(Josephs et al., 2006). This PD subtype is characterized by tremor predominance
and a slow progression of the disease with no other non-motor symptoms.
Patients also present less global substantia nigra cell loss than non-benign PD
patients (Selikhova et al., 2013). However, there is a high percentage of
misdiagnosis and when the PD diagnosis is correct, the course is not benign.
Patients eventually end up with PD-related symptomatology such as falls,
hallucinations and even dementia (Deuschl, 2013).
MRI techniques allow studying grey matter (GM) and white matter (WM) structural
changes, its underlying structural and functional connectivity, and the molecular
and metabolic changes of the brain in vivo (see Panels 1.1, 1.2 and 1.3 on pages
28-30 for an explanation of the most common MRI techniques). When comparing
both types of tremor and PIGD dominant, regional GM volume reductions were
found in the PIGD group in all brain lobes (Rosenberg-Katz et al., 2013). A recent
study found that non-tremor patients had significant lower DaTSCAN uptakes
values in the less affected side of the caudate nucleus than PD tremor patients
(Barbagallo et al., 2017). Also related to the caudate, shape analysis of the left
caudate showed atrophy in this structure in PIGD patients compared with controls
(Vervoort et al., 2016). Results from a probabilistic tractography methodology,
reduced structural connectivity values in nigro-pallidal (globus pallidus-substantia
nigra) and fronto-striatal (putamen-precentral cortex, caudate nucleus-
supplementary motor area, and thalamus-precentral cortex) pathways were

26
reported when comparing the two motor subtypes and also the non-tremor group
with the controls group (Barbagallo et al., 2017). Vervoort et al., reported
decreased fractional anisotropy (FA) in antero-posterior tracts when comparing
PIGD patients with a tremor group (Vervoort et al., 2016). Findings in the same
direction in the superior longitudinal fasciculus and the corpus callosum were of
special relevance. The superior longitudinal tract has projections with all the
cortical brain lobes and the crossing fibers of the corpus callosum connect with
sensorimotor cortical regions (Vervoort et al., 2016).
PIGD patients also had reduced levels of amyloid-β levels in cerebrospinal fluid
(CSF) and increments and decrements in different forms of tau in comparison
with the tremor-dominant group (Zuo et al., 2017). Zuo et al., suggested that the
PIGD variant would be linked to MCI in PD and that specific phosphorylated tau
levels could be a biomarker of motor progression (Zuo et al., 2017). Nevertheless,
in a more recent study, measures of amyloid-β and tau levels in a sample of non-
demented PD patients did not differ from the controls sample (Winer et al., 2018).
The division of PD according to its motor manifestations is under debate.
Primarily, because there is divergent literature on motor subtypes nomenclature
and while some describe the tremor-dominant, the PIGD dominant and the mixed
or undetermined subtype; others consider two classifications: the tremoric and
the non-tremoric group. Additionally, PIGD subtype has also been referred to as
axial motor disability or as the akinetic/rigid subtype in the literature (Kotagal,
2016).
More importantly, the temporal instability of the subtypes is up for debate. Motor
phenotypes instability has been found even in the early stages of the disease
diagnosis (Simuni et al., 2016). Eisinger et al., reported that motor symptoms
remained stable in half of the sample whereas the other half suffered different
motor manifestations over a 4 years follow-up (Eisinger et al., 2017).
Contradictorily, Rajput et al., found that motor subtypes are good predictors of
motor prognosis (Rajput et al., 2017). Recently, a multidimensional continuum
(Kotagal, 2016) has been proposed where motor manifestations would be a
temporal evolution of the disease (Fereshtehnejad and Postuma, 2017; Nutt,
2016) and where the PIGD PD-type is actually a measure of motor disturbances
affected overall by disease progression and by other age-related conditions and
comorbidities (Fereshtehnejad and Postuma, 2017). Notwithstanding the clinical
importance of motor manifestations, it seems that age at disease onset would be
a more important feature than motor subtypes to stratify groups of PD patients. A
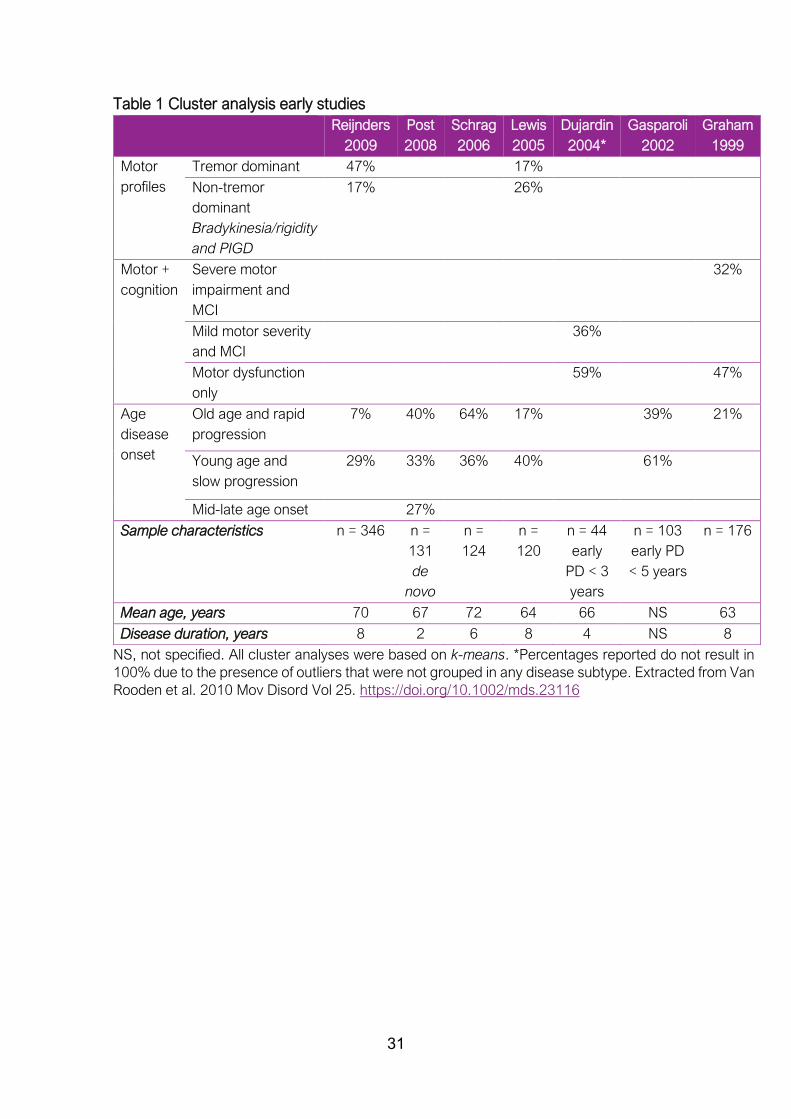
review of seven studies based on data-driven methodologies with sample sizes
ranging from 44 to 176 PD patients (Van Rooden et al., 2010) found that only 2
studies out of the 7 differentiated two motor profiles (the tremor-dominant and
the bradykinesia/rigidity and PIGD dominant), while 6 studies clearly divided
patients based on early and late onset (see Table 1 on page 31). This review

27
summarized the first studies based on cluster analysis techniques that appeared
in the PD literature. Further review of these techniques will be introduced in
posterior sections of the thesis.

28
Panel 1.1 MRI techniques
Structural anatomy GM and WM
Voxel-based morphometry (VBM): VBM estimates the amount of GM in a voxel through
its signal intensity (Good et al., 2001; Whitwell, 2009). This technique also allows to
estimate subcortical GM structures that represent the volume. Both GM volumes and
GM density can be quantified through VBM. For group analyses, images need to be
transformed into a standard space, using linear and non-linear registration. VBM
techniques are dependent on a good registration of each individual and sometimes
ambiguities can arise between what is actual GM atrophy or changes in the folding of
gyrification (Bookstein, 2001).
Cortical thickness (CTh): CTh is calculated as the distance between the WM/GM
boundary (white surface) and the pial surface (created by expanding the WM surface
so that it closely follows the GM-CSF intensity gradient) at each vertex of the
reconstructed cortical mantle. FreeSurfer is the most common software suite used to
estimate CTh measures (Dale et al., 1999; Fischl and Dale, 2000). Vertex-wise CTh
analyses are more informative of cortical topographical differences than VBM.
Diffusion tensor imaging (DTI) measures: diffusion-weighted MRI are sensitive to the
microdiffusion of water molecules. Water diffusion in and out the cells is impeded by
cell membranes, fibers and macromolecules (Le Bihan, 2003). The principle is that
water molecules are always in random motion and bumping into structures and into
each other. Diffusion is significantly altered by the presence of bundles of elongated
axons, as the water cannot pass easily through the cell membranes. Consequently,
the water molecules diffuse (i.e., move) along the direction in which the axons are
oriented, in the extracellular and intracellular spaces.
DTI is typically used to investigate tissue microstructure or to examine the wiring of the
brain (that is anatomical connectivity, commented below in the tractography section).
Different metrics can be obtained from DTI (see Figure 1 in Panel 1.2):
Fractional anisotropy (FA): FA is the degree of anisotropy in a scale ranging
from 0 (isotropic) to 1 (anisotropic). It is related to myelin integrity, being the
more anisotropic, the more myelinated (Le Bihan, 2003).
Mean diffusivity (MD): it is the overall diffusion inside a voxel, and it is given by
the mean of three eigenvalues (λ1, λ2, λ3) which are the magnitude of water
diffusion along the longest (principal direction of the diffusion), middle and
shortest orthogonal (secondary directions of the water molecules) axes.
Other less frequently used DTI measures: axial diffusivity that corresponds to
λ1 eigenvalue, that is the direction of the long axis (secondary direction); and
radial diffusivity (RD) which is the mean of λ2 and λ3, that is, the amount of
diffusion perpendicular to the long axis.
The most common methodology to assess FA, MD or other diffusion measures within
each brain voxels is the FSL tract-based spatial statistics (TBSS) tool
(https://fsl.fmrib.ox.ac.uk/fsl/fslwiki/TBSS).
All structural MRI techniques can be whole-brain (voxel-wise or vertex-wise) or
measures can be extracted from a priori regions of interest (ROI).

29
Continuation Panel 1.2 MRI techniques
Figure 1 Extracted from Alexander et al., 2007 Neurotherapeutics. Vol 4(3).
https://doi.org/10.1016/j.nurt.2007.05.011
Structural connectivity
Tractography: directional information obtained from DTI measures in each voxel is
used to generate virtual, three-dimensional white matter maps. Once the white matter
tracts are defined, the structural connectivity in the brain can be investigated.
Tractography can be deterministic or probabilistic.
Probabilistic tractography is a more recent technique that tries to overcome the
deterministic methodology pitfalls that include uncertainty into estimating at every
voxel the most likely fiber orientation (see
https://www.humanconnectome.org/study/hcp-young-adult/project-
protocol/diffusion-tractography for a more detailed explanation of DTI
measurements).
Functional connectivity
Functional connectivity is defined as the temporal dependency of neuronal activation
patterns of anatomically separated brain regions (van den Heuvel and Hulshoff Pol,
2010). The most common techniques are:
Independent component analysis (ICA) as a data-driven approach to obtain
spatial maps from temporal connectivity measures (Beckmann and Smith,
2004; Smith et al., 2014).
Seed-based analysis: correlations seed-to-whole brain or seed-to-seed.
Graph theory analysis: to obtain global and local measurements of large-scale
networks (Bullmore and Sporns, 2009).
Perfusion MRI
It is a variant of functional imaging that provides direct information on the delivery of
blood to the brain tissue. It offers quantitative measurements that are, for every voxel,
a measure of perfusion (i.e., ml of blood delivered per 100 g of tissue per minute).
Arterial spin labeling (ASL) is the most common noninvasive technique to obtain
perfusion measures.
The book from Jenkinson and Chappell (2018) Introduction to Neuroimaging
Analysis. Oxford editor offers a good overview of all neuroimaging techniques.
30
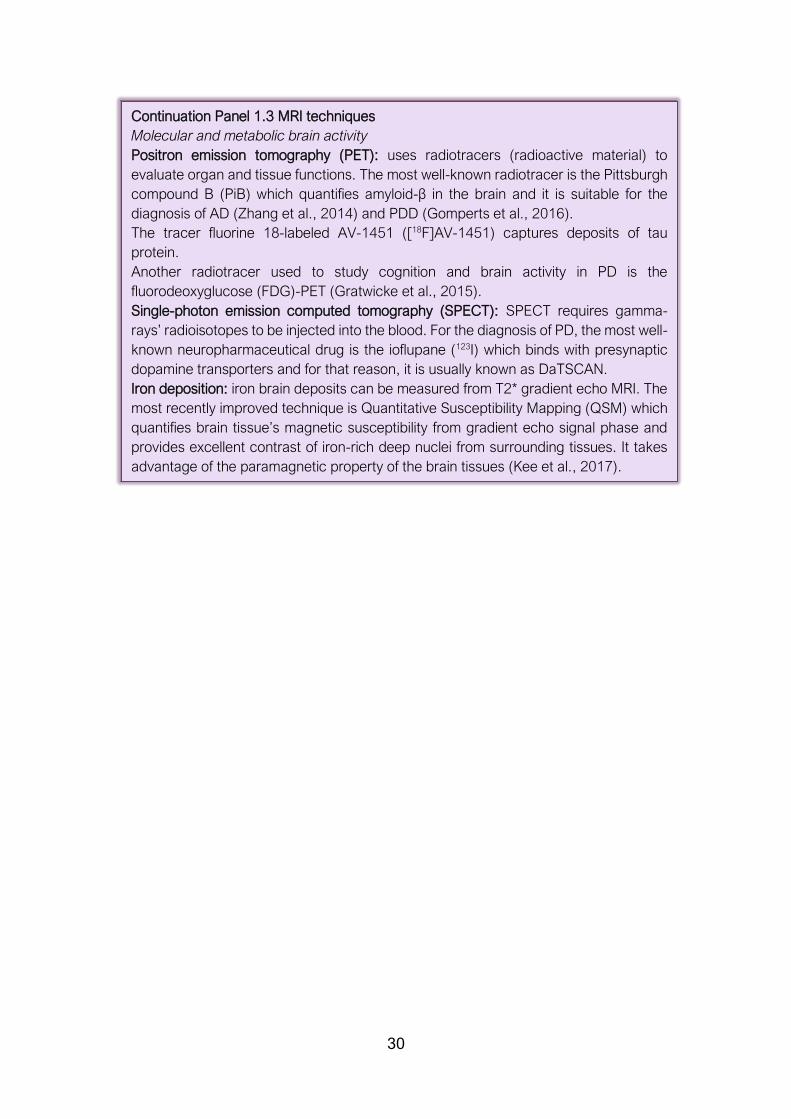
Continuation Panel 1.3 MRI techniques
Molecular and metabolic brain activity
Positron emission tomography (PET): uses radiotracers (radioactive material) to
evaluate organ and tissue functions. The most well-known radiotracer is the Pittsburgh
compound B (PiB) which quantifies amyloid-β in the brain and it is suitable for the
diagnosis of AD (Zhang et al., 2014) and PDD (Gomperts et al., 2016).
The tracer fluorine 18-labeled AV-1451 ([18F]AV-1451) captures deposits of tau
protein.
Another radiotracer used to study cognition and brain activity in PD is the
fluorodeoxyglucose (FDG)-PET (Gratwicke et al., 2015).
Single-photon emission computed tomography (SPECT): SPECT requires gamma-
rays’ radioisotopes to be injected into the blood. For the diagnosis of PD, the most well-
known neuropharmaceutical drug is the ioflupane (123I) which binds with presynaptic
dopamine transporters and for that reason, it is usually known as DaTSCAN.
Iron deposition: iron brain deposits can be measured from T2* gradient echo MRI. The
most recently improved technique is Quantitative Susceptibility Mapping (QSM) which
quantifies brain tissue’s magnetic susceptibility from gradient echo signal phase and
provides excellent contrast of iron-rich deep nuclei from surrounding tissues. It takes
advantage of the paramagnetic property of the brain tissues (Kee et al., 2017).
31
Table 1 Cluster analysis early studies
NS, not specified. All cluster analyses were based on k-means. *Percentages reported do not result in
100% due to the presence of outliers that were not grouped in any disease subtype. Extracted from Van
Rooden et al. 2010 Mov Disord Vol 25. https://doi.org/10.1002/mds.23116
Reijnders
2009
Post
2008
Schrag
2006
Lewis
2005
Dujardin
2004*
Gasparoli
2002
Graham
1999
Motor
profiles
Tremor dominant 47% 17%
Non-tremor
dominant
Bradykinesia/rigidity
and PIGD
17% 26%
Motor +
cognition
Severe motor
impairment and
MCI
32%
Mild motor severity
and MCI
36%
Motor dysfunction
only
59% 47%
Age
disease
onset
Old age and rapid
progression
7% 40% 64% 17% 39% 21%
Young age and
slow progression
29% 33% 36% 40% 61%
Mid-late age onset 27%
Sample characteristics n = 346
n =
131
de
novo
n =
124
n =
120
n = 44
early
PD < 3
years
n = 103
early PD
< 5 years
n = 176
Mean age, years 70 67 72 64 66 NS 63
Disease duration, years 8 2 6 8 4 NS 8

32
Age of disease onset
Age is considered one of the main risk factors for idiopathic PD (Lees et al., 2009)
and diagnosis is usually made after the age of 60 although it is also possible
before 50 years (de Lau and Breteler, 2006). PD debutants younger than 21 years
old are considered juvenile cases (Schrag and Schott, 2006); juvenile PD forms
will not be reviewed in this thesis. From the age of the disease onset, PD patients
can be divided into early/young-onset and late/old-onset subtypes.
Early-onset PD is frequently linked to genetic factors (Lees et al., 2009; Schrag
and Schott, 2006), especially in juvenile cases (Schrag and Schott, 2006). Panel
2 explains the most common genetic mutations linked to PD. Young-onset PD
patients tend to have a slower progression of the disease (Ferguson et al., 2015;
Foltynie et al., 2002), milder cognitive decline (Tang et al., 2016) and fewer sleep
disturbances (Mahale et al., 2015) even when patients had longer disease
duration than the late-onset group. The early-onset subtype has a good response
to L-DOPA therapy (Jankovic et al., 2000) while dyskinesia (Aquino and Fox,
2015; Mehanna et al., 2014), dystonia (Mehanna et al., 2014) and motor
fluctuations can be frequent (Thenganatt and Jankovic, 2014). However, early
onset (<50 years) PD have more depressive symptoms (Fereshtehnejad et al.,
2014; Mehanna et al., 2014).
On the other hand, older age of onset (>60 years) is usually associated with a
more severe motor and nonmotor PD phenotype, greater impairment of
dopaminergic dysfunction in putamen and caudate as measured by DaTSCAN,
and reduced levels of α-synuclein and tau in CSF compared with controls
(Pagano et al., 2016). Hoehn and Yahr (H&Y) staging, bradykinesia, resting tremor
and postural instability scores as measured by UPDRS-III were significantly
increased in older-aged onset groups when comparing patients with similar
disease durations (Pagano et al., 2016). Late-onset PD (≥70 years) also tend to
have a greater proportion of falls (Mehanna et al., 2014). Motor manifestations at
Panel 2 Autosomal dominant and recessive genetic mutations in PD
Mutations in LRRK2 are the most common causes of dominant inherited PD and age of
onset tends to be similar to sporadic PD. Other autosomal dominant genes are SNCA,
VPS35, EIF4G1, DNAJC13 and CHCHD2.
Mutations in Parkin gene such as PARK2 are the most prevalent autosomal recessive
gene related to PD and patients frequently debut before 40 years. They are also
responsible for the juvenile parkinsonism forms (Giasson and Lee, 2001). Other
recessive genes related to PD are PINK1 and DJ-1/PARK7 also linked to an early onset
of the disease (Kalia and Lang, 2015).
A lower methylation of SNCA and PARK2 promoter regions would be related to an early-
onset of the disease. PD patients with these genetic characteristics also tend to have
positive family history of PD (Eryilmaz et al., 2017).

33
disease onset for the old-onset group are usually tremor at rest while for the early-
onset patients, a great proportion tend to debut with akinetic/rigid symptoms
(Wickremaratchi et al., 2011).
One of the drawbacks of investigating different ages of disease onset is the
arbitrary cut-off (Butterfield et al., 1993; Schrag et al., 1998; Wickremaratchi et
al., 2011). Early-onset is usually considered between 20 to 40 years-old and late-
onset from 60 years (Schrag and Schott, 2006). Although some studies included
in the early-onset subgroup, patients diagnosed up to 50 years (Butterfield et al.,
1993) and the late-onset from 50 years (Shih et al., 2007). Others report the
majority of clinical differences between early and late-onset in patients older than
70 years (Pagano et al., 2016).
Metabolic brain differences accounting for aging effects at disease onset have
been investigated using Positron Emission Tomography (PET) and Single-Photon
Emission Computed Tomography (SPECT). There is controversy on the findings
and some studies reported similar nigrostriatal dopaminergic loss in the putamen
(Liu et al., 2015; Panzacchi et al., 2008) and caudate (Panzacchi et al., 2008)
nuclei quantified with DaTSCAN-PET in both early-onset (<45 years for Panzacchi
et al., 2008 and <50 years for Liu et al., 2015) and late-onset (>50 years). In
contrast, others reported that early-onset PD patients (<50 years) have a greater
dopamine neuron loss in the striatum than late-onset PD patients (Shih et al.,
2007). More precisely, the putamen would have a greater loss of neurons
although early-onset PD patients have a slower disease progression and
therefore, it seems that early-onset PD patients have more efficient compensatory
mechanisms to cope the disease (De La Fuente-Fernández et al., 2011). The
caudate nucleus in proportion to the putamen loss would be preserved in the
early-onset group (Liu et al., 2015). On the other hand, mid-late onset PD patients
(>50 years) have greater content of iron deposition in putamen than that observed
in early PD patients (≤50 years) although both groups had increased levels of iron
deposition in the substantia nigra comparing them with similar-aged controls
(Xuan et al., 2017). Excessive iron content increases the oxidative processes in
the cells and therefore leads to neurotoxicity (Gutteridge, 1992). Correlations
between iron content and clinical variables of disease severity were reported in
mid-late onset patients but not in the early-onset group possibly due to
compensatory mechanisms (Xuan et al., 2017). There is scarce literature on
structural MRI studies comparing groups of different ages in disease onset and
one functional connectivity seed-to-whole brain correlation study found increased
connectivity between the basal ganglia and regional neocortical and cerebellar
areas in both PD groups compared with two samples of similar-aged controls
although they were not compared between each other (Hou et al., 2016).
34
Visual hallucinations
Patients with visual hallucinations would constitute a subtype at more risk evolving
to PDD (Aarsland et al., 2003; Aarsland and Kurz, 2010; Hobson and Meara,
2004). Longitudinal studies reported that 75% of the patients with visual
hallucinations end up with dementia over 2.5 years (Ibarretxe-Bilbao et al., 2010).
Hallucinations in PD are mainly visual, they affect one out of four patients with PD
(Fenelon, 2000) or even up to 50% of the PD population in the second half of the
disease based on autopsy reports (Williams and Lees, 2005). Alterations in visual
function in PD have been reported from the retina to higher associative cortical
brain regions (Weil et al., 2016). Visual hallucinations can be a side effect of L-
DOPA medication (Armstrong, 2008) or it can worsen them (Connolly and Lang,
2014). However, other factors might be implicated since hallucinations can be
present at diagnosis in untreated de novo patients and thus cannot be attributed
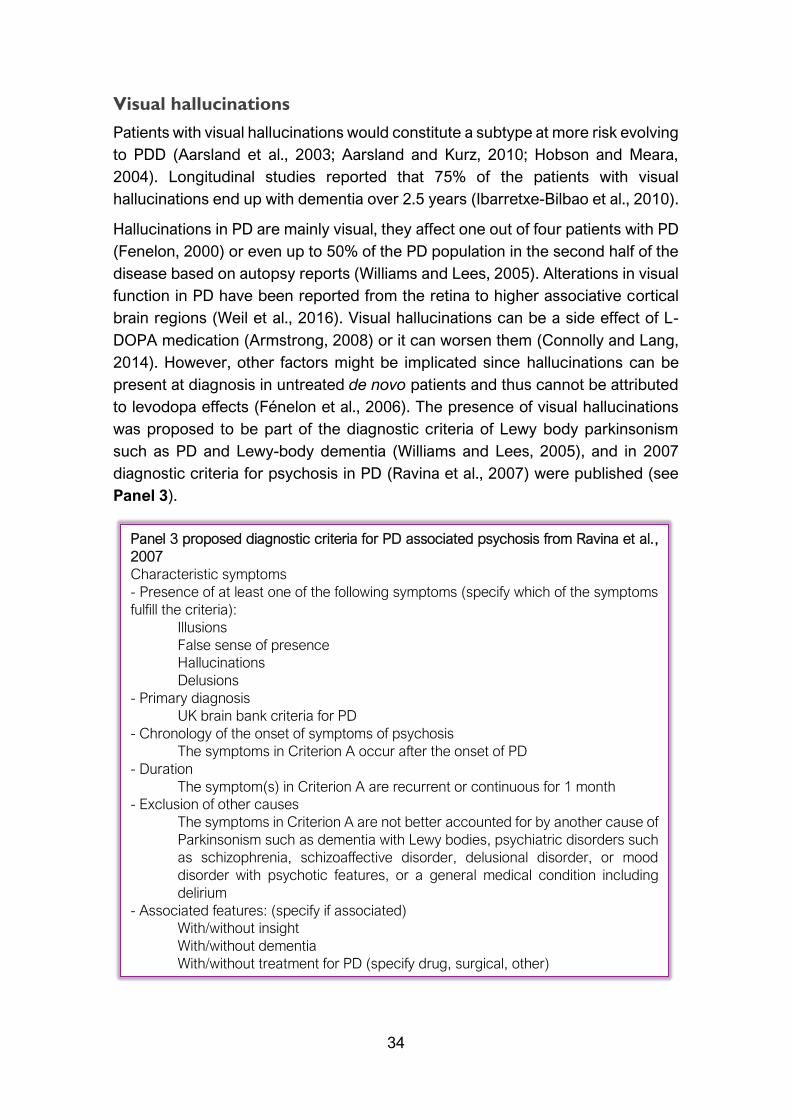
to levodopa effects (Fénelon et al., 2006). The presence of visual hallucinations
was proposed to be part of the diagnostic criteria of Lewy body parkinsonism
such as PD and Lewy-body dementia (Williams and Lees, 2005), and in 2007
diagnostic criteria for psychosis in PD (Ravina et al., 2007) were published (see
Panel 3).
Panel 3 proposed diagnostic criteria for PD associated psychosis from Ravina et al.,
2007
Characteristic symptoms
- Presence of at least one of the following symptoms (specify which of the symptoms
fulfill the criteria):
Illusions
False sense of presence
Hallucinations
Delusions
- Primary diagnosis
UK brain bank criteria for PD
- Chronology of the onset of symptoms of psychosis
The symptoms in Criterion A occur after the onset of PD
- Duration
The symptom(s) in Criterion A are recurrent or continuous for 1 month
- Exclusion of other causes
The symptoms in Criterion A are not better accounted for by another cause of
Parkinsonism such as dementia with Lewy bodies, psychiatric disorders such
as schizophrenia, schizoaffective disorder, delusional disorder, or mood
disorder with psychotic features, or a general medical condition including
delirium
- Associated features: (specify if associated)
With/without insight
With/without dementia
With/without treatment for PD (specify drug, surgical, other)

35
Frequently, hallucinations appear as minor illusions in early stages of the disease,
with the feeling that there is a presence in the room, behind the patient or next to
but patients cannot see it. These are usually not disturbing for the patients
(Fénelon et al., 2011) and they can be present in more than 40% of de novo,
unmedicated PD patients (Pagonabarraga et al., 2016). Progressively, this minor
illusion evolves to more sophisticated hallucinations which involve “a disturbance
in the regulation of the gating and filtering of the external perception and internally
generated visual images” (Armstrong, 2008).
The neuropsychological profile of patients with visual hallucinations includes
deficits over all the main cognitive domains such as impairment in verbal and
visual memory, language comprehension, visuospatial and visuoperceptive
functions, verbal fluency and executive function (Ibarretxe-Bilbao et al., 2011;
Lenka et al., 2017). Instead, minor hallucinations are not related to any specific
neuropsychological impairment (Llebaria et al., 2010). The genetic contribution
to psychosis in PD has been poorly investigated and there are no associated well-
defined genes linked to it (Ffytche et al., 2017).
The advent of visual hallucinations has been linked to densities of Lewy bodies in
the parahippocampal and inferior temporal cortices (Harding et al., 2002). MRI
studies comparing non-demented PD patients with and without visual
hallucinations have reported specific regional atrophy in brain areas related to
higher visual processing. GM reductions in the left lingual gyrus and bilateral
superior parietal were found in hallucinating patients compared with controls and
non-hallucinating PD (Ramírez-Ruiz et al., 2007). Subcortically, the head of the
hippocampus has also been related to non-demented PD patients with visual
hallucinations (Ibarretxe-Bilbao et al., 2008). A recent study on the hippocampal
subregions in psychosis found widening of the bilateral hippocampal fissure in PD
psychotic patients compared with PD without psychosis, thus suggesting
hippocampal atrophy (Lenka et al., 2018). Other studies have also stressed the
importance of posterior brain atrophy including occipital, parietal and medial
temporal lobe degeneration linked to visual hallucinations although findings were
uncorrected (Goldman et al., 2014). Longitudinally, PD patients with visual
hallucinations have greater atrophy across widespread regions. Of special
relevance, the limbic and paralimbic areas in the temporal lobe but also
widespread atrophy in the frontal lobe over 2.5 years (Ibarretxe-Bilbao et al.,
2010).
Functionally, early studies investigating brain pattern activations of visual
associative areas in hallucinating patients have reported: reduced functional
connectivity in the right prefrontal (inferior, superior and middle) cortex and in the
anterior cingulate gyrus when comparing them with patients without visual
hallucinations. Contrarily, when presenting simple visual stimuli (not-related to
associative processing), the hallucinating group had hyperactivations in the right

36
inferior frontal region (Ramírez-Ruiz et al., 2008). Another study reported reduced
activation in the lateral occipital cortex and the extrastriate temporal visual
cortices in the hallucinating PD group suggesting bottom-up visual processing
impairment (Meppelink et al., 2009). When investigating the functional
connectivity of the brain at rest, default mode network reduced connectivity was
found in PD patients compared with controls, and concretely, PD patients with
visual hallucinations had increased connectivity in frontal and parietal regions of
this network than non-hallucinating patients (Yao et al., 2014). These
abnormalities in the default mode network, together with disrupted connectivity
in the visual and attentional networks would define the neural mechanisms of
visual hallucinations in PD (Shine et al., 2014).
More recently, once structural and functional studies described the brain changes
associated with hallucinations in PD, the focus changed to study minor
hallucination phenomena as a possible prodromal stage to reduce, prevent or
delay the onset of major (complex) hallucinations and finally, overt dementia. A
recent review on MRI findings of hallucinations in PD (Lenka et al., 2015), stresses
the importance of the progressive superior parietal atrophy as a marker of
evolution from minor hallucinations to complex ones, since this region has also
been reported in patients with minor hallucinations (Pagonabarraga et al., 2014).
However, methodology discrepancies and different PD disease stages prevent its
elucidation. In this early study investigating the neural correlates of minor
hallucinations, modest increments and decrements are reported in a very
homogeneous sample of PD patients and healthy controls. Compared with
controls, PD patients with presence of minor hallucinations had left superior
parietal, superior occipital, right cuneus and midbrain volume reductions as well
as increments in hippocampal and cerebellar regions. Compared with patients
without this phenomenon, decrements were placed in the right precuneus,
increments in the left orbitofrontal gyrus and finally, both increments and
decrements in specific regions of the cerebellum (Pagonabarraga et al., 2014). A
more recent study have found left middle occipital, left parietal and right
parahippocampal GM reductions in PD with minor hallucinations compared with
non-hallucinating patients (Bejr‐Kasem et al., 2018). Functionally, similar results
in the default mode network have been reported in patients with minor visual
hallucinations from a seed-based approach placed in the posterior cingulate
cortex (Bejr‐Kasem et al., 2018). Specifically, increased connectivity with bilateral
superior parietal, middle temporal and right precentral regions of the default
mode network were reported.
Together these findings confirm the involvement of temporal limbic and
paralimbic regions as well as posterior cortical brain areas into visuoperceptual
and visuospatial functions in visual hallucinations in PD.

37
Cognition in PD
In 1997, Dubois and Pillon described that the cognitive deficits observed in PD
“they mainly include defective use of memory stores and a dysexecutive
syndrome. These disorders result from dysfunction of processes that are
commonly considered to be controlled by the pre-frontal cortex. […] These
deficits may be related to the subcortical pathology of the disease, because they
are noticed even at an early stage” (Dubois and Pillon, 1997). Nowadays, the
hypothesis that PD only involves fronto-striatal dysfunction has been rejected
(Goedert et al., 2013). Both MRI and neuropsychological studies have contributed
to the idea that brain atrophy underlying PD-MCI is extensive (Kehagia et al.,
2010; Robbins and Cools, 2014). Atrophy can be found through neocortical and
subcortical structures even at early stages of the disease (Lee et al., 2014; Pereira
et al., 2014) where cognitive decline can already be present (Aarsland et al.,
2009).
Cognitive deficits related to PD
Following the classical idea of the fronto-striatal deficits, cognitive dysfunctions
were attributed to the frontal lobe: that is, executive function that requires
cognitive flexibility and internally guided behavior to answer to external cues
(Dubois and Pillon, 1997). This idea was supported by the impairment observed
in frontal lobe-related tests such as the Wisconsin Card Sorting Test, Trail Making
Test (TMT), Odd Man Out Test, letter fluency, Stroop test and the tower of London
test (Dubois and Pillon, 1997). Impairment in flexibility, response inhibition, and
working memory were reported to be restored thank to dopamine receptors
agonists, monoamine oxidase (MAO) type B inhibitors and catechol-O-
methyltransferase (COMT) inhibitors (Kehagia et al., 2010). For example,
rasagiline treatment (MAO-B inhibitor) has beneficial effects on the digit span
backward test as a measure of attention and on verbal fluency total scores as a
measure of executive function in non-demented PD patients (Hanagasi et al.,
2011).
However, L-DOPA may also worsen other cognitive abilities (Svenningsson et al.,
2012). There is a functional differentiation between the dorsal and the ventral
striatum and medication seems to improve dorsal striatum functions such as
flexibility while impairing ventral striatal function that would cause impulsivity and
impairment in other cognitive functions such as reversal learning and decision
making (Cools, 2006; Cools et al., 2003). These deficits would be caused by a
“dopaminergic overdose” in less depleted striatal regions (Kehagia et al., 2012,
2010), because dopaminergic denervation follows a dorsal to ventral gradient
within the basal ganglia (Grace, 2008; Kish et al., 2010).
Executive function is a complex cognitive domain and working memory, rule-
switching and response inhibition include an attentional component that, apart

38
from being mediated by dopaminergic fronto-striatal circuits, they interact with
other neurotransmitter networks in the brain. Indeed, beyond the dopaminergic
depletion in PD mainly causing motor dysfunction, the noradrenergic,
serotoninergic and cholinergic systems are also involved in PD non-motor
symptoms (e.g., cognition) by degeneration of the locus coeruleus, dorsal raphe
and the nucleus of Meynert (Jellinger, 2012).
Different cholinergic networks have been related to visuoperceptual deficits such
as visuospatial function via the superior parietal and the occipital gyrus; visual
hallucinations via the inferior parietal, the cuneus and the lingual gyrus; and
visuoperceptual deficits via the middle occipital, the parahippocampal and
fusiform gyri. Memory deficits are also related to cholinergic dysfunction in the
medial temporal lobe of the hippocampal and parahippocampal formation causing
recognition memory deficits and semantic memory impairment (Gratwicke et al.,
2015). Cholinergic dysfunction has been proposed as a biomarker of PDD by
means of PET imaging (Delgado-Alvarado et al., 2016). Indeed, the most effective
treatment for the management of cognitive disturbances in PDD patients is the
rivastigmine which is a cholinesterase inhibitor (Seppi et al., 2011).
Overall the great heterogeneity of PD-MCI even in newly diagnosed patients
(Aarsland et al., 2009; Muslimovic et al., 2005) and the existence of different
neural networks underlying cognitive dysfunction (Cools, 2006; Kehagia et al.,
2010), a dual syndrome hypothesis was proposed (Kehagia et al., 2012). In 2004,
this research group from Cambridge divided PD-MCI patients according to the
presence of frontostriatal deficits as evaluated with the Tower of London,
temporal lobe deficits as evaluated by a pattern recognition memory task or global
PD-MCI patients with both frontal and temporal deficits (Foltynie et al., 2004). This
study was of high importance since the cohort was representative from the
Cambridgeshire region in the UK therefore, patients were not enrolled from an
outpatient clinic with the subsequent possible bias. From this first work, the cohort
was followed-up to three (Williams-Gray et al., 2007), five (Williams-Gray et al.,
2009a) and ten (Williams-Gray et al., 2013) years with the aim to establish
dementia incidence, cognitive profiles in PD and baseline variables predicting
cognitive evolution (Williams-Gray et al., 2007). In addition, different genetic
expressions were investigated (Williams-Gray et al., 2009b, 2009a). See Panel 4
for a brief summary of the genes associated with cognition in PD.
The dual syndrome hypothesis differentiates two cognitive profiles (Figure 2): (1)
a neuropsychological profile with mainly executive dysfunction linked to
dopaminergic amelioration; (2) a subgroup with early deficits in visuospatial
function and semantic fluency, dependent on cholinergic dysfunction and linked
to posterior cortical and temporal lobe atrophy, with rapid cognitive decline and
more probability to end up in PDD (Kehagia et al., 2012). Indeed, PD patients with
semantic fluency performance <20 words in 90 seconds, not being able to copy

39
the pentagons’ figure of the Mini-Mental State Examination (MMSE) (Williams-
Gray et al., 2007) and aging > 71 years would be at more risk to dementia
(Williams-Gray et al., 2009a).
Figure 2 Genes associated to cognition in PD. Extracted from Collins and Williams-
Gray 2016 Frontiers in Psychiatry. https://doi.org/10.3389/fpsyt.2016.00089
Panel 4 Genes associated to cognition in PD
- H1 haplotype of the microtubule associated protein tau (MAPT) gene has been
associated to dementia (Williams-Gray et al., 2009a; Seto-Salvia et al., 2011).
- The glucocerebrosidase (GBA) influence progression to dementia and the
heterozygote GBA mutation is more overrepresented in PD than in controls (Seto-Salvia
et al., 2012).
- The α-synuclein gene (SNCA) duplications but not polymorphisms is also implicated in
PD disease progression to dementia (Kurz et al., 2006; Halliday, 2014).
- The brain derived neurotrophic factor (BDNF) Met/Met allele correlates with MCI and
disease duration (Guerini et al., 2009).
- Polimorphisms of DYRK1A have been related to PDD and dementia with Lewy bodies
(Jones et al., 2012).
- The gene coding for catechol-O-methyltransferase (COMT) has no effect on dementia
in any of the allele forms (Val/Met), which are more related to frontal deficits (Williams-
Gray et al., 2009a).
- Appoliprotein E (APOE) ε4 alleles effect on PD are inconsistent contrary to that found
in Alzheimer’s disease (AD), while some studies found an association of ε4 carriers with
PD (Kurz et al. 2009) other did not (Williams-Gray et al., 2009b) and no studies have
related conversion to dementia with any form of APOE. However, verbal memory and
semantic fluency performance are predicted by the presence of the APOE ε4 allele
(Mata et al., 2014).
Reviews on the genetic contribution to cognition in PD can be found in Svenningsson et
al., 2012 and Collins and Williams-Gray, 2016.

40
Progression of cognitive decline
Initial longitudinal prospective studies in PD samples that assessed
neuropsychological performance reported miscellaneous results. In part, this is
due to different scan intervals and heterogeneous small PD samples of non-
demented patients. Back in 2007, a first meta-analysis evaluated 25 longitudinal
studies that pooled 901 non-demented PD patients with scan intervals ranging
from 2.4 months to 8 years (Muslimović et al., 2007). Overall, subtle cognitive
decline was found across all cognitive domains assessed (global cognitive ability,
memory, verbal fluency, verbal ability, mental flexibility and reasoning, attention
and speed processing, and visuoperceptual and visuoconstructive skills). From
this moderate cognitive evolution, the memory domain, visuoconstructive skills,
and global cognitive ability were the most impaired. Posterior to this meta-
analysis, better well-controlled prospective works have reported a greater decline
in processing speed (Broeders et al., 2013b; Gasca-Salas et al., 2014; Muslimović
et al., 2009). Modest memory decline was also reported (Broeders et al., 2013b;
Muslimović et al., 2009) as well as visuospatial skills and executive function
(Muslimović et al., 2009). Indeed, the transition from PD normal cognition to PD-
MCI was characterized by the presence of attention, executive and memory
impairments whereas patients who converted from PD-MCI to PDD suffered
visuospatial deficits over a 2.5-year period (Gasca-Salas et al., 2014). Attention
decline over time is less clear in PD patients (Broeders et al., 2013b). See Table
2 for effect sizes information of longitudinal PD cognitive studies. In the table, we
can observe that the greater the scan interval, the larger the effect sizes.
However, there is no consensus in the cognitive domains and neuropsychological
tests included across studies. Visuospatial function, verbal and visual memory,
language and tests that require processing speed and working memory suffered
the most significant time effects.
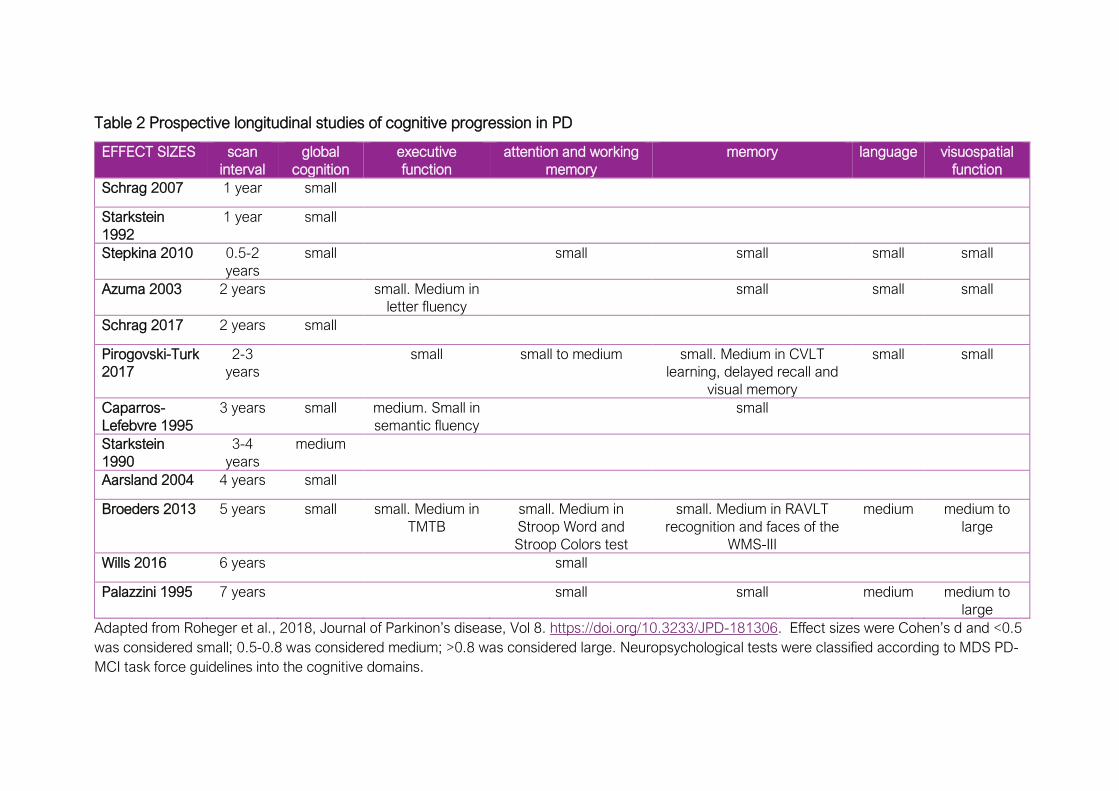
Table 2 Prospective longitudinal studies of cognitive progression in PD
EFFECT SIZES scan
interval
global
cognition
executive
function
attention and working
memory
memory language visuospatial
function
Schrag 2007 1 year small
Starkstein
1992
1 year small
Stepkina 2010 0.5-2
years
small small small small small
Azuma 2003 2 years small. Medium in
letter fluency
small small small
Schrag 2017 2 years small
Pirogovski-Turk
2017
2-3
years
small small to medium small. Medium in CVLT
learning, delayed recall and
visual memory
small small
Caparros-
Lefebvre 1995
3 years small medium. Small in
semantic fluency
small
Starkstein
1990
3-4
years
medium
Aarsland 2004 4 years small
Broeders 2013 5 years small small. Medium in
TMTB
small. Medium in
Stroop Word and
Stroop Colors test
small. Medium in RAVLT
recognition and faces of the
WMS-III
medium medium to
large
Wills 2016 6 years small
Palazzini 1995 7 years small small medium medium to
large
Adapted from Roheger et al., 2018, Journal of Parkinon’s disease, Vol 8. https://doi.org/10.3233/JPD-181306. Effect sizes were Cohen’s d and <0.5
was considered small; 0.5-0.8 was considered medium; >0.8 was considered large. Neuropsychological tests were classified according to MDS PD-
MCI task force guidelines into the cognitive domains.

42
PD-MCI diagnosis
Cognition in PD is conceived as a spectrum (Caviness et al., 2007). As in
Alzheimer’s disease (AD), PD-MCI definition is of high relevance because patients
have a higher risk to develop dementia than cognitively intact PD patients
(Domellöf et al., 2015; Janvin et al., 2006; Pedersen et al., 2013). Specific
cognitive deficits such as impairment in verbal immediate and delayed recall
memory tests and in verbal fluency have been pointed out as markers of PDD
(Levy et al., 2002). Nonetheless, not all PD-MCI patients eventually evolve to
dementia and follow-up studies also reported that PD cognitively intact patients
at baseline end up with dementia over a 4 years follow-up (Janvin et al., 2006).
This suggests that the continuum does not follow a simple linear progression. The
prevalence of PD-MCI ranges from 19% to 38% (Litvan et al., 2012), although it
can be up to 50% (Janvin et al., 2006; Picillo et al., 2014). In newly diagnosed
untreated PD patients, the prevalence of MCI is already nearly 20% (Aarsland et
al., 2009; Nguyen et al., 2007). This great variability is even more remarkable
concerning PD-MCI subtypes (Aarsland et al., 2009; Caviness et al., 2007; Janvin
et al., 2006) maybe due to different cut-off criteria and the use of different number
of tests.
Initially, PD-MCI diagnostic criteria were taken from the definition of MCI as a pre-
stage of AD dementia (Petersen et al., 2001). In this early definition of MCI,
memory decline was the key characteristic of the diagnosis. This decline was
greater than that observed in normal aging but patients could not reach criteria
for probable AD (Petersen et al., 2001). A few years later, these criteria were
revised and although memory impairment was still a key point for the
characterization of MCI, the criteria for the diagnosis were that decline could be
in any cognitive domain being self and/or informant report or derived from
comprehensive neuropsychological assessment (Winblad et al., 2004). MCI could
be amnestic or non-amnestic and single or multidomain (Winblad et al., 2004).
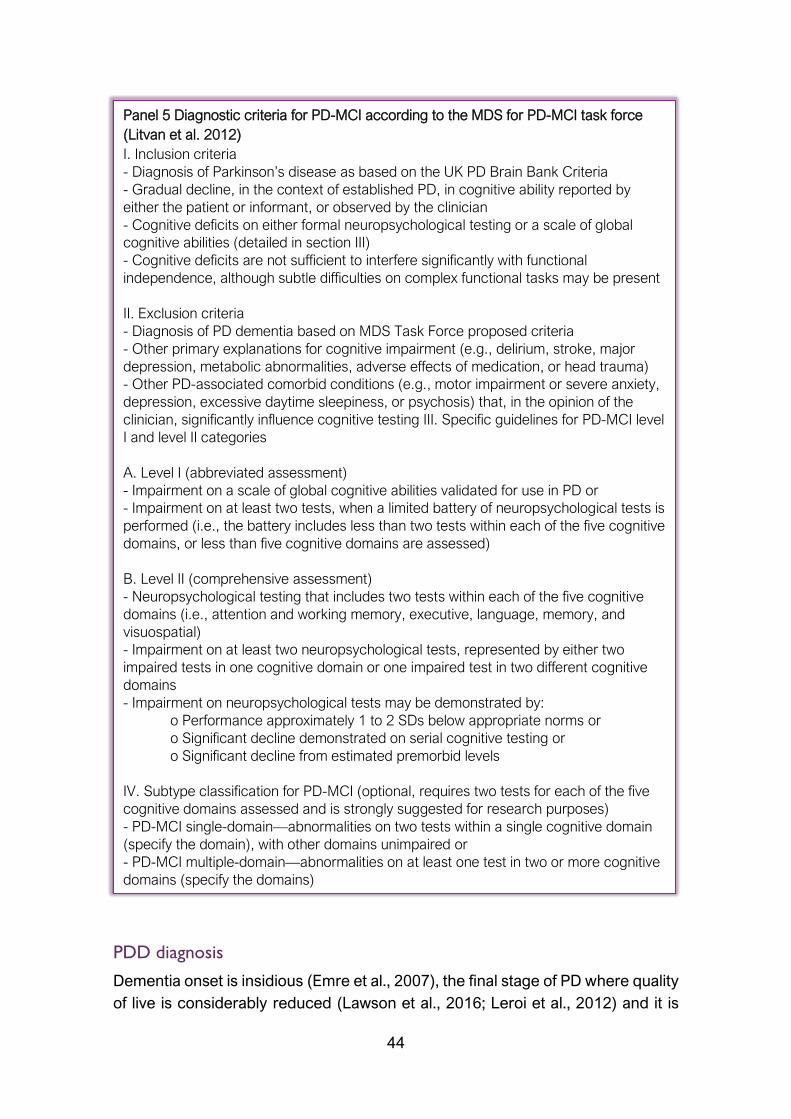
The MDS PD-MCI task force published new criteria to diagnose MCI especially
for PD patients in 2012 (Litvan et al., 2012). Two levels were established: level I
allows for the “diagnosis of PD-MCI based on an abbreviated cognitive
assessment, because comprehensive testing may not always be practical or
available. Level I criteria provide less diagnostic certainty than level II”. Level II is
a comprehensive assessment that includes the possibility of subtyping PD-MCI in
cognitive domains, being single or multi-domain (Litvan et al., 2012). The main
difference between PDD and PD-MCI is that in MCI no functional impairment
affects the patient’s performance on the activities of the daily living (see Panel 5
on page 44).
After the publication of the criteria, some studies have assessed their utility. Level
I criteria were tested at different cut-off points (1 SD, 1.5 SD, and 2 SD). Scores

43
were then compared with age-matched and/or education-matched normative
data and secondly, with premorbid measures. The results presented a great
variability in the characterization of PD-MCI (Szeto et al., 2015a). A similar study
was previously published with level II criteria and the authors finally concluded
that the 2 SD cut-off was the most optimal when comparing PD-MCI published
criteria with the consensus-based diagnosis performed in their center (Goldman
et al., 2013).
Another goal of the PD-MCI task force is to narrow the recommended test battery
for the diagnosis. However, a recent work that included more than 3,000 PD
subjects and 1,000 controls from the MDS PD-MCI task force concluded that
cognitive performance measured based on published norms revealed a great
variability across studies while calculating normative data from controls reduced
this variability (Hoogland et al., 2018). This makes difficult to confidently choose
sensitive tests for PD cognition. The MDS PD-MCI task force has recently
published a multicenter study on 467 PD patients from four large cohorts that
related level II PD-MCI criteria (<1.5 SD cut-off) to the evolution of PDD after
controlling for demographics and clinical characteristics such as PD disease
severity and depression (Hoogland et al., 2017). Recently in this year, similar
findings were reported for level I PD-MCI diagnosis in the prediction of PDD
(Hoogland et al., 2019).
44
PDD diagnosis
Dementia onset is insidious (Emre et al., 2007), the final stage of PD where quality
of live is considerably reduced (Lawson et al., 2016; Leroi et al., 2012) and it is
Panel 5 Diagnostic criteria for PD-MCI according to the MDS for PD-MCI task force
(Litvan et al. 2012)
I. Inclusion criteria
- Diagnosis of Parkinson’s disease as based on the UK PD Brain Bank Criteria
- Gradual decline, in the context of established PD, in cognitive ability reported by
either the patient or informant, or observed by the clinician
- Cognitive deficits on either formal neuropsychological testing or a scale of global
cognitive abilities (detailed in section III)
- Cognitive deficits are not sufficient to interfere significantly with functional
independence, although subtle difficulties on complex functional tasks may be present
II. Exclusion criteria
- Diagnosis of PD dementia based on MDS Task Force proposed criteria
- Other primary explanations for cognitive impairment (e.g., delirium, stroke, major
depression, metabolic abnormalities, adverse effects of medication, or head trauma)
- Other PD-associated comorbid conditions (e.g., motor impairment or severe anxiety,
depression, excessive daytime sleepiness, or psychosis) that, in the opinion of the
clinician, significantly influence cognitive testing III. Specific guidelines for PD-MCI level
I and level II categories
A. Level I (abbreviated assessment)
- Impairment on a scale of global cognitive abilities validated for use in PD or
- Impairment on at least two tests, when a limited battery of neuropsychological tests is
performed (i.e., the battery includes less than two tests within each of the five cognitive
domains, or less than five cognitive domains are assessed)
B. Level II (comprehensive assessment)
- Neuropsychological testing that includes two tests within each of the five cognitive
domains (i.e., attention and working memory, executive, language, memory, and
visuospatial)
- Impairment on at least two neuropsychological tests, represented by either two
impaired tests in one cognitive domain or one impaired test in two different cognitive
domains
- Impairment on neuropsychological tests may be demonstrated by:
o Performance approximately 1 to 2 SDs below appropriate norms or
o Significant decline demonstrated on serial cognitive testing or
o Significant decline from estimated premorbid levels
IV. Subtype classification for PD-MCI (optional, requires two tests for each of the five
cognitive domains assessed and is strongly suggested for research purposes)
- PD-MCI single-domain—abnormalities on two tests within a single cognitive domain
(specify the domain), with other domains unimpaired or
- PD-MCI multiple-domain—abnormalities on at least one test in two or more cognitive
domains (specify the domains)

45
the phase of the disease with the most burdensome for caregivers also mainly
due to the presence of hallucinations (Aarsland et al., 2000). The most reported
risk factors for dementia are old age (Aarsland and Kurz, 2010; Domellöf et al.,
2015; Williams-Gray et al., 2013), severity of motor symptoms, mainly PIGD
manifestations (Aarsland et al., 2003; Aarsland and Kurz, 2010; Burn et al., 2006),
MCI (Aarsland and Kurz, 2010; Domellöf et al., 2015) or specific deficits in
neuropsychological tests (Williams-Gray et al., 2013), visual hallucinations
(Aarsland et al., 2003; Aarsland and Kurz, 2010) and the haplotype H1 in MAPT
genotype (Williams-Gray et al., 2013). It seems that the disease duration or age
of onset have no further contributions to the development of dementia beyond
age itself (Kehagia et al., 2010).
After 10 years from PD diagnosis (Williams-Gray et al., 2013), dementia occurred
in 46% of the population while only 23% of the sample (142 PD patients) had a
good outcome. Dementia incidence is estimated over 55 per 1,000 person-years
in PD, 2.6 times higher than the estimated incidence in the general population.
Mortality at 10 years from the diagnosis is up to 55% causes are usually not
related to PD (Williams-Gray et al., 2013). Based on prospective, community-
based studies reported estimated incidences are diverse. In a 5-years follow-up
study (147 PD patients), the percentage of dementia was slightly lower (almost
30%) although the estimated incidence was higher: 63 per 1,000 person-years
(Domellöf et al., 2015). Over 4.2 years (130 patients), estimated dementia
incidence was estimated up to 95 per 1,000 person-years (33%). When following
a cohort up to 8 years, the prevalence of PD patients evolving to dementia was
80% (Aarsland et al., 2003). Incidence and prevalence can vary between studies
because while some explored the probability of developing dementia in PD
populations, others explored the prevalence of dementia in PD patients as part of
large, prospective population-based cohorts.
Previous to PD-MCI criteria, the MDS task force dedicated to PDD published
diagnostic criteria (Panel 6) of probable and possible PDD according to the level
of uncertainty (Emre et al., 2007). Also in 2007, parallel to the diagnostic criteria
publication (Emre 2007) and similar to what would posteriorly be published for
PD-MCI, two levels of diagnosis for PDD were established (Dubois et al., 2007).
Level I is a “simple short algorithm based on tools that can be used in an office or
in the bedside”. It is mainly conceived for clinicians with no expertise in
neuropsychological methods and for example, proposes a cut-off <26 in MMSE
scores. Level II implies a comprehensive neuropsychological assessment to
specify PDD severity or its patterns. It includes four domains: global cognitive
efficiency, subcortico-frontal features, instrumental functions and
neuropsychiatric features (Dubois et al., 2007).

46
Panel 6 Diagnostic criteria for PDD from Emre et al., 2007
Features of dementia associated with PD
I. Core features
1. Diagnosis of Parkinson’s disease according to Queen Square Brain Bank criteria
2. A dementia syndrome with insidious onset and slow progression, developing within the context of established
Parkinson’s disease and diagnosed by history, clinical, and mental examination, defined as: impairment in more than
one cognitive domain; representing a decline from premorbid level; deficits severe enough to impair daily life (social,
occupational, or personal care), independent of the impairment ascribable to motor or autonomic symptoms
II. Associated clinical features
1. Cognitive features:
• Attention: Impaired.
• Executive functions: Impaired.
• Visuo-spatial functions: Impaired.
• Memory: Impaired.
• Language: Core functions largely preserved. Word finding difficulties and impaired comprehension of complex
sentences may be present
2. Behavioral features:
• Apathy: decreased spontaneity; loss of motivation, interest, and effortful behavior
• Changes in personality and mood including depressive features and anxiety
• Hallucinations: mostly visual, usually complex, formed visions of people, animals or objects
• Delusions: usually paranoid, such as infidelity, or phantom boarder (unwelcome guests living in the home)
delusions
• Excessive daytime sleepiness
III. Features which do not exclude PD-D, but make the diagnosis uncertain
• Co-existence of any other abnormality which may by itself cause cognitive impairment, but judged not to be the
cause of dementia
• Time interval between the development of motor and cognitive symptoms not known
IV. Features suggesting other conditions or diseases as cause of mental impairment, which, when present
make it impossible
to reliably diagnose PD-D
• Cognitive and behavioral symptoms appearing solely in the context of other conditions such as:
Acute confusion due to
a. Systemic diseases or abnormalities
b. Drug intoxication
Major Depression according to DSM IV
• Features compatible with “Probable Vascular dementia” criteria according to NINDS-AIREN (dementia in the
context of cerebrovascular disease)
Diagnostic criteria for PDD
Probable PD-D
A. Core features: Both must be present
B. Associated clinical features:
• Typical profile of cognitive deficits including impairment in at least two of the four core cognitive domains (impaired
attention which may fluctuate, impaired executive functions, impairment in visuo-spatial functions, and impaired free
recall memory which usually improves with cueing)
• The presence of at least one behavioral symptom (apathy, depressed or anxious mood, hallucinations, delusions,
excessive daytime sleepiness) supports the diagnosis of Probable PD-D, lack of behavioral symptoms, however,
does not
exclude the diagnosis
C. None of the group III features present
D. None of the group IV features present
Possible PD
A. Core features: Both must be present
B. Associated clinical features:
• Atypical profile of cognitive impairment in one or more domains, such as prominent or receptive-type (fluent)
aphasia,
or pure storage-failure type amnesia (memory does not improve with cueing or in recognition tasks) with preserved
attention
• Behavioral symptoms may or may not be present
OR
C. One or more of the group III features present
D. None of the group IV features present
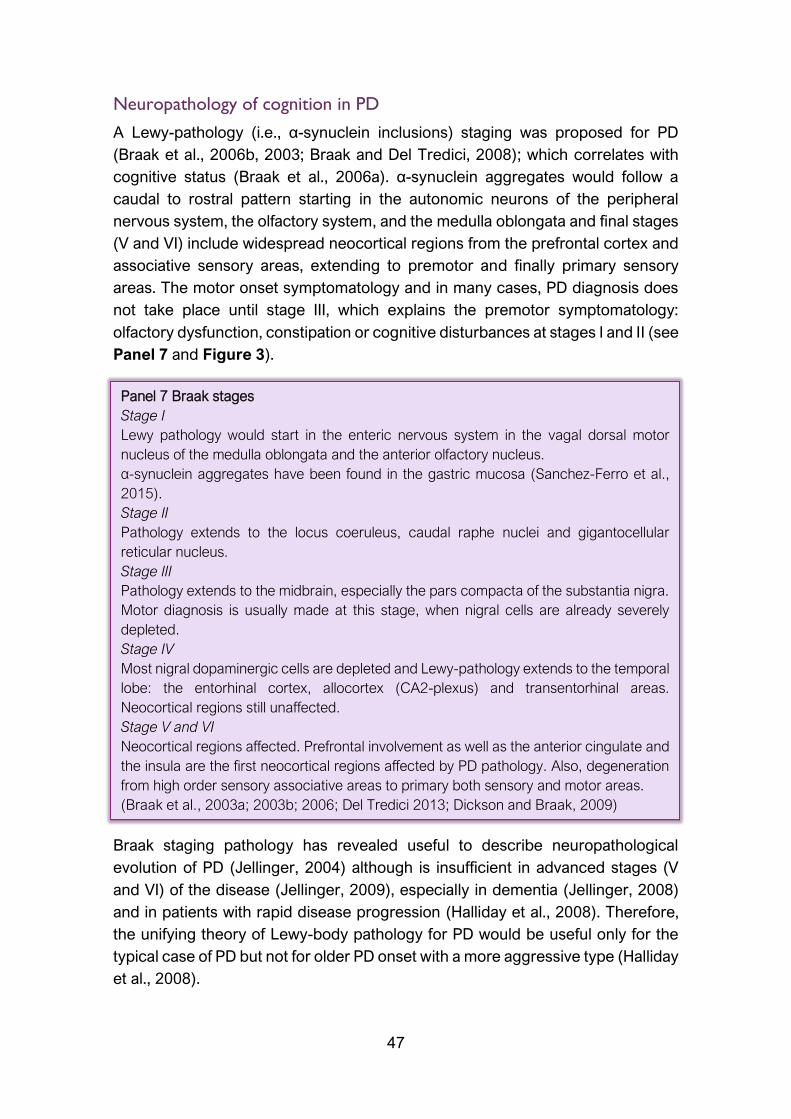
47
Neuropathology of cognition in PD
A Lewy-pathology (i.e., α-synuclein inclusions) staging was proposed for PD
(Braak et al., 2006b, 2003; Braak and Del Tredici, 2008); which correlates with
cognitive status (Braak et al., 2006a). α-synuclein aggregates would follow a
caudal to rostral pattern starting in the autonomic neurons of the peripheral
nervous system, the olfactory system, and the medulla oblongata and final stages
(V and VI) include widespread neocortical regions from the prefrontal cortex and
associative sensory areas, extending to premotor and finally primary sensory
areas. The motor onset symptomatology and in many cases, PD diagnosis does
not take place until stage III, which explains the premotor symptomatology:
olfactory dysfunction, constipation or cognitive disturbances at stages I and II (see
Panel 7 and Figure 3).
Braak staging pathology has revealed useful to describe neuropathological
evolution of PD (Jellinger, 2004) although is insufficient in advanced stages (V
and VI) of the disease (Jellinger, 2009), especially in dementia (Jellinger, 2008)
and in patients with rapid disease progression (Halliday et al., 2008). Therefore,
the unifying theory of Lewy-body pathology for PD would be useful only for the
typical case of PD but not for older PD onset with a more aggressive type (Halliday
et al., 2008).
Panel 7 Braak stages
Stage I
Lewy pathology would start in the enteric nervous system in the vagal dorsal motor
nucleus of the medulla oblongata and the anterior olfactory nucleus.
α-synuclein aggregates have been found in the gastric mucosa (Sanchez-Ferro et al.,
2015).
Stage II
Pathology extends to the locus coeruleus, caudal raphe nuclei and gigantocellular
reticular nucleus.
Stage III
Pathology extends to the midbrain, especially the pars compacta of the substantia nigra.
Motor diagnosis is usually made at this stage, when nigral cells are already severely
depleted.
Stage IV
Most nigral dopaminergic cells are depleted and Lewy-pathology extends to the temporal
lobe: the entorhinal cortex, allocortex (CA2-plexus) and transentorhinal areas.
Neocortical regions still unaffected.
Stage V and VI
Neocortical regions affected. Prefrontal involvement as well as the anterior cingulate and
the insula are the first neocortical regions affected by PD pathology. Also, degeneration
from high order sensory associative areas to primary both sensory and motor areas.
(Braak et al., 2003a; 2003b; 2006; Del Tredici 2013; Dickson and Braak, 2009)

48
The pathological mechanisms contributing to PDD are heterogeneous including
Lewy body pathology (Del Tredici and Braak, 2013; Irwin et al., 2012),
neurofibrillary tangles and senile plaques from AD (Del Tredici and Braak, 2013;
Halliday et al., 2014). Lewy body densities seem to be the most important
biological marker for PDD and cognition (Aarsland et al., 2005). Densities in the
temporal lobe differentiated PDD patients from non-demented patients (Halliday
et al., 2014; Harding and Halliday, 2001) and more importantly, independent from
the presence of neuritic plaques related to AD pathology, Lewy body presence in
the frontal gyrus was a predictor of MCI in PD (Mattila et al., 2000). Indeed, higher
Lewy pathology findings in occipital regions of PD patients indicated a more rapid
progression to dementia (Toledo et al., 2016).
However, another study found that a combination of both PD-related and AD-
related pathologies were the best predictors of PDD (Compta et al., 2011;
Jellinger, 2010). Although further research is needed, the neuropathological basis
of PDD would be formed by a synergistic effect of α-synuclein aggregates PD-
type with other pathologies specially AD-type such as amyloid-β (Delgado-
Alvarado et al., 2016) that drives the cognitive evolution of PD patients to overt
dementia (Halliday et al., 2014; Irwin and Hurtig, 2018). Interestingly, one
longitudinal study has evaluated the predictive value of several markers that could
contribute to PDD (Compta et al., 2013). Lower CSF amyloid-β levels, decline in
verbal learning, semantic fluency and visuoperceptual scores, and cortical
thinning in superior frontal, anterior cingulate and precentral regions were
significant predictors of dementia (Compta et al., 2013). In the next section,
structural MRI correlates of cognition in PD will be presented.
Figure 3 Extracted from Jellinger, 2014 Expert Review of Neurotherapeutics. Vol 14(2).
https://doi.org/10.1586/14737175.2014.877842

49
Structural MRI correlates
Structural MRI studies have reported differences between PD patients and
controls. VBM estimates the amount of GM in a voxel through its signal intensity
(Good et al., 2001; Whitwell, 2009). This technique also allows to estimate
subcortical GM structures that represent the volume. Both GM volumes and GM
density can be quantified through VBM (see Panel 1.1, on page 28). GM
reductions have been found in non-demented PD patients compared with
controls in left superior temporal gyrus (Pereira et al., 2012). Subcortically, PD
patients also had hippocampal, amygdala and nucleus accumbens volume
reductions (Biundo et al., 2013). However, VBM techniques are dependent on a
good registration of each individual and sometimes ambiguities can arise
between what is actual GM atrophy or changes in folding of gyrification
(Bookstein, 2001). In the same study that assessed VBM GM reductions in PD
patients, regional cortical thickness was found to be more correlated with age and
more extended cortical thinning regions were reported: the bilateral occipital,
bilateral inferior and left superior parietal areas, right superior temporal and
regions of the right frontal cortex including the pars opercularis, precentral and
postcentral gyri (Pereira et al., 2012).
PD-MCI
Structural MRI findings linked to cognition in PD are inconsistent. Global atrophy
measures were reported in PD large cohorts such as ventricular enlargement in
PD-MCI patients relative to controls and PD cognitively preserved patients
(Apostolova et al., 2012; Segura et al., 2014) as also reported in PDD patients
(Apostolova et al., 2010). Total GM volumes and mean cortical thickness
measures were also reduced in PD-MCI patients (Segura et al., 2014).
GM density studies have reported density reductions not surviving multiple
comparisons adjustment in the right anterior temporal gyrus, left prefrontal,
insular, right parietal and occipital areas in PD-MCI compared with controls (Song
et al., 2011). When comparing them with PD cognitively preserved patients
dissimilar in disease duration to PD-MCI, only GM density reductions were found
in the right middle frontal area (Song et al., 2011). GM volume reductions have
been reported in the left superior temporal gyrus (Yarnall et al., 2014) in PD-MCI
patients at an early stage of the disease (mean ± SD disease duration: 5.5 ± 5.0
years). Others reported no significant GM reductions in 11 subjects with early PD-
MCI (Dalaker et al., 2010) or differences in temporal and frontal areas that did not
survive multiple comparisons correction (S. W. Noh et al., 2014). With a more
advanced time in the disease (7.2 ± 5.0 years), GM differences are more evident
when comparing PD-MCI patients with controls in superior and inferior temporal
regions, in bilateral precentral and postcentral gyri, in the precuneus, superior

50
and middle frontal gyri, superior lateral occipital and subcortical regions: bilateral
amygdala, hippocampus and right putamen (Melzer et al., 2012).
Differences were found in PD-MCI patients compared with PD cognitively intact
patients in left frontal areas (Beyer et al., 2007; Mak et al., 2014; S. W. Noh et al.,
2014), left precuneus (S. W. Noh et al., 2014), left posterior cingulate (S. W. Noh
et al., 2014), and left (Beyer et al., 2007; Mak et al., 2014) and right (Beyer et al.,
2007; S. W. Noh et al., 2014) temporal regions. However, none of these results
survived multiple comparison correction and patients’ cohorts had different
disease durations.
Research from cortical thickness studies have revealed to be more sensitive to
subtle changes across the cortical mantle (Pereira et al., 2012). When analyzing
cortical parcellations, PD-MCI patients had reduced thickness in the cuneus and
the olfactory areas compared with controls (Biundo et al., 2013) and increased
mean cortical thickness compared with PD normal cognition patients in left
temporal inferior and occipital and right parietal and frontal areas including the
orbital (Biundo et al., 2013).
Vertex-wise cortical thickness differences reported that PD-MCI diagnosed
patients according to MDS criteria level II differentiate from controls in
widespread both lateral and middle posterior areas (Mak et al., 2015; Segura et
al., 2014) such as the lateral occipital, the superior and inferior parietal, the
supramarginal gyrus and the precuneus. Some authors also reported the
involvement of left frontal regions (Segura et al., 2014) and middle temporal areas
(Hanganu et al., 2013) including the parahippocampal as well as the lateral
posterior and inferior temporal gyrus. In early medicated patients, cortical
thinning was observed in frontal bilateral regions including the orbitofrontal
(Hanganu et al., 2013; Mak et al., 2015). In newly diagnosed unmedicated PD
patients reported atrophy between PD-MCI and controls groups was more focal
(Danti et al., 2015; Pereira et al., 2014). Thickness reductions were reported in
the superior frontal gyrus (Danti et al., 2015), precentral gyrus (Pereira et al.,
2014), precuneus (Danti et al., 2015; Pereira et al., 2014), superior (Pereira et al.,
2014) and inferior (Danti et al., 2015) parietal gyri, lateral and medial temporal
(Danti et al., 2015; Pereira et al., 2014) and lingual gyrus (Pereira et al., 2014).
PD patients with and without MCI also differentiated from each other in left
superior temporal, precentral (Pereira et al., 2014), insula (Danti et al., 2015),
bilateral postcentral (Pereira et al., 2014; Segura et al., 2014), right superior
frontal, middle temporal (Danti et al., 2015), superior parietal (Pereira et al., 2014)
and right supramarginal and precuneus regions (Pereira et al., 2014; Segura et
al., 2014). Nonetheless, the comprehensive neuropsychological batteries used to
diagnose level II PD-MCI patients (Pereira et al., 2014; Segura et al., 2014) did

51
not cover the language assessment as recommended (Litvan et al., 2012) or the
sample size was very small (Danti et al., 2015).
A recent coordinate-based meta-analysis including 15 studies have reported as
coincident regions of GM reductions the right supramarginal gyrus and left
posterior insula (14 studies) and the mid-cingulate (13 studies) between PD-MCI
patients and PD cognitively normal (Mihaescu et al., 2018). This meta-analysis
also investigated differences with PDD patients across 11 studies. GM reductions
in the bilateral insula differentiated PDD patients from non-demented PD patients
in all 11 studies (Mihaescu et al., 2018).
Prospective longitudinal studies are scarce probably due to attrition rates. In a
sample of early treated PD patients with mild cognitive deficits cortical thickness
reductions were found in bilateral frontal regions in precentral gyrus and pars
opercularis and in bilateral temporal regions when compared to controls over a
3-years follow-up and no baseline differences (Ibarretxe-Bilbao et al., 2012).
Cortical thinning progression was probably underestimated in this sample that did
not differentiate patients from their cognitive prognosis.
Two prospective studies with approximately 1.5 years follow-up (Hanganu et al.,
2014; Mak et al., 2015), reported widespread rates of cortical thinning in PD-MCI
compared with controls including left lateral and parts of the prefrontal cortex
(Mak et al., 2015), left lateral superior temporal cortex extending to the inferior
parietal gyrus (Mak et al., 2015), right anterior and posterior medial parts of the
temporal cortex (Hanganu et al., 2014), right superior parietal (Hanganu et al.,
2014; Mak et al., 2015) extending to the precentral and postcentral gyri (Mak et
al., 2015), and right precuneus (Hanganu et al., 2014). When comparing both PD
groups, the PD-MCI group had greater rates of atrophy in the superior lateral
temporal gyrus, medial superior parietal (Hanganu et al., 2014; Mak et al., 2015)
and superior precentral (Mak et al., 2015) atrophy.
Another study followed prospectively 22 PD de novo patients with normal
cognition over 3 years with no detectable atrophy at baseline (Tessa et al., 2014).
Over time, PD patients had increased progressive atrophy in the superior
prefrontal, anterior cingulate cortices, the caudate nucleus and the thalamus in
comparison with controls regardless their cognitive status (Tessa et al., 2014).
Given the association of PD pathology with AD, a longitudinal study investigated
the relationship between a specific pattern of regional GM atrophy found in AD
(temporal lobe areas, precuneus, posterior cingulate and peri-hippocampal white
matter) with PD neuropsychological performance (Weintraub et al., 2012).
Longitudinally, this study included non-demented PD patients and the atrophy
index in the AD-type areas was the most significant predictor of long-term
cognitive decline (Weintraub et al., 2012).

52
Overall, the presence of PD-MCI is related to greater atrophy than that observed
in controls and more importantly in PD patients with no cognitive decline. Thus,
such atrophy is not only due to disease pathological progression but also
underlies cognitive dysfunction. However, studies are inconsistent may be due to
different methodologies used to diagnose PD-MCI, the number and the type of
the neuropsychological tests employed, the different disease duration between
cohorts and that, as proposed by the dual syndrome hypothesis, not all types of
PD-MCI evolve to dementia where cortical atrophy is generalized and
widespread.
PD dementia
Reports on global brain atrophy rates over a year were significantly increased in
a small sample of PDD patients in comparison with PD non-demented patients
and controls (Burton et al., 2004). More specifically, cortical degeneration in the
medial temporal lobe has been related to PDD although less pronounced than in
dementia with Lewy bodies and AD (Tam et al., 2005). Bilateral ventricular
enlargement, posterior cortical degeneration and right caudate atrophy have
been reported in PDD patients compared with PD non-demented and controls
(Apostolova et al., 2010). Ventricular enlargement has been described in other
types of dementia such as in AD as cognitive decline predictor (Chou et al., 2010).
GM density reductions have been found in PDD patients across all cortical lobes
when comparing them with controls, although results were not corrected for
multiple comparisons (Song et al., 2011). These differences were more modest
when comparing PDD patients with PD-MCI in bilateral middle temporal, right
inferior temporal and left middle and superior prefrontal (Song et al., 2011).
From VBM-GM volumes studies, the right hippocampus, the bilateral anterior
cingulate gyrus (Summerfield et al., 2005) and the left inferior and parietal lobes
(Burton et al., 2004) were reported to be reduced in PDD patients compared with
controls. Other studies have reported uncorrected hippocampal (Beyer et al.,
2007), parahippocampal (Nagano-Saito et al., 2005) and cingulate atrophy (Beyer
et al., 2007) in the left hemisphere as well as in the right inferior frontal gyrus
(Nagano-Saito et al., 2005), occipital gyrus, bilateral temporal and amygdalar
atrophy (Beyer et al., 2007) when comparing demented patients with controls.
Between PDD patients and the non-demented group, GM reductions were found
in left fusiform and bilateral lingual gyri of the occipital lobe (Burton et al., 2004)
as well as bilateral frontal, temporal (Beyer et al., 2007; Nagano-Saito et al., 2005)
and parietal (Beyer et al., 2007) regions, in the thalamus (Beyer et al., 2007;
Nagano-Saito et al., 2005), the caudate and the right hippocampus (Nagano-Saito
et al., 2005). More interestingly, PDD patients did not differentiate from dementia
of Lewy bodies in GM reductions while AD patients had more pronounced atrophy

53
in the hippocampus, parahippocampal gyrus and inferior temporal gyrus (Burton
et al., 2004).
Longitudinally, PDD patients have more increased rates of global brain atrophy
than non-demented PD patients and control subjects (Burton et al., 2005). Indeed,
PDD patients followed up to 2 years had more discrete GM progressive
reductions than non-demented patients located in the right hemisphere, including
occipital and temporal regions whereas PD non-demented had progressive loss
in paralimbic regions and associative temporo-occipital atrophy (Ramírez-Ruiz et
al., 2005). These findings could reflect the neuropathological Braak staging
(Braak et al., 2003), that postulated at stage 4 limbic and paralimbic atrophy
preceding stages 5 and 6 that includes neocortical degeneration (Braak et al.,
2006b, 2003), see Panel 7 on page 47.
Cluster analysis techniques for the identification of PD subtypes
The most common PD classifications based on their motor and non-motor clinical
manifestations have been introduced. Reviewing the literature, one can establish
links between PD subtypes. For example, patients with severe motor impairment
including tremor and postural instability motor disturbances in turn are usually
older at disease onset or they also have PD-MCI; or PD patients with visual
hallucinations or depression symptoms are usually the ones who end up with
dementia. Therefore, the existence of one particular trait in PD that determines
prognosis is improbable and interaction between PD subtypes is not clear in the
literature. The emergence of machine learning techniques has allowed to evolve
in the study of neurodegenerative diseases. Machine learning is a discipline in the
field of the Artificial Intelligence which creates systems that learn automatically
for “understanding data” (James et al., 2013). Thus, confers the power to perform
studies free of a priori hypotheses from data-driven approaches. Figure 4
summarizes the increasing number of works that took advantage of these new
techniques in the field of PD research.

54
Machine learning techniques: cluster analysis
Cluster analysis is part of the machine learning techniques that during the past
few decades have emerged as one possible future technique for the
characterization and prediction of diseases. Though the discipline is fairly new,
some of the underlying concepts were introduced back in the XIX century.
The “method of least squares” is the root for linear regression that allows
predicting quantitative values; and later on, logistic regression was suited for
categorial variables (Hastie et al., 2008; James et al., 2013).
Most of the machine learning techniques can be divided as supervised or
unsupervised. Indeed, regression analyses would be one example of supervised
prediction (see Figure 5). Supervised methodologies are based on algorithms
that learn from a training set of labeled examples for generalization to the set of
all possible inputs. In other words, for each observation of the predictor
measurement there is an associated response measure (James et al., 2013).
0
10
20
30
40
50
60
70
80
90
100
Cluster analysis in PD Machine learning in PD PD subtypes in PD
Figure 4 Number of studies per year, from Pubmed in PD samples
(http://dan.corlan.net/medline-trend.html).

55
Figure 5 Supervised and unsupervised machine learning techniques
Machine learning
Supervised
Classificators
Discriminant
Nearest neighbor
Super vector machines (SVM)
Naïve Bayes
Regression
Linear regression
General linear models (GLM)
Super vector regression (SVR)
Decision trees
Neural networks
Gaussian Processes
Regression (GPR)
Unsupervised
Clustering
Principal components
analysis (PCA)
K-means
Hierarchical
Gaussian Mixture
Neural networks
Hidden Markov model
Semisupervised
Graph-based methods
Heuristic
Low-density separation
Reinforcement
Monte Carlo algorithm
Deep Q Network
Inverse reinforcement
learning
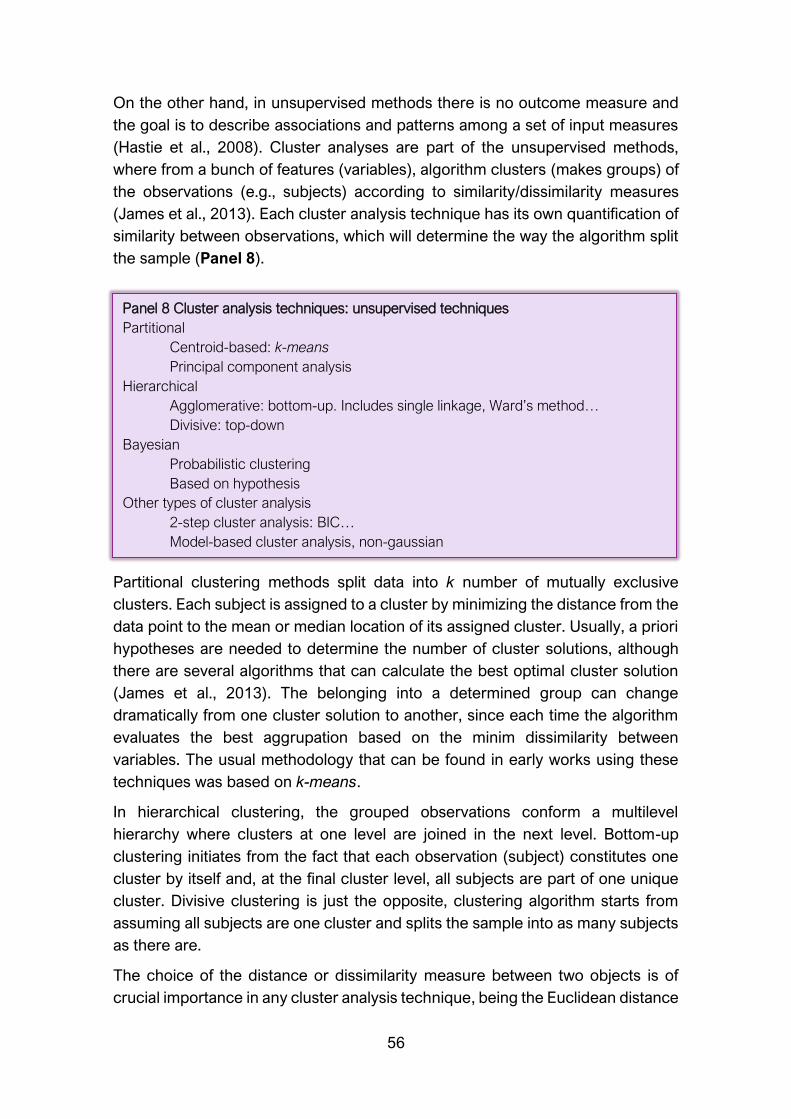
56
On the other hand, in unsupervised methods there is no outcome measure and
the goal is to describe associations and patterns among a set of input measures
(Hastie et al., 2008). Cluster analyses are part of the unsupervised methods,
where from a bunch of features (variables), algorithm clusters (makes groups) of
the observations (e.g., subjects) according to similarity/dissimilarity measures
(James et al., 2013). Each cluster analysis technique has its own quantification of
similarity between observations, which will determine the way the algorithm split
the sample (Panel 8).
Partitional clustering methods split data into k number of mutually exclusive
clusters. Each subject is assigned to a cluster by minimizing the distance from the
data point to the mean or median location of its assigned cluster. Usually, a priori
hypotheses are needed to determine the number of cluster solutions, although
there are several algorithms that can calculate the best optimal cluster solution
(James et al., 2013). The belonging into a determined group can change
dramatically from one cluster solution to another, since each time the algorithm
evaluates the best aggrupation based on the minim dissimilarity between
variables. The usual methodology that can be found in early works using these
techniques was based on k-means.
In hierarchical clustering, the grouped observations conform a multilevel
hierarchy where clusters at one level are joined in the next level. Bottom-up
clustering initiates from the fact that each observation (subject) constitutes one
cluster by itself and, at the final cluster level, all subjects are part of one unique
cluster. Divisive clustering is just the opposite, clustering algorithm starts from
assuming all subjects are one cluster and splits the sample into as many subjects
as there are.
The choice of the distance or dissimilarity measure between two objects is of
crucial importance in any cluster analysis technique, being the Euclidean distance
Panel 8 Cluster analysis techniques: unsupervised techniques
Partitional
Centroid-based: k-means
Principal component analysis
Hierarchical
Agglomerative: bottom-up. Includes single linkage, Ward’s method…
Divisive: top-down
Bayesian
Probabilistic clustering
Based on hypothesis
Other types of cluster analysis
2-step cluster analysis: BIC…
Model-based cluster analysis, non-gaussian

57
the most commonly used. However, dissimilarity only refers to pairs of
observations (or subjects). Specially in hierarchical methods, once the first
aggrupation has been made, the distance will be calculated between two clusters
where at least one will contain multiple observations (see dendrogram in Figure
6). Therefore, the dissimilarity between pairs of clusters made in the previous step
will be referred to as linkage measures. The most common types are the complete
linkage, the average, single, centroid and Ward’s method (see Table 3 on page
58).
Figure 6 Dendrogram example, modified from the Matlab website help
(https://es.mathworks.com/help/stats/dendrogram.html?lang=en). In orange a
distance similarity between two observations. In purple linkage distance between two
previously formed clusters
Once two observations are clustered, in the next level the aggrupation already
considers the former two observations as one that in the same turn will cluster
with other single observations or clusters.
There is no standard single criterion that allows to choose the best clustering
method. In fact, depending on the type of the data and the aims, multiple
clustering techniques will be fitted. For example, a study could aim to explore how
the subjects of a sample tend to group. However, there is no clear predefined
hypothesis that implies the sample should be divided by an n number of clusters.
In this case, hierarchical clustering techniques are suitable to explore different
levels of aggrupation since they not only give groups but also a structure (James
et al., 2013).

58
Between linkage methods, each can be best fitted depending on the distribution
of the data. An early study that compared several types of linkage methods
reported that among all, Ward’s was the best classifier (Blashfield, 1976).
However, the presence of outliers in the features (variables) included in the
clustering analysis worsen its performance. Indeed, cluster analysis can be also
useful to detect the presence of outliers and after the exclusion, the algorithm can
be re-run (Milligan, 1980).
Table 3 Types of linkage methods
Extracted from James et al., 2013 Statistical Learning. Springer Texts in Statistics.
Multidimensional subtypes in PD based on clinical data
In 1999 a first paper was published with the aim to characterize PD clinical
variants from a data-driven approach (Graham and Sagar, 1999). In this study
using non-hierarchical cluster analysis, motor function, mood disorders, different
aspects of cognition and demographics such as disease duration variables were
used to identify three distinct subtypes of PD: the “motor-only”, the “motor and
cognitive” and the “rapid progression” subtype. These 3 subgroups identified via
data-driven methodology were in accordance of previous literature described: the
first “motor-only” suggested nigro-putaminal dopamine deficiency, the second
subtype could have additional non-dopaminergic implications more related to
Linkage Description
Complete Maximal intercluster dissimilarity. Compute all pairwise dissimilarities
between the observations in cluster A and the observations in cluster B
and record the largest of these dissimilarities.
Single Minimal intercluster dissimilarity. Compute all pairwise dissimilarities
between the observations in cluster A and the observations in cluster B
and record the smallest of these dissimilarities. Single linkage can result
in extended, trailing clusters in which single observations are fused one-
at-a-time.
Average Mean intercluster dissimilarity. Compute all pairwise dissimilarities
between the observations in cluster A and the observations in cluster B
and record the average of these dissimilarities.
Centroid A centroid is the vector of the n feature means for the observations in the
cluster; in other words, they are the mean of the observations assigned
to each cluster. Dissimilarity between the centroid for cluster A (a mean
vector of length p) and the centroid for cluster B. Centroid linkage can
result in undesirable inversions.
Ward Uses the incremental sum of squares; that is, the increase in the total
within-group sum of squares as a result of joining groups A and B.
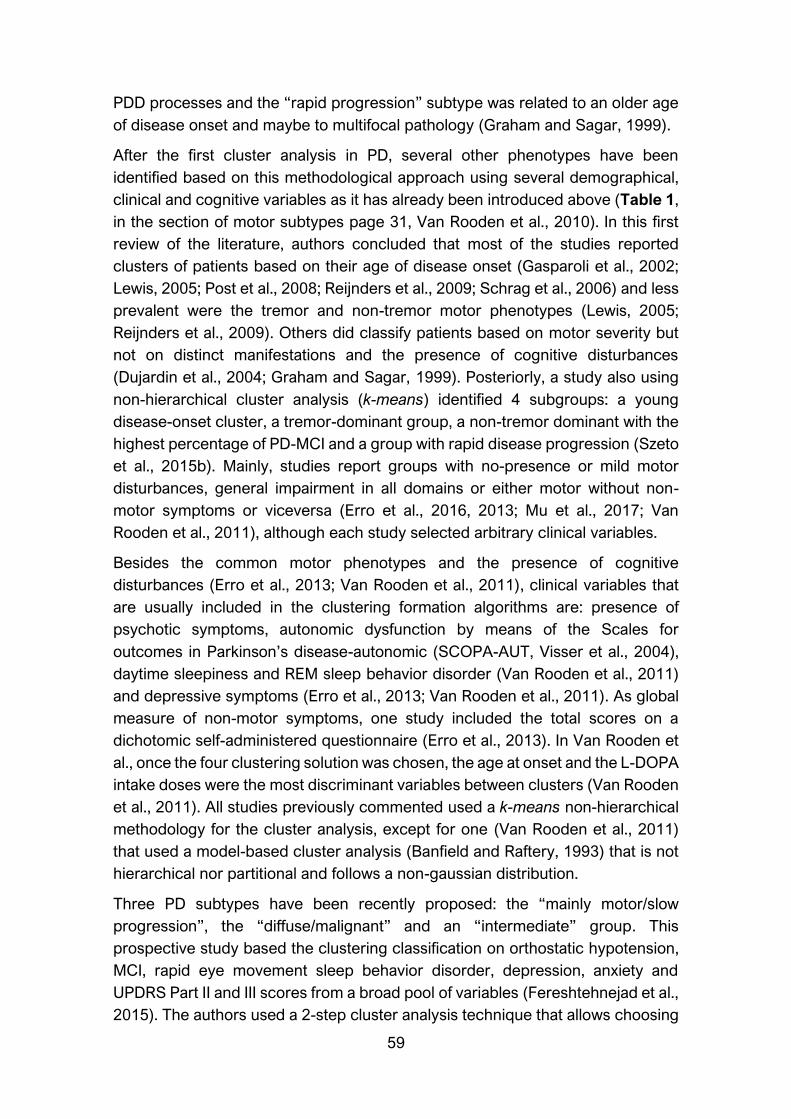
59
PDD processes and the “rapid progression” subtype was related to an older age
of disease onset and maybe to multifocal pathology (Graham and Sagar, 1999).
After the first cluster analysis in PD, several other phenotypes have been
identified based on this methodological approach using several demographical,
clinical and cognitive variables as it has already been introduced above (Table 1,
in the section of motor subtypes page 31, Van Rooden et al., 2010). In this first
review of the literature, authors concluded that most of the studies reported
clusters of patients based on their age of disease onset (Gasparoli et al., 2002;
Lewis, 2005; Post et al., 2008; Reijnders et al., 2009; Schrag et al., 2006) and less
prevalent were the tremor and non-tremor motor phenotypes (Lewis, 2005;
Reijnders et al., 2009). Others did classify patients based on motor severity but
not on distinct manifestations and the presence of cognitive disturbances
(Dujardin et al., 2004; Graham and Sagar, 1999). Posteriorly, a study also using
non-hierarchical cluster analysis (k-means) identified 4 subgroups: a young
disease-onset cluster, a tremor-dominant group, a non-tremor dominant with the
highest percentage of PD-MCI and a group with rapid disease progression (Szeto
et al., 2015b). Mainly, studies report groups with no-presence or mild motor
disturbances, general impairment in all domains or either motor without non-
motor symptoms or viceversa (Erro et al., 2016, 2013; Mu et al., 2017; Van
Rooden et al., 2011), although each study selected arbitrary clinical variables.
Besides the common motor phenotypes and the presence of cognitive
disturbances (Erro et al., 2013; Van Rooden et al., 2011), clinical variables that
are usually included in the clustering formation algorithms are: presence of
psychotic symptoms, autonomic dysfunction by means of the Scales for
outcomes in Parkinson’s disease-autonomic (SCOPA-AUT, Visser et al., 2004),
daytime sleepiness and REM sleep behavior disorder (Van Rooden et al., 2011)
and depressive symptoms (Erro et al., 2013; Van Rooden et al., 2011). As global
measure of non-motor symptoms, one study included the total scores on a
dichotomic self-administered questionnaire (Erro et al., 2013). In Van Rooden et
al., once the four clustering solution was chosen, the age at onset and the L-DOPA
intake doses were the most discriminant variables between clusters (Van Rooden
et al., 2011). All studies previously commented used a k-means non-hierarchical
methodology for the cluster analysis, except for one (Van Rooden et al., 2011)
that used a model-based cluster analysis (Banfield and Raftery, 1993) that is not
hierarchical nor partitional and follows a non-gaussian distribution.
Three PD subtypes have been recently proposed: the “mainly motor/slow
progression”, the “diffuse/malignant” and an “intermediate” group. This
prospective study based the clustering classification on orthostatic hypotension,
MCI, rapid eye movement sleep behavior disorder, depression, anxiety and
UPDRS Part II and III scores from a broad pool of variables (Fereshtehnejad et al.,
2015). The authors used a 2-step cluster analysis technique that allows choosing

60
the best number of clusters and the selected clinical variables were also chose
from the Bayesian information criterion. More recently, the same team has
published a hierarchical cluster analysis on newly diagnosed drug naïve PD
patients using 18 variables as features that included motor and non-motor clinical
variables including neuropsychological performance and blood biomarkers
(Fereshtehnejad et al., 2017). Unfortunately, structural MRI markers and CSF
levels could not be part of the features in cluster analysis. Authors replicated
previous results, identifying three clusters of “mild motor-predominant”,
“intermediate” and “diffuse malignant”. Of high relevance was the fact that the
diffuse malignant subtype had higher GM cortical atrophy compared with the
other two subtypes and healthy controls as well as greater caudate denervation,
and lower amyloid-β levels in CSF. Overall suggesting that in de novo PD patients
with similar disease duration and demographical characteristics, there exists
substantial differences in clinical and biomarker measurements (Fereshtehnejad
et al., 2017).
Cluster analysis techniques have been used to identify cognitive phenotypes. A
study based on k-means found five different cognitive groups of patients based
on their cognitive performance (Dujardin et al., 2013). The groups composed a
gradient from the cognitively intact group to a group of patients with severe
impairment in all cognitive domains. In between there was a group of patients with
no cognitive impairment but slight mental slowing, mild impairment in cognition
except for recognition memory and a fourth patient with all domains impaired
(Dujardin et al., 2013). In a recent work, PD de novo patients were also classified
according to their cognitive profile (LaBelle et al., 2017). In this study, the cluster
classification algorithm was like that used for exploratory factor analysis. Six
classes were found in a sample of 424 newly diagnosed drug naïve PD patients.
There were two opposing groups in the extremes: the weak overall group with
mainly impairment in all the neuropsychological tests and the strong overall group
with a high standing performance. In between there was a group with average
normal-range z-scores in all subtests. The other three classes reported were
based on authors assumptions. There was an amnestic group with deficits in
learning and recall verbal memory. Another class with marked visuospatial
impairment (as measured by the Judgement of Line Orientation Test).The sixth
group was the “Strong-Memory” performance that, besides the outstanding
performance in the two verbal memory tests, patients showed poor performance
in the visuospatial task (LaBelle et al., 2017). These two studies overlapped in the
extreme subgroups: the cognitively intact and the one with severe cognitive
impairment, while the in between clusters were not that clear, possibly due to the
use of different number of tests and variety. Indeed, the last commented study
(LaBelle et al., 2017) used a more limited neuropsychological battery. The finding

61
of an outstanding group (LaBelle et al., 2017) could be also due to the biased
sample characteristics.
Table 4 summarizes all cluster analysis studies in PD based on clinical data.

Table 4 Cluster analysis studies in PD
PD sample Technique Features evaluated Clusters Description Clinical characteristics
Graham 1999
(motor and non-
motor clinical
subtypes)
176
(un)medicated
PD
Mean disease
duration: 7.5
years
k-means Age of onset and disease
duration
UPDRS-II, activities of the daily
living
UPDRS-III, motor section
BDI, depression symptoms
Premorbid IQ
Global cognition, dementia
scale
Visuospatial function
Executive function, working
memory and attentional tests.
5 Group 1: good motor
control without MCI.
Group 2: good motor
control with cognitive
deficits of the ‘‘executive’’
type.
Group 3: older age of
onset, poor motor control
with motor complications,
and global MCI.
Group 4: poor
motor control without MCI.
Group 5: poor motor
control with moderately
severe global cognitive
impairment.
Authors described 3 main
PD phenotypes from the 5
clusters:
“motor only”: Groups 1
and 4
“motor and cognitive”:
Groups 2 and 5
“rapid progression”:
Group 3
Gasparoli 2002
(motor and non-
motor clinical
subtypes)
103 early PD <5
years
Prospective 5-
years follow-up
study
Not specified UPDRS-III motor section
presence of motor fluctuations
dyskinesia at 5 years
2 Slow progression: earlier age at onset, lateralization of
parkinsonian signs, prevalence of rest tremor
Rapid progression: older age, no lateralization of
parkinsonian signs, bradykinesia-rigidity and PIGD

PD sample Technique Features evaluated Clusters Description Clinical characteristics
Dujardin 2004
(motor and non-
motor clinical
subtypes)
44 PD
unmedicated
PD patients
Prospective 3-
years follow-up
study
k-means +
stepwise
discriminant
analysis
Age and education
UPDRS-III, motor section
7 neuropsychological variables
subset from Principal
Component Analysis (PCA):
Stroop test, semantic and
phonetic fluency, verbal
memory learning, recall and
recognition tests, Mattis DRS
scores.
Measurements were from time
2.
Discriminant analysis was
performed on 25 variables:
neuropsychological,
demographic and 10 ROI from
SPECT data.
Data were from time 1.
3,
reduced
to 2
Cluster 1: no MCI and less severe motor disturbances
than C2.
Cluster 2: reduced overall cognitive efficiency and
exacerbated subcorticofrontal syndrome
Cluster 3: 2 patients with dementia at follow-up,
discarded.
Lewis 2005
(motor and non-
motor clinical
subtypes)
120 early
stages PD
k-means age of onset, rate of disease
progression, L-DOPA doses
UPDRS-III, motor phenotype
score
BDI, depression symptoms
Premorbid IQ
MMSE, global cognition
PRM, pattern recognition
memory
TOL, Tower of London
4 C1: younger disease onset
Mean age: 60 years and
age of onset: 50
C2: tremor dominant
C3: non-tremor dominant
with significant levels of
cognitive
impairment and mild
depression
C4: rapid disease
progression but no MCI
younger onset and tremor
subtypes: slow rate of
disease progression, mild
motor symptoms, no MCI
non-tremor subtype: MCI
executive impairment
type, depression and
more rapid disease
progression
rapid disease
progression: aggressive
course, but no severe
motor disturbances or
MCI than other groups.
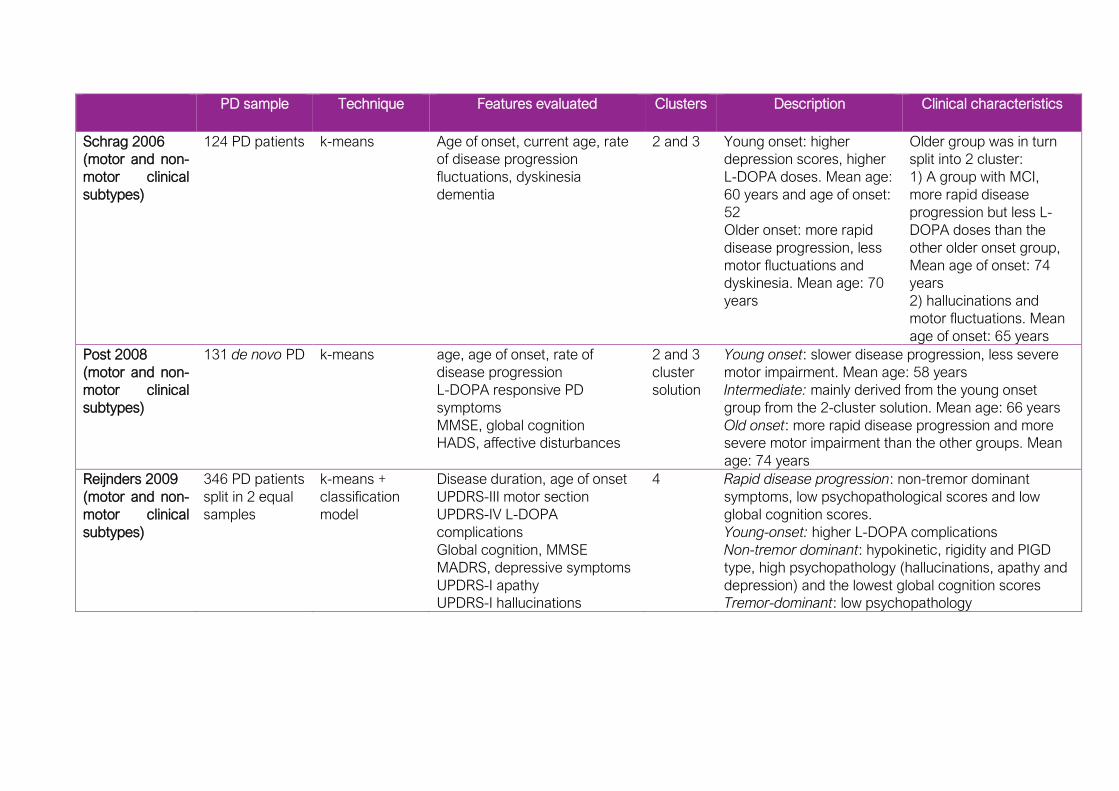
PD sample Technique Features evaluated Clusters Description Clinical characteristics
Schrag 2006
(motor and non-
motor clinical
subtypes)
124 PD patients k-means Age of onset, current age, rate
of disease progression
fluctuations, dyskinesia
dementia
2 and 3 Young onset: higher
depression scores, higher
L-DOPA doses. Mean age:
60 years and age of onset:
52
Older onset: more rapid
disease progression, less
motor fluctuations and
dyskinesia. Mean age: 70
years
Older group was in turn
split into 2 cluster:
1) A group with MCI,
more rapid disease
progression but less L-
DOPA doses than the
other older onset group,
Mean age of onset: 74
years
2) hallucinations and
motor fluctuations. Mean
age of onset: 65 years
Post 2008
(motor and non-
motor clinical
subtypes)
131 de novo PD k-means age, age of onset, rate of
disease progression
L-DOPA responsive PD
symptoms
MMSE, global cognition
HADS, affective disturbances
2 and 3
cluster
solution
Young onset: slower disease progression, less severe
motor impairment. Mean age: 58 years
Intermediate: mainly derived from the young onset
group from the 2-cluster solution. Mean age: 66 years
Old onset: more rapid disease progression and more
severe motor impairment than the other groups. Mean
age: 74 years
Reijnders 2009
(motor and non-
motor clinical
subtypes)
346 PD patients
split in 2 equal
samples
k-means +
classification
model
Disease duration, age of onset
UPDRS-III motor section
UPDRS-IV L-DOPA
complications
Global cognition, MMSE
MADRS, depressive symptoms
UPDRS-I apathy
UPDRS-I hallucinations
4 Rapid disease progression: non-tremor dominant
symptoms, low psychopathological scores and low
global cognition scores.
Young-onset: higher L-DOPA complications
Non-tremor dominant: hypokinetic, rigidity and PIGD
type, high psychopathology (hallucinations, apathy and
depression) and the lowest global cognition scores
Tremor-dominant: low psychopathology
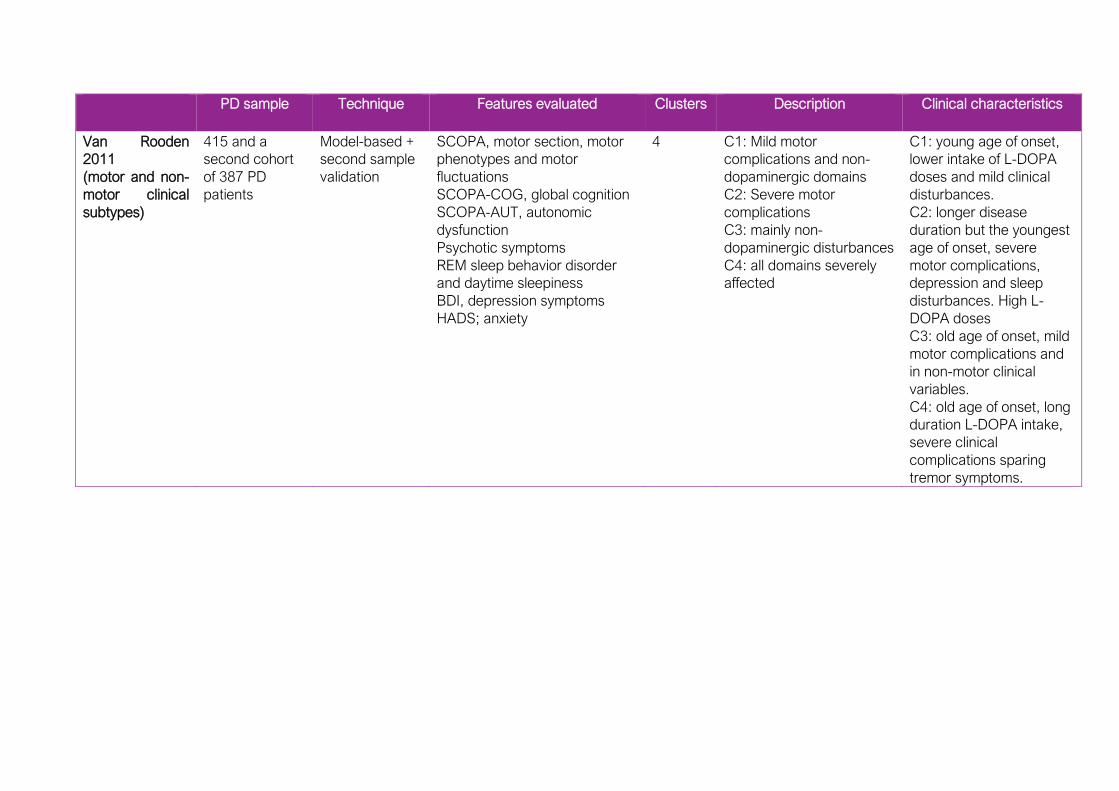
PD sample Technique Features evaluated Clusters Description Clinical characteristics
Van Rooden
2011
(motor and non-
motor clinical
subtypes)
415 and a
second cohort
of 387 PD
patients
Model-based +
second sample
validation
SCOPA, motor section, motor
phenotypes and motor
fluctuations
SCOPA-COG, global cognition
SCOPA-AUT, autonomic
dysfunction
Psychotic symptoms
REM sleep behavior disorder
and daytime sleepiness
BDI, depression symptoms
HADS; anxiety
4 C1: Mild motor
complications and non-
dopaminergic domains
C2: Severe motor
complications
C3: mainly non-
dopaminergic disturbances
C4: all domains severely
affected
C1: young age of onset,
lower intake of L-DOPA
doses and mild clinical
disturbances.
C2: longer disease
duration but the youngest
age of onset, severe
motor complications,
depression and sleep
disturbances. High L-
DOPA doses
C3: old age of onset, mild
motor complications and
in non-motor clinical
variables.
C4: old age of onset, long
duration L-DOPA intake,
severe clinical
complications sparing
tremor symptoms.

PD sample Technique Features evaluated Clusters Description Clinical characteristics
Dujardin 2013
(cognitive
subtypes)
557 PD patients k-means 13 neuropsychological
variables:
Global efficiency, Verbal
episodic memory, Stroop test,
Digits span, TMT, verbal
fluencies, visuospatial abilities,
speed processing
5 Cluster 1: cognitively intact
Cluster 2: cognitively
normal, slightly slowed
mental speed, working
memory, verbal memory
and executive function
Cluster 3: overall cognitive
impairment, recognition
memory spared.
Cluster 4: all cognitive
domains impaired,
including memory
recognition but with spare
of mental flexibility
Cluster 5: all cognitive
domains severely impaired.
C1: younger and more
educated.
C3,4 and 5: more severe
motor symptoms, longer
disease duration, and
more axial signs.
C4 and 5: hallucinations,
depression, apathy and
higher blood pressure
C5: more presence of
dementia
Erro 2013
(motor and non-
motor clinical
subtypes)
100 de novo PD
patients
Longitudinal 2-
years follow-up
k-means UPDRS-III, motor section
NMS; questionnaire non-motor
symptoms, divided also by
domains
MMSE, global cognition
FAB, frontal assessment battery
HADS, anxiety and depression
Cluster analysis was performed
on time 1 measures
4 Benign pure motor: younger age at onset, mild motor
disturbances
Benign mixed motor and non-motor: mild motor
impairment, presence of mild non-motor symptoms
such as frontal cognitive impairment, depression and
anxiety
Non-motor dominant: higher memory impairment,
digestive and sleep disturbances, depression and
anxiety symptoms
Motor dominant: high motor impairment, rapid
progression rate, depression, anxiety, frontal cognitive
impairment.

PD sample Technique Features evaluated Clusters Description Clinical characteristics
Fereshtehnejad
2015
(motor and non-
motor clinical
subtypes)
113 PD patients
Prospective 4.5
years follow-up
2-step cluster
analysis
Most informative variables for
cluster solutions:
UPDRS-III, motor section
UPDRS-II, activities of the daily
living
REM sleep behavior disorder
MCI
Systolic blood pressure
Analysis was performed with
variables at time 1
3 Mainly motor/slow
progression: tremor
phenotypes and
uncommon falls and
freezing.
Diffuse/malignant: higher
presence of falls and gait
disturbances, MCI
multidomain (frontal and
posterior), orthostatic
hypotension, REM sleep
behavior disorder and
hallucinations.
Intermediate: drop of
systolic blood pressure, no
MCI, intermediate scores
on REM disorder,
depression and anxiety
At follow-up,
diffuse/malignant had
more rapid disease
progression, increased
the presence of motor
and non-motor symptoms
and patients more likely
developed dementia.
Szeto 2015b
(motor and non-
motor clinical
subtypes)
209 PD patients
Mean disease
duration: 6
years
k-means Age of onset, rate of disease
progression
UPDRS-III, motor phenotype
score
Premorbid IQ
MMSE, global cognition
Logical Memory II, TMT B, BDI,
depression symptoms
L-DOPA dosage
4 Young age of onset
Tremor dominant: low L-DOPA doses and no cognitive
impairment
Non-tremor dominant: high L-DOPA doses, global
cognitive impairment and Trail Making Test B impaired
scores.
Rapid disease progression: no severe cognitive
impairment or motor disability

PD sample Technique Features evaluated Clusters Description Clinical characteristics
Erro 2016
(motor and non-
motor clinical
subtypes)
398 newly
diagnosed PD
patients
k-means Gender, age at onset
MDS-UPDRS-III
MoCA, global cognition
GDS, depression symptoms
STAI, anxiety
UPSIT, hyposmia
RBDSQ, sleep disturbances
SCOPA-AUT autonomic
dysfunction
MDS-UPDRS-I for apathy,
hallucinations, fatigue
3 G1: lowest motor and non-
motor burden
G2 and G3 had similar
motor dysfunction, greater
than G1.
G2 had greater non-motor
disturbances (apathy,
hallucinations and fatigue)
than G3.
123[I]-FP-CIT binding
SPECT scan:
G1 less nigral-striatal
denervation
Fereshtehnejad
2017
(motor and non-
motor clinical
subtypes)
421 de novo PD
patients
Prospective
study of at least
1 year
Agglomerative
hierarchical,
Euclidean
distance
age, genetic risk score,
orthostatic systolic
blood pressure drop, MDS-
UPDRS-Part II, MDS-UPDRS
Part III, tremor/PIGD scores,
ESS, GDS, STAI, QUIP,
RBDSQ, SCOPA-AUT, UPSIT,
and average z-scores of
visuospatial, speed/attention,
memory and executive function
3 Mild-motor: younger
patients, mild motor
disturbances and mild non-
motor including preserved
cognitive decline
compared with the other
two groups
Intermediate: patients with
clinical scores in between
the two extreme clusters.
Diffuse/malignant: severe
motor and non-motor
impairment except for
olfactory dysfunction and
hallucinations
GM atrophy from
deformation-based
morphometry measures:
diffuse/malignant >
intermediate > mild-motor
Diffuse/malignant subtype
had the lowest CSF
amyloid-β and total tau
levels.

PD sample Technique Features evaluated Clusters Description Clinical characteristics
LaBelle 2017
(cognitive
subtypes)
424 de novo PD
patients
Latent class
analysis
Neuropsychological variables:
Verbal fluency
SDMT, speed-processing
JLO, visuospatial
Working memory, letter
sequence
Verbal memory, learning and
recall
6 Weak-overall: worse performance in all test scores
Typical overall: average performance in all cognitive
domains
Strong-memory: poor visuospatial function and good
performance in learning and recall verbal memory
Weak-visuospatial: as in the strong memory domain,
visuospatial impairment but with no outstanding
performance in any other test
Amnestic: impairment in verbal memory learning and
recall and slight impairment in verbal fluency tests
Strong-overall: outstanding performance in all tests,
especially in the verbal memory domain

70
Cluster analysis from objective MRI measurements
Frequently, clinical and cognitive features are used to subtype patients.
Nevertheless, clinical variables are instrument and examiner-dependent. In other
neurodegenerative diseases, machine learning techniques have been used on
objective data such as MRI measurements, which have revealed as potential tools
for identifying biomarkers.
In AD, unsupervised agglomerative hierarchical cluster analysis revealed three
differential patterns of cortical atrophy based on cortical thickness data from the
whole cortical mantle (Y. Noh et al., 2014). From the three patterns, one had
diffused widespread cortical atrophy while the other two presented parietal
dominant atrophy and the third medial temporal cortical thinning.
In frontotemporal dementia, a study also based on hierarchical clustering using
GM volumes from 26 regions of interest found 4 subgroups of different cortical
GM atrophy compared with controls from a whole-brain voxel-based
morphometry approach (Whitwell et al., 2009). Authors reported a pattern of
frontal dominant GM atrophy, another frontotemporal, a third temporo-fronto-
parietal (widespread) and a final cortical atrophy pattern of temporal-predominant
atrophy.
In PD, supervised machine learning techniques have also allowed discriminating
PD-MCI patients from cognitively normal patients based on functional
connectomics via supervised machine learning techniques (Abós et al., 2017).
Motor subtypes have been identified through supervised methods of multimodal
MRI information (Cherubini et al., 2014b). Indeed, multimodal MRI measures
discriminated PD patients and multiple system atrophy patients (Péran et al.,
2018) and also PD from progressive supranuclear palsy (Cherubini et al., 2014a).
Nonetheless, no previous studies have attempted to identify different patterns of
regional atrophy among PD patients as performed in AD or frontotemporal
dementia (Y. Noh et al., 2014; Whitwell et al., 2009).
From the case studies to big data
The most frequent limitation in studies with patients is the small sample size that
prevents the generalization of the results. In addition, PD cohorts are usually
biased since they are not usually community-based, but from outpatient clinics.
These could partially contribute to the great heterogeneity observed in the
multidimensionality of PD. Similar to the efforts made with other diseases such as
in AD (http://adni.loni.usc.edu/) or in psychiatric disorders
(http://enigma.ini.usc.edu/), a multi-site consortium was created for the study of
PD. The Parkinson’s Progression Markers Initiative (PPMI) has the mission to
identify biomarkers of PD progression (https://www.ppmi-info.org/). PPMI has
enrolled a great variety and a large number of PD patients over the world from all

71
participating centers. Indeed, one of the studies presented in this thesis has been
performed on MRI and clinical data from the de novo PD cohort in PPMI database.
Some of the papers from early unmedicated PD groups that have been reviewed
in this introduction used PPMI data (Eisinger et al., 2017; Erro et al., 2016;
Fereshtehnejad et al., 2017; LaBelle et al., 2017; Pereira et al., 2014; Simuni et
al., 2016). The de novo cohort enrolled up to 430 eligible PD participants and
almost 200 healthy controls that have been followed-up to 8 years. The
consortium also has data of three more cohorts: prodromal PD participants
(without PD diagnosis) with diagnosis of hyposmia or REM sleep behavior
disorder, PD participants without evidence of dopaminergic deficits assessed with
DaTSCAN and a genetic cohort with PD and non-PD diagnosis with genetic
mutations in LRRK2, GBA or SNCA. PPMI database includes a wide range of
meaningful data: demographics, clinical, MRI, PET, SPECT, genome sequencing
data, biospecimens such as CSF, DNA, RNA, plasma, serum, urine and blood
(Marek et al., 2011).
All the efforts made for identifying PD subtypes finally aim to identify risk factors
and gold standard biomarkers to predict PD dementia and therefore, prevent
patients losing their independency. A recent review in the Brain journal has
investigated the power of MRI techniques in predicting this late stage of PD
(Lanskey et al., 2018). As final remarks of what could be the future, and actually
the present in this field, authors mention multimodal predictors based on machine
learning techniques that can predict cognitive decline. However, these algorithms
are far from being the key to PD dementia prevention, meanwhile research fails
to identify the exact factors that machine learning algorithms need for adequately
identifying PD patients’ prognosis.

72

73
Chapter 2
Objectives and hypotheses This thesis is contextualized in the identification of PD subtypes based on
objective MRI quantitative measures that can serve as markers of PD progression
and that would be research center and examiner-independent. The general
objective of this thesis is to characterize structural changes in Parkinson’s disease
over the course of the neurodegenerative process as well as to relate these
changes to neuropsychological performance. This aim pursues to identify MRI
and neuropsychological markers of higher risk to evolve to dementia.
The general hypothesis is that there are different patterns of cortical atrophy
related to cognition in Parkinson’s disease already present at the time of the
diagnosis and these patterns progress over the course of the disease.
Specific objectives
1. to describe patterns of cortical thickness alterations in PD patients through
cluster analysis approach at different stages of the disease.
2. to investigate the clinical and cognitive correlates of the atrophy patterns
identified.
3. to explore the cortical brain progression and cognitive decline of the patients
identified in each pattern.
Specific hypotheses
1. distinct cortical atrophy patterns in PD would be present in de novo,
unmedicated patients regardless the presence of MCI.
1.1. the presence of cortical atrophy would be focal.
2. different patterns of cortical thickness alterations would be present in
medicated Parkinson's disease patients.
2.1. such patterns would present more extensive regional thinning than the de
novo patients.
2.2. these brain atrophy patterns would be linked to different cognitive and/or
clinical profiles.
2.3. patients with a frontal pattern of atrophy would have executive function
and working memory impairment.
2.4. patients with a posterior-predominant pattern would have more presence
of visual hallucinations and several cognitive deficits such as memory or
visuospatial impairment.
3. patterns of cortical thinning identified in the medicated PD sample would
follow a different progression over time.

74
3.1. greater extent of progressive atrophy would be linked to greater motor
severity and/or to an older age of disease onset.
3.2. there would be a pattern of patients with higher proportion of dementia
and/or PD-MCI converters.
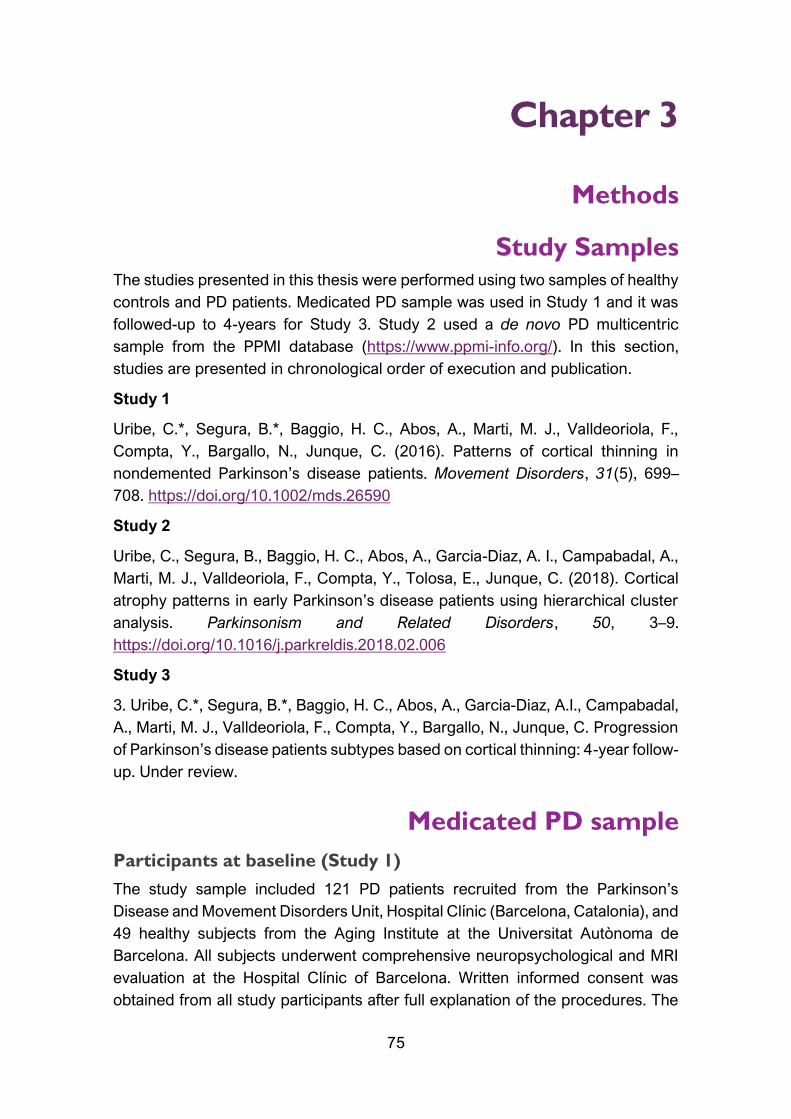
75
Chapter 3
Methods
Study Samples The studies presented in this thesis were performed using two samples of healthy
controls and PD patients. Medicated PD sample was used in Study 1 and it was
followed-up to 4-years for Study 3. Study 2 used a de novo PD multicentric
sample from the PPMI database (https://www.ppmi-info.org/). In this section,
studies are presented in chronological order of execution and publication.
Study 1
Uribe, C.*, Segura, B.*, Baggio, H. C., Abos, A., Marti, M. J., Valldeoriola, F.,
Compta, Y., Bargallo, N., Junque, C. (2016). Patterns of cortical thinning in
nondemented Parkinson’s disease patients. Movement Disorders, 31(5), 699–
708. https://doi.org/10.1002/mds.26590
Study 2
Uribe, C., Segura, B., Baggio, H. C., Abos, A., Garcia-Diaz, A. I., Campabadal, A.,
Marti, M. J., Valldeoriola, F., Compta, Y., Tolosa, E., Junque, C. (2018). Cortical
atrophy patterns in early Parkinson’s disease patients using hierarchical cluster
analysis. Parkinsonism and Related Disorders, 50, 3–9.
https://doi.org/10.1016/j.parkreldis.2018.02.006
Study 3
3. Uribe, C.*, Segura, B.*, Baggio, H. C., Abos, A., Garcia-Diaz, A.I., Campabadal,
A., Marti, M. J., Valldeoriola, F., Compta, Y., Bargallo, N., Junque, C. Progression
of Parkinson’s disease patients subtypes based on cortical thinning: 4-year follow-
up. Under review.
Medicated PD sample
Participants at baseline (Study 1)
The study sample included 121 PD patients recruited from the Parkinson’s
Disease and Movement Disorders Unit, Hospital Clínic (Barcelona, Catalonia), and
49 healthy subjects from the Aging Institute at the Universitat Autònoma de
Barcelona. All subjects underwent comprehensive neuropsychological and MRI
evaluation at the Hospital Clínic of Barcelona. Written informed consent was
obtained from all study participants after full explanation of the procedures. The

76
study was approved by the institutional Ethics Committee from the University of
Barcelona (IRB00003099).
Inclusion criteria for patients were: (i) fulfilling the UK PD Society Brain Bank
diagnostic criteria for PD (Hughes et al., 1992); (ii) no surgical treatment with
deep-brain stimulation.
Exclusion criteria for PD patients and healthy controls (HC) were: (i) dementia
according to the MDS criteria (Emre et al., 2007), (ii) H&Y scale (Hoehn and Yahr,
1967) score > 3, (iii) young-onset PD, (iv) age below 50 years, (v) presence of
severe psychiatric or neurological comorbidity, (vi) low global intellectual quotient
(IQ) estimated by the Vocabulary subtest of the Wechsler Adult Intelligence Scale,
3rd edition (scalar score ≤ 7), (vii) MMSE (Folstein et al., 1975) score below 25,
(viii) presence of claustrophobia, (ix) pathological MRI findings other than mild
white-matter hyperintensities in the FLAIR sequence or any others that might be
related to PD, and (x) MRI artifacts.
Eighty-eight PD patients and 31 HC were finally selected. Twelve patients and 8
HC were excluded because they fulfilled criteria for dementia or other
neurological disease; 6 patients for psychiatric comorbidity; 1 patient with H&Y
score > 3; 1 patient who had young-onset PD; 3 patients and 1 HC with low global
IQ score; 2 patients for claustrophobia; 3 HC who did not complete the
neuropsychological assessment, and 2 patients and 2 HC due to MRI artifacts.
We also excluded 4 patients and 3 HC aged below 50 years, and 2 patients and
1 HC because they were outliers in cluster analyses, constituting a cluster by
themselves.
Participants of the longitudinal sample over 4-years (Study 3)
Forty-five PD patients and 22 HC returned for follow-up at 3.8±0.4 years apart
(range: 3.1-5.3).
At follow-up, a diagnosis of dementia, H&Y score > 3 and MMSE scores below 25
were not considered as exclusion criteria.
At time 2, two patients underwent deep brain stimulation, five patients and one
HC died, twelve PD patients and two controls refused to participate or had moved
at follow-up, three PD patients and three controls had developed
neurological/psychiatric comorbidities, fifteen PD patients had functional
impairment and reduced mobility that prevented going to the hospital for MRI
scanning, six patients and three HC had MRI motion artifacts or could not finish
the scanning protocol and one patient and was excluded due to problems in
longitudinal image preprocessing. See Figure 7.
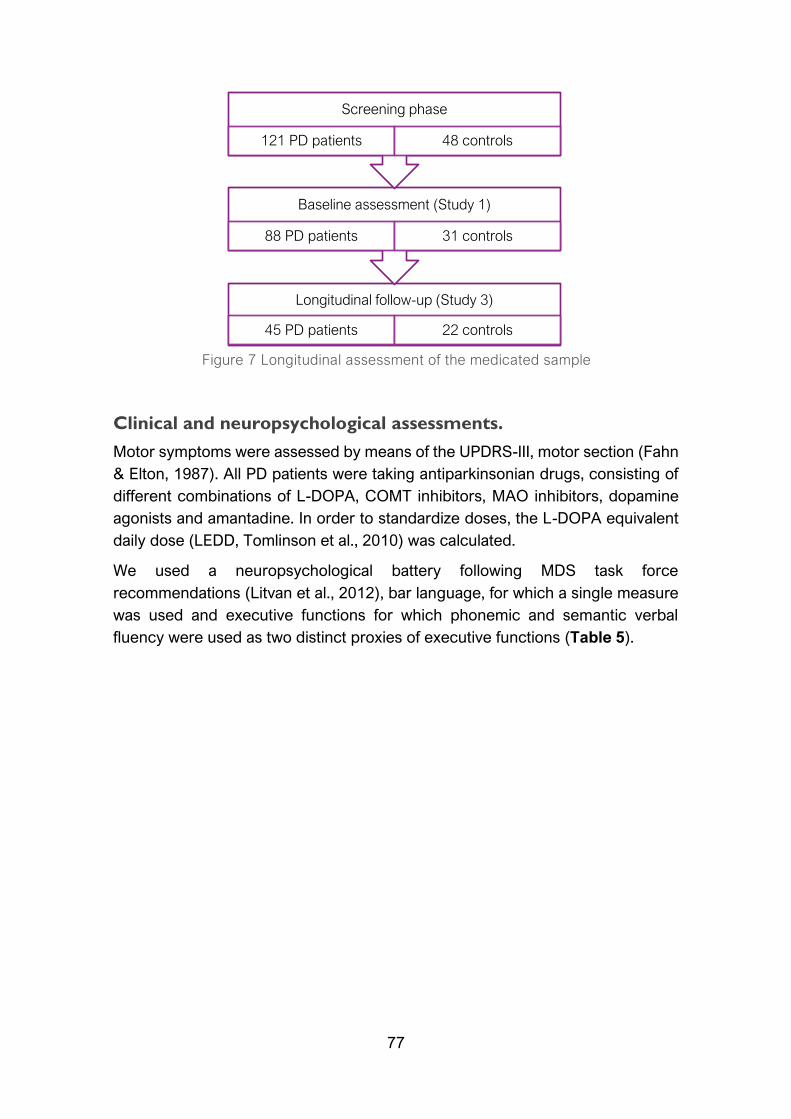
77
Clinical and neuropsychological assessments.
Motor symptoms were assessed by means of the UPDRS-III, motor section (Fahn
& Elton, 1987). All PD patients were taking antiparkinsonian drugs, consisting of
different combinations of L-DOPA, COMT inhibitors, MAO inhibitors, dopamine
agonists and amantadine. In order to standardize doses, the L-DOPA equivalent
daily dose (LEDD, Tomlinson et al., 2010) was calculated.
We used a neuropsychological battery following MDS task force
recommendations (Litvan et al., 2012), bar language, for which a single measure
was used and executive functions for which phonemic and semantic verbal
fluency were used as two distinct proxies of executive functions (Table 5).
Longitudinal follow-up (Study 3)
45 PD patients 22 controls
Baseline assessment (Study 1)
88 PD patients 31 controls
Screening phase
121 PD patients 48 controls
Figure 7 Longitudinal assessment of the medicated sample
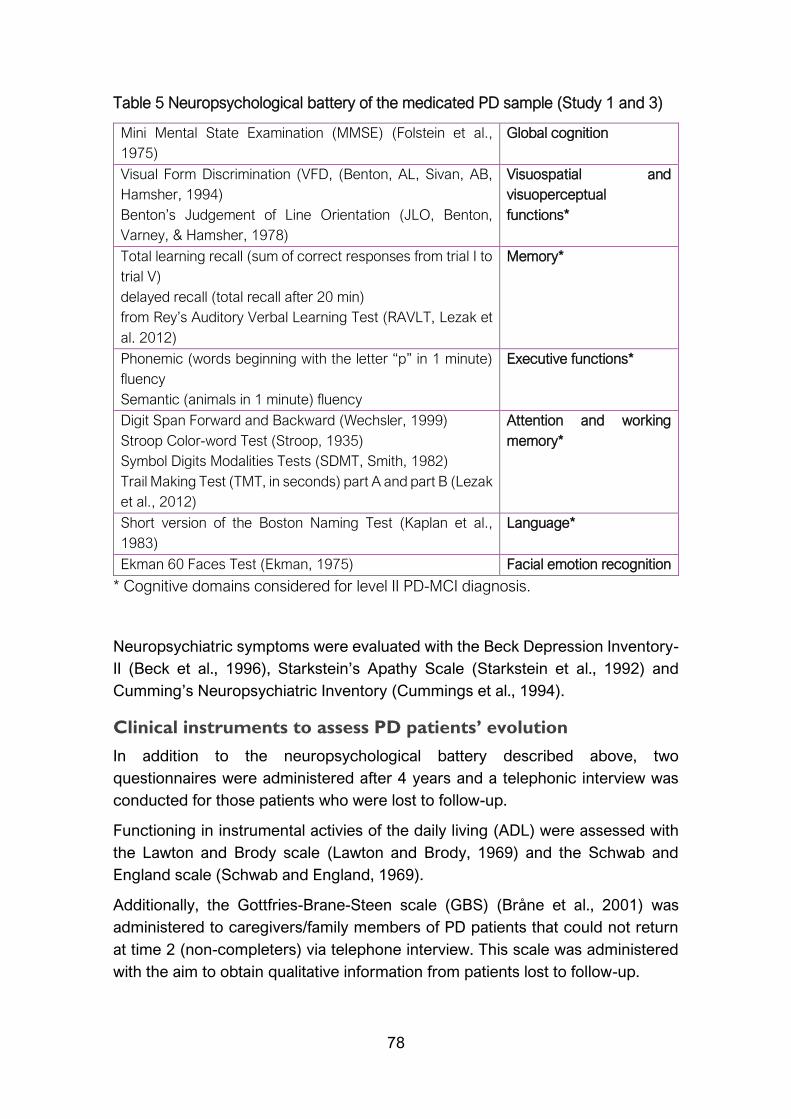
78
Table 5 Neuropsychological battery of the medicated PD sample (Study 1 and 3)
Mini Mental State Examination (MMSE) (Folstein et al.,
1975)
Global cognition
Visual Form Discrimination (VFD, (Benton, AL, Sivan, AB,
Hamsher, 1994)
Benton’s Judgement of Line Orientation (JLO, Benton,
Varney, & Hamsher, 1978)
Visuospatial and
visuoperceptual
functions*
Total learning recall (sum of correct responses from trial I to
trial V)
delayed recall (total recall after 20 min)
from Rey’s Auditory Verbal Learning Test (RAVLT, Lezak et
al. 2012)
Memory*
Phonemic (words beginning with the letter “p” in 1 minute)
fluency
Semantic (animals in 1 minute) fluency
Executive functions*
Digit Span Forward and Backward (Wechsler, 1999)
Stroop Color-word Test (Stroop, 1935)
Symbol Digits Modalities Tests (SDMT, Smith, 1982)
Trail Making Test (TMT, in seconds) part A and part B (Lezak
et al., 2012)
Attention and working
memory*
Short version of the Boston Naming Test (Kaplan et al.,
1983)
Language*
Ekman 60 Faces Test (Ekman, 1975) Facial emotion recognition
* Cognitive domains considered for level II PD-MCI diagnosis.
Neuropsychiatric symptoms were evaluated with the Beck Depression Inventory-
II (Beck et al., 1996), Starkstein’s Apathy Scale (Starkstein et al., 1992) and
Cumming’s Neuropsychiatric Inventory (Cummings et al., 1994).
Clinical instruments to assess PD patients’ evolution
In addition to the neuropsychological battery described above, two
questionnaires were administered after 4 years and a telephonic interview was
conducted for those patients who were lost to follow-up.
Functioning in instrumental activies of the daily living (ADL) were assessed with
the Lawton and Brody scale (Lawton and Brody, 1969) and the Schwab and
England scale (Schwab and England, 1969).
Additionally, the Gottfries-Brane-Steen scale (GBS) (Bråne et al., 2001) was
administered to caregivers/family members of PD patients that could not return
at time 2 (non-completers) via telephone interview. This scale was administered
with the aim to obtain qualitative information from patients lost to follow-up.

79
MRI acquisition
MRI were acquired with a 3T scanner (MAGNETOM Trio, Siemens, Germany).
The scanning protocol included high-resolution 3-dimensional T1-weighted
images acquired in the sagittal plane (TR=2300 ms, TE=2.98 ms, TI=900 ms, 240
slices, FOV=256 mm; 1 mm isotropic voxel) and an axial FLAIR sequence
(TR=9000 ms, TE=96 ms).
de novo PD sample (Study 2)
Participants
Data used in this study were obtained from the PPMI database (Marek et al.,
2011). For up to-date information on the study, visit www.ppmi-info.org. T1-
weighted images acquired on 3-tesla Siemens MRI scanners and clinical and
neuropsychological data obtained from 119 PD patients and 77 HC assessed
between 2010 and 2015 were included. All imaging and non-imaging data
corresponded to the same time points and were acquired prior to any L-DOPA
intake (Figure 8).
Inclusion criteria were: (i) recent diagnosis of PD with asymmetric resting tremor
or asymmetric bradykinesia, or two of: bradykinesia, resting tremor, and rigidity;
(ii) absence of treatment for PD; (iii) neuroimaging evidence of significant
dopamine transporter deficit consistent with the clinical diagnosis of PD and ruling
out PD look-alike conditions such as drug-induced and vascular parkinsonism or
essential tremor; (iv) available T1-weighted images in a 3T Siemens scanner (for
both PD patients and HC) and (v) age > 50 years old (for both PD patients and
HC).
Exclusion criteria for all participants were: (i) diagnosis of dementia; (ii) significant
neurologic or psychiatric dysfunction; (iii) first-degree family member with PD,
and (iv) presence of MRI motion artifacts, field distortions, intensity
inhomogeneities, or detectable brain injuries.
A total of 77 de novo PD patients and 50 HC were selected. The following
participants were excluded from the study: 4 patients and 1 HC due to other
neurological disease, 18 PD patients and 20 HC due to MRI motion artifacts at
visual inspection performed by an expert radiologist, and 18 PD patients and 5
HC due to cortical thickness preprocessing problems. Finally, we performed an
initial cluster analysis for the PD group and another for the control group to detect
possible abnormal outliers on MRI data. From these, we discarded 2 PD patients
and 1 HC that constituted independent clusters by themselves.
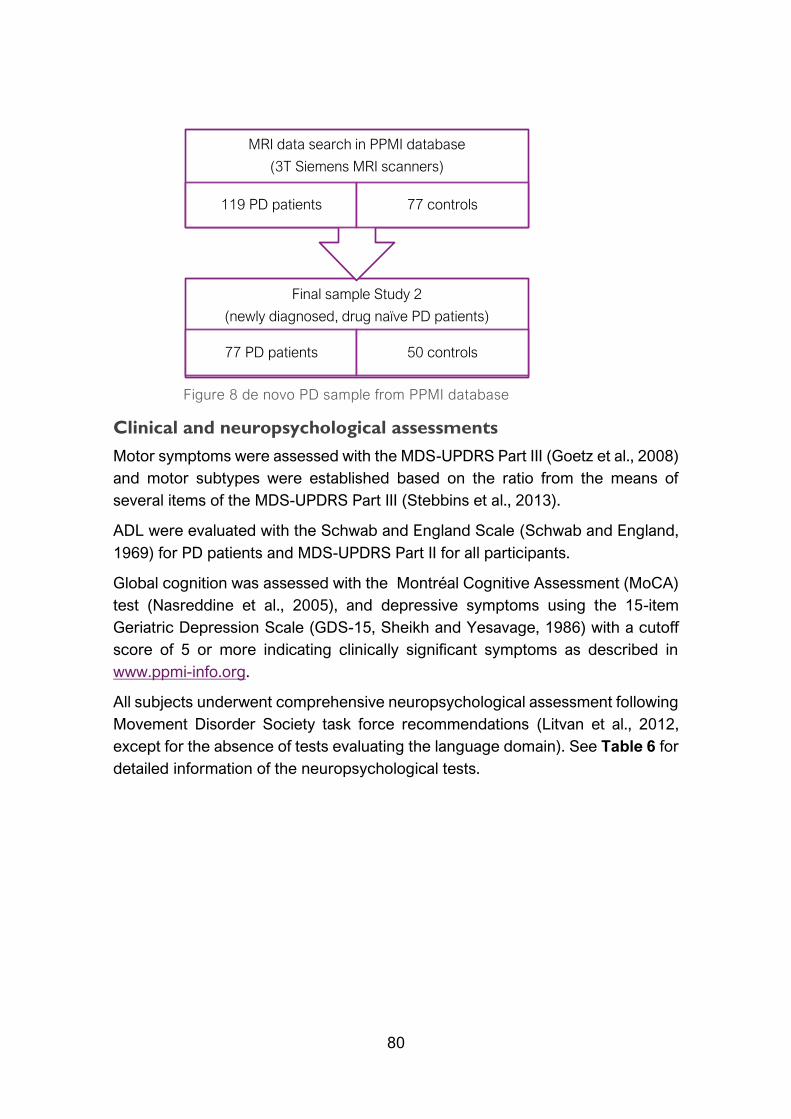
80
Clinical and neuropsychological assessments
Motor symptoms were assessed with the MDS-UPDRS Part III (Goetz et al., 2008)
and motor subtypes were established based on the ratio from the means of
several items of the MDS-UPDRS Part III (Stebbins et al., 2013).
ADL were evaluated with the Schwab and England Scale (Schwab and England,
1969) for PD patients and MDS-UPDRS Part II for all participants.
Global cognition was assessed with the Montréal Cognitive Assessment (MoCA)
test (Nasreddine et al., 2005), and depressive symptoms using the 15-item
Geriatric Depression Scale (GDS-15, Sheikh and Yesavage, 1986) with a cutoff
score of 5 or more indicating clinically significant symptoms as described in
www.ppmi-info.org.
All subjects underwent comprehensive neuropsychological assessment following
Movement Disorder Society task force recommendations (Litvan et al., 2012,
except for the absence of tests evaluating the language domain). See Table 6 for
detailed information of the neuropsychological tests.
Final sample Study 2
(newly diagnosed, drug naïve PD patients)
77 PD patients 50 controls
MRI data search in PPMI database
(3T Siemens MRI scanners)
119 PD patients 77 controls
Figure 8 de novo PD sample from PPMI database
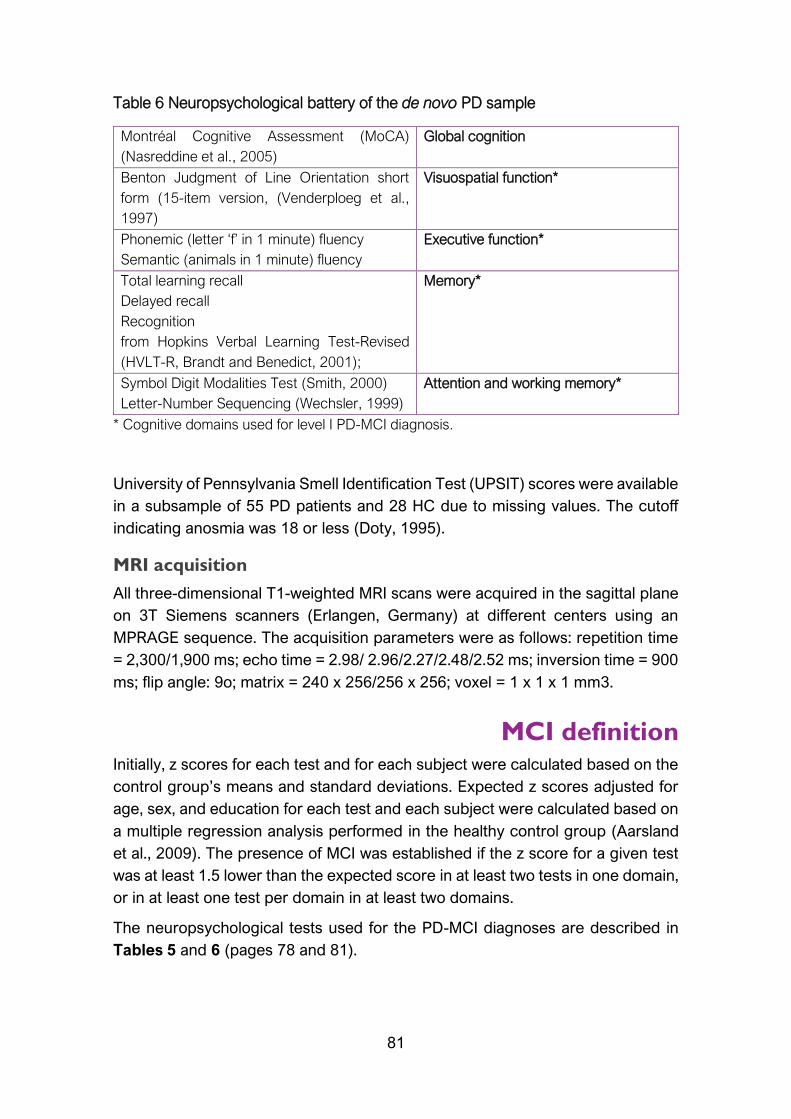
81
Table 6 Neuropsychological battery of the de novo PD sample
* Cognitive domains used for level I PD-MCI diagnosis.
University of Pennsylvania Smell Identification Test (UPSIT) scores were available
in a subsample of 55 PD patients and 28 HC due to missing values. The cutoff
indicating anosmia was 18 or less (Doty, 1995).
MRI acquisition
All three-dimensional T1-weighted MRI scans were acquired in the sagittal plane
on 3T Siemens scanners (Erlangen, Germany) at different centers using an
MPRAGE sequence. The acquisition parameters were as follows: repetition time
= 2,300/1,900 ms; echo time = 2.98/ 2.96/2.27/2.48/2.52 ms; inversion time = 900
ms; flip angle: 9o; matrix = 240 x 256/256 x 256; voxel = 1 x 1 x 1 mm3.
MCI definition Initially, z scores for each test and for each subject were calculated based on the
control group’s means and standard deviations. Expected z scores adjusted for
age, sex, and education for each test and each subject were calculated based on
a multiple regression analysis performed in the healthy control group (Aarsland
et al., 2009). The presence of MCI was established if the z score for a given test
was at least 1.5 lower than the expected score in at least two tests in one domain,
or in at least one test per domain in at least two domains.
The neuropsychological tests used for the PD-MCI diagnoses are described in
Tables 5 and 6 (pages 78 and 81).
Montréal Cognitive Assessment (MoCA)
(Nasreddine et al., 2005)
Global cognition
Benton Judgment of Line Orientation short
form (15-item version, (Venderploeg et al.,
1997)
Visuospatial function*
Phonemic (letter ‘f’ in 1 minute) fluency
Semantic (animals in 1 minute) fluency
Executive function*
Total learning recall
Delayed recall
Recognition
from Hopkins Verbal Learning Test-Revised
(HVLT-R, Brandt and Benedict, 2001);
Memory*
Symbol Digit Modalities Test (Smith, 2000)
Letter-Number Sequencing (Wechsler, 1999)
Attention and working memory*

82
For the medicated PD sample
The presence of MCI was defined using PD-MCI diagnostic criteria level II (Litvan
et al., 2012): the z score of a given test was at least 1.5 lower than the expected
score on any 2 test scores. Impairment in each cognitive domain was also
established if at least 1 test in the domain was impaired. Level II constitutes a
comprehensive assessment to diagnose PD MCI.
For the de novo PD sample
The presence of MCI was defined using PD-MCI diagnostic criteria level I (Litvan
et al., 2012): (i) MoCA scores as measure of global cognition below 26
(Dalrymple-Alford, 2010) and/or (ii) the z score of a given test was at least 1.5
lower than the expected score on any 2 test scores. Impairment in each cognitive
domain was also established if at least 1 test in the domain was impaired. Level I
leads to a diagnostic of Possible MCI.
MRI techniques
Cortical thickness preprocessing
Cortical thickness was estimated using the automated FreeSurfer stream (version
5.1, https://surfer.nmr.mgh.harvard.edu/). The procedures carried out by
FreeSurfer software include removal of nonbrain data, intensity normalization
(Fischl et al., 2001), tessellation of the gray matter/white matter boundary,
automated topology correction (Dale et al., 1999; Ségonne et al., 2007), and
accurate surface deformation to identify tissue borders (Dale and Sereno, 1993;
Fischl et al., 2002; Fischl and Dale, 2000). Cortical thickness is then calculated as
the distance between the white matter and GM surfaces at each vertex of the
reconstructed cortical mantle (Fischl et al., 2002). In our study, results for each
subject were visually inspected to ensure accuracy of registration, skull stripping,
segmentation, and cortical surface reconstruction. Maps were smoothed using a
circularly symmetric Gaussian kernel across the surface with a full width at half
maximum (FWHM) of 15 mm.
After Freesurfer preprocessing, results for each subject were visually inspected
to ensure accuracy of registration, skull stripping, segmentation, and cortical
surface reconstruction. Possible errors were fixed by manual intervention
following standard procedures
(https://surfer.nmr.mgh.harvard.edu/fswiki/FsTutorial/TroubleshootingData#Fixin
gerrors).
Longitudinal preprocessing of cortical thickness
For Study 3, the FreeSurfer longitudinal stream was used to process the images
of both times (Reuter et al., 2012). Specifically, an unbiased within-subject

83
template space and image is created using robust, inverse consistent registration
(Reuter et al., 2010). Several processing steps, such as skull stripping, Talairach
transforms, atlas registration as well as spherical surface maps and parcellations
are then initialized with common information from the within-subject template,
significantly increasing reliability and statistical power (Reuter et al., 2012).
Cortical maps were smoothed with a FWHM of 25 mm to increase sensitivity to
detect longitudinal differences in a small sample.
Parcellations of the cortical mantle
For Study 2, we extracted the mean thickness for each of the 360 cortical areas
defined in the Human Connectome Project Multi-Modal Parcellation version 1.0
(HCP-MMP1.0, Glasser et al., 2016; CJNeuroLab, 2018). The HCP-MMP1.0
(Figure 9) is an atlas that contains 180 areas per hemisphere, and it is based on
the multimodal MRI from the Human Connectome Project and an objective semi-
automated neuroanatomical approach. The areas are bounded by sharp changes
in cortical architecture, function, connectivity, and topography in a group of 210
healthy young adults.
Figure 9 Extracted from Glasser et al. 2016 Nature Vol 536.
https://doi.org/10.1038/nature18933

84
Hierarchical cluster analyses Ward's linkage method for hierarchical cluster analysis was used for Studies 1
and 2 using MATLAB (release 2014b, The MathWorks, Inc., Natick,
Massachussetts).
For Study 1, whole-brain Free-Surfer vertex information (327,684 vertex points)
of cortical thickness estimation for each of the 88 PD patients was used. This
technique produces hierarchical representations in which the clusters at each
level of the hierarchy are created by merging clusters at the next lower level. In
hierarchical cluster analysis there is no need to specify the number of clusters a
priori because grouping is based on the dissimilarity between groups of
observations. To control for variations in global atrophy between patients, we
normalized the vertices using the mean cortical thickness of the whole brain (Y.
Noh et al., 2014; Whitwell et al., 2009). Ward’s clustering linkage method (Ward,
1963) was used to combine pairs of clusters at each step while minimizing the
sum of square errors from the cluster mean. Each of the 88 patients was placed
in their own cluster and then progressively clustered with others.
For Study 2, mean cortical thickness values for the 360 areas from the HCP-
MMP1.0 were used as features for the 77 early PD patients. This feature selection
was used to improve the model’s performance in calculating similarity/distance
measures.
Statistical analysis
Cortical thickness
Intergroup cortical thickness comparisons in Study 1 and 2 were performed using
a vertex-by-vertex general linear model with FreeSurfer. The model included
cortical thickness as a dependent factor and group as an independent factor. Age
and education were considered as nuisance covariates in Study 1 group
comparisons when they were significantly different between groups being
compared.
All cortical thickness group analyses were corrected for multiple comparisons by
using a pre-cached cluster-wise Monte Carlo simulation of 10,000 iterations.
Reported cortical regions reached a two-tailed corrected significance level of p <
0.05.

85
Longitudinal cortical thickness
Longitudinal cortical thickness comparisons were performed using the
longitudinal two stage model (Reuter et al., 2012) and we computed the
symmetrized percent of change of cortical thickness (SPC). SPC is the rate in
mm/year ((thickness2-thickness1)/(time2-time1)) with respect to the average
thickness (0.5*(thick1+thick2)). In aging or disease, SPC is expected to be
negative in most regions
(https://surfer.nmr.mgh.harvard.edu/fswiki/LongitudinalTwoStageModel).
Comparisons between groups were assessed using a vertex-by-vertex general
linear model. Two statistical models were performed: one sample t-test was
performed to test time effect in groups (if the SPC was different from zero); and
to test time by group interaction effects, SPC was included as a dependent factor
and group as an independent factor. In the second model, age and years of
education were considered as nuisance covariates.
As in the cross-sectional analyses, all cortical thickness group analyses were
corrected for multiple comparisons by using a pre-cached cluster-wise Monte
Carlo simulation of 10,000 iterations. Reported cortical regions reached a two-
tailed corrected significance level of p < 0.05.
Study 1
Demographical and clinical measurements
Demographic, neuropsychological and clinical statistical analyses were
conducted using IBM SPSS Statistics 20.0 (2011; Armonk, NY: IBM Corp). We
tested for group differences in demographic and clinical variables as well as in
neuropsychological performance between HC and PD patient subtypes using an
ANOVA with Bonferroni or Tamhane post hoc test when analyzing quantitative
variables and Pearson’s chi-square test when analyzing categorical variables. For
comparisons between the collapsed PD group and HC we used Student’s t test.
Cluster evaluation
MATLAB was used to perform principal component analysis (PCA) in order to
validate the classification obtained from the cluster analysis. PCA is a multivariate
method that can detect correlations in a set of variables (Abdi and Williams, 2010).
After discarding vertices with values of zero and vertices that correlated highly
with others, PCA was performed with 4,150 vertices (Field, 2009).

86
Study 2
Demographical and clinical measurements
Demographic, neuropsychological, and clinical statistical analyses were
conducted using IBM SPSS Statistics 24.0 (2011; Armonk, NY: IBM Corp). We
tested for group differences in demographic and clinical variables as well as in
neuropsychological performance between HC and PD patient subtypes using
Kruskal-Wallis test followed by Mann-Whitney’s pairwise comparisons and
Bonferroni correction for non-normally distributed quantitative measures as
indicated by the Kolmogorov-Smirnov test; for normally distributed measures, an
analysis of variance (ANOVA) followed by Bonferroni post hoc test was used.
Pearson’s chi squared tests were used for categorical measures.
For comparisons between the collapsed PD sample and HC we used Mann-
Whitney’s test or Student t test as appropriate.
Cluster evaluation
To determine the optimal number of clusters, we computed the Calinski-Harabasz
index with MATLAB. The Calinski-Harabasz criterion is best suited for cluster
analysis with squared Euclidean distances. The higher the ratio is, the better the
cluster solution. An optimal ratio is determined by a large between-cluster
variance and a small within-cluster variance
(https://es.mathworks.com/help/stats/clustering.evaluation.calinskiharabaszevalu
ation-class.html).
Study 3
Cross-sectional analysis of clinical measures
Group differences in demographic variables, disease outcomes and GBS scale
scores at time 2 were analyzed with Kruskal-Wallis test followed by Mann-
Whitney’s pairwise comparisons and Bonferroni correction for quantitative
measures. Chi squared test were used where appropriate for categorical
measures.
Group differences in demographic and clinical variables between completers and
non- completers were analyzed with Mann-Whitney’s U test for quantitative
measures and Chi squared test for categorical measures at time 1. These
analyses were conducted using IBM SPSS Statistics 22.0 (2013; Armonk, NY:
IBM Corp).
Repeated measures analyses
Group by time interaction effects in clinical disease-related variables and
neuropsychological performance between pattern 2 and 3 patients and HC were
assessed through a repeated-measures general linear model and permutation

87
testing with 10,000 iterations. To control type-I errors, a Bonferroni correction was
applied.
The same was applied for the global atrophy measures including total GM volume,
subcortical and cortical GM volume, mean lateral ventricular volume and
estimated intracranial volume were obtained automatically via whole brain
segmentation with the FreeSurfer suite. Global average thickness for both
hemispheres was calculated as:
((lh.thickness*lh.surface area)+(rh.thickness*rh.surface area))/(lh.surface
area+rh.surface area)
The estimated intracranial volume was considered as a nuisance covariate in the
volumetric analyses.

88

89
Chapter 4
Results
Study 1
Uribe, C., Segura, B., Baggio, H. C., Abos, A., Marti, M. J., Valldeoriola, F., Compta,
Y., Bargallo, N., Junque, C. (2016). Patterns of cortical thinning in nondemented
Parkinson’s disease patients. Movement Disorders, 31(5), 699–708.
https://doi.org/10.1002/mds.26590

90

Patterns of Cortical Thinning in Nondemented Parkinson’sDisease Patients
Carme Uribe, MSc,1 Barbara Segura, PhD,1 Hugo Cesar Baggio, MD, PhD,1 Alexandra Abos, MSc,1
Maria Jose Marti, MD, PhD,2,3,5 Francesc Valldeoriola, MD, PhD,2,3,5 Yaroslau Compta, MD, PhD,2,3,5
Nuria Bargallo, MD, PhD,4,5 and Carme Junque, PhD1,2,5
1Department of Psychiatry and Clinical Psychobiology, University of Barcelona, Barcelona, Catalonia, Spain2Centro de Investigaci�on Biom�edica en Red sobre Enfermedades Neurodegenerativas (CIBERNED), Hospital Cl�ınic de Barcelona,
Barcelona, Catalonia, Spain3Movement Disorders Unit, Neurology Service, Hospital Cl�ınic de Barcelona, Barcelona, Catalonia, Spain
4Centre de Diagnostic per la Imatge, Hospital Clinic, Barcelona, Catalonia, Spain5Institute of Biomedical Research August Pi i Sunyer (IDIBAPS), Barcelona, Catalonia, Spain
ABSTRACT: Background: Clinical variability inthe Parkinson’s disease phenotype suggests the exis-tence of disease subtypes. We investigated whetherdistinct anatomical patterns of atrophy can be identifiedin Parkinson’s disease using a hypothesis-free, data-driven approach based on cortical thickness data.Methods: T1-weighted 3-tesla MRI and a comprehen-sive neuropsychological assessment were performed ina sample of 88 nondemented Parkinson’s diseasepatients and 31 healthy controls. We performed a hier-archical cluster analysis of imaging data using Ward’slinkage method. A general linear model with corticalthickness data was used to compare clustering groups.Results : We observed 3 patterns of cortical thinningin patients when compared with healthy controls. Pat-tern 1 (n 5 30, 34.09%) consisted of cortical atrophy inbilateral precentral gyrus, inferior and superior parietallobules, cuneus, posterior cingulate, and parahippo-campal gyrus. These patients showed worse cognitiveperformance when compared with controls and theother 2 patterns. Pattern 2 (n 5 29, 32.95%) consisted
of cortical atrophy involving occipital and frontal as wellas superior parietal areas and included patients withyounger age at onset. Finally, in pattern 3 (n 5 29,32.95%), there was no detectable cortical thinning.Patients in the 3 patterns did not differ in disease dura-tion, motor severity, dopaminergic medication doses, orpresence of mild cognitive impairment.Conclusions: Three cortical atrophy subtypes wereidentified in nondemented Parkinson’s disease patients:(1) parieto-temporal pattern of atrophy with worse cogni-tive performance, (2) occipital and frontal cortical atrophyand younger disease onset, and (3) patients withoutdetectable cortical atrophy. These findings may help iden-tify prognosis markers in Parkinson’s disease. VC 2016 TheAuthors. Movement Disorders published by Wiley Periodi-cals, Inc. on behalf of International Parkinson and Move-ment Disorder Society
Key Words: Parkinson disease; cluster analysis;neuropsychology; magnetic resonance imaging; corticalatrophy
Parkinson’s disease (PD) is associated with progres-sive cognitive impairment and cortical atrophy.1 Clini-cal variability in PD suggests the existence of disease
subtypes. A review of cluster analysis studies concludedthat there is clear evidence of 2 clinical profiles: onewith old-age onset and rapid disease progression and
------------------------------------------------------------------------------------------------------------------------------This is an open access article under the terms of the Creative CommonsAttribution License, which permits use, distribution and reproduction inany medium, provided the original work is properly cited.
*Correspondence to: Dr. Carme Junqu�e, Department of Psychiatry andClinical Psychobiology. University of Barcelona, Casanova 143 (08036)Barcelona, Spain; [email protected]
Carme Uribe and Barbara Segura contributed equally to the manuscript.
Funding agencies: This study was sponsored by Spanish Ministry ofEconomy and Competitiveness (PSI2013-41393-P), by Generalitat deCatalunya (2014SGR 98) and by Fundaci�o La Marat�o de TV3 in Spain(20142310).
Relevant conflicts of interests/financial disclosures: C.U. was sup-ported by a fellowship from 2014, Spanish Ministry of Economy andCompetitiveness (BES-2014-068173) and cofinanced by the EuropeanSocial Fund (ESF). B.S., H.C.B., A.A., C.J., M.J.M., F.V., and N.B. reportno disclosures. Y.C. has received funding, research support, and/or hon-oraria in the past 5 years from Union Chimique Belge (UCB pharma),Lundbeck, Medtronic, Abbvie, Novartis, GSK, Boehringer, Pfizer, Merz,Piramal Imaging, and Esteve.
Received: 19 November 2015; Revised: 18 January 2016; Accepted:31 January 2016
Published online in Wiley Online Library(wileyonlinelibrary.com). DOI: 10.1002/mds.26590
R E S E A R C H A R T I C L E
Movement Disorders, Vol. 31, No. 5, 2016 699
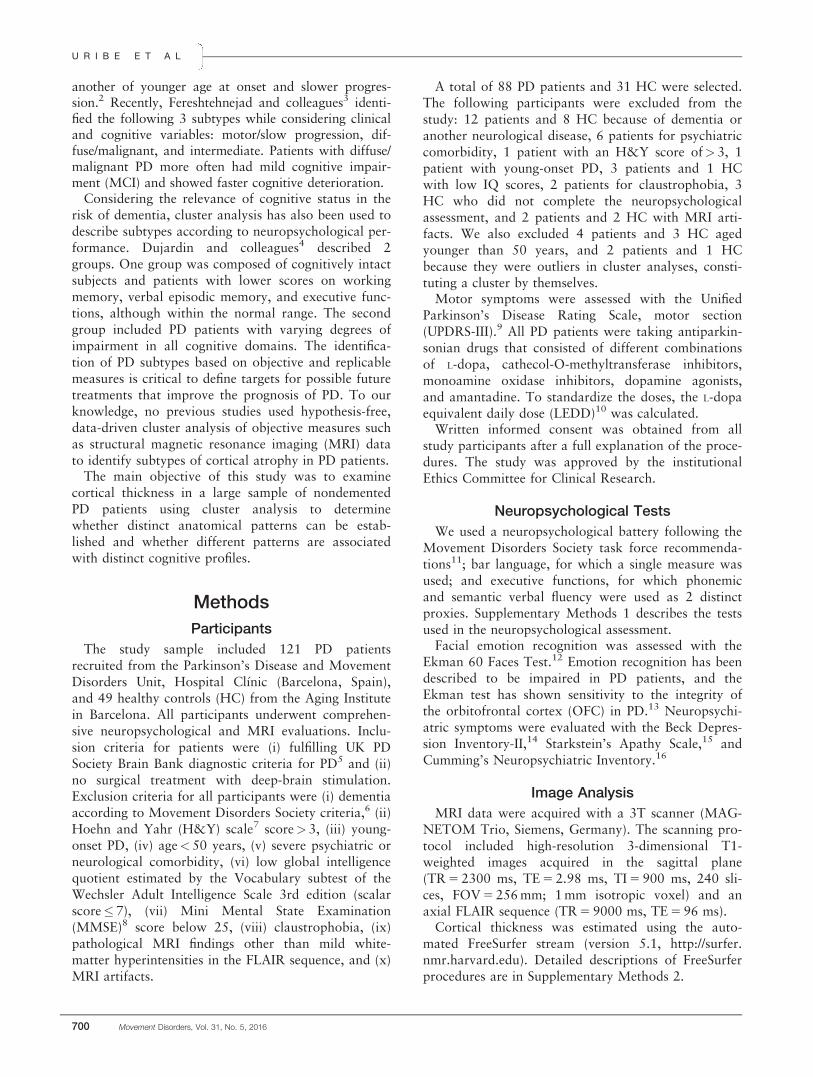
another of younger age at onset and slower progres-sion.2 Recently, Fereshtehnejad and colleagues3 identi-fied the following 3 subtypes while considering clinicaland cognitive variables: motor/slow progression, dif-fuse/malignant, and intermediate. Patients with diffuse/malignant PD more often had mild cognitive impair-ment (MCI) and showed faster cognitive deterioration.
Considering the relevance of cognitive status in therisk of dementia, cluster analysis has also been used todescribe subtypes according to neuropsychological per-formance. Dujardin and colleagues4 described 2groups. One group was composed of cognitively intactsubjects and patients with lower scores on workingmemory, verbal episodic memory, and executive func-tions, although within the normal range. The secondgroup included PD patients with varying degrees ofimpairment in all cognitive domains. The identifica-tion of PD subtypes based on objective and replicablemeasures is critical to define targets for possible futuretreatments that improve the prognosis of PD. To ourknowledge, no previous studies used hypothesis-free,data-driven cluster analysis of objective measures suchas structural magnetic resonance imaging (MRI) datato identify subtypes of cortical atrophy in PD patients.
The main objective of this study was to examinecortical thickness in a large sample of nondementedPD patients using cluster analysis to determinewhether distinct anatomical patterns can be estab-lished and whether different patterns are associatedwith distinct cognitive profiles.
Methods
Participants
The study sample included 121 PD patientsrecruited from the Parkinson’s Disease and MovementDisorders Unit, Hospital Cl�ınic (Barcelona, Spain),and 49 healthy controls (HC) from the Aging Institutein Barcelona. All participants underwent comprehen-sive neuropsychological and MRI evaluations. Inclu-sion criteria for patients were (i) fulfilling UK PDSociety Brain Bank diagnostic criteria for PD5 and (ii)no surgical treatment with deep-brain stimulation.Exclusion criteria for all participants were (i) dementiaaccording to Movement Disorders Society criteria,6 (ii)Hoehn and Yahr (H&Y) scale7 score> 3, (iii) young-onset PD, (iv) age<50 years, (v) severe psychiatric orneurological comorbidity, (vi) low global intelligencequotient estimated by the Vocabulary subtest of theWechsler Adult Intelligence Scale 3rd edition (scalarscore�7), (vii) Mini Mental State Examination(MMSE)8 score below 25, (viii) claustrophobia, (ix)pathological MRI findings other than mild white-matter hyperintensities in the FLAIR sequence, and (x)MRI artifacts.
A total of 88 PD patients and 31 HC were selected.The following participants were excluded from thestudy: 12 patients and 8 HC because of dementia oranother neurological disease, 6 patients for psychiatriccomorbidity, 1 patient with an H&Y score of>3, 1patient with young-onset PD, 3 patients and 1 HCwith low IQ scores, 2 patients for claustrophobia, 3HC who did not complete the neuropsychologicalassessment, and 2 patients and 2 HC with MRI arti-facts. We also excluded 4 patients and 3 HC agedyounger than 50 years, and 2 patients and 1 HCbecause they were outliers in cluster analyses, consti-tuting a cluster by themselves.
Motor symptoms were assessed with the UnifiedParkinson’s Disease Rating Scale, motor section(UPDRS-III).9 All PD patients were taking antiparkin-sonian drugs that consisted of different combinationsof L-dopa, cathecol-O-methyltransferase inhibitors,monoamine oxidase inhibitors, dopamine agonists,and amantadine. To standardize the doses, the L-dopaequivalent daily dose (LEDD)10 was calculated.
Written informed consent was obtained from allstudy participants after a full explanation of the proce-dures. The study was approved by the institutionalEthics Committee for Clinical Research.
Neuropsychological Tests
We used a neuropsychological battery following theMovement Disorders Society task force recommenda-tions11; bar language, for which a single measure wasused; and executive functions, for which phonemicand semantic verbal fluency were used as 2 distinctproxies. Supplementary Methods 1 describes the testsused in the neuropsychological assessment.
Facial emotion recognition was assessed with theEkman 60 Faces Test.12 Emotion recognition has beendescribed to be impaired in PD patients, and theEkman test has shown sensitivity to the integrity ofthe orbitofrontal cortex (OFC) in PD.13 Neuropsychi-atric symptoms were evaluated with the Beck Depres-sion Inventory-II,14 Starkstein’s Apathy Scale,15 andCumming’s Neuropsychiatric Inventory.16
Image Analysis
MRI data were acquired with a 3T scanner (MAG-NETOM Trio, Siemens, Germany). The scanning pro-tocol included high-resolution 3-dimensional T1-weighted images acquired in the sagittal plane(TR 5 2300 ms, TE 5 2.98 ms, TI 5 900 ms, 240 sli-ces, FOV 5 256 mm; 1 mm isotropic voxel) and anaxial FLAIR sequence (TR 5 9000 ms, TE 5 96 ms).
Cortical thickness was estimated using the auto-mated FreeSurfer stream (version 5.1, http://surfer.nmr.harvard.edu). Detailed descriptions of FreeSurferprocedures are in Supplementary Methods 2.
U R I B E E T A L
700 Movement Disorders, Vol. 31, No. 5, 2016
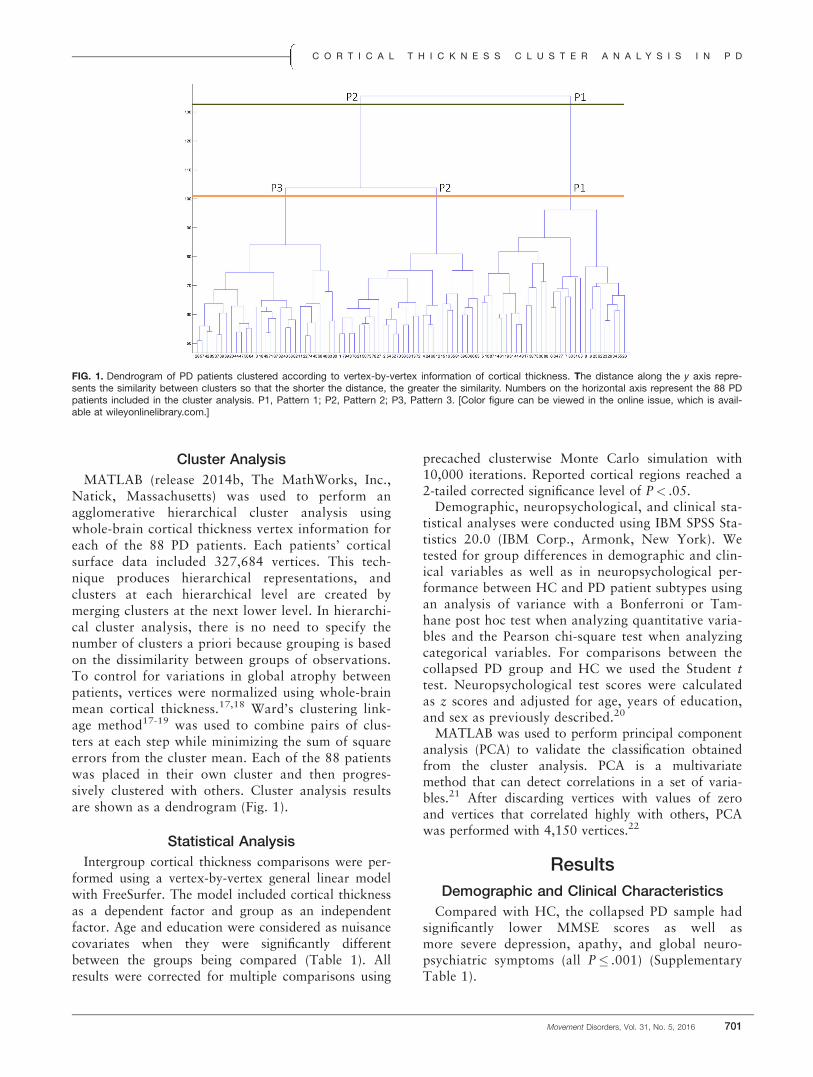
Cluster Analysis
MATLAB (release 2014b, The MathWorks, Inc.,Natick, Massachusetts) was used to perform anagglomerative hierarchical cluster analysis usingwhole-brain cortical thickness vertex information foreach of the 88 PD patients. Each patients’ corticalsurface data included 327,684 vertices. This tech-nique produces hierarchical representations, andclusters at each hierarchical level are created bymerging clusters at the next lower level. In hierarchi-cal cluster analysis, there is no need to specify thenumber of clusters a priori because grouping is basedon the dissimilarity between groups of observations.To control for variations in global atrophy betweenpatients, vertices were normalized using whole-brainmean cortical thickness.17,18 Ward’s clustering link-age method17-19 was used to combine pairs of clus-ters at each step while minimizing the sum of squareerrors from the cluster mean. Each of the 88 patientswas placed in their own cluster and then progres-sively clustered with others. Cluster analysis resultsare shown as a dendrogram (Fig. 1).
Statistical Analysis
Intergroup cortical thickness comparisons were per-formed using a vertex-by-vertex general linear modelwith FreeSurfer. The model included cortical thicknessas a dependent factor and group as an independentfactor. Age and education were considered as nuisancecovariates when they were significantly differentbetween the groups being compared (Table 1). Allresults were corrected for multiple comparisons using
precached clusterwise Monte Carlo simulation with10,000 iterations. Reported cortical regions reached a2-tailed corrected significance level of P< .05.
Demographic, neuropsychological, and clinical sta-tistical analyses were conducted using IBM SPSS Sta-tistics 20.0 (IBM Corp., Armonk, New York). Wetested for group differences in demographic and clin-ical variables as well as in neuropsychological per-formance between HC and PD patient subtypes usingan analysis of variance with a Bonferroni or Tam-hane post hoc test when analyzing quantitative varia-bles and the Pearson chi-square test when analyzingcategorical variables. For comparisons between thecollapsed PD group and HC we used the Student ttest. Neuropsychological test scores were calculatedas z scores and adjusted for age, years of education,and sex as previously described.20
MATLAB was used to perform principal componentanalysis (PCA) to validate the classification obtainedfrom the cluster analysis. PCA is a multivariatemethod that can detect correlations in a set of varia-bles.21 After discarding vertices with values of zeroand vertices that correlated highly with others, PCAwas performed with 4,150 vertices.22
Results
Demographic and Clinical Characteristics
Compared with HC, the collapsed PD sample hadsignificantly lower MMSE scores as well asmore severe depression, apathy, and global neuro-psychiatric symptoms (all P� .001) (SupplementaryTable 1).
FIG. 1. Dendrogram of PD patients clustered according to vertex-by-vertex information of cortical thickness. The distance along the y axis repre-sents the similarity between clusters so that the shorter the distance, the greater the similarity. Numbers on the horizontal axis represent the 88 PDpatients included in the cluster analysis. P1, Pattern 1; P2, Pattern 2; P3, Pattern 3. [Color figure can be viewed in the online issue, which is avail-able at wileyonlinelibrary.com.]
C O R T I C A L T H I C K N E S S C L U S T E R A N A L Y S I S I N P D
Movement Disorders, Vol. 31, No. 5, 2016 701

PD Subtypes According to Cluster Analysis
Models with 2 and 3 clusters were selected as possi-ble solutions. Detailed information about the 2-clusterand 4-cluster solutions is included as supplementaryresults (see Supplementary Result 1 and Supplemen-tary Tables 2, 3, and 4).
At the 3-cluster level (Fig. 2a), 3 patterns of corticalthickness were identified. PD patients included in pat-tern 1 (n 5 30, 34.09%) showed reduced cortical thick-ness when compared with HC in lateral and medialregions bilaterally, including the precentral gyrus, infe-rior and superior parietal areas, cuneus, posterior cin-gulate gyrus, and parahippocampal gyrus. Years ofeducation were controlled for when comparing pattern1 with HC (see Table 1). Pattern 2 included patients(n 5 29, 32.95%) with cortical atrophy in bilateralsuperior parietal and occipital areas and bilateral fron-tal regions such as the middle frontal, orbitofrontal,and right anterior superior frontal. Patients in the thirdcluster, pattern 3 (n 5 29, 32.95%), showed no signifi-cant cortical thinning when compared with HC.
Comparisons between patients in different patternsalso showed significant differences (see Fig. 2b). PDpatients included in pattern 1 showed cortical thinning
in the posterior cingulate/isthmus of the cingulategyrus and precuneus as well as precentral gyrus incomparison with pattern 2 patients. Pattern 2 patientsshowed cortical thinning in dorsolateral and orbitalfrontal regions when compared with pattern 1patients. Age and years of education were controlledfor when comparing these two groups (Table 1).
Pattern 1 patients showed significant cortical thin-ning in lateral and medial regions bilaterally, includingthe precentral gyrus, inferior and superior parietalareas, cuneus, posterior cingulate gyrus, and parahip-pocampal gyrus when compared with pattern 3patients. On the other hand, when compared with pat-tern 1 patients, pattern 3 patients showed corticalthinning in the left medial OFC. Age was controlledfor when comparing these groups (Table 1).
Finally, pattern 2 patients showed cortical thinningin the superior parietal and occipital areas and in theleft dorsolateral frontal cortex in comparison withpattern 3 patients.
Demographic and Clinical Characteristics
There were no significant differences in motor dis-ease severity as measured by the UPDRS-III, H&Y,
TABLE 1. Demographic and clinical characteristics at the 3-cluster level
PD subtypes
HC (n 5 31)Pattern 1 (n 5 30) Pattern 2 (n 5 29) Pattern 3 (n 5 29) Test stats, P value
Sex, male, n (%) 15 (50.0) 20 (69.0) 16 (55.2) 16 (51.6) 2.667, .446a
Age, y, mean (SD) 70.60 (9.6) 58.03 (8.9) 63.48 (9.5) 64.32 (8.5) 9.401,< .0001b,f,g
Education, y, mean (SD) 7.77 (4.8) 13.55 (5.5) 10.55 (4.0) 11.03 (4.2) 7.622,< .0001b,d,f
MMSE, mean (SD) 28.57 (1.4) 29.24 (0.9) 29.31 (0.9) 29.68 (0.5) 6.944,< .0001c,d
Disease duration, y, mean (SD) 8.77 (6.6) 8.36 (5.7) 6.83 (4.6) NA 0.949, .391b
Age of onset, y, mean (SD) 61.83 (12.7) 49.67 (8.3) 56.66 (10.3) NA 9.710,< .0001c,f,h
Early PD, 5 y n, (%) 12 (40.0) 11 (37.9) 14 (48.3) NA 0.715, .699a
BDI, mean (SD) 13.67 (5.7) 8.88 (6.8) 9.61 (5.7) 6.03 (5.7) 7.888,< .0001b,d,f
Apathy, mean (SD) 15.11 (7.9) 11.60 (7.1) 11.29 (6.0) 8.38 (5.1) 4.958, .003c,d
NPI, mean (SD) 6.59 (7.8) 4.41 (8.2) 6.21 (6.5) 1.52 (3.2) 3.242, .025c,d,e
Visual hallucinations, n (%) 6 (20.0) 6 (22.2) 5 (17.2) 0 (0) 7.900, .245a
UPDRS part III, mean (SD) 18.07 (9.1) 15.17 (11.6) 13.07 (8.4) NA 1.945, .149b
Hoehn & Yahr stage, n 1/1.5/2/2.5/3 2/3/16/4/5 9/2/13/3/2 11/0/14/1/3 NA 12.262, .140a
LEDD, mg, mean (SD) 764.63 (388.3) 930.52 (576.4) 718.00 (493.9) NA 1.503, .228b
Total MCI, n (%) 20 (66.7) 14 (48.3) 11 (37.9) NA 5.015, .081a
Visuospatial functions, n (%) 10 (33.3) 9 (31.0) 7 (24.1) NA 0.645, .724a
Executive functions, n (%) 16 (53.3) 6 (20.7) 6 (20.7) NA 9.712, .008a
Memory, n (%) 14 (46.7) 11 (37.9) 9 (31.0) NA 1.529, .466a
Attention and WM, n (%) 20 (66.7) 17 (58.6) 14 (48.3) NA 2.055, .358a
Language, n (%) 2 (6.7) 3 (10.3) 2 (6.9) NA 0.339, .844a
Apathy, Starkstein’s Apathy Scale; BDI, Beck Depression Inventory-II; HC, healthy controls; LEDD, L-dopa equivalent daily dose; MCI, Mild Cognitive Impair-ment; MMSE, Mini-Mental State Examination; NA, not applicable; NPI, Cumming’s Neuropsychiatric Inventory; PD, Parkinson’s disease; UPDRS III, UnifiedParkinson’s Disease Rating Scale motor section; WM, working memory.Data are presented as mean (standard deviation) (continuous) or frequencies (categorical).aThe Chi-squared test was used.bAnalysis of variance followed by Bonferroni post hoc test was used.cAnalysis of variance followed by Tamhane (T2) post hoc test was used.dSignificant post hoc differences (P<.05) between HC and pattern 1.eSignificant post hoc differences (P<.05) between HC and pattern 3.fSignificant post hoc differences (P<.05) between pattern 1 and pattern 2.gSignificant post hoc differences (P<.05) between pattern 1 and pattern 3.hSignificant post hoc differences (P<.05) between pattern 2 and pattern 3.
U R I B E E T A L
702 Movement Disorders, Vol. 31, No. 5, 2016
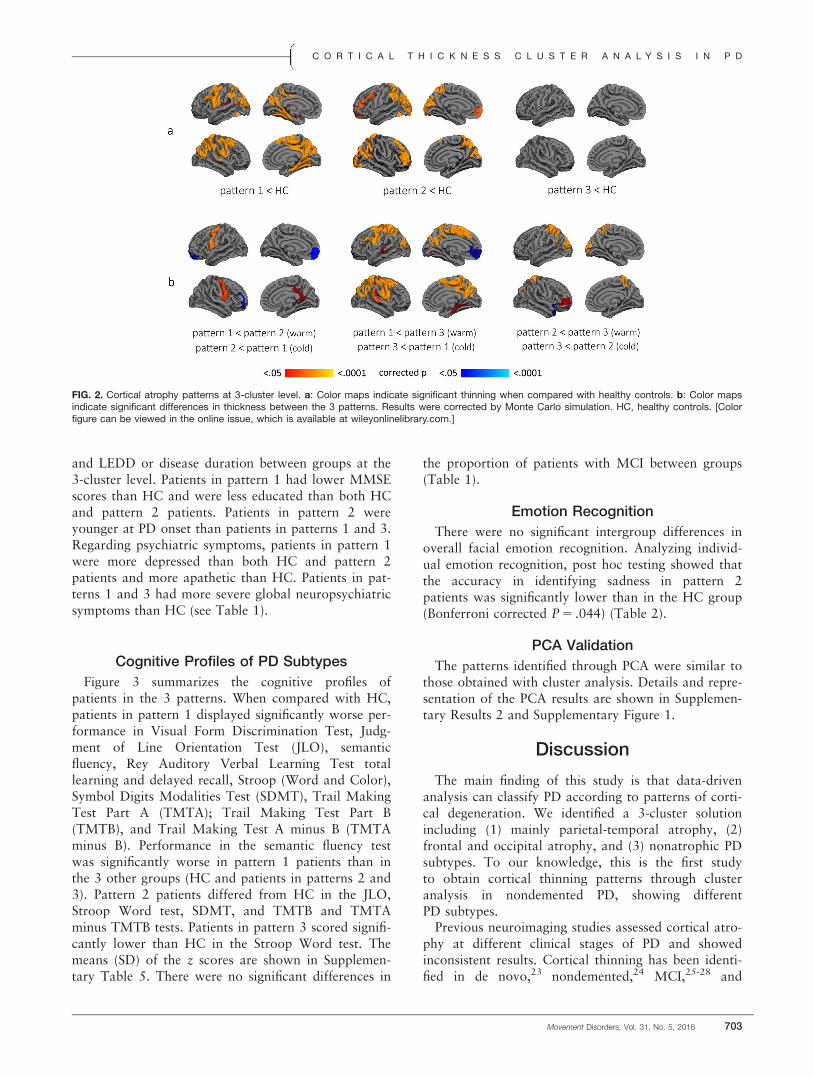
and LEDD or disease duration between groups at the3-cluster level. Patients in pattern 1 had lower MMSEscores than HC and were less educated than both HCand pattern 2 patients. Patients in pattern 2 wereyounger at PD onset than patients in patterns 1 and 3.Regarding psychiatric symptoms, patients in pattern 1were more depressed than both HC and pattern 2patients and more apathetic than HC. Patients in pat-terns 1 and 3 had more severe global neuropsychiatricsymptoms than HC (see Table 1).
Cognitive Profiles of PD Subtypes
Figure 3 summarizes the cognitive profiles ofpatients in the 3 patterns. When compared with HC,patients in pattern 1 displayed significantly worse per-formance in Visual Form Discrimination Test, Judg-ment of Line Orientation Test (JLO), semanticfluency, Rey Auditory Verbal Learning Test totallearning and delayed recall, Stroop (Word and Color),Symbol Digits Modalities Test (SDMT), Trail MakingTest Part A (TMTA); Trail Making Test Part B(TMTB), and Trail Making Test A minus B (TMTAminus B). Performance in the semantic fluency testwas significantly worse in pattern 1 patients than inthe 3 other groups (HC and patients in patterns 2 and3). Pattern 2 patients differed from HC in the JLO,Stroop Word test, SDMT, and TMTB and TMTAminus TMTB tests. Patients in pattern 3 scored signifi-cantly lower than HC in the Stroop Word test. Themeans (SD) of the z scores are shown in Supplemen-tary Table 5. There were no significant differences in
the proportion of patients with MCI between groups(Table 1).
Emotion Recognition
There were no significant intergroup differences inoverall facial emotion recognition. Analyzing individ-ual emotion recognition, post hoc testing showed thatthe accuracy in identifying sadness in pattern 2patients was significantly lower than in the HC group(Bonferroni corrected P 5 .044) (Table 2).
PCA Validation
The patterns identified through PCA were similar tothose obtained with cluster analysis. Details and repre-sentation of the PCA results are shown in Supplemen-tary Results 2 and Supplementary Figure 1.
Discussion
The main finding of this study is that data-drivenanalysis can classify PD according to patterns of corti-cal degeneration. We identified a 3-cluster solutionincluding (1) mainly parietal-temporal atrophy, (2)frontal and occipital atrophy, and (3) nonatrophic PDsubtypes. To our knowledge, this is the first studyto obtain cortical thinning patterns through clusteranalysis in nondemented PD, showing differentPD subtypes.
Previous neuroimaging studies assessed cortical atro-phy at different clinical stages of PD and showedinconsistent results. Cortical thinning has been identi-fied in de novo,23 nondemented,24 MCI,25-28 and
FIG. 2. Cortical atrophy patterns at 3-cluster level. a: Color maps indicate significant thinning when compared with healthy controls. b: Color mapsindicate significant differences in thickness between the 3 patterns. Results were corrected by Monte Carlo simulation. HC, healthy controls. [Colorfigure can be viewed in the online issue, which is available at wileyonlinelibrary.com.]
C O R T I C A L T H I C K N E S S C L U S T E R A N A L Y S I S I N P D
Movement Disorders, Vol. 31, No. 5, 2016 703
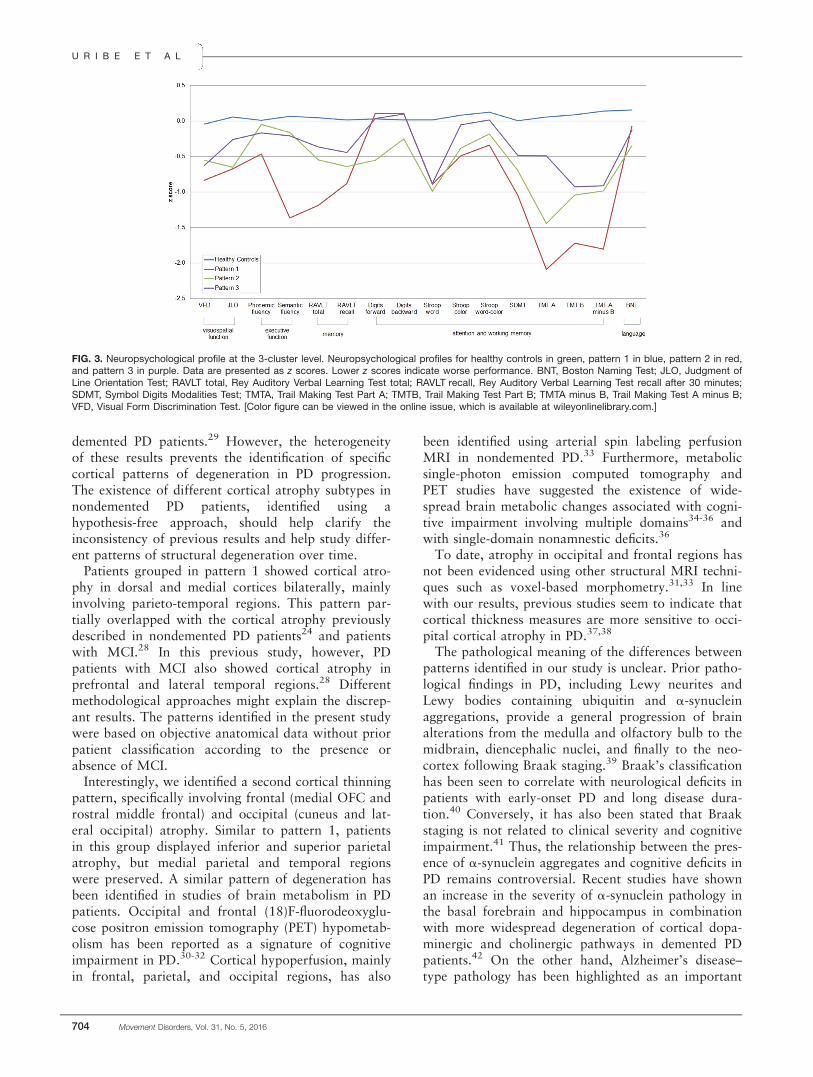
demented PD patients.29 However, the heterogeneityof these results prevents the identification of specificcortical patterns of degeneration in PD progression.The existence of different cortical atrophy subtypes innondemented PD patients, identified using ahypothesis-free approach, should help clarify theinconsistency of previous results and help study differ-ent patterns of structural degeneration over time.
Patients grouped in pattern 1 showed cortical atro-phy in dorsal and medial cortices bilaterally, mainlyinvolving parieto-temporal regions. This pattern par-tially overlapped with the cortical atrophy previouslydescribed in nondemented PD patients24 and patientswith MCI.28 In this previous study, however, PDpatients with MCI also showed cortical atrophy inprefrontal and lateral temporal regions.28 Differentmethodological approaches might explain the discrep-ant results. The patterns identified in the present studywere based on objective anatomical data without priorpatient classification according to the presence orabsence of MCI.
Interestingly, we identified a second cortical thinningpattern, specifically involving frontal (medial OFC androstral middle frontal) and occipital (cuneus and lat-eral occipital) atrophy. Similar to pattern 1, patientsin this group displayed inferior and superior parietalatrophy, but medial parietal and temporal regionswere preserved. A similar pattern of degeneration hasbeen identified in studies of brain metabolism in PDpatients. Occipital and frontal (18)F-fluorodeoxyglu-cose positron emission tomography (PET) hypometab-olism has been reported as a signature of cognitiveimpairment in PD.30-32 Cortical hypoperfusion, mainlyin frontal, parietal, and occipital regions, has also
been identified using arterial spin labeling perfusionMRI in nondemented PD.33 Furthermore, metabolicsingle-photon emission computed tomography andPET studies have suggested the existence of wide-spread brain metabolic changes associated with cogni-tive impairment involving multiple domains34-36 andwith single-domain nonamnestic deficits.36
To date, atrophy in occipital and frontal regions hasnot been evidenced using other structural MRI techni-ques such as voxel-based morphometry.31,33 In linewith our results, previous studies seem to indicate thatcortical thickness measures are more sensitive to occi-pital cortical atrophy in PD.37,38
The pathological meaning of the differences betweenpatterns identified in our study is unclear. Prior patho-logical findings in PD, including Lewy neurites andLewy bodies containing ubiquitin and a-synucleinaggregations, provide a general progression of brainalterations from the medulla and olfactory bulb to themidbrain, diencephalic nuclei, and finally to the neo-cortex following Braak staging.39 Braak’s classificationhas been seen to correlate with neurological deficits inpatients with early-onset PD and long disease dura-tion.40 Conversely, it has also been stated that Braakstaging is not related to clinical severity and cognitiveimpairment.41 Thus, the relationship between the pres-ence of a-synuclein aggregates and cognitive deficits inPD remains controversial. Recent studies have shownan increase in the severity of a-synuclein pathology inthe basal forebrain and hippocampus in combinationwith more widespread degeneration of cortical dopa-minergic and cholinergic pathways in demented PDpatients.42 On the other hand, Alzheimer’s disease–type pathology has been highlighted as an important
FIG. 3. Neuropsychological profile at the 3-cluster level. Neuropsychological profiles for healthy controls in green, pattern 1 in blue, pattern 2 in red,and pattern 3 in purple. Data are presented as z scores. Lower z scores indicate worse performance. BNT, Boston Naming Test; JLO, Judgment ofLine Orientation Test; RAVLT total, Rey Auditory Verbal Learning Test total; RAVLT recall, Rey Auditory Verbal Learning Test recall after 30 minutes;SDMT, Symbol Digits Modalities Test; TMTA, Trail Making Test Part A; TMTB, Trail Making Test Part B; TMTA minus B, Trail Making Test A minus B;VFD, Visual Form Discrimination Test. [Color figure can be viewed in the online issue, which is available at wileyonlinelibrary.com.]
U R I B E E T A L
704 Movement Disorders, Vol. 31, No. 5, 2016

cofactor in the progression of cognitive impairment inPD43,44 as well as other pathological findings such ascerebrovascular disease and hippocampal sclerosis (seeHalliday and colleagues45 for a review). In our opin-ion, our results might be related to abnormal proteindeposition, including a-synucleinopathy and Alzhei-mer’s disease–type pathology, as has been shown inprevious neuropathological and PittsburghCompound-B (PiB) PET studies.46 A neuropathologicalstudy of a large sample of demented PD patientsshowed that all patients had abnormal cortical synu-clein aggregates, and 60% also had abnormalamyloid-b deposits.46 In one PET study of cognitivelyimpaired PD patients, abnormal PiB binding wasobserved in 17% of the patients.47 We could speculatethat pattern 1 in our sample could be reflectingpatients with abnormal amyloid-b associated withabnormal cortical a-synuclein deposition becausepatients in this group showed atrophy in the medialtemporal and parietal cortices, regions reported as sen-sitive to progressive cortical thinning in cognitivelypreserved PiB 1 patients.48 Patterns 1 and 2 in ourstudy differed in the degree of atrophy in the posteriorcingulate, isthmus of the cingulate, and precuneus. Inthis line, it has been reported that in nondementedPD, higher PiB retention in the precuneus seems tocontribute to cognitive decline over time.49
In addition, we identified a PD subtype withoutmanifest cortical atrophy. This group showed no sig-nificant differences in disease duration, motor symp-toms, or LEDD when compared with other PDsubtypes. As such, patients in this group were not inan earlier disease stage. Interestingly, other studiesreported cortical differences in gray matter atrophybetween motor subtypes showing a reduction predom-inantly in postural-instability and gait-difficultypatients in comparison with tremor-dominantpatients.50 Our results showed no significant differen-ces between groups in motor symptoms measured bythe UPDRS. However, the specific motor profile of
our groups was not evaluated in depth. Previous stud-ies comparing HC with early PD,23,28,51 or with PDpatients with and without MCI,26,27 have oftendescribed differences that did not survive correctionfor multiple comparisons. In our opinion, these find-ings suggest the existence of a subtype of PD withslower cortical degeneration. The absence of structuralchanges between cognitively unimpaired de novo PDpatients and HC has been reported even using techni-ques sensitive to subtle longitudinal changes such astensor-based morphometry.52 Longitudinal corticalthickness studies could assess whether this corticalpattern might constitute a biomarker of better cogni-tive prognosis.
The 3 PD subtypes identified had specific cognitivecharacteristics. The parietal-temporal and occipitaland frontal subtypes (patterns 1 and 2, respectively)performed significantly worse than HC on JLO,TMTB, TMTA minus TMTB, and SDMT tests,although the occipital and frontal subtype showed lesspronounced impairment. In addition, the parietal-temporal subtype also performed worse in RAVLT,Stroop Color, and TMTA and showed more severedepression and apathy symptoms than HC. However,contrary to what might have been expected, therewere no differences in the proportion of patients withMCI between PD subtypes. A previous model-basedcluster analysis study using neuropsychological data4
also described heterogeneous cognitive impairment inPD from cognitively intact patients to very severelyimpaired patients with a progressive severity gradient.The authors found a group of patients within the nor-mal range of cognitive performance, but with lowerscores on working memory, verbal episodic memory,and executive functions. In addition, they found a sec-ond group of PD patients with varying degrees ofimpairment in all cognitive domains. Patients in thecognitively impaired cluster were older, less educated,and more apathetic than the cognitively unimpairedpatients; these characteristics partially overlap with
TABLE 2. Results from emotion recognition tests at the 3-cluster level
PD subtypes
HC, n 5 31,
mean (SD)
Pattern 1, n 5 30,
mean (SD)
Pattern 2, n 5 29,
mean (SD)
Pattern 3, n 5 29,
mean (SD)
Test stats,a
P value
Anger 20.23 (1.0) 20.23 (1.1) 0.00 (0.7) 0.07 (1.0) 0.762, .518Disgust 20.45 (1.6) 20.43 (1.1) 20.50 (1.0) 0.09 (0.9) 1.513, .216Fear 0.00 (0.8) 0.07 (0.8) 20.04 (1.0) 20.07 (1.0) 0.124, .946Sadness 20.19 (1.1) 20.53 (0.9) 20.27 (0.7) 0.14 (0.7) 2.587, .057b
Happiness 20.18 (1.6) 20.58 (1.9) 20.22 (1.1) 20.11 (1.0) 0.526, .665Surprise 20.40 (1.4) 20.11 (1.1) 0.06 (0.9) 0.04 (0.9) 1.040, .378Total score 20.12 (0.7) 20.03 (0.6) 0.02 (0.5) 0.02 (1.1) 0.209, .890
HC, healthy controls; PD, Parkinson’s disease; SD, standard deviation.Results of the Ekman 60 Faces Test, presented in z scores.aAnalysis of variance.bSignificant differences between HC and pattern 2 in Bonferroni post hoc test (P<.05).
C O R T I C A L T H I C K N E S S C L U S T E R A N A L Y S I S I N P D
Movement Disorders, Vol. 31, No. 5, 2016 705
the parietal-temporal subtype we describe. However,the cognitively impaired group in the study by Dujar-din and colleagues4 included a wider range of cogni-tive deficits, from MCI to dementia, whereas ourstudy did not include demented patients. Contrary toour results in which there were no significant differen-ces in motor disease severity or disease durationbetween cluster groups, Dujardin and colleagues4
found that the cognitively impaired group showedmore severe motor symptoms, longer disease duration,and more axial signs in comparison with cognitivelyunimpaired patients.
It is noteworthy that, among all the cognitive testsused, only semantic fluency specifically differentiatedthe parietal-temporal pattern from other PD subtypes.We have previously shown a positive correlationbetween semantic fluency and medial temporal andprecuneus cortical thickness.13 In addition, semanticfluency has been shown in population-based longitudi-nal studies to be a predictor of dementia in PD.53,54
Barker and Williams-Gray55 suggested that there is aposterior cognitive syndrome with impaired semanticfluency, nondopaminergic deficits, and worse progno-sis. In a recent review, Sauerbier and colleagues56
defined this phenotype as “Park cognitive.” Together,these results highlight the usefulness of semantic flu-ency as an easily administered task that should beincluded in the routine neuropsychological assessmentto help identify this subtype of PD patients.
Focusing on the occipital and frontal subtype,patients were younger at PD onset and showedimpaired recognition of sadness in facial expressions.In line with these results, voxel-based morphometrystudies showed medial OFC atrophy in younger PDpatients (<70 years) when compared with HC57 andrelated it with specific cognitive deficits.58 Specifically,medial OFC volume has been associated with overall58
as well as negative facial emotion recognition in PD.13
Cognitive performance in the nonatrophic subtypefollowed a similar pattern as that in the other groups.However, only Stroop Word scores were significantlydifferent between the nonatrophic group and HC.Similarly, as we previously mentioned, previous clusteranalyses using neuropsychological data reported theexistence of a PD subtype composed of cognitivelyintact patients and patients with lower scores(although within the normal range) on different cogni-tive domains commonly impaired in PD.4 These resultscould lead us to speculate the existence of a subgroupof PD patients with limited cortical atrophy with cog-nitive profiles similar but possibly less severe thanthose of patients with faster structural degeneration.Beyond the presence of a-synuclein pathology andAlzheimer’s disease–type pathology, functional deficitsrelated to neurotransmitter deficiencies (mostly butnot only dopaminergic) as well as defects involving
diverse metabolic pathways (abnormal oxidativestress, gene regulation, protein degradation, and syn-aptic degeneration), translate as an early involvementof the cerebral cortex in PD (see Ferrer59 and Ferrerand colleagues60 for reviews). These findings mightexplain cognitive dysfunctions in the absence of evi-dent structural changes. Alternatively, structuralchanges might be below the detection threshold ofcortical thickness methods in such cases. In this vein,future fMRI connectivity studies might help to charac-terize the functional changes associated with the corti-cal thickness patterns herein identified.
Finally, none of the PD subtypes showed significantdifferences on the digits subtest, Stroop Word-Color,phonemic fluency, or the BNT. The sensitivity of thesetests to detect cognitive impairment in PD should beassessed in future studies using different cohorts tovalidate their role in recommended neuropsychologicalbatteries. Moreover, in light of our results, it wouldbe interesting to include other tests that could be asso-ciated with occipital and frontal atrophy, such as emo-tion recognition tests, in standard protocols. The earlyidentification of these PD subtypes through cognitiveand clinical characteristics could facilitate the study ofdifferent patterns of deterioration over time. In thenear future, longitudinal assessments might help clar-ify whether the cortical atrophy patterns reported inour results are associated with clinical PD subtypesidentified recently as diffuse/malignant with rapid pro-gression to dementia, mainly motor/slow progressionand intermediate.3
The main strength of our study is the use of corticalthickness as a main variable because this is an objec-tive measure based on validated methods. Clusteringanalysis using MRI data may allow future studiesusing other independent cohorts to validate thesepatterns.
In conclusion, the cluster analysis of cortical thick-ness data in nondemented PD patients identified 3 sub-types consisting of (1) parieto-temporal pattern ofatrophy with significant cognitive impairment, (2)occipital and frontal cortical atrophy with younger PDonset, and (3) patients without manifest cortical atro-phy. This effort to identify different PD phenotypesbased on objective data could be valuable for theestablishment of prognostic markers in PD.
Acknowledgments: Without the support of the patients, their fam-ilies, and control subjects, this work would have not been possible.
References1. Svenningsson P, Westman E, Ballard C, Aarsland D. Cognitive
impairment in patients with Parkinson’s disease: diagnosis, bio-markers, and treatment. Lancet Neurol 2012;11:697-707.
2. Van Rooden SM, Colas F, Martinez-Martin P, et al. Clinical sub-types of Parkinson’s disease. Mov Disord 2011;26(1):51-58.
3. Fereshtehnejad SM, Romenets SR, Anang JBM, Latreille V,Gagnon JF, Postuma RB. New clinical subtypes of parkinson
U R I B E E T A L
706 Movement Disorders, Vol. 31, No. 5, 2016
disease and their longitudinal progression: a prospective cohortcomparison with other phenotypes. JAMA Neurol 2015;72(8):1-11.
4. Dujardin K, Leentjens AFG, Langlois C, et al. The spectrum ofcognitive disorders in Parkinson’s disease: a data-driven approach.Mov Disord 2013;28(2):183-189.
5. Daniel SE, Lees AJ. Parkinson’s Disease Society Brain Bank, Lon-don: overview and research. J Neural Transm Suppl 1993;39:165-172.
6. Emre M, Aarsland D, Brown R, et al. Clinical diagnostic criteriafor dementia associated with Parkinson’s disease. Mov Disord2007;22(12):1689-1707.
7. Hoehn MM, Yahr MD. Parkinsonism: onset, progression and mor-tality. Neurology 1967;17(5):427-442.
8. Folstein MF, Folstein SE, McHugh PR. Mini-mental state. A prac-tical method for grading the cognitive state of patients for the clini-cian. J Psychiatr Res 1975;12(3):189-198.
9. Fahn, S, Elton R. UPDRS program members. Unified Parkinson’sDisease Rating Scale. In: Fahn S, Marsden CD, Goldstein M, CalneD, eds. Recent Developments in Parkinson’s Disease. XXX,XX:XXXXX Florham Park, NJ: Macmillan Health Care Information;1987:153-163.
10. Tomlinson CL, Stowe R, Patel S, Rick C, Gray R, Clarke CE. Sys-tematic review of levodopa dose equivalency reporting in Parkin-son’s disease. Mov Disord 2010;25(15):2649-2653.
11. Litvan I, Goldman JG, Tr€oster AI, et al. Diagnostic criteria formild cognitive impairment in Parkinson’s disease: MovementDisorder Society Task Force guidelines. Mov Disord 2012;27(3):349-356.
12. Ekman R. Pictures of Facial Affect. Palo Alto, CA: Consulting Psy-chologists Press; 1975.
13. Baggio HC, Segura B, Ibarretxe-Bilbao N, et al. Structural corre-lates of facial emotion recognition deficits in Parkinson’s diseasepatients. Neuropsychologia 2012;50(8):2121-2128.
14. Beck A, Steer R, Brown G. Manual for the Beck Depression Inven-tory-II. San Antonio, TX: Psychological Corporation; 1996.
15. Starkstein SE, Mayberg HS, Preziosi TJ, Andrezejewski P,Leiguarda R, Robinson RG. Reliability, validity, and clinical corre-lates of apathy in Parkinson’s disease. J Neuropsychiatry Clin Neu-rosci 1992;4(2):134-139.
16. Cummings JL, Mega M, Gray K, Rosenberg-Thompson S, CarusiDA, Gornbein J. The Neuropsychiatric Inventory: comprehensiveassessment of psychopathology in dementia. Neurology 1994;44(12):2308-2314.
17. Whitwell JL, Przybelski SA, Weigand SD, et al. Distinct anatomicalsubtypes of the behavioral variant of frontotemporal dementia: Acluster analysis study. Brain 2009;132(11):2932-2946.
18. Noh Y, Jeon S, Lee JM, et al. Anatomical heterogeneity of Alzhei-mer disease: based on cortical thickness on MRIs. Neurology2014;83:1-9.
19. Ward JH. Hierarchical grouping to optimize an objective function.J Am Stat Assoc 1963;58(301):236-244.
20. Aarsland D, Brønnick K, Larsen JP, Tysnes OB, Alves G. Cognitiveimpairment in incident, untreated Parkinson disease: the Norwe-gian ParkWest study. Neurology 2009;72(13):1121-1126.
21. Abdi H, Williams LJ. Principal component analysis. Wiley Interdis-cip Rev Comput Stat 2010;2(4):433-459.
22. Field A. Discovering Statistics Using SPSS. 2nd ed. London, UK:Sage Publications; 2009.
23. Ibarretxe-Bilbao N, Junque C, Segura B, et al. Progression of corti-cal thinning in early Parkinson’s disease. Mov Disord 2012;27(14):1746-1753.
24. Lyoo CH, Ryu YH, Lee MS. Topographical distribution of cere-bral cortical thinning in patients with mild Parkinson’s diseasewithout dementia. Mov Disord 2010;25(4):496-499.
25. Segura B, Baggio HC, Marti MJ, et al. Cortical thinning associatedwith mild cognitive impairment in Parkinson’s disease. Mov Dis-ord 2014;29(12):1495-1503.
26. Hanganu A, Bedetti C, Jubault T, et al. Mild cognitive im-pairment in patients with Parkinson’s disease is associated withincreased cortical degeneration. Mov Disord 2013;28(10):1360-1369.
27. Pagonabarraga J, Corcuera-Solano I, Vives-Gilabert Y, et al. Pat-tern of regional cortical thinning associated with cognitive deterio-ration in Parkinson’s disease. PLoS One 2013;8(1):e54980.
28. Pereira JB, Svenningsson P, Weintraub D, et al. Initial cognitivedecline is associated with cortical thinning in early Parkinson dis-ease. Neurology 2014;82(22):2017-2025.
29. Compta Y, Pereira JB, R�ıos J, et al. Combined dementia-risk bio-markers in Parkinson’s disease: a prospective longitudinal study.Park Relat Disord 2013;19(8):717-724.
30. Garcia-Garcia D, Clavero P, Gasca-Salas C, et al. Posterior parie-tooccipital hypometabolism may differentiate mild cognitiveimpairment from dementia in Parkinson’s disease. Eur J Nucl MedMol Imaging 2012;39(11):1767-1777.
31. Gonzalez-Redondo R, Garc�ıa-Garc�ıa D, Clavero P, et al. Greymatter hypometabolism and atrophy in Parkinson’s disease withcognitive impairment: a two-step process. Brain 2014;137:2356-2367.
32. Huang C, Tang C, Feigin A, et al. Changes in network activitywith the progression of Parkinson’s disease. Brain 2007;130(7):1834-1846.
33. Fern�andez-Seara MA, Mengual E, Vidorreta M, et al. Corticalhypoperfusion in Parkinson’s disease assessed using arterial spinlabeled perfusion MRI. Neuroimage 2012;59(3):2743-2750.
34. Christopher L, Strafella AP. Neuroimaging of brain changes associ-ated with cognitive impairment in Parkinson’s disease. J Neuropsy-chol 2013;7(2):225-240.
35. Lin CH, Wu RM. Biomarkers of cognitive decline in Parkinson’sdisease. Parkinsonism Relat Disord 2015;21:431-443.
36. Lyoo CH, Jeong Y, Ryu YH, Rinne JO, Lee MS. Cerebral glucosemetabolism of Parkinson’s disease patients with mild cognitiveimpairment. Eur Neurol 2010;64:65-73.
37. Madhyastha TM, Askren MK, Boord P, Zhang J, Leverenz JB,Grabowski TJ. Cerebral perfusion and cortical thickness indicatecortical involvement in mild Parkinson’s disease. Mov Disord2015;30(14):1893-1900.
38. Pereira JB, Ibarretxe-Bilbao N, Marti MJ, et al. Assessment ofcortical degeneration in patients with Parkinson’s disease by voxel-based morphometry, cortical folding, and cortical thickness. HumBrain Mapp 2012;33(11):2521-2534.
39. Braak H, Del K, R€ub U, de Vos RAI, Jansen-Steur ENH, Braak E.Staging of brain pathology related to sporadic Parkinson’s disease.Neurobiol Aging 2003;24:197-211.
40. Jellinger KA. Lewy body-related a-synucleinopathy in the agedhuman brain. J Neural Transm 2004;111:1219-1235.
41. Jellinger KA. A critical reappraisal of current staging of Lewy-related pathology in human brain. Acta Neuropathol 2008;116:1-16.
42. Hall H, Reyes S, Landeck N, et al. Hippocampal Lewy pathologyand cholinergic dysfunction are associated with dementia in Par-kinson’s disease. Brain 2014;137:2493-2508.
43. Jellinger KA. A critical evaluation of current staging of alpha-synuclein pathology in Lewy body disorders. Biochim BiophysActa 2009;1792(7):730-740.
44. Horvath J, Herrmann FR, Burkhard PR, Bouras C, K€ovari E. Neu-ropathology of dementia in a large cohort of patients with Parkin-son’s disease. Park Relat Disord 2013;19(10):864-868.
45. Halliday GM, Leverenz MD, Schneider JS, Adler CH. The neuro-biological basis of cognitive impairment in Parkinson’s disease.Mov Disord 2014;29(5):634-650.
46. Perlmutter JS, Norris SA. Neuroimaging biomarkers forParkinson disease: facts and fantasy. Ann Neurol 2014;76(6):769-783.
47. Campbell MC, Markham J, Flores H, et al. Principal componentanalysis of PiB distribution in Parkinson and Alzheimer disease.Neurology 2013;81:520-527.
48. Dor�e V, Villemagne VL, Bourgeat P, et al. Cross-sectionaland longitudinal analysis of the relationship between Ab deposi-tion, cortical thickness, and memory in cognitively unimpairedindividuals and in Alzheimer disease. JAMA Neurol 2013;70(7):903-911.
49. Gomperts SN, Locascio JJ, Rentz DM, et al. Amyloid is linked tocognitive decline in patients with Parkinson disease withoutdementia. Neurology 2013;80(1):85-91.
C O R T I C A L T H I C K N E S S C L U S T E R A N A L Y S I S I N P D
Movement Disorders, Vol. 31, No. 5, 2016 707
50. Rosenberg-Katz K, Herman T, Jacob Y, Giladi N, Hendler T,Hausdorff JM. Gray matter atrophy distinguishes between Parkin-son disease motor subtypes. Neurology 2013;80(16):1476-1484.
51. Jubault T, Gagnon JF, Karama S, et al. Patterns of cortical thick-ness and surface area in early Parkinson’s disease. Neuroimage2011;55(2):462-467.
52. Tessa C, Lucetti C, Giannelli M, et al. Progression of brain atro-phy in the early stages of Parkinson’s disease: A longitudinaltensor-based morphometry study in de novo patients without cog-nitive impairment. Hum Brain Mapp 2014;35:3932-3944.
53. Williams-Gray CH, Foltynie T, Brayne CEG, Robbins TW, BarkerRA. Evolution of cognitive dysfunction in an incident Parkinson’sdisease cohort. Brain 2007;130(7):1787-1798.
54. Williams-Gray CH, Evans JR, Goris A, et al. The distinct cognitivesyndromes of Parkinson’s disease: 5 year follow-up of the Cam-PaIGN cohort. Brain 2009;132(11):2958-2969.
55. Barker RA, Williams-Gray CH. Mild cognitive impairment andParkinson’s disease—something to remember. J Parkinson’s D2014;4:651-656.
56. Sauerbier A, Jenner P, Todorova A, Chaudhuri KR. Non motorsubtypes and Parkinson’s Disease. Parkinsonism Relat Disord2016;22:S41-S46.
57. Lee YE, Sen S, Eslinger PJ, et al. Early cortical gray matter lossand cognitive correlates in non-demented Parkinson’s patients. Par-kinsonism Relat Disord 2013;19(12):1088-1093.
58. Ibarretxe-Bilbao N, Junque C, Tolosa E, et al. Neuroanatomicalcorrelates of impaired decision-making and facial emotion recogni-tion in early Parkinson’s disease. Eur J Neurosci 2009;30(6):1162-1171.
59. Ferrer I. Early involvement of the cerebral cortex in Parkinson’sdisease: convergence of multiple metabolic defects. Prog Neurobiol2009;88:89-103.
60. Ferrer I, L�opez-Gonz�alez I, Carmona M, Dalf�o E, Pujol A,Mart�ınez A. Neurochemistry and the non-motor aspects of PD.Neurobiol Dis 2012; 46:508-526.
Supporting Data
Additional Supporting Information may be found inthe online version of this article at the publisher’sweb-site
U R I B E E T A L
708 Movement Disorders, Vol. 31, No. 5, 2016

101
Supplementary material
Supplementary Methods 1. Neuropsychological assessment Visuospatial and visuoperceptual functions were assessed with Benton Visual Form Discrimination (VFD) and Judgment of Line Orientation (JLO) tests; executive functions were evaluated with phonemic (words beginning with the letter “p” in 1 minute) and semantic (animals in 1 minute) fluencies; memory through total learning recall (sum of correct responses from trial I to trial V) and delayed recall (total recall after 20 min) through scores on Rey’s Auditory Verbal
Learning Test (RAVLT). Attention and WM were assessed with Digit Span Forward and Backward, the Stroop Color-Word Test, Symbol Digits Modalities Tests (SDMT) and the Trail Making Test (in seconds), part A (TMTA) and part B (TMTB); and language was assessed by the total number of correct responses in the short version of the Boston Naming Test (BNT). Initially, z scores for each test and for each subject were calculated based on the control group’s means and standard deviations. Expected z scores adjusted for
age, sex, and education for each test and each subject were calculated based on a multiple regression analysis performed in the HC group.1 As in a previous study,2 the presence of MCI was established if the z score for a given test was at least 1.5 lower than the expected score in at least two tests in one domain, or in at least one test per domain in at least two domains. Supplementary Methods 2. Cortical thickness procedures The procedures carried out by FreeSurfer include removal of nonbrain data, intensity normalization,3 tessellation of the gray matter/white matter boundary, automated topology correction,4,5 and accurate surface deformation to identify tissue borders).6-8 Cortical thickness is then calculated as the distance between the white and gray matter surfaces at each vertex of the reconstructed cortical mantle.8 In our study, results for each subject were visually inspected to ensure accuracy of registration, skull stripping, segmentation, and cortical surface reconstruction. Maps were smoothed using a circularly symmetric Gaussian kernel across the surface with a full width at half maximum of 15 mm. Supplementary Results 1. PD patterns according to cluster analysis at 2 and 4-cluster level solutions. At the 2-cluster level, two patterns of cortical atrophy were identified. PD patients included in pattern 1 (n=30, 34.09%) showed reduced cortical thickness compared with HC in lateral and medial regions bilaterally, including the precentral gyrus, inferior and superior parietal lobules, cuneus, posterior cingulate gyrus and parahippocampal gyrus. As patients included in pattern 1 were significantly older and less educated than HC (age mean ± SD for pattern
1: 70.60 ± 9.6; for HC: 64.3 ± 8.5, F=11.115, p<0.0001; education mean ± SD for pattern 1: 7.77 ± 4.8; for HC: 11.0 ± 4.2, F=8.089; p=0.001), age and years of education were controlled for when comparing these groups. Patients in pattern
2 (n=58, 65.10%) showed reduced cortical thickness in the left lateral occipital region, and bilaterally in the cuneus and medial orbitofrontal areas in comparison with HC.
102
Demographical and clinical characteristics of the two patterns are in supplementary Table 2, neuropsychological tests results in supplementary Table 3 and the emotion recognition task in supplementary Table 4. At the 4-cluster level, pattern 1 was divided into two different clusters. As the number of subjects in one group was too small (n=9), we did not perform additional analyses. Supplementary Results 2. Principal Component Analysis Eigenvalues extracted from the analyses had the highest separation between the first four components. We chose the first two components because they had the highest separation and explained 12.84% of variance (7.49% the first component and 5.35% the second). The third and fourth components only accounted for 3.74% and 2.95% of the explained variance based on the loadings of the PCA. The first component (x-axis) captured the variability of cortical thickness differences in pattern 1. PD patients that had positive loading for the first component were also classified in pattern 1 (n=25). PD patients who are represented in the PCA plot as negative loading for the first component were from pattern 2 at the 2 cluster level (n=47). Half of them also had negative loadings for the second component, whereas others were positive. Patients who are represented in the left inferior side of the plot (negative for both components) were those that at the 3 cluster level had no cortical thickness differences with HC (pattern 3; n=21). Patients in pattern 2 at the 3 cluster level had positive loading for the second component (n=26) (Figure A1). References 1. Aarsland D, Brønnick K, Larsen JP, Tysnes OB, Alves G. Cognitive impairment in incident, untreated Parkinson disease: the Norwegian ParkWest study. Neurology 2009;72(13):1121-1126. 2. Segura B, Baggio HC, Marti MJ, et al. Cortical thinning associated with mild cognitive impairment in Parkinson’s disease. Mov Disord 2014;29(12):1495-1503. 3. Fischl B, Liu A, Dale AM. Automated manifold surgery: constructing geometrically accurate and topologically correct models of the human cerebral cortex. IEEE Trans Med Imaging 2001;20:70-80. 4. Dale AM, Fischl B, Sereno MI. Cortical surface-based analysis. I. Segmentation and surface reconstruction. Neuroimage 1999;9:179-194. 5. Segonne F, Pacheco J, Fischl B. Geometrically accurate topology-correction of cortical surfaces using nonseparating loops. IEEE Trans Med Imaging 2007;26:518-529.

103
6. Dale AM, Sereno MI. Improved localization of cortical activity by combining EEG and MEG with MRI cortical surface reconstruction: a linear approach. J Cogn Neurosci 1993;5:162-176. 7. Fischl B, Dale AM. Measuring the thickness of the human cerebral cortex from magnetic resonance images. Proc Natl Acad Sci U S A 2000;97:11050-11055. 8. Fischl B, Salat DH, Busa E, et al. Whole brain segmentation: automated labeling of neuroanatomical structures in the human brain. Neuron 2002;33:341-355.
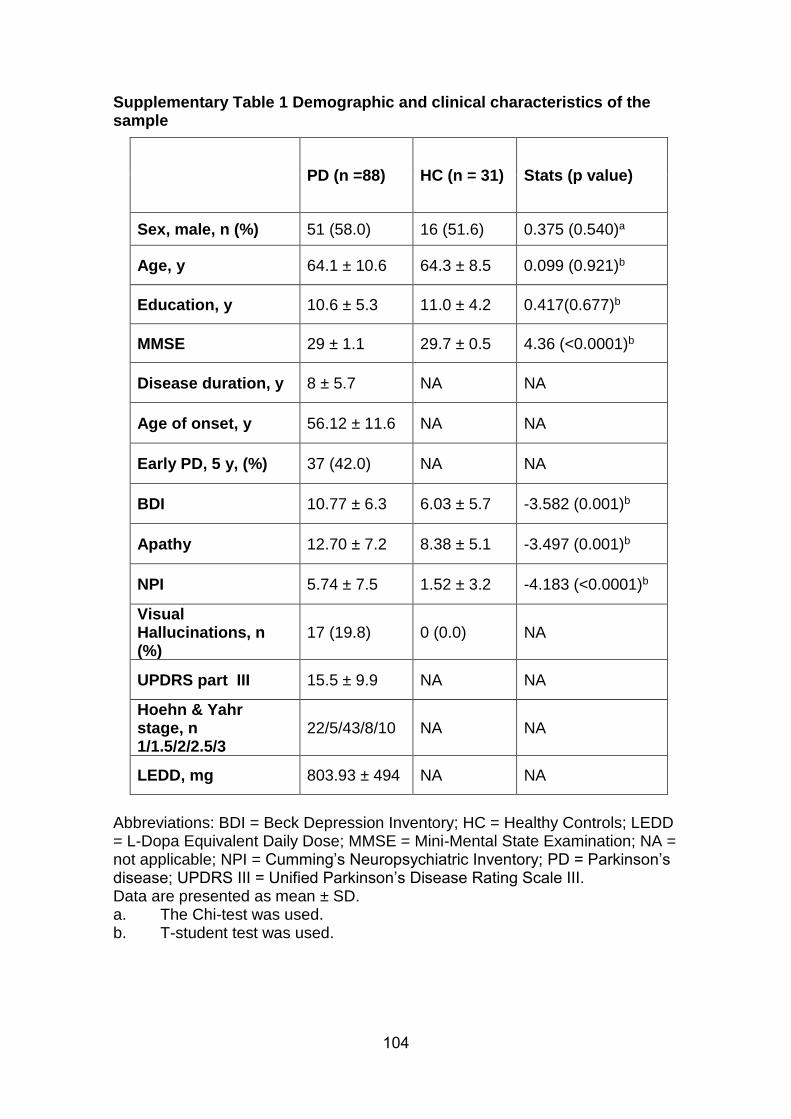
104
Supplementary Table 1 Demographic and clinical characteristics of the sample
PD (n =88) HC (n = 31) Stats (p value)
Sex, male, n (%) 51 (58.0) 16 (51.6) 0.375 (0.540)a
Age, y 64.1 ± 10.6 64.3 ± 8.5 0.099 (0.921)b
Education, y 10.6 ± 5.3 11.0 ± 4.2 0.417(0.677)b
MMSE 29 ± 1.1 29.7 ± 0.5 4.36 (<0.0001)b
Disease duration, y 8 ± 5.7 NA NA
Age of onset, y 56.12 ± 11.6 NA NA
Early PD, 5 y, (%) 37 (42.0) NA NA
BDI 10.77 ± 6.3 6.03 ± 5.7 -3.582 (0.001)b
Apathy 12.70 ± 7.2 8.38 ± 5.1 -3.497 (0.001)b
NPI 5.74 ± 7.5 1.52 ± 3.2 -4.183 (<0.0001)b
Visual Hallucinations, n (%)
17 (19.8) 0 (0.0) NA
UPDRS part III 15.5 ± 9.9 NA NA
Hoehn & Yahr stage, n 1/1.5/2/2.5/3
22/5/43/8/10 NA NA
LEDD, mg 803.93 ± 494 NA NA
Abbreviations: BDI = Beck Depression Inventory; HC = Healthy Controls; LEDD = L-Dopa Equivalent Daily Dose; MMSE = Mini-Mental State Examination; NA = not applicable; NPI = Cumming’s Neuropsychiatric Inventory; PD = Parkinson’s disease; UPDRS III = Unified Parkinson’s Disease Rating Scale III. Data are presented as mean ± SD. a. The Chi-test was used. b. T-student test was used.

105
Supplementary Table 2 Demographic and clinical characteristics at 2-cluster level
PD subtypes
HC (n = 31)
Stats (p value) Pattern 1
(n=30) Pattern 2 (n=58)
Sex, male, n (%) 15 (50.0) 36 (62.1) 16 (51.6) 1.545 (0.462)a
Age, y 70.60 ± 9.6 60.76 ± 9.5 64.3 ± 8.5 11.115 (<0.0001)c,e,g
Education, y 7.77 ± 4.8 12.05 ± 5.0 11.0 ± 4.2 8.089 (0.001)c,e,g
MMSE 28.57 ± 1.4 29.28 ± 0.9 29.7 ± 0.5 10.462 (<0.0001)d,e,f,g
Disease duration, y
8.77 ± 6.6 7.60 ± 5.1 NA 0.917 (0.362)b
Age of onset, y 61.83 ± 12.7 53.16 ± 9.9 NA 3.252 (0.002)b
Early PD, <=5 y, (%)
12 (40.0) 25 (43.1) NA 0.078 (0.780)a
BDI 13.67 ± 5.7 9.27 ± 6.2 6.03 ± 5.7 11.824 (<0.0001)c,e,g
Apathy 15.11 ± 7.9 11.43 ± 6.5 8.38 ± 5.1 7.489 (0.001)d,e
NPI 6.59 ± 7.8 5.31 ± 7.4 1.52 ± 3.2 4.352 (0.015)d,f
Visual Hallucinations, n (%)
6 (20.0) 11 (19.6) 0 (0.0) 7.640 (0.106)a
UPDRS part III 18.07 ± 9.1 14.12 ± 10.1 NA 1.798 (0.076)b
Hoehn & Yahr stage, n 1/1.5/2/2.5/3
2/3/16/4/5 20/2/27/4/5 NA 9.827 (0.043)a
LEDD,mg 764.63 ± 388.28
824.26 ± 542.72
NA -0.593 (0.555)b
Total MCI, n (%) 20 (66.7) 25 (43.1) NA 4.394 (0.036)a
Visuospatial functions, n (%)
10 (33.3) 16 (27.6) NA 0.314 (0.575)a
Executive functions, n (%)
16 (3.3) 12 (20.7) NA 9.712 (0.002)a
Memory, n (%) 14 (46.7) 20 (34.5) NA 1.238 (0.266)a
Attention and WM, n (%)
20 (66.7) 31 (53.4) NA 1.418 (0.234)a

106
Language, n (%) 2 (6.7) 5 (8.6) NA 0.103 (0.748)a
Abbreviations: Apathy = Starkstein’s Apathy Scale; BDI = Beck Depression Inventory-II; HC = Healthy Controls; LEDD = L-DOPA Equivalent Daily Dose; MCI = Mild Cognitive Impairment; MMSE = Mini-Mental State Examination; NA = not applicable; NPI = Cumming’s Neuropsychiatric Inventory; PD = Parkinson’s disease; UPDRS III = Unified Parkinson’s Disease Rating Scale, motor section; WM = Working Memory. Data are presented as mean ± SD(continuous) or frequencies (categorical).
a. The Chi-test was used. b. T-student test was used. c. Analysis of variance (ANOVA) followed by Bonferroni post hoc test was
used. d. Analysis of variance (ANOVA) followed by Tamhane (T2) post hoc test
was used. e. Significant differences (p<0.05) between HC and Pattern 1. f. Significant differences (p<0.05) between HC and Pattern 2. g. Significant differences (p<0.05) between both PD patterns.
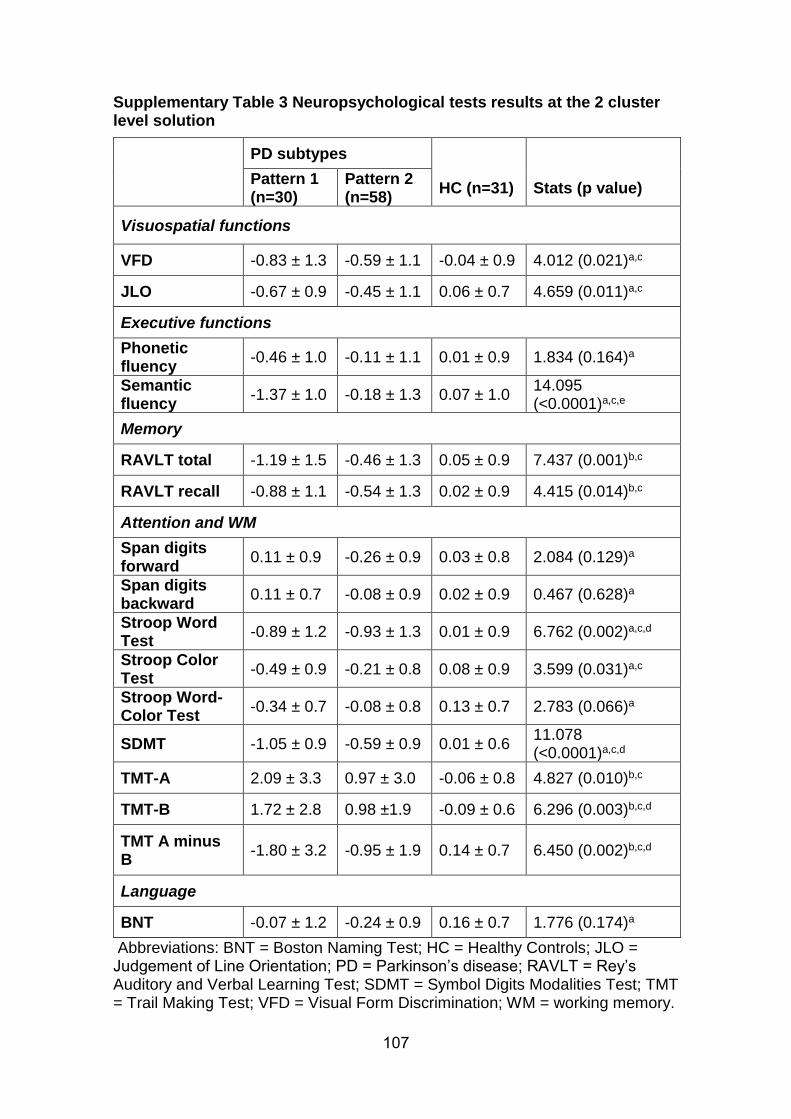
107
Supplementary Table 3 Neuropsychological tests results at the 2 cluster level solution
PD subtypes
Pattern 1 (n=30)
Pattern 2 (n=58)
HC (n=31) Stats (p value)
Visuospatial functions
VFD -0.83 ± 1.3 -0.59 ± 1.1 -0.04 ± 0.9 4.012 (0.021)a,c
JLO -0.67 ± 0.9 -0.45 ± 1.1 0.06 ± 0.7 4.659 (0.011)a,c
Executive functions
Phonetic fluency
-0.46 ± 1.0 -0.11 ± 1.1 0.01 ± 0.9 1.834 (0.164)a
Semantic fluency
-1.37 ± 1.0 -0.18 ± 1.3 0.07 ± 1.0 14.095 (<0.0001)a,c,e
Memory
RAVLT total -1.19 ± 1.5 -0.46 ± 1.3 0.05 ± 0.9 7.437 (0.001)b,c
RAVLT recall -0.88 ± 1.1 -0.54 ± 1.3 0.02 ± 0.9 4.415 (0.014)b,c
Attention and WM
Span digits forward
0.11 ± 0.9 -0.26 ± 0.9 0.03 ± 0.8 2.084 (0.129)a
Span digits backward
0.11 ± 0.7 -0.08 ± 0.9 0.02 ± 0.9 0.467 (0.628)a
Stroop Word Test
-0.89 ± 1.2 -0.93 ± 1.3 0.01 ± 0.9 6.762 (0.002)a,c,d
Stroop Color Test
-0.49 ± 0.9 -0.21 ± 0.8 0.08 ± 0.9 3.599 (0.031)a,c
Stroop Word-Color Test
-0.34 ± 0.7 -0.08 ± 0.8 0.13 ± 0.7 2.783 (0.066)a
SDMT -1.05 ± 0.9 -0.59 ± 0.9 0.01 ± 0.6 11.078 (<0.0001)a,c,d
TMT-A 2.09 ± 3.3 0.97 ± 3.0 -0.06 ± 0.8 4.827 (0.010)b,c
TMT-B 1.72 ± 2.8 0.98 ±1.9 -0.09 ± 0.6 6.296 (0.003)b,c,d
TMT A minus B
-1.80 ± 3.2 -0.95 ± 1.9 0.14 ± 0.7 6.450 (0.002)b,c,d
Language
BNT -0.07 ± 1.2 -0.24 ± 0.9 0.16 ± 0.7 1.776 (0.174)a
Abbreviations: BNT = Boston Naming Test; HC = Healthy Controls; JLO = Judgement of Line Orientation; PD = Parkinson’s disease; RAVLT = Rey’s Auditory and Verbal Learning Test; SDMT = Symbol Digits Modalities Test; TMT = Trail Making Test; VFD = Visual Form Discrimination; WM = working memory.

108
Data are presented as mean ± SD. All scores are z scores. a. Analysis of variance (ANOVA) followed by Bonferroni post hoc test was
used. b. Analysis of variance (ANOVA) followed by Tamhane (T2) post hoc test
was used. c. Significant differences (p<0.05) between HC and Pattern 1. d. Significant differences (p<0.05) between HC and Pattern 2. e. Significant differences (p<0.05) between both PD patterns.

109
Supplementary Table 4 Results from emotion recognition tests at the 2-cluster level
PD subtypes
HC (n=31) Test stats (p value) Pattern 1
(n=30) Pattern 2 (n=58)
Ekman anger -0.23 ± 1.0 -0.11 ± 0.9 0.07 ± 1.0 0.735 (0.482)a
Ekman disgust -0.45 ± 1.6 -0.47 ± 1.0 0.09 ± 0.9 2.266 (0.109)b
Ekman fear 0.00 ± 0.8 0.01 ± 0.9 -0.07 ± 1.0 0.085 (0.918)a
Ekman sadness -0.19 ± 1.1 -0.39 ± 0.8 0.14 ± 0.7 3.345 (0.039)a,c
Ekman happy -0.18 ± 1.6 -0.39 ± 1.5 -0.11 ± 1.0 0.389 (0.679)a
Ekman surprise -0.40 ± 1.4 -0.02 ± 1.0 0.04 ± 0.9 1.408 (0.249)a
Ekman total score
-0.12 ± 0.7 -0.00 ± 0.5 0.02 ± 1.1 0.285 (0.753)a
Results of the Ekman 60 Faces Test, presented in z scores. Abbreviations: HC = healthy controls; PD = Parkinson’s Disease.
a. Analysis of variance (ANOVA) followed by Bonferroni post hoc test. b. Analysis of variance (ANOVA) followed by Tamhane (T2) post hoc test. c. Significant differences (p<0.05) between HC and Pattern 2.

110
Supplementary Table 5 Neuropsychological tests results at the 3 cluster level solution
PD subtypes
Pattern 1 (n=30)
Pattern 2 (n=29)
Pattern 3 (n=29)
HC (n=31)
Stats (p value)
Visuospatial functions
VFD -0.83 ± 1.3
-0.55 ± 1.0
-0.62 ± 1.2
-0.04 ± 0.9
2.674 (0.051)a,c
JLO -0.67 ± 0.9
-0.65 ± 1.2
-0.26 ± 1.0
0.06 ± 0.7
3.933 (0.010)a,c,d
Executive functions
Phonetic fluency
-0.46 ± 1.0
-0.05 ± 1.1
-0.17 ± 1.1
0.01 ± 0.9
1.280 (0.285)
Semantic fluency
-1.37 ± 1.0
-0.16 ± 1.1
-0.21 ± 1.5
0.07 ± 1.0
9.325 (<0.0001)a,c,f,g
Memory
RAVLT total -1.19 ± 1.5
-0.55 ± 1.3
-0.37 ± 1.3
0.05 ± 0.9
5.031 (0.003)a,c
RAVLT recall
-0.88 ± 1.1
-0.64 ± 1.4
-0.44 ± 1.3
0.02 ± 0.9
3.061 (0.031)a,c
Attention and WM
Span digits forward
0.11 ± 0.9
-0.55 ± 0.8
0.04 ± 0.9
0.03 ± 0.8
3.687 (0.014)a,f
Span digits backward
0.11 ± 0.7
-0.25 ± 0.8
0.10 ± 1.0
0.02 ± 0.9
1.124 (0.342)
Stroop Word Test
-0.89 ± 1.2
-0.99 ± 1.4
-0.88 ± 1.4
0.01 ± 0.9
4.506 (0.005)a,c,d,e
Stroop Color Test
-0.49 ± 0.9
-0.38 ± 0.8
-0.05 ± 0.7
0.08 ± 0.9
3.149 (0.028)a,c
Stroop Word-Color Test
-0.34 ± 0.7
-0.18 ± 0.9
0.02 ± 0.7
0.13 ± 0.7
2.161 (0.097)
SDMT -1.05 ± 0.9
-0.70 ± 1.0
-0.48 ± 0.8
0.01 ± 0.6
7.685 (0.000)a,c,d
TMT-A 2.09 ± 3.3
1.44 ± 3.8
0.49 ± 1.7
-0.06 ± 0.8
3.848 (0.011)b,c
TMT-B 1.72 ± 2.8
1.04 ± 1.6
0.93 ± 2.2
-0.09 ± 0.6
4.178 (0.008)b,c,d
TMT A minus B
-1.80 ± 3.2
-0.98 ± 1.6
-0.91 ± 2.1
0.14 ± 0.7
4.267 (0.007)b,c,d
Language
BNT -0.07 ± 1.2
-0.35 ± 0.9
-0.13 ± 0.9
0.16 ± 0.7
1.448 (0.233)
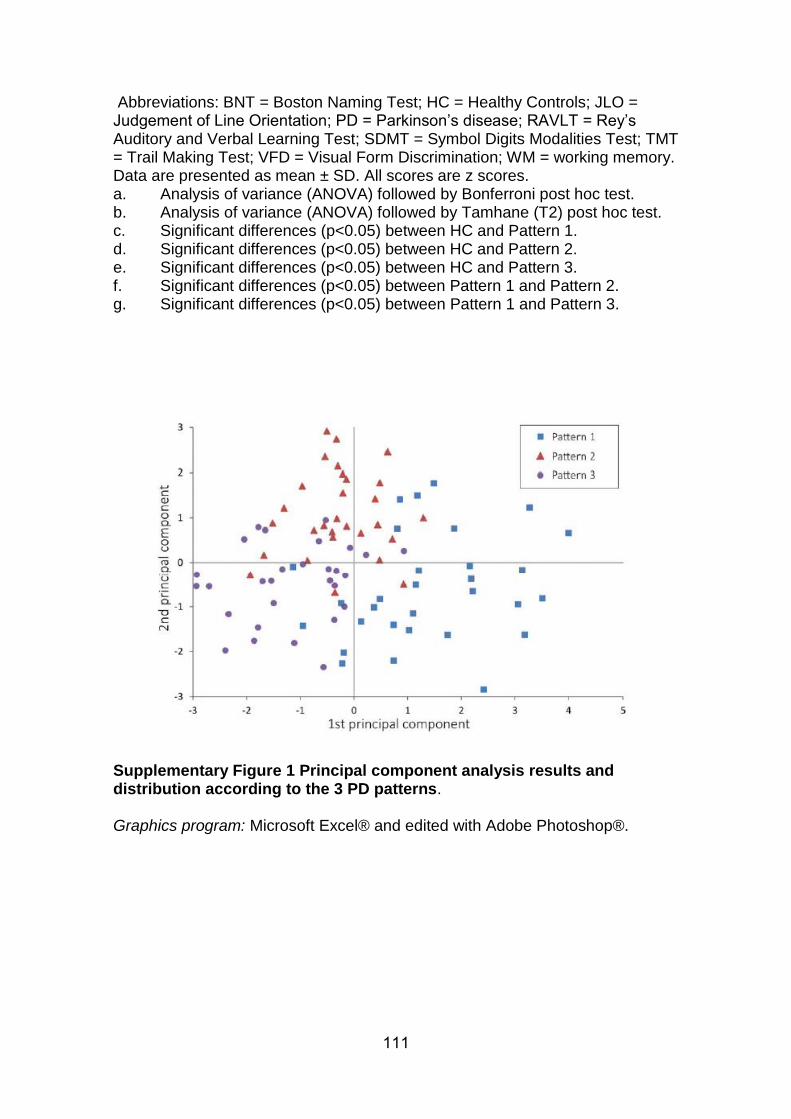
111
Abbreviations: BNT = Boston Naming Test; HC = Healthy Controls; JLO = Judgement of Line Orientation; PD = Parkinson’s disease; RAVLT = Rey’s Auditory and Verbal Learning Test; SDMT = Symbol Digits Modalities Test; TMT = Trail Making Test; VFD = Visual Form Discrimination; WM = working memory. Data are presented as mean ± SD. All scores are z scores. a. Analysis of variance (ANOVA) followed by Bonferroni post hoc test. b. Analysis of variance (ANOVA) followed by Tamhane (T2) post hoc test. c. Significant differences (p<0.05) between HC and Pattern 1. d. Significant differences (p<0.05) between HC and Pattern 2. e. Significant differences (p<0.05) between HC and Pattern 3. f. Significant differences (p<0.05) between Pattern 1 and Pattern 2. g. Significant differences (p<0.05) between Pattern 1 and Pattern 3.
Supplementary Figure 1 Principal component analysis results and distribution according to the 3 PD patterns. Graphics program: Microsoft Excel® and edited with Adobe Photoshop®.

112
113
Study 2
Uribe, C., Segura, B., Baggio, H. C., Abos, A., Garcia-Diaz, A. I., Campabadal, A.,
Marti, M. J., Valldeoriola, F., Compta, Y., Tolosa, E., Junque, C. (2018). Cortical
atrophy patterns in early Parkinson’s disease patients using hierarchical cluster
analysis. Parkinsonism and Related Disorders, 50, 3–9.
https://doi.org/10.1016/j.parkreldis.2018.02.006

114

lable at ScienceDirect
Parkinsonism and Related Disorders 50 (2018) 3e9
Contents lists avai
Parkinsonism and Related Disorders
journal homepage: www.elsevier .com/locate/parkreldis
Cortical atrophy patterns in early Parkinson's disease patients usinghierarchical cluster analysis
Carme Uribe a, Barbara Segura a, Hugo Cesar Baggio a, Alexandra Abos a,Anna Isabel Garcia-Diaz a, Anna Campabadal a, b, Maria Jose Marti b, c, d,Francesc Valldeoriola b, c, d, Yaroslau Compta b, c, d, Eduard Tolosa b, c, d,Carme Junque a, b, c, *
a Medical Psychology Unit, Department of Medicine, Institute of Neurosciences, University of Barcelona, Barcelona, Catalonia, Spainb Institute of Biomedical Research August Pi i Sunyer (IDIBAPS), Barcelona, Catalonia, Spainc Centro de Investigaci�on Biom�edica en Red Enfermedades Neurodegenerativas (CIBERNED), Spaind Movement Disorders Unit, Neurology Service, Hospital Clínic de Barcelona, Institute of Neurosciences, University of Barcelona, Barcelona, Catalonia, Spain
a r t i c l e i n f o
Article history:Received 14 December 2017Received in revised form26 January 2018Accepted 2 February 2018
Keywords:Early parkinson diseaseCluster analysisMagnetic resonance imagingCortical atrophyPPMI
* Corresponding author. Medical Psychology UniUniversity of Barcelona, Casanova 143, 08036, Barcelo
E-mail addresses: [email protected] (C. Uribe),[email protected] (H.C. Baggio), [email protected] (A.I. Garcia-Diaz), [email protected] (A. Ccat (M.J. Marti), [email protected] (F. Vallde(Y. Compta), [email protected] (E. Tolosa), cjunque@u
https://doi.org/10.1016/j.parkreldis.2018.02.0061353-8020/© 2018 Elsevier Ltd. All rights reserved.
a b s t r a c t
Introduction: Cortical brain atrophy detectable with MRI in non-demented advanced Parkinson's disease(PD) is well characterized, but its presence in early disease stages is still under debate. We aimed toinvestigate cortical atrophy patterns in a large sample of early untreated PD patients using a hypothesis-free data-driven approach.Methods: Seventy-seven de novo PD patients and 50 controls from the Parkinson's Progression MarkerInitiative database with T1-weighted images in a 3-tesla Siemens scanner were included in this study.Mean cortical thickness was extracted from 360 cortical areas defined by the Human Connectome ProjectMulti-Modal Parcellation version 1.0, and a hierarchical cluster analysis was performed using Ward'slinkage method. A general linear model with cortical thickness data was then used to compare clusteringgroups using FreeSurfer software.Results: We identified two patterns of cortical atrophy. Compared with controls, patients grouped inpattern 1 (n¼ 33) were characterized by cortical thinning in bilateral orbitofrontal, anterior cingulate,and lateral and medial anterior temporal gyri. Patients in pattern 2 (n¼ 44) showed cortical thinning inbilateral occipital gyrus, cuneus, superior parietal gyrus, and left postcentral gyrus, and they showedneuropsychological impairment in memory and other cognitive domains.Conclusions: Even in the early stages of PD, there is evidence of cortical brain atrophy. Neuroimagingclustering analysis is able to detect two subgroups of cortical thinning, one with mainly anterior atrophy,and the other with posterior predominance and worse cognitive performance.
© 2018 Elsevier Ltd. All rights reserved.
1. Introduction
Impaired cognition in Parkinson's disease (PD) is often presentin untreated patients, over 20% of whom fulfill criteria for mildcognitive impairment (MCI) affecting a wide range of cognitive
t, Department of Medicine,na, [email protected] (B. Segura),(A. Abos), [email protected]), [email protected]), [email protected] (C. Junque).
domains such as executive function, memory, attention, or visuo-spatial function [1]. Advances in magnetic resonance imaging (MRI)acquisition and analysis allowed the identification of corticalimplication in early untreated patients. Cortical thinning is presentin de novo PD patients with MCI involving frontal, temporal [2,3],and parietal [3] regions. However, in newly diagnosed PD patientswithoutMCI, studies failed to find differences between patients andcontrols [2] or found thinning in small temporal [3] or parietal [4]cortical regions.
The heterogeneity of PD clinical phenotypes has led to increasedinterest in patient subtyping [5] in an attempt to understand theunderlying mechanisms and improve prognostic accuracy. In line

C. Uribe et al. / Parkinsonism and Related Disorders 50 (2018) 3e94
with these efforts, we have previously identified three subtypesbased on hierarchical cluster analysis of cortical thickness. Onesubtype showed temporal and parietal involvement; another dis-played orbitofrontal and occipital atrophy and younger diseaseonset; and a third group of patients showed no detectable corticalatrophy [6].
The Parkinson's Progression Markers Initiative (PPMI) is acomprehensive observational, international, multicenter studydesigned to identify PD progression biomarkers such as cerebralimaging in a cohort of recently-diagnosed PD patients [7]. Recentstudies have identified Parkinson's subtypes in this cohort based onmotor and non-motor data [8,9]. However, there is no evidenceregarding subtypes based on objective structural imaging data inearly PD.
Using data from the PPMI database, we aimed to examinecortical atrophy patterns in a large sample of newly diagnosed, drugnaïve PD patients using a hypothesis-free data-driven approach. Inlight of previous results, we hypothesized that we would identifydifferent brain cortical atrophy patterns associated with differentclinical and neuropsychological characteristics.
2. Methods
2.1. Participants
Data used in this study were obtained from the PPMI database[7]. For up-to-date information on the study, visit www.ppmi-info.org. T1-weighted images acquired on 3-tesla SiemensMRI scannersand clinical and neuropsychological data obtained from 119 PDpatients and 77HC assessed between 2010 and 2015were included.All imaging and non-imaging data corresponded to the same timepoints and were acquired prior to any L-DOPA intake. Inclusioncriteria were: (i) recent diagnosis of PD with asymmetric restingtremor or asymmetric bradykinesia, or two of: bradykinesia, restingtremor, and rigidity; (ii) absence of treatment for PD; (iii) neuro-imaging evidence of significant dopamine transporter deficitconsistent with the clinical diagnosis of PD and ruling out PD look-alike conditions such as drug-induced and vascular parkinsonismor essential tremor; (iv) available T1-weighted images in a 3TSiemens scanner (for both PD patients and HC) and (v) age> 50years old (for both PD patients and HC). Exclusion criteria for allparticipants were: (i) diagnosis of dementia; (ii) significantneurologic or psychiatric dysfunction; (iii) first-degree familymember with PD, and (iv) presence of MRI motion artifacts, fielddistortions, intensity inhomogeneities, or detectable brain injuries.A total of 77 de novo PD patients and 50 HC were selected. Thefollowing participants were excluded from the study: 4 patientsand 1 HC due to other neurological disease, 18 PD patients and 20HC due toMRImotion artifacts at visual inspection performed by anexpert radiologist (HCB), and 18 PD patients and 5 HC due tocortical thickness preprocessing problems (see MRI images sec-tion). Finally, we performed an initial cluster analysis for the PDgroup and another for the control group to detect possibleabnormal outliers on MRI data. From these, we discarded 2 PDpatients and 1 HC that constituted independent clusters bythemselves.
Each participating PPMI site received approval from an ethicalstandards committee on human experimentation before studyinitiation and obtained written informed consent for research fromall individuals participating in the study.
2.2. Clinical and neuropsychological assessments
Motor symptoms were assessed with the Movement DisorderSociety Unified Parkinson's Disease Rating Scale (MDS-UPDRS) Part
III andmotor subtypes were established based on the ratio from themeans of several items of theMDS-UPDRS Part III. Activities of dailyliving (ADL) were evaluated with the Schwab and England Scale forPD patients and MDS-UPDRS Part II for all participants. Globalcognition was assessed with the MoCA, and depressive symptomsusing the 15-item Geriatric Depression Scale (GDS-15) with a cutoffscore of 5 or more indicating clinically significant symptoms asdescribed in www.ppmi-info.org [7].
All subjects underwent comprehensive neuropsychologicalassessment following Movement Disorder Society task force rec-ommendations [10] (except for the absence of tests evaluating thelanguage domain). Memory was assessed with the Hopkins VerbalLearning Test-Revised (HVLT-R); visuospatial function was evalu-ated with the Benton Judgment of Line Orientation short form (15-item version); attention and working memory through the SymbolDigit Modalities Test and Letter-Number Sequencing; and executivefunction with phonemic (letter ‘f’) and semantic (animal) verbalfluency [11].
Initially, z scores for each test and for each subject were calcu-lated based on the control group's means and standard deviations.Expected z scores adjusted for age, sex, and education for each testand each subject were calculated based on a multiple regressionanalysis performed in the HC group [1]. The presence of MCI wasdefined using PD-MCI diagnostic criteria level I [10]: (i) MoCAscores as measure of global cognition below 26 [12] and/or (ii) the zscore of a given test was at least 1.5 lower than the expected scoreon any 2 test scores. Impairment in each cognitive domainwas alsoestablished if at least 1 test in the domain was impaired.
University of Pennsylvania Smell Identification Test (UPSIT)scores were available in a subsample of 55 PD patients and 28 HCdue to missing values. The cutoff indicating anosmia was 18 or less[13].
2.3. MRI images
All three-dimensional T1-weighted MRI scans were acquired inthe sagittal plane on 3T Siemens scanners (Erlangen, Germany) atdifferent centers using an MPRAGE sequence. The acquisition pa-rameters were as follows: repetition time¼ 2300/1900ms; echotime¼ 2.98/2.96/2.27/2.48/2.52ms; inversion time¼ 900ms; flipangle: 9�; matrix¼ 240� 256/256� 256; voxel¼ 1� 1� 1mm3.Cortical thickness was estimated using the automated FreeSurferstream (version 5.1, http://surfer.nmr.harvard.edu). Detailed infor-mation about the processing FreeSurfer stream is described inSegura et al. [14]. After Freesurfer preprocessing, results for eachsubject were visually inspected to ensure accuracy of registration,skull stripping, segmentation, and cortical surface reconstruction.Possible errors were fixed by manual intervention following stan-dard procedures (https://surfer.nmr.mgh.harvard.edu/fswiki/FsTutorial/TroubleshootingData#Fixingerrors). In addition, weextracted the mean thickness for each of the 360 cortical areasdefined in the Human Connectome Project Multi-Modal Parcella-tion version 1.0 (HCP-MMP1.0) [15,16].
2.4. Cluster analysis
MATLAB (release 2014b, The MathWorks, Inc., Natick, Massa-chusetts) was used to perform an agglomerative hierarchicalcluster analysis using cortical thickness data from the 77 un-treated PD patients. To reduce dimensionality and improve themodel's performance calculating similarity/distance measures,mean cortical thickness values for the 360 areas from the HCP-MMP1.0 were used as features in the cluster analysis instead ofwhole-brain vertex information. To control for variations inglobal atrophy between patients [6], vertices were normalized

C. Uribe et al. / Parkinsonism and Related Disorders 50 (2018) 3e9 5
using bilateral mean thickness bh.thickness¼((lh.-thickness*lh.surfarea) þ (rh.thickness*rh.surfarea))/(lh.surfarea þ rh.surfarea).
Ward's clustering linkage method [6,17] was used to combinepairs of clusters at each step while minimizing the sum of squareerrors from the cluster mean. Each of the 77 patients was placed intheir own cluster and then progressively clustered with others.Cluster analysis results are shown as a dendrogram (Fig. 1) and aheatmap representing individual values for each cortical region(Supplementary Figure 1 and Supplementary Table 1 for the orderof regions as represented in the figure).
2.5. Statistical analysis
Intergroup cortical thickness comparisons were performed us-ing a vertex-by-vertex general linear model with FreeSurfer. Themodel included cortical thickness as a dependent factor and groupas an independent factor. All results were corrected for multiplecomparisons using pre-cached cluster-wiseMonte Carlo simulationwith 10,000 iterations. Reported cortical regions reached a two-tailed corrected significance level of p< 0.05.
Demographic, neuropsychological, and clinical statistical ana-lyses were conducted using IBM SPSS Statistics 24.0 (2011; Armonk,NY: IBM Corp). We tested for group differences in demographic andclinical variables as well as in neuropsychological performancebetween HC and PD patient subtypes using Kruskal-Wallis testfollowed byMann-Whitney's pairwise comparisons and Bonferronicorrection for non-normally distributed quantitative measures asindicated by the Kolmogorov-Smirnov test; for normally distrib-uted measures, an analysis of variance (ANOVA) followed by Bon-ferroni post hoc test was used. Pearson's chi squared tests wereused for categorical measures.
For comparisons between the collapsed PD sample and HC weused Mann-Whitney's test or Student t-test as appropriate.
2.6. Cluster evaluation
To determine the optimal number of clusters, we computed theCalinski-Harabasz index with MATLAB. The Calinski-Harabasz cri-terion is best suited for cluster analysis with squared Euclidean
Fig. 1. Dendrogram of PD patients clustered according to mean cortical thickness in-formation.Abbreviations: P1 ¼ Pattern 1; P2 ¼ Pattern 2; P3 ¼ Pattern 3.
distances.The higher the ratio is, the better the cluster solution. An
optimal ratio is determined by a large between-cluster variance anda small within-cluster variance.
(https://es.mathworks.com/help/stats/clustering.evaluation.calinskiharabaszevaluation-class.html).
3. Results
3.1. Characteristics of the PD sample
Demographic and clinical (Supplementary Table 2), neuropsy-chological (Fig. 2a), and cortical thickness (Supplementary Figure 2,Supplementary Table 3) differences between all PD patients and HCare shown in Supplementary Results 1.
3.2. PD cortical thickness subtypes based on cluster analysis
We identified 2 patterns of cortical thinning compared with HC(Fig. 3, Supplementary Table 3). Patients in pattern 1 (n¼ 33, 42.9%)showed reduced cortical thickness in bilateral orbitofrontal, ante-rior cingulate, and lateral and medial anterior temporal regions, aswell as a small cluster of cortical thickening in the right cuneus,
Fig. 2. Neuropsychological performance. (a) Healthy controls in orange and PDcollapsed sample in blue. (b) Healthy controls in orange; Pattern 1 patients in blue andPattern 2 patients in green.Data are presented as z-scores. Lower z-scores indicate worse performance.Abbreviations: HC¼ healthy controls; HVLT total¼Hopkins Verbal Learning Test total;HVLT delayed recall¼Hopkins Verbal Learning Test recall after 30min; HVLT recog-nition¼Hopkins Verbal Learning Test recognition after 30min; JLO¼ Judgment of LineOrientation Test; LNS¼ Letter-Number Sequencing; PD ¼ Parkinson's disease;SDMT¼ Symbol Digits Modalities Test. (For interpretation of the references to color inthis figure legend, the reader is referred to the Web version of this article.)
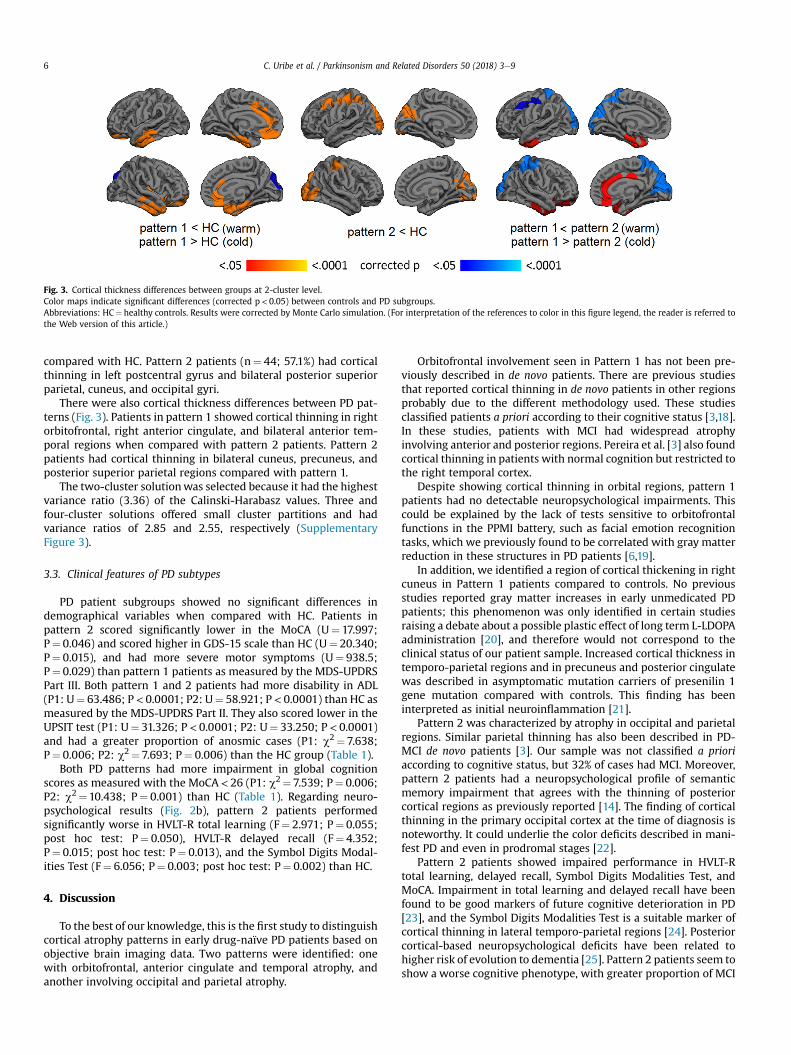
Fig. 3. Cortical thickness differences between groups at 2-cluster level.Color maps indicate significant differences (corrected p< 0.05) between controls and PD subgroups.Abbreviations: HC¼ healthy controls. Results were corrected by Monte Carlo simulation. (For interpretation of the references to color in this figure legend, the reader is referred tothe Web version of this article.)
C. Uribe et al. / Parkinsonism and Related Disorders 50 (2018) 3e96
compared with HC. Pattern 2 patients (n¼ 44; 57.1%) had corticalthinning in left postcentral gyrus and bilateral posterior superiorparietal, cuneus, and occipital gyri.
There were also cortical thickness differences between PD pat-terns (Fig. 3). Patients in pattern 1 showed cortical thinning in rightorbitofrontal, right anterior cingulate, and bilateral anterior tem-poral regions when compared with pattern 2 patients. Pattern 2patients had cortical thinning in bilateral cuneus, precuneus, andposterior superior parietal regions compared with pattern 1.
The two-cluster solutionwas selected because it had the highestvariance ratio (3.36) of the Calinski-Harabasz values. Three andfour-cluster solutions offered small cluster partitions and hadvariance ratios of 2.85 and 2.55, respectively (SupplementaryFigure 3).
3.3. Clinical features of PD subtypes
PD patient subgroups showed no significant differences indemographical variables when compared with HC. Patients inpattern 2 scored significantly lower in the MoCA (U¼ 17.997;P¼ 0.046) and scored higher in GDS-15 scale than HC (U¼ 20.340;P¼ 0.015), and had more severe motor symptoms (U¼ 938.5;P¼ 0.029) than pattern 1 patients as measured by the MDS-UPDRSPart III. Both pattern 1 and 2 patients had more disability in ADL(P1: U¼ 63.486; P< 0.0001; P2: U¼ 58.921; P< 0.0001) than HC asmeasured by the MDS-UPDRS Part II. They also scored lower in theUPSIT test (P1: U¼ 31.326; P< 0.0001; P2: U¼ 33.250; P< 0.0001)and had a greater proportion of anosmic cases (P1: c2¼ 7.638;P¼ 0.006; P2: c2¼ 7.693; P¼ 0.006) than the HC group (Table 1).
Both PD patterns had more impairment in global cognitionscores as measured with the MoCA< 26 (P1: c2¼ 7.539; P¼ 0.006;P2: c2¼10.438; P¼ 0.001) than HC (Table 1). Regarding neuro-psychological results (Fig. 2b), pattern 2 patients performedsignificantly worse in HVLT-R total learning (F¼ 2.971; P¼ 0.055;post hoc test: P¼ 0.050), HVLT-R delayed recall (F¼ 4.352;P¼ 0.015; post hoc test: P¼ 0.013), and the Symbol Digits Modal-ities Test (F¼ 6.056; P¼ 0.003; post hoc test: P¼ 0.002) than HC.
4. Discussion
To the best of our knowledge, this is the first study to distinguishcortical atrophy patterns in early drug-naïve PD patients based onobjective brain imaging data. Two patterns were identified: onewith orbitofrontal, anterior cingulate and temporal atrophy, andanother involving occipital and parietal atrophy.
Orbitofrontal involvement seen in Pattern 1 has not been pre-viously described in de novo patients. There are previous studiesthat reported cortical thinning in de novo patients in other regionsprobably due to the different methodology used. These studiesclassified patients a priori according to their cognitive status [3,18].In these studies, patients with MCI had widespread atrophyinvolving anterior and posterior regions. Pereira et al. [3] also foundcortical thinning in patients with normal cognition but restricted tothe right temporal cortex.
Despite showing cortical thinning in orbital regions, pattern 1patients had no detectable neuropsychological impairments. Thiscould be explained by the lack of tests sensitive to orbitofrontalfunctions in the PPMI battery, such as facial emotion recognitiontasks, which we previously found to be correlated with gray matterreduction in these structures in PD patients [6,19].
In addition, we identified a region of cortical thickening in rightcuneus in Pattern 1 patients compared to controls. No previousstudies reported gray matter increases in early unmedicated PDpatients; this phenomenon was only identified in certain studiesraising a debate about a possible plastic effect of long term L-LDOPAadministration [20], and therefore would not correspond to theclinical status of our patient sample. Increased cortical thickness intemporo-parietal regions and in precuneus and posterior cingulatewas described in asymptomatic mutation carriers of presenilin 1gene mutation compared with controls. This finding has beeninterpreted as initial neuroinflammation [21].
Pattern 2 was characterized by atrophy in occipital and parietalregions. Similar parietal thinning has also been described in PD-MCI de novo patients [3]. Our sample was not classified a prioriaccording to cognitive status, but 32% of cases had MCI. Moreover,pattern 2 patients had a neuropsychological profile of semanticmemory impairment that agrees with the thinning of posteriorcortical regions as previously reported [14]. The finding of corticalthinning in the primary occipital cortex at the time of diagnosis isnoteworthy. It could underlie the color deficits described in mani-fest PD and even in prodromal stages [22].
Pattern 2 patients showed impaired performance in HVLT-Rtotal learning, delayed recall, Symbol Digits Modalities Test, andMoCA. Impairment in total learning and delayed recall have beenfound to be good markers of future cognitive deterioration in PD[23], and the Symbol Digits Modalities Test is a suitable marker ofcortical thinning in lateral temporo-parietal regions [24]. Posteriorcortical-based neuropsychological deficits have been related tohigher risk of evolution to dementia [25]. Pattern 2 patients seem toshow a worse cognitive phenotype, with greater proportion of MCI
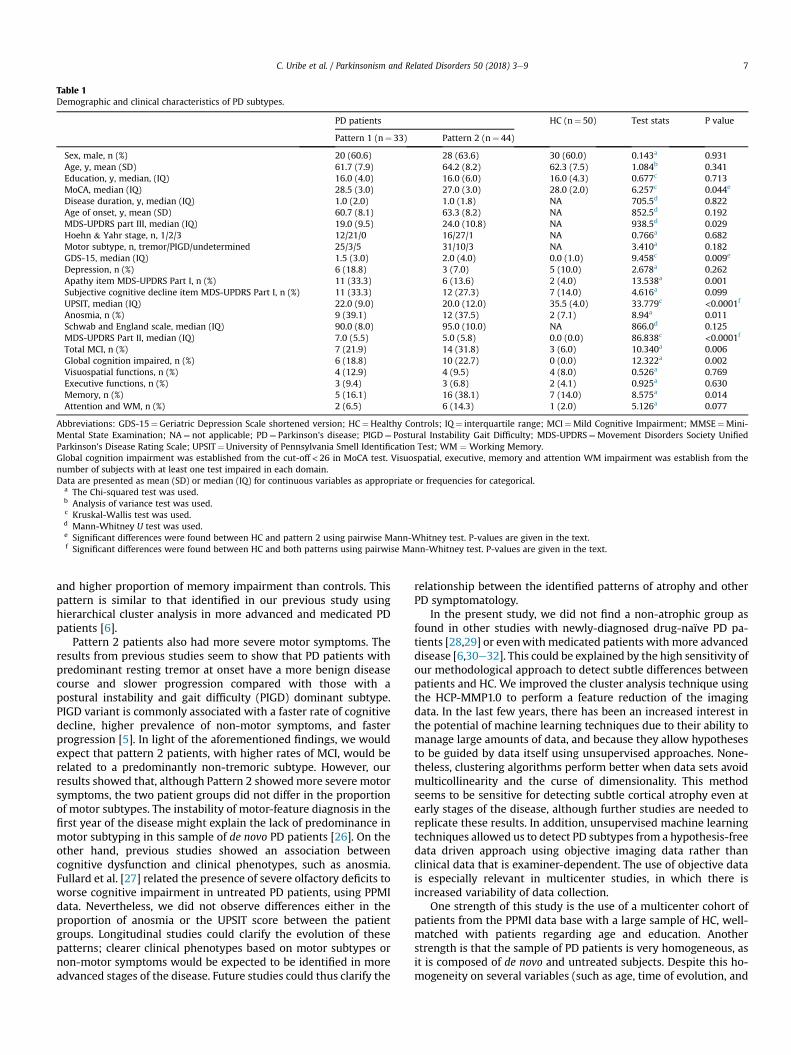
Table 1Demographic and clinical characteristics of PD subtypes.
PD patients HC (n¼ 50) Test stats P value
Pattern 1 (n¼ 33) Pattern 2 (n¼ 44)
Sex, male, n (%) 20 (60.6) 28 (63.6) 30 (60.0) 0.143a 0.931Age, y, mean (SD) 61.7 (7.9) 64.2 (8.2) 62.3 (7.5) 1.084b 0.341Education, y, median, (IQ) 16.0 (4.0) 16.0 (6.0) 16.0 (4.3) 0.677c 0.713MoCA, median (IQ) 28.5 (3.0) 27.0 (3.0) 28.0 (2.0) 6.257c 0.044e
Disease duration, y, median (IQ) 1.0 (2.0) 1.0 (1.8) NA 705.5d 0.822Age of onset, y, mean (SD) 60.7 (8.1) 63.3 (8.2) NA 852.5d 0.192MDS-UPDRS part III, median (IQ) 19.0 (9.5) 24.0 (10.8) NA 938.5d 0.029Hoehn & Yahr stage, n, 1/2/3 12/21/0 16/27/1 NA 0.766a 0.682Motor subtype, n, tremor/PIGD/undetermined 25/3/5 31/10/3 NA 3.410a 0.182GDS-15, median (IQ) 1.5 (3.0) 2.0 (4.0) 0.0 (1.0) 9.458c 0.009e
Depression, n (%) 6 (18.8) 3 (7.0) 5 (10.0) 2.678a 0.262Apathy item MDS-UPDRS Part I, n (%) 11 (33.3) 6 (13.6) 2 (4.0) 13.538a 0.001Subjective cognitive decline item MDS-UPDRS Part I, n (%) 11 (33.3) 12 (27.3) 7 (14.0) 4.616a 0.099UPSIT, median (IQ) 22.0 (9.0) 20.0 (12.0) 35.5 (4.0) 33.779c <0.0001f
Anosmia, n (%) 9 (39.1) 12 (37.5) 2 (7.1) 8.94a 0.011Schwab and England scale, median (IQ) 90.0 (8.0) 95.0 (10.0) NA 866.0d 0.125MDS-UPDRS Part II, median (IQ) 7.0 (5.5) 5.0 (5.8) 0.0 (0.0) 86.838c <0.0001f
Total MCI, n (%) 7 (21.9) 14 (31.8) 3 (6.0) 10.340a 0.006Global cognition impaired, n (%) 6 (18.8) 10 (22.7) 0 (0.0) 12.322a 0.002Visuospatial functions, n (%) 4 (12.9) 4 (9.5) 4 (8.0) 0.526a 0.769Executive functions, n (%) 3 (9.4) 3 (6.8) 2 (4.1) 0.925a 0.630Memory, n (%) 5 (16.1) 16 (38.1) 7 (14.0) 8.575a 0.014Attention and WM, n (%) 2 (6.5) 6 (14.3) 1 (2.0) 5.126a 0.077
Abbreviations: GDS-15¼Geriatric Depression Scale shortened version; HC¼Healthy Controls; IQ¼ interquartile range; MCI¼Mild Cognitive Impairment; MMSE¼Mini-Mental State Examination; NA¼ not applicable; PD¼ Parkinson's disease; PIGD¼ Postural Instability Gait Difficulty; MDS-UPDRS¼Movement Disorders Society UnifiedParkinson's Disease Rating Scale; UPSIT¼University of Pennsylvania Smell Identification Test; WM ¼Working Memory.Global cognition impairment was established from the cut-off < 26 in MoCA test. Visuospatial, executive, memory and attention WM impairment was establish from thenumber of subjects with at least one test impaired in each domain.Data are presented as mean (SD) or median (IQ) for continuous variables as appropriate or frequencies for categorical.
a The Chi-squared test was used.b Analysis of variance test was used.c Kruskal-Wallis test was used.d Mann-Whitney U test was used.e Significant differences were found between HC and pattern 2 using pairwise Mann-Whitney test. P-values are given in the text.f Significant differences were found between HC and both patterns using pairwise Mann-Whitney test. P-values are given in the text.
C. Uribe et al. / Parkinsonism and Related Disorders 50 (2018) 3e9 7
and higher proportion of memory impairment than controls. Thispattern is similar to that identified in our previous study usinghierarchical cluster analysis in more advanced and medicated PDpatients [6].
Pattern 2 patients also had more severe motor symptoms. Theresults from previous studies seem to show that PD patients withpredominant resting tremor at onset have a more benign diseasecourse and slower progression compared with those with apostural instability and gait difficulty (PIGD) dominant subtype.PIGD variant is commonly associated with a faster rate of cognitivedecline, higher prevalence of non-motor symptoms, and fasterprogression [5]. In light of the aforementioned findings, we wouldexpect that pattern 2 patients, with higher rates of MCI, would berelated to a predominantly non-tremoric subtype. However, ourresults showed that, although Pattern 2 showedmore severe motorsymptoms, the two patient groups did not differ in the proportionof motor subtypes. The instability of motor-feature diagnosis in thefirst year of the disease might explain the lack of predominance inmotor subtyping in this sample of de novo PD patients [26]. On theother hand, previous studies showed an association betweencognitive dysfunction and clinical phenotypes, such as anosmia.Fullard et al. [27] related the presence of severe olfactory deficits toworse cognitive impairment in untreated PD patients, using PPMIdata. Nevertheless, we did not observe differences either in theproportion of anosmia or the UPSIT score between the patientgroups. Longitudinal studies could clarify the evolution of thesepatterns; clearer clinical phenotypes based on motor subtypes ornon-motor symptoms would be expected to be identified in moreadvanced stages of the disease. Future studies could thus clarify the
relationship between the identified patterns of atrophy and otherPD symptomatology.
In the present study, we did not find a non-atrophic group asfound in other studies with newly-diagnosed drug-naïve PD pa-tients [28,29] or evenwith medicated patients with more advanceddisease [6,30e32]. This could be explained by the high sensitivity ofour methodological approach to detect subtle differences betweenpatients and HC. We improved the cluster analysis technique usingthe HCP-MMP1.0 to perform a feature reduction of the imagingdata. In the last few years, there has been an increased interest inthe potential of machine learning techniques due to their ability tomanage large amounts of data, and because they allow hypothesesto be guided by data itself using unsupervised approaches. None-theless, clustering algorithms perform better when data sets avoidmulticollinearity and the curse of dimensionality. This methodseems to be sensitive for detecting subtle cortical atrophy even atearly stages of the disease, although further studies are needed toreplicate these results. In addition, unsupervised machine learningtechniques allowed us to detect PD subtypes from a hypothesis-freedata driven approach using objective imaging data rather thanclinical data that is examiner-dependent. The use of objective datais especially relevant in multicenter studies, in which there isincreased variability of data collection.
One strength of this study is the use of a multicenter cohort ofpatients from the PPMI data base with a large sample of HC, well-matched with patients regarding age and education. Anotherstrength is that the sample of PD patients is very homogeneous, asit is composed of de novo and untreated subjects. Despite this ho-mogeneity on several variables (such as age, time of evolution, and

C. Uribe et al. / Parkinsonism and Related Disorders 50 (2018) 3e98
clinical severity) we were able to detect subtypes of cortical thin-ning and neuropsychological profile.
The limitations include the short neuropsychological batterythat did not allow using level II criteria to diagnose PD-MCI, and thefact that MRI acquisitions were acquired at different researchcenters (although all scanners were similar and acquisition pro-tocols were standardized). In addition, the PPMI is a research cohortwith highly educated participants that might not be representativeof the general population. The PPMI sample have scarce cognitiveor psychiatric symptoms at baseline, restricting the use of corre-lational approaches with neuroimaging findings. We would alsolike to highlight the complexity of PD diagnosis at early stages ofthe disease. Patients were selected based on neuroimaging evi-dence of significant dopamine transporter deficit consistent withthe clinical diagnosis of PD and ruling out PD look-alike conditionssuch as drug-induced and vascular parkinsonism or essentialtremor. However, certain diagnoses can only be established bypathological findings.
To sum up, two different cortical atrophy patterns can beidentified at the time of diagnosis in unmedicated PD patients. Ourresults establish a starting point to investigate the evolution ofthese patterns as possible useful markers of clinical prognosis.Moreover, the MRI findings indicate the necessity to review theneuropsychological tests included in cohort studies trying to coverthe functional assessment of all cortical regions that have beenfound to be impaired in PD.
Financial disclosures
This study was sponsored by Spanish Ministry of Economy andCompetitiveness (PSI2013-41393-P, PSI2017-86930-P), by Gen-eralitat de Catalunya (2014SGR 98) and by Fundaci�o la Marat�o deTV3 (20142310).
CU was supported by a 2014 fellowship from the Spanish Min-istry of Economy and Competitiveness and co-financed by the Eu-ropean Social Fund (BES 2014-068173). AAwas supported by a 2016fellowship from the Departament d’Empresa i Coneixement de laGeneralitat de Catalunya, AGAUR (2016FI_B 00360).
Declaration of interest
None.
Authors' roles
Research project conception and acquisition of data areexplained in Marek et al., 2011 as cited in the text. CJ contributed inthe design of the study. CU, AA, AIGD and AC contributed to theanalysis of the data and CU, BS, HCB, AA, AIGD, AC, MJM, FV, YC, ETand CJ contributed to the interpretation of the data. CU, BScontributed to the draft of the article. CU, BS, HCB, AA, AIGD, AC,MJM, FV, YC, ET, CJ revised the manuscript critically for importantintellectual content and approved the final version of themanuscript.
Acknowledgment
PPMI - a public-private partnership - is funded by the Michael J.Fox Foundation for Parkinson's Research and funding partners,including Abbvie, Avid, Biogen, Bristol-Myers Squibb, Covance, GEHealthcare, Genentech, GlaxoSmithKline, Lilly, Lundbeek, Merck,Meso Scale Discovery, Pfizer, Piramal, Roche, Servier, Teva, UCB, andGolub Capital. The authors would also like to acknowledge CERCAprogramme/Generalitat de Catalunya.
Appendix A. Supplementary data
Supplementary data related to this article can be found athttps://doi.org/10.1016/j.parkreldis.2018.02.006.
References
[1] D. Aarsland, K. Brønnick, J.P. Larsen, O.B. Tysnes, G. Alves, Cognitive impair-ment in incident, untreated Parkinson disease: the Norwegian ParkWeststudy, Neurology 72 (2009) 1121e1126, https://doi.org/10.1212/01.wnl.0000338632.00552.cb.
[2] S. Danti, N. Toschi, S. Diciotti, C. Tessa, M. Poletti, P. Del Dotto, C. Lucetti,Cortical thickness in de novo patients with Parkinson disease and mildcognitive impairment with consideration of clinical phenotype and motorlaterality, Eur. J. Neurol. 22 (2015) 1564e1572, https://doi.org/10.1111/ene.12785.
[3] J.B. Pereira, P. Svenningsson, D. Weintraub, K. Brønnick, A. Lebedev,E. Westman, D. Aarsland, Initial cognitive decline is associated with corticalthinning in early Parkinson disease, Neurology 82 (2014) 2017e2025, https://doi.org/10.1212/WNL.0000000000000483.
[4] S.W. Noh, Y.H. Han, C.W. Mun, E.J. Chung, E.G. Kim, K.H. Ji, J.H. Seo, S.J. Kim,Analysis among cognitive profiles and gray matter volume in newly diagnosedParkinson's disease with mild cognitive impairment, J. Neurol. Sci. 347 (2014)210e213, https://doi.org/10.1016/j.jns.2014.09.049.
[5] S.M. Fereshtehnejad, R.B. Postuma, Subtypes of Parkinson's disease: what dothey tell us about disease progression? Curr. Neurol. Neurosci. Rep. 17 (2017)34, https://doi.org/10.1007/s11910-017-0738-x.
[6] C. Uribe, B. Segura, H.C. Baggio, A. Abos, M.J. Marti, F. Valldeoriola, Y. Compta,N. Bargallo, C. Junque, Patterns of cortical thinning in nondemented Parkin-son's disease patients, Mov. Disord. 31 (2016) 699e708, https://doi.org/10.1002/mds.26590.
[7] K. Marek, D. Jennings, S. Lasch, A. Siderowf, C. Tanner, T. Simuni, C. Coffey,K. Kieburtz, E. Flagg, S. Chowdhury, W. Poewe, B. Mollenhauer, T. Sherer,M. Frasier, C. Meunier, A. Rudolph, C. Casaceli, J. Seibyl, S. Mendick, N. Schuff,Y. Zhang, A. Toga, K. Crawford, A. Ansbach, P. de Blasio, M. Piovella,J. Trojanowski, L. Shaw, A. Singleton, K. Hawkins, J. Eberling, D. Russell,L. Leary, S. Factor, B. Sommerfeld, P. Hogarth, E. Pighetti, K. Williams,D. Standaert, S. Guthrie, R. Hauser, H. Delgado, J. Jankovic, C. Hunter, M. Stern,B. Tran, J. Leverenz, M. Baca, S. Frank, C.A. Thomas, I. Richard, C. Deeley, L. Rees,F. Sprenger, E. Lang, H. Shill, S. Obradov, H. Fernandez, A. Winters, D. Berg,K. Gauss, D. Galasko, D. Fontaine, Z. Mari, M. Gerstenhaber, D. Brooks,S. Malloy, P. Barone, K. Longo, T. Comery, B. Ravina, I. Grachev, K. Gallagher,M. Collins, K.L. Widnell, S. Ostrowizki, P. Fontoura, F.H. La-Roche, T. Ho,J. Luthman, M. van der Brug, A.D. Reith, P. Taylor, The Parkinson progressionmarker initiative (PPMI), Prog. Neurobiol. 95 (2011) 629e635, https://doi.org/10.1016/j.pneurobio.2011.09.005.
[8] D.R. LaBelle, R.R. Walsh, S.J. Banks, Latent cognitive phenotypes in de novoParkinson's disease: a person-centered approach, J. Int. Neuropsychol. Soc. 23(2017) 1e13, https://doi.org/10.1017/S1355617717000406.
[9] T. Simuni, C. Caspell-Garcia, C. Coffey, S. Lasch, C. Tanner, K. Marek, How stableare Parkinson's disease subtypes in de novo patients: analysis of the PPMIcohort? Park. Relat. Disord. 28 (2016) 62e67, https://doi.org/10.1016/j.parkreldis.2016.04.027.
[10] I. Litvan, J.G. Goldman, A.I. Tr€oster, B.A. Schmand, D. Weintraub, R.C. Petersen,B. Mollenhauer, C.H. Adler, K. Marder, C.H. Williams-Gray, D. Aarsland,J. Kulisevsky, M.C. Rodriguez-Oroz, D.J. Burn, R.A. Barker, M. Emre, Diagnosticcriteria for mild cognitive impairment in Parkinson's disease: MovementDisorder Society Task Force guidelines, Mov. Disord. 27 (2012) 349e356,https://doi.org/10.1002/mds.24893.
[11] M.D. Lezak, Neuropsychological Assessment, fifth ed., Oxford University Press,Oxford, 2012.
[12] J.C. Dalrymple-Alford, The MoCA. Well-suited screen for cognitive impairmentin Parkinson disease, Neurology 75 (2010) 1717e1725, https://doi.org/10.1212/WNL.0b013e3181fc29c9.
[13] R. Doty, The Smell Identification Test Administration Manual, third ed., Sen-sonics, Haddon Heights, 1995.
[14] B. Segura, H.C. Baggio, M.J. Marti, F. Valldeoriola, Y. Compta, A.I. Garcia-Diaz,P. Vendrell, N. Bargallo, E. Tolosa, C. Junque, Cortical thinning associated withmild cognitive impairment in Parkinson's disease, Mov. Disord. 29 (2014)1495e1503, https://doi.org/10.1002/mds.25982.
[15] M.F. Glasser, T.S. Coalson, E.C. Robinson, C.D. Hacker, J. Harwell, E. Yacoub,K. Ugurbil, J. Andersson, C.F. Beckmann, M. Jenkinson, S.M. Smith, D.C. VanEssen, A multi-modal parcellation of human cerebral cortex, Nature 536(2016) 171e178, https://doi.org/10.1038/nature18933.
[16] C.J. Neurolab, HCP-MMP1.0 Volumetric (NIfTI) Masks in Native StructuralSpace, Figshare, 2017, https://doi.org/10.6084/m9.figshare.4249400.v3.
[17] J.H. Ward, Hierarchical grouping to optimize an objective function, J. Am. Stat.Assoc. 58 (1963) 236e244, https://doi.org/10.1080/01621459.1963.10500845.
[18] C.H. Lyoo, Y. Jeong, Y.H. Ryu, J.O. Rinne, M.S. Lee, Cerebral glucose metabolismof Parkinson's disease patients with mild cognitive impairment, Eur. Neurol.64 (2010) 65e73, https://doi.org/10.1159/000315036.
[19] N. Ibarretxe-Bilbao, C. Junque, E. Tolosa, M.J. Marti, F. Valldeoriola, N. Bargallo,M. Zarei, Neuroanatomical correlates of impaired decision-making and facial

C. Uribe et al. / Parkinsonism and Related Disorders 50 (2018) 3e9 9
emotion recognition in early Parkinson's disease, Eur. J. Neurosci. 30 (2009)1162e1171, https://doi.org/10.1111/j.1460-9568.2009.06892.x.
[20] A.C. Vernon, M. Modo, Do levodopa treatments modify the morphology of theparkinsonian brain? Mov. Disord. 27 (2012) 166e167, https://doi.org/10.1002/mds.24018.
[21] R. Sala-Llonch, A. Llado, J. Fortea, B. Bosch, A. Antonell, M. Balasa, N. Bargallo,D. Bartres-Faz, J.L. Molinuevo, R. Sanchez-Valle, Evolving brain structuralchanges in PSEN1 mutation carriers, Neurobiol. Aging 36 (2015) 1261e1270,https://doi.org/10.1016/j.neurobiolaging.2014.12.022.
[22] R.B. Postuma, J.F. Gagnon, J.A. Bertrand, D. G�enier Marchand, J.Y. Montplaisir,Parkinson risk in idiopathic REM sleep behavior disorder: preparing forneuroprotective trials, Neurology 84 (2015) 1104e1113, https://doi.org/10.1212/WNL.0000000000001364.
[23] G. Levy, D.M. Jacobs, M.X. Tang, L.J. Cot�e, E.D. Louis, B. Alfaro, H. Mejia, Y. Stern,K. Marder, Memory and executive function impairment predict dementia inParkinson's disease, Mov. Disord. 17 (2002) 1221e1226, https://doi.org/10.1002/mds.10280.
[24] A.I. Garcia-Diaz, B. Segura, H.C. Baggio, M.J. Marti, F. Valldeoriola, Y. Compta,N. Bargallo, C. Uribe, A. Campabadal, A. Abos, C. Junque, Structural braincorrelations of visuospatial and visuoperceptual tests in Parkinson's disease,J. Int. Neuropsychol. Soc. 17 (2017) 1e12, https://doi.org/10.1017/S1355617717000583.
[25] C.H. Williams-Gray, J.R. Evans, A. Goris, T. Foltynie, M. Ban, T.W. Robbins,C. Brayne, B.S. Kolachana, D.R. Weinberger, S.J. Sawcer, R.A. Barker, Thedistinct cognitive syndromes of Parkinson's disease: 5 year follow-up of theCamPaIGN cohort, Brain 132 (2009) 2958e2969, https://doi.org/10.1093/brain/awp245.
[26] T. Simuni, C. Caspell-Garcia, C. Coffey, S. Lasch, C. Tanner, K. Marek, How stable
are Parkinson's disease subtypes in de novo patients: analysis of the PPMIcohort? Park. Relat. Disord. 28 (2016) 62e67, https://doi.org/10.1016/j.parkreldis.2016.04.027.
[27] M.E. Fullard, B. Tran, S.X. Xie, J.B. Toledo, C. Scordia, C. Linder, R. Purri,D. Weintraub, J.E. Duda, L.M. Chahine, J.F. Morley, Olfactory impairmentpredicts cognitive decline in early Parkinson's disease, Park. Relat. Disord. 25(2016) 45e51, https://doi.org/10.1016/j.parkreldis.2016.02.013.
[28] H.M. Lee, K.Y. Kwon, M.J. Kim, J.W. Jang, S. Suh, S.B. Koh, J.H. Kim, Subcorticalgrey matter changes in untreated, early stage Parkinson's disease withoutdementia, Park. Relat. Disord. 20 (2014) 622e626, https://doi.org/10.1016/j.parkreldis.2014.03.009.
[29] W.R.W. Martin, M. Wieler, M. Gee, R. Camicioli, Temporal lobe changes inearly, untreated Parkinson's disease, Mov. Disord. 24 (2009) 1949e1954,https://doi.org/10.1002/mds.22680.
[30] A. Hanganu, C. Bedetti, T. Jubault, J.F. Gagnon, B. Mejia-Constain, C. Degroot,A.L. Lafontaine, S. Chouinard, O. Monchi, Mild cognitive impairment in pa-tients with Parkinson's disease is associated with increased cortical degen-eration, Mov. Disord. 28 (2013) 1360e1369, https://doi.org/10.1002/mds.25541.
[31] J. Pagonabarraga, I. Corcuera-Solano, Y. Vives-Gilabert, G. Llebaria, C. García-S�anchez, B. Pascual-Sedano, M. Delfino, J. Kulisevsky, B. G�omez-Ans�on, Patternof regional cortical thinning associated with cognitive deterioration in Par-kinson's disease, PLoS One 8 (2013), e54980, https://doi.org/10.1371/journal.pone.0054980.
[32] T. Jubault, J.F. Gagnon, S. Karama, A. Ptito, A.L. Lafontaine, A.C. Evans,O. Monchi, Patterns of cortical thickness and surface area in early Parkinson'sdisease, Neuroimage 55 (2011) 462e467, https://doi.org/10.1016/j.neuroimage.2010.12.043.

122
Cortical atrophy patterns in early Parkinson’s disease patients using
hierarchical cluster analysis
Carme Uribe, MSc1; Barbara Segura, PhD1; Hugo Cesar Baggio, MD, PhD1; Alexandra
Abos, MSc1; Anna Isabel Garcia-Diaz, MSc1; Anna Campabadal, MSc1,2; Maria Jose
Marti, MD, PhD2,3,4; Francesc Valldeoriola, MD, PhD2,3,4; Yaroslau Compta, MD,
PhD2,3,4; Eduard Tolosa, MDS, PhD2,3,4; Carme Junque, PhD1,2,3.
1Medical Psychology Unit, Department of Medicine. Institute of Neurosciences,
University of Barcelona. Barcelona, Catalonia, Spain.
2Institute of Biomedical Research August Pi i Sunyer (IDIBAPS). Barcelona,
Catalonia, Spain.
3Centro de Investigación Biomédica en Red Enfermedades Neurodegenerativas
(CIBERNED), Spain.
4Movement Disorders Unit, Neurology Service, Hospital Clínic de Barcelona.
Institute of Neurosciences, University of Barcelona, Barcelona, Catalonia, Spain.
Supplementary material:
Supplementary Results 1. Characteristics of the collapsed sample.
Compared with HC, the collapsed PD sample had a greater proportion of subjective
cognitive decline (chi=4.232; P=0.040) and apathy (chi=7.787; P=0.005) per the
MDS-UPDRS Part I items. PD patients also scored significantly higher than HC in
GDS-15 scale (U=2,460.0; P=0.002) and MDS-UPDRS Part II (U=3,770.5; P<0.0001)
although without clinical relevance (Supplementary Table 2).
Regarding neuropsychological testing, PD patients performed significantly worse
than HC in HVLT-R total learning (T=2.233; P=0.027), HVLT-R delayed recall
(U=1,401.0; P=0.029), and SDMT (T=2.943; P=0.004) (Figure 2a). PD patients had a
greater proportion of PD-MCI level I diagnosis (chi=9.152; P=0.002), more global
cognition impairment (chi=12.057; P=0.001), and more olfactory dysfunction
(U=168.0; P<.0001) than HC (Supplementary Table 2).

123
PD patients had cortical thickness reductions in bilateral temporal and occipital
regions and in the left lateral superior parietal lobe when compared with HC
(Supplementary Figure 2, Supplementary Table 3).
Supplementary Figure 1. Cluster analysis dendrogram and heatmap.
Heatmap displaying mean cortical thickness for each of the 360 regions (rows) and 77 patients (columns) included in the cluster analysis. Subjects are ordered according to the results of the cluster analysis, as shown in the dendrogram in the top part of the figure. Cortical regions are ordered according to brain region/lobe in a roughly anterior-posterior sequence, following the order given in Supplementary Table 1. Cortical thickness values are represented by the colormap shown in the left part of the figure.

124
Supplementary Table 1. Parcellation order as plotted in the heatmap
(Supplementary Figure 1)
1 Area 9 anterior 61 Frontal opercular area 1 121 IntraParietal sulcus area 1
2 Area 10v 62 Frontal opercular area 3 122 Parieto-occipital sulcus area 1
3 Area anterior 10p 63 Frontal opercular area 2 123 Area 5L
4 Polar 10p 64 Area frontal opercular 5 124 Lateral area 7A
5 Area 10r 65 Primary motor cortex 125 Medial area 7A
6 Area 10d 66 Area 52 126 Lateral area 7P
7 Area posterior 10p 67 Anterior ventral insular area 127 Area 7PC
8 Area IFSp 68 Anterior agranular insula complex
128 Area lateral intraParietal ventral
9 Area IFSa 69 Insular granular complex 129 Ventral intraParietal complex
10 Area posterior 9-46v 70 Middle insular area 130 Medial intraParietal area
11 Area 46 71 Posterior insular Area 2 131 Area lateral intraParietal dorsal
12 Area anterior 9-46v 72 Area posterior insular 1 132 Area 43
13 Area 9-46d 73 Area TG dorsal 133 Area OP4/PV
14 Area 8Av 74 Para-insular area 134 Area OP1/SII
15 Area 8Ad 75 Primary auditory cortex 135 Area OP2-3/VS
16 Area 8B lateral 76 Auditory 4 complex 136 RetroInsular cortex
17 Area 9 posterior 77 Auditory 5 complex 137 Area PFcm
18 Superior 6-8 transitional area
78 Area STSv anterior 138 Area PFt
19 Area posterior 47r 79 PeriSylvian language area 139 Anterior intraParietal area
20 Area 8BM 80 Superior temporal visual area
140 Area intraParietal 2
21 Area 9 middle 81 Area TA2 141 Area intraParietal 1
22 Area anterior 47r 82 Area STGa 142 Area intraParietal 0
23 Area 47m 83 Area STSd anterior 143 Area PF opercular
24 Area 47 lateral 84 Area STSd posterior 144 Area PF complex
25 Area 47s 85 Area STSv posterior 145 Area PFm complex
26 Area 11l 86 Area TE1 anterior 146 Area PGi
27 Area 13l 87 Area TE1 posterior 147 Area PGs
28 Orbital frontal complex 88 Area TE2 anterior 148 PreCuneus visual area
29 Posterior OFC complex 89 Area TF 149 Medial area 7P
30 Area 44 90 Area TE2 posterior 150 Area 7m
31 Area 45 91 Area PHT 151 Area 23c
32 Area IFJa 92 Area PH 152 Area temporoParietoOccipital junction 2
33 Area IFJp 93 Area TG ventral 153 Area temporoParietoOccipital junction 3
34 Inferior 6-8 transitional area
94 ParaBelt complex 154 RetroSplenial complex
35 Area 8C 95 Medial belt complex 155 Area 23d
36 Dorsal area 24d 96 Lateral belt complex 156 Area ventral 23 a+b

125
37 Ventral area 24d 97 Area TE1 middle 157 Area dorsal 23 a+b
38 Area posterior 24 prime
98 Piriform cortex 158 Area 31p ventral
39 Area 33 prime 99 Entorhinal cortex 159 Area 31pd
40 Anterior 24 prime 100 PreSubiculum 160 Area 31a
41 Area p32 prime 101 Hippocampus 161 VentroMedial visual area 1
42 Area a24 102 Perirhinal ectorhinal cortex 162 VentroMedial visual area 3
43 Area dorsal 32 103 ParaHippocampal area 1 163 Area V3CD
44 Area p32 104 ParaHippocampal area 3 164 VentroMedial visual area 2
45 Area 25 105 ParaHippocampal area 2 165 Primary visual cortex
46 Area s32 106 Fusiform face complex 166 Sixth visual area
47 Area anterior 32 prime 107 Posterior inferoTemporal 167 Second visual area
48 Area posterior 24 prime
108 Medial superior temporal area
168 Third visual area
49 Superior frontal language area
109 Area FST 169 Fourth visual area
50 Frontal eye fields 110 Middle temporal area 170 Eighth visual area
51 Premotor eye fields 111 Area temporoParietoOccipital junction 1
171 Area V3A
52 Area 55b 112 ProStriate area 172 Seventh visual area
53 Supplementary and cingulate eye field
113 Ventral visual complex 173 Area V3B
54 Area 6m anterior 114 Area 1 174 Area lateral occipital 1
55 Dorsal area 6 115 Area 2 175 Area lateral occipital 2
56 Area 6mp 116 Area 3a 176 Dorsal transitional visual area
57 Ventral area 6 117 Primary sensory cortex 177 Area PGp
58 Rostral area 6 118 Area 5m 178 VentroMedial visual area 6A
59 Area 6 anterior 119 Area 5m ventral 179 Area V4t
60 Frontal opercular area 4
120 Parieto-occipital sulcus area 2
180 Area lateral occipital 3
For each label, there are two values in the heatmap shown in Supplementary Figure 1: even rows correspond to regions in the left hemisphere and odd rows to those in the right hemisphere, in a total of 360 regions used for the cluster analysis.
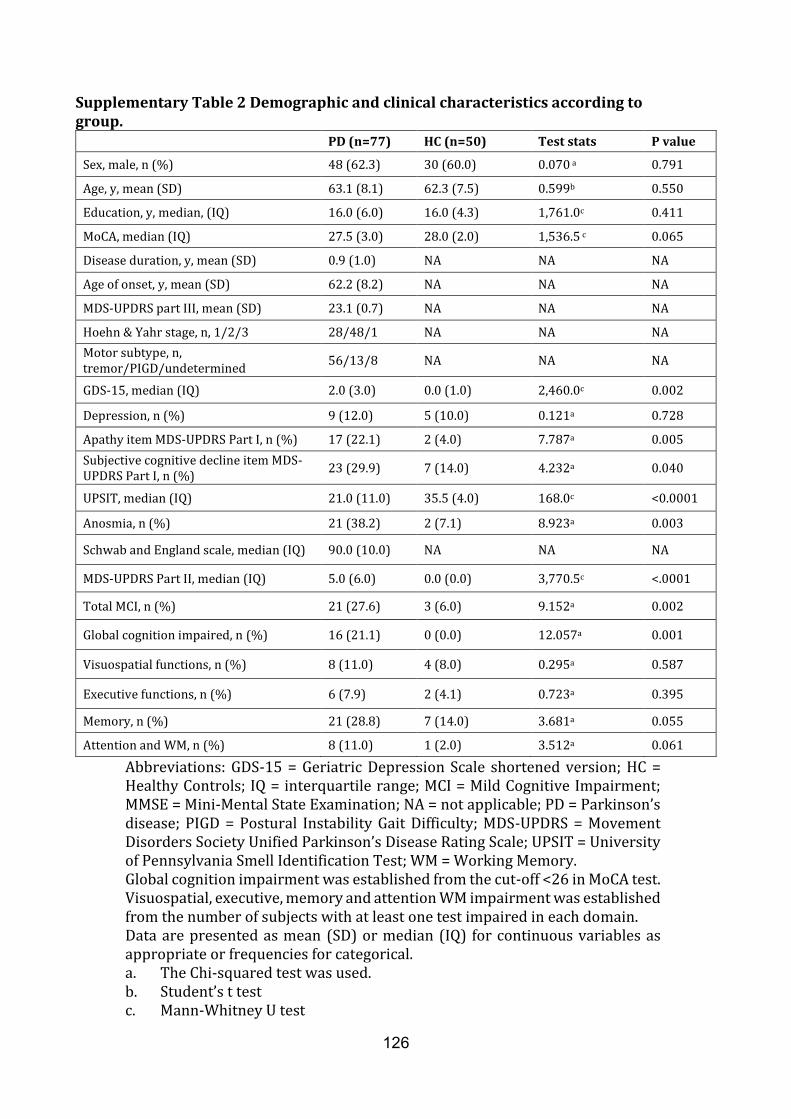
126
Supplementary Table 2 Demographic and clinical characteristics according to group.
PD (n=77) HC (n=50) Test stats P value
Sex, male, n (%) 48 (62.3) 30 (60.0) 0.070 a 0.791
Age, y, mean (SD) 63.1 (8.1) 62.3 (7.5) 0.599b 0.550
Education, y, median, (IQ) 16.0 (6.0) 16.0 (4.3) 1,761.0c 0.411
MoCA, median (IQ) 27.5 (3.0) 28.0 (2.0) 1,536.5 c 0.065
Disease duration, y, mean (SD) 0.9 (1.0) NA NA NA
Age of onset, y, mean (SD) 62.2 (8.2) NA NA NA
MDS-UPDRS part III, mean (SD) 23.1 (0.7) NA NA NA
Hoehn & Yahr stage, n, 1/2/3 28/48/1 NA NA NA
Motor subtype, n, tremor/PIGD/undetermined
56/13/8 NA NA NA
GDS-15, median (IQ) 2.0 (3.0) 0.0 (1.0) 2,460.0c 0.002
Depression, n (%) 9 (12.0) 5 (10.0) 0.121a 0.728
Apathy item MDS-UPDRS Part I, n (%) 17 (22.1) 2 (4.0) 7.787a 0.005
Subjective cognitive decline item MDS-UPDRS Part I, n (%)
23 (29.9) 7 (14.0) 4.232a 0.040
UPSIT, median (IQ) 21.0 (11.0) 35.5 (4.0) 168.0c <0.0001
Anosmia, n (%) 21 (38.2) 2 (7.1) 8.923a 0.003
Schwab and England scale, median (IQ) 90.0 (10.0) NA NA NA
MDS-UPDRS Part II, median (IQ) 5.0 (6.0) 0.0 (0.0) 3,770.5c <.0001
Total MCI, n (%) 21 (27.6) 3 (6.0) 9.152a 0.002
Global cognition impaired, n (%) 16 (21.1) 0 (0.0) 12.057a 0.001
Visuospatial functions, n (%) 8 (11.0) 4 (8.0) 0.295a 0.587
Executive functions, n (%) 6 (7.9) 2 (4.1) 0.723a 0.395
Memory, n (%) 21 (28.8) 7 (14.0) 3.681a 0.055
Attention and WM, n (%) 8 (11.0) 1 (2.0) 3.512a 0.061
Abbreviations: GDS-15 = Geriatric Depression Scale shortened version; HC = Healthy Controls; IQ = interquartile range; MCI = Mild Cognitive Impairment; MMSE = Mini-Mental State Examination; NA = not applicable; PD = Parkinson’s disease; PIGD = Postural Instability Gait Difficulty; MDS-UPDRS = Movement Disorders Society Unified Parkinson’s Disease Rating Scale; UPSIT = University of Pennsylvania Smell Identification Test; WM = Working Memory. Global cognition impairment was established from the cut-off <26 in MoCA test. Visuospatial, executive, memory and attention WM impairment was established from the number of subjects with at least one test impaired in each domain. Data are presented as mean (SD) or median (IQ) for continuous variables as appropriate or frequencies for categorical. a. The Chi-squared test was used. b. Student’s t test c. Mann-Whitney U test

127
Supplementary Table 3. Cortical thickness information.
Cortical area Cluster Size (mm2)
Stats P-value MNI coordinates (x,y,z)1
healthy controls vs PD collapsed sample
Left inferior temporal 2,064.5 4.515 0.010 -52 -23 -32
Left superior parietal 2,699.7 3.303 0.001 -33 -36 45
Left lateral occipital 1,843.9 2.887 0.020 -36 -88 -5
Right lateral occipital 2,489.1 3.504 0.001 20 -98 -14
Right superior temporal 1,655.1 2.583 0.039 46 -23 -11
healthy controls vs Pattern 1
Left inferior temporal 3,979.0 5.176 <0.001 -52 -19 -34
Left medial orbitofrontal 3,638.9 3.724 <0.001 -10 33 -14
Right inferior temporal 8,217.9 4.427 <0.001 51 -18 -34
Right lateral occipital 1,865.8 -2.230 0.010 12 -97 13
healthy controls vs Pattern 2
Left precentral 11,641.6 5.386 <0.001 -32 -20 45
Right lateral occipital 7,863.9 4.889 <0.001 26 -92 17
Right supramarginal 3,108.3 4.313 <0.001 32 -34 41
Pattern 1 vs Pattern 2
Left postcentral 7,671.7 -6.167 <0.001 -18 -38 67
Left precentral 2,126.2 -3.862 0.007 -33 -17 48
Left entorhinal 2,461.2 3.688 0.002 -20 -15 -27
Right superior parietal 13,384.7 -7.164 <0.001 20 -86 36
Right caudal anterior cingulate
2,217.9 3.193 0.003 6 23 24
Right inferior temporal 1,770.5 3.036 0.015 55 -20 -26
Right lateral orbitofrontal 1,564.4 2.908 0.039 25 10 -16 1MNI305 space. Results were obtained using Monte Carlo simulation with 10.000 iterations applied to cortical thickness maps to provide clusterwise correction for multiple comparisons (1.3). Significant clusters were reported at p<0.05. z-Max indicates the maximum -log10(pvalue) in the cluster.
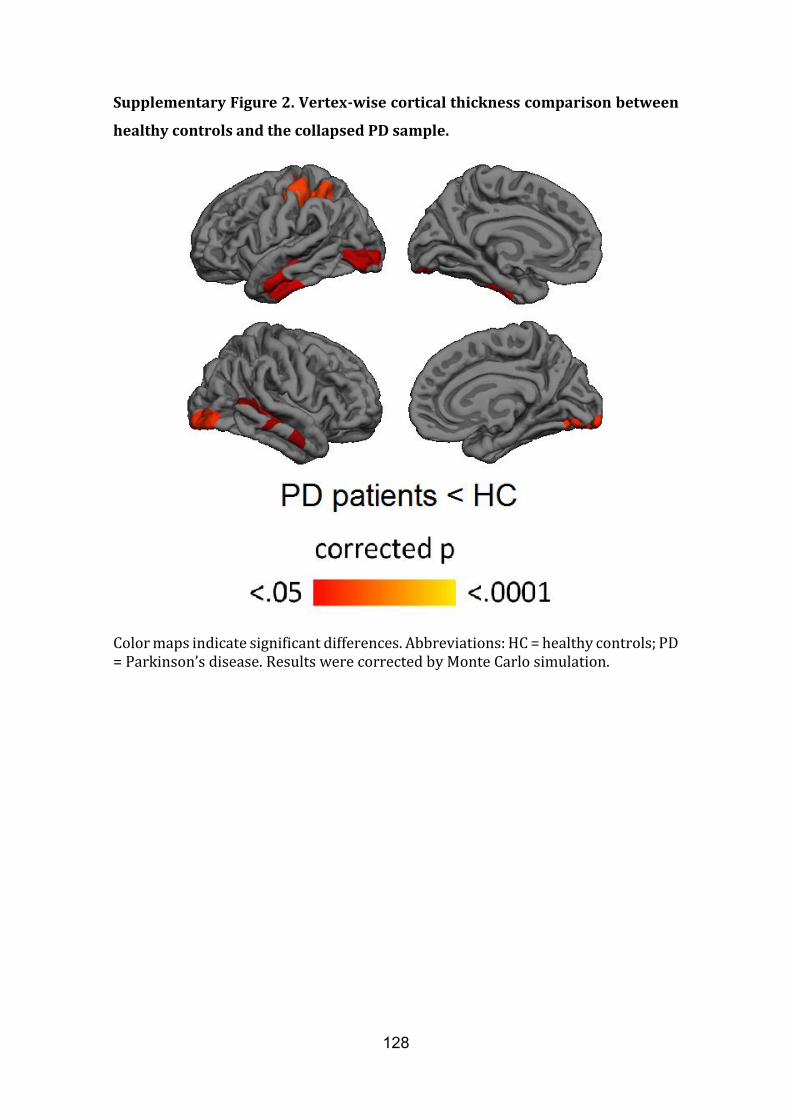
128
Supplementary Figure 2. Vertex-wise cortical thickness comparison between
healthy controls and the collapsed PD sample.
Color maps indicate significant differences. Abbreviations: HC = healthy controls; PD = Parkinson’s disease. Results were corrected by Monte Carlo simulation.
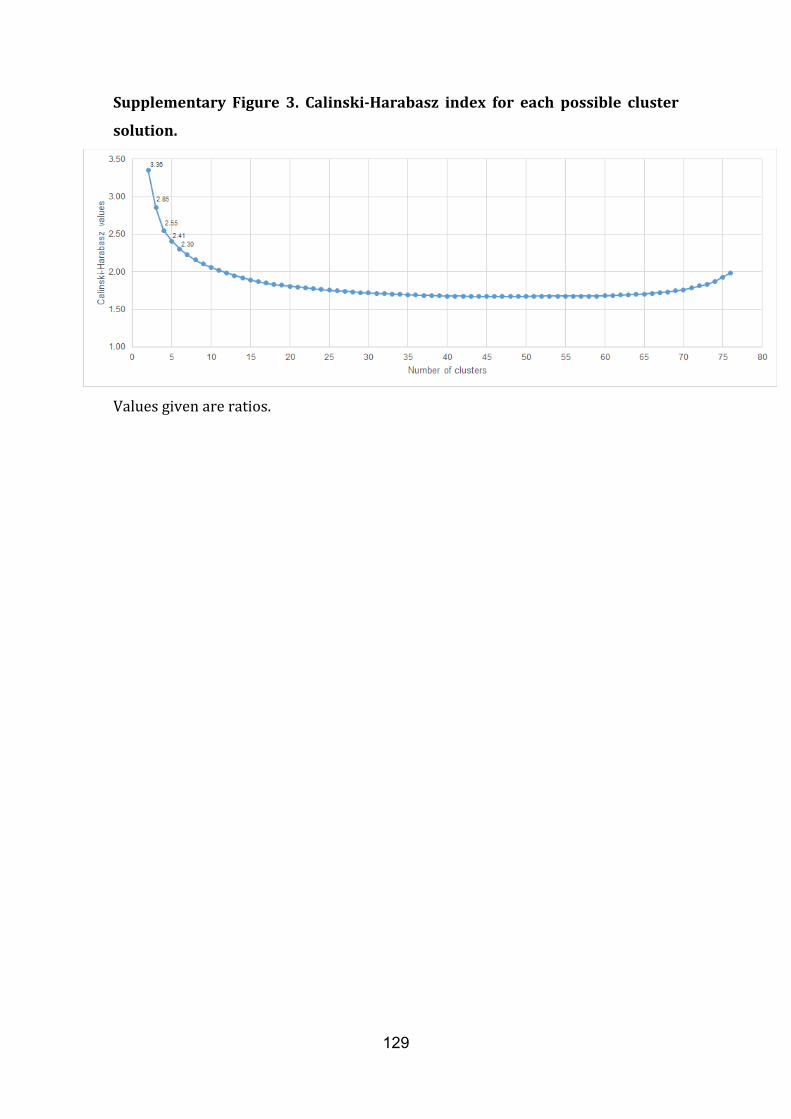
129
Supplementary Figure 3. Calinski-Harabasz index for each possible cluster
solution.
Values given are ratios.

130

131
Study 3
3. Uribe, C.*, Segura, B.*, Baggio, H. C., Abos, A., Garcia-Diaz, A.I., Campabadal,
A., Marti, M. J., Valldeoriola, F., Compta, Y., Bargallo, N., Junque, C. Progression
of Parkinson’s disease patients subtypes based on cortical thinning: 4-year follow-
up. Under review.

132
133
Progression of Parkinson’s disease patients’ subtypes based on cortical
thinning: 4-year follow-up
Carme Uribe*, MSc1; Barbara Segura*, PhD1,2; Hugo Cesar Baggio, MD, PhD1;
Alexandra Abos, MSc1; Anna Isabel Garcia-Diaz, PhD1; Anna Campabadal, MSc1; Maria
Jose Marti, MD, PhD2,3,4; Francesc Valldeoriola, MD, PhD2,3,4; Yaroslau Compta, MD,
PhD2.3,4; Nuria Bargallo, MD, PhD4,5; Carme Junque, PhD1,2,4.
1Medical Psychology Unit, Department of Medicine. Institute of Neuroscience,
University of Barcelona. Barcelona, Catalonia, Spain.
2Centro de Investigación Biomédica en Red sobre Enfermedades Neurodegenerativas
(CIBERNED), Hospital Clínic de Barcelona. Barcelona, Spain.
3Movement Disorders Unit, Neurology Service, Hospital Clínic de Barcelona. Institute
of Neuroscience, University of Barcelona, Barcelona, Catalonia, Spain.
4Institute of Biomedical Research August Pi i Sunyer (IDIBAPS). Barcelona, Catalonia,
Spain.
5Centre de Diagnòstic per la Imatge, Hospital Clínic, Barcelona, Catalonia, Spain.
*CU and BS contributed equally to the manuscript.
Corresponding author: Prof. Carme Junque
Medical Psychology Unit, Department of Medicine. University of Barcelona
Casanova 143 (08036) Barcelona, Spain
Phone: (+34) 93 402 45 70 // Fax: (+34) 93 403 52 94 // E-mail: [email protected]
Authors’ contact information:
C Uribe: [email protected]
B Segura: [email protected]
HC Baggio: [email protected]
A Abos: [email protected]

134
AI Garcia-Diaz: [email protected]
A Campabadal: [email protected]
MJ Marti: [email protected]
F Valldeoriola: [email protected]
Y Compta: [email protected]
N Bargallo: [email protected]
Keywords: Parkinson disease, cluster analysis, Magnetic Resonance Imaging, cortical
atrophy, longitudinal assessment.

135
Abstract
Background. Three cortical atrophy patterns were previously identified in non-
demented Parkinson’s disease patients using a data-driven approach based on cortical
thickness data: i) parieto-temporal pattern of atrophy with worse cognitive performance
(pattern 1), ii) occipital and frontal cortical atrophy with younger disease onset (pattern
2), and iii) non-detectable cortical atrophy (pattern 3). We aimed to investigate the
evolution of these three patterns over time. Methods. Magnetic resonance imaging and
neuropsychological assessment were obtained at baseline and follow-up (3.8±0.4 year
apart) in a group of 45 Parkinson’s disease patients and 22 healthy controls. FreeSurfer
was used for cortical thickness analysis and global atrophy measures. Results. Temporo-
parietal cortical thinning occurred in all groups and patients showed decline in processing
speed and semantic fluency. Pattern 3 patients showed more progressive cortical
thinning in the left prefrontal cortex than controls and more right occipital thinning than
pattern 2 patients over time. Pattern 1 patients had greater compromise in activities of
the daily living and suffered higher attrition rate. Conclusion. The three Parkinson’s
disease phenotypes identified using cluster analysis of cortical thickness data showed
different progression over time. The presence of prefrontal thinning and younger disease
onset at baseline was associated to less cortical degeneration, whereas initial temporo-
parietal pattern of atrophy was associated to worse clinical decline. Non-atrophic
patients progressed showing a temporo-parietal cortical thinning.

136
1. Introduction
Impaired cognitive functions in Parkinson’s disease (PD) are present even in untreated
patients and around 20% fulfill criteria for mild cognitive impairment (MCI) [1]. The
cumulative prevalence of dementia during eight years’ evolution is near 80% [2]. A meta-
analysis performed in 2007 including 25 heterogeneous longitudinal studies reported that
significant cognitive decline was obtained for global cognitive ability, visuoconstructive
skills and memory functions [3]. Posteriorly, well-controlled prospective works
coincided that the greatest decline was seen in psychomotor speed followed by memory
functions but disagreed regarding the progression of attention deficits [4-6]. It has been
suggested that the neuropsychological functions sensitive to cognitive decline and
progression to dementia are those supported by regions of the posterior cortex [7,8].
Longitudinal magnetic resonance imaging (MRI) studies have contributed to establish the
brain substrates for cognitive decline in PD. Voxel-wise and vertex-wise analyses
demonstrated that demented and non-demented PD patients had gray matter (GM)
reductions over relatively short periods of time [9-11] and these reductions were more
remarkable in patients with visual hallucinations [12]. In addition to hallucinations, the
presence of MCI is also a predictor of higher rates of cortical thinning [13]. The
differences between studies in cortical and subcortical regions that suffer atrophy during
the course of the disease could be due to the heterogeneity of the disease. A clinical
subtype named diffuse/malignant presenting non-motor features such as MCI, orthostatic
hypotension and rapid eye movement sleep behavior disorder, showed a more rapid
progression of cognitive decline [14]. Thus, different phenotypes could lead to different
patterns of cortical degeneration.
In a previous study using cluster analysis of cortical thickness data in PD patients, we
identified three PD subtypes: (i) parieto-temporal pattern of atrophy associated with

137
significant cognitive impairment, (ii) occipital and frontal cortical atrophy with younger
PD onset, and (iii) patients without manifest cortical atrophy [15]. In the current study,
we aimed to investigate longitudinally the evolution of these three different cortical
atrophy patterns over a 4-year period.
2. Methods
2.1 Participants
Forty-five PD patients from the Parkinson’s Disease and Movement Disorders Unit,
Hospital Clinic (Barcelona, Spain) and 22 HC from the Aging Institute in Barcelona were
assessed twice at 3.8±0.4 years apart (range: 3.1-5.3).
At time 1, 88 PD patients and 31 HC were recruited between October 2010 and March
2012 and classified into three subtypes as previously described [15]. In the present study,
only subjects who underwent comprehensive neuropsychological and MRI evaluation at
both times were included (see Supplementary Figure 1).
Inclusion criteria for patients at time 1 were: (i) fulfilling the UK PD Society Brain Bank
diagnostic criteria for PD; (ii) no surgical treatment with deep-brain stimulation.
Exclusion criteria for PD patients and HC were: (i) dementia according to the Movement
Disorders Society (MDS) criteria and clinic assessment performed by clinical neurologist
(MJM, FV, YC), (ii) Hoehn and Yahr (H&Y) scale score > 3, (iii) young-onset PD, (iv) age
below 50 years, (v) presence of severe psychiatric or neurological comorbidity, (vi) low
global intellectual quotient estimated by the Vocabulary subtest of the Wechsler Adult
Intelligence Scale, (scalar score ≤ 7), (vii) Mini Mental State Examination (MMSE) score
below 25, (viii) claustrophobia, (ix) pathological MRI findings other than mild white
matter hyperintensities in the FLAIR sequence, and (x) MRI artifacts.
Motor symptoms were assessed with the Unified Parkinson’s Disease Rating Scale,
motor section (UPDRS-III). All PD patients were taking antiparkinsonian drugs,

138
consisting of different combinations of L-DOPA, cathecol-O-methyltransferase
inhibitors, monoamine oxidase inhibitors, dopamine agonists and amantadine. In order
to standardize doses, the L-DOPA equivalent daily dose (LEDD) [16] was calculated.
Written informed consent was obtained from all study participants after full explanation
of the procedures. The study was approved by the institutional Ethics Committee from
the University of Barcelona (IRB00003099).
2.2 Neuropsychological and clinical assessment
In line with MDS PD-MCI task force recommendations [17], we assessed five cognitive
domains: visuospatial and visuoperceptual functions, executive functions, verbal memory,
attention and working memory and language (see Uribe et al., [15] for detailed protocol).
As in the baseline study [15], adjusted z-scores were calculated and the presence of MCI
was established if the z-score for a given test was at least 1.5 lower than the expected
score in at least two tests. Furthermore, the presence of dementia was determined if
MMSE score was below 26, or if there was cognitive impairment in more than one
domain and impaired instrumental activities of daily living (IADL).
Neuropsychiatric symptoms were evaluated with the Beck Depression Inventory-II,
Starkstein’s Apathy Scale and Cumming’s Neuropsychiatric Inventory. Functioning in
IADL were assessed with the Lawton and Brody scale and the Schwab and England scale.
Additionally, the Gottfries-Brane-Steen scale (GBS) was administered to
caregivers/family members of PD patients that could not return at time 2 (non-
completers) via telephone interview. This scale was administered with the aim to obtain
qualitative information from patients lost to follow-up, specially concerning pattern 1
patients.
2.3 Preprocessing and analysis of longitudinal imaging data

139
MRI data were acquired with a 3T scanner (MAGNETOM Trio, Siemens, Germany) at
both times. The scanning protocol included high-resolution 3-dimensional T1-weighted
images acquired in the sagittal plane (TR=2300ms, TE=2.98ms, TI=900ms, 240 slices,
FOV=256mm; 1mm isotropic voxel) and an axial FLAIR sequence (TR=9000ms,
TE=96ms).
Cross sectional preprocessing of both times was estimated using the automated
FreeSurfer stream (version 5.1; available at: http://surfer.nmr.harvard.edu). Detailed
description of FreeSurfer procedures is reported in the baseline study [15] and
information about the longitudinal cortical thickness preprocessing and the computed
symmetrized percent of change (SPC) of cortical thickness are described elsewhere [18].
Cortical thickness maps were smoothed using a circularly symmetric Gaussian kernel
across the surface with a full width at half maximum of 25 mm.
2.4 Statistical analysis
Group differences in demographic variables, disease outcomes and GBS scale scores at
time 2 were analyzed with Kruskal-Wallis test followed by Mann-Whitney’s pairwise
comparisons and Bonferroni correction for quantitative measures. Chi squared test
were used where appropriate for categorical measures.
Group differences in demographic and clinical variables between completers and non-
completers were analyzed with Mann-Whitney’s U test for quantitative measures and
Chi squared test for categorical measures at time 1. These analyses were conducted
using IBM SPSS Statistics 22.0 (2013; Armonk, NY: IBM Corp).
Group by time interaction effects in clinical disease-related variables and
neuropsychological performance between pattern 2 and 3 patients and HC were
assessed through a repeated-measures general linear model and permutation testing
with 10,000 iterations. To control type-I errors, a Bonferroni correction was applied.

140
Comparisons between groups were assessed using a vertex-by-vertex general linear
model. Two statistical models were performed: one sample t-test was performed to test
time effect in groups (if the SPC was different from zero); and to test time by group
interaction effects, SPC was included as a dependent factor and group as an independent
factor. In the second model, age and years of education were considered as nuisance
covariates (see Table 1).
All results were corrected for multiple comparisons using pre-cached cluster-wise
Monte Carlo simulation with 10,000 iterations. Reported cortical regions reached a two-
tailed corrected significance level of p < 0.05.
Global atrophy measures including total GM volume, subcortical and cortical GM
volume, mean lateral ventricular volume and estimated intracranial volume were
obtained automatically via whole brain segmentation with the FreeSurfer suite. Global
average thickness for both hemispheres was calculated as:
((lh.thickness*lh.surface area)+(rh.thickness*rh.surface area))/(lh.surface
area+rh.surface area).
Group by time interaction effects were assessed by permutation test statistics with
10,000 iterations. Bonferroni was then used to control for multiple comparison. The
estimated intracranial volume was considered as a nuisance covariate in the volumetric
analyses.
141
3. Results
There were no significant differences in the assessment interval between groups
(H=6.516; P=.089).
3.1 Demographic and clinical characteristics
Pattern 2 patients were younger than both HC and pattern 1, younger at disease onset
than pattern 1, and had more years of education than patients in pattern 1 and 3 and
HC (Table 1).
Regarding functioning in IADLS, patients in pattern 1 had significantly more impairment
than HC and pattern 3 patients as measured by the Lawton and Brody scale at time 2.
There were also significant differences between HC and pattern 1, pattern 2 and pattern
3 as measured by the Schwab and England scale (Table 1).
Pattern 2 patients and controls had significant time effects in the MMSE scores as
measure of global cognition although they were not clinically significant. Regarding L-
DOPA intake, a significant interaction was found between the decreased doses of
pattern 2 patients compared with an increment in the doses of pattern 3 patients.
Regarding psychiatric symptoms over time, patients in pattern 2 had more severe global
neuropsychiatric symptoms than HC (Table 2).
Due to the high attrition rate in Pattern 1 patients, this group (n = 7) was not included
in the statistical general linear models to investigate cortical thinning progression, clinical
evolution and neuropsychological decline.

142
Table 1 Demographic and clinical characteristics of the sample at both times
Parkinson’s Disease subtypes Healthy
controls
(n=22)
Test stats/
P-values Pattern 1
(n=7)
Pattern 2
(n=16)
Pattern 3
(n=22)
Age, y, median (IQ range)
Time 1 76.0 (18.0) 57.5 (13.0) 63.0 (10.0) 66.0 (13.0) 13.740/.003
Time 2 80.0 (18.0) 61.0 (13.0) 67.5 (11.0) 70.0 (13.0) 14.017/.003
Education, y,
median (IQ
range)
8.0 (6.0) 17.5 (8.0) 10.5 (6.0) 10.0 (8.0) 16.492/.001
Sex, male, n
(%) 6 (86.7) 13 (81.3) 12 (54.5) 11 (50.0) 6.081/.108
Disease duration, y, median (IQ range)
Time 1 4.0 (7.0) 6.0 (8.3) 6.0 (9.0) NA 1.564/.457
Time 2 7.0 (7.0) 9.0 (7.0) 9.0 (7.0) NA 0.278/.870
Age of onset,
y, median (IQ
range)
67.0 (19.0) 47.5 (14.6) 54.5 (12.7) NA 10.583/.005
Hoehn &Yahr stage, n 1/1.5/2/2.5/3/4
Time 1 2/0/5/0/0/0 5/1/7/2/1/0 11/0/8/1/2/0 NA 6.466/.595
Time 2 0/0/2/0/4/1 2/0/6/0/8/0 4/0/11/0/7/0 NA 8.629/.196
Instrumental Activities of Daily Living Scales, median (IQ range)
Lawton and
Brody Scale 3.5 (2.0) 7.0 (3.0) 8.0 (2.0) 8.0 (2.0) 17.096/.001
Schwab and
England
Scale, %
70.0 (20.0) 85.0 (30.0) 90.0 (20.0) 100.0 (0.0) 33.105/<.001
noMCI1 2 (28.6) 9 (56.2) 11 (50.0) 21 (95.5) 80.136/<.001
11.734/.0192
MCI1 3 (42.8) 7 (43.8) 11 (50.0) 1 (4.5)
Dementia1 2 (28.6) 0 0 0
IQ range, interquartile range; MCI, mild cognitive impairment; NA, not applicable.
P-values are from Kruskal-Wallis test followed by Mann-Whitney pairwise test and
Bonferroni correction for continuous variables and chi-squared test for categorical
variables. 1 Proportions of noMCI, MCI and dementia at time 2. 2 Chi squared test between all groups was 80.136; P<.001. Chi squared test between PD
groups was 11.734; P=.019.

143
Age showed significant differences between pattern 2 and HC (P=.013 at time 1; P=.015
at time 2) and pattern 1 (P=.009 at time 1; P=.007 at time 2). Years of education showed
significant differences between pattern 2 and HC (P=.016), pattern 1 (P =.003) and pattern
3 (P =.011). Age of onset showed significant differences between pattern 1 and pattern 2
(P =.005). At time 2, Lawton and Brody Scale showed significant differences between
pattern 1 and HC (P=.001) and pattern 3 (P=.003); Schwab and England Scale showed
significant differences between pattern 1 and HC (P<.001) and pattern 2 (P<.001) and
pattern 3 (P=.003).
Table 2 Clinical measures of the sample at both times
Parkinson’s Disease subtypes Healthy
controls
(n=22)
Pattern 1
(n=7)
Pattern 2
(n=16)
Pattern 3
(n=22)
Mini Mental State Examination, mean (SD)
Time 1 28.3 (2.0) 29.6 (0.6) 29.3 (0.9) 29.8 (0.4)
Time 2 25.7 (4.5) 29.1 (1.0) 29.1 (1.0) 29.3 (0.8)
UPDRS part III, mean (SD)
Time 1 13.7 (7.0) 13.8 (11.3) 12.5 (9.5) NA
Time 2 23.9 (15.4) 19.1 (9.5) 14.5 (7.8) NA
LEDD, mg, mean (SD)
Time 1 552.9 (386.0) 849.4 (557.9) 603.3 (445.5) NA
Time 2 924.3 (484.5) 672.8 (326.6) 694.6 (462.1) NA
Beck Depression Inventory II, mean (SD)
Time 1 13.9 (5.2) 6.4 (6.1) 8.9 (4.7) 6.6 (5.5)
Time 2 19.7 (9.4) 6.6 (5.3) 8.3 (4.8) 5.1 (4.6)
Starkstein’s Apathy Scale, mean (SD)
Time 1 19.1 (7.5) 11.1 (7.3) 10.7 (5.7) 8.6 (5.8)
Time 2 23.0 (7.0) 10.6 (8.2) 11.3 (5.9) 9.1 (5.5)
Cummings’ Neuropsychiatric Inventory, mean (SD)
Time 1 9.1 (13.7) 5.8 (10.5) 5.4 (6.4) 1.8 (3.5)
Time 2 20.6 (16.4) 9.8 (9.8) 6.2 (6.0) 2.2 (2.5)
LEDD, L-dopa equivalent daily dose; SD, Standard deviation; UPDRS part III, Unified
Parkinson’s Disease Rating Scale motor section.
Pattern 1 patients were not included into the permutation testing general linear model.
All reported significant effects were corrected by Bonferroni.
There were significant time effects in MMSE in pattern 2 (t=1.804; =.054) and in controls
(t=1.923; P=.035). There was a significant interaction time x group in LEDD medication
between pattern 2 and pattern 3 (t=1.825; P=.047). Cummings’ Neuropsychiatric
Inventory showed significant differences between HC and pattern 2 (t=1.665: P=.036).
144
3.2 Cognitive decline over time
Both pattern 2 and 3 patients as well as the controls group had worsened their
performance over time in the Trail Making Test (TMT) Part A minus B. Specific effect
times were found in pattern 2 and 3 patients’ groups. Pattern 2 and pattern 3 patients
also had decreased performance in semantic fluency, Stroop Word-Color test, Symbol
Digits Modalities test (SDMT) and in the TMT Part B over time. Additionally, pattern 2
patients also showed decline in the Stroop Color test. Pattern 3 patients performed
worse over time also in the TMT Part A. Patients in pattern 2 declined significantly more
than HC in Stroop Color test and SDMT. Pattern 3 patients differed from HC in TMTA,
TMTB and SDMT (Figure 1A). In Supplementary Table 1 means and SD of the
neuropsychological performance can be found for all groups.
At time 2, 2 (28.6%) patients in pattern 1 converted to dementia and 3 (28.6%) patients
had MCI. From the 3 MCI patients, two were converters and the other already had MCI
at time 1. In pattern 2 subtype, there were 7 MCI (43.8%), 4 of whom were converters,
whereas in pattern 3 there were 11 MCI (50.0%), 6 of whom were converters. In the
HC group, 1 (4.5%) control also converted to MCI (Table 1 and Supplementary Table
2).
Figure 1 Neuropsychological and cortical thinning effect times. A)
Neuropsychological performance of pattern 2 and 3 PD patients and controls at both
times. Time 1 in blue and time 2 in orange. Data are presented as z-scores. Lower z-
scores indicate worse performance. Abbreviations: BNT = Boston Naming Test; JLO =
Judgment of Line Orientation Test; RAVLT = Rey’s Auditory Verbal Learning Test;
SDMT = Symbol Digits Modalities Test; TMT = Trail Making Test; VFD = Visual Form
Discrimination Test. B) symmetrized percent of change of cortical thickness. Color maps
indicate significant time effect in each group. Results were corrected by Monte Carlo
simulation.
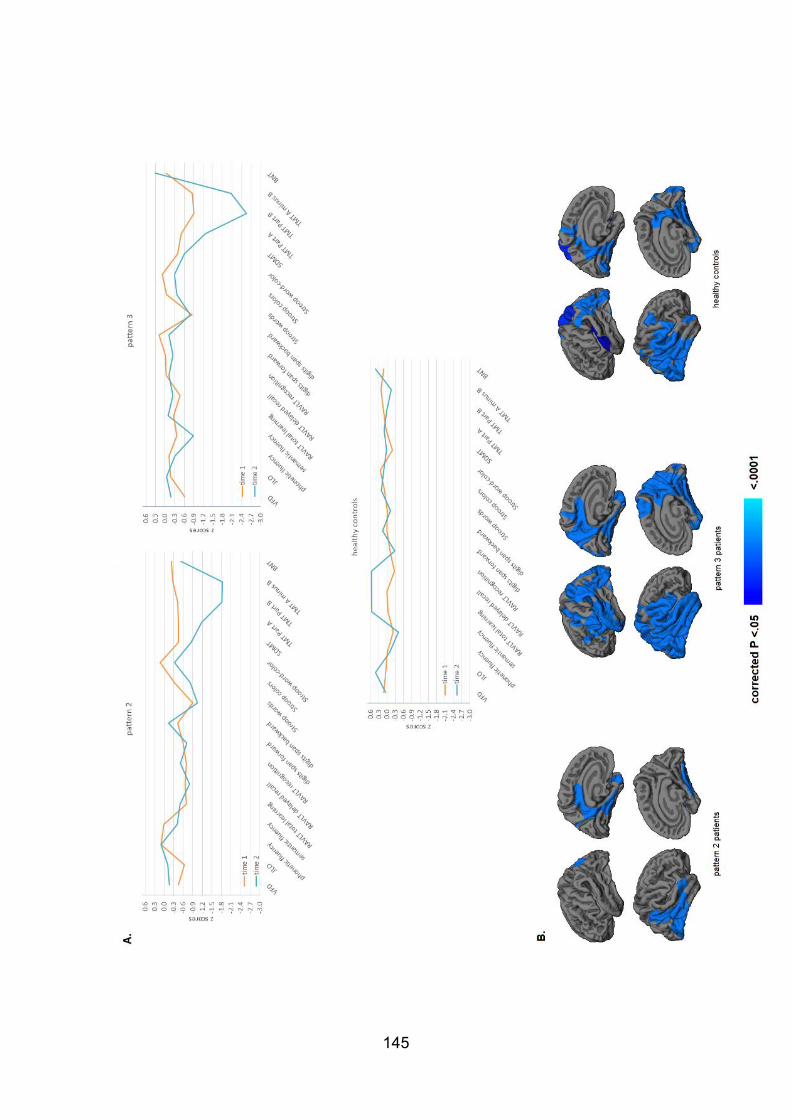
145

146
3.3 Cortical thickness changes
Regarding changes over time, patients in pattern 2 had reductions in left
parahippocampal gyrus, left posterior cingulate extending to the midcingulate, left
precuneus and right inferior parietal and temporal gyri, fusiform and lateral occipital gyri.
Significant cortical thinning in pattern 3 patients was found bilaterally in lateral and medial
regions of the temporal and parietal lobes, lateral occipital and extending to frontal
regions such as the precentral and postcentral gyri and the left pars opercularis. HC
group also showed a significant effect of time, specifically cortical thinning was found in
posterior regions, such as right parahippocampal, bilateral fusiform, posterior cingulate,
lateral occipital, lingual gyri and both inferior and superior parietal areas extending to
the right precentral gyrus (Figure 1B).
Pattern 3 had more cortical thinning in the left pars opercularis gyrus extending to lateral
parts of the ventrolateral prefrontal cortex such as the pars triangularis gyrus compared
with HC over time (see Figure 2). There were no significant intergroup differences in
cortical thickness decline between HC and pattern 2.
Differential changes in cortical thinning were also found between pattern 2 and 3 (Figure
2). Pattern 3 patients had more significant decrements in the right lateral occipital, lingual
and pericalcarine gyri compared with pattern 2 patients.
Montreal Neurological Institute coordinates, cluster sizes and significance from
longitudinal analyses are summarized in Supplementary Table 3.
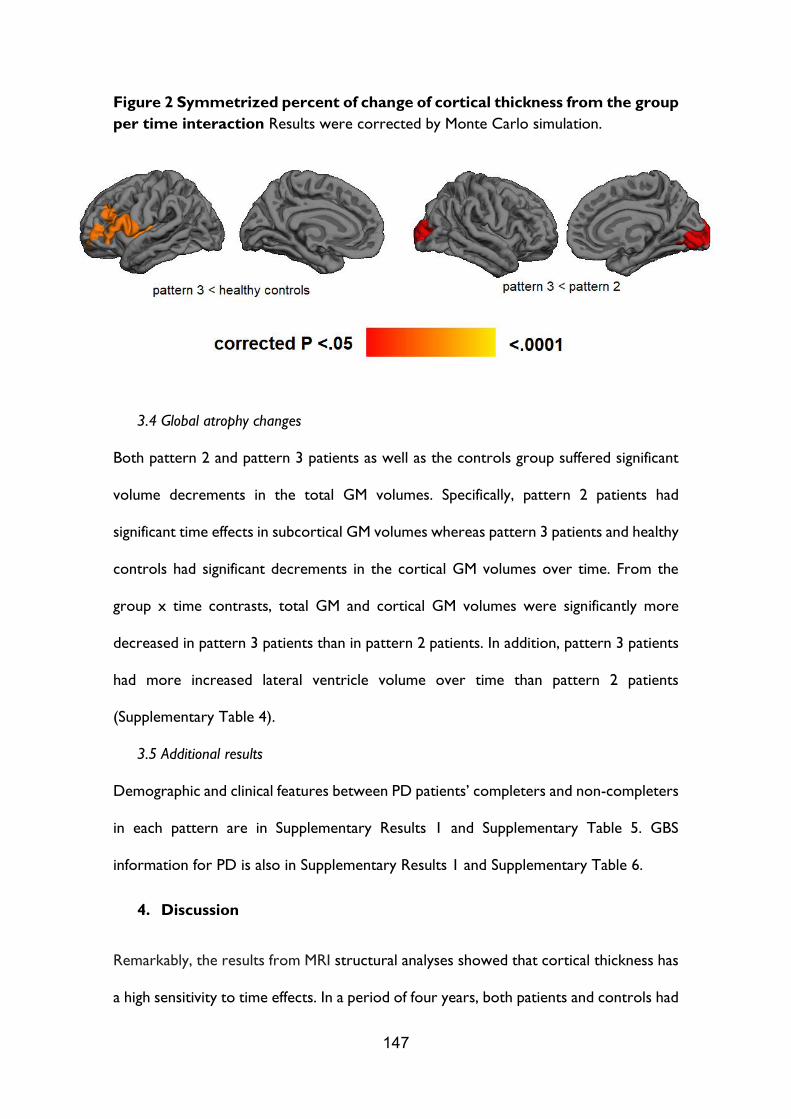
147
Figure 2 Symmetrized percent of change of cortical thickness from the group
per time interaction Results were corrected by Monte Carlo simulation.
3.4 Global atrophy changes
Both pattern 2 and pattern 3 patients as well as the controls group suffered significant
volume decrements in the total GM volumes. Specifically, pattern 2 patients had
significant time effects in subcortical GM volumes whereas pattern 3 patients and healthy
controls had significant decrements in the cortical GM volumes over time. From the
group x time contrasts, total GM and cortical GM volumes were significantly more
decreased in pattern 3 patients than in pattern 2 patients. In addition, pattern 3 patients
had more increased lateral ventricle volume over time than pattern 2 patients
(Supplementary Table 4).
3.5 Additional results
Demographic and clinical features between PD patients’ completers and non-completers
in each pattern are in Supplementary Results 1 and Supplementary Table 5. GBS
information for PD is also in Supplementary Results 1 and Supplementary Table 6.
4. Discussion
Remarkably, the results from MRI structural analyses showed that cortical thickness has
a high sensitivity to time effects. In a period of four years, both patients and controls had
148
cortical thinning mainly in parieto-temporal regions, as well as global gray matter
atrophy. However, PD patients differed in clinical, cognitive and structural degeneration
over time according to their initial regional cortical thinning pattern.
Patients from pattern 1 characterized by an extensive parieto-temporal atrophy [15]
showed a higher attrition rate and for that reason they were not included in the
quantitative MRI analyses. This group showed higher severity of motor symptoms
measured by the H&Y scale at baseline, more IADL, and more cognitive impairment
assessed by telephone interview at follow-up. Previous longitudinal studies also
reported that patients who were lost to follow-up were older, had higher age at disease
onset, more axial impairment, scored higher on H&Y and showed higher percentage of
PD dementia [5]. Considering the initial sample, we estimated that 15% of PD patients
converted to dementia during the follow-up period. This percentage was similar to other
population-based studies [5,8,19,20].
The time effect in pattern 2 patients, initially identified as frontal and occipital atrophy
pattern [15], showed localized cortical thinning over time mainly in temporal and
occipital lobe and posterior cingulate gyrus. These patients were initially younger, with
higher education and younger age at onset, probably as indicators of better prognosis.
Patients from pattern 2 who dropped out of the study had less years of education, more
global cognitive impairment and had more depressive symptoms. Thus, patients from
pattern 2 who completed the follow-up assessment probably represent a PD group with
better progression of these disease aspects.
On the other hand, pattern 3 and healthy controls that initially were identified as the
less atrophic groups, showed an extensive cortical thinning effect in bilateral parietal and
temporal regions. This time effect in pattern 3 was similar to cortical atrophy previously

149
detected in pattern 1 at baseline [15] and it is similar to the cortical degeneration
observed in the controls group.
Inter-group comparisons of symmetrized percent of cortical thickness change showed
that pattern 3 patients had statistically significant greater cortical compared with healthy
controls and pattern 2. Although this group was initially non-atrophic, after a four-year
period, they presented significant cortical thinning. These patients differed from normal
aging in right frontal lobe and showed higher symmetrized percent of change in the left
occipital lobe than pattern 2 PD patients that already showed atrophy in this region.
Occipital thinning compared to controls has been observed in cross sectional [21] and
longitudinal studies in demented PD patients [9], in PD-MCI [22] and in PD with visual
hallucinations [23,24]. However, these studies also reported more widespread atrophy
including other lobes.
Global atrophy measures also revealed higher volume decrements in pattern 3 patients
than in pattern 2, as well as increased ventricular enlargement. Previous literature has
reported an association between global atrophy measures [25,26] with cognitive
impairment. However, the proportion of MCI was not significantly different between
pattern 2 and 3.
Regarding the neuropsychological assessment, our results identified that semantic
fluency, TMT, SDMT and Stroop tests were sensitive to time effect. This result agrees
with previous findings in longitudinal studies showing processing speed impairment in
PD over time assessed by Digit Symbol Test and TMTA [4,5]. Contrarily to the expected
results accounted by aging effects, we did not find statistical memory decline. This could
be due to a test-retest effect. In favor of this interpretation we can see that, although
non-significant, the healthy control group showed a slight increase in their performance.
Other longitudinal studies reported memory loss but the follow up was longer [3,5].

150
After four years, patients from patterns 2 and 3 showed reduced semantic fluency
performance. At baseline, semantic fluency test differentiated the parieto-temporal
pattern from other PD subtypes [15]. In light of our new findings, such worsened
performance could be related to the progressive posterior parietal and temporal
thinning observed in PD. Cognitive differences between healthy controls and pattern 3
patients in executive function and processing speed were coherent with cortical atrophy
results in prefrontal regions.
In summary, patients from pattern 1 were mainly lost to follow-up due to functional
impairment in IALD and had the highest proportion of dementia. Patients from pattern
2 showed modest progressive temporal and parietal cortical thinning and probably
better evolution. Finally, pattern 3 patients were non-atrophic at baseline but progressed
showing temporo-parietal cortical thinning. In conclusion, cortical thinning in PD
subtypes follows different progression over time.
Disclosures.
This study was sponsored by the Spanish Ministry of Economy and Competitiveness
(PSI2013-41393-P; PSI2017-86930-P cofinanced by Agencia Estatal de Investigación (AEI)
and the European Regional Development Fund), by Generalitat de Catalunya (2017SGR
748) and by Fundació La Marató de TV3 in Spain (20142310). CU was supported by a
fellowship from 2014, Spanish Ministry of Economy and Competitiveness (BES-2014-
068173) and co-financed by the European Social Fund (ESF). AA was supported by a
fellowship from 2016, Departament d’Empresa i Coneixement de la Generalitat de
Catalunya, AGAUR (2016FI_B 00360). AC was supported by APIF predoctoral
fellowship from the University of Barcelona (2017–2018).
MJM received honoraria for advice and lecture from Abbvie, Bial and Merzt Pharma and
grants from Michael J. Fox Foundation for Parkinson Disease (MJFF): MJF_PPMI_10_001,
151
PI044024. YC has received funding in the past five years from FIS/FEDER, H2020
programme, Union Chimique Belge (UCB pharma), Teva, Medtronic, Abbvie, Novartis,
Merz, Piramal Imaging, and Esteve, Bial, and Zambon. YC is currently an associate editor
for Parkinsonism and Related Disorders.
Declaration of interest. None.
Authors’ contribution.
CJ and BS contributed to the research project conception and in the design of the study.
CU, AA and AC contributed to the acquisition of the data. CU, AA, AIGD and AC
contributed to the analysis of the data and CU, BS, HCB, AA, AIGD, AC, MJM, FV, YC,
NB and CJ contributed to the interpretation of the data. CU, BS contributed to the draft
of the article. CU, BS, HCB, AA, AIGD, AC, MJM, FV, YC, NB, CJ revised the manuscript
critically for important intellectual content and approved the final version of the
manuscript.
Acknowledgment. Without the support of the patients, their families and control
subjects this work would have not been possible. We are also indebted to the Magnetic
Resonance Imaging core facility of the IDIBAPS for the technical support, especially to
C. Garrido, G. Lasso, V. Sanchez and A. Albaladejo; and we would also like to
acknowledge the CERCA Program/Generalitat de Catalunya.
References
[1] D. Aarsland, K. Brønnick, J.P. Larsen, O.B. Tysnes, G. Alves, Cognitive
impairment in incident, untreated parkinson disease: The norwegian parkwest study,
Neurology. 72 (2009) 1121–1126. doi:10.1212/01.wnl.0000338632.00552.cb.
[2] D. Aarsland, K. Andersen, J.P. Larsen, A. Lolk, Prevalence and Characteristics of
Dementia in Parkinson Disease, Arch. Neurol. 60 (2003) 387.
doi:10.1001/archneur.60.3.387.

152
[3] D. Muslimović, B. Schmand, J.D. Speelman, R.J. De Haan, Course of cognitive
decline in Parkinson’s disease: A meta-analysis, J. Int. Neuropsychol. Soc. 13 (2007)
920–932. doi:10.1017/S1355617707071160.
[4] D. Muslimović, B. Post, J.D. Speelman, R.J. De Haan, B. Schmand, Cognitive
decline in Parkinson’s disease: A prospective longitudinal study, J. Int. Neuropsychol.
Soc. 15 (2009) 426–437. doi:10.1017/S1355617709090614.
[5] M. Broeders, D.C. Velseboer, R. de Bie, J.D. Speelman, D. Muslimovic, B. Post,
R. de Haan, B. Schmand, Cognitive change in newly-diagnosed patients with Parkinson’s
disease: a 5-year follow-up study., J. Int. Neuropsychol. Soc. 19 (2013) 695–708.
doi:10.1017/S1355617713000295.
[6] C. Gasca-salas, A. Estanga, P. Clavero, I. Aguilar-Palacio, R. González-Redondo,
J. a Obeso, M.C. Rodríguez-Oroz, R. Gonz, Longitudinal Assessment of the Pattern of
Cognitive Decline in Non-Demented Patients with Advanced Parkinson’s Disease., J.
Parkinsons. Dis. 4 (2014) 677–686. doi:10.3233/JPD-140398.
[7] C.H. Williams-Gray, T. Foltynie, C.E.G. Brayne, T.W. Robbins, R.A. Barker,
Evolution of cognitive dysfunction in an incident Parkinson’s disease cohort, Brain. 130
(2007) 1787–1798. doi:10.1093/brain/awm111.
[8] C.H. Williams-Gray, J.R. Evans, A. Goris, T. Foltynie, M. Ban, T.W. Robbins, C.
Brayne, B.S. Kolachana, D.R. Weinberger, S.J. Sawcer, R.A. Barker, The distinct
cognitive syndromes of Parkinson’s disease: 5 year follow-up of the CamPaIGN cohort,
Brain. 132 (2009) 2958–2969. doi:10.1093/brain/awp245.
[9] B. Ramírez-Ruiz, M.J. Martí, E. Tolosa, D. Bartrés-Faz, C. Summerfield, P.
Salgado-Pineda, B. Gómez-Ansón, C. Junqué, Longitudinal evaluation of cerebral
morphological changes in Parkinson’s disease with and without dementia, J. Neurol.
252 (2005) 1345–1352. doi:10.1007/s00415-005-0864-2.

153
[10] N. Ibarretxe-Bilbao, C. Junque, B. Segura, H.C. Baggio, M.J. Marti, F.
Valldeoriola, N. Bargallo, E. Tolosa, Progression of cortical thinning in early Parkinson’s
disease., Mov. Disord. 27 (2012) 1746–53. doi:10.1002/mds.25240.
[11] C. Tessa, C. Lucetti, M. Giannelli, S. Diciotti, M. Poletti, S. Danti, F. Baldacci, C.
Vignali, U. Bonuccelli, M. Mascalchi, N. Toschi, Progression of brain atrophy in the
early stages of Parkinson’s disease: A longitudinal tensor-based morphometry study in
de novo patients without cognitive impairment, Hum. Brain Mapp. 35 (2014) 3932–
3944. doi:10.1002/hbm.22449.
[12] N. Ibarretxe-Bilbao, B. Ramirez-Ruiz, C. Junque, M.J. Marti, F. Valldeoriola, N.
Bargallo, S. Juanes, E. Tolosa, Differential progression of brain atrophy in Parkinson’s
disease with and without visual hallucinations, J. Neurol. Neurosurg. Psychiatry. 81
(2010) 650–657. doi:10.1136/jnnp.2009.179655.
[13] E. Mak, L. Su, G.B. Williams, J.T. O’Brien, Neuroimaging correlates of cognitive
impairment and dementia in Parkinson’s disease, Parkinsonism Relat. Disord. 21 (2015)
862–870. doi:10.1016/j.parkreldis.2015.05.013.
[14] S.-M. Fereshtehnejad, S.R. Romenets, J.B.M. Anang, V. Latreille, J.-F. Gagnon,
R.B. Postuma, New Clinical Subtypes of Parkinson Disease and Their Longitudinal
Progression, JAMA Neurol. 72 (2015) 863. doi:10.1001/jamaneurol.2015.0703.
[15] C. Uribe, B. Segura, H.C. Baggio, A. Abos, M.J. Marti, F. Valldeoriola, Y.
Compta, N. Bargallo, C. Junque, Patterns of cortical thinning in nondemented
Parkinson’s disease patients, Mov. Disord. 31 (2016) 699–708. doi:10.1002/mds.26590.
[16] C.L. Tomlinson, R. Stowe, S. Patel, C. Rick, R. Gray, C.E. Clarke, Systematic
review of levodopa dose equivalency reporting in Parkinson’s disease, Mov. Disord. 25
(2010) 2649–2653. doi:10.1002/mds.23429.

154
[17] I. Litvan, J.G. Goldman, A.I. Tröster, B.A. Schmand, D. Weintraub, R.C.
Petersen, B. Mollenhauer, C.H. Adler, K. Marder, C.H. Williams-Gray, D. Aarsland, J.
Kulisevsky, M.C. Rodriguez-Oroz, D.J. Burn, R.A. Barker, M. Emre, Diagnostic criteria
for mild cognitive impairment in Parkinson’s disease: Movement Disorder Society Task
Force guidelines, Mov. Disord. 27 (2012) 349–356. doi:10.1002/mds.24893.
[18] A. Campabadal, C. Uribe, B. Segura, H.C. Baggio, A. Abos, A.I. Garcia-Diaz, M.J.
Marti, F. Valldeoriola, Y. Compta, N. Bargallo, C. Junque, Brain correlates of
progressive olfactory loss in Parkinson’s disease, Park. Relat. Disord. 41 (2017) 44–50.
doi:10.1016/j.parkreldis.2017.05.005.
[19] M. Broeders, R.M.A. de Bie, D.C. Velseboer, J.D. Speelman, D. Muslimovic, B.
Schmand, Evolution of mild cognitive impairment in Parkinson disease, Neurology. 81
(2013) 346–352. doi:10.1212/WNL.0b013e31829c5c86.
[20] F. Mahieux, G. Fénelon, A. Flahault, M.J. Manifacier, D. Michelet, F. Boller,
Neuropsychological prediction of dementia in Parkinson’s disease., J. Neurol.
Neurosurg. Psychiatry. 64 (1998) 178–83.
http://www.ncbi.nlm.nih.gov/pubmed/9489527 (accessed February 11, 2019).
[21] E.J. Burton, I.G. McKeith, D.J. Burn, E.D. Williams, J.T. O’Brien, Cerebral
atrophy in Parkinson’s disease with and without dementia: A comparison with
Alzheimer’s disease, dementia with Lewy bodies and controls, Brain. 127 (2004) 791–
800. doi:10.1093/brain/awh088.
[22] A. Hanganu, C. Bedetti, C. Degroot, B. Mejia-Constain, A.L. Lafontaine, V.
Soland, S. Chouinard, M.A. Bruneau, S. Mellah, S. Belleville, O. Monchi, Mild cognitive
impairment is linked with faster rate of cortical thinning in patients with Parkinson’s
disease longitudinally, Brain. 137 (2014) 1120–1129. doi:10.1093/brain/awu036.

155
[23] B. Ramírez-Ruiz, M.-J. Martí, E. Tolosa, M. Giménez, N. Bargalló, F. Valldeoriola,
C. Junqué, Cerebral atrophy in Parkinson’s disease patients with visual hallucinations.,
Eur. J. Neurol. 14 (2007) 750–756. doi:10.1111/j.1468-1331.2007.01768.x.
[24] J.G. Goldman, G.T. Stebbins, V. Dinh, B. Bernard, D. Merkitch, L. deToledo-
Morrell, C.G. Goetz, Visuoperceptive region atrophy independent of cognitive status in
patients with Parkinson’s disease with hallucinations, Brain. 137 (2014) 849–859.
doi:10.1093/brain/awt360.
[25] L. Apostolova, G. Alves, K.S. Hwang, S. Babakchanian, K.S. Bronnick, J.P. Larsen,
P.M. Thompson, Y.-Y. Chou, O.B. Tysnes, H.K. Vefring, M.K. Beyer, Hippocampal and
ventricular changes in Parkinson’s disease mild cognitive impairment., Neurobiol. Aging.
33 (2012) 2113–24. doi:10.1016/j.neurobiolaging.2011.06.014.
[26] E.J. Burton, I.G. McKeith, D.J. Burn, J.T. O’Brien, Brain atrophy rates in
Parkinson’s disease with and without dementia using serial magnetic resonance imaging,
Mov. Disord. 20 (2005) 1571–1576. doi:10.1002/mds.20652.

156

157
Supplementary material
Progression of Parkinson’s disease patients’ subtypes based on cortical
thinning: 4-year follow-up
Carme Uribe*, MSc1; Barbara Segura*, PhD1,2; Hugo Cesar Baggio, MD, PhD1;
Alexandra Abos, MSc1; Anna Isabel Garcia-Diaz, PhD1; Anna Campabadal,
MSc1; Maria Jose Marti, MD, PhD2,3,4; Francesc Valldeoriola, MD, PhD2,3,4;
Yaroslau Compta, MD, PhD2.3,4; Nuria Bargallo, MD, PhD4,5; Carme Junque,
PhD1,2,4.
Supplementary Figure 1 Flowchart of participants who participated at both
times and those lost to time 2
Abbreviations: DBS = deep brain stimulation; IADL = instrumental activities of
daily living; MRI = magnetic resonance imaging; P1 = Pattern 1; P2 = Pattern 2;
P3 = Pattern 3; PD = Parkinson’s disease.
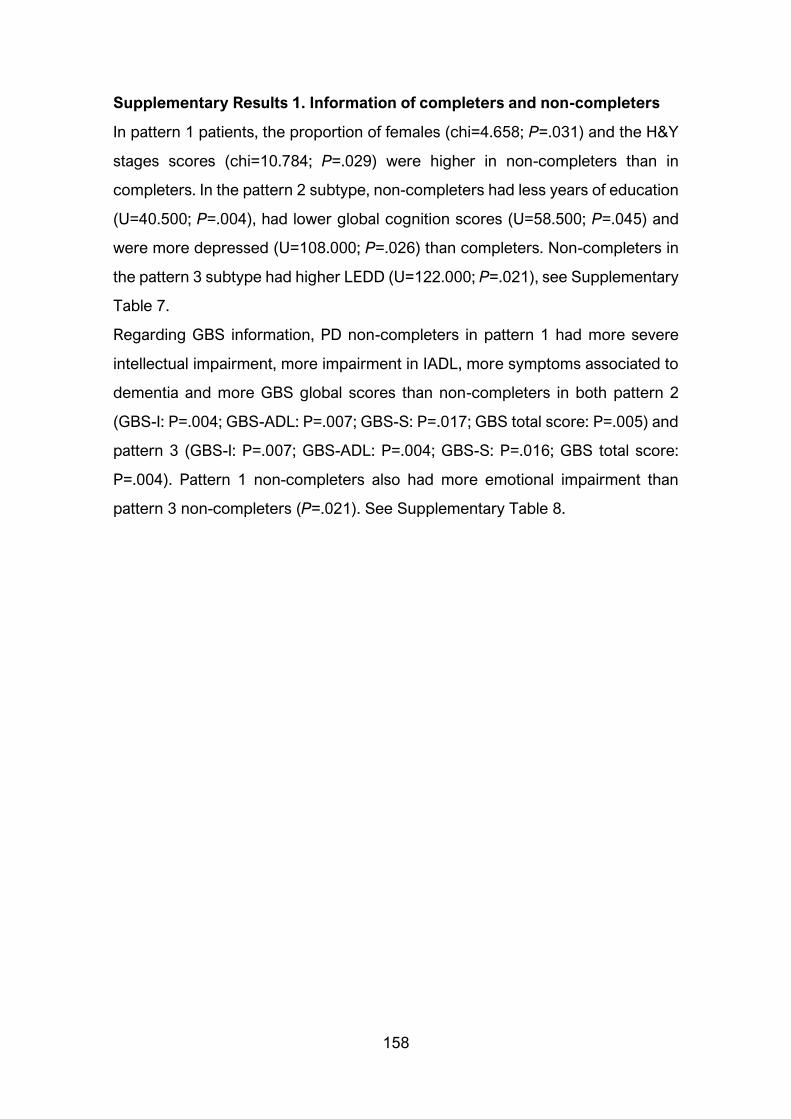
158
Supplementary Results 1. Information of completers and non-completers
In pattern 1 patients, the proportion of females (chi=4.658; P=.031) and the H&Y
stages scores (chi=10.784; P=.029) were higher in non-completers than in
completers. In the pattern 2 subtype, non-completers had less years of education
(U=40.500; P=.004), had lower global cognition scores (U=58.500; P=.045) and
were more depressed (U=108.000; P=.026) than completers. Non-completers in
the pattern 3 subtype had higher LEDD (U=122.000; P=.021), see Supplementary
Table 7.
Regarding GBS information, PD non-completers in pattern 1 had more severe
intellectual impairment, more impairment in IADL, more symptoms associated to
dementia and more GBS global scores than non-completers in both pattern 2
(GBS-I: P=.004; GBS-ADL: P=.007; GBS-S: P=.017; GBS total score: P=.005) and
pattern 3 (GBS-I: P=.007; GBS-ADL: P=.004; GBS-S: P=.016; GBS total score:
P=.004). Pattern 1 non-completers also had more emotional impairment than
pattern 3 non-completers (P=.021). See Supplementary Table 8.
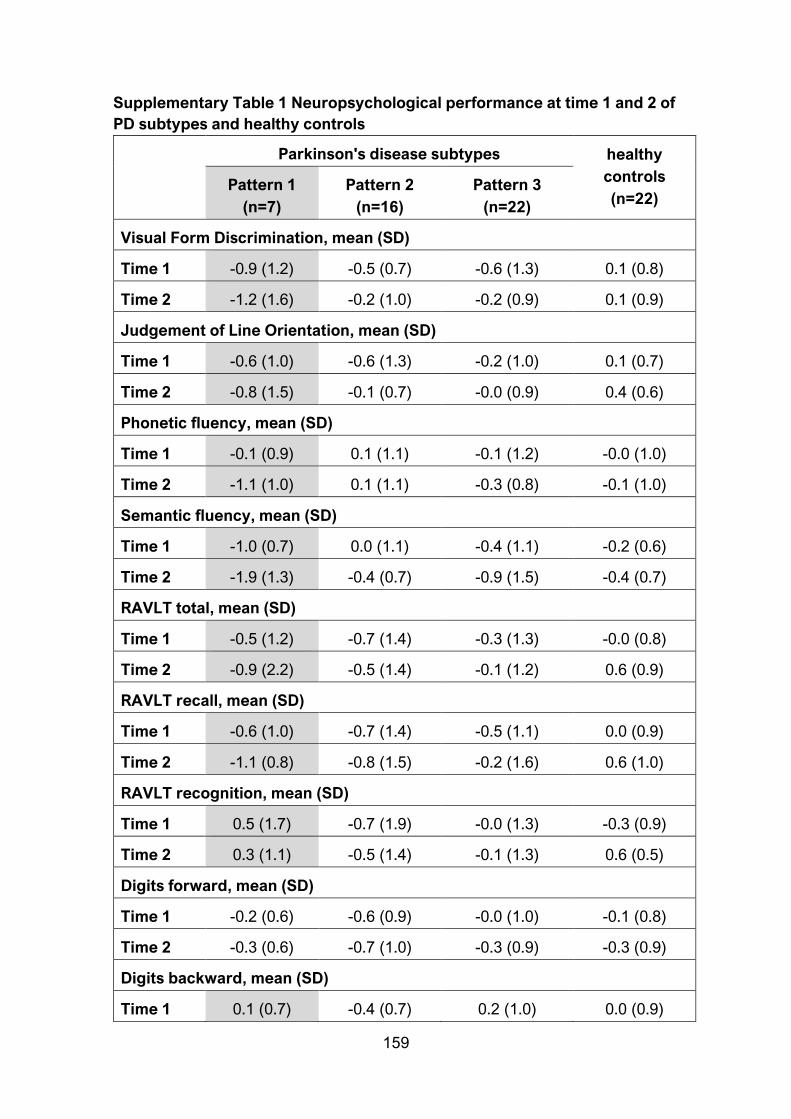
159
Supplementary Table 1 Neuropsychological performance at time 1 and 2 of
PD subtypes and healthy controls
Parkinson's disease subtypes healthy
controls
(n=22) Pattern 1
(n=7)
Pattern 2
(n=16)
Pattern 3
(n=22)
Visual Form Discrimination, mean (SD)
Time 1 -0.9 (1.2) -0.5 (0.7) -0.6 (1.3) 0.1 (0.8)
Time 2 -1.2 (1.6) -0.2 (1.0) -0.2 (0.9) 0.1 (0.9)
Judgement of Line Orientation, mean (SD)
Time 1 -0.6 (1.0) -0.6 (1.3) -0.2 (1.0) 0.1 (0.7)
Time 2 -0.8 (1.5) -0.1 (0.7) -0.0 (0.9) 0.4 (0.6)
Phonetic fluency, mean (SD)
Time 1 -0.1 (0.9) 0.1 (1.1) -0.1 (1.2) -0.0 (1.0)
Time 2 -1.1 (1.0) 0.1 (1.1) -0.3 (0.8) -0.1 (1.0)
Semantic fluency, mean (SD)
Time 1 -1.0 (0.7) 0.0 (1.1) -0.4 (1.1) -0.2 (0.6)
Time 2 -1.9 (1.3) -0.4 (0.7) -0.9 (1.5) -0.4 (0.7)
RAVLT total, mean (SD)
Time 1 -0.5 (1.2) -0.7 (1.4) -0.3 (1.3) -0.0 (0.8)
Time 2 -0.9 (2.2) -0.5 (1.4) -0.1 (1.2) 0.6 (0.9)
RAVLT recall, mean (SD)
Time 1 -0.6 (1.0) -0.7 (1.4) -0.5 (1.1) 0.0 (0.9)
Time 2 -1.1 (0.8) -0.8 (1.5) -0.2 (1.6) 0.6 (1.0)
RAVLT recognition, mean (SD)
Time 1 0.5 (1.7) -0.7 (1.9) -0.0 (1.3) -0.3 (0.9)
Time 2 0.3 (1.1) -0.5 (1.4) -0.1 (1.3) 0.6 (0.5)
Digits forward, mean (SD)
Time 1 -0.2 (0.6) -0.6 (0.9) -0.0 (1.0) -0.1 (0.8)
Time 2 -0.3 (0.6) -0.7 (1.0) -0.3 (0.9) -0.3 (0.9)
Digits backward, mean (SD)
Time 1 0.1 (0.7) -0.4 (0.7) 0.2 (1.0) 0.0 (0.9)
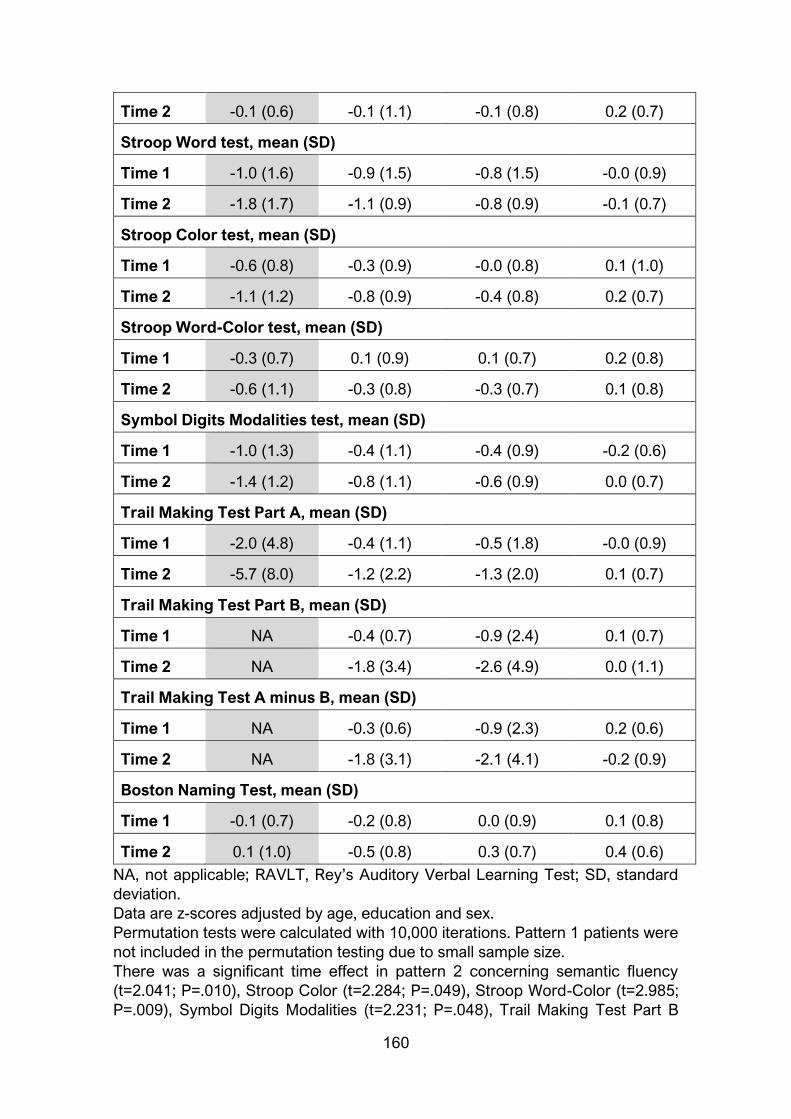
160
Time 2 -0.1 (0.6) -0.1 (1.1) -0.1 (0.8) 0.2 (0.7)
Stroop Word test, mean (SD)
Time 1 -1.0 (1.6) -0.9 (1.5) -0.8 (1.5) -0.0 (0.9)
Time 2 -1.8 (1.7) -1.1 (0.9) -0.8 (0.9) -0.1 (0.7)
Stroop Color test, mean (SD)
Time 1 -0.6 (0.8) -0.3 (0.9) -0.0 (0.8) 0.1 (1.0)
Time 2 -1.1 (1.2) -0.8 (0.9) -0.4 (0.8) 0.2 (0.7)
Stroop Word-Color test, mean (SD)
Time 1 -0.3 (0.7) 0.1 (0.9) 0.1 (0.7) 0.2 (0.8)
Time 2 -0.6 (1.1) -0.3 (0.8) -0.3 (0.7) 0.1 (0.8)
Symbol Digits Modalities test, mean (SD)
Time 1 -1.0 (1.3) -0.4 (1.1) -0.4 (0.9) -0.2 (0.6)
Time 2 -1.4 (1.2) -0.8 (1.1) -0.6 (0.9) 0.0 (0.7)
Trail Making Test Part A, mean (SD)
Time 1 -2.0 (4.8) -0.4 (1.1) -0.5 (1.8) -0.0 (0.9)
Time 2 -5.7 (8.0) -1.2 (2.2) -1.3 (2.0) 0.1 (0.7)
Trail Making Test Part B, mean (SD)
Time 1 NA -0.4 (0.7) -0.9 (2.4) 0.1 (0.7)
Time 2 NA -1.8 (3.4) -2.6 (4.9) 0.0 (1.1)
Trail Making Test A minus B, mean (SD)
Time 1 NA -0.3 (0.6) -0.9 (2.3) 0.2 (0.6)
Time 2 NA -1.8 (3.1) -2.1 (4.1) -0.2 (0.9)
Boston Naming Test, mean (SD)
Time 1 -0.1 (0.7) -0.2 (0.8) 0.0 (0.9) 0.1 (0.8)
Time 2 0.1 (1.0) -0.5 (0.8) 0.3 (0.7) 0.4 (0.6)
NA, not applicable; RAVLT, Rey’s Auditory Verbal Learning Test; SD, standard
deviation.
Data are z-scores adjusted by age, education and sex.
Permutation tests were calculated with 10,000 iterations. Pattern 1 patients were
not included in the permutation testing due to small sample size.
There was a significant time effect in pattern 2 concerning semantic fluency
(t=2.041; P=.010), Stroop Color (t=2.284; P=.049), Stroop Word-Color (t=2.985;
P=.009), Symbol Digits Modalities (t=2.231; P=.048), Trail Making Test Part B

161
(t=2.188; P=.029) and Part A minus B (t=2.545; P=0.001). There was a trend
between pattern 2 and controls in Stroop Color (t=2.182; P=.058) and there was
significant group effect in Symbol Digits Modalities (t=2.639; P=.018).
There was a significant time effect in pattern 3 concerning semantic fluency
(t=2.592; P=.029), Stroop Word-Color (t=2.970; P=.001), Symbol Digits Modalities
(t=1.728; P=.006), Trail Making Test Part A (t=3.390; P=.004), Part B (t=2.775;
P=.005) and A minus B (t=2.192; P=.059). There were significant differences
between pattern 3 and HC in Symbol Digits Modalities (t=2.218; P=.008), Trail
Making Test Part A (t=2.615; P=.032) and Part B (t=1.826; P=.030).
There was a significant time effect in controls in Trail Making Test A minus B
(t=0.709; P=.0.054).
Supplementary Table 2 Proportion of mild cognitive impairment or PD
dementia converters within groups
Parkinson's disease subtypes healthy
controls
(n=22) Pattern 1
(n=7)
Pattern 2
(n=16)
Pattern 3
(n=22)
converters, n (%) 4 (57.1) 4 (25.0) 6 (27.3) 1 (4.5)
no-converters, n
(%)
3 (42.9) 12 (75.0) 16 (72.7) 21
(95.5)
Chi squared test between all groups was 9.262; P=.026. Chi squared test between
PD groups was 2.643; P=.267.
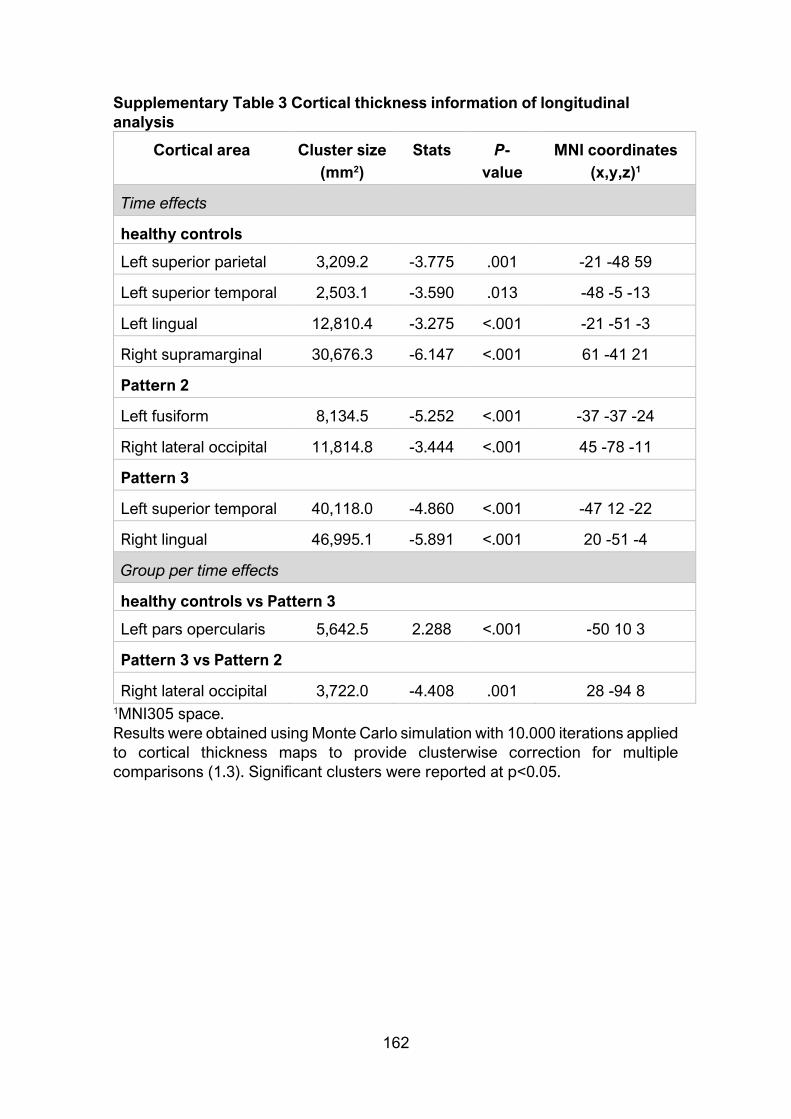
162
Supplementary Table 3 Cortical thickness information of longitudinal
analysis
Cortical area Cluster size
(mm2)
Stats P-
value
MNI coordinates
(x,y,z)1
Time effects
healthy controls
Left superior parietal 3,209.2 -3.775 .001 -21 -48 59
Left superior temporal 2,503.1 -3.590 .013 -48 -5 -13
Left lingual 12,810.4 -3.275 <.001 -21 -51 -3
Right supramarginal 30,676.3 -6.147 <.001 61 -41 21
Pattern 2
Left fusiform 8,134.5 -5.252 <.001 -37 -37 -24
Right lateral occipital 11,814.8 -3.444 <.001 45 -78 -11
Pattern 3
Left superior temporal 40,118.0 -4.860 <.001 -47 12 -22
Right lingual 46,995.1 -5.891 <.001 20 -51 -4
Group per time effects
healthy controls vs Pattern 3
Left pars opercularis 5,642.5 2.288 <.001 -50 10 3
Pattern 3 vs Pattern 2
Right lateral occipital 3,722.0 -4.408 .001 28 -94 8 1MNI305 space.
Results were obtained using Monte Carlo simulation with 10.000 iterations applied
to cortical thickness maps to provide clusterwise correction for multiple
comparisons (1.3). Significant clusters were reported at p<0.05.

163
Supplementary Table 4 Global atrophy measures
Parkinson's disease subtypes healthy
controls
(n=22) Pattern 1
(n=6) *
Pattern 2
(n=16)
Pattern 3
(n=22)
Mean thickness, mm, mean (SD)
Time 1 2.4 (0.1) 2.4 (0.1) 2.5 (0.1) 2.5 (0.7)
Time 2 2.4 (0.2) 2.4 (0.1) 2.4 (0.2) 2.5 (0.1)
Lateral ventricles, mm3, mean (SD)
Time 1 13,794.3
(7,381.0)
10,731.0
(4,664.2)
11,273.2
(6,970.8)
9,359.2
(4,167.1)
Time2 17,815.2
(9,865.6)
12,397.3
(5,857.7)
13,029.1
(7,903.5)
11,009.1
(4,837.8)
Total gray matter, mm3, mean (SD)
Time 1 412,884.6
(26,132.0)
457,530.6
(42,379.1)
435,619.7
(49,877.4)
442,086.2
(31,781.1)
Time 2 408,021.3
(35,260.5)
453,746.1
(46,130.0)
421,838.7
(49,118.0)
434,227.8
(33,086.1)
Cortical gray matter, mm3, mean (SD)
Time 1 591,136.9
(42,135.8)
642,346.8
(52,725.5)
605,341.1
(67,393.5)
612,253.5
(44,795.3)
Time 2 581,585.6
(55,598.3)
636,953.8
(57,142.7)
587,168.3
(59,403.5)
599,098.0
(45,617.0)
Subcortical gray matter, mm3, mean (SD)
Time 1 178,252.3
(17,724.7)
184,816.3
(17,956.6)
169,721.5
(22,292.9)
170,167.4
(19,916.5)
Time 2 173,564.3
(21,207.5)
183,207.7
(13,614.8)
165,329.6
(15,479.9)
164,870.2
(17,891.0)
* one PD patient was excluded due to motion artifacts.
SD, standard deviation.
Permutation tests were calculated with 10,000 iterations.
Pattern 1 patients were not included in the permutation testing due to small
sample size.
There were significant time effects in total gray matter (pattern 2: t=3.226; P=.018;
pattern 3: t=6.412; P<.001; controls: t=3.228; P=.005), in cortical gray matter
(pattern 3: t=4.969; P<.001; controls: t=2.476; P=.032) and in subcortical gray
matter (pattern 2: t=2.674; P=.053). There was an interaction group x time

164
between pattern 2 and pattern 3 patients in lateral ventricles (t=-2.827; P=.008),
total gray matter (t=3.124; P=.003) and cortical gray matter (t=3.027; P=.004)
volumes.

165
Supplementary Table 5 Demographical and clinical characteristics of
completers and non-completers
Parkinson’s Disease subtypes healthy
controls
Pattern1 Pattern2 Pattern3
Age, y, median (IQ range)
completers 76.0 (18.0) 57.5(13.0) 63.0 (10.0) 66.0 (13.0)
non-
completers 73.0 (13.0) 64.0 (19.0) 66.0 (11.0) 65.0 (18.0)
Education, y, median (IQ range)
completers 8.0 (6.0) 17.5 (8.0) 10.5 (6.0) 10.0 (8.0)
non-
completers 7.0 (5.0) 9.0 (8.0) 10.0 (5.0) 9.0 (8.0)
Sex, male, n (%)
completers 6 (86.7) 13 (81.3) 12 (54.5) 11 (50.0)
non-
completers 9 (39.1) 7 (53.8) 4 (57.1) 5 (55.6)
Mini Mental State Examination, median (IQ range)
completers 29.0 (4.0) 30.0 (1.0) 30.0 (1.0) 30.0 (0.0)
non-
completers 29.0 (2.0) 29.0 (1.0) 30.0 (1.0) 29.0 (1.0)
Disease duration, y, median (IQ range)
completers 4.0 (7.0) 6.0 (8.3) 6.0 (8.5) NA
non-
completers 9.0 (12.0) 8.0 (9.0) 5.0 (11.0) NA
Age of onset, y, median (IQ range)
completers 67.0 (19.0) 47.5 (14.6) 54.5 (12.8) NA
non-
completers 63.0 (22.0) 55.0 (12.5) 61.0 (21.0) NA
UPDRS part III, median (IQ range)
completers 13.0 (12.0) 12.0 (20.0) 11.5 (14) NA
non-
completers 17.0 (13.0) 12.0 (16.0) 15.0 (3.0) NA

166
Hoehn&Yahr stage, n 1/1.5/2/2.5/3
completers 2/0/5/0/0 5/1/7/2/1 11/0/8/1/2 NA
non-
completers 0/3/11/4/5 4/1/6/1/1 0/0/6/1/1 NA
LEDD, mg, median (IQ range)
completers 400.0 (450.0) 800.0
(1150.0) 485.0 (639.0) NA
non-
completers 780.0 (580.0)
1,000.0
(1,035.0)
1,033.0
(1,007.0) NA
Beck Depression Inventory II, median (IQ range)
completers 14.0 (6.0) 5.0 (7.0) 8.0 (5.0) 6.0 (9.0)
non-
completers 15.5 (9.0) 11.5 (11.0) 7.0 (12.0) 2.0 (8.0)
Starkstein’s Apathy Scale, median (IQ range)
completers 17.0 (12.0) 8.0(11.0) 10.0 (10.0) 10.0 (11.0)
non-
completers 14.0 (14.0) 13.5 (13.0) 11.0 (9.0) 9.0 (4.0)
Cummings’ Neuropsychiatric Inventory, median (IQ range)
completers 2.0 (26.0) 2.5 (6.0) 4.0 (9.0) 0.0 (3.0)
non-
completers 3.5 (9.0) 1.0 (5.0) 7.0 (9.0) 0.0 (0.0)
MCI at time 1, n (%)
completers 3 (42.9) 6 (37.5) 7 (31.8) NA
non-
completers 17 (73.9) 8 (61.5) 4 (57.1) NA
IQ range, Interquartil range; LEDD, L dopa equivalent daily dose; MCI, mild
cognitive impairment;NA, not applicable; UPDRS part III, Unified Parkinson’s
Disease Rating Scale motor section.
Mann-Whitney pairwise test for continuous variables and chi-squared test for
categorical variables were calculated.
There were significant differences between completers and non-completers of
pattern 1 in sex (chi=4.658; P=.031) and Hoehn & Yahr stage (chi=10.784;
P=.029). There were significant differences between completers and non-
completers of pattern 2 in education (U=40.500; P=.004), Mini Mental State
Examination (U=58.500; P=.045) and Beck Depression Inventory-II (U=108.000;

167
P=.026). There were significant differences between completers and non-
completers of pattern 3 in LEDD (U=122.000; P=.021).
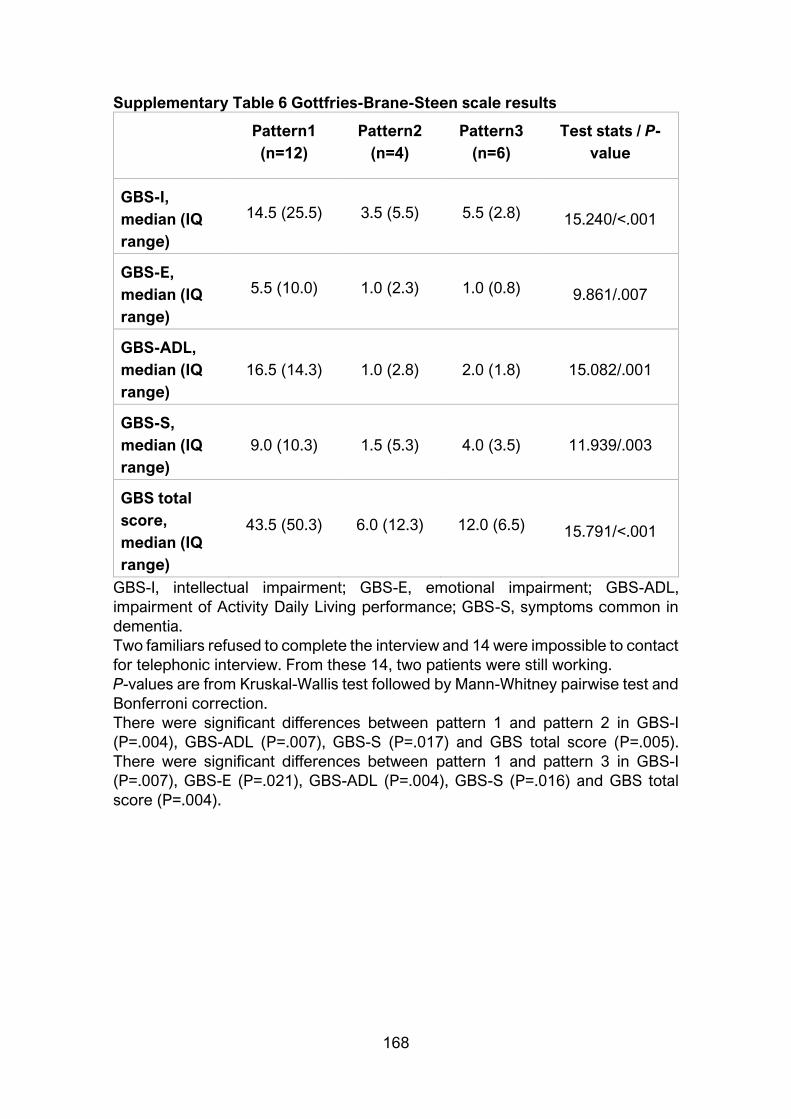
168
Supplementary Table 6 Gottfries-Brane-Steen scale results
Pattern1
(n=12)
Pattern2
(n=4)
Pattern3
(n=6)
Test stats / P-
value
GBS-I,
median (IQ
range)
14.5 (25.5) 3.5 (5.5) 5.5 (2.8) 15.240/<.001
GBS-E,
median (IQ
range)
5.5 (10.0) 1.0 (2.3) 1.0 (0.8) 9.861/.007
GBS-ADL,
median (IQ
range)
16.5 (14.3) 1.0 (2.8) 2.0 (1.8) 15.082/.001
GBS-S,
median (IQ
range)
9.0 (10.3) 1.5 (5.3) 4.0 (3.5) 11.939/.003
GBS total
score,
median (IQ
range)
43.5 (50.3) 6.0 (12.3) 12.0 (6.5) 15.791/<.001
GBS-I, intellectual impairment; GBS-E, emotional impairment; GBS-ADL,
impairment of Activity Daily Living performance; GBS-S, symptoms common in
dementia.
Two familiars refused to complete the interview and 14 were impossible to contact
for telephonic interview. From these 14, two patients were still working.
P-values are from Kruskal-Wallis test followed by Mann-Whitney pairwise test and
Bonferroni correction.
There were significant differences between pattern 1 and pattern 2 in GBS-I
(P=.004), GBS-ADL (P=.007), GBS-S (P=.017) and GBS total score (P=.005).
There were significant differences between pattern 1 and pattern 3 in GBS-I
(P=.007), GBS-E (P=.021), GBS-ADL (P=.004), GBS-S (P=.016) and GBS total
score (P=.004).
169
Chapter 5
Discussion The present thesis aimed to identify different patterns of brain atrophy in PD
patients at different stages of the disease from a data-driven approach. Distinct
regional atrophy would contribute differently to clinical manifestations such as
cognitive impairment. Moreover, we were interested in following the progression
of the described patterns over time in order to identify which cerebral pattern was
a better predictor of progression to dementia.
The regional patterns of atrophy identified via cluster analysis will be discussed:
firstly, concerning the de novo PD sample (Study 2) and secondly results from
the medicated PD sample (Study 1) with its correspondent longitudinal follow-up
(Study 3). Such organization, despite the anachronism, follows a temporal
continuum of the disease evolution. Posteriorly, clinical manifestations with
special emphasis to cognitive profiles will be commented, and the possible
neuropathological underpinnings of the described patterns. At last but not the
least, methodological strengths and limitations of the cluster analysis technique
will be discussed.
PD cortical atrophy patterns
Two patterns of cortical atrophy were identified in the early drug-naïve sample of
PD patients (Study 2): 1) one with orbitofrontal involvement, anterior cingulate
and temporal atrophy and 2) a second involving occipital and parietal atrophy. In
the medicated PD sample (Study 1), we found: 1) a pattern mainly involving
parietal and temporal atrophy; 2) a second pattern with frontal and occipital
atrophy and finally, 3) a third group of patients that did not have any overt atrophy
compared with controls of similar age.
The atrophic groups identified were not identical between the two samples. As
hypothesized, the de novo PD sample had more specific focal atrophy than the
medicated PD sample, where the two first patterns showed wider extension of
cortical thinning in temporal, parietal and occipital lobes as well as in the
prefrontal cortex. In Study 1, the 2- and 3-cluster solutions were reported while
in Study 2 the 2-cluster solution was the most optimal classification.
Cortical thickness comparisons between patterns confirmed the differences
found when comparing them with controls. In Study 2 (de novo sample), there
was clearly a differentiation between the anterior predominant pattern 1 and the
posterior atrophy reported in pattern 2 patients. In Study 1 (medicated sample),
170
the posterior/anterior regional thinning observed in the patterned patients in
comparison with healthy controls was also seen between them.
PD de novo regional patterns
Orbitofrontal involvement in de novo PD patients (i.e., newly diagnosed drug
naïve) has not been previously described. Preserved cerebral blood flow through
arterial spin labeling (ASL) was reported in the right prefrontal cortex whereas
reduced precuneus perfusion and cortical thinning in parietal regions took place
(Madhyastha et al., 2015) in early staged PD patients (i.e., disease onset < 5
years). In the same line, in a pooled sample of early-to-moderate PD patients ASL
hypoperfusion was found in posterior regions ranging from the occipital cortex,
through the superior parietal and the superior frontal cortex but not in the
prefrontal cortex (Fernández-Seara et al., 2012). Nevertheless, such orbital
atrophy has been recently reported in early staged patients (i.e., disease onset <
5 years) when comparing them with controls (Wilson et al., 2019), and in PD-MCI
newly-diagnosed patients at an uncorrected threshold (S. W. Noh et al., 2014).
In Study 2, pattern 1 de novo patients had orbitofrontal thinning extending to the
anterior cingulate and also anterior temporal thinning compared with controls. It
would be interesting to follow-up these patients to see if they have any memory
progressive decline, although at the time of diagnosis they did not differ in any
neuropsychological tests from controls or pattern 2 patients. Indeed, worsened
neuropsychological performance has been mainly linked to the medial temporal
cortex (Squire et al., 2004) and not to lateral parts.
More remarkably, the de novo PD sample (Study 2) had occipital involvement in
pattern 2 patients. To the best of our knowledge, such atrophy has not been
previously reported at this early stage of the disease. Indeed, PD-MCI de novo
patients had medial occipital-temporal thinning in the left lingual compared with
controls but no primary order visual regions was observed (Pereira et al., 2014).
This finding is very interesting since regional lateral occipital thinning could
underlie the color deficits described in prodromal stages of PD such as REM sleep
behavior disorders (Postuma et al., 2015). In addition to the occipital thinning,
pattern 2 patients also showed lateral parietal atrophy. Similar parietal thinning
has been reported in de novo PD-MCI patients (Pereira et al., 2014).
PD medicated regional patterns
In Study 1 with more advanced medicated PD patients, pattern 2 patients
presented a cortical thinning pattern involving the medial orbitofrontal cortex and
rostral middle frontal areas.
Prefrontal and occipital hypometabolism using PET MRI techniques have been
described in advanced PD patients of more than 10 years of disease evolution
(Garcia-Garcia et al., 2012; González-Redondo et al., 2014; Huang et al., 2007).
171
Reduced 18F-fluorodeoxyglucose (FDG)-PET uptake was reported in PD-MCI and
PDD patients in bilateral orbitofrontal areas extending to other regions of the
prefrontal cortex (Garcia-Garcia et al., 2012; González-Redondo et al., 2014).
Hypometabolism in the orbital gyrus was accompanied of GM atrophy in the
demented PD but not in PD-MCI patients (González-Redondo et al., 2014). The
authors suggested that GM atrophy and hypometabolism are two steps of the
same process. Firstly, a reduction on the cortical glucose uptake would take place
in the orbitofrontal cortex evolving to a reduction in GM volume (González-
Redondo et al., 2014). Thus, it would possibly explain why cortical atrophy has
not been found in previous studies of non-demented patients using structural MRI
techniques such as VBM (González-Redondo et al., 2014; Pereira et al., 2012) or
cortical thickness (Pereira et al., 2014, 2012; Segura et al., 2014).
Contrarily to the focal degeneration described in the de novo patients, this pattern
also displayed distinct occipital thinning in the cuneus and the lateral occipital and
lateral inferior and superior parietal thinning similar to the hypometabolism
pattern previously described in PD-MCI (Garcia-Garcia et al., 2012) and
demented PD patients (González-Redondo et al., 2014). GM volume reductions
in lateral occipital, fusiform and lateral orbitofrontal have been recently reported
to be predictors of cognitive impairment in the de novo PPMI sample over 3-years
follow-up (Caspell-Garcia et al., 2017). Indeed, lateral occipital atrophy would be
linked to cognitive impairment in PD (Segura et al., 2014). Pattern 2 patients of
Study 1 did not differentiate from the other two patterns in the proportion of MCI
although they showed worse visuospatial, speed processing, working memory
and attention performance when compared with controls.
Pattern 1 patients (Study 1) displayed distinctive medial temporal thinning in
comparison with HC. Lateral and medial temporal lobe atrophy has been reported
in PD-MCI patients (Danti et al., 2015; Garcia-Diaz et al., 2018; Kunst et al., 2019;
Pereira et al., 2014; Segura et al., 2014) and PDD patients (Burton et al., 2004;
Tam et al., 2005). Indeed, higher Lewy body densities in the temporal lobe is a
marker of PDD patients (Halliday et al., 2014; Harding and Halliday, 2001).
Patients grouped in Pattern 1 and 2 in Study 1 presented parietal atrophy. Such
atrophy has been previously described in PD-MCI de novo (Pereira et al., 2014)
and medicated (Segura et al., 2014) patients. Indeed, differences between
cognitively preserved and PD-MCI patients were found in the medial parietal
cortex located in the cuneus (Garcia-Diaz et al., 2018; Pereira et al., 2014; Segura
et al., 2014) and laterally in the supramarginal (Garcia-Diaz et al., 2018; Segura
et al., 2014) and both the superior (Garcia-Diaz et al., 2018) and inferior (Danti et
al., 2015) parietal gyri. The main difference between pattern 1 and 2 patients
concerning the parietal lobe is that the pattern 1 group had more widespread
atrophy, especially in middle regions that extended to the middle temporal lobe.
On the other hand, the parietal contribution in pattern 2 patients was mainly
172
lateral, extending from the occipital thinning previously described through the
superior parietal cortex.
From the prospective longitudinal Study 3, cortical thickness revealed sensitive
to time effects among the PD patterned patients and in normal aging. Over four
years, pattern 2 and 3 patients and controls had cortical thinning mainly in parieto-
temporal regions, as well as global gray matter atrophy.
Patterned 2 patients, initially identified as the frontal and occipital atrophy pattern,
showed focal increases in the symmetrized percent of change of cortical thinning
measures mainly in temporal and occipital lobe and posterior cingulate gyrus.
Such progressive atrophy was consistent with the cognitive evolution that PD
patients suffered.
Non-atrophic patients, a distinct subtype?
In PD, it has been reported no manifest brain atrophy in cognitively normal
patients (Garcia-Diaz et al., 2018) or modest results (Hanganu et al., 2013) with
significant small cluster sizes over the cortical mantle (S. W. Noh et al., 2014;
Pagonabarraga et al., 2013), especially in early (Tessa et al., 2014) PD patients
when comparing them with age-matched controls.
In Study 1 using the medicated sample, we described a third pattern of non-
atrophic patients when they were compared with a group of similar age and
education. The lack of regional cortical thinning in this PD subgroup does not
mean patients had no brain atrophy at all. Indeed, patients were compared with a
group of controls with similar ages and years of education. This means that, at
least, pattern 3 patients did not have further cortical degeneration associated to
PD at baseline and that they followed a normal aging pattern. The lack of
differences in PD patients’ pattern 3 with aged healthy control participants could
be due to the actual existence of a specific subgroup that is called the benign
tremulous subtype, introduced in the first section of the present thesis.
Unfortunately, in Study 1 we did not calculated the motor phenotypes of the
patients; and UPDRS-III total scores as well as L-DOPA doses as measures of
motor severity alongside with the disease duration did not differed from the other
two patients’ groups.
At the 2-cluster level solution in Study 1, non-atrophic PD patients (pattern 3)
were grouped with patients showing frontal and occipital thinning. Our data-
driven free-hypothesis results could partially overlap the dual syndrome
hypothesis. Pattern 2 patients alongside with patients in Pattern 3 would have
mainly fronto-striatal involvement, suggesting a more benign form of PD.
Surprisingly, we did not find a non-atrophic group of de novo PD patients in Study
2 as we could expect to be more prevalent at early stages of the diagnosis than

173
in more advanced PD. This non-finding would be in contrast with the benign
subtype, since all patients at the time of diagnosis show specific non-aging related
neocortical atrophy. The differences found between patterns in Study 1 and 2
could also be possibly explained due to methodological differences between both
studies, which will be discussed in a posterior section.
Longitudinally, pattern 3 and healthy controls that initially were identified as the
less atrophic groups in Study 1, they showed an extensive cortical thinning effect
in bilateral parietal and temporal regions. This time effect in pattern 3 was similar
to cortical atrophy previously detected in pattern 1 at baseline.
Group comparisons of the symmetrized percent of cortical thickness change
showed that pattern 3 patients had greater cortical degeneration compared with
healthy controls and pattern 2, in spite of the absence of manifest atrophy at
baseline. After a four-year period, pattern 3 patients differed from normal aging
in right frontal lobe and showed higher symmetrized percent of change in the left
occipital lobe than pattern 2 PD patients that already showed atrophy in this
region at baseline. As introduced in this thesis and discussed above, occipital
thinning compared to controls has been observed in cross-sectional (Burton et
al., 2004) and longitudinal studies in demented PD patients (Ramírez-Ruiz et al.,
2005), in PD-MCI (Hanganu et al., 2014) and in PD with visual hallucinations
(Goldman et al., 2014; Ramírez-Ruiz et al., 2007). However, these studies also
reported more widespread atrophy including other lobes.
Global atrophy measures also revealed higher volume decrements in pattern 3
patients than in pattern 2, as well as increased ventricular enlargement. Previous
literature has reported an association between global atrophy measures
(Apostolova et al., 2012; Burton et al., 2005) with cognitive impairment. However,
the proportion of MCI was not significantly different between pattern 2 and 3.
From the prospective four-years follow-up we can conclude that pattern 3 patients
did not follow a benign course of the disease. In fact, such PD pattern depicted a
similar cortical progression than normal aging but with the presence of PD-related
features.
Clinical manifestations underlying neuroanatomical correlates
In Study 1 of unmedicated patients, pattern 2 patients were younger at the
disease onset than pattern 1 and 3 patients. In addition, pattern 1 patients were
less educated than controls and pattern 2 patients and the oldest among the PD
subgroups. These demographical differences could partially explain the greater
extent of atrophy observed in pattern 1 patients. For this reason, in all statistical
group comparison analyses age and education were considered as variables of
no interest. Based on previous findings, age would substantially contribute to PD

174
degeneration (Williams-Gray et al., 2009a), although pattern 3 patients with no
overt atrophy would be expected to be the youngest. At baseline, medicated
pattern 2 patients were initially younger, with higher education and younger age
at onset, probably as indicators of better prognosis. In the longitudinal Study 3,
patients from pattern 2 who dropped out of the study had less years of education,
more global cognitive impairment and had more depressive symptoms. Thus,
patients from pattern 2 who completed the follow-up assessment probably
represent a PD group with better progression of these disease aspects.
Despite the different patterns of regional thinning described in PD patients,
patterned groups in Study 1 (medicated patients) did not differentiate in their
motor severity. Instead, in Study 2 (de novo patients), pattern 2 patients had more
severe motor impairment than pattern 1 patients although patients did not show
motor phenotypical differences. We would expect that pattern 2 de novo patients
would show a greater proportion of PIGD subtype as they also showed worse
cognitive performance. However, the instability of motor-feature diagnosis in the
first year of the disease might explain the lack of a motor predominance between
patterns (Simuni et al., 2016).
We would also expect an increased proportion of patients with visual
hallucinations in medicated pattern 2 patients as previous GM volume
decrements (Ramírez-Ruiz et al., 2007) and activity reductions (Meppelink et al.,
2009) have been reported in occipital regions. Similarly, the proportion of PD-MCI
patients was not different between PD subgroups. In spite of that, we did find
some neuropsychological distinct characteristics between patterns. Overall, we
found that in both studies the patterns with the more widespread posterior-
dominant atrophy had the worse cognitive performance.
In Study 1, medicated pattern 1 and 2 patients had worse visuospatial
performance than controls. Specifically, pattern 1 patients showed manifest
impairment in the VFD and the JLO tests whereas pattern 2 patients only had
significant worse performance in the JLO test. Previous neuroanatomical
correlates on VFD have linked a worse performance to thinning in posterior
middle temporal regions and JLO to thinning in temporal and parietal regions
(Garcia-Diaz et al., 2018). Such correlates partially overlap the cortical thinning
observed in our patterned groups. Additionally, SDMT worse performance was
observed in both pattern 1 and 2 groups in Study 1 and in pattern 2 patients of
Study 2. SDMT has been found to be a suitable marker of lateral temporal and
parietal regions (Garcia-Diaz et al., 2018). Overall, neuropsychological posterior
cortical-based instruments have been reported to be markers of the risk to
dementia (Williams-Gray et al., 2009a).
On the other hand, the orbital pattern described in the de novo sample did not
show any specific neuropsychological deficit, although global cognition scores
175
were lower than controls performance. Most of the studies that have investigated
the structural MRI correlates associated to PD have divided the patients
according to their cognitive outcome either in de novo patients (Danti et al., 2015;
Pereira et al., 2014), early staged patients (Hanganu et al., 2013) and in more
advanced staged patients (Pagonabarraga et al., 2013; Segura et al., 2014)
including PET studies (Garcia-Garcia et al., 2012; González-Redondo et al., 2014;
Huang et al., 2007). However, PD-MCI diagnostic criteria have never included
specific tools sensitive to the orbital function. Indeed, the prefrontal cortex has
always been assessed non-specifically using the classical neuropsychological
tests that supported the classical hypotheses of the frontostriatal cognitive deficits
in PD (Dubois and Pillon, 1997). In Study 1 (medicated sample) we found specific
facial emotion recognition deficits in pattern 2 patients supporting previous
findings of the bilateral orbital gyrus as neural correlate of facial emotion
recognition (Ibarretxe-Bilbao et al., 2009).
In our results, we found specific memory deficits associated to posterior cortical
involvement (Study 1 and 2) and medial temporal atrophy (only in Study 1).
Memory impairment and semantic fluency deficits have been postulated as
markers of progression to dementia (Levy et al., 2002; Williams-Gray et al., 2009a,
2007). Indeed, both cognitive performances are thought to be related to the
temporal lobe functioning (Henry and Crawford, 2004; Squire et al., 2004).
In Study 1, although neither the proportion of PD-MCI nor the proportion of
memory impairment significantly differed from other patterns; pattern 1 patients
had the worse verbal memory performance in both RAVLT total learning and
delayed recall tests that significantly differed from that observed in controls. This
patients’ subgroup presented middle temporal atrophy including the
parahippocampal gyrus. Regional thinning in temporal regions was not observed
in the posterior-based pattern 2 patients of the de novo sample. In that case, we
found a predominant regional thinning in posterior regions including the parietal
and occipital lobes and these patterned patients showed worse memory
performance than the controls group.
The non-atrophic medicated PD subgroup described in Study 1 had similar
cognitive profile to that observed in the other PD subgroups, although only
performance in Stroop words test significantly differed from controls
performance. These results are in line with previous cluster analysis works that
reported a cluster of PD patients with no manifest MCI although with lowered
speed processing (Dujardin et al., 2013).
176
Clinical progression of the patterns
Patients in pattern 1 with initial extensive parieto-temporal atrophy (Study 1)
showed a higher attrition rate and for that reason they were not included in the
quantitative MRI analyses (Study 3). This group showed higher severity of motor
symptoms measured by the H&Y scale at baseline, more ADL, and more cognitive
impairment assessed by telephone interview at follow-up. Previous longitudinal
studies also reported that patients who were lost to follow-up were older, had
higher age at disease onset, more axial impairment, scored higher on H&Y and
showed higher percentage of PD dementia (Broeders et al., 2013b). Considering
the initial sample, we estimated that 15% of PD patients converted to dementia
during the follow-up period. This percentage was similar to other population-
based studies (Broeders et al., 2013a, 2013b; Mahieux et al., 1998; Williams-Gray
et al., 2009a).
Regarding the cognitive evolution of the PD patients, our results identified that
semantic fluency, TMT, SDMT and Stroop tests were sensitive to time effect. This
result agrees with previous findings in longitudinal studies showing processing
speed impairment in PD over time assessed by Digit Symbol Test and TMTA
(Broeders et al., 2013b; Muslimović et al., 2009). Contrarily to the expected
results accounted by aging effects, we did not find memory decline. This could
be due to a test-retest effect. In favor of this interpretation, we can see that,
although non-significant, the healthy control group showed a slight increase in
their performance. Other longitudinal studies reported memory loss but the follow
up was longer (Broeders et al., 2013b; Muslimović et al., 2007).
After four years, patients from patterns 2 and 3 showed reduced semantic fluency
performance. At baseline, semantic fluency test differentiated the parieto-
temporal pattern (pattern 1) from other PD subtypes. In light of our new findings,
such worsened performance could be related to the progressive posterior parietal
and temporal thinning observed in PD.
Heterogeneity in PD: a matter of time or distinct
symptomatologic entities?
Two possible theories concerning the disease subtypes have been recently
proposed (Fereshtehnejad and Postuma, 2017). PD could be a single entity with
all patients having the same brain degeneration but with different slopes of
progression or, there is no uniform disease progression and patients can
progress over time in different ways. These authors have demonstrated that even
in de novo PD patients (from the PPMI database, like Study 2 patients sample),
there exists a diffuse-malignant subtype that showed different symptomatology
(Fereshtehnejad et al., 2017).
177
The first two studies that compose the present thesis aimed to subtype PD
patients in two different stages of the disease progression. Based on our results,
we can hypothesize that at the very moment of the PD diagnosis, there already
exist at least two distinct patterns of cortical progression regardless the
dopaminergic effects. These two subtypes, although they share some common
regional atrophy, they represent two distinct patterns of cortical degeneration,
regardless PD-MCI diagnosis.
In fact, the two patterned atrophic groups of patients would partially be in
accordance of the neurobiological dual syndrome hypothesis (Kehagia et al.,
2012). One group of patients would predominantly manifest prefrontal thinning
already present at the diagnosis (pattern 1, Study 2). In more advanced stages,
thinning would progress to occipital and parietal regions but not in medial parietal
and temporal regions (pattern 2, Study 1). This progression would be
accompanied with a progressive development of impairment in speed
processing, attention and working memory and visuospatial function. This group
of patients would have a better disease evolution and less progressive cortical
atrophy, with modest decrements in temporal and parietal regions and no
significant to the degeneration observed in normal aging.
On the other hand, a second group of patients would have a predominantly
posterior patterned atrophy associated to worse memory and speed processing
performance already present at the time of the diagnosis (pattern 2, Study 2).
This posterior-predominant atrophy would evolve to degeneration of medial and
lateral parietal regions and medial temporal atrophy in turn associated to the
worse performance in neuropsychological evaluation: visuospatial, semantic
fluency and memory impairment (pattern 1, Study 1). Therefore, these patients
would have dopaminergic and non-dopaminergic disturbances that potentially
would evolve to dementia. Patients would eventually evolve to dementia or at
least, they would present a greater compromise of the ADL (pattern 1 patients in
Study 3).
Less certain is the existence of a third group of non-atrophic patients that arise
from the group with prefrontal involvement in Study 1 based on the the 2-cluster
solution. This group follows a similar evolution to normal aged controls but with
progressive atrophy in the prefrontal cortex and worsened performance in
processing speed in comparison with controls progression over time.
From a neurobiological point of view, the pathological meaning of the differences
between the patterns is unclear. As stated in the introduction of the present thesis,
Braak stages (Braak et al., 2006a, 2003) and the synergistic effect between α-
synuclein and amyloid-β deposition in PD are still controversial (Halliday et al.,
2014). Indeed, Braak staging pathology has revealed useful to describe
neuropathological evolution of PD (Jellinger, 2004) although is insufficient in

178
advanced stages (V and VI) of the disease (Jellinger, 2009), especially in
dementia (Jellinger, 2008) and in patients with rapid disease progression
(Halliday et al., 2008). We could speculate that pattern 1 patients in Study 1 could
have abnormal amyloid-β depositions since they showed medial temporal and
parietal atrophy. In normal aging, these regions have been reported as sensitive
to progressive cortical thinning in cognitively preserved Pittsburgh compound B
(PiB) positive participants (Doré et al., 2013).
In the first study, Patterns 1 and 2 medicated patients differed in the degree of
atrophy in the posterior cingulate, isthmus of the cingulate, and precuneus. In this
line, it has been reported that in non-demented PD patients, higher PiB retention
in the precuneus seems to contribute to cognitive decline over time although no
baseline differences were reported between PD-MCI and noMCI patients
(Gomperts et al., 2013). Of high relevance is the temporal atrophy observed
distinctively in Pattern 1 patients of Study 1. Densities in the temporal lobe
differentiated PDD patients from non-demented patients (Halliday et al., 2014;
Harding and Halliday, 2001).
Methodological implications in cluster analysis
Cluster analysis techniques have revealed sensitive for detecting regional cortical
thinning even at early stages of the disease. Indeed, unsupervised machine
learning techniques has allowed us to detect distinct atrophy patterns from a
hypothesis-free data-driven approach at different stages of the disease using
objective imaging data rather than clinical data that is examiner-dependent.
Interest in machine learning techniques has increased with big data management
that can allow training large data sets to predict future outcomes or to group data
sets according to multiple features such as clustering techniques. However,
algorithms perform better when the number of features does not overcome the
number of observations (i.e., subjects in our case). Methodology between Study
1 and 2 was improved to overcome multicollinearity and the curse of
multidimensionality. Multicollinearity is a phenomenon in which one predictor
variable can be linearly predicted from the others (Farrar and Glauber, 1967). The
problem with dimensionality is that when the later increases, the volume of the
space increases so fast that the available data become sparse (Trunk, 1979). In
Study 2, we extracted the means of the recently published atlas from the Human
Connectome Project (Glasser et al., 2016) in order to reduce the three-
dimensionality of the whole-brain vertex-wise approach. Indeed, in Study 1 we
used all vertex information as features of the clustering analysis as previously
described (Y. Noh et al., 2014). However, when we performed the Principal
Component Analysis (PCA) to validate the cluster groups, we did reduce the
matrix. We discarded vertices with values of 0 and vertices that correlated highly
with others. The result was a PCA with 4,150 vertices.

179
The decision of including all vertex-wise information in the clustering was from
the idea of the hypothesis-free data-driven methodology. At that time, we could
not find a well-defined cytoarchitectonic atlas that could allow us to reduce vertex
information without losing too much topographical information. The atlas HCP-
MMP1.0 was published posteriorly to Study 1. For Study 2, we decided to take
advantage of such multi-modal cortical parcellations (Glasser et al., 2016).
Although the data-driven nature of unsupervised methodologies, it is always
important to contrast the findings with the literature state-of-the-art. For this
reason, in Study 1 both 2-level and 3-level cluster solutions were reported, and
patterned groups did make sense with the classical findings in PD. In Study 2, we
only reported the 2-cluster solution given the small number of patients clustered
in the third group. Similarly, in Study 1 the 4-cluster solution was not considered
due to small sample size.
This does not mean that there must exist two patterns of atrophy related to PD
pathology. Indeed, the choice of a hierarchical cluster analysis technique was
based on the lack of preconceived number of possible PD subtypes. Inside the 2-
cluster solution presented in Study 2, there could exist subgroups with more
specific focal atrophy. However, small sample sizes in comparison with the
features prevented us to further characterize subgroups. In fact, in Study 1 the 2-
cluster solution already identified two different patterns: one mainly posterior and
another with an anterior atrophy involvement. Inside pattern 2 (frontal-occipital
thinning) there were two distinct groups: 1) one with a younger onset that mainly
contributed to the prefrontal-occipital thinning observed in pattern 2, and 2) a
third group that was not as young but did not present overt atrophy.
Final remarks
This thesis has helped clarify the heterogeneity of cortical atrophy in non-
demented PD patients at different stages of the disease. The data-driven
hypothesis free approach has contributed to establish distinct patterns of atrophy
that possibly explain the differences found across studies investigating
neuroanatomical correlates in PD cognition and other clinical manifestations. In
addition, we had available the followed-up sample of the medicated PD patients
that, despite the high attrition rate, allowed us to describe the progressive brain
degeneration that took place in the patterned patients over 4 years. Indeed, the
high percentage of dropouts in pattern 1 patients is informative of the worse
prognosis in patients with predominant posterior atrophy. Together all these
findings should help elucidate which PD patients are more likely to evolve to
dementia. For this, longitudinal large-multicentric samples are required.

180
181
Chapter 6
Conclusions From the two cross-sectional studies we can conclude that:
1) In medicated PD patients, three patterns of cortical thinning were
identified. One with prefrontal and occipital predominance, another with
widespread posterior temporo-parieto-occipital atrophy and a third pattern
with similar atrophy to healthy aging subjects. Clinically, the first pattern is
characterized by younger disease onset. Both PD subtypes with cortical
thinning have significant cognitive decline and a similar proportion of PD-
MCI patients. However, the posterior-based pattern is associated with
specific semantic fluency deficits.
2) In newly diagnosed untreated PD patients, cortical thinning is already
present, and two patterns of atrophy were identified. One pattern with
medial orbitofrontal and lateral temporal thinning and another with occipital
and parietal predominance. Cortical thickness differences in comparison
with controls seem to be less extensive and more focal than that observed
in medicated PD patients.
3) Both patterns of de novo PD patients had global cognitive decline.
However, patients with posterior predominance had more severe motor
symptoms; worse verbal memory learning and delayed recall
performance, as well as visuospatial and processing speed deficits.
4) Structural MRI findings based on hypothesis free data-driven
methodologies stress the importance to review neuropsychological tools
for the diagnosis of PD-MCI. Specific orbital function assessment should
be included.
From the longitudinal study we can conclude that:
5) Cortical thinning is an MRI measure sensitive to aging effects and to
specific cortical degeneration in PD. It is observed in all PD patients,
although the three Parkinson’s disease phenotypes identified via clustering
analysis displayed different progressions over time.
6) Initial temporo-parietal atrophy was linked to worsening of functional ADL
and patients were more likely to progress to dementia. In contrast, the
pattern with initial prefrontal and occipital thinning and younger disease
onset was linked to a better disease evolution.
Overall, data-driven analyses are able to classify PD patients according to
patterns of cortical degeneration. Such patterns had clinical and

182
neuropsychological distinct characteristics and different evolution. Thus, PD
prognosis could be characterized by MRI data.
183
Abstract Background and objectives. Parkinson’s disease is a heterogenous
neurodegenerative disorder. To characterize homogeneous groups of PD
patients, PD phenotypes have been described based on clinical data including
motor and non-motor manifestations. This thesis is presented as a compendium
of three research studies. The aim was to identify different PD subtypes based on
objective MRI measures of cortical thickness. We hypothesized that different
patterns of regional brain atrophy would be associated to distinct clinical and
cognitive features.
Methods. We have used T1-weighted MRI images acquired with 3T Siemens
scanners in two sample of PD patients at different times of the disease evolution:
a sample of medicated PD patients (n = 88; disease duration: 8 ± 5.7 years) and
a second sample from the Parkinson Progression Marker Initiative (PPMI,
https://www.ppmi-info.org/) that enrolled 119 PD newly diagnosed drug naïve
patients (n = 77; disease duration: 0.9 ± 1.0 years) with available MRI and
neuropsychological assessments. Additionally, the medicated sample was
followed-up after four years (n = 45). Both PD samples were compared with two
similar groups of healthy elders. Cortical thickness estimation was performed with
the FreeSurfer suite v5.1 (https://surfer.nmr.mgh.harvard.edu/). An agglomerative
hierarchical cluster analysis technique was used to classify patients from a
hypothesis-free data driven approach using Matlab (release 2014b, The
MathWorks, Inc., Natick, Massachusetts). For the longitudinal assessment, we
computed the symmetrized percent of change of the cortical thickness estimation
of both times.
Results. In Study 1, we firstly classified patients of the medicated sample
according to the vertex-wise cortical thickness data. Three patterns of regional
thinning were obtained when comparing them with a sample of healthy controls
with similar age and education: (1) a pattern mainly involving temporal and
parietal atrophy; (2) a second pattern with frontal and occipital and younger age
at disease onset; (3) a third pattern with no manifest atrophy in comparison with
controls and reduced processing speed.
In Study 2, we classified the PD de novo patients according to their cortical
thickness information from the 360 parcellations of the Human Connectome
Project Multi-Modal Parcellation version 1.0. Two PD patterns were identified: (1)
one pattern with anterior predominance including orbitofrontal, anterior cingulate
and temporal atrophy with no cognitive deficits and (2) a posterior-based pattern
with lateral occipital and parietal atrophy with associated verbal memory learning
and delayed recall deficits as well as visuospatial and processing speed
impairment.
In Study 3, we assessed the progression of the cortical patterns identified in Study
1 over four years. Pattern 1 patients with initial temporal and parietal widespread

184
atrophy had worse compromise in the activities of daily living. Regarding the other
two patterns and the controls group, all groups displayed temporo-parietal
progressive decline and reduced processing speed. However, pattern 2 patients
with initial prefrontal involvement and younger disease onset had better evolution
and focal cortical thinning changes. Pattern 3 patients and controls, that at
baseline were the less atrophic groups, displayed extensive symmetrized percent
of change in temporal and parietal regions. Despite the similar progression of
pattern 3 with controls, pattern 3 patients had more atrophy in the prefrontal
cortex over time than controls and more decline in semantic fluency, processing
speed and visuospatial function.
Conclusions. PD patients showed different patterns of cortical thinning even at
the time of diagnosis, regardless the presence of mild cognitive impairment and
medication doses. Our patterned groups of patients based on hypothesis free
data-driven methodologies stress the importance to review neuropsychological
tools for the diagnosis of PD-MCI. Cortical thickness measures of percent of
change revealed sensitive to aging and specific cortical degeneration in PD.
Different regional atrophy patterns progress differently over time. It has been
observed that initial posterior-based atrophy had worse compromise in the
activities of daily living and patients were more likely to progress to dementia,
whereas initial prefrontal involvement is linked to a better clinical evolution.
Overall, data-driven analyses were able to classify PD patients based on their
cortical degeneration depicting distinct clinical manifestations and different
progressions. Thus, PD prognosis can be characterized by structural MRI data.
185
Resum Antecedents i objectius. La malaltia de Parkinson és una malaltia
neurodegenerativa molt heterogènia. Per a caracteritzar grups homogenis de
malalts, s’han descrit fenotips de pacients basats en manifestacions motores i no
motores de la malaltia. Aquesta tesi s’ha elaborat en format de compendi de tres
estudis de recerca. L’objectiu va ser identificar diferents subtipus de malaltia de
Parkinson basat en mesures objectives de gruix cortical (imatge estructural). Vam
hipotetitzar que diferents patrons d’atròfia regional estarien associats a diferents
manifestacions clíniques i cognitives de la malaltia.
Mètodes. S’han utilitzat imatges potenciades en T1 de ressonància magnètica
estructural amb escàners Siemens de 3T en dues mostres de pacients amb
diagnòstic de malaltia de Parkinson en diferents moments evolutius de la malaltia:
una mostra de pacients medicats (n = 88; duració de la malaltia: 8 ± 5.7 anys) i
una segona mostra extreta de Parkinson Progression Marker Initiative (PPMI,
https://www.ppmi-info.org/). Aquesta base de dades pública inclou pacients amb
malaltia de Parkinson recent diagnosticats que encara no prenien medicació
dopaminèrgica per al maneig de la malaltia (n = 77; duració de la malaltia: 0.9 ±
1.0 anys) i que tenien disponibles imatges de ressonància magnètica i avaluació
neuropsicològica. Addicionalment, la mostra de pacients medicats es va seguir
després de quatre anys (n = 45). Les dues mostres de pacients esmentades es
van comparar amb dos grups de controls amb envelliment sa de característiques
demogràfiques similars. L’estimació de gruix cortical es va fer amb el software
FreeSurfer versió 5.1 (https://surfer.nmr.mgh.harvard.edu/). La tècnica de l’anàlisi
de clustering jeràrquic aglomeratiu es va utilitzar per a classificar els pacients des
d’una aproximació lliure d’hipòtesis prèvies i guiat per les pròpies dades. Per a
l’anàlisi longitudinal, vam calcular una mesura de percentatge de canvi simètric
dels valors de gruix cortical en els dos temps.
Resultats. En l’estudi 1, primerament vam classificar els pacients medicats
d’acord amb la informació de cada un dels vèrtexs que conformen el mantell
cortical. Es van obtenir tres patrons d’atròfia regional comparant-los amb la
mostra de controls d’edat i educació similars: (1) un patró amb atròfia
majoritàriament temporal i parietal; (2) un segon patró amb atròfia frontal i
occipital i una edat de debut de la malaltia més precoç; (3) un tercer patró sense
atròfia cerebral diferent als controls envellits sans i una reducció en la velocitat
de processament.
En l’estudi 2, vam classificar els pacients recent diagnosticats i sense medicació
(de novo) segons la informació obtinguda de les mitjanes de les 360
parcel·lacions de l’atles Human Connectome Project Multi-Modal Parcellation
versió 1.0. Es van identificar dos patrons: (1) un patró amb atròfia
predominantment anterior que incloïa regions orbitofrontals, anterior cingulat i
temporals i sense alteracions cognitives i (2) un segon patró de base posterior
186
amb atròfia a l’occipital i el parietal laterals i amb alteracions associades en
l’aprenentatge i el record de la memòria verbal així com en les habilitats viso-
espacials i en la velocitat de processament.
En l’estudi 3, vam valorar la progressió dels patrons corticals identificats en
l’estudi 1 després de quatre anys de progressió. Els pacients classificats en el
patró 1 amb atròfia inicial generalitzada en els lòbuls temporal i parietal van tenir
la major proporció de casos de demència i compromís de les activitats de la vida
diària. En referència als altres dos patrons d’atròfia i al grup de controls, tots els
grups van patir un declivi progressiu en regions temporo-parietals i una reducció
en la velocitat de processament.
No obstant, els pacients classificats en el patró 2 amb atròfia inicial en el còrtex
prefrontal i una edat d’inici de la malaltia més jove, van mostrar la millor evolució
i atròfia focal progressiva al llarg del temps. Els pacients en el patró 3 i els
controls, que en l’estudi 1 primerament van ser descrits com els menys atròfics,
van mostrar atròfia extensa al llarg del temps. Tot i la progressió similar entre
aquests dos últims grups esmentats, els pacients en el patró 3 van patir més
deteriorament en regions del còrtex prefrontal que els controls i en l’occipital
medial en comparació a l’evolució dels pacients en el patró 2. Cognitivament, els
pacients del patró 3 van presentar pitjors puntuacions en fluència semàntica,
velocitat de processament i habilitats viso-espacials al llarg del temps.
Conclusió. Els pacients amb malaltia de Parkinson es poden classificar segons
diferents patrons de gruix cortical fins i tot en el moment del diagnòstic i
independentment de la presència de deteriorament cognitiu lleu i la medicació
dopaminèrgica per al maneig de la malaltia. Els nostres grups de pacients
identificats a partir de dades objectives lliures d’hipòtesis a priori posen de
manifest la rellevància de revisar les eines neuropsicològiques per al diagnòstic
de deteriorament cognitiu en la malaltia de Parkinson. Les mesures de
percentatge de canvi en el gruix cortical es van mostrar sensibles a l’envelliment
sa i també a processos de degeneració cortical específics de la malaltia de
Parkinson. Diferents patrons d’atròfia regional progressen de forma diferent al
llarg del temps. Hem mostrat que els pacients amb una atròfia inicial de base
posterior mostren més compromís en activitats de la vida diària i tendeixen a
evolucionar més probablement cap a demència mentre que una atròfia
inicialment prefrontal va lligada a una millor evolució clínica.
En definitiva, els anàlisis guiats per les dades (data-driven) lliures d’hipòtesis van
ser capaços de classificar pacients amb malaltia de Parkinson en base a la seva
degeneració cerebral, mostrant diferents manifestacions clínics i progressions al
llarg del temps. Per tant, l’evolució de la malaltia es pot caracteritzar a partir de
dades de neuroimatge estructural.

187
Agraïments Són moltes les persones a qui he d’agrair que hagi arribat el temut dia en què em
trobo amb la síndrome del full en blanc, intentant resumir tot el que ha suposat
aquesta etapa. En primer lloc i molt especialment el meu agraïment a les doctores
Carme Junqué i Bàrbara Segura. Aquesta tesi no hauria estat possible sense la
seva infinita professionalitat, paciència i exigència. És un honor haver estat la
vostra doctoranda i no imagino un grup millor on haver-me iniciat en el món de
la recerca. Mil gràcies!
A tot l’equip que ha fet possible la realització dels treballs que conformen aquesta
tesi. A les companyes del CJNeurolab, en especial a les àngels Anna i Àlex amb
qui hem patit mesos interminables d’avaluacions, riures, cafès i congressos.
També a les altres dues Annes, l’Anna G per marcar el camí i a la benjamina Anna
I. A la resta de companys del laboratori, les Lídies, el Pablo, el Kilian, el Dídac, la
Cristina, el David i l’Hugo.
Aquesta tesi tampoc hauria estat possible sense la col·laboració de l’equip de
Neurologia de l’Hospital Clínic, un agraïment especial al Dr Yaroslau Compta per
la seva dedicació. Als companys del CDI de l’hospital, al César i la Gema per les
mil hores de ressonàncies i berenars. I per suposat, moltíssimes gràcies a tots els
participants dels estudis que ens han regalat el seu temps.
Tampoc voldria deixar d’expressar la meva gratitud a la Dr Esther Gómez, pel seu
entusiasme i per comptar sempre amb mi. Ha estat un luxe treballar al seu costat!
També a l’investigador principal del projecte sobre transgènere, el Dr Antonio
Guillamón.
Je voudrais aussi remercier l’équipe du Dr Patrice Péran de l’Inserm de Toulouse
pour m’accueillir pendant mon stage et pour avoir appris de leur savoir-faire.
Voldria agrair a tots els amics i amigues que m’han suportat tots aquests anys.
Als imprescindibles, la Júlia, la Núria i l’Ore i també als que des que vaig arribar
a Barcelona m’han adoptat, el Carlos, el tibi Sergi, la tibi Clàudia i els seus dos
preciosos sols, l’Estefania i l’Adam, l’Edu i la Griselda. També a les companyes
del màster, mis queridas Karla y Lesly, habéis sido mi motivación para llegar a
estas últimas páginas. I a l’Anira, una gran crack i encara millor persona.
Finalmente, a Marta, por su energía inagotable, eskerrik asko!!
Vull agrair també de forma molt especial als meus tiets, la Mercè i el Miquel, que
sempre hi són quan menys se’ls espera però més se’ls necessita. I finalment, a la
meva padrineta Marcel·la i l’Antònia que mantenen viu el record dels qui no hi
són.

188

189
References
Aarsland, D., Andersen, K., Larsen, J.P., Lolk, A., 2003. Prevalence and
Characteristics of Dementia in Parkinson Disease. Arch. Neurol. 60, 387.
https://doi.org/10.1001/archneur.60.3.387
Aarsland, D., Brønnick, K., Larsen, J.P., Tysnes, O.-B., Alves, G., 2009. Cognitive
impairment in incident, untreated parkinson disease: The norwegian
parkwest study. Neurology 72, 1121–1126.
https://doi.org/10.1212/01.wnl.0000338632.00552.cb
Aarsland, D., Kurz, M.W., 2010. The epidemiology of dementia associated with
parkinson’s disease. Brain Pathol. 20, 633–639.
https://doi.org/10.1111/j.1750-3639.2009.00369.x
Aarsland, D., Larsen, J.P., Tandberg, E., Laake, K., 2000. Predictors of nursing
home placement in Parkinson’s disease: A population-based, prospective
study. J. Am. Geriatr. Soc. 48, 938–942. https://doi.org/10.1111/j.1532-
5415.2000.tb06891.x
Aarsland, D., Perry, R., Brown, A., Larsen, J.P., Ballard, C., 2005.
Neuropathology of dementia in Parkinson’s disease: A prospective,
community-based study. Ann. Neurol. 58, 773–776.
https://doi.org/10.1002/ana.20635
Abdi, H., Williams, L.J., 2010. Principal component analysis. Wiley Interdiscip.
Rev. Comput. Stat. 2, 433–459. https://doi.org/10.1002/wics.101
Abós, A., Baggio, H.C., Segura, B., García-Díaz, A.I., Compta, Y., Martí, M.J.,
Valldeoriola, F., Junqué, C., 2017. Discriminating cognitive status in
Parkinson’s disease through functional connectomics and machine
learning. Sci. Rep. 7, 1–13. https://doi.org/10.1038/srep45347
Alves, G., Larsen, J.P., Emre, M., Wentzel-Larsen, T., Aarsland, D., 2006.
Changes in motor subtype and risk for incident dementia in Parkinson’s
disease. Mov. Disord. 21, 1123–1130. https://doi.org/10.1002/mds.20897
Apostolova, L., Alves, G., Hwang, K.S., Babakchanian, S., Bronnick, K.S., Larsen,
J.P., Thompson, P.M., Chou, Y.Y., Tysnes, O.B., Vefring, H.K., Beyer, M.K.,
2012. Hippocampal and ventricular changes in Parkinson’s disease mild
cognitive impairment. Neurobiol. Aging 33, 2113–24.
https://doi.org/10.1016/j.neurobiolaging.2011.06.014
Apostolova, L.G., Beyer, M., Green, A.E., Hwang, K.S., Morra, J.H., Chou, Y.-Y.,
Avedissian, C., Aarsland, D., Janvin, C.C., Larsen, J.P., Cummings, J.L.,
Thompson, P.M., 2010. Hippocampal, caudate, and ventricular changes in
Parkinson’s disease with and without dementia. Mov. Disord. 25, 687–95.
https://doi.org/10.1002/mds.22799
Aquino, C.C., Fox, S.H., 2015. Clinical spectrum of levodopa-induced
complications. Mov. Disord. https://doi.org/10.1002/mds.26125
Armstrong, R.A., 2008. Visual signs and symptoms of Parkinson’s disease:

190
Review. Clin. Exp. Optom. 91, 129–138. https://doi.org/10.1111/j.1444-
0938.2007.00211.x
Ascherio, A., Schwarzschild, M.A., 2016. The epidemiology of Parkinson’s
disease: risk factors and prevention. Lancet Neurol. 15, 1257–1272.
https://doi.org/10.1016/S1474-4422(16)30230-7
Banfield, J.D., Raftery, A.E., 1993. Model-Based Gaussian and Non-Gaussian
Clustering. Biometrics 49, 803. https://doi.org/10.2307/2532201
Barbagallo, G., Caligiuri, M.E., Arabia, G., Cherubini, A., Lupo, A., Nisticò, R.,
Salsone, M., Novellino, F., Morelli, M., Cascini, G.L., Galea, D., Quattrone,
A., 2017. Structural connectivity differences in motor network between
tremor-dominant and nontremor Parkinson’s disease. Hum. Brain Mapp. 38,
4716–4729. https://doi.org/10.1002/hbm.23697
Beck, A.T., Steer, R.A., Brown, G.K., 1996. Manual for the Beck Depression
Inventory. Psychological Corporation, San Antonio, TX.
Bejr‐Kasem, H., Pagonabarraga, J., Martínez‐Horta, S., Sampedro, F., Marín‐Lahoz, J., Horta‐Barba, A., Aracil‐Bolaños, I., Pérez‐Pérez, J., Ángeles Botí,
M., Campolongo, A., Izquierdo, C., Pascual‐Sedano, B., Gómez‐Ansón, B.,
Kulisevsky, J., 2018. Disruption of the default mode network and its intrinsic
functional connectivity underlies minor hallucinations in Parkinson’s
disease. Mov. Disord. mds.27557. https://doi.org/10.1002/mds.27557
Benton, AL, Sivan, AB, Hamsher, K., 1994. Contributions to neuropsychological
assessment. A clinical manual, 2nd ed. New York.
Benton, A.L., Varney, N.R., Hamsher, K.D., 1978. Visuospatial judgment. A
clinical test. Arch. Neurol. 35, 364–367.
Beyer, M.K., Janvin, C.C., Larsen, J.P., Aarsland, D., 2007. A magnetic
resonance imaging study of patients with Parkinson’s disease with mild
cognitive impairment and dementia using voxel-based morphometry. J
Neurol Neurosurg Psychiatry 78, 254–259.
https://doi.org/10.1136/jnnp.2006.093849
Biundo, R., Calabrese, M., Weis, L., Facchini, S., Ricchieri, G., Gallo, P., Antonini,
A., 2013. Anatomical correlates of cognitive functions in early Parkinson’s
disease patients. PLoS One 8, e64222.
https://doi.org/10.1371/journal.pone.0064222
Blashfield, R.K., 1976. Mixture model tests of cluster analysis: Accuracy of four
agglomerative hierarchical methods. Psychol. Bull. 83, 377–388.
https://doi.org/10.1037/0033-2909.83.3.377
Bookstein, F.L., 2001. “Voxel-Based Morphometry” Should Not Be Used with
Imperfectly Registered Images. Neuroimage 14, 1454–1462.
https://doi.org/10.1006/nimg.2001.0770
Braak, H., Del Tredici, K., 2008. Cortico-basal ganglia-cortical circuitry in
Parkinson’s disease reconsidered. Exp. Neurol. 212, 226–229.
https://doi.org/10.1016/j.expneurol.2008.04.001

191
Braak, H., Rüb, U., Del Tredici, K., 2006a. Cognitive decline correlates with
neuropathological stage in Parkinson’s disease. J. Neurol. Sci. 248, 255–
258. https://doi.org/10.1016/j.jns.2006.05.011
Braak, H., Rüb, U., Schultz, C., Del Tredici, K., 2006b. Vulnerability of cortical
neurons to Alzheimer’s and Parkinson’s diseases. J. Alzheimers. Dis. 9, 35–
44.
Braak, H., Tredici, K. Del, Rüb, U., de Vos, R.A., Jansen Steur, E.N., Braak, E.,
2003. Staging of brain pathology related to sporadic Parkinson’s disease.
Neurobiol. Aging 24, 197–211.
Brandt, J., Benedict, R., 2001. The Hopkins Verbal Learning Test – Revised.
Psychological Assessment Resources, Odessa, FL.
Bråne, G., Gottfries, C., Winblad, B., 2001. The Gottfries-Bråne-Steen scale:
Validity, reliability and application in anti-dementia drug trials. Dement.
Geriatr. Cogn. Disord. 12, 1–14. https://doi.org/10.1159/000051230
Broeders, M., de Bie, R.M.A., Velseboer, D.C., Speelman, J.D., Muslimovic, D.,
Schmand, B., 2013a. Evolution of mild cognitive impairment in Parkinson
disease. Neurology 81, 346–352.
https://doi.org/10.1212/WNL.0b013e31829c5c86
Broeders, M., Velseboer, D.C., de Bie, R., Speelman, J.D., Muslimovic, D., Post,
B., de Haan, R., Schmand, B., 2013b. Cognitive change in newly-diagnosed
patients with Parkinson’s disease: a 5-year follow-up study. J. Int.
Neuropsychol. Soc. 19, 695–708.
https://doi.org/10.1017/S1355617713000295
Burn, D.J., Landau, S., Hindle, J. V, Samuel, M., Wilson, K.C., Hurt, C.S., Brown,
R.G., 2012. Parkinson’s disease motor subtypes and mood. Mov. Disord.
27, 379–386. https://doi.org/10.1002/mds.24041
Burn, D.J., Rowan, E.N., Allan, L.M., Molloy, S., O’Brien, J.T., McKeith, I.G., 2006.
Motor subtype and cognitive decline in Parkinson’s disease, Parkinson’s
disease with dementia, and dementia with Lewy bodies. J. Neurol.
Neurosurg. Psychiatry 77, 585–589.
https://doi.org/10.1136/jnnp.2005.081711
Burton, E.J., McKeith, I.G., Burn, D.J., O’Brien, J.T., 2005. Brain atrophy rates in
Parkinson’s disease with and without dementia using serial magnetic
resonance imaging. Mov. Disord. 20, 1571–1576.
https://doi.org/10.1002/mds.20652
Burton, E.J., McKeith, I.G., Burn, D.J., Williams, E.D., O’Brien, J.T., 2004.
Cerebral atrophy in Parkinson’s disease with and without dementia: A
comparison with Alzheimer’s disease, dementia with Lewy bodies and
controls. Brain 127, 791–800. https://doi.org/10.1093/brain/awh088
Butterfield, P., Valanis, B., Spencer, P., Lindeman, C., Nutt, J.G., 1993.
Environmental antecedents of young-onset Parkinson’s disease. Neurology
43, 1150–8.
Caspell-Garcia, C., Simuni, T., Tosun-Turgut, D., Wu, I.W., Zhang, Y., Nalls, M.,
192
Singleton, A., Shaw, L.A., Kang, J.H., Trojanowski, J.Q., Siderowf, A.,
Coffey, C., Lasch, S., Aarsland, D., Burn, D., Chahine, L.M., Espay, A.J.,
Foster, E.D., Hawkins, K.A., Litvan, I., Richard, I., Weintraub, D., 2017.
Multiple modality biomarker prediction of cognitive impairment in
prospectively followed de novo Parkinson disease. PLoS One 12, 1–18.
https://doi.org/10.1371/journal.pone.0175674
Caviness, J.N., Driver-Dunckley, E., Connor, D.J., Sabbagh, M.N., Hentz, J.G.,
Noble, B., Evidente, V.G.H., Shill, H. a, Adler, C.H., 2007. Defining mild
cognitive impairment in Parkinson’s disease. Mov. Disord. 22, 1272–7.
https://doi.org/10.1002/mds.21453
Cherubini, A., Morelli, M., Nisticó, R., Salsone, M., Arabia, G., Vasta, R.,
Augimeri, A., Caligiuri, M.E., Quattrone, A., 2014a. Magnetic resonance
support vector machine discriminates between Parkinson disease and
progressive supranuclear palsy. Mov. Disord. 29, 266–9.
https://doi.org/10.1002/mds.25737
Cherubini, A., Nisticó, R., Novellino, F., Salsone, M., Nigro, S., Donzuso, G.,
Quattrone, A., 2014b. Magnetic resonance support vector machine
discriminates essential tremor with rest tremor from tremor-dominant
Parkinson disease. Mov. Disord. 29, 1216–9.
https://doi.org/10.1002/mds.25869
Chou, Y.-Y., Leporé, N., Saharan, P., Madsen, S.K., Hua, X., Jack, C.R., Shaw,
L.M., Trojanowski, J.Q., Weiner, M.W., Toga, A.W., Thompson, P.M., 2010.
Ventricular maps in 804 ADNI subjects: correlations with CSF biomarkers
and clinical decline. Neurobiol. Aging 31, 1386–1400.
CJNeuroLab, 2018. HCP-MMP1.0 volumetric (NIfTI) masks in native structural
space [WWW Document]. figshare. URL https://figshare.com/articles/HCP-
MMP1_0_volumetric_NIfTI_masks_in_native_structural_space/4249400/3
(accessed 10.15.18).
Compta, Y., Parkkinen, L., O’sullivan, S.S., Vandrovcova, J., Holton, J.L., Collins,
C., Lashley, T., Kallis, C., Williams, D.R., De Silva, R., Lees, A.J., Revesz, T.,
2011. Lewy-and Alzheimer-type pathologies in Parkinson’s disease
dementia: which is more important? Europe PMC Funders Group. Brain
134, 1493–1505. https://doi.org/10.1093/brain/awr031
Compta, Y., Pereira, J.B., Ríos, J., Ibarretxe-Bilbao, N., Junqué, C., Bargalló, N.,
Cámara, A., Buongiorno, M., Fernández, M., Pont-Sunyer, C., Martí, M.J.,
2013. Combined dementia-risk biomarkers in Parkinson’s disease: A
prospective longitudinal study. Park. Relat. Disord. 19, 717–724.
https://doi.org/10.1016/j.parkreldis.2013.03.009
Connolly, B.S., Lang, A.E., 2014. Pharmacological treatment of Parkinson
disease: A review. JAMA - J. Am. Med. Assoc. 311, 1670–1683.
https://doi.org/10.1001/jama.2014.3654
Cools, R., 2006. Dopaminergic modulation of cognitive function-implications for
L-DOPA treatment in Parkinson’s disease. Neurosci. Biobehav. Rev. 30, 1–
23. https://doi.org/10.1016/j.neubiorev.2005.03.024

193
Cools, R., Barker, R.A., Sahakian, B.J., Robbins, T.W., 2003. L-Dopa medication
remediates cognitive inflexibility, but increases impulsivity in patients with
Parkinson’s disease. Neuropsychologia 41, 1431–1441.
https://doi.org/10.1016/S0028-3932(03)00117-9
Cummings, J.L., Mega, M., Gray, K., Rosenberg-Thompson, S., Carusi, D.A.,
Gornbein, J., 1994. The Neuropsychiatric Inventory: Comprehensive
assessment of psychopathology in dementia. Neurology 44, 2308–2308.
https://doi.org/10.1212/WNL.44.12.2308
Dalaker, T.O., Zivadinov, R., Larsen, J.P., Beyer, M.K., Cox, J.L., Alves, G.,
Bronnick, K., Tysnes, O.-B., Antulov, R., Dwyer, M.G., Aarsland, D., 2010.
Gray matter correlations of cognition in incident Parkinson’s disease. Mov.
Disord. 25, 629–33. https://doi.org/10.1002/mds.22867
Dale, A.M., Fischl, B., Sereno, M.I., 1999. Cortical Surface-Based Analysis.
Neuroimage 9, 179–194. https://doi.org/10.1006/nimg.1998.0395
Dale, A.M., Sereno, M.I., 1993. Improved Localizadon of Cortical Activity by
Combining EEG and MEG with MRI Cortical Surface Reconstruction: A
Linear Approach. J. Cogn. Neurosci. 5, 162–176.
https://doi.org/10.1162/jocn.1993.5.2.162
Dalrymple-Alford, J.C., 2010. The MoCA Well-suited screen for cognitive
impairment in Parkinson disease The MoCA Well-suited screen for
cognitive impairment in Parkinson disease 1717–1725.
https://doi.org/10.1212/WNL.0b013e3181fc29c9
Danti, S., Toschi, N., Diciotti, S., Tessa, C., Poletti, M., Del Dotto, P., Lucetti, C.,
2015. Cortical thickness in de novo patients with Parkinson disease and
mild cognitive impairment with consideration of clinical phenotype and
motor laterality. Eur. J. Neurol. 22, 1564–1572.
https://doi.org/10.1111/ene.12785
De La Fuente-Fernández, R., Schulzer, M., Kuramoto, L., Cragg, J.,
Ramachandiran, N., Au, W.L., Mak, E., McKenzie, J., McCormick, S., Sossi,
V., Ruth, T.J., Lee, C.S., Calne, D.B., Stoessl, A.J., 2011. Age-specific
progression of nigrostriatal dysfunction in Parkinson’s disease. Ann. Neurol.
69, 803–810. https://doi.org/10.1002/ana.22284
de Lau, L.M., Breteler, M.M., 2006. Epidemiology of Parkinson’s disease. Lancet
Neurol. 5, 525–535. https://doi.org/10.1016/S1474-4422(06)70471-9
Del Tredici, K., Braak, H., 2013. Dysfunction of the locus coeruleus-
norepinephrine system and related circuitry in Parkinson’s disease-related
dementia. J. Neurol. Neurosurg. Psychiatry 84, 774–783.
https://doi.org/10.1136/jnnp-2011-301817
Delgado-Alvarado, M., Gago, B., Navalpotro-Gomez, I., Jiménez-Urbieta, H.,
Rodriguez-Oroz, M.C., 2016. Biomarkers for dementia and mild cognitive
impairment in Parkinson’s disease. Mov. Disord.
https://doi.org/10.1002/mds.26662
Deuschl, G., 2013. Benign tremulous Parkinson’s disease: A misnomer? Mov.

194
Disord. 28, 117–119. https://doi.org/10.1002/mds.25317
Dickson, D.W., Braak, H., Duda, J.E., Duyckaerts, C., Gasser, T., Halliday, G.M.,
Hardy, J., Leverenz, J.B., Del Tredici, K., Wszolek, Z.K., Litvan, I., 2009.
Neuropathological assessment of Parkinson’s disease: refining the
diagnostic criteria. Lancet Neurol. 8, 1150–1157.
https://doi.org/10.1016/s1474-4422(09)70238-8
Dirkx, M.F., Den Ouden, H.E.M., Aarts, E., Timmer, M.H.M., Bloem, B.R., Toni, I.,
Helmich, R.C., 2017. Dopamine controls Parkinson’s tremor by inhibiting
the cerebellar thalamus. Brain 140, 721–734.
https://doi.org/10.1093/brain/aww331
Domellöf, M.E., Ekman, U., Forsgren, L., Elgh, E., 2015. Cognitive function in the
early phase of Parkinson’s disease, a five-year follow-up. Acta Neurol.
Scand. 132, 79–88. https://doi.org/10.1111/ane.12375
Doré, V., Villemagne, V.L., Bourgeat, P., Fripp, J., Acosta, O., Chetélat, G., Zhou,
L., Martins, R., Ellis, K.A., Masters, C.L., Ames, D., Salvado, O., Rowe, C.C.,
2013. Cross-sectional and Longitudinal Analysis of the Relationship
Between Aβ Deposition, Cortical Thickness, and Memory in Cognitively
Unimpaired Individuals and in Alzheimer Disease. JAMA Neurol. 70, 903.
https://doi.org/10.1001/jamaneurol.2013.1062
Doty, R., 1995. The smell identification test administration manual, third. ed.
Sensonics, Haddon Heights.
Doty, R.L., 2012. Olfactory dysfunction in Parkinson’s disease. Nat. Rev. Neurol.
8, 329–339. https://doi.org/10.1038/nrneurol.2012.80
Dubois, B., Burn, D., Goetz, C., Aarsland, D., Brown, R.G., Broe, G.A., Dickson,
D., Duyckaerts, C., Cummings, J., Gauthier, S., Korczyn, A., Lees, A., Levy,
R., Litvan, I., Mizuno, Y., McKeith, I.G., Olanow, C.W., Poewe, W., Sampaio,
C., Tolosa, E., Emre, M., 2007. Diagnostic procedures for Parkinson’s
disease dementia: recommendations from the movement disorder society
task force. Mov. Disord. 22, 2314–24. https://doi.org/10.1002/mds.21844
Dubois, B., Pillon, B., 1997. Cognitive deficits in Parkinson’s disease. J. Neurol.
244, 2–8. https://doi.org/10.1007/PL00007725
Dujardin, K., Defebvre, L., Duhamel, A., Lecouffe, P., Rogelet, P., Steinling, M.,
Destée, A., 2004. Cognitive and SPECT characteristics predict progression
of Parkinson’s disease in newly diagnosed patients. J. Neurol. 251, 1383–
1392. https://doi.org/10.1007/s00415-004-0549-2
Dujardin, K., Leentjens, A.F.G., Langlois, C., Moonen, A.J.H., Duits, A.A., Carette,
A.S., Duhamel, A., 2013. The spectrum of cognitive disorders in Parkinson’s
disease: a data-driven approach. Mov. Disord. 28, 183–9.
https://doi.org/10.1002/mds.25311
Eisinger, R.S., Hess, C.W., Martinez-Ramirez, D., Almeida, L., Foote, K.D., Okun,
M.S., Gunduz, A., 2017. Motor subtype changes in early Parkinson’s
disease. Park. Relat. Disord. 43, 67–72.
https://doi.org/10.1016/j.parkreldis.2017.07.018
195
Ekman, R., 1975. Pictures of Facial Affect, Emotion. Consulting Psychologists
Press, Palo Alto. https://doi.org/citeulike-article-id:4270156
Emre, M., Aarsland, D., Brown, R., Burn, D.J., Duyckaerts, C., Mizuno, Y., Broe,
G.A., Cummings, J., Dickson, D.W., Gauthier, S., Goldman, J., Goetz, C.,
Korczyn, A.A., Lees, A., Levy, R., Litvan, I., McKeith, I., Olanow, W., Poewe,
W., Quinn, N., Sampaio, C., Tolosa, E., Dubois, B., 2007. Clinical diagnostic
criteria for dementia associated with Parkinson’s disease. Mov. Disord. 22,
1689–1707. https://doi.org/10.1002/mds.21507
Erro, R., Picillo, M., Vitale, C., Palladino, R., Amboni, M., Moccia, M., Pellecchia,
M.T., Barone, P., 2016. Clinical clusters and dopaminergic dysfunction in
de-novo Parkinson disease. Park. Relat. Disord. 28, 137–140.
https://doi.org/10.1016/j.parkreldis.2016.04.026
Erro, R., Vitale, C., Amboni, M., Picillo, M., Moccia, M., Longo, K., Santangelo, G.,
De Rosa, A., Allocca, R., Giordano, F., Orefice, G., De Michele, G., Santoro,
L., Pellecchia, M.T., Barone, P., 2013. The heterogeneity of early
Parkinson’s disease: a cluster analysis on newly diagnosed untreated
patients. PLoS One 8, e70244.
https://doi.org/10.1371/journal.pone.0070244
Fahn, S., Elton, R., 1987. UPDRS Program Member Unified Parkinson’s Disease
Rating Scale, in: Fahn, S, Marsden, CD, Goldstein, M, Calne, D. (Ed.),
Recent Developments in Parkinson’s Disease, Vol. 2. Macmillan Healthcare
Information, Florham Park, NJ, pp. 153-163,293-304.
Farrar, D.E., Glauber, R.R., 1967. Multicollinearity in Regression Analysis: The
Problem Revisited. Rev. Econ. Stat. 49, 92. https://doi.org/10.2307/1937887
Fenelon, G., 2000. Hallucinations in Parkinson’s disease: Prevalence,
phenomenology and risk factors. Brain 123, 733–745.
https://doi.org/10.1093/brain/123.4.733
Fénelon, G., Goetz, C.G., Karenberg, A., 2006. Hallucinations in Parkinson
disease in the prelevodopa era. Neurology 66, 93–8.
https://doi.org/10.1212/01.wnl.0000191325.31068.c4
Fénelon, G., Soulas, T., De Langavant, L.C., Trinkler, I., Bachoud-Lévi, A.C.,
2011. Feeling of presence in Parkinson’s disease. J. Neurol. Neurosurg.
Psychiatry 82, 1219–1224. https://doi.org/10.1136/jnnp.2010.234799
Fereshtehnejad, S.-M.M., Romenets, S.R., Anang, J.B.M., Latreille, V., Gagnon,
J.-F.F., Postuma, R.B., 2015. New clinical subtypes of Parkinson disease
and their longitudinal progression. JAMA Neurol. 72, 1–11.
https://doi.org/10.1001/jamaneurol.2015.0703
Fereshtehnejad, S.M., Hadizadeh, H., Farhadi, F., Shahidi, G.A., Delbari, A.,
Lökk, J., 2014. Comparison of the Psychological Symptoms and Disease-
Specific Quality of Life between Early- and Typical-Onset Parkinson’s
Disease Patients. Parkinsons. Dis. 2014, 1–7.
https://doi.org/10.1155/2014/819260
Fereshtehnejad, S.M., Postuma, R.B., 2017. Subtypes of Parkinson’s disease:

196
What do they tell us about disease progression? Curr. Neurol. Neurosci.
Rep. 17, 34. https://doi.org/10.1007/s11910-017-0738-x
Fereshtehnejad, S.M., Zeighami, Y., Dagher, A., Postuma, R.B., 2017. Clinical
criteria for subtyping Parkinson’s disease: Biomarkers and longitudinal
progression. Brain 140, 1959–1976. https://doi.org/10.1093/brain/awx118
Ferguson, L.W., Rajput, A.H., Rajput, A., 2015. Early-onset vs. Late-onset
Parkinson’s disease: A Clinical-pathological Study. Can. J. Neurol. Sci. 43,
113–119. https://doi.org/10.1017/cjn.2015.244
Fernández-Seara, M. a, Mengual, E., Vidorreta, M., Aznárez-Sanado, M., Loayza,
F.R., Villagra, F., Irigoyen, J., Pastor, M. a, 2012. Cortical hypoperfusion in
Parkinson’s disease assessed using arterial spin labeled perfusion MRI.
Neuroimage 59, 2743–50.
https://doi.org/10.1016/j.neuroimage.2011.10.033
Ffytche, D.H., Creese, B., Politis, M., Chaudhuri, R.K., Weintraub, D., Ballard, C.,
Aarsland, D., 2017. The psychosis spectrum in Parkinson disease. Nat. Rev.
Neurol. https://doi.org/10.1038/nrneurol.2016.200
Field, A., 2009. Discovering statistics using SPSS. Sage publications.
Fischl, B., Dale, A.M., 2000. Measuring the thickness of the human cerebral
cortex from magnetic resonance images. Proc. Natl. Acad. Sci. 97, 11050–
11055. https://doi.org/10.1073/pnas.200033797
Fischl, B., Liu, A., Dale, A.M., 2001. Automated manifold surgery: constructing
geometrically accurate and topologically correct models of the human
cerebral cortex. IEEE Trans. Med. Imaging 20, 70–80.
https://doi.org/10.1109/42.906426
Fischl, B., Salat, D.H., Busa, E., Albert, M., Dieterich, M., Haselgrove, C., van der
Kouwe, A., Killiany, R., Kennedy, D., Klaveness, S., Montillo, A., Makris, N.,
Rosen, B., Dale, A.M., 2002. Whole brain segmentation: automated labeling
of neuroanatomical structures in the human brain. Neuron 33, 341–55.
Fishman, P.S., 2008. Paradoxical aspects of parkinsonian tremor. Mov. Disord.
23, 168–173. https://doi.org/10.1002/mds.21736
Folstein, M.F., Folstein, S.E., McHugh, P.R., 1975. “Mini-mental state”. A
practical method for grading the cognitive state of patients for the clinician.
J. Psychiatr. Res. 12, 189–198. https://doi.org/10.1016/0022-
3956(75)90026-6
Foltynie, T., Brayne, C., Barker, R.A., 2002. The heterogeneity of idiopathic
Parkinson’s disease. J. Neurol. https://doi.org/10.1007/PL00007856
Foltynie, T., Brayne, C.E.G., Robbins, T.W., Barker, R.A., 2004. The cognitive
ability of an incident cohort of Parkinson’s patients in the UK. The
CamPaIGN study. Brain 127, 550–60. https://doi.org/10.1093/brain/awh067
Garcia-Diaz, A.I., Segura, B., Baggio, H.C., Marti, M.J., Valldeoriola, F., Compta,
Y., Bargallo, N., Uribe, C., Campabadal, A., Abos, A., Junque, C., 2018.
Structural Brain Correlations of Visuospatial and Visuoperceptual Tests in

197
Parkinson’s Disease. J. Int. Neuropsychol. Soc. 24, 33–44.
https://doi.org/10.1017/S1355617717000583
Garcia-Garcia, D., Clavero, P., Gasca Salas, C., Lamet, I., Arbizu, J., Gonzalez-
Redondo, R., Obeso, J.A., Rodriguez-Oroz, M.C., 2012. Posterior
parietooccipital hypometabolism may differentiate mild cognitive
impairment from dementia in Parkinson’s disease. Eur. J. Nucl. Med. Mol.
Imaging 39, 1767–77. https://doi.org/10.1007/s00259-012-2198-5
Gasca-Salas, C., Estanga, A., Clavero, P., Aguilar-Palacio, I., González-Redondo,
R., Obeso, J. a, Rodríguez-Oroz, M.C., Gonz, R., 2014. Longitudinal
Assessment of the Pattern of Cognitive Decline in Non-Demented Patients
with Advanced Parkinson’s Disease. J. Parkinsons. Dis. 4, 677–686.
https://doi.org/10.3233/JPD-140398
Gasparoli, E., Delibori, D., Polesello, G., Santelli, L., Ermani, M., Battistin, L.,
Bracco, F., 2002. Clinical predictors in Parkinson’s disease. Neurol. Sci. 23
Suppl 2, S77-8. https://doi.org/10.1007/s100720200078
Glasser, M.F., Coalson, T.S., Robinson, E.C., Hacker, C.D., Harwell, J., Yacoub,
E., Ugurbil, K., Andersson, J., Beckmann, C.F., Jenkinson, M., Smith, S.M.,
Van Essen, D.C., 2016. A multi-modal parcellation of human cerebral
cortex. Nature 536, 171–8. https://doi.org/10.1038/nature18933
Goedert, M., 2015. Alzheimer’s and Parkinson’s diseases: The prion concept in
relation to assembled Aβ, tau, and α-synuclein. Science (80-. ). 349,
1255555–1255555. https://doi.org/10.1126/science.1255555
Goedert, M., Spillantini, M.G., Del Tredici, K., Braak, H., 2013. 100 years of Lewy
pathology. Nat. Rev. Neurol. 9, 13–24.
https://doi.org/10.1038/nrneurol.2012.242
Goetz, C.G., Chmura, T.A., Lanska, D.J., 2001. The history of Parkinson’s
disease: Part 2 of the MDS-sponsored history of movement disorders
exhibit, Barcelona, June 2000. Mov. Disord. 16, 156–161.
https://doi.org/10.1002/1531-8257(200101)16:1<156::AID-
MDS1028>3.0.CO;2-B
Goetz, C.G., Tilley, B.C., Shaftman, S.R., Stebbins, G.T., Fahn, S., Martinez-
Martin, P., Poewe, W., Sampaio, C., Stern, M.B., Dodel, R., Dubois, B.,
Holloway, R., Jankovic, J., Kulisevsky, J., Lang, A.E., Lees, A., Leurgans, S.,
LeWitt, P.A., Nyenhuis, D., Olanow, C.W., Rascol, O., Schrag, A., Teresi,
J.A., van Hilten, J.J., LaPelle, N., Agarwal, P., Athar, S., Bordelan, Y.,
Bronte-Stewart, H.M., Camicioli, R., Chou, K., Cole, W., Dalvi, A., Delgado,
H., Diamond, A., Dick, J.P., Duda, J., Elble, R.J., Evans, C., Evidente, V.G.,
Fernandez, H.H., Fox, S., Friedman, J.H., Fross, R.D., Gallagher, D., Goetz,
C.G., Hall, D., Hermanowicz, N., Hinson, V., Horn, S., Hurtig, H., Kang, U.J.,
Kleiner-Fisman, G., Klepitskaya, O., Kompoliti, K., Lai, E.C., Leehey, M.L.,
Leroi, I., Lyons, K.E., McClain, T., Metzer, S.W., Miyasaki, J., Morgan, J.C.,
Nance, M., Nemeth, J., Pahwa, R., Parashos, S.A., Schneider, J.S.J.S.,
Schrag, A., Sethi, K., Shulman, L.M., Siderowf, A., Silverdale, M., Simuni, T.,
Stacy, M., Stern, M.B., Stewart, R.M., Sullivan, K., Swope, D.M., Wadia,

198
P.M., Walker, R.W., Walker, R., Weiner, W.J., Wiener, J., Wilkinson, J.,
Wojcieszek, J.M., Wolfrath, S., Wooten, F., Wu, A., Zesiewicz, T.A., Zweig,
R.M., 2008. Movement Disorder Society-Sponsored Revision of the Unified
Parkinson’s Disease Rating Scale (MDS-UPDRS): Scale presentation and
clinimetric testing results. Mov. Disord. 23, 2129–2170.
https://doi.org/10.1002/mds.22340
Goldman, J.G., Holden, S., Bernard, B., Ouyang, B., Goetz, C.G., Stebbins, G.T.,
2013. Defining optimal cutoff scores for cognitive impairment using
Movement Disorder Society Task Force criteria for mild cognitive
impairment in Parkinson’s disease. Mov. Disord. 28, 1972–9.
https://doi.org/10.1002/mds.25655
Goldman, J.G., Stebbins, G.T., Dinh, V., Bernard, B., Merkitch, D., deToledo-
Morrell, L., Goetz, C.G., 2014. Visuoperceptive region atrophy independent
of cognitive status in patients with Parkinson’s disease with hallucinations.
Brain 137, 849–59. https://doi.org/10.1093/brain/awt360
Gomperts, S.N., Locascio, J.J., Rentz, D., Santarlasci, A., Marquie, M., Johnson,
K. a., Growdon, J.H., 2013. Amyloid is linked to cognitive decline in patients
with Parkinson disease without dementia. Neurology 80, 85–91.
https://doi.org/10.1212/WNL.0b013e31827b1a07
González-Redondo, R., García-García, D., Clavero, P., Gasca-Salas, C., García-
Eulate, R., Zubieta, J.L., Arbizu, J., Obeso, J.A., Rodríguez-Oroz, M.C., 2014.
Grey matter hypometabolism and atrophy in Parkinson’s disease with
cognitive impairment: A two-step process. Brain 137, 2356–2367.
https://doi.org/10.1093/brain/awu159
Good, C.D., Johnsrude, I.S., Ashburner, J., Henson, R.N., Friston, K.J.,
Frackowiak, R.S., 2001. A voxel-based morphometric study of ageing in 465
normal adult human brains. Neuroimage 14, 21–36.
https://doi.org/10.1006/nimg.2001.0786
Grace, A.A., 2008. Physiology of the normal and dopamine-depleted basal
ganglia: Insights into levodopa pharmacotherapy. Mov. Disord. 23, S560–
S569. https://doi.org/10.1002/mds.22020
Graham, J.M., Sagar, H.J., 1999. A data-driven approach to the study of
heterogeneity in idiopathic Parkinson’s disease: identification of three
distinct subtypes. Mov. Disord. 14, 10–20.
Gratwicke, J., Jahanshahi, M., Foltynie, T., 2015. Parkinson’s disease dementia:
A neural networks perspective. Brain 138, 1454–1476.
https://doi.org/10.1093/brain/awv104
Gutteridge, J.M., 1992. Iron and oxygen radicals in brain. Ann. Neurol. 32 Suppl,
S16-21.
Hallett, M., 2012. Parkinson’s disease tremor: pathophysiology. Parkinsonism
Relat. Disord. 18, S85–S86. https://doi.org/10.1016/S1353-8020(11)70027-
X
Halliday, G., Hely, M., Reid, W., Morris, J., 2008. The progression of pathology in
199
longitudinally followed patients with Parkinson’s disease. Acta Neuropathol.
115, 409–415. https://doi.org/10.1007/s00401-008-0344-8
Halliday, G.M., Leverenz, J.B., Schneider, J.S., Adler, C.H., 2014. The
neurobiological basis of cognitive impairment in Parkinson’s disease. Mov.
Disord. 29, 634–650. https://doi.org/10.1002/mds.25857
Hanagasi, H.A., Gurvit, H., Unsalan, P., Horozoglu, H., Tuncer, N., Feyzioglu, A.,
Gunal, D.I., Yener, G.G., Cakmur, R., Sahin, H.A., Emre, M., 2011. The
effects of rasagiline on cognitive deficits in Parkinson’s disease patients
without dementia: A randomized, double-blind, placebo-controlled,
multicenter study. Mov. Disord. 26, 1851–1858.
https://doi.org/10.1002/mds.23738
Hanganu, A., Bedetti, C., Degroot, C., Mejia-Constain, B., Lafontaine, A.L.,
Soland, V., Chouinard, S., Bruneau, M.A., Mellah, S., Belleville, S., Monchi,
O., 2014. Mild cognitive impairment is linked with faster rate of cortical
thinning in patients with Parkinson’s disease longitudinally. Brain 137,
1120–1129. https://doi.org/10.1093/brain/awu036
Hanganu, A., Bedetti, C., Jubault, T., Gagnon, J.F., Mejia-Constain, B., Degroot,
C., Lafontaine, A.-L., Chouinard, S., Monchi, O., 2013. Mild cognitive
impairment in patients with Parkinson’s disease is associated with
increased cortical degeneration. Mov. Disord. 28, 1360–9.
https://doi.org/10.1002/mds.25541
Harding, A.J., Broe, G.A., Halliday, G.M., 2002. Visual hallucinations in Lewy
body disease relate to Lewy bodies in the temporal lobe. Brain 125, 391–
403.
Harding, A.J., Halliday, G.M., 2001. Cortical Lewy body pathology in the
diagnosis of dementia. Acta Neuropathol. 102, 355–63.
Hastie, T., Tibshirani, R., Friedman, J., 2008. Springer Series in Statistics The
Elements of Statistical Learning Data Mining, Inference, and Prediction, 2nd
ed. Springer.
Hely, M.A., Morris, J.G.L., Reid, W.G.J., O’Sullivan, D.J., Williamson, P.M., Broe,
G.A., Adena, M.A., 1995. Age at onset: the major determinant of outcome in
Parkinson’s disease. Acta Neurol. Scand. 92, 455–463.
https://doi.org/10.1111/j.1600-0404.1995.tb00480.x
Henry, J.D., Crawford, J.R., 2004. A Meta-Analytic Review of Verbal Fluency
Performance in Patients With Traumatic Brain Injury. Neuropsychology 18,
621–628. https://doi.org/10.1037/0894-4105.18.4.621
Hobson, P., Meara, J., 2004. Risk and incidence of dementia in a cohort of older
subjects with Parkinson’s disease in the United Kingdom. Mov. Disord. 19,
1043–1049. https://doi.org/10.1002/mds.20216
Hoehn, M.M., Yahr, M.D., 1967. Parkinsonism: onset, progression and mortality.
Neurology 17, 427–42. https://doi.org/10.1212/WNL.17.5.427
Hoogland, J., Boel, J.A., de Bie, R.M.A., Geskus, R.B., Schmand, B.A.,
Dalrymple-Alford, J.C., Marras, C., Adler, C.H., Goldman, J.G., Tröster, A.I.,
200
Burn, D.J., Litvan, I., Geurtsen, G.J., 2017. Mild cognitive impairment as a
risk factor for Parkinson’s disease dementia. Mov. Disord. 32, 1056–1065.
https://doi.org/10.1002/mds.27002
Hoogland, J., Boel, J.A., de Bie, R.M.A., Schmand, B.A., Geskus, R.B.,
Dalrymple-Alford, J.C., Marras, C., Adler, C.H., Weintraub, D., Junque, C.,
Pedersen, K.F., Mollenhauer, B., Goldman, J.G., Tröster, A.I., Burn, D.J.,
Litvan, I., Geurtsen, G.J., 2019. Risk of Parkinson’s disease dementia
related to level I MDS PD-MCI. Mov. Disord.
https://doi.org/10.1002/mds.27617
Hoogland, J., van Wanrooij, L.L., Boel, J.A., Goldman, J.G., Stebbins, G.T.,
Dalrymple-Alford, J.C., Marras, C., Adler, C.H., Junque, C., Pedersen, K.F.,
Mollenhauer, B., Zabetian, C.P., Eslinger, P.J., Lewis, S.J.G., Wu, R.M.,
Klein, M., Rodriguez-Oroz, M.C., Cammisuli, D.M., Barone, P., Biundo, R., de
Bie, R.M.A., Schmand, B.A., Tröster, A.I., Burn, D.J., Litvan, I., Filoteo, J.V.,
Geurtsen, G.J., Weintraub, D., 2018. Detecting Mild Cognitive Deficits in
Parkinson’s Disease: Comparison of Neuropsychological Tests. Mov.
Disord. 33, 1750–1759. https://doi.org/10.1002/mds.110
Hou, Y., Yang, J., Luo, C., Ou, R., Song, W., Liu, W., Gong, Q., Shang, H., 2016.
Patterns of striatal functional connectivity differ in early and late onset
Parkinson’s disease. J. Neurol. 263, 1993–2003.
https://doi.org/10.1007/s00415-016-8211-3
Huang, C., Tang, C., Feigin, A., Lesser, M., Ma, Y., Pourfar, M., Dhawan, V.,
Eidelberg, D., 2007. Changes in network activity with the progression of
Parkinson’s disease. Brain 130, 1834–1846.
https://doi.org/10.1093/brain/awm086
Hughes, A.J., Daniel, S.E., Kilford, L., Lees, A.J., 1992. Accuracy of clinical
diagnosis of idiopathic Parkinson’s disease: A clinico-pathological study of
100 cases. J. Neurol. Neurosurg. Psychiatry 55, 181–184.
https://doi.org/10.1136/jnnp.55.3.181
Ibarretxe-Bilbao, N., Junque, C., Marti, M.J., Tolosa, E., 2011. Cerebral basis of
visual hallucinations in Parkinson’s disease: Structural and functional MRI
studies. J. Neurol. Sci. 310, 79–81. https://doi.org/10.1016/j.jns.2011.06.019
Ibarretxe-Bilbao, N., Junque, C., Segura, B., Baggio, H.C., Marti, M.J.,
Valldeoriola, F., Bargallo, N., Tolosa, E., 2012. Progression of cortical
thinning in early Parkinson’s disease. Mov. Disord. 27, 1746–53.
https://doi.org/10.1002/mds.25240
Ibarretxe-Bilbao, N., Junque, C., Tolosa, E., Marti, M.J., Valldeoriola, F., Bargallo,
N., Zarei, M., 2009. Neuroanatomical correlates of impaired decision-
making and facial emotion recognition in early Parkinson’s disease. Eur. J.
Neurosci. 30, 1162–1171. https://doi.org/10.1111/j.1460-9568.2009.06892.x
Ibarretxe-Bilbao, N., Ramirez-Ruiz, B., Junque, C., Marti, M.J., Valldeoriola, F.,
Bargallo, N., Juanes, S., Tolosa, E., 2010. Differential progression of brain
atrophy in Parkinson’s disease with and without visual hallucinations. J.
Neurol. Neurosurg. Psychiatry 81, 650–657.

201
https://doi.org/10.1136/jnnp.2009.179655
Ibarretxe-Bilbao, N., Ramírez-Ruiz, B., Tolosa, E., Martí, M.J., Valldeoriola, F.,
Bargalló, N., Junqué, C., 2008. Hippocampal head atrophy predominance in
Parkinson’s disease with hallucinations and with dementia. J. Neurol. 255,
1324–1331. https://doi.org/10.1007/s00415-008-0885-8
Irwin, D.J., Hurtig, H.I., 2018. The Contribution of Tau, Amyloid-Beta and Alpha-
Synuclein Pathology to Dementia in Lewy Body Disorders. J. Alzheimer’s
Dis. Park. 8. https://doi.org/10.4172/2161-0460.1000444
Irwin, D.J., White, M.T., Toledo, J.B., Xie, S.X., Robinson, J.L., Van Deerlin, V.,
Lee, V.M.-Y., Leverenz, J.B., Montine, T.J., Duda, J.E., Hurtig, H.I.,
Trojanowski, J.Q., 2012. Neuropathologic substrates of Parkinson disease
dementia. Ann. Neurol. 72, 587–598. https://doi.org/10.1002/ana.23659
James, G., Witten, D., Hastie, T., Tibshirani, R., 2013. An introduction to
statistical learning with applications in R. Springer Texts in Statistics, New
York.
Jankovic, J., Kapadia, A.S., 2001. Functional decline in Parkinson disease. Arch.
Neurol. 58, 1611–1615. https://doi.org/10.1001/archneur.58.10.1611
Jankovic, J., McDermott, M., Carter, J., Gauthier, S., Goetz, C., Golbe, L., Huber,
S., Koller, W., Olanow, C., Shoulson, I., 1990. Variable expression of
Parkinson’s disease: a base-line analysis of the DATATOP cohort. The
Parkinson Study Group. Neurology 40, 1529–34.
Jankovic, J., Rajput, A.H., McDermott, M.P., Perl, D.P., 2000. The evolution of
diagnosis in early Parkinson disease. Parkinson Study Group. Arch. Neurol.
57, 369–72.
Janvin, C.C., Larsen, J.P., Aarsland, D., Hugdahl, K., 2006. Subtypes of mild
cognitive impairment in Parkinson’s disease: progression to dementia. Mov.
Disord. 21, 1343–9. https://doi.org/10.1002/mds.20974
Jellinger, K.A., 2012. Neuropathology of sporadic Parkinson’s disease:
Evaluation and changes of concepts. Mov. Disord. 27, 8–30.
https://doi.org/10.1002/mds.23795
Jellinger, K.A., 2010. The neuropathologic substrate of Parkinson disease
dementia. Acta Neuropathol. 119, 151–153. https://doi.org/10.1007/s00401-
009-0613-1
Jellinger, K.A., 2009. A critical evaluation of current staging of α-synuclein
pathology in Lewy body disorders. Biochim. Biophys. Acta - Mol. Basis Dis.
1792, 730–740. https://doi.org/10.1016/j.bbadis.2008.07.006
Jellinger, K.A., 2008. A critical reappraisal of current staging of Lewy-related
pathology in human brain. Acta Neuropathol. 116, 1–16.
https://doi.org/10.1007/s00401-008-0406-y
Jellinger, K.A., 2004. Lewy body-related alfa-synucleinopathy in the aged human
brain. J. Neural Transm. 111, 1219–1235. https://doi.org/10.1007/s00702-
004-0138-7
202
Josephs, K.A., Matsumoto, J.Y., Ahlskog, J.E., 2006. Benign tremulous
parkinsonism. Arch. Neurol. 63, 354–357.
https://doi.org/10.1001/archneur.63.3.354
Kalia, L. V, Lang, A.E., 2015. Parkinson’s disease. Lancet 386, 896–912.
https://doi.org/10.1016/S0140-6736(14)61393-3
Kaplan, E., Goodglass, H., Weintraub, S., 1983. Boston Naming Test. Pro-ed.
https://doi.org/10.1002/9780470479216.corpsy0139
Kehagia, A.A., Barker, R.A., Robbins, T.W., 2012. Cognitive impairment in
Parkinson’s disease: The dual syndrome hypothesis. Neurodegener. Dis.
11, 79–92. https://doi.org/10.1159/000341998
Kehagia, A.A., Barker, R.A., Robbins, T.W., 2010. Neuropsychological and
clinical heterogeneity of cognitive impairment and dementia in patients with
Parkinson ’ s disease. Lancet Neurol. 9, 1200–1213.
https://doi.org/10.1016/S1474-4422(10)70212-X
Kish, S.J., Shannak, K., Hornykiewicz, O., 2010. Uneven Pattern of Dopamine
Loss in the Striatum of Patients with Idiopathic Parkinson’s Disease. N.
Engl. J. Med. 318, 876–880. https://doi.org/10.1056/nejm198804073181402
Kotagal, V., 2016. Is PIGD a legitimate motor subtype in Parkinson disease?
Ann. Clin. Transl. Neurol. 3, 473–477. https://doi.org/10.1002/acn3.312
Kunst, J., Marecek, R., Klobusiakova, P., Balazova, Z., Anderkova, L., Nemcova-
Elfmarkova, N., Rektorova, I., 2019. Patterns of Grey Matter Atrophy at
Different Stages of Parkinson’s and Alzheimer’s Diseases and Relation to
Cognition. Brain Topogr. 32, 142–160. https://doi.org/10.1007/s10548-018-
0675-2
LaBelle, D.R., Walsh, R.R., Banks, S.J., 2017. Latent cognitive phenotypes in de
novo Parkinson’s disease: A person-centered approach. J. Int.
Neuropsychol. Soc. 1–13. https://doi.org/10.1017/S1355617717000406
Lanskey, J.H., McColgan, P., Schrag, A.E., Acosta-Cabronero, J., Rees, G.,
Morris, H.R., Weil, R.S., 2018. Can neuroimaging predict dementia in
Parkinson’s disease? Brain. https://doi.org/10.1093/brain/awy211
Lawson, R.A., Yarnall, A.J., Duncan, G.W., Breen, D.P., Khoo, T.K., Williams-
Gray, C.H., Barker, R.A., Collerton, D., Taylor, J.-P., Burn, D.J., 2016.
Cognitive decline and quality of life in incident Parkinson’s disease: The role
of attention. https://doi.org/10.1016/j.parkreldis.2016.04.009
Lawton, M.P., Brody, E.M., 1969. Assessment of Older People: Self-Maintaining
and Instrumental Activities of Daily Living. Gerontologist 9, 179–186.
https://doi.org/10.1093/geront/9.3_Part_1.179
Lee, H.M., Kwon, K.-Y., Kim, M.K., Jang, J.-W., Suh, S., Koh, S.-B., Kim, J.H.,
2014. Subcortical grey matter changes in untreated, early stage
Parkinson’s disease without dementia. Parkinsonism Relat. Disord. 20, 1–5.
https://doi.org/10.1016/j.parkreldis.2014.03.009
Lees, A.J., Hardy, J., Revesz, T., 2009. Parkinson’s disease, The Lancet.

203
https://doi.org/10.1016/S0140-6736(09)60492-X
Lenka, A., Hegde, S., Arumugham, S.S., Pal, P.K., 2017. Pattern of cognitive
impairment in patients with Parkinson’s disease and psychosis: A critical
review. Parkinsonism Relat. Disord. 37, 11–18.
https://doi.org/10.1016/j.parkreldis.2016.12.025
Lenka, A., Ingalhalikar, M., Shah, A., Saini, J., Arumugham, S.S., Hegde, S.,
George, L., Reddy, V., Reddy, Y.C.J., Yadav, R., Pal, P.K., 2018.
Hippocampal subfield atrophy in patients with Parkinson’s disease and
psychosis. J. Neural Transm. 125, 1361–1372.
https://doi.org/10.1007/s00702-018-1891-3
Lenka, A., Jhunjhunwala, K.R., Saini, J., Pal, P.K., 2015. Structural and functional
neuroimaging in patients with Parkinson’s disease and visual hallucinations:
A critical review. Park. Relat. Disord. 21, 683–691.
https://doi.org/10.1016/j.parkreldis.2015.04.005
Leroi, I., McDonald, K., Pantula, H., Harbishettar, V., 2012. Cognitive impairment
in parkinson disease: Impact on quality of life, disability, and caregiver
burden. J. Geriatr. Psychiatry Neurol. 25, 208–214.
https://doi.org/10.1177/0891988712464823
Levy, G., Jacobs, D.M., Tang, M.X., Côté, L.J., Louis, E.D., Alfaro, B., Mejia, H.,
Stern, Y., Marder, K., 2002. Memory and executive function impairment
predict dementia in Parkinson’s disease. Mov. Disord. 17, 1221–1226.
https://doi.org/10.1002/mds.10280
Lewis, S.J.G., 2005. Heterogeneity of Parkinson’s disease in the early clinical
stages using a data driven approach. J. Neurol. Neurosurg. Psychiatry 76,
343–348. https://doi.org/10.1136/jnnp.2003.033530
Lezak, M.D., Howieson, D.B., Loring, D.W., Hannay, H.J., Fischer, J.S., Bigler,
E.D., Tranel, D., 2012. Neuropsychological assessment. Oxford University
Press.
Litvan, I., Goldman, J.G., Tröster, A.I., Schmand, B.A., Weintraub, D., Petersen,
R.C., Mollenhauer, B., Adler, C.H., Marder, K., Williams-Gray, C.H.,
Aarsland, D., Kulisevsky, J., Rodriguez-Oroz, M.C., Burn, D.J., Barker, R.A.,
Emre, M., 2012. Diagnostic criteria for mild cognitive impairment in
Parkinson’s disease: Movement Disorder Society Task Force guidelines.
Mov. Disord. 27, 349–356. https://doi.org/10.1002/mds.24893
Liu, S.-Y., Wu, J.-J., Zhao, J., Huang, S.-F., Wang, Y.-X., Ge, J.-J., Wu, P., Zuo,
C.-T., Ding, Z.-T., Wang, J., 2015. Onset-related subtypes of Parkinson’s
disease differ in the patterns of striatal dopaminergic dysfunction: A
positron emission tomography study. Parkinsonism Relat. Disord. 21, 1448–
53. https://doi.org/10.1016/j.parkreldis.2015.10.017
Llebaria, G., Pagonabarraga, J., Martínez-Corral, M., García-Sánchez, C.,
Pascual-Sedano, B., Gironell, A., Kulisevsky, J., 2010. Neuropsychological
correlates of mild to severe hallucinations in Parkinson’s disease. Mov.
Disord. 25, 2785–2791. https://doi.org/10.1002/mds.23411

204
Madhyastha, T.M., Askren, M.K., Boord, P., Zhang, J., Leverenz, J.B., Grabowski,
T.J., 2015. Cerebral perfusion and cortical thickness indicate cortical
involvement in mild Parkinson’s disease. Mov. Disord. 00, n/a-n/a.
https://doi.org/10.1002/mds.26128
Mahale, R., Yadav, R., Pal, P.K., 2015. Quality of sleep in young onset
Parkinson’s disease: Any difference from older onset Parkinson’s disease.
Parkinsonism Relat. Disord. 21, 461–4.
https://doi.org/10.1016/j.parkreldis.2015.02.007
Mahieux, F., Fénelon, G., Flahault, A., Manifacier, M.J., Michelet, D., Boller, F.,
1998. Neuropsychological prediction of dementia in Parkinson’s disease. J.
Neurol. Neurosurg. Psychiatry 64, 178–83.
Mak, E., Su, L., Williams, G.B., Firbank, M.J., Lawson, R.A., Yarnall, A.J., Duncan,
G.W., Owen, A.M., Khoo, T.K., Brooks, D.J., Rowe, J.B., Barker, R.A., Burn,
D.J., Brien, J.T.O., 2015. Baseline and longitudinal grey matter changes in
newly diagnosed Parkinson’s disease: ICICLE-PD study. Brain 138, 2974–
2986. https://doi.org/10.1093/brain/awv211
Mak, E., Zhou, J., Tan, L.C.S., Au, W.L., Sitoh, Y.Y., Kandiah, N., 2014. Cognitive
deficits in mild Parkinson’s disease are associated with distinct areas of
grey matter atrophy. J. Neurol. Neurosurg. Psychiatry 85, 576–580.
https://doi.org/10.1136/jnnp-2013-305805
Marek, K., Jennings, D., Lasch, S., Siderowf, A., Tanner, C., Simuni, T., Coffey,
C., Kieburtz, K., Flagg, E., Chowdhury, S., Poewe, W., Mollenhauer, B.,
Sherer, T., Frasier, M., Meunier, C., Rudolph, A., Casaceli, C., Seibyl, J.,
Mendick, S., Schuff, N., Zhang, Y., Toga, A., Crawford, K., Ansbach, A., de
Blasio, P., Piovella, M., Trojanowski, J., Shaw, L., Singleton, A., Hawkins, K.,
Eberling, J., Russell, D., Leary, L., Factor, S., Sommerfeld, B., Hogarth, P.,
Pighetti, E., Williams, K., Standaert, D., Guthrie, S., Hauser, R., Delgado, H.,
Jankovic, J., Hunter, C., Stern, M., Tran, B., Leverenz, J., Baca, M., Frank,
S., Thomas, C.A., Richard, I., Deeley, C., Rees, L., Sprenger, F., Lang, E.,
Shill, H., Obradov, S., Fernandez, H., Winters, A., Berg, D., Gauss, K.,
Galasko, D., Fontaine, D., Mari, Z., Gerstenhaber, M., Brooks, D., Malloy, S.,
Barone, P., Longo, K., Comery, T., Ravina, B., Grachev, I., Gallagher, K.,
Collins, M., Widnell, K.L., Ostrowizki, S., Fontoura, P., La-Roche, F.H., Ho,
T., Luthman, J., van der Brug, M., Reith, A.D., Taylor, P., 2011. The
Parkinson Progression Marker Initiative (PPMI). Prog. Neurobiol. 95, 629–
635. https://doi.org/10.1016/j.pneurobio.2011.09.005
Mattila, P.M., Rinne, J.O., Helenius, H., Dickson, D.W., Röyttä, M., 2000. Alpha-
synuclein-immunoreactive cortical Lewy bodies are associated with
cognitive impairment in Parkinson’s disease. Acta Neuropathol. 100, 285–
290. https://doi.org/10.1007/s004019900168
Mehanna, R., Moore, S., Hou, J.G., Sarwar, A.I., Lai, E.C., 2014. Comparing
clinical features of young onset, middle onset and late onset Parkinson’s
disease. Parkinsonism Relat. Disord. 20, 530–534.
https://doi.org/10.1016/j.parkreldis.2014.02.013
205
Melzer, T.R., Watts, R., MacAskill, M.R., Pitcher, T.L., Livingston, L., Keenan, R.J.,
Dalrymple-Alford, J.C., Anderson, T.J., 2012. Grey matter atrophy in
cognitively impaired Parkinson’s disease. J. Neurol. Neurosurg. Psychiatry
83, 188–194. https://doi.org/10.1136/jnnp-2011-300828
Meppelink, A.M., De Jong, B.M., Renken, R., Leenders, K.L., Cornelissen, F.W.,
Van Laar, T., 2009. Impaired visual processing preceding image recognition
in Parkinson’s disease patients with visual hallucinations. Brain 132, 2980–
2993. https://doi.org/10.1093/brain/awp223
Mihaescu, A.S., Masellis, M., Graff-Guerrero, A., Kim, J., Criaud, M., Cho, S.S.,
Ghadery, C., Valli, M., Strafella, A.P., 2018. Brain degeneration in
Parkinson’s disease patients with cognitive decline: a coordinate-based
meta-analysis. Brain Imaging Behav. 1–14. https://doi.org/10.1007/s11682-
018-9922-0
Milligan, G.W., 1980. An examination of the effect of six types of error
perturbation on fifteen clustering algorithms. Psychometrika 45, 325–342.
https://doi.org/10.1007/BF02293907
Moustafa, A.A., Chakravarthy, S., Phillips, J.R., Gupta, A., Keri, S., Polner, B.,
Frank, M.J., Jahanshahi, M., 2016. Motor symptoms in Parkinson’s disease:
A unified framework. Neurosci. Biobehav. Rev. 68, 727–740.
https://doi.org/10.1016/j.neubiorev.2016.07.010
Movement Disorder Society Task Force on Rating Scales for Parkinson’s
Disease., 2003. The Unified Parkinson’s Disease Rating Scale (UPDRS):
Status and recommendations. Mov. Disord. 18, 738–750.
https://doi.org/10.1002/mds.10473
Mu, J., Chaudhuri, K.R., Bielza, C., de Pedro-Cuesta, J., Larrañaga, P., Martinez-
Martin, P., 2017. Parkinson’s disease subtypes identified from cluster
analysis of motor and non-motor symptoms. Front. Aging Neurosci. 9, 1–10.
https://doi.org/10.3389/fnagi.2017.00301
Muslimović, D., Post, B., Speelman, J.D., De Haan, R.J., Schmand, B., 2009.
Cognitive decline in Parkinson’s disease: A prospective longitudinal study.
J. Int. Neuropsychol. Soc. 15, 426–437.
https://doi.org/10.1017/S1355617709090614
Muslimovic, D., Post, B., Speelman, J.D., Schmand, B., 2005. Cognitive profile of
patients with newly diagnosed Parkinson disease. Neurology 65, 1239–45.
Muslimović, D., Schmand, B., Speelman, J.D., De Haan, R.J., 2007. Course of
cognitive decline in Parkinson’s disease: A meta-analysis. J. Int.
Neuropsychol. Soc. 13, 920–932.
https://doi.org/10.1017/S1355617707071160
Nagano-Saito, A., Washimi, Y., Arahata, Y., Kachi, T., Lerch, J.P., Evans, A.C.,
Dagher, A., Ito, K., 2005. Cerebral atrophy and its relation to cognitive
impairment in Parkinson disease. Neurology 64, 224–9.
https://doi.org/10.1212/01.WNL.0000149510.41793.50
Nasreddine, Z., Phillips, N., Bédirian, V., Charbonneau, S., Whitehead, V., Colllin,

206
I., Cummings, J., Chertkow, H., 2005. The Montreal Cognitive Assessment,
MoCA: a brief screening tool for mild cognitive impairment. J. Am. Geriatr.
Soc. 53, 695–699. https://doi.org/10.1111/j.1532-5415.2005.53221.x
Nguyen, M. Le, Nguyen, T.T., Shimazu, A., 2007. Subtree mining for question
classification problem. IJCAI Int. Jt. Conf. Artif. Intell. 75, 1695–1700.
https://doi.org/10.1212/WNL.0b013e3181f39d0e
Noh, S.W., Han, Y.H., Mun, C.W., Chung, E.J., Kim, E.G., Ji, K.H., Seo, J.H., Kim,
S.J., 2014. Analysis among cognitive profiles and gray matter volume in
newly diagnosed Parkinson’s disease with mild cognitive impairment. J.
Neurol. Sci. 347, 210–213. https://doi.org/10.1016/j.jns.2014.09.049
Noh, Y., Lee, J.M., Kim, G.H., Yoon, C.W., Kim, H.J., Park, K.H., Heilman, K.M.,
2014. Anatomical heterogeneity of Alzheimer disease Based on cortical
thickness on MRIs. Neurology 83, 1–9.
Nutt, J.G., 2016. Motor subtype in Parkinson’s disease: Different disorders or
different stages of disease? Mov. Disord. 31, 957–961.
https://doi.org/10.1002/mds.26657
Pagano, G., Ferrara, N., Brooks, D.J., Pavese, N., 2016. Age at onset and
Parkinson disease phenotype. Neurology 86, 1400–1407.
https://doi.org/10.1212/WNL.0000000000002461
Pagonabarraga, J., Corcuera-Solano, I., Vives-Gilabert, Y., Llebaria, G., García-
Sánchez, C., Pascual-Sedano, B., Delfino, M., Kulisevsky, J., Gómez-Ansón,
B., 2013. Pattern of regional cortical thinning associated with cognitive
deterioration in Parkinson’s disease. PLoS One 8, e54980.
https://doi.org/10.1371/journal.pone.0054980
Pagonabarraga, J., Kulisevsky, J., 2012. Cognitive impairment and dementia in
Parkinson’s disease. Neurobiol. Dis. 46, 590–596.
https://doi.org/10.1016/j.nbd.2012.03.029
Pagonabarraga, J., Martinez-Horta, S., Fernández de Bobadilla, R., Pérez, J.,
Ribosa-Nogué, R., Marín, J., Pascual-Sedano, B., García, C., Gironell, A.,
Kulisevsky, J., 2016. Minor hallucinations occur in drug-naive Parkinson’s
disease patients, even from the premotor phase. Mov. Disord. 31, 45–52.
https://doi.org/10.1002/mds.26432
Pagonabarraga, J., Soriano-Mas, C., Llebaria, G., López-Solà, M., Pujol, J.,
Kulisevsky, J., 2014. Neural correlates of minor hallucinations in non-
demented patients with Parkinson’s disease. Parkinsonism Relat. Disord.
20, 290–296. https://doi.org/10.1016/J.PARKRELDIS.2013.11.017
Panzacchi, A., Moresco, R.M., Garibotto, V., Antonini, A., Gobbo, C., Isaias, I.U.,
Goldwurm, S., Bonaldi, L., Carpinelli, A., Pezzoli, G., Fazio, F., Perani, D.,
2008. A voxel-based PET study of dopamine transporters in Parkinson’s
disease: Relevance of age at onset. Neurobiol. Dis. 31, 102–109.
https://doi.org/10.1016/j.nbd.2008.03.012
Parkinson Study Group, 1989. DATATOP: A multicenter controlled clinical trial
in early Parkinson’s disease: Parkinson study group. Arch. Neurol. 46,

207
1052–1060. https://doi.org/10.1001/archneur.1989.00520460028009
Pedersen, K.F., Larsen, J.P., Tysnes, O.-B., Alves, G., 2013. Prognosis of mild
cognitive impairment in early Parkinson disease: the Norwegian ParkWest
study. JAMA Neurol. 70, 580–6.
https://doi.org/10.1001/jamaneurol.2013.2110
Péran, P., Barbagallo, G., Nemmi, F., Sierra, M., Galitzky, M., Traon, A.P.-L.,
Payoux, P., Meissner, W.G., Rascol, O., 2018. MRI supervised and
unsupervised classification of Parkinson’s disease and multiple system
atrophy. Mov. Disord. 33, 600–608. https://doi.org/10.1002/mds.27307
Pereira, J.B., Ibarretxe-Bilbao, N., Marti, M.J., Compta, Y., Junqué, C., Bargallo,
N., Tolosa, E., 2012. Assessment of cortical degeneration in patients with
Parkinson’s disease by voxel-based morphometry, cortical folding, and
cortical thickness. Hum. Brain Mapp. 33, 2521–34.
https://doi.org/10.1002/hbm.21378
Pereira, J.B., Svenningsson, P., Weintraub, D., Brønnick, K., Lebedev, A.,
Westman, E., Aarsland, D., 2014. Initial cognitive decline is associated with
cortical thinning in early Parkinson disease. Neurology 82, 2017–2025.
https://doi.org/10.1212/WNL.0000000000000483
Petersen, R., Doody, R., Kurz, A., Mohs, R., Morris, J., Rabins, P., Ritchie, K.,
Rossor, M., Thal, L., Winblad, B., 2001. Current concepts in mild cognitive
impairment. Arch. Neurol. 58, 1985–1992.
Picillo, M., Barone, P., Pellecchia, M.T., Santangelo, G., Kano, O., Ikeda, K.,
Iwasaki, Y., 2014. Evolution of mild cognitive impairment in Parkinson
disease. Neurology 82, 1384–1384.
https://doi.org/10.1212/WNL.0000000000000234
Politis, M., 2014. Neuroimaging in Parkinson disease: From research setting to
clinical practice. Nat. Rev. Neurol. 10, 708–722.
https://doi.org/10.1038/nrneurol.2014.205
Post, B., Speelman, J.D., de Haan, R.J., 2008. Clinical heterogeneity in newly
diagnosed Parkinson’s disease. J. Neurol. 255, 716–22.
https://doi.org/10.1007/s00415-008-0782-1
Postuma, R.B., Gagnon, J.F., Bertrand, J.A., Génier Marchand, D., Montplaisir,
J.Y., 2015. Parkinson risk in idiopathic REM sleep behavior disorder:
Preparing for neuroprotective trials. Neurology 84, 1104–1113.
https://doi.org/10.1212/WNL.0000000000001364
Rajput, A.A.H., Rajput, M.L., Ferguson, L.W., Rajput, A.A.H., 2017. Baseline
motor findings and Parkinson disease prognostic subtypes. Neurology 89,
138–143. https://doi.org/10.1212/WNL.0000000000004078
Ramírez-Ruiz, B., Martí, M.-J., Tolosa, E., Falcón, C., Bargalló, N., Valldeoriola, F.,
Junqué, C., 2008. Brain response to complex visual stimuli in Parkinson’s
patients with hallucinations: a functional magnetic resonance imaging study.
Mov. Disord. 23, 2335–2343. https://doi.org/10.1002/mds.22258
Ramírez-Ruiz, B., Martí, M.J., Tolosa, E., Bartrés-Faz, D., Summerfield, C.,

208
Salgado-Pineda, P., Gómez-Ansón, B., Junqué, C., 2005. Longitudinal
evaluation of cerebral morphological changes in Parkinson’s disease with
and without dementia. J. Neurol. 252, 1345–1352.
https://doi.org/10.1007/s00415-005-0864-2
Ramírez-Ruiz, B., Martí, M.J., Tolosa, E., Giménez, M., Bargalló, N., Valldeoriola,
F., Junqué, C., 2007. Cerebral atrophy in Parkinson’s disease patients with
visual hallucinations. Eur. J. Neurol. 14, 750–756.
https://doi.org/10.1111/j.1468-1331.2007.01768.x
Ravina, B., Marder, K., Fernandez, H.H., Friedman, J.H., McDonald, W., Murphy,
D., Aarsland, D., Babcock, D., Cummings, J., Endicott, J., Factor, S.,
Galpern, W., Lees, A., Marsh, L., Stacy, M., Gwinn-Hardy, K., Voon, V.,
Goetz, C., 2007. Diagnostic criteria for psychosis in Parkinson’s disease:
report of an NINDS, NIMH work group. Mov. Disord. 22, 1061–8.
https://doi.org/10.1002/mds.21382
Reijnders, J.S.A.M., Ehrt, U., Lousberg, R., Aarsland, D., Leentjens, A.F.G., 2009.
The association between motor subtypes and psychopathology in
Parkinson’s disease. Parkinsonism Relat. Disord. 15, 379–82.
https://doi.org/10.1016/j.parkreldis.2008.09.003
Reuter, M., Rosas, H.D., Fischl, B., 2010. Highly accurate inverse consistent
registration: A robust approach. Neuroimage 53, 1181–1196.
https://doi.org/10.1016/j.neuroimage.2010.07.020
Reuter, M., Schmansky, N.J., Rosas, H.D., Fischl, B., 2012. Within-subject
template estimation for unbiased longitudinal image analysis. Neuroimage
61, 1402–1418. https://doi.org/10.1016/j.neuroimage.2012.02.084
Robbins, T.W., Cools, R., 2014. Cognitive deficits in Parkinson’s disease: A
cognitive neuroscience perspective. Mov. Disord. 29, 597–607.
https://doi.org/10.1002/mds.25853
Rosenberg-Katz, K., Herman, T., Jacob, Y., Giladi, N., Hendler, T., Hausdorff,
J.M., 2013. Gray matter atrophy distinguishes between Parkinson disease
motor subtypes. Neurology 80, 1476–1484.
https://doi.org/10.1212/WNL.0b013e31828cfaa4
Schapira, A.H. V, Chaudhuri, R.K., Jenner, P., 2017. Non-motor features of
Parkinson disease. Nat. Rev. Neurosci. 18, 435–450.
https://doi.org/10.1038/nrn.2017.62
Schrag, A., Ben-Shlomo, Y., Brown, R., Marsden, C.D., Quinn, N., 1998. Young-
onset Parkinson’s disease revisited - Clinical features, natural history, and
mortality. Mov. Disord. 13, 885–894.
https://doi.org/10.1002/mds.870130605
Schrag, A., Quinn, N.P., Ben-Shlomo, Y., 2006. Heterogeneity of Parkinson’s
disease. J. Neurol. Neurosurg. Psychiatry 77, 275–6.
Schrag, A., Schott, J.M., 2006. Epidemiological, clinical, and genetic
characteristics of early-onset parkinsonism. Lancet Neurol. 5, 355–363.
https://doi.org/10.1016/S1474-4422(06)70411-2

209
Schwab, S., England, E., 1969. Projection technique for evaluating surgery in
Parkinson s disease., in: Gillingham, F., Donaldson, M. (Eds.), Third
Symposium on Parkinson s Disease. pp. 152–157.
Ségonne, F., Pacheco, J., Fischl, B., 2007. Geometrically accurate topology-
correction of cortical surfaces using nonseparating loops. IEEE Trans. Med.
Imaging 26, 518–529. https://doi.org/10.1109/TMI.2006.887364
Segura, B., Baggio, H.C., Marti, M.J., Valldeoriola, F., Compta, Y., Garcia-Diaz,
A.I., Vendrell, P., Bargallo, N., Tolosa, E., Junque, C., 2014. Cortical thinning
associated with mild cognitive impairment in Parkinson’s disease. Mov.
Disord. 29, 1495–1503. https://doi.org/10.1002/mds.25982
Seifert, K.D., Wiener, J.I., 2013. The impact of DaTscan on the diagnosis and
management of movement disorders: A retrospective study. Am. J.
Neurodegener. Dis. 2, 29–34.
Selikhova, M., Kempster, P.A., Revesz, T., Holton, J.L., Lees, A.J., 2013.
Neuropathological findings in benign tremulous Parkinsonism. Mov. Disord.
28, 145–152. https://doi.org/10.1002/mds.25220
Seppi, K., Weintraub, D., Coelho, M., Perez-Lloret, S., Fox, S.H., Katzenschlager,
R., Hametner, E.M., Poewe, W., Rascol, O., Goetz, C.G., Sampaio, C., 2011.
The movement disorder society evidence-based medicine review update:
Treatments for the non-motor symptoms of Parkinson’s disease. Mov.
Disord. 26. https://doi.org/10.1002/mds.23884
Sheikh, J., Yesavage, J., 1986. Depression Scale GDS: recent evidence and
development of a shorter version, in: Brink, T. (Ed.), Clinical Gerontology: A
Guide to Assessment and Intervention. New York, pp. 165–173.
Shih, M.C., Franco de Andrade, L.A., Amaro, E., Felicio, A.C., Ferraz, H.B.,
Wagner, J., Hoexter, M.Q., Lin, L.F., Fu, Y.K., Mari, J.J., Tufik, S., Bressan,
R.A., 2007. Higher nigrostriatal dopamine neuron loss in early than late
onset Parkinson’s disease?--a [99mTc]-TRODAT-1 SPECT study. Mov.
Disord. 22, 863–6. https://doi.org/10.1002/mds.21315
Shine, J.M., Keogh, R., O’Callaghan, C., Muller, A.J., Lewis, S.J.G., Pearson, J.,
2014. Imagine that: elevated sensory strength of mental imagery in
individuals with Parkinson’s disease and visual hallucinations. Proc. R. Soc.
B Biol. Sci. 282, 20142047–20142047.
https://doi.org/10.1098/rspb.2014.2047
Sieber, B.-A., Landis, S., Koroshetz, W., Bateman, R., Siderowf, A., Galpern,
W.R., Dunlop, J., Finkbeiner, S., Sutherland, M., Wang, H., Lee, V.M.-Y., Orr,
H.T., Gwinn, K., Ludwig, K., Taylor, A., Torborg, C., Montine, T.J.,
Parkinson’s Disease 2014: Advancing Research, I.L.C.O.C., 2014.
Prioritized research recommendations from the National Institute of
Neurological Disorders and Stroke Parkinson’s Disease 2014 Conference.
Ann. Neurol. 76, 469–472. https://doi.org/10.1002/ana.24261
Simuni, T., Caspell-Garcia, C., Coffey, C., Lasch, S., Tanner, C., Marek, K., 2016.
How stable are Parkinson’s disease subtypes in de novo patients: Analysis
of the PPMI cohort? Park. Relat. Disord. 28, 62–67.
210
https://doi.org/10.1016/j.parkreldis.2016.04.027
Smith, A., 2000. Symbol digit modalities test:Manual, 8th ed. Western
Psychological Services, Los Angeles.
Song, S.K., Lee, J.E., Park, H.J., Sohn, Y.H., Lee, J.D., Lee, P.H., 2011. The
pattern of cortical atrophy in patients with Parkinson’s disease according to
cognitive status. Mov. Disord. 26, 289–296.
https://doi.org/10.1002/mds.23477
Squire, L.R., Stark, C.E.L., Clark, R.E., 2004. THE MEDIAL TEMPORAL LOBE.
Annu. Rev. Neurosci. 27, 279–306.
https://doi.org/10.1146/annurev.neuro.27.070203.144130
St Louis, E.K., Boeve, A.R., Boeve, B.F., 2017. REMSleep Behavior Disorder in
Parkinson’s Disease and Other Synucleinopathies. Mov. Disord. 32, 645–
658. https://doi.org/10.1002/mds.27018
Starkstein, S.E., Mayberg, H.S., Preziosi, T.J., Andrezejewski, P., Leiguarda, R.,
Robinson, R.G., 1992. Reliability, validity, and clinical correlates of apathy in
Parkinson’s disease. J. Neuropsychiatry Clin. Neurosci. 4, 134–139.
https://doi.org/10.1176/jnp.4.2.134
Stebbins, G.T., Goetz, C.G., Burn, D.J., Jankovic, J., Khoo, T.K., Tilley, B.C.,
2013. How to identify tremor dominant and postural instability/gait difficulty
groups with the movement disorder society unified Parkinson’s disease
rating scale: Comparison with the unified Parkinson’s disease rating scale.
Mov. Disord. 28, 668–670. https://doi.org/10.1002/mds.25383
Stroop, J.R., 1935. Studies of interference in serial verbal reactions. J. Exp.
Psychol. 18, 643–662. https://doi.org/10.1037/h0054651
Summerfield, C., Junqué, C., Tolosa, E., Salgado-Pineda, P., Gómez-Ansón, B.,
Martí, M.J., Pastor, P., Ramírez-Ruíz, B., Mercader, J., 2005. Structural brain
changes in parkinson disease with dementia: A voxel-based morphometry
study. Arch. Neurol. 62, 281–285. https://doi.org/10.1001/archneur.62.2.281
Svenningsson, P., Westman, E., Ballard, C., Aarsland, D., 2012. Cognitive
impairment in patients with Parkinson’s disease: Diagnosis, biomarkers, and
treatment. Lancet Neurol. 11, 697–707. https://doi.org/10.1016/S1474-
4422(12)70152-7
Szeto, J.Y.Y., Mowszowski, L., Gilat, M., Walton, C.C., Naismith, S.L., Lewis,
S.J.G., 2015a. Assessing the utility of the Movement Disorder Society Task
Force Level 1 diagnostic criteria for mild cognitive impairment in
Parkinson’s disease. Park. Relat. Disord. 21, 31–35.
https://doi.org/10.1016/j.parkreldis.2014.10.020
Szeto, J.Y.Y., O’Callaghan, C., Shine, J.M., Walton, C.C., Mowszowski, L.,
Naismith, S.L., Halliday, G.M., Lewis, S.J.G., 2015b. The relationships
between mild cognitive impairment and phenotype in Parkinson’s disease.
Parkinsons. Dis. 1, 1–7. https://doi.org/10.1038/npjparkd.2015.15
Tam, C.W.C., Burton, E.J., McKeith, I.G., Burn, D.J., O’Brien, J.T., 2005.
Temporal lobe atrophy on MRI in Parkinson disease with dementia A

211
comparison with Alzheimer disease and dementia with Lewy bodies.
Neurology 64(5), 861–865.
Tang, H., Huang, J., Nie, K., Gan, R., Wang, L.L., Zhao, J., Huang, Z., Zhang, Y.,
Wang, L.L., 2016. Cognitive profile of Parkinson’s disease patients: a
comparative study between early-onset and late-onset Parkinson’s disease.
Int. J. Neurosci. 126, 227–234.
https://doi.org/10.3109/00207454.2015.1010646
Tessa, C., Lucetti, C., Giannelli, M., Diciotti, S., Poletti, M., Danti, S., Baldacci, F.,
Vignali, C., Bonuccelli, U., Mascalchi, M., Toschi, N., Radiology, D., Hospital,
V., Viareggio, A., Lu, C., 2014. Progression of brain atrophy in the early
stages of Parkinson’s disease: A longitudinal tensor-based morphometry
study in de novo patients without cognitive impairment. Hum. Brain Mapp.
35, 3932–3944. https://doi.org/10.1002/hbm.22449
Thenganatt, M.A., Jankovic, J., 2014. Parkinson disease subtypes. JAMA Neurol.
71, 499–504. https://doi.org/10.1001/jamaneurol.2013.6233
Toledo, J.B., Gopal, P., Raible, K., Irwin, D.J., Brettschneider, J., Sedor, S., Waits,
K., Boluda, S., Grossman, M., Van Deerlin, V.M., Lee, E.B., Arnold, S.E.,
Duda, J.E., Hurtig, H., Lee, V.M.Y., Adler, C.H., Beach, T.G., Trojanowski,
J.Q., 2016. Pathological α-synuclein distribution in subjects with coincident
Alzheimer’s and Lewy body pathology. Acta Neuropathol. 131, 393–409.
https://doi.org/10.1007/s00401-015-1526-9
Tolosa, E., Compta, Y., Gaig, C., 2007. The premotor phase of Parkinson’s
disease. Park. Relat. Disord. 13, 2–7.
https://doi.org/10.1016/j.parkreldis.2007.06.007
Tolosa, E., Gaig, C., Santamaría, J., Compta, Y., 2009. Diagnosis and the
premotor phase of Parkinson disease. Neurology 72, S12–S20.
https://doi.org/10.1212/WNL.0b013e318198db11
Tomlinson, C.L., Stowe, R., Patel, S., Rick, C., Gray, R., Clarke, C.E., 2010.
Systematic review of levodopa dose equivalency reporting in Parkinson’s
disease. Mov. Disord. 25, 2649–2653. https://doi.org/10.1002/mds.23429
Trunk, G. V., 1979. A Problem of Dimensionality: A Simple Example. IEEE Trans.
Pattern Anal. Mach. Intell. PAMI-1, 306–307.
https://doi.org/10.1109/TPAMI.1979.4766926
Van Rooden, S.M., Colas, F., Martínez-Martín, P., Visser, M., Verbaan, D.,
Marinus, J., Chaudhuri, R.K., Kok, J.N., Van Hilten, J.J., 2011. Clinical
subtypes of Parkinson’s disease. Mov. Disord. 26, 51–8.
https://doi.org/10.1002/mds.23346
Van Rooden, S.M., Heiser, W.J., Kok, J.N., Verbaan, D., Van Hilten, J.J., Marinus,
J., 2010. The identification of Parkinson’s disease subtypes using cluster
analysis: A systematic review. Mov. Disord. 25, 969–978.
https://doi.org/10.1002/mds.23116
Venderploeg, R.D., LaLone, L. V., Greblo, P., Schinka, J.A., 1997. Odd-Even
Short Forms of the Judgment of Line Orientation Test. Appl. Neuropsychol.
212
4, 244–246. https://doi.org/10.1207/s15324826an0404_6
Vervoort, G., Leunissen, I., Firbank, M., Heremans, E., Nackaerts, E.,
Vandenberghe, W., Nieuwboer, A., 2016. Structural brain alterations in
motor subtypes of Parkinson’s disease: Evidence from probabilistic
tractography and shape analysis. PLoS One 11, 1–17.
https://doi.org/10.1371/journal.pone.0157743
Visser, M., Marinus, J., Stiggelbout, A.M., Van Hilten, J.J., 2004. Assessment of
autonomic dysfunction in Parkinson’s disease: The SCOPA-AUT. Mov.
Disord. 19, 1306–1312. https://doi.org/10.1002/mds.20153
Ward, J.H., 1963. Hierarchical grouping to optimize an objective function. J. Am.
Stat. Assoc. https://doi.org/10.1080/01621459.1963.10500845
Wechsler, D., 1999. Escala de inteligencia de Weschler para adultos-III. TEA,
Madrid.
Weil, R.S., Schrag, A.E., Warren, J.D., Crutch, S.J., Lees, A.J., Morris, H.R.,
2016. Visual dysfunction in Parkinson’s disease. Brain 139, 2827–2843.
https://doi.org/10.1093/brain/aww175
Weintraub, D., Dietz, N., Duda, J.E., Wolk, D.A., Doshi, J., Xie, S.X., Davatzikos,
C., Clark, C.M., Siderowf, A., 2012. Alzheimer’s disease pattern of brain
atrophy predicts cognitive decline in Parkinson’s disease. Brain 135, 170–
80. https://doi.org/10.1093/brain/awr277
Whitwell, J.L., 2009. Voxel-based morphometry: an automated technique for
assessing structural changes in the brain. J. Neurosci. 29, 9661–4.
https://doi.org/10.1523/JNEUROSCI.2160-09.2009
Whitwell, J.L., Przybelski, S. a., Weigand, S.D., Ivnik, R.J., Vemuri, P., Gunter,
J.L., Senjem, M.L., Shiung, M.M., Boeve, B.F., Knopman, D.S., Parisi, J.E.,
Dickson, D.W., Petersen, R.C., Jack, C.R., Josephs, K.A., 2009. Distinct
anatomical subtypes of the behavioural variant of frontotemporal dementia:
A cluster analysis study. Brain 132, 2932–2946.
https://doi.org/10.1093/brain/awp232
Wickremaratchi, M.M., Knipe, M.D.W., Sastry, B.S.D., Morgan, E., Jones, A.,
Salmon, R., Weiser, R., Moran, M., Davies, D., Ebenezer, L., Raha, S.,
Robertson, N.P., Butler, C.C., Ben-Shlomo, Y., Morris, H.R., 2011. The
motor phenotype of Parkinson’s disease in relation to age at onset. Mov.
Disord. 26, 457–463. https://doi.org/10.1002/mds.23469
Williams-Gray, C.H., Evans, J.R., Goris, A., Foltynie, T., Ban, M., Robbins, T.W.,
Brayne, C., Kolachana, B.S., Weinberger, D.R., Sawcer, S.J., Barker, R.A.,
2009a. The distinct cognitive syndromes of Parkinson’s disease: 5 year
follow-up of the CamPaIGN cohort. Brain 132, 2958–2969.
https://doi.org/10.1093/brain/awp245
Williams-Gray, C.H., Foltynie, T., Brayne, C., Robbins, T.W., Barker, R.A., 2007.
Evolution of cognitive dysfunction in an incident Parkinson’s disease cohort.
Brain 130, 1787–1798. https://doi.org/10.1093/brain/awm111
Williams-Gray, C.H., Goris, A., Saiki, M., Foltynie, T., Compston, D., Sawcer, S.J.,
213
Barker, R.A., 2009b. Apolipoprotein e genotype as a risk factor for
susceptibility to and dementia in Parkinson’s Disease. J. Neurol. 256, 493–
498. https://doi.org/10.1007/s00415-009-0119-8
Williams-Gray, C.H., Mason, S.L., Evans, J.R., Foltynie, T., Brayne, C., Robbins,
T.W., Barker, R.A., 2013. The CamPaIGN study of Parkinson’s disease: 10-
year outlook in an incident population-based cohort. J. Neurol. Neurosurg.
Psychiatry 84, 1258–1264. https://doi.org/10.1136/jnnp-2013-305277
Williams, D.R., Lees, A.J., 2005. Visual hallucinations in the diagnosis of
idiopathic Parkinson’s disease: a retrospective autopsy study. Lancet.
Neurol. 4, 605–10. https://doi.org/10.1016/S1474-4422(05)70146-0
Wilson, H., Niccolini, F., Pellicano, C., Politis, M., 2019. Cortical thinning across
Parkinson’s disease stages and clinical correlates. J. Neurol. Sci. 398, 31–
38. https://doi.org/10.1016/j.jns.2019.01.020
Winblad, B., Palmer, K., Kivipelto, M., Jelic, V., Fratiglioni, L., Wahlund, L.-O.,
Nordberg, A., Backman, L., Albert, M., Almkvist, O., Arai, H., Basun, H.,
Blennow, K., de Leon, M., DeCarli, C., Erkinjuntti, T., Giacobini, E., Graff, C.,
Hardy, J., Jack, C., Jorm, A., Ritchie, K., van Duijn, C., Visser, P., Petersen,
R.C., 2004. Mild cognitive impairment - beyond controversies, towards a
consensus: report of the International Working Group on Mild Cognitive
Impairment. J. Intern. Med. 256, 240–246. https://doi.org/10.1111/j.1365-
2796.2004.01380.x
Winer, J.R., Maass, A., Pressman, P., Stiver, J., Schonhaut, D.R., Baker, S.L.,
Kramer, J., Rabinovici, G.D., Jagust, W.J., 2018. Associations Between Tau,
β-Amyloid, and Cognition in Parkinson Disease. JAMA Neurol. 75, 227.
https://doi.org/10.1001/jamaneurol.2017.3713
Xuan, M., Guan, X., Gu, Q., Shen, Z., Yu, X., Qiu, T., Luo, X., Song, R., Jiaerken,
Y., Xu, X., Huang, P., Luo, W., Zhang, M., 2017. Different iron deposition
patterns in early- and middle-late-onset Parkinson’s disease. Park. Relat.
Disord. 44, 23–27. https://doi.org/10.1016/j.parkreldis.2017.08.013
Yao, N., Shek-Kwan Chang, R., Cheung, C., Pang, S., Lau, K.K., Suckling, J.,
Rowe, J.B., Yu, K., Ka-Fung Mak, H., Chua, S.-E., Ho, S.L., McAlonan, G.M.,
2014. The default mode network is disrupted in Parkinson’s disease with
visual hallucinations. Hum. Brain Mapp. 35, 5658–66.
https://doi.org/10.1002/hbm.22577
Yarnall, A.J., Breen, D.P., Duncan, G.W., Khoo, T.K., Coleman, S.Y., Firbank,
M.J., Nombela, C., Winder-Rhodes, S., Evans, J.R., Rowe, J.B., Mollenhauer,
B., Kruse, N., Hudson, G., Chinnery, P.F., O’Brien, J.T., Robbins, T.W.,
Wesnes, K., Brooks, D.J., Barker, R. a, Burn, D.J., 2014. Characterizing mild
cognitive impairment in incident Parkinson disease: the ICICLE-PD study.
Neurology 82, 308–16. https://doi.org/10.1212/WNL.0000000000000066
Zuo, L.J., Piao, Y.S., Li, L.X., Yu, S.Y., Guo, P., Hu, Y., Lian, T.H., Wang, R.D., Yu,
Q.J., Jin, Z., Wang, Y.J., Wang, X.M., Chan, P., Chen, S. Di, Wang, Y.J.,
Zhang, W., 2017. Phenotype of postural instability/gait difficulty in Parkinson
disease: Relevance to cognitive impairment and mechanism relating

214
pathological proteins and neurotransmitters. Sci. Rep. 7, 1–9.
https://doi.org/10.1038/srep44872


Related Documents