Tomorrow’s Progress Today Q3 FY’16 Earnings Presentation Apar Industries Ltd

Welcome message from author
This document is posted to help you gain knowledge. Please leave a comment to let me know what you think about it! Share it to your friends and learn new things together.
Transcript

Apar Industries Limited Earnings Presentation | Q3 FY'16
1
Tomorrow’s Progress Today
Corporate Presentation
Q3 FY’16 Earnings Presentation
Apar Industries Ltd

Apar Industries Limited Earnings Presentation | Q3 FY'16
2
Safe Harbor
This presentation may have certain statements that may be “forward looking” including those relating to general business plans and strategy of Apar Industries Ltd., its future outlook and growth prospects. The actual results may differ materially from these forward looking statements due to a number of risks and uncertainties which could include future changes or developments in Apar Industries Ltd.(Apar), the competitive environment, the company’s ability to implement its strategies and initiatives, respond to technological changes as well as sociopolitical, economic and regulatory conditions in India.
All financial data in this presentation is obtained from the audited/unaudited financial statements and the various ratios are calculated based on these data. This presentation does not constitute a prospectus, offering circular or offering memorandum or an offer, invitation or a solicitation of any offer, to purchase or sell, any shares of Apar and should not be considered or construed in any manner whatsoever as a recommendation that any person should subscribe for or purchase any of Apar’s shares. None of the projection, expectations, estimates or prospects in this presentation should be construed as a forecast implying any indicative assurance or guarantee of future performance, nor that the assumptions on which such future projects, expectations, estimates or prospects have been prepared are complete or comprehensive .
This presentation is for information purposes only. This document and its contents should not forwarded or delivered or transmitted in any manner to any person other than its intended recipients, and should not be reproduced in any manner whatsoever. The recipients further represents and warrants that : (i) It is lawfully able to receive this presentation under the laws of the jurisdiction in which it is located, and / or any other applicable laws, (ii) It is not a U.S. person, (iii) This presentation is furnished to it, and has been received, outside of the United States, and (iv) It will not reproduce, publish, disclose, redistribute or transmit this presentation, directly or indirectly, into the United States or to any U.S. person either within or outside of recipient’s organisation.

Apar Industries Limited Earnings Presentation | Q3 FY'16
3
Consolidated Financials Figures in Rs Cr
Q3FY16: Profitability grows despite industry headwinds
Revenue stabilized by growth in Cable segment and Volume growth in Oils segment
Rs 1,203 Cr Robust 47% YoY growth in Cables
segment partially offsets the decline in Oils & Conductors as
Raw Material prices falls
Up ~263bps YoY driven by increased margins in Specialty Oils & Cables
7.1% Rs 69 Cr Includes exceptional gain of Rs 43 Cr from treasury
shares sale
Revenue EBITDA Margin PAT PBT bef exceptional
3.3% Up ~281bps with
improved profitability
• Export as well as domestic market stays challenging due to aggressive pricing trends. Rate of improvement of market conditions remains slow.
• Strong order book of Transmission players at ~Rs 13,968 Cr is expected to improve demand in near future.
• Current order book up by Rs 207 Cr at Rs 1,809 Cr.
• Volumes up 10% YoY with growth across all product groups.
• Revenues impacted as global crude prices continue to be under pressure.
• Margins improve with better operational management and strong growth in Automotive & Industrial Lubricants business in Q3FY’16.
• Revenue up 47% at Rs 206 Cr. • Robust Order book at Rs 224 Cr, up
24% YoY. • Focus on Renewable energy sees
increased orders from Wind Mill & Solar segments.
• Business from Defence & Railways improved compared to last quarters.
Conductors Speciality Oils & Auto Lubes Cables

Apar Industries Limited Earnings Presentation | Q3 FY'16
4
UDAY (Ujwal DISCOM Assurance Yojana) provides for the financial turnaround and revival of Power DISCOMs. States shall take over 75% of DISCOMs debt as on 30 Sep’ 15 over 2 years.
- 15 States agrees to join UDAY- Andhra Pradesh, Rajasthan, Jharkhand, Madhya Pradesh, Uttarakhand, Himachal Pradesh, Punjab, Jammu & Kashmir, Haryana, Gujarat, Chhattisgarh, Uttar Pradesh, Bihar, Odisha & Maharashtra.
- 3 states already signed MOU- Rajasthan has became third state after Jharkhand & Chhattisgarh to sign MOU. - Discom recast on track, Rs 1 lakh Cr bonds to be issued soon- UDAY, made a promising start with key states coming on
board & bonds worth Rs 70,000 Cr - 1 lakh Cr likely to be issued in the next three months.
Rs 9,000 Cr Warangal Project expected to be awarded in February- The Warangal project is one of the projects to be auctioned out Rs 1 Lakh Cr projects announced by Power ministry and the largest so far in this year.
Cabinet revises power tariff policy - The announced amendments guide the regulators while setting power tariffs. - Promotes renewable energy by incentivising distribution companies to procure clean energy. - Allows producers to sell power that state utilities fail to procure as per commitments to industrial customers through
exchanges.
Recent Government initiatives to boost Indian Power Sector
Transmission sector progress until Dec 31, 2015:
Source: BSE Website
Key Q3FY’16 Transmission Orders:
System Type End of 10th plan
End of 11th plan
As on Dec 2015
End of 12th plan
Expected Addition
AC transmission Lines(In C Kms) 1,92,535 2,48,049 3,23,522 3,48,049 24,527 HVDC (In C Kms) 5,872 9,432 12,938 16,872 3,934 Total (In C Kms) 1,98,407 2,57,481 3,36,460 3,64,921 28,461 AC Substations Transformation Capacity (In MVA) 2,49,439 3,99,801 6,18,056 6,69,801 51,745
HVDC (In MVA) 8,200 9,750 15,000 22,500 7,500 Total (In MVA) 2,57,639 4,09,551 6,33,056 6,92,301 59,245 Inter-regional transmission Capacity (In MW) 14,050 27,750 55,950 65,550 18,100
Company Order Value (Rs Cr)
Kalpataru Power Transmission Ltd 1,207
KEC International 822
Power Grid 7,032
Larsen & Toubro 2,311
Sterlite Grid 2,596
Total 13,968
Source: CEA Website

Apar Industries Limited Earnings Presentation | Q3 FY'16
5
Financial Performance
Business performance
Company Overview
Annexure

Apar Industries Limited Earnings Presentation | Q3 FY'16
6
Figures in Rs Cr
9%
Q3 FY’16 (Consol): Significant improvement in Margins
Cables segment witnessed strong growth in the quarter, however Conductors & Speciality Oils revenues declined on account of sluggish business conditions & falling commodity prices.
EBITDA increased 45% YoY from Rs 59 Cr in Q3FY'15 to Rs 85 Cr in Q3FY'16 driven by improved profitability in Speciality Oils as well as Cables.
PAT increased from Rs 5 Cr in Q3FY’15 to Rs 26 Cr in Q3FY’16. PAT Margin at 2.2%. - Excludes exceptional gain of Rs 43 Cr on the sale of treasury shares.
Revenue EBITDA (Margin %) PAT *(Margin %)
Q3 FY’15
Q3 FY’16
Consolidated Figures in Rs Cr
1,329
1,203
9%
85 (7.1%)
59 (4.4%)
45%
5 (0.3%)
26 (2.2%)
* After adjusting exceptional gains
460%
Apar Industries Limited Earnings Presentation | Q3 FY'16
7
Figures in Rs Cr
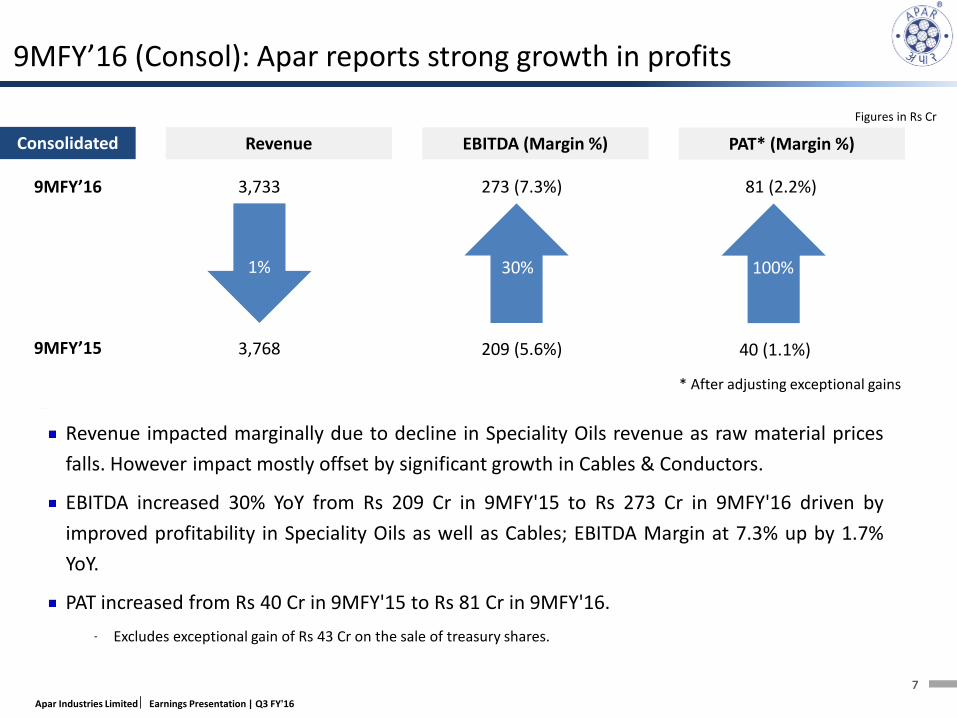
Revenue impacted marginally due to decline in Speciality Oils revenue as raw material prices falls. However impact mostly offset by significant growth in Cables & Conductors.
EBITDA increased 30% YoY from Rs 209 Cr in 9MFY'15 to Rs 273 Cr in 9MFY'16 driven by improved profitability in Speciality Oils as well as Cables; EBITDA Margin at 7.3% up by 1.7% YoY.
PAT increased from Rs 40 Cr in 9MFY'15 to Rs 81 Cr in 9MFY'16. - Excludes exceptional gain of Rs 43 Cr on the sale of treasury shares.
1% 30%
9MFY’16 (Consol): Apar reports strong growth in profits
Revenue EBITDA (Margin %) PAT* (Margin %)
9MFY’15
9MFY’16
Consolidated
3,768
3,733
1%
273 (7.3%)
209 (5.6%)
30%
40 (1.1%)
81 (2.2%)
* After adjusting exceptional gains
100%

Apar Industries Limited Earnings Presentation | Q3 FY'16
8
Financial Performance
Segmental Overview
Company Overview
Annexure
Business Performance

Apar Industries Limited Earnings Presentation | Q3 FY'16
9
* After adjusting open period forex
Figures in Rs Cr
Revenue decreased 17% YoY from Rs 656 Cr in Q3FY'15 to Rs 542 Cr in Q3FY'16 due to some despatches being held back and the back log is likely to be cleared in Q4FY’16. Exports contributed 50% to revenues. Capacity utilisation at 100% for 5th consecutive quarter. Order book at Rs 1,809 Cr as on Dec 31, 2015 compared to Rs 1,602 Cr as on Sep 30, 2015. Export orders contributed 43% of order book. EBITDA per MT, post forex adjustment increased by 10% to reach Rs 7,150 in Q3FY’16 from Rs 6,488 in Q3FY’15. New capacity addition project in Odisha going as per schedule, the plant is expected to be commissioned by Q3FY’17.
Conductors EBITDA per MT improved in a stressed pricing scenario
656
542
Revenue EBITDA (Margin %)
EBITDA (Rs per MT)
17% 30% 30%
EBITDA (post adj*)
EBITDA post adj* (Rs per MT)
35 (5.3%)
28 (5.2%)
20%
8,303
7,589
9%
27 (4.1%)
26 (4.8%)
6,488
7,150
10%
Q3 FY’15
Q3 FY’16
3%
Apar Industries Limited Earnings Presentation | Q3 FY'16
10
* After adjusting open period forex
Figures in Rs Cr
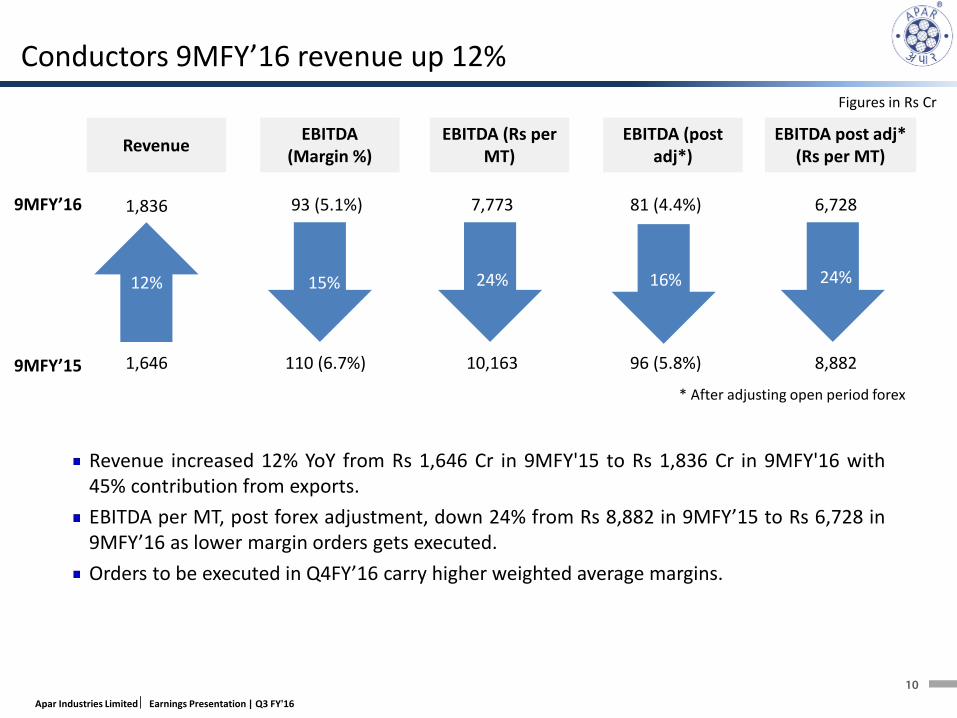
Revenue increased 12% YoY from Rs 1,646 Cr in 9MFY'15 to Rs 1,836 Cr in 9MFY'16 with 45% contribution from exports. EBITDA per MT, post forex adjustment, down 24% from Rs 8,882 in 9MFY’15 to Rs 6,728 in 9MFY’16 as lower margin orders gets executed. Orders to be executed in Q4FY’16 carry higher weighted average margins.
Conductors 9MFY’16 revenue up 12%
1,646
1,836
Revenue EBITDA (Margin %)
EBITDA (Rs per MT)
12% 30% 30%
EBITDA (post adj*)
EBITDA post adj* (Rs per MT)
110 (6.7%)
93 (5.1%)
15%
10,163
7,773
24%
96 (5.8%)
81 (4.4%)
8,882
6,728
24%
9MFY’15
9MFY’16
16%

Apar Industries Limited Earnings Presentation | Q3 FY'16
11
* After adjusting open period forex
Figures in Rs Cr
Revenue down 15% YoY from Rs 531 Cr in Q3FY'15 to Rs 453 Cr in Q3FY'16 on account of falling oil prices. Significant expansion in EBITDA post forex, from Rs 1,096 per KL in Q3FY’15 to Rs 4,975 per KL in Q3FY’16 driven by significant growth in Industrial & Automotive Lubricants and Transformer Oil exports. Total shipment increased 10% YoY from 77,336 KL in Q3FY’15 to 85,369 KL in Q3FY’16.
Speciality Oils: Margins up significantly with strategic initiatives
531
453
Revenue EBITDA (Margin %)
EBITDA (Rs per KL)
Q3FY'15
Q3FY'16
15% 30% 30%
Volume (KL) EBITDA (post adj*)
EBITDA post adj* (Rs per KL)
17 (3.2%)
45 (10.0%)
165%
2,135
5,308
149%
8 (1.5%)
42 (9.3%)
425%
1,096
4,975
354%
77,336
85,369
10%
Apar Industries Limited Earnings Presentation | Q3 FY'16
12
* After adjusting open period forex
Figures in Rs Cr
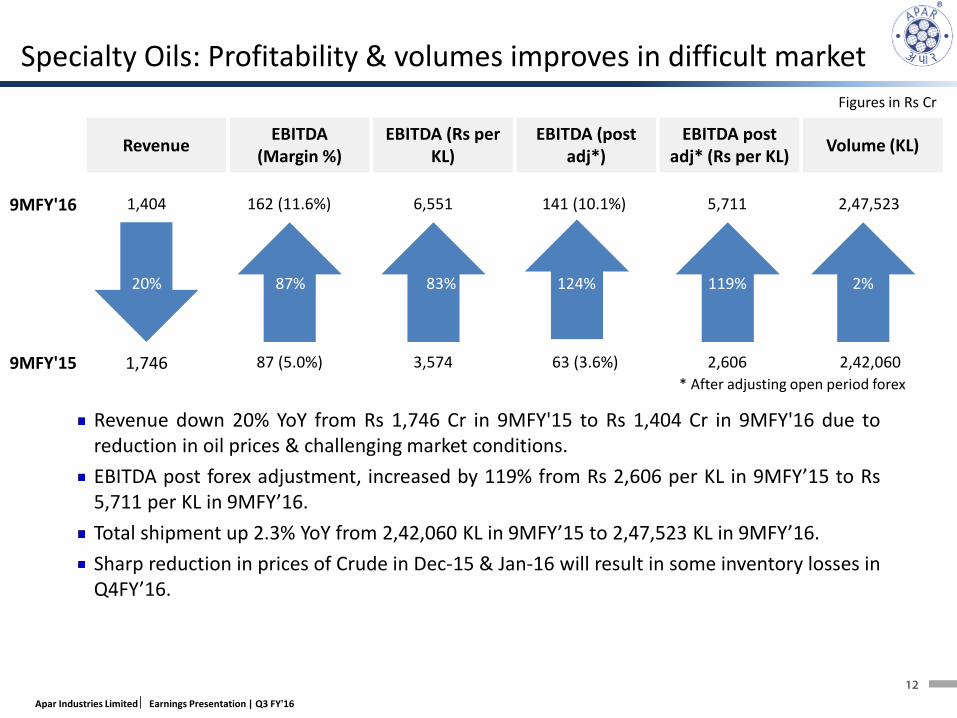
Revenue down 20% YoY from Rs 1,746 Cr in 9MFY'15 to Rs 1,404 Cr in 9MFY'16 due to reduction in oil prices & challenging market conditions. EBITDA post forex adjustment, increased by 119% from Rs 2,606 per KL in 9MFY’15 to Rs 5,711 per KL in 9MFY’16. Total shipment up 2.3% YoY from 2,42,060 KL in 9MFY’15 to 2,47,523 KL in 9MFY’16. Sharp reduction in prices of Crude in Dec-15 & Jan-16 will result in some inventory losses in Q4FY’16.
Specialty Oils: Profitability & volumes improves in difficult market
1,746
1,404
Revenue EBITDA (Margin %)
EBITDA (Rs per KL)
9MFY'15
9MFY'16
20% 30% 30%
Volume (KL) EBITDA (post adj*)
EBITDA post adj* (Rs per KL)
87 (5.0%)
162 (11.6%)
87%
3,574
6,551
83%
63 (3.6%)
141 (10.1%)
124%
2,606
5,711
119%
2,42,060
2,47,523
2%

Apar Industries Limited Earnings Presentation | Q3 FY'16
13
Automotive segment sales improved by 8.3% compared to same period last year but retail market sales continues to be sluggish.
Higher Profitability from Automotive segment on account of disciplined pricing, improved product mix and lower raw material cost.
Company continues to focus on expanding distribution reach, along with improving product mix, to sell more high margin high performance products.
Auto Lubes: Profitability improves despite a challenging quarter

Apar Industries Limited Earnings Presentation | Q3 FY'16
14
* After adjusting open period forex
Figures in Rs Cr
Revenue up 47% YoY from Rs 140 Cr in Q3FY'15 to Rs 206 Cr in Q3FY'16. EBITDA Margin post forex adjustment increased to 7.8% in Q3FY’16 from 6.4% in Q3FY’15 with better cost controls across all products. Elastomeric Cables grew by 77% and Power Cables grew by 59% YoY. Further consolidation of Leadership position in Renewable sector yielding high results, increased orders from Wind Mills & Solar Companies along with Defence & Railways orders.
Cables segment posts robust growth in revenue & margins
Revenue EBITDA (Margin %) Order Book
Q3 FY’15
Q3 FY’16
140
206
47%
12 (8.6%)
17 (8.3%)
180
224
24%
16 (7.8%)
9 (6.4%)
EBITDA (post adj*)
42% 78%
Apar Industries Limited Earnings Presentation | Q3 FY'16
15
* After adjusting open period forex
Figures in Rs Cr
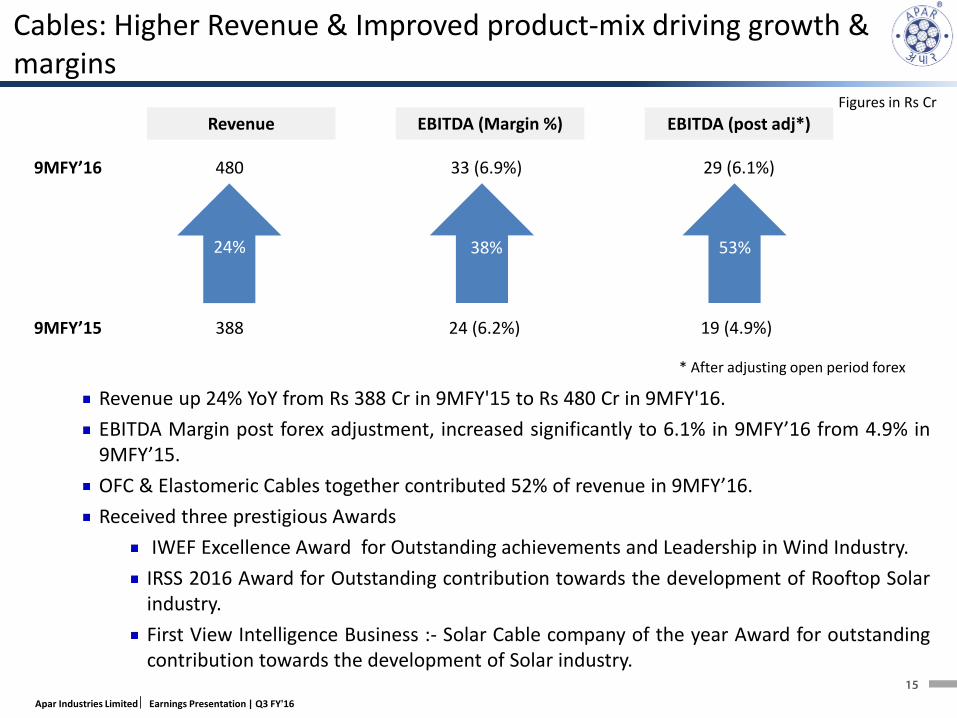
Cables: Higher Revenue & Improved product-mix driving growth & margins
9MFY’15
9MFY’16
Revenue
388
480
24%
EBITDA (Margin %)
24 (6.2%)
33 (6.9%)
38%
29 (6.1%)
19 (4.9%)
EBITDA (post adj*)
53%
Revenue up 24% YoY from Rs 388 Cr in 9MFY'15 to Rs 480 Cr in 9MFY'16. EBITDA Margin post forex adjustment, increased significantly to 6.1% in 9MFY’16 from 4.9% in 9MFY’15. OFC & Elastomeric Cables together contributed 52% of revenue in 9MFY’16. Received three prestigious Awards
IWEF Excellence Award for Outstanding achievements and Leadership in Wind Industry. IRSS 2016 Award for Outstanding contribution towards the development of Rooftop Solar industry. First View Intelligence Business :- Solar Cable company of the year Award for outstanding contribution towards the development of Solar industry.

Apar Industries Limited Earnings Presentation | Q3 FY'16
16
Financial Performance
Business Performance
Power Sector Overview
Annexure
Company Overview

Apar Industries Limited Earnings Presentation | Q3 FY'16
17
Dominating global presence in power transmission & distribution • 3rd largest conductors manufacturer and 4th largest transformer oil manufacturer in the world
Diverse Portfolio • Over 400 types of specialty and automotive oils; largest range of conventional and new
generation conductors and a comprehensive range of power and telecommunication cables
Driving growth through innovation • Pioneer in adoption of new technologies and development of value added products creating new
market segments through in-house research & development programmes
Trusted by prominent customers • Multi-year relationships with Indian and global majors. Exports to 100 countries; plants
strategically located close to ports in India
Strong Alliances • Brand and manufacturing alliance with global energy leader ENI S.P.A Italy and technical alliance
with CTC Global (USA) for manufacture of new generation carbon composite conductors
Expanding growth canvas on the back of robust financials • Successfully entering and expanding new markets and business segments • 18% 5-year CAGR in revenues, 11% 5 yr CAGR in EBITDA
Conductors
Transformer & Sp Oil
Cables
Auto Lubes
Global leader in Conductors & Transformer Oils

Apar Industries Limited Earnings Presentation | Q3 FY'16
18
Conductors Specialty Oils
Since 1969 Since 1958
23% market share Total Capacity: 150,000MTA Silvassa : 82629MT Umbergaon : 20868MT Athola : 46000MT 45% revenue contribution
45% market share Total Capacity:4,42,000KL Rabale : 222,000KL Silvassa : 220,000 KL
38% revenue contribution
Cables
Since 2008
Acquired Uniflex in 2008 Grew sales from Rs 129 Cr to Rs 556 Cr
11% revenue contribution 5.4% revenue contribution
Auto Lubes Licensing Agreement with ENI, Italy for ENI brand Successful national rollout Registered sales of Rs 275 Cr in FY15
Since 2007
With established presence across diverse businesses

Apar Industries Limited Earnings Presentation | Q3 FY'16
19
Market Leader in key segments
Best in class technology &
diversified products
Strong relationships with large clientele Strong export market
• Top 5 largest producer in conductors and Sp Oil in the world.
• 60% market share in power transformer oil and 40% in distribution transformer oil in India
• Among largest bare overhead aluminum conductor manufacturers in India with market share of 23%
• Technology tie up with CTC-Global, USA for ACCC conductors.
• Pioneer in Aluminum alloy rod and conductors in India
• Manufactures over 300 different types of Specialty Oils
• Launched India’s most advanced E-beam facility; will help make superior cables
• Among first to test successfully 765KV & 800KV conductors in India
• Best in class in-house R&D center and NABL accredited QC labs
• Preferred supplier to over 80 % of its speciality oil customers in India
• Product & plant approvals from many large clients across the globe
• Supplies conductors to all top 25 global turnkey operators and leading utilities
• Exports to over 100 countries across the world
• Exports at 33% of total sales in FY15
• Developed green field conductor plant in Athola with focus on exports
• Largest Indian conductor exporter
• Developing export market in new territories. Exported conductors to USA, EU, middle east, Africa and Latin America
Diversified into new business for growth
• Entered Auto lubes in 2007 under ENI brand through Licensing Agreement with ENI Italy
• Acquired Uniflex to enter Cables business
• Has setup Electron Beam irradiation facility for cables and other products
Competitive strengths

Apar Industries Limited Earnings Presentation | Q3 FY'16
20
Figures in Rs Cr Sustained 18% CAGR revenue growth driven by growth in all segments. . . .
986 1,326 1,363
2,195
1,650
2,318
FY10 FY11 FY12 FY13 FY14 FY15
19% CAGR
1,107
1,544
1,958 2,037 2,395
2,224
FY10 FY11 FY12 FY13 FY14 FY15
15% CAGR
128 183
315 355 404
569 556
FY09 FY10 FY11 FY12 FY13 FY14 FY15
28% CAGR
Consolidated Revenue
Conductors Cables Specialty Oils
2,236 3,033
3,595 4,651 4,633
5,122
FY10 FY11 FY12 FY13 FY14 FY15
18% CAGR
Maintained strong revenue growth over the years
Export, 33%
Domestic, 67%
744 1025 1400 1555 1,673
2289 2569 3251 3078
3,449
FY11 FY12 FY13 FY14 FY15Exports Domestic
Exports grew at 22% CAGR Revenue Geographic Break-up
Apar Industries Limited Earnings Presentation | Q3 FY'16
21
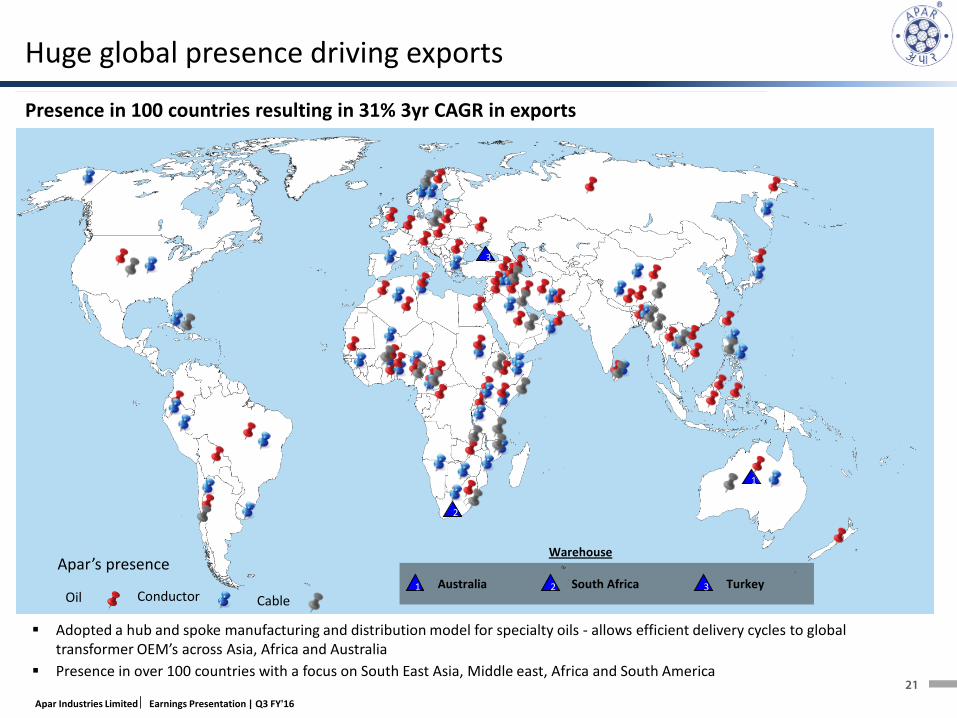
Presence in 100 countries resulting in 31% 3yr CAGR in exports
Warehouse
1 Australia 2 South Africa 3 Turkey
1
2
3
Apar’s presence
Oil Conductor Adopted a hub and spoke manufacturing and distribution model for specialty oils - allows efficient delivery cycles to global
transformer OEM’s across Asia, Africa and Australia Presence in over 100 countries with a focus on South East Asia, Middle east, Africa and South America
Cable
Huge global presence driving exports

Apar Industries Limited Earnings Presentation | Q3 FY'16
22
Financial Performance
Business Performance
Company Overview
Financial Overview
Annexure

Apar Industries Limited Earnings Presentation | Q3 FY'16
23
Q3 FY'16 : Profit & Loss Statement- Standalone
Particulars (Rs Cr) Q3 FY'16 Q3 FY'15 % Chg YoY Q2 FY'16 % Chg QoQ 9MFY'16 9MFY'15 % Chg YoY FY'15 Net sales 1,179.7 1,290.4 -8.6% 1,241.2 (5.0%) 3,661.5 3,644.9 0.5% 4,968.7 Other Operating Income 6.5 8.4 (22.6%) 9.6 (32.2%) 23.4 28.1 (16.7%) 42.3 Total Operating Income 1,186.2 1,298.8 -8.7% 1,250.9 (5.2%) 3,684.9 3,673.0 0.3% 5,011.0 Total Expenditure 1,104.2 1,242.6 -11.1% 1,161.2 (4.9%) 3,420.0 3,476.2 (1.6%) 4,769.7 Cost of Raw Materials 878.3 1,045.2 -16.0% 963.3 (8.8%) 2,801.9 2,889.4 (3.0%) 3,985.9 Employees Cost 22.6 18.3 23.5% 23.2 -2.4% 68.2 52.5 29.9% 70.0 Other Expenditure 203.4 179.1 13.6% 174.7 16.4% 550.2 534.3 3.0% 713.8 Transfer to Capital Asset 0.1 - NM 0.0 399.7% 0.2 - NM 0.0 Profit from operations before other income, finance costs and exceptional items
82.0 56.2 46.0% 89.7 -8.6% 264.9 196.8 34.6% 241.2
Other Income 1.7 0.2 NM 1.0 74.4% 2.9 8.3 (64.6%) 8.4 EBITDA 83.7 56.3 48.7% 90.7 -7.7% 267.8 205.1 30.6% 249.6 Depreciation 9.5 8.2 15.8% 9.3 2.9% 27.7 22.8 21.4% 31.0 EBIT 74.2 48.1 54.3% 81.4 -8.9% 240.1 182.3 31.7% 218.6 Interest & Finance charges 25.8 15.0 72.4% 18.4 40.1% 62.7 49.0 27.8% 65.4
Applicable net loss on foreign currency transactions and translation 10.3 29.4 -64.8% 26.2 -60.5% 60.6 79.2 -23.5% 84.7
Profit from ordinary activities after finance costs but before exceptional items
38.0 3.7 NM 36.8 3.3% 116.8 54.1 116.1% 68.5
Exceptional items- Expense/(Income) -43.1 - NM - NM -43.1 - NM 0.3 PBT 81.2 3.7 NM 36.8 120.6% 160.0 54.1 195.9% 68.2 Tax Expense 13.1 1.2 NM 12.4 6.3% 39.9 15.4 158.7% 20.4 Net Profit 68.0 2.6 NM 24.4 178.5% 120.1 38.6 210.8% 47.9 Minority Interest (profit)/loss - - - - - - - - - Net Profit after taxes, minority interest 68.0 2.6 NM 24.4 178.5% 120.1 38.6 210.8% 47.9

Apar Industries Limited Earnings Presentation | Q3 FY'16
24
Key Ratios – Standalone
Key Ratios (%) Q3 FY'16 Q3 FY'15 Q2 FY'16 9MFY'16 9MFY'15
EBITDA Margin 7.1% 4.3% 7.2% 7.3% 5.6%
Net Margin 5.7% 0.2% 2.0% 3.3% 1.1%
Total Expenditure/ Total Operating Income 93.1% 95.7% 92.8% 92.8% 94.6%
Raw Material Cost/ Total Operating Income 74.0% 80.5% 77.0% 76.0% 78.7%
Staff Cost/ Total Operating Income 1.9% 1.4% 1.9% 1.9% 1.4%
Other Expenditure/ Total Operating Income 17.1% 13.8% 14.0% 14.9% 14.5%

Apar Industries Limited Earnings Presentation | Q3 FY'16
25
Q3 FY'16 : Standalone Segment Analysis
Segment (Rs Cr) Q3 FY'16 Q3 FY'15 %YoY Q2 FY'16 % QoQ 9MFY'16 9MFY'15 % Chg YoY FY'15 Revenue Conductors 542.0 655.6 -17.3% 653.8 (17.1%) 1,835.5 1,645.6 -11.5% 2,320.1 Transformer & Specialty Oils 434.8 501.0 (13.2%) 457.1 (4.9%) 1,355.3 1,627.9 (16.7%) 2,115.2 Power & Telecom Cables 205.9 139.7 47.4% 133.8 -53.9% 479.7 388.2 -23.6% 560.1 Others/Unallocated 7.1 5.5 28.5% 8.8 -19.5% 22.8 17.6 29.7% 23.4 Total 1,189.8 1,301.7 -8.6% 1,253.5 (5.1%) 3,693.4 3,679.2 -0.4% 5,018.8 Less: Inter - Segment Revenue 3.6 2.9 23.9% 2.7 34.1% 8.5 6.2 36.0% 7.8 Revenue from Operations 1,186.2 1,298.8 -8.7% 1,250.9 (5.2%) 3,684.9 3,673.0 -0.3% 5,011.0 Segment Results before Interest and Tax - - 0.0% - 0.0% - - 0.0% - Conductors 25.1 32.1 -21.9% 28.8 -12.8% 85.3 103.4 -17.6% 117.4 Transformer & Specialty Oils 41.4 12.3 236.2% 54.7 -24.3% 150.2 77.8 93.2% 98.1 Power and Telecom Cables 13.5 8.2 -64.8% 4.3 -214.0% 22.3 13.8 -62.0% 20.1 Others/Unallocated 0.6 0.3 78.7% 0.2 210.2% 1.6 1.6 2.1% 2.1 Total 80.5 52.9 52.2% 87.9 -8.4% 259.4 196.5 32.0% 237.6 Less : Finance costs (net) 36.2 44.4 -18.4% 44.6 -18.9% 123.2 128.2 -3.9% 150.1 Less : Unallocable expenditure net of income -36.8 4.8 NM 6.5 NM -23.8 14.3 NM 19.3 Profit before Tax 81.2 3.7 2069.9% 36.8 120.7% 160.0 54.1 195.9% 68.2 Segment Results – % to Segment Revenue
Conductors 4.6% 4.9% 4.4% 4.6% 6.3% 5.1% Transformer & Specialty Oils 9.5% 2.5% 12.0% 11.1% 4.8% 4.6% Power and Telecom Cables 6.5% 5.8% 3.2% 4.6% 3.5% 3.6% Total 6.8% 4.1% 7.0% 7.0% 5.3% 4.7%
Segment contribution- as % to total revenue Q3 FY'16 Q3 FY'15 Q2 FY'16 9MFY'16 9MFY'15 FY'15 Conductors 45.6% 50.4% 52.2% 49.7% 44.7% 46.2% Transformer & Specialty Oils 36.5% 38.5% 36.5% 36.7% 44.2% 42.1% Power and Telecom Cables 17.3% 10.7% 10.7% 13.0% 10.6% 11.2%

Apar Industries Limited Earnings Presentation | Q3 FY'16
26
Balance Sheet Statement – Consolidated : FY’15
Balance Sheet FY’15 FY’14 Liabilities Total Shareholder's Funds 730 696 Minority Interest 1 2 Non-current Liabilities:
(a) Long-term borrowings 95 70 (b) Deferred tax liabilities (net) 27 22 (c) Other-long term liabilities 2 7 (d) Long-term provisions 4 3
Total Non-Current Liabilities 128 102 Current Liabilities:
(a) Short-term borrowings 387 708 (b) Trade payables 1,573 1367 (c) Other current liabilities 121 98 (d) Short-term provisions 16 24
Total Current Liabilities 2,096 2198 Total Liabilities 2,956 2998 Assets Total Non-Current Assets 450 422 Current Assets:
(a) Current investments 5 2 (b) Inventories 944 1017 (c) Trade receivables 1267 1104 (d) Cash and bank balances 100 231 (e) Short-term loans and advances 151 175 (f) Other current assets 39 48
Total Current Assets 2,506 2576 Total Assets 2,956 2998

Apar Industries Limited Earnings Presentation | Q3 FY'16
27
As on Dec 31, 2015 Outstanding shares – 3,84,96,769
Promoter, 58.2%
FII, 8.5%
DII, 11.2%
Bodies Corporate, 14.7%
Others, 7.4% Major Non-Promoter Shareholders Shareholding (%)
Templeton Strategic Emerging Markets Funds 9.45
HDFC Trustee company 6.77
Reliance Capital 3.52
Goldman Sachs 2.94
Raiffeisen Kapitalanlage 2.54 FIL Investments (Mauritius) Ltd. 1.78 Aadi Financial Advisors 1.11 Kedia Securities Pvt Ltd 1.04
Shareholding pattern

Apar Industries Limited Earnings Presentation | Q3 FY'16
28
Contact us
For any Investor Relations queries, please contact:
Sanjaya Kunder Apar industries Ltd Phone: +91 22 67800400 Email: [email protected]
Nisha Kakran Phone: +91 22 4215 3659 Mumbai [email protected]
This presentation may have certain statements that may be “forward looking” including those relating to general business plans and strategy of Apar Industries Ltd., its future outlook and growth prospects. The actual results may differ materially from these forward looking statements due to a number of risks and uncertainties which could include future changes or developments in Apar Industries Ltd.(Apar), the competitive environment, the company’s ability to implement its strategies and initiatives, respond to technological changes as well as sociopolitical, economic and regulatory conditions in India.
All financial data in this presentation is obtained from the audited/unaudited financial statements and the various ratios are calculated based on these data. This presentation does not constitute a prospectus, offering circular or offering memorandum or an offer, invitation or a solicitation of any offer, to purchase or sell, any shares of Apar and should not be considered or construed in any manner whatsoever as a recommendation that any person should subscribe for or purchase any of Apar’s shares. None of the projection, expectations, estimates or prospects in this presentation should be construed as a forecast implying any indicative assurance or guarantee of future performance, nor that the assumptions on which such future projects, expectations, estimates or prospects have been prepared are complete or comprehensive .
This presentation is for information purposes only. This document and its contents should not forwarded or delivered or transmitted in any manner to any person other than its intended recipients, and should not be reproduced in any manner whatsoever. The recipients further represents and warrants that : (i) It is lawfully able to receive this presentation under the laws of the jurisdiction in which it is located, and / or any other applicable laws, (ii) It is not a U.S. person, (iii) This presentation is furnished to it, and has been received, outside of the United States, and (iv) It will not reproduce, publish, disclose, redistribute or transmit this presentation, directly or indirectly, into the United States or to any U.S. person either within or outside of recipient’s organisation.
Safe Harbor:
Seema Shukla Phone: +91 124 425 1443 Gurgaon [email protected]
Related Documents