Apar Industries Ltd. Tomorrow's Progress Today Q3FY'14 Earnings Presentation

Welcome message from author
This document is posted to help you gain knowledge. Please leave a comment to let me know what you think about it! Share it to your friends and learn new things together.
Transcript

Apar Industries Limited Earnings Presentation | Q3FY'14
Apar Industries Ltd.
Tomorrow's Progress Today
Q3FY'14 Earnings Presentation

Apar Industries Limited Earnings Presentation | Q3FY'14
Successfully growing exports: from 920cr in 9MFY13 to 940cr in 9MFY’14. Oil exports up 9% and
Cable exports grew 500% in 9MFY14
Undertaking measures to curtail volatility in forex by increasing forward cover in oil division from
90 to 120 days.
Capacities expanded to drive growth in high value products: • Athola conductors plant focused on high quality products for the exports is now operating at
full capacity of 3,000 Mt per month • Khatalwad cable plant with a capital cost of Rs 107cr fully commissioned: increased utilisation
of the expanded E-beam, Elastomeric and telecom cable facilities
Orders flow in for new businesses: • First order for high margin HTLS conductors - Rs 15cr order from Orissa Transmission (OPTCL)
for ACCC conductors • First E-beam order from Navy (Goa shipyard) in the quarter and approval from RDSO (Railways)
for Electrical Locomotives
Growing high margin automotive lubricant business through focussed marketing and promotional
efforts 2
Key strategic initiatives undertaken to strengthen the company
Apar Industries Limited Earnings Presentation | Q3FY'14
Financial Performance
3
Business performance
Company Overview
Annexure

Apar Industries Limited Earnings Presentation | Q3FY'14
Q3 FY’14 (Standalone): Stable revenues in a difficult environment
1138
1080
99 (8.7%)
55 (5.1%)
33 (2.9%)
15 (1.4%)
Revenue EBFTDA (Margin %) Profit after Tax (Margin %)
Q3 FY’13
Q3 FY’14
Standalone
4
44% 56% 5%
Figures in Rs Cr
Revenue down 5% YoY from Rs 1,138cr in Q3FY'13 to Rs 1,080cr in Q3FY'14 due to lower revenue from conductors. However, oils and cables continue on strong growth path, revenues up 36% for both segments
EBFTDA down 44% YoY from Rs 99cr in Q3FY'13 to Rs 55cr in Q3FY'14 due to drop in conductors, partly offset by robust growth in oil (79%) and cables (52%).
PAT down 56% YoY from Rs 33cr in Q3FY'13 to Rs 15cr in Q3FY'14
Due to volatility and depreciation in the rupee, hedging cost increased to 8.5% per annum leading to an increase in overall finance cost.
EBFTDA – Earnings before finance cost, tax, depreciation and amortisation

Apar Industries Limited Earnings Presentation | Q3FY'14
Q3 FY’14 (Consolidated ): Navigating in tough market conditions
1243
1118
48 (3.9%)
29 (2.6%)
34 (2.7%)
19 (1.7%)
Revenue PBT (Margin %) Profit after Tax (Margin %)
Q3 FY’13
Q3 FY’14
Consolidated
5
40% 43% 10%
Figures in Rs Cr
Revenue down 10% YoY from Rs 1,243cr in Q3FY'13 to Rs 1,118cr in Q3FY'14 due to lower conductors revenue, effect of decline in conductors partially offset by higher revenue in oil and cable divisions.
PBT down 40% YoY from Rs 48cr in Q3FY'13 to Rs 29cr in Q3FY'14.
PAT down 43% YoY from Rs 34cr in Q3FY'13 to Rs 19cr in Q3FY'14.
Due to volatility and depreciation in the rupee, hedging cost have increased to 8.5% per annum leading to an increase in overall finance cost.

Apar Industries Limited Earnings Presentation | Q3FY'14
9M FY’14(Standalone): EBFTDA grows 7%; touches Rs 230cr
3368
3165
215(6.4%)
230(7.3%)
73 (2.2%)
57 (1.8%)
Revenue EBFTDA (Margin %) Profit after Tax (Margin %)
Figures in Cr
9M FY’13
9M FY’14
Standalone
6
7% 22% 6%
Revenue down 6% YoY from Rs 3,368cr in 9MFY'13 to Rs 3,165cr in 9MFY'14 due to lower revenues from conductors business partly offset by increase in revenue from oil (17%) and cable (38%).
EBFTDA up 7% YoY from Rs 215cr in 9MFY'13 to Rs 230cr in 9MFY'14 with margin expansions in oil and cables.
PAT down 22% YoY from Rs 73cr in 9MFY'13 to Rs 57cr in 9MFY'14

Apar Industries Limited Earnings Presentation | Q3FY'14
3535
3260
109(3.1%)
101(3.1%)
78(2.2%)
70 (2.1%)
Revenue PBT (Margin %) Profit after Tax (Margin)
Figures in Cr
9M FY’13
9M FY’14
Consolidated
7
7% 10% 8%
Revenue down 8% YoY from Rs 3,535cr in 9MFY'13 to Rs 3,260cr in 9MFY'14 due to lower revenue from conductors, growth in oil and cables business partly offsetting impact of decline in conductors
PBT Margin down 7% YoY from Rs 109cr in 9MFY'13 to Rs 101cr in 9MFY'14
PAT down 10% YoY from Rs 78cr in 9MFY'13 to Rs 70cr in 9MFY'14
9M FY’14 (Consolidated): Revenue at Rs 3,260cr

Apar Industries Limited Earnings Presentation | Q3FY'14
Financial Performance
Segmental Overview
Company Overview
Annexure
8
Business Performance
Apar Industries Limited Earnings Presentation | Q3FY'14
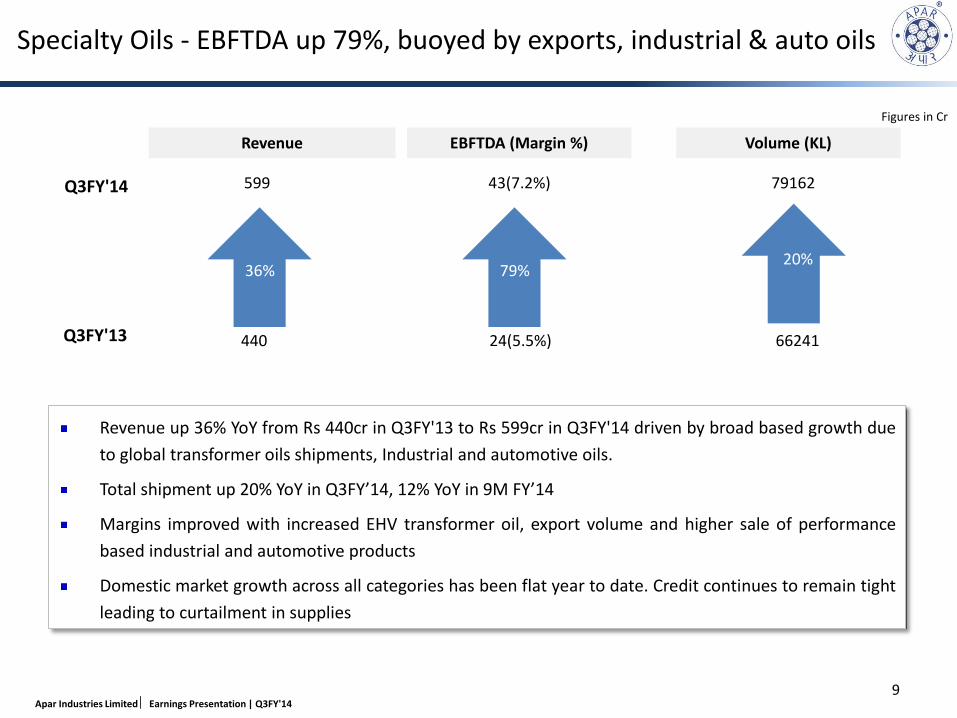
Specialty Oils - EBFTDA up 79%, buoyed by exports, industrial & auto oils
440
599
24(5.5%)
43(7.2%)
66241
79162
Revenue EBFTDA (Margin %) Volume (KL)
Q3FY'13
Q3FY'14
Revenue up 36% YoY from Rs 440cr in Q3FY'13 to Rs 599cr in Q3FY'14 driven by broad based growth due to global transformer oils shipments, Industrial and automotive oils.
Total shipment up 20% YoY in Q3FY’14, 12% YoY in 9M FY’14
Margins improved with increased EHV transformer oil, export volume and higher sale of performance based industrial and automotive products
Domestic market growth across all categories has been flat year to date. Credit continues to remain tight leading to curtailment in supplies
9
36% 20%
Figures in Cr
79%

Apar Industries Limited Earnings Presentation | Q3FY'14
Conductors : Sluggish domestic demand being offset with exports
Revenue EBFTDA (Margin %) Order Book
Revenue down 44% YoY from Rs 583cr in Q3FY'13 to Rs 324cr in Q3FY'14 due to sluggish domestic demand, delayed customer projects and withheld dispatches in the absence of clear financial instruments from customers
Export order book grew strongly (92%) during the quarter. Received total orders of Rs 770cr in Q3FY’14 of which export contributes Rs 493cr. Pending orders up from Rs 1,110cr to Rs 1,569cr during the quarter
Received first order for high margin HTLS conductors from Orissa Transmission (OPTCL) for advanced high technology ACCC on turnkey basis(of Rs 15cr)
Order book of Rs 1,569cr as on 1st Jan 2014 and a pipeline of Rs 787cr. Strict credit control policy prevented company to accept risky business from clients with unsound cash flow conditions
EBFTDA down 80% YoY from Rs 79cr in Q3 FY’13 to Rs 16 cr in Q3 FY’14. Pressure on margins due to lack of PGCIL tenders as it is destocking its conductors inventory
10
Figures in Cr
583
324
80%
79(13.6%)
16(4.9%)
1402
1569
Q3FY'13
Q3FY'14
44% 12%
Apar Industries Limited Earnings Presentation | Q3FY'14
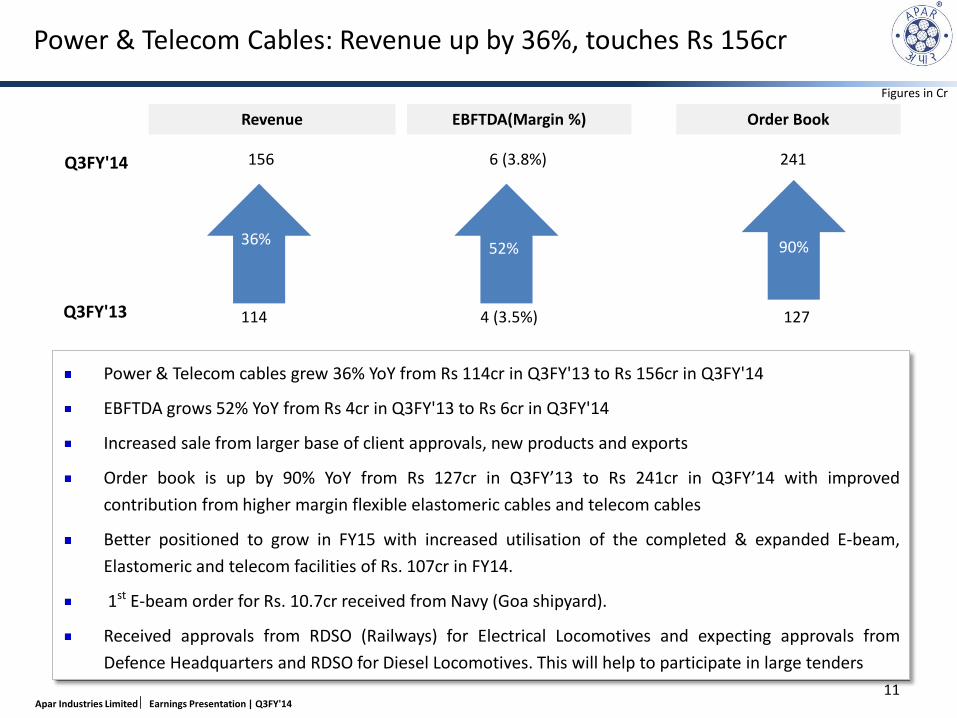
Power & Telecom Cables: Revenue up by 36%, touches Rs 156cr
114
156
4 (3.5%)
6 (3.8%)
127
241
Revenue EBFTDA(Margin %) Order Book
Q3FY'13
Q3FY'14
Power & Telecom cables grew 36% YoY from Rs 114cr in Q3FY'13 to Rs 156cr in Q3FY'14
EBFTDA grows 52% YoY from Rs 4cr in Q3FY'13 to Rs 6cr in Q3FY'14
Increased sale from larger base of client approvals, new products and exports
Order book is up by 90% YoY from Rs 127cr in Q3FY’13 to Rs 241cr in Q3FY’14 with improved contribution from higher margin flexible elastomeric cables and telecom cables
Better positioned to grow in FY15 with increased utilisation of the completed & expanded E-beam, Elastomeric and telecom facilities of Rs. 107cr in FY14.
1st E-beam order for Rs. 10.7cr received from Navy (Goa shipyard).
Received approvals from RDSO (Railways) for Electrical Locomotives and expecting approvals from Defence Headquarters and RDSO for Diesel Locomotives. This will help to participate in large tenders
11
90% 36% 52%
Figures in Cr

Apar Industries Limited Earnings Presentation | Q3FY'14
Automotive volumes up 8% in Q3FY14 and 6% in 9MFY’14, despite challenging market conditions Sales of high margin performance products being successfully driven through promotions and direct channel marketing efforts Sales to OEMs up by more than 50% in 9MFY’14 YoY Strong focus on Indian motorcycle segment resulting in 10% growth in volumes. India is the largest motorcycle market in the world Sustained healthy cash flow/collections despite difficult financial environment due to prudent balancing of sales v/s. client exposure
12
Automotive Lubricants business continues to grow

Apar Industries Limited Earnings Presentation | Q3FY'14
Financial Performance
Business Performance
Power Sector Overview
Annexure
13
Company Overview
Apar Industries Limited Earnings Presentation | Q3FY'14
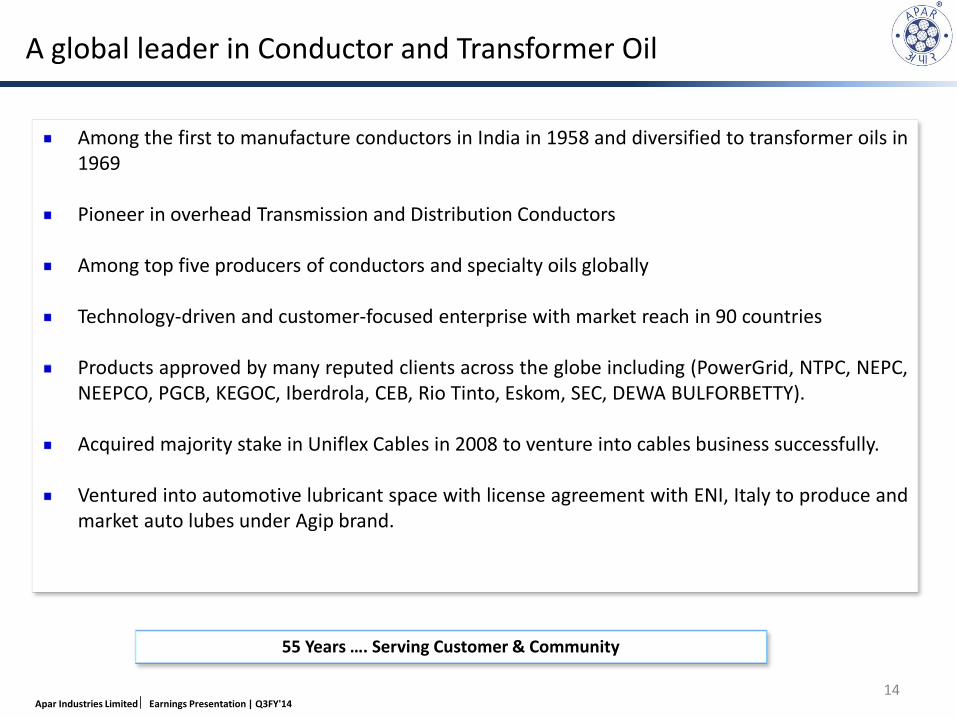
A global leader in Conductor and Transformer Oil
Among the first to manufacture conductors in India in 1958 and diversified to transformer oils in 1969 Pioneer in overhead Transmission and Distribution Conductors Among top five producers of conductors and specialty oils globally Technology-driven and customer-focused enterprise with market reach in 90 countries
Products approved by many reputed clients across the globe including (PowerGrid, NTPC, NEPC, NEEPCO, PGCB, KEGOC, Iberdrola, CEB, Rio Tinto, Eskom, SEC, DEWA BULFORBETTY). Acquired majority stake in Uniflex Cables in 2008 to venture into cables business successfully. Ventured into automotive lubricant space with license agreement with ENI, Italy to produce and market auto lubes under Agip brand.
55 Years …. Serving Customer & Community
14

Apar Industries Limited Earnings Presentation | Q3FY'14
Business Structure
• Since 1990 • Umbergaon plant:
Capacity 88935KM • Acquired Uniflex in
2008
• Since 2007 • Licensing Agreement
with ENI, Italy for Agip brand
• Since 1958 • 23% market share • Silvassa Plant:
82629MT • Umbergaon Plant:
20868MT • Athola Plant:
36,000MT
• Since 1969 • 45% market share • Rabale Plant:
222,000KL • Silvassa Plant: 220,000
KL
Speciality Oil (Revenue: 38%)
Conductors (Revenue: 48%)
Power & Telecom Cables
(Revenue: 9%)
Automotive Lubricants
(Revenue: 5%)
15

Apar Industries Limited Earnings Presentation | Q3FY'14
Competitive strengths
Market Leader in key segments
Best in class technology &
diversified products
Strong relationship with large clientele Strong export market
• Top 5 largest producer in conductors and Sp Oil in the world.
• 60% market share in power transformer oil and 40% in distribution transformer oil in India
• Among largest bare overhead aluminum conductor manufacturers in India with market share of 23%
• Technology tie up with CTC-Global, USA for ACCC conductors.
• Pioneer in Aluminum alloy rod and conductors in India
• Manufactures over 300 different types of Specialty Oils
• Launched India’s most advanced E-beam facility; will help make superior cables
• Among first to test successfully 765KV & 800KV conductors in India
• Best in class in-house R&D center and NABL accredited QC labs
• Preferred supplier to over 80 % of its speciality oil customers in India
• The company got product & plant approvals from many large clients across the globe
• Supplies conductors to all top 25 global turnkey operators and leading utilities
• Exports to more than 90 countries
• Exports grew to 43% of total sales in FY13 from 29% in FY12
• Developed green field conductor plant in Athola with focus on exports
• Largest Indian conductor exporter last year
• Developing export market in new territories. Exported conductors to USA for the first time in FY13
Diversified into new business for growth
• Entered in Auto lubes in 2007 under Agip brand through Licensing Agreement with ENI Italy
• Acquired Uniflex to enter Cables business
• Has setup Electron Beam irradiation facility for cables and other products
16
Apar Industries Limited Earnings Presentation | Q3FY'14
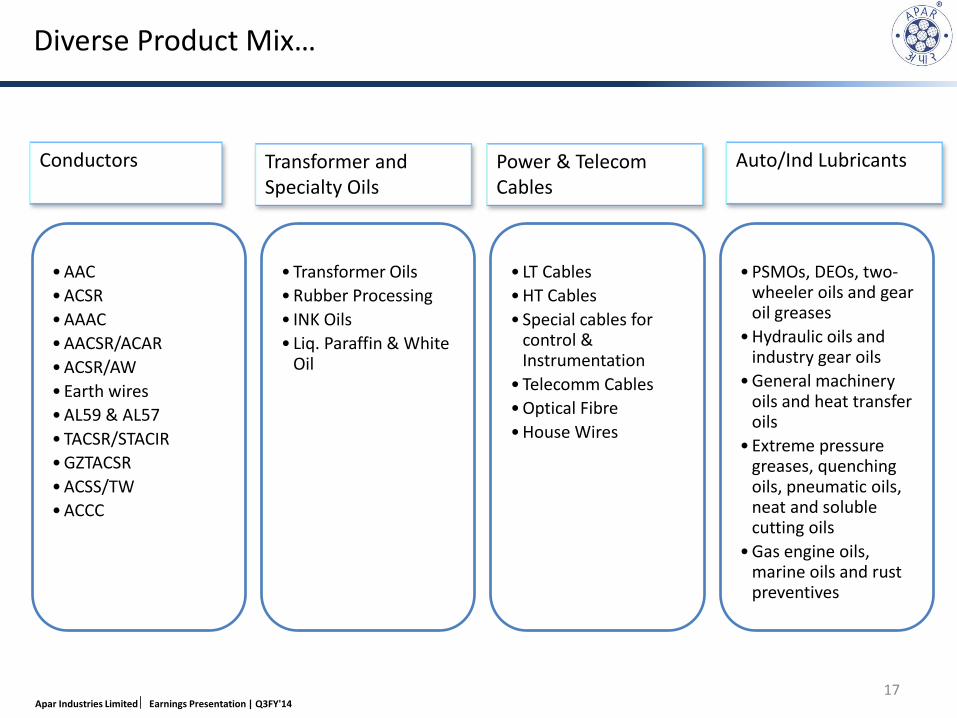
Diverse Product Mix…
•AAC •ACSR •AAAC •AACSR/ACAR •ACSR/AW •Earth wires •AL59 & AL57 •TACSR/STACIR •GZTACSR •ACSS/TW •ACCC
•Transformer Oils •Rubber Processing • INK Oils • Liq. Paraffin & White
Oil
• LT Cables •HT Cables • Special cables for
control & Instrumentation
•Telecomm Cables •Optical Fibre •House Wires
•PSMOs, DEOs, two-
wheeler oils and gear oil greases
•Hydraulic oils and industry gear oils
•General machinery oils and heat transfer oils
•Extreme pressure greases, quenching oils, pneumatic oils, neat and soluble cutting oils
•Gas engine oils, marine oils and rust preventives
Transformer and Specialty Oils
Conductors
Power & Telecom Cables
Auto/Ind Lubricants
17

Apar Industries Limited Earnings Presentation | Q3FY'14
95
183
315 355
419
050
100150200250300350400450
FY09 FY10 FY11 FY12 FY13
986
1,326 1,363
2,226
50
550
1,050
1,550
2,050
2,550
FY10 FY11 FY12 FY13
1,107
1,544
1,958 2,039
70
570
1,070
1,570
2,070
2,570
FY10 FY11 FY12 FY13
2,236
3,033 3,595
4,651
150650
1,1501,6502,1502,6503,1503,6504,1504,6505,150
FY10 FY11 FY12 FY13
Strong revenue growth over the years
18
Consol Revenue
Transformer & Sp Oil
Conductor
Figures in Rs Cr
Power & Telecom Cables
28% CAGR
31% CAGR
45% CAGR 23% CAGR

Apar Industries Limited Earnings Presentation | Q3FY'14
Global Presence
Presence across 90 countries
19
Manufacturing Units. Rabale (Maharashtra), Silvassa & Athola (Union Territory of Dadra and Nagar Haveli), Umbergaon & Khatalwad (Gujarat)
Apar Industries Limited Earnings Presentation | Q3FY'14 20
Financial Performance
Business Performance
Company Overview
Financial Overview
Annexure

Apar Industries Limited Earnings Presentation | Q3FY'14
Q3FY'14 : Profit & Loss Statement – Standalone
Particulars (Rs Cr) Q3 FY'14 Q3 FY'13 % Chg YoY Q2 FY‘14 % Chg
QoQ 9M FY’14 9M FY’13 %Y-o-Y
Net sales 1071.7 1131.1 -5.2 1129.8 -5.1 3,139.4 3,342.9 -6.1 Other operating income 8.2 7.0 17.1 10.4 -20.9 26.1 24.8 5.4 Total Operating Income 1079.9 1138.1 -5.1 1140.2 -5.3 3,165.5 3,367.7 -6.0 Total Expenditure 1024.7 1039.3 -1.4 1040.6 -1.5 2,935.1 3,152.4 -6.9 Consumption of Raw Materials 864.8 888.8 -2.7 872.9 -0.9 2,467.9 2,672.9 -7.7 Employees Cost 14.8 12.7 17.0 16.0 -7.6 44.5 39.1 13.8 Other Expenditure 145.1 137.8 5.3 151.7 -4.3 422.7 440.3 -4.0 EBFTDA 55.2 98.8 -44.1 99.6 -44.6 230.3 215.3 7.0 Depreciation 6.8 5.5 24.6 6.6 3.1 19.4 16.3 18.9 EBIT 48.4 93.3 -48.1 93.0 -47.9 210.9 199.0 6.0 Interest & Finance charges -2.4 2.6 -191.6 -4.8 -51.1 (10.8) 11.3 -195.5 Applicable net loss on foreign currency transactions and translation 27.8 44.4 -37.3 53.8 -48.2 140.3 87.2 60.9
Other Income 0.0 0.8 -100.1 2.3 -100.0 4.1 1.6 153.2 Profit from ordinary activities after finance costs but before exceptional items 22.9 47.1 -51.1 46.3 -50.5 85.5 102.1 -16.3
Exceptional items 0.0 0.0 NA 0.7 -100.0 0.9 0.1 549.1 PBT 22.9 47.1 -51.3 45.6 -49.8 84.6 102.0 -17.0 Tax Expense 8.3 14.1 -41.1 13.7 -39.5 27.8 29.4 -5.7 PAT 14.6 33.0 -55.7 31.9 -54.2 56.9 72.5 -21.6
21
Apar Industries Limited Earnings Presentation | Q3FY'14
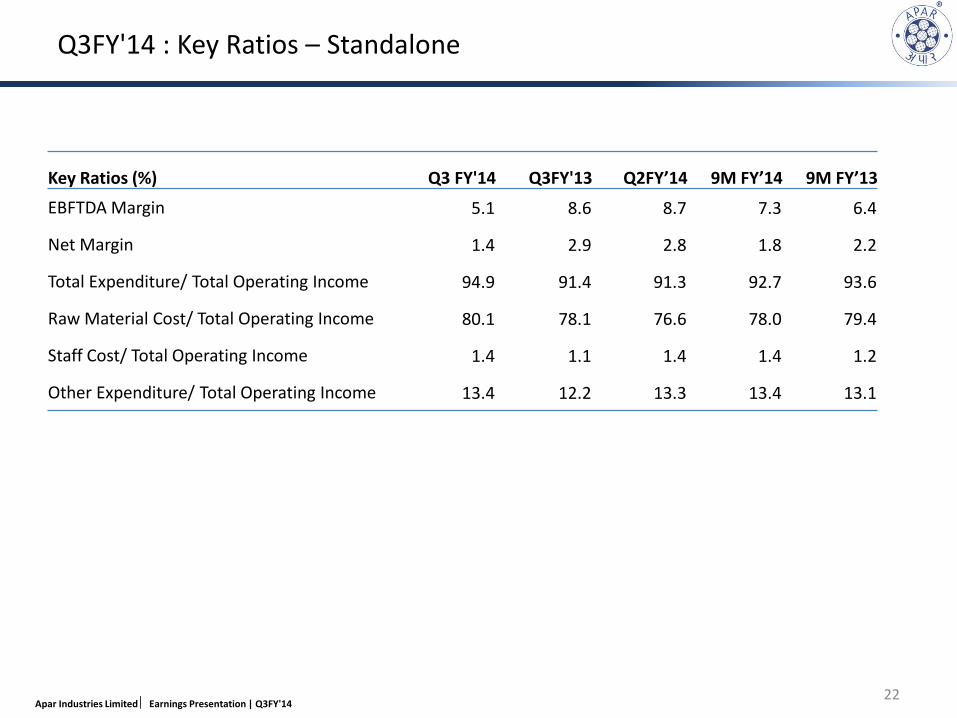
Q3FY'14 : Key Ratios – Standalone
Key Ratios (%) Q3 FY'14 Q3FY'13 Q2FY’14 9M FY’14 9M FY’13
EBFTDA Margin 5.1 8.6 8.7 7.3 6.4
Net Margin 1.4 2.9 2.8 1.8 2.2
Total Expenditure/ Total Operating Income 94.9 91.4 91.3 92.7 93.6
Raw Material Cost/ Total Operating Income 80.1 78.1 76.6 78.0 79.4
Staff Cost/ Total Operating Income 1.4 1.1 1.4 1.4 1.2
Other Expenditure/ Total Operating Income 13.4 12.2 13.3 13.4 13.1
22
Apar Industries Limited Earnings Presentation | Q3FY'14
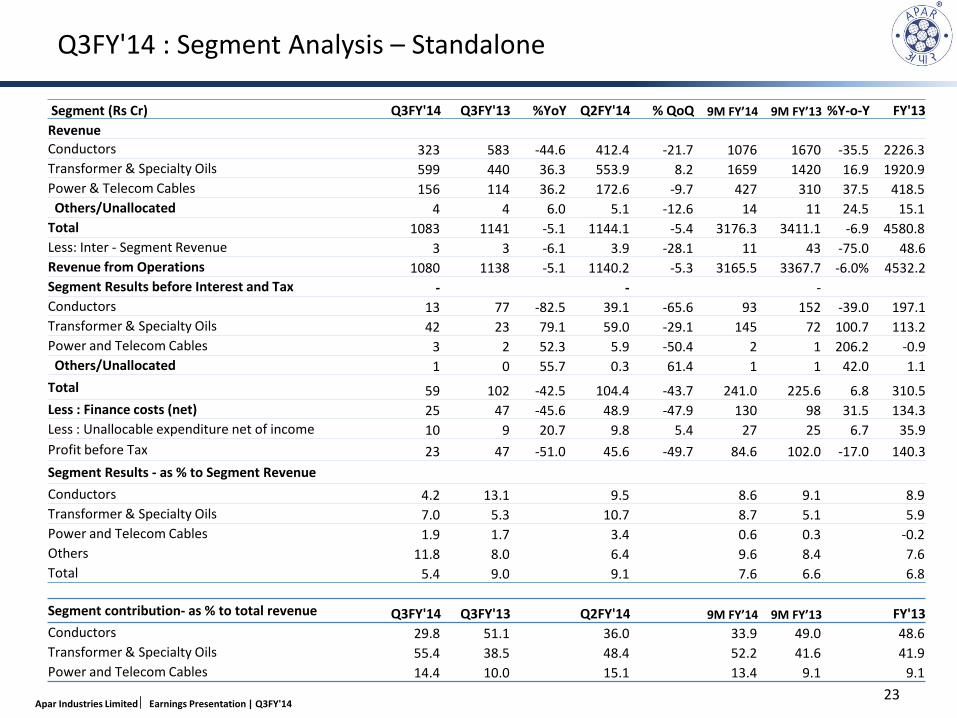
Q3FY'14 : Segment Analysis – Standalone
Segment (Rs Cr) Q3FY'14 Q3FY'13 %YoY Q2FY'14 % QoQ 9M FY’14 9M FY’13 %Y-o-Y FY'13 Revenue Conductors 323 583 -44.6 412.4 -21.7 1076 1670 -35.5 2226.3 Transformer & Specialty Oils 599 440 36.3 553.9 8.2 1659 1420 16.9 1920.9 Power & Telecom Cables 156 114 36.2 172.6 -9.7 427 310 37.5 418.5 Others/Unallocated 4 4 6.0 5.1 -12.6 14 11 24.5 15.1 Total 1083 1141 -5.1 1144.1 -5.4 3176.3 3411.1 -6.9 4580.8 Less: Inter - Segment Revenue 3 3 -6.1 3.9 -28.1 11 43 -75.0 48.6 Revenue from Operations 1080 1138 -5.1 1140.2 -5.3 3165.5 3367.7 -6.0% 4532.2 Segment Results before Interest and Tax - - - Conductors 13 77 -82.5 39.1 -65.6 93 152 -39.0 197.1 Transformer & Specialty Oils 42 23 79.1 59.0 -29.1 145 72 100.7 113.2 Power and Telecom Cables 3 2 52.3 5.9 -50.4 2 1 206.2 -0.9 Others/Unallocated 1 0 55.7 0.3 61.4 1 1 42.0 1.1 Total 59 102 -42.5 104.4 -43.7 241.0 225.6 6.8 310.5 Less : Finance costs (net) 25 47 -45.6 48.9 -47.9 130 98 31.5 134.3 Less : Unallocable expenditure net of income 10 9 20.7 9.8 5.4 27 25 6.7 35.9 Profit before Tax 23 47 -51.0 45.6 -49.7 84.6 102.0 -17.0 140.3 Segment Results - as % to Segment Revenue Conductors 4.2 13.1 9.5 8.6 9.1 8.9 Transformer & Specialty Oils 7.0 5.3 10.7 8.7 5.1 5.9 Power and Telecom Cables 1.9 1.7 3.4 0.6 0.3 -0.2 Others 11.8 8.0 6.4 9.6 8.4 7.6 Total 5.4 9.0 9.1 7.6 6.6 6.8
23
Segment contribution- as % to total revenue Q3FY'14 Q3FY'13 Q2FY'14 9M FY’14 9M FY’13 FY'13 Conductors 29.8 51.1 36.0 33.9 49.0 48.6 Transformer & Specialty Oils 55.4 38.5 48.4 52.2 41.6 41.9 Power and Telecom Cables 14.4 10.0 15.1 13.4 9.1 9.1
Apar Industries Limited Earnings Presentation | Q3FY'14
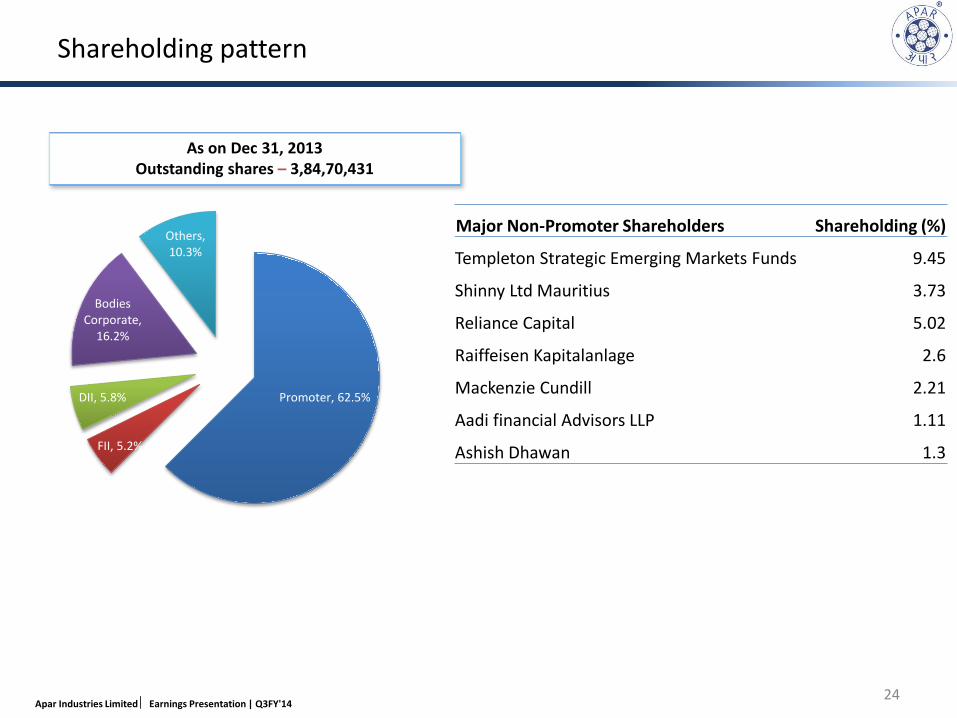
Shareholding pattern
Major Non-Promoter Shareholders Shareholding (%)
Templeton Strategic Emerging Markets Funds 9.45
Shinny Ltd Mauritius 3.73
Reliance Capital 5.02
Raiffeisen Kapitalanlage 2.6
Mackenzie Cundill 2.21
Aadi financial Advisors LLP 1.11
Ashish Dhawan 1.3
As on Dec 31, 2013 Outstanding shares – 3,84,70,431
24
Promoter, 62.5%
FII, 5.2%
DII, 5.8%
Bodies Corporate,
16.2%
Others, 10.3%
Apar Industries Limited Earnings Presentation | Q3FY'14
Contact us
For any Investor Relations queries, please contact:
Sanjaya Kunder Apar industries Ltd Phone: +91 22 67800400 Email: [email protected]
Alok Somwanshi Phone: +91 22 4215 3659 Mumbai [email protected]
This presentation may have certain statements that may be “forward looking” including those relating to general business plans and strategy of Apar Industries Ltd., its future outlook and growth prospects. The actual results may differ materially from these forward looking statements due to a number of risks and uncertainties which could include future changes or developments in Apar Industries Ltd.(Apar), the competitive environment, the company’s ability to implement its strategies and initiatives, respond to technological changes as well as sociopolitical, economic and regulatory conditions in India.
All financial data in this presentation is obtained from the audited financial statements and the various ratios are calculated based on these data. This presentation does not constitute a prospectus, offering circular or offering memorandum or an offer, invitation or a solicitation of any offer, to purchase or sell, any shares of Apar and should not be considered or construed in any manner whatsoever as a recommendation that any person should subscribe for or purchase any of Apar’s shares. None of the projection, expectations, estimates or prospects in this presentation should be construed as a forecast implying any indicative assurance or guarantee of future performance, nor that the assumptions on which such future projects, expectations, estimates or prospects have been prepared are complete or comprehensive .
This presentation is for information purposes only. This document and its contents should not forwarded or delivered or transmitted in any manner to any person other than its intended recipients, and should not be reproduced in any manner whatsoever. The recipients further represents and warrants that : (i) It is lawfully able to receive this presentation under the laws of the jurisdiction in which it is located, and / or any other applicable laws, (ii) It is not a U.S. person, (iii) This presentation is furnished to it, and has been received, outside of the United States, and (iv) It will not reproduce, publish, disclose, redistribute or transmit this presentation, directly or indirectly, into the United States or to any U.S. person either within or outside of recipient’s organisation.
Safe Harbor:
Seema Shukla Phone: +91 124 4241441 Gurgaon [email protected]
Related Documents