INDIA'S LARGEST CEMENT COMPANY CORPORATE DOSSIER Stock code: BSE: 532538 NSE: ULTRACEMCO Reuters: UTCL.NS Bloomberg: UTCEM IS / UTCEM LX

Welcome message from author
This document is posted to help you gain knowledge. Please leave a comment to let me know what you think about it! Share it to your friends and learn new things together.
Transcript
INDIA'S LARGEST CEMENT
COMPANY
CORPORATE DOSSIER
Stock code: BSE: 532538 NSE: ULTRACEMCO Reuters: UTCL.NS Bloomberg: UTCEM IS / UTCEM LX
Contents
2
ADITYA BIRLAGROUP-
OVERVIEW
ECONOMIC ENVIRONENT
INDIAN CEMENT SECTOR
GLOSSARY
OPERATIONAL AND FINANCIALPERFORMANCE
ULTRATECH LANDSCAPE
Note: The financial figures in this presentation have been rounded off to the nearest ` 1 cr. 1 US$ = ` 64.46
Mnt – Million Metric tons Lmt – Lakhs Metric tons MTPA – Million Tons Per Annum MW – Mega Watts Q1 – April-June Q2 – July - September
Q3 – October - December Q4 – January-March CY – Current year period LY – Corresponding Period last Year FY – Financial Year (April-March)
ROCE – Return on Average Capital Employed ROIC – Return on Invested Capital
ADITYA BIRLA GROUP - OVERVIEW
4
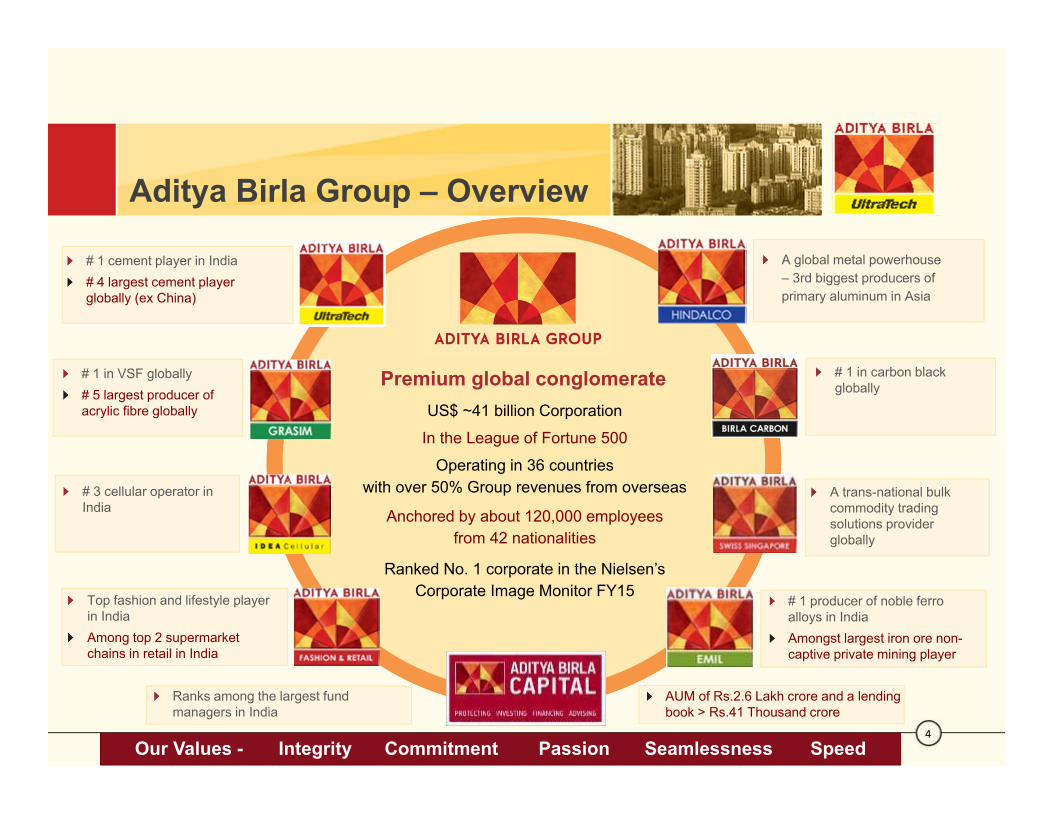
Aditya Birla Group – Overview
Our Values - Integrity Commitment Passion Seamlessness Speed
US$ ~41 billion Corporation
In the League of Fortune 500
Operating in 36 countries with over 50% Group revenues from overseas
Anchored by about 120,000 employees from 42 nationalities
Ranked No. 1 corporate in the Nielsen’s Corporate Image Monitor FY15
Premium global conglomerate
# 1 cement player in India # 4 largest cement player globally (ex China)
# 1 in VSF globally# 5 largest producer of acrylic fibre globally
# 3 cellular operator in India
A global metal powerhouse – 3rd biggest producers of primary aluminum in Asia
Top fashion and lifestyle player in IndiaAmong top 2 supermarket chains in retail in India
# 1 in carbon black globally
A trans-national bulk commodity trading solutions provider globally
# 1 producer of noble ferroalloys in IndiaAmongst largest iron ore non-captive private mining player
Ranks among the largest fund managers in India
AUM of Rs.2.6 Lakh crore and a lending book > Rs.41 Thousand crore
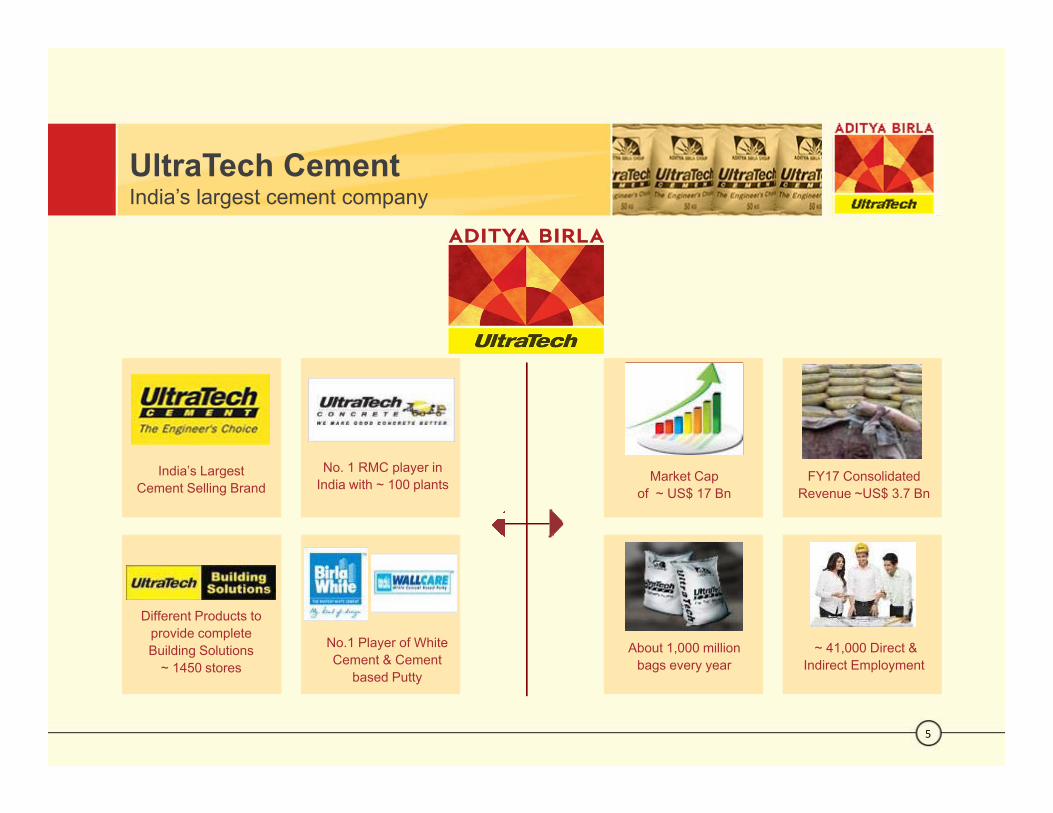
UltraTech CementIndia’s largest cement company
5
India’s Largest Cement Selling Brand
No. 1 RMC player in India with ~ 100 plants
Different Products to provide complete Building Solutions
~ 1450 stores
No.1 Player of White Cement & Cement
based Putty
Market Cap of ~ US$ 17 Bn
FY17 Consolidated Revenue ~US$ 3.7 Bn
About 1,000 million bags every year
~ 41,000 Direct & Indirect Employment
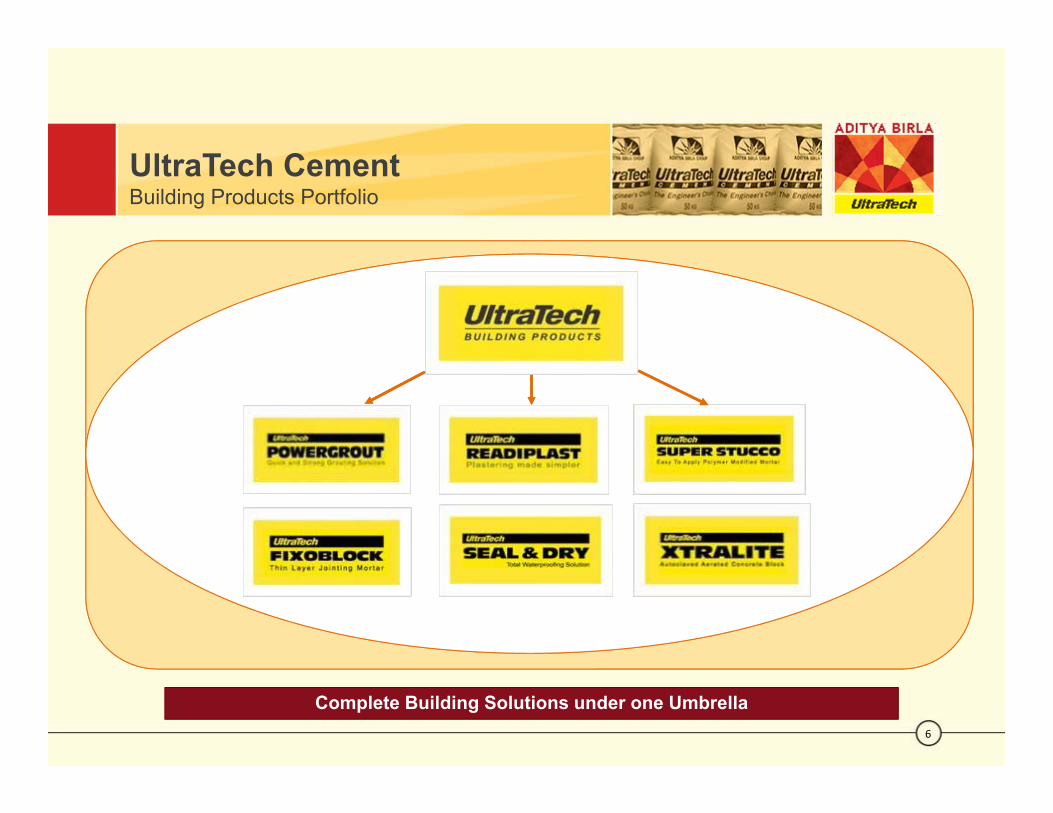
UltraTech CementBuilding Products Portfolio
6
Complete Building Solutions under one Umbrella
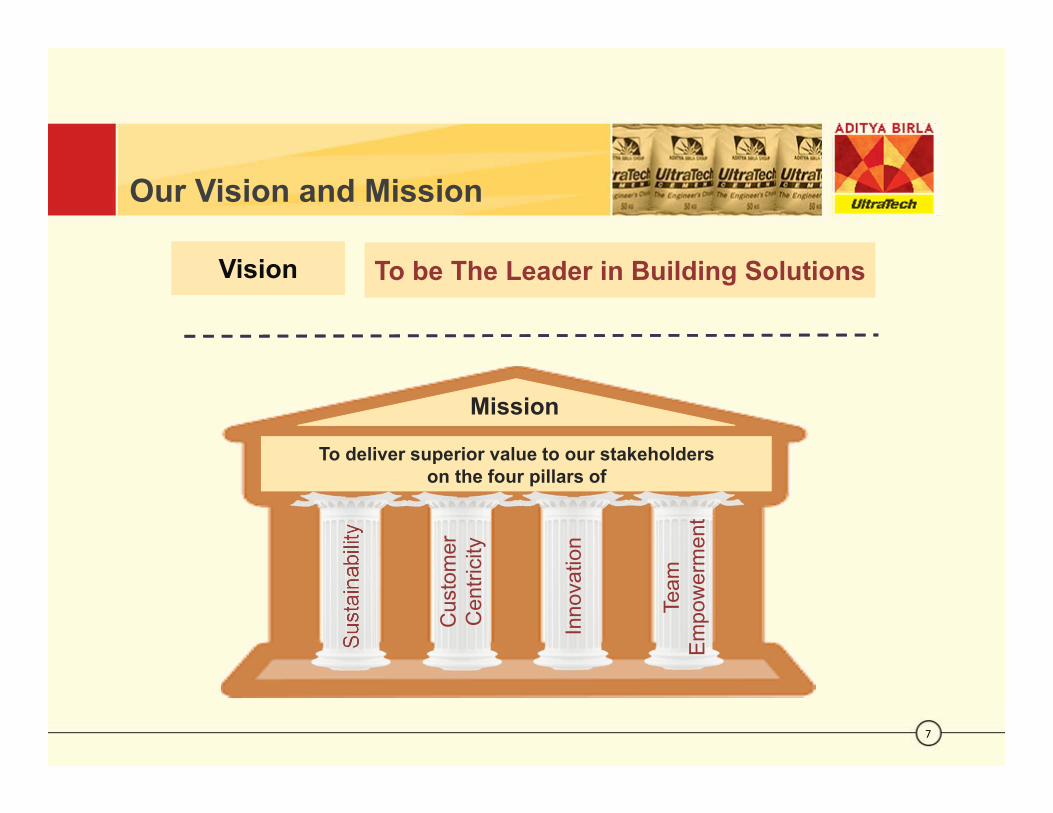
Our Vision and Mission
7
Sust
aina
bilit
y
Cus
tom
er
Cen
trici
ty
Inno
vatio
n
Team
Em
pow
erm
ent
To deliver superior value to our stakeholders on the four pillars of
Mission
Vision To be The Leader in Building Solutions
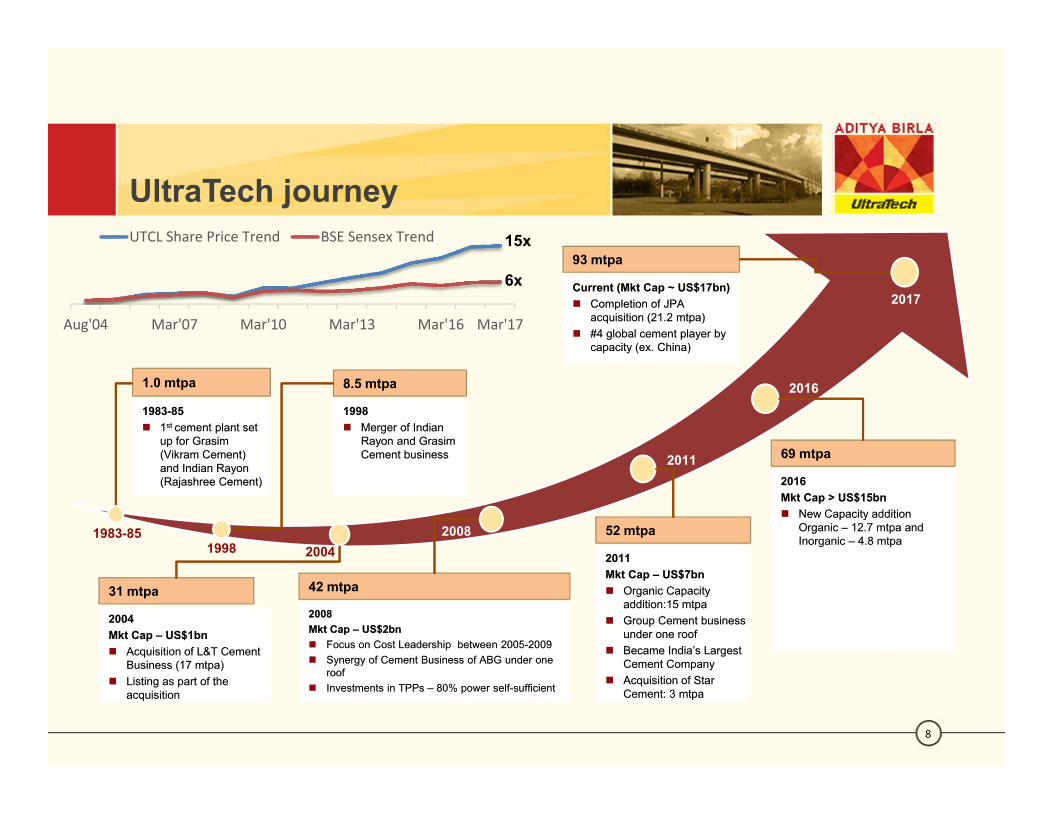
UltraTech journey
8
20042008
2011
2016
1983-85
2017
1.0 mtpa
1983-85 1st cement plant set
up for Grasim (Vikram Cement) and Indian Rayon (Rajashree Cement)
1983-85 1st cement plant set
up for Grasim (Vikram Cement) and Indian Rayon (Rajashree Cement)
8.5 mtpa
1998 Merger of Indian
Rayon and Grasim Cement business
1998 Merger of Indian
Rayon and Grasim Cement business
31 mtpa
2004Mkt Cap – US$1bn Acquisition of L&T Cement
Business (17 mtpa) Listing as part of the
acquisition
2004Mkt Cap – US$1bn Acquisition of L&T Cement
Business (17 mtpa) Listing as part of the
acquisition
1998
42 mtpa
2008Mkt Cap – US$2bn Focus on Cost Leadership between 2005-2009 Synergy of Cement Business of ABG under one
roof Investments in TPPs – 80% power self-sufficient
2008Mkt Cap – US$2bn Focus on Cost Leadership between 2005-2009 Synergy of Cement Business of ABG under one
roof Investments in TPPs – 80% power self-sufficient
93 mtpa
Current (Mkt Cap ~ US$17bn) Completion of JPA
acquisition (21.2 mtpa) #4 global cement player by
capacity (ex. China)
Current (Mkt Cap ~ US$17bn) Completion of JPA
acquisition (21.2 mtpa) #4 global cement player by
capacity (ex. China)
52 mtpa
2011Mkt Cap – US$7bn Organic Capacity
addition:15 mtpa Group Cement business
under one roof Became India’s Largest
Cement Company Acquisition of Star
Cement: 3 mtpa
2011Mkt Cap – US$7bn Organic Capacity
addition:15 mtpa Group Cement business
under one roof Became India’s Largest
Cement Company Acquisition of Star
Cement: 3 mtpa
69 mtpa
2016Mkt Cap > US$15bn New Capacity addition
Organic – 12.7 mtpa and Inorganic – 4.8 mtpa
2016Mkt Cap > US$15bn New Capacity addition
Organic – 12.7 mtpa and Inorganic – 4.8 mtpa
Aug'04 Mar'07 Mar'10 Mar'13 Mar'16 Mar'17
UTCL Share Price Trend BSE Sensex Trend 15x
6x

Governance
9
Non-Executive Chairman Independent Directors Executive Directors
Mr. KM Birla
Board of Directors
Mr. KK Maheshwari- MDMr. GM Dave
Mr. SB Mathur
Mr. Arun Adhikari
Mrs. Renuka RamnathMr. DD Rathi
Mrs. Sukanya KripaluMr. OP Puranmalka
Ms. Alka Bharucha
Mr. Atul Daga- CFONon-Executive Directors
Mrs. Rajashree Birla
Management Team
10
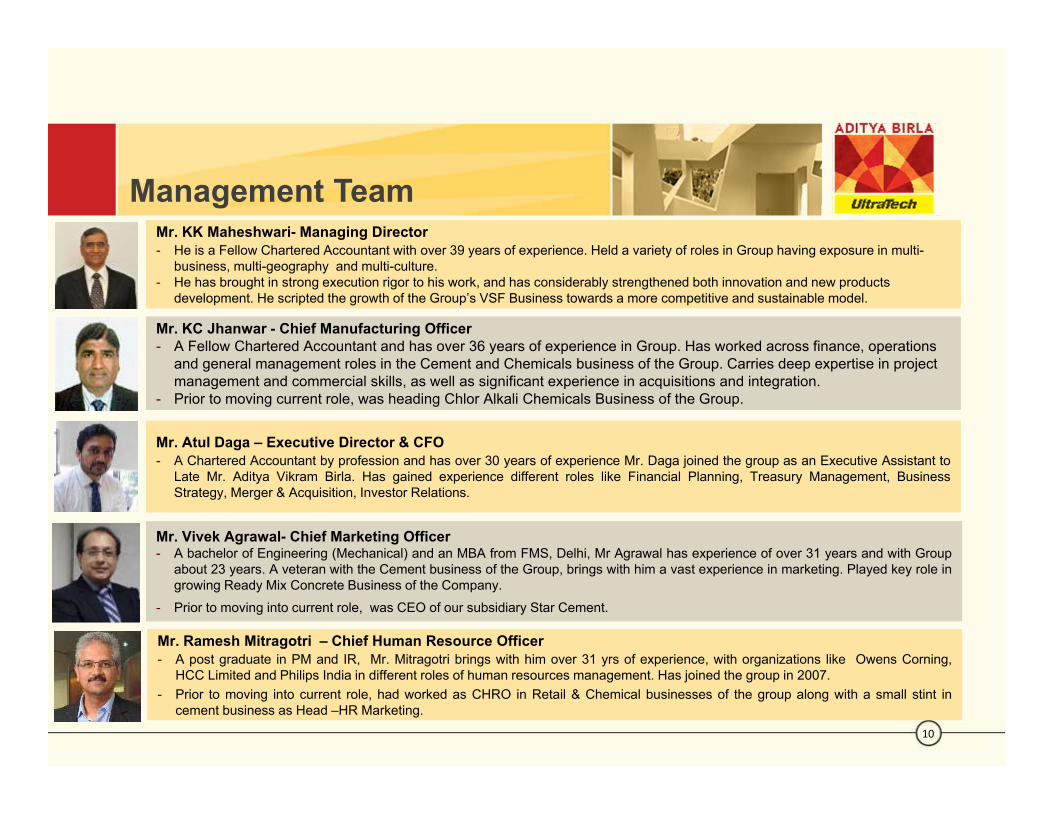
Mr. KK Maheshwari- Managing Director- He is a Fellow Chartered Accountant with over 39 years of experience. Held a variety of roles in Group having exposure in multi-
business, multi-geography and multi-culture. - He has brought in strong execution rigor to his work, and has considerably strengthened both innovation and new products
development. He scripted the growth of the Group’s VSF Business towards a more competitive and sustainable model.
Mr. KC Jhanwar - Chief Manufacturing Officer- A Fellow Chartered Accountant and has over 36 years of experience in Group. Has worked across finance, operations
and general management roles in the Cement and Chemicals business of the Group. Carries deep expertise in project management and commercial skills, as well as significant experience in acquisitions and integration.
- Prior to moving current role, was heading Chlor Alkali Chemicals Business of the Group.
Mr. Atul Daga – Executive Director & CFO- A Chartered Accountant by profession and has over 30 years of experience Mr. Daga joined the group as an Executive Assistant to
Late Mr. Aditya Vikram Birla. Has gained experience different roles like Financial Planning, Treasury Management, BusinessStrategy, Merger & Acquisition, Investor Relations.
Mr. Vivek Agrawal- Chief Marketing Officer- A bachelor of Engineering (Mechanical) and an MBA from FMS, Delhi, Mr Agrawal has experience of over 31 years and with Group
about 23 years. A veteran with the Cement business of the Group, brings with him a vast experience in marketing. Played key role ingrowing Ready Mix Concrete Business of the Company.
- Prior to moving into current role, was CEO of our subsidiary Star Cement.
Mr. Ramesh Mitragotri – Chief Human Resource Officer- A post graduate in PM and IR, Mr. Mitragotri brings with him over 31 yrs of experience, with organizations like Owens Corning,
HCC Limited and Philips India in different roles of human resources management. Has joined the group in 2007.- Prior to moving into current role, had worked as CHRO in Retail & Chemical businesses of the group along with a small stint in
cement business as Head –HR Marketing.

Shareholding Pattern
11
As on 30th June,2017
Promoter Group, 61.1%Foreign Portfolio Investors, 21.9%
Mutual Fund, Insititutions, 5.5%
Other Public Holding, 9.8%
GDRs, 1.7%
Name Holding %
Grasim Industries Limited 60.23%
Hindalco Industries Limited 0.46%
Trapti Trading & Investments Pvt Ltd 0.24%
Turquoise Investments and Finance Pvt Ltd 0.19%
Others 0.02%
Total 61.14%
Promoter Group Non-promoter Shareholding > 1%
Name Holding %
Aberdeen 2.78%
LIC of India 2.20%
Oppenheimer Developing Markets Fund 1.45%
Euro Pacific Growth Fund 1.37%
Total FPI holding 21.89%

Economic Environment
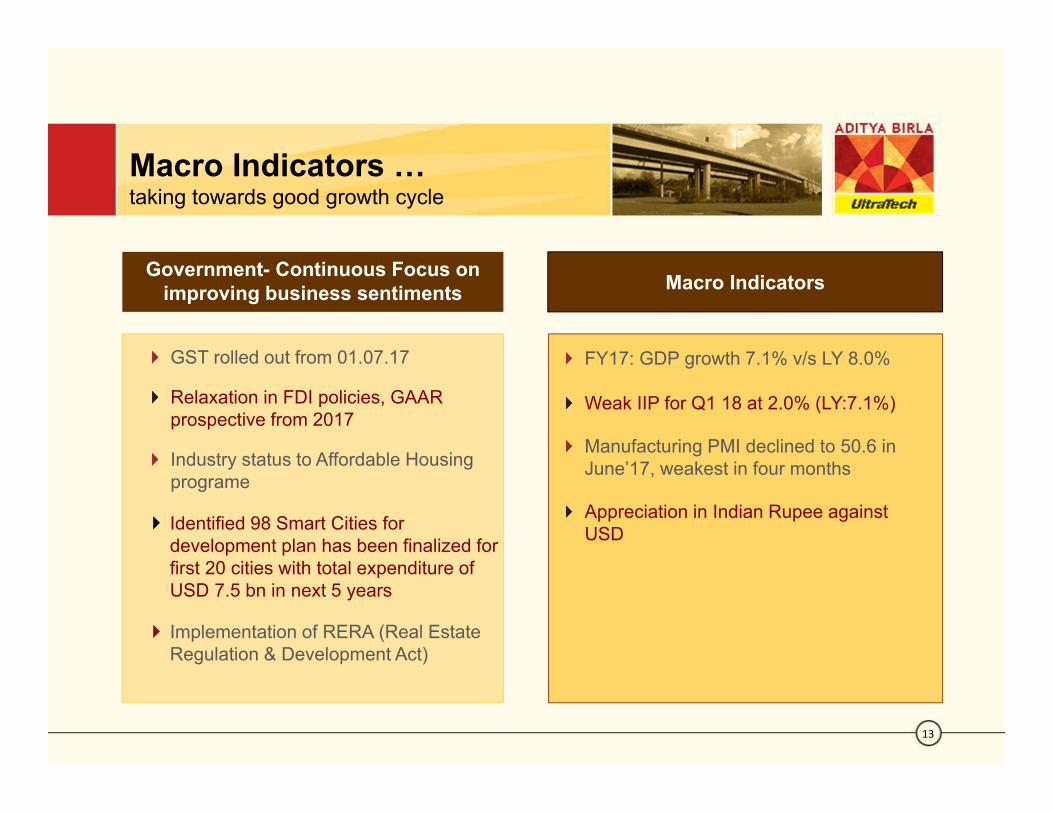
Macro Indicators … taking towards good growth cycle
13
Government- Continuous Focus on improving business sentiments
GST rolled out from 01.07.17
Relaxation in FDI policies, GAAR prospective from 2017
Industry status to Affordable Housing programe
Identified 98 Smart Cities for development plan has been finalized for first 20 cities with total expenditure of USD 7.5 bn in next 5 years
Implementation of RERA (Real Estate Regulation & Development Act)
Macro Indicators
FY17: GDP growth 7.1% v/s LY 8.0%
Weak IIP for Q1 18 at 2.0% (LY:7.1%)
Manufacturing PMI declined to 50.6 in June’17, weakest in four months
Appreciation in Indian Rupee against USD

Indian Cement Sector
15
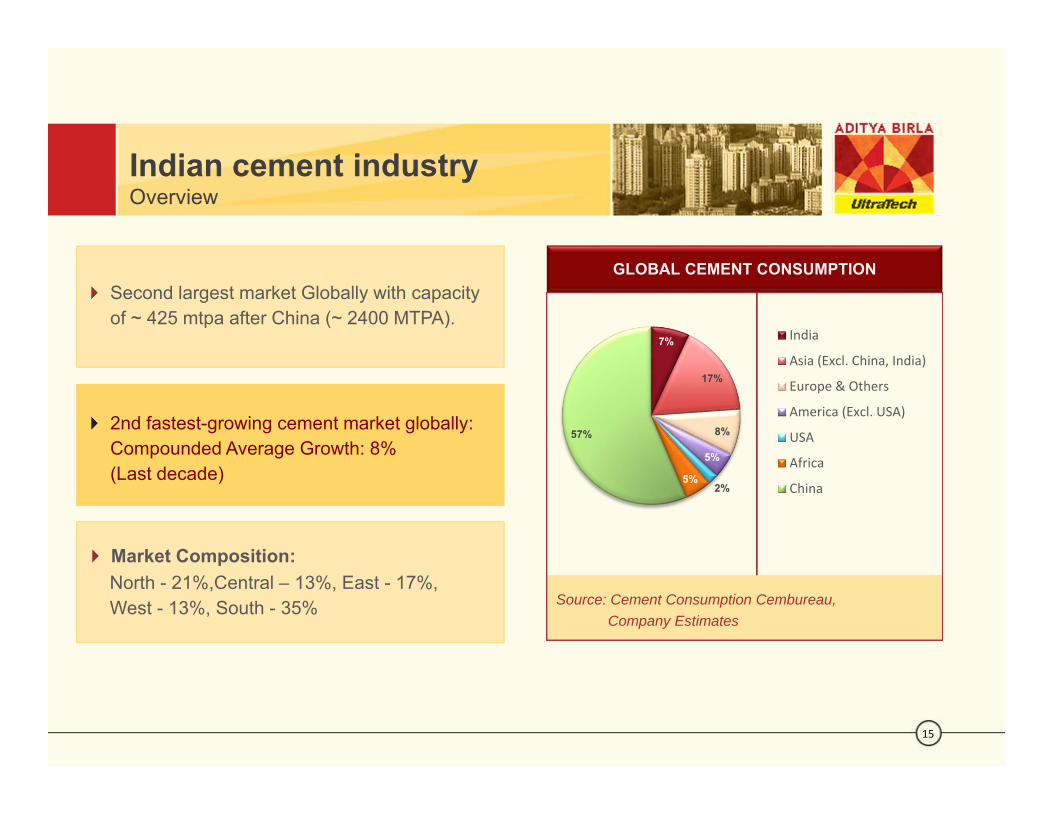
Indian cement industryOverview
Second largest market Globally with capacity of ~ 425 mtpa after China (~ 2400 MTPA).
2nd fastest-growing cement market globally: Compounded Average Growth: 8% (Last decade)
GLOBAL CEMENT CONSUMPTION
Source: Cement Consumption Cembureau, Company Estimates
Market Composition:North - 21%,Central – 13%, East - 17%, West - 13%, South - 35%
7%
17%
8%
5%
2%5%
57%
India
Asia (Excl. China, India)
Europe & Others
America (Excl. USA)
USA
Africa
China

Indian cement industryOverview (contd…)
16
Consolidation in industry at regular intervals
Entry of new players (non-cement)
PER CAPITA CEMENT COSNUMPTION (KG)
Fragmented Market:No of plants ~ 195, owned by ~ 55 playersTop 5 players holds ~ 50% of capacity
Per Capita Cement Consumption at 200 kg lowest among the developing countries; World average ~ 580 Kg 1780
830
660 580470
355280 200
China
Turkey
Vietnam
World
Russia
Brazil
USA
India
Source: Cement Consumption Cembureau, Company Estimates Population IMF
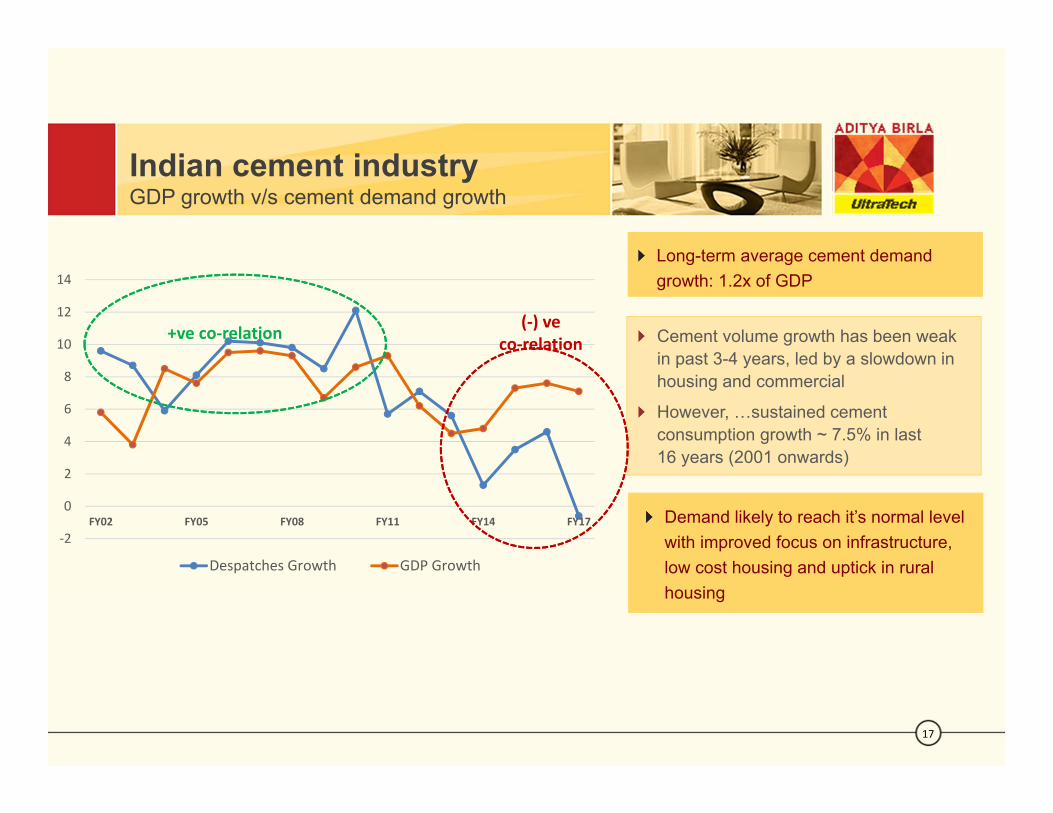
Indian cement industryGDP growth v/s cement demand growth
17
Cement volume growth has been weak in past 3-4 years, led by a slowdown in housing and commercial
However, …sustained cement consumption growth ~ 7.5% in last 16 years (2001 onwards)
Demand likely to reach it’s normal level with improved focus on infrastructure, low cost housing and uptick in rural housing
Long-term average cement demand growth: 1.2x of GDP
‐2
0
2
4
6
8
10
12
14
FY02 FY05 FY08 FY11 FY14 FY17
Despatches Growth GDP Growth
(‐) veco‐relation+ve co‐relation
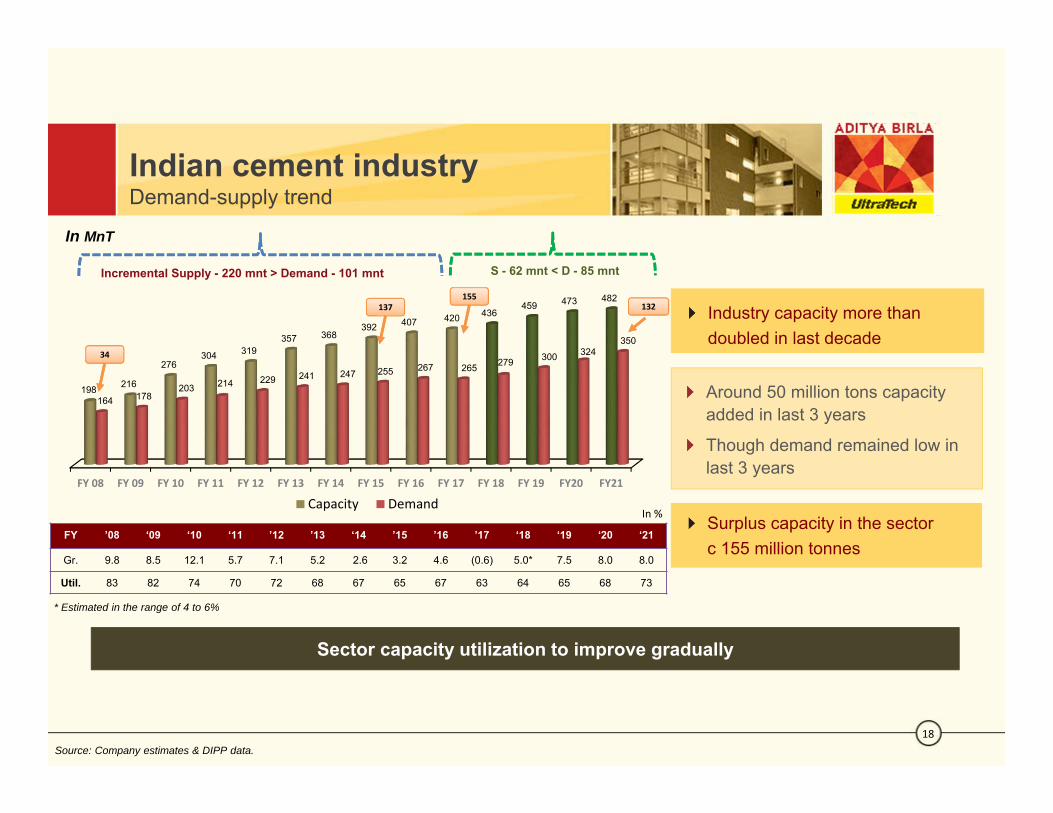
FY 08 FY 09 FY 10 FY 11 FY 12 FY 13 FY 14 FY 15 FY 16 FY 17 FY 18 FY 19 FY20 FY21
198 216
276304 319
357 368392 407 420 436
459 473 482
164 178203 214 229 241 247 255 267 265 279 300 324
350
Capacity Demand
Indian cement industryDemand-supply trend
18Source: Company estimates & DIPP data.
In MnT
Around 50 million tons capacity added in last 3 years
Though demand remained low in last 3 years
Surplus capacity in the sector c 155 million tonnes
Industry capacity more than doubled in last decade
Incremental Supply - 220 mnt > Demand - 101 mnt S - 62 mnt < D - 85 mnt
155132
In %
FY ’08 ‘09 ‘10 ‘11 ’12 ’13 ‘14 ’15 ’16 ’17 ‘18 ‘19 ‘20 ‘21
Gr. 9.8 8.5 12.1 5.7 7.1 5.2 2.6 3.2 4.6 (0.6) 5.0* 7.5 8.0 8.0
Util. 83 82 74 70 72 68 67 65 67 63 64 65 68 73
Sector capacity utilization to improve gradually
* Estimated in the range of 4 to 6%
34
137
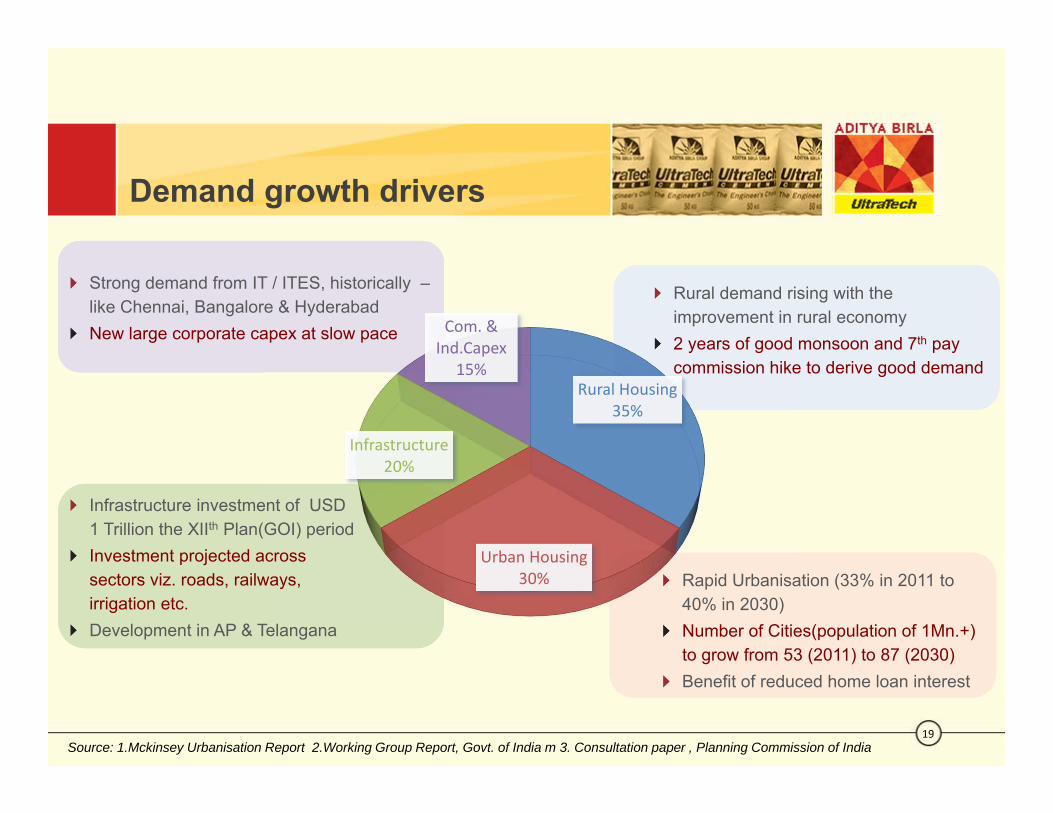
Demand growth drivers
19Source: 1.Mckinsey Urbanisation Report 2.Working Group Report, Govt. of India m 3. Consultation paper , Planning Commission of India
Rural Housing35%
Urban Housing30%
Infrastructure20%
Com. & Ind.Capex
15%
Rapid Urbanisation (33% in 2011 to 40% in 2030)Number of Cities(population of 1Mn.+) to grow from 53 (2011) to 87 (2030)Benefit of reduced home loan interest
Rural demand rising with the improvement in rural economy2 years of good monsoon and 7th pay commission hike to derive good demand
Infrastructure investment of USD 1 Trillion the XIIth Plan(GOI) periodInvestment projected across sectors viz. roads, railways, irrigation etc. Development in AP & Telangana
Strong demand from IT / ITES, historically –like Chennai, Bangalore & HyderabadNew large corporate capex at slow pace

Sector guidance
20
Government led spending will continue to be a key growth driver :
Government Housing Plan –
Housing for all: 20 ml Houses for urban areas and 40 ml in Rural areas
Pradhan Mantri Awas Yozana – Gramin : To construct 10 ml units (FY17-19), increased target by 33% more
Introduced affordable housing program with increased size of house along with interest subvention scheme
Roads (concrete) - another 1,00,000 kms in addition to 1,00,000 kms road which is already in process (Road Execution target for FY18 – 15000 kms; 40 kms/day against actual of ~ 23 kms/day in FY17)
Western and Eastern dedicated freight corridor (~$ 13 bln)
100 smart cities, Identified first 20 smart cities (Expenditure plan USD 7.5 bn in next 5 years)
Metro rail project coming up in various cities like Mumbai, Delhi , Kolkatta, Chennai, Lucknow, Kochi, Jaipur, Ahmedabad, Chandigarh, Nagpur, Kanpur, Hyderabad, Surat and Pune (Plan of ~ 1000 Kms)
5 new Mega Power Projects each of 4000 MW in the Plug-and-Play mode ( ~ $ 16 bln)
Target of 175,000 MW renewable energy by 2022.
Port Development – Handling capacity to increase more than double 3000 ml tons by 2025 (~ 15 bn)
Gradual pick-up in demand post-monsoon

UltraTech Landscape

UltraTech - A snapshot
22
GrowthDomestic Capacity post acquisition augmented to 89.0 Mtpa. Total Capacity 93.0 MtpaProven Capabilities to Grow: Organically 44 Mtpaand Inorganically 46 Mtpa.
Market Leadership“UltraTech” -Premium national brand
Leadership in key consuming markets
Strong nationwide distribution network
Cost Leadership Large Size kiln – Economy of scale
Latest Technology Plant
> 85% Power Self Sufficiency thru TPP & WHRS
Hub and Spoke Model through Split GUs/ Terminals near market & Efficient Logistics
Particulars UOM Current
Capacity
Grey Cement (Incl. Overseas) Mtpa 93.0
White Cement + Wall Care Putty Mtpa 1.5
RMC Mn. Cub. Mtr 13.1
Captive Power Plants MW 982
WHRS + Wind Mill + Solar MW 63
Distribution Network
No. of Dealers Nos. 20500
% of exclusive Dealers % 65%
No. of Retailers Nos. 50000
No. of UBS outlets Nos. 1450
No. of truck fleets Nos. 22000
% of dedicated fleet Nos. 40%
No. of destination served Nos. 28000
No. of truck movement per day Nos. 700
No. of rake movement per day Nos. 22
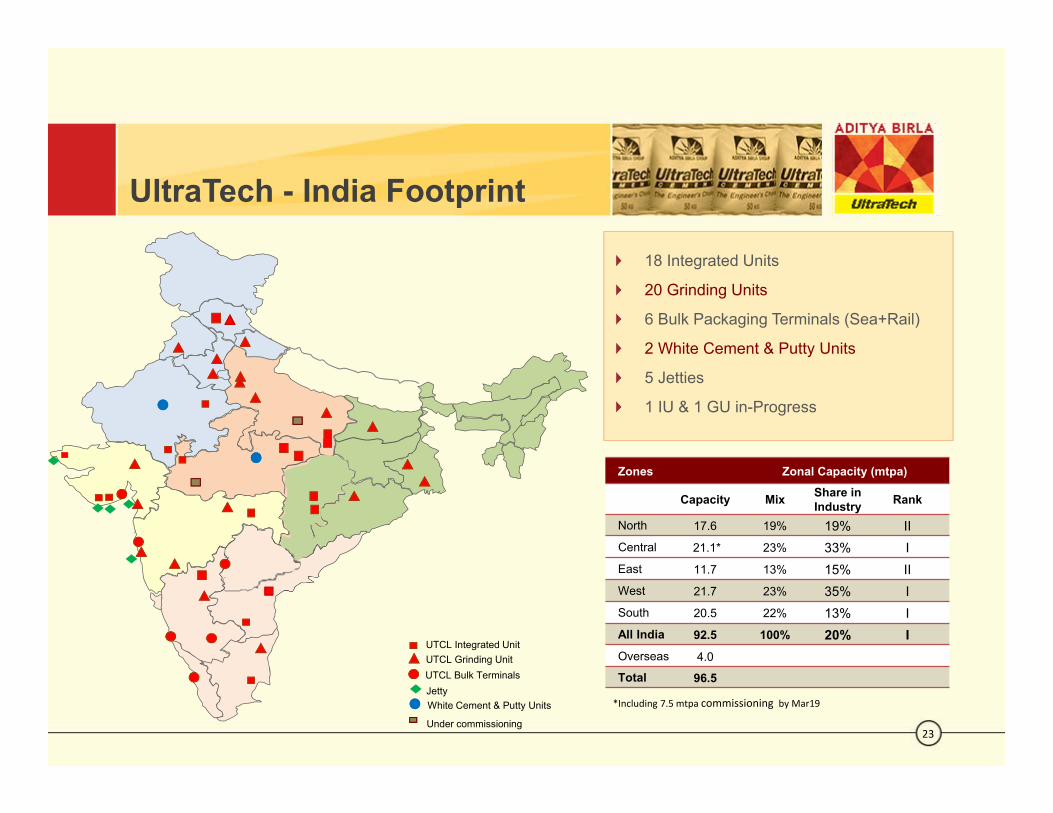
UltraTech - India Footprint
23
18 Integrated Units
20 Grinding Units
6 Bulk Packaging Terminals (Sea+Rail)
2 White Cement & Putty Units
5 Jetties
1 IU & 1 GU in-Progress
Zones Zonal Capacity (mtpa)
Capacity Mix Share in Industry Rank
North 17.6 19% 19% IICentral 21.1* 23% 33% IEast 11.7 13% 15% IIWest 21.7 23% 35% ISouth 20.5 22% 13% IAll India 92.5 100% 20% IOverseas 4.0
Total 96.5
White Cement & Putty UnitsJetty
UTCL Grinding UnitUTCL Integrated Unit
UTCL Bulk Terminals
Under commissioning
*Including 7.5 mtpa commissioning by Mar19

Operational and Financial Performance
Regional update Q1 FY18
25
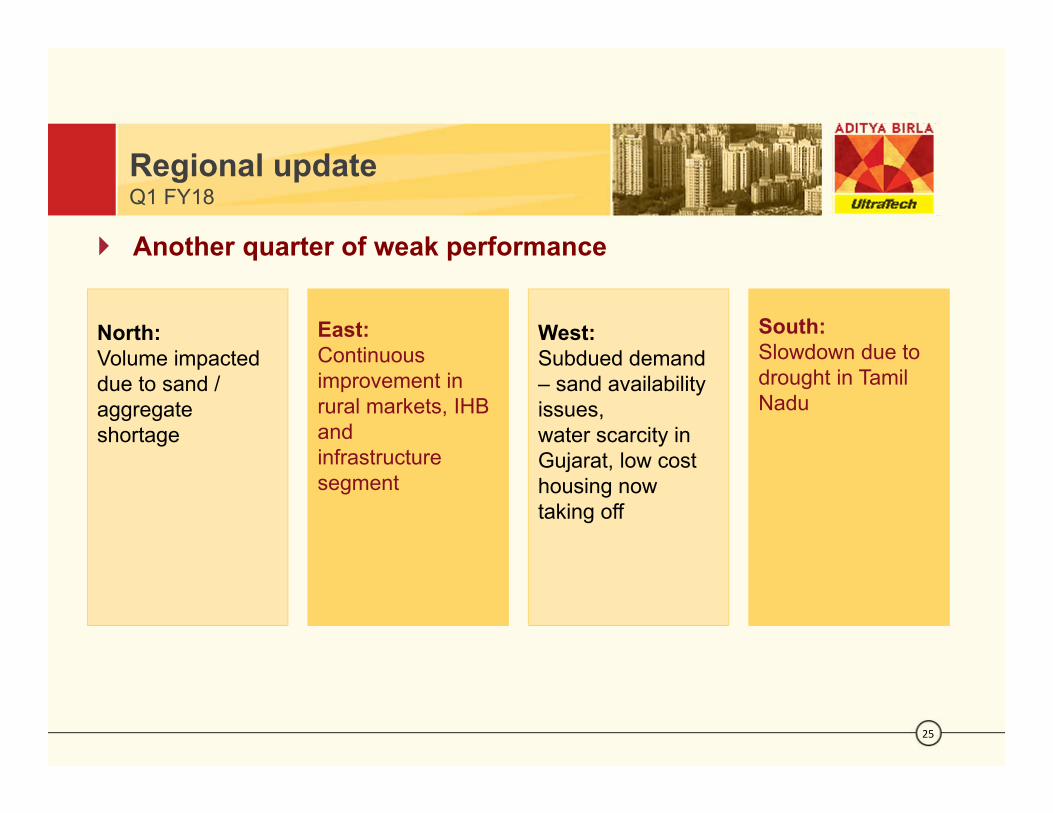
North: Volume impacted due to sand / aggregate shortage
East: Continuous improvement in rural markets, IHB and infrastructure segment
West: Subdued demand – sand availability issues, water scarcity in Gujarat, low cost housing now taking off
South: Slowdown due to drought in Tamil Nadu
Another quarter of weak performance

Key Highlights for the Quarter

27
Q1 – Highlights Standalone
Operating margin @ 24%
Turnover (` crs)
Q1FY17 Q1FY18
EBITDA (` crs)
Q1FY17 Q1FY18
Op. Profit (` PMT)
Q1FY17 Q1FY18
PAT (` crs)
Q1FY17 Q1FY18
65336179
17251573
10781183
775891
Operational and Financial Performance
Acquisition Update
29
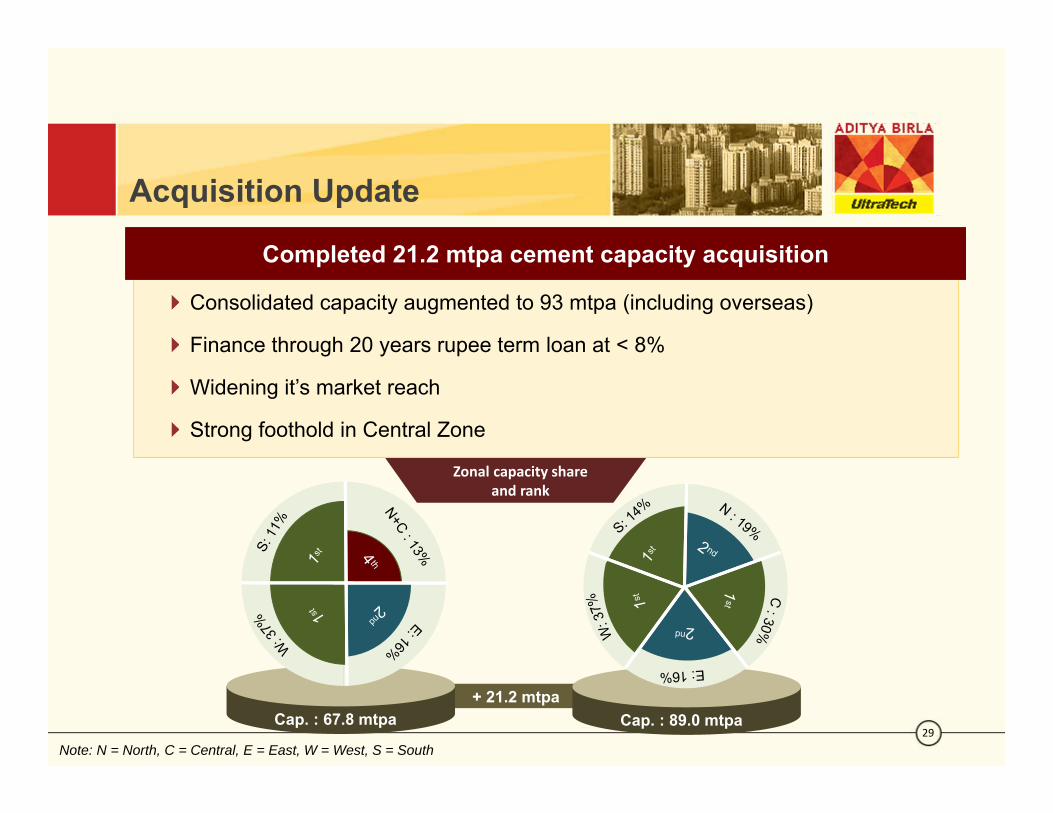
Completed 21.2 mtpa cement capacity acquisitionCompleted 21.2 mtpa cement capacity acquisition
Consolidated capacity augmented to 93 mtpa (including overseas)
Finance through 20 years rupee term loan at < 8%
Widening it’s market reach
Strong foothold in Central Zone
Cap. : 67.8 mtpa Cap. : 89.0 mtpa+ 21.2 mtpa
Note: N = North, C = Central, E = East, W = West, S = South
Zonal capacity shareand rank
Acquisition IntegrationKey priorities
30
Turnaround planTurnaround plan
Added over 5000 dealers in the new markets
Steps to improve quality
Leveraging procurement synergies
Enhancing operational benchmarks
Re-organizing the clinker movement – plan to reduce logistics costs
Training to the employees to work on UltraTech systems & safety standards
UltraTech’s well oiled outperformance driven culture
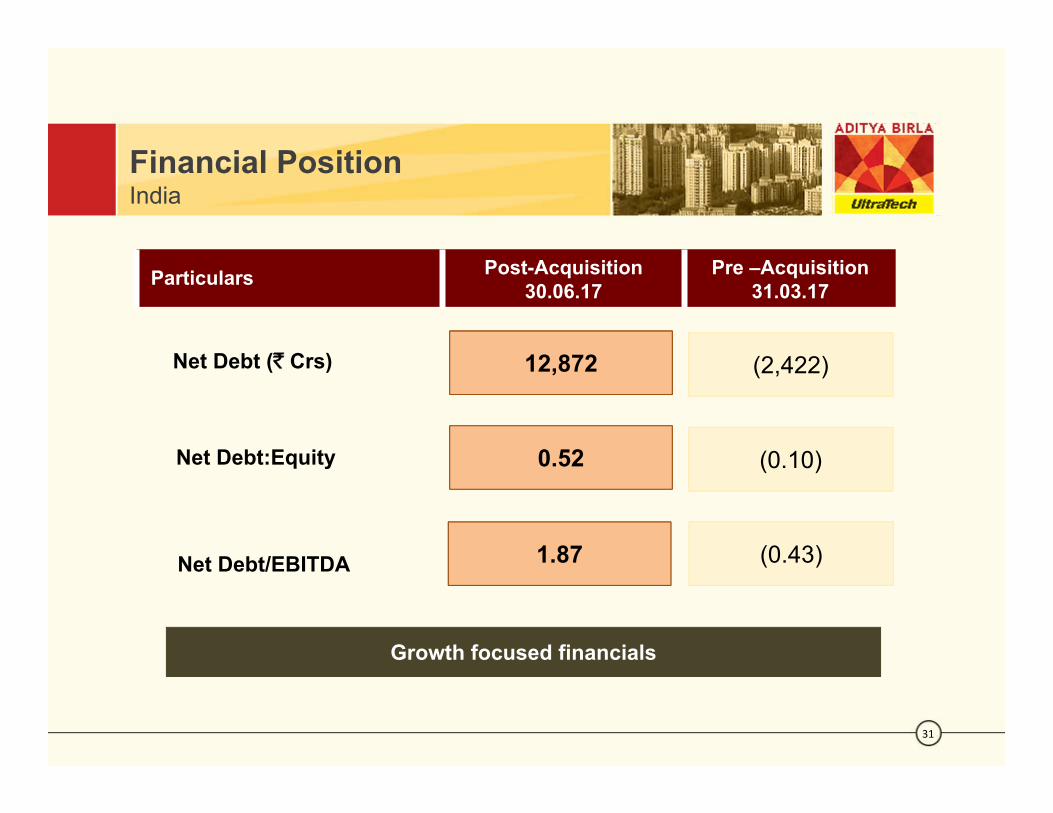
Financial PositionIndia
31
Particulars Post-Acquisition30.06.17
Pre –Acquisition31.03.17
12,872 (2,422)Net Debt (` Crs)
0.52 (0.10)Net Debt:Equity
1.87 (0.43)Net Debt/EBITDA
Growth focused financials
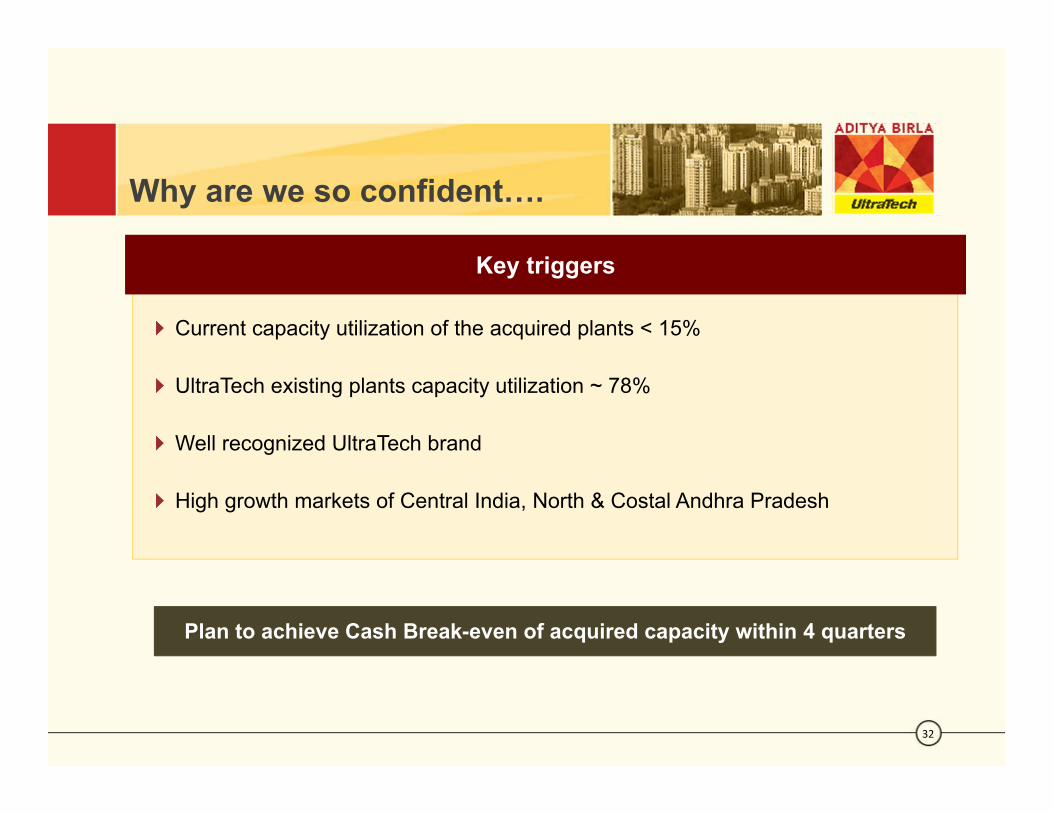
Why are we so confident….
32
Key triggersKey triggers
Current capacity utilization of the acquired plants < 15%
UltraTech existing plants capacity utilization ~ 78%
Well recognized UltraTech brand
High growth markets of Central India, North & Costal Andhra Pradesh
Plan to achieve Cash Break-even of acquired capacity within 4 quarters
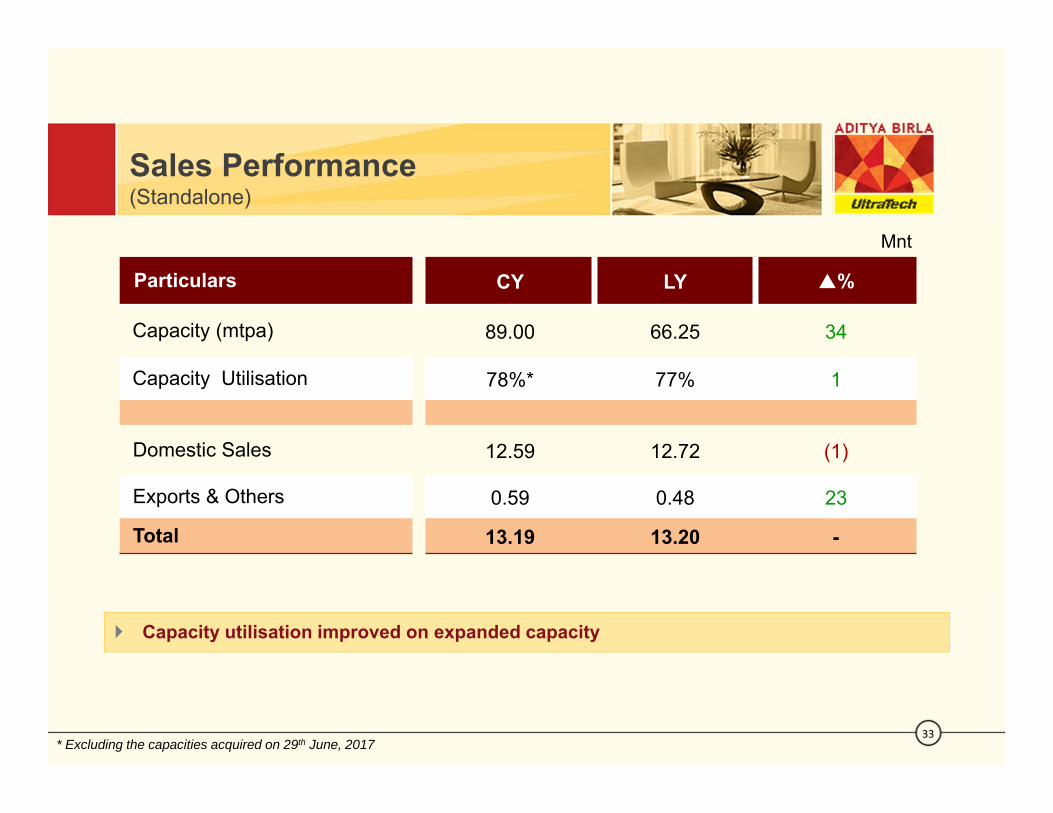
Sales Performance(Standalone)
33
Capacity utilisation improved on expanded capacity
Particulars CY LY %
Capacity (mtpa) 89.00 66.25 34
Capacity Utilisation 78%* 77% 1
Domestic Sales 12.59 12.72 (1)
Exports & Others 0.59 0.48 23
Total 13.19 13.20 -
Mnt
* Excluding the capacities acquired on 29th June, 2017

Operating Costs(Grey Cement)
34
Logistics cost ` 1098/t up 2% YoY
Impact of increase in diesel prices
Efficiency improved
2964
3229
Total Operational Costs incl. Logisitcs &Packing (Pmt)
Q1'17 Q1'189%34%*
Energy cost increased 28% YoY : ` 871/t
Petoke prices jumped 2x
Efficiency improvement gain 5%
Raw materials cost : ` 466/t +4% (YoY)
Increased usage of additives14%*
Efficiency improvements contributed ~ 5% improvement in EBITDA. More to follow
27%*
* Share in total operating costs
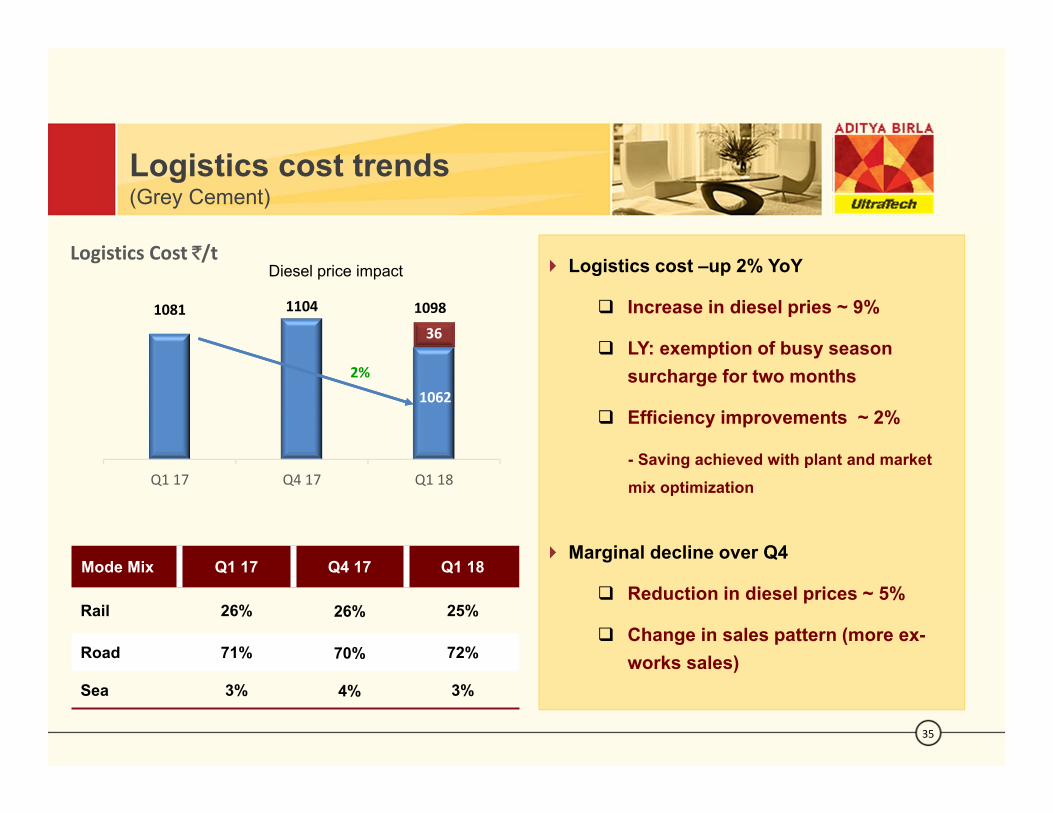
Logistics cost trends(Grey Cement)
35
Logistics cost –up 2% YoY
Increase in diesel pries ~ 9%
LY: exemption of busy season surcharge for two months
Efficiency improvements ~ 2%
- Saving achieved with plant and market mix optimization
Marginal decline over Q4
Reduction in diesel prices ~ 5%
Change in sales pattern (more ex-works sales)
1081 1104
1062
36
Q1 17 Q4 17 Q1 18
Logistics Cost `/t
1098
Mode Mix Q1 17 Q4 17 Q1 18
Rail 26% 26% 25%
Road 71% 70% 72%
Sea 3% 4% 3%
Diesel price impact
2%
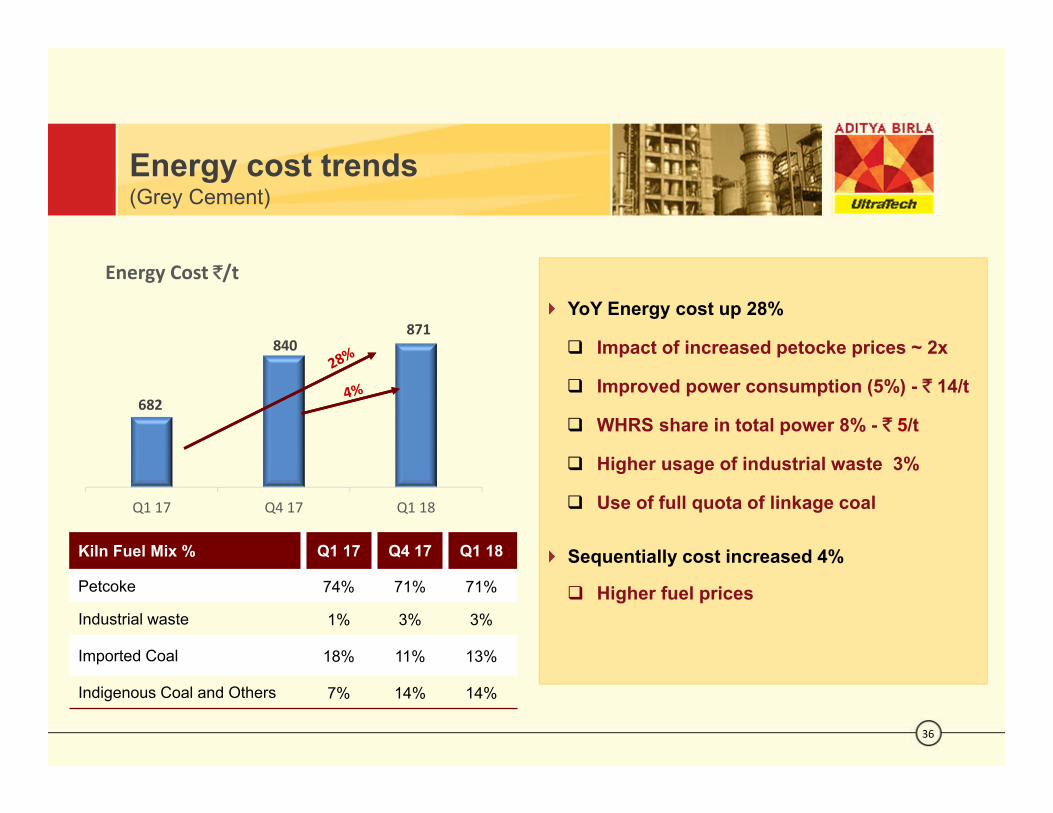
682
840871
Q1 17 Q4 17 Q1 18
Energy Cost `/t
Energy cost trends(Grey Cement)
36
Kiln Fuel Mix % Q1 17 Q4 17 Q1 18
Petcoke 74% 71% 71%
Industrial waste 1% 3% 3%
Imported Coal 18% 11% 13%
Indigenous Coal and Others 7% 14% 14%
YoY Energy cost up 28%
Impact of increased petocke prices ~ 2x
Improved power consumption (5%) - ` 14/t
WHRS share in total power 8% - ` 5/t
Higher usage of industrial waste 3%
Use of full quota of linkage coal
Sequentially cost increased 4%
Higher fuel prices
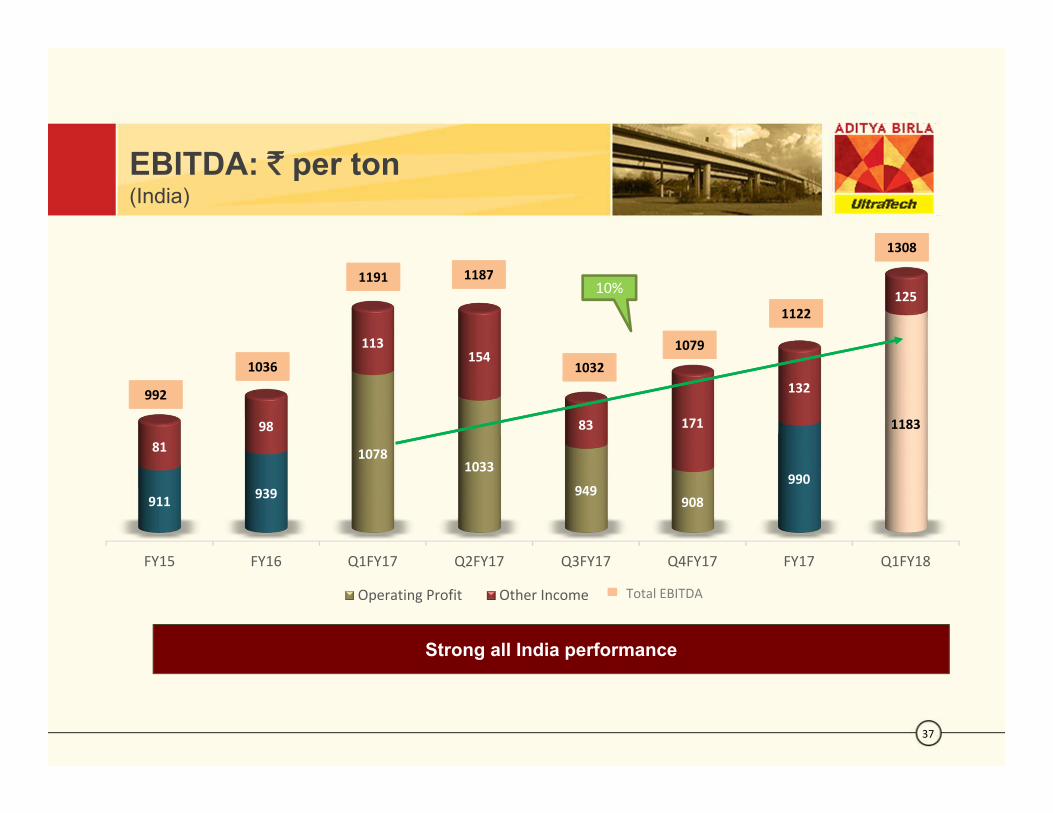
FY15 FY16 Q1FY17 Q2FY17 Q3FY17 Q4FY17 FY17 Q1FY18
911 939
10781033
949908
990
118381
98
113154
83 171
132
125
Operating Profit Other Income Total EBITDA
EBITDA: ` per ton(India)
37
992
1036
1191 1187
1032
1122
10%
1079
1308
Strong all India performance

Income statement- Q1
38
` crs
ConsolidatedParticulars
Standalone
CY LY % CY LY %6938 6535 6 Revenues (net of excise duty) 6533 6179 6166 151 10 Other Income 165 150 10
1798 1626 11 EBITDA 1725 1573 1026% 25% 1 Margin (%) 26% 25% 1141 180 22 Finance Costs 128 152 16
361 323 (12) Depreciation incl. investmentimpairment 310 303 (2)
1296 1124 15 PBT 1,287 1,118 15398 344 (16) Tax Expenses 396 343 (16)0.9 (0.3) Minority Interest - - -897 780 15 PAT 891 775 1532.7 28.4 15 EPS (`) 32.4 28.2 15
EBITDA improved 10% at standalone level and 11% at consolidated level
PAT improved 15%
Financial Position
39
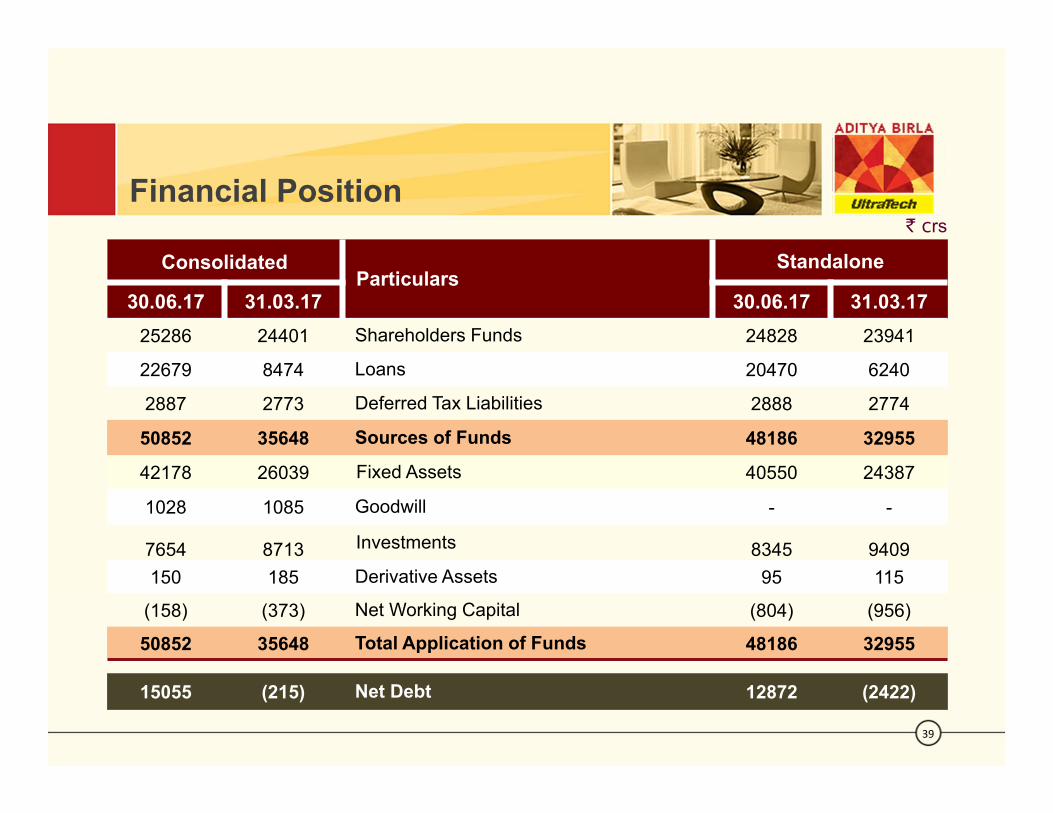
` crs
15055 (215) Net Debt 12872 (2422)
ConsolidatedParticulars
Standalone
30.06.17 31.03.17 30.06.17 31.03.1725286 24401 Shareholders Funds 24828 23941
22679 8474 Loans 20470 6240
2887 2773 Deferred Tax Liabilities 2888 2774
50852 35648 Sources of Funds 48186 32955
42178 26039 Fixed Assets 40550 24387
1028 1085 Goodwill - -
7654 8713 Investments 8345 9409150 185 Derivative Assets 95 115
(158) (373) Net Working Capital (804) (956)
50852 35648 Total Application of Funds 48186 32955
40
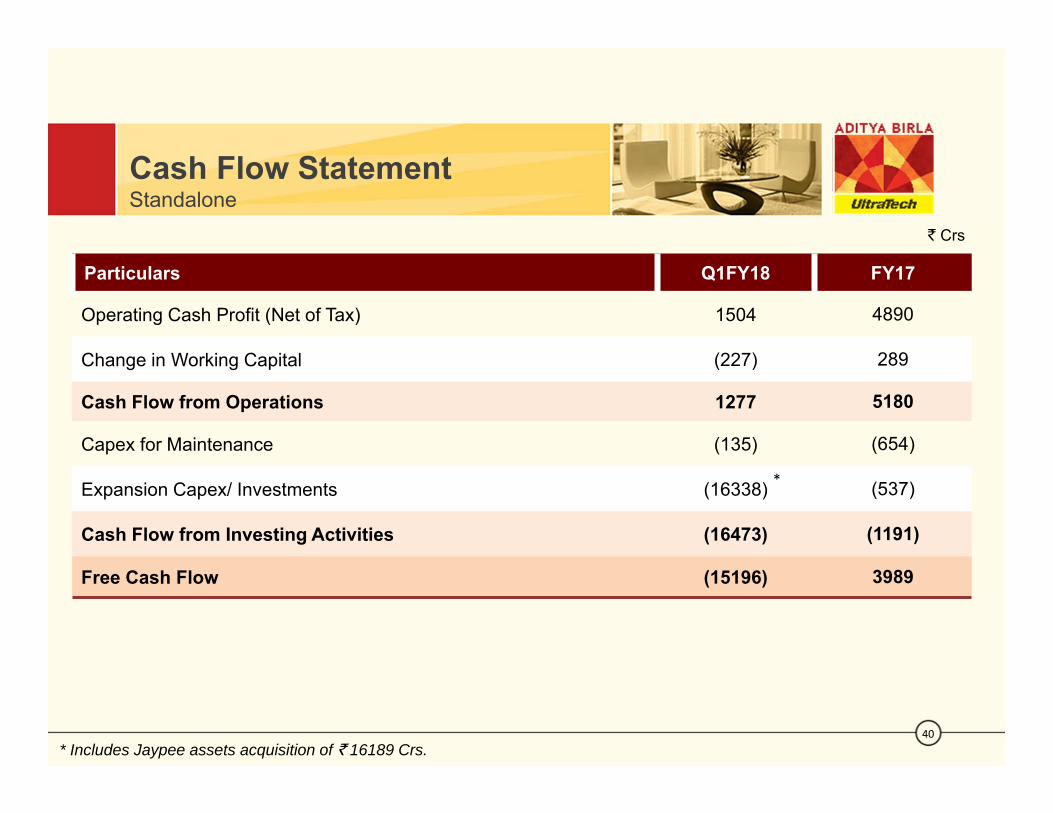
` Crs
Particulars Q1FY18 FY17
Operating Cash Profit (Net of Tax) 1504 4890
Change in Working Capital (227) 289
Cash Flow from Operations 1277 5180
Capex for Maintenance (135) (654)
Expansion Capex/ Investments (16338) (537)
Cash Flow from Investing Activities (16473) (1191)
Free Cash Flow (15196) 3989
* Includes Jaypee assets acquisition of ` 16189 Crs.
Cash Flow StatementStandalone
*

Financial Indicators
41
ConsolidatedIndicators
Standalone
30.06.17 31.03.17 30.06.17 31.03.17
0.60 (0.01) Net Debt: Equity 0.52 (0.10)
2.09 (0.04) Net Debt / EBITDA 1.87 (0.43)
10.5 7.1 Interest Cover 11.0 7.5
16.3% 12.8% ROCE 16.9% 13.4%
10.3% 7.7% ROIC 10.7% 8.1%
240* 240 EV (USD/t)
15.2* 18.6 EV / EBITDA
921 889 Book Value (`/Share) 904 872
* Excluding the impact of capacities acquired on 29th June, 2017

Historical Performance Trend
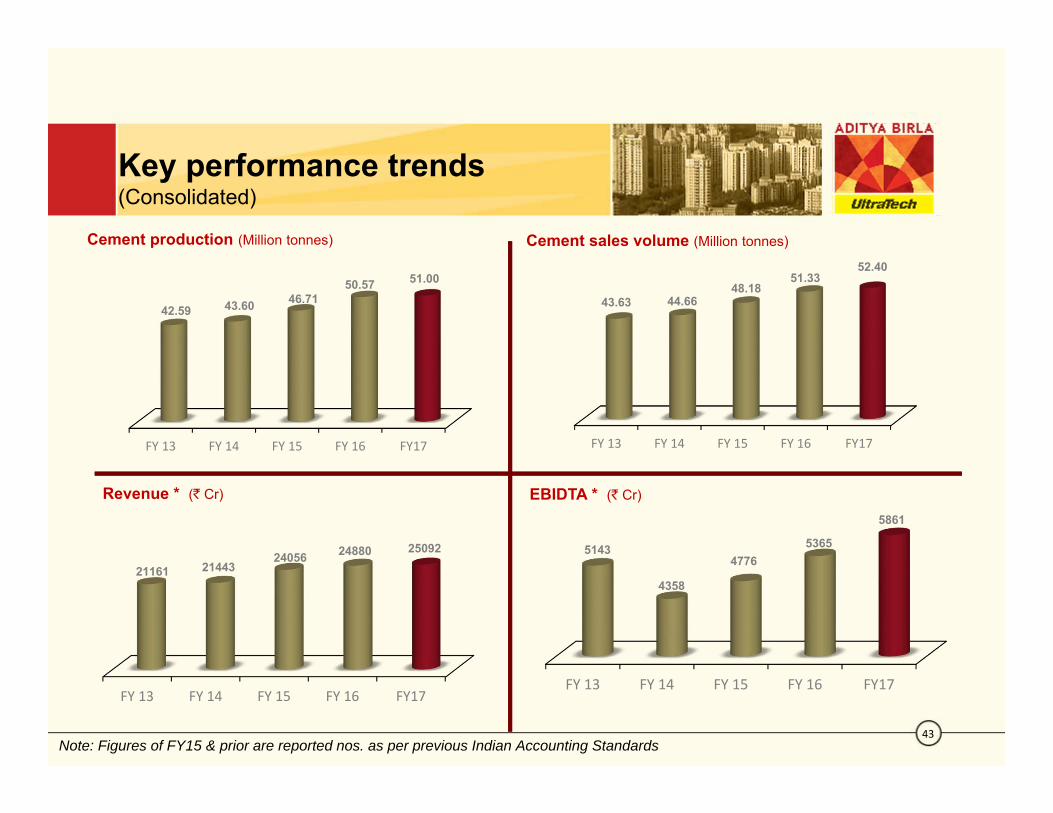
Cement sales volume (Million tonnes)
43
Key performance trends(Consolidated)
FY 13 FY 14 FY 15 FY 16 FY17
43.63 44.6648.18
51.3352.40
Revenue * (` Cr)
FY 13 FY 14 FY 15 FY 16 FY17
21161 2144324056 24880 25092
FY 13 FY 14 FY 15 FY 16 FY17
5143
4358
47765365
5861
EBIDTA * (` Cr)
Cement production (Million tonnes)
FY 13 FY 14 FY 15 FY 16 FY17
42.59 43.60 46.7150.57 51.00
Note: Figures of FY15 & prior are reported nos. as per previous Indian Accounting Standards

44
Grey Cement Costs trends(Standalone)
Raw Material Cost (`/Mt)
FY 13 FY 14 FY 15 FY 16 FY17
399419
444464 467
Logistics Cost (`/Mt)
FY 13 FY 14 FY 15 FY16 FY17
925 976
10751099 1074
Mix FY13 FY14 FY15 FY 16 FY17
Rail 34% 34% 29% 28% 25%
Road 63% 62% 67% 69% 72%Sea 3% 3% 4% 3% 4%
Energy Cost (`/Mt)
FY 13 FY 14 FY 15 FY16 FY17
989951 979
824763
Fuel Mix FY13 FY14 FY15 FY16 FY17Imported Coal 35% 26% 26% 20% 14%Petcoke 38% 48% 52% 70% 74%
Ind. Coal & Others 27% 26% 22% 10% 12%
Comparative Cost Trend TPP / WHRS
FY 13 FY 14 FY 15 FY16 FY17
TPP Rate WHRS Rate
Power Mix FY13 FY14 FY15 FY16 FY17
TPP 79% 81% 82% 82% 80%WHRS 0.3% 0.3% 2% 5% 7%Others 21% 19% 16% 13% 13%

a ULTRA READYWE ARE
ALL GEARED UP TO FACE THE FUTURE!
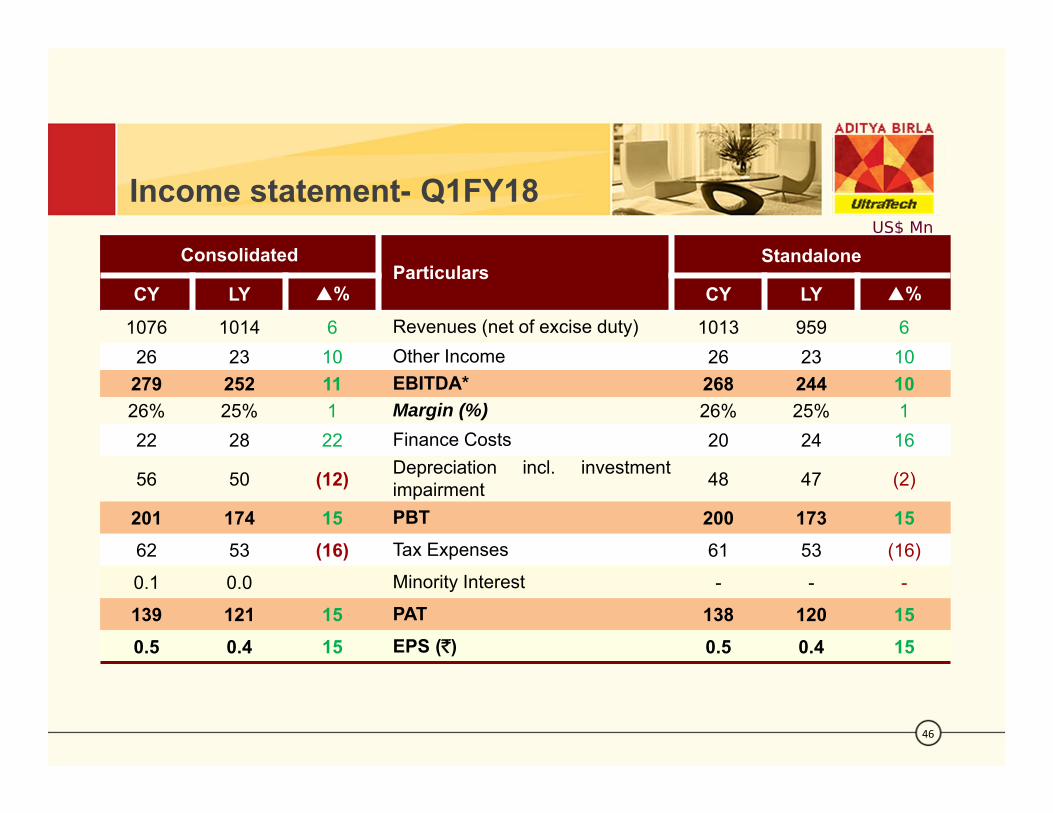
Income statement- Q1FY18
46
US$ Mn
ConsolidatedParticulars
Standalone
CY LY % CY LY %
1076 1014 6 Revenues (net of excise duty) 1013 959 626 23 10 Other Income 26 23 10
279 252 11 EBITDA* 268 244 1026% 25% 1 Margin (%) 26% 25% 122 28 22 Finance Costs 20 24 16
56 50 (12) Depreciation incl. investmentimpairment 48 47 (2)
201 174 15 PBT 200 173 1562 53 (16) Tax Expenses 61 53 (16)
0.1 0.0 Minority Interest - - -
139 121 15 PAT 138 120 150.5 0.4 15 EPS (`) 0.5 0.4 15

Financial Position
47
US$ Mn
2336 (33) Net Debt 1997 (376)
ConsolidatedParticulars
Standalone
30.06.17 31.03.17 30.06.17 31.03.173923 3786 Shareholders Funds 3852 3714
3518 1315 Loans 3176 968
448 430 Deferred Tax Liabilities 448 430
7889 5530 Sources of Funds 7475 5112
6543 4040 Fixed Assets 6291 3783
160 168 Goodwill - -
1187 1352 Investments 1295 1460
23 29 Derivative Assets 15 18
(25) (58) Net Working Capital (125) (148)
7889 5530 Total Application of Funds 7475 5112
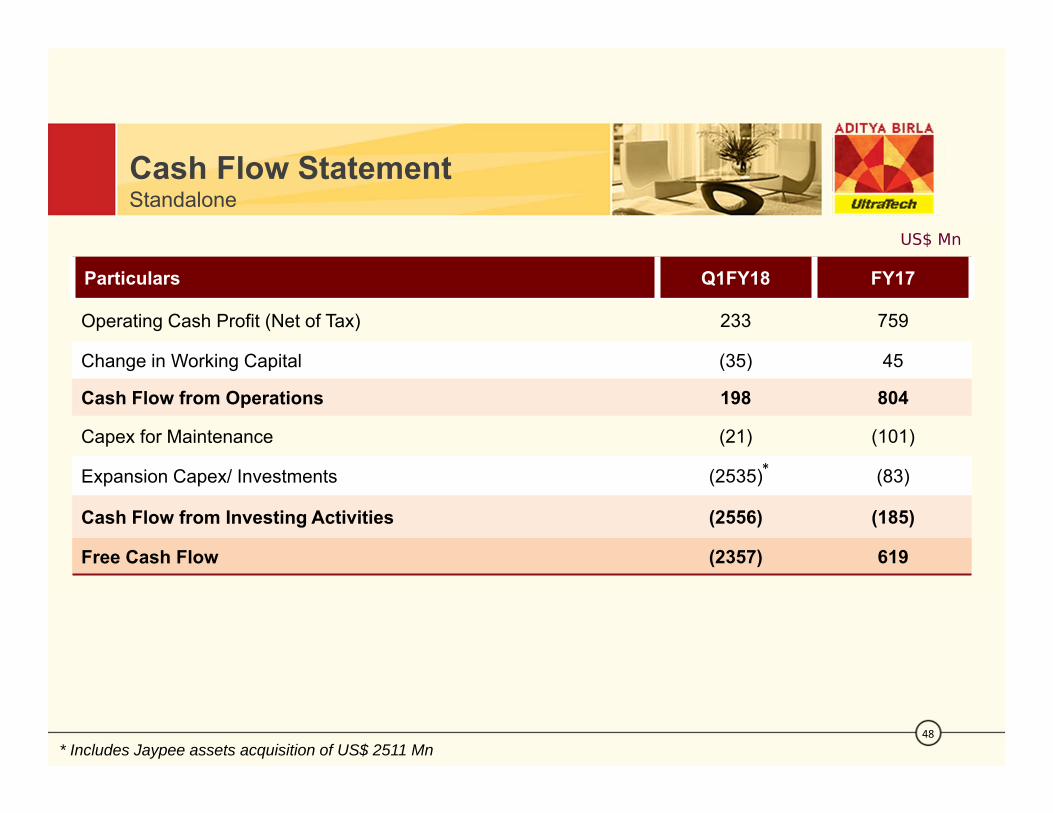
48
Particulars Q1FY18 FY17
Operating Cash Profit (Net of Tax) 233 759
Change in Working Capital (35) 45
Cash Flow from Operations 198 804
Capex for Maintenance (21) (101)
Expansion Capex/ Investments (2535) (83)
Cash Flow from Investing Activities (2556) (185)
Free Cash Flow (2357) 619
Cash Flow StatementStandalone
*
US$ Mn
* Includes Jaypee assets acquisition of US$ 2511 Mn
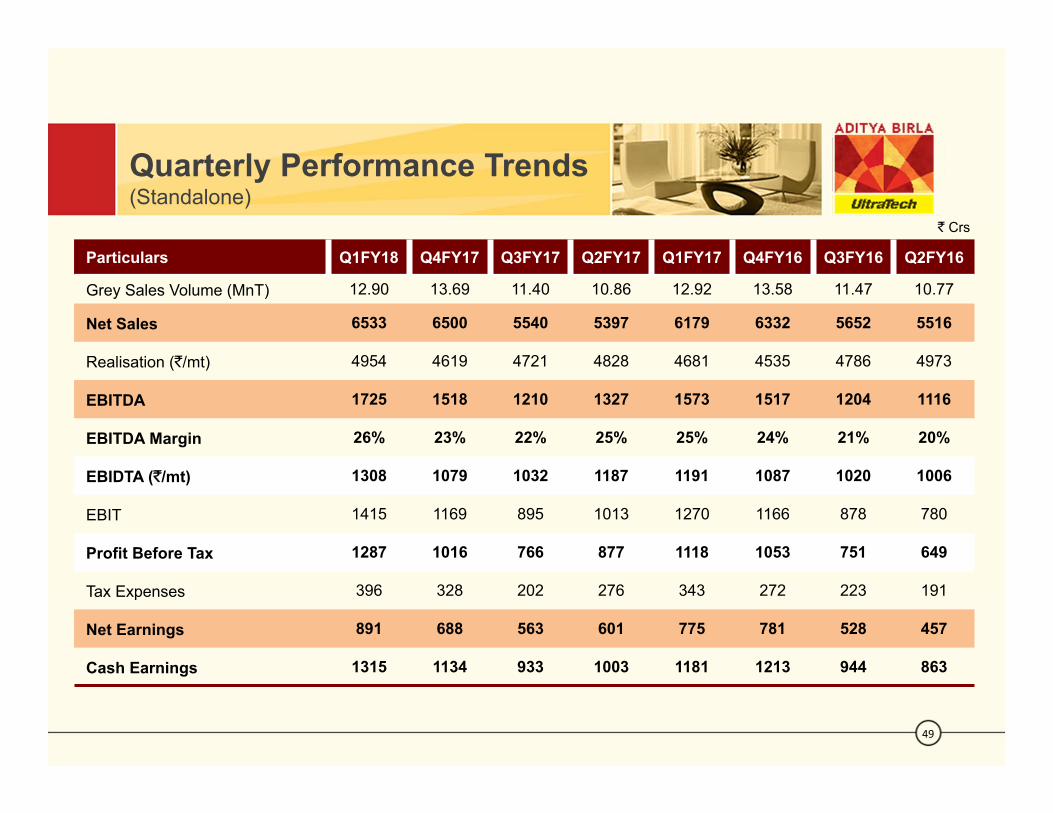
Quarterly Performance Trends(Standalone)
49
Particulars Q1FY18 Q4FY17 Q3FY17 Q2FY17 Q1FY17 Q4FY16 Q3FY16 Q2FY16
Grey Sales Volume (MnT) 12.90 13.69 11.40 10.86 12.92 13.58 11.47 10.77
Net Sales 6533 6500 5540 5397 6179 6332 5652 5516
Realisation (`/mt) 4954 4619 4721 4828 4681 4535 4786 4973
EBITDA 1725 1518 1210 1327 1573 1517 1204 1116
EBITDA Margin 26% 23% 22% 25% 25% 24% 21% 20%
EBIDTA (`/mt) 1308 1079 1032 1187 1191 1087 1020 1006
EBIT 1415 1169 895 1013 1270 1166 878 780
Profit Before Tax 1287 1016 766 877 1118 1053 751 649
Tax Expenses 396 328 202 276 343 272 223 191
Net Earnings 891 688 563 601 775 781 528 457
Cash Earnings 1315 1134 933 1003 1181 1213 944 863
` Crs
50
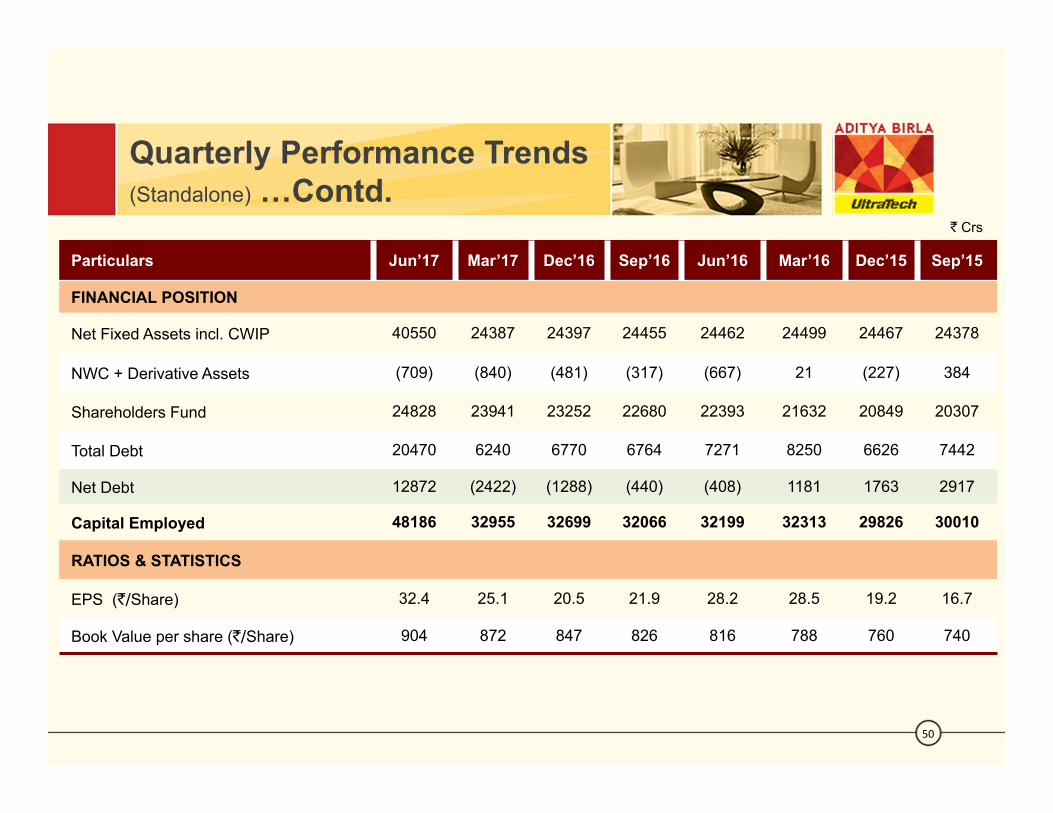
Quarterly Performance Trends(Standalone) …Contd.
` Crs
Particulars Jun’17 Mar’17 Dec’16 Sep’16 Jun’16 Mar’16 Dec’15 Sep’15
FINANCIAL POSITION
Net Fixed Assets incl. CWIP 40550 24387 24397 24455 24462 24499 24467 24378
NWC + Derivative Assets (709) (840) (481) (317) (667) 21 (227) 384
Shareholders Fund 24828 23941 23252 22680 22393 21632 20849 20307
Total Debt 20470 6240 6770 6764 7271 8250 6626 7442
Net Debt 12872 (2422) (1288) (440) (408) 1181 1763 2917
Capital Employed 48186 32955 32699 32066 32199 32313 29826 30010
RATIOS & STATISTICS
EPS (`/Share) 32.4 25.1 20.5 21.9 28.2 28.5 19.2 16.7
Book Value per share (`/Share) 904 872 847 826 816 788 760 740
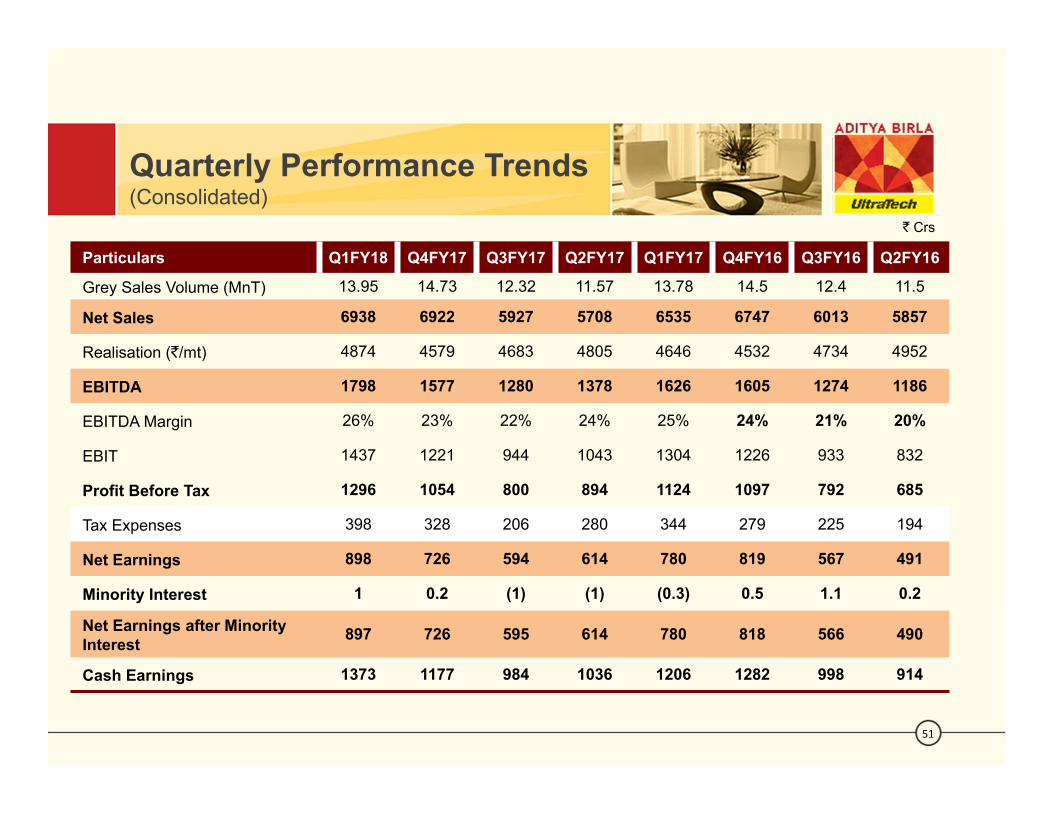
Quarterly Performance Trends(Consolidated)
51
Particulars Q1FY18 Q4FY17 Q3FY17 Q2FY17 Q1FY17 Q4FY16 Q3FY16 Q2FY16
Grey Sales Volume (MnT) 13.95 14.73 12.32 11.57 13.78 14.5 12.4 11.5
Net Sales 6938 6922 5927 5708 6535 6747 6013 5857
Realisation (`/mt) 4874 4579 4683 4805 4646 4532 4734 4952
EBITDA 1798 1577 1280 1378 1626 1605 1274 1186
EBITDA Margin 26% 23% 22% 24% 25% 24% 21% 20%
EBIT 1437 1221 944 1043 1304 1226 933 832
Profit Before Tax 1296 1054 800 894 1124 1097 792 685
Tax Expenses 398 328 206 280 344 279 225 194
Net Earnings 898 726 594 614 780 819 567 491
Minority Interest 1 0.2 (1) (1) (0.3) 0.5 1.1 0.2
Net Earnings after MinorityInterest 897 726 595 614 780 818 566 490
Cash Earnings 1373 1177 984 1036 1206 1282 998 914
` Crs

52
Quarterly Performance Trends(Consolidated) …Contd.
` Crs
Particulars Jun’17 Mar’17 Dec’16 Sep’16 Jun’16 Mar’16 Dec’15 Sep’15
FINANCIAL POSITION
Net Fixed Assets incl. CWIP 42178 26039 26129 26134 26130 26127 26098 25990
NWC + Derivative Assets (8) (189) 216 325 (39) 667 429 1040
Shareholders Fund 25268 24392 23705 23031 22725 21946 21122 20538
Total Debt 22679 8474 9173 9135 9669 10616 9042 9860
Net Debt 15055 (215) 1101 1923 1961 3523 4165 5320
Capital Employed 50852 35648 35565 34796 34944 35008 32525 32667
RATIOS & STATISTICS
EPS (`/Share) 32.7 26.4 21.7 22.4 28.4 29.8 20.6 17.9
Book Value (`/Share) 921 889 864 839 828 800 770 748
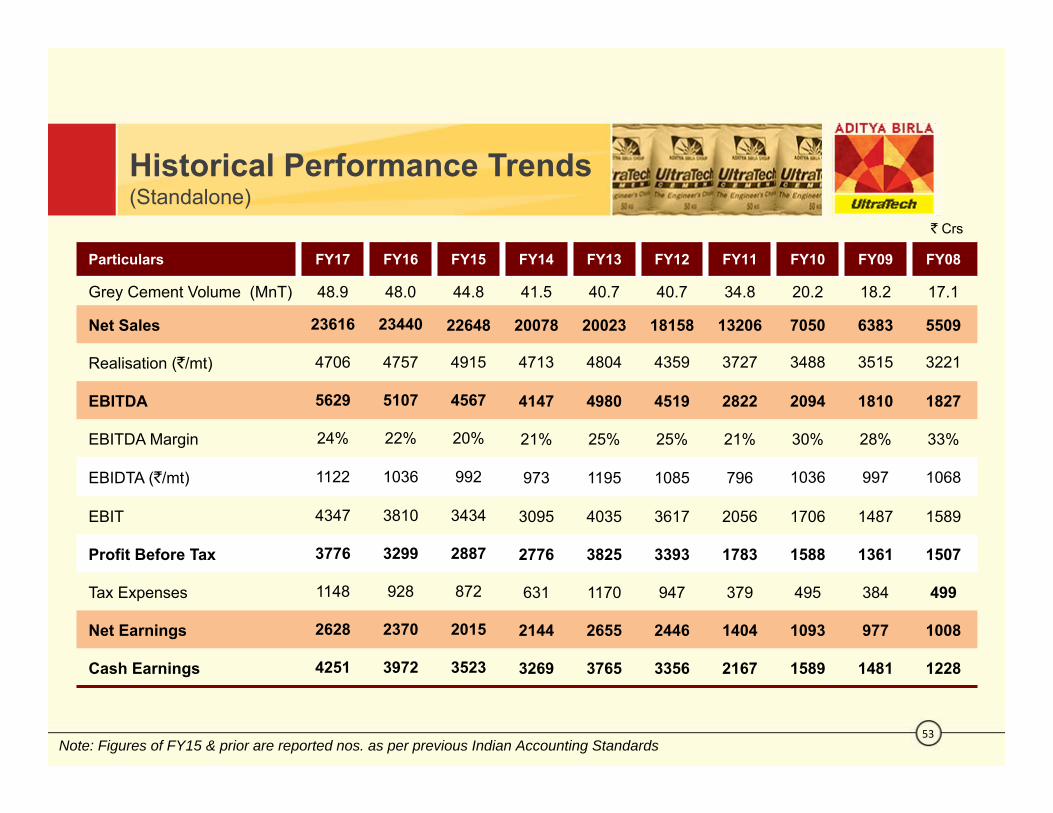
Historical Performance Trends(Standalone)
53
Particulars FY17 FY16 FY15 FY14 FY13 FY12 FY11 FY10 FY09 FY08
Grey Cement Volume (MnT) 48.9 48.0 44.8 41.5 40.7 40.7 34.8 20.2 18.2 17.1
Net Sales 23616 23440 22648 20078 20023 18158 13206 7050 6383 5509
Realisation (`/mt) 4706 4757 4915 4713 4804 4359 3727 3488 3515 3221
EBITDA 5629 5107 4567 4147 4980 4519 2822 2094 1810 1827
EBITDA Margin 24% 22% 20% 21% 25% 25% 21% 30% 28% 33%
EBIDTA (`/mt) 1122 1036 992 973 1195 1085 796 1036 997 1068
EBIT 4347 3810 3434 3095 4035 3617 2056 1706 1487 1589
Profit Before Tax 3776 3299 2887 2776 3825 3393 1783 1588 1361 1507
Tax Expenses 1148 928 872 631 1170 947 379 495 384 499
Net Earnings 2628 2370 2015 2144 2655 2446 1404 1093 977 1008
Cash Earnings 4251 3972 3523 3269 3765 3356 2167 1589 1481 1228
` Crs
Note: Figures of FY15 & prior are reported nos. as per previous Indian Accounting Standards
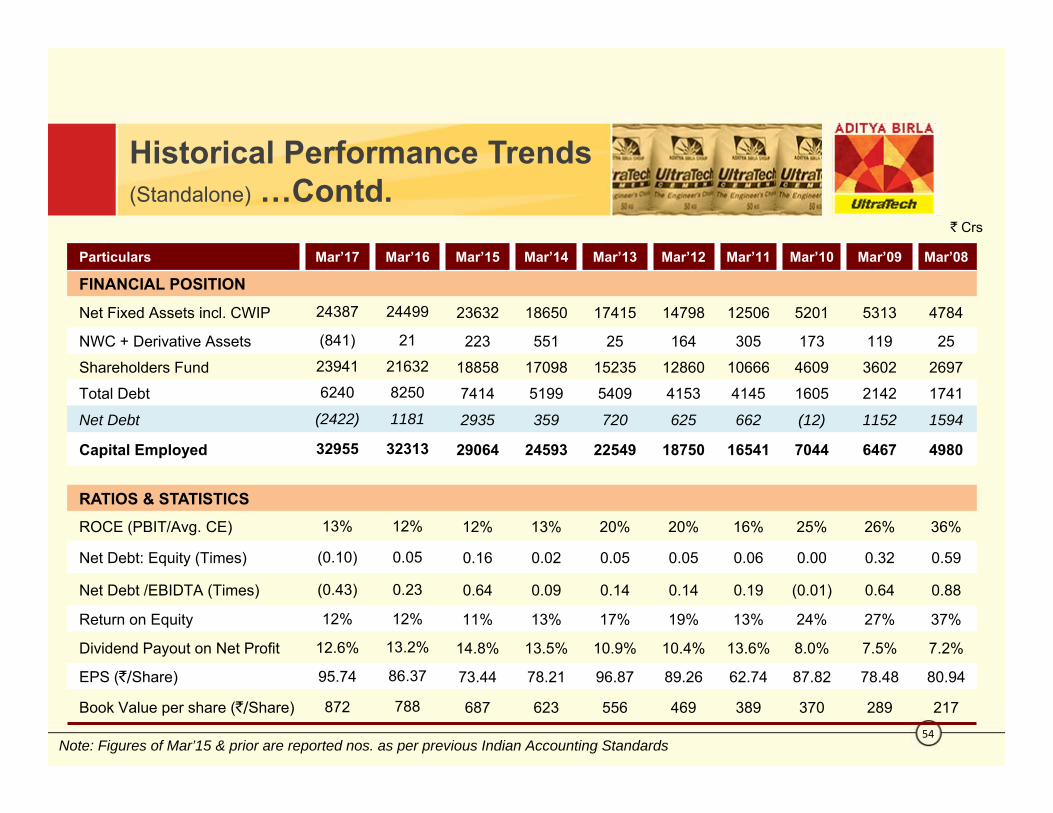
Historical Performance Trends(Standalone) …Contd.
54
Particulars Mar’17 Mar’16 Mar’15 Mar’14 Mar’13 Mar’12 Mar’11 Mar’10 Mar’09 Mar’08
FINANCIAL POSITIONNet Fixed Assets incl. CWIP 24387 24499 23632 18650 17415 14798 12506 5201 5313 4784
NWC + Derivative Assets (841) 21 223 551 25 164 305 173 119 25Shareholders Fund 23941 21632 18858 17098 15235 12860 10666 4609 3602 2697Total Debt 6240 8250 7414 5199 5409 4153 4145 1605 2142 1741
Net Debt (2422) 1181 2935 359 720 625 662 (12) 1152 1594
Capital Employed 32955 32313 29064 24593 22549 18750 16541 7044 6467 4980
RATIOS & STATISTICSROCE (PBIT/Avg. CE) 13% 12% 12% 13% 20% 20% 16% 25% 26% 36%
Net Debt: Equity (Times) (0.10) 0.05 0.16 0.02 0.05 0.05 0.06 0.00 0.32 0.59
Net Debt /EBIDTA (Times) (0.43) 0.23 0.64 0.09 0.14 0.14 0.19 (0.01) 0.64 0.88
Return on Equity 12% 12% 11% 13% 17% 19% 13% 24% 27% 37%
Dividend Payout on Net Profit 12.6% 13.2% 14.8% 13.5% 10.9% 10.4% 13.6% 8.0% 7.5% 7.2%
EPS (`/Share) 95.74 86.37 73.44 78.21 96.87 89.26 62.74 87.82 78.48 80.94
Book Value per share (`/Share) 872 788 687 623 556 469 389 370 289 217
` Crs
Note: Figures of Mar’15 & prior are reported nos. as per previous Indian Accounting Standards

55
` Crs
Particulars FY17 FY16 FY15 FY14 FY13 FY12 FY11 FY10 FY09 FY08
Operating Cash Profit (Net of Tax) 4890 4279 4427 3497 4266 3787 2311 1705 1601 1340
Change in Working Capital 289 914 236 21 (229) (133) (118) (87) (87) 442
Cash Flow from Operations 5180 5193 4663 3517 4037 3655 2193 1618 1514 1783
Capex for Maintenance (654) (868) (1158) (1131) (1559) (1246) (993) (227) (441) (688)
Expansion Capex/ Investments (537) (1167) (5310) (1287) (2162) (1912) (439) (57) (390) (1139)
Cash Flow from Investing Activities (1191) (2034) (6469) (2417) (3722) (3158) (1432) (284) (831) (1827)
Free Cash Flow 3989 3159 (1805) 1100 315 497 761 1334 683 (44)
Cash Flow StatementStandalone
* Includes Gujarat Jaypee assets acquisition of ` 3647 Crs.
*

Historical Performance Trends(Consolidated)
56
` Crs
Particulars FY17 FY16 FY15 FY14 FY13 FY12 FY11 FY10 FY09 FY08
Grey Cement Volume (MnT) 52.4 51.3 48.2 44.7 43.6 44.0 36.9 20.3 18.5 17.3
Net Sales 25092 24880 24056 21443 21161 19077 13687 7175 6564 5623
Realisation (`/Mt) 4789 4847 4993 4801 4850 4340 3704 3535 3548 3250
EBITDA 5861 5365 4776 4358 5143 4565 2850 2107 1819 1837
EBITDA Margin 23% 22% 20% 20% 24% 24% 21% 29% 28% 33%
EBIT 4512 3988 3572 3219 4120 3602 2037 1715 1493 1598
Profit Before Tax 3872 3421 2986 2858 3867 3345 1745 1598 1368 1515
Tax Expenses 1159 942 884 645 1179 948 384 501 388 504
Net Earnings 2714 2480 2102 2213 2688 2397 1361 1097 980 1012
Minority Interest (1) 2 4 7 10 (6) (6) 2 2 1
Net Earnings after MinorityInterest 2715 2478 2098 2206 2678 2403 1367 1095 978 1010
Cash Earnings 4404 4166 3680 3424 3869 3370 2172 1595 1485 1234
Note: Figures of FY15 & prior are reported nos. as per previous Indian Accounting Standards
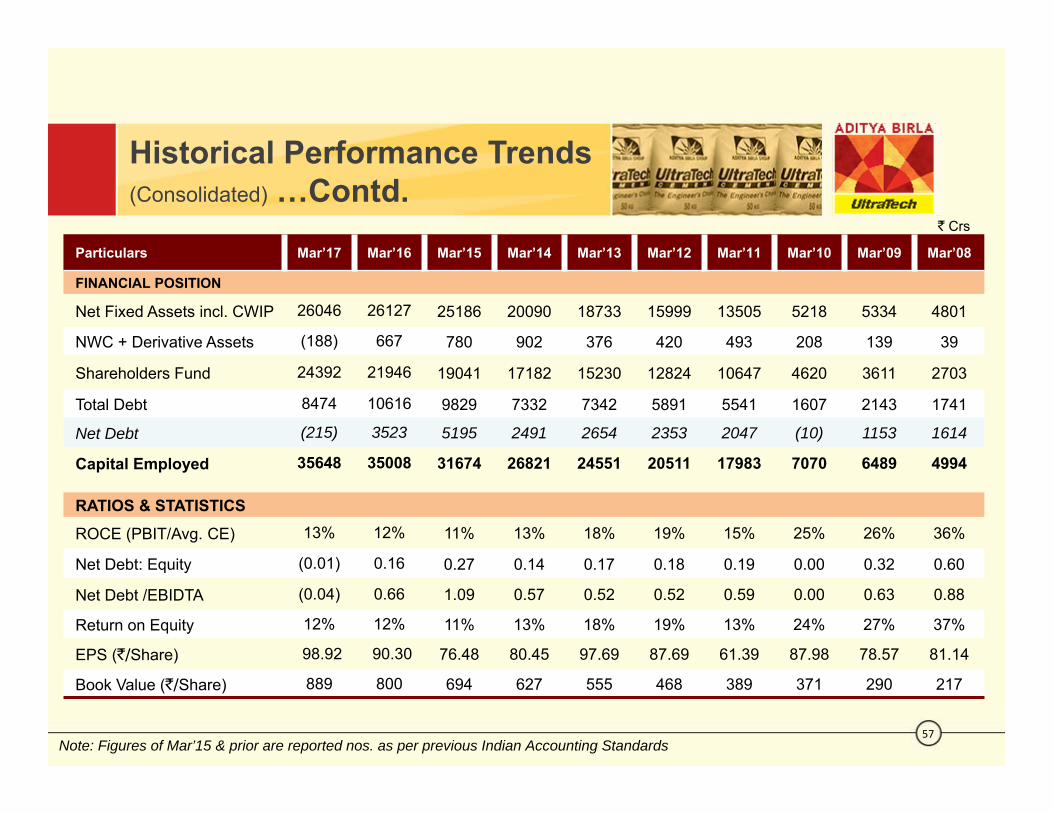
Historical Performance Trends(Consolidated) …Contd.
57
` Crs
Particulars Mar’17 Mar’16 Mar’15 Mar’14 Mar’13 Mar’12 Mar’11 Mar’10 Mar’09 Mar’08
FINANCIAL POSITION
Net Fixed Assets incl. CWIP 26046 26127 25186 20090 18733 15999 13505 5218 5334 4801
NWC + Derivative Assets (188) 667 780 902 376 420 493 208 139 39
Shareholders Fund 24392 21946 19041 17182 15230 12824 10647 4620 3611 2703
Total Debt 8474 10616 9829 7332 7342 5891 5541 1607 2143 1741
Net Debt (215) 3523 5195 2491 2654 2353 2047 (10) 1153 1614
Capital Employed 35648 35008 31674 26821 24551 20511 17983 7070 6489 4994
RATIOS & STATISTICSROCE (PBIT/Avg. CE) 13% 12% 11% 13% 18% 19% 15% 25% 26% 36%
Net Debt: Equity (0.01) 0.16 0.27 0.14 0.17 0.18 0.19 0.00 0.32 0.60
Net Debt /EBIDTA (0.04) 0.66 1.09 0.57 0.52 0.52 0.59 0.00 0.63 0.88
Return on Equity 12% 12% 11% 13% 18% 19% 13% 24% 27% 37%
EPS (`/Share) 98.92 90.30 76.48 80.45 97.69 87.69 61.39 87.98 78.57 81.14
Book Value (`/Share) 889 800 694 627 555 468 389 371 290 217
Note: Figures of Mar’15 & prior are reported nos. as per previous Indian Accounting Standards
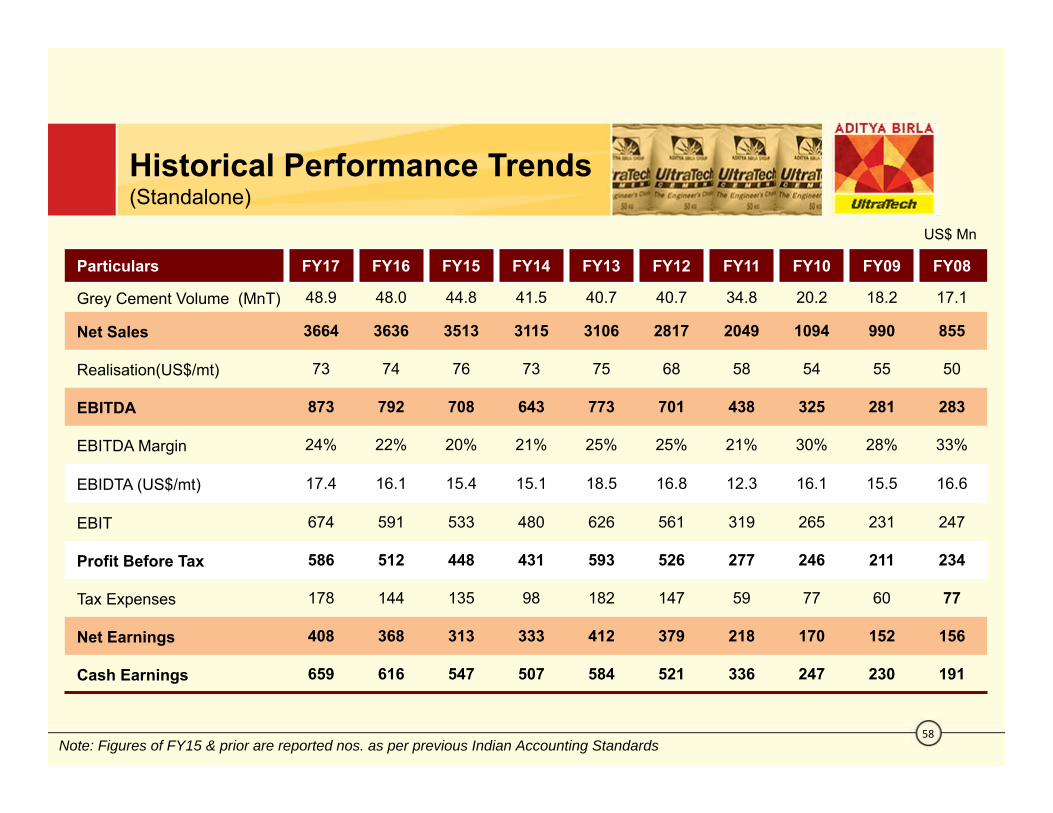
Historical Performance Trends(Standalone)
58
Particulars FY17 FY16 FY15 FY14 FY13 FY12 FY11 FY10 FY09 FY08
Grey Cement Volume (MnT) 48.9 48.0 44.8 41.5 40.7 40.7 34.8 20.2 18.2 17.1
Net Sales 3664 3636 3513 3115 3106 2817 2049 1094 990 855
Realisation(US$/mt) 73 74 76 73 75 68 58 54 55 50
EBITDA 873 792 708 643 773 701 438 325 281 283
EBITDA Margin 24% 22% 20% 21% 25% 25% 21% 30% 28% 33%
EBIDTA (US$/mt) 17.4 16.1 15.4 15.1 18.5 16.8 12.3 16.1 15.5 16.6
EBIT 674 591 533 480 626 561 319 265 231 247
Profit Before Tax 586 512 448 431 593 526 277 246 211 234
Tax Expenses 178 144 135 98 182 147 59 77 60 77
Net Earnings 408 368 313 333 412 379 218 170 152 156
Cash Earnings 659 616 547 507 584 521 336 247 230 191
US$ Mn
Note: Figures of FY15 & prior are reported nos. as per previous Indian Accounting Standards

Historical Performance Trends(Standalone) …Contd.
59
Particulars Mar’17 Mar’16 Mar’15 Mar’14 Mar’13 Mar’12 Mar’11 Mar’10 Mar’09 Mar’08FINANCIAL POSITION
Net Fixed Assets incl. CWIP 3783 3801 3666 2893 2702 2296 1940 807 824 742
NWC + Derivative Assets (130) 3 35 85 4 25 47 27 18 4
Shareholders Fund 3714 3356 2925 2652 2363 1995 1655 715 559 418
Total Debt 968 1280 1150 807 839 644 643 249 332 270Net Debt (376) 183 455 56 112 97 103 (2) 179 247
Capital Employed 5112 5013 4509 3815 3498 2909 2566 1093 1003 773
RATIOS & STATISTICS
ROCE (PBIT/Avg. CE) 13% 12% 12% 13% 20% 20% 16% 25% 26% 36%
Net Debt: Equity (0.10) 0.05 0.16 0.02 0.05 0.05 0.06 0.00 0.32 0.59
Net Debt /EBIDTA (0.43) 0.23 0.64 0.09 0.14 0.14 0.19 (0.01) 0.64 0.88
Return on Equity 12% 12% 11% 13% 17% 19% 13% 24% 27% 37%
Dividend Payout on Net Profit 12.6% 13.2% 14.8% 13.5% 10.9% 10.4% 13.6% 8.0% 7.5% 7.2%
EPS ($/Share) 1.5 1.3 1.1 1.2 1.5 1.4 1.0 1.4 1.2 1.3
Book Value ($/Share) 13.5 12.2 10.7 9.7 8.6 7.3 6.0 5.7 4.5 3.4
US$ Mn
Note: Figures of Mar’15 & prior are reported nos. as per previous Indian Accounting Standards
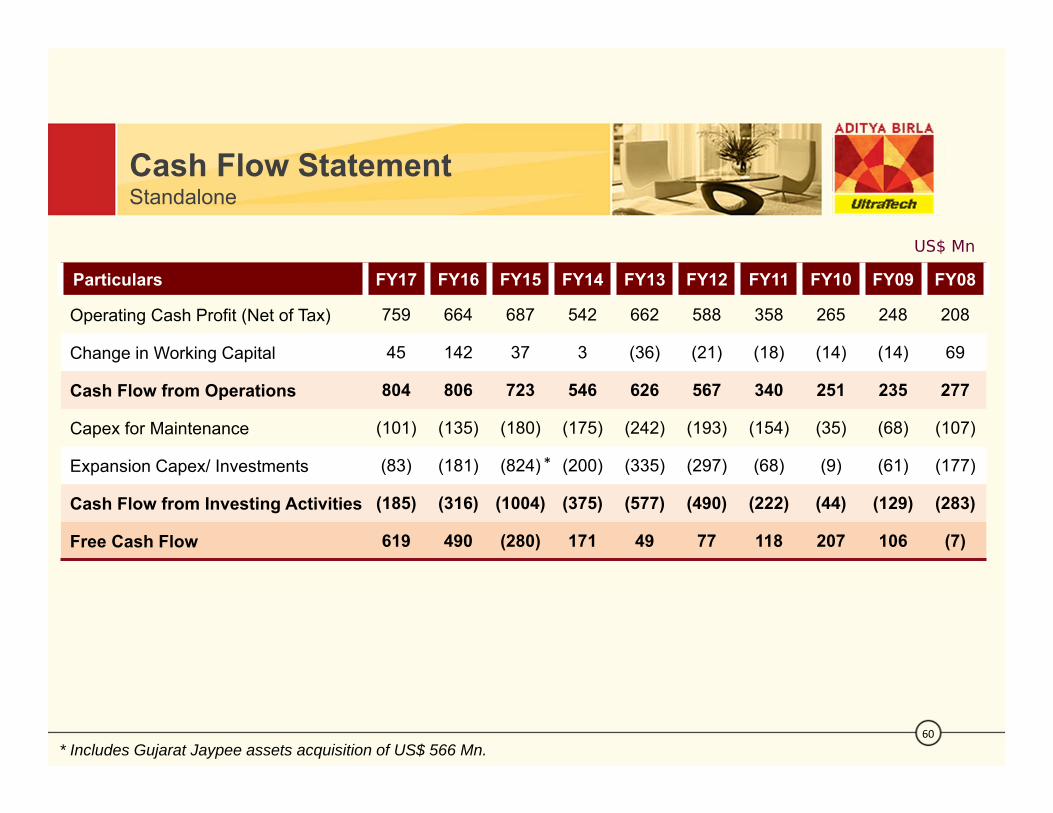
60
Particulars FY17 FY16 FY15 FY14 FY13 FY12 FY11 FY10 FY09 FY08
Operating Cash Profit (Net of Tax) 759 664 687 542 662 588 358 265 248 208
Change in Working Capital 45 142 37 3 (36) (21) (18) (14) (14) 69
Cash Flow from Operations 804 806 723 546 626 567 340 251 235 277
Capex for Maintenance (101) (135) (180) (175) (242) (193) (154) (35) (68) (107)
Expansion Capex/ Investments (83) (181) (824) (200) (335) (297) (68) (9) (61) (177)
Cash Flow from Investing Activities (185) (316) (1004) (375) (577) (490) (222) (44) (129) (283)
Free Cash Flow 619 490 (280) 171 49 77 118 207 106 (7)
Cash Flow StatementStandalone
*
US$ Mn
* Includes Gujarat Jaypee assets acquisition of US$ 566 Mn.
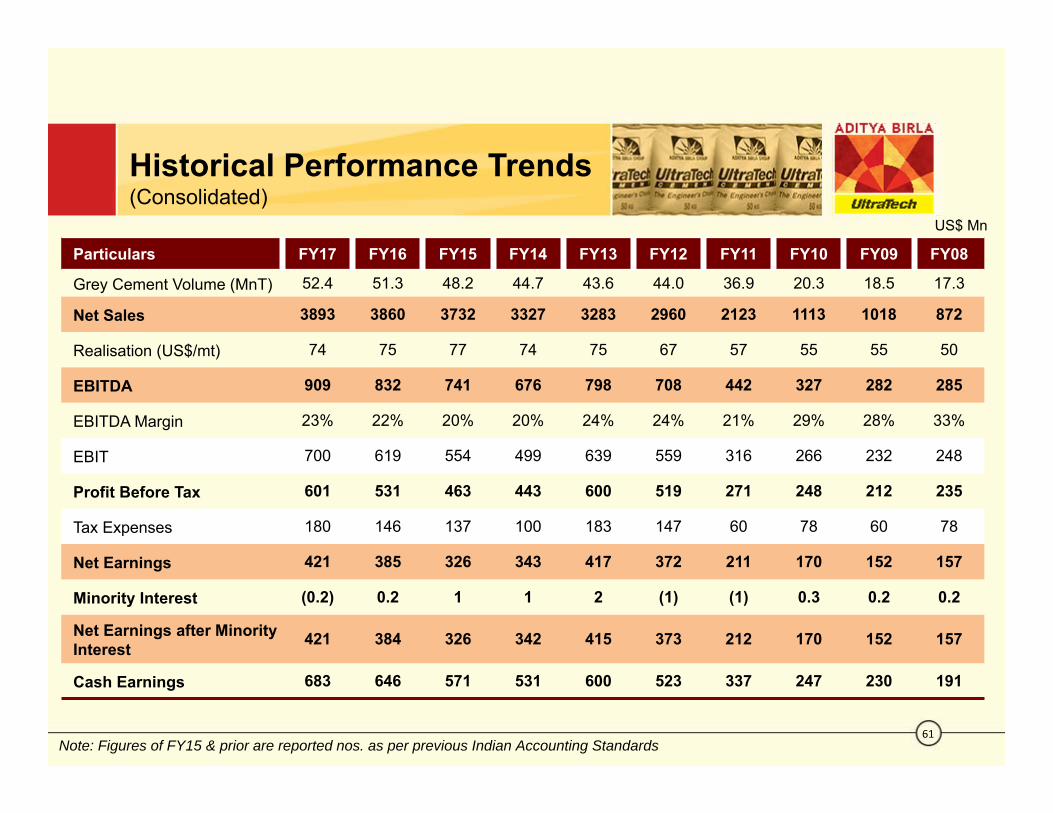
Historical Performance Trends(Consolidated)
61
Particulars FY17 FY16 FY15 FY14 FY13 FY12 FY11 FY10 FY09 FY08
Grey Cement Volume (MnT) 52.4 51.3 48.2 44.7 43.6 44.0 36.9 20.3 18.5 17.3
Net Sales 3893 3860 3732 3327 3283 2960 2123 1113 1018 872
Realisation (US$/mt) 74 75 77 74 75 67 57 55 55 50
EBITDA 909 832 741 676 798 708 442 327 282 285
EBITDA Margin 23% 22% 20% 20% 24% 24% 21% 29% 28% 33%
EBIT 700 619 554 499 639 559 316 266 232 248
Profit Before Tax 601 531 463 443 600 519 271 248 212 235
Tax Expenses 180 146 137 100 183 147 60 78 60 78
Net Earnings 421 385 326 343 417 372 211 170 152 157
Minority Interest (0.2) 0.2 1 1 2 (1) (1) 0.3 0.2 0.2
Net Earnings after MinorityInterest 421 384 326 342 415 373 212 170 152 157
Cash Earnings 683 646 571 531 600 523 337 247 230 191
US$ Mn
Note: Figures of FY15 & prior are reported nos. as per previous Indian Accounting Standards
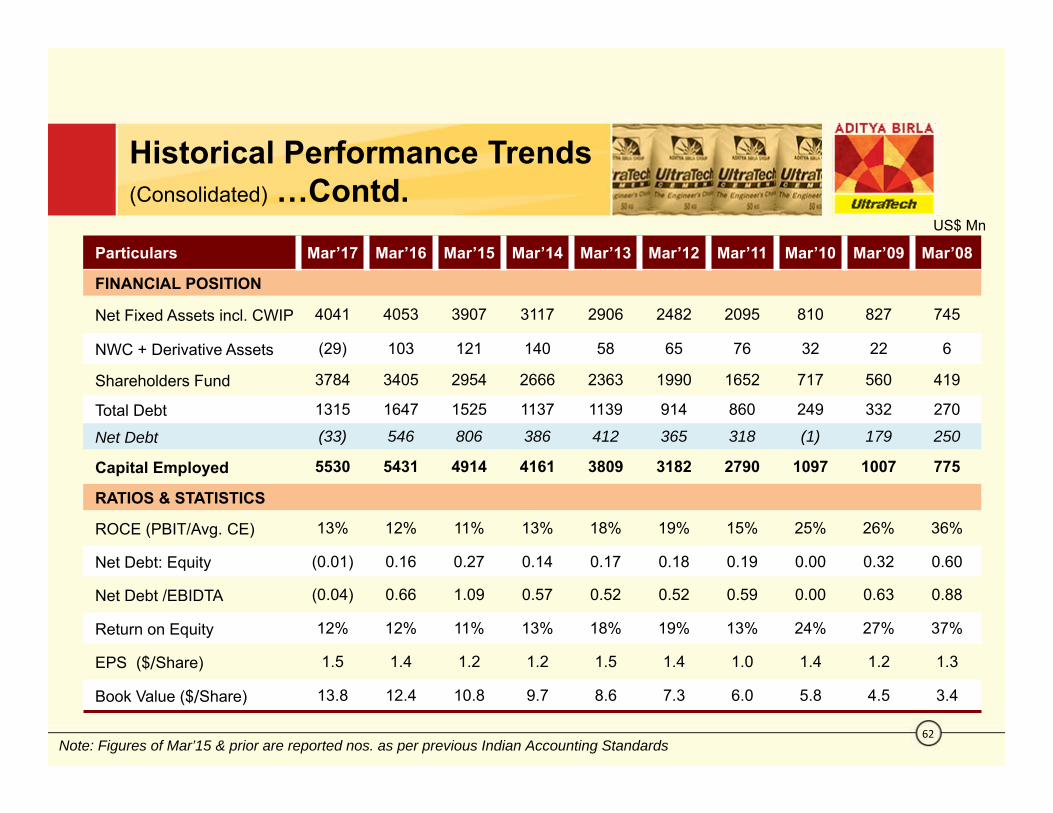
Historical Performance Trends(Consolidated) …Contd.
62
Particulars Mar’17 Mar’16 Mar’15 Mar’14 Mar’13 Mar’12 Mar’11 Mar’10 Mar’09 Mar’08
FINANCIAL POSITION
Net Fixed Assets incl. CWIP 4041 4053 3907 3117 2906 2482 2095 810 827 745
NWC + Derivative Assets (29) 103 121 140 58 65 76 32 22 6
Shareholders Fund 3784 3405 2954 2666 2363 1990 1652 717 560 419
Total Debt 1315 1647 1525 1137 1139 914 860 249 332 270
Net Debt (33) 546 806 386 412 365 318 (1) 179 250
Capital Employed 5530 5431 4914 4161 3809 3182 2790 1097 1007 775
RATIOS & STATISTICS
ROCE (PBIT/Avg. CE) 13% 12% 11% 13% 18% 19% 15% 25% 26% 36%
Net Debt: Equity (0.01) 0.16 0.27 0.14 0.17 0.18 0.19 0.00 0.32 0.60
Net Debt /EBIDTA (0.04) 0.66 1.09 0.57 0.52 0.52 0.59 0.00 0.63 0.88
Return on Equity 12% 12% 11% 13% 18% 19% 13% 24% 27% 37%
EPS ($/Share) 1.5 1.4 1.2 1.2 1.5 1.4 1.0 1.4 1.2 1.3
Book Value ($/Share) 13.8 12.4 10.8 9.7 8.6 7.3 6.0 5.8 4.5 3.4
US$ Mn
Note: Figures of Mar’15 & prior are reported nos. as per previous Indian Accounting Standards

Statements in this “Presentation” describing the Company’s objectives, estimates, expectationsor predictions may be “forward looking statements” within the meaning of applicable securitieslaws and regulations. Actual results could differ materially from those expressed or implied.Important factors that could make a difference to the Company’s operations include global andIndian demand supply conditions, finished goods prices, feedstock availability and prices,cyclical demand and pricing in the Company’s principal markets, changes in Governmentregulations, tax regimes, economic developments within India and the countries within which theCompany conducts business and other factors such as litigation and labour negotiations. TheCompany assumes no responsibility to publicly amend, modify or revise any forward lookingstatement, on the basis of any subsequent development, information or events, or otherwise.
UltraTech Cement LimitedRegd. Office: 2nd Floor, ‘B’ Wing, Ahura Centre, MIDC, Andheri (E), Mumbai – 400 093
[Corporate Identity Number L26940MH2000PLC128420]+91 82910 48644 www.ultratechcement.com or www.adityabirla.com
Disclaimer
63
Related Documents