This information was prepared by Coriolis solely for the use of our client; it is not to be relied on by any third party without prior written consent. Food & Beverage Information Project 2011 Sector Stream – Beverages October 2011; v1.8 Final Report www.foodandbeverage.govt.nz

Welcome message from author
This document is posted to help you gain knowledge. Please leave a comment to let me know what you think about it! Share it to your friends and learn new things together.
Transcript
This information was prepared by Coriolis solely for the use of our client; it is not to be relied on by any third party without prior written consent.
Food & Beverage Information Project 2011Sector Stream – Beverages
October 2011; v1.8Final Report
www.foodandbeverage.govt.nz
Coriolis is a strategic management consulting andmarket research firm
We work with organisations to help them grow. For corporations, thatoften means developing strategies for revenue growth. Forgovernments, it means working on national economic development. Fornon‐profits, it means helping to grow their social impact.
We address all the problems that are involved in growth: strategy,marketing, pricing, innovation, new product development, new markets,organisation, leadership, economic competitiveness.
We bring to our clients specialised industry and functional expertise.We invest significant resources in building knowledge. We see it as ourmission to bring this knowledge to our clients and we publish much of itfor the benefit of others.
A hallmark of our work is rigorous, fact‐based analysis, grounded inproven methodologies. We rely on data because it provides clarity andaligns people.
However, we deliver results, not reports. To that end, we work side byside with our clients to create and implement practical solutions.
The Coriolis name
The coriolis force, named for French physicist Gaspard Coriolis (1792‐1843), may be seen on a large scale in the movement of winds andocean currents on the rotating earth. It dominates weather patterns,producing the counterclockwise flow observed around low‐pressurezones in the Northern Hemisphere and the clockwise flow around suchzones in the Southern Hemisphere. To us it means understanding thebig picture before you get into the details.
PO Box 90‐509, Victoria Street West, Auckland 1142, New ZealandTel: +64 9 623 1848 www.coriolisresearch.com

The objective of this report is to provide a factual source of high quality information on the current situation in the New Zealand beverage sector for four audiences:
‐ Investors (domestic or international)‐ Industry participants (firms & individuals)‐ Government (across all roles and responsibilities)‐ Scientific researchers (academic, government & firm)
It creates a common set of facts and figures on the current situation in the industry.
It draws conclusions on potential industry strategic directionsand highlights opportunities for further investment.
It forms a part of the wider Food & Beverage Information Project and will be updated annually.
PAGE 3

TABLE OF CONTENTS
Section Page
Contents 4
Glossary of terms 5
Methodology & data sources 6
F&B IP Overview 7
Summary & conclusions 9
Sector overview 17
Wine 43
Appendices 62
GLOSSARY OF TERMS
PAGE 5
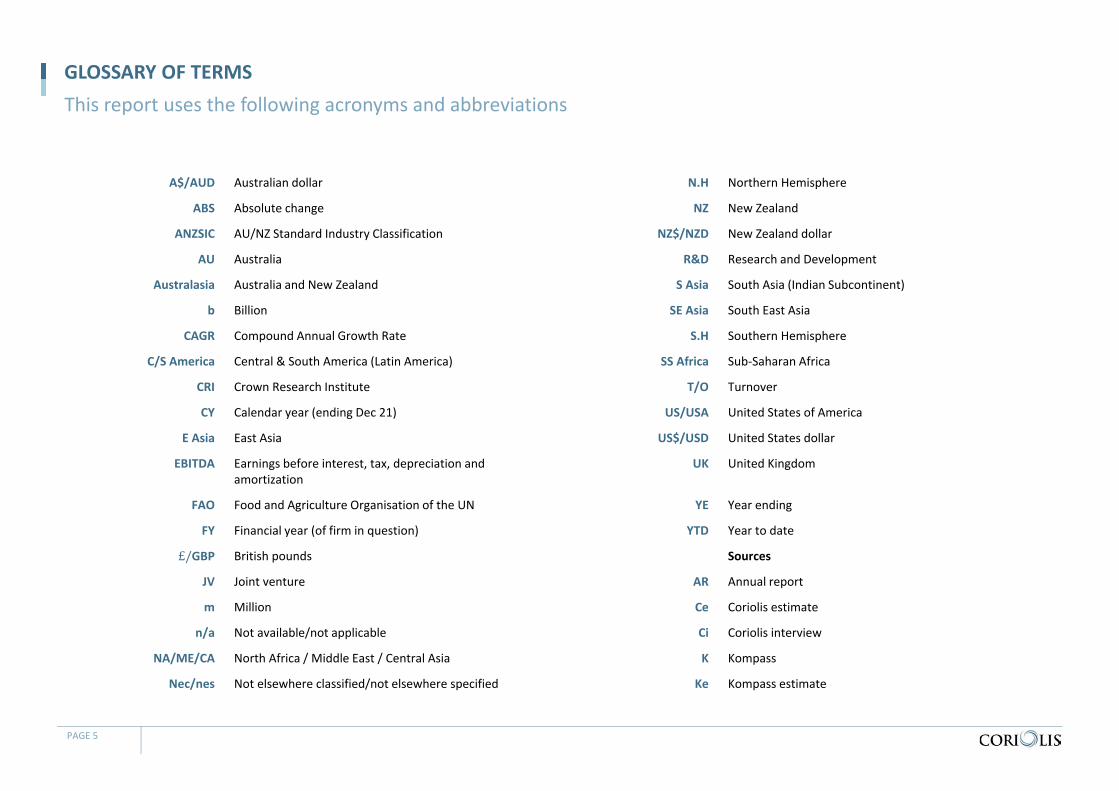
This report uses the following acronyms and abbreviations
A$/AUD Australian dollar N.H Northern Hemisphere
ABS Absolute change NZ New Zealand
ANZSIC AU/NZ Standard Industry Classification NZ$/NZD New Zealand dollar
AU Australia R&D Research and Development
Australasia Australia and New Zealand S Asia South Asia (Indian Subcontinent)
b Billion SE Asia South East Asia
CAGR Compound Annual Growth Rate S.H Southern Hemisphere
C/S America Central & South America (Latin America) SS Africa Sub‐Saharan Africa
CRI Crown Research Institute T/O Turnover
CY Calendar year (ending Dec 21) US/USA United States of America
E Asia East Asia US$/USD United States dollar
EBITDA Earnings before interest, tax, depreciation and amortization
UK United Kingdom
FAO Food and Agriculture Organisation of the UN YE Year ending
FY Financial year (of firm in question) YTD Year to date
£/GBP British pounds Sources
JV Joint venture AR Annual report
m Million Ce Coriolis estimate
n/a Not available/not applicable Ci Coriolis interview
NA/ME/CA North Africa / Middle East / Central Asia K Kompass
Nec/nes Not elsewhere classified/not elsewhere specified Ke Kompass estimate
METHODOLOGY & DATA SOURCES
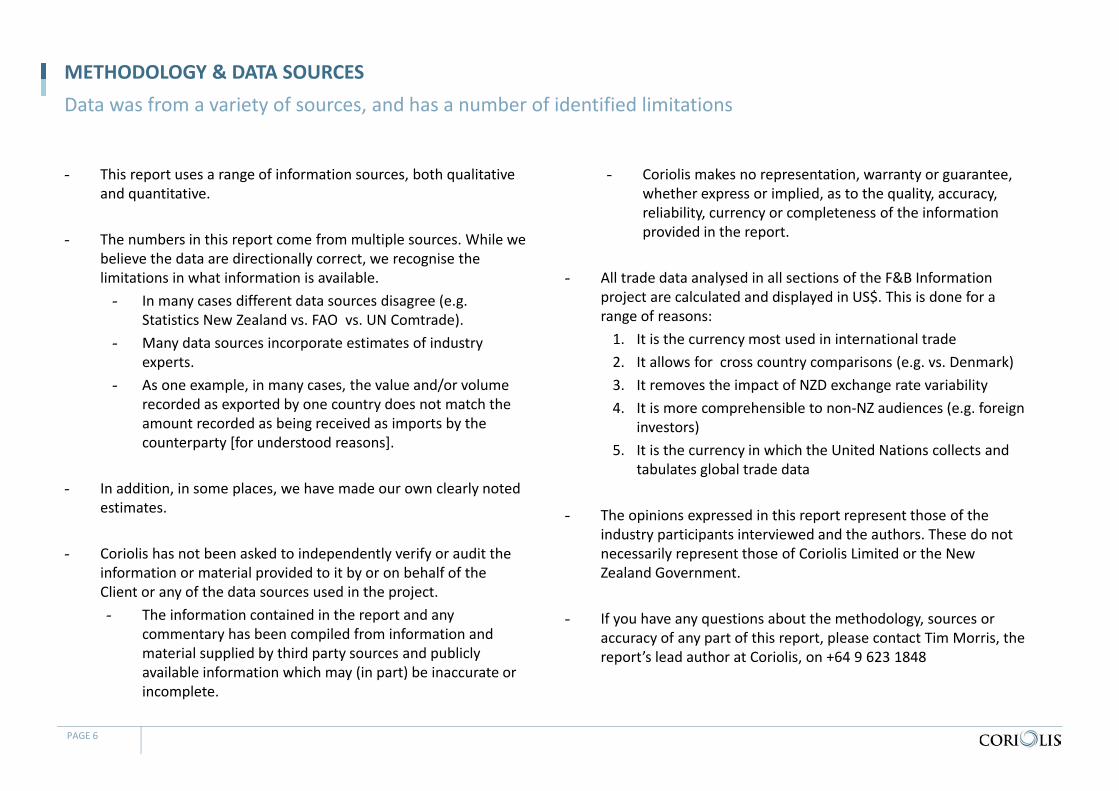
- This report uses a range of information sources, both qualitative and quantitative.
- The numbers in this report come from multiple sources. While we believe the data are directionally correct, we recognise the limitations in what information is available. - In many cases different data sources disagree (e.g.
Statistics New Zealand vs. FAO vs. UN Comtrade). - Many data sources incorporate estimates of industry
experts. - As one example, in many cases, the value and/or volume
recorded as exported by one country does not match the amount recorded as being received as imports by the counterparty [for understood reasons].
- In addition, in some places, we have made our own clearly noted estimates.
- Coriolis has not been asked to independently verify or audit the information or material provided to it by or on behalf of the Client or any of the data sources used in the project.- The information contained in the report and any
commentary has been compiled from information and material supplied by third party sources and publicly available information which may (in part) be inaccurate or incomplete.
- Coriolis makes no representation, warranty or guarantee, whether express or implied, as to the quality, accuracy, reliability, currency or completeness of the information provided in the report.
- All trade data analysed in all sections of the F&B Information project are calculated and displayed in US$. This is done for a range of reasons:1. It is the currency most used in international trade2. It allows for cross country comparisons (e.g. vs. Denmark)3. It removes the impact of NZD exchange rate variability4. It is more comprehensible to non‐NZ audiences (e.g. foreign
investors)5. It is the currency in which the United Nations collects and
tabulates global trade data
- The opinions expressed in this report represent those of the industry participants interviewed and the authors. These do not necessarily represent those of Coriolis Limited or the New Zealand Government.
- If you have any questions about the methodology, sources or accuracy of any part of this report, please contact Tim Morris, the report’s lead author at Coriolis, on +64 9 623 1848
PAGE 6
Data was from a variety of sources, and has a number of identified limitations

Structure of the New Zealand Food & Beverage Information Project(2011)
F&B INFORMATION PROJECTThe New Zealand Food & Beverage Information Project is designed to be the foundation of facts and figures on which a range of audiences can build
PAGE 7 Note: Every year two subsectors are completed in more detail. This year it is Seafood and Nutraceuticals
Dairy Sector
Meat Sector
ProduceSector
Seafood Sector
NutraceuticalsSector
Processed Foods Sector
Beverages Sector
Investor’s Guide
Global Markets
Overview
Sectors
Industry Snapshot
Markets High Potential Market Profiles
FirmsInvestors Government

Structure of the New Zealand Food & Beverage Information Project(2011)
BEVERAGES SECTOR ANALYSISThis analysis of the New Zealand beverages sector forms a part of the wider Food & Beverage Information Project
PAGE 8
FirmsInvestors Government
Dairy Sector
ProduceSector
Seafood Sector
NutraceuticalsSector
Processed Foods Sector
Beverages Sector
Investor’s Guide
Global Markets
Overview Industry Snapshot
Markets
Sectors Meat Sector
High Potential Market Profiles
TABLE OF CONTENTS
Section Page
Contents 4
Glossary of terms 5
Methodology & data sources 6
F&B IP Overview 7
Summary & conclusions 9
Sector overview 17
Wine 43
Appendices 62

BEVERAGES – WINE – SITUATION
New Zealand wine (exports US$774m)
- Wine production is a fast growing industry for New Zealand with a number of large players
- Many wineries are now foreign owned (Montana, Nobilo); ongoing acquisitions are occurring
- Large group of small‐to‐medium sized New Zealand owned wineries who are capital constrained
- The New Zealand wine industry has achieved spectacular growth over the last 40 years
- From NZ£51 in exports in 1960 to NZ$1b in 2009
- Achieved premium price position in–market on par with France (which has been producing wine for ~2,000 years)
- Competes successfully with major old world wine producers (e.g. France, Germany)
- Success to date almost exclusively Marlborough Sauvignon Blanc
- A “must‐have” wine for major wine players
- Good Marlborough wine area is now almost all used
- Emergent secondary regions are 20 years behind Marlborough in terms of development
- Hawkes Bay, Waipara and Central Otago stand out as the next best prospects
- Other than Gimblett Gravels Syrah, most still to find “their” wine
- Foreign ownership plays a big part in the wine industry, with the
top three wineries foreign owned; New World wines are an important part of a global portfolio.
Competitors
- New Zealand wine competes directly with other premium temperate climate countries
- France, Germany, USA, South Africa, Chile
Consumers/Markets
- Global Financial Crisis (GFC) depressed global demand, pushing down prices; this in turn triggered a decrease in global production
- These falling prices have impacted New Zealand wines
- Wine consumption is declining in many EU markets (France, Italy, Spain) due to economic conditions; however, New Zealand’s key markets (AU, UK, USA) have been stable to increasing
- Wine sales success to date in wine has been primarily in Anglo‐Saxon 4 (USA, Canada, UK & AU);
- China is an emerging growth market; now New Zealand’s #5 export destination
- Available market data suggests that the growth of New Zealand wine is at the expense of French wines (i.e. that the two are close substitutes to consumers)
PAGE 10 GFC = Global Financial Crisis; Source: Interviews; Coriolis
The wine industry has shown rapid growth driven by Marlborough Sauvignon Blanc; further diversification into new varieties and new regions should occur going forward
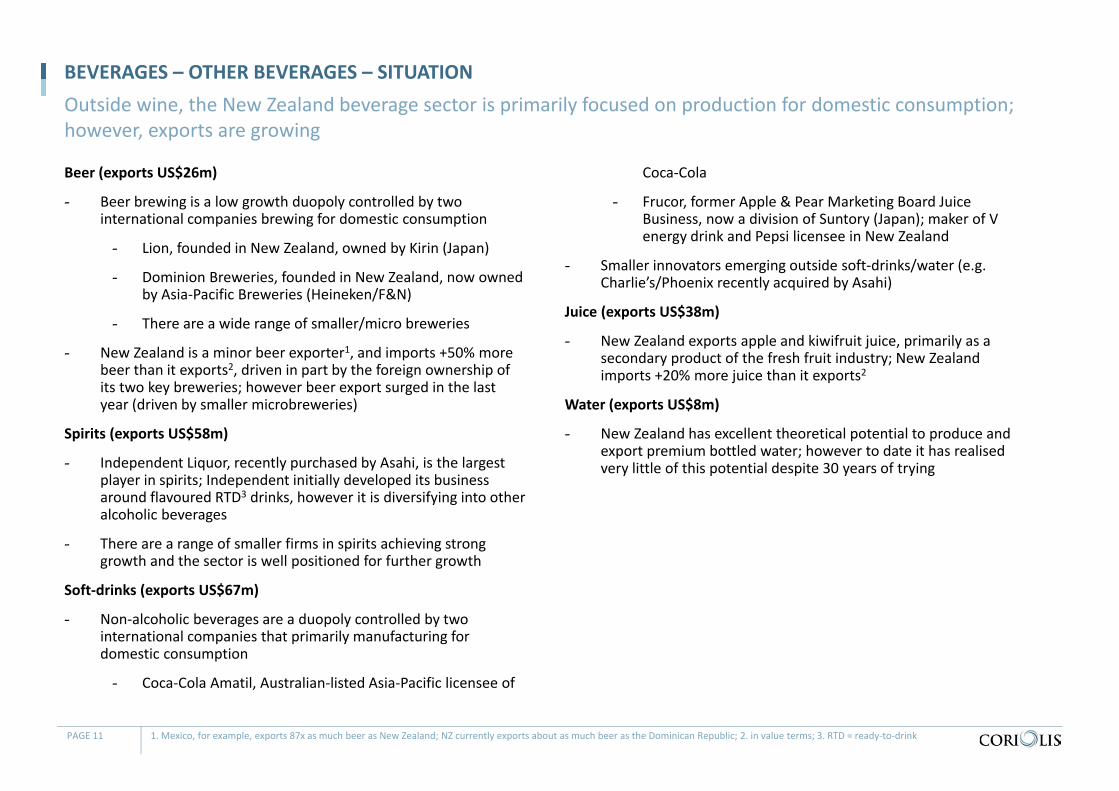
BEVERAGES – OTHER BEVERAGES – SITUATION
Beer (exports US$26m)
- Beer brewing is a low growth duopoly controlled by two international companies brewing for domestic consumption
- Lion, founded in New Zealand, owned by Kirin (Japan)
- Dominion Breweries, founded in New Zealand, now owned by Asia‐Pacific Breweries (Heineken/F&N)
- There are a wide range of smaller/micro breweries
- New Zealand is a minor beer exporter1, and imports +50% more beer than it exports2, driven in part by the foreign ownership of its two key breweries; however beer export surged in the last year (driven by smaller microbreweries)
Spirits (exports US$58m)
- Independent Liquor, recently purchased by Asahi, is the largest player in spirits; Independent initially developed its business around flavoured RTD3 drinks, however it is diversifying into other alcoholic beverages
- There are a range of smaller firms in spirits achieving strong growth and the sector is well positioned for further growth
Soft‐drinks (exports US$67m)
- Non‐alcoholic beverages are a duopoly controlled by two international companies that primarily manufacturing for domestic consumption
- Coca‐Cola Amatil, Australian‐listed Asia‐Pacific licensee of
Coca‐Cola
- Frucor, former Apple & Pear Marketing Board Juice Business, now a division of Suntory (Japan); maker of V energy drink and Pepsi licensee in New Zealand
- Smaller innovators emerging outside soft‐drinks/water (e.g. Charlie’s/Phoenix recently acquired by Asahi)
Juice (exports US$38m)
- New Zealand exports apple and kiwifruit juice, primarily as a secondary product of the fresh fruit industry; New Zealand imports +20% more juice than it exports2
Water (exports US$8m)
- New Zealand has excellent theoretical potential to produce and export premium bottled water; however to date it has realised very little of this potential despite 30 years of trying
PAGE 11 1. Mexico, for example, exports 87x as much beer as New Zealand; NZ currently exports about as much beer as the Dominican Republic; 2. in value terms; 3. RTD = ready‐to‐drink
Outside wine, the New Zealand beverage sector is primarily focused on production for domestic consumption; however, exports are growing

Key metrics #(2010)
CAGR(00‐10)
CAGR(09‐10)
ABS(09‐10)
Turnover (NZ$) $4,240m 5% 7% $271m
Exports (US$) $971m 18% 23% $182m
Enterprises1 519 6% 10% 49
Employment 8,900 3% ‐4% ‐410
Turnover per employee
$476,404 ‐ ‐ ‐
BEVERAGES – QUANTITATIVE SCORECARD Most of the beverages produced in New Zealand are consumed in New Zealand; the wine industry is the key export success story to date
PAGE 12 1. Manufacturing only; Source: various company annual reports; various company websites; Kompass; Coriolis analysis
Key firms Employ(#; 10)
Turnover(NZ$m; 10)
Lion
Pernod Ricard
Delegats Group
Constellation Brands
Villa Maria
DB Breweries
Independent Liquor
Coca Cola Amatil
Frucor
1,400
750
50
270
250
500
300
1,100
900
$605m
$337m
$220m
$215m
$141m
$461m
$414m
$493m
$380m
Key markets %(2010)
US$m(2010)
CAGR(00‐10)
CAGR(09‐10)
ABS(09‐10)
East Asia
SE Asia
Europe
North America
Australia/PI
Other
Total
5%
3%
28%
25%
38%
1%
100%
$51
$25
$274
$241
$370
$10
$971
12%
20%
18%
22%
18%
15%
18%
20%
36%
23%
29%
19%
52%
23%
$9m
$6m
$51m
$54m
$59m
$4m
$182m
Key competingcountries Key regions
France
Germany
USA
Chile
‐ Loire Valley (Sancerre,
Pouilly Furme)
‐ Bordeaux Regions (Entre‐
Deux‐Mers, Pessac‐
Leognan)
‐ Alsace, Mosel
‐Washington State, Oregon
‐ Valparaiso, Casablanca
Valley
Key products export value
US$m(2010)
CAGR(00‐10)
CAGR(09‐10)
ABS(09‐10)
Wine
Spirits
Beer
Soft drinks
Juice
Water
Total
$774
$58
$26
$67
$38
$8
$971
24%
9%
12%
7%
7%
18%
18%
21%
46%
64%
23%
5%
51%
23%
$137
$18
$10
$13
$2
$3
$182

BEVERAGES – WINE – SWOT ANALYSISThe New Zealand wine industry is well positioned for further growth, but pressures will continue
PAGE 13 Source: Interviews; Coriolis
Strengths Weaknesses
‐ Islands in the middle of the South Pacific the size of Italy but with only the populationof Singapore; therefore relatively unspoilt
‐ Strong and growing success in premium/super‐premium
‐ Achieves a strong price premium in key markets (similar to France)
‐ New Zealand Sauvignon Blanc now a “must have” for global wine companies
‐ Growth in market share in key markets (e.g. USA)
‐ Innovative and quality‐focused winemakers
‐ Large number of small wineries with low/no economies of scale
‐ High debt levels of many small and medium sized wineries
‐ Highly dependant on four countries (AU, UK, USA and Canada)
‐ Increasing exports of bulk wine
‐ Lack strong super‐premium heritage brands as demanded by brand and status conscious Asian consumers
Opportunities Issues/Threats/Risk
‐ Continued income growth in Asian markets
‐ Continued growth of New Zealand wine consumption in China
‐ Low share in Europe (two thirds of global wine consumption) outside British Isles
‐ Joint in‐market activity spreading cost of marketing
‐ Automated vineyard pruning technology reducing requirements for labour
‐ Strong and growing demand in Asia for premium fortified wines/wine based spirits (e.g. cognac)
‐ Growing consolidation of the wine industry
‐ Difficult finding good distributors to gain access into key markets
‐ Continued growth of bulk wine trade reducing the value of wine
‐ Continued impact of GFC, reducing wine spend
‐ Oversupply of wine globally increasing pressure on price
‐ Continued growth of retail brands/store brands in wine

BEVERAGES – NON‐WINE – SWOT ANALYSISNew Zealand is currently less well positioned outside wine; however the country is well positioned for further growth
PAGE 14 Source: Interviews; Coriolis
Strengths Weaknesses
‐ Islands in the middle of the South Pacific the size of Italy but with only the populationof Singapore; therefore relatively unspoilt
‐ Closer shipping distances to Asia compared to European competitors
‐ Demonstrated capabilities in beverage production
‐ On‐going growth and success of Frucor/V, and Charlies/Phoenix in non‐alcoholic drinks category
‐ Emergent success in spirits (e.g VoC and 42Below)
‐ No deep cultural unique “spirits” associated with New Zealand
‐ Long shipping distance to traditional western markets
‐ No large New Zealand owned champion growing and driving New Zealand brand position in beverages
‐ Limited culture or mentality of super‐premium branding or positioning (e.g. relative to France)
‐ Low levels of skills outside wine relative to peer group
‐ Not a producer of many base ingredients of typical beverages
Opportunities Issues/Threats/Risk
‐ Leverage success of New Zealand wine industry; build on awareness of New Zealand in wider premium beverages segments
‐ Wide range of New Zealand unique plants available as flavouring (e.g. 42 Below Manuka honey)
‐ Rapidly growing demand for premium alcoholic beverages in Asia
‐ Limited opportunity shipping “water” around the world if it isn’t a premium product
‐ Changing consumer sentiment (e.g. bottled water backlash)
‐ Failure to achieve large scale export traction outside wine
‐ Hollowing out of management skills in New Zealand industry due to foreign ownership

Situation creating opportunity Resulting potential strategic direction
Opportunity Challenges
‐ New Zealand has built a strong position in Sauvignon blanc
‐ Competitors improving and pushing into variety (e.g. South Africa) often at lower price point
1. Continuous improvement of Sauvignon Blanc from Marlborough
‐ Build on existing position‐ Create upward price pressure through
improvement in relative quality‐ “Vineyard‐to‐glass” approach
‐ Competitors improving as well‐ Spreading best practice across large
number of industry participants
‐ NZ still a very young wine producer finding its way
‐ Industry emerged from vision of handful of people, primarily EU/AU immigrants
‐ Peers have much wider range of regions and wines
2. Nurture emerging regions to Marlborough Sauvignon Blanc status
‐ Marlborough accounted for 70% of NZ wine production
‐ New Zealand over dependant on one variety/one region relative to peers
‐ Discovering new varieties that suit New Zealand conditions
‐ Expand immigration allowance of skilled wine industry participants
‐ Corporate group‐think and prevailing wisdom
‐ Capital‐ Biosecurity limiting introduction of
new genetics‐ Barriers to immigration
‐ The four large Anglo‐Saxon countries account for 20% of global wine consumption but 86% of New Zealand’s wine export value
‐ Northern Europe accounts for 32% of global wine imports but only 4% of NZ wine exports
3. Diversifying away from traditional Anglo Saxon markets into wine drinking Northern Europe
‐ Significant untapped potential for growth in Northern Europe, specifically Denmark, Netherlands and Sweden
‐ Language and cultural barriers‐ In‐market legal structures (e.g.
Sweden’s Systembolaget1)‐ Requires many years of hard work‐ Need to achieve minimum critical mass
“tipping point”1
‐ Asian consumers, particularly Chinese, favour smaller amounts of strong spirits
‐ Asian consumer are clearly signalling with their wallets that they want fortified wine not table wine
4. Move into fortified wines ‐ Fortified wine gets high prices‐ Fortified wine can support unique
positioning (e.g. Cognac, Armagnac, Pisco, Jerez)
‐ Lack of experience or skills‐ No heritage in space (need to do “new
world” approach)
‐ Many countries have a strong identity with a specific alcoholic spirit
‐ Peer group countries suggest spirits a strong area for growth going forward
5. Nurture development of a spirit industry
‐ Find New Zealand “spirit” (e.g. Mexico=Tequila)
‐ Build on existing premium position in wine
‐ Lack of heritage or history
BEVERAGES – POTENTIAL STRATEGIC DIRECTIONSFive potential high potential strategic directions are identified for the beverages industry
PAGE 15 1. For example a retail bay with the word “New Zealand” on the sign overhead

BEVERAGES – POTENTIAL AREAS FOR INVESTMENT
Wine- New Zealand Sauvignon Blanc a “must‐have” component of
portfolio for major global wine companies- Three of the top five US wine companies in NZ- Three of the largest EU alcoholic beverage companies in NZ- Three of the top five Australian wine companies in NZ
- Some opportunity in Marlborough- Due to lower price of wine (due to GFC)- Future area growth of Marlborough limited due to
geological constraints
- Large firms either foreign owned by majors or committed NZ family owners - Delegats and Villa Maria both committed owners
- Opportunities for investment in next tier down layer of firms (e.g. Giesen, Lawsons Dry Hills, Chard Farm, Allan Scott, Coopers Creek, Kumeu River etc.)
- Investors looking to unlock value in other regions; investigate emergent secondary regions (i.e. the next “Marlborough”)
Premium alcoholic spirits- Clear potential in premium alcoholic beverages
- Building on New Zealand positioning in premium wine
- Peer group countries suggest strong future growth possible- Limited entry vehicles; greenfields by global player with
skill sets recommended
Beer- No revealed demand for New Zealand beer in world markets
- Lion owned by Kirin- DB owned by Asia Pacific Breweries - Independent Liquor owned by Asahi- Microbreweries small and growing but primarily domestic
focussed
Soft drinks- In Soft drinks, Frucor/V and Charlie’s/Phoenix are attractive but
both recently changed hands for top dollars; both now Japanese owned
Water- Limited opportunities in export bottled water- Best fit would be for investor with transferrable capability
PAGE 16 GFC – Global Financial Crisis; Source: Interviews; Coriolis
Alcoholic beverages is a major opportunity for investors; wine has shown rapid growth; opportunities exist in second tier wine regions and developing a premium spirits category

TABLE OF CONTENTS
Section Page
Contents 4
Glossary of terms 5
Methodology & data sources 6
F&B IP Overview 7
Summary & conclusions 9
Sector overview 17
Wine 43
Appendices 62

Simplified model of New Zealand beverage supply chain(model; ANZSIC codes as available))
BEVERAGES – SUPPLY CHAINBeverages have a relatively simple supply chain
PAGE 18 1. Tobacco inseparable at source; 2. There may be one or more layers of wholesaling, depending on product or market; some wholesale functions may be captive inside retailers or foodservice operators; Source: Coriolis
Soft drink manufacturing(C121‐100)
Liquor/tobacco1wholesale(F360‐600)
SeafreightAirfreight
Liquor specialists
Hospitality/ Foodservice
Beverage/liquorwholesale2(in‐market)
Supermarkets & other retail
Internationalmarkets
Domesticmarket
Distributorwholesaler
Other fruit growing(rem. A013)
Apple/pear growing(A013‐400)
Grape growing (A013‐100)
Wine making (C121‐400)
Beer manufacturing(C121‐200)
Hospitality/ Foodservice
Supermarkets & other retail
Spirit manufacturing(C121‐300)
Other ingredients/ imports
Grocerywholesale(F360‐100)
Imported beverages

56 59 68 68 78 75 77 81 85 86 83
54 47 45 46 46 48 46 47 39 39 51 12 11 15 16 20 21 25 27 27 26 27
165 180 180
201 210 225
258 281 290
319
358
2000 2001 2002 2003 2004 2005 2006 2007 2008 2009 2010
Number of enterprise units in beverage manufacturing in New Zealand1(enterprises; 2000‐2010)
BEVERAGES – # OF ENTERPRISESThe number of enterprises involved in beverage manufacturing in New Zealand is growing strongly, driven by wine
PAGE 19 1. Uses persons employed by enterprise unit; 2. Such as port, brandy, etc.; Source: SNZ business demographics (detailed industry for enterprise units) and (detailed industry for geographic units); Coriolis analysis
Soft drinks, other non‐alcoholic
Beer
287297
308
331354
369
406
436 441
470
519
CAGR
(00‐10) (09‐10)
8% 12%
‐1% 31%
4% ‐3%
Wine
6% 10%
Spirits 8% 4%
Comments
‐ Question: What does the experience of other countries tell us about the long term industry structure for wine? If we double production again, will we have ~700 wine manufacturers?
Notes/Definitions
‐ Soft Drink, Cordial and Syrup Mnfg. (C121‐100)‐ Beer Manufacturing (C121‐200)‐ Spirit Manufacturing (C121‐300)‐ Wine and Other2 Alcoholic Bev. Mnfg. (C121‐
400)

Number of enterprise units in beverage manufacturing in New Zealand by employment size1(enterprises; 2000‐2010)
BEVERAGES – # OF ENTERPRISES BY EMPLOYMENT SIZELooking at the same group split by employee size, we find growth is coming from an explosion of smaller beverage manufacturers
PAGE 20 1. Uses persons employed by enterprise unit; Source: SNZ business demographics (detailed industry for enterprise units) and (detailed industry for geographic units); Coriolis analysis
CAGR
(00‐10) (09‐10)
9% 17%No employees
6% 10%
5% 0%50‐99
4% 11%10 to 19
9% 1%1 to 5
8% 30%6 to 9
2% ‐11%20‐49
9 9 9 9 10 11 12 13 13 12 129 11 9 8 10 11 12 14 13 14 1433 29 32 38 37 34 35 39 47 46 4132 37 37 41 33 39 38 41 41 44 4923 23 33 32 36 29 39 38 32 37 4880 89 76
88 89 97 9397 109 104
105101
99 112115
139148
177194 186
213
250
2000 2001 2002 2003 2004 2005 2006 2007 2008 2009 2010
287297
308
331354
369
406
436 441
470
519
3% 0%100+
Comments
‐ Question: Are the firms with no employees small family enterprises or something else?
Notes/Definitions
As sub‐aggregate level data not available this aggregates:
‐ Soft Drink, Cordial and Syrup Mnfg. (C121‐100)‐ Beer Manufacturing (C121‐200‐ Spirit Manufacturing (C121‐300)‐ Wine and Other2 Alcoholic Bev. Mnfg. (C121‐
400)

Number of persons employed in beverage manufacturing in New Zealand1(people; 2000‐2010)
BEVERAGES – EMPLOYMENTThe number of people employed in beverage manufacturing grew at 3%/per annum over the past decade; however sector employment rate was ‐4% in 2010
PAGE 21 1. Uses persons employed by enterprise unit; Source: SNZ business demographics (detailed industry for enterprise units) and (detailed industry for geographic units); Coriolis analysis
1,680 1,890 1,850 1,720 1,720 1,900 1,850 2,010 2,030 2,070 2,060
1,530 1,400 1,410 1,580 1,700 1,470 1,490 1,470 1,440 1,490 1,540
230 270 280 270 460 590 580 520 540 520 510
3,030
3,710 3,750 4,110
4,150 4,230 4,580 4,770 5,080 5,230
4,790
2000 2001 2002 2003 2004 2005 2006 2007 2008 2009 2010
6,470
7,270 7,2907,680
8,030 8,1908,500
8,7709,090
9,310
8,900
Soft drinks, other non‐alcoholic
Beer
CAGR
(00‐10) (09‐10)
5% ‐8%
0% 3%
2% ‐0.5%
Wine
3% ‐4%
Spirits 8% ‐2%
Comments
‐ Employment not growing as fast as enterprise numbers; are we increasing efficiency or fragmenting?
‐ Almost all employment loss in 2010 in wine
Notes/Definitions
‐ Soft Drink, Cordial and Syrup Mnfg. (C121‐100)‐ Beer Manufacturing (C121‐200‐ Spirit Manufacturing (C121‐300)‐ Wine and Other2 Alcoholic Bev. Mnfg. (C121‐
400)

Number of persons employed in beverage manufacturing in New Zealand by employment size1(people; 2000‐2010)
BEVERAGES – EMPLOYMENT BY ENTERPRISE SIZELooking at employment by employee size highlights (1) the importance of large firms and (2) that the larger firms have been more impacted in the last year
PAGE 22 1. Uses persons employed by enterprise unit; Source: SNZ business demographics (detailed industry for enterprise units) and (detailed industry for geographic units); Coriolis analysis
CAGR(00‐10) (09‐10)3% ‐4%
4% 12%10 to 19
2% 0%1 to 57% 21%6 to 9
2% ‐13%20‐49
3,940 4,670 4,720 4,950 5,200 5,290 5,530 5,510 5,640 5,690 5,400
620
750 610 530
720 810 830 920 860 990
940
1,080
910 990 1,160
1,160 1,080 1,090 1,270
1,510 1,500
1,310
440
530 530 570
460 530 540
550 540
570
640
170
160 240
230
260 220
290 270
240 280
340
230
250 220
240
240 260
250 250
300 280
280
2000 2001 2002 2003 2004 2005 2006 2007 2008 2009 2010
6,470
7,270 7,2907,680
8,030 8,1908,500
8,7709,090
9,310
8,900
4% ‐5%50‐99
3% ‐5%100+
Comments
‐ Larger firms more impacted than small
Notes/Definitions
‐ Soft Drink, Cordial and Syrup Mnfg. (C121‐100)‐ Beer Manufacturing (C121‐200‐ Spirit Manufacturing (C121‐300)‐ Wine and Other2 Alcoholic Bev. Mnfg. (C121‐
400)

Otago/Southland 356 4%
Canterbury 600 7%
Nelson/Tas/WC 260 3%
Marlborough 1,110 12%
Wellington 90 1%
Man/Wan/Tar 85 1%Hawke's Bay
600 7%
Gisborne 110 1%Bay of Plenty 160
2%Waikato 110 1%
Auckland 2,930 33%
Northland 40 0%
Classified elsewhere 2,450 28%
Number of persons employed in the beverage industry in New Zealand by region(people; 2010)
BEVERAGE – EMPLOYMENT BY REGIONIndustry employment is concentrated in Auckland and the key wine producing regions
PAGE 23 Note: Uses persons employed by geographic unit; Source: SNZ business demographics ; Coriolis analysis
Comments
‐ Soft drinks and beer more location neutral; wine more place specific
Notes/Definitions
‐ Statistics New Zealand calculates its statistics based on the predominant business activity of the enterprise
‐ A firm that is defined as “beverage manufacturing” at the enterprise level may have a subsidiary at the geographic level that is classified as “grape growing”
‐ Data here is “geographic” units not “enterprise” units (pages prior)
‐ “Classified elsewhere” is the difference between geographic unit employees and enterprise unit employees; it represents firm subsidiaries not involved in “beverage manufacturing,” for example those classified as “grape growing” or “beverage wholesaling”
‐ Man/Wan/T = Manawatu, Wanganui, Taranaki
‐ Wellington includes Martinborough and other Wairarapa wineries
Total = 8,900
For example as “grape growing”

160 160 240 260 350 300 403 366 373 433 356 570 570 560 510 600 520 550 600 620 660 600 195 190 188 195
141 134 139 210 245 225 260
650 740 830 960 1,060 1,210
1,320 1,040 1,170 1,210 1,110 150 130
110 130 150 140
130 120
100 95 90
49 52 44 56 61 62
61 100
90 75 85
290 360 400
430 470 480
440 500
500 580
600
120 200 90
95
270 280 250
120 150
160 110
180 170 150
160
220 250 230
260 200
170 160
75 90 85
90
100 110 120
100 110
110 110
2,490
2,960 3,030 3,050
2,900 2,920 2,830 2,960
2,950 3,000
2,930 18
18 20 35
55 55 50 70 50 40
40
1,540
1,640 1,530 1,700
1,640 1,740 1,970 2,350
2,540 2,550
2,450
2000 2001 2002 2003 2004 2005 2006 2007 2008 2009 2010
Number of persons employed in the beverage industry in New Zealand(people; 2000‐2010)
BEVERAGE – EMPLOYMENT BY REGIONAuckland and major wine growing regions only areas creating large scale employment growth
PAGE 24 Source: SNZ business demographics detailed industry for geographic & enterprise units; Coriolis analysis
Comments
‐ Auckland and major wine growing regions only areas creating large scale
Notes/Definitions
‐ Statistics New Zealand calculates its statistics based on predominant business activity; firms are classified by their predominant activity.
‐ Data here is “geographic” units not “enterprise” units (pages prior)
‐ “Classified elsewhere” is difference between geographic unit employees and enterprise unit employees; it represents firm subsidiaries not involved in “beverage manufacturing,” for example those classified as “grape growing” or “beverage wholesaling”
‐ So a firm that is defined as “beverage manufacturing” at the enterprise level may have a subsidiary at the geographic level that is classified as “grape growing”
‐ Wellington includes Martinborough and other Wairarapa wineries
‐ Mana/Wanga/Tara = Manawatu, Wanganui, Taranaki
‐ Nel/Tas/Marl/WC = Nelson, Tasman, Marlborough, West Coast
10 yearAbsoluteChange(00‐10)+2,830
Otago/Southland
Canterbury
Nel/Tas/Marl/WC
WellingtonMana/Wanga/TaraHawkes Bay
GisborneBay of PlentyWaikato
Auckland
Northland
Classified elsewhere(e.g. grape growing)
6,470
7,270 7,290
7,680
8,0308,190
8,5008,770
9,0909,310
8,900
+196
+30
+65
‐60+36+310
‐10‐20+35
+440
+22
+910
Marlborough +460

Aggregate beverage (and tobacco) industry turnover/total income(NZ$; FY10 or as available)
BEVERAGE – INDUSTRY AGGREGATE TURNOVERThe New Zealand beverage industry has a wide range of firms
PAGE 25 Source: SNZ (Manufacturing survey); Coriolis analysis
Comments
‐ Lion split into Lion Nathan Wine & Spirits and NZ Breweries and Maltexo
‐ Data includes tobacco, inseparable at source
‐ Suggest Statistics New Zealand remove tobacco from data as this does not help industry
Notes/Definitions
‐ Wine growing aggregated into fruit/horticulture
‐ Table reference MFG001AA
Coca‐Cola Amatil 12%
Frucor 9%
EnzaFoods 1%
Charlie's 1%
Just Water 0%
dbbreweries 11%
Independent Liquor 10%
Lion 9%
Harringtons 0%
Bacardi/42 Below 0%
Pernod Ricard 8%
Delegat's 5%
Lion 5%
Constellation 5%
Villa Maria 3%
Treasury Wine 2%
Wither Hills 1%
Yealands 1%
Giesen 1%
St Clair 1%
Mud House 1%
Cloudy Bay 1%Sacred Hill
1%
Mount Riley 1% Vavasour 1%
Other 490 firms 9%
Likely mostly wine; may currently includes
tobacco
TOTAL = $4,240m
Non‐alcoholic~20%
Non‐wine alcohol~30%
Wine~50%
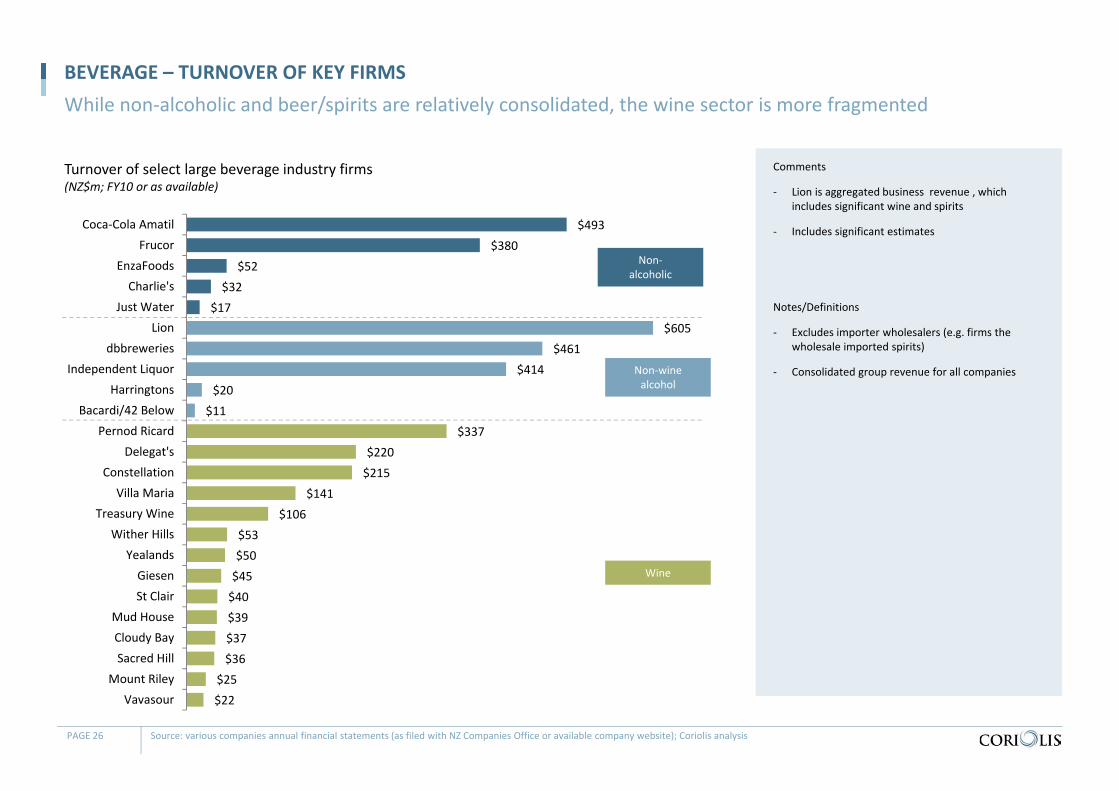
Turnover of select large beverage industry firms(NZ$m; FY10 or as available)
BEVERAGE – TURNOVER OF KEY FIRMSWhile non‐alcoholic and beer/spirits are relatively consolidated, the wine sector is more fragmented
PAGE 26 Source: various companies annual financial statements (as filed with NZ Companies Office or available company website); Coriolis analysis
Comments
‐ Lion is aggregated business revenue , which includes significant wine and spirits
‐ Includes significant estimates
Notes/Definitions
‐ Excludes importer wholesalers (e.g. firms the wholesale imported spirits)
‐ Consolidated group revenue for all companies
$493 $380
$52 $32
$17 $605
$461 $414
$20 $11
$337 $220 $215
$141 $106
$53 $50 $45 $40 $39 $37 $36
$25 $22
Coca‐Cola AmatilFrucor
EnzaFoodsCharlie's
Just WaterLion
dbbreweriesIndependent Liquor
HarringtonsBacardi/42 Below
Pernod RicardDelegat's
ConstellationVilla Maria
Treasury WineWither Hills
YealandsGiesenSt Clair
Mud HouseCloudy BaySacred Hill
Mount RileyVavasour
Non‐alcoholic
Non‐wine alcohol
Wine

Aggregate beverage industry turnover/total income(NZ$m; nominal, non‐inflation adjusted; 2000‐2010)
BEVERAGE – INDUSTRY AGGREGATE TURNOVERThe beverage industry has been showing constant growth
PAGE 27 Source: SNZ (Manufacturing survey); Coriolis analysis
Beverage & tobacco product mnfg.
CAGR
5% 7%
(00‐10) (09‐10)
Comments
‐ Data includes tobacco, inseparable at source
‐ Suggest Statistics New Zealand remove tobacco from data as this does not help industry
Notes/Definitions
‐ Wine growing aggregated into fruit/horticulture
‐ Table reference MFG001AA
$‐
$500
$1,000
$1,500
$2,000
$2,500
$3,000
$3,500
$4,000
$4,500
2000 2001 2002 2003 2004 2005 2006 2007 2008 2009 2010

Turnover of select large beverage industry firms(NZ$m; FY2005‐2010 as available)
BEVERAGE – TURNOVER OF KEY FIRMSCompanies are driving growth through both acquisition and organic growth
PAGE 28 Source: various companies annual financial statements (as filed with NZ Companies Office or available company website); Coriolis analysis
‐4.7%
Last 5 yrCAGR(05‐10)
‐0.4%
6.2%
$0
$100
$200
$300
$400
$500
$600
$700
$800
2005 2006 2007 2008 2009 2010
(cross)(triangle)
2.4%
5.4%
12.3%
‐4.3%
30.5%
Comments
‐ Question: Why is Pernod Ricard ‘s (Montana) revenue shrinking during a period of New Zealand wine industry growth? Will recent sale of some assets to Lion accelerate this process?
‐ Lions figures supplied by Lion (not taken from yearly annual reports as per the other companies)
Notes/Definitions
‐ Consolidated group revenue for all companies
‐ CCA & Frucor CAGR = (04‐09)

Source: various company annual reports (AR); various company websites (WS) ; Kompass (K); Kompass estimate (Ke); interviews (Ci); Coriolis analysis and estimates (Ce)
There are two key groups in non‐alcoholic beverages – Coca‐Cola Amatil and Suntory/Frucor
Key firms in the New Zealand beverage sector(2010 or as available)
Turnover % Export Employees OwnershipYear
founded Notes
$492.9m (2009)
1,100(2010)
Australia; listed(ASX: CCL)
1939 www.coke.co.nz; ccamatil.com; www.cokecareers.co.nzCCA is licensed bottler by US brand owner
$380.4m(2009)
900 Japan; private(Suntory Holdings; 90% Kotobuki Realty; Torii family; others)
1965 www.frucor.co.nz; www.vrepublic.co.nz; www.suntory.comOriginally NZ Apple & Pear marketing board; listed; acquired by PEP, then Danone, now SuntoryBrands: V, Just Juice, H2GO, McCoy, Pepsi (licensed), Simply Squeezed, Mizone, Frank, others
$45m Enza Foods only
(Ce; 2010)
85 (FT) + 200 seasonal (Ce)
New Zealand; listed(NZX: TUR)
1962 www.enzafoods.cco.nz; www.turnersandgrowers.comParent company is Turners & Growers LtdConcentrated apple juice, apple sauce
$31.6m(2010)
~40%(Ce)
80 (K) Japan; listed(Asahi; TYO: 2502)
1999 www.charliesgroup.co.nzIncreasing presence in AU market; winning distribution through Coles and WWX; (sales increased 95% in first half of 2011)Acquired by Asahi (Japan) August 2011
$17.1m (Ke)
60(K) NZ; listed (NZX:JWI)
1987 www.justwater.co.nzIn office water coolers
BEVERAGE– KEY FIRMS
PAGE 29
Source: various company annual reports (AR); various company websites (WS) ; Kompass (K); Kompass estimate (Ke); interviews (Ci); Coriolis analysis and estimates (Ce)
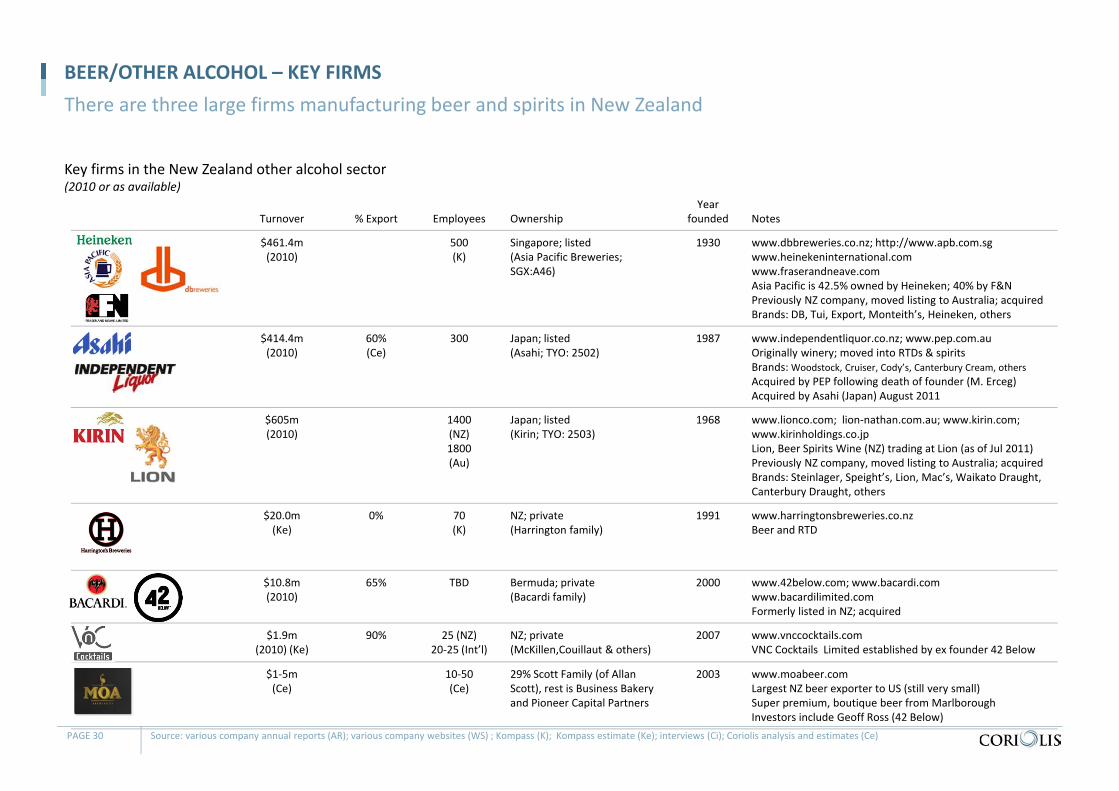
There are three large firms manufacturing beer and spirits in New Zealand
Key firms in the New Zealand other alcohol sector(2010 or as available)
Turnover % Export Employees OwnershipYear
founded Notes
$461.4m (2010)
500 (K)
Singapore; listed(Asia Pacific Breweries;SGX:A46)
1930 www.dbbreweries.co.nz; http://www.apb.com.sgwww.heinekeninternational.comwww.fraserandneave.comAsia Pacific is 42.5% owned by Heineken; 40% by F&NPreviously NZ company, moved listing to Australia; acquiredBrands: DB, Tui, Export, Monteith’s, Heineken, others
$414.4m(2010)
60%(Ce)
300 Japan; listed(Asahi; TYO: 2502)
1987 www.independentliquor.co.nz; www.pep.com.auOriginally winery; moved into RTDs & spiritsBrands: Woodstock, Cruiser, Cody’s, Canterbury Cream, othersAcquired by PEP following death of founder (M. Erceg)Acquired by Asahi (Japan) August 2011
$605m(2010)
1400 (NZ)1800 (Au)
Japan; listed(Kirin; TYO: 2503)
1968 www.lionco.com; lion‐nathan.com.au; www.kirin.com; www.kirinholdings.co.jpLion, Beer Spirits Wine (NZ) trading at Lion (as of Jul 2011) Previously NZ company, moved listing to Australia; acquiredBrands: Steinlager, Speight’s, Lion, Mac’s, Waikato Draught, Canterbury Draught, others
$20.0m(Ke)
0% 70 (K)
NZ; private(Harrington family)
1991 www.harringtonsbreweries.co.nzBeer and RTD
$10.8m(2010)
65% TBD Bermuda; private(Bacardi family)
2000 www.42below.com; www.bacardi.comwww.bacardilimited.comFormerly listed in NZ; acquired
$1.9m(2010) (Ke)
90% 25 (NZ)20‐25 (Int’l)
NZ; private (McKillen,Couillaut & others)
2007 www.vnccocktails.comVNC Cocktails Limited established by ex founder 42 Below
$1‐5m(Ce)
10‐50(Ce)
29% Scott Family (of Allan Scott), rest is Business Bakery and Pioneer Capital Partners
2003 www.moabeer.comLargest NZ beer exporter to US (still very small)Super premium, boutique beer from MarlboroughInvestors include Geoff Ross (42 Below)
BEER/OTHER ALCOHOL – KEY FIRMS
PAGE 30

Source: various company annual reports (AR); various company websites (WS) ; Kompass (K); Kompass estimate (Ke); interviews (Ci); Coriolis analysis and estimates (Ce)
There are five large companies in New Zealand with sales over $100m
Key firms in the New Zealand wine sector(2010 or as available)
Turnover % Export Employees OwnershipYear
founded Notes
$337.2m(2010)
750 France; listed (Euronext: RI)
[1797]1936
www.pernod‐ricard‐nz.com; www.pernod‐ricard.comPurchased Montana in 2005
$605m(2010)
1400 (NZ)1800 (Au)
Japan; listed(Kirin; TYO: 2503)
1968 www.lionco.com; lion‐nathan.com.au; www.kirin.com; www.kirinholdings.co.jp#2 wine player in NZ; brands include Lindauer, Saints, Corbans, Wither Hills etc. Recent acquisition of 12 PernodRicard brandsLion, Beer Spirits Wine (NZ) trading at Lion (as of Jul 2011)
$219.7m(2010)
88%(2008)
50(K) New Zealand; publicly listed (NZX:DLG)(Delegat family 66%)
1947 www.delegatsgroup.co.nz; www.delegatwines.comOwns Oyster BayPublicly listed 1991Marlborough and Hawke’s Bay vineyards11% of total NZ wine exports
$214.6m(2010)
270 (K) USA; listed(NYSE:STZ & STZ:B)
1943 www.cbrands.comLargest wine company in the worldOwns Nobilo, Kim Crawford, Drylands, Monkey Bay, Selaks
$141.3m(Ke)
250 (K) New Zealand; private(Fistonich family)
1961 www.villamaria.co.nzBrands: Villa Maria, Esk Valley, Vidal EstateMarlborough, Hawke’s Bay, Auckland vineyards
$105.8m(2010)$46.8m
(2010; AR; Fosters Matua
only)
70 Australia; listed(ASX: TWE)
2011 www.fostersgroup.com; www.treasurywineestates.comBrands AU include Beringer & PenfoldsRecently (April 2011) demerged from Fosters GroupOwns Matua; also distributors of international wines2009 Fosters NZ Matua merged with Shingle Peak & Waikoukou Vineyards
WINE – KEY FIRMS
PAGE 31

Source: various company annual reports (AR); various company websites (WS) ; Kompass (K); Kompass estimate (Ke); interviews (Ci); Coriolis analysis and estimates (Ce)
There is also a strong group of mid‐to‐large size wineries
Key firms in the New Zealand wine sector(2010 or as available)
Turnover % Export Employees OwnershipYear
founded Notes
$52.7m(2010)
55(K)
Japan; listed(Kirin/Lion Nathan)
1994 www.witherhills.co.nz; lion‐nathan.com.au; www.kirin.com; www.kirinholdings.co.jp; Marlborough vineyards
$50m (2008; K)
34(K)
New Zealand; private(Yealand family)
2002 www.yealands.comEnvironmentally conscious winesMarlborough winery
Giesen Wines $40‐50m(Ce)
95% 30(K)
New Zealand; private(Giesen family)
1981 www.giesen.co.nz; Marlborough wineryExports primarily to Australia
$30‐40m(Ce)$3m(Ke)
66%(K)
17(K)
New Zealand; private(Ibbotson family)
1978/1994
www.saintclair.co.nzMarlborough winery
$39.4m(2010)
30(K)
New Zealand; public (unlisted)
2001 www.mudhouse.co.nzMarlborough, Central Otago, Waipara
$37.3m(2009)
50(K)
France; listed(Euronext:MC)
1985 www.cloudybay.co.nzPurchased Cloudy Bay 1990Marlborough‐based vineyards
$36.0m(2010)
50% 36(K)
New Zealand; private(Mason family 63%; Jebsen & Co (China) 29%)
1985 www.sacredhill.comHawke’s Bay winery
$30.8m (2009)
120(K)
Australia; private(Peabody family)
1998 www.craggyrange.comVineyards in Marlborough, Martinborough, Hawke’s Bay, Central Otago
$20‐30m(Ce)
70%(NZTE)
20(K)
New Zealand; private(Buchanan family)
1992 www.mountriley.co.nzMarlborough winery
WINE – KEY FIRMS
PAGE 32

Source: various company annual reports (AR); various company websites (WS) ; Kompass (K); Kompass estimate (Ke); interviews (Ci); Coriolis analysis and estimates (Ce)
… continued
Key firms in the New Zealand wine sector(2010 or as available)
Turnover % Export Employees OwnershipYear
founded Notes
$22.0m(2009)
70% 15(K)
USA; private(Foley Family Wines/Foley family)
1989 www.vavasour.com; www.cliffordbay.co.nzwww.foleyfamilywines.comBrands: Clifford Bay, VavasourMarlborough winery70% of grapes are from contract growers
Allan Scott $15‐25m(Ce)
25(K)
New Zealand; private(Scott family)
1993 www.allanscott.comMarlborough‐based winery
$17.1m(Ke)
60 New Zealand; private(Darby family; others)
1999 www.amisfield.co.nzCentral Otago winery60 ha of vineyards
$14.3m (Ke)
50(K)
New Zealand; private(Preston family)
1989 Also a restaurant; Hawke’s Bay vineyardswww.millsreef.co.nz
$14.3m (Ke)
50(K)
New Zealand; private(Soljan family)
1937 www.soljans.co.nzAuckland region based winery
$9m(Ke)
57% 30(K)
New Zealand; private(Babich family)
1916/1959
www.babichwines.co.nzVineyards in Auckland, Hawke’s Bay, Marlborough
WINE – KEY FIRMS
PAGE 33
Source: various company annual reports (AR); various company websites (WS) ; Kompass (K); Kompass estimate (Ke); interviews (Ci); Coriolis analysis and estimates (Ce)
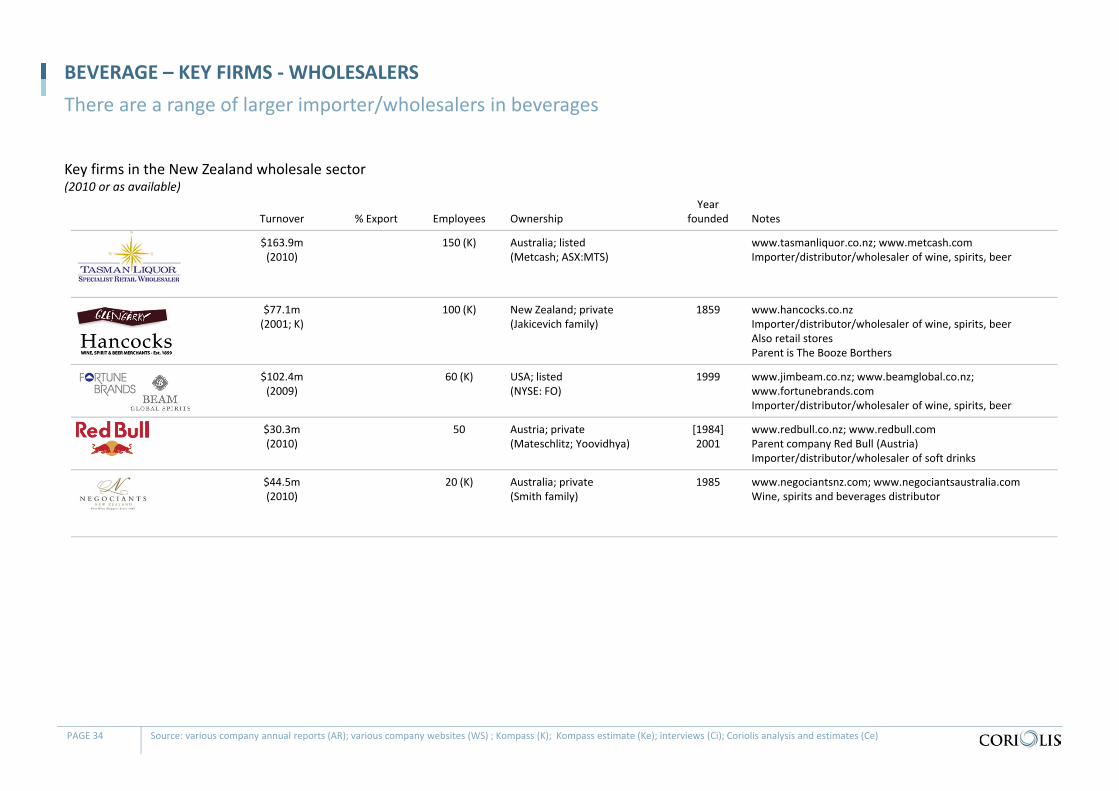
There are a range of larger importer/wholesalers in beverages
Key firms in the New Zealand wholesale sector(2010 or as available)
Turnover % Export Employees OwnershipYear
founded Notes
$163.9m(2010)
150 (K) Australia; listed(Metcash; ASX:MTS)
www.tasmanliquor.co.nz; www.metcash.comImporter/distributor/wholesaler of wine, spirits, beer
$77.1m(2001; K)
100 (K) New Zealand; private(Jakicevich family)
1859 www.hancocks.co.nzImporter/distributor/wholesaler of wine, spirits, beerAlso retail storesParent is The Booze Borthers
$102.4m(2009)
60 (K) USA; listed(NYSE: FO)
1999 www.jimbeam.co.nz; www.beamglobal.co.nz; www.fortunebrands.comImporter/distributor/wholesaler of wine, spirits, beer
$30.3m (2010)
50 Austria; private(Mateschlitz; Yoovidhya)
[1984]2001
www.redbull.co.nz; www.redbull.comParent company Red Bull (Austria)Importer/distributor/wholesaler of soft drinks
Negociants $44.5m(2010)
20 (K) Australia; private(Smith family)
1985 www.negociantsnz.com; www.negociantsaustralia.comWine, spirits and beverages distributor
BEVERAGE – KEY FIRMS ‐WHOLESALERS
PAGE 34
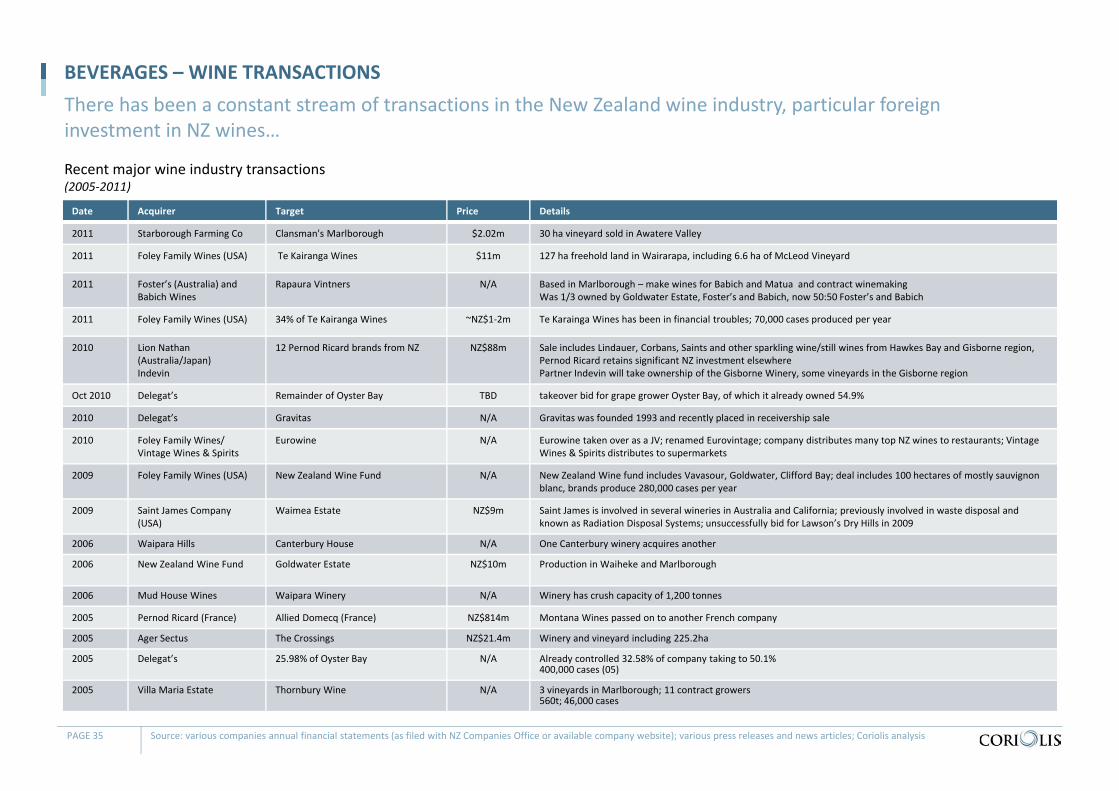
Recent major wine industry transactions(2005‐2011)
BEVERAGES – WINE TRANSACTIONSThere has been a constant stream of transactions in the New Zealand wine industry, particular foreign investment in NZ wines…
PAGE 35
Date Acquirer Target Price Details
2011 Starborough Farming Co Clansman's Marlborough $2.02m 30 ha vineyard sold in Awatere Valley
2011 Foley Family Wines (USA) Te Kairanga Wines $11m 127 ha freehold land in Wairarapa, including 6.6 ha of McLeod Vineyard
2011 Foster’s (Australia) and Babich Wines
Rapaura Vintners N/A Based in Marlborough – make wines for Babich and Matua and contract winemaking Was 1/3 owned by Goldwater Estate, Foster’s and Babich, now 50:50 Foster’s and Babich
2011 Foley Family Wines (USA) 34% of Te Kairanga Wines ~NZ$1‐2m Te Karainga Wines has been in financial troubles; 70,000 cases produced per year
2010 Lion Nathan (Australia/Japan)Indevin
12 Pernod Ricard brands from NZ NZ$88m Sale includes Lindauer, Corbans, Saints and other sparkling wine/still wines from Hawkes Bay and Gisborne region, Pernod Ricard retains significant NZ investment elsewherePartner Indevin will take ownership of the Gisborne Winery, some vineyards in the Gisborne region
Oct 2010 Delegat’s Remainder of Oyster Bay TBD takeover bid for grape grower Oyster Bay, of which it already owned 54.9%
2010 Delegat’s Gravitas N/A Gravitas was founded 1993 and recently placed in receivership sale
2010 Foley Family Wines/Vintage Wines & Spirits
Eurowine N/A Eurowine taken over as a JV; renamed Eurovintage; company distributes many top NZ wines to restaurants; Vintage Wines & Spirits distributes to supermarkets
2009 Foley Family Wines (USA) New Zealand Wine Fund N/A New Zealand Wine fund includes Vavasour, Goldwater, Clifford Bay; deal includes 100 hectares of mostly sauvignon blanc, brands produce 280,000 cases per year
2009 Saint James Company (USA)
Waimea Estate NZ$9m Saint James is involved in several wineries in Australia and California; previously involved in waste disposal and known as Radiation Disposal Systems; unsuccessfully bid for Lawson’s Dry Hills in 2009
2006 Waipara Hills Canterbury House N/A One Canterbury winery acquires another
2006 New Zealand Wine Fund Goldwater Estate NZ$10m Production in Waiheke and Marlborough
2006 Mud House Wines Waipara Winery N/A Winery has crush capacity of 1,200 tonnes
2005 Pernod Ricard (France) Allied Domecq (France) NZ$814m Montana Wines passed on to another French company
2005 Ager Sectus The Crossings NZ$21.4m Winery and vineyard including 225.2ha
2005 Delegat’s 25.98% of Oyster Bay N/A Already controlled 32.58% of company taking to 50.1%400,000 cases (05)
2005 Villa Maria Estate Thornbury Wine N/A 3 vineyards in Marlborough; 11 contract growers560t; 46,000 cases
Source: various companies annual financial statements (as filed with NZ Companies Office or available company website); various press releases and news articles; Coriolis analysis

Recent major wine industry transactions(1998‐2003)
BEVERAGES – WINE TRANSACTIONS…continued
PAGE 36
Date Acquirer Target Price Details
2004 Pernod Ricard (France) Framingham Wines NZ$6.67m Established 1991; 10.7ha freehold land; 5.94ha leasehold land; includes Tylers Stream brand270,000l; 30,000 cases
2003 Constellation Brands (USA)
BRL Hardy (Australia) Au$1.9b Part of a series of acquisitions worldwide
2003 Vincor (Canada) Kim Crawford NZ$14.8 Part of a series of acquisitions worldwide; Vincor encountered financial troubles and was bought by Constellation Brands (USA) for US$1.09 billion in 2006
2003 LVMH (France) Cloudy Bay N/A LVMH has invested in wineries in Argentina, California, Australia and a distillery in China
2002 Aster Family De Redcliffe Winery N/A Aster family of Oregon purchases De Redcliffe and Firstland brand as well as Hotel du Vin luxury hotel; 40,000 cases
2002 Rangitira 25% of Te Kairanga N/A Rangitira (JR Mckenzie Trust) acquires 25% share of Te KairangaWines
2002 Lion Nathan (Australia/Japan)
Wither Hill Wines NZ$52m From founder John and Brent Maris
2002 Foster’s (Australia) Ponder Estate Wines NZ$11.1m Winery purchased to provide fruit for Matua Valley wines
2002 Foster’s (Australia) Hawkesbridge NZ$3.5m House/cellar door; brand; plant & equipment10,000 cases (02)
2002 Rangitira Te Kairanga N/A Rangitira (JR Mckenzie Trust) acquires 25% share of Te KairangaWines
2001 Sacred Hill Cairnbrae Wines N/A Allows company access to Marlborough grapes
2001 Allied Domecq Montana Wines N/A Allied purchases Montana Wines the largest wine company in New Zealand
2001 Jebsen & Co (China) 30% of Sacred Hill Winery Ltd $3m Jebsen & Co is a diversified company importing products into China
2001‐04 Foster’s (Australia) Matua Valley Wines ~NZ$25m Large Australian investment in NZ wine industry
2000 Montana Wines Corbans Wines NZ$151m Montana buys Corbans, then a subsidiary of DB Breweries; including 623ha in Gisborne/Hawkes Bay, 130ha Marlborough and 87ha leasehold in Marlborough; was NZ’s 3rd largest winery
2000 BRL Hardy (Australia) Nobilo Wine Group ~NZ$50m Acquires remaining 75.32% shareholding; 167ha including 142ha in Marlborough
1998 Nobilo Vintners Selaks Wines N/A Selaks produced 100,000 cases
Source: various companies annual financial statements (as filed with NZ Companies Office or available company website); various press releases and news articles; Coriolis analysis

Recent major non‐wine alcohol industry transactions(1993‐2011)
BEVERAGES – NON‐WINE ALCOHOL TRANSACTIONSThere have been limited transactions recently in beer and spirits
PAGE 37
Date Acquirer Target Price Details
Aug 2011 Asahi (Japan) Independent Liquor NZ$1.5b Major Japanese brewer acquires #3 player in beverages in New Zealand
2010 Warren Couillault Former Pinto (beverages) factory N/A Warren Couillault invests in VnC ‐ current supply of 200,000 casesPurchased the former Pinto (beverage) factory to secure bottling facility
2009 Kirin (Jp) Lion N/A Kirin (Japans #1 beer company) acquires the remaining 54% share of Lion
2008 Foodstuffs (NZ) Liquorland (DB Breweries) N/A DB Breweries sold Liquorland to Foodstuffs
2006 Bacardi 42 Below NZ$138m Bacardi global spirits player purchased NZ owned 42 Below
2006 Pacific Equity Partners (Australia)
Independent Liquors (NZ) NZ$1.25b Independent Liquors is #1 (NZ) and #2 (Australia) premixed drink manufacturer
2004 Asia Pacific Breweries (JV between Heineken (Dutch) and Fraser & Neave (Singapore))
DB Breweries N/A APB completed purchase of DB Breweries, DB Breweries de‐listed in NZ
2002 Tasman Liquor Company
Allied Liquor N/A Tasman Liquor Company, a subsidiary of Metcash (Australia), bought Allied Liquor to increase turnover
1998 Kirin (Japan) 46% of Lion Nathan Kirin Japan (Japan #1 beer company); acquires 45% (later 46%) of Lion Nathan
1993 Asia Pacific Breweries (JV Heineken and Fraser & Neave(Singapore))
50% of DB Breweries N/A Part of regional consolidations
Source: various companies annual financial statements (as filed with NZ Companies Office or available company website); various press releases and news articles; Coriolis analysis

Recent major non‐alcoholic beverage industry transactions(2002‐2011)
BEVERAGES – NON‐ALCOHOLIC TRANSACTIONSThere has been a range of transactions in the non‐alcoholic sector
PAGE 38
Date Acquirer Target Price Details
Aug 2011 Asahi (Japan) Charlie’s Beverages NZ$129.3m Major Japanese brewer acquires NZX listed juice firm with $31.6m turnover for $129m
2009 Frucor Simply Squeezed from Crescent Capital Partners (AU; PE)
N/A Frucor purchases Simply Squeezed fresh juice (orange) company, adds Simply Squeezed, Supreme, Allganics and Bay Harvest brands to its stable
2009 Suntory (Japan) Frucor from Danone (France) NZ$1.3 b Frucor sold by Groupe Danone to Japanese international beverage company Suntory
2007 Frucor Arano N/A Frucor purchases Arano fresh juice (orange) company
2006 Charlie’s Phoenix Organics NZ$10m Charlies purchased Phoenix Organics and moved to plant in West Auckland
2006 Crescent Capital Partners (AU PrivateEquity)
Simply Squeezed N/A Purchased 60% of SS from Brownlie (based in the Hawkes Bay)
2006 Just Water International (NZ)
Clearwater International NZ$14.7 Clearwater is a water dispenser company, purchase was move to expand into AustraliaAustralian company is proving to be massively unprofitable
Apr 2004 Just Water Aqua‐Cool N/A Water delivery business
July 2002 Coca‐Cola Amatil Rio Beverages from ThextonFamily Trust and Cerebos Gregg's
NZ$40m include Rio Gold, Keri and Thexton fruit juice drinks; also makes e2 lifestyle beverage, Ikon energy drinks and Kiwi Blue mineral water; 220 employees; $100m sales; 2 bottling plants (AKL & CHC)
2002 Danone Frucor N/A French based Danone purchases Frucor juice and beverage company
Source: various companies annual financial statements (as filed with NZ Companies Office or available company website); various press releases and news articles; Coriolis analysis

Recent major beverage industry activity(2006‐2010)
BEVERAGES – ACTIVITYOther alcoholic industries have had limited activity in NZ
PAGE 39
Date Company Activity Cost Details
Non‐alcoholic
2011 Coca Cola Amatil
New bottling plant in Christchurch $15m Coca‐Cola Amatil is to build a NZ$15m bottle manufacturing and filling facility at its Woolston site in Christchurch, New Zealand
2010 Charlie’s Overseas expansion Expanding into Australia, selling juice at Coles and WoolworthsTrialling juice at 60 ParknShop supermarkets in Hong KongExports to 14 countries
2009 Coca Cola Amatil
New automated plant in Auckland $90m In 2008 CCA Announced investment of NZ$80m in automated distribution centre in Auckland
2008 Charlie’s Built juice factory in South Australia Au$2m Limited supply of citrus in NZ and exports to Australia meant investment in Australian plant
Beer/spirits
2011 Monteith’s Brewery makeoever $4m $4m redevelopment of Greymouth facility to increase tourism to area
2010 Lion New brewery $250m New manufacturing and warehousing facility in East Tamaki, Auckland. Central location for brewing and distributing beer and Contract Bottling; floor space of 23,000 sq m and storage capacity for 26,000 palletsFully automated bottling plant
Wine
2006 GiesenWines
Winery upgrade, new bottling plant $3.5m Established new bottling and packaging plant in Chch, expanded capacity in Marlborough vineyard
Source: various companies annual financial statements (as filed with NZ Companies Office or available company website); various press releases and news articles; Coriolis analysis
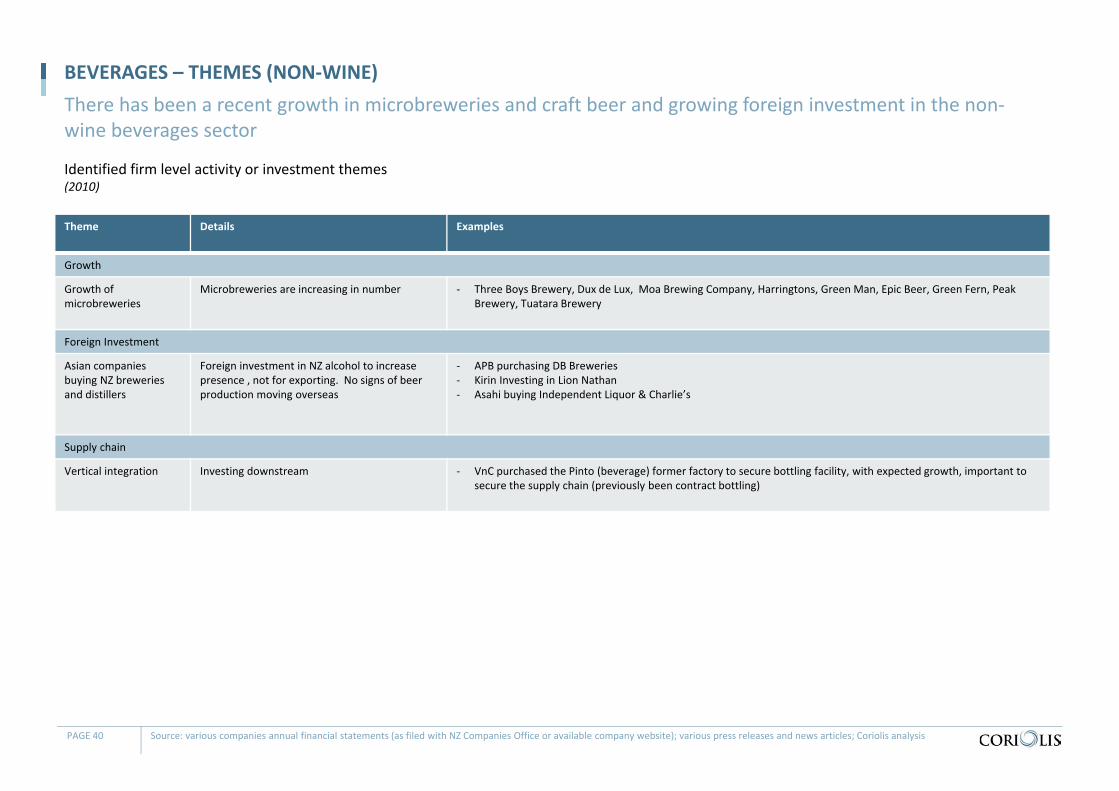
Theme Details Examples
Growth
Growth of microbreweries
Microbreweries are increasing in number ‐ Three Boys Brewery, Dux de Lux, Moa Brewing Company, Harringtons, Green Man, Epic Beer, Green Fern, Peak Brewery, Tuatara Brewery
Foreign Investment
Asian companies buying NZ breweries and distillers
Foreign investment in NZ alcohol to increase presence , not for exporting. No signs of beer production moving overseas
‐ APB purchasing DB Breweries‐ Kirin Investing in Lion Nathan‐ Asahi buying Independent Liquor & Charlie’s
Supply chain
Vertical integration Investing downstream ‐ VnC purchased the Pinto (beverage) former factory to secure bottling facility, with expected growth, important to secure the supply chain (previously been contract bottling)
Identified firm level activity or investment themes(2010)
BEVERAGES – THEMES (NON‐WINE)There has been a recent growth in microbreweries and craft beer and growing foreign investment in the non‐wine beverages sector
PAGE 40 Source: various companies annual financial statements (as filed with NZ Companies Office or available company website); various press releases and news articles; Coriolis analysis

$2 $2 $2 $5 $3 $3 $3 $8 $6 $6 $8 $19 $19 $15 $16 $32 $24 $31 $34 $48 $36 $38 $35 $26 $29 $38 $50 $50 $52 $67 $64 $55 $67
$8 $7 $9 $11 $13 $14 $11
$14 $15 $16
$26
$25 $32 $25 $30 $35 $30 $31
$40 $38 $39
$58 $90 $97 $127
$158
$245 $332
$396
$560
$644 $637
$774
2000 2001 2002 2003 2004 2005 2006 2007 2008 2009 2010
New Zealand beverage export by form(US$m; 2000‐2010)
BEVERAGES – EXPORTS BY TYPENew Zealand beverage exports have shown strong growth driven by wine
PAGE 41 Source: UN Comtrade database; Coriolis analysis
Water 18% +$7m 51% +$3mJuice 7% +$19m 5% +$2m
Soft drinks 7% +$32m 23% +$13mBeer 12% +$18m 64% +$10m
Spirits 9% +33m 46% +$18m
Wine 24% +$684m 21% +$137m
$178 $184$208
$258
$378
$454
$524
$722
$816$789
$971 TOTAL 18% +$793m 23% +$182m
CAGR Absolute
10 Year
CAGR Absolute
Last Year
Can spirits and soft drinks show the same growth over the next 10 years, replicating wines growth in the past 10 years?

New Zealand beverage export by region(US$m; 2000‐2010)
BEVERAGES – EXPORTS BY REGIONNew Zealand beverage exports have achieved strong growth to the developed world
PAGE 42 Source: UN Comtrade database; Coriolis analysis
Europe 18% +$222m 23% +$51m
N. America 22% +$208m 29% +$54m
Australia/ Pacific Islands
18% +$299m 19% +$59m
SE Asia 20% +$20m 36% +$6m
E Asia 12% +$35m 20% +$9m
Other 15% +$8m 52% +$4m
$52 $58 $69 $83 $116 $141 $156 $229 $227 $222
$274
$33 $36 $43 $58
$92 $121
$147
$176 $188 $187
$241
$71 $67 $74
$93
$137
$155
$187
$269
$337 $311
$370
$3 $2 $2
$2
$4
$4
$5
$7
$9 $7
$10
$4 $5 $5
$6
$8
$9
$9
$14
$17 $18
$25
$16 $16 $15
$16
$21
$23
$20
$28
$38 $43
$51
2000 2001 2002 2003 2004 2005 2006 2007 2008 2009 2010
$178 $184$208
$258
$378
$454
$524
$722
$816$789
$971 TOTAL 18% +$793m 23% +$182m
CAGR Absolute
10 Year
CAGR Absolute
Last Year

TABLE OF CONTENTS
Section Page
Contents 4
Glossary of terms 5
Methodology & data sources 6
F&B IP Overview 7
Summary & conclusions 9
Sector overview 17
Wine 43
Appendices 62

WINE – METRICSGrape prices have fallen sharply over the past two years
PAGE 44 Source: NZ Wine Statistical Annual; Coriolis analysis
$0
$500
$1,000
$1,500
$2,000
$2,500
1991
1992
1993
1994
1995
1996
1997
1998
1999
2000
2001
2002
2003
2004
2005
2006
2007
2008
2009
2010
10 year CAGR(00‐10)0.8%
Change(09‐10)‐20.6%
NZ Average Grape Price (NZ$/tonne; 1991‐2010)
5 5 6 6 6 6 77 8
910
1214
1618
2123
2529
3233
199019911992199319941995199619971998199920002001200220032004200520062007200820092010
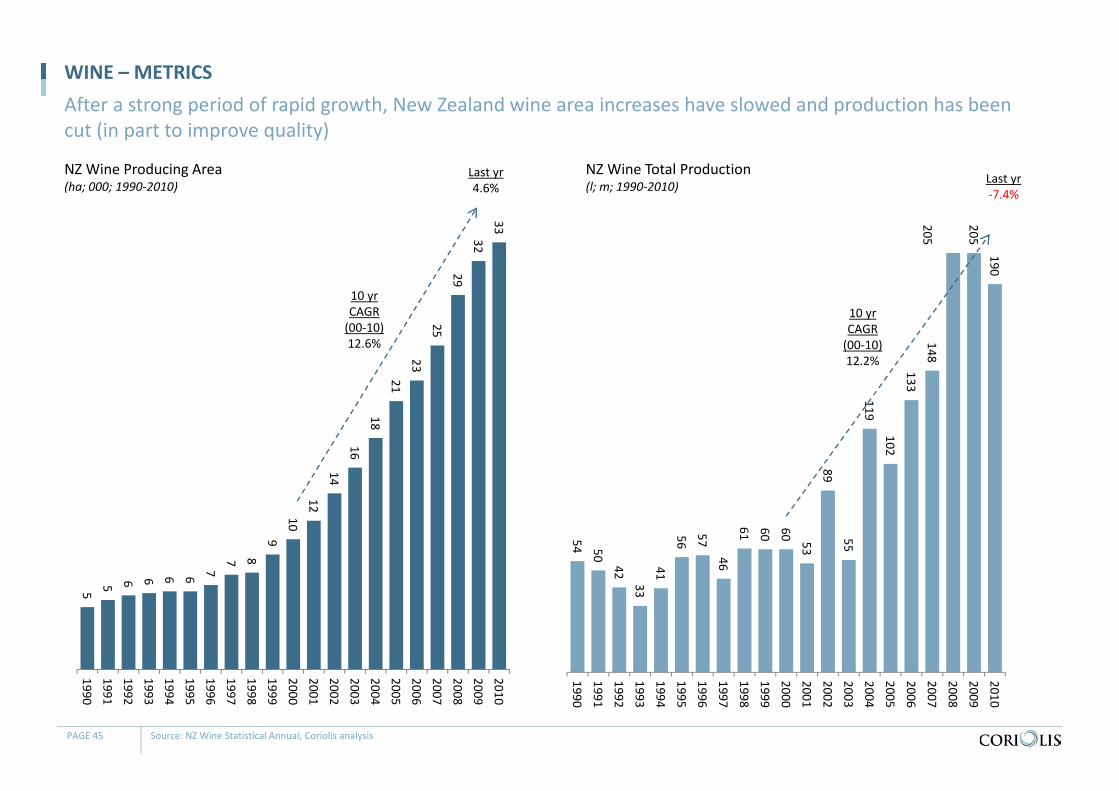
WINE – METRICS
NZ Wine Producing Area(ha; 000; 1990‐2010)
After a strong period of rapid growth, New Zealand wine area increases have slowed and production has been cut (in part to improve quality)
PAGE 45 Source: NZ Wine Statistical Annual; Coriolis analysis
10 yrCAGR(00‐10)12.6%
Last yr4.6%
NZ Wine Total Production(l; m; 1990‐2010)
54 50
42
33
41
56
57
46
61 60 60 53
89
55
119
102
133
148205
205
190
1990
1991
1992
1993
1994
1995
1996
1997
1998
1999
2000
2001
2002
2003
2004
2005
2006
2007
2008
2009
2010
10 yrCAGR(00‐10)12.2%
Last yr‐7.4%

New Zealand grape crush by region(t; 1992‐2010)
WINE – PRODUCTION BY REGIONClose to 70% of grapes crushed are in Marlborough and the region has grown its share over the past decade
PAGE 46 * Wairarapa/ Wellington; Source: New Zealand Wine Growers Survey; Coriolis analysis
10 yrCAGR
Otago 20%
18%NelsonCanterbury
13%
Wrpa / Wgtn* 13%
Marlborough21%
Gisborne ‐2%Waikato/BOP ‐16%Northland/Akld 0%
Hawkes Bay
‐0.4%22% 7%
‐23%
‐5%
‐15%‐42%‐21%
5% 5%
‐11%
‐
50,000
100,000
150,000
200,000
250,000
1992
1994
1996
1998
2000
2002
2004
2006
2008
2010
Last year
‐7%
Share of grapes crushed by region(t; %; 1992‐2010)
0%
10%
20%
30%
40%
50%
60%
70%
80%
90%
100%
1992199319941995199619971998199920002001200220032004200520062007200820092010

5 5 4 4 4 4 5 5 5 5 52 1 1 2 2 3 2 2 2 2 20 0 0 0 0 1 1 2 2 2 30 0 0 0 0 0 0 1 1 2 33 3 3 3 4 5 4 4 6 5 50 1 1 1 2
3 4 6 6 68
8 10 1217
20
3643
57
67
92
116
2000 2001 2002 2003 2004 2005 2006 2007 2008 2009 2010
+0.7m
NZ Wine exports by grape variety(millions of litres; 2000‐2010)
WINE – NZ WINE EXPORTS BY VARIETYClose to 90% of the growth in New Zealand wine exports comes from Sauvignon Blanc
PAGE 47 Source: New Zealand Wine; Coriolis analysis
18
CAGR Absolute
10 Year
CAGR Absolute
Last Year
2023
2731
51
59
76
88
113
141
Other 1% +0.3m 5% +0.2m
Merlot 24% +2m 36% +0.7mPinot Gris
Sparkling ‐1% ‐0.1m ‐12% ‐0.2m
TOTAL 23% +123m 25% +28
Pinot Noir
Sauv Blanc
60% +3m 36%
39% +8m 33% +2m
30% +108m 27% +24m
Chardonnay 5% +2m 9% +0.4m

$51 $56 $66 $77 $112
$140 $154
$226 $224 $221 $271
$20 $23 $32
$45
$69
$103 $122
$151 $163 $170
$213
$15 $14 $24
$29
$54
$76
$102
$159
$224 $210
$240
$0 $0 $0
$1
$1
$2
$3
$5
$6 $5
$8
$1 $1 $1
$2
$3
$4
$5
$7
$10 $10
$14
$3 $3 $3
$4
$6
$7
$8
$11
$16 $22
$29
2000 2001 2002 2003 2004 2005 2006 2007 2008 2009 2010
NZ Wine exports by region(US$m; 2000‐2010)
WINE – NZ WINE EXPORTS BY REGIONNew Zealand wine exports have been showing strong value growth across all regions; Australia, the UK and the USA are our top markets
PAGE 48 Source: UN Comtrade database; Coriolis analysis
$90
CAGR Absolute
10 Year
CAGR Absolute
Last Year
$97
$127$158
$245
$332
$396
$560
$644 $637
$774 TOTAL 24% +$684m 23% +$50
N.America 27% +$193m 26% +$43m
Australia/ Pacific Islands
32% +$225m 15% +$31m
E Asia 26% +$26m 28% +$6mSE Asia 28% +$13m 42% +$4mOther 42% +$7m 46% +$2m
Europe 18% +$220m 23% +$50m
Top 5 countries (2010)
TOTAL = $774
UK$214
USA$168
Canada$45
China$20 Other
$92 Australia $236
$6 $5 $9 $9 $11 $10 $11 $21 $31 $19 $21 $2 $1 $2 $2 $2 $3 $3 $5
$7 $6 $8
$13 $12 $12 $13 $16 $20 $21 $31
$37 $32 $30
$28 $21 $29
$43 $52 $60
$89
$114
$151
$102
$143
$14 $13
$22
$29
$51
$73
$98
$155
$222
$206
$237
2000 2001 2002 2003 2004 2005 2006 2007 2008 2009 2010
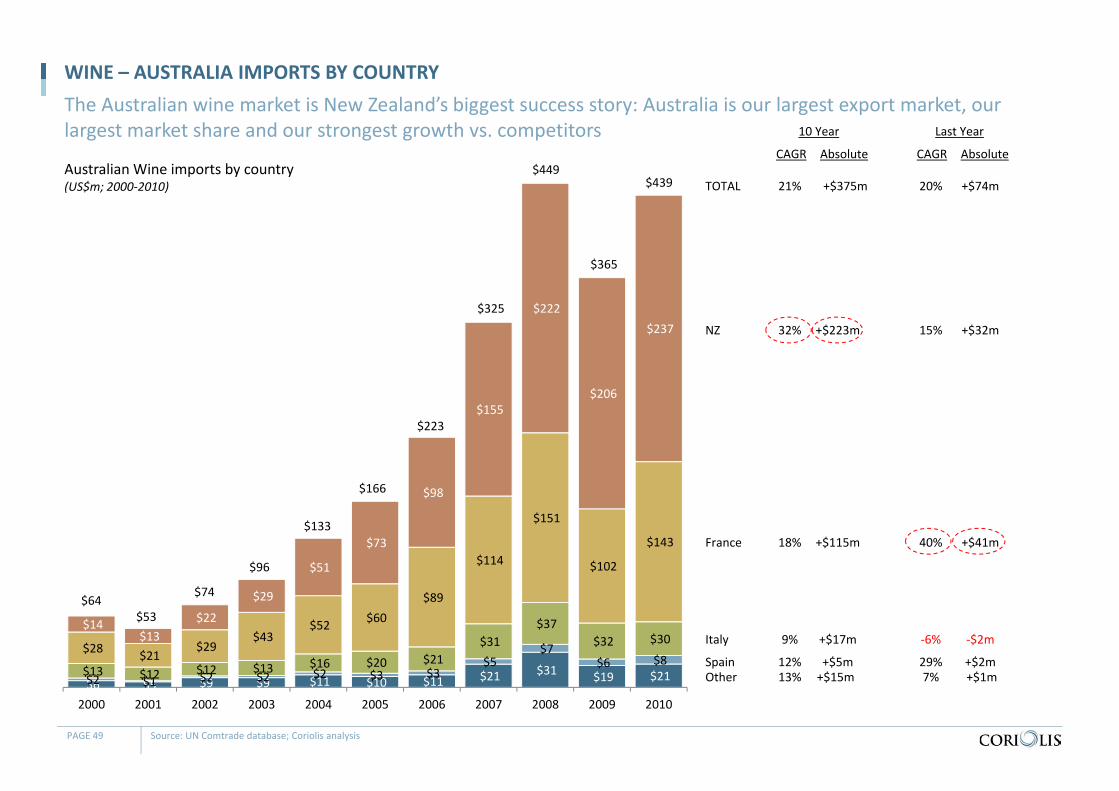
WINE – AUSTRALIA IMPORTS BY COUNTRY
Australian Wine imports by country(US$m; 2000‐2010)
The Australian wine market is New Zealand’s biggest success story: Australia is our largest export market, our largest market share and our strongest growth vs. competitors
PAGE 49 Source: UN Comtrade database; Coriolis analysis
$64
CAGR Absolute
10 Year
CAGR Absolute
Last Year
$53
$74
$96
$133
$166
$223
$325
$449
$365
$439
Other 13% +$15m 7% +$1mSpain
NZ 32% +$223m 15% +$32m
TOTAL 21% +$375m 20% +$74m
Italy
France
12% +$5m 29% +$2m
9% +$17m ‐6% ‐$2m
18% +$115m 40% +$41m

$6 $5 $9 $9 $11 $10 $11 $21 $31 $19 $21
$2 $1 $2
$2 $2 $3 $3 $5 $7 $6 $8
$13 $12 $12 $13 $16
$20 $21 $31 $37 $32 $30
$28 $21
$29 $43
$52
$60 $89 $114 $151 $102 $143
$14 $13 $22 $29
$51 $73 $98
$155 $222 $206 $237
2000 2001 2002 2003 2004 2005 2006 2007 2008 2009 2010
WINE – AUSTRALIA IMPORTS BY COUNTRY
Australian Wine imports by country(US$m; 2000‐2010)
NZ is taking market share from France and Italy in the Australian wine market
PAGE 50 Source: UN Comtrade database; Coriolis analysis
CAGR Absolute
10 Year
CAGR Absolute
Last Year
Other 13% +$15m 7% +$1mSpain
NZ 32% +$223m 15% +$32m
TOTAL 21% +$375m 20% +$74m
Italy
France
12% +$5m 29% +$2m
9% +$17m ‐6% ‐$2m
18% +$115m 40% +$41m
$307 $269 $291 $338 $378 $397 $403 $458 $489 $409 $414 $111 $133 $178 $232 $255 $231 $193 $223 $242
$227 $211 $166 $203 $227 $284
$348 $239 $235 $248 $236
$164 $217 $46 $52
$63 $86
$116 $143 $147
$210 $206 $188 $235
$126 $140 $142
$164 $206
$197 $214 $304 $310
$304 $306
$194 $209 $239
$270 $308
$299 $288
$350 $358 $323
$352
$421 $496
$622
$658
$874 $871 $827
$972 $836
$592 $561
$262 $249
$255
$319
$416 $455
$402
$460 $528
$606 $648
$913 $888
$995
$1,210
$1,374 $1,424 $1,530
$1,916 $2,000
$1,448 $1,574
2000 2001 2002 2003 2004 2005 2006 2007 2008 2009 2010
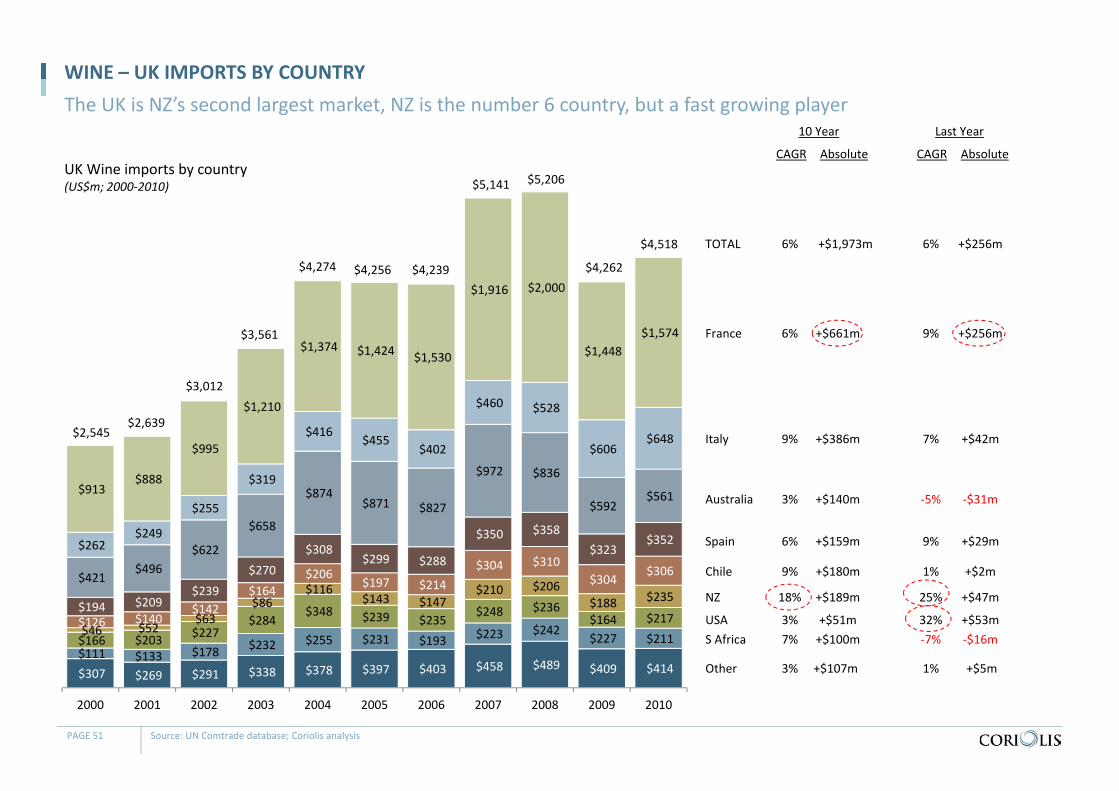
WINE – UK IMPORTS BY COUNTRY
UK Wine imports by country(US$m; 2000‐2010)
The UK is NZ’s second largest market, NZ is the number 6 country, but a fast growing player
PAGE 51 Source: UN Comtrade database; Coriolis analysis
$2,545
CAGR Absolute
10 Year
CAGR Absolute
Last Year
$2,639
$3,012
$3,561
$4,274 $4,256 $4,239
$5,141 $5,206
$4,262
$4,518
Other 3% +$107m 1% +$5m
S Africa 7% +$100m ‐7% ‐$16mUSA 3% +$51m 32% +$53m
Chile 9% +$180m 1% +$2m
Spain
NZ 18% +$189m 25% +$47m
TOTAL 6% +$1,973m 6% +$256m
Australia
Italy
France
6% +$159m 9% +$29m
3% +$140m ‐5% ‐$31m
9% +$386m 7% +$42m
6% +$661m 9% +$256m

$‐
$1.0
$2.0
$3.0
$4.0
$5.0
$6.0
$7.0
$8.0
$9.0
$10.0
2000 2001 2002 2003 2004 2005 2006 2007 2008 2009 2010
WINE – UK IMPORTS VALUE BY COUNTRY
UK Wine imports by $/l by country(US$/litre; 2000‐2010)
NZ has the second highest price for its wine in the UK market
PAGE 52 Source: UN Comtrade database; Coriolis analysis
CAGR Absolute
10 Year
CAGR Absolute
Last Year
Other 7% +$1.66 3% +$0.10
S Africa ‐1% +$0.11 10% +$0.18USA ‐1% ‐$0.29 15% +$0.24
Chile ‐1% +$0.13 ‐7% ‐$0.20
Spain
NZ 1% $0.34 ‐2% +$0.09
TOTAL 3% +$0.88 ‐3% ‐$0.11
Australia
Italy
France
4% +$0.99 ‐10% ‐$0.35
‐3% ‐$0.66 ‐6% ‐$0.14
5% +$1.06 ‐9% ‐$0.39
8% +$4.20 ‐15% ‐$1.32
Growth in “bulk wine” sales tothe UK, reducing dollar per litre value

$105 $103 $126 $132 $153 $182 $187 $201 $198 $177 $218 $46 $46 $53 $75 $86 $106 $128 $152 $155 $127 $147 $19 $22 $33 $48 $65 $101 $110 $152 $152 $159
$206
$109 $116 $139 $166 $194 $223 $251
$286 $296 $257 $282
$36 $39 $37 $42
$52 $75
$101 $143 $197 $232
$290
$147 $150 $149 $151 $165
$181 $184
$226 $243 $298 $300
$294 $365 $490
$663 $775
$814 $815
$844 $745 $686 $649
$979 $861
$971
$1,172 $1,087
$1,146 $1,377
$1,515 $1,494
$1,017 $1,047
$604 $653
$803
$960 $1,000
$1,117
$1,217
$1,336 $1,360
$1,238
$1,323
2000 2001 2002 2003 2004 2005 2006 2007 2008 2009 2010
WINE – US IMPORTS BY COUNTRY
US Wine imports by country(US$m; 2000‐2010)
NZ is a small player in the US wine market, but is the fastest growing over the long and short term
PAGE 53 Source: UN Comtrade database; Coriolis analysis
$2,339
CAGR Absolute
10 Year
CAGR Absolute
Last Year
$2,355
$2,802
$3,409$3,578
$3,945
$4,370
$4,856 $4,841
$4,190
$4,462
Other 8% +$113m 23% +$41m
Argentina 23% +$254m 25% $58m
Chile 7% +$153m 1% +$2m
Spain
NZ 27% +$187m 30% +$47m
TOTAL 7% +$2,123m 6% +$272m
Australia
Italy
France
10% +$173m 10% +$25m
8% +$355m ‐5% ‐$37m
8% +$719m 7% +$86m
1% +$67m 3% +$30m
Germany 12% +$101m 16% +$20m

WINE – SKEWED TO ANGLO‐SAXON
Note: NZ uses receiving country reported value not NZ export value; Source: UN Comtrade; UN DESA; Wine Institute (CA); Coriolis analysis
NZ wine exports are currently skewed towards the Anglo‐Saxon countries; the Northern European market stands out as the next logical market to target as it accounts for 1/3 of global wine import value
Comparison of global wine consumption share vs. global wine import value share with New Zealand wine import value(%; 2008/2009)
2% 2%
32%
13%22%
27%
5%
19%
31%
15%
32%
4%
4%
3%
0%
32%
6%
1%
7%
4%
0%
6%1%
1%
1%4%
1%
0%
4%2%
14%5% 2%
% of global wineconsumption
% of global wine importvalue
% of New Zealand exportvalue
France/Italy/Spain/Portugal
Russia
Northern Europe
UK/Ireland
Other Europe
USA/Canada
ChinaJapanOther Asia
Australia
Other
PAGE 54
89%
20%

Key metrics: Northern European wine markets & New Zealand(various; 2009)
SUMMARYWhile there are a range of opportunities in Northern Europe, research to date suggests an initial focus on the Netherlands, Denmark & Sweden
PAGE 55 1. Inter‐EU data issues; needs more work; Source: UN DESA; UN FAOStat; UN Comtrade; World Bank; CIA World Fact Book; Wine Institute (CA); Coriolis analysis
Pop(m; 09)
GDP/capita(US$; 09)
Grape area(ha; 09)
Wine cons/capita(l; 09)
Total importvalue CIF(US$m; 09)
Import value per capita (US$/cap; 09)
Import $/l(US$; 09)
New World % of import value (%; 09)
NZ imp $ share(% of $; 09)
NZ imp $ as a % of AU imp $(% of $; 09)
NZ imp $/cap CIF(US$; 09)
U.K. 62.0 $35,049 700 19.8 $3,776m $61 $3.33 TBD 5.0% 32% $3.03
Ireland 4.5 $50,948 ‐ 14.0 $272m $61 $4.31 46% 4.6% 30% $2.84
Netherlands 16.6 $47,707 50 21.7 $1,114m $67 $4.18 24% 1.0% 17% $0.64
Iceland 0.3 $38,166 ‐ 17.7 $19m $59 $3.30 49% 1.0% 6% $0.60
Sweden 9.4 $43,356 ‐ 20.3 $636m $68 $3.26 32% 0.8% 13% $0.51
Denmark 5.5 $55,881 ‐ 28.1 $638m $115 $3.35 31% 0.8% 12% $0.34
Finland 5.4 $44,276 ‐ 11.7 $222m $41 $3.37 44% 0.6% 7% $0.24
Norway 4.9 $78,029 ‐ 15.3 $333m $68 $4.38 15% 0.2% 4% $0.14
Switzerland 7.8 $64,277 14,820 36.2 $1,016m $131 $5.33 8% 0.1% 6% $0.13
Belgium 10.8 $43,271 50 25.3 $1,256m $116 $4.10 7% 0.1% 7% $0.11
Germany 81.8 $40,934 99,800 24.1 $2,774m $34 $1.96 13% 0.2% 7% $0.06
Austria 8.4 $45,971 45,098 30.3 $221m $26 $3.62 8% 0.1% 3% $0.02
Russia 141.9 $8,672 42,100 7.5 $639m $4 $1.41 15% 0.2% 27% $0.01
Luxembourg1 0.5 $104,437 1,400 52.7 $123m $245 $5.33 0.3%1 0.0% N/A N/A
Poland 38.2 $11,268 1 2.3 $219m $6 $2.42 TBD 0.0% 7% $0.01
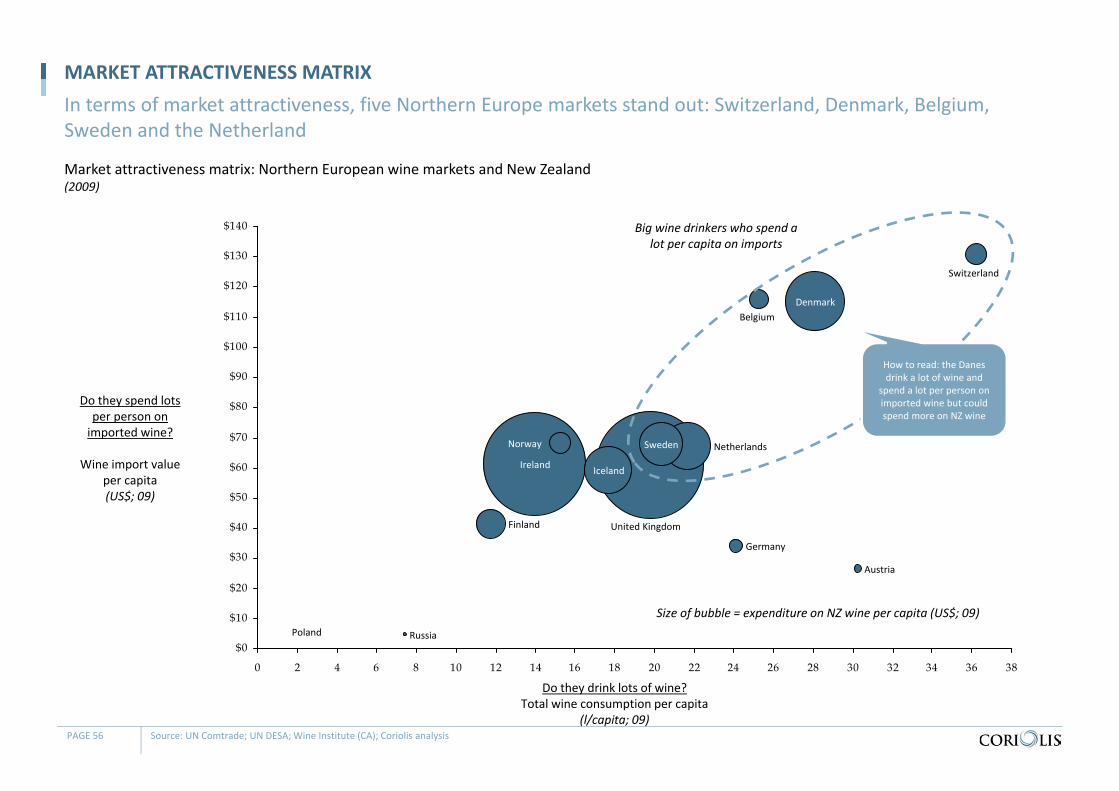
Market attractiveness matrix: Northern European wine markets and New Zealand (2009)
MARKET ATTRACTIVENESS MATRIXIn terms of market attractiveness, five Northern Europe markets stand out: Switzerland, Denmark, Belgium, Sweden and the Netherland
PAGE 56 Source: UN Comtrade; UN DESA; Wine Institute (CA); Coriolis analysis
$0
$10
$20
$30
$40
$50
$60
$70
$80
$90
$100
$110
$120
$130
$140
0 2 4 6 8 10 12 14 16 18 20 22 24 26 28 30 32 34 36 38
United Kingdom
Ireland
Norway Sweden
Finland
Denmark
Iceland
Germany
Switzerland
Austria
Belgium
Netherlands
Poland Russia
Do they drink lots of wine?Total wine consumption per capita
(l/capita; 09)
Do they spend lots per person on imported wine?
Wine import value per capita(US$; 09)
Size of bubble = expenditure on NZ wine per capita (US$; 09)
Big wine drinkers who spend a lot per capita on imports
How to read: the Danes drink a lot of wine and
spend a lot per person on imported wine but could spend more on NZ wine

Market potential matrix: Northern Europe markets and the opportunity for New Zealand wine(2009)
MARKET POTENTIAL MATRIXIn terms of market potential, three Northern European markets stand out: Netherlands, Sweden and Denmark
PAGE 57 Source: UN Comtrade; UN DESA; Coriolis analysis
$0
$100
$200
$300
$400
0% 5% 10% 15% 20% 25% 30% 35% 40% 45% 50%
Ireland
Norway
Sweden
Finland
Denmark
Iceland
Germany
Switzerland
Austria
Belgium
Netherlands
Russia
Are they favourable to New World style wines?New World wine as a % of total wine import value
(% of US$; 09)
How big is the market for New World wines?
New World wine import value(US$m; 09)
High potential markets for further NZ export growth
Size of bubble = expenditure on NZ wine per capita (US$; 09)
U.K.
How to read: Sweden is a relatively big market that likes New World
wines but could spend more on NZ wine

New Zealand wine import value (CIF) by select Northern European country(US$m; 1999‐2009)
NZ WINE IMPORT VALUE GROWTHThe markets that stand out for potential – Netherlands, Denmark and Sweden – are also the markets where New Zealand has achieved growth to date
PAGE 58 Note: data is as reported by receiving country; Source: UN Comtrade; UN DESA; Coriolis analysis
$‐
$5
$10
$15
$20
$25
$30
1999 2000 2001 2002 2003 2004 2005 2006 2007 2008 2009
Netherlands 17% +$8m
10 yearCAGR(99‐09)
10 yearAbsoluteGrowth(99‐09)
Denmark 17% +$4m
Sweden 15% +$4m
Germany 8% +$3m
Finland 36% +$1mBelgium 5% +$1mRussia 50% +$1mSwitzerland 3% +$0mNorway 27% +$1mOther 4 countries 7% +$0m
14% +$23m
$8.8$7.7 $8.1 $8.6 $8.6
$12.3
$19.9$19.2
$28.0$29.3
$31.4

Theme Details Examples
Declining value
Value Average value of bottled wine exports declining ‐ Bottled wine value similar to those current in early 2006
Growing Debt Many growers and smaller wineries building up debt levels
‐ Boutique wineries suffered an average loss of nearly 32 per cent in 2010, or five bottles of wine for every case‐ Fall in vineyard values‐ Grape prices falling (lowest price per tonne for a decade)‐ “Profitability in the wine sector is under siege on all fronts.” NZ Wine Annual report, 2011
Global Oversupply
Controlling supply To prevent falling prices it is necessary to keep production and market demand in alignment
‐ Australia production an example of oversupply resulting in collapsed pricing‐ Emphasise and focus on quality‐ Niche markets‐ Move away from flat domestic market
Bulk sales – export Reduces average price ‐ Bulk wine now accounts for 27% of total export volume‐ Exported and used in overseas brands and supermarket private label e.g. Tesco own brand sales #1
Bulk sales ‐ import Price pressure ‐ Bulk cheap imports increases in‐market price pressure for local wineries
Identified firm level activity or investment themes – difficult conditions(2010)
WINE – THEMESWhile sales growth is increasing, wineries are suffering from declining value and global oversupply
PAGE 59 Source: various companies annual financial statements (as filed with NZ Companies Office or available company website); various press releases and news articles; Coriolis analysis
PRELIMINARY‐ In progress ‐

Theme Details Examples
Cost savings
Industry Consolidation Fewer larger firms, gaining economies of scale ‐ Pernod Ricard ‐ owns 100% Montana 100 % Brancott Estate, Camshorm, Penfolds Wines NZ, Tylers Stream Wine Company
‐ Villa Maria Estate: Whale Bay Wine, Half Bay Wine, Aotea Wines, Atlas Wine, Breakaway Bay Wines, Caroline Bay Wines, Carter Rock Wine, Esk Valley Estate, First Barrel Wine, Glenvale Estate, House of Wine, Kapua Springs, Moneo Vintners, Riverstone, Silverlake, Southern Cross Wines, Te Whetu, Terra Vitae , Thornbury, Vidal Estate.
‐ The New Zealand Wine Company: Grove Mill Wine Company Limited, Sanctuary Wine Company Limited, Bedford Road Investments Limited
‐ Delegat’s Marlborough‐Gold Wines, Oyster Bay Wines (USA) Ltd
Automation Research into pruning automation to reduce labour costs
‐ Wine Industry funding research into automatic pruning‐ Mechanical thinning for yield management‐ Lion new facility has increased automation
Processing joint ventures
Local joint venture in contract winery, costsharing and maximising capacity
‐ Rapaura Vintners Ltd, biggest NZ contract winery (makes Marlborough wines for Babich Wines, Vavasour Wines and Foster's own Matua Valley Wines label)
‐ Was third held by Fosters, Babich and Goldwater Shares; now its 50/50 between Babich and TWE (Foster’s Group/ Treasury Wine Estate/Matua)
Joint marketing Shared overseas marketing reduces cost ‐ The Family of Twelve (international marketing)‐ New Zealand Winegrowers USA (21 Companies in Super Premium category)
Foreign Investment
Searching for newflavours
European and Australian firms are looking forpopular wines such as Sauvignon Blanc to extend portfolio
‐ Sauvignon Blanc is rising in popularity and is well developed in NZ‐ Traditional heavier wines from Europe/Australia are declining in demand‐ Investment in new varieties (Pinot Gris, Syrah, Viognier, Gewurztraminer, Riesling)‐ Foreign companies such as LMVH, Pernod Ricard, making significant investments in NZ vineyards
Growth of existing investments
Companies with significant investments in NZ are expanding production and exports
‐ Matua increasing vineyards and production
New entrants Companies are newly investing in NZ vineyards for export
‐ Large multinationals, investment firms
Identified firm level activity or investment themes – cost savings(2010)
WINE – THEMESSignificant cost savings are being made in the sector with significant overseas investment
PAGE 60 Source: various companies annual financial statements (as filed with NZ Companies Office or available company website); various press releases and news articles; Coriolis analysis
PRELIMINARY‐ In progress ‐

Theme Details Examples
Growth strategies
Pushing sustainability Leveraging NZ’s clean green image ‐ Membership of Sustainable Winegrowing NZ represents 90% of wine production‐ Growth of organic wines e.g. goal to increase organic wineries to 20%; OWNZ has 140 members; currently 4.5% of
wine area e.g. Millton Winery ‐ Vineyards are beginning to present data on carbon footprint
Development of new export markets
While traditional markets are still of primary importance, other countries are being targeted
‐ Japan/Asia/China increasing wine consumption and growth of income‐ Shipments to China increased 180% to $17m (now NZ’s 6th largest export destination)‐ The highest average prices are achieved in Asia now, and total sales have reached over $60 million, compared with
just $10 million only five years ago.
Higher value‐addedproducts
Sparkling wine, method traditionalle ‐ Launched Oyster Bay Sparkling Cuvée Brut and Oyster Bay Sparkling Cuvée Rosé ( Delegats)‐ NZ wines in the “Super premium” categories‐ Mount Riley, Allan Scott, Lindauer starting to offer sparkling Sauvignon Blanc
New wines Growth of new wine varieties increasing range ‐ Growth in Pinto Gris, Reisling, Viogner (light, fresh wines)
Branding NZ wine Generic Marketing raising awareness of all NZ wines and brands
‐ Generic NZ wine marketing; Wine NZ marketing brand NZ‐ Creating regional wine identities for instance Otago Pinot Noir wines are spicy/complex
Identified firm level activity or investment themes – growth(2010)
WINE – THEMESWine companies are looking to grow the market
PAGE 61 Source: various companies annual financial statements (as filed with NZ Companies Office or available company website); various press releases and news articles; Coriolis analysis
PRELIMINARY‐ In progress ‐

TABLE OF CONTENTS
Section Page
Contents 4
Glossary of terms 5
Methodology & data sources 6
F&B IP Overview 7
Summary & conclusions 9
Sector overview 16
Wine 43
Appendices 62

TotalIncome
TotalStaff Focus & activities
N/A 24 ‐ Aroma studies‐ geological etc. effects on Sauvignon Blanc aroma‐ $12m FRST funding of sauvignon blanc (with Plant and Food), Auckland and Lincoln
Universities)‐ Conjunction with Nelson Marlborough Institute of Technology
www.wineresearch.org.nz
Wine Research Institute(Dept. of Chemistry – (Wine Science Programme)
N/A N/A ‐ Chemistry research into high acid, co‐ferments, yeasts, polyphenol analyses‐ Pinot Noir research into aroma colour, polyphenols, soil profiles (Funding from
liquorland and ‐ Sauvignon blanc programme researching aroma compounds (FRST funding $1.6m/yr)
http://web.auckland.ac.nz/uoa/science/about/departments/chemistry/about/subjects/winescience/research/furtherwineresearch/furtherwineresearch.cfm
N/A(2010)
N/A ‐ Pest and Disease Management‐ Viticulture production systems‐ Biological controls‐ Applied sensors‐ Viticulture and Wine research (18 staff at Marlborough Research Centre)‐ Sensory Science‐ Developing fining agents from
www.plantandfood.co.nz/page/home/landing‐pages/wine‐industry/
N/A 8 core19 assoc
‐ Focus on Pinot Noir‐ Climate and soil effects on vine growth and grape composition ‐ Enhancing nature’s ecosystem services in vineyards‐ Enhancing innovation and adoption of new technologies in the grape wine sector ‐ Sensory evaluation and psychological aspects of flavour perception
www.lincoln.ac.nz/Research‐at‐Lincoln/Research‐centres/Centre‐for‐Viticulture‐and‐Oenology/
$56.7m 116 academic +110 general
‐ Viticulture and Wine courses‐ Situated within the Marlborough Wine Research Centre
http://www.nmit.ac.nz/courses/areaofstudy/mid/12245/a/25/viticulture‐wine.aspx
N/A N/A ‐ Sustainable farming fund‐ others
http://www.maf.govt.nz
Key scientific research organisations involved in beverage industry research in New Zealand(2010)
BEVERAGES – INDUSTRY SCIENTIFIC RESEARCHA number of research institutes are researching in the wine sector
PAGE 63 Source: Company websites; annual reports; Coriolis

# of members Details
website
New Zealand Wine 1,000 growers700 winery
‐ Funded through: a levy on the sale of grapes collected by the Grape Growers Council under the Commodity Levies Act 1991;
‐ a levy on the sale of wine collected by the Wine Institute under the Wine Act 2003;
‐ user pays activities and sponsorships
www.nzwine.com
12 ‐ Represent views of producers and marketers of premium spirits and liqueurs
www.distillers.co.nz
77 ‐ Represent views of producers and marketers of juices and non‐alcoholic beverages
www.nzjba.org.nz
46+ ‐ Represents all of the breweries in New Zealand brewersguild.org.nz
Key industry organisations involved in beverage industry research in New Zealand(2010)
BEVERAGE – INDUSTRY ORGANISATIONSThere are four key industry organisations representing the New Zealand beverage industry
PAGE 64 Source: Company websites; annual reports; Coriolis
Related Documents