February 8, 2016 The Packaging Conference Beverages 2016 The Shifting Beverage Landscape: What’s In Store?

Welcome message from author
This document is posted to help you gain knowledge. Please leave a comment to let me know what you think about it! Share it to your friends and learn new things together.
Transcript

February 8, 2016
The Packaging Conference
Beverages 2016The Shifting Beverage Landscape:
What’s In Store?

-2- Copyright © 2016 Beverage Marketing Corp.
Unique Beverage Industry Expertise for Providing “Added-Value” to Selected Clients
Beverage Marketing Capabilities
Cutting Edge Insights: New Age Emergence, Multiple Beverage Competition, Specialty Beer Opportunity, Bottled Water Dominance, Hyper-Category
Competition, Micro-Marketing Age
Beverage Marketing Corporation utilizes an integrated model for providing information, analysis and advice to beverage industry clients

-3- Copyright © 2016 Beverage Marketing Corp.
Introducing…The Beverage Packaging Data MODULE
The latest addition to Beverage Marketing Corporation’s
DrinkTell™ Database with Market Forecasts!
Visit our exhibit for a closer look!
The Beverage Packaging Module is brought to you by:
and
Beverage Marketing Capabilities

-4- Copyright © 2016 Beverage Marketing Corp.
What’s In Store
Agenda
I. Market Overview
II. Key Trends
III. Category Updates
IV. Projections
-5- Copyright © 2016 Beverage Marketing Corp.
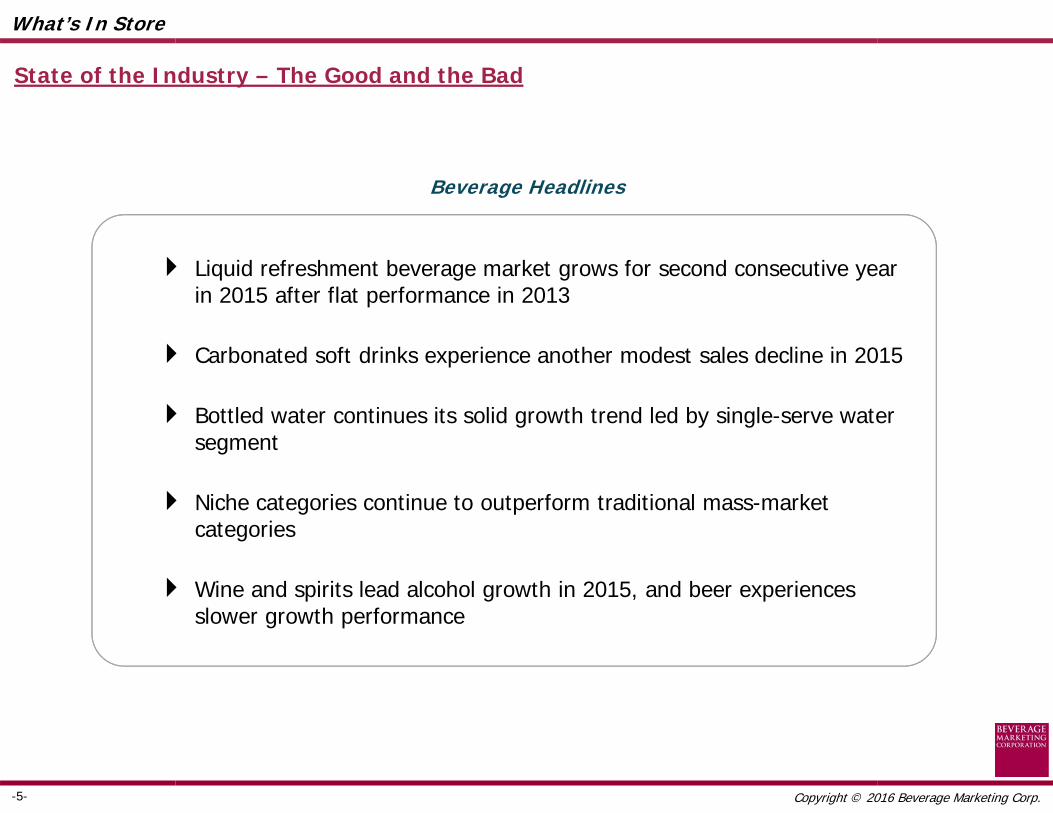
State of the Industry – The Good and the Bad
Beverage Headlines
What’s In Store
Liquid refreshment beverage market grows for second consecutive year in 2015 after flat performance in 2013
Carbonated soft drinks experience another modest sales decline in 2015
Bottled water continues its solid growth trend led by single-serve water segment
Niche categories continue to outperform traditional mass-market categories
Wine and spirits lead alcohol growth in 2015, and beer experiences slower growth performance

-6- Copyright © 2016 Beverage Marketing Corp.
Source: Beverage Marketing Corporation; Bureau of Economic Analysis, Department of Commerce, Department of Labor
What’s In Store
Quarterly GDP Change2010 – 2015
Unemployment Rate2000 – 2015
2010 2011 2012
4.0%
4.7%
6.0%5.5%
5.1%
9.6%
9.0%
8.1%
7.4%
6.2%
9.3%
5.8%
4.6%4.6%
5.3%
5.8%
0%
2%
4%
6%
8%
10%
'00 '01 '02 '03 '04 '05 '06 '07 '08 '09 '10 '11 '12 '13 '14 '152013 2014 2015
The economy continues to move in a positive direction with improved GDP growth and lower unemployment, but improvement has been slow

-7- Copyright © 2016 Beverage Marketing Corp.
Stock Price Performance2010 – 2015
Source: Beverage Marketing Corporation; Google Finance
What’s In Store
2010 2011 2012 2013 2014 2015
KO +15.4% +7.1% +2.8% +13.5% +6.3% +6.3%
PEP +7.5% -2.2% +2.5% +21.2% +14.0% +8.9%
DPS +24.2% +5.5% +11.9% +10.3% +34.7% +30.2%
CCE +18.1% +1.1% +23.1% +39.1% +21.3% +1.2%
COT +36.7% -29.7% +28.3% +0.4% -13.9% +57.0%
Soft Drinks +14.6% +3.8% +8.6% +9.8% +11.6% +6.6%
Beverages +15.0% +4.2% +10.1% +13.1% +14.1% +9.1%
Consumer Goods N/A +10.0% +10.5% +12.8% +10.4 +3.9%
Beverage stock performance was solid in 2015 – consistent with the performance of the overall stock market – but market has been rocky first month of 2016
-8- Copyright © 2016 Beverage Marketing Corp.
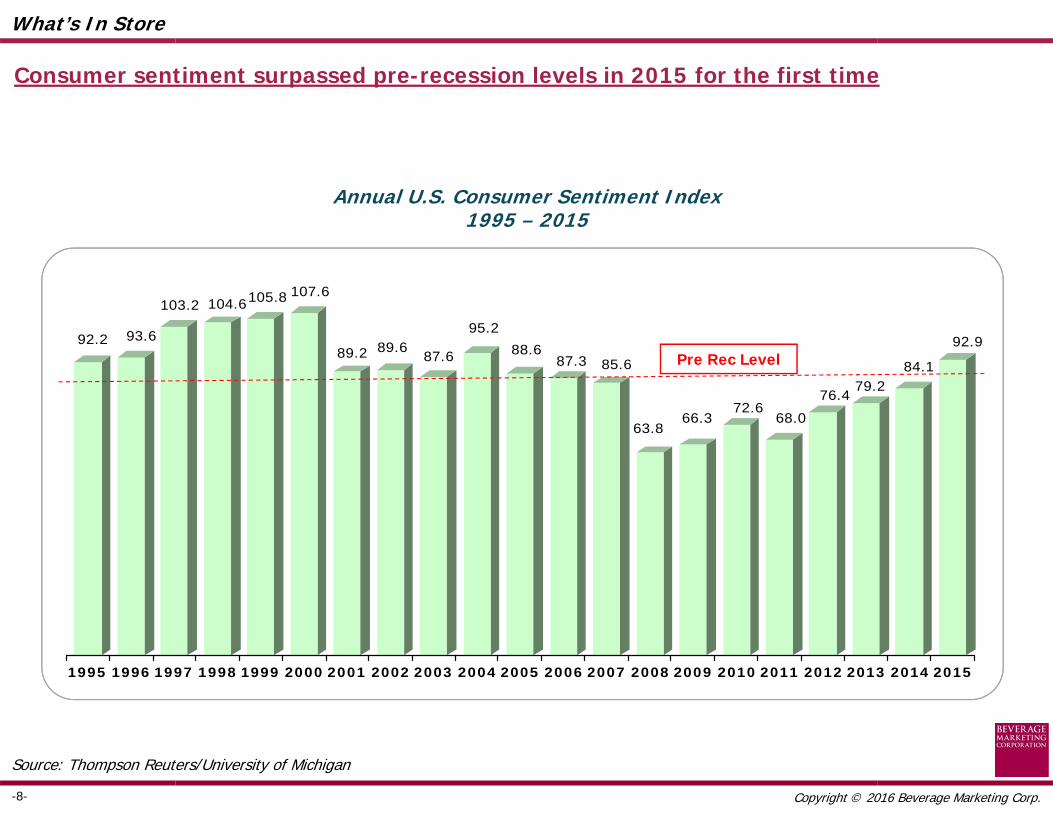
Annual U.S. Consumer Sentiment Index1995 – 2015
Source: Thompson Reuters/University of Michigan
What’s In Store
92.2 93.6
103.2 104.6105.8 107.6
89.2 89.687.6
95.2
88.687.3 85.6
63.866.3
72.668.0
76.479.2
84.1
92.9
1995 1996 1997 1998 1999 2000 2001 2002 2003 2004 2005 2006 2007 2008 2009 2010 2011 2012 2013 2014 2015
Consumer sentiment surpassed pre-recession levels in 2015 for the first time
Pre Rec Level
-9- Copyright © 2016 Beverage Marketing Corp.
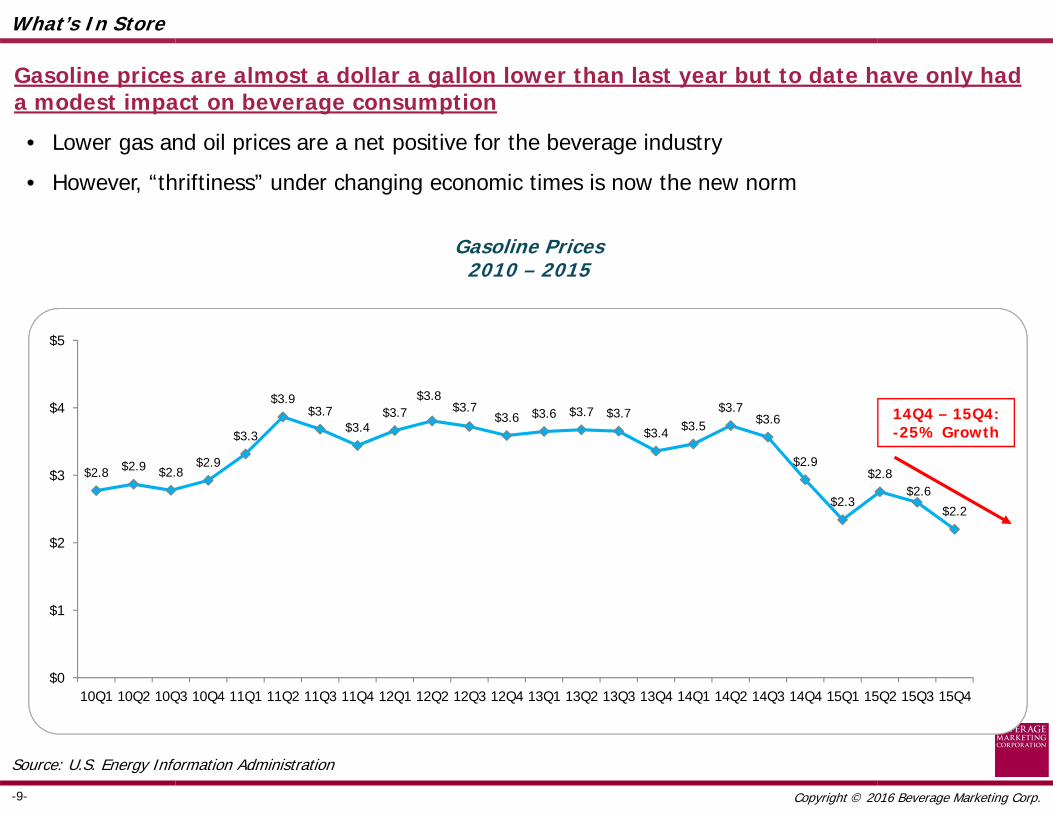
Gasoline Prices2010 – 2015
$2.8 $2.9 $2.8$2.9
$3.3
$3.9$3.7
$3.4$3.7
$3.8$3.7
$3.6 $3.6 $3.7 $3.7
$3.4 $3.5$3.7
$3.6
$2.9
$2.3
$2.8$2.6
$2.2
$0
$1
$2
$3
$4
$5
10Q1 10Q2 10Q3 10Q4 11Q1 11Q2 11Q3 11Q4 12Q1 12Q2 12Q3 12Q4 13Q1 13Q2 13Q3 13Q4 14Q1 14Q2 14Q3 14Q4 15Q1 15Q2 15Q3 15Q4
14Q4 – 15Q4: -25% Growth
What’s In Store
Gasoline prices are almost a dollar a gallon lower than last year but to date have only had a modest impact on beverage consumption
• Lower gas and oil prices are a net positive for the beverage industry
• However, “thriftiness” under changing economic times is now the new norm
Source: U.S. Energy Information Administration
-10- Copyright © 2016 Beverage Marketing Corp.
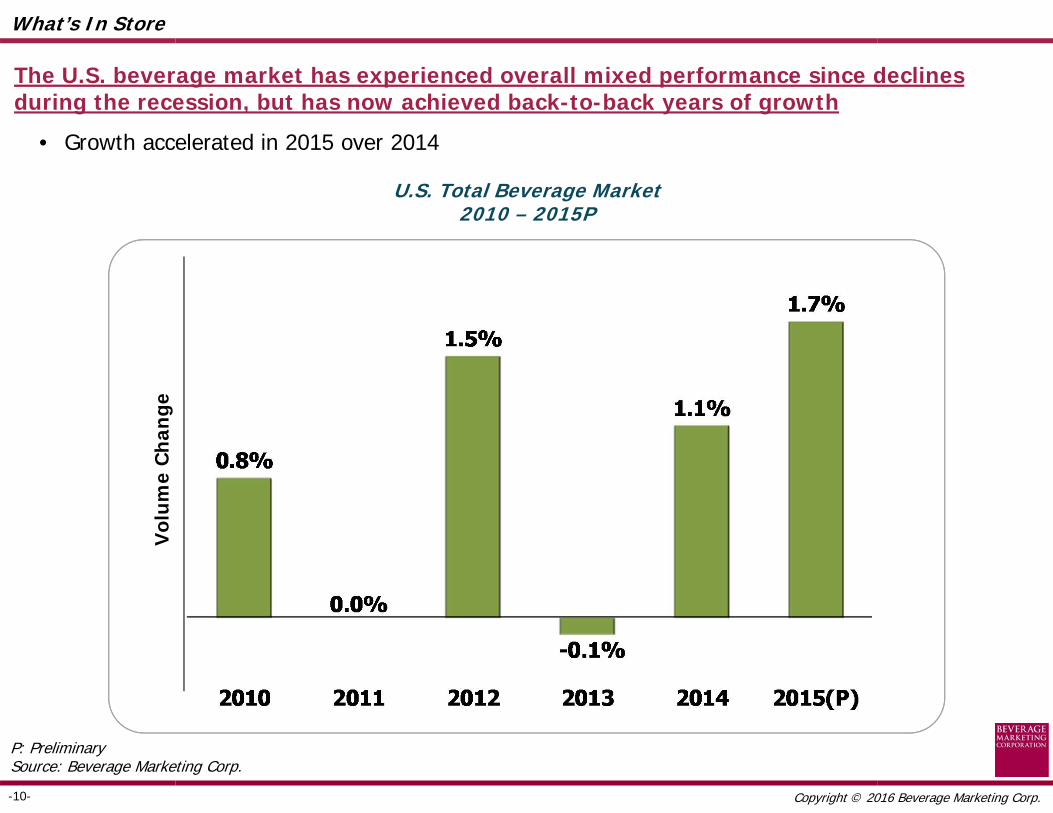
U.S. Total Beverage Market2010 – 2015P
P: PreliminarySource: Beverage Marketing Corp.
What’s In Store
Vol
um
e C
han
ge
The U.S. beverage market has experienced overall mixed performance since declines during the recession, but has now achieved back-to-back years of growth
• Growth accelerated in 2015 over 2014

-11- Copyright © 2016 Beverage Marketing Corp.
U.S. Total Beverage MarketVolume and Wholesale Revenue
(Millions of Gallons and Wholesale Dollars)2010 – 2015P
What’s In Store
P: PreliminarySource: Beverage Marketing Corp.
Post-recession annual beverage revenues have been consistently positive, but the differential versus volume growth is narrowing
Cha
nge
0.8%
0.0%
1.5%
-0.1%
1.1%
1.7%
0.8%0.9%
2.3%
3.7%
1.5%
3.1%
2.7% 2.7%
2010 2011 2012 2013 2014 2015(P) 10/15CAGR
Volume Wholesale Revenue

-12- Copyright © 2016 Beverage Marketing Corp.
2.9%
0.5%0.8%
-5.2%
RefreshmentBeverages
TraditionalBeverages
BeverageAlcohol
Tap Water
U.S. Beverage Market – 2015PV
olu
me
Ch
ange
What’s In Store
P: PreliminarySource: Beverage Marketing Corp.
In 2015, refreshment beverages led by bottled water and some niche categories are growing fastest

-13- Copyright © 2016 Beverage Marketing Corp.
-1.1% -2.1%
18.8%
10.1%
6.1% 5.8% 5.5%7.6%
CSDs Fruit Bevs
RTD Coffee
Energy Drinks
RTD Tea Value Added Waters
Sports Bevs
Bottled Water
Vol
um
e C
han
ge
The U.S. Liquid Refreshment Beverage Market2015P
P: PreliminarySource: Beverage Marketing Corp.
What’s In Store
In general, traditional mass market categories have struggled while niche categories have experienced growth
• Bottled water is the primary exception of a mainstream category that has thrived
-14- Copyright © 2016 Beverage Marketing Corp.
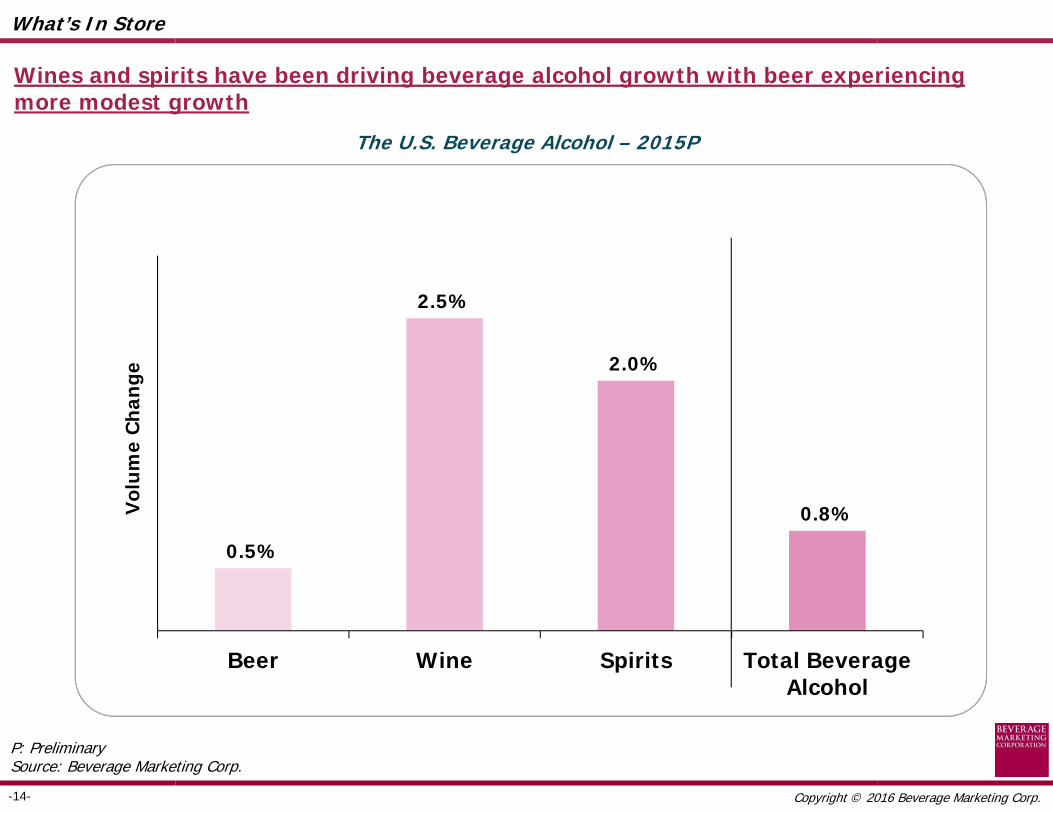
0.5%
2.5%
2.0%
0.8%
Beer Wine Spirits Total BeverageAlcohol
Vol
um
e C
han
ge
The U.S. Beverage Alcohol – 2015P
P: PreliminarySource: Beverage Marketing Corp.
What’s In Store
Wines and spirits have been driving beverage alcohol growth with beer experiencing more modest growth
-15- Copyright © 2016 Beverage Marketing Corp.
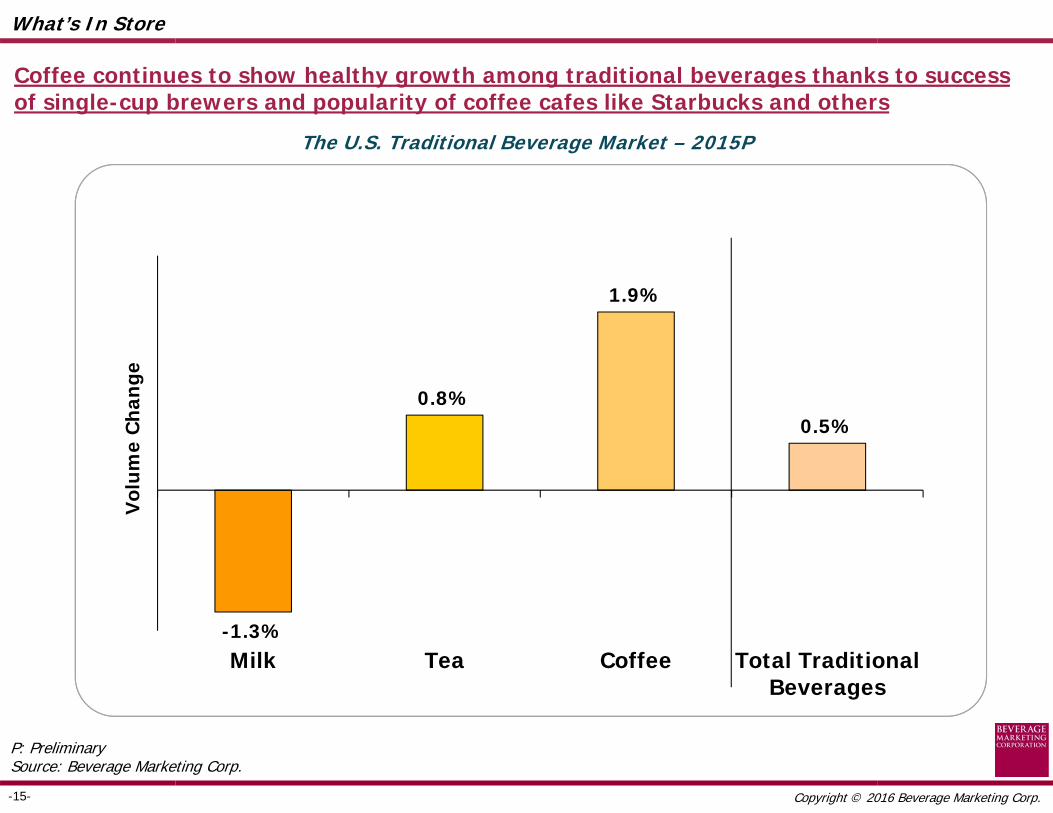
-1.3%
0.8%
1.9%
0.5%
Milk Tea Coffee Total TraditionalBeverages
Vol
um
e C
han
ge
The U.S. Traditional Beverage Market – 2015P
P: PreliminarySource: Beverage Marketing Corp.
What’s In Store
Coffee continues to show healthy growth among traditional beverages thanks to success of single-cup brewers and popularity of coffee cafes like Starbucks and others
-16- Copyright © 2016 Beverage Marketing Corp.
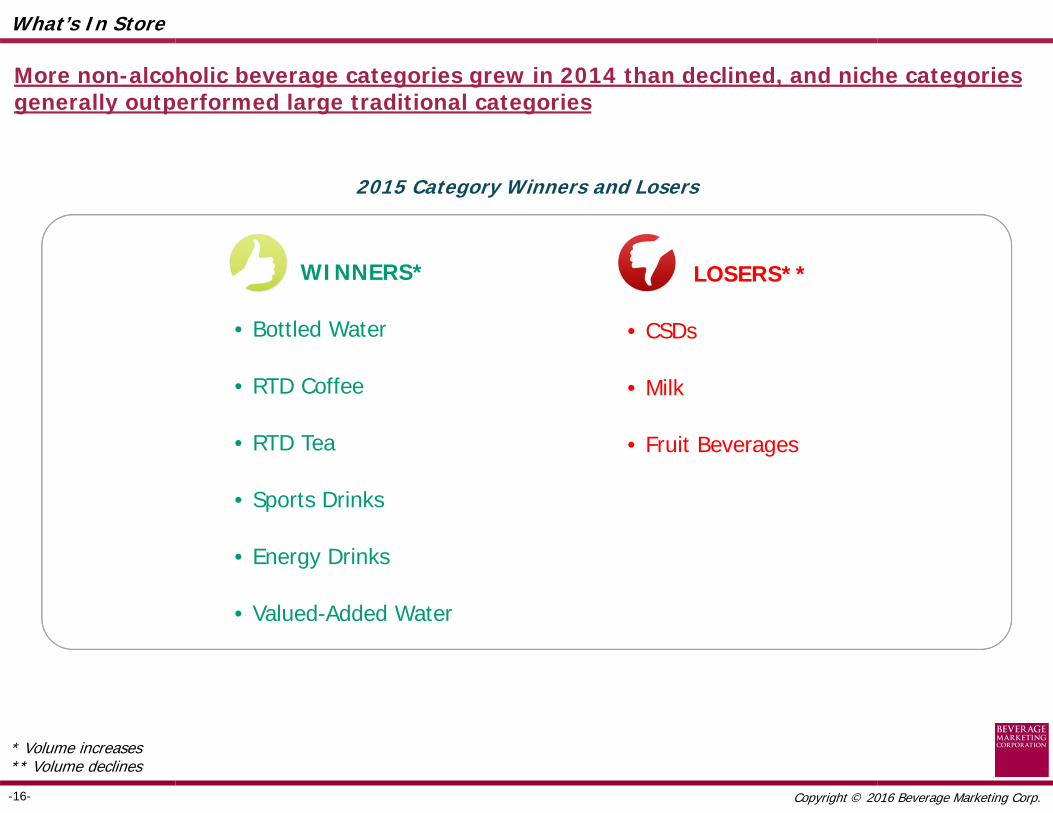
2015 Category Winners and Losers
* Volume increases** Volume declines
What’s In Store
WINNERS*
• Bottled Water
• RTD Coffee
• RTD Tea
• Sports Drinks
• Energy Drinks
• Valued-Added Water
LOSERS**
• CSDs
• Milk
• Fruit Beverages
More non-alcoholic beverage categories grew in 2014 than declined, and niche categories generally outperformed large traditional categories

-17- Copyright © 2016 Beverage Marketing Corp.
What’s In Store
IMPROVED
• Bottled Water
• Energy Drinks
• Fruit Beverages
• Milk
• RTD Coffee
• RTD Tea
• Sports Drinks
• Value-Added Water
WORSENED
• CSDs
2015 Beverage Report Card
More categories experienced improved performance in 2015 even when they declined

-18- Copyright © 2016 Beverage Marketing Corp.
Traditional Key Consumer Drivers Are Evolving
What’s In Store
Health and wellness Balanced nutrition
Variety Flavors, seasonals, hybrids
Convenience With product information

-19- Copyright © 2016 Beverage Marketing Corp.
U.S. Health/Wellness Beverage Market vs. All Others2010 – 2015P
Mill
ions
of
Gal
lons
What’s In Store
Beverages with health and wellness attributes are growing at a rate faster than those categories without such attributes
38.3
21.0
38.4
21.4
38.3
22.0
38.4
22.3
38.2
23.0
37.7
24.1
2010 2011 2012 2013 2014 2015(P)
All Others Health/Wellness
Bill
ion
s of
Gal
lon
s
Health/Wellness MarketGrowth
2011 – 2015P
Year Wellness All Others
10/11 1.8% 0.4%
11/12 2.8% -0.4%
12/13 1.5% 0.3%
13/14 3.0% -0.4%
14/15P 4.5% -1.4%
10/15PCAGR 2.7% -0.3%
P: PreliminarySource: Beverage Marketing Corporation

-20- Copyright © 2016 Beverage Marketing Corp.
What’s In Store
The beverage industry has committed to a reduction of 20% of calories from beverages by 2025 through the Balanced Calories Initiative
Source: Beverage Marketing Corporation; American Beverage Association

-21- Copyright © 2016 Beverage Marketing Corp.
What’s In Store
Beverage companies are moving to healthier product portfolios. Coca-Cola, for example, has expanded participation in high-growth areas through investments. Many of the categories feature healthy product attributes
Source: Beverage Marketing Corporation; Coca-Cola Company

-22- Copyright © 2016 Beverage Marketing Corp.
What’s In Store
Additionally, PepsiCo is expanding its healthier beverage options; today about half of its refreshment beverage volume comes from healthier products
PepsiCo U.S. Beverage Volume Mix
1997
24%
76%
Today
49% 51%
Full- or mid-calorie refreshment, energy, indulgence
Zero- or low-calorie beverages (<40 calories per 8oz), active hydration, healthy juices
Source: Beverage Marketing Corporation; PepsiCo
-23- Copyright © 2016 Beverage Marketing Corp.
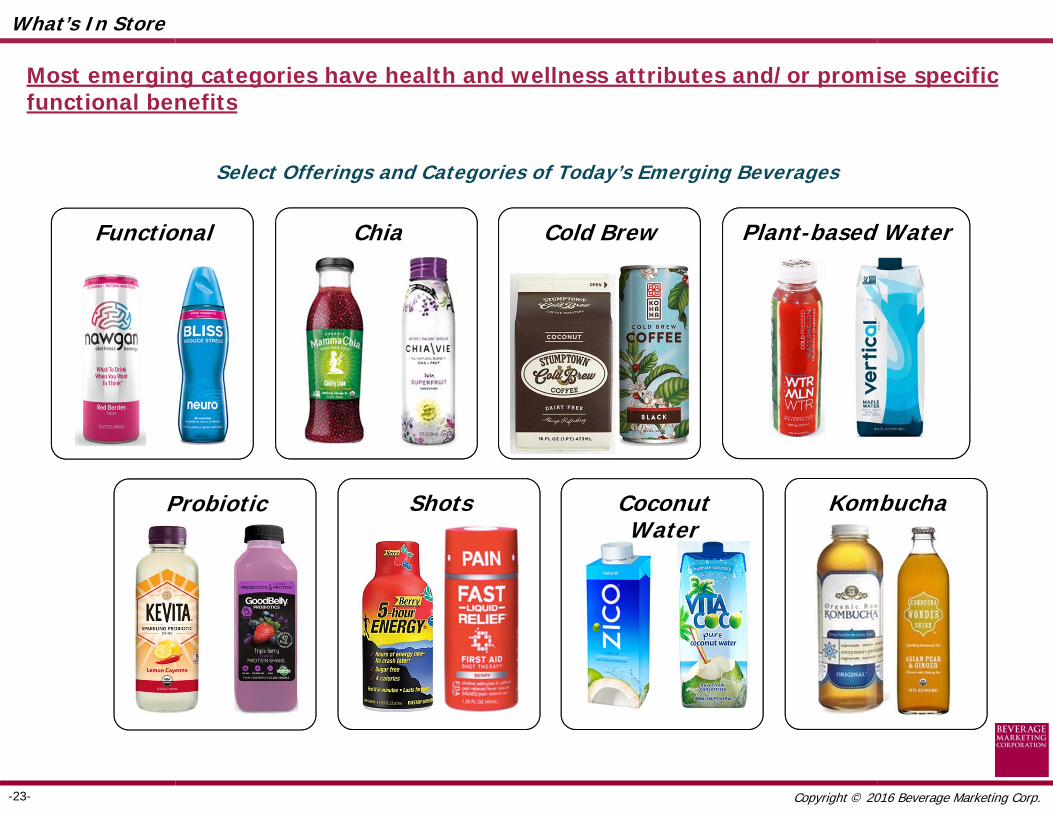
Functional Chia Cold Brew Plant-based Water
Probiotic Shots Coconut Water
Kombucha
Select Offerings and Categories of Today’s Emerging Beverages
What’s In Store
Most emerging categories have health and wellness attributes and/or promise specific functional benefits

-24- Copyright © 2016 Beverage Marketing Corp.
What’s In Store
Craft beer continues to be the fastest growing segment in the beer category as new breweries now total 4,000 nationally; craft beer now accounts for about 11% of category volume

-25- Copyright © 2016 Beverage Marketing Corp.
What’s In Store
Top 10 Soft Drinks
Pepsi-Cola
Diet Coke
Mountain Dew
Diet Pepsi
Coke Zero
Top 10 Beer Brands
Bud Light
Coors Light
Budweiser
Miller Lite
Corona Extra
Natural Light
Busch Light
Busch
Top 10 Spirits Brands
Bacardi
Captain Morgan
Absolut
Many big brands declined in 2014

-26- Copyright © 2016 Beverage Marketing Corp.
Decade Comparison 2004 – 2014
Which Categories Gained, Which Lost Volume?
4.5%
6.6%
14.7%
2.0%
3.6%
10.2%
-2.9%
-1.9%
0.7%
Category Millions of Gallons 2005/15P CAGR
4,163
795
274
136
66
-1,041
-2,656
2,212
476
Total LRB
CSD
Fruit Beverages
RTD Coffee
Value-Added Water
Sports Drinks
Energy Drinks
RTD Tea
Bottled Water
What’s In Store
Bottled water has gained the most volume over the last 10 years while carbonated soft drinks have lost the most
P: PreliminarySource: Beverage Marketing Corp.

-27- Copyright © 2016 Beverage Marketing Corp.
10/15P5-Yr CAGR -1.8%
Bill
ion
s of
Gal
lon
s
U.S. Carbonated Soft Drink Market2010 – 2015P
CSD Market Growth2011 – 2015P
Year Change
10/11 -1.8%
11/12 -1.8%
12/13 -3.2%
13/14 -1.0%
14/15P -1.1%
P: PreliminarySource: Beverage Marketing Corporation
What’s In Store
Carbonated soft drink volume declined for the 11th consecutive year in 2015 but remains the most popular beverage in the United States
• Despite the decline, category performance actually improved in 2014 from preceding years and worsened only slightly in 2015
13.8
13.6
13.3
12.912.8
12.6
2010 2011 2012 2013 2014 2015(P)

-28- Copyright © 2016 Beverage Marketing Corp.
Stevia Sweetened CSDs
What’s In Store
As the search for a good-tasting, natural sweetener continues, some brands have begun to use stevia but taste issues remain

-29- Copyright © 2016 Beverage Marketing Corp.
Craft Soda
What’s In Store
One potential source of growth is craft sodas, which are beginning to emerge as a viable option for today’s consumers with new brands and companies entering the market, but the segment is unlikely to reach the same level as craft beer

-30- Copyright © 2016 Beverage Marketing Corp.
What’s In Store
SodaStream Bonne O
SodaStream has first-mover advantage in the home beverage dispenser market, while rivals such as Bonne O are close to coming into the market
• PepsiCo is now making its Pepsi and Sierra Mist brands available in capsules for SodaStream
Keurig Kold
-31- Copyright © 2016 Beverage Marketing Corp.
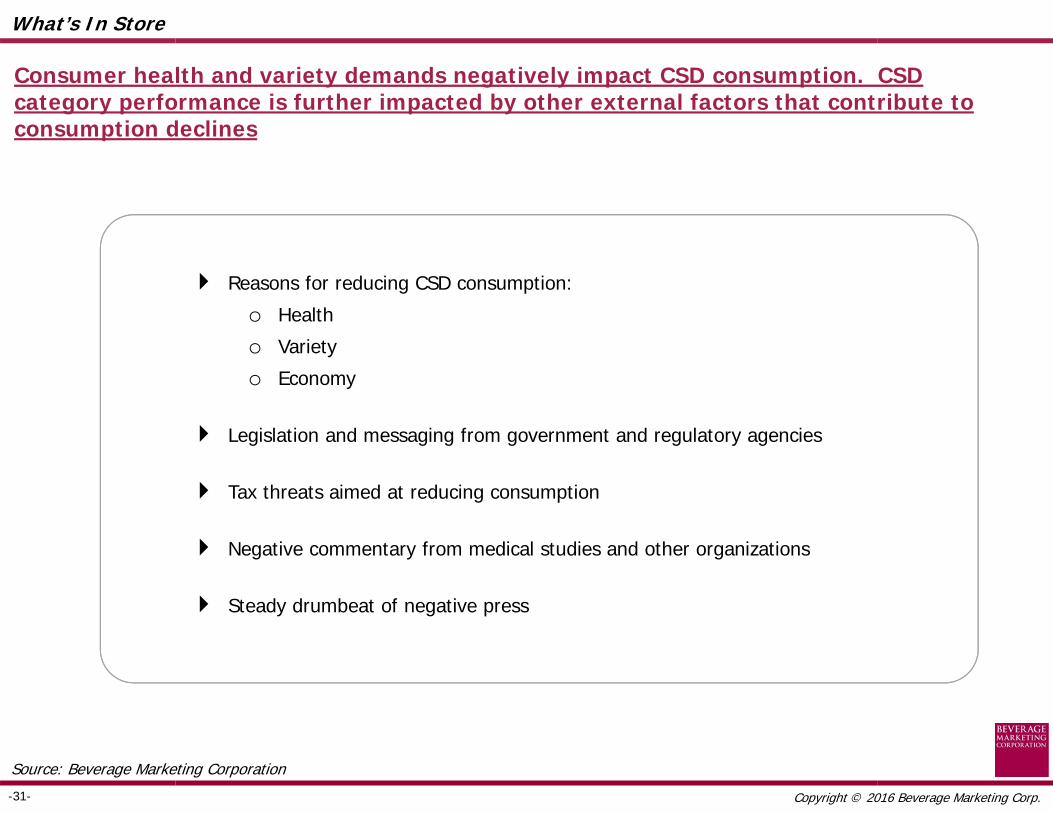
Reasons for reducing CSD consumption:
o Health
o Variety
o Economy
Legislation and messaging from government and regulatory agencies
Tax threats aimed at reducing consumption
Negative commentary from medical studies and other organizations
Steady drumbeat of negative press
What’s In Store
Consumer health and variety demands negatively impact CSD consumption. CSD category performance is further impacted by other external factors that contribute to consumption declines
Source: Beverage Marketing Corporation

-32- Copyright © 2016 Beverage Marketing Corp.
U.S. Bottled Water Market2010 – 2015P
P: PreliminarySource: Beverage Marketing Corporation
Bottled Water Market Growth
2011 – 2015P
Bill
ion
s of
Gal
lon
s
What’s In Store
Bottled water has experienced healthy growth each year since the recession
• The category is aided by its positioning as the ultimate health beverage
• The category now approaches nearly 12 billion gallons
8.8 9.19.6
10.110.9
11.7
2010 2011 2012 2013 2014 2015(P)
10/15PCAGR 6.0%
Year Change
10/11 4.0%
11/12 6.2%
12/13 4.7%
13/14 7.3%
14/15P 7.6%
-33- Copyright © 2016 Beverage Marketing Corp.
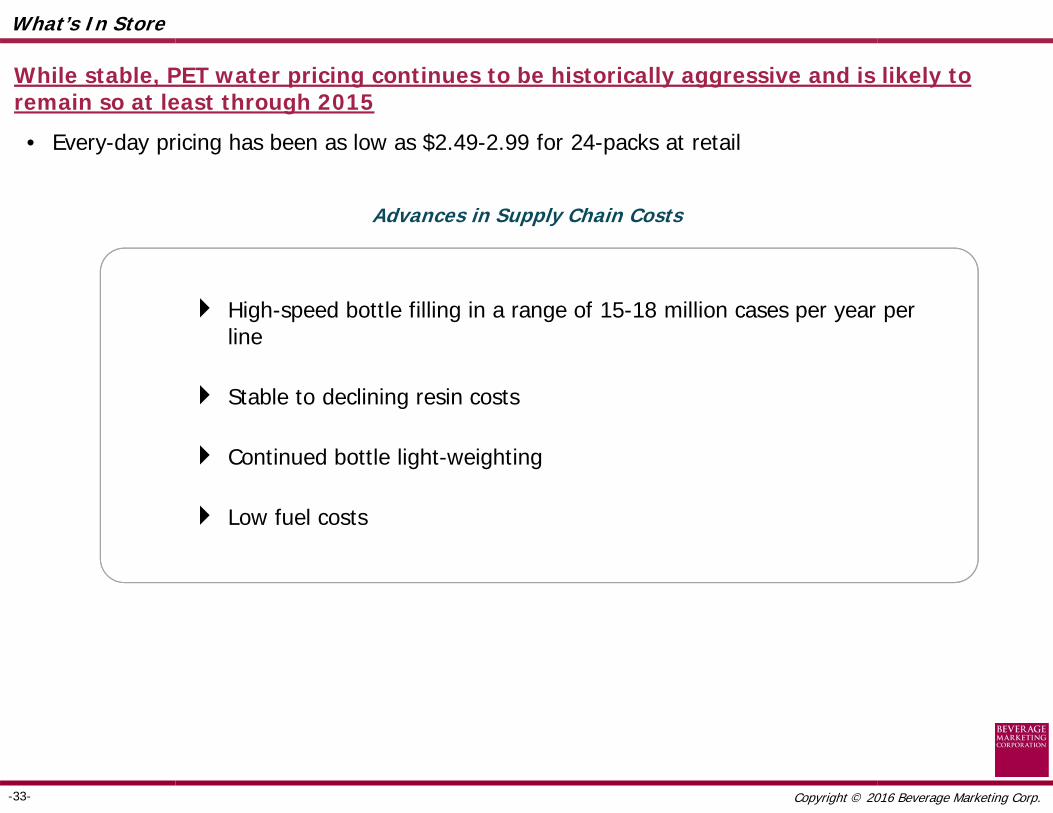
Advances in Supply Chain Costs
What’s In Store
High-speed bottle filling in a range of 15-18 million cases per year per line
Stable to declining resin costs
Continued bottle light-weighting
Low fuel costs
While stable, PET water pricing continues to be historically aggressive and is likely to remain so at least through 2015
• Every-day pricing has been as low as $2.49-2.99 for 24-packs at retail

-34- Copyright © 2016 Beverage Marketing Corp.
U.S. Retail PET Water MarketBranded vs. Private Label
2010
Private Label28.4%
Branded71.6%
Branded53.4%
Private Label46.6%
What’s In Store
While branded water outsells private label in the retail PET segment, private label has made significant inroads over the last five years
2015P
P: PreliminarySource: Beverage Marketing Corporation

-35- Copyright © 2016 Beverage Marketing Corp.
Enhanced Waters
PH Balanced Water Plant WaterEssence Water
Essentia Trader Joe’sHint
Cap-Activated Water
Activate
What’s In Store
Similar to craft soda, from a small base, enhanced waters of all types are now proliferating and gaining traction in all parts of the country
• These premium value, craft type waters are adding additional benefits to consumers’ water experience

-36- Copyright © 2016 Beverage Marketing Corp.
0
2,000
4,000
6,000
8,000
10,000
12,000
14,000
16,000
2009 2010 2011 2012 2013 2014 2015P 2016P 2017P 2018P 2019P
Projected Water & CSD GrowthMillions of Gallons
2009 – 2019P
Premium Retail PET Waters
Bulk, HOD, Vended, Sparkling, Imported Waters
Flavored WaterEnhanced Water
CSDs: -1.1% CAGR
CSDs
What’s In Store
The timeline for bottled water to become the #1 beverage category continues to contract, with late 2016 or early 2017 becoming a target date
• With today’s updated projections, bottled water (including flavored and enhanced water) could capture the top spot by 2016
• The timeline for plain water to capture the top spot could happen by 2016 year-end

-37- Copyright © 2016 Beverage Marketing Corp.
* Includes Milk, does not include Beer kegs Source: Beverage Marketing Corporation
100% = 240.2 249.0
41.8% 40.4%
34.6% 38.3%
15.2% 14.3%
6.0% 5.0%1.3% 1.1%1.1% 0.9%
2009 2014
Plastic
Pouches
Cans
Glass
Paper
Aseptic
Beverage Packaging Share by Package Type*Billions of Packaging Units
What’s In Store
Cans, plastic and glass comprise more than 90% of the beverage packaging universe
• Over the last five years, plastic has seen the most growth due mostly to the success of the bottled water category
Beverage Package TypesGrowth
2009 – 2014
TOTAL 0.7%
2009-2014
Type CAGR(%)
Aseptic -2.8%
Pouches -2.5%
Paper -2.8%
Glass -0.5%
Plastic 3.9%
Cans -1.1%

-38- Copyright © 2016 Beverage Marketing Corp.
What’s In Store
Packaging innovation has gained in importance as the marketplace has gotten more crowded as a means to distinguish both categories and brands
-39- Copyright © 2016 Beverage Marketing Corp.
What’s In Store
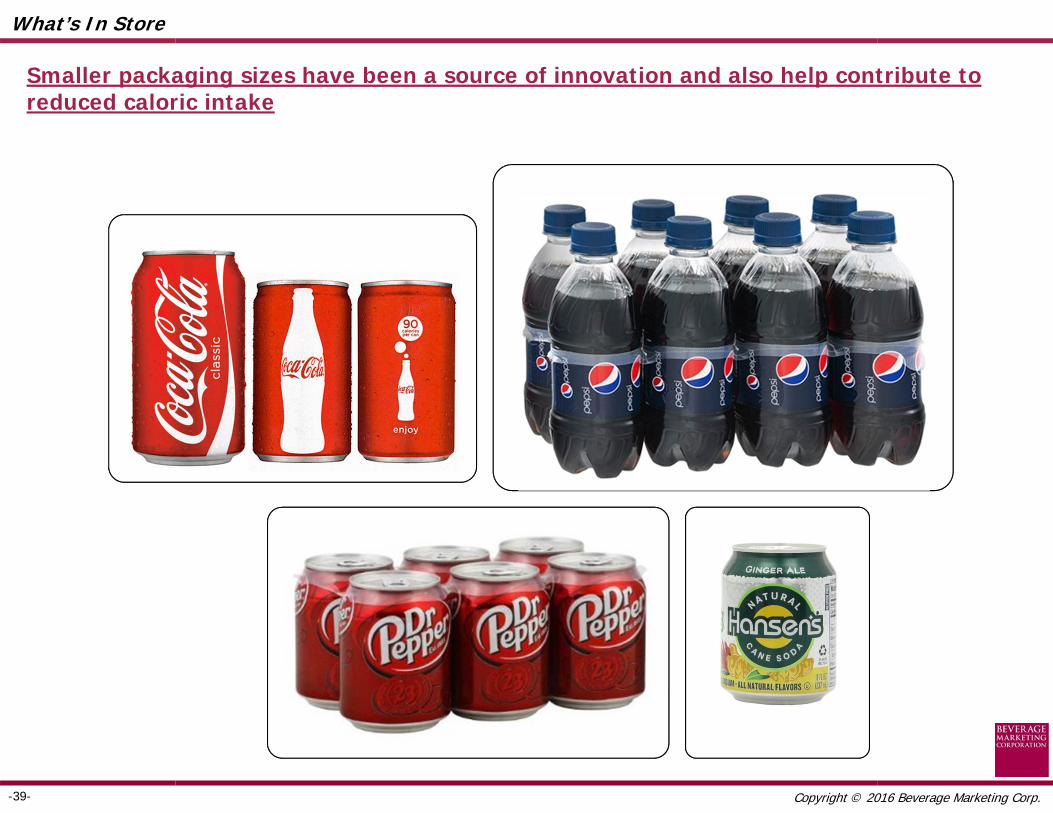
Smaller packaging sizes have been a source of innovation and also help contribute to reduced caloric intake

-40- Copyright © 2016 Beverage Marketing Corp.
What’s In Store
In the future, the marketplace will be characterized by numerous high-value, low relative volume opportunities
Projected Value
High Growth
Energy
Enhanced Fruit
Drinks
Enhanced Water
SS Dairy Drinks
RTD Coffee
Low Growth
$500M
20%
10%
0%
-5%
Bulk/HOD Water
Milk
Soy
(2009-2014 CAGR)
Coconut Water
Hard Cider
AlcPouches
Tequila
Sparkling Wine
Table Wine
Imp. Beer
MalternativesCraft Beer
Enhanced RTD Teas
Straight Whiskey Vodka
SPFJ
100% Juice
Fruit DrinksFlavored
Water
$250M
Almond Milk
$1B
Diet CSDs
Reg CSDs
$35B $50B$25B$10B$5B
Prem CSDs
Sports Drinks
RTD Teas
PET Water
Organic
Juices

-41- Copyright © 2016 Beverage Marketing Corp.
P: Projected Source: Beverage Marketing Corporation
What’s In Store
2016 Liquid Refreshment Beverage Projections
LRB Category 2016(P)
RTD Coffee +12.0% to +13.0%
Energy Drinks +7.0% to +8.0%
Bottled Water +5.5% to +6.5%
RTD Tea +5.0% to +6.0%
Value Added Water +4.0% to +5.0%
Sports Drinks +3.0% to +4.0%
Carbonated Soft Drinks -0.7% to -1.2%
Fruit Beverages -1.0% to -2.0%
TOTAL LRBs +1.9% to +2.3%
Among refreshment beverages, the strongest growth is projected for bottled water, energy drinks and RTD teas and coffees
• CSDs, milk and fruit beverages will need to innovate and provide healthier options to rekindle growth

Thank You
• Strategic Associates
• Research
• Advisors
Beverage Marketing Corporation
Related Documents