In Collaboration with the Netherlands Institute for Sea Research P URNAll OF ELSEVIER Journal of Sea Research 37 (1997) 131-144 Coral colony tissue damage in six species of reef-building corals: partial mortality in relation with depth and surface area Erik H. Meesters a,b,*, Ineke Wesseling a, Rolf P.M. Bak arc ’Institute of Systematics and Population Biology, PO. Box 94766, University of Amsterdam, 1090 CT, Amsterdam, The Netherlands b Carmabi Institute, Piscadera Bay, CuraEao, Netherlands Antilles ’Netherlands Institute for Sea Research (NIOZ), PO. Box 59, 1790 AB, Den Burg, The Netherlands Received 21 March 1996; revised version received 26 July 1996; accepted 22 November 1996 Abstract Partial mortality and its relation with colony size was assessed in colonies of 6 species of reef-building corals (Scleractinia) at three sites in 2 depth zones, reef terrace (7 m) and fore-reef slope (18 m), on the fringing reefs of Curacao, Netherlands Antilles. Partial mortality is manifest on coral colonies as tissue lesions which have not been closed by the surrounding tissue. Two types of lesions were distinguished: (1) Type I lesions, completely enclosed by living tissue, and (2) Type II lesions, not completely surrounded by tissue and open to the edge of the colony. These lesion types differed in occurrence and lesion size-frequency distributions, as well as in relation to variation in colony surface area and morphology. The percentage of undamaged colonies decreased with increasing colony size and lesion number increased logarith- mically with colony surface area. Larger colonies have little chance to escape partial mortality. The abundance of Type I lesions was significantly less on the reef slope, while the number of Type II lesions was greater. This is probably caused by a relative increase of the colony circumference because colony height is reduced on the reef slope. Median lesion sizes ranged from 0.5 to 3 cm2 for Type I lesions and from 2 to 60 cm2 for Type II lesions. Type II lesions covered a much larger colony area than Type I lesions, suggesting that bottom-associated causes are relatively important with respect to partial mortality. Species and colonies with large circumference relative to total colony surface area, such as plate-like and small colonies, were particularly susceptible to partial mortality by Type II lesions. Whole-colony mortality rate of small juvenile corals was very high, but dropped abruptly with increasing size, probably at the time that growth direction changes from horizontal to vertical. This ‘escape in height’ makes corals less susceptible to partial mortality and represents an important life history characteristic. There were important differences between the species. These are explained, after correcting for variation in colony size (surface area), by differences in colony morphology and lesion regeneration potential. Keywords: coral reef; Scleractinia; partial mortality; damage; regeneration; ecology; colony size; clonal strategy; modular- ity; morphology 1. Introduction Modular organisms, such as corals, ascidians and bryozoans, abound on reefs, with stony corals (Scle- * Second address is mailing address. ractinia) as the key modular organisms. These organ- isms can survive death of modules, a phenomenon known as partial mortality (Hughes and Jackson, 1985). Through partial mortality, the physical and the genetic individual often become dissociated (Bak and Luckhurst, 1980; Hughes and Jackson, 1985). 1385-1101/97/$17.00 0 1997 Elsevier Science B.V. All rights reserved. PII Sl385-1101(96)00004-4

Welcome message from author
This document is posted to help you gain knowledge. Please leave a comment to let me know what you think about it! Share it to your friends and learn new things together.
Transcript
In Collaboration with the Netherlands Institute for Sea Research
P URNAll OF
ELSEVIER Journal of Sea Research 37 (1997) 131-144
Coral colony tissue damage in six species of reef-building corals: partial mortality in relation with depth and surface area
Erik H. Meesters a,b,*, Ineke Wesseling a, Rolf P.M. Bak arc
’ Institute of Systematics and Population Biology, PO. Box 94766, University of Amsterdam, 1090 CT, Amsterdam, The Netherlands b Carmabi Institute, Piscadera Bay, CuraEao, Netherlands Antilles
’ Netherlands Institute for Sea Research (NIOZ), PO. Box 59, 1790 AB, Den Burg, The Netherlands
Received 21 March 1996; revised version received 26 July 1996; accepted 22 November 1996
Abstract
Partial mortality and its relation with colony size was assessed in colonies of 6 species of reef-building corals (Scleractinia) at three sites in 2 depth zones, reef terrace (7 m) and fore-reef slope (18 m), on the fringing reefs of Curacao, Netherlands Antilles. Partial mortality is manifest on coral colonies as tissue lesions which have not been closed by the surrounding tissue. Two types of lesions were distinguished: (1) Type I lesions, completely enclosed by living tissue, and (2) Type II lesions, not completely surrounded by tissue and open to the edge of the colony. These lesion types differed in occurrence and lesion size-frequency distributions, as well as in relation to variation in colony surface area and morphology.
The percentage of undamaged colonies decreased with increasing colony size and lesion number increased logarith- mically with colony surface area. Larger colonies have little chance to escape partial mortality. The abundance of Type I lesions was significantly less on the reef slope, while the number of Type II lesions was greater. This is probably caused by a relative increase of the colony circumference because colony height is reduced on the reef slope. Median lesion sizes ranged from 0.5 to 3 cm2 for Type I lesions and from 2 to 60 cm2 for Type II lesions.
Type II lesions covered a much larger colony area than Type I lesions, suggesting that bottom-associated causes are relatively important with respect to partial mortality. Species and colonies with large circumference relative to total colony surface area, such as plate-like and small colonies, were particularly susceptible to partial mortality by Type II lesions. Whole-colony mortality rate of small juvenile corals was very high, but dropped abruptly with increasing size, probably at the time that growth direction changes from horizontal to vertical. This ‘escape in height’ makes corals less susceptible to partial mortality and represents an important life history characteristic.
There were important differences between the species. These are explained, after correcting for variation in colony size (surface area), by differences in colony morphology and lesion regeneration potential.
Keywords: coral reef; Scleractinia; partial mortality; damage; regeneration; ecology; colony size; clonal strategy; modular- ity; morphology
1. Introduction
Modular organisms, such as corals, ascidians and bryozoans, abound on reefs, with stony corals (Scle-
* Second address is mailing address.
ractinia) as the key modular organisms. These organ- isms can survive death of modules, a phenomenon known as partial mortality (Hughes and Jackson, 1985). Through partial mortality, the physical and the genetic individual often become dissociated (Bak and Luckhurst, 1980; Hughes and Jackson, 1985).
1385-1101/97/$17.00 0 1997 Elsevier Science B.V. All rights reserved. PII Sl385-1101(96)00004-4
132 E.H. Meesters et al./Joumal of Sea Research 37 (1997) 131-144
Consequently, the process has a major influence on coral demography, appearing even to promote asexual propagation in some species (Hughes and Jackson, 1985). Demographic studies of corals have shown that partial mortality, in terms of loss of living tissue, is more important than whole colony death (e.g., Hughes, 1984). However, mortality in corals has mostly been studied in terms of loss of coral cover or colony numbers.
Partial mortality in corals is manifest as lesions, areas of the colony where the living surface has died or been removed. Lesions are caused by diseases (e.g., the black band and white band diseases, Glad- felter, 1982; Peters, 1984), prolonged coral bleaching (Meesters and Bak, 1993), sedimentation (Rogers, 1990), grazing (Bak and Van Eys, 1975; Brugge- mann et al., 1994), substratum collapse (Bak and Luckhurst, 1980) etc. While experimental lesions in modular organisms have been studied (e.g., for re- generation rates; Bak, 1983), it is surprising that, apart from two exceptions (Bythell et al., 1993; Meesters et al., 1996), there is hardly any quantita- tive data on occurrence and characteristics of natural lesions.
Coral species differ in morphology, size, depth distribution, regeneration capacity, recruitment, at- tractiveness to predators, and susceptibility to disease and environmental stress. This variation suggests interspecific and environment-related differences in vulnerability that should be evident by differences in lesion characteristics. Important questions are raised: Do species vary in the amount of partial mortal- ity? Are there different types of partial mortality? What is the size-frequency distribution of lesions? Is partial mortality related to size or shape of coral colonies? These questions are urgent in view of the global degradation of reefs (Ginsburg and Glynn, 1994) and the implications for coral survival and reef management.
In this report we describe characteristics of nat- urally occurring lesions on colonies of 6 massive coral species in two depth zones, i.e., the reef ter- race and the seaward reef slope. The objective was to determine whether lesion characteristics differed between species and depths, and to what degree this variation could be explained by colony surface area using analysis of covariance.
2. Methods
2.1. Species, locations, and techniques
The research was carried out on the fringing reefs of Curacao, Netherlands Antilles. The reefs are char- acterized by a terrace that gently slopes to a depth of about 10 m, after which the reef steepens down to ap- proximately 60 m (Bak, 1977). Coral colonies were surveyed on the terrace at 7 m (6.5 to 7.5 m) and on the slope at 18 m (17 to 19 m) at three sites. The sites were located in front of the Avila hotel, at Carmabi Buoy 2, and in front of Seaquarium. At each site colonies were surveyed in 2 or 4 m wide transects, depending on density of coral colonies. Transects were along isobaths, parallel to the shore. We studied the main reef-building species, notably, Montastrea annularis Columnar morphotype (Ellis and Solander, 1786), M. annularis Massive morph (Ellis and Solan- der, 1786), M. cavernosa (Linnaeus, 1767), Meand- rina meandrites (Linnaeus, 1758), Porites astreoides (Lamarck, 1816), and Siderastrea siderea (Ellis and Solander, 1786). There is uncertainty about the sta- tus of the 2 morphotypes of Montastrea annularis (Knowlton et al., 1992; Van Veghel and Bak, 1993) and we will simply distinguish them.
To assess species specific characteristics of par- tial mortality we measured for each species the total colony surface area and lesion characteristics of the first 30 to 70 colonies encountered, depending on colony densities in the transects. Total numbers of colonies surveyed at 7 and 18 m depth were: Mon- tastrea annularis C. 174, 132; M. annularis M.142, 106; M. cavernosa 143, 153; Meandrina meandrites 161, 161; Porites astreoides 163, 202; Siderastrea siderea 154, 154.
2.2. Variables
2.2.1. Colony size A colony was defined as any autonomous coral
skeleton with living tissue. A colony divided by par- tial mortality into separate patches of living tissue, but morphologically still one entity, was considered one colony. Of each colony we measured height, length, and width. Colony diameter was estimated by taking the square root of the product of the maximal length and perpendicular width. The species in this
E.H. Meesters et al./Joumal of Sea Research 37 (1997) 131-144 133
study form massive colonies that approach a hemi- spherical or circular shape, The total surface area of each colony was estimated by regarding the colony as a geometric shape (i.e., a circle or a hemisphere) and applying the appropriate geometrical formula. The error of the surface area estimate did generally not exceed 20%. In colonies of Montustrea annu- his Columnar, a species that can have more than 100 columns per colony, we examined one randomly chosen column per colony. Because only the upper part of each column is covered by living tissue, the total surface area in this species refers only to this part of the colony.
2.2.2. Lesion type Meesters et al. (1996) showed that, on the basis of
fundamental differences, two types of lesions should be distinguished. They proposed that the very differ- ent characteristics of the two types can be explained by a theory of Jackson (1979), who hypothesized that colony morphology may affect species vulner- ability to bottom-associated processes. Lesion types are:
(a) Type I lesions: lesions fully encircled by living tissue, generally on top of colonies, often the result of pecks of grazing and the bites of territorial fishes (e.g., Chaetodontidae and Scaridae),
(b) Type II lesions: lesions only partly surrounded by living tissue, in contact with the periphery of the colony. These are lesions at the border of the colony, indentations from the side into the living colony surface, which can cover enormous dead areas and can extend from the side over the top of the colony. Common agents involved are interspecific competi- tion, urchin grazing and sand/rubble abrasion.
The two lesion types can be thought of as ‘top lesions’ and ‘side lesions’, respectively. However, this is a simplification and source for confusion because side lesions are often so large that they include large areas on top of colonies. Consequently, we prefer to use the terms Type I and Type II lesion (Meesters et al., 1996).
2.2.3. Lesion size Lesions were assigned to one of six size classes:
-0.1-l cm*, 1-4, 4-16, 16-49, 49-100, and >lOO cm*. Lesions larger than 100 cm* were measured to the nearest 50 cm*. For calculations of the total
lesion area the geometric mean of the limits of each size class was taken for lesions in the first 5 size classes. For lesions > 100 cm* we used the log of the actual size.
2.3. Statistics
Sites are sample units sensu Hurlbert (1984). We calculated the mean of each dependent variable (e.g., lesion number, lesion size) for each site based on 30 to 70 colonies per species. Standard errors of means (SE) were calculated from the error mean square of the analyses.
2.3.1. Cluster analysis Species lesion size-frequency distributions were
compared by cluster analysis. Mean percentage data were standardized within lesion size classes to pre- vent higher values having a disproportionately high influence (Gower, 1985). The standardized data ma- trix was analyzed by a hierarchical cluster analysis that calculated the similarity (Euclidean distance) between any two distributions and used complete linkage as amalgamation method.
2.3.2. Analysis of covariance To assess the influence of colony surface area
we compared species and depths with a multi-factor analysis of covariance (ANCOVA) with colony sur- face area as covariable. This analysis determines the relationship between colony size and the dependent variable (i.e., percentage of undamaged colonies, le- sion number, lesion size), and, under the assumption that this relationship is the same for all species, an adjusted value of the dependent variable is calculated for the average colony size. Comparisons can then be made while variation due to differences in colony size is excluded. The ANCOVA was only carried out if the assumption of an identical relationship between the dependent variable and colony surface area (homogeneity of slopes) was satisfied. Other assumptions (e.g., normally distributed errors) were checked graphically. Multiple pairwise comparisons were made using the T-method (Sokal and Rohlf, 1981). All analyses were done using the program Systat (Wilkinson, 1989).
134 E.H. Meesters et al./Joumal of Sea Research 37 (1997) 131-144
MaC IF135
ii 6Ot ,
0 <I -4 -16 -49 -IL%3 >I00
100
80 #
& 6o g 40
MaC n=127
Terrace
51 -4 -16 49 -100 >100
i
MaM n=3 10
t
id s-1 -4 -16 49 -100 >I00
8 3
EL( Mm n=78
51 4 -16 49-1CJ.J >100 51 4 -16 49 -100 >I00
100 Mm 80 n=99
u & 60
g 40 20
0 L SI -4 -16 49 -100 >IW
Pa n=136
!L Sl 4 -16 49 -100 >loO
Lesion size class (cm2)
A
MC n=223 L
zG1 4 -16 49 -100 >IW
MC n=180
Ll 51 4 -16 49 -IM >lOO
SS n=798
L- il -4 -16 49 -1M) >I00
SS n=212
L 51 4 -16 49 -100 >lOO
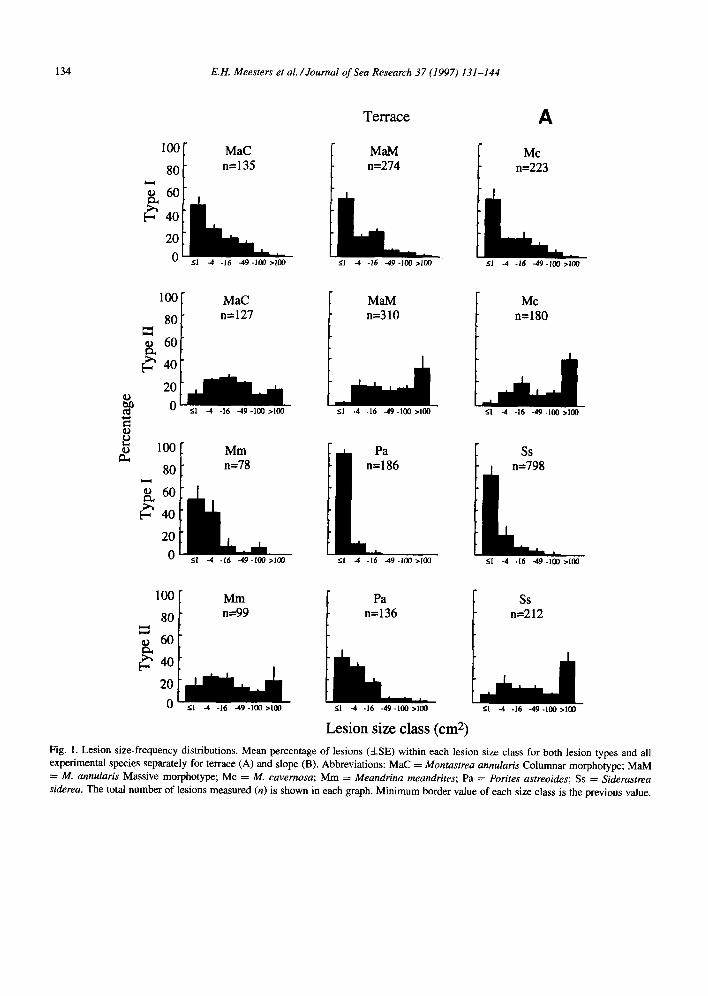
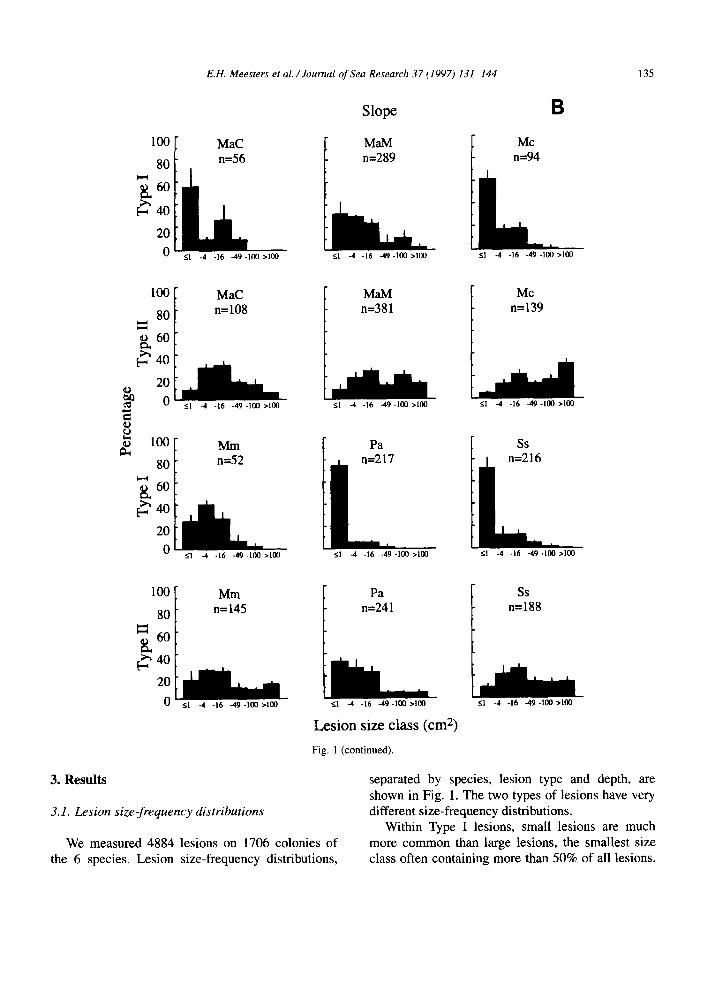
Fig. 1. Lesion size-frequency distributions. Mean percentage of lesions (GE) within each lesion size class for both lesion types and all experimental species separately for terrace (A) and slope (B). Abbreviations: MaC = Montastrea annularis Columnar morphotype; MaM = M. annularis Massive morphotype; MC = M. cavemosa; Mm = Meandrina meandrites; Pa = Porites astreoides; Ss = Siderastrea siderea. The total number of lesions measured (n) is shown in each graph. Minimum border value of each size class is the previous value.
E.H. Meesters et al. /Journal of Sea Research 37 (1997) 131-144 135
Slope
100
f
MaC
80 I n=56
‘k 60
E3x 40
20
0 51 -4 -16 -49 -l&l >lNl
MaC n=lOS
‘j, 60
I? 40
$
20
0 -49 -100 >lOO
%
61 -4 -16
8 z 100 PC
80 n=52
t Mm
100 Mm
80 n=145
; 60 1
f
MaM n=289 F MC
n=94
Sl -4 -16 -49-100 .I00 51 -4 -16 -49 -100 >I00
MaM n=381
51 -4 -16 -49 -100 >lW
Pa n=217 IL_
51 -4 -16 -49 -100 >lCIl
Pa n=24 1
MC n=139
La 51 -4 -16 49 -100 >lM)
ss n=216 IL_
51 -4 -16 49 -100 >loO
/
ss n=188
51 4 -16 49 -100 >lOO il -4 -16 -49 -100 >I00 <I -4 -16 49 -100 >I00
3. Results
3. I. Lesion size-frequency distributions
Lesion size class (cm2)
Fig. 1 (continued).
separated by species, lesion type and depth, are shown in Fig. 1. The two types of lesions have very different size-frequency distributions.
Within Type I lesions, small lesions are much We measured 4884 lesions on 1706 colonies of
the 6 species. Lesion size-frequency distributions, more common than large lesions, the smallest size class often containing more than 50% of all lesions.
136 E.H. Meesters et al. /Joumal of Sea Research 37 (1997) 131-144
The lesion size-frequency distributions of Type II lesions are much more evenly spread over the size classes but sometimes, completely contrary to the Type I lesions, the distribution of Type II lesions is dominated by the largest size class. This is the case in Montastrea annular-is Massive and Siderastrea siderea on the terrace, and A4. cavemosa in both zones (Fig. 1). In some species the total number of lesions is very low (e.g., Meandrina meandrites), while other species were characterized by very high numbers (e.g., it4. annularis Massive and S. siderea).
3.2. Similarity of lesion size-frequency distributions
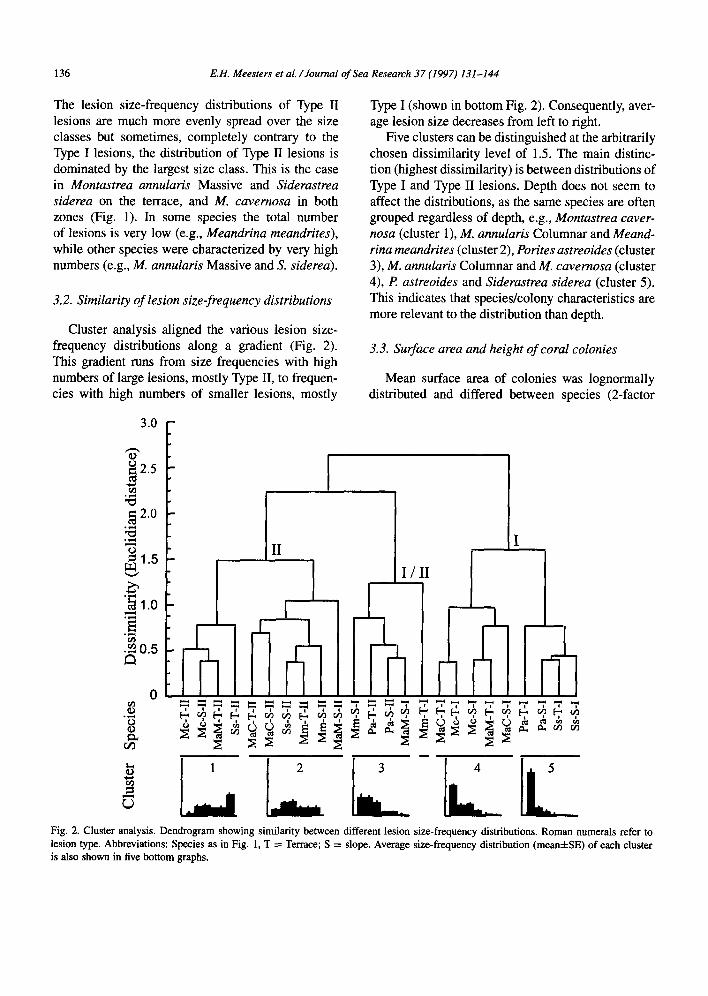
Cluster analysis aligned the various lesion size- frequency distributions along a gradient (Fig. 2). This gradient runs from size frequencies with high numbers of large lesions, mostly Type II, to frequen- cies with high numbers of smaller lesions, mostly
Type I (shown in bottom Fig. 2). Consequently, aver- age lesion size decreases from left to right.
Five clusters can be distinguished at the arbitrarily chosen dissimilarity level of 1.5. The main distinc- tion (highest dissimilarity) is between distributions of Type I and Type II lesions. Depth does not seem to affect the distributions, as the same species are often grouped regardless of depth, e.g., Montastrea caver- nosa (cluster l), M. annularis Columnar and Meand- rina meandrites (cluster 2), Porites astreoides (cluster 3), M. annularis Columnar and M. cavemosa (cluster 4), P. astreoides and Siderastrea siderea (cluster 5). This indicates that species/colony characteristics are more relevant to the distribution than depth.
3.3. Surface area and height of coral colonies
Mean surface area of colonies was lognormally distributed and differed between species (Zfactor
Fig. 2. Cluster analysis. Dendrogram showing similarity between different lesion size-frequency distributions. Roman numerals refer to lesion type. Abbreviations: Species as in Fig. 1, T = Terrace; S = slope. Average size-frequency distribution (mean&SE) of each cluster is also shown in five bottom graphs.
E.H. Meesters et al. /Journal of Sea Research 37 (1997) 131-144 137
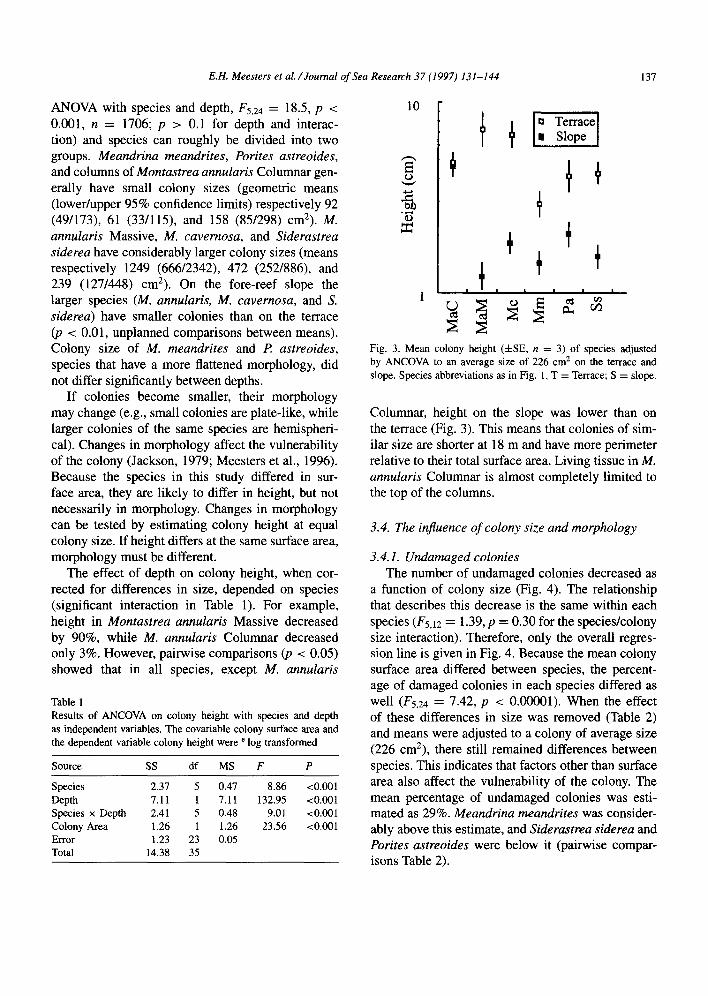
ANOVA with species and depth, F5,24 = 18.5, p < 0.001, n = 1706; p > 0.1 for depth and interac- tion) and species can roughly be divided into two groups. Meandrina meandrites, Porites astreoides, and columns of Montastrea annularis Columnar gen- erally have small colony sizes (geometric means (lower/upper 95% confidence limits) respectively 92 (49/173), 61 (33/115), and 158 (85/298) cm2). M. annularis Massive, M. cavernosa, and Siderastrea siderea have considerably larger colony sizes (means respectively 1249 (666/2342), 472 (252/886), and 239 (127/448) cm2). On the fore-reef slope the larger species (M. annularis, M. cavernosa, and S. siderea) have smaller colonies than on the terrace @ < 0.01, unplanned comparisons between means). Colony size of M. meandrites and I? astreoides, species that have a more flattened morphology, did not differ significantly between depths.
If colonies become smaller, their morphology may change (e.g., small colonies are plate-like, while larger colonies of the same species are hemispheri- cal). Changes in morphology affect the vulnerability of the colony (Jackson, 1979; Meesters et al., 1996). Because the species in this study differed in sur- face area, they are likely to differ in height, but not necessarily in morphology. Changes in morphology can be tested by estimating colony height at equal colony size. If height differs at the same surface area, morphology must be different.
The effect of depth on colony height, when cor- rected for differences in size, depended on species (significant interaction in Table 1). For example, height in Montastrea annularis Massive decreased by 90%, while M. annularis Columnar decreased only 3%. However, pairwise comparisons (p < 0.05) showed that in all species, except M. annularis
Table 1 Results of ANCOVA on colony height with species and depth as independent variables. The covariable colony surface area and the dependent variable colony height were e log transfotmed
Source SS df MS F P
Species 2.31 5 0.47 8.86 to.001 Depth 7.11 1 7.11 132.95 <O.ool Species x Depth 2.41 5 0.48 9.01 <0.001 Colony Area 1.26 1 1.26 23.56 to.001 Error 1.23 23 0.05 Total 14.38 35
Fig. 3. Mean colony height (&SE, n = 3) of species adjusted by ANCOVA to an average size of 226 cm* on the terrace and slope. Species abbreviations as in Fig. 1, T = Terrace; S = slope.
Columnar, height on the slope was lower than on the terrace (Fig. 3). This means that colonies of sim- ilar size are shorter at 18 m and have more perimeter relative to their total surface area. Living tissue in M. annularis Columnar is almost completely limited to the top of the columns.
3.4. The injbence of colony size and morphology
3.4.1. Undamaged colonies The number of undamaged colonies decreased as
a function of colony size (Fig. 4). The relationship that describes this decrease is the same within each species (F~,J = 1.39, p = 0.30 for the species/colony size interaction). Therefore, only the overall regres- sion line is given in Fig. 4. Because the mean colony surface area differed between species, the percent- age of damaged colonies in each species differed as well (F5,24 = 7.42, p < 0.00001). When the effect of these differences in size was removed (Table 2) and means were adjusted to a colony of average size (226 cm2), there still remained differences between species. This indicates that factors other than surface area also affect the vulnerability of the colony. The mean percentage of undamaged colonies was esti- mated as 29%. Meandrina meandrites was consider- ably above this estimate, and Siderastrea siderea and Porites astreoides were below it (pairwise compar- isons Table 2).
138 E.H. Meesters et al./Joumal of Sea Research 37 (1997) 131-144
Fig. size
4 5 6 7 8 Ln(Colony area)
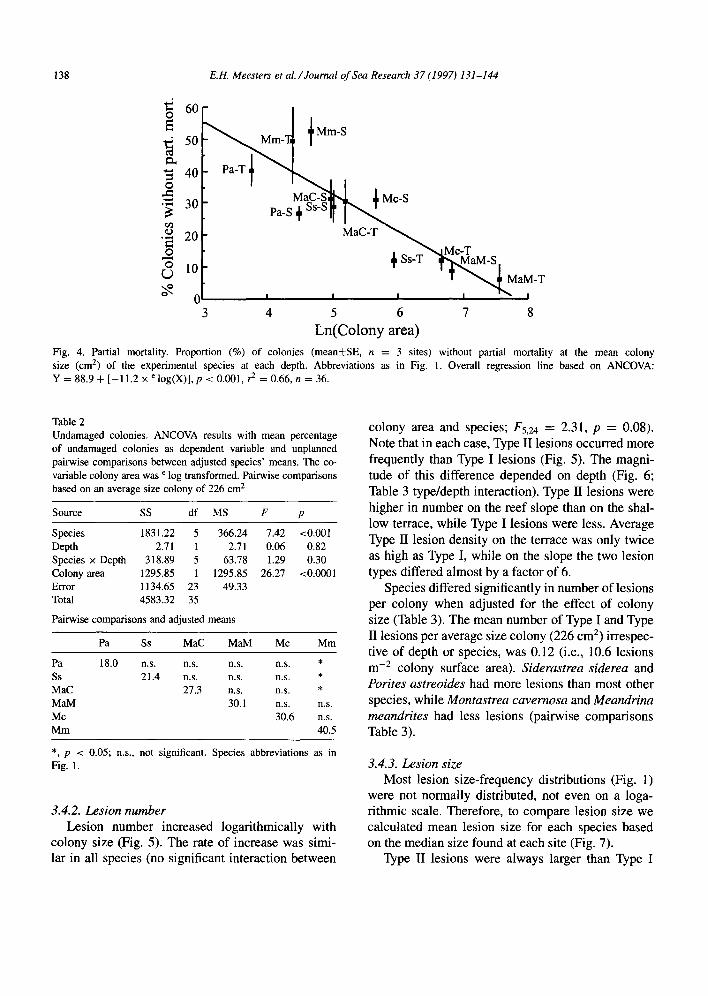
4. Partial mortality. Proportion (%) of colonies (mean&SE, n = 3 sites) without partial mortality at the mean colony (cm’) of the experimental species at each depth. Abbreviations as in Fig. 1. Overall regression line based on ANCOVA:
Y = 88.9 + [-11.2 x’ log(X)], p 2 0.001, ? = 0.66,n = 36.
Table 2 Undamaged colonies. ANCOVA results with mean percentage of undamaged colonies as dependent variable and unplanned pairwise comparisons between adjusted species’ means. The co- variable colony area was e log transformed. Pairwise comparisons based on an average size colony of 226 cm2
Source ss df MS F P
Species 1831.22 5 366.24 7.42 <O.OOl Depth 2.71 1 2.71 0.06 0.82 Species x Depth 318.89 5 63.78 1.29 0.30 Colony area 1295.85 1 1295.85 26.27 t0.0001 Error 1134.65 23 49.33 Total 4583.32 35
Pairwise comparisons and adjusted means
Pa ss MaC Mah4 MC Mm
Pa ss MaC MaM MC Mm
18.0 n.s. n.s. n.s. n.s. * 21.4 n.s. n.s. n.s. *
27.3 ns. n.s. * 30.1 n.s. n.s.
30.6 n.s. 40.5
*, p < 0.05; n.s., not significant. Species abbreviations as in Fig. 1.
3.4.2. Lesion number Lesion number increased logarithmically with
colony size (Fig. 5). The rate of increase was simi- lar in all species (no significant interaction between
colony area and species; F5,z4 = 2.31, p = 0.08). Note that in each case, Type II lesions occurred more frequently than Type I lesions (Fig. 5). The magni- tude of this difference depended on depth (Fig. 6; Table 3 type/depth interaction). Type II lesions were higher in number on the reef slope than on the shal- low terrace, while Type I lesions were less. Average Type II lesion density on the terrace was only twice as high as Type I, while on the slope the two lesion types differed almost by a factor of 6.
Species differed significantly in number of lesions per colony when adjusted for the effect of colony size (Table 3). The mean number of Type I and Type II lesions per average size colony (226 cm*) irrespec- tive of depth or species, was 0.12 (i.e., 10.6 lesions m-* colony surface area). Siderastrea siderea and Porites astreoides had more lesions than most other species, while Montastrea cavemosa and Meandrina meandrites had less lesions (pair-wise comparisons Table 3).
3.4.3. Lesion size Most lesion size-frequency distributions (Fig. 1)
were not normally distributed, not even on a loga- rithmic scale. Therefore, to compare lesion size we calculated mean lesion size for each species based on the median size found at each site (Fig. 7).
Type II lesions were always larger than Type I
E.H. Meesters et al. /Joumal of Sea Research 37 (1997) 131-144 139
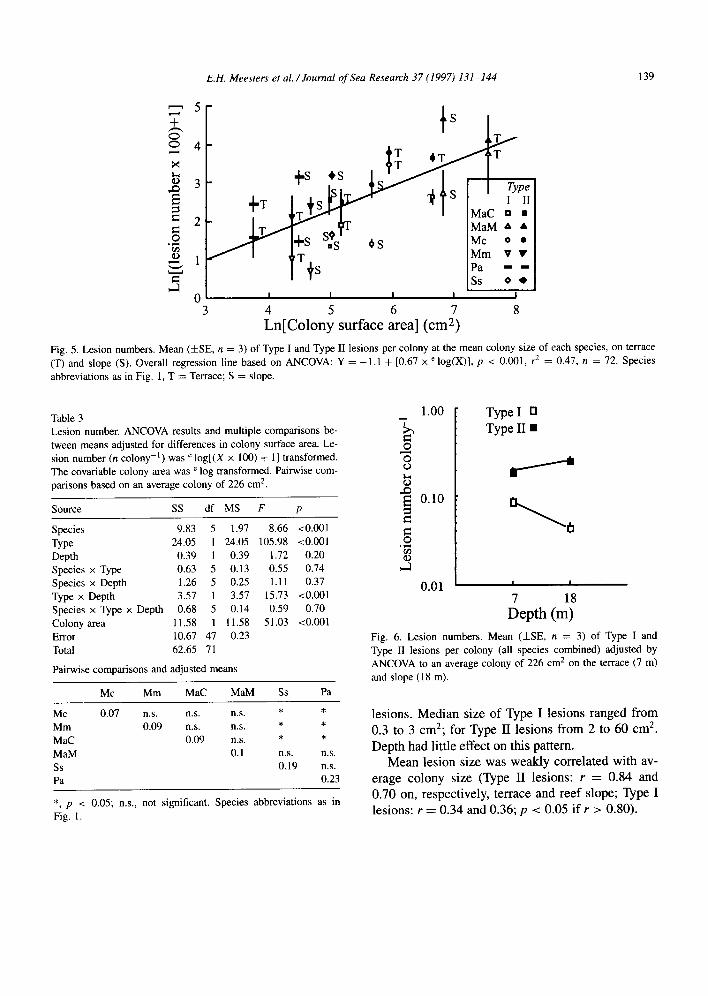
MaM A A MC 0. Mm VI Pa -- ss o*
I I I I 1 I
3 6 in[Colon~ surface area] (cn$)
8
Fig. 5. Lesion numbers, Mean (HE, n = 3) of Type I and Type II lesions per colony at the mean colony size of each species, on terrace (T) and slooe (S). Overall regression line based on ANCOVA: Y = -1 .l + [0.67 x ’ log(X)], p < 0.001, rz = 0.47, n = 72. Species abbreviations as in Fig. 1, T = Terrace; S = slope.
Table 3 Lesion number, ANCOVA results and multiple comparisons be- tween means adjusted for differences in colony surface area. Le- sion number (n colony-t) was e log[(X x 100) + l] transformed. The covariable colony area was e log transformed. Pairwise com- parisons based on an average colony of 226 cm*.
Source SS df MS F P
Species 9.83 5 1.97 8.66 <O.OOl Type 24.05 1 24.05 105.98 <O.OOl Depth 0.39 1 0.39 1.72 0.20 Species x Type 0.63 5 0.13 0.55 0.74 Species x Depth 1.26 5 0.25 1.11 0.37 Type x Depth 3.57 1 3.57 15.73 to.001 Species x Type x Depth 0.68 5 0.14 0.59 0.70 Colony area 11.58 1 11.58 51.03 <O.OOl Error 10.67 47 0.23 Total 62.65 71
Pairwise comparisons and adjusted means
MC Mm MaC MaM Ss Pa
MC 0.07 n.s. n.s. ns. * *
Mm 0.09 n.s. n.s. * *
MaC 0.09 ns. * *
MaM 0.1 ::;9
n.s. ss ns. Pa 0.23
*, p < 0.05; n.s., not significant. Species abbreviations as in Fig. 1.
Fig. 6. Lesion numbers. Mean (GE, n = 3) of Type I and Type II lesions per colony (all species combined) adjusted by ANCOVA to an average colony of 226 cm* on the terrace (7 m) and slope (18 m).
lesions. Median size of Type I lesions ranged from 0.3 to 3 cm*; for Type II lesions from 2 to 60 cm*. Depth had little effect on this pattern.
Mean lesion size was weakly correlated with av- erage colony size (Type II lesions: r = 0.84 and 0.70 on, respectively, terrace and reef slope; Type I lesions: r = 0.34 and 0.36; p -C 0.05 if r > 0.80).
140 E.H. Meesters et al. /Journal of Sea Research 37 (1997) 131-144
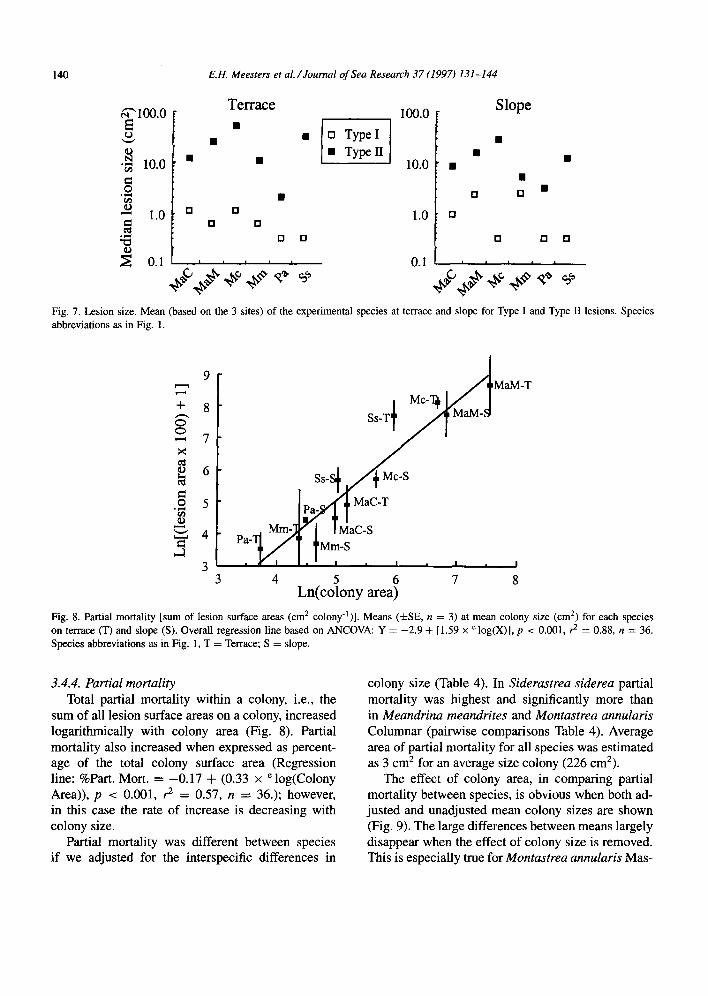
Terrace r
t ??
?? ??
?? ??
Slope
Fig. 7. Lesion size. Mean (based on the 3 sites) of the experimental species at terrace and slope for Type I and Type II lesions. Species abbreviations as in Fig. 1.
9 - lMaM-T
Pa-
3 3 4
Ln(cofiony area! 7 8
Fig. 8. Partial mortality [sum of lesion surface areas (cm* colony-‘)]. Means (&SE, n = 3) at mean colony size (cm*) for each species on terrace (T) and slope (S). Overall regression line based on ANCOVA: Y = -2.9 + [1.59 x e log(X)], p -c 0.001, ? = 0.88, n = 36. Species abbreviations as in Fig. 1, T = Terrace; S = slope.
3.4.4. Partial mortality Total partial mortality within a colony, i.e., the
sum of all lesion surface areas on a colony, increased logarithmically with colony area (Fig. 8). Partial mortality also increased when expressed as percent- age of the total colony surface area (Regression line: %Part. Mort. = -0.17 + (0.33 x e log(Colony Area)), p < 0.001, ? = 0.57, n = 36.); however, in this case the rate of increase is decreasing with colony size.
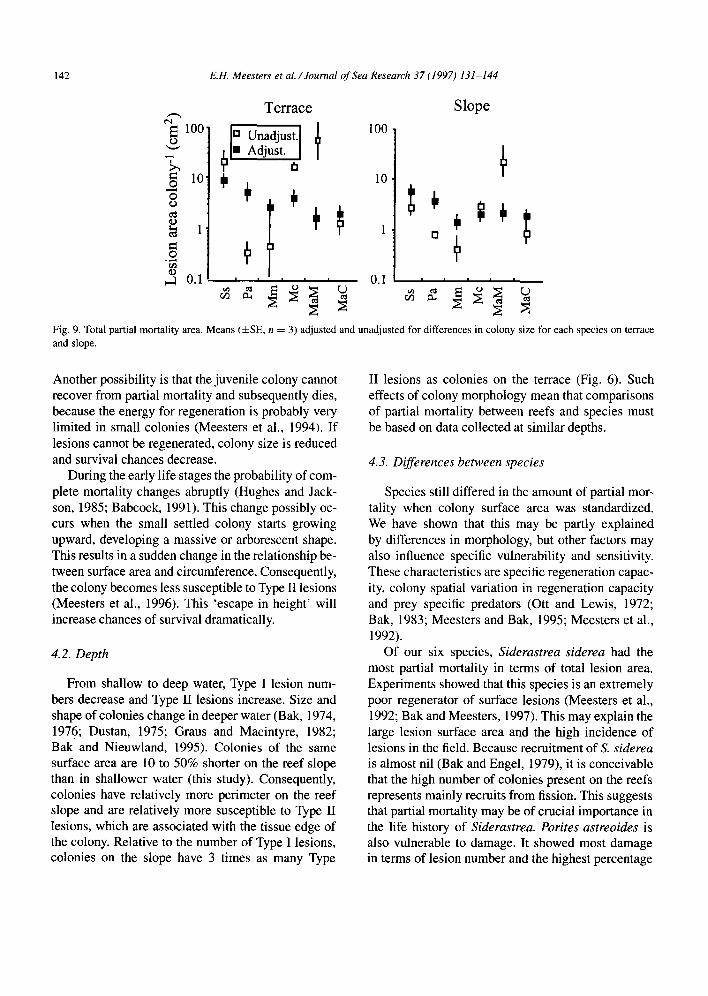
Partial mortality was different between species if we adjusted for the interspecific differences in
colony size (Table 4). In Siderastrea siderea partial mortality was highest and significantly more than in Meandrina meandrites and Montastrea annularis Columnar (pairwise comparisons Table 4). Average area of partial mortality for all species was estimated as 3 cm2 for an average size colony (226 cm2).
The effect of colony area, in comparing partial mortality between species, is obvious when both ad- justed and unadjusted mean colony sizes are shown (Fig. 9). The large differences between means largely disappear when the effect of colony size is removed. This is especially true for Montastrea annularis Mas-
E.H. Meesters et al. /Journal of Sea Research 37 (1997) 131-144 141
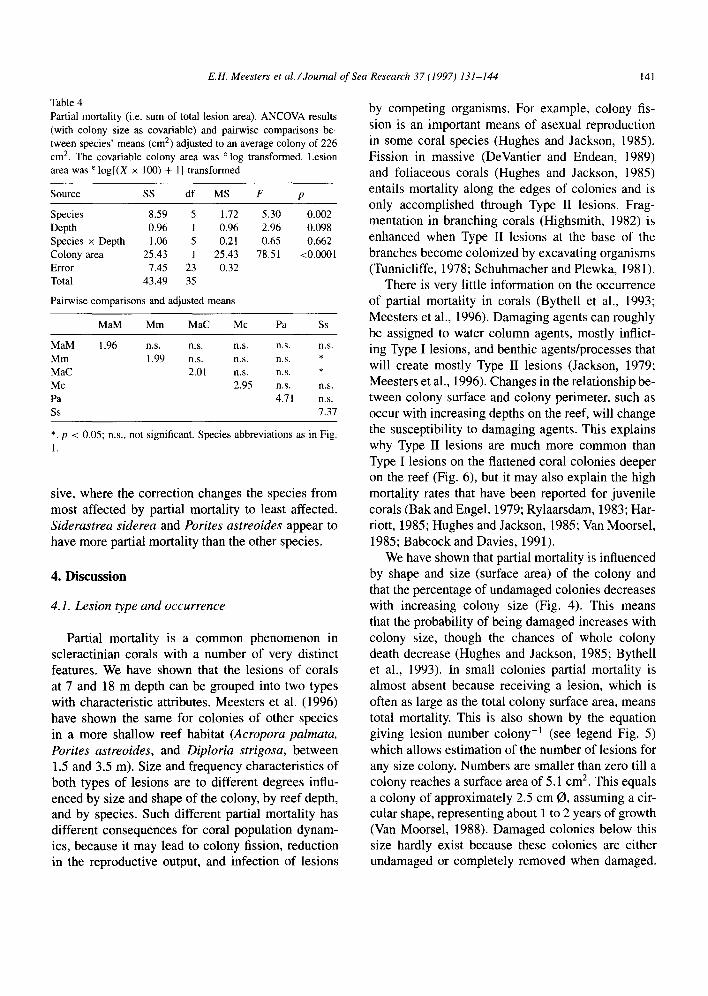
Table 4 Partial mortality (i.e. sum of total lesion area). ANCOVA results (with colony size as covariable) and pairwise comparisons be- tween species’ means (cm*) adjusted to an average colony of 226 cm*. The covariable colony area was e log transformed. Lesion area was e log[(X x 100) + 11 transformed
Source ss df MS F P
Species 8.59 5 1.72 Depth 0.96 1 0.96 Species x Depth 1.06 5 0.21 Colony area 25.43 1 25.43 Error 7.45 23 0.32 Total 43.49 35
Pairwise comparisons and adjusted means
5.30 0.002 2.96 0.098 0.65 0.662
78.5 1 <O.OOOl
MaM Mm MaC MC Pa ss
MaM Mm MaC MC Pa ss
1.96 n.s. n.s. n.s. n.s. n.s. 1.99 n.s. n.s. ns. *
2.01 n.s. n.s. * 2.95 n.s. ns.
4.71 ns. 7.37
*, p < 0.05; ns., not significant. Species abbreviations as in Fig.
sive, where the correction changes the species from most affected by partial mortality to least affected. Siderastrea siderea and Porites astreoides appear to have more partial mortality than the other species.
4. Discussion
4.1. Lesion type and occurrence
Partial mortality is a common phenomenon in scleractinian corals with a number of very distinct features. We have shown that the lesions of corals at 7 and 18 m depth can be grouped into two types with characteristic attributes. Meesters et al. (1996) have shown the same for colonies of other species in a more shallow reef habitat (Acroporu pahata, Porites astreoides, and Diploria strigosa, between 1.5 and 3.5 m). Size and frequency characteristics of both types of lesions are to different degrees influ- enced by size and shape of the colony, by reef depth, and by species. Such different partial mortality has different consequences for coral population dynam- ics, because it may lead to colony fission, reduction in the reproductive output, and infection of lesions
by competing organisms. For example, colony fis- sion is an important means of asexual reproduction in some coral species (Hughes and Jackson, 1985). Fission in massive (DeVantier and Endean, 1989) and foliaceous corals (Hughes and Jackson, 1985) entails mortality along the edges of colonies and is only accomplished through Type II lesions. Frag- mentation in branching corals (Highsmith, 1982) is enhanced when Type II lesions at the base of the branches become colonized by excavating organisms (Tunnicliffe, 1978; Schuhmacher and Plewka, 1981).
There is very little information on the occurrence of partial mortality in corals (Bythell et al., 1993; Meesters et al., 1996). Damaging agents can roughly be assigned to water column agents, mostly inflict- ing Type I lesions, and benthic agents/processes that will create mostly Type II lesions (Jackson, 1979; Meesters et al., 1996). Changes in the relationship be- tween colony surface and colony perimeter, such as occur with increasing depths on the reef, will change the susceptibility to damaging agents. This explains why Type II lesions are much more common than Type I lesions on the flattened coral colonies deeper on the reef (Fig. 6), but it may also explain the high mortality rates that have been reported for juvenile corals (Bak and Engel, 1979; Rylaarsdam, 1983; Har- riott, 1985; Hughes and Jackson, 1985; Van Moorsel, 1985; Babcock and Davies, 1991).
We have shown that partial mortality is influenced by shape and size (surface area) of the colony and that the percentage of undamaged colonies decreases with increasing colony size (Fig. 4). This means that the probability of being damaged increases with colony size, though the chances of whole colony death decrease (Hughes and Jackson, 1985; Bythell et al., 1993). In small colonies partial mortality is almost absent because receiving a lesion, which is often as large as the total colony surface area, means total mortality. This is also shown by the equation giving lesion number colony-’ (see legend Fig. 5) which allows estimation of the number of lesions for any size colony. Numbers are smaller than zero till a colony reaches a surface area of 5.1 cm’. This equals a colony of approximately 2.5 cm 0, assuming a cir- cular shape, representing about 1 to 2 years of growth (Van Moorsel, 1988). Damaged colonies below this size hardly exist because these colonies are either undamaged or completely removed when damaged.
142 E.H. Meesters et al./Joumal of Sea Research 37 (1997) 131-144
Terrace 100
10
1
0.1
Slope
+ Ir 6
Fig. 9. Total partial mortality area. Means (&SE, n = 3) adjusted and unadjusted for differences in colony size for each species on terrace and slope.
Another possibility is that the juvenile colony cannot recover from partial mortality and subsequently dies, because the energy for regeneration is probably very limited in small colonies (Meesters et al., 1994). If lesions cannot be regenerated, colony size is reduced and survival chances decrease.
During the early life stages the probability of com- plete mortality changes abruptly (Hughes and Jack- son, 1985; Babcock, 1991). This change possibly oc- curs when the small settled colony starts growing upward, developing a massive or arborescent shape. This results in a sudden change in the relationship be- tween surface area and circumference. Consequently, the colony becomes less susceptible to Type II lesions (Meesters et al., 1996). This ‘escape in height’ will increase chances of survival dramatically.
4.2. Depth
From shallow to deep water, Type I lesion num- bers decrease and Type II lesions increase. Size and shape of colonies change in deeper water (Bak, 1974, 1976; Dustan, 1975; Graus and Macintyre, 1982; Bak and Nieuwland, 1995). Colonies of the same surface area are 10 to 50% shorter on the reef slope than in shallower water (this study). Consequently, colonies have relatively more perimeter on the reef slope and are relatively more susceptible to Type II lesions, which are associated with the tissue edge of the colony. Relative to the number of Type I lesions, colonies on the slope have 3 times as many Type
II lesions as colonies on the terrace (Fig. 6). Such effects of colony morphology mean that comparisons of partial mortality between reefs and species must be based on data collected at similar depths.
4.3. Differences between species
Species still differed in the amount of partial mor- tality when colony surface area was standardized. We have shown that this may be partly explained by differences in morphology, but other factors may also influence specific vulnerability and sensitivity. These characteristics are specific regeneration capac- ity, colony spatial variation in regeneration capacity and prey specific predators (Ott and Lewis, 1972; Bak, 1983; Meesters and Bak, 1995; Meesters et al., 1992).
Of our six species, Siderastrea siderea had the most partial mortality in terms of total lesion area. Experiments showed that this species is an extremely poor regenerator of surface lesions (Meesters et al., 1992; Bak and Meesters, 1997). This may explain the large lesion surface area and the high incidence of lesions in the field. Because recruitment of S. siderea is almost nil (Bak and Engel, 1979), it is conceivable that the high number of colonies present on the reefs represents mainly recruits from fission. This suggests that partial mortality may be of crucial importance in the life history of Siderastrea. Porites astreoides is also vulnerable to damage. It showed most damage in terms of lesion number and the highest percentage
E.H. Meesters et al/Journal of Sea Research 37 (1997) 131-144 143
of damaged colonies. This seems to contradict the potential efficiency of its average regeneration rate (Meesters et al., 1992) but can be explained by its small colony size and flattened morphology. These morphological features mean that Porites is relatively often subjected to Type II lesions. P. astreoides has indeed the highest number of Type II lesions at both depths. P. astreoides also had the highest number of Type I lesions, with the exception of S. siderea, probably caused by a high frequency of parrotfish bites (unpub. data). Recruitment of P astreoides is very successful (Bak and Engel, 1979) and should compensate the high incidence of partial mortal- ity. Meandrina meandrites showed the least partial mortality. This is probably due to the extremely well-developed lesion regeneration capacity in this species (Meesters and Bak, 1993; Bak and Meesters, 1997). Additional protection against partial mortality in Meandrina is caused by the withdrawn position of the polyps between large septa and the aggressive dominance in interactions with other coral species (Lang, 1973).
In conclusion, there are two aspects of main im- portance in partial mortality. Firstly, there are the general morphological relationships. These are re- lated to depth of corals on the reef, and to colony size and shape. Secondly, there are the particular eco- logical traits of the different species, such as specific regeneration rates, which affect size and quantity of lesions on coral colony surfaces.
Acknowledgements
We thank the Carmabi Institute for providing lo- gistic support, and 0. Frans, F. Isabella and A. Thiel for diving and other assistance in the field. We also would like to thank the anonymous reviewers of the manuscript. We thank the people of the decompres- sion team at St. Elizabeth hospital for their quick and effective response. The research was supported by a grant from the Netherlands Foundation for the Advancement of Tropical Research (WOTRO) W84- 311.
References
Babcock, R.C., 1991. Comparative demography of three species of scleractinian corals using age- and size-dependent classifi-
cations. Ecol. Monogt, 61: 225-244. Babcock, R. and Davies, P., 1991. Effects of sedimentation on
settlement of Acropora millepora. Coral Reefs. 9: 205-208. Bak, R.P.M., 1974. Available light and other factors influencing
growth of stony corals through the year in Curacao. Proc. 2nd Int. Coral Reef Symp., 2: 229-233.
Bak, R.P.M., 1976. The growth of coral colonies and the im- portance of crustose coralline algae and burrowing sponges in relation with carbonate accumulation. Neth. J. Sea Res., 10: 285-337.
Bak, R.P.M., 1977. Coral Reefs and their zonation in Netherlands Antilles. Stud. Geol., 4: 3-16.
Bak, RPM., 1983. Neoplasia, regeneration and growth in the reefbuilding coral Acropora palmata. Mar. Biol., 77: 221-227.
Bak, R.P.M. and Engel, M.S., 1979. Distribution, abundance and survival of juvenile hermatypic corals (Scleractinia) and the importance of life history strategies in the parent coral community. Mar. Biol., 54: 341-352.
Bak, R.P.M. and Luckhurst, E., 1980. Constancy and change in coral reef habitats along depth gradients at Curacao. Oecolo- gia, 47: 145-155.
Bak, RPM. and Meesters, E.H., 1996. Coral diversity, popula- tions and ecosystem functioning. Proc. 6th Int. Conf. Coelen- terate Biol., in press.
Bak, R.P.M. and Nieuwland, G., 1995. Long-term change in coral communities along depth gradients over leeward reefs in the Netherlands Antilles. Bull. Mar. Sci., 56: 609419.
Bak, R.P.M. and Van Eys, G., 1975. Predation of the sea urchin Diadema antillarum Philippi on living coral. Oecologia, 20: 111-115.
Bruggemann, J.H., Van Oppen, M.J.H. and Breeman, A.M., 1994. Foraging by the stoplight parrotfish Sparisoma viride. Mar. Ecol. Prog. Ser., 106: 41-55.
Bythell, J.C., Gladfelter, E.H. and Bythell, M., 1993. Chronic and catastrophic natural mortality of three common Caribbean reef corals. Coral Reefs, 12: 143-152.
DeVantier, L.M. and Endean, R., 1989. Observations of colony fission following ledge formation in massive reef corals of the genus Porites. Mar. Ecol. Prog. Ser., 58: 191-195.
Dustan, P., 1975. Growth and form in the reef-building coral Montastrea annularis. Mar. Biol., 33: 101-107.
Ginsburg, R.N. and Glynn, P.W., 1994. Summary of the col- loquium and forum on global aspects of coral reefs: health, hazards and history. In: R.N. Ginsburg (Editor), Proceedings of the Colloquium and Forum on Global Aspects of Coral Reefs, RSMAS, Univ. Miami, Miami, FL, pp. i-ix.
Gladfelter, E.H., 1982. White-band disease in Acropora palmata: implications for the structure and growth of shallow reefs. Bull. Mar. Sci., 32: 63943.
Gower, J.C., 1985. Measures of similarity, dissimilarity, and distance. In: S. Kotz and N.L. Johnson (Editors), Encyclopedia of Statistical Sciences. Wiley, New York, NY, pp. 397405.
Graus, R.R. and Macintyre, I.G., 1982. Variation in growth forms of the reef coral Montastrea annular-is (Ellis and Solander): a quantitative evaluation of growth response to light distribution using computer simulation. In: K. Riitzler and I.G. Macintyre
144 E.H. Meesters et al./Joumal of Sea Research 37 (1997) 131-144
(Editors), The Atlantic barrier reef ecosystem at Carrie Bow Cay, Belize. Smith. Inst. Press, Washington, DC, pp. 441465.
Harriott, V.J., 1985. Mortality rates of scleractinian corals before and during a mass bleaching event. Mar. Ecol. Prog. Ser., 21: 81-88.
Highsmith, R.C., 1982. Reproduction by fragmentation in corals. Mar. Ecol. Prog. Ser., 7: 207-226.
Hughes, TX, 1984. Population dynamics based on individual size rather than age: a general model with a reef coral exam- ple. Am. Nat., 123: 778-795.
Hughes, T.P. and Jackson, J.B.C., 1985. Population dynamics and life histories of foliaceous corals. Ecol. Monogr., 55: 141-166.
Hurlbert, S.H., 1984. Pseudoreplication and the design of eco- logical field experiments. Ecol. Monogr., 54: 187-211.
Jackson, J.B.C., 1979. Morphological strategies of sessile ani- mals. In: G. Larwood and B.R. Rosen (Editors), Biology and Systematics of Colonial Organisms. Academic Press, London, pp. 499-555.
Knowlton, N., Weil, E., Weigt, L.A. and Guzman, H.M., 1992. Sibling species in Montastraea annularis, coral bleaching, and the coral climate record. Science, 255: 330-333.
Lang, J., 1973. Interspecific aggression by scleractinian corals. 2. Why the race is not only to the swift. Bull. Mar. Sci., 23: 260-279.
Meesters, E.H. and Bak, R.P.M., 1993. Effects of coral bleaching on tissue regeneration potential and colony survival. Mar. Ecol. Prog. Ser., 96: 189-198.
Meesters, E.H. and Bak, RPM., 1995. Age-related deterioration of a physiological function in the branching coral Acropora palm&a. Mar. Ecol. Prog. Ser., 121: 203-209.
Meesters, E.H., Bos, A. and Gast, G.J., 1992. Effects of sedimen- tation and lesion position on coral tissue regeneration. Proc. 7th Int. Coral Reef Symp., 2: 681-688.
Meesters, E.H., Noordeloos, M. and Bak, R.P.M., 1994. Damage and regeneration: Links to growth in the reef-building coral Montastrea annularis. Mar. Ecol. Prog. Ser., 112: 119-128.
Meesters, E.H., Wesseling, I. and Bak, R.P.M., 1996. Partial mortality in three species of reef-building corals (Scleractinia)
and the relation with colony morphology. Bull. Mar. Sci., 58: 838-852.
Ott, B. and Lewis, J.B., 1972. The importance of the gastropod Coralliophila abbtwiata (Lamarck) and the polychaete Her- modice carunculata (Pallas) as coral reef predators. Can. J. Zool., 50: 1651-1656.
Peters, EC., 1984. A survey of cellular reactions to environmen- tal stress and disease in Caribbean scleractinian corals. Helgol. Meeresunters., 37: 113-137.
Rogers, C.S., 1990. Responses of coral reefs and reef organisms to sedimentation. Mar. Ecol. Prog. Ser., 62: 185-202.
Rylaarsdam, K.W., 1983. Life histories and abundance patterns of colonial corals on Jamaican reefs. Mar. Ecol. Prog. Ser., 13: 249-260.
Schuhmacher, H. and Plewka, M., 1981. The adaptive signifi- cance of mechanical properties versus morphological adjust- ments in skeletons of Acropora palmata and Acropora cer- vicornis (Cnidaria, Scleractinia). Proc. 4th Int. Coral Reef Symp., 2: 121-128.
Sokal, R.R. and Rohlf, F.J., 1981. Biometry. Freeman, New York, NY.
Tunnicliffe, V., 1978. The role of boring sponges in coral frac- ture. In: C. Levi and N. Boury-Esnault (Editors), Biologie des Spongiaires. Coll. Int. CNRS, Paris, pp. 309-315.
Van Moorsel, G.W.N.M., 1985. Disturbance and growth of ju- venile corals (Agaricia humilis and Agaricia agaricites, Scler- actinia) in natural habitats on the reef of Curacao. Mar. Ecol. Prog. Ser., 24: 99-l 12.
Van Moorsel, G.W.N.M., 1988. Early maximum growth of stony corals (Scleractinia) after settlement on artificial substrata on a Caribbean reef. Mar. Ecol. Prog. Ser., 50: 127-135.
Van Veghel, M.L.J. and Bak, R.P.M., 1993. Intraspecific varia- tion of a dominant Caribbean reef building coral, Montastrea annularis: genetic, behavioral and morphometric aspects. Mar. Ecol. Prog. Ser., 92: 255-265.
Wilkinson, L., 1989. Systat: The System for Statistics. Systat, Evanston. IL.
Related Documents