Summer Hot Snaps and Winter Conditions: Modelling White Syndrome Outbreaks on Great Barrier Reef Corals Scott F. Heron 1,2 *, Bette L. Willis 3 , William J. Skirving 2 , C. Mark Eakin 4 , Cathie A. Page 3 , Ian R. Miller 5 1 Coral Reef Watch, National Oceanic and Atmospheric Administration, Townsville, Queensland, Australia, 2 Physics Department and Marine Geophysical Laboratory, School of Engineering and Physical Sciences, James Cook University, Townsville, Queensland, Australia, 3 School of Marine and Tropical Biology and ARC Centre of Excellence for Coral Reef Studies, James Cook University, Townsville, Queensland, Australia, 4 Coral Reef Watch, National Oceanic and Atmospheric Administration, Silver Spring, Maryland, United States of America, 5 Long Term Monitoring Program, Australian Institute of Marine Science, Townsville, Queensland, Australia Abstract Coral reefs are under increasing pressure in a changing climate, one such threat being more frequent and destructive outbreaks of coral diseases. Thermal stress from rising temperatures has been implicated as a causal factor in disease outbreaks observed on the Great Barrier Reef, Australia, and elsewhere in the world. Here, we examine seasonal effects of satellite-derived temperature on the abundance of coral diseases known as white syndromes on the Great Barrier Reef, considering both warm stress during summer and deviations from mean temperatures during the preceding winter. We found a high correlation (r 2 = 0.953) between summer warm thermal anomalies (Hot Snap) and disease abundance during outbreak events. Inclusion of thermal conditions during the preceding winter revealed that a significant reduction in disease outbreaks occurred following especially cold winters (Cold Snap), potentially related to a reduction in pathogen loading. Furthermore, mild winters (i.e., neither excessively cool nor warm) frequently preceded disease outbreaks. In contrast, disease outbreaks did not typically occur following warm winters, potentially because of increased disease resistance of the coral host. Understanding the balance between the effects of warm and cold winters on disease outbreak will be important in a warming climate. Combining the influence of winter and summer thermal effects resulted in an algorithm that yields both a Seasonal Outlook of disease risk at the conclusion of winter and near real-time monitoring of Outbreak Risk during summer. This satellite-derived system can provide coral reef managers with an assessment of risk three-to-six months in advance of the summer season that can then be refined using near-real-time summer observations. This system can enhance the capacity of managers to prepare for and respond to possible disease outbreaks and focus research efforts to increase understanding of environmental impacts on coral disease in this era of rapidly changing climate. Citation: Heron SF, Willis BL, Skirving WJ, Eakin CM, Page CA, et al. (2010) Summer Hot Snaps and Winter Conditions: Modelling White Syndrome Outbreaks on Great Barrier Reef Corals. PLoS ONE 5(8): e12210. doi:10.1371/journal.pone.0012210 Editor: Steve Vollmer, Northeastern University, United States of America Received April 20, 2010; Accepted July 8, 2010; Published August 17, 2010 This is an open-access article distributed under the terms of the Creative Commons Public Domain declaration which stipulates that, once placed in the public domain, this work may be freely reproduced, distributed, transmitted, modified, built upon, or otherwise used by anyone for any lawful purpose. Funding: This work was supported by the NOAA Coral Reef Conservation Program; the World Bank/Global Environment Facility Coral Reef Targeted Research Remote Sensing and Coral Disease Working Groups; and the Marine and Tropical Sciences Research Facility. The funders had no role in study design, data collection and analysis, decision to publish, or preparation of the manuscript. Competing Interests: The authors have declared that no competing interests exist. * E-mail: [email protected] Introduction Disease outbreaks have the potential to cause significant damage to coral reefs, not only as a consequence of widespread mortality of framework-building corals but also because of the consequences for many other dependent reef organisms and the resulting likelihood of phase shifts in community structure [e.g., 1,2]. Evidence from a variety of studies suggests that trends of increasing numbers and severity of damaging coral diseases over the past three decades [3] are linked to temperature anomalies. In particular, disease events have been observed to coincide with or follow episodes of coral bleaching in both the Caribbean and Indo- Pacific reef regions [4–7], suggesting links with elevated temper- ature and/or increased susceptibility of coral hosts. Moreover, a seasonal signal in disease abundance has been detected for a number of coral diseases on the Great Barrier Reef, with temperature being one of the most likely driving factors [4,8,9]. A recent modelling study also highlights the likelihood that some coral disease outbreaks are linked to extremes of water temperature, possibly by compounding other factors such as high coral cover [10]. An analysis of the effects of climate change on a number of terrestrial and marine pathogens and their hosts suggests that warming can increase pathogen development and survival, while also increasing host susceptibility [11]. For example, it has been shown that the surface mucus layer, which inhibits pathogen growth on healthy corals, shows diminished antibiotic properties during thermal stress, resulting in lowered disease resistance [12]. This change in the surface microbial community may occur quickly at thresholds that are not yet understood and may persist long after thermal stress ends [13]. Understanding the links between temperature anomalies and coral disease has become paramount given the mounting evidence that temperature anomalies are contributing to the increasing frequency and severity of infectious disease outbreaks in corals globally and to the irrevocable decline of coral reef ecosystems, particularly when coupled with increasing coral bleaching episodes. Satellite monitoring of sea surface temperature (SST) has been used as the basis for several metrics that evaluate the links between thermal stress and coral bleaching [14,15]. These metrics provide successful nowcasting of coral bleaching events around the world PLoS ONE | www.plosone.org 1 August 2010 | Volume 5 | Issue 8 | e12210

Welcome message from author
This document is posted to help you gain knowledge. Please leave a comment to let me know what you think about it! Share it to your friends and learn new things together.
Transcript

Summer Hot Snaps and Winter Conditions: ModellingWhite Syndrome Outbreaks on Great Barrier Reef CoralsScott F. Heron1,2*, Bette L. Willis3, William J. Skirving2, C. Mark Eakin4, Cathie A. Page3, Ian R. Miller5
1 Coral Reef Watch, National Oceanic and Atmospheric Administration, Townsville, Queensland, Australia, 2 Physics Department and Marine Geophysical Laboratory,
School of Engineering and Physical Sciences, James Cook University, Townsville, Queensland, Australia, 3 School of Marine and Tropical Biology and ARC Centre of
Excellence for Coral Reef Studies, James Cook University, Townsville, Queensland, Australia, 4 Coral Reef Watch, National Oceanic and Atmospheric Administration, Silver
Spring, Maryland, United States of America, 5 Long Term Monitoring Program, Australian Institute of Marine Science, Townsville, Queensland, Australia
Abstract
Coral reefs are under increasing pressure in a changing climate, one such threat being more frequent and destructiveoutbreaks of coral diseases. Thermal stress from rising temperatures has been implicated as a causal factor in diseaseoutbreaks observed on the Great Barrier Reef, Australia, and elsewhere in the world. Here, we examine seasonal effects ofsatellite-derived temperature on the abundance of coral diseases known as white syndromes on the Great Barrier Reef,considering both warm stress during summer and deviations from mean temperatures during the preceding winter. Wefound a high correlation (r2 = 0.953) between summer warm thermal anomalies (Hot Snap) and disease abundance duringoutbreak events. Inclusion of thermal conditions during the preceding winter revealed that a significant reduction in diseaseoutbreaks occurred following especially cold winters (Cold Snap), potentially related to a reduction in pathogen loading.Furthermore, mild winters (i.e., neither excessively cool nor warm) frequently preceded disease outbreaks. In contrast,disease outbreaks did not typically occur following warm winters, potentially because of increased disease resistance of thecoral host. Understanding the balance between the effects of warm and cold winters on disease outbreak will be importantin a warming climate. Combining the influence of winter and summer thermal effects resulted in an algorithm that yieldsboth a Seasonal Outlook of disease risk at the conclusion of winter and near real-time monitoring of Outbreak Risk duringsummer. This satellite-derived system can provide coral reef managers with an assessment of risk three-to-six months inadvance of the summer season that can then be refined using near-real-time summer observations. This system canenhance the capacity of managers to prepare for and respond to possible disease outbreaks and focus research efforts toincrease understanding of environmental impacts on coral disease in this era of rapidly changing climate.
Citation: Heron SF, Willis BL, Skirving WJ, Eakin CM, Page CA, et al. (2010) Summer Hot Snaps and Winter Conditions: Modelling White Syndrome Outbreaks onGreat Barrier Reef Corals. PLoS ONE 5(8): e12210. doi:10.1371/journal.pone.0012210
Editor: Steve Vollmer, Northeastern University, United States of America
Received April 20, 2010; Accepted July 8, 2010; Published August 17, 2010
This is an open-access article distributed under the terms of the Creative Commons Public Domain declaration which stipulates that, once placed in the publicdomain, this work may be freely reproduced, distributed, transmitted, modified, built upon, or otherwise used by anyone for any lawful purpose.
Funding: This work was supported by the NOAA Coral Reef Conservation Program; the World Bank/Global Environment Facility Coral Reef Targeted ResearchRemote Sensing and Coral Disease Working Groups; and the Marine and Tropical Sciences Research Facility. The funders had no role in study design, datacollection and analysis, decision to publish, or preparation of the manuscript.
Competing Interests: The authors have declared that no competing interests exist.
* E-mail: [email protected]
Introduction
Disease outbreaks have the potential to cause significant
damage to coral reefs, not only as a consequence of widespread
mortality of framework-building corals but also because of the
consequences for many other dependent reef organisms and the
resulting likelihood of phase shifts in community structure [e.g.,
1,2]. Evidence from a variety of studies suggests that trends of
increasing numbers and severity of damaging coral diseases over
the past three decades [3] are linked to temperature anomalies. In
particular, disease events have been observed to coincide with or
follow episodes of coral bleaching in both the Caribbean and Indo-
Pacific reef regions [4–7], suggesting links with elevated temper-
ature and/or increased susceptibility of coral hosts. Moreover, a
seasonal signal in disease abundance has been detected for a
number of coral diseases on the Great Barrier Reef, with
temperature being one of the most likely driving factors [4,8,9].
A recent modelling study also highlights the likelihood that some
coral disease outbreaks are linked to extremes of water
temperature, possibly by compounding other factors such as high
coral cover [10]. An analysis of the effects of climate change on a
number of terrestrial and marine pathogens and their hosts
suggests that warming can increase pathogen development and
survival, while also increasing host susceptibility [11]. For
example, it has been shown that the surface mucus layer, which
inhibits pathogen growth on healthy corals, shows diminished
antibiotic properties during thermal stress, resulting in lowered
disease resistance [12]. This change in the surface microbial
community may occur quickly at thresholds that are not yet
understood and may persist long after thermal stress ends [13].
Understanding the links between temperature anomalies and coral
disease has become paramount given the mounting evidence that
temperature anomalies are contributing to the increasing frequency
and severity of infectious disease outbreaks in corals globally and to
the irrevocable decline of coral reef ecosystems, particularly when
coupled with increasing coral bleaching episodes.
Satellite monitoring of sea surface temperature (SST) has been
used as the basis for several metrics that evaluate the links between
thermal stress and coral bleaching [14,15]. These metrics provide
successful nowcasting of coral bleaching events around the world
PLoS ONE | www.plosone.org 1 August 2010 | Volume 5 | Issue 8 | e12210

(e.g., http://coralreefwatch.noaa.gov, http://www.cmar.csiro.au/
remotesensing/reeftemp/web/ReefTemp_application.htm), dem-
onstrating the direct link that exists between thermal stress and the
breakdown of the coral-Symbiodinium symbiotic association known
as coral bleaching. The near real-time nature of satellite
monitoring provides reef managers with vital information that
can enable rapid management response. If similar links exist
between disease occurrence and temperature metrics, it should be
possible to predict disease outbreak risk based on environmental
conditions. Modelling studies can provide a mechanism for
exploring the nature of such links, thereby enhancing our
understanding of factors promoting disease risk.
Previous modelling [10] used SST in combination with long-
term records of disease abundance to identify both coral cover and
thermal stress as significant drivers of white syndrome abundance
on the Great Barrier Reef (GBR), Australia. Disease risk was
predicted using the WSSTA (weekly SST anomaly) metric, which
counted the number of weeks during the previous one-year period
for which the temperature anomaly was at or above +1uC. The
anomaly for each week was calculated by subtracting the long-
term average temperature for that week from the measured
temperature. The study concluded that a significant proportion of
surveys with high disease counts occurred in locations that had
experienced five or more weeks of anomalously warm tempera-
tures within the prior year in areas of high (greater than 50%)
coral cover. Thermal stress was suggested to be necessary, but not
sufficient, to predict outbreak events. However, the WSSTA
metric only counts the number of warm anomalies, considering
neither the magnitude of warm (positive) temperature anomalies
nor any effects of negative anomalies, which may also influence the
health of the coral host [e.g. 16,17], its symbiotic algae, or the
virulence of pathogens.
A causal relationship has been identified between the coral
pathogen Vibrio coralliilyticus and coral white syndromes (WS) in
locations across the Pacific Ocean [18]. Warm anomalies have
been linked to increased populations and virulence of pathogens
[19] and the corollary, that cold anomalies may reduce survival,
density and virulence of pathogens, has also been proposed [11].
Reductions in WS counts from summer surveys to the following
winter surveys at Lizard Island in the northern Great Barrier Reef
[8] suggested a role for cold thermal anomalies in disease
dynamics. In particular, cold temperature anomalies, especially
during winter months, may reduce pathogen loads and thereby the
risk of disease outbreaks in the following summer.
Here, we built on existing findings [10] to develop SST metrics
that incorporated influences of warm summer anomalies, cold
winter anomalies and overall winter conditions to elucidate links
between the abundance of coral white syndromes and tempera-
ture. We sought a method to predict the risk of disease outbreak
based on satellite-derived environmental parameters, the vision
being to produce an operationally-available tool for managers.
Given the complexity of influences that temperature can have on
corals and their pathogens, we explored both positive and negative
thermal events, their magnitudes and their relevance during
different seasons to produce a decision-tree algorithm.
Methods
Field surveys of diseaseThere is a general paucity of long-term disease datasets of the
abundance of coral diseases. Due to its longevity and large spatial
domain, the Australian Institute of Marine Science’s (AIMS)
surveys of white syndromes (WS) on the Great Barrier Reef (GBR)
[20] provide one of the best datasets with which to explore the
links between SST and disease occurrence. For this study, we used
field observations of coral disease undertaken by AIMS’ Long
Term Monitoring Program (LTMP) and Representative Areas
Program (RAP) during 1998–2007, under a permit provided by
the GBR Marine Park Authority. In total, 47 LTMP and 56 RAP
locations were monitored annually or biennially along the length
of the GBR, including inner-, mid- and outer-shelf reefs (Fig. 1; see
[20] for details of survey timing). Monitoring protocols were
identical in these two programs; five belt transects (2 m650 m)
were monitored at three sites for each reef location (total of
1500 m2). Transects were permanently marked for repeat visits
and photographically sampled along their lengths for post-survey
confirmation of data records and a detailed post-analysis of the
benthic community, including assessment of benthic structure
(percent cover of hard and soft coral to genus, plus other benthic
categories such as algae, sponges and substratum type). In some
years, transect numbers were reduced at some sites due to weather
and/or safety issues.
Data selected for this study were ‘‘Total White Syndrome
counts’’ (TWS), a summation of tissue loss observations char-
acterised by a front of recently exposed skeleton coupled with the
absence of predators or other visible causative agents, and
‘‘percent cover of Acropora spp.’’, a measure of host density. White
syndromes have been reported to be amongst the most prevalent
and destructive coral diseases on the GBR. While corals in the
TWS category were not identified, acroporid corals are typically
the most susceptible to WS [8] and comprise the greatest
percentage, by far, of corals in GBR reef assemblages [21,22].
In cases where the number of transects was reduced from the
standard protocol, disease counts were proportionally upscaled to
a standard area (counts per 1500 m2).
Figure 1. Map of the Great Barrier Reef showing reef locationssurveyed for white syndrome abundance. Surveys undertaken aspart of the AIMS LTMP and RAP programs. Red symbols indicatelocations that experienced a WS outbreak observed during AIMSsurveys. Survey sectors indicated for CL = Cooktown-Lizard, CA = Cairns,WH = Whitsunday, SW = Swains and CB = Capricorn-Bunker.doi:10.1371/journal.pone.0012210.g001
Hot Snaps and Coral Disease
PLoS ONE | www.plosone.org 2 August 2010 | Volume 5 | Issue 8 | e12210
Defining a disease outbreakA disease outbreak, or epizootic, has been defined as the occurrence
of disease at an unexpected time or place, or at a rate greater than
expected [23]. The 10-year WS dataset (1998–2007) spanned years
and locations where WS was absent; and years and locations where
WS abundance increased up to 20-fold beyond apparent background
levels [8]. In the absence of longer-term data from which to establish
more rigorous baselines, we defined a threshold for WS outbreaks
across all locations by statistically isolating unusually high disease
events. Our definition assumed that (a) outbreaks did not occur in all
years within the record; and (b) outbreaks did not occur at all survey
locations in outbreak years. These assumptions were reasonable given
the temporal and geographic extent (.1700 km along the length of
the GBR) of the surveys.
To identify the outbreak threshold in the WS dataset, the
maximum observed disease abundance was selected for each year
and the overall mean and standard deviation of these maxima
calculated. Outliers (i.e., outbreaks) were defined as maximum
abundance values that were greater than the overall mean value
plus one standard deviation. Any such outliers were replaced with
the next highest abundance value for that year and the overall
mean and standard deviation recalculated. This process was
iterated until no outliers existed, with the outbreak threshold
defined as the sum of the final values of overall mean and standard
deviation of the maxima, with all excluded outliers thus defined as
outbreaks.
Temperature-based parametersA previous study [10] used the retrospective Pathfinder v5.0
SST dataset [24], at ,4 km spatial and weekly temporal
resolution. The data were temporally gap-filled using a simple
interpolation if cloud or other algorithmic tests deemed the quality
of a SST value to be poor. Here we also utilised the Pathfinder
v5.0 dataset as the source of temperature data but used only night-
time retrievals as these are generally more representative of
temperature variability at the depths of corals [25]. Additionally,
we employed a more sophisticated gap-filling technique than that
employed previously [10] for data deemed to be of poor quality
(quality value below four [24]). Data gaps were filled using
temporal interpolation only for gaps of 3 weeks or less. Beyond this
gap-length, it was considered inappropriate to undertake simple
interpolation because of the time-scale of ocean processes.
Consequently, any remaining gaps were filled by comparing
ambient temperatures in the surrounding pixels with the spatial
pattern of climatological temperatures (mean for 1985–2005) from
the same year-week and setting the gap-value to match the
identified pattern. The SST dataset spanned the period 1985–
2005 and allowed comparison with the AIMS disease observations
for the period 1998–2005.
Several new metrics of environmental conditions were devel-
oped to compare with in situ WS abundance data and to improve
upon the WSSTA metric [10]. A variety of additional tempera-
ture-based metrics were examined (including maximum and
minimum temperature; maximum and minimum anomaly; and
temperature events above or below various thresholds); the three
metrics that provided significant predictive capability are present-
ed here. These metrics incorporated both the magnitude and
duration of anomalous thermal events by integrating temperature
anomalies through time; thus their units are uC-weeks. For each
metric, we calculated anomalies from a temperature baseline and
summed anomalies through a period of accumulation (see example in
Fig. 2).
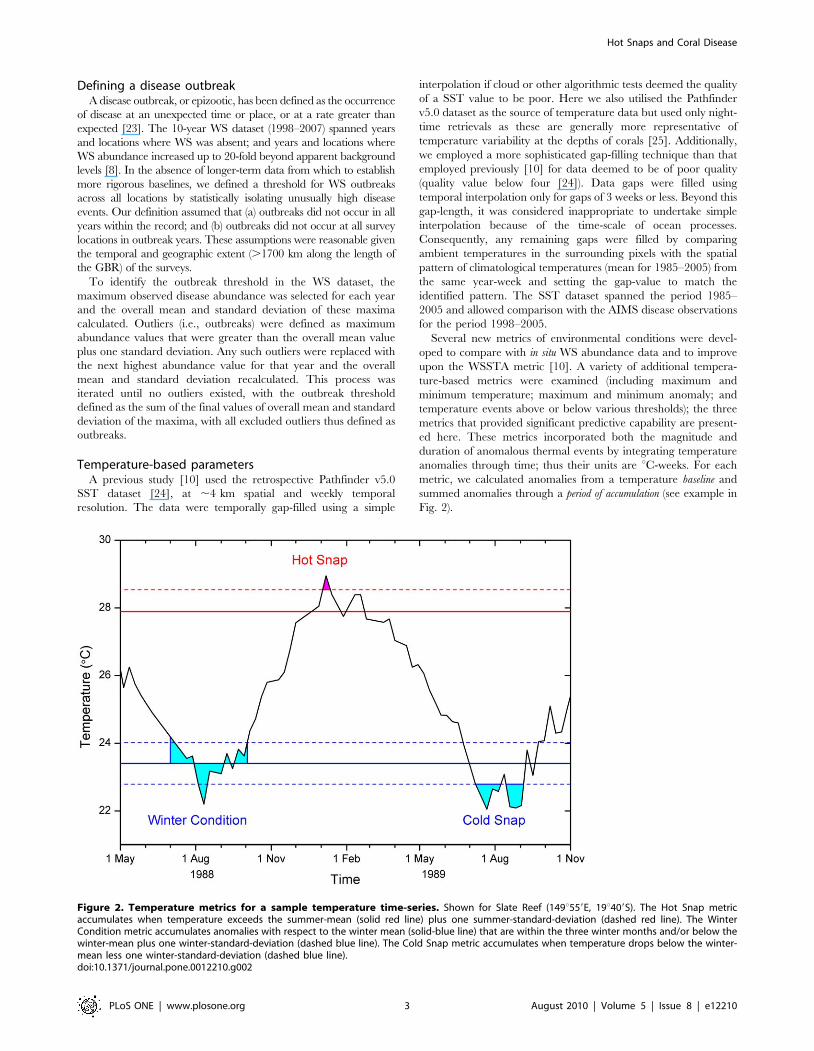
Figure 2. Temperature metrics for a sample temperature time-series. Shown for Slate Reef (149u559E, 19u409S). The Hot Snap metricaccumulates when temperature exceeds the summer-mean (solid red line) plus one summer-standard-deviation (dashed red line). The WinterCondition metric accumulates anomalies with respect to the winter mean (solid-blue line) that are within the three winter months and/or below thewinter-mean plus one winter-standard-deviation (dashed blue line). The Cold Snap metric accumulates when temperature drops below the winter-mean less one winter-standard-deviation (dashed blue line).doi:10.1371/journal.pone.0012210.g002
Hot Snaps and Coral Disease
PLoS ONE | www.plosone.org 3 August 2010 | Volume 5 | Issue 8 | e12210
The Hot Snap metric examined whether unusually warm
conditions were experienced during the summer period preceding
each disease survey. A pixel-by-pixel summer mean temperature
was constructed by averaging all SST values from the three
climatologically warmest months. The summer standard deviation
was also calculated for each pixel and used to identify significantly
warm excursions from the summer mean. Hot Snaps occurred
when the temperature exceeded the baseline, defined for Hot Snaps
as one standard deviation above the summer mean. The period of
accumulation included dates from three months before the most-
recent summer that preceded each survey, through to the date of
the survey. We accumulated temperatures exceeding the summer
baseline during this period, including values outside the climato-
logically warmest months to incorporate any extra-seasonal
warming. As only positive anomalies contribute to the Hot Snap
metric, heat stress accumulations at the time of the disease surveys
were either positive or zero.
The Cold Snap metric is essentially the winter-time corollary to
the Hot Snap, combining the magnitude and duration of cold
events prior to the summer accumulation. Pixel-by-pixel winter
mean temperatures and standard deviations were determined from
all SST values that occurred during the three coldest months. The
Cold Snap baseline was set at one winter standard deviation below
the winter mean. The period of accumulation was for the nine-months
that preceded the most-recent summer (i.e., Cold Snap is
calculated prior to Hot Snap). Temperatures below this baseline,
including any anomalously cold temperatures outside the defined
winter months, were accumulated. This tested the hypothesis that
anomalous cold conditions have a negative impact on pathogens,
reducing the risk of disease outbreaks. Only negative anomalies
(i.e., temperatures less than the baseline) contribute to the Cold
Snap metric, resulting in either negative (anomalously cold) or
zero metric values.
The Winter Condition metric provided an alternate measure of
winter pre-conditioning, measuring the overall conditions of the
cooler months in the annual temperature cycle. This metric was
designed to determine if the winter was unusually cold or warm,
potentially affecting pathogen loads and/or host susceptibility and
thus the risk of disease should subsequent warm summer stress
occur. Using the same winter means and standard deviations
calculated for the Cold Snap metric, the Winter Condition baseline
was set to the winter mean temperature. The period of accumulation
included (a) any time when the temperature was at or below the
winter mean plus one standard deviation, to include all winter-like
conditions; and (b) the three winter months, even during times
when temperatures exceeded one standard deviation above the
winter mean – capturing unusually warm periods during winter.
Anomalies calculated with respect to the Winter Condition baseline
could therefore be either negative or positive. All anomalies in this
period were accumulated in the Winter Condition metric, giving
an overall measure of winter conditions that could be either
positive or negative relative to the mean climatology.
As the Pathfinder SST dataset is reprocessed retrospectively;
i.e., the data are not produced in real-time, a different dataset
would be needed for a near real-time product. NOAA Coral Reef
Watch currently produces its near real-time Operational SST
twice each week and at ,50 km (0.5u) spatial resolution for the
global ocean [25]. The Operational SST uses the same split-
window algorithm as the Pathfinder dataset but a different cloud-
clearing methodology. We tested the potential of using the above
metrics to provide near real-time risk assessments with NOAA’s
operational products by evaluating Hot Snap, Cold Snap and
Winter Condition metrics calculated using a 50 km, twice-weekly
SST dataset. These 50 km data were derived from the same 4 km
Pathfinder data as above, but sub-sampled using an algorithm
similar to the one used for the near real-time data [26].
Developing an outbreak risk algorithmWS outbreaks have been shown to be dependent on multiple
environmental factors as well as biotic factors like host density
[e.g., 10], reflecting the role that interactions between coral hosts
and pathogens play in disease causation [23]. As the SST metrics
focused on three different aspects of temperature stress, each was
tested independently to evaluate its role in describing disease risk.
Algorithms were then developed to amalgamate different combi-
nations of information from these metrics into a decision tree
system [27] to predict outbreak risk. WS outbreaks were hindcast
using 4 km and 50 km SST metrics to compare the system
outcomes at retrospective and near real-time global spatial
resolutions, respectively.
Results
Overlap of disease survey dates with periods of satellite SST
data acquisition between 1998 and 2005 provided a dataset of 342
data points with which to explore the relationship between WS
abundance and thermal anomalies. January through March were
the three warmest (i.e., summer) months at all survey locations.
Similarly, the three coldest months were also consecutive (Jul-Sep
at all but one survey location), thereby enabling identification of
continuous seasons for each location. Based on these empirically-
derived definitions of seasonal timing, 84 of the disease surveys
occurred in autumn, 104 in winter, 107 in spring and 47 in
summer. Acropora spp. coral cover across the 342 surveys was
14.0616.7% (mean 6 standard deviation). Based on this
variability we set the threshold for high coral cover at 30% (mean
plus one standard deviation).
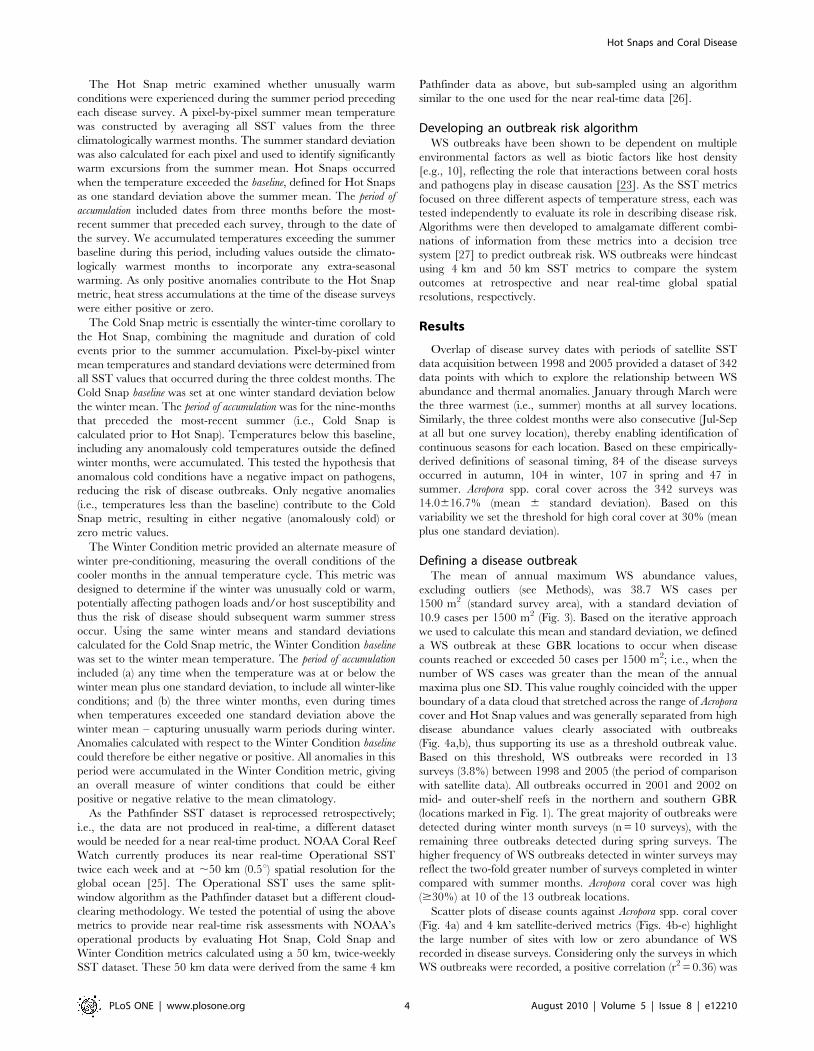
Defining a disease outbreakThe mean of annual maximum WS abundance values,
excluding outliers (see Methods), was 38.7 WS cases per
1500 m2 (standard survey area), with a standard deviation of
10.9 cases per 1500 m2 (Fig. 3). Based on the iterative approach
we used to calculate this mean and standard deviation, we defined
a WS outbreak at these GBR locations to occur when disease
counts reached or exceeded 50 cases per 1500 m2; i.e., when the
number of WS cases was greater than the mean of the annual
maxima plus one SD. This value roughly coincided with the upper
boundary of a data cloud that stretched across the range of Acropora
cover and Hot Snap values and was generally separated from high
disease abundance values clearly associated with outbreaks
(Fig. 4a,b), thus supporting its use as a threshold outbreak value.
Based on this threshold, WS outbreaks were recorded in 13
surveys (3.8%) between 1998 and 2005 (the period of comparison
with satellite data). All outbreaks occurred in 2001 and 2002 on
mid- and outer-shelf reefs in the northern and southern GBR
(locations marked in Fig. 1). The great majority of outbreaks were
detected during winter month surveys (n = 10 surveys), with the
remaining three outbreaks detected during spring surveys. The
higher frequency of WS outbreaks detected in winter surveys may
reflect the two-fold greater number of surveys completed in winter
compared with summer months. Acropora coral cover was high
($30%) at 10 of the 13 outbreak locations.
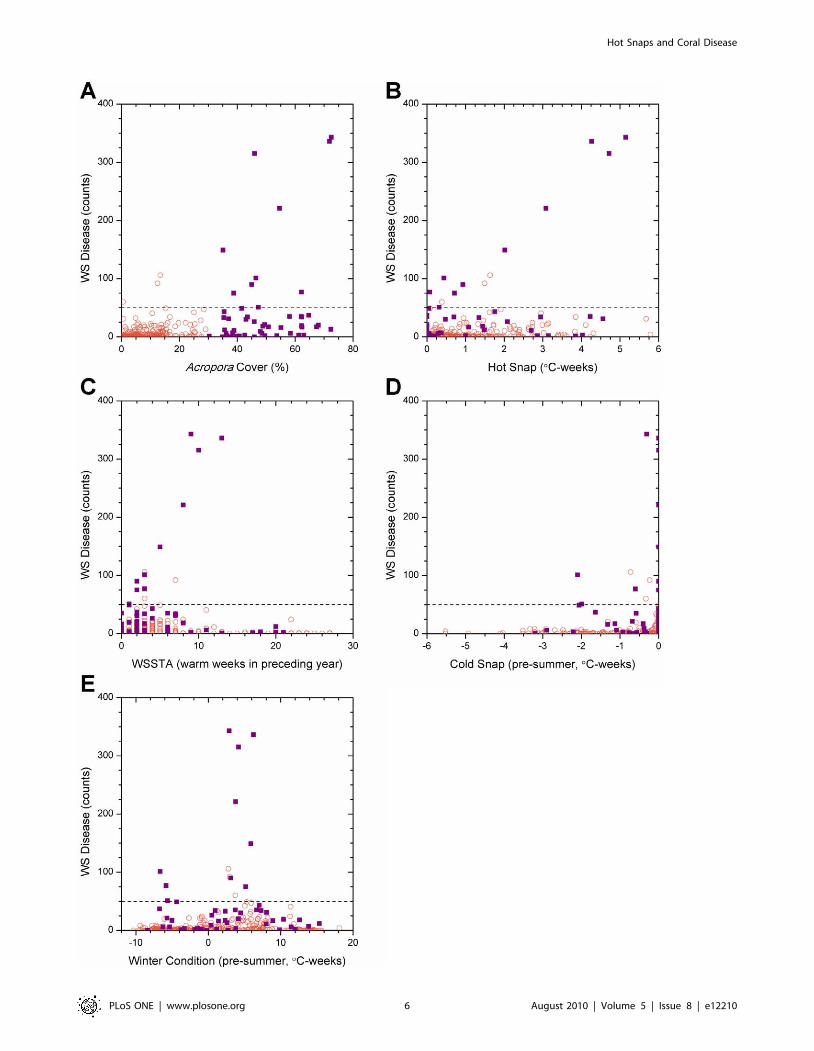
Scatter plots of disease counts against Acropora spp. coral cover
(Fig. 4a) and 4 km satellite-derived metrics (Figs. 4b-e) highlight
the large number of sites with low or zero abundance of WS
recorded in disease surveys. Considering only the surveys in which
WS outbreaks were recorded, a positive correlation (r2 = 0.36) was
Hot Snaps and Coral Disease
PLoS ONE | www.plosone.org 4 August 2010 | Volume 5 | Issue 8 | e12210
detected between percent cover of Acropora spp. and WS
abundance (Fig. 4a), thus the highest disease counts occurred in
regions with highest cover of host corals.
Temperature-based parametersThe full suite of temperature-based metrics developed in this
study was compared with disease abundance; the results of only
those metrics found to have predictive skill are described below.
For sites experiencing WS outbreaks ($50 cases per 1500 m2),
there was also a strong linear relationship between the Hot Snap
metric and WS abundance (WS = 39.0+59.8 * Hot Snap;
r2 = 0.953; Fig. 4b), suggesting a link between warm temperature
stress and WS outbreaks. Note that the intercept value agreed
surprisingly well with the mean of annual maximum abundance
values, excluding outliers, lending support to the threshold for
outbreaks defined in this study. The highest WS abundances
occurred concurrently with the highest Hot Snap values recorded,
in contrast to the pattern found for the WSSTA metric [10]
(Fig. 4c). In the latter case, the highest WS abundances were
recorded when the WSSTA metric was approximately half of its
maximum value, whereas low or zero WS abundances were
recorded when the WSSTA metric peaked, suggesting that the
Hot Snap metric provides a better measure of heat stress
experienced by corals than WSSTA. While the correlation
between WS outbreaks and the Hot Snap metric (r2 = 0.953)
was marginally higher than that with WSSTA (r2 = 0.834), positive
values of both metrics successfully predicted the 13 high-disease
events. However, surveys revealed a large number of low-disease
events when both metrics showed high thermal stress, suggesting
that neither was sufficient to predict low-disease counts: of 329
low-disease events, a Hot Snap of 0uC-weeks correctly predicted
92 events, while WSSTA = 0 predicted only 65. Raising the
metric threshold to WSSTA $5 [10] correctly identified more
low-disease counts (216 of 329) at the cost of successfully predicting
high-disease events (6 of 13); a similar pattern was found for Hot
Snap $1uC-weeks (214 of 329 and 7 of 13, respectively). Thus,
observed WS outbreaks were preceded by Hot Snaps but
anomalously warm summer conditions were not sufficient for
outbreaks to occur.
Analysis of the Cold Snap metric (Fig. 4d) indicated that the
highest WS abundances occurred in the absence of unusually cold
temperatures during winter. Of the 13 WS outbreaks, nine occurred
following winters when cold snaps did not occur (Cold Snap
$20.5uC-weeks). The corollary was also true; lower levels of disease
occurred following winters characterised by Cold Snaps (,20.5uC-
weeks), suggesting that unusually cold periods hindered WS
outbreaks. The remaining WS outbreaks occurred at Cold Snap
values around 22.0uC-weeks, with considerably lower WS abun-
dance than the highest disease counts. Thus, WS outbreaks were
predominately seen after winters without significant Cold Snaps.
The Winter Condition scatter plot (Fig. 4e) shows that the
distribution of disease counts was offset slightly to the right of the
mean baseline Winter Condition (warm bias). The highest disease
counts coincided with Winter Condition values of 2.5–6.5uC-
weeks, values that were at the centre of the observed range of this
metric across all surveys [range: 211 to +19]. The majority of WS
outbreak observations (10 of 13) occurred within this central peak,
suggesting that mild winters (i.e., those that were neither unusually
warm nor unusually cool) may have facilitated outbreaks of WS.
The corollary to this considered the 329 non-outbreak surveys, of
which 273 experienced values outside the central peak of the
Winter Condition distribution. This suggested that disease
outbreaks were inhibited when preceded by either cooler or
warmer winters. The three outbreaks outside the central peak were
grouped at Winter Condition values around 26uC-weeks; this
grouping was inconsistent with an apparent Gaussian envelope
encompassing the rest of the distribution. Thus, WS outbreaks
predominately were seen following mild winters, infrequently after
Figure 3. White syndrome abundance plotted against survey years, showing outbreak events (red triangle). Outbreak thresholddetermined by the iterative analysis (see Methods). Open blue squares correspond to disease observations interpreted as non-outbreak abundances,with the yearly-maximum non-outbreak events, all within one standard deviation of their mean, marked by blue triangles. The blue line shows themean of non-outbreak yearly maxima (38.7 WS cases per 1500 m2); the red line is the outbreak threshold, one standard deviation (10.9 WS cases per1500 m2) above the mean.doi:10.1371/journal.pone.0012210.g003
Hot Snaps and Coral Disease
PLoS ONE | www.plosone.org 5 August 2010 | Volume 5 | Issue 8 | e12210
Hot Snaps and Coral Disease
PLoS ONE | www.plosone.org 6 August 2010 | Volume 5 | Issue 8 | e12210

unusually cool winters and were not observed to occur following
warm winters.
Repeating the calculation of the metrics using the 50 km, twice-
weekly SST data yielded similar results (see Fig. S1 in Supporting
Online Material). The strong linear relationship between high-
disease and Hot Snaps remained (r2 = 0.878), as did the association
between high-disease events and the absence of Cold Snaps. The
peak in the Winter Condition metric was closer to zero, likely a
function of the warm-bias sub-sampling algorithm giving consis-
tently increased temperature in the 50 km metrics compared to
the 4 km metrics. The mild Winter Condition for the 50 km
satellite data was slightly cooler (1.0–5.0uC-weeks) than that found
for the 4 km Winter Condition. While variability was slightly
higher than for the 4 km metrics, the predictive capacity of the
metrics at 50 km resolution remains strong.
Developing an outbreak risk algorithmUsing our defined threshold for disease outbreak ($50 WS cases
per 1500 m2), we increased the effectiveness of predicting outbreak
risk by combining the outcomes from our three satellite metrics
into a decision tree system. A successful predictive tool should
forecast the likelihood of both high- and low-disease abundance.
While Acropora spp. coral cover cannot be detected through remote
sensing, the threshold of $30% provided guidance in identifying
reefs for which this system could be expected to perform properly.
For reefs that met or exceeded 30% coral cover, the following
system provided the greatest success at predicting WS outbreaks:
(1) a Seasonal Outlook using only winter metrics to predict risk 3–6
months in advance; and (2) a near real-time Outbreak Risk
assessment during the summer warm period.
First, the Seasonal Outlook algorithm evaluated the two winter
metrics. Locations that experienced non-mild winters (Winter
Condition metric outside the range 2.5–6.5uC-weeks) and/or
experienced a Cold Snap were assigned as having ‘‘No Risk’’ of
disease outbreak. Locations that experienced mild-winters and no
Cold Snap ($20.5uC-weeks) were assigned to the ‘‘At Risk’’
category for the Seasonal Outlook. Second, those reefs identified
as being ‘‘At Risk’’ after the end of the winter were monitored for
their summer Outbreak Risk. For locations that experienced mild-
winters and no Cold Snap, the near real-time Outbreak Risk was
assigned the value of the Hot Snap metric, of which the range was
0–6uC-weeks for low to high risk.
(1) Seasonal Outlook (3–6 month lead-time)
Mild Winter Condition:
No ‘‘No Risk’’ category
Yes
Cold Snap:
Yes ‘‘No Risk’’ category
No ‘‘At Risk’’ category
(2) Outbreak Risk (near real-time)
Hot Snap Low to High Risk(continuous scale)
Discussion
Use of modelling to explore the relationship between seasonal
temperature anomalies and coral disease abundance has revealed
the importance of both warm summer and cold winter
temperature anomalies in explaining patterns of white syndrome
abundance on the Great Barrier Reef. WS outbreaks showed clear
relationships with all three temperature metrics developed; i.e.,
with stressfully warm summer periods, with a lack of unusually
cold conditions during the preceding winter and with overall mild
conditions during the preceding winter. However, a combination
of the three metrics in a decision tree system yielded the greatest
potential for predicting WS outbreak risk.
The significant correlation between Hot Snaps and WS
abundance confirmed that WS outbreaks typically occur following
anomalously warm summer periods. The Hot Snap metric
provided an improvement over the WSSTA metric [10] in
describing WS abundance, indicating that a simple count of warm
weeks did not adequately characterise outbreak risk. This
improvement likely resulted from the inclusion of both magnitude
and duration of the anomaly in the Hot Snap metric and from
accumulating warm stress only during the summer months, rather
than through an entire year. The WSSTA metric included
warmer-than-usual periods outside summer, which may have had
an inverse influence on disease occurrence. Based on evaluation of
the Winter Condition metric, warm periods during winter appear
to reduce the likelihood of disease events, possibly through
mechanisms such as increased host resistance. Thus, inclusion of
only summer warm anomalies in the Hot Snap metric probably
enhanced its sensitivity as a predictor of WS. For both Hot Snap
and WSSTA metrics, high (.30%) cover of Acropora spp. seemed
to be a necessary pre-condition for WS outbreaks. However, while
both warm temperature and high Acropora spp. cover appeared to
be necessary for WS outbreaks, these did not completely explain
temporal patterns of disease occurrence. In particular, there were
several cases of low WS abundance when the metrics were high.
Thus additional factors were needed to develop a robust
prediction of outbreak risk.
Inclusion of the winter metrics in a conditional manner in the
algorithm significantly reduced the number of false outbreak
predictions. Most (9 of 13) disease outbreaks in surveys followed
winters with few or no cold anomalies (i.e., Cold Snap $20.5uC-
weeks). This was consistent with the hypothesis that cold winters
reduced WS abundance perhaps by reducing pathogen loads. The
data did not support the alternative hypothesis that cold stress
could have increased the susceptibility of corals to WS, although
further study will be needed to verify this. The correlation between
Cold Snaps and low-disease occurrence was an important result
for understanding the influence of temperature on disease
abundance and for the prediction of disease outbreaks. An
exception to this general pattern was seen in a small group
of disease observations that corresponded to Cold Snap of
ca. 22.0uC-weeks. These surveys occurred during winter and
were therefore being compared with Cold Snap values from
almost one year before the surveys (i.e., before the preceding
summer). This large time interval made it likely that other
mechanisms intervened to exert greater influence on disease
abundance, such as the most recent winter-like temperatures.
Although we do not have a clear understanding of factors that
might have influenced WS abundance in these surveys, we are
constrained by the temporal frequency (annual, at best) of the
dataset. However, these outbreaks were smaller in magnitude
(,120 counts/1500 m2) and did occur following a warm summer
(Hot Snap .0uC-weeks) and at sites with very high Acropora spp.
Figure 4. Variation in white syndrome disease counts with coral cover and 4 km satellite metrics. The symbol shape and colour indicatewhether Acropora spp. coral cover was low: ,30% (open orange circle), or high: $30% (violet square). Dashed lines indicate the outbreak threshold(50 WS cases per 1500 m2). WS counts plotted against (a) Acropora spp. cover; (b) Hot Snap; (c) WSSTA; (d) Cold Snap; and (e) Winter Condition.doi:10.1371/journal.pone.0012210.g004
Hot Snaps and Coral Disease
PLoS ONE | www.plosone.org 7 August 2010 | Volume 5 | Issue 8 | e12210
cover (.45%). Thus WS abundance was more likely to have been
influenced by conditions during the preceding summer (6 months
prior to surveys) than by those of the preceding winter (12 months
prior to surveys).
Use of the Winter Condition metric as a pre-condition also
significantly improved the predictions from the algorithm. The
clustering of WS outbreaks at the centre of the range of Winter
Condition values (4.5uC-weeks; Fig. 4e) indicated that most WS
outbreaks followed mild winters. Winter Condition values
showed a positive offset, likely because early- or late-season
winter-like conditions were included within the period of
accumulation. These periods were most often warmer than the
winter-mean temperature. Mild Winter Condition values (2.5–
6.5uC-weeks) may increase the potential for pathogens to persist
through the winter, providing a larger population from which an
outbreak can develop. Low disease abundance coincided with
lower (cooler) Winter Condition values supporting the hypothesis
that cold winters reduce the likelihood of disease outbreak.
Interestingly, higher (warmer) values of the Winter Condition
metric (.6.5uC-weeks) also corresponded with low WS abun-
dance, suggesting that disease outbreaks did not occur following
warm winters. Such conditions may have improved host resilience,
potentially through mechanisms such as pathogen inhibition as a
consequence of antibiotic production [12], which may be
facilitated by warmer winters. Most climate change models
indicate that winter temperatures will increase more rapidly than
summer temperatures [28]. Although winter warming may allow
corals to develop stronger disease resistance, increasing winter
temperatures would also reduce the likelihood of Cold Snaps that
appear to decrease pathogen loads. Patterns in disease abundance
over more years and in a greater range of seasonal conditions are
needed to evaluate these alternative hypotheses. The three
outbreak values seen near a Winter Condition value of 26uC-
weeks were from the same winter surveys discussed in the Cold
Snap section. As stated above, the inconsistency of these points
from the Winter Condition pattern may have resulted from the
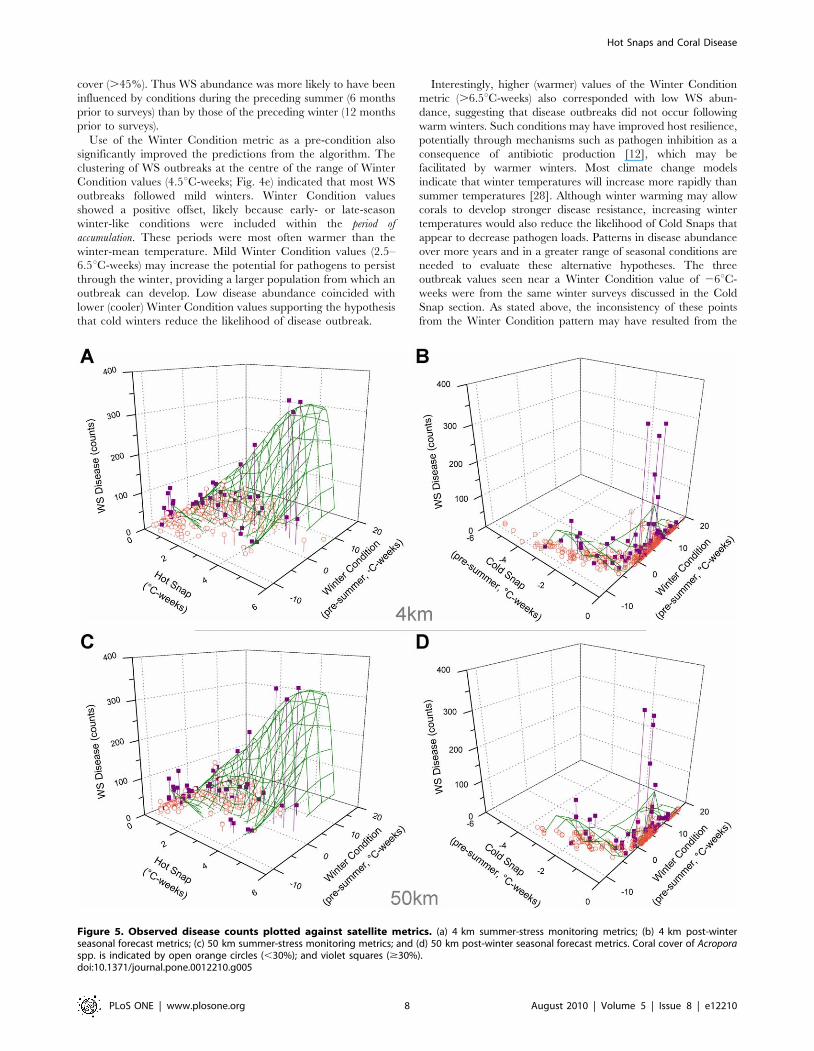
Figure 5. Observed disease counts plotted against satellite metrics. (a) 4 km summer-stress monitoring metrics; (b) 4 km post-winterseasonal forecast metrics; (c) 50 km summer-stress monitoring metrics; and (d) 50 km post-winter seasonal forecast metrics. Coral cover of Acroporaspp. is indicated by open orange circles (,30%); and violet squares ($30%).doi:10.1371/journal.pone.0012210.g005
Hot Snaps and Coral Disease
PLoS ONE | www.plosone.org 8 August 2010 | Volume 5 | Issue 8 | e12210
recent summer season conditions rather than conditions during
the prior winter, ca. one year earlier.
The greatest utility of the Winter Condition metric was to
improve prediction of non-outbreak events at locations and times
that did not experience mild winters. As described above, the Hot
Snap metric was used to infer the level of risk during summer
monitoring at the mild-winter locations. Each of the documented
disease outbreaks at high cover locations did coincide with Hot
Snap events; however, use of the Hot Snap alone without
consideration of the Winter Condition would have yielded a large
proportion (71%) of Hot Snap events not associated with
outbreaks (falsely predicting an outbreak). When outbreak
prediction required pre-conditioning by mild Winter Condition,
the rate of false predictions at high-cover locations dropped to
13%. While the mild-winter requirement failed to predict the
winter observations discussed above, it successfully selected the
most severe outbreaks. There may be a Hot Snap threshold that
overrides the requirement for a preceding mild Winter Condition;
should this exist, its identification would improve the prediction
system. However, we could not identify such a threshold with the
existing dataset. Incorporating mild Winter Condition (2.5–6.5uC-
weeks) improved the predictive ability of the near real-time
assessment of Outbreak Risk during summer (87% accuracy) over
the use of summer metrics alone (29% accuracy; Fig. 5a).
Disease risk associated with pathogen loading and the pre-
summer condition of the coral host can be assessed in advance of
an oncoming warm season. To this end, there is significant value
in considering the combination of Winter Condition and Cold
Snap metrics to estimate the risk of outbreak leading into the
summer period (i.e., a Seasonal Outlook). This combination of
metrics can be calculated several months in advance of any
subsequent warm stress and indicates pre-conditioning for
outbreaks. The rate of false outbreak predictions at high-cover
locations was reduced from 79% to 42% by including only
locations with mild Winter Condition (Fig. 5b). While the latter
rate of erroneous predictions was reduced, it remained too large
for the predictive tool to be definitive. However, by providing a
58% success in predicting outbreaks at high-cover sites, the
Seasonal Outlook provides a conservative but useful advance
notice of disease risk. Even at this skill level, the algorithm provides
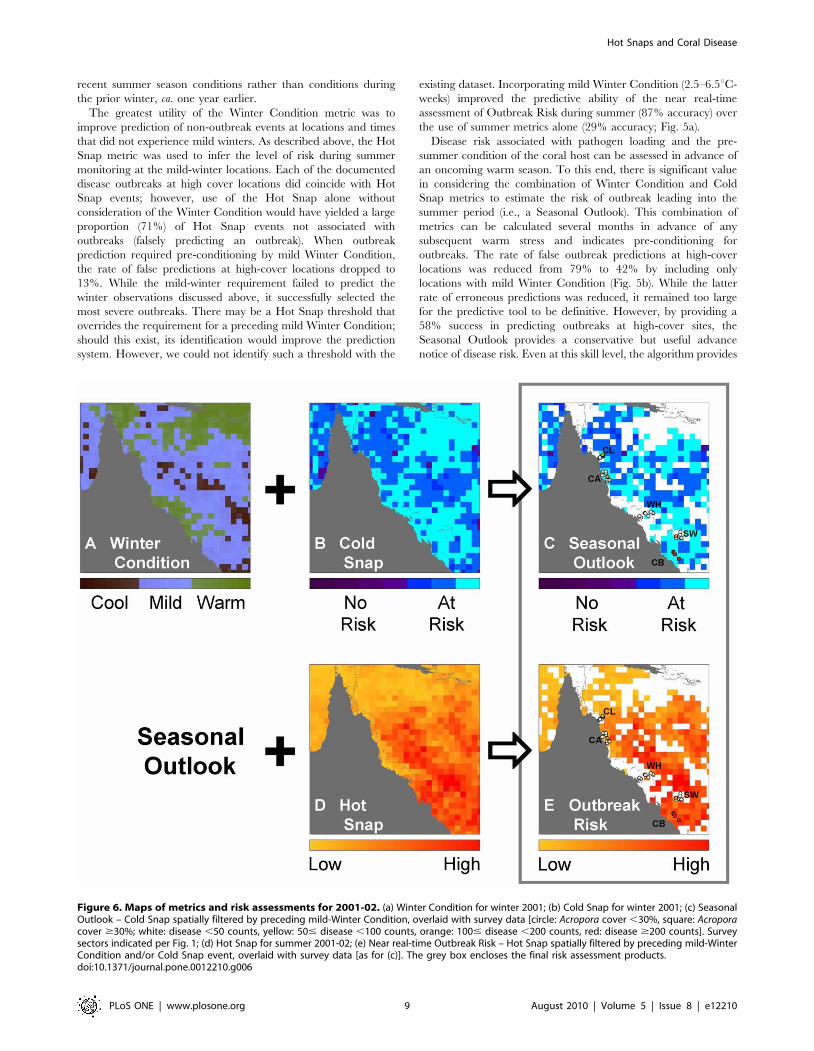
Figure 6. Maps of metrics and risk assessments for 2001-02. (a) Winter Condition for winter 2001; (b) Cold Snap for winter 2001; (c) SeasonalOutlook – Cold Snap spatially filtered by preceding mild-Winter Condition, overlaid with survey data [circle: Acropora cover ,30%, square: Acroporacover $30%; white: disease ,50 counts, yellow: 50# disease ,100 counts, orange: 100# disease ,200 counts, red: disease $200 counts]. Surveysectors indicated per Fig. 1; (d) Hot Snap for summer 2001-02; (e) Near real-time Outbreak Risk – Hot Snap spatially filtered by preceding mild-WinterCondition and/or Cold Snap event, overlaid with survey data [as for (c)]. The grey box encloses the final risk assessment products.doi:10.1371/journal.pone.0012210.g006
Hot Snaps and Coral Disease
PLoS ONE | www.plosone.org 9 August 2010 | Volume 5 | Issue 8 | e12210
substantial utility by alerting reef managers to the potential for
outbreaks. Additionally, a Seasonal Outlook can inform research
by directing survey efforts to target potentially at-risk areas.
The combination of metrics from the winter and summer
monitoring produced a system that provided both a Seasonal
Outlook at the end of winter and near real-time monitoring of the
Outbreak Risk through summer. The example in Fig. 6 shows the
condition that was hindcast for 2001–2002 using 50 km metrics.
The decision tree identified locations with mild Winter Condition
values (2.5–6.5uC-weeks, blue in Fig. 6a) from winter 2001 and
assessed risk if there was no Cold Snap (.20.5uC-weeks, Fig. 6b)
to provide a Seasonal Outlook (Fig. 6c), issued at the end of winter
2001. Leading into the subsequent summer (2001–2002), the
decision tree employed the Hot Snap values (Fig. 6d) at the at-risk
locations from the Seasonal Outlook to produce a map of
Outbreak Risk (Fig. 6e). This image would be updated in near
real-time as the summer progresses. Surveys conducted within the
six-month period centred at 18 Oct 2002 (overlaid on Fig. 6c,e)
showed that WS counts in the Capricorn-Bunkers (24uS) exceeded
those around Cooktown-Lizard Island (15uS), the Whitsundays
(20uS) and in the Swains (22uS), consistent with the patterns in the
risk maps. The surveys near Cairns (17uS) all had less then 30%
Acropora cover and illustrate the need to interpret the Outbreak
Risk using local coral community data.
Reducing spatial resolution of the satellite-SST data to 50 km
resolution (Fig. 5cd) did not substantially weaken the relationships
established between the temperature metrics and WS outbreaks
using 4 km data. Given that these quality-checked 4 km data are
only available retrospectively, the comparable predictive capacity
at the two spatial resolutions suggests that this approach can be
implemented to provide a coral disease outbreak risk assessment in
near real-time using existing operational data. Managers and
monitoring groups can use these to identify locations of potential
outbreaks and undertake management responses. While more
details on disease transmission and vectors will be needed to fully
develop and evaluate management actions, these could include
closures to minimize transport of pathogens among reefs and
reducing stressors that increase corals’ susceptibility to disease.
The statistics used to define the threshold for WS outbreak
provide a starting point for the development of thresholds for other
diseases and/or locations, although data on the onset and
development of a disease in each location would still be required.
Such data are needed to further understand the links between
temperature variations and disease abundance for each disease
type and each coral reef region. We expect that many
combinations of diseases and corals will behave differently,
however with more data we hope that some common patterns
will emerge. The outcomes of this study also highlight the need for
long-term monitoring programs to time their surveys to match
known or suspected causal factors (e.g., warm summer stress).
GBR surveys for WS would be best timed to occur shortly after the
end of summer to immediately follow stressful temperatures.
There is also a need to investigate links between disease
outbreak and other factors that may influence disease outbreak.
These include strong currents and/or wave activity that increase
turbulence; the abundance of disease transmission vectors,
including fish, divers and vessels; the distance from terrestrial
sources of nutrient input; and the time period required to flush the
surrounding waters.
The disease data used in this study are from only one group of
diseases (white syndromes) and in a region where there is distinct
seasonality in the temperature signal. The algorithm needs to be
tested and refined against other surveys of this disease for further
validation, in this and other locations, and against other diseases
that affect corals and other marine organisms before it should be
applied widely. However, the findings here are an important step
in identifying relationships that may exist between disease
outbreaks and the physical environment. More frequent monitor-
ing of all disease types is required to identify interannual and
seasonal variations that may be related to variations in
temperature. Fortunately, more organizations are now including
coral disease monitoring in their survey protocols. With careful
experimental design and regular data collection, approaches like
the one described here may be able to broadly provide advance
warning of coral disease through the use of satellite SST data.
Supporting Information
Figure S1 Variation in disease counts with 50 km satellite metrics.
The symbol shape and colour indicate whether Acropora spp. coral
cover was low: ,30% (open orange circle), or high: $30% (violet
square). Dashed lines indicate the outbreak threshold (50 WS cases
per 1500 m2). WS counts plotted against (a) Hot Snap; (b) Cold Snap;
and (c) Winter Condition.
Found at: doi:10.1371/journal.pone.0012210.s001 (1.75 MB
TIF)
Acknowledgments
We thank D. Harvell and J. Maynard for discussions in the development of
temperature metrics. Field observations were made under Research Permit
G06/19994.1 issued by the Great Barrier Reef Marine Park Authority.
The manuscript contents are solely the opinions of the authors and do not
constitute a statement of policy, decision, or position on behalf of NOAA or
the US Government.
Author Contributions
Conceived and designed the experiments: SFH BLW WS CAP. Performed
the experiments: SFH IRM. Analyzed the data: SFH BLW. Wrote the
paper: SFH BLW CME.
References
1. Hughes TP (1994) Catastrophes, phase-shifts, and large-scale degradation of a
Caribbean coral reef. Science 265: 1547–1551.
2. Precht WF, Aronson RB (2004) Climate flickers and range shifts of reef corals.
Frontiers in Ecology and the Environment 2: 307–314.
3. Harvell CD, Jordan-Dahlgren E, Merkel S, Rosenberg E, Raymundo L, et al.
(2007) Coral disease, environmental drivers and the balance between coral and
microbial associates. Oceanography 20: 58–81.
4. Jones RJ, Bowyer J, Hoegh-Guldberg O, Blackall LL (2004) Dynamics of a
temperature-related coral disease outbreak. Marine Ecology Progress Series 281:
63–77.
5. Lafferty KD, Porter JW, Ford SE (2004) Are diseases increasing in the ocean?
Annual Review of Ecology, Evolution, and Systematics 35: 31–54.
6. Brandt ME, McManus JW (2009) Dynamics and impact of the coral disease
white plague: insights from a simulation model. Diseases of Aquatic Organisms
87: 117–33.
7. Miller J, Muller E, Rogers C, Waara R, Atkinson A, et al. (2009) Coral disease
following massive bleaching in 2005 causes 60% decline in coral cover on reefs
in the US Virgin Islands. Coral Reefs 28: 925–937.
8. Willis B, Page C, Dinsdale E (2004) Coral disease on the Great Barrier Reef. In:
Rosenberg E, Loya Y, eds. Coral Health and Disease. Berlin: Springer. pp 69–104.
9. Sato Y, Bourne DG, Willis BL (2009) Dynamics of seasonal outbreaks of black
band disease in an assemblage of Montipora species at Pelorus Island (Great
Barrier Reef, Australia). Proceedings of the Royal Society of London B Biological
Sciences 276: 2795–2803.
10. Bruno JF, Selig ER, Casey KS, Page CA, Willis BL, et al. (2007) Thermal stress
and coral cover as drivers of coral disease outbreaks. PLoS Biology 5(6): e124.
doi:101371/journalpbio0050124.
11. Harvell CD, Mitchell CE, Ward JR, Altizer S, Dobson AP, et al. (2002) Climate
Warming and Disease Risks for Terrestrial and Marine Biota. Science 296:
2158–2162.
Hot Snaps and Coral Disease
PLoS ONE | www.plosone.org 10 August 2010 | Volume 5 | Issue 8 | e12210

12. Ritchie KB (2006) Regulation of microbial populations by coral surface mucus
and mucus-associated bacteria. Marine Ecology Progress Series 322: 1–14.
13. Mao-Jones J, Ritchie KB, Jones LE, Ellner SP (2010) How microbiol community
composition regulates coral disease development. PLoS Biology 8(3): e1000345.
14. Liu G, Strong AE, Skirving W (2003) Remote Sensing of Sea Surface
Temperatures During 2002 Barrier Reef Coral Bleaching. Eos, Transactions
84: 137–144.
15. Maynard JA, Turner PJ, Anthony KRN, Baird AH, Berkelmans R, et al. (2007)
ReefTemp: an interactive monitoring system for coral bleaching using high-
resolution SST and improved stress predictors. Geophysical Research Letters 35:
L05603. doi:101029/2007GL032175.
16. Hoegh-Guldberg O, Fine M (2004) Low temperatures cause coral bleaching.
Coral Reefs 23: 444.
17. Hoegh-Guldburg O, Fine M, Skirving W, Johnstone R, Dove S, et al. (2005)
Coral bleaching following wintry weather. Limnology and Oceanography 50:
265–271.
18. Sussman M, Willis BL, Victor S, Bourne DG (2008) Coral Pathogens Identified
for White Syndrome (WS) Epizootics in the Indo-Pacific. PLoS ONE 3(6):
e2393. doi:101371/journalpone0002393.
19. Harvell CD, Kim K, Burkholder JM, Colwell RR, Epstein PR, et al. (1999)
Emerging marine diseases – climate links and anthropogenic factors. Science
285: 1505–1510.
20. Sweatman H, Cheal A, Coleman G, Emslie M, Johns K, et al. (2008) Long-
Term Monitoring of the Great Barrier Reef: Status Report Number 8, 2008:
Australian Institute of Marine Science. 369 p.
21. Ninio R, Meekan MG, Done TJ, Sweatman HPA (2000) Temporal patterns in
coral assemblages on the Great Barrier Reef from local to large spatial scales.Marine Ecology Progress Series 194: 65–74.
22. Ninio R, Meekan MG (2002) Spatial patterns in benthic communities and the
dynamics of a mosaic ecosystem on the Great Barrier Reef, Australia. CoralReefs 21: 95–104.
23. Wobeser GA (2006) Essentials of disease in wild animals. Ames, Iowa: BlackwellPublishing. 243 p.
24. Kilpatrick KA, Podesta GP, Evans R (2001) Overview of the NOAA/NASA
advanced very high resolution radiometer Pathfinder algorithm for sea surfacetemperature and associated matchup database. Journal of Geophysical Research
106: 9179–9197.25. Skirving WJ, Strong AE, Liu G, Liu C, Arzayus F, et al. (2006) Extreme events
and perturbations of coastal ecosystems: Sea surface temperature change andcoral bleaching. In: Richardson LL, LeDrew EF, eds. Remote Sensing of
Aquatic Coastal Ecosystem Processes. Berlin: Springer. pp 11–25.
26. Eakin CM, Lough JM, Heron SF (2009) Climate, Weather and Coral Bleaching.In: Van Oppen MJH, Lough JM, eds. Coral Bleaching: Patterns, Processes,
Causes and Consequences, Ecological Studies 205. Berlin: Springer-Verlag. pp41–67.
27. Kirkwood CW Decision Tree Primer. Arizona State University. Available:
http://www.public.asu.edu/ kirkwood/DAStuff/decisiontrees/index.html viathe Internet. Accessed 23 Feb 2010.
28. IPCC (2007) Climate Change 2007: Synthesis Report.Contribution of WorkingGroups I, II and III to the Fourth Assessment Report of the Intergovernmental
Panel on Climate Change [Core Writing Team, Pachauri RK, Reisinger A,editors] Geneva: IPCC. 104 p.
Hot Snaps and Coral Disease
PLoS ONE | www.plosone.org 11 August 2010 | Volume 5 | Issue 8 | e12210
Related Documents