INTRODUCTION The study of business statistics is important, valuable, and interesting. However, because it involves a new language of terms, symbols, logic, and application of mathematics, it can be at times overwhelming. For many students, this text is their first and only introduction to business statistics, which instructors often teach as a “survey course.” That is, the student is presented with an overview of the subject, including a waterfront of tech- niques, concepts, and formulas. One of the main difficulties in studying business statistics in this way is to be able to see “the forest for the trees,” that is, sorting out the myriad of topics so they make sense. With this in mind, the 18 chapters of this text have been organized into five units with each unit containing chapters that tend to present similar material. At the beginning of each unit, there is an introduction presenting the overlying themes to those chapters. Unit I is titled Introduction because the four chapters (1–4) contained therein “introduce” the study of business statistics. In Chapter 1, students will learn what statistics are, the concepts of descriptive and inferential statistics, and levels of data measurement. In Chapter 2, students will see how raw data can be organized using various graphical and tabular tech- niques to facilitate their use in making better business decisions. Chapter 3 introduces some essential and basic statistics that will be used to both summarize data and as tools for techniques introduced later in the text. There will also be discussion of distribution shapes. In Chapter 4, the basic laws of probability are presented. The notion of probability underlies virtu- ally every business statistics topic, distribution, and technique, thereby making it important to acquire an appreciation and understanding of prob- ability. In Unit I, the first four chapters, we are developing “building blocks” that will enable students to understand and apply statistical con- cepts to analyze data that can assist present and future business managers in making better decisions. UNIT I COPYRIGHTED MATERIAL

Welcome message from author
This document is posted to help you gain knowledge. Please leave a comment to let me know what you think about it! Share it to your friends and learn new things together.
Transcript
INTRODUCTION
The study of business statistics is important, valuable, and interesting.However, because it involves a new language of terms, symbols, logic, andapplication of mathematics, it can be at times overwhelming. For manystudents, this text is their first and only introduction to business statistics,which instructors often teach as a “survey course.” That is, the student ispresented with an overview of the subject, including a waterfront of tech-niques, concepts, and formulas. One of the main difficulties in studyingbusiness statistics in this way is to be able to see “the forest for the trees,”that is, sorting out the myriad of topics so they make sense. With this inmind, the 18 chapters of this text have been organized into five units witheach unit containing chapters that tend to present similar material. At thebeginning of each unit, there is an introduction presenting the overlyingthemes to those chapters.
Unit I is titled Introduction because the four chapters (1–4) containedtherein “introduce” the study of business statistics. In Chapter 1, studentswill learn what statistics are, the concepts of descriptive and inferentialstatistics, and levels of data measurement. In Chapter 2, students will seehow raw data can be organized using various graphical and tabular tech-niques to facilitate their use in making better business decisions. Chapter3 introduces some essential and basic statistics that will be used to bothsummarize data and as tools for techniques introduced later in the text.There will also be discussion of distribution shapes. In Chapter 4, the basiclaws of probability are presented. The notion of probability underlies virtu-ally every business statistics topic, distribution, and technique, therebymaking it important to acquire an appreciation and understanding of prob-ability. In Unit I, the first four chapters, we are developing “buildingblocks” that will enable students to understand and apply statistical con-cepts to analyze data that can assist present and future business managersin making better decisions.
UNIT I
c01IntroductionToStatistics.qxd 7/26/13 6:50 PM Page 1
COPYRIG
HTED M
ATERIAL
C H A P T E R 1
Introduction to Statistics
LEARNING OBJECTIVES
The primary objective of Chapter 1 is to introduce you to the world of statistics, thereby enabling you to:
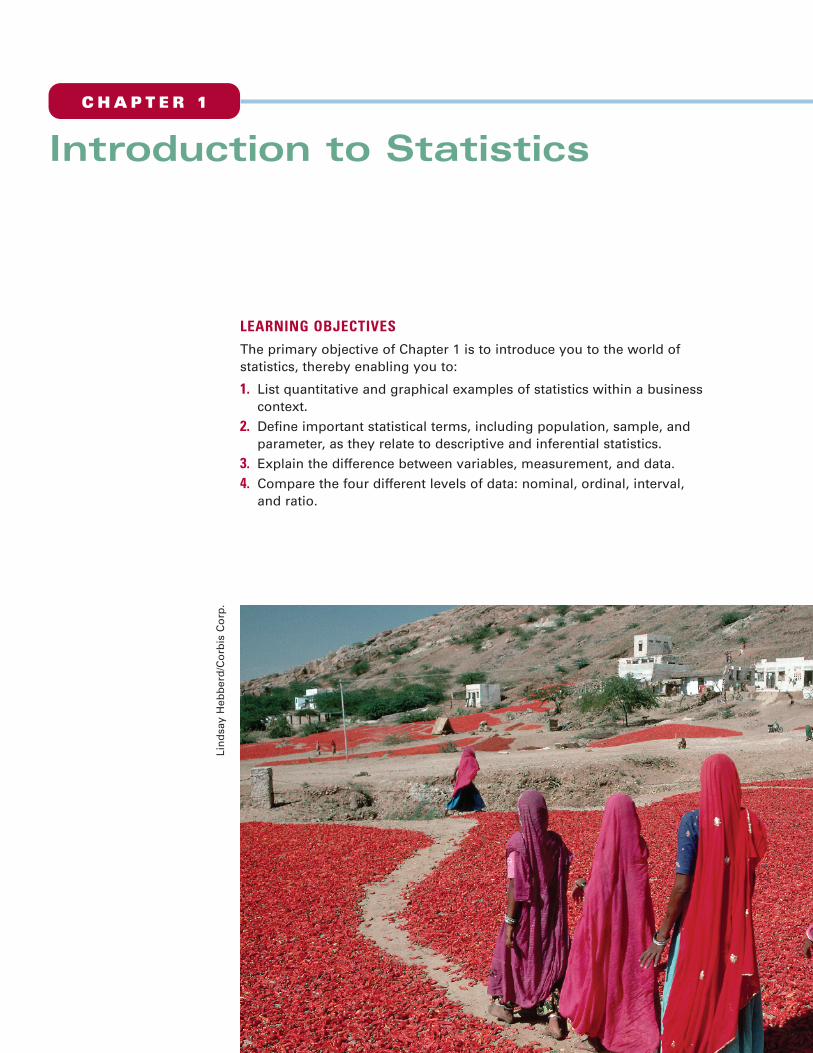
1. List quantitative and graphical examples of statistics within a businesscontext.
2. Define important statistical terms, including population, sample, andparameter, as they relate to descriptive and inferential statistics.
3. Explain the difference between variables, measurement, and data.
4. Compare the four different levels of data: nominal, ordinal, interval, and ratio.
Lin
dsa
y H
ebb
erd
/Co
rbis
Co
rp.
c01IntroductionToStatistics.qxd 7/26/13 6:52 PM Page 2
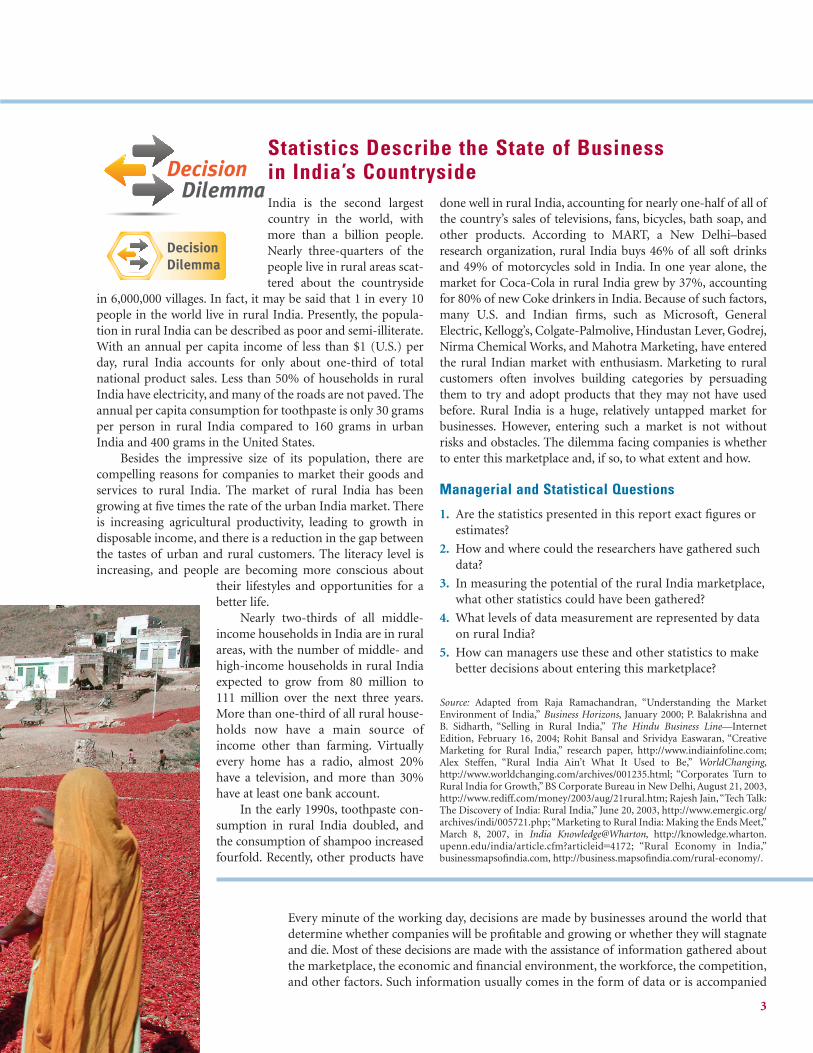
India is the second largestcountry in the world, withmore than a billion people.Nearly three-quarters of thepeople live in rural areas scat-tered about the countryside
in 6,000,000 villages. In fact, it may be said that 1 in every 10people in the world live in rural India. Presently, the popula-tion in rural India can be described as poor and semi-illiterate.With an annual per capita income of less than $1 (U.S.) perday, rural India accounts for only about one-third of totalnational product sales. Less than 50% of households in ruralIndia have electricity, and many of the roads are not paved. Theannual per capita consumption for toothpaste is only 30 gramsper person in rural India compared to 160 grams in urbanIndia and 400 grams in the United States.
Besides the impressive size of its population, there arecompelling reasons for companies to market their goods andservices to rural India. The market of rural India has beengrowing at five times the rate of the urban India market. Thereis increasing agricultural productivity, leading to growth indisposable income, and there is a reduction in the gap betweenthe tastes of urban and rural customers. The literacy level isincreasing, and people are becoming more conscious about
their lifestyles and opportunities for abetter life.
Nearly two-thirds of all middle-income households in India are in ruralareas, with the number of middle- andhigh-income households in rural Indiaexpected to grow from 80 million to111 million over the next three years.More than one-third of all rural house-holds now have a main source ofincome other than farming. Virtuallyevery home has a radio, almost 20%have a television, and more than 30%have at least one bank account.
In the early 1990s, toothpaste con-sumption in rural India doubled, andthe consumption of shampoo increasedfourfold. Recently, other products have
done well in rural India, accounting for nearly one-half of all ofthe country’s sales of televisions, fans, bicycles, bath soap, andother products. According to MART, a New Delhi–basedresearch organization, rural India buys 46% of all soft drinksand 49% of motorcycles sold in India. In one year alone, themarket for Coca-Cola in rural India grew by 37%, accountingfor 80% of new Coke drinkers in India. Because of such factors,many U.S. and Indian firms, such as Microsoft, GeneralElectric, Kellogg’s, Colgate-Palmolive, Hindustan Lever, Godrej,Nirma Chemical Works, and Mahotra Marketing, have enteredthe rural Indian market with enthusiasm. Marketing to ruralcustomers often involves building categories by persuadingthem to try and adopt products that they may not have usedbefore. Rural India is a huge, relatively untapped market forbusinesses. However, entering such a market is not withoutrisks and obstacles. The dilemma facing companies is whetherto enter this marketplace and, if so, to what extent and how.
Managerial and Statistical Questions
1. Are the statistics presented in this report exact figures orestimates?
2. How and where could the researchers have gathered suchdata?
3. In measuring the potential of the rural India marketplace,what other statistics could have been gathered?
4. What levels of data measurement are represented by dataon rural India?
5. How can managers use these and other statistics to makebetter decisions about entering this marketplace?
Source: Adapted from Raja Ramachandran, “Understanding the MarketEnvironment of India,” Business Horizons, January 2000; P. Balakrishna and B. Sidharth, “Selling in Rural India,” The Hindu Business Line—InternetEdition, February 16, 2004; Rohit Bansal and Srividya Easwaran, “CreativeMarketing for Rural India,” research paper, http://www.indiainfoline.com;Alex Steffen, “Rural India Ain’t What It Used to Be,” WorldChanging,http://www.worldchanging.com/archives/001235.html; “Corporates Turn toRural India for Growth,” BS Corporate Bureau in New Delhi, August 21, 2003,http://www.rediff.com/money/2003/aug/21rural.htm; Rajesh Jain,“Tech Talk:The Discovery of India: Rural India,” June 20, 2003, http://www.emergic.org/archives/indi/005721.php; “Marketing to Rural India: Making the Ends Meet,”March 8, 2007, in India Knowledge@Wharton, http://knowledge.wharton.upenn.edu/india/article.cfm?articleid=4172; “Rural Economy in India,”businessmapsofindia.com, http://business.mapsofindia.com/rural-economy/.
3
Statistics Describe the State of Business in India’s Countryside
Every minute of the working day, decisions are made by businesses around the world thatdetermine whether companies will be profitable and growing or whether they will stagnateand die. Most of these decisions are made with the assistance of information gathered aboutthe marketplace, the economic and financial environment, the workforce, the competition,and other factors. Such information usually comes in the form of data or is accompanied
c01IntroductionToStatistics.qxd 7/26/13 6:52 PM Page 3
4 Chapter 1 Introduction to Statistics
Virtually every area of business uses statistics in decision making. Here are some recentexamples:
■ According to a TNS Retail Forward ShopperScape survey, the average amountspent by a shopper on electronics in a three-month period is $629 at Circuit City,$504 at Best Buy, $246 at Walmart, $172 at Target, and $120 at RadioShack.
■ A survey of 1465 workers by Hotjobs reports that 55% of workers believe that thequality of their work is perceived the same when they work remotely as when theyare physically in the office.
■ A survey of 477 executives by the Association of Executive Search Consultantsdetermined that 48% of men and 67% of women say they are more likely to negotiate for less business travel compared with five years ago.
■ A survey of 1007 adults by RBC Capital Markets showed that 37% of adults wouldbe willing to drive 5 to 10 miles to save 20 cents on a gallon of gas.
■ A Deloitte Retail “Green” survey of 1080 adults revealed that 54% agreed that plastic, non-compostable shopping bags should be banned.
■ A recent Household Economic Survey by Statistics New Zealand determined thatthe average weekly household net expenditure in New Zealand was $956 and thathouseholds in the Wellington region averaged $120 weekly on recreation and culture. In addition, 75% of all households were satisfied or very satisfied withtheir material standard of living.
■ The Experience’s Life After College survey of 320 recent college graduates showedthat 58% moved back home after college. Thirty-two percent then remained athome for more than a year.
STATISTICS IN BUSINESS
by data. Business statistics provides the tool through which such data are collected, ana-lyzed, summarized, and presented to facilitate the decision-making process, and businessstatistics plays an important role in the ongoing saga of decision making within thedynamic world of business.
Nic
k M
Do
/Ph
oto
dis
c/G
etty
Imag
es, I
nc.
Will
iam
Kin
g/T
he
Imag
e B
ank
/G
etty
Imag
es, I
nc.
Co
mst
ock
/Get
ty Im
ages
, In
c.
1.1
c01IntroductionToStatistics.qxd 7/26/13 6:53 PM Page 4
1.2 Basic Statistical Concepts 5
You can see from these few examples that there is a wide variety of uses and applications ofstatistics in business. Note that in most of these examples, business researchers have con-ducted a study and provided us rich and interesting information.
In this text we will examine several types of graphs for depicting data as we study waysto arrange or structure data into forms that are both meaningful and useful to decisionmakers. We will learn about techniques for sampling from a population that allow studiesof the business world to be conducted more inexpensively and in a more timely manner.We will explore various ways to forecast future values and examine techniques for predict-ing trends. This text also includes many statistical tools for testing hypotheses and forestimating population values. These and many other exciting statistics and statistical tech-niques await us on this journey through business statistics. Let us begin.
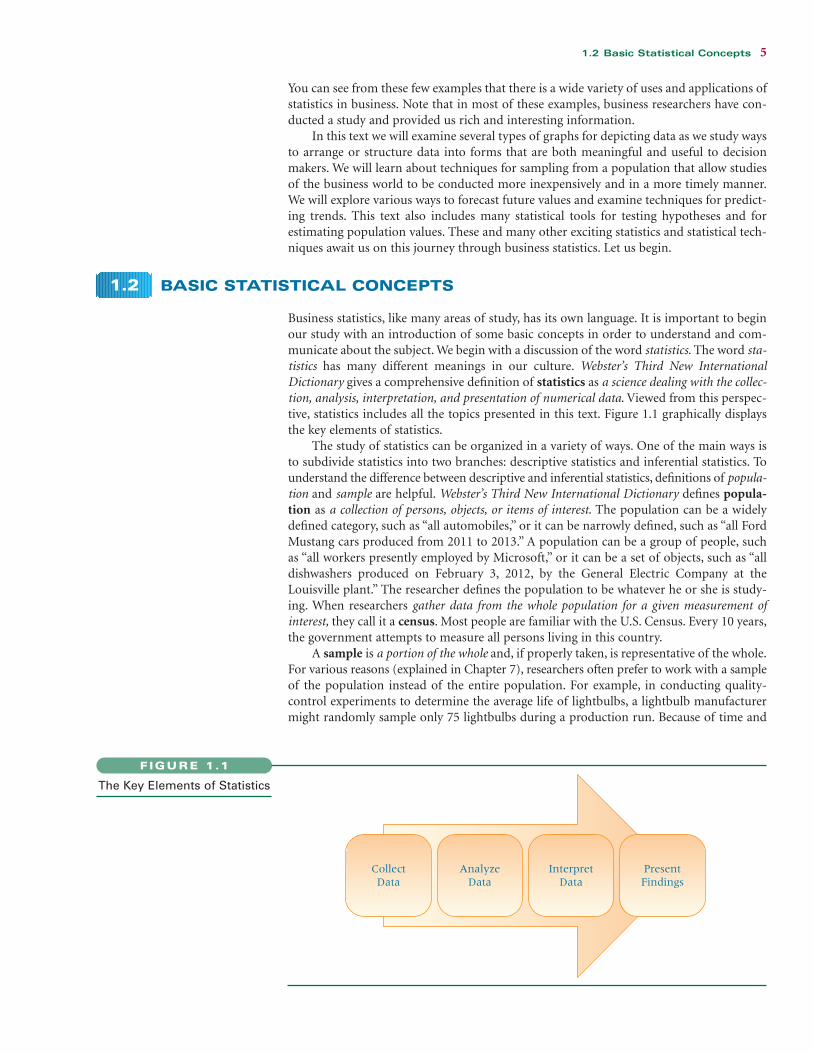
Business statistics, like many areas of study, has its own language. It is important to beginour study with an introduction of some basic concepts in order to understand and com-municate about the subject. We begin with a discussion of the word statistics. The word sta-tistics has many different meanings in our culture. Webster’s Third New InternationalDictionary gives a comprehensive definition of statistics as a science dealing with the collec-tion, analysis, interpretation, and presentation of numerical data. Viewed from this perspec-tive, statistics includes all the topics presented in this text. Figure 1.1 graphically displaysthe key elements of statistics.
The study of statistics can be organized in a variety of ways. One of the main ways isto subdivide statistics into two branches: descriptive statistics and inferential statistics. Tounderstand the difference between descriptive and inferential statistics, definitions of popula-tion and sample are helpful. Webster’s Third New International Dictionary defines popula-tion as a collection of persons, objects, or items of interest. The population can be a widelydefined category, such as “all automobiles,” or it can be narrowly defined, such as “all FordMustang cars produced from 2011 to 2013.” A population can be a group of people, suchas “all workers presently employed by Microsoft,” or it can be a set of objects, such as “alldishwashers produced on February 3, 2012, by the General Electric Company at theLouisville plant.” The researcher defines the population to be whatever he or she is study-ing. When researchers gather data from the whole population for a given measurement ofinterest, they call it a census. Most people are familiar with the U.S. Census. Every 10 years,the government attempts to measure all persons living in this country.
A sample is a portion of the whole and, if properly taken, is representative of the whole.For various reasons (explained in Chapter 7), researchers often prefer to work with a sampleof the population instead of the entire population. For example, in conducting quality-control experiments to determine the average life of lightbulbs, a lightbulb manufacturermight randomly sample only 75 lightbulbs during a production run. Because of time and
BASIC STATISTICAL CONCEPTS1.2
The Key Elements of Statistics
FIGURE 1.1
CollectData
AnalyzeData
InterpretData
PresentFindings
c01IntroductionToStatistics.qxd 7/26/13 6:53 PM Page 5
6 Chapter 1 Introduction to Statistics
money limitations, a human resources manager might take a random sample of 40 employeesinstead of using a census to measure company morale.
If a business analyst is using data gathered on a group to describe or reach conclusionsabout that same group, the statistics are called descriptive statistics. For example, if aninstructor produces statistics to summarize a class’s examination effort and uses those sta-tistics to reach conclusions about that class only, the statistics are descriptive.
Many of the statistical data generated by businesses are descriptive. They mightinclude number of employees on vacation during June, average salary at the Denver office,corporate sales for 2013, average managerial satisfaction score on a company-wide censusof employee attitudes, and average return on investment for the Lofton Company for theyears 1992 through 2012.
Another type of statistics is called inferential statistics. If a researcher gathers datafrom a sample and uses the statistics generated to reach conclusions about the population fromwhich the sample was taken, the statistics are inferential statistics. The data gathered fromthe sample are used to infer something about a larger group. Inferential statistics are some-times referred to as inductive statistics. The use and importance of inferential statistics con-tinue to grow.
One application of inferential statistics is in pharmaceutical research. Some new drugsare expensive to produce, and therefore tests must be limited to small samples of patients.Utilizing inferential statistics, researchers can design experiments with small randomlyselected samples of patients and attempt to reach conclusions and make inferences aboutthe population.
Market researchers use inferential statistics to study the impact of advertising onvarious market segments. Suppose a soft drink company creates an advertisement depict-ing a dispensing machine that talks to the buyer, and market researchers want to meas-ure the impact of the new advertisement on various age groups. The researcher couldstratify the population into age categories ranging from young to old, randomly sampleeach stratum, and use inferential statistics to determine the effectiveness of the advertise-ment for the various age groups in the population. The advantage of using inferentialstatistics is that they enable the researcher to study effectively a wide range of phenom-ena without having to conduct a census. Most of the topics discussed in this text pertainto inferential statistics.
A descriptive measure of the population is called a parameter. Parameters are usuallydenoted by Greek letters. Examples of parameters are population mean ( ), populationvariance ( ), and population standard deviation ( ). A descriptive measure of a sample iscalled a statistic. Statistics are usually denoted by Roman letters. Examples of statistics aresample mean ( ), sample variance (s 2), and sample standard deviation (s).
Differentiation between the terms parameter and statistic is important only in the useof inferential statistics. A business researcher often wants to estimate the value of a param-eter or conduct tests about the parameter. However, the calculation of parameters is usu-ally either impossible or infeasible because of the amount of time and money required totake a census. In such cases, the business researcher can take a random sample of thepopulation, calculate a statistic on the sample, and infer by estimation the value of theparameter. The basis for inferential statistics, then, is the ability to make decisions aboutparameters without having to complete a census of the population.
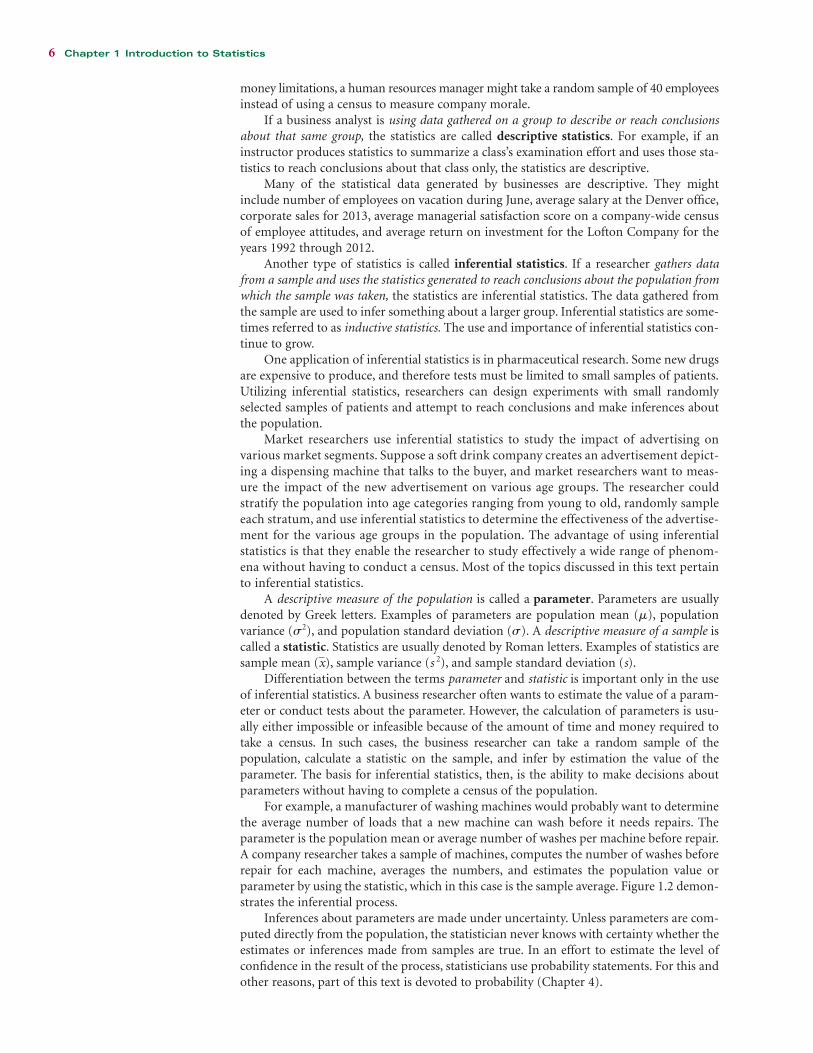
For example, a manufacturer of washing machines would probably want to determinethe average number of loads that a new machine can wash before it needs repairs. Theparameter is the population mean or average number of washes per machine before repair.A company researcher takes a sample of machines, computes the number of washes beforerepair for each machine, averages the numbers, and estimates the population value orparameter by using the statistic, which in this case is the sample average. Figure 1.2 demon-strates the inferential process.
Inferences about parameters are made under uncertainty. Unless parameters are com-puted directly from the population, the statistician never knows with certainty whether theestimates or inferences made from samples are true. In an effort to estimate the level ofconfidence in the result of the process, statisticians use probability statements. For this andother reasons, part of this text is devoted to probability (Chapter 4).
x
ss2m
c01IntroductionToStatistics.qxd 7/26/13 6:53 PM Page 6
1.4 Data Measurement 7
The Inferential Process
FIGURE 1.2
Millions of numerical data are gathered in businesses every day, representing myriad items.For example, numbers represent dollar costs of items produced, geographical locations ofretail outlets, weights of shipments, and rankings of subordinates at yearly reviews. All suchdata should not be analyzed the same way statistically because the entities represented bythe numbers are different. For this reason, the business researcher needs to know the levelof data measurement represented by the numbers being analyzed.
DATA MEASUREMENT
VARIABLES AND DATA
Business statistics is about measuring phenomena in the business world and organizing,analyzing, and presenting the resulting numerical information in such a way such that better,more informed business decisions can be made. Most business statistics studies containvariables, measurements, and data.
In business statistics, a variable is a characteristic of any entity being studied that iscapable of taking on different values. Some examples of variables in business might includereturn on investment, advertising dollars, labor productivity, stock price, historical cost,total sales, market share, age of worker, earnings per share, miles driven to work, time spentin store shopping, and many, many others. In business statistics studies, most variables pro-duce a measurement that can be used for analysis. A measurement is when a standardprocess is used to assign numbers to particular attributes or characteristics of a variable. Manymeasurements are obvious, such as time spent in a store shopping by a customer, age of theworker, or the number of miles driven to work. However, some measurements, such aslabor productivity, customer satisfaction, and return on investment, have to be defined bythe business researcher or by experts within the field. Once such measurements arerecorded and stored, they can be denoted as “data.” It can be said that data are recordedmeasurements. The processes of measuring and data gathering are basic to all that we do inbusiness statistics. It is data that are analyzed by a business statistician in order to learnmore about the variables being studied. Sometimes, sets of data are organized into data-bases as a way to store data or as a means for more conveniently analyzing data or compar-ing variables. Valid data are the lifeblood of business statistics, and it is important that thebusiness researcher give thoughtful attention to the creation of meaningful, valid databefore embarking on analysis and reaching conclusions.
1.3
1.4
Select a random sample fromthe population
Populationm
(parameter)
Calculate x to estimate m
Samplex
(statistic)
c01IntroductionToStatistics.qxd 7/26/13 6:53 PM Page 7
8 Chapter 1 Introduction to Statistics
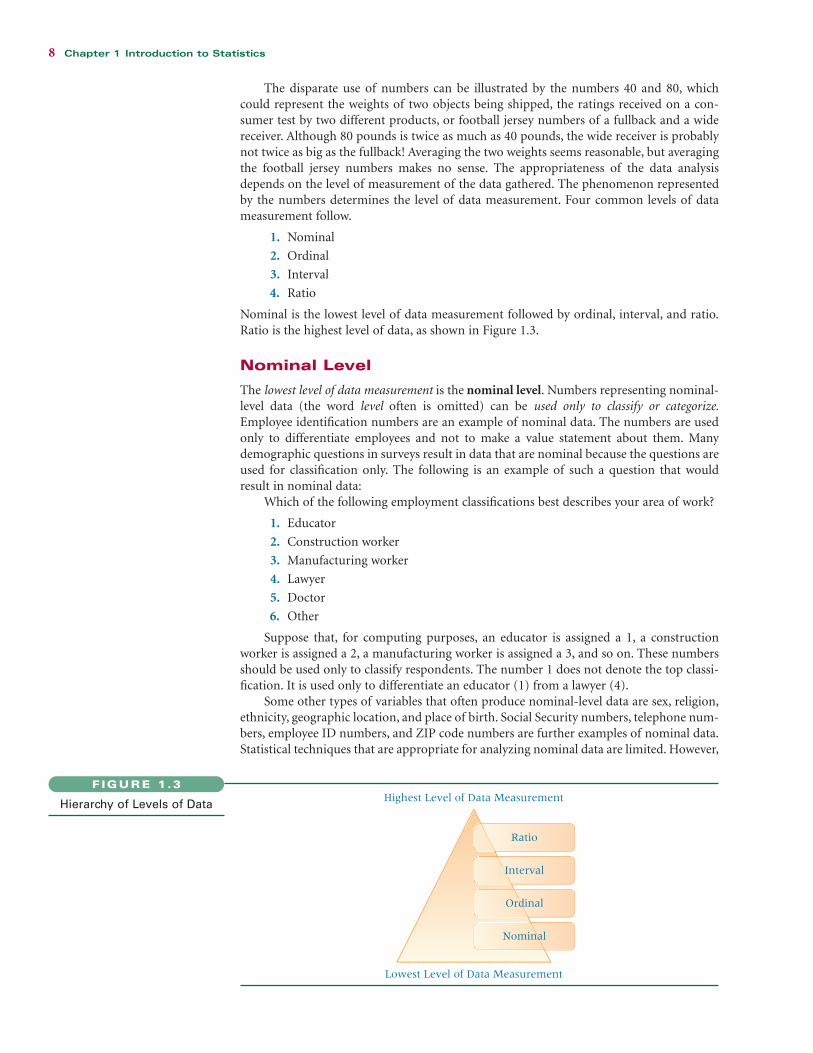
The disparate use of numbers can be illustrated by the numbers 40 and 80, whichcould represent the weights of two objects being shipped, the ratings received on a con-sumer test by two different products, or football jersey numbers of a fullback and a widereceiver. Although 80 pounds is twice as much as 40 pounds, the wide receiver is probablynot twice as big as the fullback! Averaging the two weights seems reasonable, but averagingthe football jersey numbers makes no sense. The appropriateness of the data analysisdepends on the level of measurement of the data gathered. The phenomenon representedby the numbers determines the level of data measurement. Four common levels of datameasurement follow.
1. Nominal
2. Ordinal
3. Interval
4. Ratio
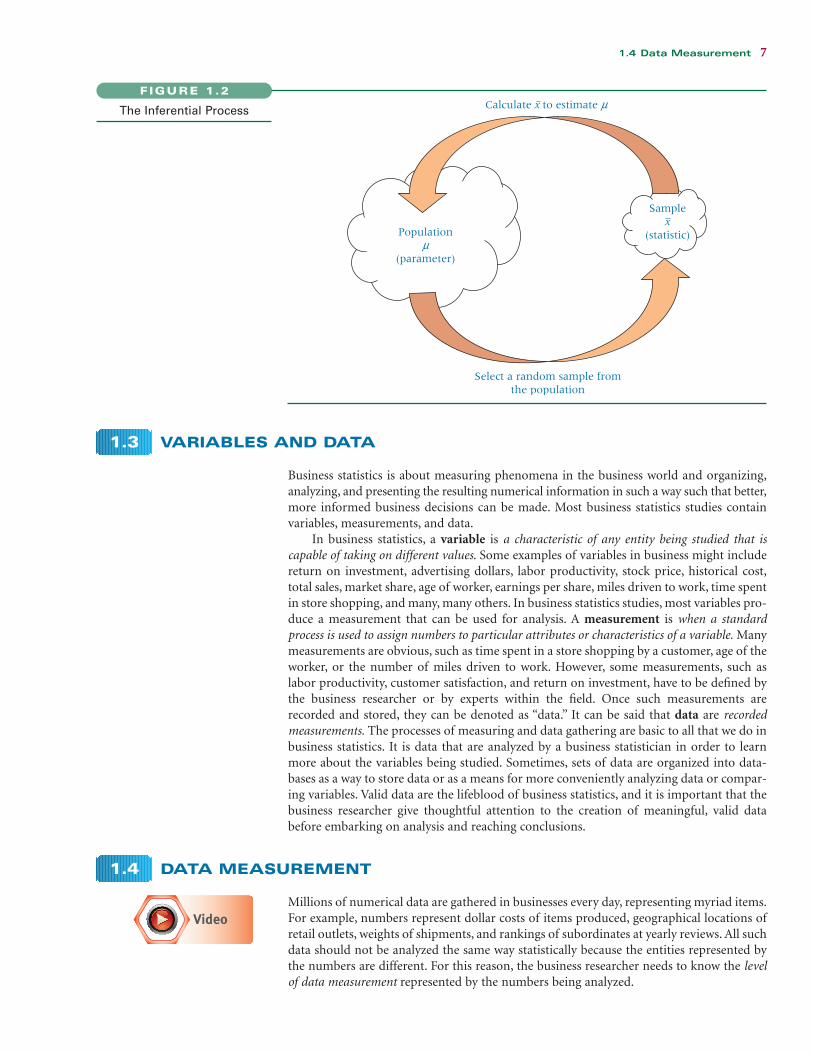
Nominal is the lowest level of data measurement followed by ordinal, interval, and ratio.Ratio is the highest level of data, as shown in Figure 1.3.
Nominal Level
The lowest level of data measurement is the nominal level. Numbers representing nominal-level data (the word level often is omitted) can be used only to classify or categorize.Employee identification numbers are an example of nominal data. The numbers are usedonly to differentiate employees and not to make a value statement about them. Manydemographic questions in surveys result in data that are nominal because the questions areused for classification only. The following is an example of such a question that wouldresult in nominal data:
Which of the following employment classifications best describes your area of work?
1. Educator
2. Construction worker
3. Manufacturing worker
4. Lawyer
5. Doctor
6. Other
Suppose that, for computing purposes, an educator is assigned a 1, a constructionworker is assigned a 2, a manufacturing worker is assigned a 3, and so on. These numbersshould be used only to classify respondents. The number 1 does not denote the top classi-fication. It is used only to differentiate an educator (1) from a lawyer (4).
Some other types of variables that often produce nominal-level data are sex, religion,ethnicity, geographic location, and place of birth. Social Security numbers, telephone num-bers, employee ID numbers, and ZIP code numbers are further examples of nominal data.Statistical techniques that are appropriate for analyzing nominal data are limited. However,
Hierarchy of Levels of Data
FIGURE 1.3
Ratio
Interval
Ordinal
Nominal
Lowest Level of Data Measurement
Highest Level of Data Measurement
c01IntroductionToStatistics.qxd 7/26/13 6:53 PM Page 8
1.4 Data Measurement 9
some of the more widely used statistics, such as the chi-square statistic, can be applied tonominal data, often producing useful information.
Ordinal Level
Ordinal-level data measurement is higher than the nominal level. In addition to thenominal-level capabilities, ordinal-level measurement can be used to rank or order peopleor objects. For example, using ordinal data, a supervisor can evaluate three employeesby ranking their productivity with the numbers 1 through 3. The supervisor could iden-tify one employee as the most productive, one as the least productive, and one as some-where between by using ordinal data. However, the supervisor could not use ordinaldata to establish that the intervals between the employees ranked 1 and 2 and betweenthe employees ranked 2 and 3 are equal; that is, she could not say that the differences inthe amount of productivity between workers ranked 1, 2, and 3 are necessarily the same.With ordinal data, the distances or spacing represented by consecutive numbers are notalways equal.
Some questionnaire Likert-type scales are considered by many researchers to be ordi-nal in level. The following is an example of one such scale:
This computer tutorial is ___not
helpful
1
___somewhat
helpful
2
___moderately
helpful
3
___very
helpful
4
___extremely
helpful
5
When this survey question is coded for the computer, only the numbers 1 through 5will remain, not the adjectives. Virtually everyone would agree that a 5 is higher than a 4on this scale and that ranking responses is possible. However, most respondents would notconsider the differences between not helpful, somewhat helpful, moderately helpful, veryhelpful, and extremely helpful to be equal.
Mutual funds as investments are sometimes rated in terms of risk by using measuresof default risk, currency risk, and interest rate risk. These three measures are applied toinvestments by rating them as having high, medium, and low risk. Suppose high risk isassigned a 3, medium risk a 2, and low risk a 1. If a fund is awarded a 3 rather than a 2, itcarries more risk, and so on. However, the differences in risk between categories 1, 2, and3 are not necessarily equal. Thus, these measurements of risk are only ordinal-level meas-urements. Another example of the use of ordinal numbers in business is the ranking of thetop 50 most admired companies in Fortune magazine. The numbers ranking the companiesare only ordinal in measurement. Certain statistical techniques are specifically suited toordinal data, but many other techniques are not appropriate for use on ordinal data. Forexample, it does not make sense to say that the average of “moderately helpful” and “veryhelpful” is “moderately helpful and a half.”
Because nominal and ordinal data are often derived from imprecise measurementssuch as demographic questions, the categorization of people or objects, or the ranking ofitems, nominal and ordinal data are nonmetric data and are sometimes referred to as qual-itative data.
Interval Level
Interval-level data measurement is the next to the highest level of data in which the dis-tances between consecutive numbers have meaning and the data are always numerical.The distances represented by the differences between consecutive numbers are equal; thatis, interval data have equal intervals. An example of interval measurement is Fahrenheittemperature. With Fahrenheit temperature numbers, the temperatures can be ranked, andthe amounts of heat between consecutive readings, such as 20�, 21�, and 22�, are the same.
In addition, with interval-level data, the zero point is a matter of convention or con-venience and not a natural or fixed zero point. Zero is just another point on the scale anddoes not mean the absence of the phenomenon. For example, zero degrees Fahrenheit isnot the lowest possible temperature. Some other examples of interval-level data are the
c01IntroductionToStatistics.qxd 7/26/13 6:53 PM Page 9
10 Chapter 1 Introduction to Statistics
percentage change in employment, the percentage return on a stock, and the dollar changein stock price.
Ratio Level
Ratio-level data measurement is the highest level of data measurement. Ratio data have thesame properties as interval data, but ratio data have an absolute zero, and the ratio of twonumbers is meaningful. The notion of absolute zero means that zero is fixed, and the zero valuein the data represents the absence of the characteristic being studied. The value of zero can-not be arbitrarily assigned because it represents a fixed point. This definition enables thestatistician to create ratios with the data.
Examples of ratio data are height, weight, time, volume, and Kelvin temperature. Withratio data, a researcher can state that 180 pounds of weight is twice as much as 90 poundsor, in other words, make a ratio of 180:90. Many of the data measured by valves or gaugesin industry are ratio data.
Other examples in the business world that are ratio level in measurement are produc-tion cycle time, work measurement time, passenger miles, number of trucks sold, complaintsper 10,000 fliers, and number of employees.
Because interval- and ratio-level data are usually gathered by precise instruments oftenused in production and engineering processes, in national standardized testing, or in stan-dardized accounting procedures, they are called metric data and are sometimes referred toas quantitative data.
Comparison of the Four Levels of Data
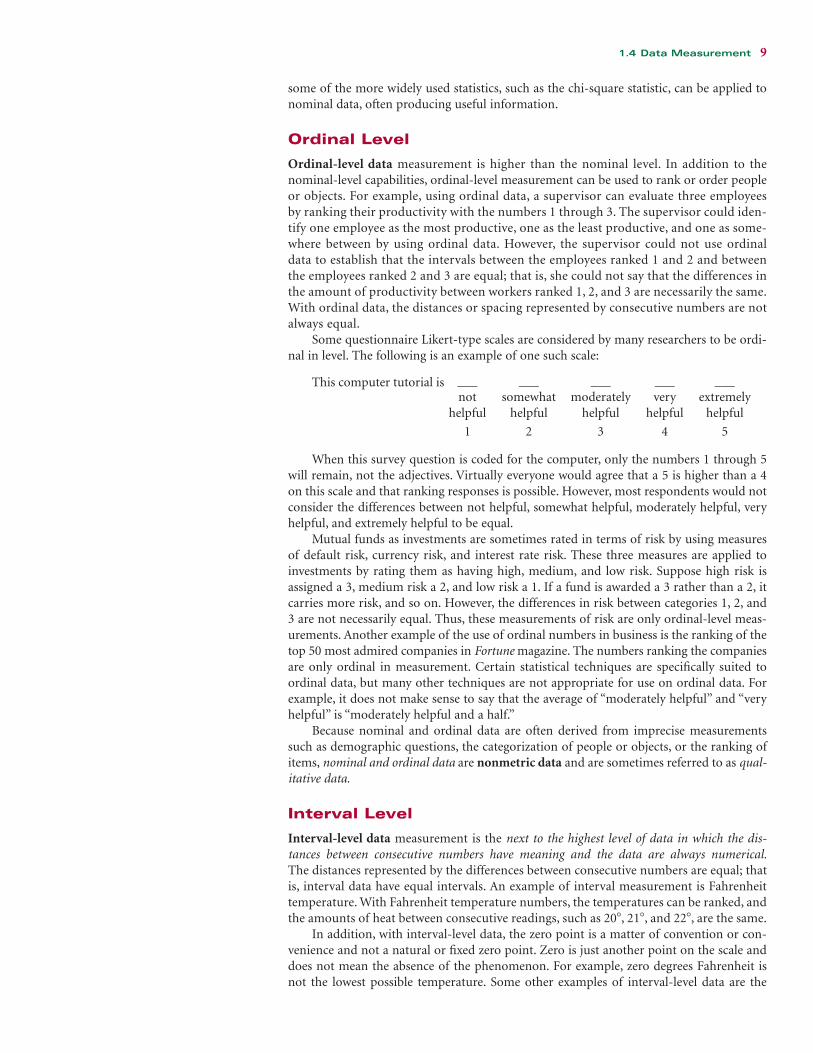
Figure 1.4 shows the relationships of the usage potential among the four levels of datameasurement. The concentric squares denote that each higher level of data can be analyzedby any of the techniques used on lower levels of data but, in addition, can be used in otherstatistical techniques. Therefore, ratio data can be analyzed by any statistical techniqueapplicable to the other three levels of data plus some others.
Nominal data are the most limited data in terms of the types of statistical analysis thatcan be used with them. Ordinal data allow the researcher to perform any analysis that canbe done with nominal data and some additional analyses. With ratio data, a statistician canmake ratio comparisons and appropriately do any analysis that can be performed on nom-inal, ordinal, or interval data. Some statistical techniques require ratio data and cannot beused to analyze other levels of data.
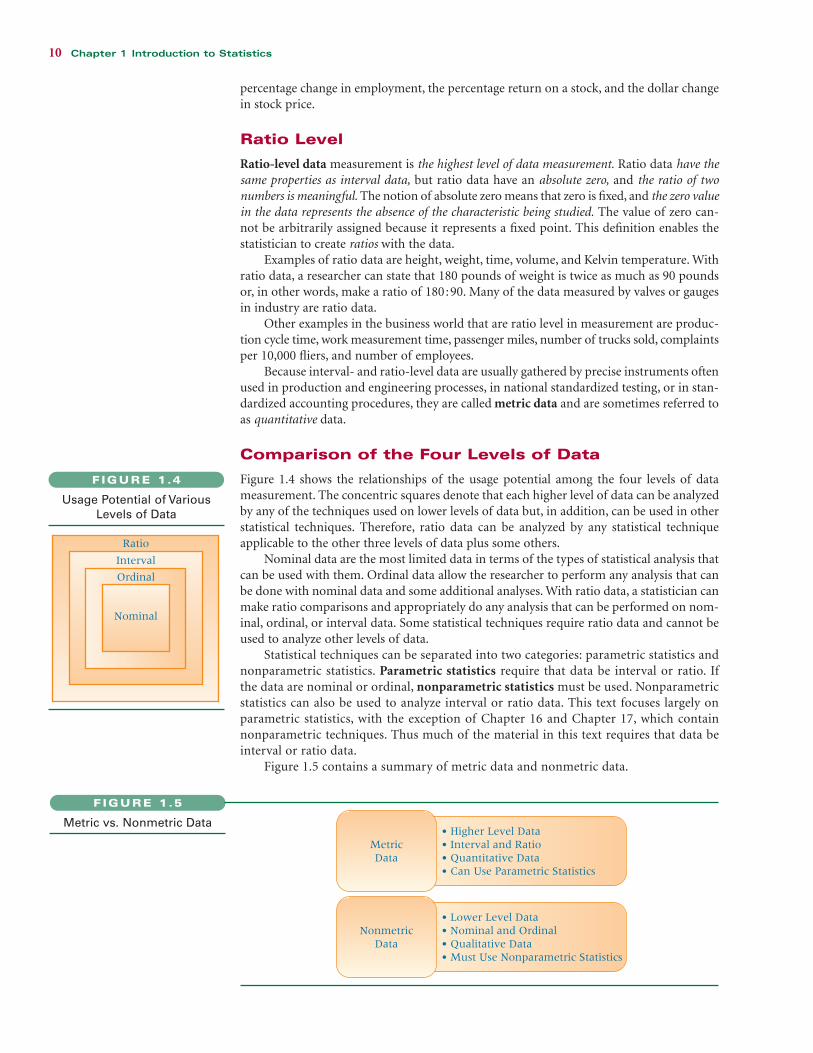
Statistical techniques can be separated into two categories: parametric statistics andnonparametric statistics. Parametric statistics require that data be interval or ratio. Ifthe data are nominal or ordinal, nonparametric statistics must be used. Nonparametricstatistics can also be used to analyze interval or ratio data. This text focuses largely onparametric statistics, with the exception of Chapter 16 and Chapter 17, which containnonparametric techniques. Thus much of the material in this text requires that data beinterval or ratio data.
Figure 1.5 contains a summary of metric data and nonmetric data.
FIGURE 1.4
Usage Potential of VariousLevels of Data
Nominal
Ordinal
Interval
Ratio
FIGURE 1.5
Metric vs. Nonmetric Data
MetricData
• Higher Level Data• Interval and Ratio• Quantitative Data• Can Use Parametric Statistics
NonmetricData
• Lower Level Data• Nominal and Ordinal• Qualitative Data• Must Use Nonparametric Statistics
c01IntroductionToStatistics.qxd 7/26/13 6:53 PM Page 10
1.4 Data Measurement 11
DEMONSTRATION
PROBLEM 1.1
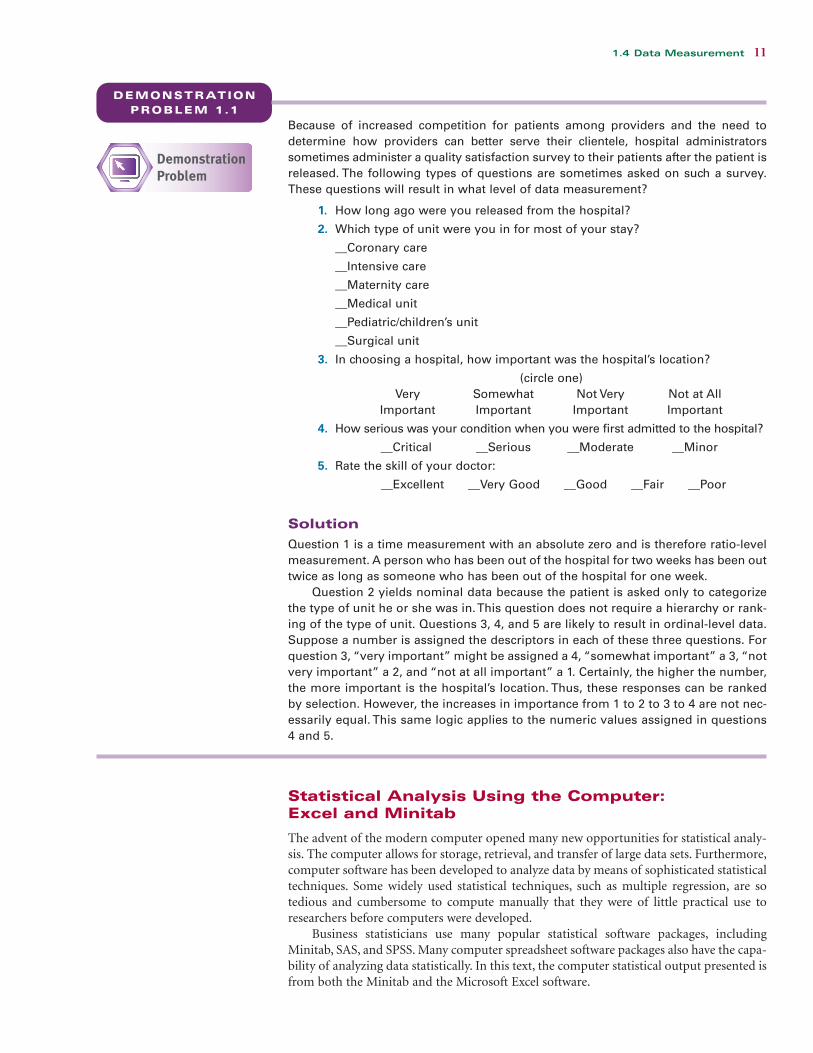
Because of increased competition for patients among providers and the need todetermine how providers can better serve their clientele, hospital administratorssometimes administer a quality satisfaction survey to their patients after the patient isreleased. The following types of questions are sometimes asked on such a survey.These questions will result in what level of data measurement?
1. How long ago were you released from the hospital?
2. Which type of unit were you in for most of your stay?
__Coronary care
__Intensive care
__Maternity care
__Medical unit
__Pediatric/children’s unit
__Surgical unit
3. In choosing a hospital, how important was the hospital’s location?
(circle one)Very Somewhat Not Very Not at All
Important Important Important Important
4. How serious was your condition when you were first admitted to the hospital?
__Critical __Serious __Moderate __Minor
5. Rate the skill of your doctor:
__Excellent __Very Good __Good __Fair __Poor
Solution
Question 1 is a time measurement with an absolute zero and is therefore ratio-levelmeasurement. A person who has been out of the hospital for two weeks has been outtwice as long as someone who has been out of the hospital for one week.
Question 2 yields nominal data because the patient is asked only to categorizethe type of unit he or she was in. This question does not require a hierarchy or rank-ing of the type of unit. Questions 3, 4, and 5 are likely to result in ordinal-level data.Suppose a number is assigned the descriptors in each of these three questions. Forquestion 3, “very important” might be assigned a 4, “somewhat important” a 3, “notvery important” a 2, and “not at all important” a 1. Certainly, the higher the number,the more important is the hospital’s location. Thus, these responses can be rankedby selection. However, the increases in importance from 1 to 2 to 3 to 4 are not nec-essarily equal. This same logic applies to the numeric values assigned in questions4 and 5.
Statistical Analysis Using the Computer: Excel and Minitab
The advent of the modern computer opened many new opportunities for statistical analy-sis. The computer allows for storage, retrieval, and transfer of large data sets. Furthermore,computer software has been developed to analyze data by means of sophisticated statisticaltechniques. Some widely used statistical techniques, such as multiple regression, are sotedious and cumbersome to compute manually that they were of little practical use toresearchers before computers were developed.
Business statisticians use many popular statistical software packages, includingMinitab, SAS, and SPSS. Many computer spreadsheet software packages also have the capa-bility of analyzing data statistically. In this text, the computer statistical output presented isfrom both the Minitab and the Microsoft Excel software.
c01IntroductionToStatistics.qxd 7/26/13 6:53 PM Page 11
12 Chapter 1 Introduction to Statistics
Several statistics werereported in the DecisionDilemma about rural India,including the average annualconsumption of toothpasteper person, the percentage of
households having electricity, and the percentage of house-holds that have at least one bank account. The authors ofthe sources from which the Decision Dilemma was drawnnever stated whether the reported statistics were based onactual data drawn from a census of rural India householdsor on estimates taken from a sample of rural households. Ifthe data came from a census, then the totals, averages, andpercentages presented in the Decision Dilemma are param-eters. If, on the other hand, the data were gathered fromsamples, then they are statistics. Although governmentsespecially do conduct censuses and at least some of thereported numbers could be parameters, more often thannot, such data are gathered from samples of people or items.For example, in rural India, the government, academicians,or business researchers could have taken random samples ofhouseholds, gathering consumer statistics that are thenused to estimate population parameters, such as percentageof households with televisions, and so forth.
In conducting research on a topic like consumer con-sumption in rural India, there is potential for a wide varietyof statistics to be gathered that represent several levels ofdata. For example, ratio-level measurements on items suchas income, number of children, age of household heads,
Statistics Describe the State of Business in India’s Countryside
number of livestock, and grams of toothpaste consumed peryear might be obtained. On the other hand, if researchers usea Likert scale (1-to-5 measurements) to gather responsesabout the interests, likes, and preferences of rural India con-sumers, an ordinal-level measurement would be obtained,as would the ranking of products or brands in marketresearch studies. Other variables, such as geographic loca-tion, sex, occupation, or religion, are usually measured withnominal data.
The decision to enter the rural India market is not just amarketing decision. It involves production capacity andschedule issues, transportation challenges, financial commit-ments, managerial growth or reassignment, accounting issues(accounting for rural India may differ from techniques usedin traditional markets), information systems, and otherrelated areas. With so much on the line, company decisionmakers need as much relevant information available as pos-sible. In this Decision Dilemma, it is obvious to the decisionmaker that rural India is still quite poor and illiterate. Itscapacity as a market is great. The statistics on the increasingsales of a few personal-care products look promising. Whatare the future forecasts for the earning power of people inrural India? Will major cultural issues block the adoption ofthe types of products that companies want to sell there? Theanswers to these and many other interesting and useful ques-tions can be obtained by the appropriate use of statistics. The750 million people living in rural India represent the secondlargest group of people in the world. It certainly is a marketsegment worth studying further.
THINKING CRITICALLY ABOUT STATISTICS IN BUSINESS TODAY
Cellular Phone Use in JapanThe Communications and Information NetworkAssociation of Japan (CIAJ) conducts an annual study ofcellular phone use in Japan. A recent survey was taken aspart of this study using a sample of 600 cell phone userssplit evenly between men and women and almost equallydistributed over six age brackets. The survey was admin-istered in the greater Tokyo and Osaka metropolitanareas. The study produced several interesting findings. Itwas determined that 62.2% had replaced their handsets inthe previous 10 months. A little more than 6% owned asecond cell phone. Of these, the objective of about two-thirds was to own one for business use and a second onefor personal use. Of all those surveyed, 18.2% used theirhandsets to view videos, and another 17.3% were not
currently using their handsets to view videos but wereinterested in doing so.
Things to Ponder1. In what way was this study an example of infer-
ential statistics?
2. What is the population of this study?
3. What are some of the variables being studied?
4. How might a study such as this yield informa-tion that is useful to business decision makers?
Source: “CIAJ Releases Report on the Study of Cellular Phone Use,”Results of an annual study of cellular phone use in Japan conducted bythe Communications and Information Network Association of Japan(CIAJ), July 30, 2008, http://www.wirelesswatch.jp/docs/CIAJ_0808.doc.
c01IntroductionToStatistics.qxd 7/26/13 6:53 PM Page 12
Supplementary Problems 13
SUMMARY
Statistics is an important decision-making tool in businessand is used in virtually every area of business. In this course,the word statistics is defined as the science of gathering, ana-lyzing, interpreting, and presenting numerical data.
The study of statistics can be subdivided into two main areas:descriptive statistics and inferential statistics. Descriptive statisticsresult from gathering data from a body, group, or populationand reaching conclusions only about that group. Inferential sta-tistics are generated from the process of gathering sample datafrom a group, body, or population and reaching conclusionsabout the larger group from which the sample was drawn.
Most business statistics studies contain variables, meas-urements, and data. A variable is a characteristic of anyentity being studied that is capable of taking on different val-ues. Examples of variables might include monthly house-hold food spending, time between arrivals at a restaurant,and patient satisfaction rating. A measurement is when astandard process is used to assign numbers to particularattributes or characteristics of a variable. Measurements onmonthly household food spending might be taken in dollars,time between arrivals might be measured in minutes, andpatient satisfaction might be measured using a 5-point scale.Data are recorded measurements. It is data that are analyzed
by business statisticians in order to learn more about thevariables being studied.
The appropriate type of statistical analysis depends on thelevel of data measurement, which can be (1) nominal, (2) ordi-nal, (3) interval, or (4) ratio. Nominal is the lowest level,representing classification only of such data as geographic loca-tion, sex, or Social Security number. The next level is ordinal,which provides rank ordering measurements in which theintervals between consecutive numbers do not necessarily rep-resent equal distances. Interval is the next to highest level ofdata measurement in which the distances represented by consecutive numbers are equal. The highest level of data meas-urement is ratio, which has all the qualities of interval measure-ment, but ratio data contain an absolute zero and ratiosbetween numbers are meaningful. Interval and ratio data some-times are called metric or quantitative data. Nominal and ordi-nal data sometimes are called nonmetric or qualitative data.
Two major types of inferential statistics are (1) parametricstatistics and (2) nonparametric statistics. Use of parametricstatistics requires interval or ratio data and certain assump-tions about the distribution of the data. The techniques presentedin this text are largely parametric. If data are only nominal orordinal in level, nonparametric statistics must be used.
KEY TERMS
descriptive statisticsinferential statisticsinterval-level datameasurementmetric datanominal-level data
nonmetric datanonparametric statisticsordinal-level dataparameterparametric statisticspopulation
ratio-level datasamplestatisticstatisticsvariableSUPPLEMENTARY
censusdata
SUPPLEMENTARY PROBLEMS
1.1 Give a specific example of data that might be gatheredfrom each of the following business disciplines: account-ing, finance, human resources, marketing, informationsystems, production, and management. An example in
the marketing area might be “number of sales per monthby each salesperson.”
1.2 State examples of data that can be gathered for decisionmaking purposes from each of the following industries:
With the abundance and proliferation of statistical data,potential misuse of statistics in business dealings is a con-cern. It is, in effect, unethical business behavior to use sta-tistics out of context. Unethical business people might useonly selective data from studies to underscore their point,omitting statistics from the same studies that argue againsttheir case. The results of statistical studies can be misstatedor overstated to gain favor.
This chapter noted that if data are nominal or ordinal,then only nonparametric statistics are appropriate for
analysis. The use of parametric statistics to analyze nomi-nal and/or ordinal data is wrong and could be consideredunder some circumstances to be unethical.
In this text, each chapter contains a section on ethics that discusses how businesses can misuse the techniquespresented in the chapter in an unethical manner. Asboth users and producers, business students need to beaware of the potential ethical pitfalls that can occur withstatistics.
ETHICAL CONSIDERATIONS
c01IntroductionToStatistics.qxd 7/26/13 6:53 PM Page 13
14 Chapter 1 Introduction to Statistics
manufacturing, insurance, travel, retailing, communica-tions, computing, agriculture, banking, and healthcare.An example in the travel industry might be the cost ofbusiness travel per day in various European cities.
1.3 Give an example of descriptive statistics in therecorded music industry. Give an example of howinferential statistics could be used in the recordedmusic industry. Compare the two examples. Whatmakes them different?
1.4 Suppose you are an operations manager for a plant thatmanufactures batteries. Give an example of how youcould use descriptive statistics to make better managerialdecisions. Give an example of how you could use infer-ential statistics to make better managerial decisions.
1.5 There are many types of information that might help themanager of a large department store run the businessmore efficiently and better understand how to improvesales. Think about this in such areas as sales, customers,human resources, inventory, suppliers, etc., and list fivevariables that might produce information that could aidthe manager in his or her job. Write a sentence or twodescribing each variable, and briefly discuss some numer-ical observations that might be generated for each variable.
1.6 Suppose you are the owner of a medium-sized restaurantin a small city. What are some variables associated withdifferent aspects of the business that might be helpful toyou in making business decisions about the restaurant?Name four of these variables, and for each variable,briefly describe a numerical observation that might bethe result of measuring the variable.
1.7 Classify each of the following as nominal, ordinal, inter-val, or ratio data.a. The time required to produce each tire on an assem-
bly lineb. The number of quarts of milk a family drinks in a
monthc. The ranking of four machines in your plant after they
have been designated as excellent, good, satisfactory,and poor
d. The telephone area code of clients in the United Statese. The age of each of your employees
f. The dollar sales at the local pizza shop each monthg. An employee’s identification numberh. The response time of an emergency unit
1.8 Classify each of the following as nominal, ordinal, inter-val, or ratio data.a. The ranking of a company in the Fortune 500b. The number of tickets sold at a movie theater on any
given nightc. The identification number on a questionnaired. Per capita incomee. The trade balance in dollarsf. Profit/loss in dollarsg. A company’s tax identificationh. The Standard & Poor’s bond ratings of cities based on
the following scales:
Rating Grade
Highest quality AAA
High quality AA
Upper medium quality A
Medium quality BBB
Somewhat speculative BB
Low quality, speculative B
Low grade, default possible CCC
Low grade, partial recovery possible CC
Default, recovery unlikely C
1.9 The Rathburn Manufacturing Company makes electricwiring, which it sells to contractors in the constructionindustry. Approximately 900 electric contractors pur-chase wire from Rathburn annually. Rathburn’s directorof marketing wants to determine electric contractors’satisfaction with Rathburn’s wire. He developed a ques-tionnaire that yields a satisfaction score between 10 and50 for participant responses. A random sample of 35 ofthe 900 contractors is asked to complete a satisfactionsurvey. The satisfaction scores for the 35 participants areaveraged to produce a mean satisfaction score.a. What is the population for this study?b. What is the sample for this study?c. What is the statistic for this study?d. What would be a parameter for this study?
ANALYZING THE DATABASES
Nine databases are available withthis text, providing additionalopportunities to apply the statis-tics presented in this course.
These databases are located in WileyPLUS, and each is availablein either Minitab or Excel format for your convenience. Thesenine databases represent a wide variety of business areas, suchas agribusiness, consumer spending, energy, finance, healthcare,
international labor, manufacturing, and the stock market.Altogether, these databases contain 61 variables and 7722observations. The data are gathered from such reliable sourcesas the U.S. government’s Bureau of Labor, the U.S. Departmentof Agriculture, the American Hospital Association, the EnergyInformation Administration, Moody’s Handbook of CommonStocks, and the U.S. Census Bureau. Five of the nine databasescontain time-series data. These databases are:
see www.wiley.com/college/black
c01IntroductionToStatistics.qxd 7/26/13 6:53 PM Page 14
Analyzing the Databases 15
12-YEAR GASOLINE DATABASE
The 12-year time-series gasoline database contains monthlydata for four variables: U.S. Gasoline Prices, OPEC Spot Price,U.S. Finished Motor Gasoline Production, and U.S. Natural GasWellhead Price. There are 137 data entries for each variable. U.S.Gasoline Prices are given in cents, the OPEC Spot Price is givenin dollars per barrel, U.S. Finished Motor Gasoline Productionis given in 1000 barrels per day, and U.S. Natural Gas WellheadPrice is given in dollars per 1000 cubic feet.
CONSUMER FOOD DATABASE
The consumer food database contains five variables: AnnualFood Spending per Household, Annual Household Income,Non-Mortgage Household Debt, Geographic Region of the U.S.of the Household, and Household Location. There are 200entries for each variable in this database representing 200 differ-ent households from various regions and locations in theUnited States. Annual Food Spending per Household, AnnualHousehold Income, and Non-Mortgage Household Debt are allgiven in dollars. The variable Region tells in which one of fourregions the household resides. In this variable, the Northeast iscoded as 1, the Midwest is coded 2, the South is coded as 3, andthe West is coded as 4. The variable Location is coded as 1 if thehousehold is in a metropolitan area and 2 if the household isoutside a metro area. The data in this database were randomlyderived and developed based on actual national norms.
MANUFACTURING DATABASE
This database contains eight variables taken from 20 industriesand 140 subindustries in the United States. Some of the indus-tries are food products, textile mill products, furniture, chemi-cals, rubber products, primary metals, industrial machinery,and transportation equipment. The eight variables are Numberof Employees, Number of Production Workers, Value Added byManufacture, Cost of Materials, Value of Industry Shipments,New Capital Expenditures, End-of-Year Inventories, andIndustry Group. Two variables, Number of Employees andNumber of Production Workers, are in units of 1000. Fourvariables, Value Added by Manufacture, Cost of Materials,New Capital Expenditures, and End-of-Year Inventories, are inmillion-dollar units. The Industry Group variable consists ofnumbers from 1 to 20 to denote the industry group to whichthe particular subindustry belongs. Value of Industry Shipmentshas been recoded to the following l-to-4 scale.
1 = $0 to $4.9 billion2 = $5 billion to $13.9 billion3 = $14 billion to $28.9 billion4 = $29 billion or more
INTERNATIONAL LABOR DATABASE
This time-series database contains the civilian unemploymentrates in percent from seven countries presented yearly over a40-year period. The data are published by the Bureau of LaborStatistics of the U.S. Department of Labor. The countries arethe United States, Canada, Australia, Japan, France, Germany,and Italy.
FINANCIAL DATABASE
The financial database contains observations on eight vari-ables for 100 companies. The variables are Type of Industry,Total Revenues ($ millions), Total Assets ($ millions), Returnon Equity (%), Earnings per Share ($), Average Yield (%),Dividends per Share ($), and Average Price per Earnings(P/E) ratio. The companies represent seven different types ofindustries. The variable Type displays a company’s industrytype as:
1 = apparel2 = chemical3 = electric power4 = grocery5 = healthcare products6 = insurance7 = petroleum
ENERGY DATABASE
The time-series energy database consists of data on five energyvariables over a period of 26 years. The five variables are U.S.Energy Consumption, World Crude Oil Production, U.S.Nuclear Electricity Generation, U.S. Coal Production, andU.S. Natural Dry Gas Production. U.S. Energy Consumptionis given in quadrillion BTUs per year, World Crude OilProduction is given in million barrels per day, U.S. NuclearElectricity Generation is given in billion kilowatt-hours, U.S.Coal Production is given in million short tons, and U.S.Natural Dry Gas Production is given in million cubic feet.
U.S. AND INTERNATIONAL STOCK MARKET DATABASE
This database contains seven variables—three from the U.S.stock market and four from international stock markets—with data representing monthly averages of each over a periodof five years resulting in 60 data points per variable. The U.S.stock market variables include the Dow Jones IndustrialAverage, the NASDAQ, and Standard & Poor’s 500. The fourinternational stock market variables of Nikkei 225, HangSeng, FTSE 100, and IPC represent Japan, Hong Kong, UnitedKingdom, and Mexico.
HOSPITAL DATABASE
This database contains observations for 11 variables on U.S.hospitals. These variables include Geographic Region,Control, Service, Number of Beds, Number of Admissions,Census, Number of Outpatients, Number of Births, TotalExpenditures, Payroll Expenditures, and Personnel.
The region variable is coded from 1 to 7, and the numbersrepresent the following regions:
1 = South2 = Northeast3 =Midwest4 = Southwest5 = Rocky Mountain6 = California7 = Northwest
c01IntroductionToStatistics.qxd 7/26/13 6:53 PM Page 15
16 Chapter 1 Introduction to Statistics
Control is a type of ownership. Four categories of controlare included in the database:
1 = government, nonfederal2 = nongovernment, not-for-profit3 = for-profit4 = federal government
Service is the type of hospital. The two types of hospitalsused in this database are:
1 = general medical2 = psychiatric
The total expenditures and payroll variables are in units of$1000.
AGRIBUSINESS TIME-SERIES DATABASE
The agribusiness time-series database contains the monthlyweight (in 1000 lbs.) of cold storage holdings for six differentvegetables and for total frozen vegetables over a 14-yearperiod. Each of the seven variables represents 168 months ofdata. The six vegetables are green beans, broccoli, carrots,sweet corn, onions, and green peas. The data are published bythe National Agricultural Statistics Service of the U.S.Department of Agriculture.
ASSIGNMENT
Use the databases to answer the following questions.
1. In the manufacturing database, what is the level of data foreach of the following variables?a. Number of Production Workersb. Cost of Materialsc. Value of Industry Shipmentsd. Industry Group
2. In the hospital database, what is the level of data for eachof the following variables?a. Regionb. Controlc. Number of Bedsd. Personnel
3. In the financial database, what is the level of data for eachof the following variables?a. Type of Industryb. Total Assetsc. P/E Ratio
CASE
Kraft Foods successfully introduced DiGiorno Pizza into themarketplace in 1996, with first year sales of $120 million, fol-lowed by $200 million in sales in 1997. It was neither luck norcoincidence that DiGiorno Pizza was an instant success. Kraftconducted extensive research about the product and the mar-ketplace before introducing this product to the public. Manyquestions had to be answered before Kraft began production.For example, why do people eat pizza? When do they eat pizza?Do consumers believe that carry-out pizza is always more tasty?
SMI-Alcott conducted a research study for Kraft in whichthey sent out 1000 surveys to pizza lovers. The results indi-cated that people ate pizza during fun social occasions or athome when no one wanted to cook. People used frozen pizzamostly for convenience but selected carry-out pizza for a vari-ety of other reasons, including quality and the avoidance ofcooking. The Loran Marketing Group conducted focusgroups for Kraft with women aged 25 to 54. Their findingsshowed that consumers used frozen pizza for convenience butwanted carry-out pizza taste. Kraft researchers realized that ifthey were to launch a successful frozen pizza that could com-pete with carry-out pizza, they had to develop a frozen pizzathat (a) had restaurant takeout quality, (b) possessed flavorvariety, (c) was fast and easy to prepare, and (d) had the con-venience of freezer storage. To satisfy these seemingly diver-gent goals, Kraft developed DiGiorno Pizza, which rises in theoven as it cooks. This impressed focus group members, and ina series of blind taste tests conducted by Product Dynamics,
DiGiorno Pizza beat out all frozen pizzas and finished secondoverall behind one carry-out brand.
DiGiorno Pizza has continued to grow in sales and marketshare over the years. By 2005, sales had topped the $600 millionmark, and DiGiorno Pizza held nearly a quarter of the marketshare of frozen pizza sales. In each of the last two quarters of2009, DiGiorno sales increased 20%. On January 6, 2010, Kraftagreed to sell its North American frozen pizza business, includ-ing its DiGiorno products, to Nestlé for $3.7 billion. Accordingto AIB International, DiGiorno was by far the top frozen pizzabrand in the U.S. in 2011, with sales of $677 million when com-pared to the next brand, which had sales of $294 million.
Discussion
Think about the market research that was conducted by Kraftand the fact that it used several companies.
1. What are some of the populations that Kraft might havebeen interested in measuring for these studies? Did Kraftactually attempt to contact entire populations? What sam-ples were taken? In light of these two questions, how was theinferential process used by Kraft in their market research?Can you think of any descriptive statistics that might havebeen used by Kraft in their decision-making process?
2. In the various market research efforts made by Kraft forDiGiorno, some of the possible measurements appear inthe following list. Categorize these by level of data. Think
DIGIORNO PIZZA: INTRODUCING A FROZEN PIZZA TO COMPETE WITH CARRY-OUT
c01IntroductionToStatistics.qxd 7/26/13 6:53 PM Page 16
of some other measurements that Kraft researchers mighthave made to help them in this research effort, and cate-gorize them by level of data.
a. Number of pizzas consumed per week per household
b. Age of pizza purchaser
c. Zip code of the survey respondent
d. Dollars spent per month on pizza per person
e. Time in between purchases of pizza
f. Rating of taste of a given pizza brand on a scale from 1 to10, where 1 is very poor tasting and 10 is excellent taste
g. Ranking of the taste of four pizza brands on a taste test
h. Number representing the geographic location of thesurvey respondent
i. Quality rating of a pizza brand as excellent, good,average, below average, poor
j. Number representing the pizza brand being evaluated
k. Sex of survey respondent
Source: Adapted from “Upper Crust,” American Demographics, March 1999,p. 58; Marketwatch—News That Matters Web sites, “What’s in a Name? BrandExtension Potential” and “DiGiorno Rising Crust Delivers $200 Million,” for-merly at http://www.foodexplorer.com/BUSINESS/Products/MarketAnalysis/PF02896b.htm, last accessed in 1999; Web site for Kraft’s 2005 Investor Meeting:Changing Consumers, Changing Kraft, May 25, http://media.corporateir.net/media_files/nys/kft/presentations/kft_050510c.pdf; “Kraft Trading Pizzafor Chocolate,” MarketWatch, October 25, 1010, http://www.marketwatch.com/story/kraft-trading-pizza-for-chocolate-2010-01-05. https://www.aibonline.org//resources/statistics/2011pizza.htm
Case 17
c01IntroductionToStatistics.qxd 7/26/13 6:53 PM Page 17
Related Documents