“c01AnIntroductionToMicroeconomics_print” — 2019/10/18 — 17:54 — page 3 — #1 UNIT 3, AREA OF STUDY 1 AN INTRODUCTION TO MICROECONOMICS: THE MARKET SYSTEM, RESOURCE ALLOCATION AND GOVERNMENT INTERVENTION 1 An introduction to microeconomics 1.1 Overview Numerous videos and interactivities are available just where you need them, at the point of learning, in your digital formats, learnON and eBookPLUS at www.jacplus.com.au. 1.1.1 Introduction Most people throughout the world would probably like to be better off and enjoy improved living standards and wellbeing. This is true in both poor and rich countries. • In poor countries, improvement may come from access to more food, to vaccinations against preventable diseases like malaria, to clean drinking water and basic education, and to dwellings that protect them from the elements. • In rich countries, however, people often expect much more. Not only will most of their basic wants be met, but many also expect to have access to a range of other, largely non-essential consumer goods and services — wants like touch-screen phones and bluetooth headphones, the latest music, a tropical holiday among whispering palm trees and warm sapphire waters, body makeovers, an extensive wardrobe with something fashionable for every occasion, and the latest appliances for their massive, energy-devouring designer home. Added to this good material life, people in rich countries also expect non-material things like living in freedom with justice, far away from the ravages of war and violence, in a pristinely clean environment, with job satisfaction, a lot of leisure time and personal happiness all round! FIGURE 1.1 Expectations of living standards and wellbeing can be extremely different between poor and rich countries. TOPIC 1 An introduction to microeconomics 3 COPYRIGHTED MATERIAL

Welcome message from author
This document is posted to help you gain knowledge. Please leave a comment to let me know what you think about it! Share it to your friends and learn new things together.
Transcript

“c01AnIntroductionToMicroeconomics_print” — 2019/10/18 — 17:54 — page 3 — #1
UNIT 3, AREA OF STUDY 1AN INTRODUCTION TO MICROECONOMICS: THE MARKET SYSTEM, RESOURCE ALLOCATION ANDGOVERNMENT INTERVENTION
1 An introduction tomicroeconomics
1.1 OverviewNumerous videos and interactivities are available just where you need them, at the point of learning, inyour digital formats, learnON and eBookPLUS at www.jacplus.com.au.
1.1.1 IntroductionMost people throughout the world would probably like to be better off and enjoy improved living standardsand wellbeing. This is true in both poor and rich countries.• In poor countries, improvement may come from access to more food, to vaccinations against
preventable diseases like malaria, to clean drinking water and basic education, and to dwellings thatprotect them from the elements.
• In rich countries, however, people often expect much more. Not only will most of their basic wants bemet, but many also expect to have access to a range of other, largely non-essential consumer goodsand services — wants like touch-screen phones and bluetooth headphones, the latest music, a tropicalholiday among whispering palm trees and warm sapphire waters, body makeovers, an extensivewardrobe with something fashionable for every occasion, and the latest appliances for their massive,energy-devouring designer home. Added to this good material life, people in rich countries also expectnon-material things like living in freedom with justice, far away from the ravages of war and violence,in a pristinely clean environment, with job satisfaction, a lot of leisure time and personal happinessall round!
FIGURE 1.1 Expectations of living standards and wellbeing can be extremely different between poor and richcountries.
TOPIC 1 An introduction to microeconomics 3
COPYRIG
HTED M
ATERIAL
“c01AnIntroductionToMicroeconomics_print” — 2019/10/18 — 17:54 — page 4 — #2
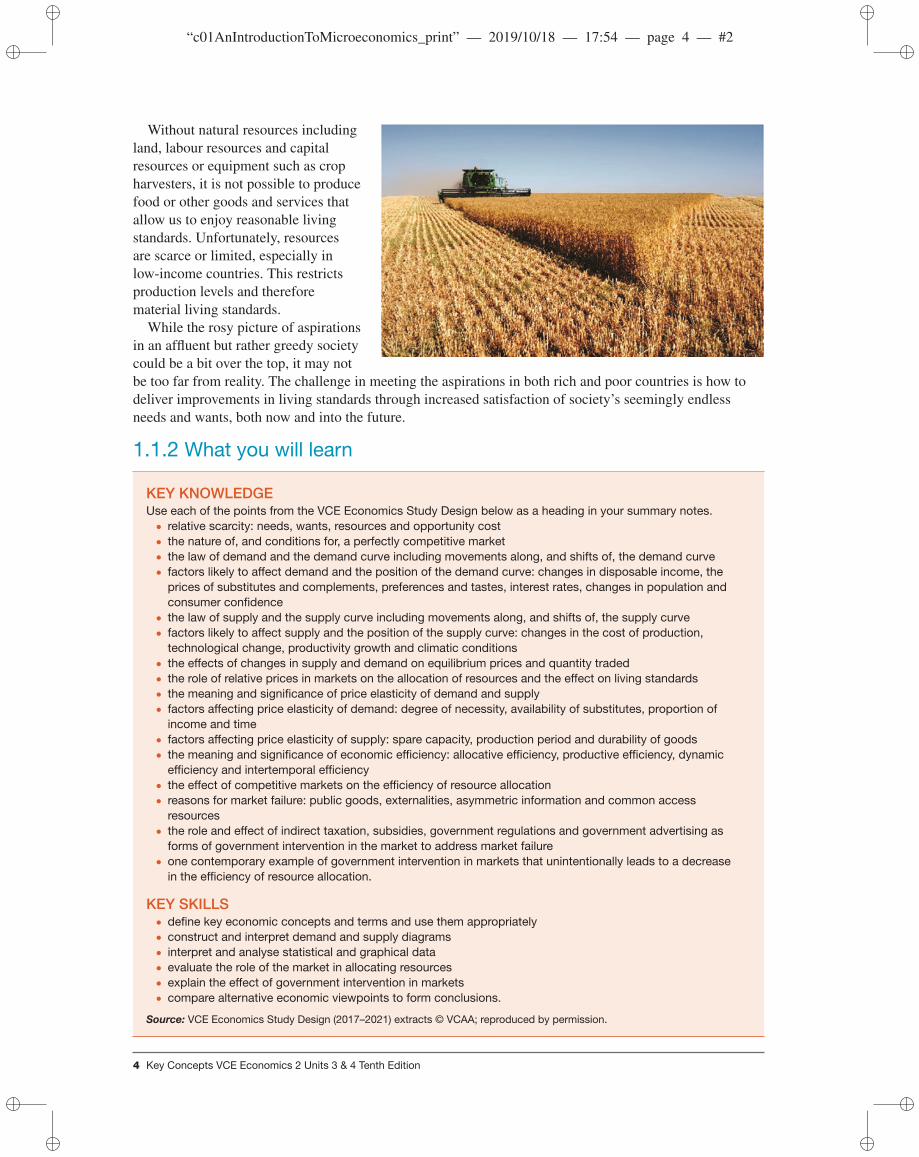
Without natural resources includingland, labour resources and capitalresources or equipment such as cropharvesters, it is not possible to producefood or other goods and services thatallow us to enjoy reasonable livingstandards. Unfortunately, resourcesare scarce or limited, especially inlow-income countries. This restrictsproduction levels and thereforematerial living standards.
While the rosy picture of aspirationsin an affluent but rather greedy societycould be a bit over the top, it may notbe too far from reality. The challenge in meeting the aspirations in both rich and poor countries is how todeliver improvements in living standards through increased satisfaction of society’s seemingly endlessneeds and wants, both now and into the future.
1.1.2 What you will learn
KEY KNOWLEDGEUse each of the points from the VCE Economics Study Design below as a heading in your summary notes.• relative scarcity: needs, wants, resources and opportunity cost• the nature of, and conditions for, a perfectly competitive market• the law of demand and the demand curve including movements along, and shifts of, the demand curve• factors likely to affect demand and the position of the demand curve: changes in disposable income, theprices of substitutes and complements, preferences and tastes, interest rates, changes in population andconsumer confidence
• the law of supply and the supply curve including movements along, and shifts of, the supply curve• factors likely to affect supply and the position of the supply curve: changes in the cost of production,technological change, productivity growth and climatic conditions
• the effects of changes in supply and demand on equilibrium prices and quantity traded• the role of relative prices in markets on the allocation of resources and the effect on living standards• the meaning and significance of price elasticity of demand and supply• factors affecting price elasticity of demand: degree of necessity, availability of substitutes, proportion ofincome and time
• factors affecting price elasticity of supply: spare capacity, production period and durability of goods• the meaning and significance of economic efficiency: allocative efficiency, productive efficiency, dynamicefficiency and intertemporal efficiency
• the effect of competitive markets on the efficiency of resource allocation• reasons for market failure: public goods, externalities, asymmetric information and common accessresources
• the role and effect of indirect taxation, subsidies, government regulations and government advertising asforms of government intervention in the market to address market failure
• one contemporary example of government intervention in markets that unintentionally leads to a decreasein the efficiency of resource allocation.
KEY SKILLS• define key economic concepts and terms and use them appropriately• construct and interpret demand and supply diagrams• interpret and analyse statistical and graphical data• evaluate the role of the market in allocating resources• explain the effect of government intervention in markets• compare alternative economic viewpoints to form conclusions.
Source: VCE Economics Study Design (2017–2021) extracts © VCAA; reproduced by permission.
4 Key Concepts VCE Economics 2 Units 3 & 4 Tenth Edition

“c01AnIntroductionToMicroeconomics_print” — 2019/10/18 — 17:54 — page 5 — #3
Resources
Digital document Key terms glossary (doc-31485)
To access key concept summaries and past VCAA exam questions download and print the studyON: Revision and practiceexam question booklet (doc-31486).
1.2 BACKGROUND KNOWLEDGE What iseconomics?
BACKGROUND INFORMATION• We need to be able to define economics and outline what it involves. This includes understanding themeaning and significance of the macroeconomy and microeconomy.
Economics is the study of choice and how to make people better off in terms of their living standards.Economics examines how limited resources are used to produce goods and services which, when distributedfairly between individuals, can help satisfy people’s unlimited needs and wants. If resources are used asefficiently or economically as possible, individuals and nations could maximise their material standard ofliving and become better off because production or economic activity is at its highest level. By contrast,unwise choices about how productive resources are to be used result in lower national output and reducedaccess to goods and services, and so material and non-material living standards suffer.
In economics, the issue of choice can be investigated from both a microeconomic and a macroeconomicperspective. This is summarised in figure 1.2.
FIGURE 1.2 Two different branches of economics: microeconomics and macroeconomics
The two main branches of economics
Microeconomics Macroeconomics
• the operations of a particular firm• the nature of a single industry• the output, employment and prices in an individual market.
• the total value of national spending• the total value of national production• the national level of unemployment• the nation’s inflation rate.
• Microeconomics involves looking at the operation of the smaller parts that make up the widerAustralian economy. It therefore focuses on a single firm, industry, sector or market.
• Macroeconomics, however, looks at the broader picture combining all markets and industries and theoverall state of the country’s economy. It therefore concentrates on areas like national spending,output, income, employment and overall material living standards. Despite these differences, almostany issue can be examined from both a microeconomic and a macroeconomic perspective.
This topic focuses mostly on the choices or decisions made at the microeconomic level, and how thesemay impact on Australia’s allocation of resources and general living standards.
TOPIC 1 An introduction to microeconomics 5

“c01AnIntroductionToMicroeconomics_print” — 2019/10/18 — 17:54 — page 6 — #4
Resources
Weblinks What is economics?
Measuring the standard of living
60-second adventures in economics
1.2 ACTIVITIESTo answer questions online and to receive immediate feedback and sample responses for every question, goto your learnON title at www.jacplus.com.au.
Check your understanding1. What is involved in the study of economics?2. What is the difference between the study of microeconomics and macroeconomics?
Applied economic exercises1. Giving brief reasons, classify each of the issues listed in table 1.1 as primarily areas of microeconomic
studies or microeconomic studies. (6 marks)
TABLE 1.1 Microeconomic or microeconomic classifications
Issue Classification of issue
(a) The reasons for Australia’s lower inflation rate
(b) The effects of a reduction in personal income tax rates
(c) The pricing of petrol by oil companies
(d) The causes of lower output and the decline of employment in the sugar industry
(e) The impact of rising debt levels on farmers
( f) The effects of a slowdown in a country’s rate of economic growth.
Fully worked solutions and sample responses are available in your digital formats.
1.3 Relative scarcity
KEY CONCEPT• relative scarcity: needs, wants, resources and opportunity cost
The central problem of relative scarcity involves unlimited wants on the one hand, relative to limitedresources on the other. Let us expand on this idea.
1.3.1 Our unlimited needs and wantsA fundamental assumption in economics is that people’s needs (goods and services necessary for survival)and especially their wants (goods and services that make life more enjoyable) are infinite or unlimited. Asa nation, for instance, we would like to have far more than we can possibly produce. As summarised infigure 1.3, there are four main groups expressing their needs and wants for Australian goods and services.
6 Key Concepts VCE Economics 2 Units 3 & 4 Tenth Edition

“c01AnIntroductionToMicroeconomics_print” — 2019/10/18 — 17:54 — page 7 — #5
FIGURE 1.3 The needs and wants for Australian goods and services
The needs
and wants for
Australian-made goods and
services justify economic activity.
OVER
SEAS NEEDS AND W
A
NTS
HO
USE
HO
LD NEEDS AND WA
NTS
GO
VERN
MENT NEEDS AND W
AN
TS
PR
IVATE
BU
SINESS NEEDS AN
D W
AN
TS
The needs and wants of households for consumer goods and servicesAustralian individuals and households need essential consumer goods and services like food, housing,clothing, education and health services. We also have wants for less essential consumer items that helpmake life more enjoyable, such as iPads, the latest jeans, and magazines or ice cream. In part, satisfyingeven some of these needs and wants generally takes money. Many factors influence the spending decisionsmade by consumers, including their level of income after tax, how optimistic they are about the future,fashions and advertising, and their desire to maximise the satisfaction gained from the choices they make.
The needs and wants of private businessesAustralian firms need to purchase various resources or productive inputs to make finished goods andservices. For example, they must buy producer goods like capital equipment (machines and buildings),raw and processed materials including oil and petrol, hire employees and pay for finance or credit forexpanding the business. In making their spending decisions, firms will be affected by their production costs,profitability, market share, the availability and impact of new technology, and changes in consumer tastes.
The needs and wants of governmentsIn Australia, federal, state and local governments also have needs and wants. They must obtain capitalequipment (such as kindergartens, power generators and infrastructure including roads and dams for watersupply), land, finished consumer goods (e.g. stationery) and the services of staff (such as economists,doctors, teachers and defence personnel). The purpose of buying all these things is to make it possiblefor the public sector to produce certain goods and services that will help to satisfy the needs and wantsof society that are not met fully by the private sector. Ultimately, this should help to raise general livingstandards.
The needs and wants of the overseas sectorForeign governments, firms and households living overseas purchase Australian-made goods and servicesto help satisfy their particular needs and wants. They buy our exports of wool, wheat, minerals, tourism,education and manufactured items. Their decisions may be influenced by factors such as how many andwhat sort of resources they have, or by production costs. Offsetting these exports are Australia’s needs forimports of goods and services such as oil, electronics, machinery and travel. We import goods and servicesbecause we are not self-sufficient and may lack the necessary resources.
TOPIC 1 An introduction to microeconomics 7

“c01AnIntroductionToMicroeconomics_print” — 2019/10/18 — 17:54 — page 8 — #6
Therefore, needs and wants arise from several sources including the household, business, governmentand overseas sectors. All contribute to unlimited needs and wants, and place a strain on our resources.Additionally, the problem of unlimited wants is made even more severe by the following:• Many needs and wants recur; for example, the need for food, petrol for the car.• Our expectations of material things tend to grow since the more we have, the more we want.• Population growth adds to the number of wants.• Advertising and the latest fashions.• Planned or built-in obsolescence, such as the toaster that is designed to last for only two years,
contribute to our growing wants.• The widespread acceptance of materialism as a personal goal (ownership of more possessions), along
with growing affluence, contribute to the escalation of society’s wants.
1.3.2 The limited availability of resources restricts national productionResources (sometimes these are also called the factors of production) are the productive inputs requiredto make any good or service. Unfortunately, the quantity or quality of resources available is limited, soAustralia’s capacity to produce is severely restricted. In turn, this means that we are not able to fully satisfysociety’s unlimited needs and wants.
There are three main types of resources or inputs required for production (see figure 1.4).
FIGURE 1.4 The three main types of productive resource available in an economy.
Natural resources
• Used in the production of many types of goods such as crops as well as services
• Examples include rainfall and climatic conditions, mineral deposits, oceans and forests
Labour resources
• Are needed to produce particular goods and services
• Examples include the skills and knowledge of doctors, builders and businesspeople
Capital resources
• Used by businesses in the production of many goods and services
• Examples include the electricity grid system, commericial buildings, highways, schools, dams and ports
Types of productive resources
1. Natural resources represent those foundin nature and include arable land, oil,minerals, rivers, climate, native forests, airquality and oceans. Natural resources havethe potential to support a variety of primary(extractive), secondary (manufacturing)and even tertiary (service) industries.
8 Key Concepts VCE Economics 2 Units 3 & 4 Tenth Edition

“c01AnIntroductionToMicroeconomics_print” — 2019/10/18 — 17:54 — page 9 — #7
2. Skilled and unskilled labour resourcesprovide physical power, mental talents, andother specialised services that are used inthe production process such as those of anarchitect, mechanic or shop attendant.Entrepreneurship is a specialised type oflabour resource and represents the skillsof management, company leadershipand organisation. Most of Australia’slabour force is employed in tertiary industry.
3. In economics, capital resources aremanufactured items set aside from pastproduction, often involving physical plantand equipment (such as machinery, factories,power generators, computer systems, trucks,dams, railways and roads) used by businessesand governments to help make other goodsand services. Capital equipment alsoincorporates new technology that results fromresearch and development (R&D). Perhaps themain feature of increased capital resources isthat they help lift the efficiency or productivityof natural and labour resources. In turn, ifresources are more productive so that outputper worker in an hour is greater, a nation canenjoy higher per capita incomes, consumptionand material living standards.
The big problem for Australia (and all countries) is that we don’t have quantities of resources, andresources of sufficient quality, to produce the amount of goods and services required to satisfy our unlimitedwants or demands. Our productive capacity and material living standards are therefore limited by thescarce resources at our disposal.
1.3.3 Relative scarcityRelative scarcity is the concept that simply describes the imbalance that exists between our unlimiteddemands or wants for goods and services on the one hand, relative to the limited or finite resources that areavailable to help satisfy these wants, on the other hand. This basic economic problem of relative scarcity isshown in figure 1.5.
FIGURE 1.5 Relative scarcity reflects unlimited wants compared with limited resources available.
Wants
Resources
SCARCITYBusiness
wants
O/S
wants
Household
wants
Government
wants
TOPIC 1 An introduction to microeconomics 9

“c01AnIntroductionToMicroeconomics_print” — 2019/10/18 — 17:54 — page 10 — #8
As a consequence of relative scarcity, nations cannot produce all the things they would wish. There arelimits on the level of domestic output or economic activity and on how fast our economy can grow in sizefrom one year to the next. Moreover, relative scarcity means that only the most important material wants ofhouseholds, firms and governments can actually be satisfied. Other less important priorities that provide lesssatisfaction, pleasure or utility, must normally be abandoned. It is also worth remembering that the price ofone good or service relative to another is used as a guide to its relative scarcity. So because diamonds arerelatively scarcer than air, they have a high price while air usually free and has a zero price.
Resources
Weblinks Basic concepts in economics
Scarcity, choices and exchange (EconMovies 1: Star Wars)
1.3 ACTIVITIESTo answer questions online and to receive immediate feedback and sample responses for every question, goto your learnON title at www.jacplus.com.au.
Check your understanding1. What is the difference between needs and wants, and why do we say that wants are unlimited?2. List, define and give examples of the three main categories of productive resources that are available
to a nation.3. Define the basic economic problem of relative scarcity.
Applied economic exercises1. (a) We say that society’s wants are unlimited. Explain what is meant by unlimited wants. (2 marks)
(b) Classify the following resources as natural, labour or capital resources. (5 marks)
ResourcesType of resource - natural, labour orcapital resource
The new NBN cables
A computer at BHP
The fertile soils in the Western District of Victoria
The MCG sports oval and complex
The school principal
Port Phillip Bay
The Sydney Opera House
The M80 Ringroad or East Link
Native forests in Tasmania
Serena Williams (tennis player)
(c) Distinguish capital resources from natural resources. (2 marks)(d) Explain why capital resources are such an important influence on a nation’s productive
capacity (size of the production possibility frontier) and material living standards. (2 marks)(e) There are two main causes of relative scarcity. Explain. (2 marks)(f) Giving examples, explain how the price of each good or service is a good indicator of its
relative scarcity. (2 marks)
To answer past VCAA exam questions online and to receive immediate feedback and sample responses for everyquestion go to your learnON title at www.jacplus.com.au.
studyON: Past VCAA exam questions
Fully worked solutions and sample responses are available in your digital formats.
10 Key Concepts VCE Economics 2 Units 3 & 4 Tenth Edition

“c01AnIntroductionToMicroeconomics_print” — 2019/10/18 — 17:54 — page 11 — #9
1.4 Choice, opportunity cost and resource allocation
KEY CONCEPTS• relative scarcity: needs, wants, resources and opportunity cost• the meaning and significance of economic efficiency: allocative efficiency, productive efficiency, dynamicefficiency and intertemporal efficiency
If our collective wants were not unlimited and if resources were infinite, scarcity would not exist as acentral economic problem facing society. Sadly, this is not the case, so we are forced to make choices ordecisions about how scarce resources are used or allocated.
1.4.1 The need for choice and decisions in allocating resourcesResource allocation involves making choices or decisions about how scarce natural, labour and capitalinputs are to be used or distributed among competing areas of production. Resources have a host ofpossible uses. For instance, should resources be devoted to the production of childcare centres or freeways,to national defence or to primary production, or to the production of consumer goods or to making capitalequipment? We must decide how to use our limited resources as efficiently as possible because relativescarcity means that we cannot have all the goods and services that we want. Given that we cannot haveall things in unlimited quantities, individuals and nations are forced to make difficult choices betweenalternative or competing areas of production. This raises the problem of opportunity cost.
1.4.2 Opportunity cost and its role in deciding how resources are usedor allocatedOpportunity costs arise out of the choices made by individuals and nations. When all available resourcesare fully and most efficiently used in production, a decision to produce more of one type of good or servicemeans reduced production in some other area. This sacrifice in production is required to free up scarceresources. The opportunity cost is therefore the cost of the benefit forgone or given up when resources areused in the production of the next best alternative good or service.
Apart from the benefits forgone when resources are redirected, opportunity cost can also be measuredin other ways. For instance, a particular choice may involve the cost in dollar terms, the cost in time andexternal costs — these are costs transferred or passed on to others (such as the cost to your neighbours oflost sleep when you decide to have a noisy party).
Opportunity cost is commonplace, for individuals as well as nations and governments.• Opportunity costs for individuals; for example, your wise choice to use your time to study a great
subject like economics may mean that you were forced to forgo having fun in, say, chemistry orbiology. Alternatively, your decision to stay at school until the end of Year 12, so that you can benefitfrom tertiary study, may mean sacrificing income that you could have earned by having a fulltime job,along with the cost of paying your school fees.
• Opportunity costs for nations and governments; in 2019–20, for example, the Australian governmentplanned to spend around $32 billion on defence. While this decision has benefits and some of society’swants could be satisfied from it, it is a sobering thought to reflect on how these same resources couldhave been redeployed or reallocated. It is likely that welfare, childcare, health and industry assistanceall suffered cutbacks because of this decision. Environmental opportunity costs also result fromvarious economic activities in Australia, especially coal-generated power, product packaging, aspectsof the timber industry, a transport system dependent on the private motor car, water usage and
TOPIC 1 An introduction to microeconomics 11

“c01AnIntroductionToMicroeconomics_print” — 2019/10/18 — 17:54 — page 12 — #10
irrigation-based agriculture in arid regions, and aviation and tourism. These activities are linked withthe cost of accelerated global warming and serious climate change.
Perhaps you might like to consider the opportunity cost of a decision to allow expanded uranium miningin Kakadu National Park (Northern Territory), the proposed Adani Carmichael coal mine (Queensland), orfurther wood chipping in the Otways (Victoria) or in Tasmania. Given that a decision to produce one typeof good or service can adversely affect the output of another, it is important that the production options arecarefully weighed. Increasingly, firms and governments use cost–benefit analysis to assist them in makingchoices that minimise opportunity costs. Failure to consider such matters results in overall lower livingstandards than could otherwise be the case.
1.4.3 The production possibility diagramThe production possibility diagram is used by economists to better understand various concepts and ideasincluding the following:• the basic economic problem of relative scarcity• the concepts of efficiency and inefficiency in allocating resources and their connection with material
living standards• how a nation’s productive capacity or ability to produce goods and services is limited at a point in time• that careful choices must be made in deciding how resources are allocated and which needs and wants
are to be satisfied• all choices or economic decisions about the allocation of resources involve an opportunity cost• how, over a period of time, a country’s production levels or its economy may grow.
Constructing a production possibility diagramIn order to construct the production possibility diagram (PPD) shown in figure 1.6 illustrating the outputchoices available for a nation, we need to understand that it is based on some simplifying assumptions:• It assumes that only two types of output can be produced by a nation — in this case, the country can
produce goods or it can produce services (or perhaps some combination of the two).• It is assumed that the nation fully uses its scarce natural, labour or capital resources to produce goods
or services, so that no resources are unemployed, wasted or lying idle (since this would mean that thecountry was not operating at its capacity).
• At a point in time (e.g. 2020), it is assumed that the total quantity or volume of productive resourcesavailable for the nation is fixed or limited, although how these resources are allocated between theproduction of goods or the production of services (i.e. the product mix) can change.
• It is assumed that the nation uses the most efficient production methods now available or the bestpractice permitted by current technology.
With these things in mind, let us now take a closer look at the PPD shown in figure 1.6.Perhaps the first thing to note is that the PPD has two axes:• The total quantity of goods produced is shown on the horizontal axis of the diagram.• The total quantity of services produced is shown on the vertical axis of the diagram.This PPD contains a production possibility frontier (PPF) for the country. This represents the productive
capacity or a nation’s potential output of goods and/or services for 2020, given the efficient and completeuse of all resources. It hence marks the current boundary or border between possible and impossibleproduction combinations of goods and/or services.
12 Key Concepts VCE Economics 2 Units 3 & 4 Tenth Edition

“c01AnIntroductionToMicroeconomics_print” — 2019/10/18 — 17:54 — page 13 — #11
FIGURE 1.6 Production possibility diagram for the hypothetical country in 2020
510 2 3 4
AB
C
D
E
F
G
H
Production of goods
(billions of units per year)
0
2
4
3
5
6
7
9
8
10
11
1
Pro
du
cti
on
of
se
rvic
es (
billio
ns o
f u
nit
s p
er
ye
ar)
I
Production combinationProduction of services
(billions of units per year)
Production of goods
(billions of units per year)
B
C
D
E
F
G
H
I
A
9.8
9.4
8.8
8.0
7.0
5.8
4.4
0.0
0.5
1.0
1.5
2.0
2.5
3.0
3.5
4.0
10.0 0.0
Production possibility frontier = the economy’s
original productive capacity in the year 2020
TOPIC 1 An introduction to microeconomics 13
“c01AnIntroductionToMicroeconomics_print” — 2019/10/18 — 17:54 — page 14 — #12
The PPF has been drawn using the table of hypothetical data located at the foot of the diagram.Notice that there are nine production possibilities or combinations of goods and/or services (labelled A to I)from which this country could choose. However, whatever production possibility, product mix or point onthe PPF is selected (e.g. point A or point I), there will always be an opportunity cost. By opportunity costwe mean that the production of one thing has to be forgone to produce more of the next best alternative. Thescarcity of resources means that it is not possible for the nation to produce maximum quantities of goods(i.e. a limit of 4 billion units per year) and services (i.e. a limit of 10 billion units per year) at the same time.
For example, if production possibility A is chosen and the country produces 10 billion units of servicesannually, rather than selecting production possibility I, it is clear that the production of goods will have tobe cut from 4 billion units a year to 0 units, so as to free up the necessary resources. Here, the opportunitycost of selecting point A rather than I is said to be 4 million units of goods. Notice too that as this gradualshift occurs — moving up and around the PPF from point I through points H, G, F, E, D, C and B, towardspoint A — the size of the opportunity cost of increasing the production of services gradually rises. It startsoff small but progressively increases.
In reverse, if the nation chose point I rather than point A on the PPF, increasing the production of goodsfrom 0 to 4 billion units each year would mean cutting the production of services from 10 billion units to 0units. The opportunity cost of gaining 4 billion units of goods would be 10 billion units of services. Againnotice that in this latter case, the opportunity cost of moving down around the PPF — from point A throughpoints B, C, D, E, F, G and H, to I — would start off quite small and then progressively increase.
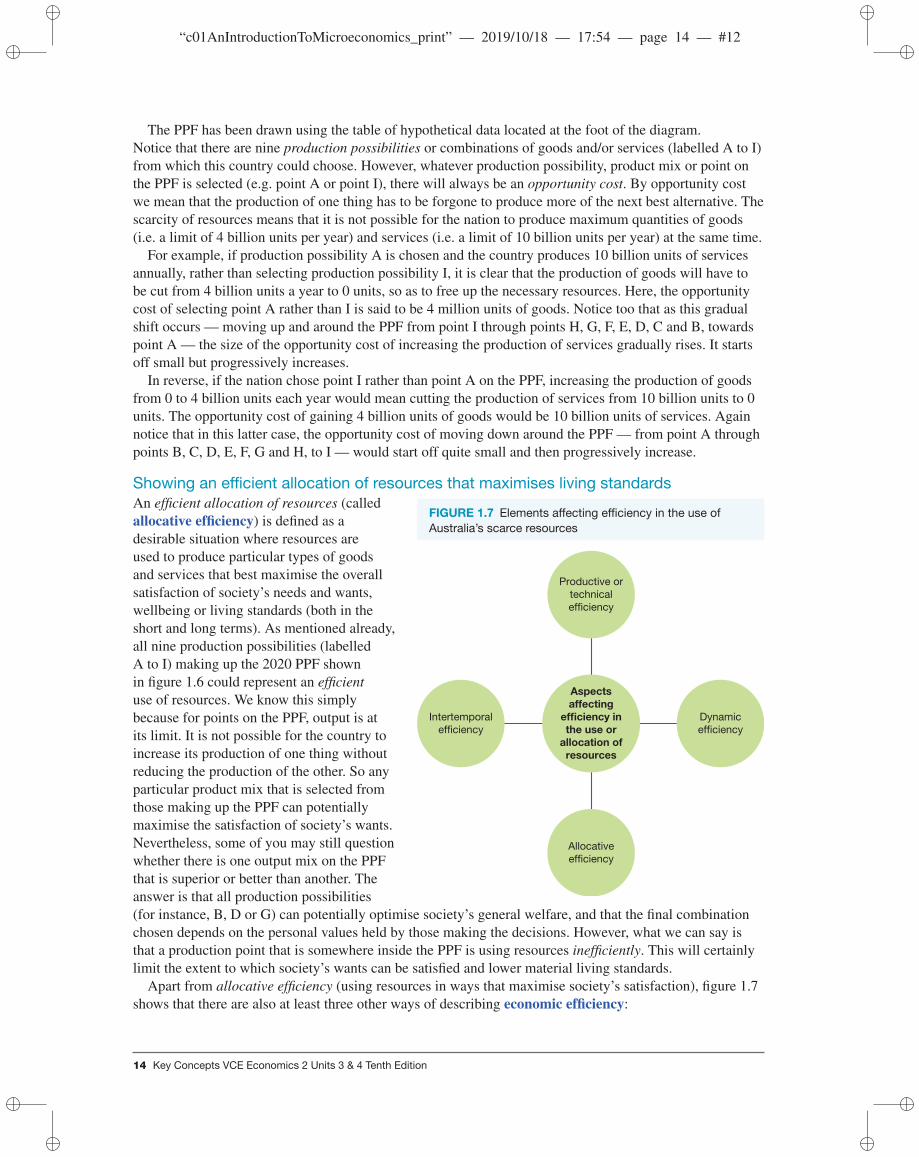
Showing an efficient allocation of resources that maximises living standards
FIGURE 1.7 Elements affecting efficiency in the use ofAustralia’s scarce resources
Dynamic
efficiency
Productive or
technical
efficiency
Allocative
efficiency
Aspects
affecting
efficiency in
the use or
allocation of
resources
Intertemporal
efficiency
An efficient allocation of resources (calledallocative efficiency) is defined as adesirable situation where resources areused to produce particular types of goodsand services that best maximise the overallsatisfaction of society’s needs and wants,wellbeing or living standards (both in theshort and long terms). As mentioned already,all nine production possibilities (labelledA to I) making up the 2020 PPF shownin figure 1.6 could represent an efficientuse of resources. We know this simplybecause for points on the PPF, output is atits limit. It is not possible for the country toincrease its production of one thing withoutreducing the production of the other. So anyparticular product mix that is selected fromthose making up the PPF can potentiallymaximise the satisfaction of society’s wants.Nevertheless, some of you may still questionwhether there is one output mix on the PPFthat is superior or better than another. Theanswer is that all production possibilities(for instance, B, D or G) can potentially optimise society’s general welfare, and that the final combinationchosen depends on the personal values held by those making the decisions. However, what we can say isthat a production point that is somewhere inside the PPF is using resources inefficiently. This will certainlylimit the extent to which society’s wants can be satisfied and lower material living standards.
Apart from allocative efficiency (using resources in ways that maximise society’s satisfaction), figure 1.7shows that there are also at least three other ways of describing economic efficiency:
14 Key Concepts VCE Economics 2 Units 3 & 4 Tenth Edition

“c01AnIntroductionToMicroeconomics_print” — 2019/10/18 — 17:54 — page 15 — #13
• Productive or technical efficiency implies using the lowest cost production methods, and minimisingwastage of resources in making goods and services.
• Dynamic efficiency occurs when resources are reallocated quickly to increase choice and meet thechanging needs of consumers.
• Intertemporal efficiency refers to finding the optimal balance between current consumption or thespending of income versus saving income to finance investment and hence future consumption.
Showing decisions or choices that result in average inefficiency and unemploymentof resourcesEarlier mention was made of the fact that if a nation chooses to produce at a point inside the PPF ratherthan somewhere on the PPF, this is regarded as an inefficient or wasteful use of resources, where there isunemployment. The shaded area inside the PPF in figure 1.8 shows this situation. The economy is clearlynot operating at its capacity.
FIGURE 1.8 Using the production possibility diagram to show unemployment in an economy
Any point that is located inside the PPD like point ‘U’ shows an economic choice
where the economy is operating below its productive capacity; i.e. the total
output of goods and services is less than what it could be. As a result, there
would be unemployment of labour and other resources, lower incomes and
material living standards, and perhaps also poverty.
Point 'J' on this diagram shows an economic choice that is located outside the
nation’s PPF with production levels that are currently unattainable (around 12
million units of goods plus 14 million units of services) given the resources
available and the economy’s productive capacity shown by the PPF. As a
result, there would be general shortages and hence inflation, reduced purchasing
power and lower material living standards.
510 2 3 4
AB
C J
D
E
F
G
H
Production of goods
(billions of units per year)
0
2
4
3
5
6
7
9
8
10
11
1
Pro
du
cti
on
of
se
rvic
es (
billio
ns o
f u
nit
s p
er
ye
ar)
I
U Production possibility frontier = the economy’s
original productive capacity in the year 2020
The total level of national output is lower than it could be and the combined production levels of bothgoods and services would be too low to ensure that all resources are fully employed. Here there would beunemployment of labour and other inputs, and material living standards would thus be reduced.
TOPIC 1 An introduction to microeconomics 15

“c01AnIntroductionToMicroeconomics_print” — 2019/10/18 — 17:54 — page 16 — #14
Increasing the nation’s productive capacity and living standardsAny point on the diagram located somewhere outside the PPF involves national production levels thatcannot be obtained currently because of the lack of resources available.
The economy simply does not have sufficient productive capacity. However, as shown in figure 1.9,if there was an increase in the volume and/or efficiency of productive resources available in the future,the whole PPF could grow and shift outwards from PPF1 to PPF2. The potential level of national outputwould rise and the country would experience economic growth and possibly, higher average material livingstandards.
FIGURE 1.9 Using the production possibility diagram to show the effect on a nation’s productive capacity, ofgrowing the volume and/or efficiency of resources available.
PPF 1 represents a country’s original productive capacity for goods and
services in 2020.
PPF 2 shows the growth of a country’s productive capacity in the future
(perhaps due to a rise in the volume and/or efficiency of the nation’s resources
available), from the original level at PPF 1.
510 2 3 4
AB
C
D
E
F
G
H
Production of goods
(billions of units per year)
0
2
4
3
5
6
7
9
8
10
11
1
Pro
du
cti
on
of
se
rvic
es (
billio
ns o
f u
nit
s p
er
ye
ar)
I
Over time, there are many things that could increase the volume and efficiency of a nation’s resourcesand expanding the PPF. For example:• a rise in foreign investment• an increase in the target for skilled immigration• discovery of new mineral deposits or other natural resources• technological breakthroughs• government spending on education and training of the labour force, or a rise in outlays on R&D• rises in worker productivity or efficiency• the building of new infrastructure such as roads, water and telecommunications.
16 Key Concepts VCE Economics 2 Units 3 & 4 Tenth Edition

“c01AnIntroductionToMicroeconomics_print” — 2019/10/18 — 17:54 — page 17 — #15
These types of developments could grow the nation’s productive capacity, enabling points originallyoutside the 2020 PPF, to now be attainable. In turn, it is quite possible that this outward shift of the PPFshould help increase incomes and improve material living standards.
1.4.4 Influences on the choices or economic decisions made byindividuals, businesses and governmentsIndividuals, businesses and governments make choices or economic decisions every day that takeopportunity costs into account. Each group realises that its resources are scarce and hence all decisionsmade involve an opportunity cost — giving up one good or service in order to free up resources for analternative use. In so doing, each group is influenced by many factors.
Choices and decisions by individualsIndividuals generally make decisions to maximise their overall satisfaction and to minimise theiropportunity cost. For example, when you decide to go to the cinema, an opportunity cost might be that youcan’t go surfing or get take-away. These decisions made by individuals are based on many factors:• limited level of disposable income• personal tastes and beliefs• advertising and fashions• seasonal conditions• rational and non-rational behaviour• government policy decisions that alter consumer behaviour.
Choices and decisions by businessesBusinesses, too, make economic decisions or choices about how to use their resources. For example, thereis a potential opportunity cost when a farmer decides to produce wheat rather than canola, or to buy newmachinery. This sort of decision might reflect the following:• production costs and profitability• decisions of rival firms in their industry• community feelings and opinions• government decisions and policies that alter business behaviour.
Choices and decisions by governmentsGovernments also have to make choices or economic decisions involving the allocation of resources andopportunity costs. For instance, a decision to be more generous with welfare benefits for the neediestmembers of society or provide tax cuts to individuals or businesses, is likely to mean a reduction inresources available for schools or health or defence. Such decisions could be motivated by variousconsiderations:• political survival and election promises• voter attitudes and expectations• the political party’s values• a desire to correct problems that would otherwise occur if nothing was done.
Resources
Weblinks Scarcity
Opportunity cost
Production possibilities curve
Shifting the production possibilities curve (PPC)
Production possibilities curve (EconMovies 3: Monsters Inc)
Introduction to economics
TOPIC 1 An introduction to microeconomics 17

“c01AnIntroductionToMicroeconomics_print” — 2019/10/18 — 17:54 — page 18 — #16
1.4 ACTIVITIESTo answer questions online and to receive immediate feedback and sample responses for every question, goto your learnON title at www.jacplus.com.au.
Check your understanding1. Why is it necessary for society to make economic choices or decisions about production and resource
allocation or use?2. What is opportunity cost and why does it arise?3. What general factors affect the overall size of a nation’s production possibility frontier?4. Explain what is meant by an efficient allocation of resources.
Applied economic exercises1. Thinking of the production possibility diagram, explain what is meant by an economy’s productive capacity.
Explain the problems that arise when a nation is not operating at its productive capacity. (4 marks)2. Because of the existence of scarcity, society is forced to make choices or decisions about how resources
should be allocated or used between alternative uses. Give two examples of the typical choices made byeach of the following, that result in opportunity costs:(a) You as a VCE student(b) Your parents(c) Mining company, BHP(d) The Australian government. (4 marks)
3. Distinguish the following pairs of terms:(a) allocative efficiency and productive (technical) efficiency(b) intertemporal efficiency and dynamic efficiency. (4 marks)
4. Examine table 1.2 showing annual production possibilities (’000 tonnes per year) for a country that canproduce only wool or cotton with the resources available.
TABLE 1.2 Production possibilities for a country
ProductProductionpossibility A
Productionpossibility B
Productionpossibility C
Productionpossibility D
Wool (’000 tonnes per year) 0 10 30 35
Cotton (’000 tonnes per year) 25 20 10 0
(a) Use these data to draw and fully label a production possibility diagram. (3 marks)(b) Define what is meant by an efficient allocation of resources, giving examples referring to the data
in table 1.2. (2 marks)(c) Which production choices or possibilities are likely to enable the country to maximise its satisfaction
using its available resources? Explain your reasoning. (2 marks)(d) Calculate the opportunity cost for each of the following economic decisions:
i. producing 25 000 tonnes of cotton per yearii. producing 35000 tonnes of wool per yeariii. moving from production possibility B to possibility C. (3 marks)
5. In 2019–20, the Australian government planned to spend $32 billion (6.4 per cent of budget outlays) ondefence. Explain a likely opportunity cost arising from this decision. (2 marks)
6. In recent years, the federal government has already reduced the rate of tax paid by small and medium-sizedcompanies from 30 per cent to 27.5 per cent, and plans to cut rates further for these firms to 25 per cent inthe next few years. Explain a likely opportunity cost arising from this decision. (2 marks)
7. The federal government has paid cash subsidies to coal mining companies equal to around $5 per tonne.Explain a likely opportunity cost arising from this policy decision. (2 marks)
To answer past VCAA exam questions online and to receive immediate feedback and sample responses for everyquestion go to your learnON title at www.jacplus.com.au.
studyON: Past VCAA exam questions
Fully worked solutions and sample responses are available in your digital formats.
18 Key Concepts VCE Economics 2 Units 3 & 4 Tenth Edition

“c01AnIntroductionToMicroeconomics_print” — 2019/10/18 — 17:54 — page 19 — #17
1.5 The nature and general effects of market structurein an economy
KEY CONCEPTS• the nature of, and conditions for, a perfectly competitive market• the effect of competitive markets on the efficiency of resource allocation
Australia has a contemporary market capitalist economy or economic system. Among other things, thismeans that most of the important economic decisions are made through the operation of markets, ratherthan through centralised government economic planning as still occurs in a few countries like North Korea.So what exactly do we mean when we refer to a ‘market’?
1.5.1 Definition and nature of marketsA market is an institution where buyers (consumers or demanders including households, businessesand governments) of goods and services, and sellers (producers or suppliers including businesses andgovernments) of goods and services, negotiate the price for each good or service. A market can exist ina particular physical location (such as the Queen Victoria Market) although, with the internet, buyers andsellers do not have to meet face to face. In Australia’s market economy, there are hundreds of differentmarkets, each with buyers and sellers. Examples include the labour market, the capital or financial market,the foreign exchange market, the property market, the grocery market, the share market, the entertainmentmarket, the fruit market, the fish market, the aviation market, and commodity markets such as those forwool, wheat, coal or iron ore.
Markets (in a capitalist economy like ours) areusually based on self-interest and competition.Typically the buyer wants to purchase a good orservice at the lowest possible price, while the sellerwants to sell at the highest price. As in a propertyauction, this process of price negotiation betweenbuyers and sellers is one of trial and error, offer andcounteroffer, until a mutually agreed market price isreached. The good or service will be sold to the buyerwho is prepared to pay the highest price, by the sellerwho is prepared to accept the lowest price.
Over a period of time, the market price for aparticular good or service might rise or fall relative to another. This is due to changing conditions that affectthe decisions of buyers and sellers:• If there are more buyers and/or fewer sellers, the market price rises.• Conversely, if there are fewer buyers and/or more sellers, the market price falls.Figure 1.10 illustrates the changeable level of prices (measured using price indexes against a base
period where they were equal to 100 points) in Australia’s property and share markets in recent years.When market prices like these change, they generate signals that help owners of resources make importanteconomic decisions.
TOPIC 1 An introduction to microeconomics 19

“c01AnIntroductionToMicroeconomics_print” — 2019/10/18 — 17:54 — page 20 — #18
FIGURE 1.10 How the market prices of Australian property and shares have changed in recent yearsIn
de
x o
f p
rop
ert
y p
ric
es
Changes in the price index of selected Australian capital city residential property
90
100
110
120
130
140
180
170
160
150
90
100
110
120
130
140
180
170
160
150
Jun
2011
Jun
2012
Jun
2013
Jun
2014
Jun
2015
Jun
2016
Jun
2017
Jun
2018
Jun
2019
Sydney
Melbourne
Brisbane
Adelaide
Perth
Hobart
Canberra
All other sectors
Financials
Resources
Australian share price indices*Log scale, end December 1994 = 100
Index
600
500
400
300
200
100
60
1999 2004 2009 2014 2019
Index
600
500
400
300
200
100
60
*ASX 200 companies
Source: Bloomberg; RBA.
Source: © Australian Bureau of Statistics.
1.5.2 Types of market structureAs institutions for making economic decisions, markets generally operate best or most efficiently whenthey are free or purely competitive. Perfect or pure competition involves rivalry between many firms ina particular market where each seller tries to undercut the price and exceed the product quality of therival firm. However, this ideal situation is not always the case in our economy. Indeed, there are a varietyof market structures. Here, the concept of market structure refers to the type of competition (pure or
20 Key Concepts VCE Economics 2 Units 3 & 4 Tenth Edition

“c01AnIntroductionToMicroeconomics_print” — 2019/10/18 — 17:54 — page 21 — #19
perfect competition, monopolistic competition, oligopoly, and pure or perfect monopoly) that existsin a particular market. Indeed, markets are often characterised or distinguished by the following features:• the number of rival firms operating in a market• how much market power or control a particular firm has in affecting its level of prices• the barriers or ease of entry or exit of firms• the importance of product differentiation and advertising• the accuracy and level of information or knowledge that exists about the market and its conditions.There are four main types of market structure ranging from pure competition (many rival firms) at one
extreme, through monopolistic competition, to oligopoly and pure monopoly (one seller that controls themarket and sets prices) at the other extreme. Each structure has different characteristics (see figure 1.11).
FIGURE 1.11 The main types of market structure found in Australia reflect the level of competition andother features.
Pure or perfect
competition
Pure or perfect
monopolyMonopolistic competition
MARKET STRUCTURESStronger competition
(little market power)
Weaker competition
(much market power)
Oligopoly
Relatively few (usually
up to around 8 or 10 but
cannot say exactly) but
large sellers control the
industry with some
potential for collusion
and abuse of market
power. Sellers often watch
their rivals when
setting prices.
Brand and product
differentiation are quite
important ways of
selling, using advertising
and development of a
certain image.
Fairly difficult entry and
exit for firms due to high
start-up costs and the
barriers operated by
already well-established
companies.
Good examples:
supermarkets, banks and
oil companies.
•
•
•
•
One seller controls
the output of the
industry and there is no
close substitute product.
No competition in pure
monopoly markets since
there are no rival sellers
Product differentiation is
unimportant
Entry and exit difficult
due to high start-up
costs and other barriers
in the case of natural
monopolies (not
practical to have many
firms selling the product)
and well-established
companies.
The firm is a ‘price
maker’ and has a lot of
market power given
there are no substitute
or rivals to undercut
prices.
Closest, but not pure
examples: water
companies, electricity
transmission, the NBN
and airport operators.
•
•
•
•
•
•
A moderate number of
sellers in the industry
(possibly between 20 to
40, but cannot say
exactly), each selling
similar but not identical
products to satisfy the
same type of want
Quite strong competition
Product or brand name
differentiation is
important, as is
advertising (e.g. style,
design, colour, service
and image)
Quite good knowledge of
market conditions
Moderate ease of entry
and exit by new firms
because there are few
barriers or restrictions.
Good examples: clothing
manufacturers, retail
trade, furniture and
restaurants.
•
••
•
•
•
Many buyers and sellers
in the industry (hard to
specify an exact number
but perhaps hundreds or
thousands of firms)
Strong competition
Firms are ‘price takers’
with no market power to
set their prices.
No brand names since
the product is identical or
homogeneous
Perfect knowledge of
market conditions exists
Ease of entry and exit by
firms because there are
no barriers like high
start-up costs or
government regulation
Closest but not pure
examples: some primary
products or rural
commodities, the share
market and property
markets.
•
••
•
•
•
•
1.5.3 The nature of and conditions for a perfectly competitive marketAs mentioned, markets usually work best if there is strong competition between sellers and between buyers.
However, in addition to this requirement, markets generally make better and more efficient decisionswhen more of the following preconditions are met:• Consumer sovereignty exists. Consumer sovereignty means that consumers of goods and services, not
governments, dictate how resources will be used. Consumers make individual decisions about thegoods and services they choose to buy and those they choose to reject, and collectively these decisionsdetermine how most of Australia’s resources are allocated (nowadays about 80 per cent). This affects
TOPIC 1 An introduction to microeconomics 21

“c01AnIntroductionToMicroeconomics_print” — 2019/10/18 — 17:54 — page 22 — #20
relative prices and relative profits in different areas of production, and hence the decisions made bybusinesses. Consumer sovereignty is perhaps the most important precondition of a purely competitivemarket.
• Firms have no market power or control over prices. Because there may be hundreds or thousands offirms producing identical products with a miniscule share of the market, businesses have no marketpower and their actions are unable to influence prices. They are therefore price takers in a purelycompetitive market (unlike firms in a monopoly, who are price makers).
• Firms have ease of entry or exit or no barriers. In a purely competitive market, there should be greatease of entry by new firms wishing to start up, and ease of exit for existing firms to leave the market ifthey want to change the things they produce. Barriers to entry — like high start-up costs, licencinglaws and bureaucracy, and restrictions by well-established firms — are minimal.
• The products are homogeneous. In a purely competitive market, it is assumed that the products sold ina market are homogeneous. This means they are identical and not differentiated using brand names,design differences or advertising. This may be hard for us to imagine but sections of primary industrysuch as grains, and perhaps a company’s shares traded on the share market, come closest to the mark.
• Resources are mobile.When relative prices change in a market, resources will either be attracted to orrepelled from that market, depending on what the change in price does to the level of relative profits.In a purely competitive market, it is assumed that resources are mobile. Mobile resources can be easilyand quickly moved from one use to another.
• Behaviour is rational and includes profit maximisation. Owners of resources in a purely competitivemarket are assumed to engage in rational behaviour and want to maximise their profits or incomes.They do this by minimising production costs, producing things that are wanted by consumers, andselling these at the highest possible price. Consumers or buyers are also assumed to generally makedecisions that are in their own self-interest.
• There is perfect knowledge of the market. Since buyers and sellers are guided by changes in relativeprices, a market system can operate effectively only when buyers and sellers have perfect knowledgeof the market and the goods being traded. Armed with this information, they can then make rationaland informed decisions about how resources should be used, adding to improved satisfaction of wantsand greater efficiency in the use of resources.
Looking at this formidable list, one would struggle to find examples of purely competitive markets thattick all the required boxes. However, there are some markets that come close and it is a useful theoreticalstarting point for further investigations into the operation of the market system.
1.5.4 The effect of competitive markets on efficiency in resourceallocationMost economists believe that a reliance on competitive markets to make key economic decisions, generallycauses scarce resources to be used or allocated efficiently, thereby improving the extent to which society’sneeds and wants can be satisfied and its wellbeing maximised. There are several possible reasons for this:
Strong competition can lead to higher efficiency in resource allocationEfficiency must be considered when decisions are made about how we should use our scarce resources soas to maximise the general satisfaction of society’s wants and improve living standards. Efficiency meansthere is more national output gained from a given quantity of factor inputs. There are powerful reasons whyefficiency is more likely to be at its highest when there is strong competition:• With many rivals and no power to set prices, firms in competitive markets need to find ways to cutcosts and to produce more with less. They are forced to have allocative efficiency to ensure they usetheir resources in ways that minimise the opportunity costs of their decisions.
• To survive, firms need to innovate by using the latest technology. This leads to productive or technicalefficiency.
22 Key Concepts VCE Economics 2 Units 3 & 4 Tenth Edition
“c01AnIntroductionToMicroeconomics_print” — 2019/10/18 — 17:54 — page 23 — #21
• Firms need to be even more responsive to rapid market shifts in fashions, products and customerrequirements. This leads to increased dynamic efficiency.
• Strong competition in various markets can lead to intertemporal efficiency where there is the rightbalance between resources allocated for current consumption, as opposed to those set aside throughsaving and investment for future use.
As mentioned earlier, in competitive markets where there is strong competition, firms are forced to cutproduction costs and use resources more efficiently, so they gain more output from the same inputs. Inturn, this can help to grow a nation’s productive capacity, shifting the PPF outwards. This means that thepotential levels of national output and hence income, should be higher than otherwise, possibly leading toimprovements in average living standards.
Strong competition can lead to lower prices and greater purchasing power of incomesStrong competition and rivalry between firms in various markets and industries is most likely to leadto higher efficiency (for the reasons already noted above), along with lower costs and prices for goodsand services. Firms in competitive markets are price takers rather than price makers, so exploitation ofconsumers through artificially higher prices is impossible. As a result of lower prices, consumers will havemore purchasing power and generally higher consumption levels and material living standards.
Strong competition can lead to better quality goods and services and improved customer serviceIn general, strong competition between firms to win over customers, along with improved efficiency, islikely to lead to the creation of better-quality products. After all, unhappy customers can choose from manyother rival suppliers if they feel they are getting shonky items and poor service from staff. This too can helpimprove living standards.
Can too much competition be bad?There are, however, some instances of where excessive competition can have negative effects:• For example, aggressive cost cutting by profit-hungry rival firms struggling to survive (such as often
occurs in aviation, manufacturing and food production) may, in the short-term, actually reduce publicsafety, product durability, quality assurance and customer satisfaction. Governments need to safeguardagainst these dangers when introducing policies to promote stronger competition such as somerestrictions on take-overs and mergers.
• In addition, if there are many rival firms competing in a single market, it is likely that their size will berelatively small with low sales volumes. In turn, this may prevent a company from becoming efficientsince business would be less likely to gain economies of large-scale production where average unitcosts can be reduced as annual production levels are increased. For instance, these cost reductions orsavings might be the result of buying resources more cheaply in bulk, using expensive technology thatis only possible when producing on a big scale, spreading the costs of research, development andadvertising, and using improved management systems.
Resources
Weblinks Introduction to market structures
Market structures
Oligopolies and game theory (EconMovies 8: The Dark Knight)
Efficiency and market failures (EconMovies 7: Anchorman)
TOPIC 1 An introduction to microeconomics 23

“c01AnIntroductionToMicroeconomics_print” — 2019/10/18 — 17:54 — page 24 — #22
1.5 ACTIVITIESTo answer questions online and to receive immediate feedback and sample responses for every question, goto your learnON title at www.jacplus.com.au.
Check your understanding1. What type of economic system do we have in Australia and what are its main features?2. Explain what is meant by a market.3. What is meant by the term market structure? Show this diagrammatically.
Applied economic exercises1. Clearly distinguish the following pairs of terms involving market structures and give typical examples of
industries where these are found in Australia’s economy:(a) perfect (pure) competition and monopolistic competition(b) oligopoly and perfect (pure) monopoly(c) price maker and price taker(d) homogeneous product and product differentiation(e) ease of entry and barriers to entry. (10 marks)
2. (a) Because of the problem of relative scarcity, all countries must make economic decisionsor choices. Identify and outline the three main choices or questions that all economiesseek to answer. (3 marks)
(b) Identify and outline five important preconditions that must normally be met for a market to be regardedas purely competitive. (5 marks)
(c) How is the price of a particular good or service normally determined in a fairly competitive market, suchas for property? (2 marks)
(d) Why would we normally expect a highly competitive market to be more efficient in allocating resourcesthan a monopoly type market? Can monopoly markets sometimes be more efficient users of resourcesthan competitive markets? (4 marks)
(e) Apart from generally being more efficient in allocating resources, identify and explain two other likelybeneficial effects of competitive markets. (2 marks)
(f) For Australia, in what ways would the markets for groceries and banking be different from those forgrowing of grains and the trading of a company’s shares? (4 marks)
(g) Why would Australia’s clothing industry probably be regarded as a market where there is monopolisticcompetition, while those for water or the NBN would normally be seen as a monopoly market? (2 marks)
To answer past VCAA exam questions online and to receive immediate feedback and sample responses for everyquestion go to your learnON title at www.jacplus.com.au.
studyON: Past VCAA exam questions
Fully worked solutions and sample responses are available in your digital formats.
1.6 Microeconomics: the market as an importantdecision maker in Australia’s economy
KEY CONCEPTS• the law of demand and the demand curve including movements along, and shifts of, the demand curve• the law of supply and the supply curve including movements along, and shifts of, the supply curve• factors likely to affect demand and the position of the demand curve: changes in disposable income, theprices of substitutes and complements, preferences and tastes, interest rates, changes in population andconsumer confidence
• factors likely to affect supply and the position of the supply curve: changes in the cost of production,technological change, productivity growth and climatic conditions
• the effects of changes in supply and demand on equilibrium prices and quantity traded• the role of relative prices in markets on the allocation of resources and the effect on living standards
24 Key Concepts VCE Economics 2 Units 3 & 4 Tenth Edition
“c01AnIntroductionToMicroeconomics_print” — 2019/10/18 — 17:54 — page 25 — #23
As discussed earlier, Australia has a market capitalist economy. Here, most of the important economicdecisions are made through the free interaction of individual buyers and sellers of goods and services — inthousands of markets, 24 hours a day — rather than through centralised government economic planning.
There are three key economic questions (or decisions) that are largely answered through the operation ofour market system:
Three basic economic questions
1. What and how much
to produce?2. How to produce? 3. For whom to produce?
1. The ‘what and how much to produce’ question. The market is used to make most decisions about thespecific types and quantities of each good (such as chocolate bars, tourist accommodation, butter,guns) or service (such as education, health, finance, entertainment) that is to be produced.
2. The ‘how to produce’ question. The market helps to make decisions about the specific productionmethod to be used by a business (the combinations of labour and capital equipment) in order to makeeach particular good or service, by establishing the price or cost of each resource or input used byfirms.
3. The ‘for whom to produce’ question. The market helps to make decisions about how the nation’sgoods, services and incomes will be shared or divided between members of society. Here, people’sincomes largely depend on the value of their economic contribution as valued by the market.
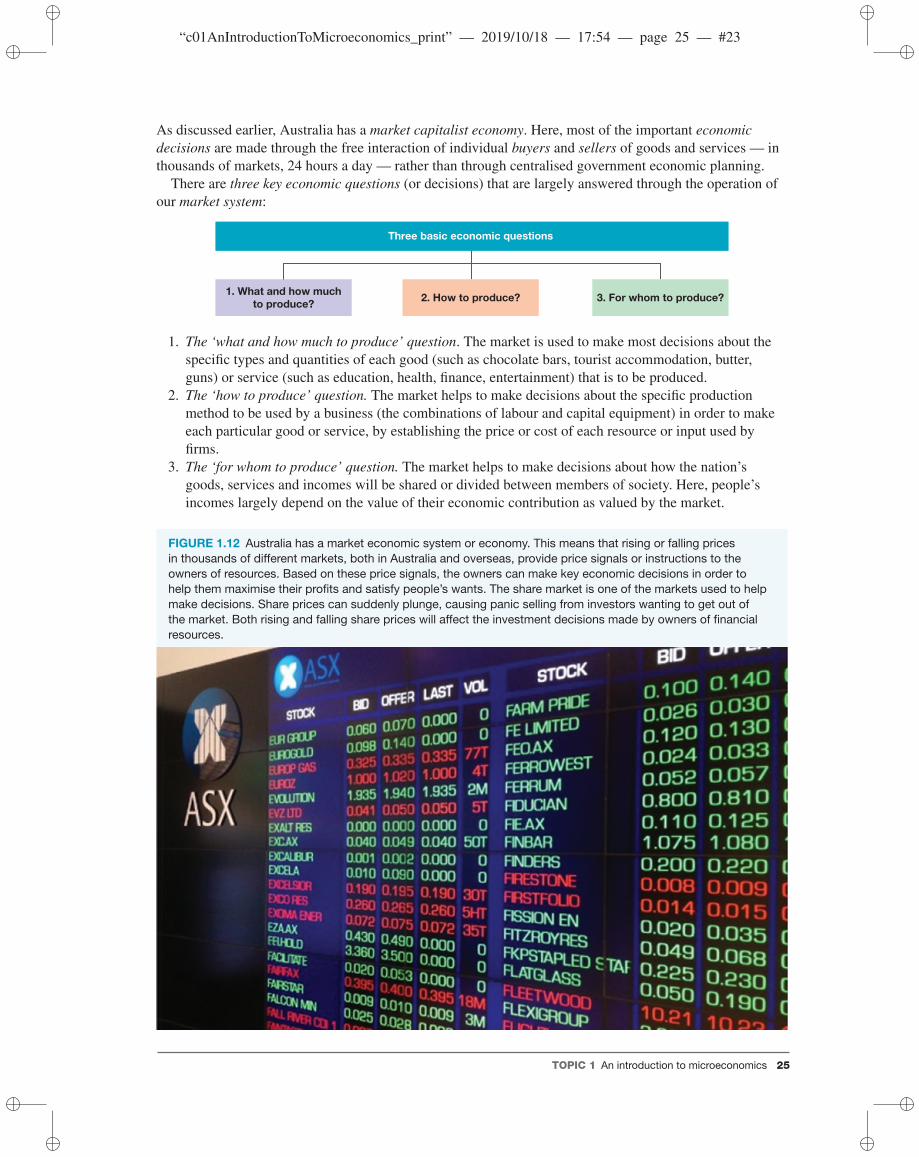
FIGURE 1.12 Australia has a market economic system or economy. This means that rising or falling pricesin thousands of different markets, both in Australia and overseas, provide price signals or instructions to theowners of resources. Based on these price signals, the owners can make key economic decisions in order tohelp them maximise their profits and satisfy people’s wants. The share market is one of the markets used to helpmake decisions. Share prices can suddenly plunge, causing panic selling from investors wanting to get out ofthe market. Both rising and falling share prices will affect the investment decisions made by owners of financialresources.
TOPIC 1 An introduction to microeconomics 25
“c01AnIntroductionToMicroeconomics_print” — 2019/10/18 — 17:54 — page 26 — #24
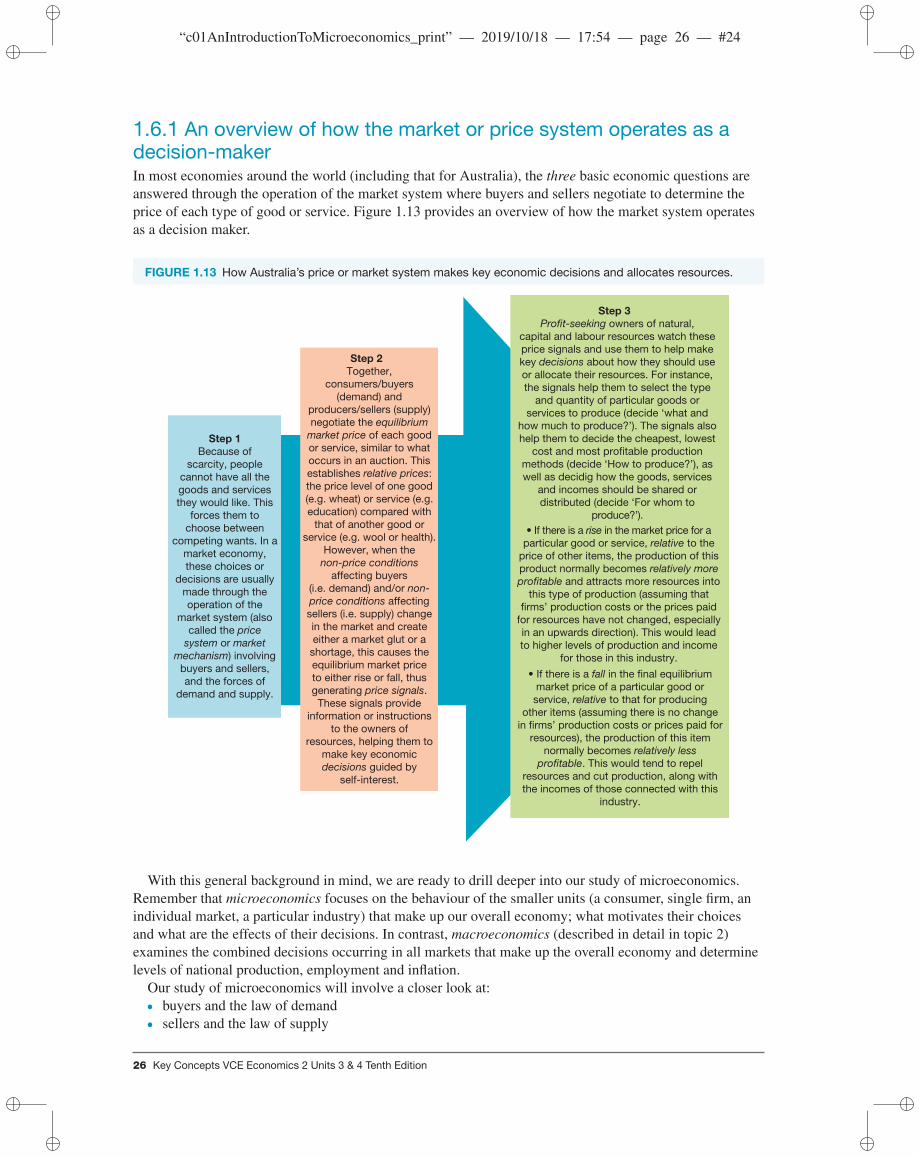
1.6.1 An overview of how the market or price system operates as adecision-makerIn most economies around the world (including that for Australia), the three basic economic questions areanswered through the operation of the market system where buyers and sellers negotiate to determine theprice of each type of good or service. Figure 1.13 provides an overview of how the market system operatesas a decision maker.
FIGURE 1.13 How Australia’s price or market system makes key economic decisions and allocates resources.
Step 2
Together,
consumers/buyers
(demand) and
producers/sellers (supply)
negotiate the equilibrium
market price of each good
or service, similar to what
occurs in an auction. This
establishes relative prices:
the price level of one good
(e.g. wheat) or service (e.g.
education) compared with
that of another good or
service (e.g. wool or health).
However, when the
non-price conditions
affecting buyers
(i.e. demand) and/or non-
price conditions affecting
sellers (i.e. supply) change
in the market and create
either a market glut or a
shortage, this causes the
equilibrium market price
to either rise or fall, thus
generating price signals.
These signals provide
information or instructions
to the owners of
resources, helping them to
make key economic
decisions guided by
self-interest.
Step 1
Because of
scarcity, people
cannot have all the
goods and services
they would like. This
forces them to
choose between
competing wants. In a
market economy,
these choices or
decisions are usually
made through the
operation of the
market system (also
called the price
system or market
mechanism) involving
buyers and sellers,
and the forces of
demand and supply.
Step 3
Profit-seeking owners of natural,
capital and labour resources watch these
price signals and use them to help make
key decisions about how they should use
or allocate their resources. For instance,
the signals help them to select the type
and quantity of particular goods or
services to produce (decide ‘what and
how much to produce?’). The signals also
help them to decide the cheapest, lowest
cost and most profitable production
methods (decide ‘How to produce?’), as
well as decidig how the goods, services
and incomes should be shared or
distributed (decide ‘For whom to
produce?’).
• If there is a rise in the market price for a
particular good or service, relative to the
price of other items, the production of this
product normally becomes relatively more
profitable and attracts more resources into
this type of production (assuming that
firms’ production costs or the prices paid
for resources have not changed, especially
in an upwards direction). This would lead
to higher levels of production and income
for those in this industry.
• If there is a fall in the final equilibrium
market price of a particular good or
service, relative to that for producing
other items (assuming there is no change
in firms’ production costs or prices paid for
resources), the production of this item
normally becomes relatively less
profitable. This would tend to repel
resources and cut production, along with
the incomes of those connected with this
industry.
With this general background in mind, we are ready to drill deeper into our study of microeconomics.Remember that microeconomics focuses on the behaviour of the smaller units (a consumer, single firm, anindividual market, a particular industry) that make up our overall economy; what motivates their choicesand what are the effects of their decisions. In contrast, macroeconomics (described in detail in topic 2)examines the combined decisions occurring in all markets that make up the overall economy and determinelevels of national production, employment and inflation.
Our study of microeconomics will involve a closer look at:• buyers and the law of demand• sellers and the law of supply
26 Key Concepts VCE Economics 2 Units 3 & 4 Tenth Edition

“c01AnIntroductionToMicroeconomics_print” — 2019/10/18 — 17:54 — page 27 — #25
• market equilibrium• changes in market equilibrium due to new non-price conditions• the allocation of resources.Some of our analysis will involve the use of demand–supply diagrams. These are used to represent
particular markets and the behaviour of buyers and sellers in them.
1.6.2 The law of demand — how changes in price cause a movementalong the demand curveBuyers are a really important group in any market, given that there is consumer sovereignty. They demandor want to purchase various goods and services. This group might include consumers like you or me,businesses or even governments. Perhaps the most important thing to note is that buyers in a market aregreatly affected by price. They are more willing to purchase a good or service at a lower price rather thanat a higher price. This observation is expressed in the law of demand.
The law of demandThe law of demand states that the quantity of a particular good or service that buyers are prepared topurchase varies inversely (in the opposite direction) with the change in price. Hence:• As the price increases, there is a contraction in the quantity demanded.• As the price decreases, there is an expansion in the quantity demanded.
There are good reasons why consumers behave like this. For example, as the price rises, demandcontracts because:
• the good or service becomes less affordable for most, and thus fewer people have the necessary moneyto spend on it
• the good or service becomes less desirable and the sacrifice or opportunity cost increases, thusreducing satisfaction and demand.
Drawing the demand line or curveUsing the table or schedule of hypothetical data for the demand of wool shown in figure 1.14, therelationship between the quantity demanded and the price can be illustrated diagrammatically.• When the data for points A, B, C, D and E in the table are plotted on a graph (see figure 1.14), notice
that the resulting demand line (also called a demand curve) falls downwards and to the right. It thushas a negative slope which visually illustrates the law of demand. Here it is worth noting that forsimplicity, this basic demand line has been drawn straight rather than curved in shape, as might appearin reality. However, either way, the line or curve has a negative slope and visually illustrates the law ofdemand.
• A move upwards along the demand line (or curve) from point A and progressing through B, C and Dto point E, is called a contraction in demand and is caused only by a rise in price. In this case, demandcontracts from 25 000 million kilograms per year at a price of $2 per kilogram (point A), to only 5000million kilograms per year if the price rises to $10 per kilogram (point E).
• In reverse, a move downward along the demand line (or curve) from point E and progressing throughD, C and B to point A, is called an expansion in demand and is only caused by a fall in price. In thiscase, as the price falls from $10 to $2 per kilogram, there is an expansion in the quantity demandedfrom 5000 to 25 000 million kilograms.
It is really important to understand that these movements along the demand line or curve (called anexpansion or contraction in the quantity demanded) are only caused by a change in price.
While our example here has been the demand for wool, the same sort of buyer behaviour could beexpected for any other good (such as grapes, hot dogs, soft drinks, TVs or iron ore) or service (such asfinance, medicine, skiing instruction, gardening or entertainment) in a fairly competitive market. Rememberthat …
TOPIC 1 An introduction to microeconomics 27

“c01AnIntroductionToMicroeconomics_print” — 2019/10/18 — 17:54 — page 28 — #26
… movements along a demand line or curve illustrate the law of demand:
If there is a rise in price then . . . . . . demand contracts
If there is a fall in price then . . . . . . demand expands
FIGURE 1.14 The law of demand for wool and the demand line (or curve)
Quantity of wool demanded per year (million kg)
10.00E
8.00
(Contraction) – Demand – (Expansion)
6.00
4.00
5000 10 000 15 000 20 000 25 000
2.00
0.00
Pri
ce
of
wo
ol p
er
kg
($)
D1
D1
D
C
B
A
If the market price per kilogramof wool was . . .
. . . then the quantity of wool demandedper year (D1) would be . . .
B $4.00/kg
C $6.00/kg
D $8.00/kg
E $10.00/kg
A $2.00/kg
20 000 million kg
15 000 million kg
10 000 million kg
5000 million kg
25 000 million kg
1.6.3 The law of supply — how changes in price cause a movementalong the supply curveSellers are also an important group in any market. They sell or supply goods or services wanted byconsumers. This group might include individuals, firms and governments. Price is perhaps the mostimportant thing affecting suppliers. They are happier and more willing to produce and sell a good or serviceat a higher price rather than at a lower price. This observation is expressed in the law of supply.
The law of supplyThe law of supply states that the quantity of a particular good or service that sellers are prepared toproduce varies directly (in the same direction) with the change in price. Hence:• As the price increases, there is an expansion in the quantity supplied.• As the price decreases, there is a contraction in the quantity supplied.
28 Key Concepts VCE Economics 2 Units 3 & 4 Tenth Edition

“c01AnIntroductionToMicroeconomics_print” — 2019/10/18 — 17:54 — page 29 — #27
Again, there are good reasons why suppliers behave like this. For example, as the price rises, supplyexpands because:• revenue normally increases, making the production of that particular good or service more attractive
and profitable than if it is sold at a lower unit price• firms are more confident and better able to cover any rises in their production costs• the opportunity costs of producing another good or service rise, making it more profitable to reallocate
resources away from other uses so that output can be increased, thus expanding supply.
Drawing the supply line or curveUsing the table or schedule of hypothetical data for the supply of wool shown in figure 1.15, therelationship between the quantity supplied and the price can be illustrated diagrammatically.
FIGURE 1.15 The law of supply for wool and the supply line
Quantity of wool supplied per year (million kg)
10.00
8.00
6.00
4.00
0
2.00
0.00
Pri
ce
of
wo
ol p
er
kg
($)
S1
S1
(Cont
ract
ion)
– S
upply
– (E
xpan
sion)
A
B
C
D
E
5000 10 000 15 000 20 000 25 000
If the market price per kilogramof wool was . . .
. . . then the quantity of wool suppliedper year (S1) would be . . .
A $2.00/kg
B $4.00/kg
C $6.00/kg
D $8.00/kg
E $10.00/kg
5000 million kg
10 000 million kg
15 000 million kg
20 000 million kg
25 000 million kg
• When the data for points A, B, C, D and E in the table are plotted on a graph (see figure 1.15), theresulting supply line (also called a supply curve) slopes up and to the right. It thus has a positive slopewhich visually illustrates the law of supply. Here it is again worth noting that for simplicity, this basicsupply line has been drawn straight rather than curved in shape, as might appear in reality. However,either way, the line has a positive slope and visually illustrates the law of supply.
TOPIC 1 An introduction to microeconomics 29
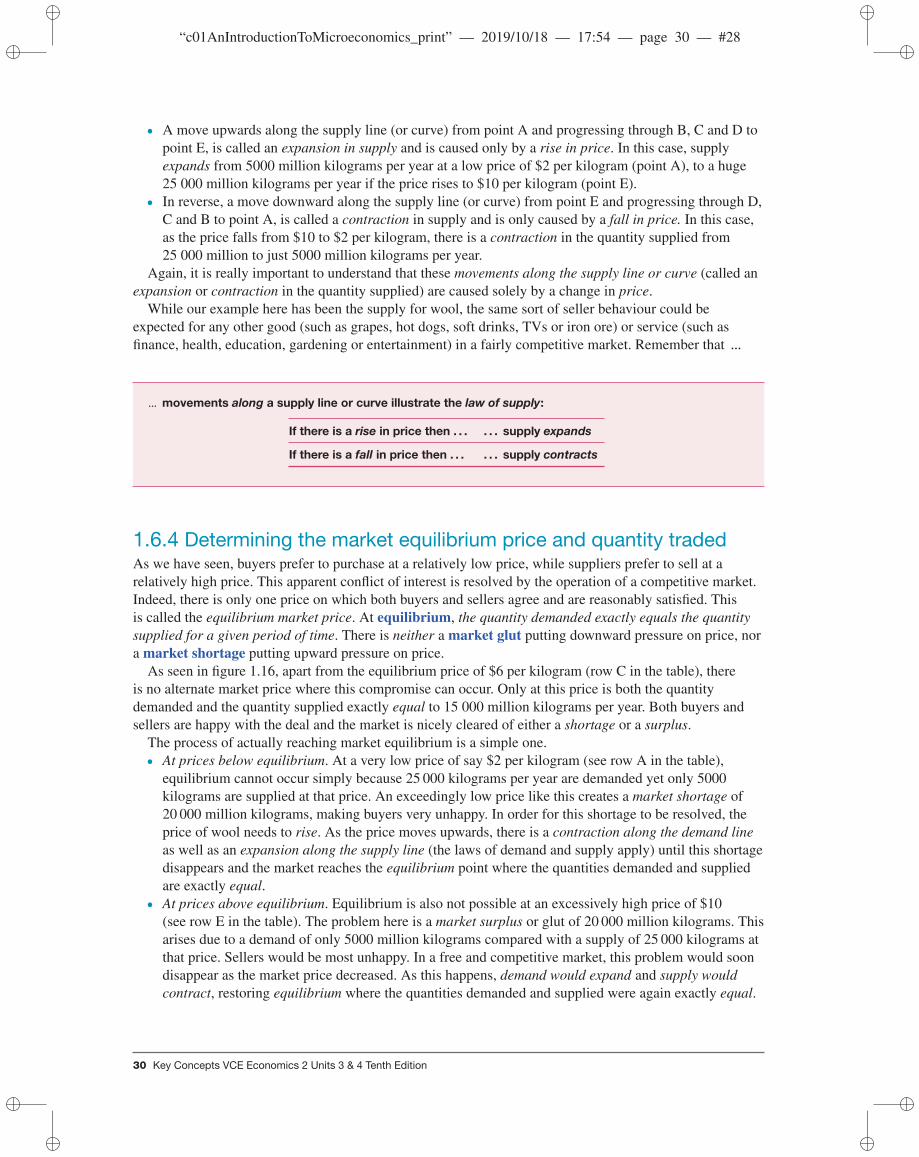
“c01AnIntroductionToMicroeconomics_print” — 2019/10/18 — 17:54 — page 30 — #28
• A move upwards along the supply line (or curve) from point A and progressing through B, C and D topoint E, is called an expansion in supply and is caused only by a rise in price. In this case, supplyexpands from 5000 million kilograms per year at a low price of $2 per kilogram (point A), to a huge25 000 million kilograms per year if the price rises to $10 per kilogram (point E).
• In reverse, a move downward along the supply line (or curve) from point E and progressing through D,C and B to point A, is called a contraction in supply and is only caused by a fall in price. In this case,as the price falls from $10 to $2 per kilogram, there is a contraction in the quantity supplied from25 000 million to just 5000 million kilograms per year.
Again, it is really important to understand that these movements along the supply line or curve (called anexpansion or contraction in the quantity supplied) are caused solely by a change in price.
While our example here has been the supply for wool, the same sort of seller behaviour could beexpected for any other good (such as grapes, hot dogs, soft drinks, TVs or iron ore) or service (such asfinance, health, education, gardening or entertainment) in a fairly competitive market. Remember that …
… movements along a supply line or curve illustrate the law of supply:
If there is a rise in price then . . . . . . supply expands
If there is a fall in price then . . . . . . supply contracts
1.6.4 Determining the market equilibrium price and quantity tradedAs we have seen, buyers prefer to purchase at a relatively low price, while suppliers prefer to sell at arelatively high price. This apparent conflict of interest is resolved by the operation of a competitive market.Indeed, there is only one price on which both buyers and sellers agree and are reasonably satisfied. Thisis called the equilibrium market price. At equilibrium, the quantity demanded exactly equals the quantitysupplied for a given period of time. There is neither a market glut putting downward pressure on price, nora market shortage putting upward pressure on price.
As seen in figure 1.16, apart from the equilibrium price of $6 per kilogram (row C in the table), thereis no alternate market price where this compromise can occur. Only at this price is both the quantitydemanded and the quantity supplied exactly equal to 15 000 million kilograms per year. Both buyers andsellers are happy with the deal and the market is nicely cleared of either a shortage or a surplus.
The process of actually reaching market equilibrium is a simple one.• At prices below equilibrium. At a very low price of say $2 per kilogram (see row A in the table),
equilibrium cannot occur simply because 25 000 kilograms per year are demanded yet only 5000kilograms are supplied at that price. An exceedingly low price like this creates a market shortage of20 000 million kilograms, making buyers very unhappy. In order for this shortage to be resolved, theprice of wool needs to rise. As the price moves upwards, there is a contraction along the demand lineas well as an expansion along the supply line (the laws of demand and supply apply) until this shortagedisappears and the market reaches the equilibrium point where the quantities demanded and suppliedare exactly equal.
• At prices above equilibrium. Equilibrium is also not possible at an excessively high price of $10(see row E in the table). The problem here is a market surplus or glut of 20 000 million kilograms. Thisarises due to a demand of only 5000 million kilograms compared with a supply of 25 000 kilograms atthat price. Sellers would be most unhappy. In a free and competitive market, this problem would soondisappear as the market price decreased. As this happens, demand would expand and supply wouldcontract, restoring equilibrium where the quantities demanded and supplied were again exactly equal.
30 Key Concepts VCE Economics 2 Units 3 & 4 Tenth Edition

“c01AnIntroductionToMicroeconomics_print” — 2019/10/18 — 17:54 — page 31 — #29
FIGURE 1.16 A demand–supply graph showing how the free operation of market forces determines theequilibrium price of wool
Quantity (Q) of wool demanded and supplied
per year (million kg)
0 5000 10 000 15 000 20 000 25 000
10.00
4.00
6.00
2.00
8.00
Pri
ce
of
wo
ol p
er
kg
($)
S1 D1
D1
Shortage or
undersupply
(i.e. D > S)
Equilibriumquantity
EquilibriumS = D
Prices toohigh formarket tocreateequilibrium
Prices arejust right
Prices toolow formarket tocreateequilibrium
S1
D = S
PEquilibriumprice
Expansion of demand
Expan
sion
of s
upply
Con
tract
ion
of sup
ply
Contraction of dem
and
Pricesrise toremoveshortage
Pricesfall toremovesurplus
Surplus or
oversupply
(i.e. S > D)
Possible market
price per kilogram
Quantity of wool
demanded (D1) per
year (million kg)
Quantity of wool
supplied (S1) per
year (million kg)
Market situation and direction
of pressure on market prices
A $2.00 Market shortages/prices rise
B $4.00 Market shortages/prices rise
C $6.00 Market equilibrium/prices stable
D $8.00 Market surplus/prices fall
E $10.00
25 000
20 000
15 000
10 000
5000
5000
10 000
15 000
20 000
25 000 Market surplus/prices fall
0.00
In our analysis so far, we have seen that market forces involving demand and supply for wool determinethe actual equilibrium price and quantity traded. However, the same explanation would apply to the pricepaid for any type of good or service in a competitive market — whether for oranges, property, companyshares, an airfare, a plumber, a soft drink or a hamburger. All competitive markets operate the same way.
1.6 ACTIVITIESTo answer questions online and to receive immediate feedback and sample responses for every question, goto your learnON title at www.jacplus.com.au.
Check your understanding1. What are demand–supply diagrams?2. In a market, what is demand? Explain the law of demand.3. When graphed, describe the features of the demand line.
TOPIC 1 An introduction to microeconomics 31

“c01AnIntroductionToMicroeconomics_print” — 2019/10/18 — 17:54 — page 32 — #30
4. Explain the difference between an expansion in demand and a contraction in demand.5. In a market, what is supply? Explain the law of supply.6. When graphed, describe the features of the supply line.7. Explain the difference between an expansion in supply and a contraction in supply.8. What is market equilibrium?
Applied economic exercises1. Examine table 1.3 showing the schedule relating to the demand and supply for coffee beans in a competitive
market and answer the questions that follow.
TABLE 1.3 Schedule showing the demand and supply of coffee beans in acompetitive market
Price of coffeebeans per kilo
Quantity of coffee beansdemanded in kilos (D1)
Quantity of coffee beanssupplied in kilos (S1)
$4.00 1600 200
$6.00 1400 400
$8.00 1200 600
$10.00 1000 800
$12.00 800 1000
$14.00 600 1200
$16.00 400 1400
(a) Describe the law of demand for coffee beans, quoting information from the table. (2 marks)(b) Describe the law of supply for coffee beans, quoting information from the table. (2 marks)(c) Use this table of data to accurately construct and fully label a demand–supply diagram
representing the market for coffee beans. (3 marks)(d) Assume that the market for coffee beans is a perfectly competitive one. On the diagram you have drawn,
clearly identify and label the equilibrium price and equilibrium quantity traded. In addition, clearly explainwhat is meant by the term ‘equilibrium’. (2 marks)
(e) Quoting information from the table, explain the type of situation that exists in the market for coffeebeans, at each of the following prices:i. $4.00 per kiloii. $11.00 per kiloiii. $16.00 per kilo. (3 marks)
To answer past VCAA exam questions online and to receive immediate feedback and sample responses for everyquestion go to your learnON title at www.jacplus.com.au.
studyON: Past VCAA exam questions
Fully worked solutions and sample responses are available in your digital formats.
32 Key Concepts VCE Economics 2 Units 3 & 4 Tenth Edition

“c01AnIntroductionToMicroeconomics_print” — 2019/10/18 — 17:54 — page 33 — #31
1.7 The effects of changes in demand and supplyconditions on market equilibrium and the allocation ofresources
KEY CONCEPTS• factors likely to affect demand and the position of the demand curve: changes in disposable income, theprices of substitutes and complements, preferences and tastes, interest rates, changes in population andconsumer confidence
• the effects of changes in supply and demand on equilibrium prices and quantity traded• the role of relative prices in markets on the allocation of resources and the effect on living standards• factors likely to affect supply and the position of the supply curve: changes in the cost of production,technological change, productivity growth and climatic conditions
Looking around us, we notice that the prices of most goods and services are always changing from weekto week, day to day, and even hour to hour. This is the result of changes in the quantity of a good orservice that buyers are prepared to demand or purchase at any given price, or changes in the quantity ofa good or service that sellers are prepared to produce or supply at any given price. We will see that thesechanges in buyer and seller behaviour are the result of new conditions of demand and/or new conditions ofsupply. These conditions shift the position of the whole demand and/or supply line (or curve) at any givenprice horizontally to the right or left of the original lines.• Changing microeconomic demand-side conditions can cause buyers to purchase a greater or smaller
quantity of a particular good or service at all possible prices. This will shift the position of the wholedemand line either to the right of the original line (showing an increase in demand at a given price) orto the left (showing a decrease in demand at a given price).
• Changing microeconomic supply-side conditions can cause sellers to produce a greater or smallerquantity of a particular good or service at all possible prices. This will shift the position of the wholesupply line either to the right of the original line (showing an increase in supply at a given price), or tothe left (showing a decrease in supply at a given price).
By altering the position of the demand line and/or the supply line, changes in non-price demand–supplyconditions will bring about a change in relative prices (the price level of a particular good or servicerelative to that of another). This has a knock-on effect by altering the relative profitability of producing aparticular good or service, causing scarce resources to then be reallocated among competing uses by theirprofit-seeking owners.
1.7.1 Non-price factors that affect the position of the demand curveand market equilibriumThere are non-price microeconomic factors or conditions of demand. These conditions might eitherincrease or decrease the quantity of a particular good or service that buyers are prepared to demand at agiven price, leading to either an increase or a decrease in the demand line on the demand–supply diagram.These conditions that shift the position of the demand line or curve at a given price might include thefollowing:• Changes in disposable income. In general, having more disposable income (such as after a pay rise, an
increase in welfare benefits or a tax cut) tends to increase the demand for particular types of goods andservices at any given price. By contrast, a cut in disposable income generally lowers the quantity
TOPIC 1 An introduction to microeconomics 33

“c01AnIntroductionToMicroeconomics_print” — 2019/10/18 — 17:54 — page 34 — #32
demanded at all possible prices. However, there are exceptions. For instance, a cut in disposableincome might actually increase the demand for lower quality substitutes (inferior goods) to replace themore expensive ones (superior goods).
• Changes in population size and age distribution. Generally, a rise in population will increase thedemand for most types of goods and services at a given price, whereas a decline in population wouldbe expected to reduce demand. Australia’s population is ageing, with a larger proportion of people inolder age groups relative to younger age groups. This has mixed effects — increasing the demand forsome things (such as aged care) but decreasing the demand for other things (such as nappies andchildren’s games). Similarly, the population shift towards capital cities has meant a rise in the demandfor goods and services in the cities and a fall in demand in rural and regional areas.
• Changes in fashions and tastes. Over time, some goods and services become more fashionable andwanted. Technology and the advertising of new products (such as for the latest digital devices andtrendy clothing) play an important role in increasing the demand at a given price. By contrast, otherthings become obsolete and face a falling level of demand by consumers.
• Changes in interest rates on borrowed money. Some people and businesses need to borrow money(known as credit) from banks and pay interest on that money in order to finance their spending.Expensive items like houses, cars and holidays are especially sensitive to changes in interest rates.Generally, higher interest rates will lower the demand at a given price for these types of goods andservices, while lower interest rates tend to increase demand. Interest rates on credit card balances canalso have some effect on the demand line for such products.
• Changes in the price of substitutes. Substitutes are a particular good or service that can be easilyreplaced by another. Margarine, for instance, can be a substitute for butter, and cotton can be asubstitute for wool. When the price of the original product being purchased goes up, buyers sometimesswitch to a cheaper substitute. This decreases the demand for the original item at a given price butincreases the demand for the substitute.
• Changes in the price of complementary goods and services. Complementary goods and services arethose used or bought at the same time. For example, the purchase of a new car also leads to an increasein the demand for fuel, tyres, motor mechanics, accident repairers and roads. Hence when the price ofa car rises, the demand for complementary goods and services is likely to decrease.
• Changes in the levels of consumer and business confidence. Confidence levels relate to howhouseholds and businesses feel about their future economic situations and conditions. This affectswhether they spend or save, which in turn will affect the level of demand for particular types of goodsand services. Recent pessimism about the future has been reflected in a slower rise or even a decline inthe demand for some goods (new cars and household items, and new business equipment) and services(entertainment and holidays).
• Changes in the seasons. In summer, the demand rises for products such as ice cream, surfboards andair conditioners, while the onset of winter might see a rise in the demand for products such as snowskis, cough medicine, electric blankets, footballs and woollen jumpers.
• Changes in government policy and regulations. Governments sometimes find it necessary to affect thedemand for particular goods and services. They might do this through spending outlays and taxes inthe budget, or through legislation. For instance, government spending on transport might generate arise in the demand for building and road-making materials, along with the demand for workers. Cashsubsidies can be used to encourage households or businesses to increase their demand for some itemslike solar panels or rainwater tanks. Alternatively, bans, taxes or restrictions on consumption can beused to reduce the demand for socially undesirable goods and services.
34 Key Concepts VCE Economics 2 Units 3 & 4 Tenth Edition
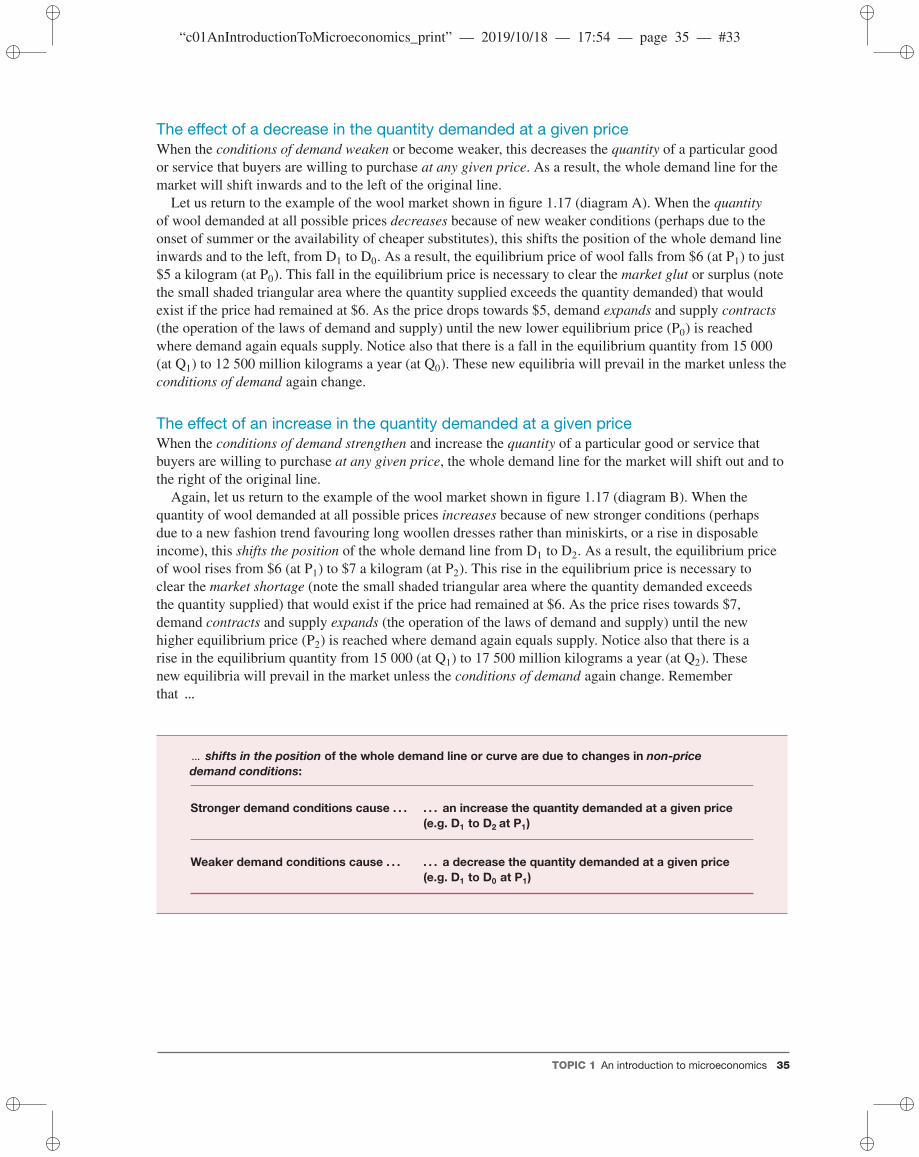
“c01AnIntroductionToMicroeconomics_print” — 2019/10/18 — 17:54 — page 35 — #33
The effect of a decrease in the quantity demanded at a given priceWhen the conditions of demand weaken or become weaker, this decreases the quantity of a particular goodor service that buyers are willing to purchase at any given price. As a result, the whole demand line for themarket will shift inwards and to the left of the original line.
Let us return to the example of the wool market shown in figure 1.17 (diagram A). When the quantityof wool demanded at all possible prices decreases because of new weaker conditions (perhaps due to theonset of summer or the availability of cheaper substitutes), this shifts the position of the whole demand lineinwards and to the left, from D1 to D0. As a result, the equilibrium price of wool falls from $6 (at P1) to just$5 a kilogram (at P0). This fall in the equilibrium price is necessary to clear the market glut or surplus (notethe small shaded triangular area where the quantity supplied exceeds the quantity demanded) that wouldexist if the price had remained at $6. As the price drops towards $5, demand expands and supply contracts(the operation of the laws of demand and supply) until the new lower equilibrium price (P0) is reachedwhere demand again equals supply. Notice also that there is a fall in the equilibrium quantity from 15 000(at Q1) to 12 500 million kilograms a year (at Q0). These new equilibria will prevail in the market unless theconditions of demand again change.
The effect of an increase in the quantity demanded at a given priceWhen the conditions of demand strengthen and increase the quantity of a particular good or service thatbuyers are willing to purchase at any given price, the whole demand line for the market will shift out and tothe right of the original line.
Again, let us return to the example of the wool market shown in figure 1.17 (diagram B). When thequantity of wool demanded at all possible prices increases because of new stronger conditions (perhapsdue to a new fashion trend favouring long woollen dresses rather than miniskirts, or a rise in disposableincome), this shifts the position of the whole demand line from D1 to D2. As a result, the equilibrium priceof wool rises from $6 (at P1) to $7 a kilogram (at P2). This rise in the equilibrium price is necessary toclear the market shortage (note the small shaded triangular area where the quantity demanded exceedsthe quantity supplied) that would exist if the price had remained at $6. As the price rises towards $7,demand contracts and supply expands (the operation of the laws of demand and supply) until the newhigher equilibrium price (P2) is reached where demand again equals supply. Notice also that there is arise in the equilibrium quantity from 15 000 (at Q1) to 17 500 million kilograms a year (at Q2). Thesenew equilibria will prevail in the market unless the conditions of demand again change. Rememberthat …
… shifts in the position of the whole demand line or curve are due to changes in non-pricedemand conditions:
Stronger demand conditions cause . . . . . . an increase the quantity demanded at a given price(e.g. D1 to D2 at P1)
Weaker demand conditions cause . . . . . . a decrease the quantity demanded at a given price(e.g. D1 to D0 at P1)
TOPIC 1 An introduction to microeconomics 35

“c01AnIntroductionToMicroeconomics_print” — 2019/10/18 — 17:54 — page 36 — #34
FIGURE 1.17 Graphs showing how changed market conditions that increase or decrease the demand for woolaffect the equilibrium market price.
S1
This may be the result of weaker demand conditions:
• reduced disposable income
• less fashionable product or seasonal changes
• lower price of substitutes
• future availability assured
• higher taxes
• reduced population or number of consumers
• higher interest rate on borrowed credit.
S1
This may be the result of stronger demand conditions:
• increased disposable income
• more fashionable product or seasonal changes
• higher price of substitutes
• future availability at risk
• lower taxes
• increased population or number of consumers
• lower interest rate on borrowed credit.
Quantity (Q) of wool demanded and supplied per year
(million kg)
10.00
8.00
6.00
5.00
4.00
Price falls
to solve surplus
Original
equilibrium
New equilibrium
Decrease
in
demand
Decrease
in
demand Surplus
(S > D)
50000 10 000 15 00012 500 20 000 25 000
2.00
0.00
Pri
ce
of
wo
ol p
er
kg
($)
S1
D1
D1D0
D0
Q0
D = S D = S
Q1
P1
P0
Quantity (Q) of wool demanded and supplied per year
(million kg)
Diagram A Diagram B
10.00
8.00
4.00
6.00
Price rises
to solve shortage
Increase
in
demand
Increase
in
demand
New
equilibriumShortage
(D > S)
50000 10 000 15 000 17 500 20 000 25 000
2.00
0.00
Pri
ce
of
wo
ol p
er
kg
($)
S1
D1
D2
D1 D2
Q1
D = S D = S
Q2
7.00
P1Original equilibrium
P2
An increase in demand, i.e. D1 D2 aboveA decrease in demand, i.e. D1 D0 above
Possible price ($)
per kg for wool
Original quantity
of wool demanded
(D1) per year
(million kg)
Original quantity
of wool supplied
(S1) per year
(million kg)
A decrease in the
quantity of wool
demanded at a
given price (D0)
per year (million kg)
An increase in the
quantity of wool
demanded at a
given price (D2)
per year (million kg)
A $2.00
B $4.00 15 000 25 000
C $6.00 10 000(the equilibrium price
must fall to $5.00 a kg)
20 000(the equilibrium price
must rise to $7.00 a kg)
D $8.00 5000 15 000
E $10.00
25 000
20 000
15 000
10 000
5000
15 000
20 000 30 0005000
10 000
20 000
25 000 0 10 000
1.7.2 Non-price factors that affect the position of the supply curveand market equilibriumJust as buyers react to changing non-price circumstances, sellers also respond to various non-pricemicroeconomic factors or conditions of supply. These conditions might either increase or decrease thequantity of a particular good or service that sellers are prepared to supply at any given price, leading to
36 Key Concepts VCE Economics 2 Units 3 & 4 Tenth Edition

“c01AnIntroductionToMicroeconomics_print” — 2019/10/18 — 17:54 — page 37 — #35
either an increase or a decrease in the supply line shown on the demand–supply diagram. There are severalcommon microeconomic supply-side conditions that can shift the position of the whole supply line:• Changes in the cost of resources used by businesses. Businesses need to purchase resources (natural,
labour and capital) in order to make goods and services. These purchases represent production costs.When the cost of resources increases — such as wage and other on-costs for staff like compulsorysuperannuation contributions; or the cost of utilities, raw materials and interest rates charged onbusiness overdrafts — these are seen as less favourable supply-side conditions. They decrease theamount firms are willing to supply at a given price. By contrast, when the cost of resources falls, this ismore favourable. Firms are now prepared to increase their supply of a good or service.
• Changes in the application of new technology affecting productivity growth. The use of newtechnology in an industry (such as automated warehouses, robotics and online trading) often liftsefficiency and therefore cuts unit production costs. This usually makes firms more willing and able toincrease their supply at a given price.
• Changes in business profitability and bankruptcy rates. If bankruptcy rates in an industry fall orprofitability rises, businesses become more willing to increase supply at a given price. However,increased bankruptcies and reduced profits are likely to produce a decrease in supply at a given price.
• Changes in climatic conditions affecting production. Climatic conditions affect rural and mineralsuppliers. For instance, recent cyclones and floods in parts of Queensland reduced the supply ofparticular fruit and vegetable crops. They also forced the closure of flooded mines and destroyedinfrastructure needed to transport minerals to terminals. Climate change such as the 2012–18 droughtin parts of northern and eastern Australia also decreased the supply of certain commodities. Bycontrast, favourable weather conditions will increase the supply of some commodities at a given price.
• Changes in government assistance to business or tax rates. On the one hand, governments providefinancial assistance to businesses operating in some manufacturing industries, along with funding forprivate schools and hospitals. This assistance helps businesses in these industries to cover some oftheir costs and makes them more profitable, thereby increasing supply. On the other hand, thegovernment also levies taxes on goods sold and on the incomes of households and companies. Thistaxation tends to decrease the supply of particular goods and services.
The effect of a decrease in the quantity supplied at a given priceWhen the conditions of supply weaken, there is a decrease in supply (the quantity of a particular good orservice that sellers are willing to produce or sell at any given price). As a result, the whole supply line forthe market will shift inwards and to the left of the original line.
Let us again return to the example of the wool market shown in figure 1.18 (diagram A). Whenthe quantity of wool supplied at all possible prices decreases because of new, weaker, less favourableconditions (perhaps reflecting the effects of severe drought or higher production costs for farmers),this shifts the position of the whole supply line outwards and to the left, from S1 to S0. As a result, theequilibrium price of wool rises from $6 (at P1) to $7 a kilogram (at P0). This rise in the equilibrium price isnecessary to clear the market shortage (note the small shaded triangular area where the quantity demandedexceeds the quantity supplied) that would exist if the price had remained at $6. As the price rises towards$7, supply expands and demand contracts (the operation of the laws of demand and supply) until the marketcomes to rest at the higher equilibrium price (P0). In addition, the equilibrium quantity falls from 15 000 (atQ1) to 12 500 million kilograms a year (at Q0). These new equilibria will prevail in the market unless theconditions of supply again change.
The effect of an increase in the quantity supplied at a given priceWhen the conditions of supply strengthen or become more favourable, there is an increase in supply (a risein the quantity of a particular good or service that sellers are willing to produce at any given price). Thewhole supply line for the market will shift down and to the right of the original line.
Again, let us return to the example of the wool market shown in figure 1.18 (diagram B). When thequantity of wool supplied at all possible prices increases because of new, more favourable conditions
TOPIC 1 An introduction to microeconomics 37

“c01AnIntroductionToMicroeconomics_print” — 2019/10/18 — 17:54 — page 38 — #36
(perhaps reflecting the effects of ideal climatic conditions and plenty of feed for stock, or lower costsand better profits for farmers), this shifts the position of the whole supply line out and to the right fromS1 to S2. As a result, the equilibrium price of wool falls from $6 (at P1) to just $5 a kilogram (at P2). Thisfall in the equilibrium price is necessary to clear the market glut or surplus (note the small shaded triangulararea where the quantity supplied exceeds the quantity demanded) that would exist if the price had remainedat $6. As the price falls towards $5, supply contracts and demand expands (the operation of the laws of
FIGURE 1.18 Graphs showing how changed market conditions that decrease or increase the supply of woolaffect the equilibrium market price.
S1
S1
D1
P1
P2
This may be the result of stronger supply conditions:
• increased profitablity
• decreased production costs
• more efficient technology
• favourable climatic conditions
• more producer, sellers or firms
• increased producer preference and expectations
• inducements to production like a subsidy.
This may be the result of weaker supply conditions:
• reduced profitability
• increased production costs
• less efficient technology
• adverse climatic conditions
• fewer producers, sellers or firms
• reduced producer preference and expectations
• obstacles to production like a new tax.
Quantity (Q) of wool demanded and supplied per year
(million kg)
50000 10 000 15 000 17 500 20 000 25 000Q1
D = S D = S
Q2
Price falls
to solve surplus
Original
equilibrium
Increase
in supply
Increase
in
supply
Surplus
(S > D)P
ric
e o
f w
oo
l p
er
kg
($)
S2
D1
Quantity (Q) of wool demanded and supplied per year
(million kg)
Diagram BDiagram A
10.00
8.00
4.00
6.00
Price rise
to solve shortage
Original
equilibrium Decrease
in supply
Decrease
in
supply
New equilibrium
Shortage
(D > S)
50000 10 000 15 00012 500 20 000 25 000
2.00
0.00
Pri
ce
of
wo
ol p
er
kg
($)
S1
S1S0 D1
D1 S0
Q0
S = D S = D
Q1
7.00
P1
P0
New
equilibrium
A decrease in supply, i.e. S1 S0 above An increase in supply, i.e. S1 S2 above
10.00
8.00
4.00
6.00
5.00
2.00
0.00
7.00
Possible price ($)
per kg for wool
Original quantity
of wool demanded
(D1) per year
(million kg)
Original quantity
of wool supplied
(S1) per year
(million kg)
A decrease in the
quantity of wool
supplied (S0) per
year (million kg)
An increase in the
quantity of wool
supplied (S2) per
year (million kg)
A $2.00 10 000
B $4.00 15 000
C $6.00
(price must rise
to $7.00 per kg)
20 000
(price must fall to
$5.00 per kg)
D $8.00 25 000
E $10.00
25 000
20 000
15 000
10 000
5000
5000
10 000
15 000
20 000
25 000
0
5000
10 000
15 000
20 000 30 000 not graphed
38 Key Concepts VCE Economics 2 Units 3 & 4 Tenth Edition

“c01AnIntroductionToMicroeconomics_print” — 2019/10/18 — 17:54 — page 39 — #37
demand and supply) until the market comes to rest at the lower equilibrium price (P2). In addition, theequilibrium quantity rises from 15 000 (at Q1) to 17 500 million kilograms a year (at Q2). These newequilibria will prevail in the market unless the conditions of supply again change. Remember that …
… shifts in the position of the whole supply curve or line are due to changes in non-price supplyconditions:
Stronger supply conditions cause … … an increase the quantity supplied at a given price (e.g. S1 toS2 at P1)
Weaker supply conditions cause … … a decrease the quantity supplied at a given price (e.g. S1 toS0 at P1)
This same analysis would apply to any good or service in a competitive market where there were similarchanges in non-price demand or supply conditions. It makes no difference whether we are dealing withalterations in the conditions for wool, oranges, computers, fish, beer, electricians, minerals, the Australiandollar or even labour. All competitive markets operate the same way.
1.7.3 Reviewing the role of relative prices in markets on the allocationof resources and living standardsYou may recall that Australia has a contemporary market economy where the three important economicdecisions (the ‘what and how much to produce’, ‘how to produce’ and ‘for whom to produce’ questions) areanswered largely through the operation of the price or market system. The main principles of this system areagain summarised below.
Five ideas about how the operation of the price system helps to make key economicdecisions1. Because we face the problem of relative scarcity, economic decisions must be made about how to allocate
our resources efficiently to maximise the satisfaction of our wants.2. As Australia has a market economy, key economic decisions are usually made through the operation of the
market system, or price mechanism. This involves buyers (demand) and sellers (supply) of particular goodsand services interacting to negotiate relative prices.
3. Over a period of time, changes in microeconomic demand conditions and/or supply conditions alter thequantity demanded and/or supplied for each good or service at any given price, thus bringing about achange in the level of relative prices (the price of one good or service compared with the price of another).
4. In turn, changes in the relative price of a particular good or service can affect production costs as well as itslevel of relative profits. Incomes will also be affected.
5. By closely monitoring the price and profit signals coming from each market, owners of resources seeking tominimise their costs, and maximise their profits and incomes, will make appropriate economic decisionsabout how best to allocate their scarce resources efficiently among competing uses. For example, higherrelative profits will normally attract extra resources to a particular use, market or industry, while lower profitswill usually repel resources.
Let us now examine in more detail exactly how the market system can answer the three main economicquestions (‘what, how and for whom to produce’) faced by our economy.
Changes in relative prices alter ‘what and how much’ is producedAs discussed, markets operate to determine relative prices of goods and services through the interaction ofbuyers and sellers. So when the relative price of one particular type of good or service (such as wool) risesor falls against the price of another (such as wheat), this alters the relative profits made from producing eachtype of product. In turn, this usually dictates how Australia’s resources are allocated among competing usesand answers the ‘what and how much’ to produce question.
TOPIC 1 An introduction to microeconomics 39
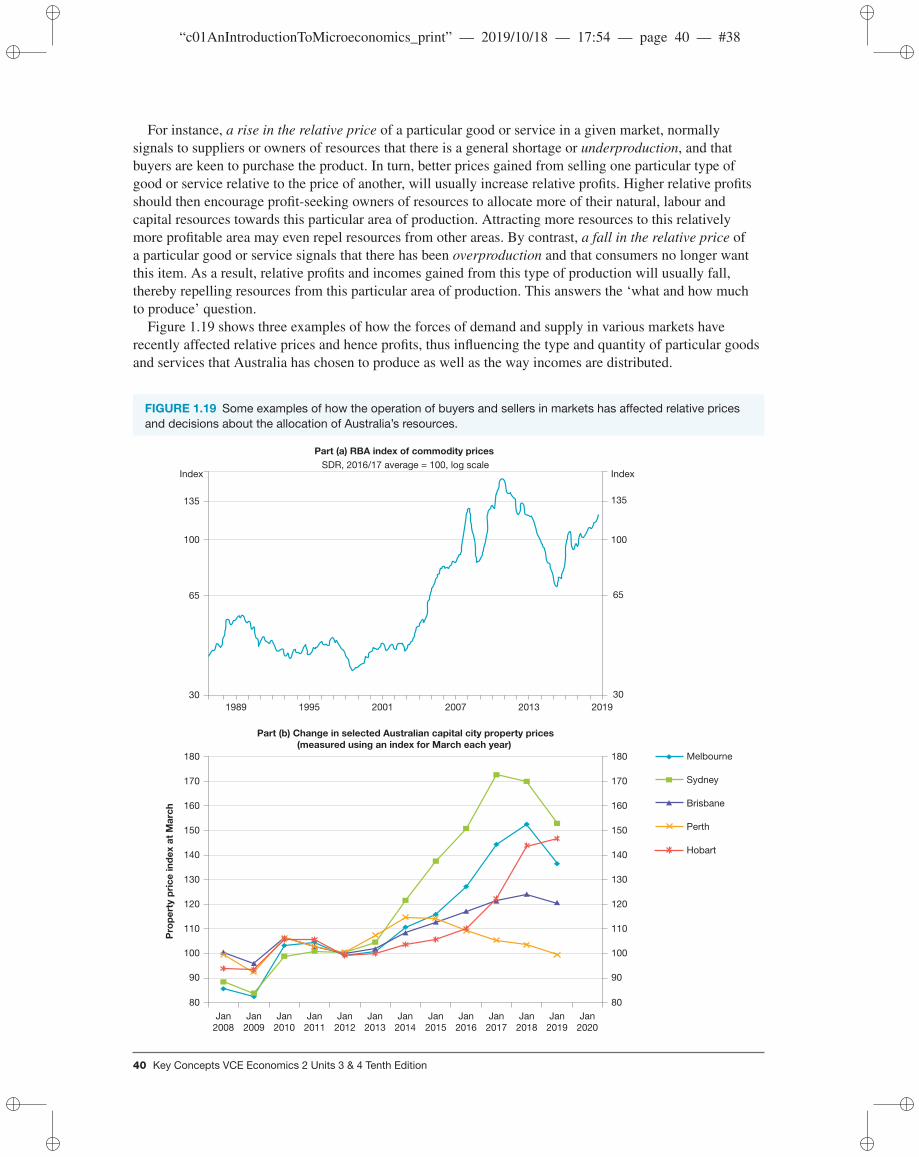
“c01AnIntroductionToMicroeconomics_print” — 2019/10/18 — 17:54 — page 40 — #38
For instance, a rise in the relative price of a particular good or service in a given market, normallysignals to suppliers or owners of resources that there is a general shortage or underproduction, and thatbuyers are keen to purchase the product. In turn, better prices gained from selling one particular type ofgood or service relative to the price of another, will usually increase relative profits. Higher relative profitsshould then encourage profit-seeking owners of resources to allocate more of their natural, labour andcapital resources towards this particular area of production. Attracting more resources to this relativelymore profitable area may even repel resources from other areas. By contrast, a fall in the relative price ofa particular good or service signals that there has been overproduction and that consumers no longer wantthis item. As a result, relative profits and incomes gained from this type of production will usually fall,thereby repelling resources from this particular area of production. This answers the ‘what and how muchto produce’ question.
Figure 1.19 shows three examples of how the forces of demand and supply in various markets haverecently affected relative prices and hence profits, thus influencing the type and quantity of particular goodsand services that Australia has chosen to produce as well as the way incomes are distributed.
FIGURE 1.19 Some examples of how the operation of buyers and sellers in markets has affected relative pricesand decisions about the allocation of Australia’s resources.
Part (a) RBA index of commodity prices
SDR, 2016/17 average = 100, log scaleIndex
135
100
65
30
19951989 2001 2007 2013 2019
Index
135
100
65
30
Pro
pe
rty p
ric
e in
de
x a
t M
arc
h
80
Part (b) Change in selected Australian capital city property prices
(measured using an index for March each year)
110
100
90
120
130
140
180
170
160
Jan2008
Jan2009
Jan2010
Jan2011
Jan2013
Jan2015
Jan2017
Jan2019
Jan2020
150
80
110
100
90
120
130
140
180
170
160
150
Melbourne
Sydney
Brisbane
Perth
Jan2012
Jan2014
Jan2016
Jan2018
Hobart
40 Key Concepts VCE Economics 2 Units 3 & 4 Tenth Edition

“c01AnIntroductionToMicroeconomics_print” — 2019/10/18 — 17:54 — page 41 — #39
Part (c) Australian dollar trade-weighted index*
Index
80
70
60
50
40
1989 1995 2001 2007 2013 2019
Index
80
70
60
50
40
Nominal
Real
*May 1970 = 100 for nominal; real indexed to equate post-float averages;
latest observations for real TWI are estimates
Sources: © Australian Bureau of Statistics; RBA; Thomson Reuters; WM/Reuters.
The graph in part (a) of figure 1.19 shows an index of changes in rural and mineral commodity pricessince 1988 (where the price index in 2015–16 equalled 100 points). Changing commodity prices havegreatly affected the decisions made by owners of resources. The spectacular rise between 2005 and 2011corresponds with the commodity boom driven by strong overseas demand relative to supply. Rising relativeprices and profits attracted more resources into the area. However, commodity prices subsequently droppeddramatically till late 2015 by almost 50 per cent, due especially to the drop in demand relative to supply.This repelled resources because of relatively lower profits. More recently, commodity prices showedsome recovery.
The graph in part (b) of figure 1.19 shows relative changes in capital city housing prices measuredin dollars. Note the steep price rises in capital cities such as Melbourne and Sydney between 2013 andearly 2017. This was due to rising demand fuelled by low interest rates and population growth (includingimmigration), relative to supply. This price rise attracted many more resources into property due to thepotential for making relatively higher profits.
The graph in part (c) of figure 1.19 shows changes in the price or exchange rate for the Australian dollarwhen it is swapped into other currencies — US dollars, yen or euros. These have also affected the decisionsmade by owners of resources. For instance, the relatively high Australian dollar during 2009 and 2012caused locally manufactured goods and services to be too expensive for consumers relative to those madeabroad. Locally, this meant reduced sales, lower profits and business closures. Consequently, resources wereredirected elsewhere. By comparison, there was an overall fall in the value of the Australian dollar between2012 and early 2019. This made local goods and services relatively more attractive and profitable, resultingin more resources being allocated in this direction.
Changes in relative prices alter ‘how’ goods and services are producedMarkets also operate to determine the price or cost of most resources. They thus provide useful informationneeded by businesses to make decisions about their production methods. For instance, changes in the cost ormarket price of one resource relative to the price of another (such as the cost of labour relative to the
TOPIC 1 An introduction to microeconomics 41
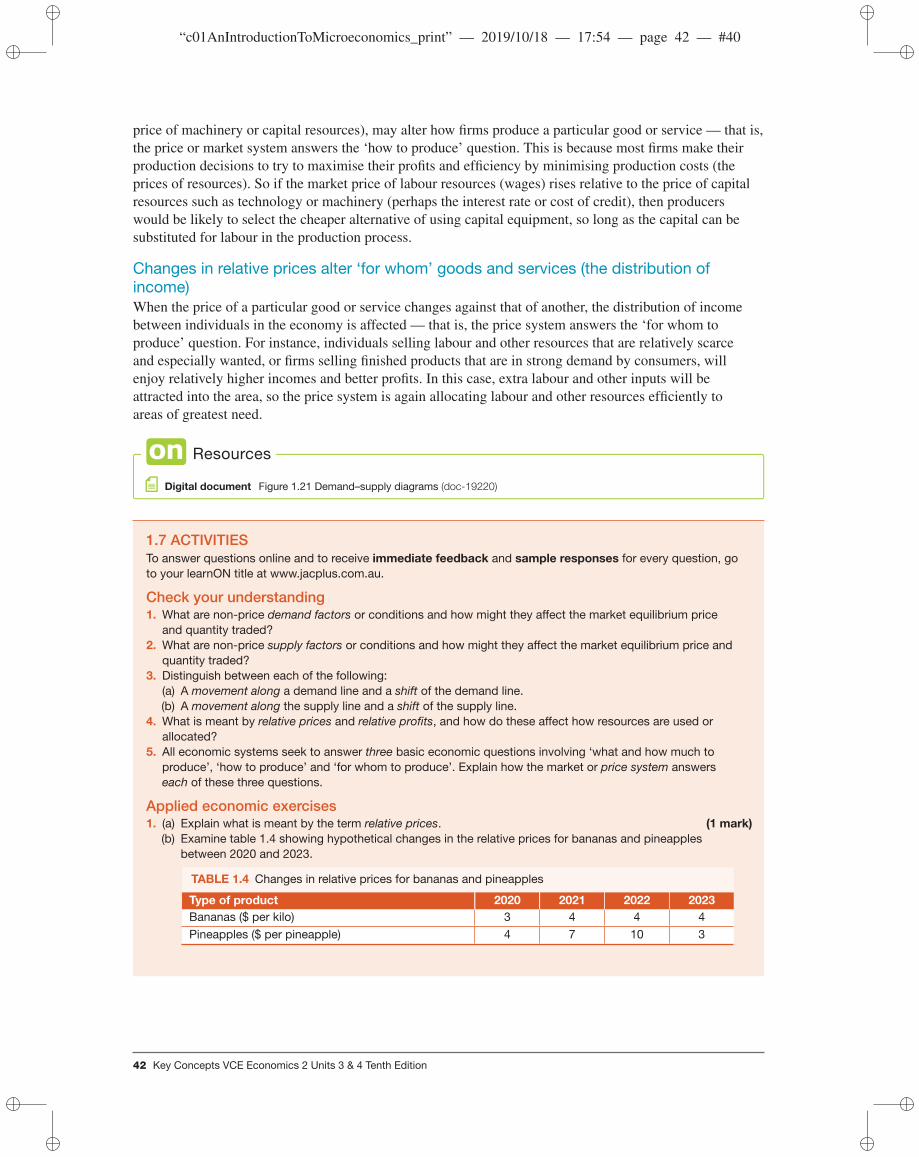
“c01AnIntroductionToMicroeconomics_print” — 2019/10/18 — 17:54 — page 42 — #40
price of machinery or capital resources), may alter how firms produce a particular good or service — that is,the price or market system answers the ‘how to produce’ question. This is because most firms make theirproduction decisions to try to maximise their profits and efficiency by minimising production costs (theprices of resources). So if the market price of labour resources (wages) rises relative to the price of capitalresources such as technology or machinery (perhaps the interest rate or cost of credit), then producerswould be likely to select the cheaper alternative of using capital equipment, so long as the capital can besubstituted for labour in the production process.
Changes in relative prices alter ‘for whom’ goods and services (the distribution ofincome)When the price of a particular good or service changes against that of another, the distribution of incomebetween individuals in the economy is affected — that is, the price system answers the ‘for whom toproduce’ question. For instance, individuals selling labour and other resources that are relatively scarceand especially wanted, or firms selling finished products that are in strong demand by consumers, willenjoy relatively higher incomes and better profits. In this case, extra labour and other inputs will beattracted into the area, so the price system is again allocating labour and other resources efficiently toareas of greatest need.
Resources
Digital document Figure 1.21 Demand–supply diagrams (doc-19220)
1.7 ACTIVITIESTo answer questions online and to receive immediate feedback and sample responses for every question, goto your learnON title at www.jacplus.com.au.
Check your understanding1. What are non-price demand factors or conditions and how might they affect the market equilibrium price
and quantity traded?2. What are non-price supply factors or conditions and how might they affect the market equilibrium price and
quantity traded?3. Distinguish between each of the following:
(a) A movement along a demand line and a shift of the demand line.(b) A movement along the supply line and a shift of the supply line.
4. What is meant by relative prices and relative profits, and how do these affect how resources are used orallocated?
5. All economic systems seek to answer three basic economic questions involving ‘what and how much toproduce’, ‘how to produce’ and ‘for whom to produce’. Explain how the market or price system answerseach of these three questions.
Applied economic exercises1. (a) Explain what is meant by the term relative prices. (1 mark)
(b) Examine table 1.4 showing hypothetical changes in the relative prices for bananas and pineapplesbetween 2020 and 2023.
TABLE 1.4 Changes in relative prices for bananas and pineapples
Type of product 2020 2021 2022 2023Bananas ($ per kilo) 3 4 4 4
Pineapples ($ per pineapple) 4 7 10 3
42 Key Concepts VCE Economics 2 Units 3 & 4 Tenth Edition
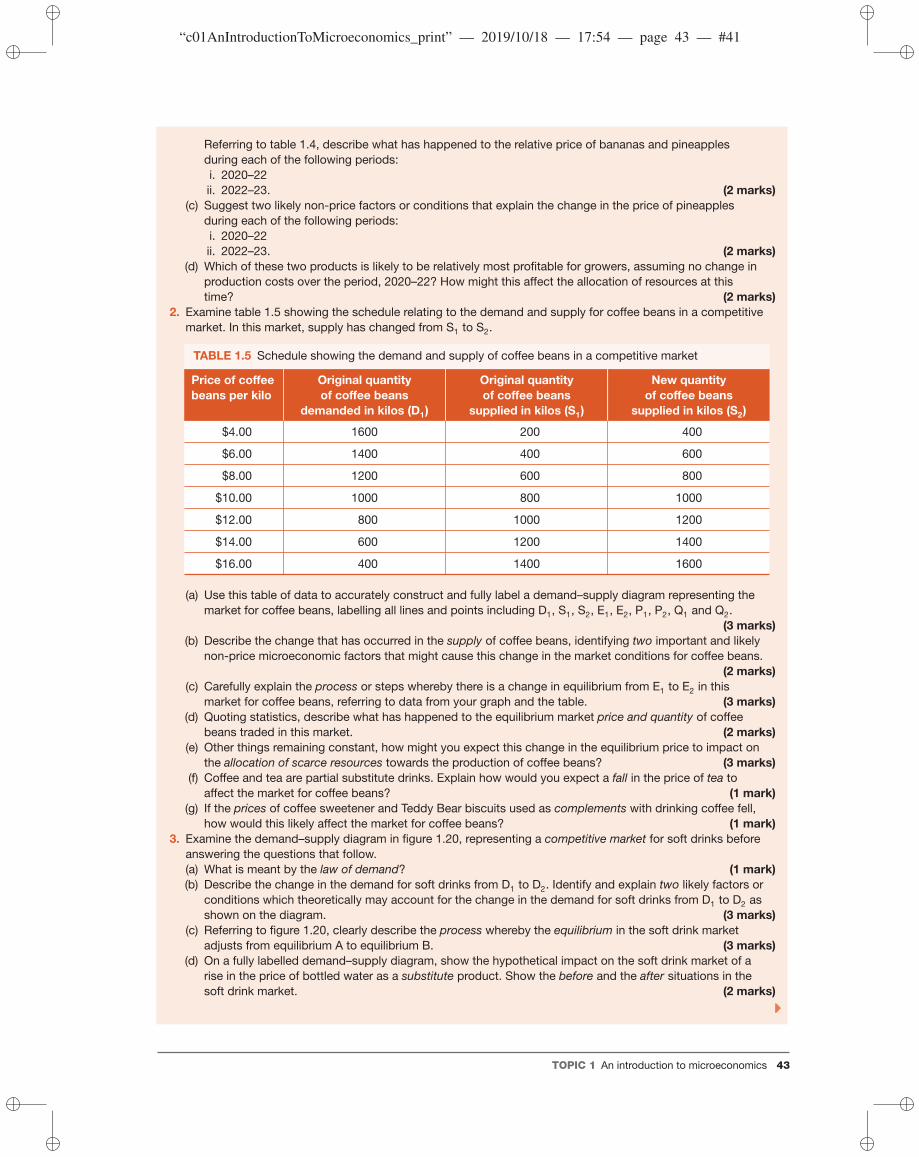
“c01AnIntroductionToMicroeconomics_print” — 2019/10/18 — 17:54 — page 43 — #41
Referring to table 1.4, describe what has happened to the relative price of bananas and pineapplesduring each of the following periods:i. 2020–22ii. 2022–23. (2 marks)
(c) Suggest two likely non-price factors or conditions that explain the change in the price of pineapplesduring each of the following periods:i. 2020–22ii. 2022–23. (2 marks)
(d) Which of these two products is likely to be relatively most profitable for growers, assuming no change inproduction costs over the period, 2020–22? How might this affect the allocation of resources at thistime? (2 marks)
2. Examine table 1.5 showing the schedule relating to the demand and supply for coffee beans in a competitivemarket. In this market, supply has changed from S1 to S2.
TABLE 1.5 Schedule showing the demand and supply of coffee beans in a competitive market
Price of coffeebeans per kilo
Original quantityof coffee beans
demanded in kilos (D1)
Original quantityof coffee beans
supplied in kilos (S1)
New quantityof coffee beans
supplied in kilos (S2)
$4.00 1600 200 400
$6.00 1400 400 600
$8.00 1200 600 800
$10.00 1000 800 1000
$12.00 800 1000 1200
$14.00 600 1200 1400
$16.00 400 1400 1600
(a) Use this table of data to accurately construct and fully label a demand–supply diagram representing themarket for coffee beans, labelling all lines and points including D1, S1, S2, E1, E2, P1, P2, Q1 and Q2.
(3 marks)(b) Describe the change that has occurred in the supply of coffee beans, identifying two important and likely
non-price microeconomic factors that might cause this change in the market conditions for coffee beans.(2 marks)
(c) Carefully explain the process or steps whereby there is a change in equilibrium from E1 to E2 in thismarket for coffee beans, referring to data from your graph and the table. (3 marks)
(d) Quoting statistics, describe what has happened to the equilibrium market price and quantity of coffeebeans traded in this market. (2 marks)
(e) Other things remaining constant, how might you expect this change in the equilibrium price to impact onthe allocation of scarce resources towards the production of coffee beans? (3 marks)
(f) Coffee and tea are partial substitute drinks. Explain how would you expect a fall in the price of tea toaffect the market for coffee beans? (1 mark)
(g) If the prices of coffee sweetener and Teddy Bear biscuits used as complements with drinking coffee fell,how would this likely affect the market for coffee beans? (1 mark)
3. Examine the demand–supply diagram in figure 1.20, representing a competitive market for soft drinks beforeanswering the questions that follow.(a) What is meant by the law of demand? (1 mark)(b) Describe the change in the demand for soft drinks from D1 to D2. Identify and explain two likely factors or
conditions which theoretically may account for the change in the demand for soft drinks from D1 to D2 asshown on the diagram. (3 marks)
(c) Referring to figure 1.20, clearly describe the process whereby the equilibrium in the soft drink marketadjusts from equilibrium A to equilibrium B. (3 marks)
(d) On a fully labelled demand–supply diagram, show the hypothetical impact on the soft drink market of arise in the price of bottled water as a substitute product. Show the before and the after situations in thesoft drink market. (2 marks)
TOPIC 1 An introduction to microeconomics 43

“c01AnIntroductionToMicroeconomics_print” — 2019/10/18 — 17:54 — page 44 — #42
FIGURE 1.20 The market for soft drinks
Quantity of soft drinksP
ric
e o
f so
ft d
rin
ks (
$)
Q2
D1
S1
D2
A
B
Q1
P1
P2
(e) Explain the likely impact on the soft drink market of a rise in the price of plastic bottles and the wagespaid to soft drink workers. (2 marks)
4. Download a copy of figure 1.21 Demand–supply diagrams from the Resources tab. Complete and fully labeleach of the following D–S diagrams representing an individual competitive market in figure 1.21 to show thehypothetical effects of an event that alters either the conditions of demand and/or supply, and hence themarket equilibrium price and quantity. In most cases, you will need to add a second D line (D2) and/or asecond S line (S2), along with a new equilibrium price (P2) and quantity (Q2). (9 marks)
FIGURE 1.21 Showing the impact of changed conditions on demand–supply diagrams forvarious markets
The banana crop in Queensland is
destroyed by a cyclone
A slowdown in China’s economy
and the market for iron ore
The effect of a heatwave on the
market for air conditioners
The effect of a successful
advertising campaign, ‘Put
some pork on your fork’.
A rise in petrol prices on the
market for large 4WDs
A rise in consumer confidence
and disposable income for air
travel
The government increases the
excise tax on the sale of cigarettes
The aviation market one week
before the AFL grand final when
a non-Victorian AFL team made
the final game
An increase in the government
subsidy paid to childcare
providers
44 Key Concepts VCE Economics 2 Units 3 & 4 Tenth Edition
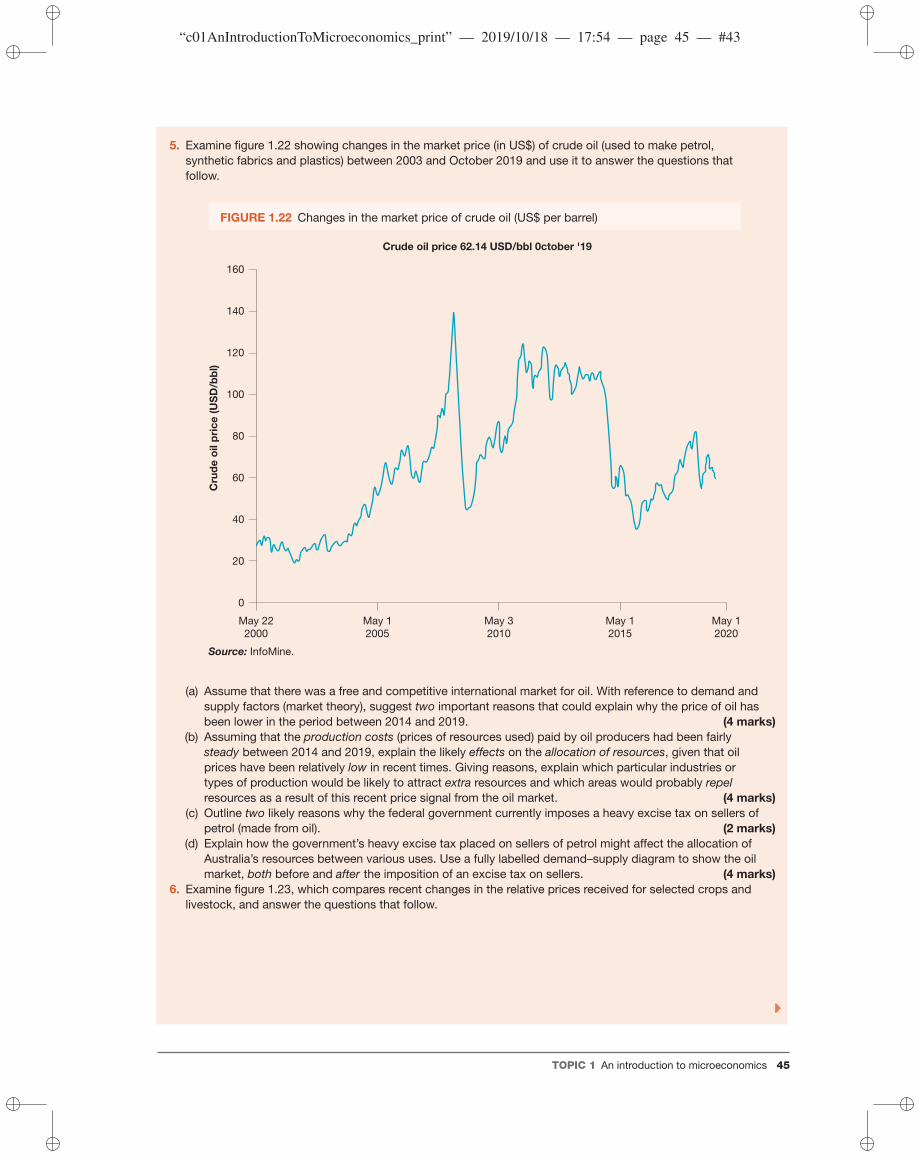
“c01AnIntroductionToMicroeconomics_print” — 2019/10/18 — 17:54 — page 45 — #43
5. Examine figure 1.22 showing changes in the market price (in US$) of crude oil (used to make petrol,synthetic fabrics and plastics) between 2003 and October 2019 and use it to answer the questions thatfollow.
FIGURE 1.22 Changes in the market price of crude oil (US$ per barrel)
May 22
2000
0
20
40
60
80
100
120
Cru
de
oil p
ric
e (
US
D/b
bl)
140
160
Crude oil price 62.14 USD/bbl 0ctober '19
May 1
2005
May 3
2010
May 1
2015
May 1
2020
Source: InfoMine.
(a) Assume that there was a free and competitive international market for oil. With reference to demand andsupply factors (market theory), suggest two important reasons that could explain why the price of oil hasbeen lower in the period between 2014 and 2019. (4 marks)
(b) Assuming that the production costs (prices of resources used) paid by oil producers had been fairlysteady between 2014 and 2019, explain the likely effects on the allocation of resources, given that oilprices have been relatively low in recent times. Giving reasons, explain which particular industries ortypes of production would be likely to attract extra resources and which areas would probably repelresources as a result of this recent price signal from the oil market. (4 marks)
(c) Outline two likely reasons why the federal government currently imposes a heavy excise tax on sellers ofpetrol (made from oil). (2 marks)
(d) Explain how the government’s heavy excise tax placed on sellers of petrol might affect the allocation ofAustralia’s resources between various uses. Use a fully labelled demand–supply diagram to show the oilmarket, both before and after the imposition of an excise tax on sellers. (4 marks)
6. Examine figure 1.23, which compares recent changes in the relative prices received for selected crops andlivestock, and answer the questions that follow.
TOPIC 1 An introduction to microeconomics 45
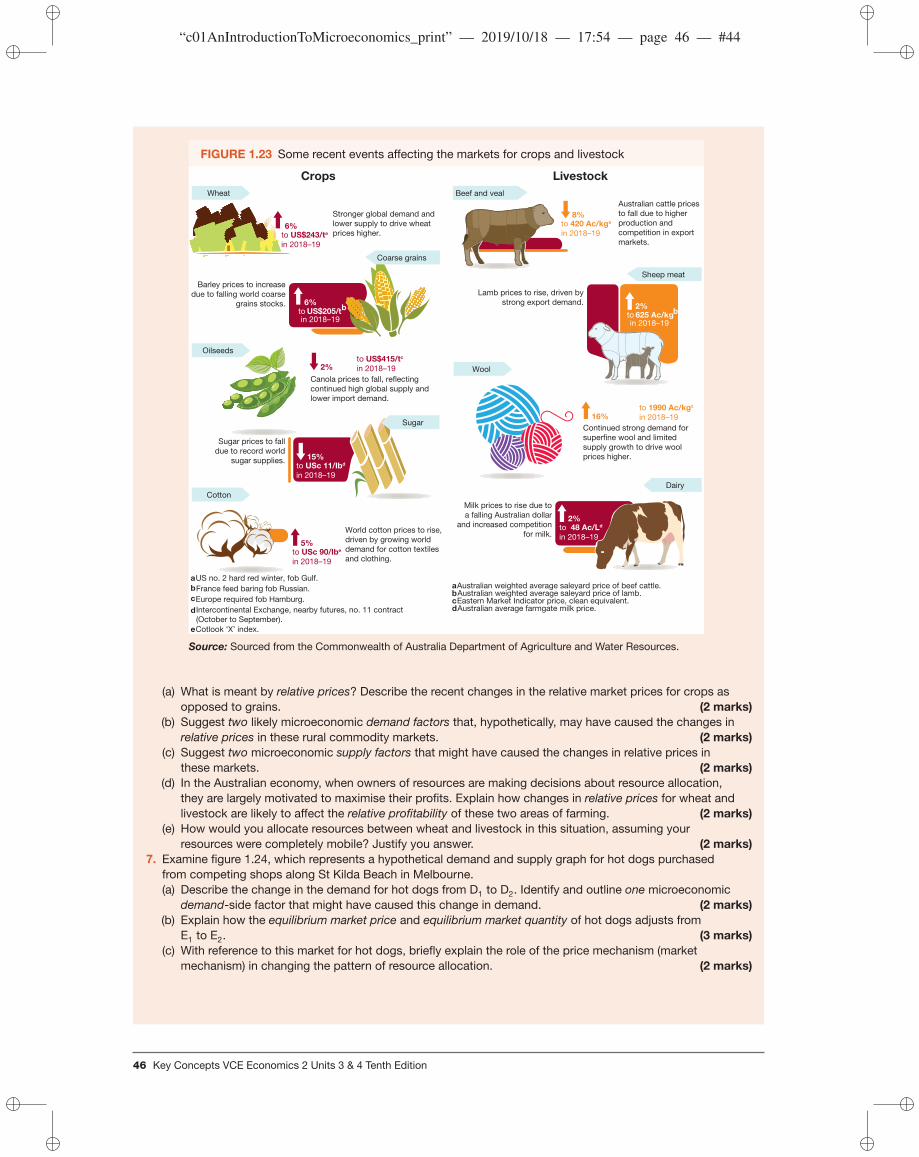
“c01AnIntroductionToMicroeconomics_print” — 2019/10/18 — 17:54 — page 46 — #44
FIGURE 1.23 Some recent events affecting the markets for crops and livestock
Barley prices to increase
due to falling world coarse
grains stocks.
Canola prices to fall, reflecting
continued high global supply and
lower import demand.
Wheat Beef and veal
Oilseeds
Wool
Cotton
Sheep meat
Dairy
Crops
6%to US$243/ta
in 2018–19
8%to 420 Ac/kga
in 2018–19
15%to USc 11/Ibd
in 2018–19
5%to USc 90/Ibe
in 2018–19
6%to US$205/t
b
in 2018–19
2%
Livestock
a US no. 2 hard red winter, fob Gulf.
b France feed baring fob Russian.
c Europe required fob Hamburg.
d Intercontinental Exchange, nearby futures, no. 11 contract
(October to September).
e Cotlook ‘X’ index.
Australian cattle prices
to fall due to higher
production and
competition in export
markets.
Lamb prices to rise, driven by
strong export demand.
Milk prices to rise due to
a falling Australian dollar
and increased competition
for milk.
Continued strong demand for
superfine wool and limited
supply growth to drive wool
prices higher.
a Australian weighted average saleyard price of beef cattle.b Australian weighted average saleyard price of lamb.c Eastern Market Indicator price, clean equivalent.d Australian average farmgate milk price.
Sugar prices to fall
due to record world
sugar supplies.
World cotton prices to rise,
driven by growing world
demand for cotton textiles
and clothing.
Stronger global demand and
lower supply to drive wheat
prices higher.
to US$415/tc
in 2018–19
16%to 1990 Ac/kgc
in 2018–19
2%to 625 Ac/kg
b
in 2018–19
2%to 48 Ac/Ld
in 2018–19
Coarse grains
Sugar
Source: Sourced from the Commonwealth of Australia Department of Agriculture and Water Resources.
(a) What is meant by relative prices? Describe the recent changes in the relative market prices for crops asopposed to grains. (2 marks)
(b) Suggest two likely microeconomic demand factors that, hypothetically, may have caused the changes inrelative prices in these rural commodity markets. (2 marks)
(c) Suggest two microeconomic supply factors that might have caused the changes in relative prices inthese markets. (2 marks)
(d) In the Australian economy, when owners of resources are making decisions about resource allocation,they are largely motivated to maximise their profits. Explain how changes in relative prices for wheat andlivestock are likely to affect the relative profitability of these two areas of farming. (2 marks)
(e) How would you allocate resources between wheat and livestock in this situation, assuming yourresources were completely mobile? Justify you answer. (2 marks)
7. Examine figure 1.24, which represents a hypothetical demand and supply graph for hot dogs purchasedfrom competing shops along St Kilda Beach in Melbourne.(a) Describe the change in the demand for hot dogs from D1 to D2. Identify and outline one microeconomic
demand-side factor that might have caused this change in demand. (2 marks)(b) Explain how the equilibrium market price and equilibrium market quantity of hot dogs adjusts from
E1 to E2. (3 marks)(c) With reference to this market for hot dogs, briefly explain the role of the price mechanism (market
mechanism) in changing the pattern of resource allocation. (2 marks)
46 Key Concepts VCE Economics 2 Units 3 & 4 Tenth Edition

“c01AnIntroductionToMicroeconomics_print” — 2019/10/18 — 17:54 — page 47 — #45
FIGURE 1.24 The demand and supply of hot dogs
Pri
ce
pe
r h
ot
do
g (
$)
P2/4.00
P1/3.00
Quantity (number of hot dogs per day)
800 1200 1600
D1
E1
E2
S1
D2
8. Explain how the operation of Australia’s market system normally allocates scarce resources efficientlybetween competing uses. Illustrate your explanation with reference to recent price changes that haveoccurred in various Australian or global markets. (6 marks)
To answer past VCAA exam questions online and to receive immediate feedback and sample responses for everyquestion go to your learnON title at www.jacplus.com.au.
studyON: Past VCAA exam questions
Fully worked solutions and sample responses are available in your digital formats.
1.8 The meaning and significance of price elasticity ofdemand and supply
KEY CONCEPTS• the meaning and significance of price elasticity of demand and supply• factors affecting price elasticity of demand: degree of necessity, availability of substitutes, proportion ofincome and time
• factors affecting price elasticity of supply: spare capacity, production period and durability of goods
We already know that the quantity of a good or service demanded or supplied either expands or contractswhen there is a change in its price (i.e. this is illustrated by a shift up or downwards along the line or curve).Indeed, this is the basis of the laws of demand and supply. Price elasticity further refines this concept bymeasuring the degree of responsiveness of the quantity demanded or supplied to a given change in price.
1.8.1 Factors affecting the price elasticity of demandAccording to the law of demand, the quantity demanded varies inversely with a change in its price — whenthe price goes up, demand contracts; when the price goes down, demand expands. However, the priceelasticity of demand measures the responsiveness of the quantity demanded relative to the percentagechange in price. For instance, given a rise in price, elasticity measures whether, in percentage terms, thedemand contracts by a lot or just a little.
TOPIC 1 An introduction to microeconomics 47

“c01AnIntroductionToMicroeconomics_print” — 2019/10/18 — 17:54 — page 48 — #46
Price elasticity of demand or PED can be calculated as follows:
PED = Percentage change in the quantity demandedPercentage change in its price
There are three types of price elasticity for demand:
Demand is relatively elastic (high PED)
Demand is relatively elastic
Quantity demanded
Pri
ce
/un
it (
$)
Q2 Q1
P2
P1
Demand line
The PED is high (a number that is greater than 1) if the quantityof a particular good or service demanded changes by a largerproportion than the change in price; for example, a 10 per centrise in price results in a 20 per cent contraction in the quantityof a good or service demanded. In this case, buyers are easilyable to defer or switch their demand elsewhere in response tohigher prices. An elastic demand means that if prices rise, thetotal revenue or value of consumer purchases (which equals theunit price multiplied by the quantity demanded or purchased)decreases. When drawn, the elastic demand line is fairly flat.
Demand is of unit elasticity (medium PED)
Demand is of unit elasticity
Q2 Q1
P2
P1
Quantity demanded
Pri
ce
/un
it (
$)
Demand line
The PED is medium (a number that is equal to 1) if the quantitydemanded changes by the same proportion as the change inprice. Here, a 10 per cent rise in price results in a 10 per centcontraction in the quantity demanded. Consequently, totalrevenue remains unchanged with a rise in price.
Demand is relatively inelastic (low PED)
Demand is relatively inelastic
Q2 Q1
P2
P1
Quantity demanded
Pri
ce
/un
it (
$)
Demand line
The PED is low (a number that is less than 1) if the quantitydemanded changes by a smaller proportion than the changein price. Here, a 10 per cent rise in price results in only a5 per cent contraction in quantity demanded. In this situation,buyers are unable or unwilling to significantly contract demand.Consequently, total revenue increases with a rise in price. Whendrawn, the inelastic demand line is fairly steep.
Note, however, that in order to use the slope of the demandline to indicate the degree of elasticity, the same scale has beenused on all axes.
The price elasticity of demand (PED) is affected by a numberof factors:• Type of item. The demand for necessities, such as basic
foods, rental accommodation and medical attention, isnormally relatively inelastic, while that for non-necessitieslike luxury cars, holidays and entertainment is usuallyrelatively elastic.
• Product substitutability. The demand for substitutes (e.g. wool and synthetics, butter and margarine,Australian wheat versus overseas wheat, different breakfast cereal) is usually fairly elastic, while thatfor unique products (such as petrol for most car owners, eggs) is quite inelastic.
48 Key Concepts VCE Economics 2 Units 3 & 4 Tenth Edition
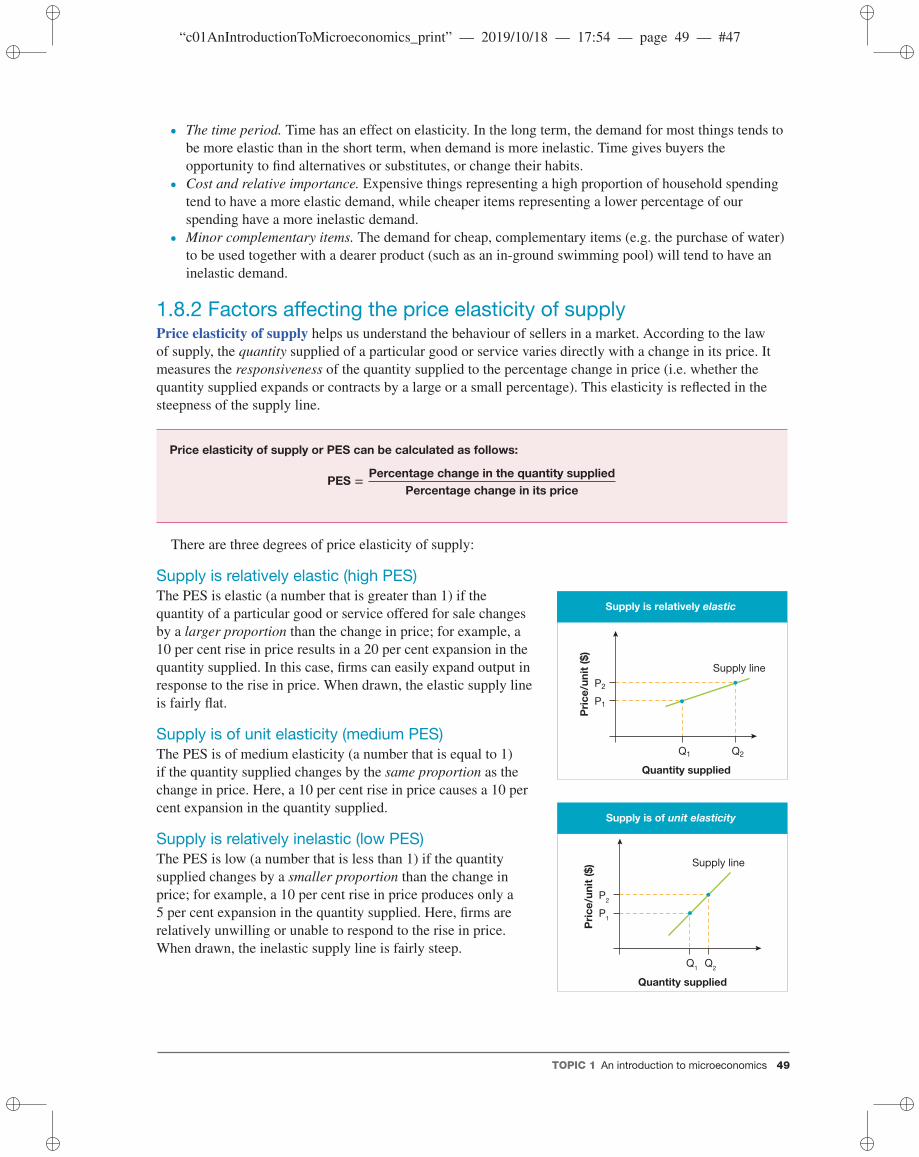
“c01AnIntroductionToMicroeconomics_print” — 2019/10/18 — 17:54 — page 49 — #47
• The time period. Time has an effect on elasticity. In the long term, the demand for most things tends tobe more elastic than in the short term, when demand is more inelastic. Time gives buyers theopportunity to find alternatives or substitutes, or change their habits.
• Cost and relative importance. Expensive things representing a high proportion of household spendingtend to have a more elastic demand, while cheaper items representing a lower percentage of ourspending have a more inelastic demand.
• Minor complementary items. The demand for cheap, complementary items (e.g. the purchase of water)to be used together with a dearer product (such as an in-ground swimming pool) will tend to have aninelastic demand.
1.8.2 Factors affecting the price elasticity of supplyPrice elasticity of supply helps us understand the behaviour of sellers in a market. According to the lawof supply, the quantity supplied of a particular good or service varies directly with a change in its price. Itmeasures the responsiveness of the quantity supplied to the percentage change in price (i.e. whether thequantity supplied expands or contracts by a large or a small percentage). This elasticity is reflected in thesteepness of the supply line.
Price elasticity of supply or PES can be calculated as follows:
PES = Percentage change in the quantity suppliedPercentage change in its price
There are three degrees of price elasticity of supply:
Supply is relatively elastic (high PES)
Quantity supplied
Pri
ce
/un
it (
$)
Q1 Q2
P2
P1
Supply line
Supply is relatively elastic
The PES is elastic (a number that is greater than 1) if thequantity of a particular good or service offered for sale changesby a larger proportion than the change in price; for example, a10 per cent rise in price results in a 20 per cent expansion in thequantity supplied. In this case, firms can easily expand output inresponse to the rise in price. When drawn, the elastic supply lineis fairly flat.
Supply is of unit elasticity (medium PES)
Supply is of unit elasticity
Q1
Q2
P2
P1
Quantity supplied
Pri
ce
/un
it (
$) Supply line
The PES is of medium elasticity (a number that is equal to 1)if the quantity supplied changes by the same proportion as thechange in price. Here, a 10 per cent rise in price causes a 10 percent expansion in the quantity supplied.
Supply is relatively inelastic (low PES)The PES is low (a number that is less than 1) if the quantitysupplied changes by a smaller proportion than the change inprice; for example, a 10 per cent rise in price produces only a5 per cent expansion in the quantity supplied. Here, firms arerelatively unwilling or unable to respond to the rise in price.When drawn, the inelastic supply line is fairly steep.
TOPIC 1 An introduction to microeconomics 49

“c01AnIntroductionToMicroeconomics_print” — 2019/10/18 — 17:54 — page 50 — #48
Supply is relatively inelastic
Q1
Q2
Quantity supplied
Pri
ce
/un
it (
$)
Supply line
P2
P1
The price elasticity of supply (PES) is affected by a number offactors:• Product storability and durability. Items that are durable and
can be stored successfully without deterioration, such asminerals, wheat, wool and red wine, generally face a moreelastic supply line. In such cases, a rise in price means thatsellers can quickly and simply access the extra suppliesof goods or services by reducing their stocks of unsoldgoods. Services tend to face a more inelastic supply becausethey cannot generally be stored.
• Resource mobility and unused industry capacity. Thequantity of a particular item supplied is likely to be more elastic if production levels can be readily andinexpensively changed by moving resources between industries. Supply is especially elastic whenthere is unused or spare productive capacity in an industry or firm. Here, the quantity supplied can beincreased quickly following a rise in the price.
• The time period. In the short term, it is often difficult for firms to expand supply following a price risefor their product, especially if resources are immobile and can’t be moved easily between uses, and ifexcess capacity in production by firms does not exist. In this case, supply is relatively more inelastic inthe short term. However, in the long term, supply becomes more elastic. Over a greater number ofyears, the availability of most resources can be increased, making supply more responsive to pricechanges.
1.8.3 The significance of price elasticity of demand and supplyPrice elasticity has two important and practical implications for sellers and government.1. The pricing policies of sellers.When pricing their products, businesses consider the price elasticity of
demand for their goods or services. For example, retailers such as Myers, Target or Harris Scarfefrequently have sales offering 10 or 20 per cent discounts on their normal prices. Normally this wouldbe expected to cut their total revenue, but this will not happen if the demand for their goods is elastic(with a high PED). Other firms are in the fortunate position of being able to increase prices when theirproducts are essential and have no close substitute. Because demand for their goods is inelastic (with alow PED), they will actually increase their revenue and profits.
2. The raising of government revenue. Governments always seem to be short of revenue. If raisingrevenue was their main goal, governments would select products with a low or inelastic PED (tobacco,alcohol, petrol, healthcare) and put a heavy excise tax on the items, which would raise their prices.Addicted, ill-informed or trapped consumers with no other choice would mostly pay the higher taxes.Being unresponsive, demand would not contract greatly and the government could raise a lot ofrevenue. However, if the main aim of the government’s excise taxes on alcohol, tobacco or fuel was tosubstantially contract demand and change buyer habits that are damaging society or individuals, thepolicy of heavily taxing such products would have limited success because their PED is low.
50 Key Concepts VCE Economics 2 Units 3 & 4 Tenth Edition

“c01AnIntroductionToMicroeconomics_print” — 2019/10/18 — 17:54 — page 51 — #49
Resources
Weblinks Demand and supply explained (1 of 2)
Demand and supply explained (2 of 2)
Shifting demand and supply
Demand, supply, equilibrium, curve shifts (EconMovies 4: Indiana Jones)
Supply and demand
Price elasticity of supply
Price elasticity of demand
The effects of a tax on D–S, taxes on producers
Marginal analysis (EconMovies 2: Monty Python and the Holy Grail)
Changes in supply, demand and market equilibrium
Interactive demand and supply diagram
1.8 ACTIVITIESTo answer questions online and to receive immediate feedback and sample responses for every question, goto your learnON title at www.jacplus.com.au.
Check your understanding1. Define price elasticity of demand. List three influences on the price elasticity of demand.2. Define price elasticity of supply. List three influences on the price elasticity of supply.3. Using an example, explain the economic importance of the concept of elasticity.
Applied economic exercises1. (a) Define what is meant by the term price elasticity. (1 mark)
(b) The demand for tobacco is price inelastic. What does this mean, explaining two reasons forthis? (3 marks)
(c) Given the price inelasticity of demand for tobacco, identify and explain one important advantage and oneimportant disadvantage of a government policy that increases the tax on tobacco sellers, by 12 per cent,in an effort to reduce smoking and its harmful effects. (2 marks)
(d) In the longer term, the price elasticity of supply for most goods tends to be more elastic than in the shortterm. What does this mean, suggesting one important reason for this observation? (2 marks)
(e) Examine table 1.6. Classify the various types of goods or services shown in the table, as to whethertheir demand and supply is likely to be price elastic or price inelastic, giving brief reasons for youranswer. (4 marks)
TABLE 1.6 Classifying price elasticities for different products
Good The likely price elasticity of demand is … The likely price elasticity of supply is …
Petrol
Bananas
Pepper
Gold
(f) Use the hypothetical data contained in table 1.7 below to:i. calculate the PEDii. determine if the good has an elastic or inelastic demand. (4 marks)
TOPIC 1 An introduction to microeconomics 51
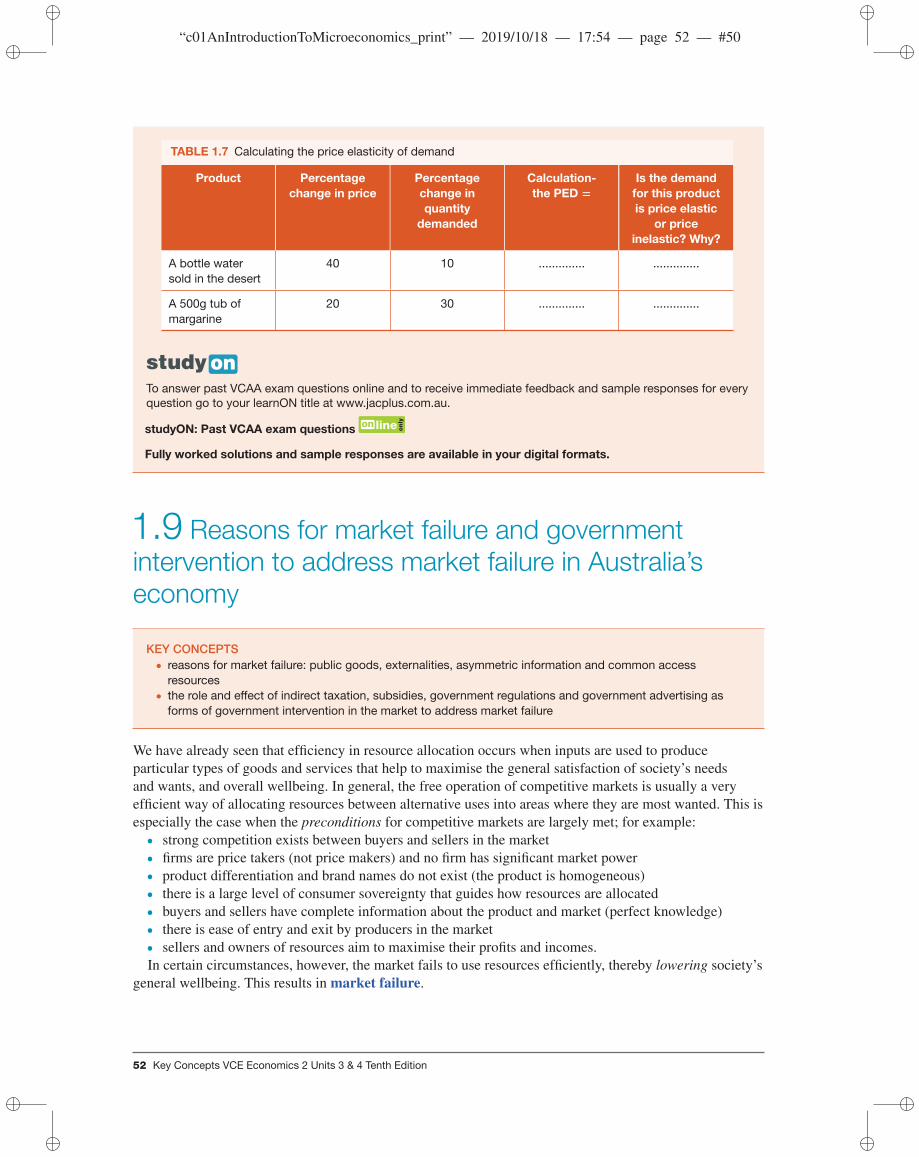
“c01AnIntroductionToMicroeconomics_print” — 2019/10/18 — 17:54 — page 52 — #50
TABLE 1.7 Calculating the price elasticity of demand
Product Percentagechange in price
Percentagechange inquantity
demanded
Calculation-the PED =
Is the demandfor this productis price elastic
or priceinelastic? Why?
A bottle watersold in the desert
40 10 .............. ..............
A 500g tub ofmargarine
20 30 .............. ..............
To answer past VCAA exam questions online and to receive immediate feedback and sample responses for everyquestion go to your learnON title at www.jacplus.com.au.
studyON: Past VCAA exam questions
Fully worked solutions and sample responses are available in your digital formats.
1.9 Reasons for market failure and governmentintervention to address market failure in Australia’seconomy
KEY CONCEPTS• reasons for market failure: public goods, externalities, asymmetric information and common accessresources
• the role and effect of indirect taxation, subsidies, government regulations and government advertising asforms of government intervention in the market to address market failure
We have already seen that efficiency in resource allocation occurs when inputs are used to produceparticular types of goods and services that help to maximise the general satisfaction of society’s needsand wants, and overall wellbeing. In general, the free operation of competitive markets is usually a veryefficient way of allocating resources between alternative uses into areas where they are most wanted. This isespecially the case when the preconditions for competitive markets are largely met; for example:• strong competition exists between buyers and sellers in the market• firms are price takers (not price makers) and no firm has significant market power• product differentiation and brand names do not exist (the product is homogeneous)• there is a large level of consumer sovereignty that guides how resources are allocated• buyers and sellers have complete information about the product and market (perfect knowledge)• there is ease of entry and exit by producers in the market• sellers and owners of resources aim to maximise their profits and incomes.In certain circumstances, however, the market fails to use resources efficiently, thereby lowering society’s
general wellbeing. This results in market failure.
52 Key Concepts VCE Economics 2 Units 3 & 4 Tenth Edition
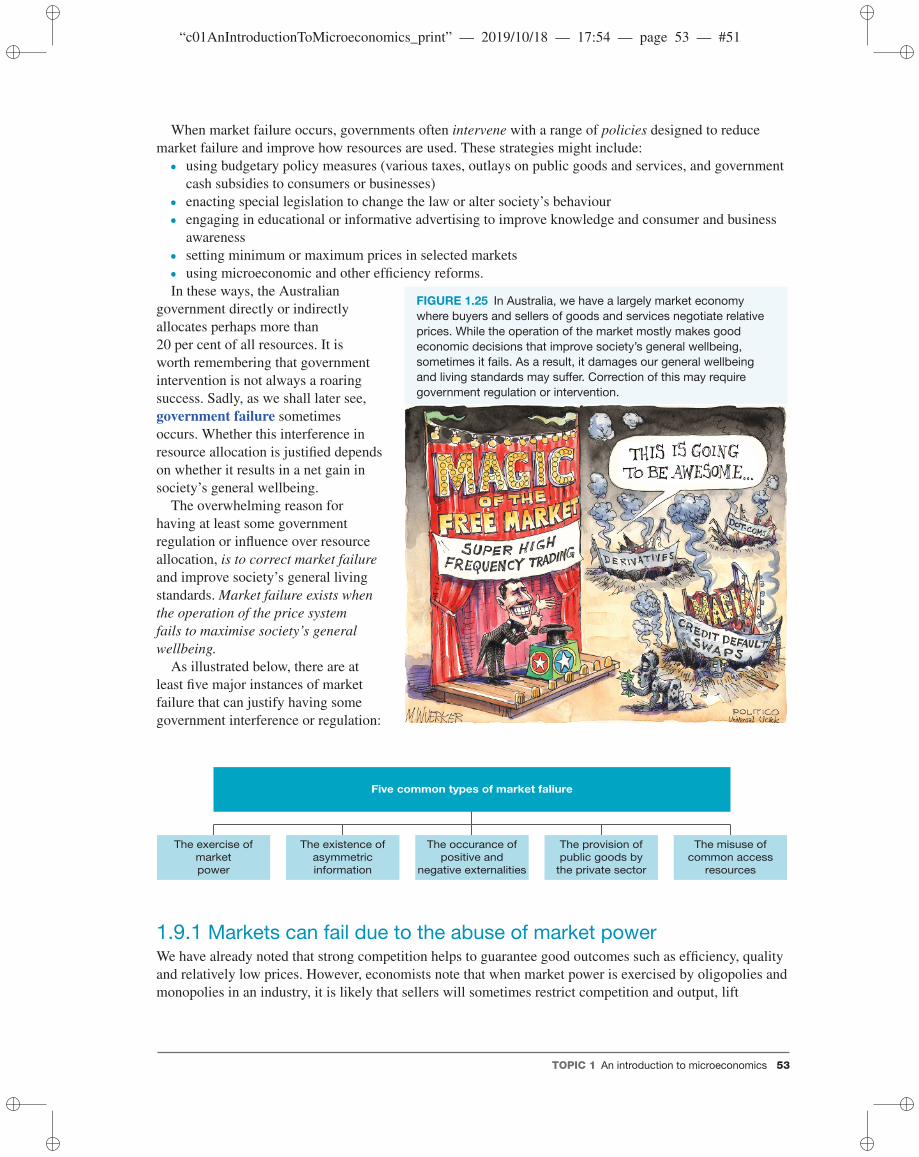
“c01AnIntroductionToMicroeconomics_print” — 2019/10/18 — 17:54 — page 53 — #51
When market failure occurs, governments often intervene with a range of policies designed to reducemarket failure and improve how resources are used. These strategies might include:• using budgetary policy measures (various taxes, outlays on public goods and services, and government
cash subsidies to consumers or businesses)• enacting special legislation to change the law or alter society’s behaviour• engaging in educational or informative advertising to improve knowledge and consumer and business
awareness• setting minimum or maximum prices in selected markets• using microeconomic and other efficiency reforms.
FIGURE 1.25 In Australia, we have a largely market economywhere buyers and sellers of goods and services negotiate relativeprices. While the operation of the market mostly makes goodeconomic decisions that improve society’s general wellbeing,sometimes it fails. As a result, it damages our general wellbeingand living standards may suffer. Correction of this may requiregovernment regulation or intervention.
In these ways, the Australiangovernment directly or indirectlyallocates perhaps more than20 per cent of all resources. It isworth remembering that governmentintervention is not always a roaringsuccess. Sadly, as we shall later see,government failure sometimesoccurs. Whether this interference inresource allocation is justified dependson whether it results in a net gain insociety’s general wellbeing.
The overwhelming reason forhaving at least some governmentregulation or influence over resourceallocation, is to correct market failureand improve society’s general livingstandards. Market failure exists whenthe operation of the price systemfails to maximise society’s generalwellbeing.
As illustrated below, there are atleast five major instances of marketfailure that can justify having somegovernment interference or regulation:
The exercise ofmarketpower
The existence ofasymmetricinformation
The occurance ofpositive and
negative externalities
The provision ofpublic goods by
the private sector
The misuse ofcommon access
resources
Five common types of market faliure
1.9.1 Markets can fail due to the abuse of market powerWe have already noted that strong competition helps to guarantee good outcomes such as efficiency, qualityand relatively low prices. However, economists note that when market power is exercised by oligopolies andmonopolies in an industry, it is likely that sellers will sometimes restrict competition and output, lift
TOPIC 1 An introduction to microeconomics 53
“c01AnIntroductionToMicroeconomics_print” — 2019/10/18 — 17:54 — page 54 — #52
prices (since such firms are price makers rather than price takers), reduce efficiency in resource allocationand lower customer service, causing market failure by reducing society’s level of satisfaction and generalwellbeing. In this situation, the government could improve market outcomes through various measuresdesigned to enhance competition.
Government deregulation of key marketsOver the past three decades there has been partial deregulation (removal of unnecessary governmentrestrictions to competition) of some important markets including those for labour, capital, waterfrontshipping, primary produce, telecommunications, electricity, water, milk and aviation. The hope is thatthe level of competition between sellers will be greater, creating increased efficiency, lower prices andimproved living standards. For instance, in the labour market, the old system of centrally determinedminimum wages set by the Fair Work Commission has gradually become less important. Instead, there hasbeen partial deregulation with an extension of a decentralised wage system involving greater flexibilityand firm-by firm-enterprise bargaining or pay agreements linked to productivity. Furthermore, in 2015the Productivity Commission made its recommendations to further deregulate some aspects of the labourmarket. Whether the government adopts all of these and other recommendations and leaves the market freerto determine wages and conditions, will depend on political considerations and the need to balance the aimsof efficiency with equity.
Deregulation reforms like these expose industries and workers to greater competition by removinggovernment restrictions and by breaking up both public and private monopolies and oligopolies.
Reducing the level of tariff protection from imports for local firms and liberalising tradeTariffs are an indirect tax added to the price of imports. They are designed to make foreign goods dearerand less attractive, thereby reducing competition for local firms. For many years the federal governmenthas been cutting tariff rates and progressively moving towards freer trade. Indeed, from an average tariffprotection level of 38 per cent in 1968–69, the general rate of tariffs on most manufactured items fell by2.5 per cent a year since the late 1980s, to effectively reach less than 5 per cent since 1995 for most items.As a result, to lift efficiency in resource allocation and survive, local firms have had to improve productquality, restructure operations and cut their production costs. It means that our resources are increasinglyallocated into areas where Australian industry has a comparative cost advantage. As a result, livingstandards should rise.
Government laws to promote price competition, and regulate monopoliesand oligopoliesGenerally, competition promotes greater efficiency in resource allocation and higher living standards. Withthis in mind, the Australian Competition and Consumer Act 2010 (formerly called the Trade Practices Act)requires that Australian firms compete with each other. Activities like price maintenance, price leadership,market zoning, interlocking directorships and exclusive dealing are illegal. Heavy fines of up to $10 millionper occasion are imposed on companies that break the law, and directors who break the law may face jailsentences. Company takeovers and mergers not considered to be in the interests of consumers are exposedand closely scrutinised. Furthermore, the Australian Competition and Consumer Commission (ACCC)undertakes ongoing price surveillance of industries where competition is weak, such as petroleum, banking,insurance and power. Firms in both public and private sectors are required to justify increases in the pricesthey charge.
1.9.2 Markets can fail due to asymmetric informationAsymmetric information is a second situation where there is market failure. For markets to allocateresources efficiently, buyers and sellers need to have complete and reliable knowledge of all the relevantinformation affecting their economic decisions. Unfortunately, this is not always the reality because
54 Key Concepts VCE Economics 2 Units 3 & 4 Tenth Edition

“c01AnIntroductionToMicroeconomics_print” — 2019/10/18 — 17:54 — page 55 — #53
one group in the market may have more knowledge than others. Often, for example, sellers have moreinformation than buyers in a transaction, so rational choices and efficient decisions about resourceallocation cannot be made. Here, the market fails to work well and society’s overall wellbeing is reduced.This imbalance in knowledge is called asymmetric information.
There are many instances of this type of market failure; for example, insider trading in the share market(when shares are either bought or sold based on information that is not revealed to the rest of the market,such as the discovery of a new goldmine), rogue elements in the used-car market (when sellers hide orcover up mechanical problems with the cars they sell), online shopping and dating (where buyers cannotphysically inspect the goods before making their decision), the building trades (where costs have been cutby inferior workmanship), an employer hiring a new employee, and harmful ingredients used in producingfood, tobacco and, in the past, asbestos-based cement sheeting. Again, the logical solution to this failure isfor governments to intervene using various strategies.
Government laws to improve market knowledgeOne approach is that the government could pass laws requiring full product disclosure by sellers ofall relevant information needed for effective decision making by potential buyers through appropriatelegislation, such as useful labelling on products such as food. These laws could make it illegal for sellersto withhold certain information; for example, laws about the responsibilities of company directors toaccurately inform and update investors of business conditions and prospects that affect decision making,or product labelling requirements that warn users of potential hazards or dangers.
Improved access to information or knowledgeThe government could conduct an advertising campaign to educate and inform consumers of potentialdangers of products so that more effective choices can be made and resources allocated efficiently tomaximise society’s wellbeing. An example of such a campaign is the QUIT campaign, which aims to makepeople stop smoking. In addition, improving the speed and level of public access to the internet (by, forexample, the rollout of the National Broadband Network or NBN) can help facilitate effective research bybuyers and sellers, and improve their knowledge and understanding of the consequences of their economicdecisions.
1.9.3 Markets can fail due to externalitiesExternalities are a third source of market failure. They represent extra costs or benefits for third parties(someone not directly involved in the particular transaction) that may arise when goods and services areproduced or consumed. There are two types of externalities: negative and positive.• Negative externalities. Negative externalities are costs paid by third parties. They can occur, for
example, when a factory producing chemicals releases unpleasant odours that we are forced to breathe,even though we do not use that firm’s products. Another example occurs in the generation of powerwith the release into the atmosphere of carbon dioxide emissions that lead to global warming, severeweather events and climate change that may then contribute to the flooding of island communities andwild weather events that damage the properties of others and cause the loss of lives and production.These costs are not paid by the producers who have created the damage. The costs of the damage forthem will be zero, thereby inflating their profits. This problem distorts the efficient allocation ofresources. Socially undesirable goods and services will be over-produced. Negative externalities leadto a misallocation or resources that represent market failure because they lower society’s generalwellbeing and living standards. Governments often seek to reduce negative externalities and improveliving standards using various measures including legislation, indirect taxes, cash subsidies andadvertising.
• Positive externalities. Sometimes, there are positive externalities or benefits received by third partiesthat arise from the production and consumption of particular goods or services. For instance, painting
TOPIC 1 An introduction to microeconomics 55

“c01AnIntroductionToMicroeconomics_print” — 2019/10/18 — 17:54 — page 56 — #54
your house or beautifying your garden brings benefits to neighbours (e.g. higher land values) andpassers-by, even though they failed to pay for the improvements you made. Positive externalities resultin the underproduction of socially beneficial goods or services since decision makers do not factor inthe value of all the benefits or satisfaction gained from a given economic activity. Again market failurehas occurred because resources are not allocated efficiently and our general wellbeing will be lowerthan it could be.
The government can help reduce externalities through various types of intervention.
Government laws to reduce negative externalitiesOne way the government can reduce negative externalities is by passing laws or legislation to force firmsand/or consumers to change their activities or behaviours causing negative externalities. For example,passing laws such as the Clean Energy Act in 2011 (that led to the carbon tax between 2012 and 2014)put a cost on carbon pollution, and compelled producers and consumers to take more responsibility fortheir emissions and change their production and consumption patterns. Similarly, anti-smoking laws havealso reduced negative externalities and adverse health issues for society that are associated with active andpassive smoking (breathing in second-hand smoke-filled air).
Using an indirect excise taxEach year, the consumption of socially undesirable goods such as alcohol and tobacco causes much harm tosociety and individuals, and adds greatly to the health and safety costs paid by governments and taxpayers.Additionally, manufacture of some products generates carbon emissions and adds to global warming. Theseare linked to severe weather events, rising sea levels, destruction of infrastructure and property, and deaths.In these two situations, negative externalities or costs are passed on to third parties. In an attempt to reducesuch negative externalities, the federal government has placed taxes on tobacco and alcohol. These taxesraise the price of the particular goods, possibly changing decisions made by buyers and sellers, therebyreallocating resources more efficiently to areas where they add most to our general wellbeing.
More specifically, let us use the demand–supply diagram shown in figure 1.26 to illustrate what happensif the government imposes a tax on producers or suppliers of an undesirable good or service whoseconsumption results in negative externalities. Here, for example, we might think of the effects of a carbontax on production that causes CO2 pollution such as electricity made from brown coal, a tax on alcoholicdrinks or a tax on the sale of cigarettes. As can be seen from figure 1.26, supply-side conditions forfirms producing these goods will become less favourable. By having their profits cut, producers will bediscouraged from producing or supplying the item, causing a decrease in supply at all possible prices.
Referring to figure 1.26, this decrease in supply following the introduction of an excise tax means thatthe supply line shifts upwards vertically from S1 to S2 by an amount equal to the level of tax per unit.This causes the equilibrium price to increase from P1 to P2. Following the imposition of the tax, buyerswill now pay the new higher, less attractive equilibrium price, P2, causing demand to contract. At thesame time the equilibrium quantity will fall from Q1 to Q2. However, following the tax, suppliers of thissocially undesirable good or service will receive a much lower, less profitable price equal to P0, cutting thequantity they produce to Q2. In this case, the difference between the buyer’s and seller’s prices (P2 versusP0) represents the amount of sales tax per unit sold, which goes to the government. Here both buyers andsellers of this item each share part of the tax burden. This policy changes behaviour and discourages bothproduction and consumption of the item, repelling resources from this socially undesirable area. Marketfailure is reduced.
However, in practice, because the demand for these fairly addictive type goods is inelastic(unresponsive), the tax has not been especially effective in changing resource allocation by making theseitems less attractive to consume (even though it has raised much government revenue).
56 Key Concepts VCE Economics 2 Units 3 & 4 Tenth Edition

“c01AnIntroductionToMicroeconomics_print” — 2019/10/18 — 17:54 — page 57 — #55
FIGURE 1.26 The impact on the market of a sales tax imposed on producers or sellers of a socially undesirablegood or service (e.g. tobacco, pollution or alcohol) to discourage production and consumption.
S1S2
Quantity of socially undesirable item
Q2 Q1
P2It
em
’s p
ric
e p
er
un
it (
$)
P0
P1
E2
E1
D1
Amount of salestax per unit
0
Using government cash subsidies and the provision of free servicesA government cash subsidy could also be used to encourage consumers of a product to change behaviourthat currently causes negative externalities. For instance, paying cash incentives to households installingsolar panels or rainwater tanks could help reduce negative externalities.
Additionally, in cases where the existence of positive externalities leads to the underproduction of meritservices that are deemed socially beneficial such as education and health, a case exists for the governmentto make more of these services available by paying a subsidy to private producers. Figure 1.27 uses ademand–supply diagram to show the impact of a government subsidy to suppliers. This policy would makesupply conditions for firms more favourable. As a result, the supply of the service at any given price would
FIGURE 1.27 The impact of a government subsidy on increasing the allocation of resources towards sociallydesirable production (e.g. solar panels, public education, health and housing).
S2S1
Quantity of socially desirable item
Q1 Q2
P3
Ite
m’s
pri
ce
pe
r u
nit
($)
P2
P1
Amount ofsubsidy paidper unitproduced
E1
D1
E2
0
TOPIC 1 An introduction to microeconomics 57

“c01AnIntroductionToMicroeconomics_print” — 2019/10/18 — 17:54 — page 58 — #56
increase and thus shift the line outwards from S1 to S2. Additionally, the equilibrium price would fall fromP1 to P2. As a result of these changes, the new price paid by buyers would fall to P2 (making this sociallydesirable item cheaper and thus more attractive to consume), while the new higher price P3 received bysellers, would make this socially desirable item more profitable to produce. The price difference — P3
versus P2 — represents that value of the government cash subsidy per unit of output produced. Notice, too,that the quantity of this socially desirable good or service has grown from Q1 to Q2, indicating that moreresources than previously are allocated to this desirable area, reducing market failure.
Education and advertising to inform the publicWhen consumers or producers have a complete knowledge of the impacts of their economic activities andconsumption, negative externalities are less likely to occur. One approach is for the government to conductan advertising campaign to educate or inform the public, and to encourage a change in behaviour that willhelp minimise the problem (for instance, anti-drink driving and anti-smoking advertisements).
1.9.4 Markets can fail in the provision of public goodsPublic goods are products or services consumed collectively by society. They might include defence,police, sanitation, knowledge, fire protection, most non-toll roads, public hospitals and schools, the ABC,national parks, beaches and street lighting. These merit goods and services are generally seen as sociallydesirable or universally beneficial for the community because they often result in positive externalities. Forinstance, the consumption of services including education and public health, bring benefits to the rest of thesociety (i.e. third parties) who did not pay for them, thereby lifting the community’s general wellbeing.Public goods differ from private goods (the items most of us purchase every day) in two ways:1. Excludability: Consumers who don’t pay for private goods can easily be refused access. For instance,
consumers without the necessary money are excludable once they get to pay at the checkout (i.e. theyare excluded from buying or accessing the product unless they have the money to pay the price).However, this is not the case with free public goods provided for the community by the government,where consumers are usually non-excludable (i.e. those who do not have the money to pay or choosenot to pay for a good cannot normally be refused access to that good). This leads to the free riderproblem in the provision of public goods where consumers who don’t pay can still gain access orbenefit.
2. Rivalry: A person who buys a particular private good, prevents another person from buying orbenefiting from that exact same item. These are called rivalrous goods. However, this does not occur tothe same degree with public goods. Public goods are usually non-rival in nature.
Because it is difficult to force some users of public goods to pay (the free rider problem), returns are lowand hence this area is unlikely to attract sufficient resources from the profit-seeking private sector. It meansthat typically, public goods will be under-produced if left to the private sector, even though they are seen asbeneficial and improve society’s overall wellbeing.
For these reasons, the government or public sector is usually left to allocate resources into these areas,often making them available free of direct charge. They are paid for out of tax revenues and made availableto all people, even those free riders who do not pay. Government provision of public goods therefore helpsto ensure that they are not under-produced. This enhances efficiency and society’s general wellbeing.
Using the annual budget to provide public goods and servicesThe main way that governments direct resources into socially beneficial public goods is through theirbudget outlays on key areas including health, education and defence (normally paid for from the moneythe government collects in taxes). These goods and services are then provided to the community throughvarious branches of the public sector. This does not necessarily mean that all public goods are directlyproduced by the government, since a significant proportion of production is contracted out to, or purchasedfrom, private businesses (such as the building of roads, prescription drugs, supplies for public hospitals ormilitary equipment). However, despite the trend towards a user pays system, most public goods are still
58 Key Concepts VCE Economics 2 Units 3 & 4 Tenth Edition
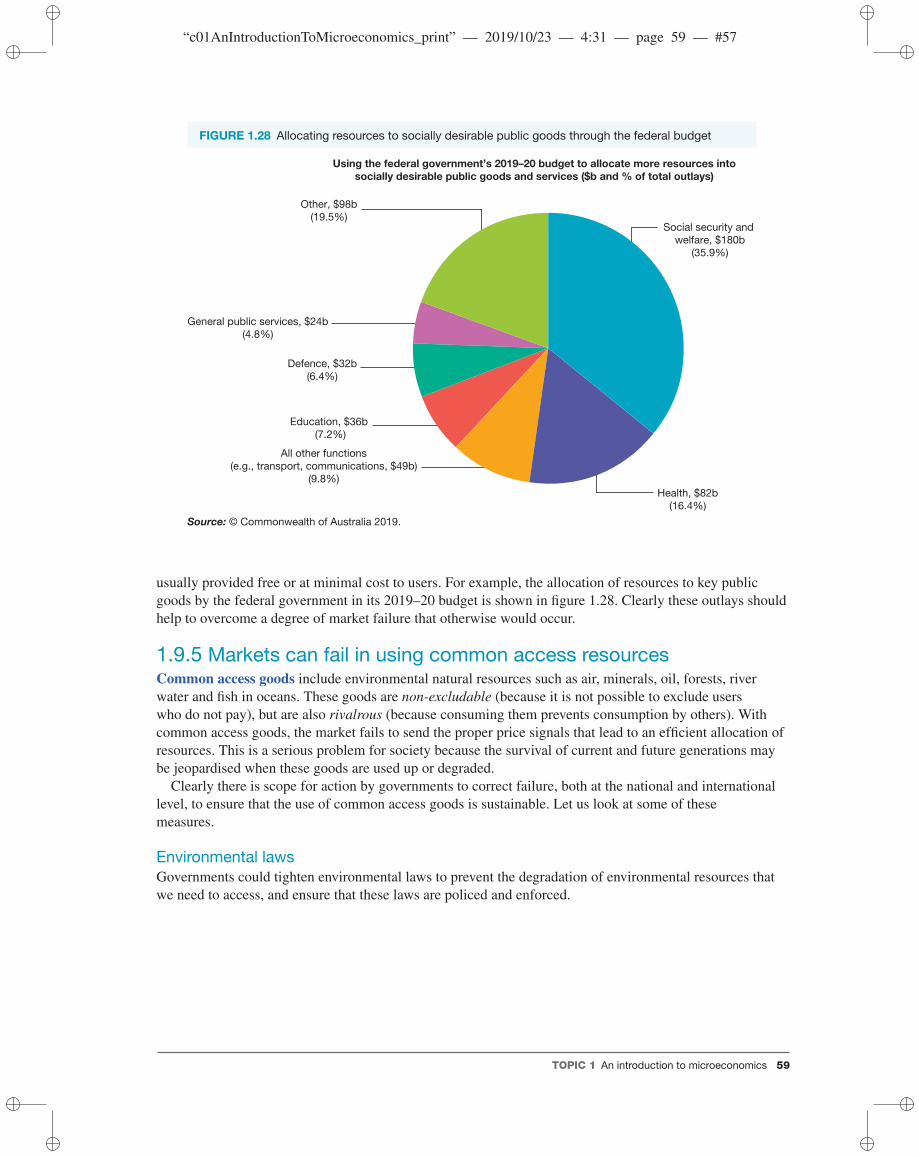
“c01AnIntroductionToMicroeconomics_print” — 2019/10/23 — 4:31 — page 59 — #57
FIGURE 1.28 Allocating resources to socially desirable public goods through the federal budget
Using the federal government’s 2019–20 budget to allocate more resources into
socially desirable public goods and services ($b and % of total outlays)
Social security and welfare, $180b
(35.9%)
Other, $98b(19.5%)
Education, $36b (7.2%)
Defence, $32b(6.4%)
Health, $82b(16.4%)
All other functions(e.g., transport, communications, $49b)
(9.8%)
General public services, $24b(4.8%)
Source: © Commonwealth of Australia 2019.
usually provided free or at minimal cost to users. For example, the allocation of resources to key publicgoods by the federal government in its 2019–20 budget is shown in figure 1.28. Clearly these outlays shouldhelp to overcome a degree of market failure that otherwise would occur.
1.9.5 Markets can fail in using common access resourcesCommon access goods include environmental natural resources such as air, minerals, oil, forests, riverwater and fish in oceans. These goods are non-excludable (because it is not possible to exclude userswho do not pay), but are also rivalrous (because consuming them prevents consumption by others). Withcommon access goods, the market fails to send the proper price signals that lead to an efficient allocation ofresources. This is a serious problem for society because the survival of current and future generations maybe jeopardised when these goods are used up or degraded.
Clearly there is scope for action by governments to correct failure, both at the national and internationallevel, to ensure that the use of common access goods is sustainable. Let us look at some of thesemeasures.
Environmental lawsGovernments could tighten environmental laws to prevent the degradation of environmental resources thatwe need to access, and ensure that these laws are policed and enforced.
TOPIC 1 An introduction to microeconomics 59

“c01AnIntroductionToMicroeconomics_print” — 2019/10/18 — 17:54 — page 60 — #58
Pricing carbon emissions and other market-based methods for reducing climate changeSome government have put a price (i.e. a cost that alters business profits) on carbon emissions thatare associated with climate change, global warming, rising sea levels and severe weather events. Theyhave done this using two main approaches. First, some have introduced a carbon tax on polluters (say,$23 per tonne of CO2) to encourage firms to change to cleaner, greener production. Other governments(the European Union, Switzerland, New Zealand and parts of the United States) have an emissions tradingscheme (ETS) where the carbon price is free to move up or down as determined in the carbon market by theactions of buyers and sellers.
International agreementsThe Kyoto Protocol is an international agreement signed by many countries from early 2005. Essentially,it commits governments to emissions targets expressed against a base level. It was developed throughseveral stages, with the last agreement negotiated in 2012 and signed by 37 countries including Australiaand members of the European Union. A post-Kyoto Protocol legal framework is also being developed,despite the reluctance of key economies such as the United States, China and India to be bound by certainemissions targets.
In 2015, many governments (including Australia) signed up to the Paris Agreement on Climate Change.In this agreement, individual countries sought to reduce CO2 emissions by varying percentages. Ourgovernment agreed to a reduction of between 26–28 per cent on 2005 levels by 2030 — a target thatseems increasingly challenging to achieve based on current trends. By contrast, Canada approved a30 per cent reduction, while the European Union agreed to a 34 per cent cut. China’s forecast is for a riseof 139 per cent, but one needs to remember that their per capita emissions of just 5.5 tonnes are relativelylow by international standards.
Direct ActionIn 2014, after the abolition of the carbon tax, the federal government introduced its Direct Action policyto reduce carbon emissions. Central to this scheme is a $2.5 billion emissions reduction fund (ERF). Thismakes government money available to successful firms who bid in a reverse auction situation, by submittingplans to get the greatest emissions reduction for the lowest possible cost. One report suggested that thispolicy supposedly reduced our emissions by 193 million tonnes over the period 2014–18. In 2019, a slightlyaltered version of the policy was announced by adding an extra $2 billion of taxpayer money for what isnow called the Climate Solutions Fund (CSF) that will operate in a similar way to the ERF. Nevertheless,because it seems that we might not reach our emissions reduction target set in the Paris Agreement, futuregovernments may well consider other policy options.
Two other reasons for government intervention in a competitive market economyApart from market failure, the free operation of a competitive market economy results in at least twoother problems: economic instability and extreme income inequality. If left unchecked by the Australiangovernment, these problems would lower people’s general wellbeing or living standards.
Stabilising the level of economic activityWe know that most markets are quite unstable. At the microeconomic level, prices and output vary greatlyover a period of time. As we shall see later, this contributes to macroeconomic instability, in which a freeor unregulated market economy may experience severe inflationary booms (where the purchasing powerof money and incomes decreases and living standards are reduced), and recessions or even depressions(where national production falls and unemployment increases, again reducing people’s incomes, purchasing
60 Key Concepts VCE Economics 2 Units 3 & 4 Tenth Edition

“c01AnIntroductionToMicroeconomics_print” — 2019/10/18 — 17:54 — page 61 — #59
power and living standards). As a result of these problems, the Australian government attempts to moderatethe severity of these economic fluctuations using special stabilisation policies to help regulate the level ofspending and economic activity to help achieve more ideal economic conditions needed for optimal livingstandards. These policies are the focus of topic 4.
Redistributing income more equitablyThe price system (involving the forces of demand and supply) not only determines the price of particularcommodities, goods and services, but also greatly affects the relative level of people’s wages (theprice of each type of labour). As a result of the free operation of the price or market system, extremeincome inequality may develop, leaving a large gap in wellbeing and living standards between high- andlow-income earners. If left unchecked, the level of inequality is likely to increase, lowering the generalwellbeing of society. Because of this problem, the Australian government moderates or reduces the extentof inequality by using various redistribution policies like progressive taxes on high incomes, and welfarebenefits and free services for the neediest. This helps to create a fairer distribution of income than wouldotherwise occur.
Reviewing the reasons why governments sometimes interfere with the freeoperation of the market systemIn Australia’s market economy, the price system generally makes good decisions that help maximisesociety’s wellbeing. However, as we have seen, sometimes the free operation of the market system fails andcreates problems that reduce efficiency and undermine our general living standards. When this occurs, theAustralian government often seeks to influence market outcomes. There are at least three main justificationsfor government intervention of our competitive market system.1. Reallocating resources to help correct various types of market failure.Markets do not always make
good decisions when, for example, there is market power, asymmetric information, externalities,common goods and public goods. We have also noted that the government attempts to correct thesefailures by passing laws, and using excise taxes and government budget outlays (including subsidies)to reallocate resources more efficiently. In so doing, society’s needs and wants are better satisfied andour living standards are improved.
2. Stabilising the level of economic activity.We know that individual markets and hence the whole marketeconomy, can be quite unstable, resulting in inflationary booms and recessions. This reduces society’swellbeing and living standards. As a result, the government attempts to moderate the severity of thesefluctuations using special stabilisation policies.
3. Redistributing income more equitably. In the absence of government, the free operation of the pricesystem greatly affects the level of people’s wages (the price of labour) and contributes to significantincome inequality. As we shall see, governments reduce the level of income inequality using specialpolicies (eg, progressive income tax and welfare) to redistribute some income from higher to lowerincome earners, improving their access to basic goods and services.
TOPIC 1 An introduction to microeconomics 61
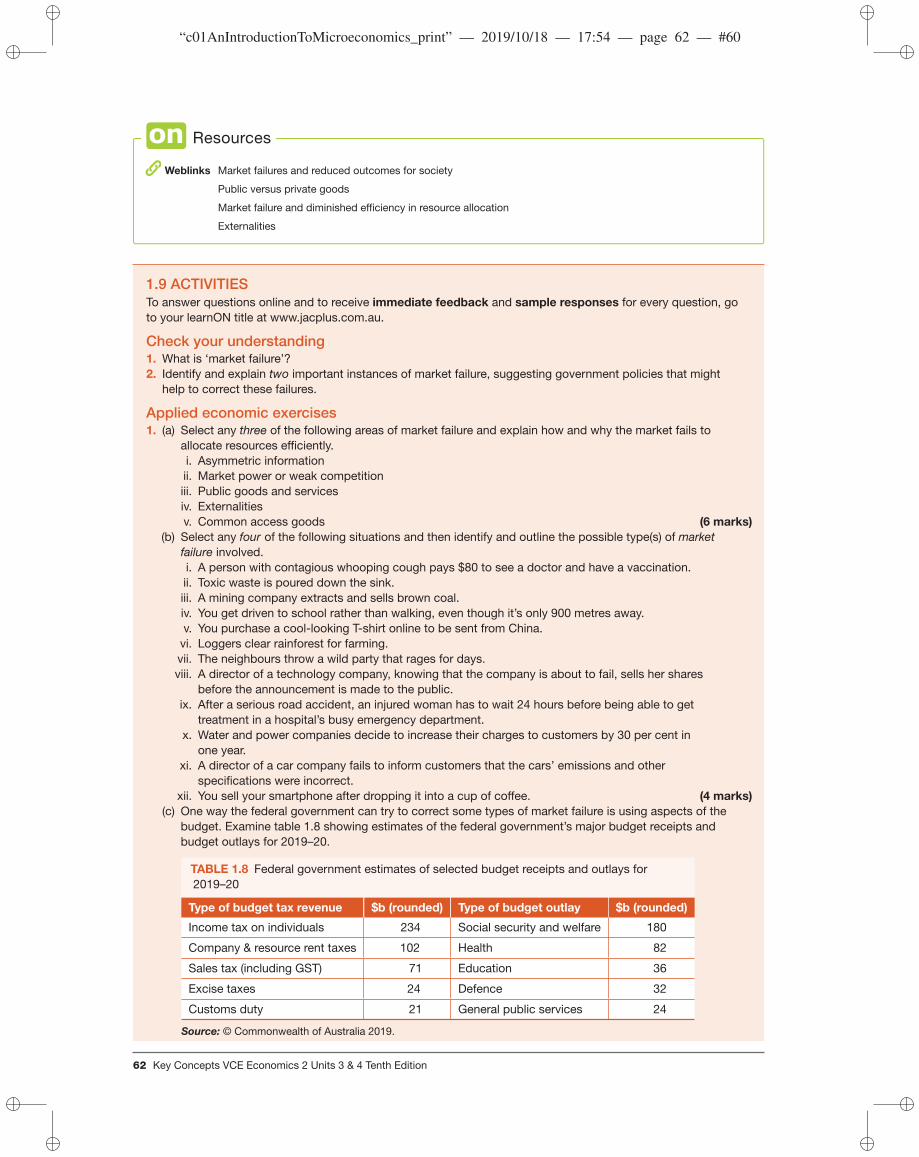
“c01AnIntroductionToMicroeconomics_print” — 2019/10/18 — 17:54 — page 62 — #60
Resources
Weblinks Market failures and reduced outcomes for society
Public versus private goods
Market failure and diminished efficiency in resource allocation
Externalities
1.9 ACTIVITIESTo answer questions online and to receive immediate feedback and sample responses for every question, goto your learnON title at www.jacplus.com.au.
Check your understanding1. What is ‘market failure’?2. Identify and explain two important instances of market failure, suggesting government policies that might
help to correct these failures.
Applied economic exercises1. (a) Select any three of the following areas of market failure and explain how and why the market fails to
allocate resources efficiently.i. Asymmetric informationii. Market power or weak competitioniii. Public goods and servicesiv. Externalitiesv. Common access goods (6 marks)
(b) Select any four of the following situations and then identify and outline the possible type(s) of marketfailure involved.i. A person with contagious whooping cough pays $80 to see a doctor and have a vaccination.ii. Toxic waste is poured down the sink.iii. A mining company extracts and sells brown coal.iv. You get driven to school rather than walking, even though it’s only 900 metres away.v. You purchase a cool-looking T-shirt online to be sent from China.vi. Loggers clear rainforest for farming.vii. The neighbours throw a wild party that rages for days.viii. A director of a technology company, knowing that the company is about to fail, sells her shares
before the announcement is made to the public.ix. After a serious road accident, an injured woman has to wait 24 hours before being able to get
treatment in a hospital’s busy emergency department.x. Water and power companies decide to increase their charges to customers by 30 per cent in
one year.xi. A director of a car company fails to inform customers that the cars’ emissions and other
specifications were incorrect.xii. You sell your smartphone after dropping it into a cup of coffee. (4 marks)
(c) One way the federal government can try to correct some types of market failure is using aspects of thebudget. Examine table 1.8 showing estimates of the federal government’s major budget receipts andbudget outlays for 2019–20.
TABLE 1.8 Federal government estimates of selected budget receipts and outlays for2019–20
Type of budget tax revenue $b (rounded) Type of budget outlay $b (rounded)
Income tax on individuals 234 Social security and welfare 180
Company & resource rent taxes 102 Health 82
Sales tax (including GST) 71 Education 36
Excise taxes 24 Defence 32
Customs duty 21 General public services 24
Source: © Commonwealth of Australia 2019.
62 Key Concepts VCE Economics 2 Units 3 & 4 Tenth Edition
“c01AnIntroductionToMicroeconomics_print” — 2019/10/23 — 4:31 — page 63 — #61
i. Select one budget receipt and one budget outlay. For each chosen item, explain how the policymeasure might affect the way Australia uses or allocates its scarce resources. (3 marks)
ii. For each of the two items identified in part (i) above, explain why the government uses the particularpolicy to alter the allocation of our resources. (3 marks)
(d) With the use of a labelled demand–supply diagram, explain how the imposition of a carbon tax oncompanies that pollute, starting at $23 per tonne (where the amount of tax reflects the annual number oftonnes of carbon dioxide pollution released into the atmosphere), could have influenced Australia’sresource allocation between 2012 and 2014, and improved efficiency. (3 marks)
(e) Explain what is meant by the free rider problem in the provision of public goods as an area of marketfailure. If left to the private sector, why would defence, the police and street lighting be under-produced,even though they bring wide social benefits? (2 marks)
(f) Identify and explain two policies the government could use to help overcome the free riderproblem. (4 marks)
(g) Government subsidies can be used to reduce some types of market failure.i. What is a government subsidy? (1 mark)ii. Explain how subsidies paid to Australia’s sugar growers or suppliers to leave the industry would alter
the allocation of resources that would otherwise occur in a market economy. Illustrate the impact ofthis type of subsidy, using a hypothetical demand–supply diagram for the sugar market, to show thebefore and after effects of the payment. (3 marks)
(h) Under Australian law, ingredients must be listed on the packaging of processed foods. How might thishelp reduce market failure associated with the consumption of these goods? (2 marks)
(i) Outline the market failure that may be associated with online dating sites. (2 marks)(j) Explain why the government provides free vaccinations to school children and some older
citizens. (2 marks)(k) The federal government currently pays a tax rebate of up to 30 per cent for those individuals taking out
or buying private health insurance. This is because it helps to correct market failure, improve resourceallocation towards socially desirable public goods and services, eases pressures on public hospitals andultimately improves government finances. With the help of a fully labelled demand–supply diagram,explain how this action by the government might help to correct market failure. (3 marks)
(l) The government applies various policies to help reduce market failure. Use small, fully labelled D–Sdiagrams, each representing a particular market, to illustrate hypothetically, the impact of variousgovernment policies listed below, on market demand, supply, price, quantity traded and the allocation ofresources. Show the market before and after the change in government policy.i. The removal of tariffs on imported cars on the local car market.ii. Lifting the legal age for the purchase of alcohol to 21 years on the market for alcohol.iii. The government allowing the merger of the two largest oil companies.iv. The introduction a tax on firms generating electricity using brown coal, and the effects on the
electricity market, the market for brown coal and the market for renewable energy sources.v. Applying a tax on foreign buyers of Australian property on our property market.vi. Freight subsidies paid to Tasmanian fruit growers, on the market for apples in other
states. (6 marks)
To answer past VCAA exam questions online and to receive immediate feedback and sample responses for everyquestion go to your learnON title at www.jacplus.com.au.
studyON: Past VCAA exam questions
Fully worked solutions and sample responses are available in your digital formats.
TOPIC 1 An introduction to microeconomics 63

“c01AnIntroductionToMicroeconomics_print” — 2019/10/18 — 17:54 — page 64 — #62
1.10 Government intervention in markets thatunintentionally leads to decreased efficiency
KEY CONCEPT• one contemporary example of government intervention in markets that unintentionally leads to a decreasein the efficiency of resource allocation
We have seen that sometimes government intervention is necessary to reduce market failure, increaseefficiency and satisfaction in resource allocation, and optimise society’s general wellbeing. However,sometimes government regulation of various markets also has unfortunate and unintended negativeconsequences or external costs for third parties, reducing efficiency and society’s general wellbeing. Thisis called government failure.
The current VCE course requires that students select one contemporary example of governmentintervention that has decreased efficiency in resource allocation.
Three contemporary Australian case studies of possible government failure could include:1. Setting the minimum wage artificially high to help protect the living standards of low-income
employees may unintentionally have lowered efficiency by:• reducing incentives and international competitiveness• causing structural unemployment• adding to income inequality.
2. Using government policies designed to help reverse the declining trend in home ownership andaffordability may have unintended consequences that lower society’s wellbeing and lead to failure by:• helping to increase the demand for first homes that could raise the price and reduce the affordability
of first homes• Encouraging those individuals who may not be able to afford to make loan repayments, later
creating financial stress and the possibility of negative equity during times of falling house prices.3. Paying subsidies to the coal industry to encourage production and employment may have
unintentionally reduced efficiency by:• accelerating climate change and adding to negative externalities• creating large opportunity costs for society.
1.10.1 Unintended problems of setting a minimum wage in the labourmarketUnder a free and purely competitive labour market, wages levels would be set at equilibrium by theforces of labour demand and supply. In theory, wages would rise if labour demand exceeded supply,or fall if supply exceeded demand. Worker wages and conditions would be individually negotiatedbetween a worker and his or her boss on a firm-by-firm basis, without government interference orregulation.
While this sounds fair in theory, in practice it was found that some staff, already working long hoursand under poor conditions, were paid such low wages that they could not support their families and enjoyeven austere living standards. In a landmark decision called the Harvester Judgement of 1907 (shortly afterfederation), the Commonwealth Court of Conciliation and Arbitration (an earlier equivalent of today’s FairWork Commission or FWC) determined that wages at McKay’s Sunshine Harvester Company were toolow and were not ‘fair and reasonable’ for a ‘civilised community’. Since then, wages have generally beenincreased in most years (in 2019–20, the minimum wage was set at $740.80 for fulltime adults, with a lowerrate for youths).
64 Key Concepts VCE Economics 2 Units 3 & 4 Tenth Edition

“c01AnIntroductionToMicroeconomics_print” — 2019/10/18 — 17:54 — page 65 — #63
For the past 113 years, many people have felt that at least some government intervention in the labourmarket is beneficial because it helps to achieve the following:• provide a safety net wage for low-paid workers and reduce poverty• avoid exploitation of employees by profit-seeking business owners keen to minimise their costs• increase the reward or incentive for employment and participation in work, boosting efficiency in the
use of resources• improve equity or fairness in society by protecting and lifting the consumption levels or purchasing
power of workers, and increasing the extent to which society’s wants are satisfied• reduce income inequality and poverty• allow individuals to have frugal comfort and enjoy socially acceptable living standards.On the other hand, despite good intentions, some economics commentators note that government wage
regulation has resulted in unintentional and negative outcomes for optimal resource allocation. They arguethat there can be a trade-off between promoting greater equity on the one hand through an artificially highminimum wage and encouraging efficiency on the other. More specifically, some critics raise the followingproblems associated with setting an artificially high minimum wage:• Slow the growth in labour productivity: Setting artificially high minimum wages disconnects pay levels
from the value of people’s work, as set by market forces. This may act as a disincentive for improvinglabour productivity and discourages an efficient use of resources. In turn, this is likely to slow thegrowth in a nation’s productive capacity and reduce the sustainable rate of economic growth.
• Increase our trade deficit: Artificially high wages and low productivity make local firms uncompetitiveagainst their overseas rivals and thereby add to an international trade deficit.
• Increase the level of structural unemployment: Setting artificially high wages can cause some localbusinesses to closure because they are less competitive. Some may relocate overseas. Locally, thiscauses higher levels of structural unemployment.
• Increase inequality in income distribution: By increasing structural unemployment, the setting ofartificially high minimum wages can in some ways, undermine equity in income distribution(especially in the long term), hurting vulnerable members of society. In addition, inequality isworsened because excessively high minimum wages discourage employment, cause firms to reduce thenumber of hours that staff work and hence depress incomes and purchasing power. Furthermore, byincreasing unemployment, they add to the number of people dependent on inadequate governmentwelfare payments of perhaps $250–$350 per week (as opposed to perhaps $1600 per week on averageweekly earnings). Clearly, lower incomes and purchasing power significantly reduce efficiency andsociety’s general wellbeing.
Some of the unwanted outcomes of setting Australia’s minimum wage can be illustrated in figure 1.29.Referring to this diagram, notice that normally the free market equilibrium wage or price would be atP1 where the demand (D1) and supply (S1) of labour would be equal. However, when the minimumwage is set too high at P2, well above the clearing wage or equilibrium, a market glut occurs where thesupply of labour exceeds the demand for labour (see the shaded triangle). In other words, the minimumwage causes structural unemployment as artificially high costs and hence lower profits cause businessclosures. With rising unemployment comes lower incomes, along with reduced living standards and generalwellbeing.
What do recent international studies reveal about these unintended effects of governments raisingminimum wages? Although the answer is not a simple one, there is some agreement that as long as theminimum wage is ‘moderate’ (as a percentage of average weekly wages), the adverse effects are likely to berelatively small in the short term. However, if wages are set too high, experience from some countries showsthat job losses are likely to be significant. Given that Australia has one of the highest minimum wages in theworld, perhaps there is cause for real concern.
TOPIC 1 An introduction to microeconomics 65

“c01AnIntroductionToMicroeconomics_print” — 2019/10/18 — 17:54 — page 66 — #64
FIGURE 1.29 Demand–supply diagram representing the labour market showing howAustralia’s minimum wage may contribute to unemployment and other unwanted outcomes.
Contractio
n
Equilibrium
S > D =glut or surplus labour(i.e. unemployment)
Quantity of labour
Q1D = S
D(D < S)
S(S > D)
Pri
ce
or
wa
ge
of
lab
ou
r/w
ork
($) S
1
Over-generous
minimum wage
Expansion
D1
P2
P1
Equilibriumwage
Additionally, in the long term and for inexperienced unskilled workers in younger age groups wherethe demand for labour is fairly elastic, wage rises do appear to cause unemployment, reduce hours ofemployment and be generally detrimental. For example, European studies showed that a 10 per cent risein the government minimum wage unfortunately led to a decrease in youth employment by up to 4 per cent,along with a reduction in efficiency in the use of resources.
In an attempt to moderate these unintended adverse effects of wage regulation, there has beenconsiderable labour market deregulation over the years. This has involved reducing unnecessarygovernment controls, extending firm-by-firm workplace agreements where wage changes more closelyreflect productivity levels, and allowing greater flexibility in employment arrangements.
In 2015, the Productivity Commission reviewed the impacts of Australia’s Fair Work laws includingthe operation of the minimum wage and the application of penalty rates of pay (i.e. the payment of higherminimum rates of pay for working outside normal hours), on efficiency and productivity growth. Itrecommended that Sunday penalty rates in industries such as retail, hospitality and pharmacies be abolishedand brought into line with the lower Saturday pay rates. Following this, in February 2017, the Fair WorkCommission made its final decision to gradually reduce Sunday and public holiday penalty rates for allwage awards for hospitality, retail and pharmacy workers. While there are some variations between differentareas or awards and for those in different employment situations, figure 1.30 shows the gradual transitionalarrangements to phase in lower Sunday rates and bring them in line with Saturday penalty rates between2017 and 2020.
In one sense, these changes that reduced the level of government wage regulation acknowledged thatthere were unintended consequences on society’s general economic wellbeing of artificially setting higherwages than would otherwise prevail in the labour market. Indeed, some argue that reducing penalty rates onSundays and public holidays should help:
66 Key Concepts VCE Economics 2 Units 3 & 4 Tenth Edition

“c01AnIntroductionToMicroeconomics_print” — 2019/10/18 — 17:54 — page 67 — #65
• create more jobs and employment opportunities (especially for young people where unemploymentrates are high) by making it more profitable for firms in retail and hospitality to stay open for longertrading hours
• increase efficiency in the use of labour and other resources, thereby growing the economy’s productivecapacity and incomes, thereby enhancing our wellbeing.
FIGURE 1.30 Scheduled reductions in Australia’s Sunday penalty wage rates as part of labour marketderegulation to reduce unintended consequences of government wage regulation
200
250
150
100
50
0
Normal wagerate
Saturday penaltyrates
Saturday penaltyrates from July
2017
Saturday penaltyrates from July
2018
Saturday penaltyrates from July
2019
Saturday penaltyrates from July
2020
Pe
na
lty w
ag
e a
s a
pe
rce
nta
ge
of
the
no
rma
l a
wa
rd w
ag
e (
tha
t e
qu
als
100)
Australia’s changing Saturday and Sunday full and part-time penalty wage rates as a
percentage of normal award rates in retail outlets and pharmacies
100%
150%
195%180%
165%150%
Source: Data compiled from Fair Work Commission, WA Chamber of Commerce and Retail Wages News.
1.10.2 Unintended consequences of the government’s attempts toencourage home ownership and affordability as a possible failurePart of the ‘Australian dream’ is to own a house. However, in the space of just five years to 2017, averagecapital city house prices rose by around 70 per cent (in the case of Sydney) and over 50 per cent (in the caseof Melbourne), making ownership less affordable for most.
Many non-price demand and supply factors have recently combined to drive up prices in the propertymarket. On the demand side, these included very rapid population growth of around 1.6 per cent due inpart to natural increase and immigration; better jobs and employment opportunities are to be found in thebig cities where poor transport systems increase the demand for land close to the city; record low interestrates on home loans or mortgages of less than 4 per cent have made debt repayments cheaper and moreaffordable; and the existence of limits to the supply of new land in capital cities due to their geographicconstraints and zoning. Indeed, speculative demand for property was also fuelled by government policiesincluding negative gearing and the 50 per cent tax discount on the capital gains made from the sale ofproperty after selling at a higher price than that paid at purchase. Together, strong demand and a limitedsupply in the property market, drove prices up till 2017, allowing some people to rapidly grow their wealth.
While the property boom has recently slowed and prices fell during 2018–19 in most cities, they arestill way too high for many first home buyers to afford. Apart from relatively high property prices, homeownership is also less affordable because average wages and incomes have only risen very slowly or insome cases, fallen, and there has been an increase in the casualisation of employment. All this has madesaving the required 20 per cent deposit to secure a bank home loan impossible for some (the average timeneeded to save the deposit is now 10 years or double what it used to be some years ago), shattering dreamsof ownership.
TOPIC 1 An introduction to microeconomics 67
“c01AnIntroductionToMicroeconomics_print” — 2019/10/18 — 17:54 — page 68 — #66
In response to this problem in the property market, the Australian government has attempted to helpmake home ownership more affordable through various types of intervention. For instance, there havebeen schemes involving low interest or subsidised loans, deposit grants from the government and the useof superannuation to help generate the required deposit. Even so, despite the good intentions behind thesemeasures, many believe that such government intervention has failed. In 2019, the Australian governmentreleased its latest policy to start in 2020. This policy has the following features:• First home buyers could access the property market with as little as a 5 per cent deposit as they would
not have to pay the hefty Lenders Mortgage Insurance. This would be guaranteed by the government tomake up the total 20 per cent deposit requirement.
• The scheme will be limited to the first 10 000 people. However, this would only represent less than 10per cent of those 127 000 who would have been eligible for this in 2018.
• The scheme is means tested. This is designed to exclude those buyers on relatively high-income above$125 000 per year in the case of a single, or $200 000 combined income for a couple.
At the time of the policy releaseby the Coalition government, Laboralso endorsed the measure that hadsome common features with previousattempts to make home ownership moreaffordable. Another claimed benefit ofthe scheme is that it may help stimulatespending and jobs in our currently weakeconomy.
However, while the government’spolicy intervention in the property marketlooks quite appealing and may helpin a limited way to lift ownership, noteveryone appears convinced of its merits.Some critics say that like most previousattempts, this policy may also failbecause helping people meet the depositrequirement is only going to stimulatethe demand for property without raisingits supply, perhaps pushing up prices inthe low-end property market for firsthome buyers. This would mean thatbuyers would have to save an even largerdeposit, thereby unintentionally, makingownership even more difficult! Furthermore, some commentators have pointed out that by helping morepeople to meet the deposit requirement, this could be very dangerous in a market where high prices havebeen falling, because those with loans have an asset that is worth less than what they paid (they could endup with negative equity). Here, owners would be unable to sell, instead, they would be saddled with a heavyburden of debt.
If, like some other previous policies in this area, property ownership is unintentionally made lessaffordable, it could represent a contemporary example of government failure. Only time will tell whetherthose people whom the policy was intended to help, may actually be worse off.
Because of the uncertain impacts of this and its other policy predecessors, some critics have suggestedthat there other more effective policy measures to curb demand by targeting multi-property owners whoare taking advantage of negative gearing and the capital gains tax discount. This, along with a smallerimmigration intake and improved public transport, might do more to slow the hike in property prices andthe severe decline in Australia’s home ownership from 71 per cent in 1968 to around 64 per cent in 2019.
68 Key Concepts VCE Economics 2 Units 3 & 4 Tenth Edition
“c01AnIntroductionToMicroeconomics_print” — 2019/10/18 — 17:54 — page 69 — #67
1.10.3 Unintended problems of allocating resources into subsidies forthe coal industryA subsidy exists when the government provides producers of goods with a cash payment or other type offinancial assistance like a tax concession. It is usually designed to increase production levels, encouragenew industries to start up and old ones to restructure their operations more efficiently, generate jobs andovercome market failure associated with the underproduction of goods with social benefit.
In Australia, governments subsidise the coal industry. A study released in September 2015 (AssessingThermal Coal Production Subsidies, see http://www.carbontracker.org/report/coal-subsidies/) revealed theextent of the Australian government’s assistance to the coal industry:• Large domestic and multinational companies received government subsidies equal to around
$1.8 billion each year.• The coal subsidy amounted to about $5.20 for every tonne produced.• Subsidies to the coal industry also come in the form of an excise tax exemption on the diesel fuel used
to run mining equipment. This is estimated to be worth perhaps $2–3 billion each year.• State and federal governments have partly funded the cost of building rail, port, water and other
infrastructure, for some coal projects.• There are accelerated depreciation costs for mining equipment used to offset the taxable profits of
companies.• Miners can instantly write off the costs of exploration and prospecting against their tax liabilities.• There are apparently accumulated and unfunded rehabilitation costs to restore the mining site at the
end of mining operations that could total a whopping $18 billion (according to independent analysis byLachlan Barker in May 2015), far in excess of the upfront bonds paid by companies.
This assistance makes coal mining even more profitable for both locally owned and transnational foreigncompanies including the proposed massive Indian-owned, Adani coal mining project in Queensland. Froma company’s point of view, this is a favourable microeconomic supply-side factor that makes them morewilling and able to produce coal. It leads to business expansion and an increase in the allocation of scarceresources to this industry, including the creation of more jobs. The subsidy also increases our GDP andincomes, and hence in some ways may increase material living standards. Finally, some politicians haverecently argued that growing the coal industry is not only good for Australia, it is good for the world’s poorby allowing them as consumers to have improved access to cheap energy and power to fuel economic andemployment growth.
Despite these good intentions and possible benefits of government intervention in the coal market, it canbe argued that the policy is a strong example of government failure where there is an unintentional net lossof wellbeing, causing overall living standards to be lower both now and into the future. In particular:• Increased negative externalities: Government coal subsidies effectively mean that taxpayer money is
being used to encourage the production of dirty, high carbon-intensive fossil fuels, the burning ofwhich leads to severe negative externalities. These problems include increased CO2, global warming,severe weather events and climate change affecting the wellbeing of Australians and other members ofthe international community. Especially in the absence of an effective price on carbon pollution,subsidies to this industry further weaken and distort the price signals in the coal market byencouraging the overproduction and consumption of coal.
• Massive opportunity costs: There are massive opportunity costs of paying coal subsidies out ofgovernment budgets. Indeed, the reduction of coal subsidies would release billions of dollars in extraresources that could be used to help the needy here and abroad, improve welfare, and strengthen ourhealth and education systems that are starved for funds. How much more might these outlays improvesociety’s general wellbeing than subsidies to coal mining companies? In a study of budget subsidiesfor the mining industry (not just for coal but also other mining operations) by state governments over asix-year period that totaled $18 billion, the Australian Institute calculated some of the possibleopportunity costs for taxpayers. These are shown in figure 1.31.
TOPIC 1 An introduction to microeconomics 69

“c01AnIntroductionToMicroeconomics_print” — 2019/10/18 — 17:54 — page 70 — #68
FIGURE 1.31 Some potential opportunity costs of government subsidies to Australia’smining industry.
Source: © The Australian Institute.
Resources
Weblinks Reasons against government intervention
Market failure and government intervention
70 Key Concepts VCE Economics 2 Units 3 & 4 Tenth Edition
“c01AnIntroductionToMicroeconomics_print” — 2019/10/18 — 17:54 — page 71 — #69
1.10 ACTIVITIESTo answer questions online and to receive immediate feedback and sample responses for every question, goto your learnON title at www.jacplus.com.au.
Check your understanding1. What is meant by government failure?2. Identify and outline an important example of government failure.
Applied economic exercises1. (a) Using a demand–supply diagram, explain why some economists believe that setting minimum wages
and conditions in the labour market represents an instance of government failure. (3 marks)(b) Discuss the advantages and disadvantages of the government policy to reduce the minimum home loan
deposit to just 5 per cent for up to 10,000 first-home-buyers, by acting as guarantor for the remainder ofthe loan deposit requirement. (4 marks)
(c) Discuss the advantages and disadvantages of governments paying subsidies to Australia’s coal miningindustry. (4 marks)
(d) In what way would the government’s use of higher tariffs on imported goods represent an example ofgovernment failure? (2 marks)
(e) When there are instances of government failure, what is one of the solutions typically used? (1 mark)
To answer past VCAA exam questions online and to receive immediate feedback and sample responses for everyquestion go to your learnON title at www.jacplus.com.au.
studyON: Past VCAA exam questions
Fully worked solutions and sample responses are available in your digital formats.
1.11 Review1.11.1 SummaryWhat is economics?
• Economics is the study of how to use limited resources efficiently to maximise the general satisfactionof society’s material needs and wants, and their overall living standards.
• Economic problems can be studied from both a microeconomic and a macroeconomic perspective.• A basic assumption in economics is that resources or productive inputs are relative to the resources
available to produce goods and service.• Scarce resources include natural, labour and capital inputs used in production.
Relative scarcity
• Relative scarcity is seen as the basic economic problem. It arises because there can never be enoughgoods and services produced from the limited resources available to a nation, to satisfy the unlimitedwants of households, businesses, governments and people overseas.
Opportunity costs
• Given the problem of scarcity, society is forced to make choices or decisions about how to use orallocate resources in ways that best satisfy society’s needs and wants. However, all choices involveopportunity costs as production is forgone in one area to release resources for an alternative use.However, some choices involving resource allocation are more efficient than others, and bettermaximise the general satisfaction of society’s wants, wellbeing and living standards.
• Economists use a production possibility diagram (PPD) to help illustrate the concept of opportunitycosts associated with various decisions and developments. On this diagram, the production possibilityfrontier (PPF) shows the physical limits to a nation’s production of goods and services when all
TOPIC 1 An introduction to microeconomics 71

“c01AnIntroductionToMicroeconomics_print” — 2019/10/18 — 17:54 — page 72 — #70
resources are fully and most efficiently used. For a nation on its PPF, a decision to increase productionof, say, goods means foregoing production of some services. It can also be used to illustrate the effectsof changes in the availability of resources on a nation’s productive capacity or potential output.
Scarcity necessitates answering three economic questions
• Nations rely on an economic system for making key economic choices about how limited resourcesshould be used. This involves deciding:• ‘what and how much to produce’• ‘how to produce’• ‘for whom to produce’.
• Most countries including Australia make these key economic decisions about allocating limitedresources between competing uses, through the operation of the market system. Understanding how themarket works to allocate scarce resources involves the study of microeconomics.
The role of markets and relative prices in allocating resources
• The market system (also called the price system or market mechanism) is a decision-making institutionat the centre of most economies found around the world.
• Not all markets have the same features, characteristics or structure. While market structures vary andmight include perfectly competitive, monopolistic competition, oligopoly and perfect monopoly typemarkets, this course focuses on perfectly competitive markets
• Perfectly competitive markets: Typically these markets can only exist if they meet certainpre-conditions such as the following:• strong competition between many rival sellers• the absence of market power to set prices by an individual seller (price takers)• ease of entry (low barriers to entry) and exit from the market• perfect knowledge of the market by buyers and sellers• the absence of product differentiation (a homogeneous product)• the existence of consumer sovereignty.
• The competitive market system involves interaction between two sets of forces in each market: theforces of demand (by buyers or consumers) on the one hand, and the forces of supply (by sellers orproducers) on the other. Together, these groups negotiate the relative price (the price level of one goodor service against that for another) or each good or service. Over time, the relative price of one good orservice changes against that for another, thereby affecting the relative profitability of each good orservice. Profit-seeking owners of resources carefully watch these price signals and use them to makedecisions about how scarce resources should be allocated between competing uses, usually without theneed for significant government regulation.
• In a perfectly competitive market, a rise in the final price for a particular good or service (relative tothe prices of other goods and services) may signal that there has been underproduction, where firmsneed to allocate more resources and lift output volumes of that given good or service to maximiseprofits. By contrast, a fall in the relative price of a good or service indicates that there has beenoverproduction where owners of resources need to cut output and move resources into other morewanted uses in order to maximise profits.
• Demand–supply diagrams illustrate the forces of demand and supply.• The law of demand states that the quantity of a good purchased or demanded varies inversely with a
change in price, giving the demand curve or line a negative slope. So a rise in price causes demandto contract, while a fall in price causes demand to expand. Here we refer to movements along thedemand line. In addition, changes in non-price demand conditions (e.g. changes in disposableincome, the price of substitutes, fashions) can cause buyers to be prepared to purchase a greater orsmaller quantity of a good at a given price, thereby shifting the position of the whole demand line tothe right or left of the original line, thereby altering the market equilibrium price and quantity,profitability and the allocation of resources.
72 Key Concepts VCE Economics 2 Units 3 & 4 Tenth Edition
“c01AnIntroductionToMicroeconomics_print” — 2019/10/18 — 17:54 — page 73 — #71
• The law of supply states that the quantity of a good produced or supplied varies directly with achange in price. So a rise in price causes supply to expand, while a fall in price causes supply tocontract. Here we refer to movements along the supply line. In addition, changes in non-price supplyconditions (e.g. changes in production costs, climatic conditions) can cause sellers to be prepared toproduce a greater or smaller quantity of a good at a given price, thereby shifting the position of thewhole supply line to the right or left of the original line, altering the market equilibrium price andquantity, profitability and the allocation of resources.
• Elasticity is a concept that describes the relative responsiveness (whether there is a large or smallcontraction or expansion) of demand and supply following price changes.• Where the quantity demanded or supplied expands or contracts greatly, following a change in price,
it is said to be relatively elastic.• Where the quantity demanded or supplied expands or contracts little, following a change in price, it
is said to be relatively inelastic.• The elasticity of demand is affected by factors such as the availability of substitutes and degree of
necessity.• The elasticity of supply can be affected by factors like storability and level of spare capacity.
Market failure
• The market fails when resources are allocated inefficiently to produce particular types of goods andservices that fail to maximise or best satisfy society’s wants, general wellbeing and overall livingstandards.
• There are at least five situations where market failure can occur:• positive and negative externalities arising out of the production and consumption of goods and
services• the provision by the private sector of socially desirable public goods• problems in the use of common access resources• asymmetric information• the exercise of market power or weak competition.
• Market failure lowers efficiency in resource allocation and general living standards.• Governments try to reduce market failure and raise society’s general living standards and wellbeing by
intervention and regulation of the price or market system using, for example:• using various types of indirect tax• changing the types of budget outlays including subsidies and industry assistance• undertaking the direct production of goods and services by the public sector,• improving society’s knowledge through informative or educational advertising campaigns, and
enhancing communication systems• making new laws and passing legislation.
Government failureGovernment failure occurs when intervention or regulation of a market results in unintentional andunwanted outcomes that diminish efficiency in resource allocation and society’s general wellbeing. Somepossible examples of government failure might include:• Setting artificially high minimum wages and working conditions to help low-income workers enjoy
better purchasing power and living standards, may unintentionally make local firms less internationallycompetitive, and lead to business closures, youth unemployment, welfare dependence and higher taxesto support welfare.
• The Australian government has attempted to use a number of schemes designed to reverse thedownward trend in home ownership. The latest scheme, due to start in 2020, runs the risk of failingbecause it may increase the demand for housing and drive up property prices even higher, makingownership less affordable and reducing society’s general satisfaction of wants, wellbeing and livingstandards. If this occurs, it would be seen as an example of government failure.
TOPIC 1 An introduction to microeconomics 73

“c01AnIntroductionToMicroeconomics_print” — 2019/10/18 — 17:54 — page 74 — #72
• The payment of huge government subsidies to the coal mining industry were designed to liftproduction, create jobs and grow our export income. However, unintentionally, this has encouraged anindustry that has massive environmental external costs that contribute to climate change andundermine society’s wellbeing. Subsidies also involve significant opportunity costs where the samevalue of resources going into social programs, could have added far more to efficiency and society’soverall wellbeing.
Resources
To access key concept summaries and past VCAA exam questions download and print the studyON: Revision and practiceexam question booklet (doc-31486).
1.11.2 Key terms
Allocative efficiency is where resources are used in ways that maximise society’s satisfaction of needs andwants. Resources are diverted to where they are most wanted.
Asymmetric information exists in a market where buyers lack complete information required to make rationaldecisions about how to use their resources.
Budget A document that sets out the government’s planned income and expenses for the next financial year.Spending on public goods and services in the budget mostly comes out of government taxes.
Capital resources are physical plant and equipment used by firms to help make other goods and services.Common access goods include the environmental natural resources such as air, minerals, oil, forests that we all
depend on. They are typically non-excludable but yet are rivalrous.Conditions of demand are the non-price factors that affect the quantity of a good or service that buyers are
prepared to purchase or demand at a given price. They shift the position of the whole supply line.Conditions of supply are the non-price factors that affect the quantity of a good or service that producers are
willing to make available at a given price. They shift the position of the whole demand line.Consumer sovereignty exists when consumers of goods and services, not governments, dictate how resources
will be used.Demand refers to the quantity of a good or service that consumers are willing to purchase at any given price.
This can be shown by a demand curve or line.Demand–supply diagrams illustrate the behaviour of buyers and sellers of a particular good or service in a
market, and how prices are determined.Economic efficiency exists when there is maximum output gained from a given volume of productive inputs,
thereby maximising society’s general wellbeing and material living standards. It can mean allocative, dynamic,productive and intertemporal efficiency.
Economic system or economy is a way of organising the production and distribution of the nation’s goods,services and incomes.
Economics examines choices or decisions whereby limited resources are used to produce goods and services tohelp satisfy needs and wants, and improve living standards.
Elasticity measures the responsiveness of the quantity of a good or service demanded or supplied when there isa change in its price.
Equilibrium is the natural situation towards which all free and competitive markets tend to move. It exists onlywhen the quantity demanded exactly equals the quantity supplied, and there is no market glut or shortage.
Externalities represent a market failure and are the costs or benefits that arise from the economic activities offirms and households that are passed on to third parties not directly involved in the original activity.
Free rider problem occurs when a service is provided but payment is difficult or almost impossible to extractfrom the users who benefit from it (e.g. national defence, police and street lighting). Users are non-excludable.
Government failure occurs when the government intervenes in a market using various policies that are intendedto improve efficiency in resource allocation and living standards, but which unintentionally, lowers the generalsatisfaction of society’s wants and wellbeing. Possible examples could include subsidizing the coal industry,setting the minimum wage and perhaps schemes to increase housing affordability and ownership.
Labour resources used in production are physical power and mental talents provided by employees.
74 Key Concepts VCE Economics 2 Units 3 & 4 Tenth Edition

“c01AnIntroductionToMicroeconomics_print” — 2019/10/18 — 17:54 — page 75 — #73
Law of demand states that the quantity of a good or service demanded varies inversely to price. As the pricerises, demand will contract along the demand curve or line, while a fall in price will cause demand to expandalong the demand curve or line.
Law of supply states that the quantity of a good or service supplied varies directly with price.Macroeconomics is a branch of economics that examines the workings and problems of the economy as a
whole (i.e. consisting of the sum of all markets and industries). It focuses on aggregate demand, GDP, inflationand unemployment nationally.
Market A decision-making institution where buyers (demanders) and sellers (suppliers) negotiate the price for aparticular good or service.
Market capitalist economy An economic system that relies mostly on the market or price system to make keydecisions about what to produce, how to produce and for whom to produce. Resources are generally privatelyowned.
Market failure occurs when the price system allocates resources inefficiently, reducing the overall satisfaction ofsociety’s wants, wellbeing and living standards. This can occur when there is weak competition, externalities,public goods, common access resources and asymmetric information.
Market glut occurs where the quantity of a good or service supplied at a given price exceeds the quantitydemanded at that price, causing the equilibrium market price to fall.
Market shortage occurs where the quantity of a good or service demanded at a given price exceeds thequantity supplied at that price, causing the equilibrium market price to rise.
Market structure refers to the type and level of competition that exists in various markets, such as monopoly orpure competition.
Microeconomics is a branch of economics that examines individual decision making by firms and households,and how this impacts on a particular market for a single good or service.
Minimum wage Set by the Fair Work Commission and is the lowest wage that an employee can be legally paid.Monopolistic competition exists when there are quite a few rival producers of a good or service, selling a
differentiated product that gives them some market power.Natural resources are the resources found in nature, such as minerals, rainfall.Oligopoly exists where a few large firms control the output of an industry or product for which there is no close
substitute.Opportunity cost is equal to the benefit forgone by a decision not to direct resources into the next best
alternative use.Price elasticity of demand measures the responsiveness of the quantity of a product demanded given a change
in its price.Price elasticity of supply measures the responsiveness of the quantity of a product supplied given a change in
its price.Price is the purchase cost or amount paid in exchange for a good or service.Production possibility diagrams are used to illustrate the production choices available to society in the ways
that resources may be used or allocated. They also help illustrate the concept of opportunity cost.Productive capacity represents the physical limit to a nation’s production level, when all resources are used as
efficiently as possible to gain the highest output. It is represented by the production possibility frontier on aproduction possibility diagram.
Public goods such as street lighting, education, defence, the police force, national parks and health are seenas socially beneficial, merit-type goods and services that are often associated with positive externalities orbenefits for third parties. They are also non-excludable and non-rival in nature. This creates market failure anda problem for their provision, since those who choose not or cannot pay for them, are still able to consumethem and gain benefit. This means lower profits and hence, if left to the private sector to provide, they wouldnormally be under-produced, reducing efficiency in resource allocation and society’s general wellbeing.
Pure or perfect competition exists when there are many buyers and rival sellers competing strongly in a market.Pure competition implies that firms are price takers, potential competitors can easily enter and exit the market,there is perfect knowledge of relevant conditions in the market allowing buyers and sellers to make rationaldecisions, and so on.
Pure or perfect monopoly exists when a single firm controls the output of a particular market. That firm is aprice maker and competition is weak.
Relative prices describe the price level of one good (such as wheat) or service (such as health) compared withthe price level of another good (such as wool) or service (such as education). Changes in relative prices (pricesignals) normally affect the relative profitability of different types of goods and services, and hence help dictatehow scarce resources are used or allocated.
TOPIC 1 An introduction to microeconomics 75

“c01AnIntroductionToMicroeconomics_print” — 2019/10/18 — 17:54 — page 76 — #74
Relative profits describe the level or rate of profit gained from producing one type of good or service comparedwith the profit gained from producing an alternative good or service, altering how resources are allocated.Changes in the relative profit of producing a good or service reflects changes in relative prices.
Relative scarcity is the basic economic problem. It exists because society’s wants are virtually unlimited yet theproductive resources available to satisfy them are limited. This necessitates choices about which wants will besatisfied first, resulting in opportunity costs.
Resource allocation relates to decisions about which types of goods and services will be produced andwhich wants will be satisfied. This may be decided by either the market system or by government economicplanning.
Resources are productive inputs and include natural, labour and physical capital used by businesses.Supply refers to the quantity of a particular good or service that sellers are willing to make available at any given
price. This can be shown by a supply curve or line.
Resources
Digital documents Key terms glossary (doc-31485)
Crossword (doc-31489)
Wordsearch (doc-31490)
Match-up definitions (doc-31491)
1.11 Review questionsTo answer questions online and to receive immediate feedback and sample responses for every question,go to your learnON title at www.jacplus.com.au.
1.11 Exercise 1: Multiple choice questions1. At a particular point in time, the quantity of resources available for national production is:
A. fixed.B. infinite.C. sufficient to meet the wants of society.D. mostly made available free of charge.
2. The problem of scarcity relates to:A. having limited quantities of resources available and unlimited wants and needs.B. having limited needs and wants and unlimited resources.C. producing sufficient goods and services free of charge for users.D. the need for further exploration for natural resources.
3. You are considering three possible ways of using two hours of leisure time:• going surfing, which you value at $12• watching a movie, which you value at $2• minding the neighbour’s children, which is valued at $20.You decide to mind the neighbour’s children. The opportunity cost is therefore:A. $2.B. $12.C. $14.D. $20.
76 Key Concepts VCE Economics 2 Units 3 & 4 Tenth Edition
“c01AnIntroductionToMicroeconomics_print” — 2019/10/18 — 17:54 — page 77 — #75
4. Which of the following statements is most correct when all of a nation’s resources are fully and mostefficiently employed?A. Scarcity no longer exists.B. It is generally possible to quickly raise GDP and increase material living standards or welfare.C. It is generally not possible to increase the total value of production in the short term simply by
reallocating resources.D. The economy is not necessarily at its productive capacity.
5. In competitive market economies, businesses wish to sell their products at high prices, while consumerswish to purchase goods at low prices. This conflict of interest is generally:A. solved by governments imposing regulations.B. solved by reaching a compromise price through the competitive operation of market forces.C. left unresolved.D. solved by businesses indulging in collusive pricing and by government rationing.
6. In competitive market economies, the level of relative profitability of alternative areas of productiondictates how best to allocate resources. In this context, profit best represents:A. the final selling price of each item in the market.B. the total cost of inputs or resources purchased.C. the final selling price plus capital efficiency.D. the final selling price minus the cost of price of inputs used.
7. In Australia’s competitive market capitalist economy, which statement is most correct?A. Most of the means of production are privately owned.B. Private ownership and wealth inequality do not create income inequality.C. There are very few monopolies or oligopolies, causing competition to be especially strong.D. It is unnecessary for governments to provide any capital equipment or collective services for the
community.
8. If a competitive market existed for vegetables, the price may fall as a result of:A. a poor growing season adversely affecting producers.B. the development and use of new higher yielding types of seed.C. a switch by consumers from meat to a vegetarian diet.D. lower labour productivity by vegetable growers.
9. Concerning purely competitive market capitalist economies, which statement is generally incorrect?A. The value of incomes paid to individuals depends upon the quantity and quality of productive
resources supplied.B. The market or price system will value the economic contribution made by each individual and use
this to determine relative income levels.C. Relative prices for all goods and services will be negotiated by the forces of demand and supply.D. Equity in income distribution would be assured by government transfer payments and progressive
taxes.
10. In an economy, the price system or market mechanism operates most freely in decision making when:A. there are no government regulations, collusive practices between firms or other restrictions on the
degree of market competition.B. there is no product differentiation.C. resources are very mobile and can be quickly and easily reallocated between uses in response to
price signals.D. all of the above.
TOPIC 1 An introduction to microeconomics 77

“c01AnIntroductionToMicroeconomics_print” — 2019/10/18 — 17:54 — page 78 — #76
11. Concerning restrictive trade practices, which of the following statements is false?A. They are generally illegal in Australia.B. They generally aim to decrease market competition.C. They increase the allocative efficiency of the price system in deciding how resources should be best
used.D. They often lead to higher prices and profits among the firms involved.
12. In Australia, the government modifies the allocation of resources that otherwise would occur in amarket economy to help correct market failures. Which of the following policies could actually operateto reallocate resources?i. Spending by government departments in providing public goods including community services and
social infrastructureii. Legislation that limits the production or consumption of various goods and services and forces the
consumption of othersiii. A system where different indirect tax rates apply on different goods and servicesiv. The fixing of minimum wagesv. The payment of subsidies and the provision of tax concessionsA. Answers (ii) and (iii) onlyB. Answers (ii) and (iv) onlyC. Answers (i), (ii), (iii) and (v) onlyD. All of the possible policies listed above
13. Butter and margarine are regarded by many consumers as very close substitutes. Given this, a rise in theprice of butter in a free or competitive market is likely to result in:A. an increase in the demand for margarine.B. a decrease in the supply of margarine.C. a fall in the price of margarine.D. no change in the demand or price of margarine since the two markets are unrelated.
14. Which of the following would not tend to result in a rise in the supply of yoyos at a given price in acompetitive market?A. A drop in wages paid to workers in yoyo plantsB. A fall in the price of plastics used to make yoyosC. A cut in bank interest rates charged on loans to yoyo businessesD. A successful TV advertising campaign
15. Products A and B are complementary goods in a competitive market. Which of the following isunlikely, given a rise in the demand for product A at a given price?A. The demand for B at a given price will rise.B. The demand for B at a given price will fall.C. There will be an expansion in the supply of A.D. There will be an expansion in the supply of B.
16. Assume that the demand for Coke is price inelastic. Which statement is correct?A. The demand for Coke contracts by a larger proportion than the rise in price.B. The demand for Coke is such that it would pay retailers to collectively lift prices a little in order to
maximise total current revenue.C. It would pay sellers of Coke to offer large discounts on their standard prices in order to maximise
total current revenue.D. The percentage rise in prices charged for Coke would exactly equal the percentage fall in the
quantity purchased.
78 Key Concepts VCE Economics 2 Units 3 & 4 Tenth Edition

“c01AnIntroductionToMicroeconomics_print” — 2019/10/18 — 17:54 — page 79 — #77
17. Faced with a rise in prices, the supply of fresh nectarines may be inelastic in the short term because:A. time is needed to grow extra trees.B. the fruit has a limited storage life.C. the resources of fruit growers are immobile.D. all of the above are possible.
18. Which of the following products is most likely to face an elastic demand?A. Electricity B. WaterC. Pepper D. Margarine
19. Which of the following would be most likely to cause an increase in the demand for surfboards at agiven price?A. A fall in the price of surfboardsB. An expectation that prices will fall for next yearC. A fall in the cost of foam used to make the boardsD. A rise in the income of consumers of surfboards
20. Assume that if Coke and Pepsi are very close soft-drink substitutes, then an increase in the price ofCoke would most likely tend to cause:A. an increase in the demand for Pepsi.B. a contraction in the demand for Coke.C. no effect on the demand for Pepsi.D. Both A and B are correct.
21. Examine the diagram in figure 1.32 showing the market for cinema tickets.
FIGURE 1.32 Changes in the market for cinema tickets
Quantity of cinema tickets
The market for cinema tickets
Pri
ce
of
a c
ine
ma
tic
ke
t ($
)
Q1
D2
D1
S1
Q2
P2
P1
The shift in the whole demand line for cinema tickets from D1 to D2 would probably not becaused by:A. a rise in the ticket price.B. a rise in the price of iTunes movies.C. a successful advertising campaign by cinemas.D. the cinema release of a popular blockbuster movie.
TOPIC 1 An introduction to microeconomics 79

“c01AnIntroductionToMicroeconomics_print” — 2019/10/18 — 17:54 — page 80 — #78
22. In a competitive or free market for wool, equilibrium would exist when:A. the market is cleared of any shortage or surplus wool.B. the quantity of wool supplied equals the quantity demanded.C. there is no tendency for the market price of wool to rise or fall.D. all of the above conditions are achieved.
23. The Australian government sets a floor price on labour by imposing minimum wages. If this minimumwage is fixed above the equilibrium that would otherwise occur in a competitive or deregulated labourmarket:A. there will be equilibrium in the market.B. there will be a shortage of labour.C. there will be unemployment, perhaps leading to poverty.D. all workers will be better off financially.
24. Australia has a floating exchange rate where demand and supply in the foreign exchange market decidethe price of the Australian dollar. Between 2013–16 and during 2017–19, the Australian dollar’sexchange rate or price generally fell or depreciated overall against the US dollar by around 30 per cent.In terms of market theory, this could be caused by:A. an increase in the supply of Australian dollars.B. a decrease in the demand for the Australian dollar.C. a relatively lower value for the US dollar.D. both A and B above.
25. Currently, the demand for petrol is described as:A. relatively elastic.B. relatively inelastic.C. unit elasticity.D. neither elastic nor inelastic, since this cannot be determined.
26. Overall, between 2014 and early 2019, the market price of crude oil fell from over US$100 per barrel tounder US$65 per barrel. Assuming rational decisions concerning the allocation of resources follow thissignal from the market, which of the following should not follow?A. Fewer resources should go into oil exploration and research into alternative fuels and more efficient
technologies.B. Fewer resources should go into the production of large 4WD vehicles and spending on freeways for
use by private vehicles.C. Fewer resources should be allocated to public transport, especially trains and trams, and provision
of cycle tracks.D. Fewer resources should go into the production of paper packaging and natural fibres for textiles
(e.g. wool) that are not made from oil.
27. Regarding the market or price mechanism, which statement is false?A. Relatively lower market prices for a good or service usually indicate underproduction or shortages
of the good or service.B. Relatively higher market prices for a good or service usually signal that firms have allocated too few
resources towards the particular area of production.C. In general, the market does not efficiently allocate resources if factors such as monopolies and
oligopolies restrict the free movement of prices up or down to reflect either shortages oroverproduction.
D. Changing market conditions of demand or supply may alter the equilibrium price of a particulargood or service.
80 Key Concepts VCE Economics 2 Units 3 & 4 Tenth Edition

“c01AnIntroductionToMicroeconomics_print” — 2019/10/18 — 17:54 — page 81 — #79
28. Examine the data in table 1.9 below relating to the price of bananas in a purely competitive market.
TABLE 1.9 Schedule relating to conditions in the market for bananas
Price of bananasper kg (A$)
Demand for bananas(million kg per year)
Supply of bananas(million kg per year)
4.20 500 50
4.40 400 150
4.60 300 250
4.80 200 350
5.00 100 450
Under these conditions, the equilibrium price of bananas per kilogram would be:A. between $4.40 and $4.50.B. between $4.60 and $4.80.C. over $4.80.D. none of the above.
29. Theoretically, in a competitive market, which of the following would not explain a shift to the right inthe location of the whole supply line for goldfish?A. An awful disease hit the industry, causing the fish to bloat and float to the surface.B. The 90 per cent tax on goldfish companies was abolished by the treasurer, who is an enthusiastic but
secret collector of goldfish.C. Workers employed in the goldfish industry reluctantly accepted a $100 per week pay cut.D. A special fertility drug was developed by breeders to cause goldfish to have more babies.
30. Which of the following is unlikely to increase the free market price of woollen mini-skirts?A. A successful and compelling mini-skirt advertising campaign by tall, thin models.B. Rising consumer confidence and disposable incomes among teenage skirt buyers.C. The implementation of a special report by the government’s minister for primary industry (who
followed the fashion industry closely), recommending the abolition of all taxes on clothingproducers.
D. The government paying a cash subsidy to wool growers, designed to encourage higher productionlevels.
31. When there is a contraction in the demand for soft drinks in a free market, the most convincingexplanation of this is:A. a rise in the price of soft drinks.B. a general fall in wages among buyers.C. a decline in population or market size.D. the onset of winter.
32. Capital or investment goods can best be described as:A. plant and equipment used by producers to help make other goods and services and to improve the
efficiency of labour and natural resources.B. money that is available for capital formation.C. the purchase of shares on the share market.D. equipment provided only by the government to help make collective services available to the public.
33. Which of the following Australian industries best approximates a highly competitive market?A. OilB. BankingC. MineralsD. Property
TOPIC 1 An introduction to microeconomics 81

“c01AnIntroductionToMicroeconomics_print” — 2019/10/18 — 17:54 — page 82 — #80
34. Which of the following Australian industries best approximates a monopolistically competitive market?A. ClothingB. ElectricityC. Air travelD. Beer
35. Which of the following Australian industries best approximates an oligopolistic market?A. WheatB. GroceriesC. LabourD. Shares
36. The size of a nation’s production possibility frontier will not be affected by:A. changes in the unemployment of resources.B. new discoveries of minerals and the use of new technology in production.C. lower rates of skilled immigration.D. climate change.
37. Which of the following statements relating to economic efficiency is least correct?A. Efficiency in resource allocation is achieved when opportunity costs are maximised.B. Intertemporal efficiency is achieved when there is an optimal balance between current consumption
or the spending of income, versus saving income to finance investment and hence futureconsumption.
C. Allocative efficiency is achieved when resources are used in ways that maximise the generalsatisfaction of society’s wants and general wellbeing.
D. Dynamic efficiency occurs when resources are reallocated quickly to increase choice and meet thechanging needs of consumers.
38. Technical efficiency would probably not be improved if:A. winemakers used new equipment for grape picking.B. government funding of training along with R&D by the CSIRO and other agencies was slowed.C. there was a reduction in water used in rice growing through the use of new drought-resistant strains
of seed.D. the rollout of the National Broadband Network (NBN) was accelerated.
39. In Australia’s economy, the market or price system involving the operation of demand and supplymakes most economic decisions about:A. the types and quantities of particular goods and services produced.B. the production methods to be used.C. how the goods and services produced will be divided or distributed.D. all of the above.
40. Which statement about the operation of the price system is least correct in the market for oil?A. A fall in the relative price of oil will normally lead to fewer resources being allocated to this
product.B. Technological breakthroughs that allow for the viable extraction of oil from shale sands will tend to
reduce the relative profitability of oil production, attracting fewer resources and leading to loweraverage incomes.
C. Rises in the relative wages paid to oil workers will tend to attract more labour resources into theindustry.
D. Lower relative prices paid for oil will tend to reduce the allocation of resources into air travel butincrease resources allocated into solar and alternative energy sources.
82 Key Concepts VCE Economics 2 Units 3 & 4 Tenth Edition
“c01AnIntroductionToMicroeconomics_print” — 2019/10/18 — 17:54 — page 83 — #81
41. If the price of coffee rises by 10 per cent and the demand for coffee contracts by 5 per cent, the priceelasticity of demand would be:A. greater than 1. B. less than 1.C. equal to 1. D. cannot be calculated.
42. An excise tax imposed on sales of petrol or tobacco is likely to:A. greatly change consumer behaviour and reduce consumption.B. raise considerable government revenue.C. correct market failure and the problems associated with the use of these products.D. have no effect at all on resource allocation.
43. A shift of the whole supply line for childcare to the right of the original line is best described as:A. an expansion in supply at a given price.B. a decrease in supply at a given price.C. an increase in the quantity supplied at a given price.D. less favourable supply conditions at a given price.
44. Bananas are often regarded as having a fairly inelastic supply curve. What is the best explanationfor this?A. They do not store well over a long period of time.B. Their supply is relatively fixed in the short term.C. Growers may have little unused growing capacity available.D. All of the above.
45. Regarding market failure, which statement is least correct?A. Failure occurs when resources are allocated to the production of certain types of goods and services
that lower the general wellbeing of society.B. The exercise of market power leads to lower prices.C. The existence of asymmetric information can lead to consumers making poor decisions that
diminish the degree to which their wants are satisfied.D. Failure can sometimes be reduced by government intervention using excise taxes, subsidies and
laws.
46. The greatest positive externality is most likely to result from the production and consumption of whichof the following?A. Tobacco B. Vaccinations against measles and fluC. Alcohol D. Cars
47. Which of the following is most likely to lead to failure in the market for electricity?A. The entry of additional firms into the industry.B. Further government deregulation and the creation of a national electricity grid connecting the states.C. Increased access to the internet through the NBN and the introduction of laws about product
disclosure.D. The abolition of the carbon tax.
48. Concerning the features of public and private goods, which of the following is most correct?A. Private goods are non-rival in nature.B. Public goods are normally non-excludable.C. Public goods are normally both non-rival and non-excludable.D. Private goods are normally provided through the federal budget.
TOPIC 1 An introduction to microeconomics 83

“c01AnIntroductionToMicroeconomics_print” — 2019/10/18 — 17:54 — page 84 — #82
49. The payment of a government subsidy to private schools due to the existence of external benefits wouldtend to:A. increase the quantity of education supplied across all possible prices or fees, and cause the
profitability for suppliers to increase.B. cause a glut of education at the original price or level of school fees so the price paid by consumers
falls.C. cause an expansion in the demand for private education.D. all of the above.
50. Tighter laws restricting the underage consumption of alcohol would tend to:A. lower the demand for alcohol and increase its price and quantity.B. lower the demand and cause a contraction in the supply of alcohol, along with a decrease in its
equilibrium market price and quantity.C. lower the demand and decrease the supply of alcohol, causing the price and quantity of alcohol to
remain unchanged.D. have no impact on the allocation of resources or on market failure.
Resources
Digital documents Multiple choice answer grid (doc-31487)
Multiple choice answers (doc-31488)
1.11 Exercise 2: Extended response questions1. Distinguish between allocative efficiency and dynamic efficiency. (2 marks)
2. a. Explain how the price system (also called the price mechanism) operates to allocate resourcesbetween competing uses. (4 marks)
b. Examine figure 1.33 showing an index that tracks international changes in the relative pricesreceived for selling various fibres used in making textiles and clothes over the years from early 2014to late 2018.
FIGURE 1.33 Changes in the price indexes for selected fibres used in textile manufacture (base year is 2014 =100 points)
200
150
Index
50
0
200
150
Index
50
0
Nov2014
May2015
May2016
May2017
May2018
Nov2015
Nov2016
Nov2017
Nov2018
Wool Cotton Polyester staple Acrylic staple
Source: Sourced from the Commonwealth of Australia Department of Agriculture and Water Resources.
84 Key Concepts VCE Economics 2 Units 3 & 4 Tenth Edition

“c01AnIntroductionToMicroeconomics_print” — 2019/10/18 — 17:54 — page 85 — #83
What are relative prices? Referring to the general trends for particular fibres shown on this graph,explain how you would normally expect changes in the relative prices received by the sellers ofthese fibres, to alter the way resources would be allocated between alternative uses, in the upcomingyears. (2 marks)
3. Electricity prices have risen sharply in Australia over recent years by threefold, partly due to newnon-price conditions affecting supply. Examine figure 1.34 hypothetically showing changes inAustralia’s electricity market in recent years through to early 2019. (5 marks)
FIGURE 1.34 Changes in Australia’s electricity market in recent years
Q2 (1000)
P2 ($1.50)
P1 ($1.00)
Q1 (1500)
Quantity of electricity (kilowatt hours)
D1S2
S1
e2
e1
Pri
ce
of
ele
ctr
icit
y p
er
kilo
wa
tt h
ou
r ($
)
The electricity market
a. Referring the above hypothetical diagram, explain what has happened in the electricity market overthe period to early 2019 suggesting two important and likely non-price microeconomic factors thatcould have caused the changes shown on this diagram. (3 marks)
b. Referring to the above diagram, systematically (step-by-step) explain the process whereby there wasa shift in the electricity market’s equilibrium from e1 to e2. (2 marks)
4. There are different market structures operating in our economy. Identify and explain three keydifferences between Australia’s wool market and that for telecommunications. (3 marks)
5. ‘Because of market failure, the Australian government modifies the allocation of resources that wouldotherwise occur if this decision was left solely to the free operation of the price or market system.’
(5 marks)a. Asymmetric information exists in some markets. Giving examples, explain how this can result inmarket failure, providing two important ways whereby the Australian government has attempted toreduce this failure. (3 marks)
b. In what way does the provision of national defence as an example of a public good illustrate amarket failure involving the free rider problem? (2 marks)
6. a. Giving reasons, clearly explain why a free (unregulated) and purely competitive tobacco market,would be likely to cause market failure. (2 marks)
b. With this in mind, the Australian government has dramatically increased the excise tax on the sellersof cigarettes by 50 per cent over the last few years causing the price to rise. Neatly and fully
TOPIC 1 An introduction to microeconomics 85

“c01AnIntroductionToMicroeconomics_print” — 2019/10/18 — 17:54 — page 86 — #84
complete and label the demand–supply diagram in figure 1.35 to show the situation that develops inthe market for cigarettes before and after the hefty rise in the excise tax levied on sellers.
FIGURE 1.35 Changes in the market for cigarettes
Qe1
Pe1
Quantity of cigarettes (packets/year)
e1
D1
S1
Pri
ce
of
a p
ac
ke
t o
f c
iga
rett
es (
$)
The market for cigarettes
Referring to parts of this completed diagram, clearly explain how this higher excise tax imposedon sellers of cigarettes, may help to alter the allocation of resources and perhaps reducemarket failure. (2 marks)
c. Giving reasons, describe the price elasticity of demand (PED) for cigarettes. Explain why thissituation might make the excise tax on tobacco on sellers somewhat ineffective in correcting thismarket failure. (1 mark)
d. Select one important case study of an Australian government policy measure primarily designed toreduce market failure, that has unintended consequences leading to government failure. Identify thispolicy and discuss the various impacts of this policy on efficiency in resource allocation andsociety’s general wellbeing. (5 marks)
Past VCAA examinationsSit past VCAA examinations and receive immediate feedback, marking guides and examiner’s report notes.
Access Course Content and select ’Past VCAA examinations’ to sit the examination online or offline.
Fully worked solutions and sample responses are available in your digital formats.
Test makerCreate unique tests and exams from our extensive range of questions, including practice exam questions.Access the Assignments section in learnON to begin creating and assigning assessments to students.
86 Key Concepts VCE Economics 2 Units 3 & 4 Tenth Edition

“c01AnIntroductionToMicroeconomics_print” — 2019/10/18 — 17:54 — page 87 — #85
1.11 Practice school-assessed courseworkThree SACs are to be completed for VCE Economics Unit 3. SAC 1 is worth 40 per cent of the totalassessment for Unit 3. It assesses the skills and knowledge associated with Outcome 1 that is largelycovered in topic 1. The SAC should be part of the regular teaching and learning program, and completedmainly in class and within a limited timeframe.
The SAC could involve one or more of the following:• a folio of applied economics exercises• an essay• a report• structured questions.Courses and assessments can change, so teachers are urged to carefully check the latest VCAA
assessment guide and various bulletins to ensure that all the assessment requirements are met fully.
A FOLIO OF APPLIED ECONOMICS EXERCISES1. Explain what is meant by an efficient allocation of Australia’s resources, outlining two important effects of
increased levels of economic efficiency. (3 marks)2. Identify and outline three important differences between a perfectly competitive market structure and a
monopolistic competitive market structure. (3 marks)3. ‘Australia has a market or price system that helps to allocate most resources between competing uses. In
2018–19, property prices in capital cities tended to fall, but oil prices started to rise.’ Referring to the aboveexamples, clearly explain how the change in relative prices in markets is likely to alter the allocation of ourresources between competing uses. (6 marks)
4. Study the following demand and supply schedule for avocados shown in table 1.10.
TABLE 1.10 Schedule showing demand and supply in the avocado market
Price per avocado ($) Demand curve1 — D1 (quantity of
avocados, thousands)
Supply curve1 — S1 (quantity of
avocados, thousands)
Supply curve2 — S2 (quantity of
avocados, thousands)
2 200 40 20
4 160 80 40
6 120 120 60
8 80 160 80
10 40 200 100
(a) Use the graph grid in figure 1.36 below and the hypothetical data about the avocado market to constructa fully labelled and accurate demand and supply diagram. (4 marks)
FIGURE 1.36 A demand and supply diagram representing the banana market
TOPIC 1 An introduction to microeconomics 87
“c01AnIntroductionToMicroeconomics_print” — 2019/10/18 — 17:54 — page 88 — #86
(b) On the diagram you have drawn, identify and label the following:i. The initial or original equilibrium price (P1) and equilibrium quantity (Q1) traded for avocados. (1 mark)ii. The new equilibrium price (P2) and quantity traded Q2) for avocados. (1 mark)
(c) Describe the change in the supply of avocados (S1 to S2), outlining two non-price microeconomic factorsthat might have led to the change in the supply of avocados. (2 marks)
(d) Explain the process or steps whereby the market for avocados will move from the initial equilibrium (E1)to the new equilibrium (E2) following the change in supply(from S1 to S2). (3 marks)
(e) If the supply of avocados was price inelastic, what would this mean? Identify and outline two possiblereasons for this. (2 marks)
5. (a) Carefully define what meant by the term market failure. (1 mark)(b) Select two situations from those listed below and then identify and outline the most likely type of market
failure involved. Please ensure you select two different types of market failure. (3 marks)i. A person with contagious whooping cough pays $80 to see a doctor and have a vaccination.ii. Toxic waste is emptied down the sink.iii. A mining company extracts and sells brown coal.iv. You get driven to school rather than walking, even though it’s only 900 metres away.v. Your neighbours throw a wild party that rages for days.vi. A director of a tech company, knowing that the company is about to fail, sells her shares before the
announcement is made to the public.(c) As areas of market failure, distinguish between merit type or public goods and common access
resources. (4 marks)(d) Suggest three important methods the government could use to help reduce market failure involving
negative externalities associated with pollution. (3 marks)(e) What is government failure? (1 mark)(f) Select one contemporary example of government failure and discuss the intended and unintended
impacts of the Australian government’s intervention in the market on efficiency in the allocation ofresources. (5 marks)
i. Subsidies paid to the coal industryii. Setting minimum wagesiii. Introducing the carbon tax on emissions
AN ESSAYThe following may be a guide to an appropriate essay topic (total 40 marks) that covers Economics Unit 3,Outcome 1.a. At the microeconomic level, explain how the operation of the price system, and changes in relative prices in
Australia, allocate scarce resources between alternative uses. Illustrate your answer by reference toappropriate current examples of markets. If you wish, use fully labelled diagrams to help yourexplanation. (20 marks)
b. What is market failure? Outline two important types of market failure and the reasonsfor them. (10 marks)
c. Explain how the Australian government has or might seek to overcome this failure using appropriate policiesto improve living standards. (10 marks)
A WRITTEN REPORTAfter conducting appropriate research using the internet and other sources, prepare a written report coveringone of the following topics (total 40 marks). Note: Your report should contain tables, graphs and diagrams, andfootnote the sources of information.
Question 1a. What is meant by an efficient allocation of resources and why is this usually achieved in competitive markets
through the price system? (10 marks)b. Explain why climate change may be described as the biggest market failure ever, noting the main reasons
for this failure. (10 marks)
88 Key Concepts VCE Economics 2 Units 3 & 4 Tenth Edition

“c01AnIntroductionToMicroeconomics_print” — 2019/10/18 — 17:54 — page 89 — #87
c. Outline how the Australian government has used various policies designed to reduce this example of marketfailure and improve the allocation of resources that would otherwise occur. (10 marks)
d. Evaluate the success of government policy to reduce climate externalities. (10 marks)
Question 2Select a commodity market for your investigation. For this chosen market, complete the following researchquestions for your report.a. Introduction to your market: Describe the likely type of market structure and the key features of your chosen
commodity market. (5 marks)b. Commodity buyers:
(i) Who are the main buyers in this market?(ii) Is the demand for this commodity likely to be price elastic or inelastic? Why?(iii) What are the microeconomic demand conditions affecting the quantity buyers are prepared to
purchase at a given price, thereby affecting the demand line for this commodity? (10 marks)c. Commodity sellers:
(i) Who are the main sellers in this market?(ii) Is the supply of this commodity likely to be price elastic or inelastic? Why?(iii) What are the microeconomic supply conditions affecting the quantity sellers are prepared to make
available at a given price, thereby shifting the supply line for this commodity? (10 marks)d. The effects of changes in the commodity price:
(i) Use the ABARES, YQ Matric graphs or RBA Statistics weblinks in the Resources tab to research agraph showing the changes in the level of the market price over the last 10 years, five years or the pastyear in a commodity of your choice. Describe these changes and trends. (5 marks)
(ii) How have recent changes in the conditions influencing the decisions of both buyers and sellersaffected the market price of your commodity? With the help of a hypothetic, fully labelled D–S diagram,explain the reasons for the change in recent market prices. (5 marks)
(iii) Explain how the recent trend in relative market prices is likely to have affected how resources areallocated by their owners between alternative uses. (5 marks)
Resources
Weblinks ABARES
YQ Matric graphs
RBA Statistics
TOPIC 1 An introduction to microeconomics 89
Related Documents