Copyright 2013, 2010, 2007, Pearson, Education, Inc. Section 1.2 Estimation

Welcome message from author
This document is posted to help you gain knowledge. Please leave a comment to let me know what you think about it! Share it to your friends and learn new things together.
Transcript

Copyright 2013, 2010, 2007, Pearson, Education, Inc.
Section 1.2
Estimation

Copyright 2013, 2010, 2007, Pearson, Education, Inc.
What You Will Learn
Estimation
1.2-2

Copyright 2013, 2010, 2007, Pearson, Education, Inc.
Estimation• The process of arriving at an approximate answer to a question is called estimation.
• Estimates are not meant to give exact values for answers, but are a means of determining whether your answer is reasonable.
• We often round numbers to estimate, or approximate, an answer.
• The symbol ≈ means is approximately equal to.
1.2-3

Copyright 2013, 2010, 2007, Pearson, Education, Inc.
Example 1: Estimating the Cost of Bagels
Sandy Mendez decides to purchase bagels for her colleagues. Estimate her cost if she purchases 29 bagels at $1.99 each.
1.2-4

Copyright 2013, 2010, 2007, Pearson, Education, Inc.
Example 1: Estimating the Cost of BagelsSolution: Round the amounts to obtain an estimate
NumberNumber Rounded 29 30
$1.99 $2.00 $60.00
The 29 bagels will cost approximately $60.00, written ≈ $60.00
1.2-5

Copyright 2013, 2010, 2007, Pearson, Education, Inc.
Example 4: Using Estimates in Calculations
The Martellos traveled 1276 miles from their home in Springfield, Missouri, to Yellowstone National Park.a) If their trip took 19.9 hours of driving time, estimate the average speed in miles per hour, that their car traveled.
1.2-6

Copyright 2013, 2010, 2007, Pearson, Education, Inc.
Example 4: Using Estimates in CalculationsSolution:To estimate the average miles
per hour, divide the number of miles by the number of hours.Numbers Rounded
1276
19.9
1300
2065
The car averaged about 65 mph.1.2-7

Copyright 2013, 2010, 2007, Pearson, Education, Inc.
Example 4: Using Estimates in Calculations
The Martellos traveled 1276 miles from their home in Springfield, Missouri, to Yellowstone National Park.b) If their car used 52 gallons of gasoline, estimate the average gas mileage of their car, in miles per gallon.
1.2-8

Copyright 2013, 2010, 2007, Pearson, Education, Inc.
Example 4: Using Estimates in CalculationsSolution:To estimate the average gas
mileage, divide the number of miles by the number of gallons.Numbers Rounded
1276
52
1300
5026
Car averaged about 26 mpg.1.2-9

Copyright 2013, 2010, 2007, Pearson, Education, Inc.
Example 4: Using Estimates in Calculations
The Martellos traveled 1276 miles from their home in Springfield, Missouri, to Yellowstone National Park.c) If the cost of gasoline averaged $3.51 per gallon, estimate the total cost of the gasoline used.
1.2-10

Copyright 2013, 2010, 2007, Pearson, Education, Inc.
Example 4: Using Estimates in CalculationsSolution:To estimate the total cost of
gasoline, multiply the price per gallon by the number of gallons.Numbers Rounded52 $3.51 50 $3.50 = $175
The cost of gasoline is about $1751.2-11

Copyright 2013, 2010, 2007, Pearson, Education, Inc.
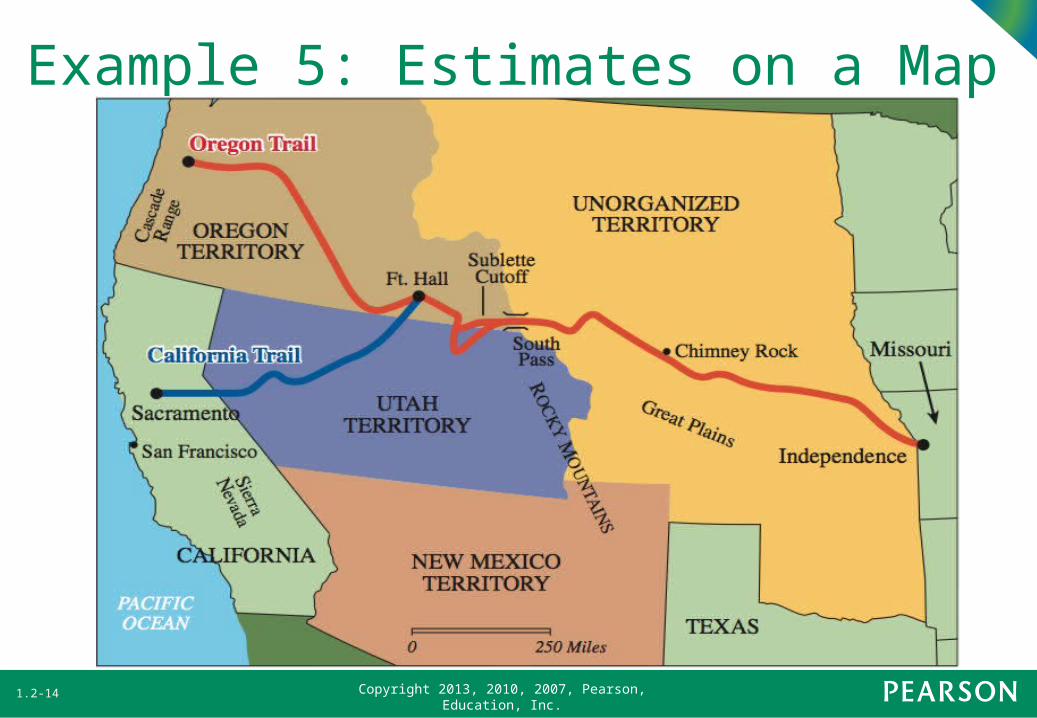
Estimates on a Map
• Sometimes when working with measurements on a map, it may be difficult to get an accurate estimate because of the curves on the map.
• To get a more accurate estimate, you may want to use a piece of string and tape or pins to mark the ends.
1.2-12

Copyright 2013, 2010, 2007, Pearson, Education, Inc.
Example 5: Estimates on a MapIn the mid-1800s, thousands of settlers followed trails to the West to gain cheap, fertile land and a chance to make a fortune. One of the main trails to the West was the Oregon Trail, which ran from Independence, Missouri, to the Oregon Territory. Another trail, the California Trail, ran from Fort Hall on the Oregon Trail to Sacramento, California. A map of the Oregon Trail and the California Trail is shown on the next slide.1.2-13
Copyright 2013, 2010, 2007, Pearson, Education, Inc.
Example 5: Estimates on a Map
1.2-14
Copyright 2013, 2010, 2007, Pearson, Education, Inc.
Example 5: Estimates on a Map
a) Using the Oregon Trail, estimate the distance from Independence, Missouri, to Fort Hall in the Oregon Territory.
1.2-15

Copyright 2013, 2010, 2007, Pearson, Education, Inc.
Example 5: Estimates on a Map
1.2-16

Copyright 2013, 2010, 2007, Pearson, Education, Inc.
Solution:a) Approximately ¾-in represents 250
miMark off ¾-in intervals, from
Independence, Missouri, to Fort Hall in the Oregon Territory, there are about 4, thus the distance is 4 250 mi or about 1000 mi
1.2-17
Example 5: Estimates on a Map

Copyright 2013, 2010, 2007, Pearson, Education, Inc.
Example 5: Estimates on a Map
b) Using the California Trail, estimate the distance from Fort Hall in the Oregon Territory to Sacramento, California.
1.2-18

Copyright 2013, 2010, 2007, Pearson, Education, Inc.
Example 5: Estimates on a Map
1.2-19

Copyright 2013, 2010, 2007, Pearson, Education, Inc.
Solution:On a map like this one, it may be
difficult to get an accurate estimate because of the curves on the map. To get an accurate estimate, one can use a string placed along the road, then stretch the string, mark off ¾-in intervals or measure string, about 3¼ in or 1083 mi
1.2-20
Example 5: Estimates on a Map

Copyright 2013, 2010, 2007, Pearson, Education, Inc.
Solution:b) Using the procedure discussed in
part (a), we estimate that the distance from Fort Hall in the Oregon Territory to Sacramento, California is about 1 5/8 in or about 2.2 ¾-in intervals
The distance is about 2.2 250 mi, or about 550 mi
1.2-21
Example 5: Estimates on a Map

Copyright 2013, 2010, 2007, Pearson, Education, Inc.
Estimates on a Photo• In order to estimate large areas, a photograph can be helpful. We can divide the photo into rectangles with equal areas, then pick one area that looks representative of all the areas.
• Estimate (count) the number of items in this single area. Then multiply by the number of equal areas.
1.2-22

Copyright 2013, 2010, 2007, Pearson, Education, Inc.
Estimates on a Photo
• The number of regions (rectangles) into which you choose to divide the photo is arbitrary. Generally, the more regions, the better the approximation.
1.2-23

Copyright 2013, 2010, 2007, Pearson, Education, Inc.
Example 7: Estimates on a PhotoEstimate the number of corn kernels in the top layer in the accompanying photograph.
1.2-24

Copyright 2013, 2010, 2007, Pearson, Education, Inc.
Solution:Divide into 20 approximately equal
areas, select the top left as representative region, enlarge the area and count the kernels
Example 7: Estimates on a Photo
1.2-25

Copyright 2013, 2010, 2007, Pearson, Education, Inc.
Solution:If half a kernel is in the region, we
count it. There are about 18 kernels in this region. Multiplying by 20 gives18 20 = 360. Thus, there are about 360 kernels in the photo.
Example 7: Estimates on a Photo
1.2-26
Related Documents


![Hand Pose Estimation - CSE, IIT Bombaypratikm/projectPages/...Figure 1.2: Applications of hand pose estimation (Image Source: [Wan]) Computer interfaces based on human hand have so](https://static.cupdf.com/doc/110x72/5ecd6645a9dc6e3f690e2b20/hand-pose-estimation-cse-iit-bombay-pratikmprojectpages-figure-12-applications.jpg)


