Copyright © 2013, 2009, 2006 Pearson Education, Inc. 1 Copyright © 2013, 2009, 2006 Pearson Education, Inc. 1 Section 3.2 Graphing Linear Equations Using Intercepts Copyright © 2013, 2009, 2006 Pearson Education, Inc. 1

Welcome message from author
This document is posted to help you gain knowledge. Please leave a comment to let me know what you think about it! Share it to your friends and learn new things together.
Transcript

Copyright © 2013, 2009, 2006 Pearson Education, Inc. 1Copyright © 2013, 2009, 2006 Pearson Education, Inc. 1
Section 3.2
GraphingLinear
Equations Using Intercepts
Copyright © 2013, 2009, 2006 Pearson Education, Inc. 1

Copyright © 2013, 2009, 2006 Pearson Education, Inc. 2Copyright © 2013, 2009, 2006 Pearson Education, Inc. 2
Objective #1 Use a graph to identify intercepts.

Copyright © 2013, 2009, 2006 Pearson Education, Inc. 3
Linear Functions
All equations of the form Ax + By = C are straight lines when graphed, as long as A and B are not both zero.
Such an equation is called the standard form of the equation of the line.
To graph equations of this form, two very important points are used – the intercepts.

Copyright © 2013, 2009, 2006 Pearson Education, Inc. 4
An x-intercept of a graph is the x-coordinate of a point where the graph intersects the x-axis. The y-coordinate of the x-intercept is always zero.
The graph of y = 4x – 8 crosses the x-axis at (2, 0) and that point is the x-intercept.
x-intercept
Copyright © 2013, 2009, 2006 Pearson Education, Inc. 5
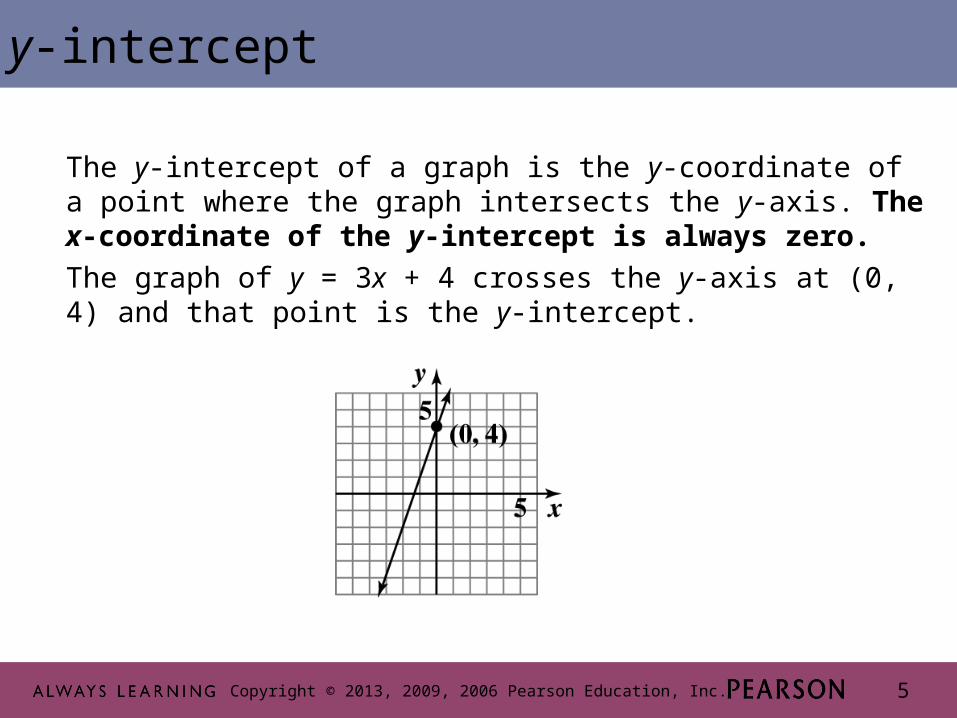
The y-intercept of a graph is the y-coordinate of a point where the graph intersects the y-axis. The x-coordinate of the y-intercept is always zero.
The graph of y = 3x + 4 crosses the y-axis at (0, 4) and that point is the y-intercept.
y-intercept

Copyright © 2013, 2009, 2006 Pearson Education, Inc. 6Copyright © 2013, 2009, 2006 Pearson Education, Inc. 6
Objective #1: Examples
1a. Identify the x- and y- intercepts:
The graph crosses the x-axis at (–3,0). Thus, the x-intercept is –3. The graph crosses the y-axis at (0,5). Thus, the y-intercept is 5.

Copyright © 2013, 2009, 2006 Pearson Education, Inc. 7Copyright © 2013, 2009, 2006 Pearson Education, Inc. 7
Objective #1: Examples
1a. Identify the x- and y- intercepts:
The graph crosses the x-axis at (–3,0). Thus, the x-intercept is –3. The graph crosses the y-axis at (0,5). Thus, the y-intercept is 5.

Copyright © 2013, 2009, 2006 Pearson Education, Inc. 8Copyright © 2013, 2009, 2006 Pearson Education, Inc. 8
Objective #1: Examples
1b. Identify the x- and y- intercepts:
The graph crosses the x-axis at (0,0). Thus, the x-intercept is 0. The graph crosses the y-axis at (0,0). Thus, the y-intercept is 0.

Copyright © 2013, 2009, 2006 Pearson Education, Inc. 9Copyright © 2013, 2009, 2006 Pearson Education, Inc. 9
Objective #1: Examples
1b. Identify the x- and y- intercepts:
The graph crosses the x-axis at (0,0). Thus, the x-intercept is 0. The graph crosses the y-axis at (0,0). Thus, the y-intercept is 0.

Copyright © 2013, 2009, 2006 Pearson Education, Inc. 10Copyright © 2013, 2009, 2006 Pearson Education, Inc. 10
Objective #2 Graph a linear equation in two variables
using intercepts.
Copyright © 2013, 2009, 2006 Pearson Education, Inc. 11
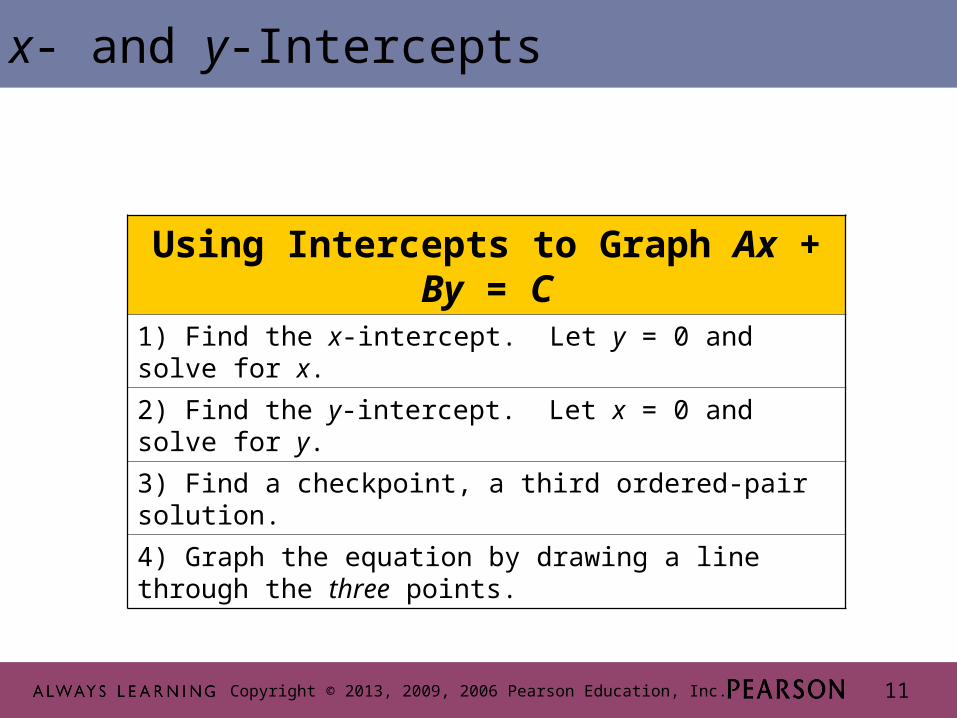
x- and y-Intercepts
Using Intercepts to Graph Ax + By = C1) Find the x-intercept. Let y = 0 and solve for x.
2) Find the y-intercept. Let x = 0 and solve for y.
3) Find a checkpoint, a third ordered-pair solution.
4) Graph the equation by drawing a line through the three points.
Copyright © 2013, 2009, 2006 Pearson Education, Inc. 12
Graphing Using Intercepts
EXAMPLEEXAMPLE
SOLUTIONSOLUTION
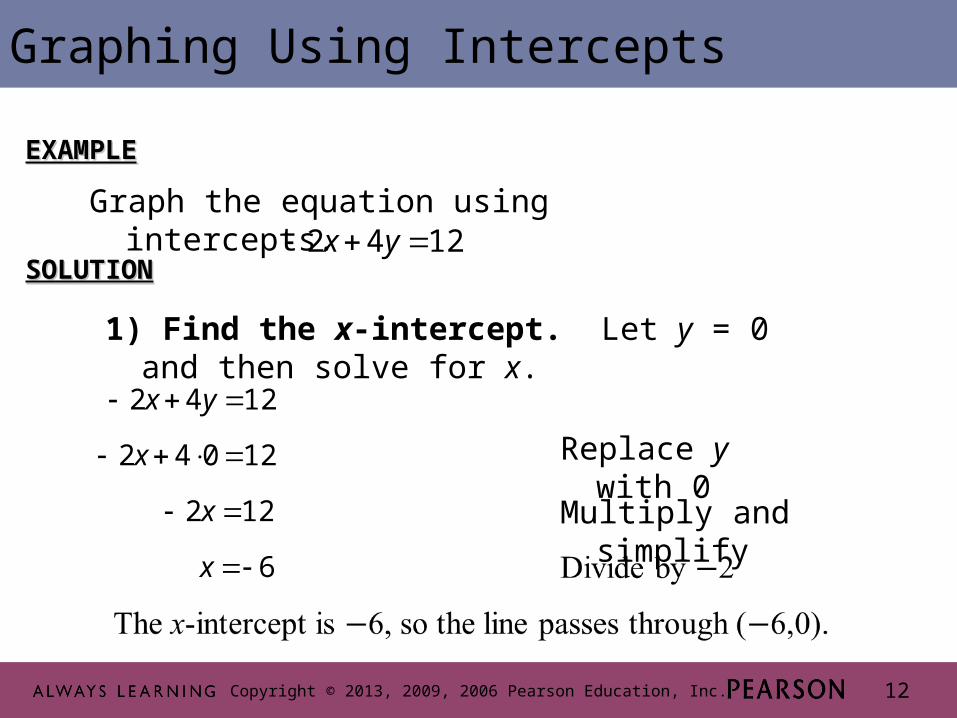
Graph the equation using intercepts.
1242 yx
1) Find the x-intercept. Let y = 0 and then solve for x.
1242 yx
12042 x
122 x
6x
Replace y with 0
Multiply and simplify

Copyright © 2013, 2009, 2006 Pearson Education, Inc. 13
Graphing Using Intercepts
1242 yx
2) Find the y-intercept. Let x = 0 and then solve for y.
12402 y
124 y
3y
Replace x with 0
Multiply and simplify
Divide by 4
CONTINUEDCONTINUED
The y-intercept is 3, so the line passes through (0,3).

Copyright © 2013, 2009, 2006 Pearson Education, Inc. 14
Graphing Using Intercepts
3) Find a checkpoint, a third ordered-pair solution. For our checkpoint, we will let x = 1 (because x = 1 is not the x-intercept) and find the corresponding value for y.
12412 y
1242 y
144 y
Replace x with 1
Multiply
Add 2 to both sides
CONTINUEDCONTINUED
The checkpoint is the ordered pair (1, 3.5).
1242 yx
5.32
7
4
14y Divide by 4 and simplify
Copyright © 2013, 2009, 2006 Pearson Education, Inc. 15
Graphing Using Intercepts
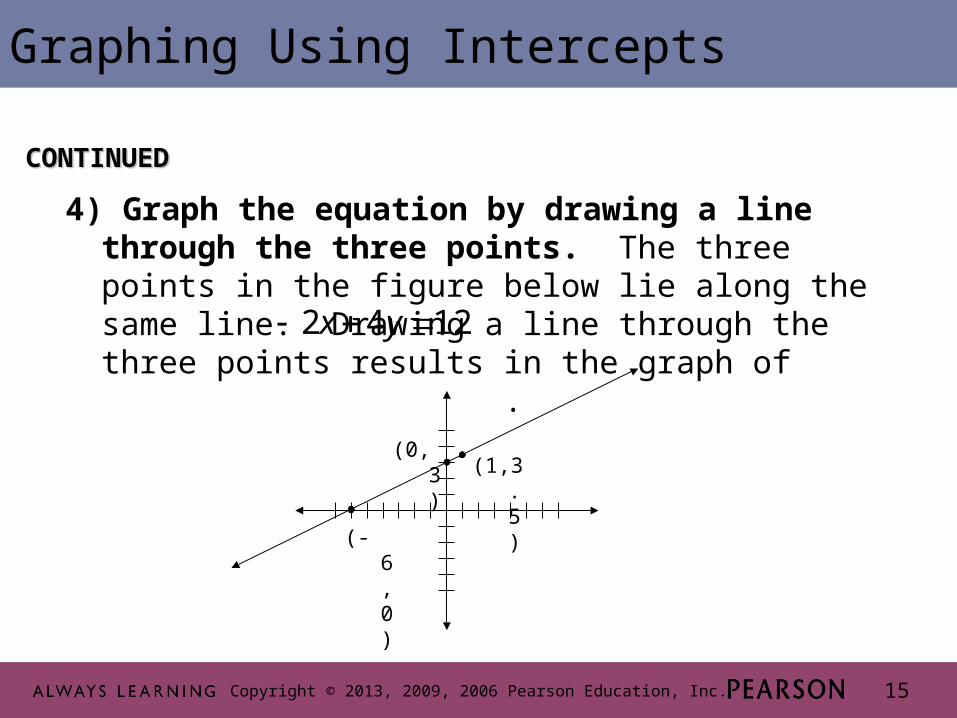
4) Graph the equation by drawing a line through the three points. The three points in the figure below lie along the same line. Drawing a line through the three points results in the graph of .
CONTINUEDCONTINUED
1242 yx
(1,3.5)
(-6,0)
(0,3)

Copyright © 2013, 2009, 2006 Pearson Education, Inc. 16
Example Use intercepts for graphing 3x + 4y = 121. Find the x-intercept. Let y = 0 and solve for x.
3x + 4(0) = 123x = 12 x = 4The x-intercept is 4. The line passes through (4, 0).
2. Find the y-intercept. Let x = 0 and solve for y. 3(0) + 4y = 124y = 12 y = 3The y-intercept is 3. The line passes through (0, 3).
Graphing Using Intercepts

Copyright © 2013, 2009, 2006 Pearson Education, Inc. 17
Example Graph 3x + 4y = 12.
3. Find a checkpoint, a third ordered-pair solution. Let x = 2
3(2) + 4y = 12
6 + 4y = 12
4y = 6
y = 6/4 = 1.5
A checkpoint is the ordered pair (2, 1.5)
Graphing Using Intercepts
CONTINUEDCONTINUED

Copyright © 2013, 2009, 2006 Pearson Education, Inc. 18
Example : Graph 3x + 4y = 12.
4. Graph the equation by drawing a line through the intercepts and checkpoint.
Graphing Using InterceptsCONTINUEDCONTINUED

Copyright © 2013, 2009, 2006 Pearson Education, Inc. 19Copyright © 2013, 2009, 2006 Pearson Education, Inc. 19
Objective #2: Examples
2a. Find the x-intercept of the graph of 4 3 12x y .
To find the x-intercept, let y = 0 and solve for x. 4 3 12
4 3(0) 12
4 12
3
x y
x
x
x
The x-intercept is 3.

Copyright © 2013, 2009, 2006 Pearson Education, Inc. 20Copyright © 2013, 2009, 2006 Pearson Education, Inc. 20
Objective #2: Examples
2a. Find the x-intercept of the graph of 4 3 12x y .
To find the x-intercept, let y = 0 and solve for x. 4 3 12
4 3(0) 12
4 12
3
x y
x
x
x
The x-intercept is 3.

Copyright © 2013, 2009, 2006 Pearson Education, Inc. 21Copyright © 2013, 2009, 2006 Pearson Education, Inc. 21
Objective #2: Examples
2b. Find the y-intercept of the graph of 4 3 12x y .
To find the y-intercept, let x = 0 and solve for y. 4 3 12
4(0) 3 12
3 12
4
x y
y
y
y
The y-intercept is –4.

Copyright © 2013, 2009, 2006 Pearson Education, Inc. 22Copyright © 2013, 2009, 2006 Pearson Education, Inc. 22
Objective #2: Examples
2b. Find the y-intercept of the graph of 4 3 12x y .
To find the y-intercept, let x = 0 and solve for y. 4 3 12
4(0) 3 12
3 12
4
x y
y
y
y
The y-intercept is –4.

Copyright © 2013, 2009, 2006 Pearson Education, Inc. 23Copyright © 2013, 2009, 2006 Pearson Education, Inc. 23
Objective #2: Examples
2c. Use intercepts to graph 2 3 6.x y
Find the x-intercept. Let y = 0 and solve for x. 2 3 6
2 3(0) 6
2 6
3
x y
x
x
x
The x-intercept is 3.
Find the y-intercept. Let x = 0 and solve for y. 2 3 6
2(0) 3 6
3 6
2
x y
y
y
y
The y-intercept is 2.

Copyright © 2013, 2009, 2006 Pearson Education, Inc. 24Copyright © 2013, 2009, 2006 Pearson Education, Inc. 24
Objective #2: Examples
2c. Use intercepts to graph 2 3 6.x y
Find the x-intercept. Let y = 0 and solve for x. 2 3 6
2 3(0) 6
2 6
3
x y
x
x
x
The x-intercept is 3.
Find the y-intercept. Let x = 0 and solve for y. 2 3 6
2(0) 3 6
3 6
2
x y
y
y
y
The y-intercept is 2.
Copyright © 2013, 2009, 2006 Pearson Education, Inc. 25Copyright © 2013, 2009, 2006 Pearson Education, Inc. 25
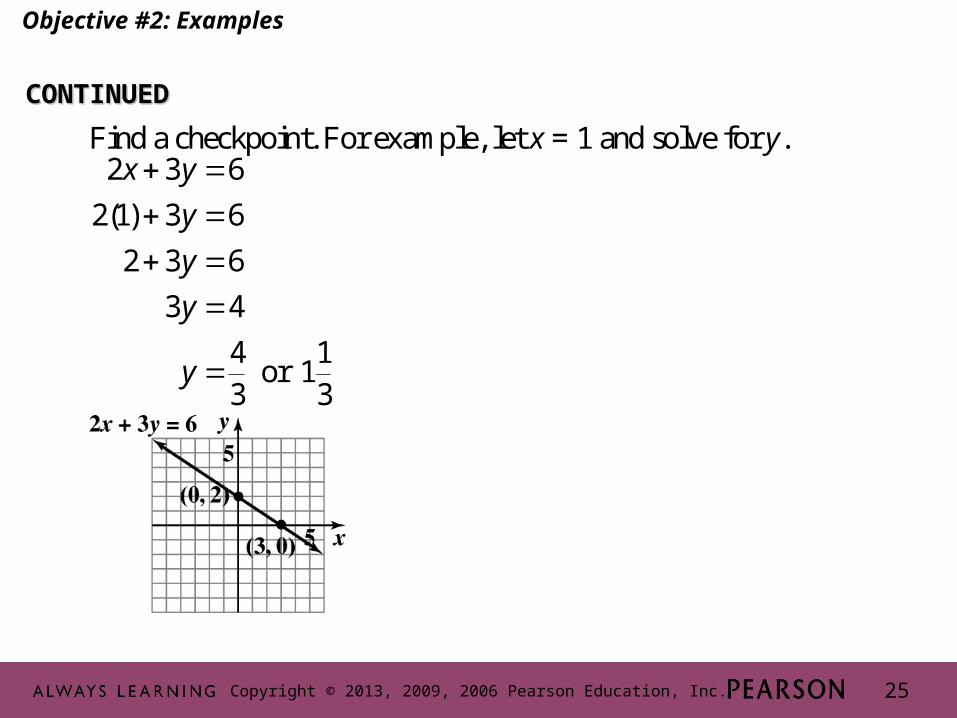
Find a checkpoint. For example, let x = 1 and solve for y. 2 3 6
2(1) 3 6
2 3 6
3 4
4 1or 1
3 3
x y
y
y
y
y
Objective #2: Examples
CONTINUEDCONTINUED

Copyright © 2013, 2009, 2006 Pearson Education, Inc. 26Copyright © 2013, 2009, 2006 Pearson Education, Inc. 26
Objective #2: Examples
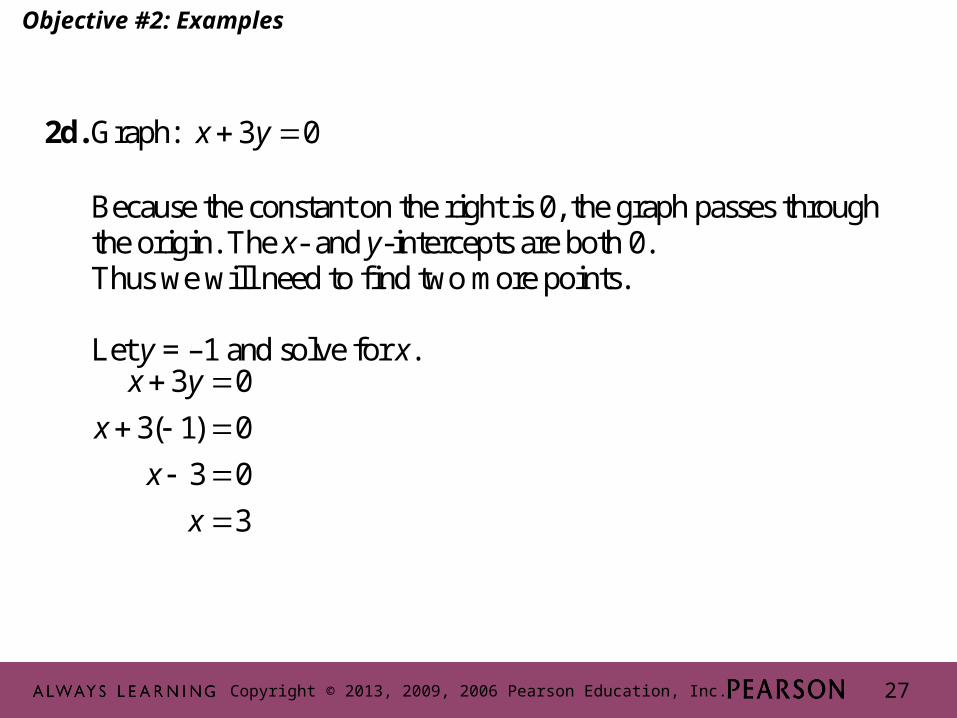
2d. Graph: 3 0x y
Because the constant on the right is 0, the graph passes through the origin. The x- and y-intercepts are both 0. Thus we will need to find two more points. Let y = –1 and solve for x.
3 0
3( 1) 0
3 0
3
x y
x
x
x
Copyright © 2013, 2009, 2006 Pearson Education, Inc. 27Copyright © 2013, 2009, 2006 Pearson Education, Inc. 27
Objective #2: Examples
2d. Graph: 3 0x y
Because the constant on the right is 0, the graph passes through the origin. The x- and y-intercepts are both 0. Thus we will need to find two more points. Let y = –1 and solve for x.
3 0
3( 1) 0
3 0
3
x y
x
x
x

Copyright © 2013, 2009, 2006 Pearson Education, Inc. 28Copyright © 2013, 2009, 2006 Pearson Education, Inc. 28
Objective #2: Examples
Let y = 1 and solve for x. 3 0
3(1) 0
3 0
3
x y
x
x
x
Use these three solutions of (0,0), (3,–1), and (–3,1).
CONTINUEDCONTINUED

Copyright © 2013, 2009, 2006 Pearson Education, Inc. 29Copyright © 2013, 2009, 2006 Pearson Education, Inc. 29
Objective #3 Graph horizontal or vertical lines.

Copyright © 2013, 2009, 2006 Pearson Education, Inc. 30
Horizontal and Vertical Lines
Horizontal and Vertical LinesEquation of a Horizontal Line
(0,b)
A horizontal line is given by an equation of the form y = b where b is the y-
intercept.
Equation of a Vertical Line
(a,0)A vertical line is given by an equation of the form x = a where a is the x-intercept.

Copyright © 2013, 2009, 2006 Pearson Education, Inc. 31
Horizontal and Vertical Lines
EXAMPLEEXAMPLE
SOLUTIONSOLUTION
x y = -4 (x,y)
-3 -4 (-3,-4)
1 -4 (1,-4)
6 -4 (6,-4)
Upon plotting the three resultant points and connecting the points with a line, the graph to the right is the solution.
(1,-4)
(-3,-4) (6,-4)
Copyright © 2013, 2009, 2006 Pearson Education, Inc. 32
Horizontal and Vertical Lines
EXAMPLEEXAMPLE
SOLUTIONSOLUTION
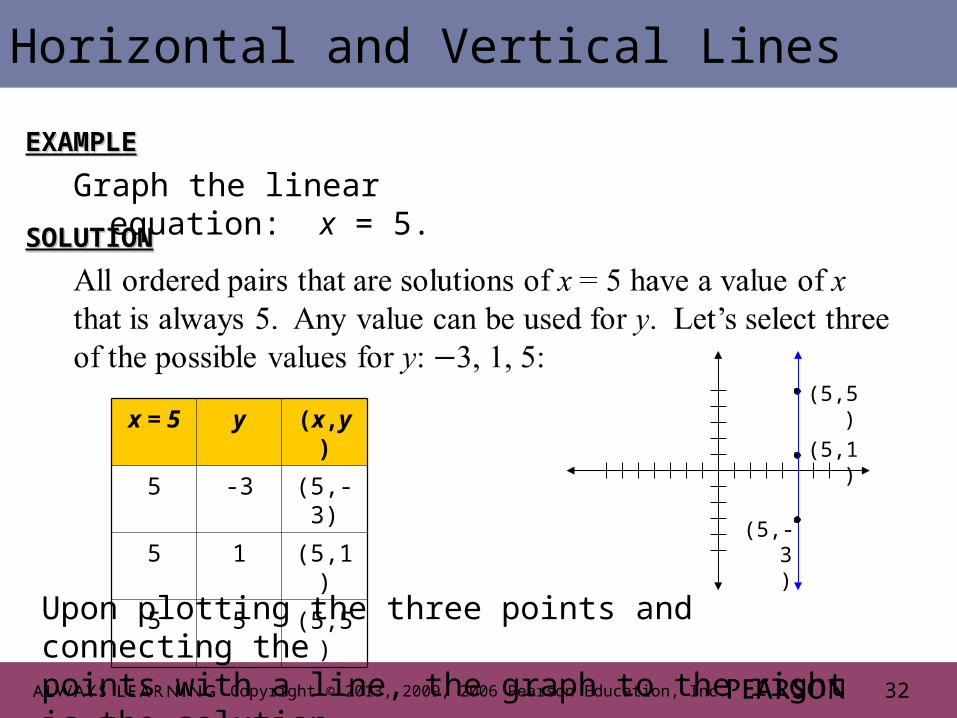
Graph the linear equation: x = 5.
x = 5 y (x,y)
5 -3 (5,-3)
5 1 (5,1)
5 5 (5,5)
Upon plotting the three points and connecting the points with a line, the graph to the right is the solution.
(5,1)
(5,-3)
(5,5)

Copyright © 2013, 2009, 2006 Pearson Education, Inc. 33Copyright © 2013, 2009, 2006 Pearson Education, Inc. 33
Objective #3: Examples
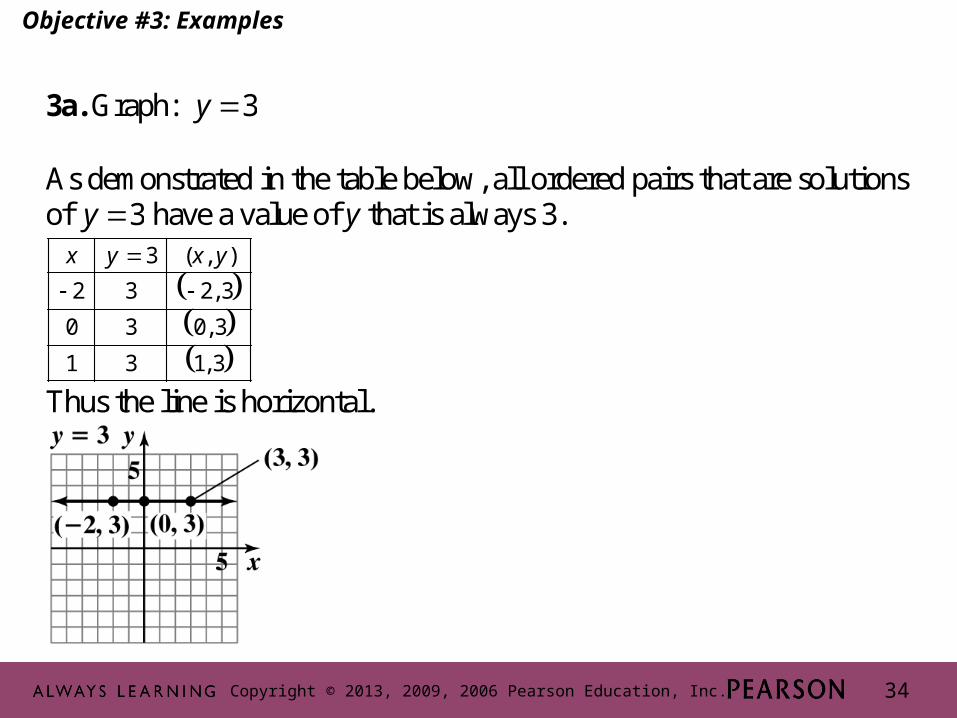
3a. Graph: 3y As demonstrated in the table below, all ordered pairs that are solutions of 3y have a value of y that is always 3.
3 ( , )
2 3 2, 3
0 3 0, 3
1 3 1, 3
x y x y
Thus the line is horizontal.
Copyright © 2013, 2009, 2006 Pearson Education, Inc. 34Copyright © 2013, 2009, 2006 Pearson Education, Inc. 34
Objective #3: Examples
3a. Graph: 3y As demonstrated in the table below, all ordered pairs that are solutions of 3y have a value of y that is always 3.
3 ( , )
2 3 2, 3
0 3 0, 3
1 3 1, 3
x y x y
Thus the line is horizontal.

Copyright © 2013, 2009, 2006 Pearson Education, Inc. 35Copyright © 2013, 2009, 2006 Pearson Education, Inc. 35
3b. Graph: 2x
As demonstrated in the table below, all ordered pairs that are solutions of 2x have a value of x that is always 2.
2 ( , )
2 3 2, 3
2 0 2, 0
2 2 2, 2
x y x y
Thus the line is vertical.
Objective #3: Examples

Copyright © 2013, 2009, 2006 Pearson Education, Inc. 36Copyright © 2013, 2009, 2006 Pearson Education, Inc. 36
3b. Graph: 2x
As demonstrated in the table below, all ordered pairs that are solutions of 2x have a value of x that is always 2.
2 ( , )
2 3 2, 3
2 0 2, 0
2 2 2, 2
x y x y
Thus the line is vertical.
Objective #3: Examples
Related Documents