Copyright 2004 ACNielsen ShopperTrends 1 March 2004 ShopperTrends 2004 ShopperTrends 2004 Romania Romania

Welcome message from author
This document is posted to help you gain knowledge. Please leave a comment to let me know what you think about it! Share it to your friends and learn new things together.
Transcript
Copyright 2004 ACNielsenShopperTrends
1
March 2004
ShopperTrends 2004ShopperTrends 2004
RomaniaRomania

Copyright 2004 ACNielsenShopperTrends
2
Research ObjectivesResearch Objectives
Copyright 2004 ACNielsenShopperTrends
3
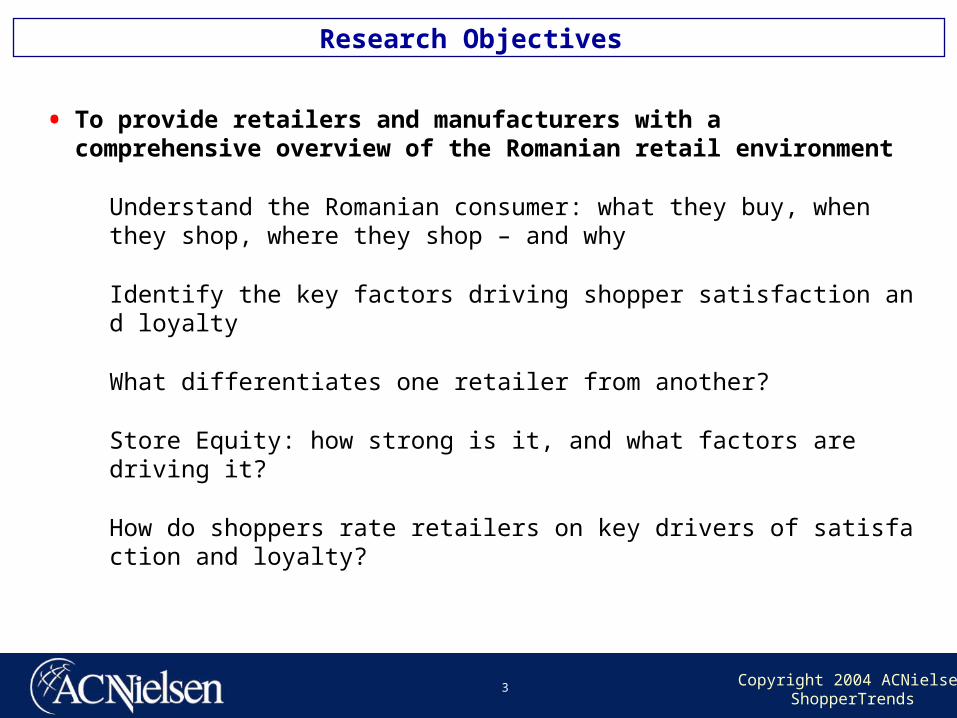
Research Objectives
• To provide retailers and manufacturers with a comprehensive overview of the Romanian retail environment
Understand the Romanian consumer: what they buy, when they shop, where they shop – and why
Identify the key factors driving shopper satisfaction and loyalty
What differentiates one retailer from another?
Store Equity: how strong is it, and what factors are driving it?
How do shoppers rate retailers on key drivers of satisfaction and loyalty?
Copyright 2004 ACNielsenShopperTrends
4
Research DesignResearch Design
Copyright 2004 ACNielsenShopperTrends
5
•
Coverage of the capital Bucharest, Romania
Face-to-face, in-home interviews using random household selection
Sample size n=500, with the following split:
n= 342 Main household buyers
n= 158 Key Influencers
Booster sample of n=60 to ensure minimum bases of n=100 for specific retailers
Fieldwork: Nov-Dec 2003
Utilised ACNielsen Winning Brands brand equity model
Research Methodology
Copyright 2004 ACNielsenShopperTrends
6
Economic Status Economic Status & Outlook& Outlook
Copyright 2004 ACNielsenShopperTrends
7
• Last 10 years have been a roller-coaster ride, but economy is now in better shape than ever. Growth is strong and possibly sustainable.
• Excellent results from food and beverage, FMCGs, consumer durables and IT.
• 80% of multi-national corporation country managers are cautiously optimistic, double the level of two years ago.
• Romania is taking one of the priority seats for business development for most clients (as growth slowed in the core CEE countries).
• Purchasing power is still low – average take-home pay is €100. But domestic demand boosted by FDI.
Business performance
Source: EIU
Copyright 2004 ACNielsenShopperTrends
8
• Continued pressure on profit margins.
• Companies now upgrading presence: spending more on advertising and brand-building, expanding out of Bucharest, expanding distribution.
• Competition will tighten in the next two years as more companies continue to invest in business development in Romania and as hypermarkets/supermarkets continue their expansion. Most major players will be on the market within a year.
Business outlook
Source: EIU
Copyright 2004 ACNielsenShopperTrends
9
Grocery Market Grocery Market PerformancePerformance
Copyright 2004 ACNielsenShopperTrends
10
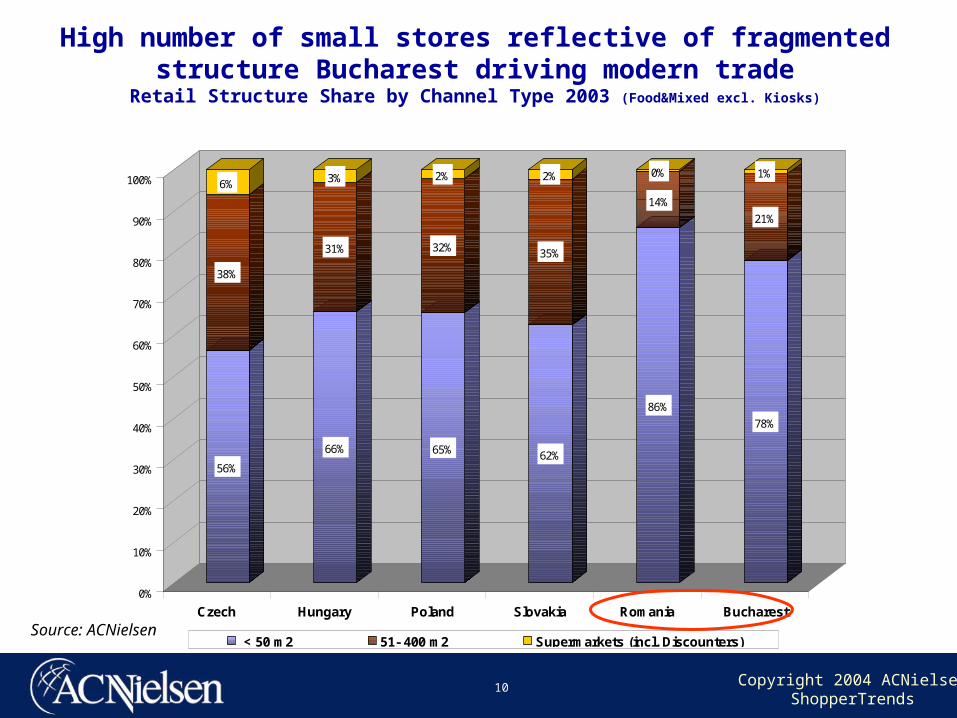
High number of small stores reflective of fragmented structure Bucharest driving modern trade
Retail Structure Share by Channel Type 2003 (Food&Mixed excl. Kiosks)
56%
38%
6%
66%
31%
3%
65%
32%
2%
62%
35%
2%
86%
14%
0%
78%
21%
1%
0%
10%
20%
30%
40%
50%
60%
70%
80%
90%
100%
Czech Hungary Poland Slovakia Romania Bucharest
< 50 m2 51- 400 m2 Supermarkets (incl. Discounters)Source: ACNielsen
Copyright 2004 ACNielsenShopperTrends
11
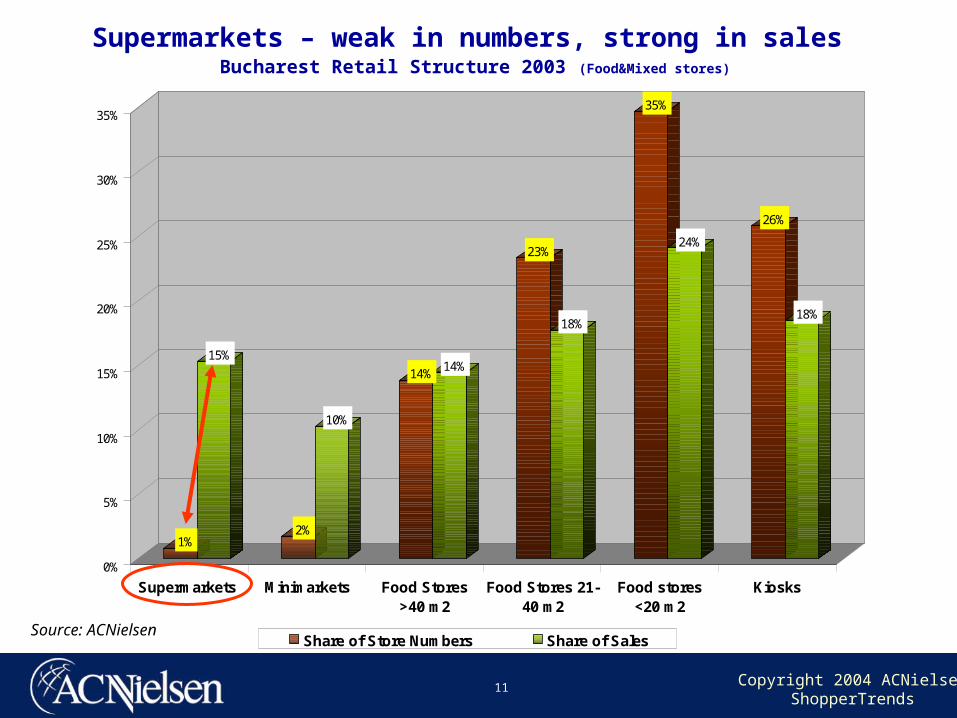
1%
15%
2%
10%
14%14%
23%
18%
35%
24%
26%
18%
0%
5%
10%
15%
20%
25%
30%
35%
Supermarkets Minimarkets Food Stores>40 m2
Food Stores 21-40 m2
Food stores<20 m2
Kiosks
Share of Store Numbers Share of Sales
Supermarkets – weak in numbers, strong in sales Bucharest Retail Structure 2003 (Food&Mixed stores)
Source: ACNielsen
Copyright 2004 ACNielsenShopperTrends
12
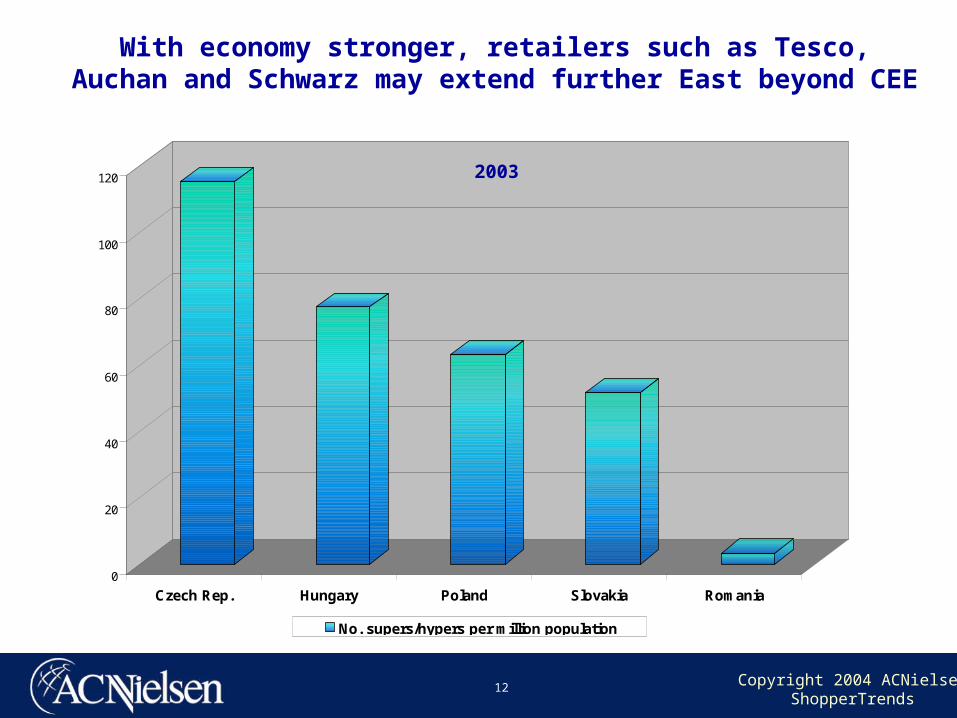
0
20
40
60
80
100
120
Czech Rep. Hungary Poland Slovakia Romania
No. supers/hypers per million population
With economy stronger, retailers such as Tesco, Auchan and Schwarz may extend further East beyond CEE
2003
Copyright 2004 ACNielsenShopperTrends
13
Source: ACNielsen
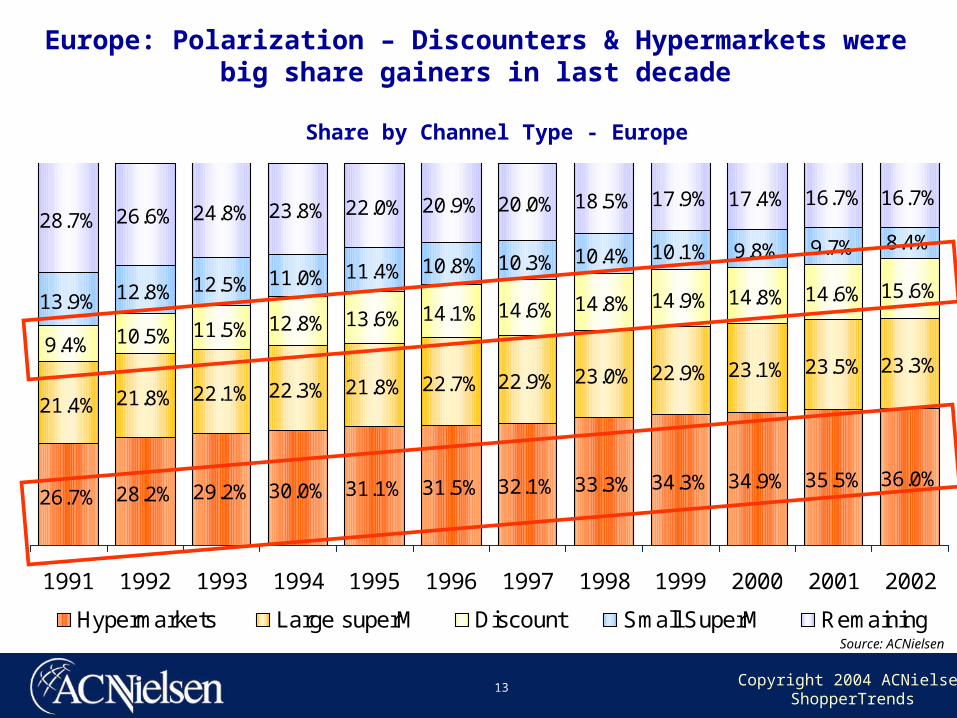
26.7% 28.2% 29.2% 30.0% 31.1% 31.5% 32.1% 33.3% 34.3% 34.9% 35.5% 36.0%
21.4% 21.8% 22.1% 22.3% 21.8% 22.7% 22.9% 23.0% 22.9% 23.1% 23.5% 23.3%9.4% 10.5% 11.5% 12.8% 13.6% 14.1% 14.6% 14.8% 14.9% 14.8% 14.6% 15.6%13.9% 12.8% 12.5% 11.0% 11.4% 10.8% 10.3% 10.4% 10.1% 9.8% 9.7% 8.4%28.7% 26.6% 24.8% 23.8% 22.0% 20.9% 20.0% 18.5% 17.9% 17.4% 16.7% 16.7%
1991 1992 1993 1994 1995 1996 1997 1998 1999 2000 2001 2002
Hypermarkets Large superM Discount Small SuperM Remaining
Europe: Polarization – Discounters & Hypermarkets were big share gainers in last decade
Share by Channel Type - Europe
Copyright 2004 ACNielsenShopperTrends
14
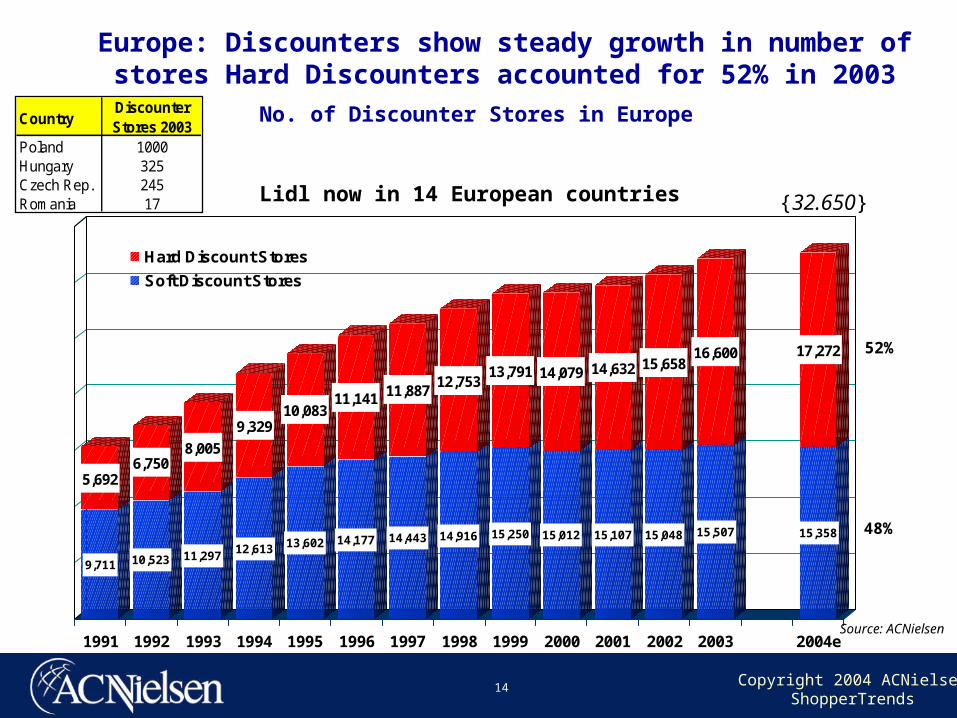
9,711
5,692
10,523
6,750
11,297
8,005
12,613
9,329
13,602
10,083
14,177
11,141
14,443
11,887
14,916
12,753
15,250
13,791
15,012
14,079
15,107
14,632
15,048
15,658
15,507
16,600
15,358
17,272
1991 1992 1993 1994 1995 1996 1997 1998 1999 2000 2001 2002 2003 2004e
Hard Discount Stores
Soft Discount Stores
Europe: Discounters show steady growth in number of stores Hard Discounters accounted for 52% in 2003
No. of Discounter Stores in Europe
Source: ACNielsen
{32.650}
52%
48%
CountryDiscounter Stores 2003
Poland 1000Hungary 325Czech Rep. 245Romania 17 Lidl now in 14 European countries
Copyright 2004 ACNielsenShopperTrends
15
ACNielsen I ACNielsen I ShopperTrendsShopperTrends
DETAILED FINDINGSDETAILED FINDINGS
Copyright 2004 ACNielsenShopperTrends
16
Shopper ProfileShopper Profile
Copyright 2004 ACNielsenShopperTrends
17
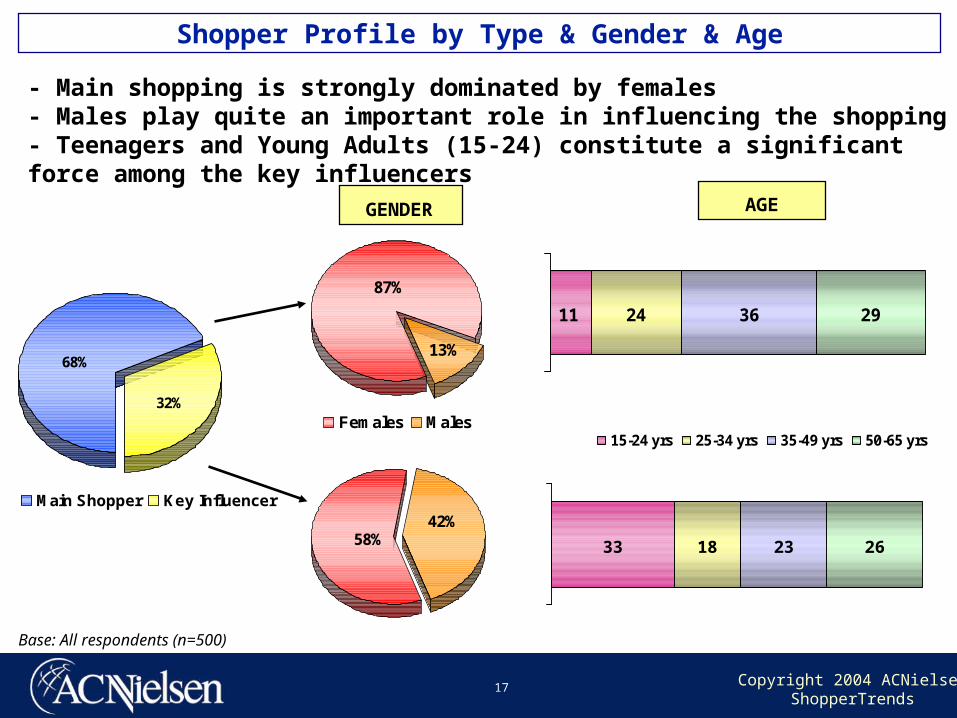
33 18 23 26
32%
68%
Main Shopper Key Influencer
13%
87%
Females Males
Shopper Profile by Type & Gender & Age
Base: All respondents (n=500)
GENDER AGE
24 36 2911
15-24 yrs 25-34 yrs 35-49 yrs 50-65 yrs
58%42%
- Main shopping is strongly dominated by females- Males play quite an important role in influencing the shopping- Teenagers and Young Adults (15-24) constitute a significant force among the key influencers
Copyright 2004 ACNielsenShopperTrends
18
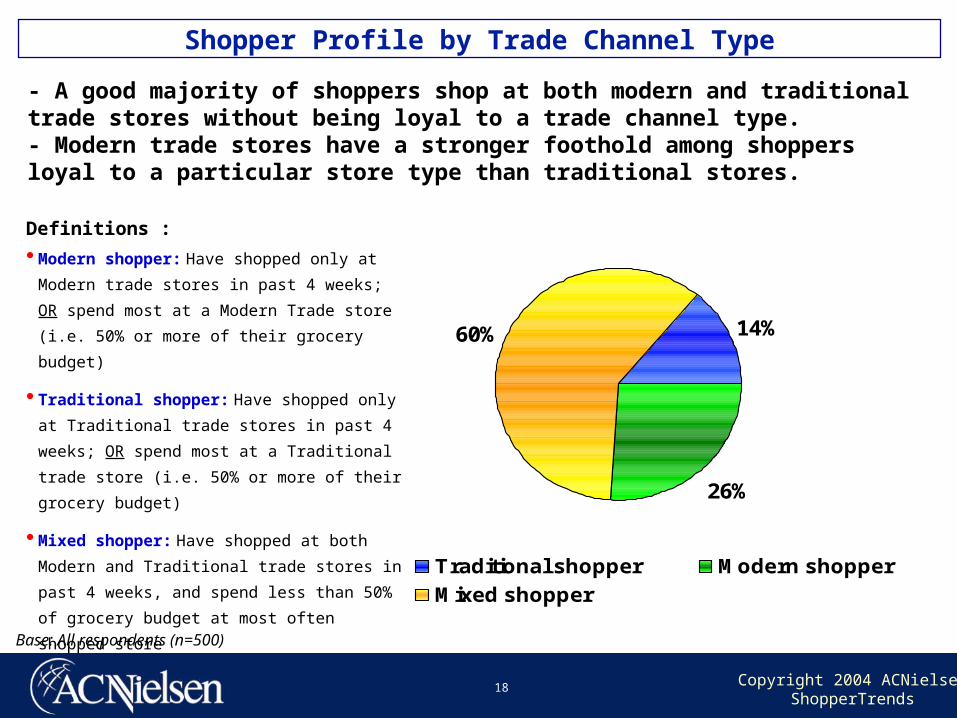
14%
26%
60%
Traditional shopper Modern shopper
Mixed shopper
Base: All respondents (n=500)
Shopper Profile by Trade Channel Type
- A good majority of shoppers shop at both modern and traditional trade stores without being loyal to a trade channel type.- Modern trade stores have a stronger foothold among shoppers loyal to a particular store type than traditional stores.
Definitions :
Modern shopper: Have shopped only at Modern
trade stores in past 4 weeks; OR spend most at a
Modern Trade store (i.e. 50% or more of their
grocery budget)
Traditional shopper: Have shopped only at
Traditional trade stores in past 4 weeks; OR spend
most at a Traditional trade store (i.e. 50% or more
of their grocery budget)
Mixed shopper: Have shopped at both Modern
and Traditional trade stores in past 4 weeks, and
spend less than 50% of grocery budget at most
often shopped store
Copyright 2004 ACNielsenShopperTrends
19
Trade Sector OverviewTrade Sector Overview
Copyright 2004 ACNielsenShopperTrends
20
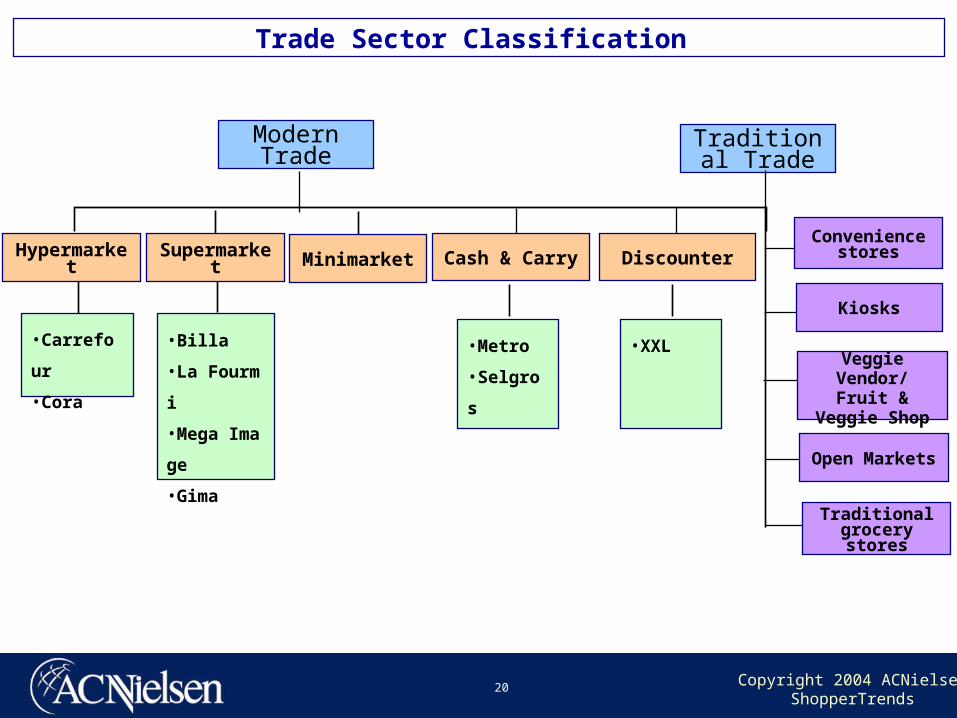
Trade Sector Classification
Kiosks
Hypermarket
•Carrefour
•Cora
•Billa
•La Fourmi
•Mega Imag
e
•Gima
•Metro
•Selgros
Supermarket
Veggie Vendor/Fruit & Veggie
Shop
Open Markets
Convenience storesCash & Carry
Traditional grocery stores
Modern Trade
Traditional Trade
•XXL
DiscounterMinimarket
Copyright 2004 ACNielsenShopperTrends
21
Trade Sector RelationshipsTrade Sector Relationships
Modern Trade & Traditional Trade
Copyright 2004 ACNielsenShopperTrends
22
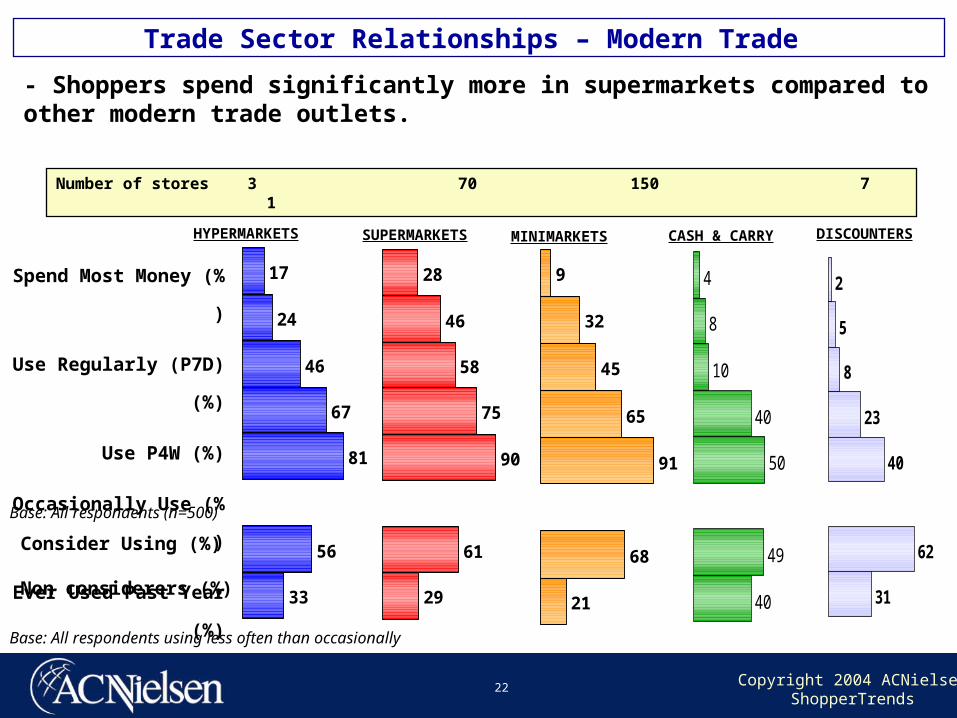
Trade Sector Relationships – Modern Trade
- Shoppers spend significantly more in supermarkets compared to other modern trade outlets.
HYPERMARKETS SUPERMARKETS MINIMARKETS
9
32
45
65
91
68
21
28
46
58
75
90
61
29
17
24
46
67
81
56
33
Base: All respondents (n=500)
Spend Most Money (%)
Use Regularly (P7D) (%)
Use P4W (%)
Occasionally Use (%)
Ever Used Past Year (%
)
Consider Using (%)
Non considerers (%)
Base: All respondents using less often than occasionally
CASH & CARRY
4
8
10
40
50
49
40
2
5
8
23
40
62
31
DISCOUNTERS
Number of stores 3 70 150 7 1
Copyright 2004 ACNielsenShopperTrends
23
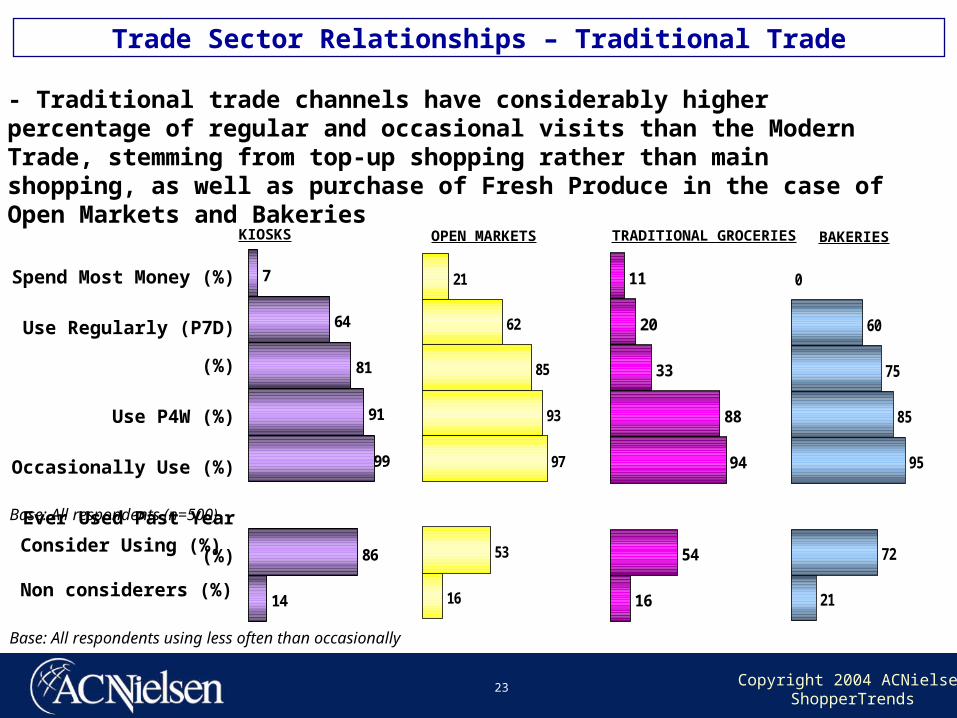
Trade Sector Relationships – Traditional Trade
- Traditional trade channels have considerably higher percentage of regular and occasional visits than the Modern Trade, stemming from top-up shopping rather than main shopping, as well as purchase of Fresh Produce in the case of Open Markets and Bakeries
11
20
33
88
94
54
16
21
62
85
93
97
53
16
7
64
81
91
99
86
14
0
60
75
85
95
72
21
KIOSKS TRADITIONAL GROCERIES
OPEN MARKETS BAKERIES
Base: All respondents (n=500)
Spend Most Money (%)
Use Regularly (P7D) (%)
Use P4W (%)
Occasionally Use (%)
Ever Used Past Year (%)
Consider Using (%)
Non considerers (%)
Base: All respondents using less often than occasionally
Copyright 2004 ACNielsenShopperTrends
24
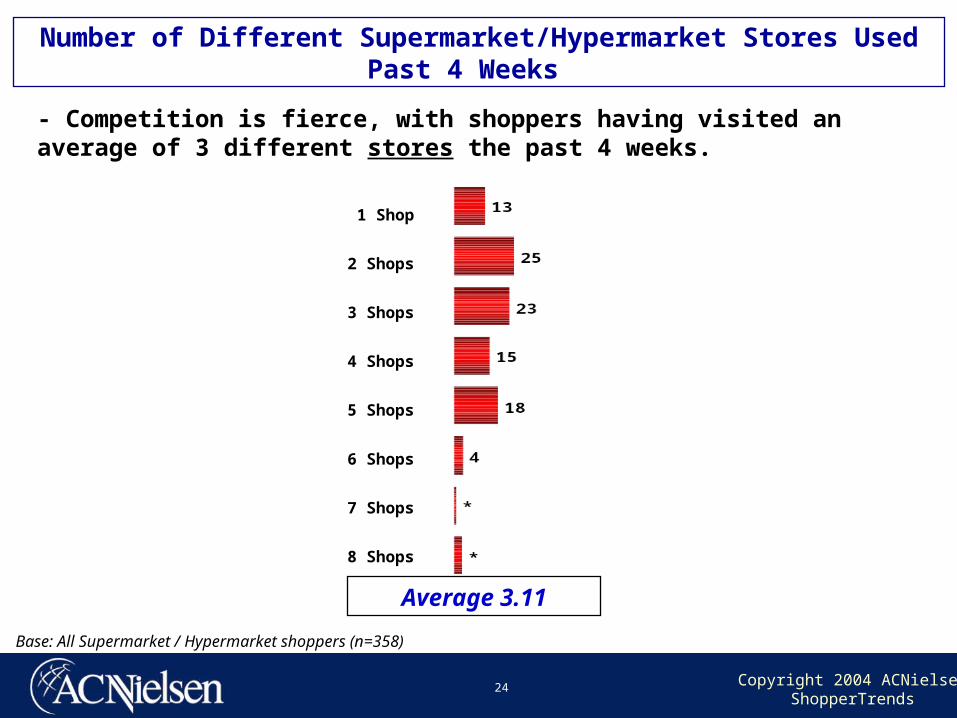
Base: All Supermarket / Hypermarket shoppers (n=358)
1 Shop
2 Shops
3 Shops
4 Shops
5 Shops
6 Shops
7 Shops
8 Shops
Average 3.11
Number of Different Supermarket/Hypermarket Stores Used Past 4 Weeks
- Competition is fierce, with shoppers having visited an average of 3 different stores the past 4 weeks.
Copyright 2004 ACNielsenShopperTrends
25
Key Product Category Key Product Category PurchasesPurchases
Copyright 2004 ACNielsenShopperTrends
26
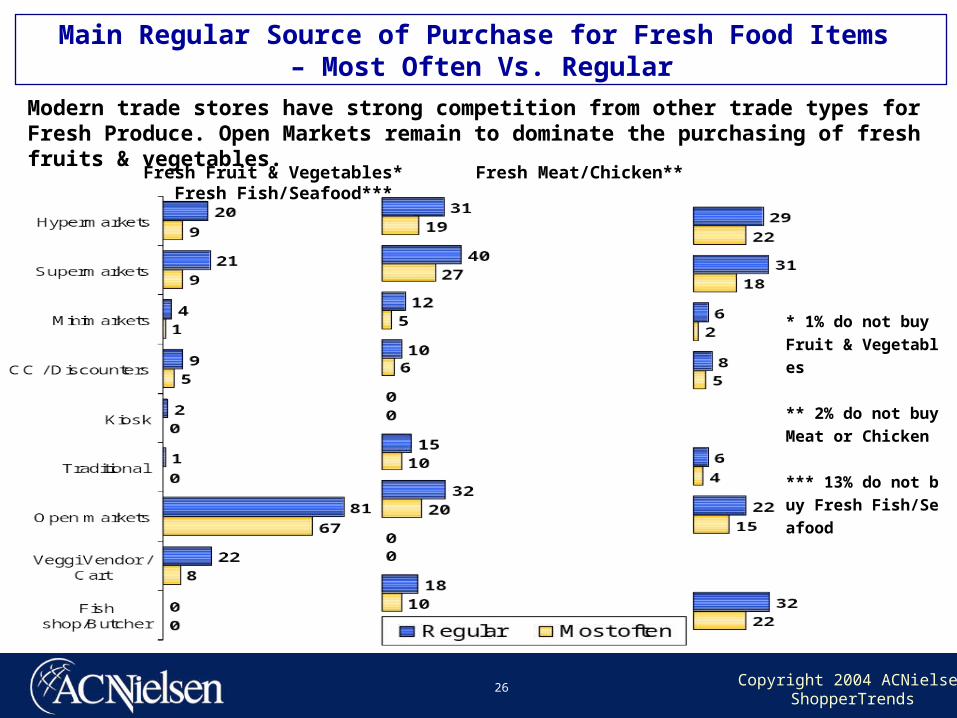
Fresh Fruit & Vegetables* Fresh Meat/Chicken** Fresh Fish/Seafood***
Main Regular Source of Purchase for Fresh Food Items – Most Often Vs. Regular
Modern trade stores have strong competition from other trade types for Fresh Produce. Open Markets remain to dominate the purchasing of fresh fruits & vegetables.
* 1% do not buy Frui
t & Vegetables
** 2% do not buy Me
at or Chicken
*** 13% do not buy
Fresh Fish/Seafood
Copyright 2004 ACNielsenShopperTrends
27
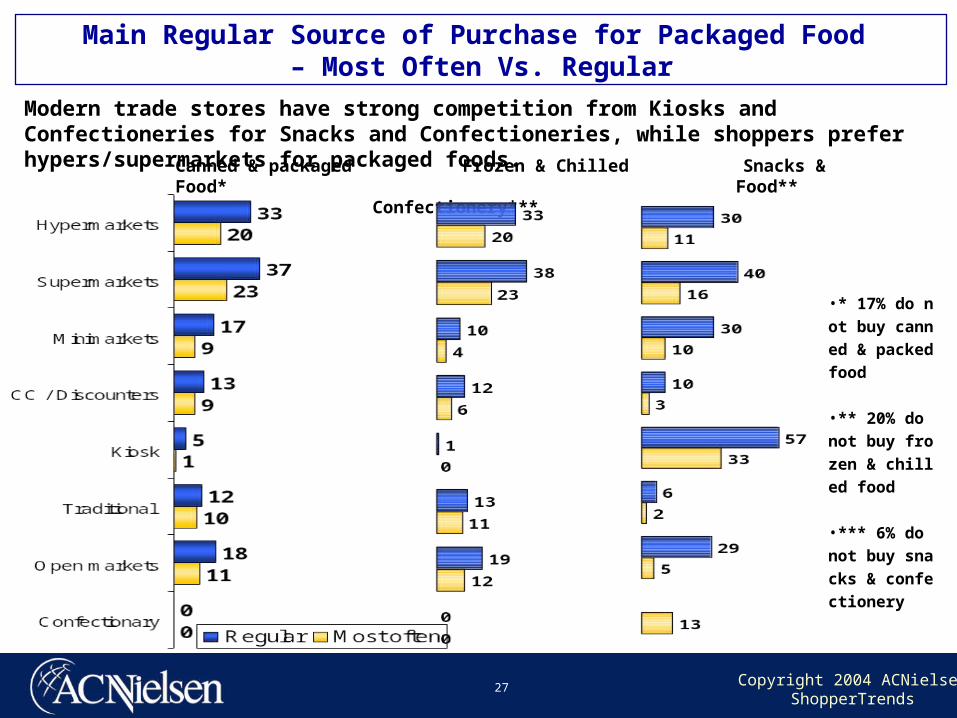
Canned & packaged Frozen & Chilled Snacks &Food* Food** Confectionery***
Main Regular Source of Purchase for Packaged Food – Most Often Vs. Regular
Modern trade stores have strong competition from Kiosks and Confectioneries for Snacks and Confectioneries, while shoppers prefer hypers/supermarkets for packaged foods.
•* 17% do not
buy canned &
packed food
•** 20% do not
buy frozen &
chilled food
•*** 6% do not
buy snacks &
confectionery
Copyright 2004 ACNielsenShopperTrends
28
Winning B®ands™Winning B®ands™Equity ModelEquity Model
What is Store Equity Index
Store Relationship with Customers
Store Equity Indices for Hypermarkets/ s
upermarkets
Copyright 2004 ACNielsenShopperTrends
29
What is Store Equity IndexWhat is Store Equity Index
Copyright 2004 ACNielsenShopperTrends
30
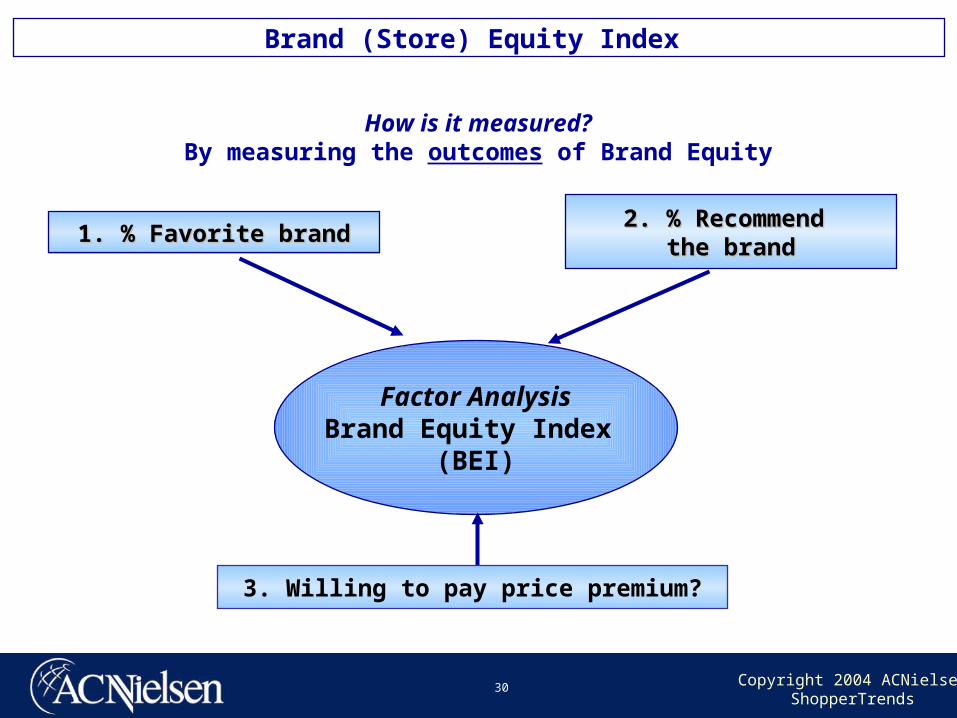
How is it measured?By measuring the outcomes of Brand Equity
Factor AnalysisBrand Equity Index
(BEI)
3. Willing to pay price premium?
1. % Favorite brand1. % Favorite brand2. % Recommend 2. % Recommend
the brandthe brand
Brand (Store) Equity Index
Copyright 2004 ACNielsenShopperTrends
31
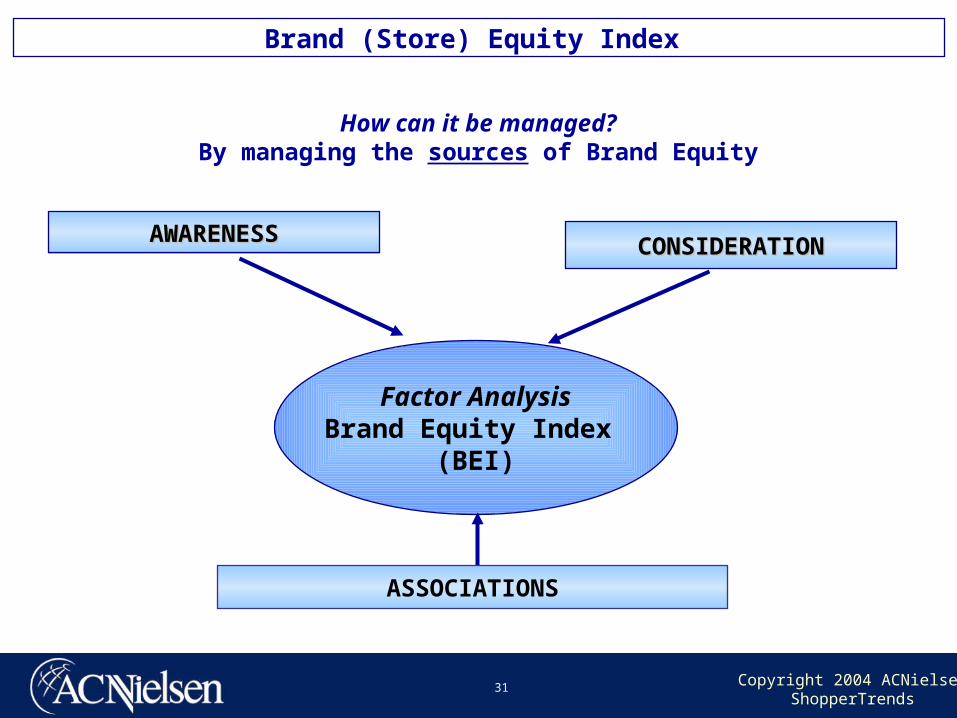
Factor AnalysisBrand Equity Index
(BEI)
ASSOCIATIONS
AWARENESSAWARENESSCONSIDERATIONCONSIDERATION
Brand (Store) Equity Index
How can it be managed?By managing the sources of Brand Equity
Copyright 2004 ACNielsenShopperTrends
32
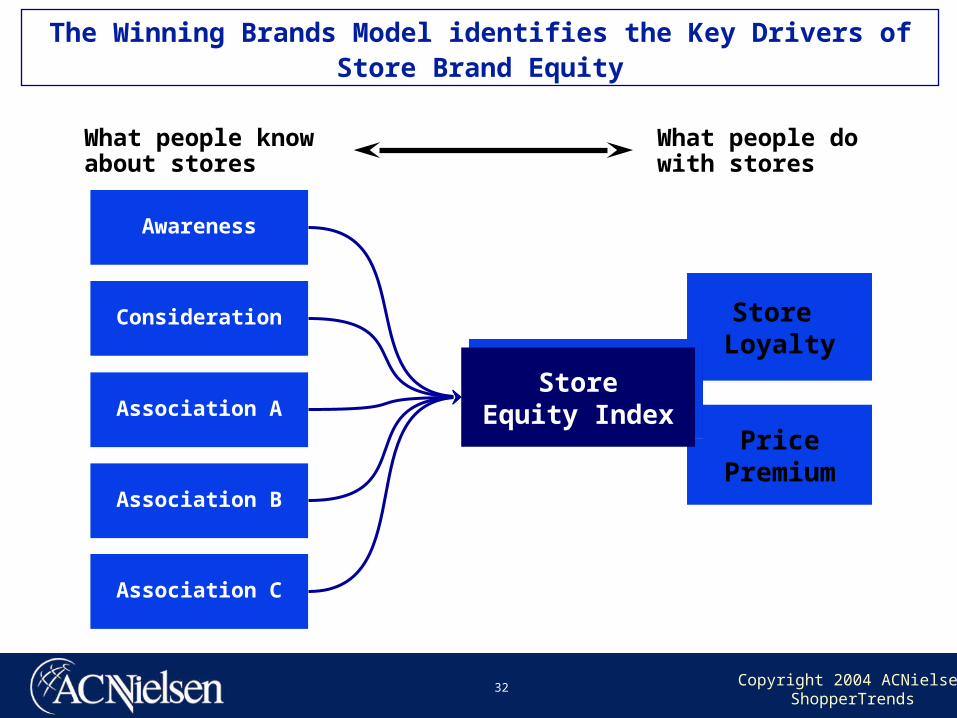
The Winning Brands Model identifies the Key Drivers of Store Brand Equity
What people dowith stores
What people knowabout stores
PricePremium
Store Loyalty
StoreEquity Index
StoreEquity Index
Awareness
Consideration
Association A
Association B
Association C
Copyright 2004 ACNielsenShopperTrends
33
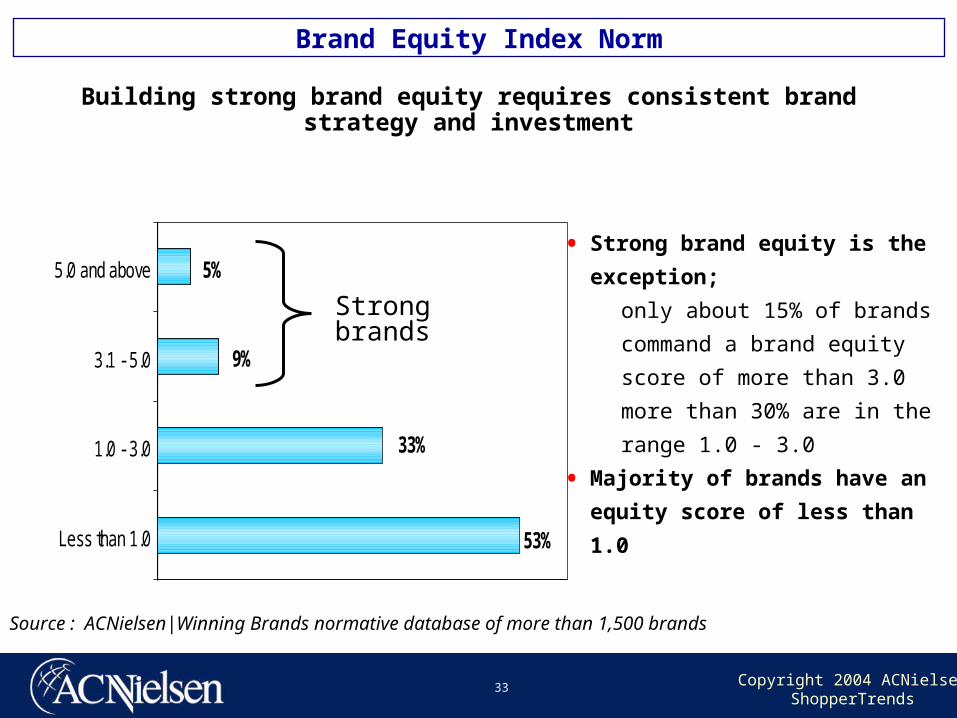
Building strong brand equity requires consistent brand strategy and investment
53%
33%
9%
5%
Less than 1.0
1.0 - 3.0
3.1 - 5.0
5.0 and above• Strong brand equity is the
exception;
only about 15% of brands
command a brand equity
score of more than 3.0
more than 30% are in the
range 1.0 - 3.0
• Majority of brands have an
equity score of less than 1.0
Source : ACNielsen|Winning Brands normative database of more than 1,500 brands
Strong brands
Brand Equity Index Norm
Copyright 2004 ACNielsenShopperTrends
34
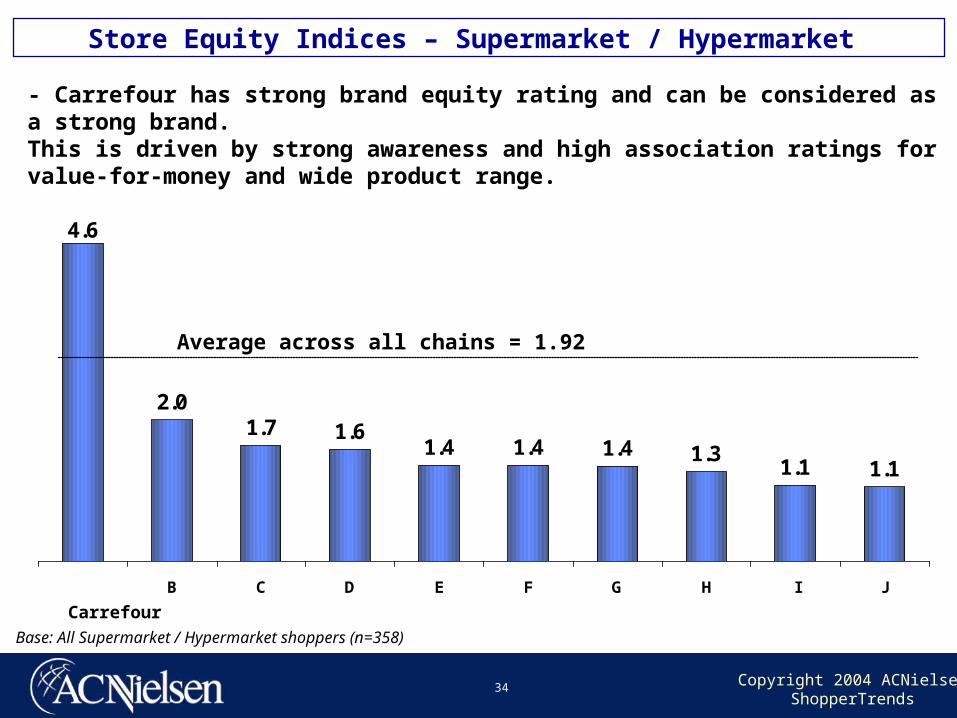
- Carrefour has strong brand equity rating and can be considered as a strong brand.This is driven by strong awareness and high association ratings for value-for-money and wide product range.
Carrefour
Base: All Supermarket / Hypermarket shoppers (n=358)
4.6
2.01.7 1.6
1.4 1.4 1.4 1.31.1 1.1
B C D E F G H I J
Store Equity Indices – Supermarket / Hypermarket
Average across all chains = 1.92
Copyright 2004 ACNielsenShopperTrends
35
Store Associations :Store Associations :What drives Store EquityWhat drives Store Equity
Copyright 2004 ACNielsenShopperTrends
36
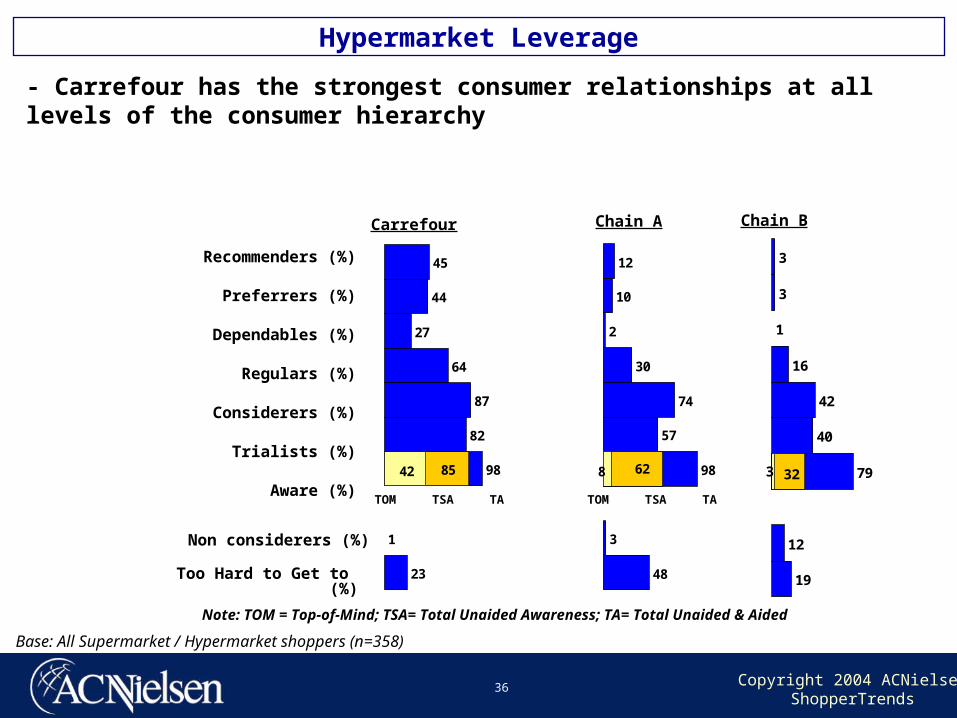
Recommenders (%)
Preferrers (%)
Dependables (%)
Regulars (%)
Considerers (%)
Trialists (%)
Aware (%)
Non considerers (%)
Too Hard to Get to (%)
Base: All Supermarket / Hypermarket shoppers (n=358)
45
44
27
64
87
82
98
1
23
8542
Carrefour
12
10
2
30
74
57
98
3
48
628
Chain A
Note: TOM = Top-of-Mind; TSA= Total Unaided Awareness; TA= Total Unaided & Aided
TOM TSA TA TOM TSA TA
Hypermarket Leverage
- Carrefour has the strongest consumer relationships at all levels of the consumer hierarchy
Chain B
3
3
1
16
42
40
79
12
19
323
Copyright 2004 ACNielsenShopperTrends
37
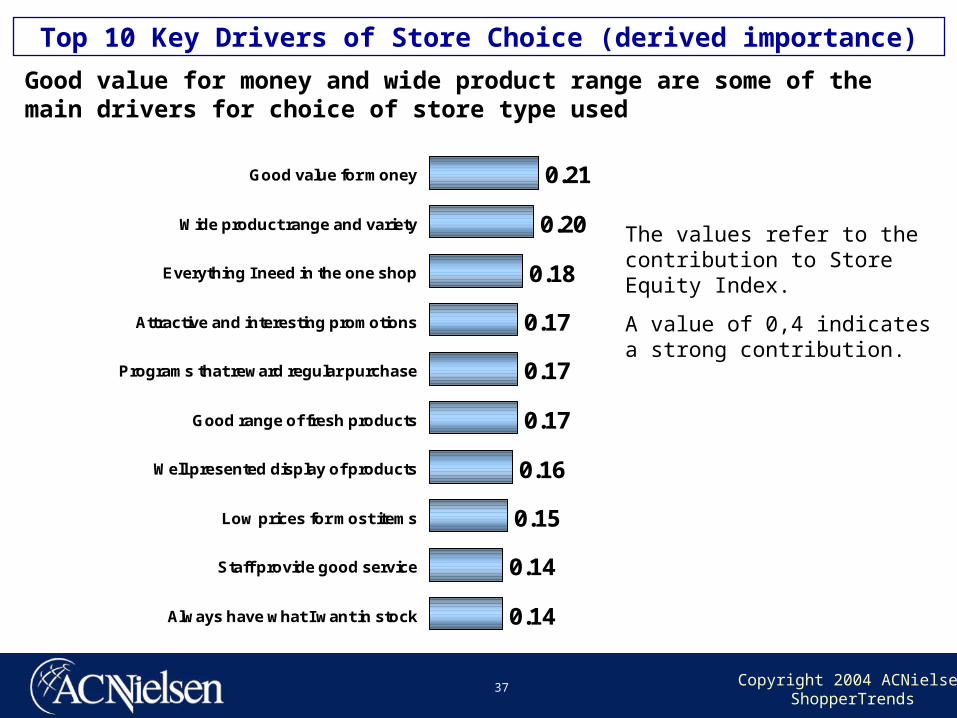
0.21
0.20
0.18
0.17
0.17
0.17
0.16
0.15
0.14
0.14
Good value for money
Wide product range and variety
Everything I need in the one shop
Attractive and interesting promotions
Programs that reward regular purchase
Good range of fresh products
Well presented display of products
Low prices for most items
Staff provide good service
Always have what I want in stock
Top 10 Key Drivers of Store Choice (derived importance)
Good value for money and wide product range are some of the main drivers for choice of store type used
The values refer to the contribution to Store Equity Index.
A value of 0,4 indicates a strong contribution.
Copyright 2004 ACNielsenShopperTrends
38
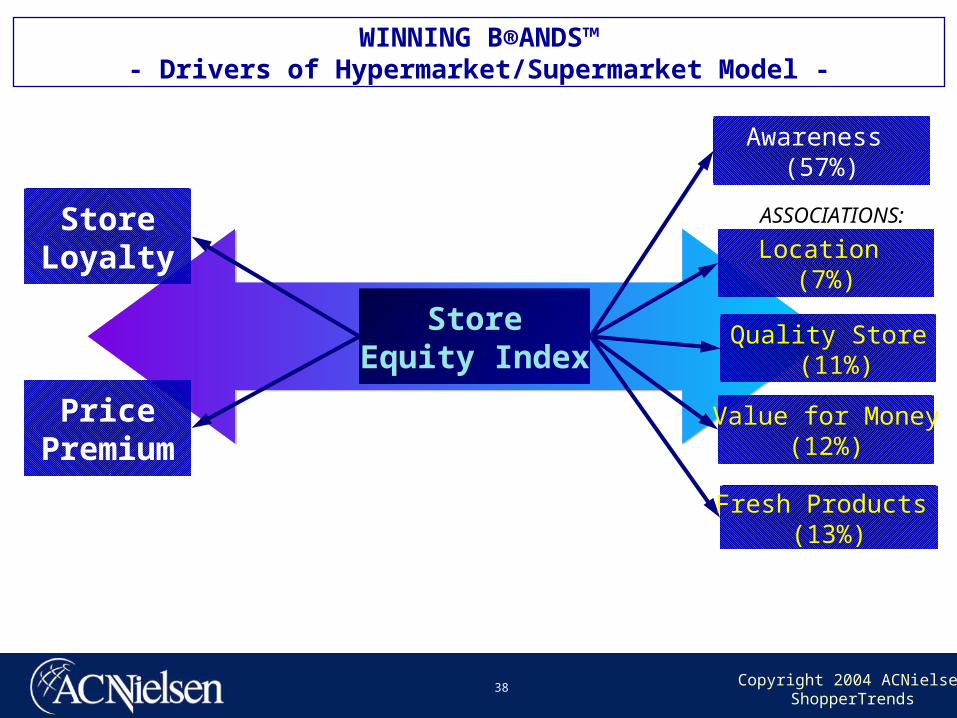
StoreEquity Index
StoreLoyalty
PricePremium
Location (7%)
Fresh Products (13%)
Value for Money(12%)
Awareness (57%)
Quality Store (11%)
WINNING B®ANDS™- Drivers of Hypermarket/Supermarket Model -
ASSOCIATIONS:
Copyright 2004 ACNielsenShopperTrends
39
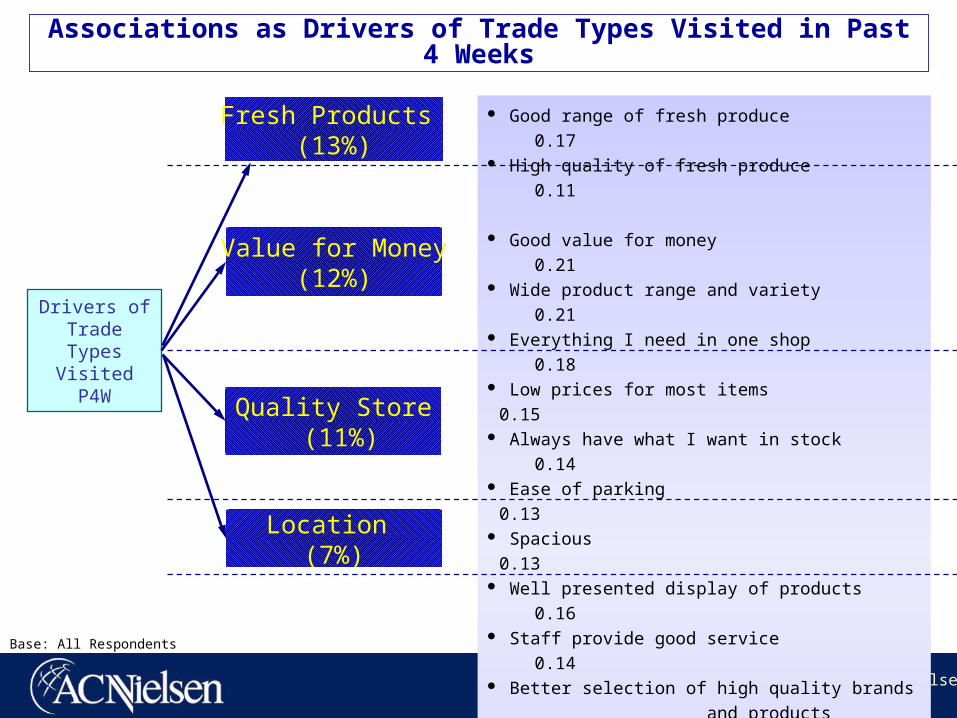
Base: All Respondents
Associations as Drivers of Trade Types Visited in Past 4 Weeks
Drivers of Trade Types Visited P4W
Good range of fresh produce 0.17 High quality of fresh produce 0.11
Good value for money 0.21 Wide product range and variety 0.21 Everything I need in one shop 0.18 Low prices for most items 0.15 Always have what I want in stock 0.14 Ease of parking 0.13 Spacious 0.13 Well presented display of products 0.16 Staff provide good service 0.14 Better selection of high quality brands and
products 0.14 Modern, confortable store 0.12 Easy to find quickly what I need 0.12 Clean, hygienic store 0.08 Convenient to get to 0.08 Proximity to home 0.02
Location (7%)
Fresh Products (13%)
Value for Money(12%)
Quality Store (11%)

Copyright 2004 ACNielsenShopperTrends
40
Store Image AssociationsStore Image Associations
Copyright 2004 ACNielsenShopperTrends
41
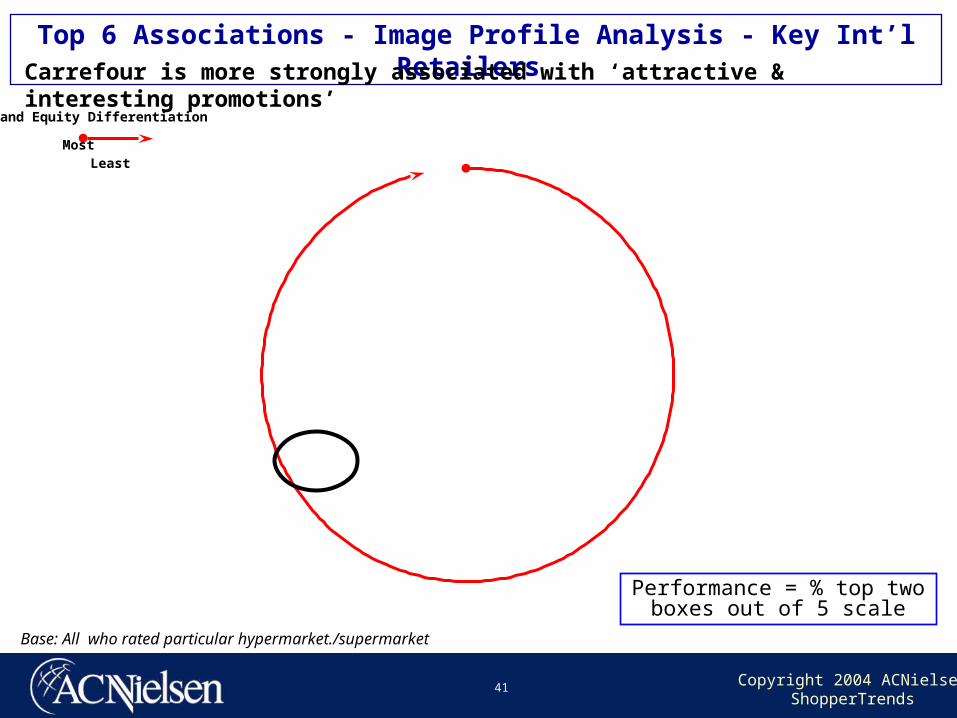
Most Least
Brand Equity Differentiation
Base: All who rated particular hypermarket./supermarket
Performance = % top two boxes out of 5 scale
Top 6 Associations - Image Profile Analysis - Key Int’l Retailers Carrefour is more strongly associated with ‘attractive & interesting promotions’
Copyright 2004 ACNielsenShopperTrends
42
Shopper BehaviorShopper Behavior
Copyright 2004 ACNielsenShopperTrends
43
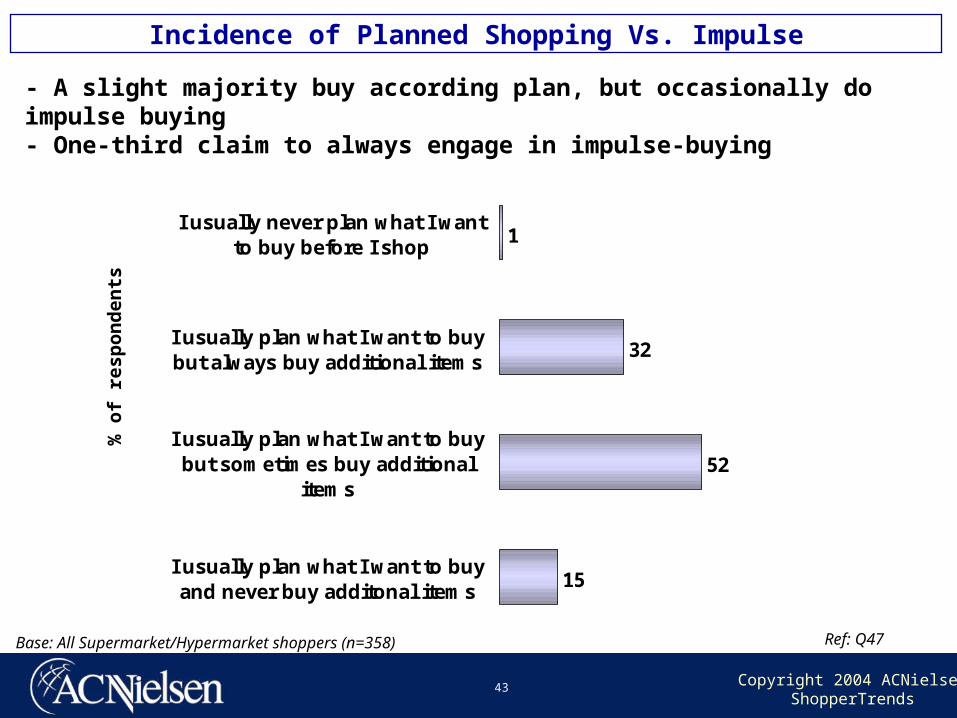
15
52
32
1
I usually plan what I want to buyand never buy additonal items
I usually plan what I want to buybut sometimes buy additional
items
I usually plan what I want to buybut always buy additional items
I usually never plan what I wantto buy before I shop
Ref: Q47
% o
f re
spo
nd
ents
Incidence of Planned Shopping Vs. Impulse
- A slight majority buy according plan, but occasionally do impulse buying- One-third claim to always engage in impulse-buying
Base: All Supermarket/Hypermarket shoppers (n=358)
Copyright 2004 ACNielsenShopperTrends
44
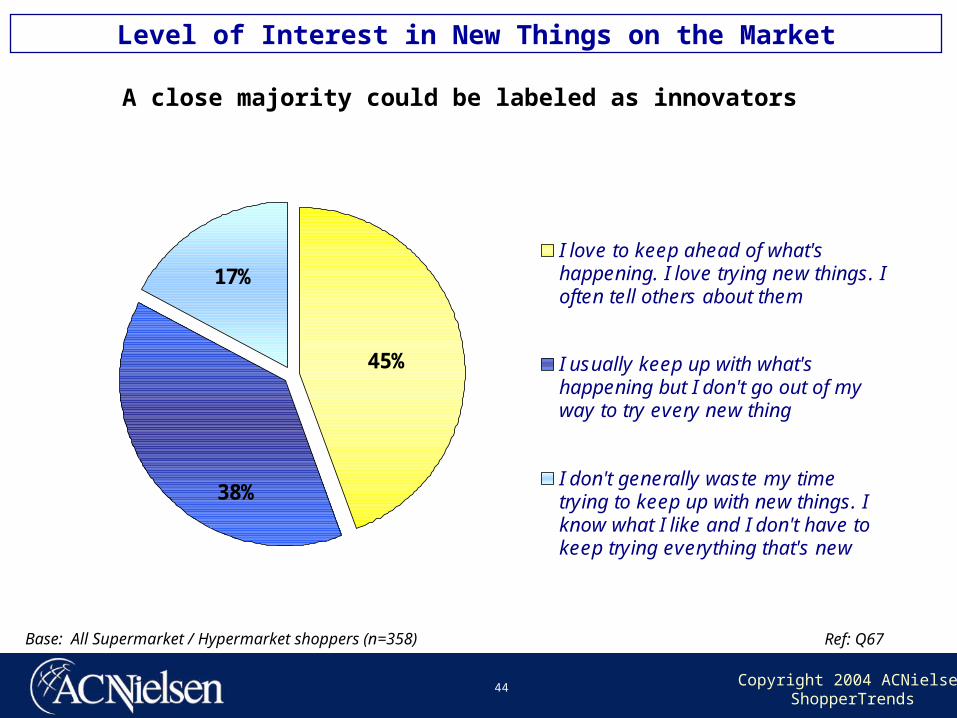
38%
45%
17%I love to keep ahead of what'shappening. I love trying new things. Ioften tell others about them
I usually keep up with what'shappening but I don't go out of myway to try every new thing
I don't generally waste my timetrying to keep up with new things. Iknow what I like and I don't have tokeep trying everything that's new
Ref: Q67
Level of Interest in New Things on the Market
A close majority could be labeled as innovators
Base: All Supermarket / Hypermarket shoppers (n=358)
Copyright 2004 ACNielsenShopperTrends
45
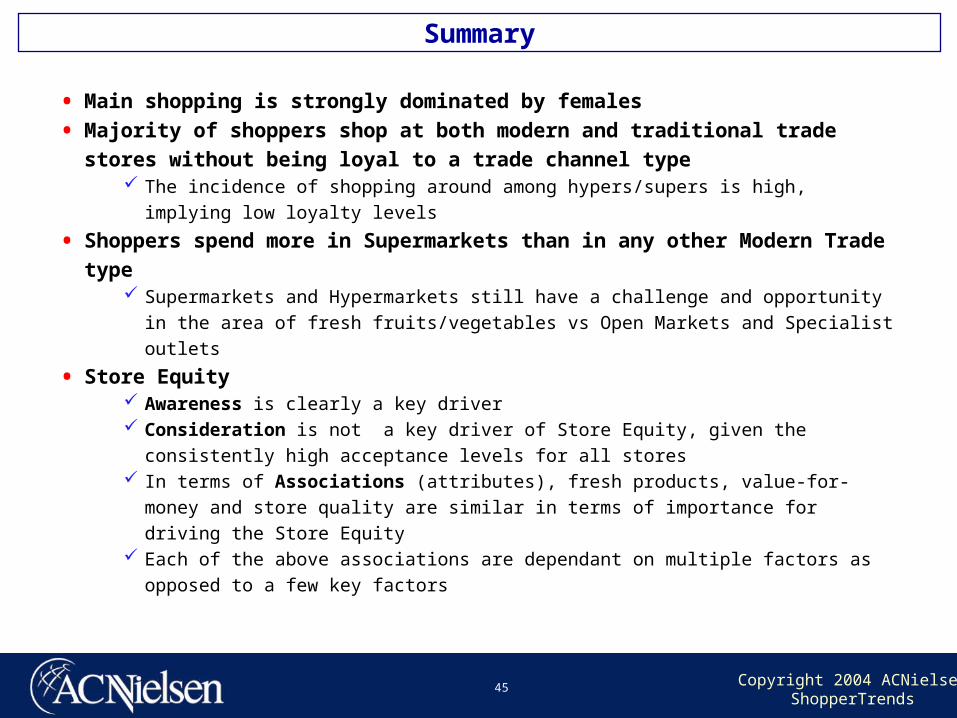
Summary
• Main shopping is strongly dominated by females
• Majority of shoppers shop at both modern and traditional trade stores
without being loyal to a trade channel type The incidence of shopping around among hypers/supers is high, implying low
loyalty levels
• Shoppers spend more in Supermarkets than in any other Modern Trade
type Supermarkets and Hypermarkets still have a challenge and opportunity in the
area of fresh fruits/vegetables vs Open Markets and Specialist outlets
• Store Equity Awareness is clearly a key driver Consideration is not a key driver of Store Equity, given the consistently high
acceptance levels for all stores In terms of Associations (attributes), fresh products, value-for-money and store
quality are similar in terms of importance for driving the Store Equity Each of the above associations are dependant on multiple factors as opposed to
a few key factors

Copyright 2004 ACNielsenShopperTrends
46
THANK YOU FOR YOUR ATTENTION!

Copyright 2004 ACNielsenShopperTrends
47
Building Better Brands
Related Documents