Copyright © 2002 by Marketspace LLC Rayport, Jaworski e-Commerce Chapter 7 Enhanced Lecture Slides Metrics Exhibits and Tables

Copyright © 2002 by Marketspace LLC Rayport, Jaworski e-Commerce Chapter 7 Enhanced Lecture Slides Metrics Exhibits and Tables.
Dec 19, 2015
Welcome message from author
This document is posted to help you gain knowledge. Please leave a comment to let me know what you think about it! Share it to your friends and learn new things together.
Transcript

Copyright © 2002 by Marketspace LLC
Rayport, Jaworski
e-Commerce
Chapter 7 Enhanced Lecture Slides
Metrics
Exhibits and Tables
Last Updated: 03/19/02Copyright 2002 by Marketspace LLC
Metrics — Today’s Objective
Develop an understanding of how to assess the financial and strategic performance of an e-business company.

Last Updated: 03/19/02Copyright 2002 by Marketspace LLC
Chapter 7:Metrics
Purposes of metrics Comprehensive measures of performance Implementing performance metrics Example of metrics development: MarketWatch.com Sources of metrics information Case study: Schwab Conclusion

Last Updated: 03/19/02Copyright 2002 by Marketspace LLC
Chapter 7:Metrics
Purposes of metrics
Comprehensive measures of performance
Implementing performance metrics
Example of metrics development: MarketWatch.com
Sources of metrics information
Case study: Schwab
Conclusion
Last Updated: 03/19/02Copyright 2002 by Marketspace LLC
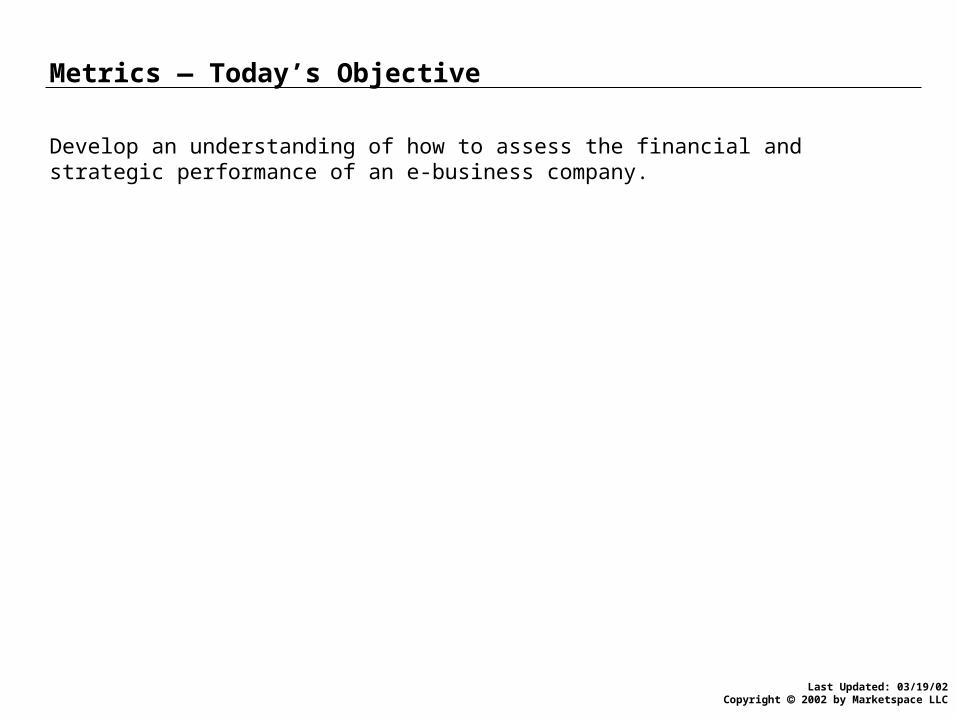
Supporting Exhibit 7–A: Purposes of Metrics
Clarify strategic prioritiesSpecify value proposition
Outline specific goalsObtain employee buy-in
Receive feedbackModify tactics
Link to performance appraisal systemTie individual performance to metrics for the company, the
team and the individual.
Harmonize individual objectives, departmental goals and companywide strategy.
Define Business ModelDefine Business Model
Communicate StrategyCommunicate Strategy
Align ObjectivesAlign Objectives
Track PerformanceTrack Performance
Increase AccountabilityIncrease Accountability
Managers can use metrics to evaluate a business’s progress in the following areas:Examples
Last Updated: 03/19/02Copyright 2002 by Marketspace LLC
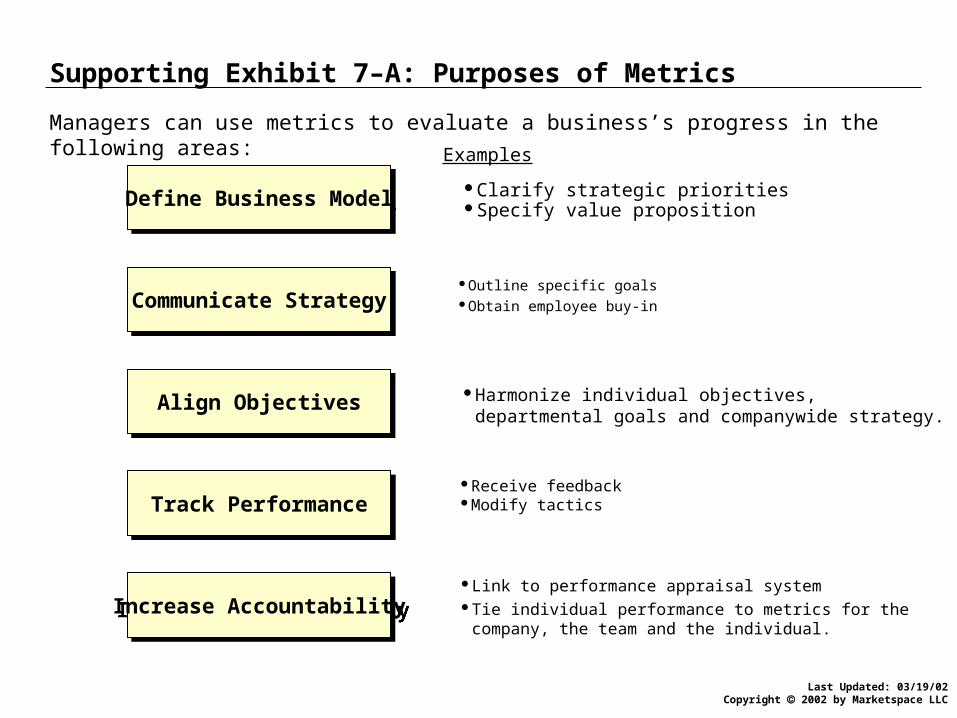
Supporting Exhibit 7–B: Challenges to Specifying Metrics for Online Businesses
Companies’ strategies change rapidly.
Online measurement is resource intensive.– Development of systems to capture data can require significant
capital investment and human resources.– Data mining is often needed to make data usable.– The amount of Information generated can overwhelm managers.
Online metrics are still evolving.– There is little agreement on which measures are appropriate.– Some metrics are ambiguous (e.g., amount of time spent at site).– Data capture is subject to manipulation.
“Hard” measures are needed for investment community, but “soft” measures are often the best early indicators of site performance.
Some reasons why many online businesses do not take a systematic approach to developing and applying metrics:

Last Updated: 03/19/02Copyright 2002 by Marketspace LLC
Chapter 7:Metrics
Purposes of metrics
Comprehensive measures of performance
Implementing performance metrics
Example of metrics development: MarketWatch.com
Sources of metrics information
Case study: Schwab
Conclusion
Last Updated: 03/19/02Copyright 2002 by Marketspace LLC
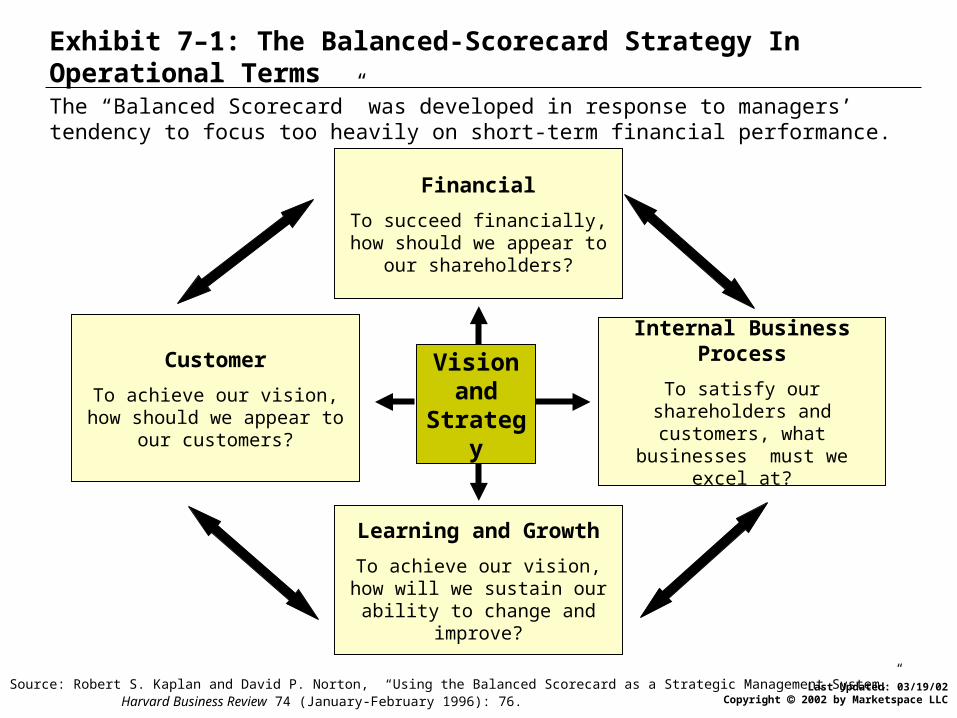
Exhibit 7–1: The Balanced-Scorecard Strategy In Operational Terms
Financial
To succeed financially, how should we appear to our
shareholders?
Internal Business Process
To satisfy our shareholders and customers, what businesses
must we excel at?
Customer
To achieve our vision, how should we appear to our
customers?
Learning and Growth
To achieve our vision, how will we sustain our ability to change
and improve?
Visionand
Strategy
Source: Robert S. Kaplan and David P. Norton, “Using the Balanced Scorecard as a Strategic Management System,” Harvard Business Review 74 (January-February 1996): 76.
The “Balanced Scorecard” was developed in response to managers’ tendency to focus too heavily on short-term financial performance.
Last Updated: 03/19/02Copyright 2002 by Marketspace LLC
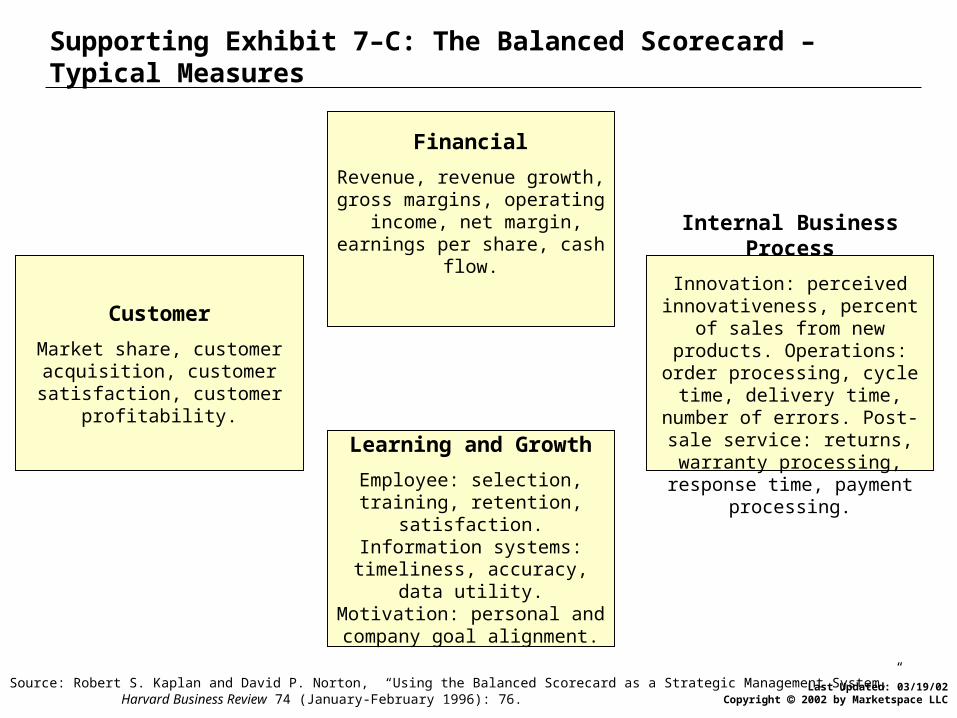
Supporting Exhibit 7–C: The Balanced Scorecard – Typical Measures
Internal Business Process
Innovation: perceived innovativeness, percent of sales from new products. Operations:
order processing, cycle time, delivery time, number of errors.
Post-sale service: returns, warranty processing, response
time, payment processing.
Customer
Market share, customer acquisition, customer satisfaction, customer
profitability.
Learning and Growth
Employee: selection, training, retention, satisfaction.
Information systems: timeliness, accuracy, data utility.
Motivation: personal and company goal alignment.
Source: Robert S. Kaplan and David P. Norton, “Using the Balanced Scorecard as a Strategic Management System,” Harvard Business Review 74 (January-February 1996): 76.
Financial
Revenue, revenue growth, gross margins, operating
income, net margin, earnings per share, cash flow.
Last Updated: 03/19/02Copyright 2002 by Marketspace LLC
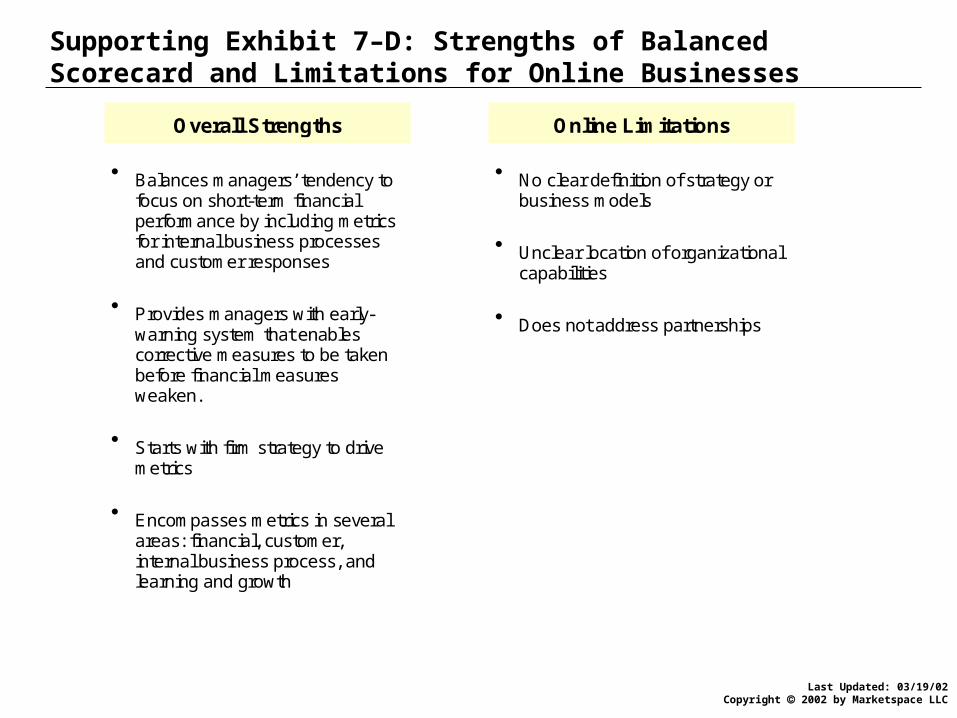
Overall Strengths Online Limitations
Balances managers’ tendency to focus on short-term financial performance by including metrics for internal business processes and customer responses
Provides managers with early-
warning system that enables corrective measures to be taken before financial measures weaken.
Starts with firm strategy to drive
metrics
Encompasses metrics in several
areas: financial, customer, internal business process, and learning and growth
No clear definition of strategy or business models
Unclear location of organizational
capabilities
Does not address partnerships
Supporting Exhibit 7–D: Strengths of Balanced Scorecard and Limitations for Online Businesses
Last Updated: 03/19/02Copyright 2002 by Marketspace LLC
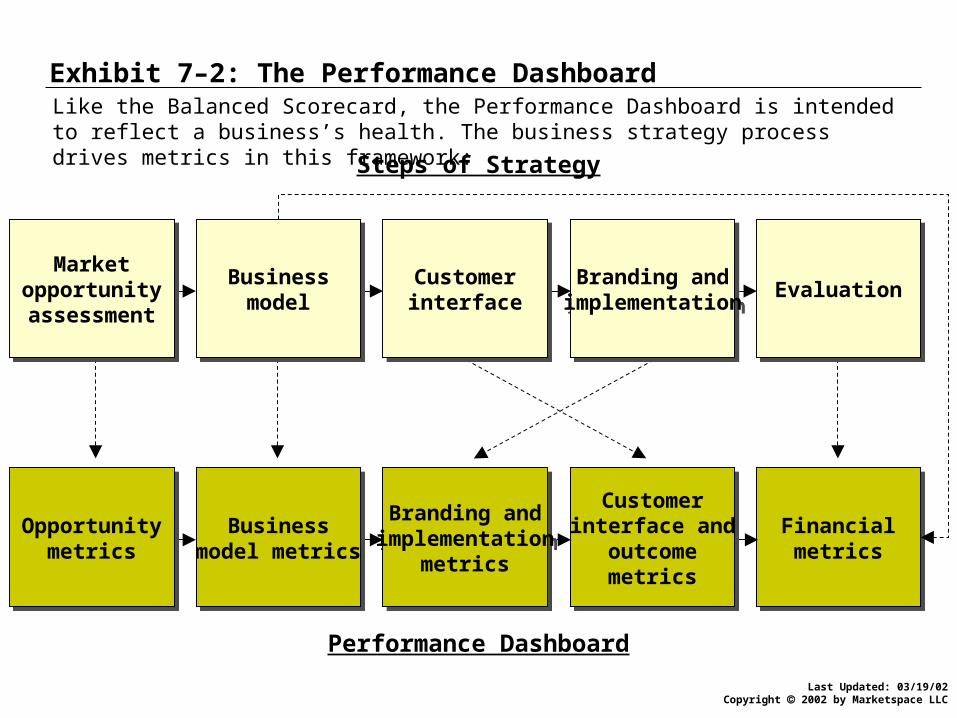
Exhibit 7–2: The Performance Dashboard
Financialmetrics
Financialmetrics
Steps of Strategy
Customerinterface
Customerinterface
Branding andimplementationBranding and
implementation
Performance Dashboard
Marketopportunityassessment
Marketopportunityassessment
Businessmodel
Businessmodel
Branding andimplementation
metrics
Branding andimplementation
metrics
Customerinterface and
outcomemetrics
Customerinterface and
outcomemetrics
Businessmodel metrics
Businessmodel metrics
Opportunitymetrics
Opportunitymetrics
EvaluationEvaluation
Like the Balanced Scorecard, the Performance Dashboard is intended to reflect a business’s health. The business strategy process drives metrics in this framework:
Last Updated: 03/19/02Copyright 2002 by Marketspace LLC
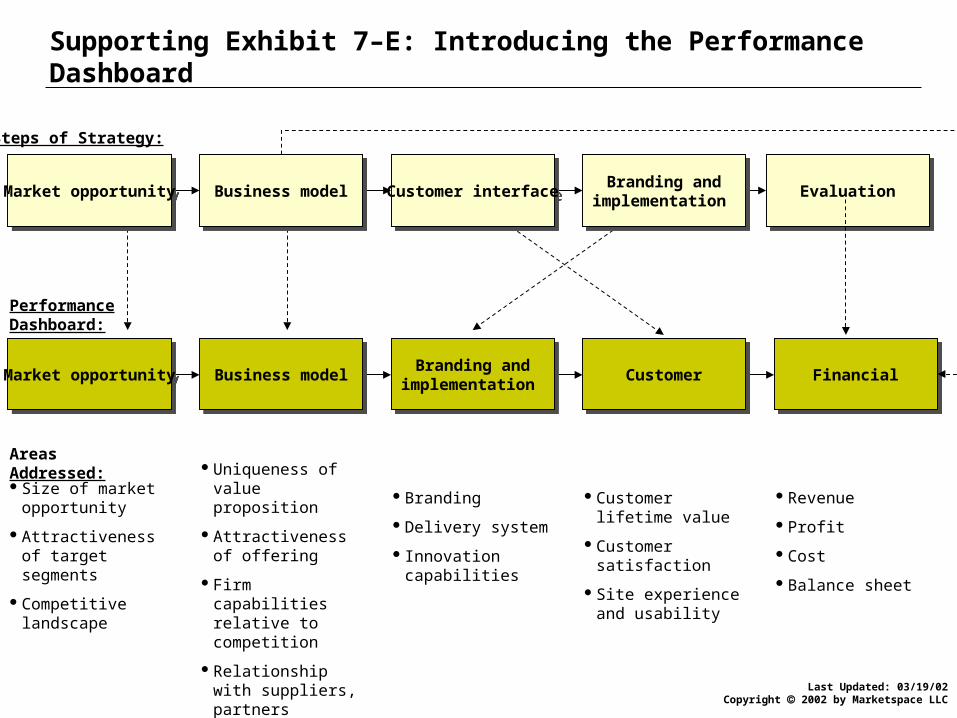
Supporting Exhibit 7–E: Introducing the Performance Dashboard
FinancialFinancial
Steps of Strategy:
Customer interfaceCustomer interface Branding andimplementation
Branding andimplementation
Performance Dashboard:
Areas Addressed:Size of market
opportunity
Attractiveness of target segments
Competitive landscape
Customer lifetime value
Customer satisfaction
Site experience and usability
Branding
Delivery system
Innovation capabilities
Revenue
Profit
Cost
Balance sheet
Market opportunityMarket opportunity Business modelBusiness model
Branding andimplementation
Branding andimplementation CustomerCustomerBusiness modelBusiness modelMarket opportunityMarket opportunity
Uniqueness of value proposition
Attractiveness of offering
Firm capabilities relative to competition
Relationship with suppliers, partners
EvaluationEvaluation
Last Updated: 03/19/02Copyright 2002 by Marketspace LLC
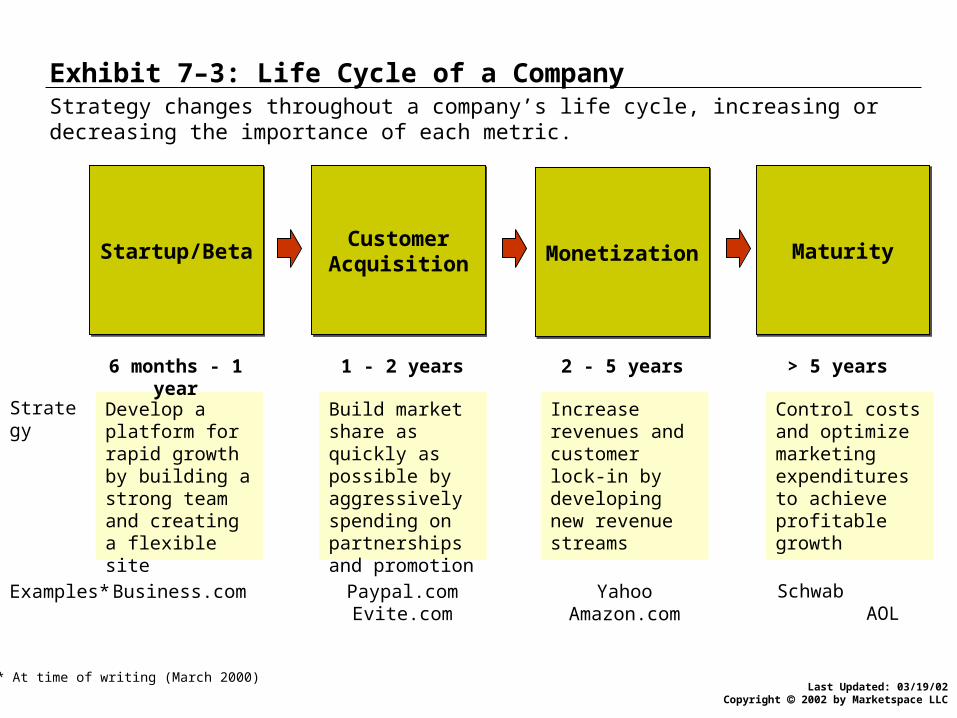
Exhibit 7–3: Life Cycle of a Company
Startup/BetaStartup/Beta CustomerAcquisitionCustomer
Acquisition MonetizationMonetization MaturityMaturity
Develop a platform for rapid growth by building a strong team and creating a flexible site
Build market share as quickly as possible by aggressively spending on partnerships and promotion
Increase revenues and customer lock-in by developing new revenue streams
Control costs and optimize marketing expenditures to achieve profitable growth
6 months - 1 year 1 - 2 years 2 - 5 years > 5 years
Strategy
Business.com Paypal.com Evite.com
Yahoo Amazon.com
Schwab AOL
Examples*
* At time of writing (March 2000)
Strategy changes throughout a company’s life cycle, increasing or decreasing the importance of each metric.

Last Updated: 03/19/02Copyright 2002 by Marketspace LLC
Chapter 7:Metrics
Purposes of metrics
Comprehensive measures of performance
Implementing performance metrics
Example of metrics development: MarketWatch.com
Sources of metrics information
Case study: Schwab
Conclusion
Last Updated: 03/19/02Copyright 2002 by Marketspace LLC
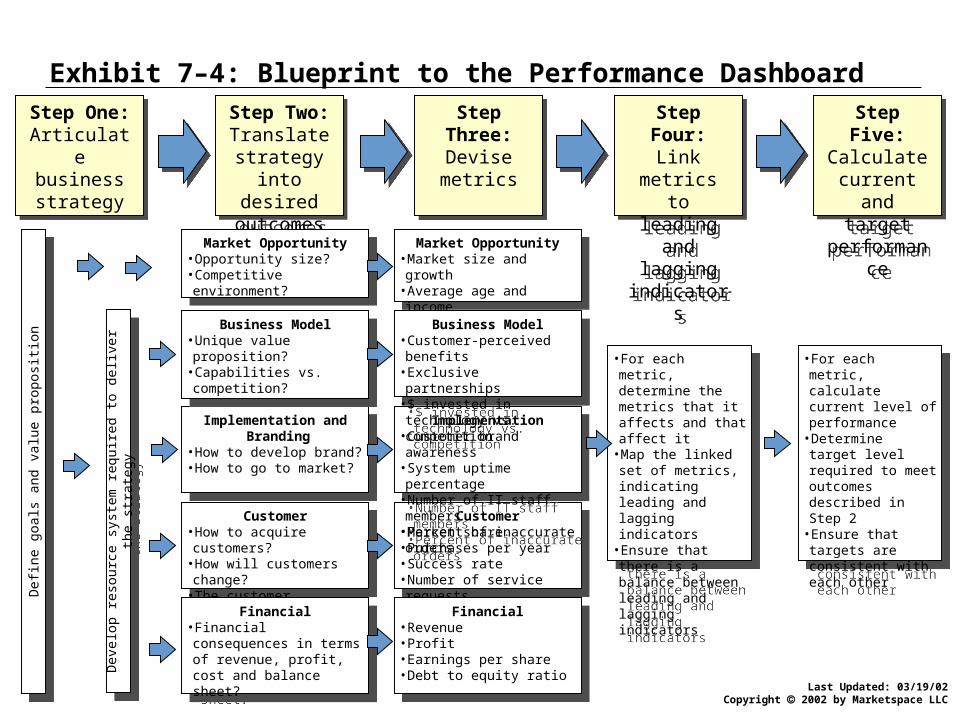
Exhibit 7–4: Blueprint to the Performance Dashboard
Step One: Articulate business strategy
Step One: Articulate business strategy
Step Two: Translate
strategy into desired
outcomes
Step Two: Translate
strategy into desired
outcomes
Step Three: Devise metrics
Step Three: Devise metrics
Step Four: Link metrics to leading
and lagging indicators
Step Four: Link metrics to leading
and lagging indicators
Step Five: Calculate
current and target
performance
Step Five: Calculate
current and target
performance
Def
ine
goal
s an
d va
lue
prop
ositi
onD
efin
e go
als
and
valu
e pr
opos
ition
Market Opportunity•Opportunity size?•Competitive environment?
Market Opportunity•Opportunity size?•Competitive environment?
Customer•How to acquire customers?•How will customers change?•The customer experience?
Customer•How to acquire customers?•How will customers change?•The customer experience?
Implementation and Branding
•How to develop brand?•How to go to market?
Implementation and Branding
•How to develop brand?•How to go to market?
Financial•Financial consequences in terms of revenue, profit, cost and balance sheet?
Financial•Financial consequences in terms of revenue, profit, cost and balance sheet?
Market Opportunity•Market size and growth•Average age and income•Competitor concentration
Market Opportunity•Market size and growth•Average age and income•Competitor concentration
Customer•Market share•Purchases per year•Success rate•Number of service requests
Customer•Market share•Purchases per year•Success rate•Number of service requests
Implementation•Customer brand awareness•System uptime percentage•Number of IT staff members•Percent of inaccurate orders
Implementation•Customer brand awareness•System uptime percentage•Number of IT staff members•Percent of inaccurate orders
Financial•Revenue•Profit•Earnings per share•Debt to equity ratio
Financial•Revenue•Profit•Earnings per share•Debt to equity ratio
•For each metric, determine the metrics that it affects and that affect it
•Map the linked set of metrics, indicating leading and lagging indicators
•Ensure that there is a balance between leading and lagging indicators
•For each metric, determine the metrics that it affects and that affect it
•Map the linked set of metrics, indicating leading and lagging indicators
•Ensure that there is a balance between leading and lagging indicators
Dev
elop
res
ourc
e sy
stem
req
uire
d to
del
iver
the
stra
tegy
Dev
elop
res
ourc
e sy
stem
req
uire
d to
del
iver
the
stra
tegy
•For each metric, calculate current level of performance
•Determine target level required to meet outcomes described in Step 2
•Ensure that targets are consistent with each other
•For each metric, calculate current level of performance
•Determine target level required to meet outcomes described in Step 2
•Ensure that targets are consistent with each other
Business Model•Unique value proposition?•Capabilities vs. competition?
Business Model•Unique value proposition?•Capabilities vs. competition?
Business Model•Customer-perceived benefits•Exclusive partnerships•$ invested in technology vs. competition
Business Model•Customer-perceived benefits•Exclusive partnerships•$ invested in technology vs. competition
Last Updated: 03/19/02Copyright 2002 by Marketspace LLC
Chapter 7:Metrics
Purposes of metrics
Comprehensive measures of performance
Implementing performance metrics
Example of metrics development: MarketWatch.com
Sources of metrics information
Case study: Schwab
Conclusion
Last Updated: 03/19/02Copyright 2002 by Marketspace LLC
Personal Finance Process
Investor’s Primer IPO Basics Financial Glossary
Broker Decision Center
Datek Online Fidelity Investments National Discount Brokers Ameritrade DLJ Direct
Sharebuilder Payment Calculator Home Price Checker Best Credit Card Rates Insurance QuickQuote
Private Email People Watch Hot Discussions Weekly Poll
Market guide Hoover’s Online Multex Annual Reports Club INVESTools Over 250,000
Investment ResearchReports
Interactive Charting Historical Charts
Fund Profile Fund Charts
Market Monitor Major Indexes Dollar Volume
Leaders
BellwetherBonds Report
Futures Contracts After-Hours Futures
Key RateSnapshot
InternationalIndexes
Non-Us Stocks
Thom Calandra’s Stockwatch Bambi Francisco’s Net Sense Bezderick on Bonds eNewsletters
News Watch Email Alerts Real-time Headlines Marketwatch Live Esignal Hotstock Tracker
Contributions To:– CBS The Early Show– CBS Evening News– CBS Newspath
Contribution toWestwood RadioNetwork
LearnAbout
PersonalFinance
PlanInvestment
Strategy
Stay Updated onLatest News
DevelopInsight
PerformInvestment
TrackInvestments
Television Radio
Stocks
Funds
US Markets
Bonds
Global Markets
Futures and Options
Commentary
Third Party Sources
Tools
Community
Sponsorships by Online Brokerages
Online
Portfolio View Portfolio Analyzer Portfolio Allocation Portfolio Forecast
Breaking News
Market Figures
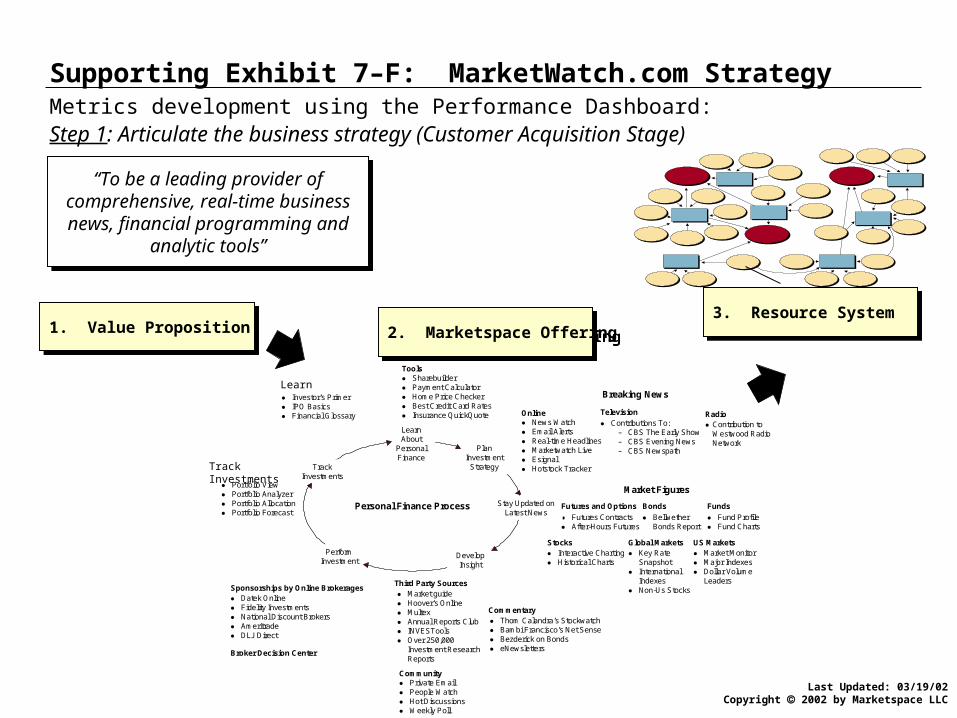
Supporting Exhibit 7–F: MarketWatch.com Strategy
“To be a leading provider of comprehensive, real-time business news, financial programming and
analytic tools”
“To be a leading provider of comprehensive, real-time business news, financial programming and
analytic tools”
1. Value Proposition1. Value Proposition3. Resource System3. Resource System
2. Marketspace Offering2. Marketspace Offering
Metrics development using the Performance Dashboard:Step 1: Articulate the business strategy (Customer Acquisition Stage)
Learn
Track Investments
Last Updated: 03/19/02Copyright 2002 by Marketspace LLC
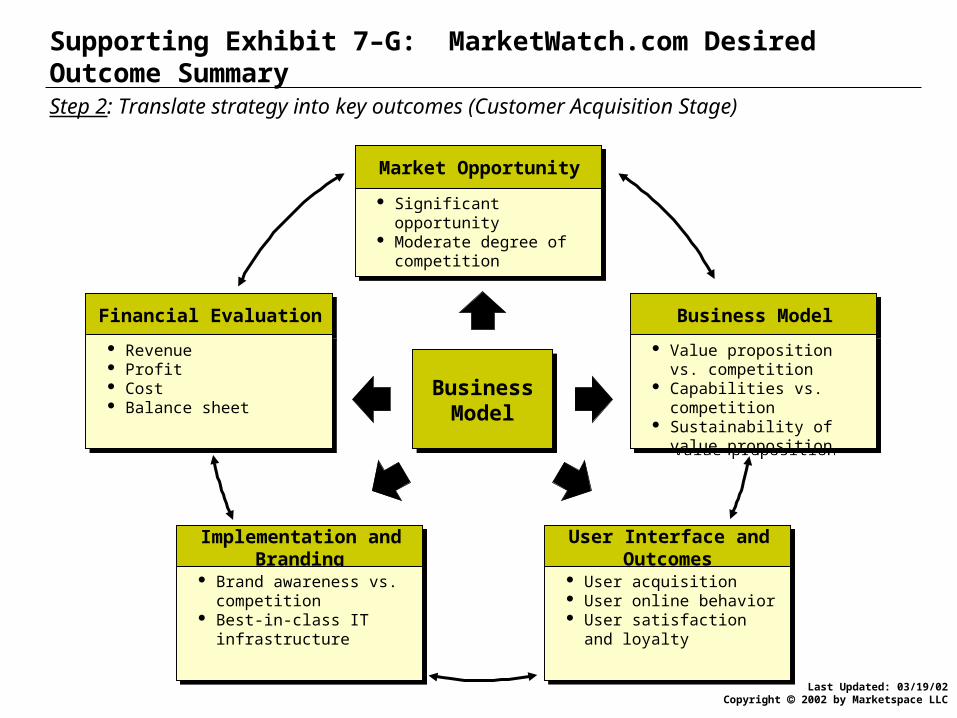
User Interface and Outcomes
User Interface and Outcomes
Market Opportunity Market Opportunity
Business Model Business Model
Implementation and Branding
Implementation and Branding
Financial Evaluation Financial Evaluation
Supporting Exhibit 7–G: MarketWatch.com Desired Outcome Summary
Significant opportunity Moderate degree of
competition
Significant opportunity Moderate degree of
competition
Revenue Profit Cost Balance sheet
Revenue Profit Cost Balance sheet
Brand awareness vs. competition
Best-in-class IT infrastructure
Brand awareness vs. competition
Best-in-class IT infrastructure
User acquisition User online behavior User satisfaction and
loyalty
User acquisition User online behavior User satisfaction and
loyalty
Value proposition vs. competition
Capabilities vs. competition Sustainability of value
proposition
Value proposition vs. competition
Capabilities vs. competition Sustainability of value
proposition
BusinessModel
BusinessModel
Step 2: Translate strategy into key outcomes (Customer Acquisition Stage)
Last Updated: 03/19/02Copyright 2002 by Marketspace LLC
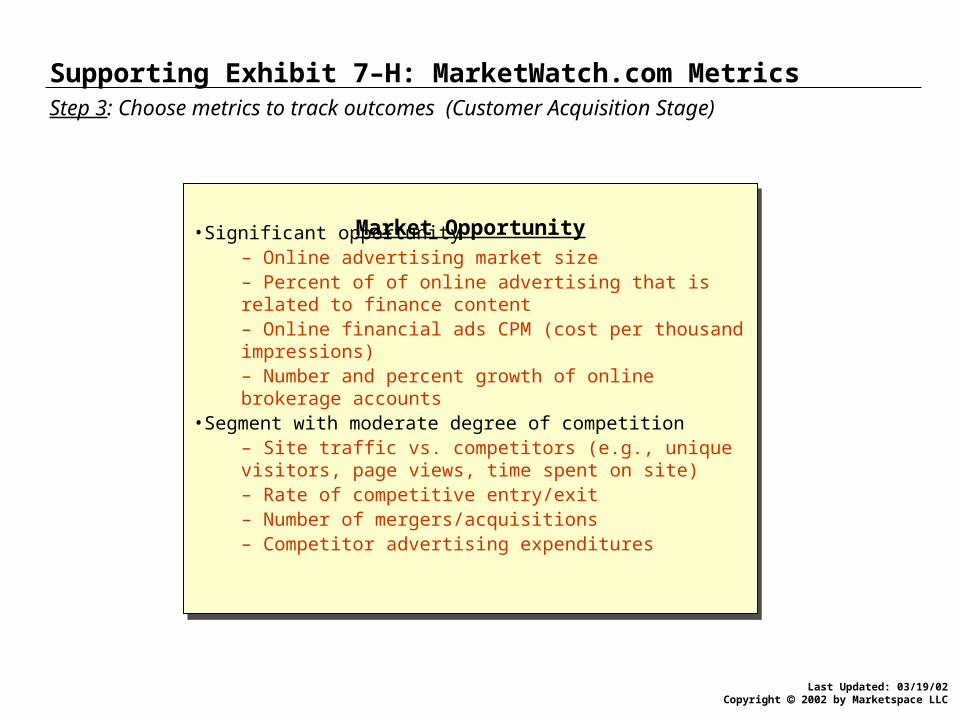
Supporting Exhibit 7–H: MarketWatch.com Metrics
•Significant opportunity– Online advertising market size– Percent of of online advertising that is related to finance content– Online financial ads CPM (cost per thousand impressions)– Number and percent growth of online brokerage accounts
•Segment with moderate degree of competition– Site traffic vs. competitors (e.g., unique visitors, page views, time spent on site) – Rate of competitive entry/exit– Number of mergers/acquisitions – Competitor advertising expenditures
Market Opportunity
Step 3: Choose metrics to track outcomes (Customer Acquisition Stage)
Last Updated: 03/19/02Copyright 2002 by Marketspace LLC
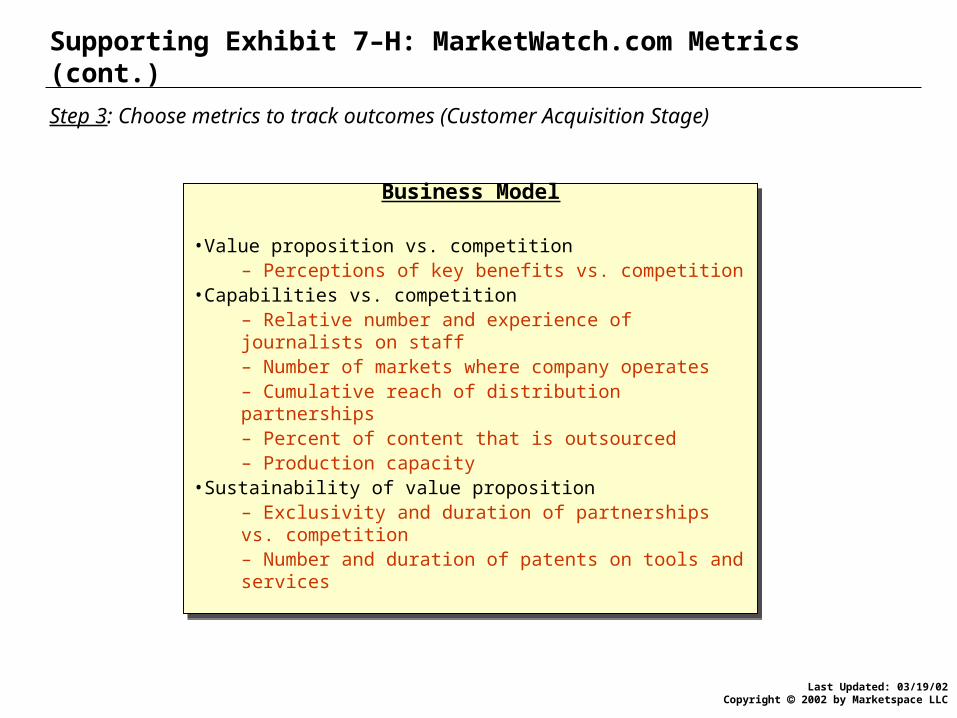
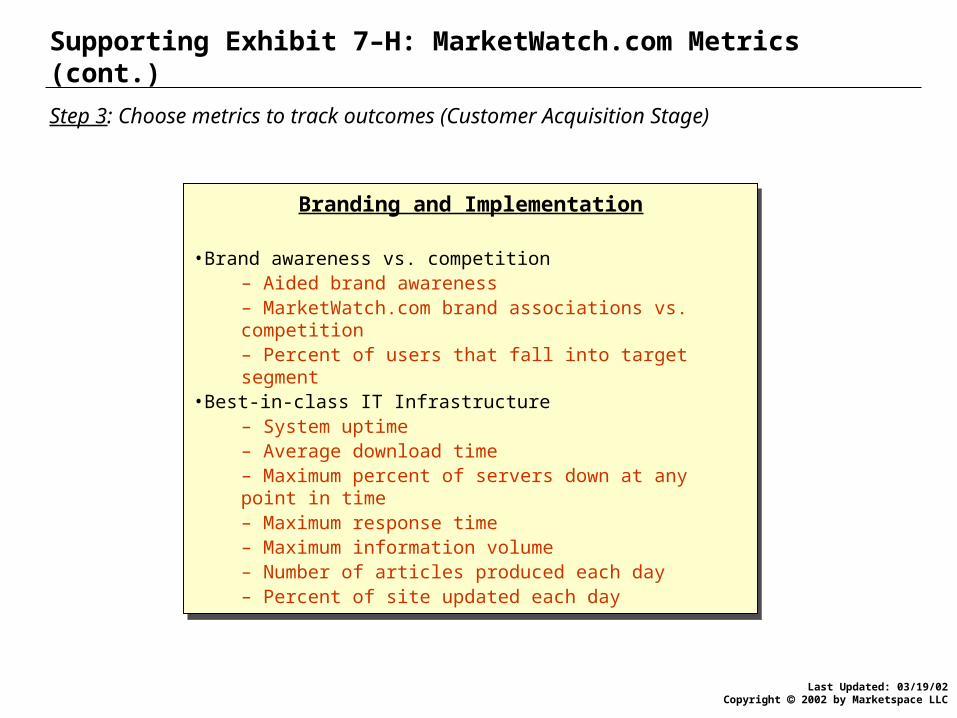
Supporting Exhibit 7–H: MarketWatch.com Metrics (cont.)
Step 3: Choose metrics to track outcomes (Customer Acquisition Stage)
Business Model
•Value proposition vs. competition– Perceptions of key benefits vs. competition
•Capabilities vs. competition– Relative number and experience of journalists on staff– Number of markets where company operates– Cumulative reach of distribution partnerships– Percent of content that is outsourced– Production capacity
•Sustainability of value proposition– Exclusivity and duration of partnerships vs. competition– Number and duration of patents on tools and services
Last Updated: 03/19/02Copyright 2002 by Marketspace LLC
Supporting Exhibit 7–H: MarketWatch.com Metrics (cont.)
Step 3: Choose metrics to track outcomes (Customer Acquisition Stage)
Branding and Implementation
•Brand awareness vs. competition– Aided brand awareness– MarketWatch.com brand associations vs. competition– Percent of users that fall into target segment
•Best-in-class IT Infrastructure– System uptime– Average download time– Maximum percent of servers down at any point in time– Maximum response time– Maximum information volume– Number of articles produced each day– Percent of site updated each day

Last Updated: 03/19/02Copyright 2002 by Marketspace LLC
Supporting Exhibit 7–H: MarketWatch.com Metrics (cont.)
Step 3: Choose metrics to track outcomes (Customer Acquisition Stage)
User Interface and Outcomes
•User acquisition costs– Number of unique visitors vs. competition– Percent of users coming from other sites– Relative marketing expenditures (as percent of revenues)– Percent of site visitors who register– Percent of visitors who purchase– Percent of visitors who return to site– Frequency of visits
•User online experience– Customer evaluation on 7Cs vs. competition– Average minutes spent at site per user– Popularity of individual articles– Average time to complete a task– Number of negative feedback items per time period
•Customer satisfaction and loyalty– User loyalty– Satisfaction overall and by attribute vs. competition– User churn rate
Last Updated: 03/19/02Copyright 2002 by Marketspace LLC
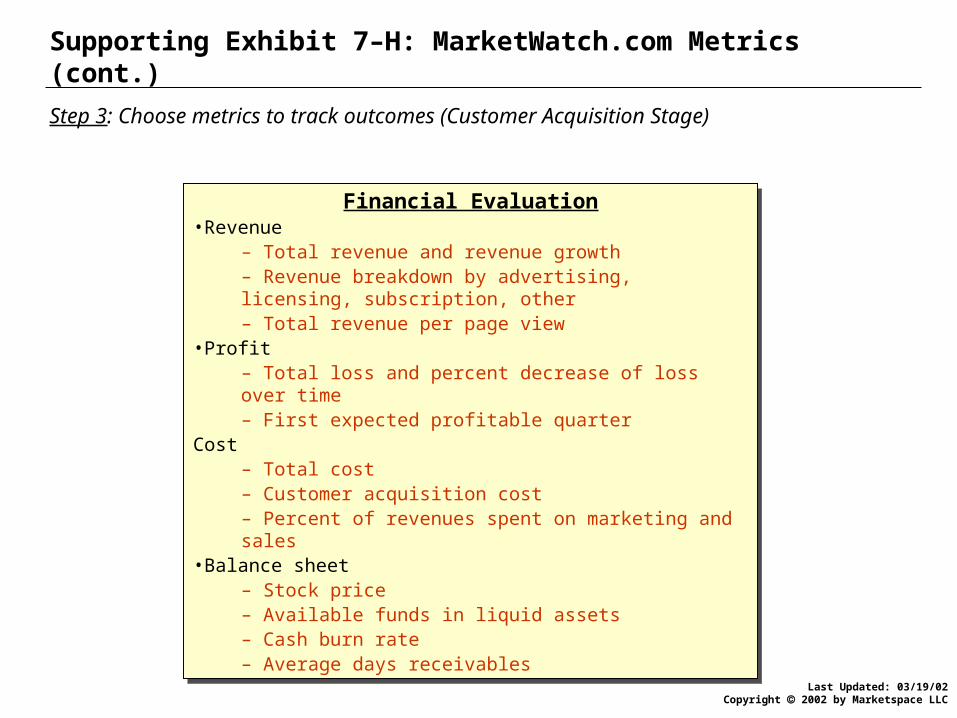
Supporting Exhibit 7–H: MarketWatch.com Metrics (cont.)
Step 3: Choose metrics to track outcomes (Customer Acquisition Stage)
Financial Evaluation•Revenue
– Total revenue and revenue growth– Revenue breakdown by advertising, licensing, subscription, other– Total revenue per page view
•Profit– Total loss and percent decrease of loss over time– First expected profitable quarter
Cost– Total cost– Customer acquisition cost– Percent of revenues spent on marketing and sales
•Balance sheet– Stock price– Available funds in liquid assets– Cash burn rate– Average days receivables
Last Updated: 03/19/02Copyright 2002 by Marketspace LLC
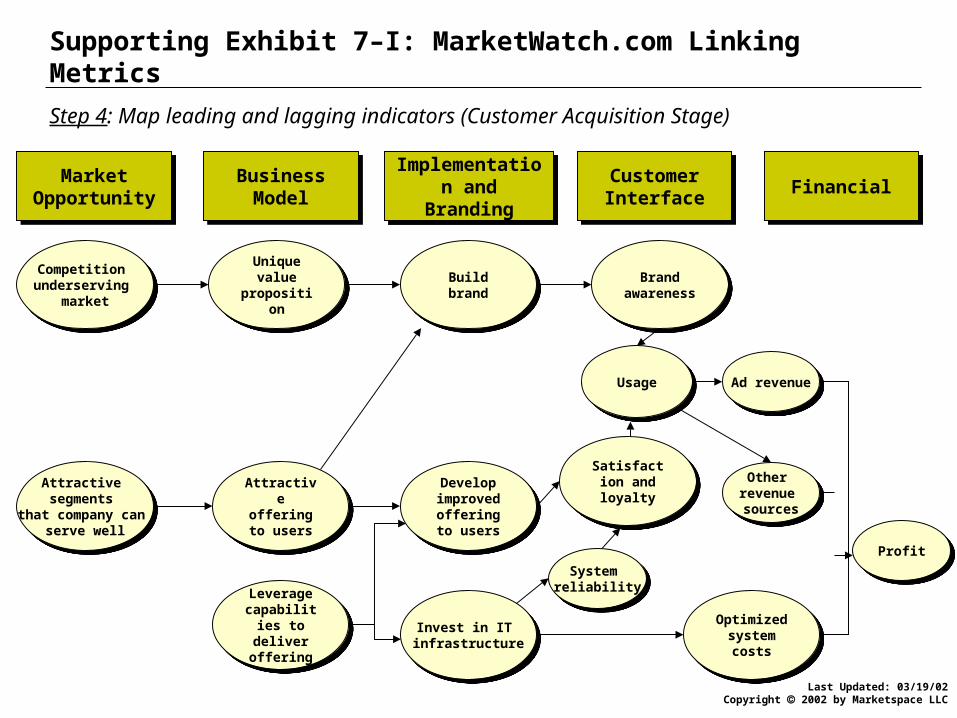
Supporting Exhibit 7–I: MarketWatch.com Linking Metrics
Market Opportunity
Market Opportunity
Business Model
Business Model
Implementation and Branding
Implementation and Branding
Customer Interface
Customer Interface FinancialFinancial
Competition underserving
market
Competition underserving
market
Unique value
proposition
Unique value
propositionBuild brandBuild brand Brand
awareness
Brand awareness
Attractive segments
that company can serve well
Attractive segments
that company can serve well
Attractive offering to
users
Attractive offering to
users
Develop improved offering to
users
Develop improved offering to
users
Satisfaction and loyalty
Satisfaction and loyalty
Leverage capabilities to deliver offering
Leverage capabilities to deliver offering
Invest in IT infrastructure
Invest in IT infrastructure
Optimized system costs
Optimized system costs
Ad revenueAd revenue
Other revenue sources
Other revenue sources
UsageUsage
ProfitProfit
System reliability
System reliability
Step 4: Map leading and lagging indicators (Customer Acquisition Stage)
Last Updated: 03/19/02Copyright 2002 by Marketspace LLC
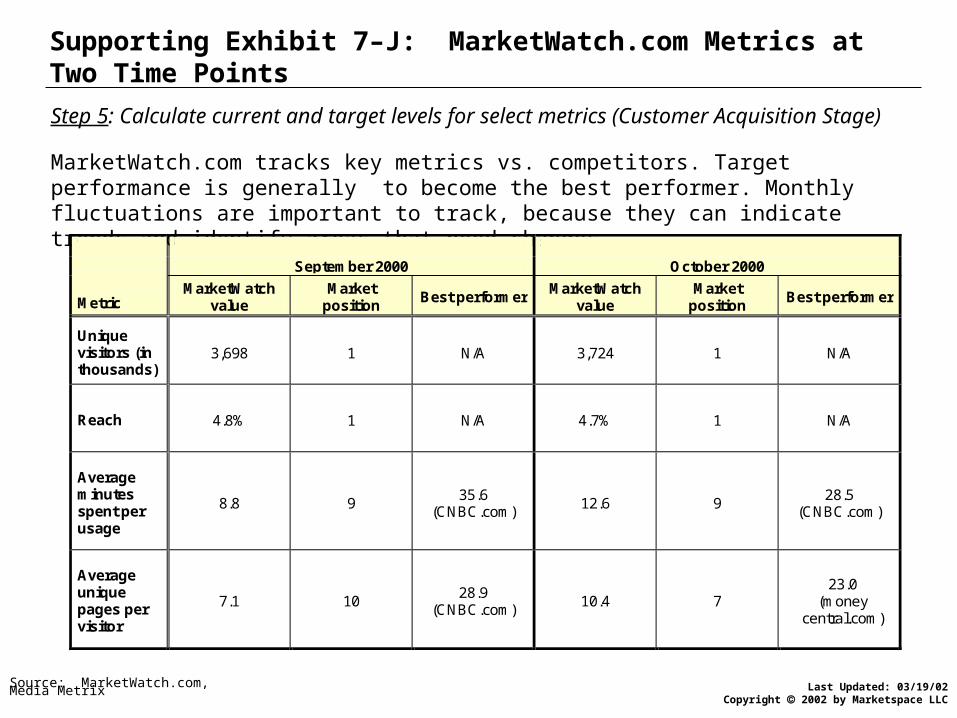
Supporting Exhibit 7–J: MarketWatch.com Metrics at Two Time Points
Source: MarketWatch.com, Media Metrix
Step 5: Calculate current and target levels for select metrics (Customer Acquisition Stage)
MarketWatch.com tracks key metrics vs. competitors. Target performance is generally to become the best performer. Monthly fluctuations are important to track, because they can indicate trends and identify areas that need changes.
September 2000 October 2000 Metric
MarketWatch value
Market position
Best performer MarketWatch
value Market
position Best performer
Unique visitors (in thousands)
3,698 1 N/A 3,724 1 N/A
Reach 4.8% 1 N/A 4.7% 1 N/A
Average minutes spent per usage
8.8 9 35.6
(CNBC.com) 12.6 9
28.5 (CNBC.com)
Average unique pages per visitor
7.1 10 28.9
(CNBC.com) 10.4 7
23.0 (money
central.com)
Last Updated: 03/19/02Copyright 2002 by Marketspace LLC
Chapter 7:Metrics
Purposes of metrics
Comprehensive measures of performance
Implementing performance metrics
Example of metrics development: MarketWatch.com
Sources of metrics information
Case study: Schwab
Conclusion
Last Updated: 03/19/02Copyright 2002 by Marketspace LLC
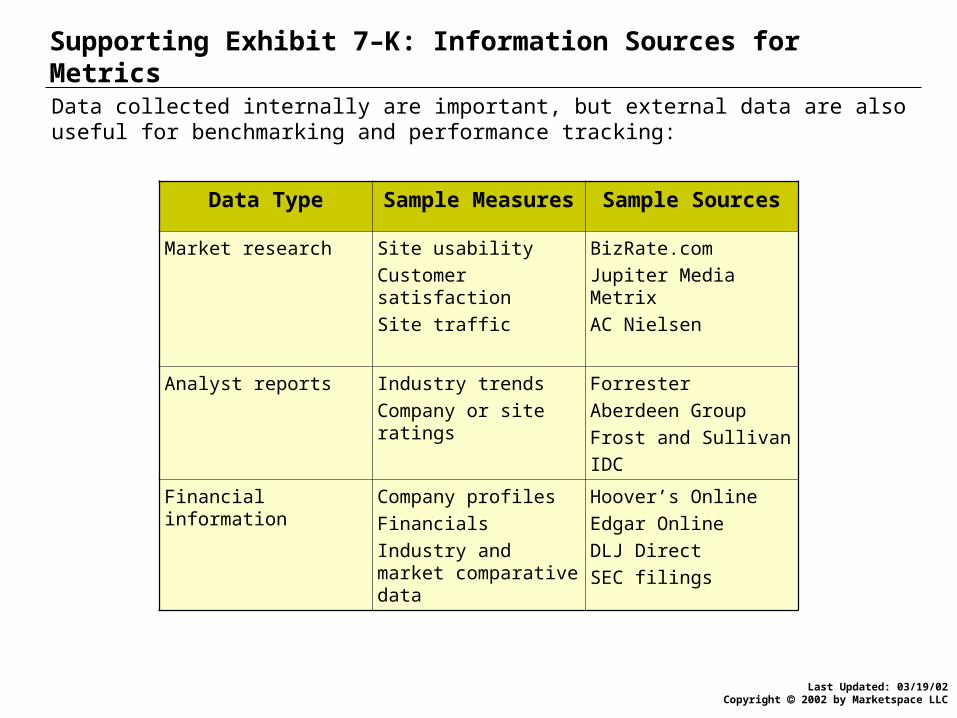
Supporting Exhibit 7–K: Information Sources for MetricsData collected internally are important, but external data are also useful for benchmarking and performance tracking:
Data Type Sample Measures Sample Sources
Market research Site usability
Customer satisfaction
Site traffic
BizRate.com
Jupiter Media Metrix
AC Nielsen
Analyst reports Industry trends
Company or site ratings
Forrester
Aberdeen Group
Frost and Sullivan
IDC
Financial information Company profiles
Financials
Industry and market comparative data
Hoover’s Online
Edgar Online
DLJ Direct
SEC filings
Last Updated: 03/19/02Copyright 2002 by Marketspace LLC
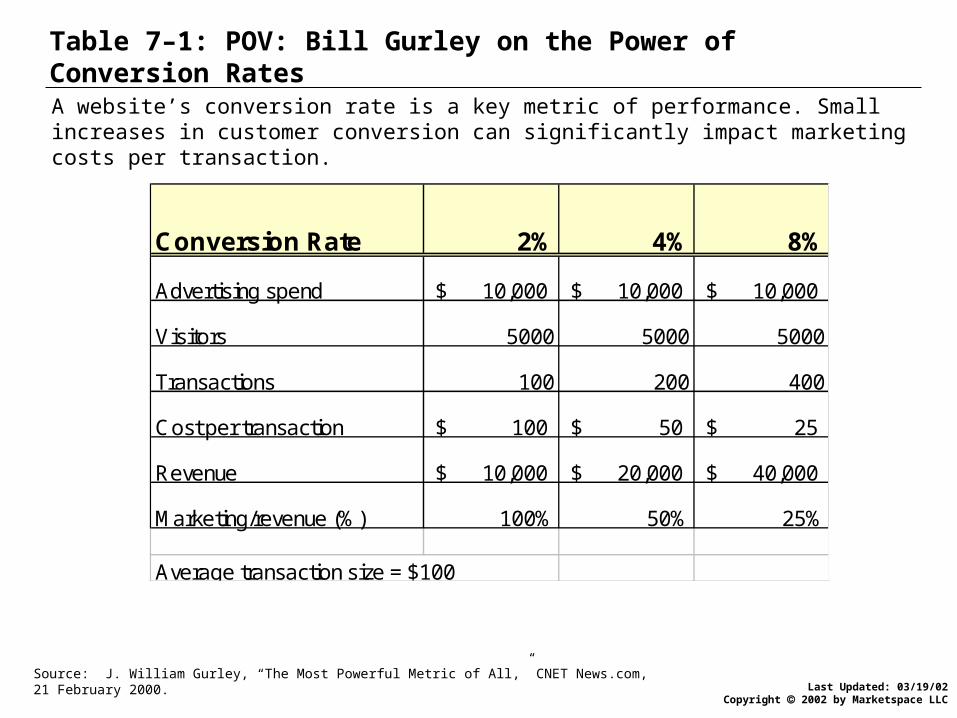
Table 7–1: POV: Bill Gurley on the Power of Conversion Rates
Conversion Rate 2% 4% 8%
Advertising spend 10,000$ 10,000$ 10,000$
Visitors 5000 5000 5000
Transactions 100 200 400
Cost per transaction 100$ 50$ 25$
Revenue 10,000$ 20,000$ 40,000$
Marketing/revenue (%) 100% 50% 25%
Average transaction size = $100
Source: J. William Gurley, “The Most Powerful Metric of All,” CNET News.com, 21 February 2000.
A website’s conversion rate is a key metric of performance. Small increases in customer conversion can significantly impact marketing costs per transaction.
Last Updated: 03/19/02Copyright 2002 by Marketspace LLC
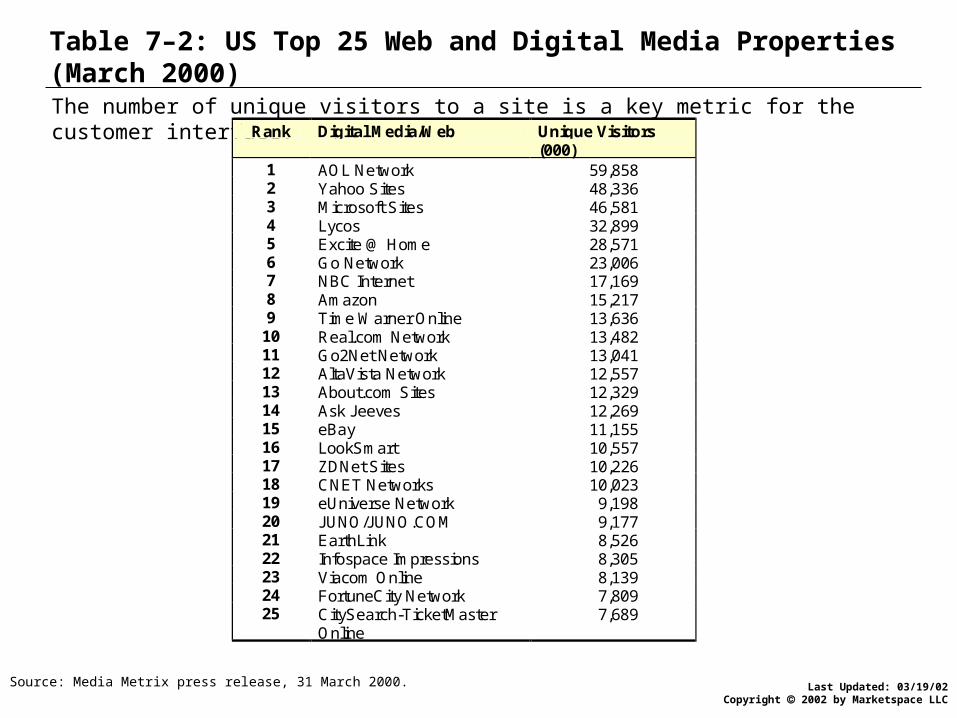
Table 7–2: US Top 25 Web and Digital Media Properties (March 2000)
Source: Media Metrix press release, 31 March 2000.
The number of unique visitors to a site is a key metric for the customer interface.Rank Digital Media/Web Unique Visitors
(000) 1 AOL Network 59,858 2 Yahoo Sites 48,336 3 Microsoft Sites 46,581 4 Lycos 32,899 5 Excite @ Home 28,571 6 Go Network 23,006 7 NBC Internet 17,169 8 Amazon 15,217 9 Time Warner Online 13,636 10 Real.com Network 13,482 11 Go2Net Network 13,041 12 AltaVista Network 12,557 13 About.com Sites 12,329 14 Ask Jeeves 12,269 15 eBay 11,155 16 LookSmart 10,557 17 ZDNet Sites 10,226 18 CNET Networks 10,023 19 eUniverse Network 9,198 20 JUNO/JUNO.COM 9,177 21 EarthLink 8,526 22 Infospace Impressions 8,305 23 Viacom Online 8,139 24 FortuneCity Network 7,809 25 CitySearch-TicketMaster
Online 7,689

Last Updated: 03/19/02Copyright 2002 by Marketspace LLC
Supporting Exhibit 7–L: US Top 25 Web and Digital Media Properties (December 2000 and November 2001)
Source: Media Metrix press releases, 16 January 2001 and 26 December 2001
2000 2001 Rank Web/Digital Media Unique Visitors
(in thousands) Rank Web/Digital Media Unique Visitors
(in thousands) 1 AOL Network 60,562 1 AOL Time Warner Network 83,843 2 Yahoo sites 54,626 2 MSN-Microsoft sites 74,782 3 Microsoft sites 53,809 3 Yahoo sites 71,976 4 Excite Network 30,819 4 Terra Lycos 38,299 5 Lycos 29,965 5 Vivendi-Universal sites 35,793 6 About the Human Internet 21,279 6 About/Primedia 30,974 7 Amazon 21,053 7 Amazon sites 30,326 8 Walt Disney Internet Group 20,469 8 eBay 28,364 9 CNET Networks Digital 19,953 9 American Greetings Property 25,540 10 eBay 19,536 10 CNET Networks 23,262 11 Alta Vista Network 18,718 11 eUniverse Network 23,054 12 Infospace Impressions 18,042 12 Google Sites 22,256 13 Time Warner Online 17,027 13 InfoSpace, Inc. 21,928 14 NBC Internet Site 15,921 14 Excite Network 20,723 15 eUniverse Network 15,134 15 Walt Disney Internet Group 20,123 16 Look Smart 13,647 16 Ask Jeeves 17,667 17 Grab.com 13,479 17 Viacom Online 17,366 18 Real.com Network 12,753 18 Classmates.com sites 15,080 19 The Weather Channel 12,461 19 Real.com Network 14,823 20 The Uproar Network 11,889 20 AT&T Properties 14,724 21 Ask Jeeves 11,853 21 Columbia House sites 14,508 22 Viacom Online 11,825 22 Gator Network 13,093 23 American Greetings 9,355 23 Ticketmaster sites 12,526 24 Network Commerce 9,150 24 Bizrate.com 12,092 25 AT&T Websites 9,121 25 United Airline, Inc 11,573

Last Updated: 03/19/02Copyright 2002 by Marketspace LLC
Exhibit 7–5: Market Research Source — BizRate.comBizRate asks consumers to rate the performance of an online store.
“Ten dimensions of service”
Last Updated: 03/19/02Copyright 2002 by Marketspace LLC
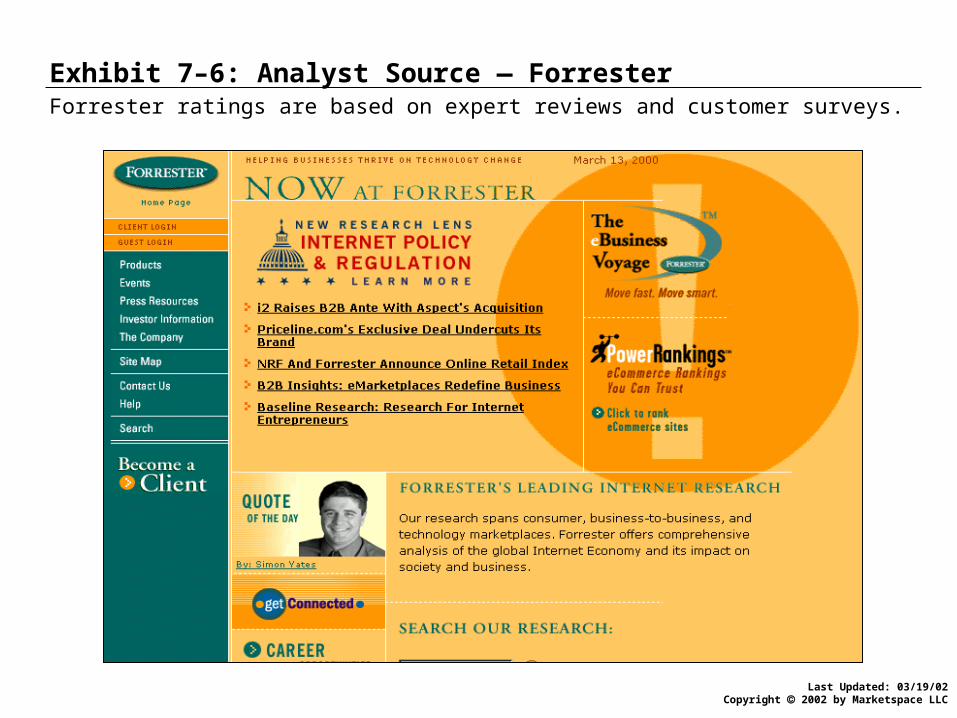
Exhibit 7–6: Analyst Source — ForresterForrester ratings are based on expert reviews and customer surveys.
Last Updated: 03/19/02Copyright 2002 by Marketspace LLC
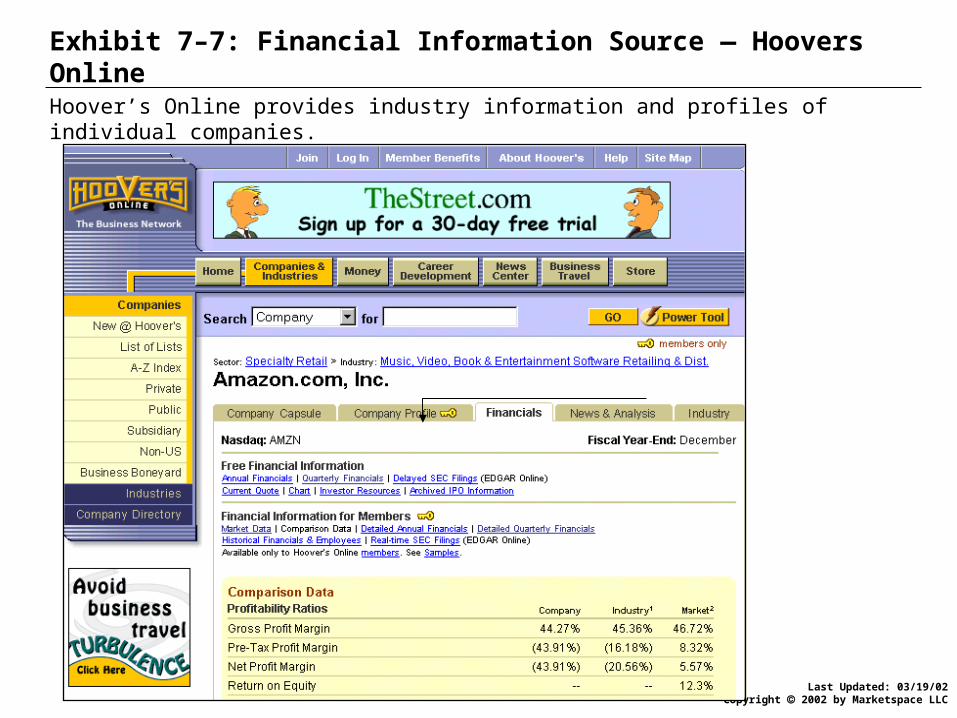
Exhibit 7–7: Financial Information Source — Hoovers OnlineHoover’s Online provides industry information and profiles of individual companies.
Last Updated: 03/19/02Copyright 2002 by Marketspace LLC
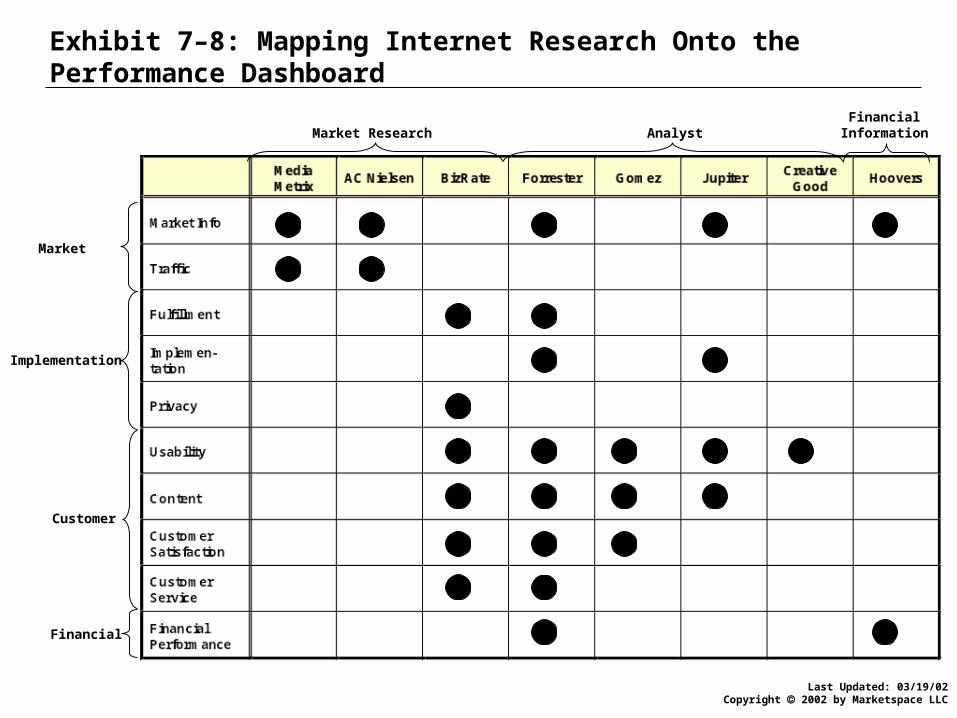
Exhibit 7–8: Mapping Internet Research Onto the Performance Dashboard
Market
Implementation
Customer
Financial
Market Research AnalystFinancial
Information
Last Updated: 03/19/02Copyright 2002 by Marketspace LLC
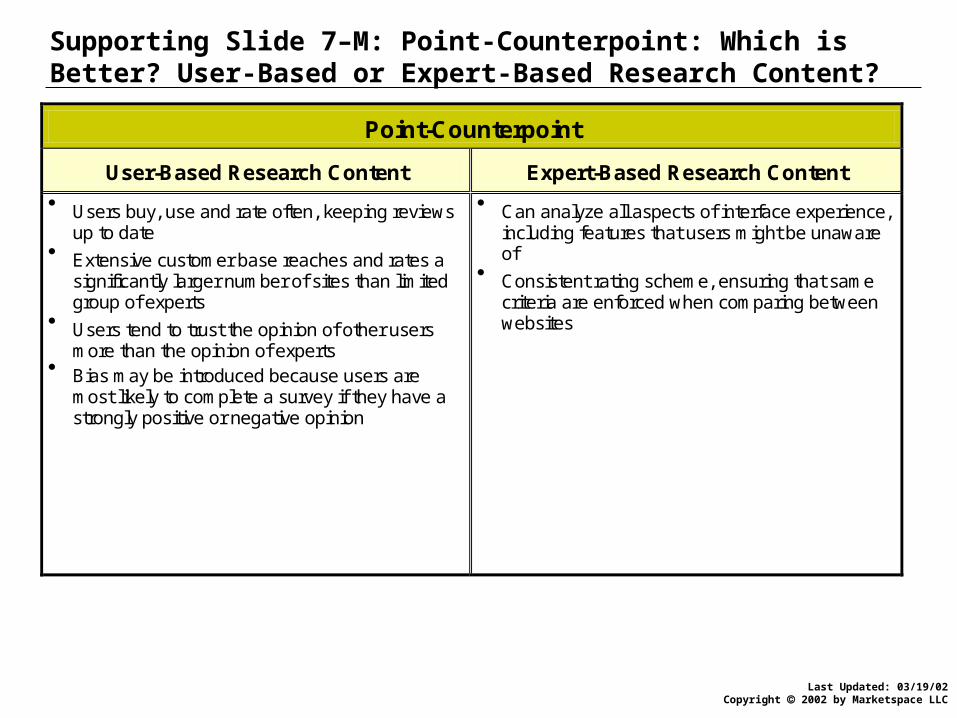
Supporting Slide 7–M: Point-Counterpoint: Which is Better? User-Based or Expert-Based Research Content?
Point-Counterpoint
User-Based Research Content Expert-Based Research Content
Users buy, use and rate often, keeping reviews up to date
Extensive customer base reaches and rates a significantly larger number of sites than limited group of experts
Users tend to trust the opinion of other users more than the opinion of experts
Bias may be introduced because users are most likely to complete a survey if they have a strongly positive or negative opinion
Can analyze all aspects of interface experience, including features that users might be unaware of
Consistent rating scheme, ensuring that same criteria are enforced when comparing between websites

Last Updated: 03/19/02Copyright 2002 by Marketspace LLC
Supporting Slide 7–W: Point-Counterpoint:Which is Better? Offline or Online Data Sources?
Point-Counterpoint
Offline Research Online Research
Advantages Allows richer interactions, such as focus groups
and in-depth phone interviews Can address an unbiased group of respondents
- does not only address online respondents
Disadvantages Labor and time intensive - questions asked in
person by telephone or by filling out surveys Data collection is costly and not scalable - very
difficult to conduct extensive survey at the point of purchase
Data must be entered for analysis - resource intensive process, subject to human error
Cannot measure people’s behavior - only opinions
Only allows for low or highly costly interactivity - interactivity requires highly trained phone interviewers
Advantages Fixed cost with almost no variable cost and
hence is highly scalable Automatic data entry, eliminating unnecessary
labor, cost and potential for human error Easy-to-conduct point-of-purchase research Can ensure higher level of data completeness
and accuracy by performing automatic error and gap checks
Disadvantages Selection bias for people with Internet access Concerns over privacy, since many users are
not aware of how their data can or will be used
Last Updated: 03/19/02Copyright 2002 by Marketspace LLC
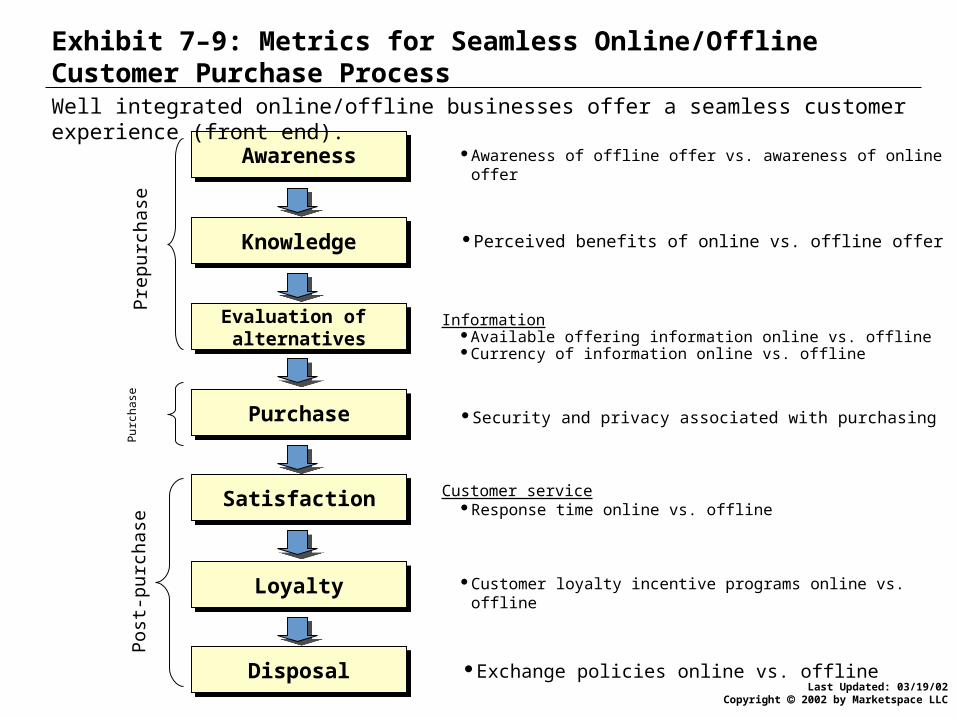
Exhibit 7–9: Metrics for Seamless Online/Offline Customer Purchase Process
Awareness of offline offer vs. awareness of online offer
Perceived benefits of online vs. offline offer
InformationAvailable offering information online vs. offlineCurrency of information online vs. offline
Security and privacy associated with purchasing
Customer serviceResponse time online vs. offline
Customer loyalty incentive programs online vs. offline
Exchange policies online vs. offline
AwarenessAwareness
KnowledgeKnowledge
Evaluation of alternatives
Evaluation of alternatives
PurchasePurchase
SatisfactionSatisfaction
LoyaltyLoyalty
DisposalDisposal
Pre
pur
chas
eP
ost-
purc
hase
Pur
chas
e
Well integrated online/offline businesses offer a seamless customer experience (front end).
Last Updated: 03/19/02Copyright 2002 by Marketspace LLC
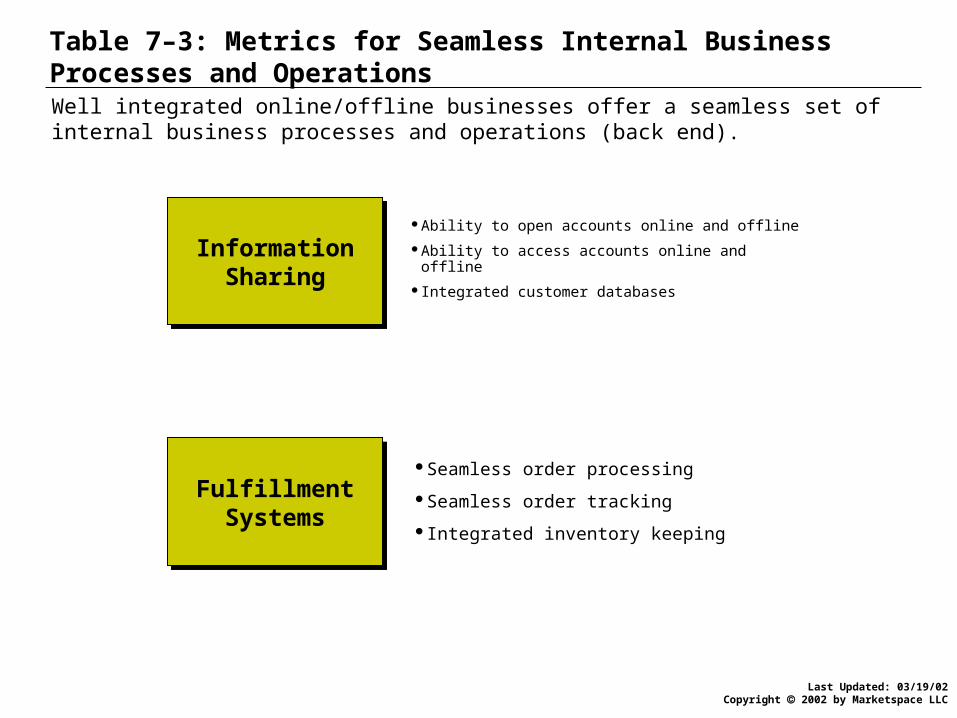
Table 7–3: Metrics for Seamless Internal Business Processes and Operations
Ability to open accounts online and offline
Ability to access accounts online and offline
Integrated customer databases
InformationSharing
InformationSharing
FulfillmentSystems
FulfillmentSystems
Seamless order processing
Seamless order tracking
Integrated inventory keeping
Well integrated online/offline businesses offer a seamless set of internal business processes and operations (back end).
Last Updated: 03/19/02Copyright 2002 by Marketspace LLC
Chapter 7:Metrics
Purposes of metrics
Comprehensive measures of performance
Implementing performance metrics
Example of metrics development: MarketWatch.com
Sources of metrics information
Case study: Schwab
Conclusion
Last Updated: 03/19/02Copyright 2002 by Marketspace LLC
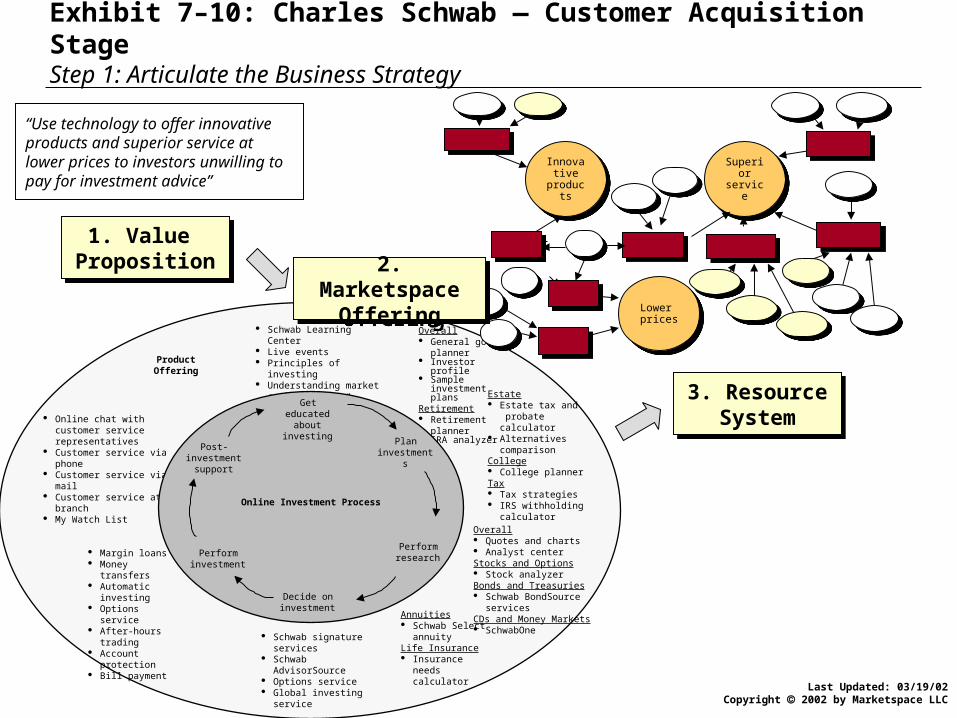
Exhibit 7–10: Charles Schwab — Customer Acquisition StageStep 1: Articulate the Business Strategy
“Use technology to offer innovative products and superior service at lower prices to investors unwilling to pay for investment advice”
Schwab Learning Center Live events Principles of investing Understanding market
cycles “Did you know” Q&A
Schwab signature services
Schwab AdvisorSource Options service Global investing service
Online chat with customer service representatives
Customer service via phone Customer service via e-mail Customer service at branch My Watch List
Margin loans Money transfers Automatic
investing Options service After-hours
trading Account
protection Bill payment
Overall General goal
planner Investor profile Sample
investment plansRetirement Retirement
planner IRA analyzer
Product Offering
Online Investment Process
Get educated about
investing
Plan investments
Decide on investment
Perform investment
Post-investment support
Perform research
Estate Estate tax and
probate calculator Alternatives
comparisonCollege College plannerTax Tax strategies IRS withholding
calculator
Overall Quotes and charts Analyst centerStocks and Options Stock analyzerBonds and Treasuries Schwab BondSource
servicesCDs and Money Markets SchwabOne
Annuities Schwab Select
annuityLife Insurance Insurance needs
calculator
Superior
service
Superior
service
Lower prices
Lower prices
Innovative
products
Innovative
products
1. Value Proposition
1. Value Proposition
2. Marketspace Offering
2. Marketspace Offering
3. Resource System
3. Resource System

Last Updated: 03/19/02Copyright 2002 by Marketspace LLC
Exhibit 7–11: Schwab Desired Outcome Summary Step 2: Translate strategy into key outcomes (Customer Acquisition Stage)
Market Opportunity
• Significant opportunity• Financially attractive segment• Competitively attractive segment
Business Model
• Value proposition vs. competition• Offer vs. competition• Capabilities vs. competition• Sustainability of value proposition
Customer Interface and Outcomes
• Lower customer acquisition costs• Transition customer base• Outperform competition on interface perceptions
• Customer satisfaction and loyalty
Implementation and Branding
• Brand associations vs. competition• Best-in-class IT infrastructure• Ability to deliver brand promise
Financial Evaluation
• Revenue• Profit• Cost• Balance sheet
BusinessModel
Last Updated: 03/19/02Copyright 2002 by Marketspace LLC
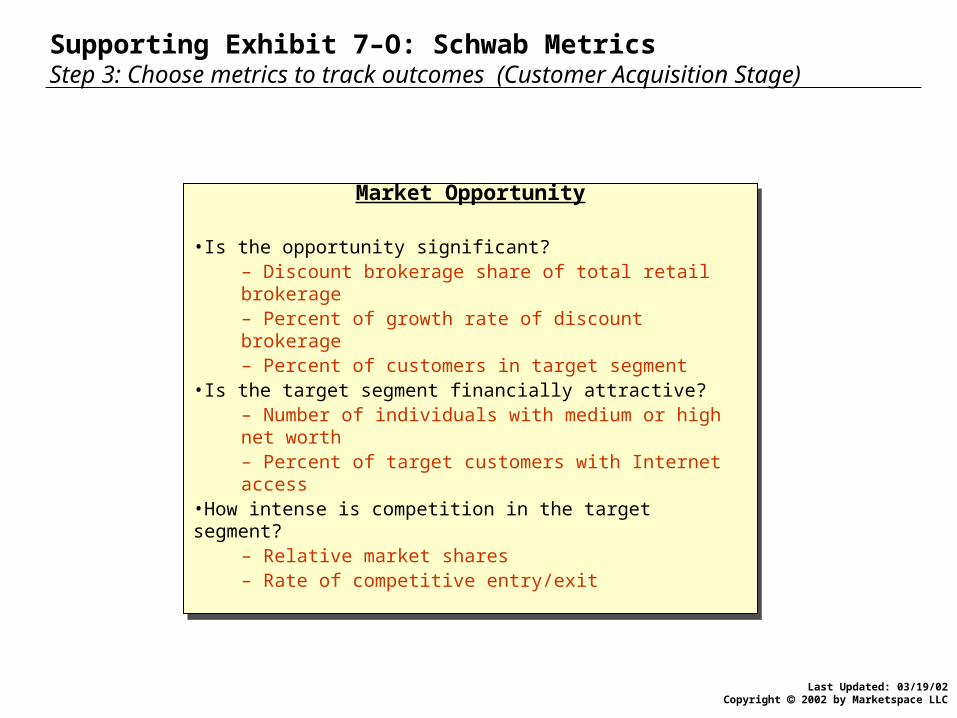
Supporting Exhibit 7–O: Schwab Metrics Step 3: Choose metrics to track outcomes (Customer Acquisition Stage)
Market Opportunity
•Is the opportunity significant?– Discount brokerage share of total retail brokerage– Percent of growth rate of discount brokerage– Percent of customers in target segment
•Is the target segment financially attractive?– Number of individuals with medium or high net worth – Percent of target customers with Internet access
•How intense is competition in the target segment? – Relative market shares– Rate of competitive entry/exit
Last Updated: 03/19/02Copyright 2002 by Marketspace LLC
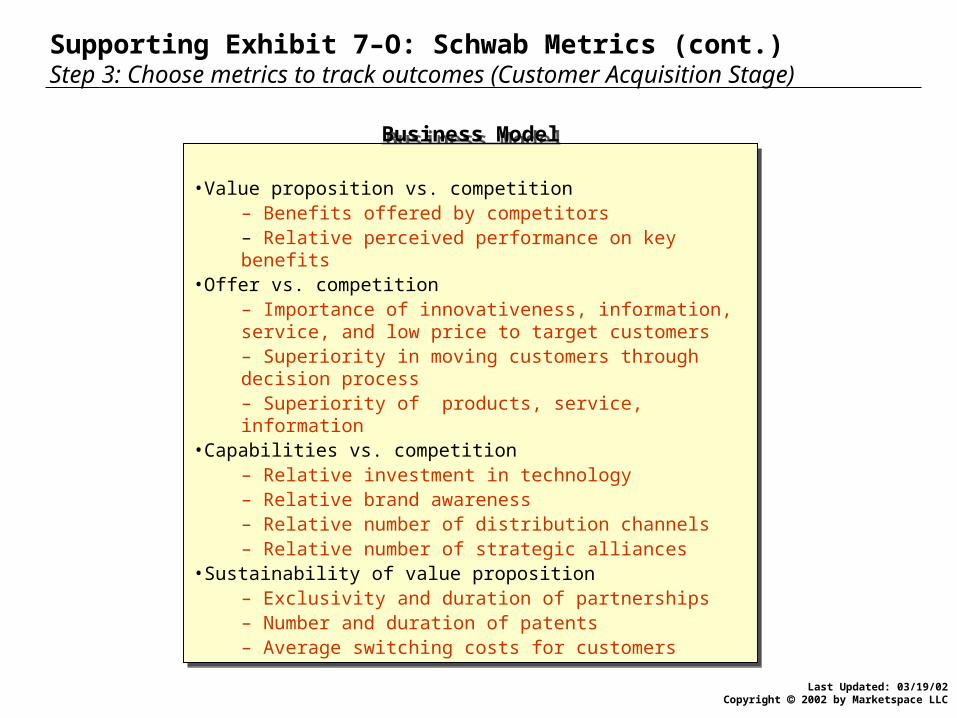
Supporting Exhibit 7–O: Schwab Metrics (cont.) Step 3: Choose metrics to track outcomes (Customer Acquisition Stage)
Business Model
•Value proposition vs. competition– Benefits offered by competitors– Relative perceived performance on key benefits
•Offer vs. competition– Importance of innovativeness, information, service, and low price to target customers– Superiority in moving customers through decision process– Superiority of products, service, information
•Capabilities vs. competition– Relative investment in technology– Relative brand awareness– Relative number of distribution channels– Relative number of strategic alliances
•Sustainability of value proposition– Exclusivity and duration of partnerships– Number and duration of patents– Average switching costs for customers

Last Updated: 03/19/02Copyright 2002 by Marketspace LLC
Supporting Exhibit 7–O: Schwab Metrics (cont.) Step 3: Choose metrics to track outcomes (Customer Acquisition Stage)
Branding and Implementation
•Brand associations vs. competition– Unprompted brand awareness– Schwab brand associations– Schwab online investing associations
•Best-in-class IT Infrastructure– Trade capacity to volume ratio– Simultaneous users capacity– System uptime– Speed of routing information– Number of security breaches
•Ability to deliver brand promise– Number and staffing of branches– Salesperson training– Time to respond to and resolve problems– Percent of orders not filled or not filled accurately
Last Updated: 03/19/02Copyright 2002 by Marketspace LLC
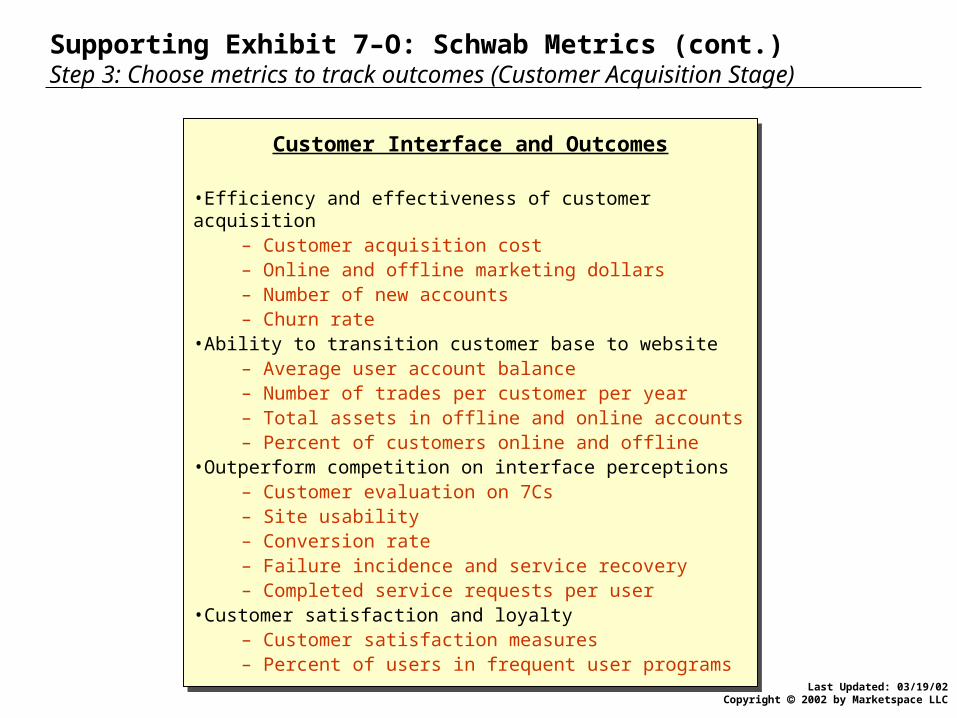
Supporting Exhibit 7–O: Schwab Metrics (cont.) Step 3: Choose metrics to track outcomes (Customer Acquisition Stage)
Customer Interface and Outcomes
•Efficiency and effectiveness of customer acquisition– Customer acquisition cost– Online and offline marketing dollars– Number of new accounts– Churn rate
•Ability to transition customer base to website– Average user account balance– Number of trades per customer per year– Total assets in offline and online accounts– Percent of customers online and offline
•Outperform competition on interface perceptions– Customer evaluation on 7Cs– Site usability– Conversion rate– Failure incidence and service recovery– Completed service requests per user
•Customer satisfaction and loyalty– Customer satisfaction measures– Percent of users in frequent user programs
Last Updated: 03/19/02Copyright 2002 by Marketspace LLC
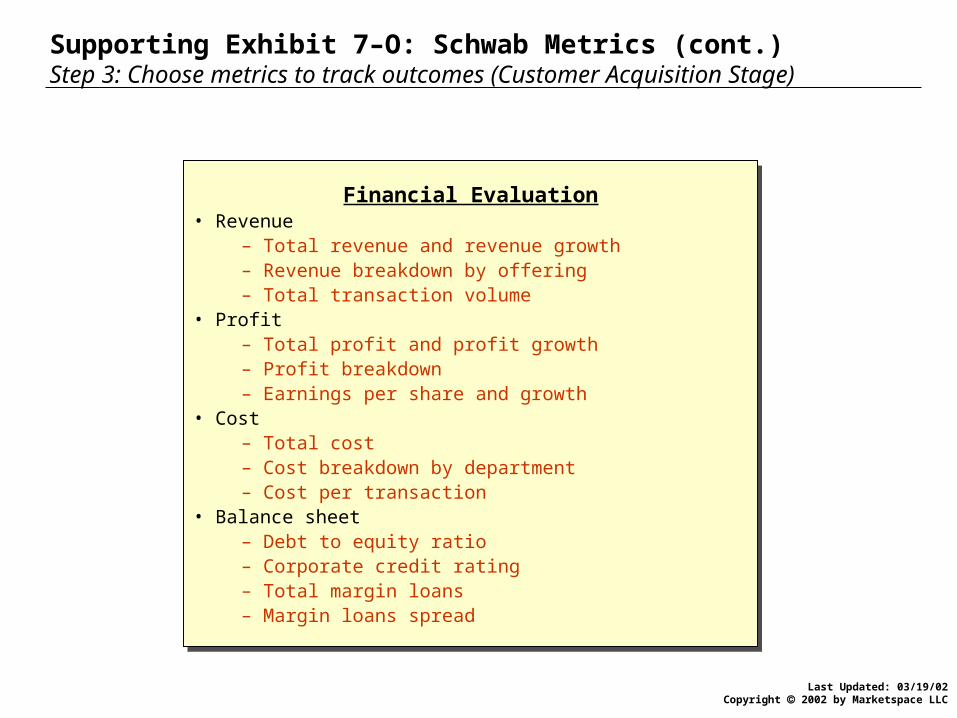
Supporting Exhibit 7–O: Schwab Metrics (cont.) Step 3: Choose metrics to track outcomes (Customer Acquisition Stage)
Financial Evaluation• Revenue
– Total revenue and revenue growth– Revenue breakdown by offering– Total transaction volume
• Profit– Total profit and profit growth– Profit breakdown– Earnings per share and growth
• Cost– Total cost– Cost breakdown by department– Cost per transaction
• Balance sheet– Debt to equity ratio– Corporate credit rating– Total margin loans– Margin loans spread

Last Updated: 03/19/02Copyright 2002 by Marketspace LLC
Exhibit 7–12: Charles Schwab – Customer Acquisition Stage Step 4: Map leading and lagging indicators
BusinessModel
BusinessModel
Implementationand Branding
Implementationand Branding CustomerCustomer FinancialFinancial
Build brand
Build brand
Increase system uptime
Increase system uptime
Train branch
staff
Train branch
staff
Improve customer service
Improve customer service
Increase customer
loyalty
Increase customer
loyalty
Increase profit
Increase profit
Optimize cost
Optimize cost
Increase revenue
Increase revenue
Investin
technology
Investin
technology
Increase number of
IT staff
Increase number of
IT staff
Increase customer satisfactio
n
Increase customer satisfactio
n
Increase usage
Increase usage
Acquire new
customers
Acquire new
customers
MarketOpportunity
MarketOpportunity
Avoid crowded markets
Avoid crowded markets
Play in attractive market
Play in attractive market
Target attractive segments
Target attractive segments
Leverage capabilitie
s to deliver offering
Leverage capabilitie
s to deliver offering
Provide unique
viewpoint
Provide unique
viewpoint
Provide attractive offering
Provide attractive offering
Last Updated: 03/19/02Copyright 2002 by Marketspace LLC
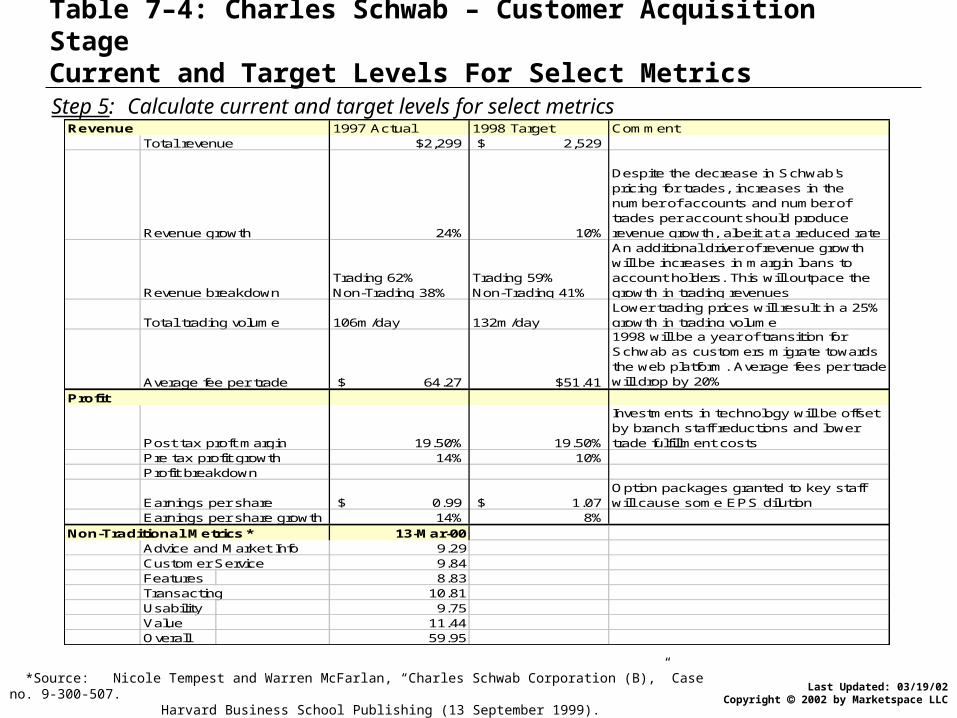
*Source: Nicole Tempest and Warren McFarlan, “Charles Schwab Corporation (B),” Case no. 9-300-507. Harvard Business School Publishing (13 September 1999).
Table 7–4: Charles Schwab – Customer Acquisition StageCurrent and Target Levels For Select MetricsStep 5: Calculate current and target levels for select metrics
Revenue 1997 Actual 1998 Target CommentTotal revenue $2,299 2,529$
Revenue growth 24% 10%
Despite the decrease in Schwab's pricing for trades, increases in the number of accounts and number of trades per account should produce revenue growth, albeit at a reduced rate
Revenue breakdownTrading 62%Non-Trading 38%
Trading 59%Non-Trading 41%
An additional driver of revenue growth will be increases in margin loans to account holders. This will outpace the growth in trading revenues
Total trading volume 106m/day 132m/dayLower trading prices will result in a 25% growth in trading volume
Average fee per trade 64.27$ $51.41
1998 will be a year of transition for Schwab as customers migrate towards the web platform. Average fees per trade will drop by 20%
Profit
Post tax proft margin 19.50% 19.50%
Investments in technology will be offset by branch staff reductions and lower trade fulfillment costs
Pre tax profit growth 14% 10%Profit breakdown
Earnings per share 0.99$ 1.07$ Option packages granted to key staff will cause some EPS dilution
Earnings per share growth 14% 8%Non-Traditional Metrics * 13-Mar-00
Advice and Market Info 9.29Customer Service 9.84Features 8.83Transacting 10.81Usability 9.75Value 11.44Overall 59.95
Last Updated: 03/19/02Copyright 2002 by Marketspace LLC
Chapter 7:Metrics
Purposes of metrics Comprehensive measures of performance Implementing performance metrics Example of metrics development: MarketWatch.com Sources of metrics information Case study: Schwab Conclusion

Last Updated: 03/19/02Copyright 2002 by Marketspace LLC
Metrics — Conclusion
Why should senior managers be concerned with metrics? How does the Balanced Scorecard assess the performance of
firms? What are its strengths and weaknesses with respect to new-economy firms?
What are the steps to implement the Performance Dashboard? What types of data can firms use for metrics? What are the
strengths and limitations of each kind of data?
After today’s lesson, you should be able to answer the following questions:
Related Documents