THE JOURNAL OF CHEMICAL PHYSICS 139, 124506 (2013) Cooee bitumen: Chemical aging Claire A. Lemarchand, a) Thomas B. Schrøder, Jeppe C. Dyre, and Jesper S. Hansen DNRF Centre “Glass and Time”, IMFUFA, Department of Sciences, Roskilde University, Postbox 260, DK-4000 Roskilde, Denmark (Received 9 July 2013; accepted 4 September 2013; published online 25 September 2013) We study chemical aging in “Cooee bitumen” using molecular dynamic simulations. This model bi- tumen is composed of four realistic molecule types: saturated hydrocarbon, resinous oil, resin, and asphaltene. The aging reaction is modelled by the chemical reaction: “2 resins → 1 asphaltene.” Molecular dynamic simulations of four bitumen compositions, obtained by a repeated application of the aging reaction, are performed. The stress autocorrelation function, the fluid structure, the rota- tional dynamics of the plane aromatic molecules, and the diffusivity of each molecule are determined for the four different compositions. The aging reaction causes a significant dynamics slowdown, which is correlated to the aggregation of asphaltene molecules in larger and dynamically slower nanoaggregates. Finally, a detailed description of the role of each molecule types in the aggregation and aging processes is given. © 2013 AIP Publishing LLC.[http://dx.doi.org/10.1063/1.4821616] I. INTRODUCTION Road deterioration is partly due to the aging of bitumen, of which viscosity 1–4 and brittleness 5, 6 increase over years. Bitumen chemical species can be categorized into the SARA classification, 7 for which S stands for saturates, the first A for aromatics, R for resins, and the second A for asphaltenes. As- phaltene molecules represent the crude oil fraction not solu- ble in alkane, usually heptane 7–9 and are the largest molecules found in crude oil. Chemical aging is characterized by an in- crease of the asphaltene content in bitumen. 1–4 Experimental work has shown that an increase of the asphaltene content leads to an increase in viscosity. 10–12 It is known from the experimental 13–16 and theoretical 18, 19 literature that asphaltene molecules tend to aggregate. In an aggregate the plane aromatic asphaltene bodies tend to align. 18, 20 We conjecture that nanoaggregates play a key role in the bitumen dynamics and lie behind the increase in viscosity observed as bitumen ages. The role of the other molecule types described in the SARA classification in the asphaltene aggregation is not completely clear. 21 In this article, we model chemical aging through a re- action transforming resins into asphaltenes. This reaction is supported by experimental evidence showing that as bitumen ages, the average molecular mass increases. 1, 3, 4, 17 A model bitumen developed in a previous work, 19 in the framework of the Cooee project, 22 is well adapted to implement this aging reaction because it contains one molecule of each class de- scribed in the SARA classification. In this context, we wish to address the following three questions: 1. Is there an effect of the aging reaction on the rheological properties? 2. If there is, is it correlated to asphaltene aggregation? 3. What is the role of the other molecular species in the aggregation and in the aging processes? a) Author to whom correspondence should be addressed. Electronic mail: [email protected] To answer these three questions, we performed molecu- lar dynamic simulations of bitumen at four different chemical compositions, representing different stages in the aging pro- cess. For each composition, the rheological properties were first studied through the stress autocorrelation function. Then, the aggregate structure was identified and quantified. Finally, dynamical properties defined at the molecular level such as the rotational dynamics of the aromatic plane molecules and the diffusivity of each molecule type, were computed for each composition. They bring fundamental new insight about the aggregates’ dynamics as bitumen ages and the role of each molecule in the aging and aggregation processes. The paper is organized as follows. Section II contains numerical methods. The stress autocorrelation function is studied in Sec. III. Section IV quantifies the nanoaggregate structure. Sections V and VI discuss results about rotational dynamics and diffusivity, respectively. A model describing the role of each molecule in the aggregation and aging processes is built up from these results. Section VII contains a summary. II. SIMULATION METHOD A. Molecular dynamics To study chemical aging of bitumen, we used molecular dynamic simulations, which have been employed previously to investigate bitumen. 18–20, 23 The simulations features used are described in detail in Ref. 19 and summarized here. 1. GPU computing To probe the slow dynamics in bitumen, molecular dy- namic simulations need to reach long time spans. To this end, the simulations were performed on Graphic-Processor-Units (GPU) using the RUMD package (version 1.2). 24 Each sim- ulation performed in this work has a time span of 0.35 μs, which corresponds to two weeks of computation time. 0021-9606/2013/139(12)/124506/12/$30.00 © 2013 AIP Publishing LLC 139, 124506-1

Welcome message from author
This document is posted to help you gain knowledge. Please leave a comment to let me know what you think about it! Share it to your friends and learn new things together.
Transcript

THE JOURNAL OF CHEMICAL PHYSICS 139, 124506 (2013)
Cooee bitumen: Chemical agingClaire A. Lemarchand,a) Thomas B. Schrøder, Jeppe C. Dyre, and Jesper S. HansenDNRF Centre “Glass and Time”, IMFUFA, Department of Sciences, Roskilde University, Postbox 260,DK-4000 Roskilde, Denmark
(Received 9 July 2013; accepted 4 September 2013; published online 25 September 2013)
We study chemical aging in “Cooee bitumen” using molecular dynamic simulations. This model bi-tumen is composed of four realistic molecule types: saturated hydrocarbon, resinous oil, resin, andasphaltene. The aging reaction is modelled by the chemical reaction: “2 resins → 1 asphaltene.”Molecular dynamic simulations of four bitumen compositions, obtained by a repeated application ofthe aging reaction, are performed. The stress autocorrelation function, the fluid structure, the rota-tional dynamics of the plane aromatic molecules, and the diffusivity of each molecule are determinedfor the four different compositions. The aging reaction causes a significant dynamics slowdown,which is correlated to the aggregation of asphaltene molecules in larger and dynamically slowernanoaggregates. Finally, a detailed description of the role of each molecule types in the aggregationand aging processes is given. © 2013 AIP Publishing LLC. [http://dx.doi.org/10.1063/1.4821616]
I. INTRODUCTION
Road deterioration is partly due to the aging of bitumen,of which viscosity1–4 and brittleness5, 6 increase over years.Bitumen chemical species can be categorized into the SARAclassification,7 for which S stands for saturates, the first A foraromatics, R for resins, and the second A for asphaltenes. As-phaltene molecules represent the crude oil fraction not solu-ble in alkane, usually heptane7–9 and are the largest moleculesfound in crude oil. Chemical aging is characterized by an in-crease of the asphaltene content in bitumen.1–4 Experimentalwork has shown that an increase of the asphaltene contentleads to an increase in viscosity.10–12
It is known from the experimental13–16 andtheoretical18, 19 literature that asphaltene molecules tendto aggregate. In an aggregate the plane aromatic asphaltenebodies tend to align.18, 20 We conjecture that nanoaggregatesplay a key role in the bitumen dynamics and lie behind theincrease in viscosity observed as bitumen ages. The role ofthe other molecule types described in the SARA classificationin the asphaltene aggregation is not completely clear.21
In this article, we model chemical aging through a re-action transforming resins into asphaltenes. This reaction issupported by experimental evidence showing that as bitumenages, the average molecular mass increases.1, 3, 4, 17 A modelbitumen developed in a previous work,19 in the framework ofthe Cooee project,22 is well adapted to implement this agingreaction because it contains one molecule of each class de-scribed in the SARA classification. In this context, we wishto address the following three questions:
1. Is there an effect of the aging reaction on the rheologicalproperties?
2. If there is, is it correlated to asphaltene aggregation?3. What is the role of the other molecular species in the
aggregation and in the aging processes?
a)Author to whom correspondence should be addressed. Electronic mail:[email protected]
To answer these three questions, we performed molecu-lar dynamic simulations of bitumen at four different chemicalcompositions, representing different stages in the aging pro-cess. For each composition, the rheological properties werefirst studied through the stress autocorrelation function. Then,the aggregate structure was identified and quantified. Finally,dynamical properties defined at the molecular level such asthe rotational dynamics of the aromatic plane molecules andthe diffusivity of each molecule type, were computed for eachcomposition. They bring fundamental new insight about theaggregates’ dynamics as bitumen ages and the role of eachmolecule in the aging and aggregation processes.
The paper is organized as follows. Section II containsnumerical methods. The stress autocorrelation function isstudied in Sec. III. Section IV quantifies the nanoaggregatestructure. Sections V and VI discuss results about rotationaldynamics and diffusivity, respectively. A model describing therole of each molecule in the aggregation and aging processesis built up from these results. Section VII contains a summary.
II. SIMULATION METHOD
A. Molecular dynamics
To study chemical aging of bitumen, we used moleculardynamic simulations, which have been employed previouslyto investigate bitumen.18–20, 23 The simulations features usedare described in detail in Ref. 19 and summarized here.
1. GPU computing
To probe the slow dynamics in bitumen, molecular dy-namic simulations need to reach long time spans. To this end,the simulations were performed on Graphic-Processor-Units(GPU) using the RUMD package (version 1.2).24 Each sim-ulation performed in this work has a time span of 0.35 μs,which corresponds to two weeks of computation time.
0021-9606/2013/139(12)/124506/12/$30.00 © 2013 AIP Publishing LLC139, 124506-1

124506-2 Lemarchand et al. J. Chem. Phys. 139, 124506 (2013)
FIG. 1. Structure of the four molecules in the “Cooee bitumen” model. Greyedges represent the carbon groups CH3, CH2, and CH and yellow edgesrepresent sulfur atoms. The “head” and “body” of the asphaltene moleculeare shown. Numbers and arrows indicate bond-vectors used to quantify thenanoaggregates’ structure and dynamics. See Secs. IV and V for details.
2. Molecules
To reproduce the SARA classification mentioned inthe Introduction, the Cooee bitumen contains four differentmolecule types: asphaltene, resin, resinous oil which repre-sents the aromatics class, and docosane which falls into thesaturates class.19 The structure chosen for each molecule isdisplayed in Fig. 1. The molecule structures come from theliterature, see Refs. 25–28. The asphaltene molecule, chosenin this work, is the largest of the four molecules consideredand contains two sulfur atoms. The resin molecule containsone sulfur atom. All molecules are aromatic except for thedocosane molecule.
3. Interaction nature
The methyl (CH3), methylene (CH2), and methine (CH)groups are represented by the same Lennard-Jones particle, aunited atomic unit (UAU) with molar mass 13.3 g mol−1 andLennard-Jones parameters σ = 3.75 Å and ε/kB = 75.4 K,where kB is the Boltzmann constant. For simplicity, sulfur
TABLE I. Force-field parameters, see Eq. (1). From Ref. 19.
Bonds lb ks
(Å) (kcal/mol)
All 1.46 403Angles θ0 kθ
(deg) (kcal/(mol rad2))Aromatic/cyclo 120 108Aliphatic 106 70Dihedrals Angle cn
(deg) (kcal/mol)Aromatic/cyclo 180 20 (n = 1)Aromatic/cyclo 0 −20 (n = 1)Linear/aliphatic Ryckaert-Belleman
atoms are modelled by the same Lennard-Jones interaction,but have a different molar mass of 32 g mol−1. Thus in thisdescription, molecules do not possess any polarity, and in-termolecular interactions are solely defined as van der Waalsinteractions.
Intramolecular interactions are modelled by flexiblebonds with length rij between two bonded UAUs i and j, an-gles θ between three bonded UAUs, and dihedral angles φ
between four bonded UAUs. The consequent full force fieldis given by
U (r) =∑
i
∑j>i
4ε
[( σ
rij
)12−
( σ
rij
)6]
+ 1
2
∑bonds
ks(rij − lb)2
+ 1
2
∑angles
kθ (cos θ − cos θ0)2 +∑
dihedrals
5∑n=0
cn cosn φ.
(1)
The values of the parameter ks, lb, kθ , θ0, and cn are listed inTable I, taken from a previous work.19
4. Choice of temperature, pressure and density
Simulations are performed in the canonical ensemble(NVT with a Nosé-Hoover thermostat) at a constant tempera-ture T = 452 K and a constant density. The density is scaledin each simulation so that the average pressure of the sys-tem is around 1 atm. The temperature chosen T = 452 K isclose to the temperature at which bitumen and stones are pro-cessed and mixed. It is also a high enough temperature so thatthe slow bitumen dynamics can be probed using moleculardynamics.19
B. Modeling chemical aging
In order to take chemical aging into account in the molec-ular dynamic simulations, we chose to simulate four systemswith four different chemical compositions. To go from onecomposition to another the reaction “2 resins → 1 asphal-tene” is applied. This reaction is chosen because some exper-imental results suggest that as bitumen ages, the asphaltenecontent increases and the resin content undergoes the great-est mass loss.4 However, the experimental literature proposesalso other scenarios for chemical aging: the aromatic con-tent could decrease while the resin and asphaltene contentsincrease3 or the resin and aromatic contents increase due to adecrease in the saturates content while the asphaltene contentis mainly constant but composed of molecules with increasingmolecular mass.17 In every cases, chemical aging is linked toan increase in the average molecular mass. The main effect ofthe aging reaction chosen in this work is to fuse molecules to-gether, resulting also in an increase of the average molecularmass. For the sake of simplicity, we considered only one agingreaction, satisfying the basic principle of increasing molecu-lar mass. Total mass is not strictly constant in this reactionbut vary very little. The exact composition of the four mix-tures is given in Table II. The number of molecules of eachtype was implemented in each mixture and the corresponding
124506-3 Lemarchand et al. J. Chem. Phys. 139, 124506 (2013)
TABLE II. Density ρ and number of asphaltene (A), resin (R), resinousoil (RO), and docosane (D) molecules in the four different mixtures. Thenumbers in parentheses refer to the weight fraction. For each mixture thetemperature is T = 452 K and the average pressure is P = 1 ± 250 atm.
Mixture ρ (kg m−3) A (%) R (%) RO (%) D (%)
I 964 10 (21.5) 10 (13.8) 10 (7.6) 82 (57.1)II 967 13 (28.5) 4 (5.6) 10 (7.7) 82 (58.2)III 969 14 (30.8) 2 (2.8) 10 (7.8) 82 (58.6)IV 973 15 (33.2) 0 10 (7.9) 82 (58.9)
weight fractions were calculated knowing the molar mass ofeach molecule. The weight fractions of asphaltene moleculesin mixtures I and IV are close to the weight fractions of as-phaltene molecules in an unaged AAD-1 bitumen and in thesame bitumen aged through the TFAAT (Thin Film Acceler-ated Aging Test) method at 113 ◦C for 72 h, respectively.1, 4
The natural abundance in asphaltene molecules in AAD-1 bi-tumen is around 20% and it reaches 36% after aging throughTFAAT. The TFAAT method is known to reproduce chemi-cal aging of bitumen for a period between 5 and 10 years.1, 4
This value is our best estimate of the aging period our reactionmodels.
To obtain statistically reliable results eight to ten simula-tions were carried out for each chemical composition, startingfrom independent initial conditions. Each simulation was firstequilibrated for 17 ns before results were computed.
III. STRESS AUTOCORRELATION FUNCTION
The first question, which is interesting from the point ofview of bitumen applications is: “Is there an effect of the ag-ing reaction on bitumen’s rheological properties?”. As a firstattempt to quantify the rheological properties, we studied thestress autocorrelation function.
The pressure tensor P is defined from molecular quan-tities as in our previous work19 using the Irving-Kirkwoodexpression:29
P = 1
V
N∑i=1
⎡⎣pipi
mi
+N∑
j=i+1
rij Fij
⎤⎦ , (2)
where V is the system volume, pi is the momentum ofmolecule i, mi is the molecule mass, rij = ri − rj is the dif-ference between the center-of-mass position of molecules jand i, and Fij is the total force applied by molecule i onmolecule j. The total force between two molecules is com-puted as the sum of the atomic forces acting between the
atoms of the two molecules. The traceless symmetric partosP
of the pressure tensor defined in Eq. (2) can be written as
osP= 1
2(P + PT ) − 1
3trace(P)I, (3)
where the superscript T denotes the transpose and I is the iden-tity tensor. The shear stress autocorrelation function C(t) isthen defined as
C(t) = 1
3
∑(αβ)
〈osP(αβ) (0)
osP(αβ) (t)〉, (4)
where t is time, (αβ) runs over the off-diagonal stress ten-sor elements, and 〈 · 〉 denotes an ensemble average. For eachindependent simulation, the average is done over 100 consec-utive intervals of 3.5 ns, the entire simulation being 0.35 μslong. For mixture I, the computation of the stress autocorrela-tion function is extended to a period of 35 ns. The last decadecorresponds to an average over 10 consecutive intervals of theentire simulation.
The stress autocorrelation function is useful because itsintegral over time leads to the viscosity η of the mixturethrough the Green-Kubo relation: η = (V/kBT )
∫ ∞0 C(t)dt ,
where kB is the Boltzmann factor. However, as will be shownin the following, the dynamics in bitumen is so slow that thestress autocorrelation function C(t) is not fully decayed evenafter the time 35 ns accessible through molecular dynamicsimulations. Consequently, it is not possible to obtain a reli-able value of the viscosity in molecular dynamics through theGreen-Kubo relation. Nevertheless, some valuable knowledgecan be obtained from the stress autocorrelation function.
To compare the stress autocorrelation function decay inthe different mixtures, we computed its “logarithmic aver-age,” as defined below. The data were collected linearly intime. Thus, the number of data points at long times is verylarge. This excess of points can be used to reduce noise atlonger times. The logarithmic average is done over an expo-nentially increasing number of points as time goes by. For-mally, for a logarithmic average in base 2, one can write:
C̄j = 1
2j − 2j−1
2j∑i=2j−1+1
Ci with j ∈ [1, Int(log2(N ))], (5)
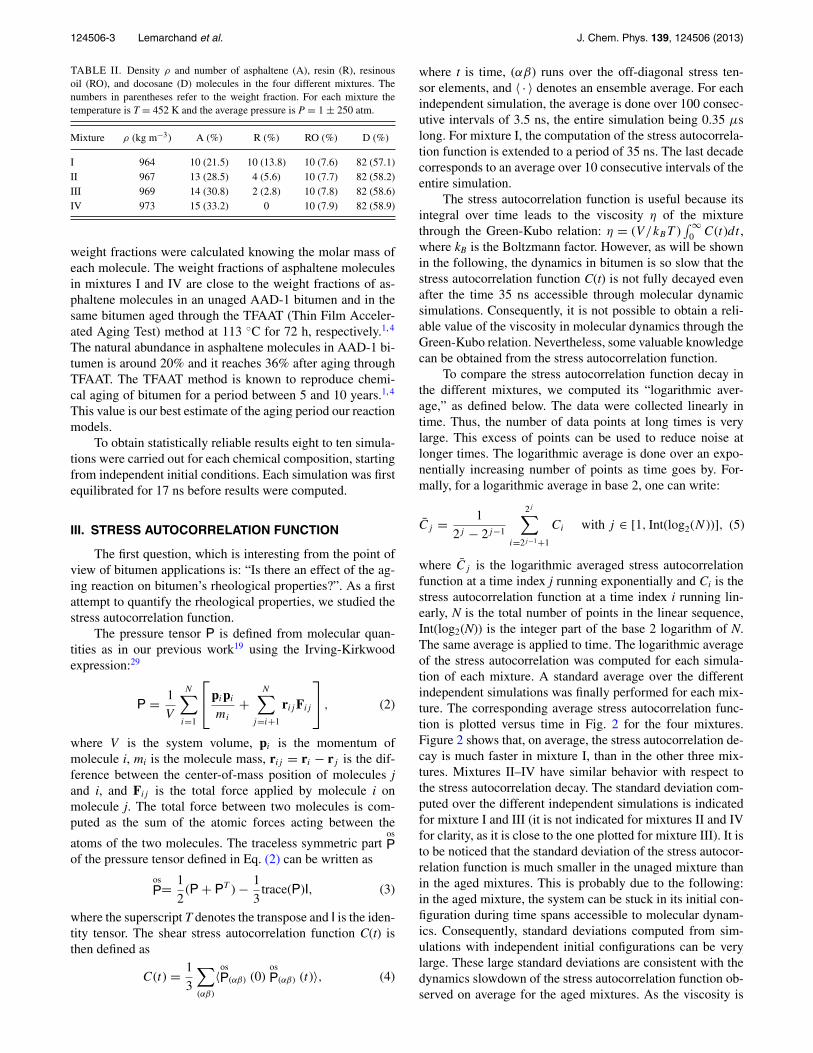
where C̄j is the logarithmic averaged stress autocorrelationfunction at a time index j running exponentially and Ci is thestress autocorrelation function at a time index i running lin-early, N is the total number of points in the linear sequence,Int(log2(N)) is the integer part of the base 2 logarithm of N.The same average is applied to time. The logarithmic averageof the stress autocorrelation was computed for each simula-tion of each mixture. A standard average over the differentindependent simulations was finally performed for each mix-ture. The corresponding average stress autocorrelation func-tion is plotted versus time in Fig. 2 for the four mixtures.Figure 2 shows that, on average, the stress autocorrelation de-cay is much faster in mixture I, than in the other three mix-tures. Mixtures II–IV have similar behavior with respect tothe stress autocorrelation decay. The standard deviation com-puted over the different independent simulations is indicatedfor mixture I and III (it is not indicated for mixtures II and IVfor clarity, as it is close to the one plotted for mixture III). It isto be noticed that the standard deviation of the stress autocor-relation function is much smaller in the unaged mixture thanin the aged mixtures. This is probably due to the following:in the aged mixture, the system can be stuck in its initial con-figuration during time spans accessible to molecular dynam-ics. Consequently, standard deviations computed from sim-ulations with independent initial configurations can be verylarge. These large standard deviations are consistent with thedynamics slowdown of the stress autocorrelation function ob-served on average for the aged mixtures. As the viscosity is
124506-4 Lemarchand et al. J. Chem. Phys. 139, 124506 (2013)
-3 -2 -1 0 1log
10(t) [ns]
0
100
200
300
400
V/k
BT
C(t
) [1
06 Pa]
Mixture IMixture IIMixture IIIMixture IV
FIG. 2. Time evolution of the logarithmic average of the normalized stressautocorrelation function (V/kBT ) C(t) for the four different mixtures. Errorbars correspond to the standard deviations computed over the ten independentsimulations performed for mixture I and over the nine independent simula-tions performed for mixture III. The initial value of the stress autocorrelationfunction (not visible) is (V/kBT ) C(0) > 1010 Pa in each mixture.
defined as the time integral of the stress autocorrelation func-tion, Fig. 2 indicates that the viscosity in the aged mixturesmight be a lot larger than the viscosity in the unaged mixture.This is in agreement with the experimental literature on agedbitumen.1–4
At this point, it is worth expanding on the results obtainedin the bitumen literature.1–4 Aging is often referred to as anoxidation process because it has been observed that the con-tent of oxidized polar molecules increases as bitumen ages. Itis not inconsistent with the increase of asphaltene moleculesalso observed as bitumen ages, because asphaltene moleculesare indeed polar. It has been argued1–4 that the increase in vis-cosity observed as bitumen ages is due to stronger interactionsbetween more and more polar molecules. In our model bitu-men, the molecules do not possess any dipole moment andintermolecular interactions are only described using the vander Waals potential. This is sufficient to produce an increasein the stress autocorrelation function relaxation time, as bitu-men ages. It means that, even in real bitumen, van der Waalsinteractions alone can account for the observed increase inbulk viscosity.
Why does the stress autocorrelation function decay moreslowly in an aged bitumen than in a younger one? We con-jecture that this is linked to the aggregation of asphaltenemolecules. The first step to prove that there is a correlation be-tween the two phenomena is to identify the nanoaggregates’structure in the different mixtures. This is the aim of Sec. IV.
IV. NANOAGGREGATE STRUCTURE
Section III showed that aged bitumen has a stress auto-correlation function that decays more slowly than unaged bi-tumen. In order to investigate whether it is linked to the ex-istence of asphaltene nanoaggregates in the system, the firststep is to observe the aggregates’ structure in the differentmixtures. The second step is to quantify a change in the ag-gregates’ structure in the different mixtures. It is done in thissection first by studying the radial distribution function and
x
y
z
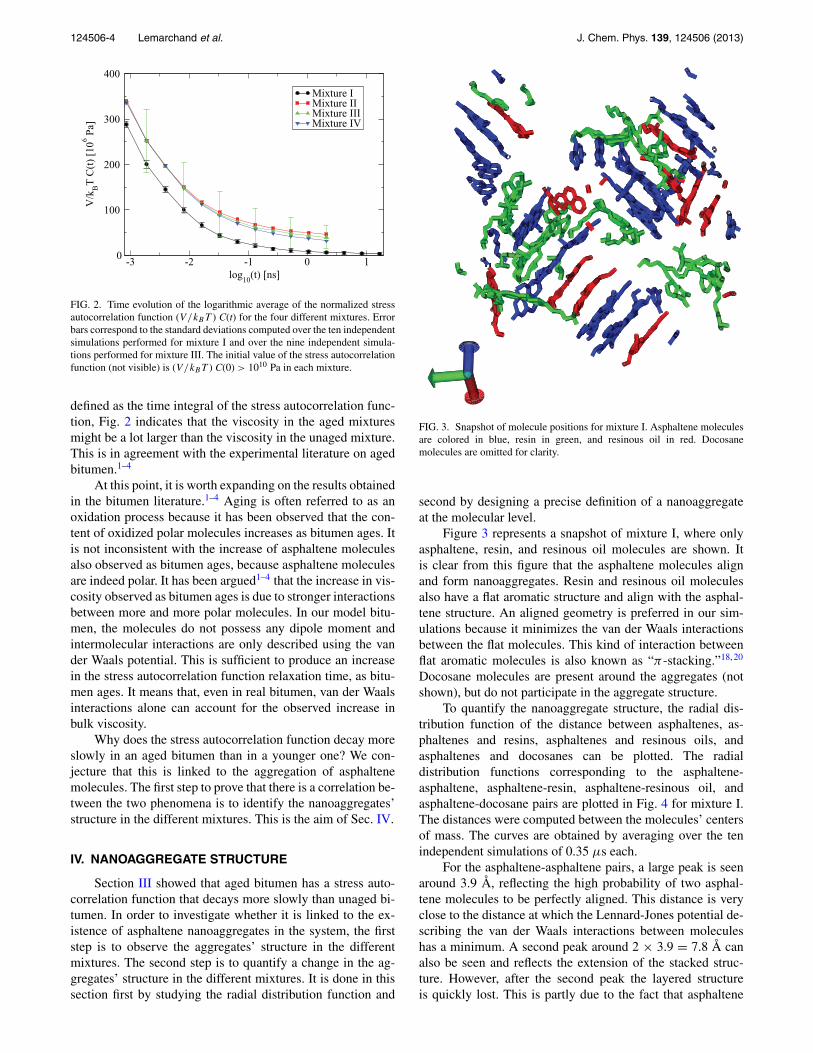
FIG. 3. Snapshot of molecule positions for mixture I. Asphaltene moleculesare colored in blue, resin in green, and resinous oil in red. Docosanemolecules are omitted for clarity.
second by designing a precise definition of a nanoaggregateat the molecular level.
Figure 3 represents a snapshot of mixture I, where onlyasphaltene, resin, and resinous oil molecules are shown. Itis clear from this figure that the asphaltene molecules alignand form nanoaggregates. Resin and resinous oil moleculesalso have a flat aromatic structure and align with the asphal-tene structure. An aligned geometry is preferred in our sim-ulations because it minimizes the van der Waals interactionsbetween the flat molecules. This kind of interaction betweenflat aromatic molecules is also known as “π -stacking.”18, 20
Docosane molecules are present around the aggregates (notshown), but do not participate in the aggregate structure.
To quantify the nanoaggregate structure, the radial dis-tribution function of the distance between asphaltenes, as-phaltenes and resins, asphaltenes and resinous oils, andasphaltenes and docosanes can be plotted. The radialdistribution functions corresponding to the asphaltene-asphaltene, asphaltene-resin, asphaltene-resinous oil, andasphaltene-docosane pairs are plotted in Fig. 4 for mixture I.The distances were computed between the molecules’ centersof mass. The curves are obtained by averaging over the tenindependent simulations of 0.35 μs each.
For the asphaltene-asphaltene pairs, a large peak is seenaround 3.9 Å, reflecting the high probability of two asphal-tene molecules to be perfectly aligned. This distance is veryclose to the distance at which the Lennard-Jones potential de-scribing the van der Waals interactions between moleculeshas a minimum. A second peak around 2 × 3.9 = 7.8 Å canalso be seen and reflects the extension of the stacked struc-ture. However, after the second peak the layered structureis quickly lost. This is partly due to the fact that asphaltene

124506-5 Lemarchand et al. J. Chem. Phys. 139, 124506 (2013)
0 5 10 15 20r [Å]
0
5
10
15
20g(
r)Asphaltene-AsphalteneAsphaltene-Resinous oilAsphaltene-ResinAsphaltene-Docosane
Mixture I
FIG. 4. The radial distribution function g(r) for asphaltene-asphaltene (bluetriangle down), asphaltene-resinous oil (red square), asphaltene-resin (greentriangle up), and asphaltene-docosane (black circle) pairs in mixture I.
molecules may align in different ways. Asphaltene moleculesare composed of a flat body and a flat head, which can ro-tate with respect to each other. These two parts of the asphal-tene molecules are shown in Fig. 1. Bodies can be alignedin two different ways, either perfectly parallel, in a head-to-head conformation or in a head-to-tail conformation. Thesetwo conformations are shown in Figs. 5(a) and 5(c). Only thefirst conformation leads to a distance between the centers ofmass close to 3.9 Å. The other conformation leads to biggerdistances around 9 Å. The head of one molecule can also bealigned with the body of another molecule. These differentconformations were also observed by Zhang and Greenfieldin Ref. 18. A fourth conformation with only heads of the as-phaltene molecules aligned was also identified in our simu-lations (not shown). These different conformations induce anattenuation of the peaks in the radial distribution function asthe distance between two molecules increases.
For the asphaltene-resin and asphaltene-resinous oilpairs, a layered structure can also be inferred from the ra-dial distribution function. It follows the structure created by
θ
12
(a)
(c)
(b)
(d)
1
2
dintra dintra
dinterdCOM dCOM
dinter
Neighbors Not neighbors
dCOM dCOM
dstacking = dinter dstacking = dCOM
FIG. 5. Scheme of four borderline cases illustrating whether an asphaltenemolecule is or is not the nearest neighbor of another one. The first asphal-tene molecule is black. The second one is green if it is the nearest neighborof the first one and red otherwise. (a) Head-to-head conformation; (b) non-aligned molecules; (c) head-to-tail conformation; and (d) molecules far fromeach other but aligned in the same plane. dCOM is the distance between themolecules’ center of mass, dinter is the distance between the two planes, dintrais the intraplanar distance, and θ is the alignment angle.
0 5 10 15 20r [Å]
0
0.2
0.4
0.6
0.8
g(r)
Mixture IMixture IIMixture IIIMixture IV
Asphaltene-Docosane
FIG. 6. Radial distribution function g(r) for asphaltene-docosane pair in allmixtures. Error bars correspond to the standard deviations computed over the8 or more independent simulations performed in each case.
the asphaltene molecules. The first peak position of these twopairs is slightly shifted to larger distances with respect to thefirst peak position of the asphaltene-asphaltene pairs. This isprobably due to the fact that resin and resinous oil moleculesare smaller than asphaltene molecules, so that they can alignon top of an asphaltene molecule and glide over it at differ-ent distances from the asphaltene center of mass. In the caseof resin molecules, this effect can also be explained by thefact that the resin molecules chosen in the Cooee bitumenmodel have side chains which can push the molecules’ cen-ter of mass away from the asphaltene plane. In the case ofasphaltene-resin and asphaltene-resinous oil pairs, the exten-sion of the layered structure is quickly smoothened out as thedistance becomes larger.
The radial distribution function for the asphaltene-docosane pairs is represented for each mixture in Fig. 6. Forthe asphaltene-docosane pair the radial distribution functionis very low around 3.9 Å, reflecting the fact that docosanemolecules are not members of the asphaltene nanoaggregates.However, there is a slightly pronounced peak around 3.9 Å. Itcan be seen from Fig. 6 that this peak is growing monotoni-cally from mixtures I to IV. It is probably due to the fact that asresin molecules disappear and asphaltene molecules becomemore numerous, aggregates are mainly composed of asphal-tene molecules. Thus, the edge of each aggregate is likely tobe represented by an asphaltene molecule next to a docosanemolecule.
In contrast to the asphaltene-docosane pairs, the stan-dard deviations for the radial distribution functions ofthe asphaltene-asphaltene, asphaltene-resin, and asphaltene-resinous oil pairs are very large. In other words, the radial dis-tribution functions for these pairs can be very different fromone simulation to another for the same mixture. For the sakeof clarity, the standard deviations were not shown on the ra-dial distribution functions in Fig. 4. The large standard devia-tion is due to the fact that one initial nanoaggregates’ config-uration is preserved for a long time throughout a simulationand can be very different from the initial configuration of an-other independent simulation. The radial distribution functionis consequently not the best way to quantify the nanoaggre-gate structure.

124506-6 Lemarchand et al. J. Chem. Phys. 139, 124506 (2013)
To deal with this problem, we propose to define a nanoag-gregate at the molecular level using the following rule. Twomolecules are nearest neighbors and in the same nanoaggre-gate if:
1. their bodies are well-aligned and close enough,2. or their heads are well-aligned and close enough,3. or one head is well-aligned and close enough to the body
of the other molecule.
Only asphaltene molecules can be characterized by ahead and a body, whereas resin and resinous oil moleculesonly have a body. The previous rule applies to them onlywhen bodies are concerned. In other words, resin and resinousoil molecules are treated as asphaltene bodies. Docosanemolecules are not part of a nanoaggregate.
The properties “well-aligned” and “close-enough” needto be quantified. Figure 5 shows different cases illustrat-ing which quantities and threshold values are used to de-fine “well-aligned” and “close-enough.” The alignment of theplane aromatic molecules is quantified by the angle betweenthe normal unit vectors to each plane. In our previous work,19
normal unit vectors were defined for the asphaltene body andthe resinous oil molecule. Similarly, the normal vector to theplane aromatic structure of the resin molecule is defined asthe cross product of two vectors pointing along a chemicalbond. The normal vector to the asphaltene head is defined inthe same way. These four vectors are shown in Fig. 1. The dotproduct between the two normal unit vectors of two differentmolecules gives the cosine of the alignment angle betweenthem. Equivalently it provides us with an alignment angle be-tween 0◦ and 180◦. The probability density functions (pdfs) ofthe alignment angles between the different kinds of moleculeare plotted in Fig. 7(a). The pdfs are computed for the align-ment angle between any molecule of one type and any dif-ferent molecule of the second type, whatever the distance be-tween them. The pdfs have the same basic features. Each pdfpossesses four peaks: one close to 0◦, two centered around60◦ and 120◦ and a last one close to 180◦. The two peaksclose to 0◦ and 180◦ correspond to molecules aligned on topof each other either in a parallel or an antiparallel conforma-tion. To understand the existence of the two peaks centeredaround 60◦ and 120◦, it is necessary to look at the probabilitydensity function of the angle between the head and the bodyof the same asphaltene molecule. It is displayed in Fig. 7(b).The pdf of the intramolecular angle between the head and thebody of an asphaltene molecule has two maxima at 60◦ and120◦. These values are monitored by the dihedral potentialchosen in this work and correspond to the known conforma-tion “gauche.” Inside a nanoaggregate, where two asphaltenebodies can be aligned in a head-to-tail conformation withouttheir heads to be aligned, this results in an angle of 60◦ or 120◦
between the head of one asphaltene molecule and the body ofthe other one, just as the intramolecular angle. It explains thetwo peaks centered around 60◦ and 120◦ observed in the pdfof the angle between the body of an asphaltene molecule andthe head of another asphaltene molecule. The same explana-tion applies for the peaks centered around 60◦ and 120◦ inthe pdfs of the intermolecular angle between asphaltene bod-ies and asphaltene heads. For the pdfs of the angle between
90 180θ [degrees]
0
0.2
0.4
0.6
0.8
1
A body - A bodyA body - A headA head - A -headA body - RROA head - RRORRO - RRO
(a)
90 180θ [degrees]
0
0.2
0.4
0.6
0.8
1
(b) A head-body intra
FIG. 7. (a) Probability density functions (pdfs) of the intermolecular anglebetween two asphaltene bodies (black circle), an asphaltene body and an-other asphaltene head (red square), two asphaltene heads (green triangle up),an asphaltene body and a resin or resinous oil molecule (blue triangle down),an asphaltene head and a resin or resinous oil molecule (orange diamond),and two resin or resinous oil molecules (purple cross), in mixture I. Thedashed lines represent the threshold values chosen. (b) pdf of the intramolec-ular angle between the head and body of an asphaltene molecule in mixture I.The error bars correspond to the ten independent simulations performed formixture I.
one resin/resinous oil molecule and another resin/resinousmolecule or one asphaltene body or head, the peaks centeredaround 60◦ and 120◦ are less well-defined and can merge intoone broad peak around 90◦. They can be explained by the factthat in a nanoaggregate, if one resin or resinous oil moleculeis aligned with an asphaltene body, it has an angle of approx-imately 60◦ or 120◦ with the same asphaltene head and thesame angle with another resin or resinous oil molecule alignedwith the same asphaltene head. The peaks are broadened be-cause they are due to angles between molecules which arenot nearest neighbors. To summarize, all the peaks observedaround 60◦ and 120◦ in the probability density functions ofthe intermolecular angle can be explained by the intramolec-ular angle between the head and body of the same asphaltenemolecule. The asphaltene molecules thus impose their struc-ture on the whole nanoaggregate, which is to be expected asthey are the largest molecules.
Important for the nanoaggregate definition are the peaksclose to 0◦ and 180◦ in the probability density functions of theintermolecular angle; they correspond to aligned molecules.Given the curve in Fig. 7(a), two molecules were considered

124506-7 Lemarchand et al. J. Chem. Phys. 139, 124506 (2013)
to be aligned if the angle θ between them satisfies:
θ ≤ 34◦ or θ ≥ 149◦. (6)
This criterion enables us to distinguish between case (a),where two molecules are perfectly aligned and case (b), wheremolecules are not aligned enough, in Fig. 5.
To quantify how close two aligned molecules should bein order to be declared nearest neighbors in the same nanoag-gregate, we studied the so-called “stacking distance.” Thestacking distance between two aligned molecules 1 and 2 isdefined in the following way. Molecules 1 and 2 need to bealigned according to the previous criterion on the alignmentangle θ . The definition of the stacking distance makes thenuse of the intraplanar distance dintra, defined as the distancein plane 1 between the center of mass of molecule 1 and theintersection point between plane 1 and the perpendicular lineto plane 1 passing through the center of mass of molecule 2(see Figs. 5(c) and 5(d)). The stacking distance between thealigned molecules 1 and 2 is equal to the distance between theplanes where these molecules lie if the intraplanar distancedintra is sufficiently small, otherwise it is equal to the directdistance between the molecules’ centers of mass. The rule forthe intraplanar distance dintra to be small enough is
dintra ≤ 0.7 × dasph, (7)
where dasph is the size of the body of an asphaltene molecule,which is dasph = 13.1 Å. Defining such a stacking distance isuseful for two main reasons. First, studying the distance be-tween the planes instead of the direct distance between themolecules’ center of mass is necessary to find the same dis-tance between two asphaltene molecules aligned on top ofeach other in a head-to-head conformation and two asphal-tene molecules aligned in a head-to-tail conformation. Thesetwo situations correspond to cases (a) and (c) in Fig. 5. Asthe molecule’s center of mass is not the geometrical centerof the molecule, the distance between the centers of mass isdifferent in the case of a head-to-head and a head-to-tail con-formation. However, the distance between the two planes isthe same in both cases and should be considered to declarethat, in both cases, the two molecules are nearest neighborsin the same nanoaggregate. Nevertheless, considering onlythe plane distance can lead to vanishing distances when twomolecules happen to be aligned in the same plane but far awayfrom each other. This situation corresponds to case (d) inFig. 5. The threshold value 0.7 × dasph on the intraplanar dis-tance is there to rule out this case from the nanoaggregate def-inition. In that case, the stacking distance is just the distancebetween the molecules’ centers of mass and is quite large. Theprecise value 0.7 × dasph was chosen because for the smallervalue 0.5 × dasph the number of distances close to zero wastoo high and because for the larger value 0.9 × dasph the as-phaltene molecules in a head-to-tail conformation were oftencomputed to be at 9 Å from each other.
Figure 8 represents the probability density function of thestacking distance between two aligned asphaltene bodies de-fined from the two previous threshold values in the four differ-ent mixtures. The extended stacked structure is visible in thisfigure whereas it was not so clear in the radial distributionfunction of the distance between molecules centers of mass
0 5 10 15 20d
stacking between asphaltene bodies [Å]
0
0.2
0.4
0.6
0.8
1
Mixture (I)Mixture (II)Mixture (III)Mixture (IV)
(a)
0 5 10 15 20d
stacking [Å]
0
0.1
0.2
0.3
0.4
A body - RRORRO-RRO
(b)
Mixture I
FIG. 8. (a) Probability density functions (pdfs) of the stacking distance be-tween asphaltene bodies as defined in the text. (b) pdfs of the stacking dis-tance in mixture I between resin/resinous oil molecules and asphaltene bodies(blue triangle down) and between resin and resinous oil (purple cross). Thedashed line in both figure represents the last threshold value chosen (6.0 Å).
shown in Fig. 4(a). The regular and well-defined peaks ofFig. 8 justify a posteriori the two threshold values definedearlier on the alignment angle and the intraplanar distance.One last threshold value can be inferred from this figure. Twoaligned molecules are said to be close enough if the stackingdistance dstacking between them is smaller than
dstacking ≤ 6.0Å. (8)
In order to check the choice of the two last threshold valuesfor pairs of molecules different from two asphaltene bodies,we plotted the probability density functions of the stackingdistance between other types of molecule. As an example,Fig. 8(b) represents the pdf of the stacking distance in mix-ture I between resin and resinous oil molecules on one handand a resin/resinous oil molecule and an asphaltene body onthe other hand. The stacked structure is less obvious than forthe asphaltene body distance, but the first peak is still verywell-defined. The minimum after the first peak is very close tothe minimum observed in the pdf of the stacking distance be-tween two asphaltene bodies. This justifies the use of the samethreshold values for the resin/resinous oil and resin/resinousoil asphaltene pairs. The same conclusion can be drawn forall the other types of pairs (not shown).

124506-8 Lemarchand et al. J. Chem. Phys. 139, 124506 (2013)
20 25 30 35asphaltene mass fraction [%]
4
5
6
7
8
9
10
num
ber
of a
sph
in la
rges
t agg
rega
te
A largest
20 25 30 35asph mass fraction [%]
4
6
8
10
num
ber
of m
olec
ules
A + R + RO
FIG. 9. Variation of the average number of asphaltene molecules in thelargest nanoaggregate versus the asphaltene mass fraction in the differentmixtures. Inset: Variation of the average number of molecules (asphaltene,resin, and resinous oil) in any aggregate versus the asphaltene mass fractionin the different mixtures.
With this precise molecular definition of an asphaltenenanoaggregate, the average number of asphaltene moleculesin the largest aggregate can be computed for the differentmixtures. The smallest nanoaggregate considered contains atleast two asphaltene molecules, which can be indirectly linkedby one or several resin or resinous oil molecules. The num-ber of asphaltene molecules in the largest nanoaggregate isdetermined regularly in each simulation for each mixture.The average number of asphaltene molecules in the largestnanoaggregate is plotted versus the mass fraction of asphal-tene molecules in the different mixtures in Fig. 9. The largestnanoaggregate is found to contain between 5 and 10 asphal-tene molecules, which is in agreement with the experimen-tal literature reporting less than ten asphaltene molecules onaverage in a nanoaggregate.14 Figure 9 also shows that theaverage number of asphaltene molecules inside the largestnanoaggregate increases going from mixture I to IV, i.e., asthe bitumen ages. It is not surprising that the number of as-phaltene molecules inside a nanoaggregate increases as bitu-men ages, because the number of asphaltene molecules in thewhole mixture increases. But the study carried out here quan-tifies properly this effect. Moreover, we have checked that theaverage number of aromatic molecules (asphaltene, resin, andresinous oil) inside any nanoaggregate increases as bitumenages. The result is displayed in the inset of Fig. 9. Even ifthe error bars are quite large, there is a definite increase inthe aggregate size from mixture I to IV. This is even moresurprising given that the total number of aromatic moleculesdecreases from mixture I to IV. It means that the higher theconcentration of asphaltene molecules is in the whole mix-ture, the easier it is for them to recruit themselves and otheraromatic molecules to a nanoaggregate. One can now arguethat the slowdown in the stress autocorrelation function dy-namics observed in Sec. III is correlated to an increase inthe nanoaggregates’ size and an increase in their asphaltenecontent.
The question whether the layered structure composed ofasphaltene, resin, and resinous oil molecules is a nanoaggre-gate miscible in docosane or a separate phase cannot be di-
0 10 20 30 40 50time [ns]
0.3
0.4
0.5
0.6
0.7
0.8
0.9
1
frac
tion
of
aggr
egat
ed a
spha
lten
es
Mixture IMixture IV 0 5 10 15 20
number of blocking transformations
0.001
0.0015
0.002
0.0025
0.003
s
"Equilibration"
Production run(total of 350 ns)
FIG. 10. Time evolution of the fraction of aggregated asphaltene moleculesfor mixture I (black circle) and IV (blue triangle down). Inset: Results of theblocking method applied to pressure for one production run of mixture I.
rectly addressed by molecular dynamic simulations, becausethe systems that can be studied numerically are too small.Consequently, the results of molecular dynamic simulationspresented here can be influenced by finite size effect. How-ever, the general trends are probably the same in larger sys-tems as they agree with experimental results on the nanoag-gregate size.14
The proper definition of a nanoaggregate allows us tojustify a posteriori the time span used to “equilibrate” thesystem. Figure 10 shows the fraction of aggregated asphal-tene molecules among all asphaltene molecules versus timefor mixtures I and IV. During the “equilibration run” thenumber of aggregated asphaltene molecules increases untilit reaches a stationary value. The number of aggregated as-phaltene molecules increases because the initial configura-tion is generated from a very dilute solution and then com-pressed. The production runs start when the stationary valuefor the number of aggregated asphaltene molecules is reached.Moreover, to check that the production runs span the phasespace properly, we used the standard “blocking method.”30
We applied this method to the pressure and computed the stan-dard deviation s of the average pressure versus the numberof blocking transformations. The results are displayed for oneproduction run of mixture I in the inset of Fig. 10. A plateau isclearly visible after a few blocking transformations have beenapplied, indicating that the phase space is spanned correctlyduring a production run. We assumed, in agreement with theresults from the blocking method, that the state describe bythe molecular dynamics simulations is a state of local equi-librium. It is associated with a given nanoaggregate config-uration. We assumed that the laws of statistical mechanicsapplied to this local equilibrium state. To span differentnanoaggregate configurations, we simulated eight to ten sys-tems with different initial conditions and always consideredquantities averaged over these different simulations.
To summarize, in this section the nanoaggregates wereidentified in all mixtures. They are not only composed of as-phaltene molecules: resin and resinous oil molecules align tothe asphaltene structure. A precise definition for the nanoag-gregate structure was arrived at and it was shown that theslowdown of the stress autocorrelation function observed as

124506-9 Lemarchand et al. J. Chem. Phys. 139, 124506 (2013)
bitumen ages is correlated to an increase in the nanoaggre-gate size. To deeper investigate the correlation between theevolution of mechanical properties and asphaltene aggrega-tion as bitumen ages, Sec. V is devoted to the study of thenanoaggregates’ dynamics.
V. ROTATIONAL DYNAMICS
It is known from Sec. III that as bitumen ages, the stressautocorrelation function dynamics is slowed down on aver-age. This is correlated to nanoaggregates being larger andcontaining more asphaltene molecules. To show that it is alsolinked to a slowdown in the nanoaggregates’ dynamics, weinvestigated the evolution of the rotational dynamics of thearomatic molecules in a nanoaggregate.
The normal unit vectors to the asphaltene bodies andresin and resinous oil molecules defined in Sec. IV can beused to investigate the rotational dynamics of each molecule.In other words, they can be used to determine how long theinitial orientation is preserved. To do so, the first-order rota-tional correlation function C(1)(t) is defined as31
C(1)(t) = 〈n̂(0) · n̂(t)〉, (9)
where n̂(t) is the unit vector normal to the plane aromaticstructure of the molecule of interest at time t and where 〈 · 〉denotes an ensemble average. In our simulations, the averageis done over the molecules of the same type, over time, andover the eight to ten independent simulations performed forthe same mixture. The rotational correlation function C(1)(t)is plotted in Fig. 11 for asphaltene, resin, and resinous oilmolecules in mixture I. It can be seen from this figure that therotational correlation function of the different molecule typescan be fitted to a stretched exponential of the form C(1)(t)= exp (− (t/τ )β), where τ can be interpreted as a relaxationtime and β is a number smaller than 1. The mean values of
-2 -1 0 1 2 3log
10(t) [ns]
0
0.2
0.4
0.6
0.8
C(1
) (t)
AsphalteneResinous oilResin1 asphaltenestretched expexp
Mixture I
1 asph
FIG. 11. Time evolution of the logarithmic average of the first-order rota-tional correlation function C(1)(t) in mixture I and in a mixture containingone asphaltene molecule and 82 docosane molecules. Blue triangles downcorrespond to asphaltene in mixture I, red squares to resinous oil in thesame mixture, and green triangles up to resin in the same mixture. Thethree dashed black lines are stretched exponential fit to the curves. Lightblue circles correspond to asphaltene in a mixture containing one asphal-tene molecule in docosane. The dotted black line is the best fit of the formC(1)(t) = exp (− 2Drt), with Dr = 0.83 ns−1, the rotational diffusioncoefficient.
the power β in the stretched exponential are β = 0.65 ± 0.10for the asphaltene type, β = 0.52 ± 0.08 for the resinous oiltype, and β = 0.45 ± 0.07 for the resin type. The averageis over ten independent simulations. These values are signif-icantly smaller than unity, whereas the rotational correlationfunction of a mixture with one asphaltene molecule in do-cosane can be very well fitted by a simple exponential (β = 1)for sufficiently large time, as can also be seen in Fig. 11. Thisproves that it is the presence of several asphaltene moleculesthat induces values of the power β smaller than unity and notthe internal structure of one asphaltene molecule.
For mixtures II–IV the rotational correlation functionsC(1)(t) can also be computed for the different molecule types,but stretched exponential fits were found to be less convinc-ing. To circumvent this problem, we chose to define the char-acteristic rotational time τrot as the time necessary for therotational correlation function C(1)(t) to reach the value 3/4.The variation of the rotational time τrot versus the asphal-tene mass fraction in the mixture is shown in Fig. 12, for allmolecule types. This figure shows that the asphaltene charac-teristic rotational time is the largest. This is expected as theyare the largest molecules. Asphaltene molecules are the slow-est and impose their dynamics on the whole mixture. Resinand resinous oil molecules have smaller characteristic rota-tional times, quite close to each other. Interestingly, Fig. 12also shows that all characteristic rotational times increase onaverage as bitumen ages. It means that, as bitumen ages, therotational dynamics is slowed down. There is consequentlya correlation between the slowdown in the stress autocorre-lation function observed in Sec. III and the slowdown in therotational dynamics, as bitumen ages.
Sections III–V indicated that asphaltene molecules im-pose their structure and dynamics on the whole mixture.The role of resin and resinous oil molecules, which are alsopart of the nanoaggregates, is however not completely clear.Section VI focuses on the role of these two molecules andstudies the translational diffusivity of each molecule type asbitumen ages.
20 25 30 35asphaltene mass fraction [%]
-1
0
1
2
3
log 10
(τro
t) [n
s]
AsphalteneResinous oilResin
1 asphaltene
FIG. 12. Variation of the rotational characteristic time τrot, defined asC(1)(τrot) = 3/4, versus the number of asphaltene molecules in the mixture.The rotational characteristic time indicated for one asphaltene correspondsto a mixture with one asphaltene molecule and 82 docosane molecules, as inFig. 11. Error bars correspond to the standard deviations computed over the8 or more independent simulations performed in each case.

124506-10 Lemarchand et al. J. Chem. Phys. 139, 124506 (2013)
VI. TRANSLATIONAL DIFFUSION
Sections III–V showed that as bitumen ages, the stressautocorrelation function decays more slowly while nanoag-gregates become larger and the rotational dynamics becomesslower. The role of asphaltene molecules seems critical in thisprocess, because they are the largest molecules and seem toimpose their structure and dynamics on the whole mixture.But the role of resin and resinous oil molecules in the nanoag-gregate formation is not yet clear. To specify the role of eachmolecule type, this section studies the diffusivity of these dif-ferent molecule types.
The mean-squared displacement 〈�r2〉 is defined for onemolecule type from the center-of-mass positions as in Ref. 19.The curves displayed in Fig. 13 show the time evolution ofthe average of the mean-squared displacement over the eightor more independent simulations performed for each mixture.
In the first three mixtures, all molecule types exhibit adiffusive behavior. In that case a diffusion coefficient Dα canbe defined for each molecule type. In mixture IV, which doesnot contain any resin molecules, the docosane and resinousoil molecules still exhibit a diffusive behavior, as shown inFig. 13, but the asphaltene molecules do not enter the diffusiveregime, even after 0.35 μs. The asphaltene molecules appearstuck in their initial position for the time spans accessible tomolecular dynamics.
Figure 14 plots the diffusion coefficient of each moleculetype versus the asphaltene mass fraction in the mixture and re-veals the role of each molecule type. First, different moleculetypes have different diffusion coefficients. As was alreadyshown in our previous work:19 DD > DRO DR > DA. Sec-ond, except for the docosane diffusion coefficient, which isroughly constant, all diffusion coefficients decrease with anincrease in the asphaltene content. The aging reaction conse-
0 20 25 30 35asphaltene mass fraction (%)
-2
-1
0
1
log 10
(Dα)
[10-1
0 m2 .s
-1]
DocosaneResinous OilResinAsphaltene
Pur
e do
cosa
ne
1 as
phal
tene
FIG. 14. Variation of the diffusion coefficient Dα of each molecule type ver-sus the asphaltene mass fraction in the different mixtures. The same symbolsare used as in Fig. 13. Error bars correspond to the standard deviations com-puted over the eight or more independent simulations performed in each case.
quently leads to a slowdown in the translational dynamics. Itis not surprising as it is also related to a slowdown in the ro-tational dynamics and the stress autocorrelation function dy-namics, as could be seen from Secs. III and V.
The fact that docosane molecules diffuse the fastest isexpected since they are the lightest and are not part of thenanoaggregate structure. The diffusion coefficient of pure do-cosane is only a bit larger than the diffusion coefficient of thissame molecule in a bitumen mixture as shown in Fig. 14. Thisfact can enable us to design coarse-grained simulations wheredocosane molecules are only implicitly included as a solventdamping the other molecules motion. This kind of simulationswill be the focus of a later work.
0 0.5 1 1.5 2 2.5 3log
10(t) [ns]
-2
-1
0
1
2
3
4
log 10
<Δr
2 (t)>
[nm
2 ]
DocosaneResinous oilResinAsphaltene
Mixture I(a)
0 0.5 1 1.5 2 2.5 3log
10(t) [ns]
-2
-1
0
1
2
3
4
log 10
<Δr
2 (t)>
[nm
2 ]
DocosaneResinous oilResinAsphaltene
Mixture II(b)
0 0.5 1 1.5 2 2.5 3log
10(t) [ns]
-2
-1
0
1
2
3
4
log 10
<Δr
2 (t)>
[nm
2 ]
DocosaneResinous oilResinAsphaltene
Mixture III(c)
0 0.5 1 1.5 2 2.5 3log
10(t) [ns]
-2
-1
0
1
2
3
4
log 10
<Δr
2 (t)>
[nm
2 ]
DocosaneResinous oilAsphaltene
Mixture IV(d)
FIG. 13. Time evolution of the mean-squared displacement of each molecule in all four mixtures. The curves are averaged over the independent simulationsperformed for each mixture: 10 for mixture I, 8 for mixture II, 9 for mixture III, and 10 for mixture IV.

124506-11 Lemarchand et al. J. Chem. Phys. 139, 124506 (2013)
The fact that the asphaltene diffusion coefficient is thesmallest agrees with their characteristic rotational time beingthe highest. It is expected since they are the largest moleculesin the bitumen mixture. The effect of the asphaltene aggrega-tion on the asphaltene diffusion coefficient is clearly visiblewhen one compares the asphaltene diffusion coefficient in amixture with a single asphaltene molecule in pure docosaneand the same diffusion coefficient in a bitumen mixture. Whenno aggregation takes place, the asphaltene diffusion coeffi-cient is one order of magnitude higher than when several as-phaltene molecules are present and aggregated together. Thisis another indication of the importance of asphaltene aggrega-tion in bitumen dynamics.
Resin and resinous oil molecules have close diffusioncoefficients, which is consistent with their rotational relax-ation time being close. However, there is a difference be-tween the rotational and translational dynamics of resinousoil molecules as bitumen ages. In Sec. V, in Fig. 12, it wasshown that the rotational time of resinous oil molecules is in-creased by a factor 10 going from mixture I to IV, whereasthe diffusion coefficient of resinous oil molecules is only de-creased by a factor two from mixture I to IV. The same is alsotrue for resin and asphaltene molecules. This decoupling be-tween the translational and rotational dynamics can be inter-preted as the consequence of spatial heterogeneities32 grow-ing with age, consistent with the nanoaggregates being largeras bitumen ages. The extreme case would be a complete de-coupling between regions with free molecules, which con-tribute a lot to the diffusive behavior but do not relax fully therotational dynamics, and regions with large nanoaggregates,where molecules do not diffuse and rotate very slowly.
In mixture IV where no resin molecules are present, theasphaltene molecules are not able to reach a diffusive be-havior in the time span accessible to molecular dynamics,whereas they were so with only a couple of resin molecules inmixture III. To test whether it is a property of resin moleculesalone, we studied the mean-squared displacement of allmolecules in a mixture containing 82 docosane molecules, 10resin molecules, and 10 asphaltene molecules, but no resinousoil molecule. The mean-squared displacement of docosane,resin, and asphaltene molecules is represented versus time inFig. 15. This figure shows that with resin molecules but with-out resinous oil molecules, asphaltene molecules do not reacha diffusive behavior in the time span accessible to moleculardynamics. The other molecule types, on the contrary, have adiffusive behavior. Resin and resinous oil molecules seem toplay similar roles in our simulations. A sufficient amount ofthem is needed to induce asphaltene molecules to have a diffu-sive behavior. It means that these molecules either enable sin-gle asphaltene molecules to detach from the aggregates fromtime to time or induce smaller aggregates to be formed.
Collecting all the results, we propose the following sim-ple scenario for the role of each molecule type in our modelbitumen. Asphaltene molecules are the largest and have anextended aromatic flat structure. They align and create basicnanoaggregates. Resin and resinous oil molecules also havea flat aromatic structure, and they can align with the asphal-tene molecules; they are also members of the nanoaggregates.However, resin and resinous oil molecules appear to prevent
0 1 2 3log
10(t) [ns]
-2
-1
0
1
2
3
4
log 10
<Δr
2 (t)>
[nm
2 ]
DocosaneResinAsphaltene
FIG. 15. Time evolution of the mean-squared displacement of each moleculein a mixture containing 82 docosane molecules, 10 resin molecules, and 10asphaltene molecules (to be compared with Fig. 13(d)). The curves are aver-aged over the ten independent simulations performed for this mixture.
the asphaltene molecules from being immobile. This fact maybe due to resin and resinous oil molecules being smaller thanthe asphaltene molecules and weakening the nanoaggregatestructure. Moreover, the resin molecules that were chosen inthis model have long side chains, that cannot align with thearomatic planes and can disturb the layered aggregate struc-ture. Resin and resinous oil molecules are believed to be ableto break off an asphaltene molecule from a nanoaggregate, be-cause they can insert between two asphaltene molecules in anaggregate thanks to their flat aromatic structure and also dis-turb the aggregate layers because of their smaller size. Finally,docosane molecules are not members of the nanoaggregatesand their diffusion coefficient does not depend on the precisechemical composition of bitumen.
With this scenario in mind, one can explain qualitativelywhat happens in the bitumen mixture as the aging reaction “2resin → 1 asphaltene” takes place. As resin molecules are re-placed by asphaltene molecules, the nanoaggregates becomelarger because resin molecules do not disturb the aggregatestructure any more. The translational and rotational dynam-ics of all aromatic molecules is consequently slowed down.This also affects the stress autocorrelation function dynamics,which is slowed down, resulting in an increase in viscosity.
VII. SUMMARY
We have shown that as the number of asphaltenemolecules increases and the number of resin molecules de-creases, that is to say as bitumen ages, the decay of the stressautocorrelation function gets slower. This is consistent withthe experimental literature on aged bitumen reporting an in-crease in viscosity.1–4 The aging reaction has an importantand significant influence on bitumen rheological properties inour model. We have also shown that the stress autocorrelationdynamics slowdown is correlated to the formation of largernanoaggregates and to a slowdown in the rotational dynamics.Finally, we described qualitatively the role of each moleculetype in our model bitumen. Asphaltene molecules tend toaggregate forming a stacked structure. Docosane molecules
124506-12 Lemarchand et al. J. Chem. Phys. 139, 124506 (2013)
are not members of this structure. Resin and resinous oilmolecules follow the structure and align with the asphaltenemolecules. In addition, they are able to break the structure anddetach some asphaltene molecules from it. As bitumen ages,the aggregation process is enhanced, because resin moleculesdisappear. This mechanism explains why asphaltene nanoag-gregates get larger as bitumen ages. It results in a dynamicslowdown and in a viscosity increase.
Knowing this scenario enables us to propose a simpleway to rejuvenate bitumen: adding small aromatic moleculessuch as resin and resinous oil molecules to the mixture. Theseadditives are hopefully cheaper than polymer additives as theyare naturally present in bitumen.
The interaction between resin and asphaltene moleculesis a longstanding issue in the bitumen literature.21 Resinmolecules were first thought to act as surfactants coatingclusters of asphaltene nanoaggregates. This picture was dis-regarded because experimental evidence showed that only asmall fraction of resin molecules are associated to asphaltenenanoaggregates.33 We argue here that resin molecules may in-teract with asphaltene nanoaggregates in such a way that theyare able to break them apart. This is possible because resinmolecules are smaller than asphaltene molecules and are ableto enter and disturb the aggregate structure.
There is, however, a question left unaddressed by ourmolecular dynamic study. Experimental results on bitumen(see especially the recent reviews14, 21) are in agreement withthe asphaltene structure following the Yen-Mullins model.According to this model asphaltene molecules tend to stackinto nanoaggregates containing less than ten molecules. Theaggregates then gather into clusters approximately 6 nm long.Even though our simulations are able to probe the nanoaggre-gate dynamics, they are unable to describe clusters becauseonly small systems can be computed. The effect of the clus-ter dynamics on bitumen aging is presumably of great im-portance and can be investigated with molecular simulationswhere docosane molecules are included as an implicit solvent.This type of simulations will be the subject of a later work.
ACKNOWLEDGMENTS
This work is sponsored by the Danish Council for Strate-gic Research as part of the Cooee project. The centre for vis-cous liquid dynamics “Glass and Time” is sponsored by theDanish National Research Foundation (DNRF).
1J. F. Branthaver, J. C. Pedersen, R. E. Robertson, J. J. Duvall, S. S. Kim, P.M. Harnsberger, T. Mill, E. K. Ensley, F. A. Barbour, and J. F. Schabron,Technical Report SHRP-A-368, Strategic Highway Research Program,1993.
2P. R. Herrington, Petrol. Sci. Technol. 16, 743 (1998).3X. Lu and U. Isacsson, Constr. Build. Mater. 16, 15 (2002).4J. C. Petersen, Transportation Research Circular E-C140, TransportationResearch Board, 2009.
5J. C. Petersen, F. A. Barbour, and S. M. Dorrence, Proc. Assoc. Asph.Paving Technol. 43a, 162 (1974).
6J. Wu, “The influence of mineral aggregates and binder volumetrics on bi-tumen ageing,” Ph.D. thesis (University of Nottingham, 2009).
7ASTM D4124-09, Standard Test Method for Separation of Asphalt intoFour Fractions (American Society for Testing and Materials, Philadelphia,2009).
8D. Lesueur, Adv. Colloid. Interface Sci. 145, 42 (2009).9C. Pierre, L. Barré, A. Pina, and M. Moan, Oil Gas Sci. Technol. 59, 489(2004).
10E. Y. Sheu, Energy Fuels 16, 74 (2002).11E. B. Sirota and M. Y. Lin, Energy Fuels 21, 2809 (2007).12MD. A. Hasan, M. Fulem, A. Bazyleva, and J. M. Shaw, Energy Fuels 23,
5012 (2009).13T. Fu. Yen, J. G. Erdman, and S. S. Pollack, Anal. Chem. 33, 1587
(1961).14O. C. Mullins, Annu. Rev. Anal. Chem. 4, 393 (2011).15J. Eyssautier, D. Frot, and L. Barré, Langmuir 28, 11997 (2012).16O. C. Mullins, H. Sabbah, J. Eyssautier, A. E. Pomerantz, L. Barré, A.
B. Andrews, Y. Ruiz-Morales, F. Mostowfi, R. McFarlane, L. Goual, R.Lepkowicz, T. Cooper, J. Orbulescu, R. M. Leblanc, J. Edwards, and R. N.Zare, Energy Fuels 26, 3986 (2012).
17M. Mouazen, A. Poulesquen, F. Bart, J. Masson, M. Charlot, and B.Vergnes, Fuel Process. Technol. 114, 144 (2013).
18L. Zhang and M. L. Greenfield, Energy Fuels 21, 1102 (2007).19J. S. Hansen, C. A. Lemarchand, E. Nielsen, J. C. Dyre, and T. Schrøder, J.
Chem. Phys. 138, 094508 (2013).20L. Zhang and M. L. Greenfield, Energy Fuels 22, 3363 (2008).21O. C. Mullins, Energy Fuels 24, 2179 (2010).22See http://www.cooee-co2.dk/ for CO2 emission reduction by exploitation
of rolling resistance modelling of pavements.23D. D. Li and M. L. Greenfield, Fuels 115, 347 (2014).24N. N. Bailey, L. Bøhling, J. S. Hansen, T. Ingebrigsten, H. Larsen, U. R.
Pedersen, and T. Schrøder, “RUMD: GPU-based molecular dynamic soft-ware” (unpublished), see http://rumd.org.
25L. Artok, Y. Hirose, Y. Su, M. Hosokawa, S. Murata, and M, Nomura, En-ergy Fuels 13, 287 (1999).
26J. Murgich, J. M. Rodriguez, and Y. Aray, Energy Fuels 10, 68 (1996).27F. D. Rossini, B. J. Mair, and A. J. Streiff, Technical report, American
Petroleum Institute Research, 1953.28D. A. Storm, J. C. Edwards, S. J. DeCanio, and E. Y. Sheu, Energy Fuels 8,
561 (1994).29J. H. Irving and J. G. Kirkwood, J. Chem. Phys. 18, 817 (1950).30H. Flyvbjerg and H. G. Petersen, J. Chem. Phys. 91, 461 (1989).31J.-P. Hansen and I. R. McDonald, Theory of Simple Liquids, 3rd ed. (Aca-
demic Press, London, 2006).32A. Cavagna, Phys. Rep. 476, 51 (2009).33K. Indo, J. Ratulowski, B. Dindoruk, J. Gao, J. Zuo, and O. C. Mullins,
Energy Fuels 23, 4460 (2009).
Related Documents