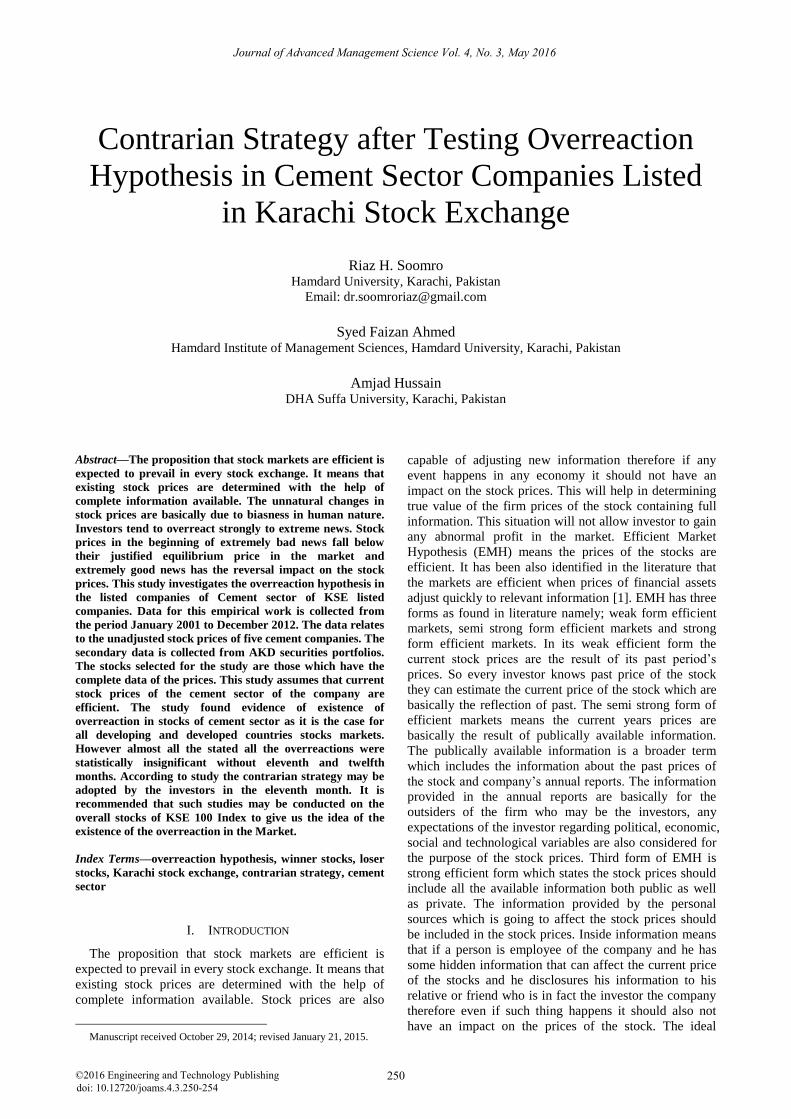
Contrarian Strategy after Testing Overreaction Hypothesis in Cement Sector Companies Listed in Karachi Stock Exchange Riaz H. Soomro Hamdard University, Karachi, Pakistan Email: [email protected] Syed Faizan Ahmed Hamdard Institute of Management Sciences, Hamdard University, Karachi, Pakistan Amjad Hussain DHA Suffa University, Karachi, Pakistan Abstract—The proposition that stock markets are efficient is expected to prevail in every stock exchange. It means that existing stock prices are determined with the help of complete information available. The unnatural changes in stock prices are basically due to biasness in human nature. Investors tend to overreact strongly to extreme news. Stock prices in the beginning of extremely bad news fall below their justified equilibrium price in the market and extremely good news has the reversal impact on the stock prices. This study investigates the overreaction hypothesis in the listed companies of Cement sector of KSE listed companies. Data for this empirical work is collected from the period January 2001 to December 2012. The data relates to the unadjusted stock prices of five cement companies. The secondary data is collected from AKD securities portfolios. The stocks selected for the study are those which have the complete data of the prices. This study assumes that current stock prices of the cement sector of the company are efficient. The study found evidence of existence of overreaction in stocks of cement sector as it is the case for all developing and developed countries stocks markets. However almost all the stated all the overreactions were statistically insignificant without eleventh and twelfth months. According to study the contrarian strategy may be adopted by the investors in the eleventh month. It is recommended that such studies may be conducted on the overall stocks of KSE 100 Index to give us the idea of the existence of the overreaction in the Market. 1 Index Terms—overreaction hypothesis, winner stocks, loser stocks, Karachi stock exchange, contrarian strategy, cement sector I. INTRODUCTION The proposition that stock markets are efficient is expected to prevail in every stock exchange. It means that existing stock prices are determined with the help of complete information available. Stock prices are also Manuscript received October 29, 2014; revised January 21, 2015. capable of adjusting new information therefore if any event happens in any economy it should not have an impact on the stock prices. This will help in determining true value of the firm prices of the stock containing full information. This situation will not allow investor to gain any abnormal profit in the market. Efficient Market Hypothesis (EMH) means the prices of the stocks are efficient. It has been also identified in the literature that the markets are efficient when prices of financial assets adjust quickly to relevant information [1]. EMH has three forms as found in literature namely; weak form efficient markets, semi strong form efficient markets and strong form efficient markets. In its weak efficient form the current stock prices are the result of its past period’s prices. So every investor knows past price of the stock they can estimate the current price of the stock which are basically the reflection of past. The semi strong form of efficient markets means the current years prices are basically the result of publically available information. The publically available information is a broader term which includes the information about the past prices of the stock and company’s annual reports. The information provided in the annual reports are basically for the outsiders of the firm who may be the investors, any expectations of the investor regarding political, economic, social and technological variables are also considered for the purpose of the stock prices. Third form of EMH is strong efficient form which states the stock prices should include all the available information both public as well as private. The information provided by the personal sources which is going to affect the stock prices should be included in the stock prices. Inside information means that if a person is employee of the company and he has some hidden information that can affect the current price of the stocks and he disclosures his information to his relative or friend who is in fact the investor the company therefore even if such thing happens it should also not have an impact on the prices of the stock. The ideal 250 ©2016 Engineering and Technology Publishing Journal of Advanced Management Science Vol. 4, No. 3, May 2016 doi: 10.12720/joams.4.3.250-254

Welcome message from author
This document is posted to help you gain knowledge. Please leave a comment to let me know what you think about it! Share it to your friends and learn new things together.
Transcript
Contrarian Strategy after Testing Overreaction
Hypothesis in Cement Sector Companies Listed
in Karachi Stock Exchange
Riaz H. Soomro Hamdard University, Karachi, Pakistan
Email: [email protected]
Syed Faizan Ahmed
Hamdard Institute of Management Sciences, Hamdard University, Karachi, Pakistan
Amjad Hussain
DHA Suffa University, Karachi, Pakistan
Abstract—The proposition that stock markets are efficient is
expected to prevail in every stock exchange. It means that
existing stock prices are determined with the help of
complete information available. The unnatural changes in
stock prices are basically due to biasness in human nature.
Investors tend to overreact strongly to extreme news. Stock
prices in the beginning of extremely bad news fall below
their justified equilibrium price in the market and
extremely good news has the reversal impact on the stock
prices. This study investigates the overreaction hypothesis in
the listed companies of Cement sector of KSE listed
companies. Data for this empirical work is collected from
the period January 2001 to December 2012. The data relates
to the unadjusted stock prices of five cement companies. The
secondary data is collected from AKD securities portfolios.
The stocks selected for the study are those which have the
complete data of the prices. This study assumes that current
stock prices of the cement sector of the company are
efficient. The study found evidence of existence of
overreaction in stocks of cement sector as it is the case for
all developing and developed countries stocks markets.
However almost all the stated all the overreactions were
statistically insignificant without eleventh and twelfth
months. According to study the contrarian strategy may be
adopted by the investors in the eleventh month. It is
recommended that such studies may be conducted on the
overall stocks of KSE 100 Index to give us the idea of the
existence of the overreaction in the Market.1
Index Terms—overreaction hypothesis, winner stocks, loser
stocks, Karachi stock exchange, contrarian strategy, cement
sector
I. INTRODUCTION
The proposition that stock markets are efficient is
expected to prevail in every stock exchange. It means that
existing stock prices are determined with the help of
complete information available. Stock prices are also
Manuscript received October 29, 2014; revised January 21, 2015.
capable of adjusting new information therefore if any
event happens in any economy it should not have an
impact on the stock prices. This will help in determining
true value of the firm prices of the stock containing full
information. This situation will not allow investor to gain
any abnormal profit in the market. Efficient Market
Hypothesis (EMH) means the prices of the stocks are
efficient. It has been also identified in the literature that
the markets are efficient when prices of financial assets
adjust quickly to relevant information [1]. EMH has three
forms as found in literature namely; weak form efficient
markets, semi strong form efficient markets and strong
form efficient markets. In its weak efficient form the
current stock prices are the result of its past period’s
prices. So every investor knows past price of the stock
they can estimate the current price of the stock which are
basically the reflection of past. The semi strong form of
efficient markets means the current years prices are
basically the result of publically available information.
The publically available information is a broader term
which includes the information about the past prices of
the stock and company’s annual reports. The information
provided in the annual reports are basically for the
outsiders of the firm who may be the investors, any
expectations of the investor regarding political, economic,
social and technological variables are also considered for
the purpose of the stock prices. Third form of EMH is
strong efficient form which states the stock prices should
include all the available information both public as well
as private. The information provided by the personal
sources which is going to affect the stock prices should
be included in the stock prices. Inside information means
that if a person is employee of the company and he has
some hidden information that can affect the current price
of the stocks and he disclosures his information to his
relative or friend who is in fact the investor the company
therefore even if such thing happens it should also not
have an impact on the prices of the stock. The ideal
250©2016 Engineering and Technology Publishing
Journal of Advanced Management Science Vol. 4, No. 3, May 2016
doi: 10.12720/joams.4.3.250-254
market is one in which prices fully reflect all available
information [2], although it is very difficult for the
markets to contain third form of EMH.
In contradiction to EMH is the market hypothesis
stating that investors react unevenly to the new
information about a given stock. The contrarian strategy
is to be followed in case overreaction exists in stock
prices. The winner stocks of one period become the losers
in the subsequent period and vice versa. There exists a
degree of predictability in future stock prices and
investors take advantage of it by selling previous winner
stocks and buying previous loser stocks to net in
consistent abnormal profit is called a contrarian strategy.
One study done by N. Ali, Nassir, Sazali, and Abidin
states that the unnatural changes in stock prices are
basically due to biasness in human nature. Investors tend
to overreact strongly to extreme news and have their own
interpretation of the stock prices or likes and dislikes
about certain stocks. Stock prices in the beginning of
extremely bad news fall below their justified equilibrium
price. And extremely good news has the reversal impact
on the stock prices. But as investors realize they reacted
too strongly to the news, price movements begin to move
towards the equilibrium price [3]. Thus the EMH
completely fails in all its three forms. Since the investors
do not have any information therefore the prices of the
stock change dramatically because of some event that has
occurred. So at that point of time the prices of the stock
do not reflect its true value straight away rather its takes
some time to readjust to its true value. In this way the
overreaction in the stock prices occurs. It is important to
find out if any overreaction occurs in each stock
exchange in general sectors in particular. In Pakistan no
proper research has been undertaken on the overreaction
in Pakistan. This study hypothesis that the significant
overreaction does exists in the cement sector of Karachi
Stock Exchange (KSE) over the period of 2000 to 2012.
The remaining part of this research paper consists of
literature on overreaction hypothesis, Data and
methodology, Data Analysis and Findings finally
Conclusion and Recommendations.
II. LITERATURE REVIEW
Ample of literature is available on the overreaction
hypothesis. The first prominent work in this area was
done by the Bondt and Thaler in which they tested the
hypothesis that whether there is a significant impact of
dramatic news events on the stock prices of the firm. It
was concluded that the dramatic news have the
significant impact on the prices of the firm. This study is
famous in literature because it was for the first time that
proper empirical research work was done on this
theory[2]. Although the work done by Professor Kendall
is also extremely important in a sense that it is considered
as basis for the study of random walk. In which he
studied the weekly data of 22 prices series related to
cotton and wheat were studied. According to him it is
difficult to predict prices a week ahead without any
information available because of the fact that the changes
in the stock prices are wandering means random pattern
arise in the series. In this study he also identified a serial
correlation and a lags of the time series which made this
study unique at that time [4]. Cootner edited a book in
which he collected series of papers on the random
characteristics of stock prices after that lot of studies have
been undertaken in the same area [5] [6] [7]. The study
conducted by A. Tversky and D. Kahneman proves that
initially it is the human nature the people tend to
overreact when they faced with good news or bad news
[8]. Coming back to the work done by Bondt, and R.
Thaler [2], they introduced two terms. First, the winner
stocks means stocks had positive returns with respect to
the market returns and second, the loser stocks meaning
stocks which were losing their returns with respect to
market returns. The results obtained from this study were
interesting in a sense looser stocks became winners
stocks and winner stocks became loser stocks. This
confirmed the notion of the study that market over
reaction does exist in long run also.
The study of contrarian and momentum strategies in
the China stock market was about the overreaction
hypothesis. In their study overreaction was reported in
weekly data for up to twenty six weeks, however those
reported overreactions were statistically insignificant [9].
One other study was done by the J. Wang, B.M. Burton,
and D.M. Power in which they reported that for that
overreaction existed for the particular set of the shares
and the stocks were reported as insignificant [10].
While identifying the sources of contrarian strategy P.
H. Chou, K.C.J. Wei, and H. Chung found that results
were significant for holding periods up to twenty four
months [11]. Yet another study done by the J.M. Griffin,
P.J. Kelly, and F. Nardari was unique in nature that it was
cross-sectional study on Pakistan Zimbabwe, Argentina
and Canada. The study was on the developed as well as
developing markets. They reported that almost
approximately 80% of the stock reported as significant in
case of developed market where as approximately 82% of
the stocks were reported as significant; as for as
overreaction in the stocks is concerned [12].
In recent studies the work done by Ali, Nassir, Hassan
and Abidin is also important. In this study the specific
events were identified in Malaysia and overreaction was
checked. They foud overreaction for the political events
and no overreaction was reported for the other events.
One similar type of study was done in Malaysia in
2011 by R. Ali, Z. Ahmad, and S. Anusakumar. They
distinguished their study from the perspective of trading
volumes while working on the data weekly data from
January 2000 to October 2010. They used the same
terminology winners and losers as defined by the Bondt,
and R. Thaler [2]. They found negative returns in case of
winner stocks and positive returns in case of loser stocks.
Statistically significant returns for the loser portfolios
were reported in this study suggesting that contrarian
strategy should be focused on the low volume stocks
because of the high overreaction existing in these stocks.
Further it was also found that there was negative
relationship between overreaction and trading volumes
[13].
251©2016 Engineering and Technology Publishing
Journal of Advanced Management Science Vol. 4, No. 3, May 2016
III. DATA AND METHODOLOGY
This study investigates the overreaction hypothesis in
the listed companies of KSE in particular to the cement
sector of Pakistan. Data for this empirical work is
collected from the month January 2001 to December
2012. Eleven years monthly data is collected related to
the prices of five cement companies, namely Maple
Cement, Lucky Cement, Pioneer Cement, Dadabhoy
Cement and Fauji Cement. The secondary data is
collected from AKD securities portfolios. The stocks
selected for the study are those which have the complete
data of the prices. This study assumes that current stock
prices of the cement sector of the company are efficient.
Only those monthly periods are considered whose
monthly prices were available. The winner and loser
stocks are constructed according to the same method as
discussed by the Ali et. al. [13]. First of all ranking of the
stocks is done according to the previous month’s returns
performance. Average monthly Price of the Stock (AMP)
is taken with the formula.
AMPit =Σ Pit
Nd
where Σ Pit show the sum of the prices of the stock and
Nd shows the total number of the days.
Monthly Returns of the Stocks Computed with the
Formula:
MRit = (AMPit − AMPit−1)
AMPit−1
where AMPit shows the average current month price of
the stock i over time period t and AMPit −1 shows the
average previous months price of the stock i over t time
period.
The top forty percent stocks are considered as winner
stock and last forty percent stocks are considered as
looser stocks for constructing returns. The portfolios are
held for the periods of first, second, third, fourth, eighth,
eleventh, twelfth, twenty fourth, thirty sixth, thirty seven,
thirty eight, seventy, seventy one and seventy second,
ninety nine, hundred, one hundred one, one hundred
thirty, one hundred thirty one, one hundred thirty eight
month.
The overreaction in the cement sector of KSE is
assessed through the formula given by the Bondt, and
Thaler [2]. For that purpose that Abnormal Returns AbRit
are computed by constructed by subtracting Market
Returns MRit of the stock i over t months from Stocks
Returns SRit of the stock i over t months.
So to show this statement mathematically, assuming
that any pricing model is not misspecified, the difference
can be reported as:
AbRit = Rit − MRit
The market returns are computed on the basis of the
available five stocks cement sector data. Where the
market return is computed as:
MRit = E(Rmt)
Under the Overreaction, the average abnormal return
of the stock is computed AAbRit is computed with the
help of formula:
AAbRit =Σ AbRit
Ns
where Σ AbRit is the sum of abnormal returns over t
months and Ns is the total number of the stocks selected
in a portfolio.
The difference between AAbRit of loser stocks shown
as ALAbRit and AbRit of winner stocks shown as WAbRit
should be greater than zero. So if such thing happens then
it means that loser stocks are outperforming the winner
stocks. It will confirm our hypothesis that overreaction
exists in the market. Mathematically stated as:
ALAbRit − AWAbRit > 0
And if the markets are efficient as per formula of the
EMH this difference should be equal to zero.
Mathematically stated as:
ALAbRit − AWAbRit = 0
Further when to adopt a contrarian strategy would be
decided in the next section of this study.
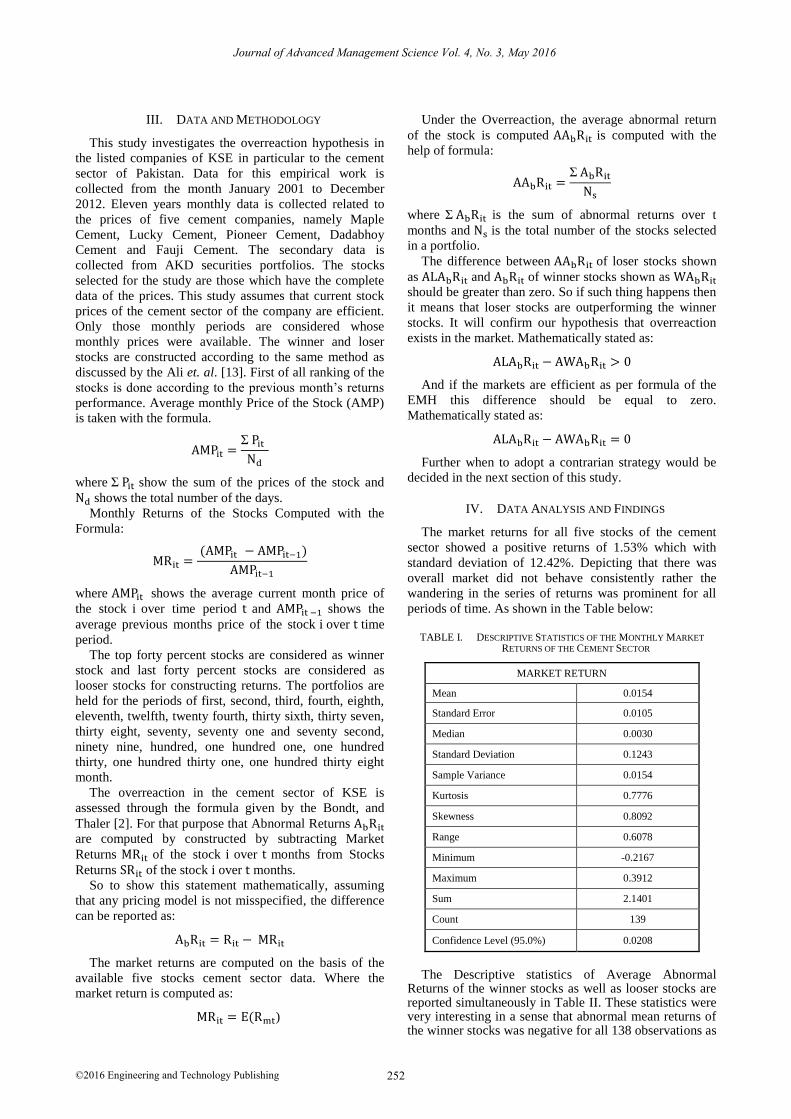
IV. DATA ANALYSIS AND FINDINGS
The market returns for all five stocks of the cement
sector showed a positive returns of 1.53% which with
standard deviation of 12.42%. Depicting that there was
overall market did not behave consistently rather the
wandering in the series of returns was prominent for all
periods of time. As shown in the Table below:
TABLE I. DESCRIPTIVE STATISTICS OF THE MONTHLY MARKET
RETURNS OF THE CEMENT SECTOR
MARKET RETURN
Mean 0.0154
Standard Error 0.0105
Median 0.0030
Standard Deviation 0.1243
Sample Variance 0.0154
Kurtosis 0.7776
Skewness 0.8092
Range 0.6078
Minimum -0.2167
Maximum 0.3912
Sum 2.1401
Count 139
Confidence Level (95.0%) 0.0208
The Descriptive statistics of Average Abnormal
Returns of the winner stocks as well as looser stocks are reported simultaneously in Table II. These statistics were very interesting in a sense that abnormal mean returns of the winner stocks was negative for all 138 observations as
252©2016 Engineering and Technology Publishing
Journal of Advanced Management Science Vol. 4, No. 3, May 2016
compare to the abnormal mean returns of loser stocks. This also suggests the stocks which were winners in the beginning of the period i.e. first month must have performed poorly for the next months and vice-versa would be the case for the loser stocks. These descriptive statistics also give hint for the existence of the overreaction of the stocks in the Market. The maximum abnormal returns of the loser stocks 31% where as for the winner stocks has been 18% and minimum average abnormal return for the loser stocks has been -0.17% where as for the winner stocks it has been -23% for the winner stocks.
TABLE II. DESCRIPTIVE STATISTICS OF AVERAGE ABNORMAL
RETURNS OF WINNER STOCKS AND LOSER STOCKS
WINNER STOCK LOSER STOCK
Mean -0.0015 0.0023
Standard Error 0.0047 0.0048
Median 0.0014 -0.0027
Standard Deviation 0.0552 0.0561
Sample Variance 0.0030 0.0031
Kurtosis 3.6255 8.0568
Skewness -0.9097 1.4772
Range 0.4147 0.4886
Minimum -0.2334 -0.1707
Maximum 0.1813 0.3179
Sum -0.2127 0.3227
Count 138 138.0000
Confidence Level(95.0%)
0.0093 0.0094
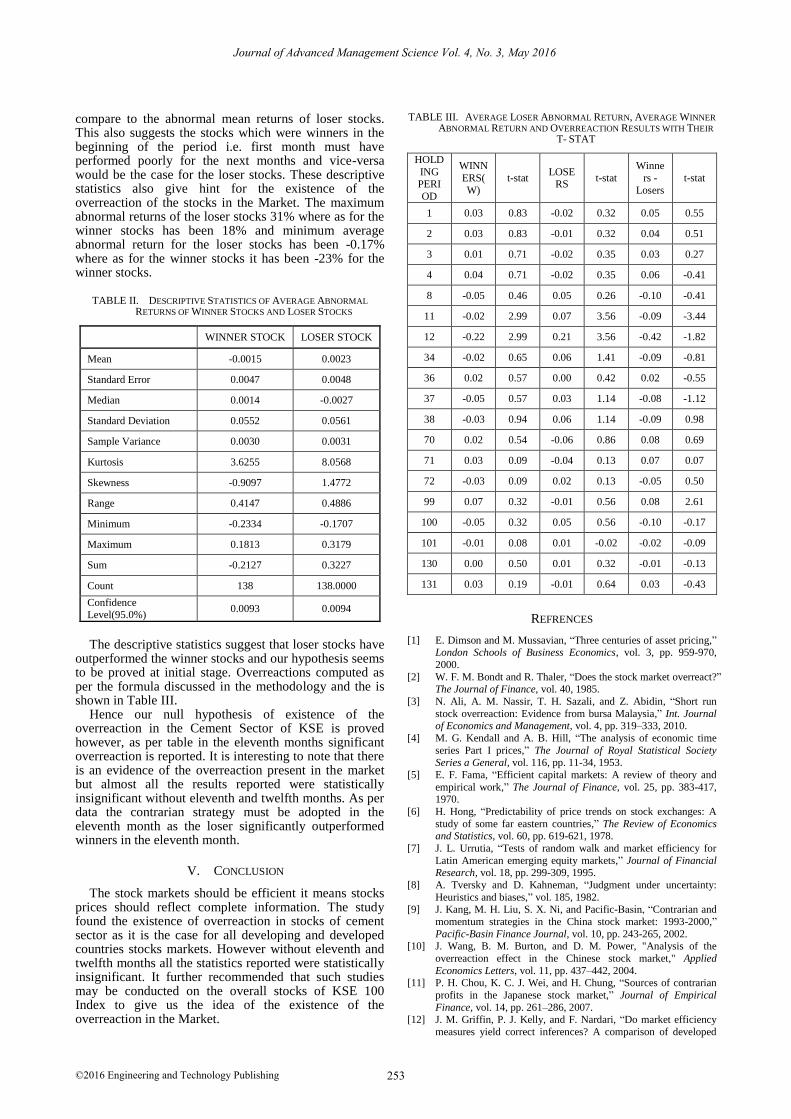
The descriptive statistics suggest that loser stocks have
outperformed the winner stocks and our hypothesis seems to be proved at initial stage. Overreactions computed as per the formula discussed in the methodology and the is shown in Table III.
Hence our null hypothesis of existence of the overreaction in the Cement Sector of KSE is proved however, as per table in the eleventh months significant overreaction is reported. It is interesting to note that there is an evidence of the overreaction present in the market but almost all the results reported were statistically insignificant without eleventh and twelfth months. As per data the contrarian strategy must be adopted in the eleventh month as the loser significantly outperformed winners in the eleventh month.
V. CONCLUSION
The stock markets should be efficient it means stocks prices should reflect complete information. The study found the existence of overreaction in stocks of cement sector as it is the case for all developing and developed countries stocks markets. However without eleventh and twelfth months all the statistics reported were statistically insignificant. It further recommended that such studies may be conducted on the overall stocks of KSE 100 Index to give us the idea of the existence of the overreaction in the Market.
TABLE III. AVERAGE LOSER ABNORMAL RETURN, AVERAGE WINNER
ABNORMAL RETURN AND OVERREACTION RESULTS WITH THEIR
T- STAT
HOLD
ING PERI
OD
WINN
ERS(
W)
t-stat LOSE
RS t-stat
Winne
rs -
Losers
t-stat
1 0.03 0.83 -0.02 0.32 0.05 0.55
2 0.03 0.83 -0.01 0.32 0.04 0.51
3 0.01 0.71 -0.02 0.35 0.03 0.27
4 0.04 0.71 -0.02 0.35 0.06 -0.41
8 -0.05 0.46 0.05 0.26 -0.10 -0.41
11 -0.02 2.99 0.07 3.56 -0.09 -3.44
12 -0.22 2.99 0.21 3.56 -0.42 -1.82
34 -0.02 0.65 0.06 1.41 -0.09 -0.81
36 0.02 0.57 0.00 0.42 0.02 -0.55
37 -0.05 0.57 0.03 1.14 -0.08 -1.12
38 -0.03 0.94 0.06 1.14 -0.09 0.98
70 0.02 0.54 -0.06 0.86 0.08 0.69
71 0.03 0.09 -0.04 0.13 0.07 0.07
72 -0.03 0.09 0.02 0.13 -0.05 0.50
99 0.07 0.32 -0.01 0.56 0.08 2.61
100 -0.05 0.32 0.05 0.56 -0.10 -0.17
101 -0.01 0.08 0.01 -0.02 -0.02 -0.09
130 0.00 0.50 0.01 0.32 -0.01 -0.13
131 0.03 0.19 -0.01 0.64 0.03 -0.43
REFRENCES
[1] E. Dimson and M. Mussavian, “Three centuries of asset pricing,” London Schools of Business Economics, vol. 3, pp. 959-970,
2000.
[2] W. F. M. Bondt and R. Thaler, “Does the stock market overreact?” The Journal of Finance, vol. 40, 1985.
[3] N. Ali, A. M. Nassir, T. H. Sazali, and Z. Abidin, “Short run
stock overreaction: Evidence from bursa Malaysia,” Int. Journal of Economics and Management, vol. 4, pp. 319–333, 2010.
[4] M. G. Kendall and A. B. Hill, “The analysis of economic time
series Part I prices,” The Journal of Royal Statistical Society
Series a General, vol. 116, pp. 11-34, 1953.
[5] E. F. Fama, “Efficient capital markets: A review of theory and
empirical work,” The Journal of Finance, vol. 25, pp. 383-417, 1970.
[6] H. Hong, “Predictability of price trends on stock exchanges: A
study of some far eastern countries,” The Review of Economics and Statistics, vol. 60, pp. 619-621, 1978.
[7] J. L. Urrutia, “Tests of random walk and market efficiency for
Latin American emerging equity markets,” Journal of Financial Research, vol. 18, pp. 299-309, 1995.
[8] A. Tversky and D. Kahneman, “Judgment under uncertainty:
Heuristics and biases,” vol. 185, 1982. [9] J. Kang, M. H. Liu, S. X. Ni, and Pacific-Basin, “Contrarian and
momentum strategies in the China stock market: 1993-2000,”
Pacific-Basin Finance Journal, vol. 10, pp. 243-265, 2002. [10] J. Wang, B. M. Burton, and D. M. Power, "Analysis of the
overreaction effect in the Chinese stock market," Applied
Economics Letters, vol. 11, pp. 437–442, 2004.
[11] P. H. Chou, K. C. J. Wei, and H. Chung, “Sources of contrarian
profits in the Japanese stock market,” Journal of Empirical
Finance, vol. 14, pp. 261–286, 2007. [12] J. M. Griffin, P. J. Kelly, and F. Nardari, “Do market efficiency
measures yield correct inferences? A comparison of developed
253©2016 Engineering and Technology Publishing
Journal of Advanced Management Science Vol. 4, No. 3, May 2016

and emerging markets,” Review of Financial Studies, vol. 23, pp. 3225–3277, 2010.
[13] R. Ali, Z. Ahmad, and S. Anusakumar, “Stock market
overreaction and trading volume: Evidence from Malaysia,” Asian Academy of Management Journal of Accounting and
Finance, vol. 7, pp. 103-119, 2011.
Dr. Riaz H. Soomro was born in Shikarpur,
Sindh, Pakistan on January 1, 1980. He
has
earned various degrees
in business and
economics including PhD in Business
Economics from Hamdard University, Karachi,
Pakistan
in 2014. M.S.
in Management Sciences
from Shaheed Zulfiqar
Ali Bhutto
Institute of Science and Technology
(SZABIST), Karachi, Pakistan
in 2008.
M.B.A.
in Finance from Newports Institute of Communication and Economics (NICE), Karachi, Pakistan in 2003., and M.A. Economics from Shah
Abdul Latif University Khaipur, Pakistan in 2002. Dr. Soomro has more
than 14 years of teaching and research experience at university level. He currently works with Hamdard Institute of Management Sciences,
Hamdard University, Karachi, Pakistan as Assistant Professor. He has
also worked in various other reputed universities of Pakistan namely Dow University of Health Sciences, Karachi, Pakistan as Assistant
Professor of Economics, Finance and Business Research. Indus
University, Karachi, Pakistan as Assistant Professor, Greenwich University, Karachi, Pakistan as Coordinator Faculty of Social Sciences
and Baqai Institute of Management Sciences, Baqai Medical University,
Karachi, Pakistan as Lecturer in the same field as mentioned above. He has more than 13 publications in various national and international
journals on his credit.
254©2016 Engineering and Technology Publishing
Journal of Advanced Management Science Vol. 4, No. 3, May 2016
Related Documents