1.3 0.3 Weighted median 1.7 0.4 Trimmed mean 1.4 0.4 All groups CPI, seasonally adjusted CPI analytical series 2.9 0.9 Insurance and financial services 3.3 0.2 Education 0.6 0.6 Recreation and culture –7.5 –2.3 Communication –3.4 –0.5 Transport 3.9 –0.2 Health 1.9 1.1 Furnishings, household equipment and services 1.8 1.0 Housing 1.2 0.3 Clothing and footwear 5.7 1.1 Alcohol and tobacco 1.5 1.7 Food and non–alcoholic beverages 1.3 0.7 All groups CPI % change % change Sep Qtr 2015 to Sep Qtr 2016 Jun Qtr 2016 to Sep Qtr 2016 W EIGHTED AVERAGE O F EIGHT CAPITAL CITIES KEY FIGURES THE ALL GROUPS CPI rose 0.7% this quarter, compared with a rise of 0.4% in the June quarter 2016. rose 1.3% over the twelve months to the September quarter 2016, compared with a rise of 1.0% over the twelve months to the June quarter 2016. OVERVIEW OF CPI MOVEMENTS The most significant price rises this quarter are fruit (+19.5%), electricity (+5.4%), vegetables (+5.9%), tobacco (+2.3%) and property rates and charges (+4.0%). The most significant offsetting price falls this quarter are automotive fuel (-2.9%) and telecommunication equipment and services (-2.5%). KEY POINTS E M B A R G O : 1 1 . 3 0 A M ( C A N B E R R A T I M E ) W E D 2 6 O C T 2 0 1 6 CONSUMER PRICE INDEX AUSTRALIA 6401.0 S E P T E M B E R Q U A R T E R 2 0 1 6 For further information about these and related statistics, contact the National Information and Referral Service on 1300 135 070. All Groups CPI Quarterly change Sep 2007 Sep 2010 Sep 2013 Sep 2016 % –0.5 0 0.5 1.0 1.5 Contribution to quarterly change All groups CPI F. & n–a.b. A. & t. C. & f. Housing F.,h.e & s. Health Transp. Comm. R. & c. Educ. I. & f.s. –0.3 0 0.3 0.6 0.9 Index points INQUIRIES www.abs.gov.au

Welcome message from author
This document is posted to help you gain knowledge. Please leave a comment to let me know what you think about it! Share it to your friends and learn new things together.
Transcript

1.30.3Weighted median
1.70.4Trimmed mean
1.40.4All groups CPI, seasonally adjusted
CPI analytical series
2.90.9Insurance and financial services
3.30.2Education
0.60.6Recreation and culture
–7.5–2.3Communication
–3.4–0.5Transport
3.9–0.2Health
1.91.1
Furnishings, household equipment and
services
1.81.0Housing
1.20.3Clothing and footwear
5.71.1Alcohol and tobacco
1.51.7Food and non–alcoholic beverages
1.30.7All groups CPI
% change% change
Sep Qtr 2015 toSep Qtr 2016
Jun Qtr 2016 toSep Qtr 2016
W E I G H T E D A V E R A G E O FE I G H T C A P I T A L C I T I E S
K E Y F I G U R E S
T H E A L L G R O U P S C P I
rose 0.7% this quarter, compared with a rise of 0.4% in the June quarter 2016.
rose 1.3% over the twelve months to the September quarter 2016, compared with a rise
of 1.0% over the twelve months to the June quarter 2016.
O V E R V I E W O F C P I M O V E M E N T S
The most significant price rises this quarter are fruit (+19.5%), electricity (+5.4%),
vegetables (+5.9%), tobacco (+2.3%) and property rates and charges (+4.0%).
The most significant offsetting price falls this quarter are automotive fuel (-2.9%) and
telecommunication equipment and services (-2.5%).
K E Y P O I N T S
E M B A R G O : 1 1 . 3 0 A M ( C A N B E R R A T I M E ) W E D 2 6 O C T 2 0 1 6
CONSUMER PRICE INDEX A U S T R A L I A
6401.0S E P T E M B E R Q U A R T E R 2 0 1 6
For further informationabout these and relatedstatistics, contact theNational Information andReferral Service on1300 135 070.
All Groups CPIQuarterly change
Sep2007
Sep2010
Sep2013
Sep2016
%
–0.5
0
0.5
1.0
1.5
Contribution to quarterly change
All groups CPIF. & n–a.b.
A. & t.C. & f.
HousingF.,h.e & s.
HealthTransp.Comm.R. & c.Educ.
I. & f.s.
–0.3 0 0.3 0.6 0.9Index points
I N Q U I R I E S
w w w . a b s . g o v . a u
25 October 2017September 2017
26 July 2017June 2017
26 April 2017March 2017
25 January 2017December 2016
RELEASE DATEISSUE (Quarter)FO R T H C O M I N G I S S U E S
Any discrepancies between totals and sums of components in this publication are due to
rounding.
RO U N D I N G
This issue contains the feature article ‘Review of the Consumer Price Index International
Trade Exposure Series'. The changes outlined in this review will be implemented in the
December quarter 2016 issue of the CPI, which is scheduled for release on 25 January
2017.
The CPI Annual Seasonal Re-analysis (ASR) was conducted in the September quarter
2016. The ASR assesses the CPI seasonal patterns in more detail than is possible in the
quarterly processing cycle. The outcomes of the ASR are provided in the Appendix to
this issue.
Changes to the seasonally adjusted CPI series do not affect the original CPI index series.
For more information about seasonal adjustment, see paragraphs 14 to 17 of the
Explanatory notes.
CH A N G E S IN TH I S I S S U E
not elsewhere classifiedn.e.c.
Consumer Price IndexCPI
Australian Bureau of StatisticsABSAB B R E V I A T I O N S
Da v i d W . Ka l i s c h
Au s t r a l i a n S t a t i s t i c i a n
2 A B S • CO N S U M E R P R I C E I N D E X • 6 4 0 1 . 0 • SE P QT R 2 0 1 6
N O T E S

The main contributors to the rise in the alcohol and tobacco group this quarter are
tobacco (+2.3%) and beer (+0.8%).The rise in tobacco is mainly due to the effects of
the federal excise tax increase effective from 1 September 2016.
Over the last twelve months, the alcohol and tobacco group rose 5.7%. The main
contributor to the rise is tobacco (+13.1%).
In seasonally adjusted terms, the alcohol and tobacco group rose 1.4% this quarter. The
main contributor to the rise is tobacco (+3.0%).
AL C O H O L AN D TO B A C C O
GR O U P (+ 1 . 1 % )
The main contributors to the rise in the housing group this quarter are electricity
(+5.4%) and property rates and charges (+4.0%). The rise in electricity is driven by
increases in wholesale electricity costs across the eastern and southern states.
Over the last twelve months, the housing group rose 1.8%. The main contributor to the
rise is new dwelling purchase by owner-occupiers (+1.6%).
In seasonally adjusted terms, the housing group rose 0.1% this quarter. The main
contributor to the rise is electricity (+1.8%).
HO U S I N G GR O U P (+ 1 . 0 % )
The main contributors to the rise in the food and non-alcoholic beverages group this
quarter are fruit (+19.5%) and vegetables (+5.9%). The rise in fruit and vegetable prices
is due to adverse weather conditions, including floods, in major growing areas, impacting
supply.
Over the last twelve months, the food and non-alcoholic beverages group rose 1.5%. The
main contributor to the rise is vegetables (+11.9%).
In seasonally adjusted terms, the food and non-alcoholic beverages group recorded a rise
of 1.2%. The main contributor to the rise is fruit (+7.9%).
FO O D AN D
NO N - A L C O H O L I C
BE V E R A G E S GR O U P
(+ 1 . 7 % )
All groups CPIFood and non-alcoholic beverages
Alcohol and tobaccoClothing and footwear
HousingFurnishings, household equipment and services
HealthTransport
CommunicationRecreation and culture
EducationInsurance and financial services
–3 –2 –1 0 1 2%
WEIGHTED AVERAGE OF EIGHT CAPITAL CIT IES, Percen tage changefrom prev ious quar te r
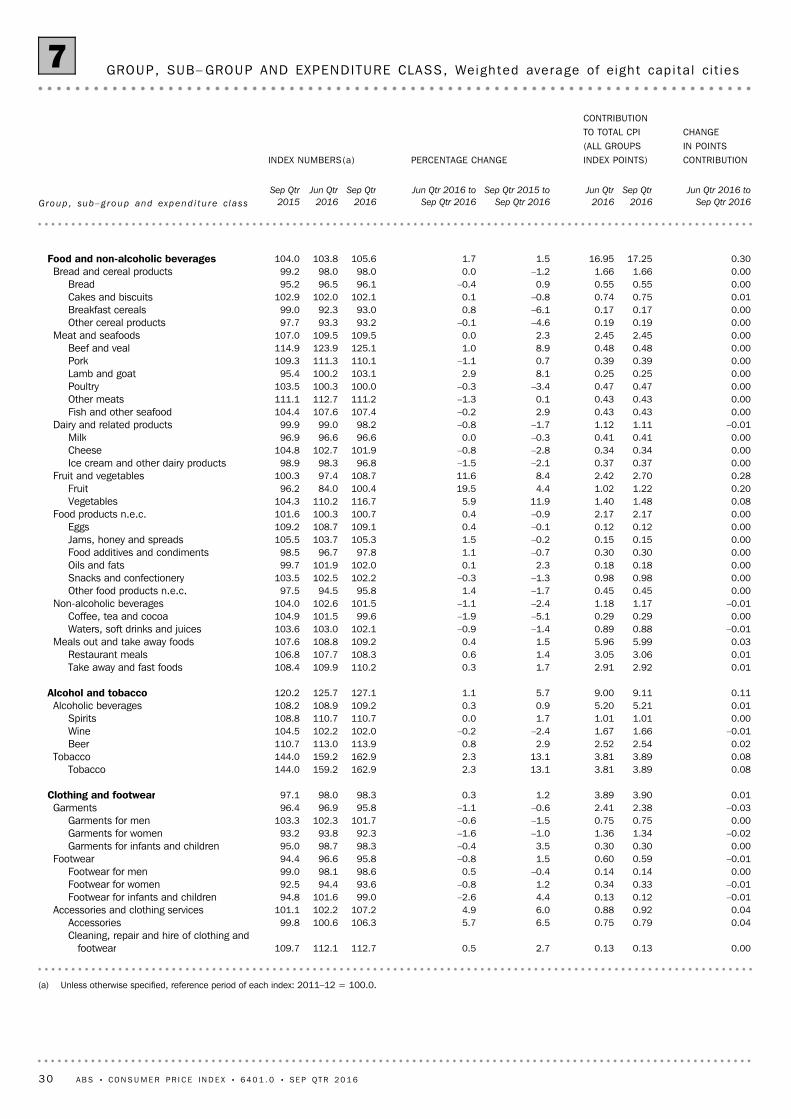
The discussion of the CPI groups below is ordered in terms of their absolute significance
to the change in All groups index points for the quarter (see Tables 6 and 7). Unless
otherwise stated, the analysis is in original terms.
CP I GR O U P S
MA I N CO N T R I B U T O R S TO CH A N G E
A B S • CO N S U M E R P R I C E I N D E X • 6 4 0 1 . 0 • SE P QT R 2 0 1 6 3
M A I N C O N T R I B U T O R S T O C H A N G E
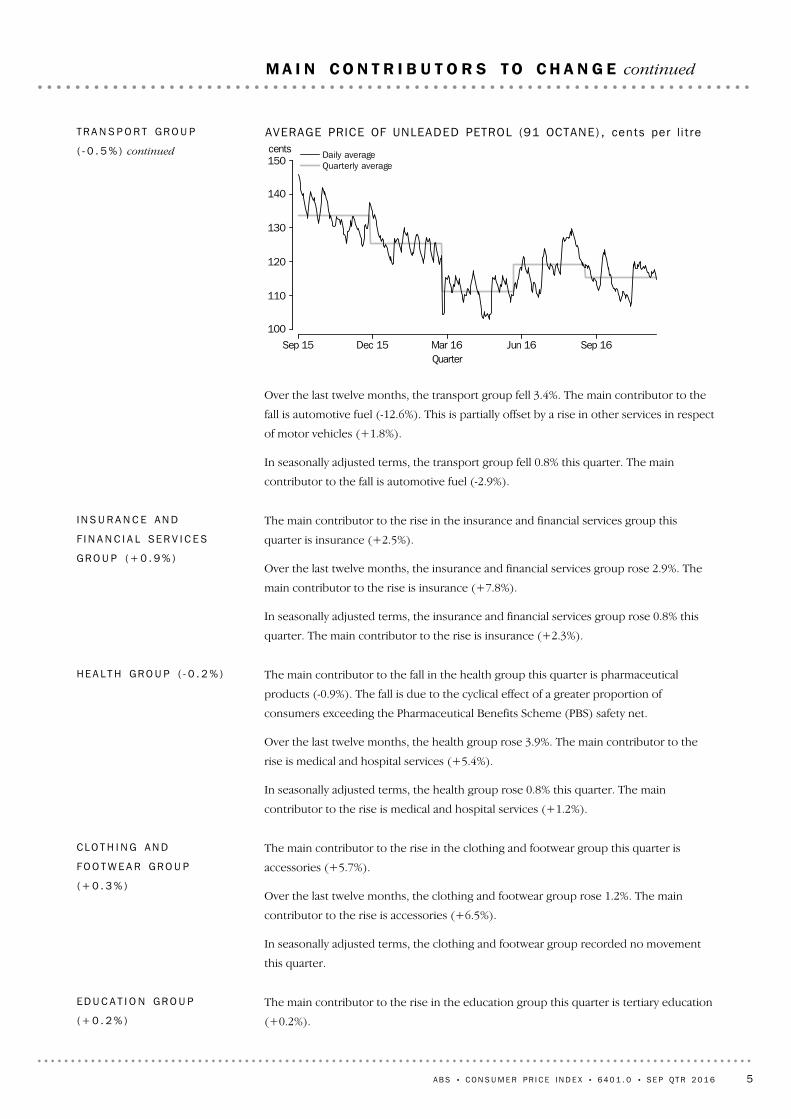
The main contributor to the fall in the transport group this quarter is automotive fuel
(-2.9%). Automotive fuel fell in July (-5.5%) and August (-5.3%), and rose in September
(+4.7%). All fuel types recorded decreases this quarter with the exception of diesel. The
fall is partially offset by a rise in other services in respect of motor vehicles (+1.5%).
The following graph shows the pattern of the average daily prices for unleaded petrol for
the eight capital cities over the last fifteen months.
TR A N S P O R T GR O U P
( - 0 . 5 % )
The main contributor to the rise in the recreation and culture group this quarter is
international holiday travel and accommodation (+1.9%). The rise in international travel
and accommodation is typical of the summer peak seasons in Europe and America.
Over the last twelve months, the recreation and culture group rose 0.6%. The main
contributors to the rise are international holiday travel and accommodation (+2.5%) and
other recreational, sporting and cultural services (+3.5%). This is partially offset by a fall
in audio, visual and computing equipment (-8.9%).
In the CPI, airfares are collected in advance (at the time of payment), but are only used
in the CPI in the quarter in which the trip is undertaken. International airfares are
collected two months in advance (July for travel in September) and domestic airfares are
collected one month in advance (August for travel in September).
In seasonally adjusted terms, the recreation and culture group fell 0.2% this quarter. The
main contributor to the fall is international holiday travel and accommodation (-1.9%).
RE C R E A T I O N AN D
CU L T U R E GR O U P (+ 0 . 6 % )
The main contributor to the fall in the communication group this quarter is
telecommunication equipment and services (-2.5%).
Over the last twelve months, the communication group fell 7.5%. The main contributor
to the fall is telecommunication equipment and services (-7.9%).
The communication group is not seasonally adjusted.
CO M M U N I C A T I O N GR O U P
( - 2 . 3 % )
The main contributors to the rise in the furnishings, household equipment and services
group this quarter are childcare (+3.6%) and household textiles (+5.9%).
Over the last twelve months, the furnishings, household equipment and services group
rose 1.9%. The main contributor to the rise is child care (+7.9%).
In seasonally adjusted terms, the furnishings, household equipment and services group
rose 0.6% this quarter.
FU R N I S H I N G S ,
HO U S E H O L D EQ U I P M E N T
AN D SE R V I C E S GR O U P
(+ 1 . 1 % )
4 A B S • CO N S U M E R P R I C E I N D E X • 6 4 0 1 . 0 • SE P QT R 2 0 1 6
M A I N C O N T R I B U T O R S T O C H A N G E continued
The main contributor to the rise in the education group this quarter is tertiary education
(+0.2%).
ED U C A T I O N GR O U P
(+ 0 . 2 % )
The main contributor to the rise in the clothing and footwear group this quarter is
accessories (+5.7%).
Over the last twelve months, the clothing and footwear group rose 1.2%. The main
contributor to the rise is accessories (+6.5%).
In seasonally adjusted terms, the clothing and footwear group recorded no movement
this quarter.
CL O T H I N G AN D
FO O T W E A R GR O U P
(+ 0 . 3 % )
The main contributor to the fall in the health group this quarter is pharmaceutical
products (-0.9%). The fall is due to the cyclical effect of a greater proportion of
consumers exceeding the Pharmaceutical Benefits Scheme (PBS) safety net.
Over the last twelve months, the health group rose 3.9%. The main contributor to the
rise is medical and hospital services (+5.4%).
In seasonally adjusted terms, the health group rose 0.8% this quarter. The main
contributor to the rise is medical and hospital services (+1.2%).
HE A L T H GR O U P ( - 0 . 2 % )
The main contributor to the rise in the insurance and financial services group this
quarter is insurance (+2.5%).
Over the last twelve months, the insurance and financial services group rose 2.9%. The
main contributor to the rise is insurance (+7.8%).
In seasonally adjusted terms, the insurance and financial services group rose 0.8% this
quarter. The main contributor to the rise is insurance (+2.3%).
I N S U R A N C E AN D
F I N A N C I A L SE R V I C E S
GR O U P (+ 0 . 9 % )
Over the last twelve months, the transport group fell 3.4%. The main contributor to the
fall is automotive fuel (-12.6%). This is partially offset by a rise in other services in respect
of motor vehicles (+1.8%).
In seasonally adjusted terms, the transport group fell 0.8% this quarter. The main
contributor to the fall is automotive fuel (-2.9%).
Sep 15 Dec 15 Mar 16 Jun 16 Sep 16Quarter
cents
100
110
120
130
140
150Daily averageQuarterly average
AVERAGE PRICE OF UNLEADED PETROL (91 OCTANE) , cents per l i t reTR A N S P O R T GR O U P
( - 0 . 5 % ) continued
A B S • CO N S U M E R P R I C E I N D E X • 6 4 0 1 . 0 • SE P QT R 2 0 1 6 5
M A I N C O N T R I B U T O R S T O C H A N G E continued

The All groups CPI seasonally adjusted rose 0.4% this quarter, compared to the original
All groups CPI which recorded a rise of 0.7%.
The trimmed mean rose 0.4% this quarter, compared to a rise of 0.5% in the June quarter
2016. Over the last twelve months, the trimmed mean rose 1.7%, compared to a rise of
1.7% over the twelve months to the June quarter 2016.
The weighted median rose 0.3% this quarter, compared to a revised rise of 0.5% in the
June quarter 2016. Over the last twelve months, the weighted median rose 1.3%,
compared to a revised rise of 1.5% over the twelve months to the June quarter 2016.
SE A S O N A L L Y AD J U S T E D
AN A L Y T I C A L SE R I E S
The tradables component (see Table 8) of the All groups CPI rose 1.0% this quarter. Price
changes for the goods and services in this component are largely determined on the
world market. The tradables component represents approximately 40% of the weight of
the CPI. The most significant contributor to the 0.9% rise in the tradable goods
component is fruit (+19.5%). The most significant offsetting fall in the tradable goods
component is automotive fuel (-2.9%). The rise in the tradable services component of
1.9% is driven by international holiday travel and accommodation (+1.9%).
The non-tradables component of the All groups CPI rose 0.5% this quarter. Price changes
for the goods and services in this component are largely determined by domestic price
pressures. The non-tradables component represents approximately 60% of the weight of
the CPI. The most significant contributor to the 0.8% rise in the non-tradable goods
component is electricity (+5.4%). The rise in the non-tradable services component of
0.4% is driven by property rates and charges (+4.0%). The most significant offsetting fall
in the non-tradable services component is telecommunication equipment and services
(-2.5%).
Over the last twelve months, the tradables component rose 0.7%, while the
non-tradables component rose 1.7%. This compares to no movement and a rise of 1.6%
respectively over the twelve months to the previous quarter.
In seasonally adjusted terms, the tradables component of the All groups CPI rose 0.4%
this quarter, while the non-tradables component rose 0.4%.
A detailed description of which expenditure classes are classified as tradable and
non-tradable in the 16th series is shown in Appendix 1 of the September quarter 2011
issue of Consumer Price Index, Australia (cat. no 6401.0).
I N T E R N A T I O N A L TR A D E
EX P O S U R E - TR A D A B L E S
AN D NO N - T R A D A B L E S
Over the last twelve months, the education group rose 3.3%. The main contributor to
the rise is secondary education (+4.6%).
In seasonally adjusted terms, the education group rose 1.4% this quarter. The main
contributors to the rise are tertiary education (+1.4%) and secondary education
(+1.3%).
ED U C A T I O N GR O U P
(+ 0 . 2 % ) continued
6 A B S • CO N S U M E R P R I C E I N D E X • 6 4 0 1 . 0 • SE P QT R 2 0 1 6
M A I N C O N T R I B U T O R S T O C H A N G E continued
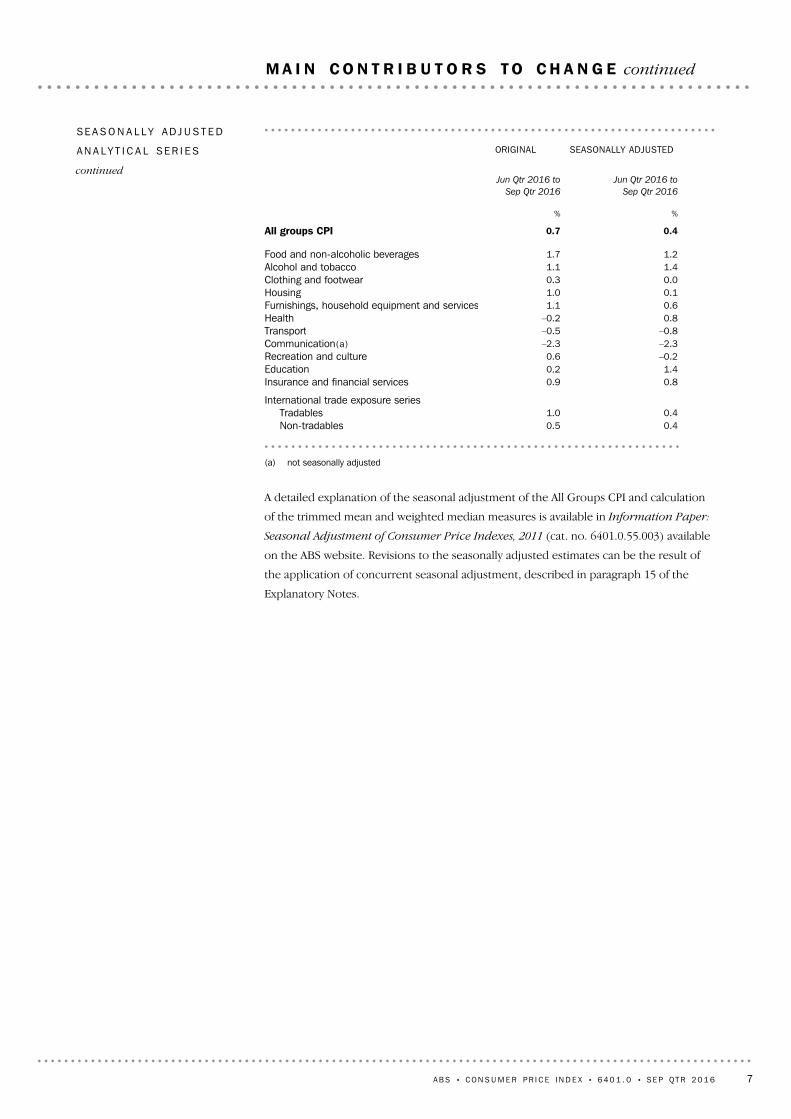
A detailed explanation of the seasonal adjustment of the All Groups CPI and calculation
of the trimmed mean and weighted median measures is available in Information Paper:
Seasonal Adjustment of Consumer Price Indexes, 2011 (cat. no. 6401.0.55.003) available
on the ABS website. Revisions to the seasonally adjusted estimates can be the result of
the application of concurrent seasonal adjustment, described in paragraph 15 of the
Explanatory Notes.
(a) not seasonally adjusted
0.40.5Non-tradables0.41.0Tradables
International trade exposure series
0.80.9Insurance and financial services1.40.2Education
–0.20.6Recreation and culture–2.3–2.3Communication(a)–0.8–0.5Transport0.8–0.2Health0.61.1Furnishings, household equipment and services0.11.0Housing0.00.3Clothing and footwear1.41.1Alcohol and tobacco1.21.7Food and non-alcoholic beverages
0.40.7All groups CPI
%%
Jun Qtr 2016 to
Sep Qtr 2016
Jun Qtr 2016 to
Sep Qtr 2016
SEASONALLY ADJUSTEDORIGINAL
SE A S O N A L L Y AD J U S T E D
AN A L Y T I C A L SE R I E S
continued
A B S • CO N S U M E R P R I C E I N D E X • 6 4 0 1 . 0 • SE P QT R 2 0 1 6 7
M A I N C O N T R I B U T O R S T O C H A N G E continued

At the All groups level, the CPI rose in all eight capital cities this quarter.
The food and non-alcoholic beverages group (+1.7%) is the most significant positive
contributor to the All groups quarterly movement, with rises across all eight capital cities.
The rise in fruit and vegetable prices is due to adverse weather conditions, including
floods, in major growing areas, impacting supply. However, Perth recorded a smaller rise
than other cities due to WA fruit growing regions being much less impacted by adverse
weather than growing regions in eastern Australia.
The housing group (+1.0%) is the second most significant positive contributor to the All
groups quarterly movement, with rises in six of eight capital cities. This is driven by rises
in electricity (+5.4%), due to electricity supply constraints and wholesale cost increases
across the eastern and southern states. Property rates and charges (+4.0%) also
contributed to the rise this quarter, as rates are adjusted annually in September quarters.
The alcohol and tobacco group (+1.1%) is the third most significant positive contributor
to the All groups quarterly movement, with rises in all eight capital cities. The rise is
driven by increases in tobacco (+2.3%), mainly due to the effects of the federal excise tax
increase effective from 1 September 2016.
The most significant offsetting negative contributor to the All groups quarterly
movement is the communication group (-2.3%). The fall is driven by telecommunication
equipment and services (-2.5%) and is due to strong continued competition amongst
service providers.
Over the last twelve months to September quarter 2016, the All groups CPI has risen in
seven out of eight capital cities with Sydney (+1.7%) recording the largest positive
movement. Darwin (0.0%) recorded no movement.
Sydney
Melbourne
Brisbane
Adelaide
Perth
Hobart
Darwin
Canberra
Weighted average of eight capital cities
0 0.2 0.4 0.6 0.8 1.0%
ALL GROUPS CPI , Percen tage change from prev ious quar te rAL L GR O U P S CP I
CA P I T A L C I T I E S CO M P A R I S O N
8 A B S • CO N S U M E R P R I C E I N D E X • 6 4 0 1 . 0 • SE P QT R 2 0 1 6
C A P I T A L C I T I E S C O M P A R I S O N
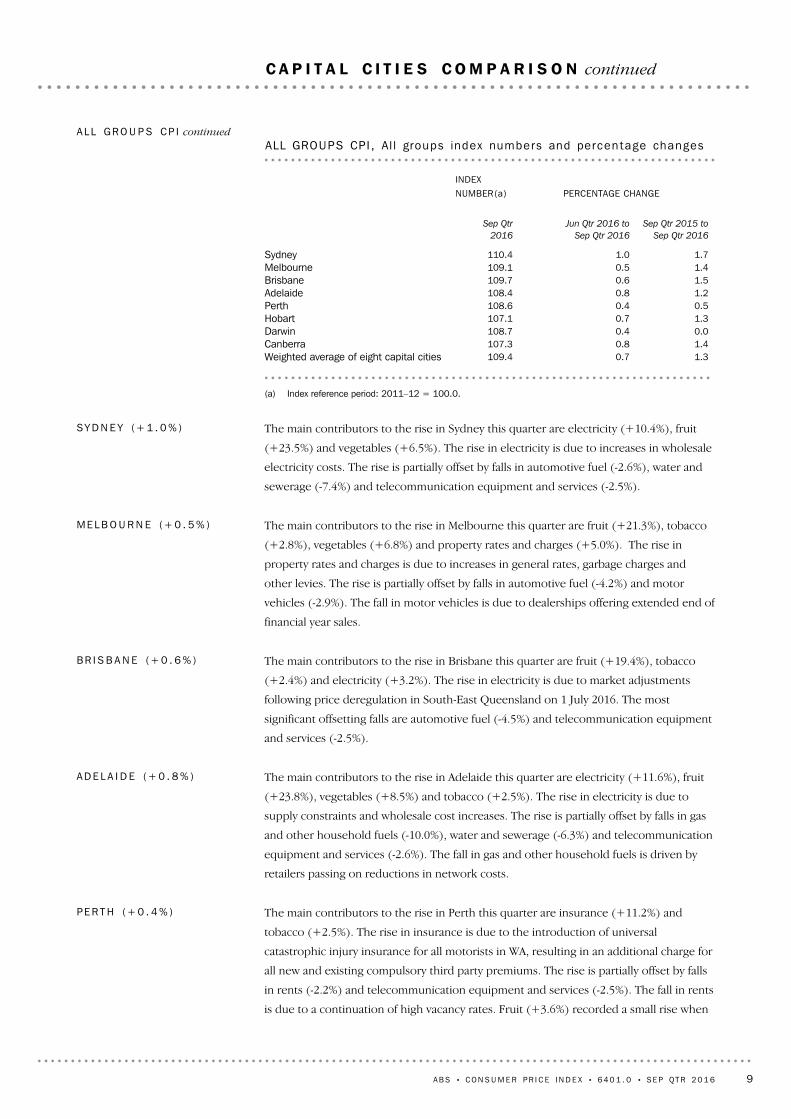
The main contributors to the rise in Perth this quarter are insurance (+11.2%) and
tobacco (+2.5%). The rise in insurance is due to the introduction of universal
catastrophic injury insurance for all motorists in WA, resulting in an additional charge for
all new and existing compulsory third party premiums. The rise is partially offset by falls
in rents (-2.2%) and telecommunication equipment and services (-2.5%). The fall in rents
is due to a continuation of high vacancy rates. Fruit (+3.6%) recorded a small rise when
PE R T H (+ 0 . 4 % )
The main contributors to the rise in Adelaide this quarter are electricity (+11.6%), fruit
(+23.8%), vegetables (+8.5%) and tobacco (+2.5%). The rise in electricity is due to
supply constraints and wholesale cost increases. The rise is partially offset by falls in gas
and other household fuels (-10.0%), water and sewerage (-6.3%) and telecommunication
equipment and services (-2.6%). The fall in gas and other household fuels is driven by
retailers passing on reductions in network costs.
AD E L A I D E (+ 0 . 8 % )
The main contributors to the rise in Brisbane this quarter are fruit (+19.4%), tobacco
(+2.4%) and electricity (+3.2%). The rise in electricity is due to market adjustments
following price deregulation in South-East Queensland on 1 July 2016. The most
significant offsetting falls are automotive fuel (-4.5%) and telecommunication equipment
and services (-2.5%).
BR I S B A N E (+ 0 . 6 % )
The main contributors to the rise in Melbourne this quarter are fruit (+21.3%), tobacco
(+2.8%), vegetables (+6.8%) and property rates and charges (+5.0%). The rise in
property rates and charges is due to increases in general rates, garbage charges and
other levies. The rise is partially offset by falls in automotive fuel (-4.2%) and motor
vehicles (-2.9%). The fall in motor vehicles is due to dealerships offering extended end of
financial year sales.
ME L B O U R N E (+ 0 . 5 % )
The main contributors to the rise in Sydney this quarter are electricity (+10.4%), fruit
(+23.5%) and vegetables (+6.5%). The rise in electricity is due to increases in wholesale
electricity costs. The rise is partially offset by falls in automotive fuel (-2.6%), water and
sewerage (-7.4%) and telecommunication equipment and services (-2.5%).
SY D N E Y (+ 1 . 0 % )
(a) Index reference period: 2011–12 = 100.0.
1.30.7109.4Weighted average of eight capital cities1.40.8107.3Canberra0.00.4108.7Darwin1.30.7107.1Hobart0.50.4108.6Perth1.20.8108.4Adelaide1.50.6109.7Brisbane1.40.5109.1Melbourne1.71.0110.4Sydney
Sep Qtr 2015 to
Sep Qtr 2016
Jun Qtr 2016 to
Sep Qtr 2016
Sep Qtr
2016
PERCENTAGE CHANGEINDEXNUMBER(a)
ALL GROUPS CPI , Al l groups index numbers and percen tage changesAL L GR O U P S CP I continued
A B S • CO N S U M E R P R I C E I N D E X • 6 4 0 1 . 0 • SE P QT R 2 0 1 6 9
C A P I T A L C I T I E S C O M P A R I S O N continued

The main contributors to the rise in Canberra this quarter are fruit (+20.0%), property
rates and charges (+8.2%) and electricity (+6.3%). The rise in property rates and
charges is typical for this time of year. The rise is partially offset by falls in garments for
women (-6.3%) and gas and other household fuels (-4.5%). The fall in gas and other
household fuels is due to lower network and distribution charges in the ACT.
CA N B E R R A (+ 0 . 8 % )
The main contributors to the rise in Darwin this quarter are domestic holiday travel and
accommodation (+7.7%), fruit (+18.9%), vegetables (+6.8%) and tobacco (+2.5%). The
rise in domestic holiday travel and accommodation is due to the peak tourist season in
Darwin. The rise is partially offset by falls in rents (-2.4%) and other financial services
(-3.6%). The fall in other financial services is due to the introduction of a First Home
Owner Discount on stamp duty.
DA R W I N (+ 0 . 4 % )
The main contributors to the rise in Hobart this quarter are fruit (+26.6%), tobacco
(+3.8%) and electricity (+3.5%). The rise in electricity is due to increases in wholesale
electricity costs. The rise is partially offset by domestic holiday travel and
accommodation (-2.3%), due to increases in airline capacity following the addition of
services to Hobart from Sydney and Melbourne.
HO B A R T (+ 0 . 7 % )
compared to other cities, as WA fruit growing regions have been much less affected by
adverse weather than growing regions in eastern Australia.
PE R T H (+ 0 . 4 % ) continued
10 A B S • CO N S U M E R P R I C E I N D E X • 6 4 0 1 . 0 • SE P QT R 2 0 1 6
C A P I T A L C I T I E S C O M P A R I S O N continued
RE V I E W OF TH E CO N S U M E R PR I C E IN D E X IN T E R N A T I O N A L TR A D E EX P O S U R ESE R I E S
The CPI Tradables and Non-tradables series, collectively known as the International
Trade Exposure series, measure the contribution of domestic (non-tradables) and
imported (tradables) inflation to overall household inflation. Identifying the source of
household inflation supports the understanding and forecasting of inflation, as well as
supporting monetary and fiscal policy decisions.
The International Trade Exposure series classifies ECs as either tradables or
non-tradables by assessing the degree to which their prices are affected by domestic
developments and international competition. The Tradables and Non-tradables series are
available each quarter in table 8 of the CPI publication.
The current classification of CPI ECs as tradables or non-tradables is listed in appendix 1.
Of the 87 ECs in the CPI, 40 are classified as non-tradables, and 47 as tradables.
Non-tradables contributes approximately 64 per cent of the CPI, while tradables
contributes the remaining 36 per cent.
The International Trade Exposure series classification was last updated in 2011 as part of
the 16th Series CPI Review. Data from the 2006-07 Input-Output tables were used to
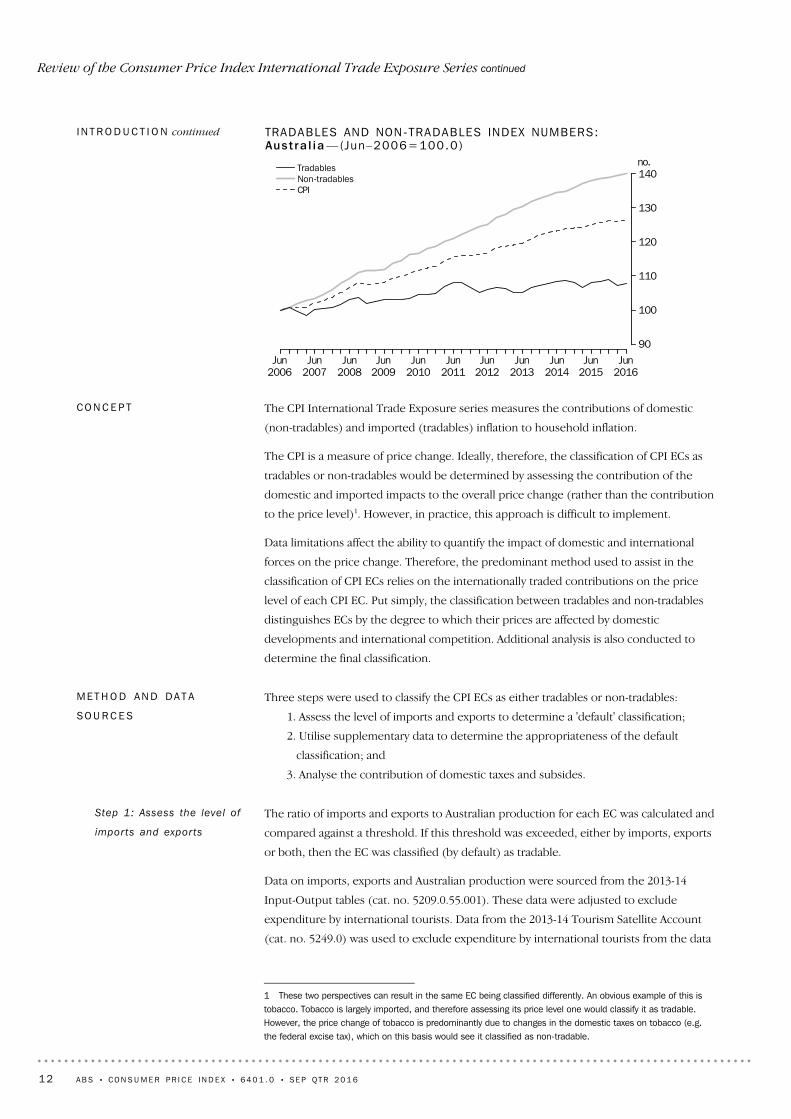
classify each of the CPI ECs. Price indexes for these series can be found in Figure 1.
Figure 1 shows over the past ten years tradables inflation increased by around 10 per
cent, while non-tradables inflation increased by 40 per cent. The lower production costs
of imports and the strength of the Australian dollar has reduced the prices of imports
and resulted in a smaller increase in the Tradables series, while growth in domestic
wages and changes in administered taxes has contributed to the larger increase in the
Non-tradables series.
I N T R O D U C T I O N
The Australian Bureau of Statistics (ABS) has reviewed the classification of the Consumer
Price Index (CPI) expenditure classes (ECs) as either tradables or non-tradables. This
review maintains the relevance of the International Trade Exposure series.
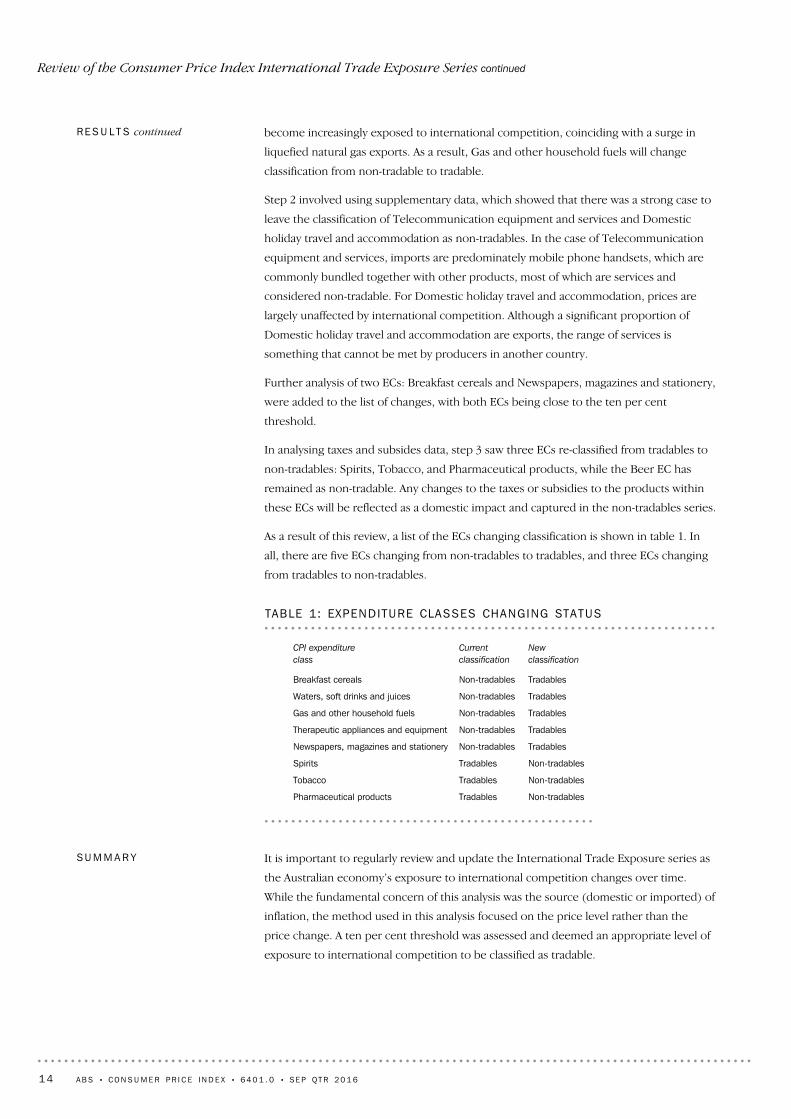
As a result of this review, five ECs that were classified as non-tradables will be re-classified
as tradables: Breakfast cereals, Waters, soft drinks and juices, Gas and other household
fuels, Therapeutic appliances and equipment and Newspapers, magazines and stationery;
and three ECs that were classified as tradables will be re-classified as non-tradables:
Spirits, Tobacco and Pharmaceutical products.
These changes to the classification of ECs will be implemented in the December quarter
2016 issue of the CPI which is scheduled for release on 25 January 2017.
In addition, the ABS will, over the coming months and in consultation with users, further
consider the terminology for these series with a view to use terms that reflect their
primary purpose: measuring the source of consumer inflation. Please provide feedback
on series names to [email protected] by 30th November 2016. The ABS Privacy
Policy outlines how the ABS will handle your personal information.
Proposed changes to terminology will be communicated to users in advance of
implementation. If changes to terminology are to occur, these will be updated as part of
the CPI re-weight scheduled for the December quarter 2017.
SU M M A R Y OF OU T C O M E S
A B S • CO N S U M E R P R I C E I N D E X • 6 4 0 1 . 0 • SE P QT R 2 0 1 6 11
F E A T U R E A R T I C L E
The ratio of imports and exports to Australian production for each EC was calculated and
compared against a threshold. If this threshold was exceeded, either by imports, exports
or both, then the EC was classified (by default) as tradable.
Data on imports, exports and Australian production were sourced from the 2013-14
Input-Output tables (cat. no. 5209.0.55.001). These data were adjusted to exclude
expenditure by international tourists. Data from the 2013-14 Tourism Satellite Account
(cat. no. 5249.0) was used to exclude expenditure by international tourists from the data
Step 1: Assess the level of
imports and exports
Three steps were used to classify the CPI ECs as either tradables or non-tradables:
1. Assess the level of imports and exports to determine a 'default' classification;
2. Utilise supplementary data to determine the appropriateness of the default
classification; and
3. Analyse the contribution of domestic taxes and subsides.
ME T H O D AN D DA T A
SO U R C E S
The CPI International Trade Exposure series measures the contributions of domestic
(non-tradables) and imported (tradables) inflation to household inflation.
The CPI is a measure of price change. Ideally, therefore, the classification of CPI ECs as
tradables or non-tradables would be determined by assessing the contribution of the
domestic and imported impacts to the overall price change (rather than the contribution
to the price level)1. However, in practice, this approach is difficult to implement.
Data limitations affect the ability to quantify the impact of domestic and international
forces on the price change. Therefore, the predominant method used to assist in the
classification of CPI ECs relies on the internationally traded contributions on the price
level of each CPI EC. Put simply, the classification between tradables and non-tradables
distinguishes ECs by the degree to which their prices are affected by domestic
developments and international competition. Additional analysis is also conducted to
determine the final classification.
CO N C E P T
Jun2006
Jun2007
Jun2008
Jun2009
Jun2010
Jun2011
Jun2012
Jun2013
Jun2014
Jun2015
Jun2016
no.
90
100
110
120
130
140TradablesNon-tradablesCPI
TRADABLES AND NON-TRADABLES INDEX NUMBERS:Aust ra l i a —(Jun–2006=100.0)
IN T R O D U C T I O N continued
12 A B S • CO N S U M E R P R I C E I N D E X • 6 4 0 1 . 0 • SE P QT R 2 0 1 6
Review of the Consumer Price Index International Trade Exposure Series continued
1 These two perspectives can result in the same EC being classified differently. An obvious example of this istobacco. Tobacco is largely imported, and therefore assessing its price level one would classify it as tradable.However, the price change of tobacco is predominantly due to changes in the domestic taxes on tobacco (e.g.the federal excise tax), which on this basis would see it classified as non-tradable.
For step 1, a number of thresholds were tested to identify the optimal level where the
classification of ECs as tradables was deemed appropriate. At a threshold value of ten per
cent, 53 ECs were considered tradables, which is comparable to the 47 that are currently
classified as tradables. The ECs that were considered non-tradables at this threshold were
found to largely consist of services, with only a handful of goods.
Based on this analysis, a ten per cent threshold was determined as the optimal level of
international exposure for classifying the ECs as tradables or non-tradables.
Using the ten per cent threshold, the default classification showed six ECs changing
classification from non-tradables to tradables:
Waters, soft drinks and juices;
Beer;
Gas and other household fuels;
Therapeutic appliances and equipment;
Telecommunication equipment and services;
Domestic holiday travel and accommodation.
In the case of Waters, soft drinks and juices, Gas and other household fuels and
Therapeutic appliances and equipment, there was ample evidence that the prices of
products within these ECs being influenced by international competition. As part of the
2011 review it was decided to classify Gas and other household fuels as non-tradable due
to the prices being highly regulated. However, more recently, the price of gas has
RE S U L T S
Changes to taxes and subsidies are a domestic contribution to inflation. Therefore, the
contribution of taxes and subsidies on the price paid by consumers was estimated to
determine the classification of ECs as either tradables or non-tradables. Data from the
2013-14 Input-Output tables were used to determine the contribution of taxes and
subsidies to final demand2. Where taxes and subsides make a large contribution to the
prices paid by consumers on products within an EC, these ECs were classified as
non-tradables.
Step 3: Analyse the
contr ibut ion of domestic
taxes and subsides
The use of a threshold in step 1 provided a 'rule of thumb' in an attempt to simply and
transparently classify each of the CPI ECs. However, it was also important to assess the
appropriateness of each EC’s classification from a consumer price change perspective.
An assessment of the appropriateness of the classification of each EC using the threshold
approach was conducted, particularly for those ECs which were close to the threshold.
The threshold approach was supplemented by information on correlations with
exchange rates, supporting trade data, significant world events and the regulatory
environment within which prices are set.
Step 2: Uti l ise
supplementary data
in the Input-Output (I-O) tables. These data were then mapped from the I-O product
classification to the CPI Commodity Classification.
Step 1: Assess the level of
imports and exports
continued
A B S • CO N S U M E R P R I C E I N D E X • 6 4 0 1 . 0 • SE P QT R 2 0 1 6 13
Review of the Consumer Price Index International Trade Exposure Series continued
2 For the contribution of taxes, the purchasers' price was used. This is the amount paid by the purchaser,excluding any deductible tax, in order to take delivery of a unit of a good or service at the time and place requiredby the purchaser. The purchaser’s price of a good includes any transport charges paid separately by thepurchaser to take delivery at the required time and place. Australian System of National Accounts, 2014-15 (cat.no. 5204.0)
It is important to regularly review and update the International Trade Exposure series as
the Australian economy’s exposure to international competition changes over time.
While the fundamental concern of this analysis was the source (domestic or imported) of
inflation, the method used in this analysis focused on the price level rather than the
price change. A ten per cent threshold was assessed and deemed an appropriate level of
exposure to international competition to be classified as tradable.
SU M M A R Y
Non-tradablesTradablesPharmaceutical products
Non-tradablesTradablesTobacco
Non-tradablesTradablesSpirits
TradablesNon-tradablesNewspapers, magazines and stationery
TradablesNon-tradablesTherapeutic appliances and equipment
TradablesNon-tradablesGas and other household fuels
TradablesNon-tradablesWaters, soft drinks and juices
TradablesNon-tradablesBreakfast cereals
New
classification
Current
classification
CPI expenditure
class
TABLE 1: EXPENDITURE CLASSES CHANGING STATUS
become increasingly exposed to international competition, coinciding with a surge in
liquefied natural gas exports. As a result, Gas and other household fuels will change
classification from non-tradable to tradable.
Step 2 involved using supplementary data, which showed that there was a strong case to
leave the classification of Telecommunication equipment and services and Domestic
holiday travel and accommodation as non-tradables. In the case of Telecommunication
equipment and services, imports are predominately mobile phone handsets, which are
commonly bundled together with other products, most of which are services and
considered non-tradable. For Domestic holiday travel and accommodation, prices are
largely unaffected by international competition. Although a significant proportion of
Domestic holiday travel and accommodation are exports, the range of services is
something that cannot be met by producers in another country.
Further analysis of two ECs: Breakfast cereals and Newspapers, magazines and stationery,
were added to the list of changes, with both ECs being close to the ten per cent
threshold.
In analysing taxes and subsides data, step 3 saw three ECs re-classified from tradables to
non-tradables: Spirits, Tobacco, and Pharmaceutical products, while the Beer EC has
remained as non-tradable. Any changes to the taxes or subsidies to the products within
these ECs will be reflected as a domestic impact and captured in the non-tradables series.
As a result of this review, a list of the ECs changing classification is shown in table 1. In
all, there are five ECs changing from non-tradables to tradables, and three ECs changing
from tradables to non-tradables.
RE S U L T S continued
14 A B S • CO N S U M E R P R I C E I N D E X • 6 4 0 1 . 0 • SE P QT R 2 0 1 6
Review of the Consumer Price Index International Trade Exposure Series continued

Insurance; Deposit and loan facilities (direct charges); Other financialservices.
Insurance and financial services
Preschool and primary education; Secondary education; Tertiaryeducation.
Education
Newspapers, magazines and stationery; Domestic holiday travel andaccommodation; Veterinary and other services for pets; Sportsparticipation; Other recreational, sporting and cultural services; Petsand related products.
Audio, visual and computing equipment; Audio, visual and computingmedia and services; Books; International holiday travel andaccommodation; Equipment for sports, camping and open-air recreation;Games, toys and hobbies.
Recreation and culture
Postal services; Telecommunication equipment and services.
Communication
Maintenance and repair of motor vehicles; Other services in respect ofmotor vehicles; Urban transport fares.
Motor vehicles; Spare parts and accessories for motor vehicles;Automotive fuel.
Transport
Therapeutic appliances and equipment; Medical and hospital services;Dental services.
Pharmaceutical products.
Health
Child care; Hairdressing and personal grooming services; Otherhousehold services.
Furniture; Carpets and other floor coverings; Household textiles; Majorhousehold appliances; Small electric household appliances; Glassware,tableware and household utensils; Tools and equipment for house andgarden; Cleaning and maintenance products; Personal care products;Other non-durable household products.
Furnishings, household equipment and services
Rents; New dwelling purchase by owner-occupiers; Maintenance andrepair of the dwelling; Property rates and charges; Water andsewerage; Electricity; Gas and other household fuels.
Housing
Cleaning, repair and hire of clothing and footwear.Garments for men; Garments for women; Garments for infants andchildren; Footwear for men; Footwear for women; Footwear for infants andchildren; Accessories.
Clothing and footwear
Beer.Spirits; Wine; Tobacco.
Alcohol and tobacco
Bread; Breakfast cereals; Poultry; Milk; Eggs; Waters, soft drinks andjuices; Restaurant meals; Take away and fast foods.
Cakes and biscuits; Other cereal products; Beef and veal; Pork; Lamb andgoat; Other meats; Fish and other seafood; Cheese; Ice cream and otherdairy products; Fruit; Vegetables; Jams, honey and spreads; Foodadditives and condiments; Oils and fats; Snacks and confectionery; Otherfood products n.e.c.; Coffee, tea and cocoa.
Food and non-alcoholic beverages
NON-TRADABLES COMPONENTTRADABLES COMPONENT
APPENDIX 1: CURRENT CLASSIF ICAT ION OF TRADABLES AND NON- TRADABLES
The ten per cent threshold was used as a rule of thumb to classify the CPI ECs as either
tradables or non-tradables. Further analysis using supplementary data, and an assessment
of the contribution of domestic taxes and subsides was conducted to ensure the
appropriateness of each EC's classification. The end result was five ECs changing
classification from non-tradables to tradables, and three ECs changing classification from
tradables to non-tradables.
SU M M A R Y continued
A B S • CO N S U M E R P R I C E I N D E X • 6 4 0 1 . 0 • SE P QT R 2 0 1 6 15
Review of the Consumer Price Index International Trade Exposure Series continued


CPI expenditure class, combined seasonal adjustment factors,
weighted average of eight capital cities
14
CPI group, expenditure class and selected analytical series index
numbers, seasonally adjusted, weighted average of eight capital cities
13
CPI group, sub–group and expenditure class, points contribution by
capital city
12
CPI group, sub–group and expenditure class, percentage change from
previous quarter by capital city
11
CPI group, sub–group and expenditure class, percentage change from
corresponding quarter of previous year by capital city
10
CPI group, sub–group and expenditure class, index numbers by
capital city
9
AD D I T I O N A L CP I TA B L E S AV A I L A B L E ON AB S WE B S I T E
33Analytical series, weighted average of eight capital cities8 . . . . . . . . . . . . .30
CPI group, sub–group and expenditure class, weighted average of eight
capital cities
7. . . . . . . . . . . . . . . . . . . . . . . . . . . . . . . . . . . . . . . .
27Contribution to change in All groups CPI6 . . . . . . . . . . . . . . . . . . . . . .24CPI groups, index numbers5 . . . . . . . . . . . . . . . . . . . . . . . . . . . . . . .22
CPI groups, weighted average of eight capital cities, percentage
changes
4. . . . . . . . . . . . . . . . . . . . . . . . . . . . . . . . . . . . . . . . . . .
20CPI groups, weighted average of eight capital cities, index numbers3 . . . . . .19All groups CPI, percentage changes2 . . . . . . . . . . . . . . . . . . . . . . . . . .18All groups CPI, index numbers1 . . . . . . . . . . . . . . . . . . . . . . . . . . . . .
CO N S U M E R PR I C E IN D E X
page
A B S • CO N S U M E R P R I C E I N D E X • 6 4 0 1 . 0 • SE P QT R 2 0 1 6 17
L I S T O F T A B L E S

(a) Unless otherwise specified, reference period of each index: 2011–12 = 100.0.
109.4107.3108.7107.1108.6108.4109.7109.1110.4September108.6106.4108.3106.4108.2107.5109.0108.6109.3June108.2106.2108.0106.4107.9107.0108.5108.2108.7March
2016108.4106.0109.0106.6108.6107.3108.5108.3108.9December108.0105.8108.7105.7108.1107.1108.1107.6108.6September107.5105.6108.3105.1107.7106.8107.4107.1108.3June106.8105.2108.3105.0107.1106.3106.7106.4107.3March
2015106.6105.3108.5104.7107.0106.2106.7106.3106.8December106.4105.2108.3104.6106.9105.9106.5106.1106.6September105.9104.8108.1104.5106.4105.5105.8105.9106.0June105.4104.6107.4104.1105.6105.1105.2105.3105.6March
2014104.8104.1106.5103.6104.9104.4104.6104.8105.0December104.0103.1105.5102.6104.2103.7103.8104.0104.3September102.8102.5104.6101.7103.0102.3102.5102.6103.1June102.4101.9103.7101.3102.4102.1102.0102.4102.7March
2013102.0101.8102.0101.0101.9102.1101.9102.0102.3December101.8101.4102.0100.6101.6101.7101.6101.6102.2September
2012
108.3106.1108.5106.3108.2107.2108.5108.2108.92015–16106.8105.3108.4104.9107.2106.3106.8106.5107.32014–15105.0104.2106.9103.7105.3104.7104.9105.0105.22013–14102.3101.9103.1101.2102.2102.1102.0102.2102.62012–13
Weighted
average
of eight
capital
citiesCanberraDarwinHobartPerthAdelaideBrisbaneMelbourneSydneyPe r i od
ALL GROUPS CPI , Index numbers (a )1
18 A B S • CO N S U M E R P R I C E I N D E X • 6 4 0 1 . 0 • SE P QT R 2 0 1 6

0.70.80.40.70.40.80.60.51.0September0.40.20.30.00.30.50.50.40.6June
–0.20.2–0.9–0.2–0.6–0.30.0–0.1–0.2March2016
0.40.20.30.90.50.20.40.70.3December0.50.20.40.60.40.30.70.50.3September0.70.40.00.10.60.50.70.70.9June0.2–0.1–0.20.30.10.10.00.10.5March
20150.20.10.20.10.10.30.20.20.2December0.50.40.20.10.50.40.70.20.6September0.50.20.70.40.80.40.60.60.4June0.60.50.80.50.70.70.60.50.6March
20140.81.00.91.00.70.70.80.80.7December1.20.60.90.91.21.41.31.41.2September0.40.60.90.40.60.20.50.20.4June0.40.11.70.30.50.00.10.40.4March
20130.20.40.00.40.30.40.30.40.1December1.41.11.30.71.11.51.11.21.7September
2012
PE R C E N T A G E CH A N G E ( f r o m p r e v i o u s qu a r t e r )
1.31.40.01.30.51.21.51.41.7September1.00.80.01.20.50.71.51.40.9June1.31.0–0.31.30.70.71.71.71.3March
20161.70.70.51.81.51.01.71.92.0December1.50.60.41.11.11.11.51.41.9September1.50.80.20.61.21.21.51.12.2June1.30.60.80.91.41.11.41.01.6March
20151.71.21.91.12.01.72.01.41.7December2.32.02.71.92.62.12.62.02.2September3.02.23.32.83.33.13.23.22.8June2.92.63.62.83.12.93.12.82.8March
20142.72.34.42.62.92.32.62.72.6December2.21.73.42.02.62.02.22.42.1September2.42.23.91.82.52.12.02.22.6June2.52.23.81.02.42.22.12.52.8March
20132.21.72.51.02.12.12.22.12.5December2.01.62.10.72.01.71.71.82.3September
2012
PE R C E N T A G E CH A N G E ( f r o m co r r e s p o n d i n g qu a r t e r o f p r e v i o u s y e a r )
1.40.80.11.30.90.81.61.61.52015–161.71.11.41.21.81.51.81.42.02014–152.62.33.72.53.02.52.82.72.52013–142.31.93.11.22.22.12.02.22.62012–13
PE R C E N T A G E CH A N G E ( f r o m p r e v i o u s f i n a n c i a l y e a r )
Weighted
average
of eight
capital
citiesCanberraDarwinHobartPerthAdelaideBrisbaneMelbourneSydneyPe r i od
ALL GROUPS CPI , Percentage changes2
A B S • CO N S U M E R P R I C E I N D E X • 6 4 0 1 . 0 • SE P QT R 2 0 1 6 19

(a) Unless otherwise specified, reference period of each index: 2011–12 = 100.0.
125.2105.9115.698.3127.1105.6September125.5104.7114.498.0125.7103.8June122.3104.1114.096.1124.5104.1March
2016120.0104.5113.798.7123.4104.3December120.5103.9113.697.1120.2104.0September120.1103.1112.998.2118.7103.9June116.9102.1112.196.9117.3104.1March
2015114.0102.6111.298.2116.4103.9December115.0102.1110.698.1114.5103.8September115.2101.7110.199.1113.3102.6June112.0100.6109.297.6111.5102.2March
2014109.2102.1108.699.7108.4101.9December109.8101.7108.1100.8106.7100.3September109.8100.7106.099.7105.8100.1June107.799.7105.497.1104.4100.0March
2013104.6101.0104.1101.0102.8100.8December105.5101.6103.9100.2102.6100.9September
2012
122.1104.3113.997.5123.5104.12015–16116.5102.5111.797.9116.7103.92014–15111.6101.5109.099.3110.0101.82013–14106.9100.8104.999.5103.9100.52012–13
Health
Furnishings,
household equipment
and servicesHousing
Clothing and
footwear
Alcohol and
tobacco
Food and
non–alcoholic
beveragesPe r i od
CPI GROUPS, Weighted average of eigh t cap i ta l ci t ies —Index numbers (a )3
20 A B S • CO N S U M E R P R I C E I N D E X • 6 4 0 1 . 0 • SE P QT R 2 0 1 6

(a) Unless otherwise specified, reference period of each index: 2011–12 = 100.0.
109.4110.5124.8103.789.397.7September108.6109.5124.6103.191.498.2June108.2109.0124.6103.892.897.2March
2016108.4108.3120.8104.894.299.7December108.0107.4120.8103.196.5101.1September107.5106.9120.6102.398.5101.0June106.8106.6120.6103.799.197.7March
2015106.6106.4114.5103.0100.5101.1December106.4105.3114.5102.0100.6103.4September105.9104.7114.4101.4102.0103.5June105.4104.7114.4101.7103.8104.2March
2014104.8104.3108.8102.2103.6103.1December104.0104.1108.8100.1102.4103.2September102.8103.7108.898.2102.3100.8June102.4103.4108.999.0101.9101.7March
2013102.0102.7103.099.8101.9101.2December101.8101.2103.099.2100.6100.5September
2012
108.3108.6122.7103.793.799.12015–16106.8106.3117.6102.899.7100.82014–15105.0104.5111.6101.4103.0103.52013–14102.3102.8105.999.1101.7101.12012–13
All groups CPI
Insurance and
financial servicesEducation
Recreation
and cultureCommunicationTransportPe r i o d
CPI GROUPS, Weighted average of eigh t cap i ta l ci t ies —Index numbers (a ) co n t i n u e d3
A B S • CO N S U M E R P R I C E I N D E X • 6 4 0 1 . 0 • SE P QT R 2 0 1 6 21

–0.21.11.00.31.11.7September2.60.60.42.01.0–0.3June1.9–0.40.3–2.60.9–0.2March
2016–0.40.60.11.62.70.3December0.30.80.6–1.11.30.1September2.71.00.71.31.2–0.2June2.5–0.50.8–1.30.80.2March
2015–0.90.50.50.11.70.1December–0.20.40.5–1.01.11.2September2.91.10.81.51.60.4June2.6–1.50.6–2.12.90.3March
2014–0.50.40.5–1.11.61.6December0.01.02.01.10.90.2September1.91.00.62.71.30.1June3.0–1.31.2–3.91.6–0.8March
2013–0.9–0.60.20.80.2–0.1December2.41.03.20.20.91.9September
2012
PE R C E N T A G E CH A N G E ( f r o m p r e v i o u s qu a r t e r )
3.91.91.81.25.71.5September4.51.61.3–0.25.9–0.1June4.62.01.7–0.86.10.0March
20165.31.92.20.56.00.4December4.81.82.7–1.05.00.2September4.31.42.5–0.94.81.3June4.41.52.7–0.75.21.9March
20154.40.52.4–1.57.42.0December4.70.42.3–2.77.33.5September4.91.03.9–0.67.12.5June4.00.93.60.56.82.2March
20144.41.14.3–1.35.41.1December4.10.14.00.64.0–0.6September6.60.15.3–0.34.01.1June6.10.65.1–1.53.71.6March
20137.70.84.40.63.50.3December7.21.54.7–0.84.3–1.1September
2012
PE R C E N T A G E CH A N G E ( f r o m co r r e s p o n d i n g qu a r t e r o f p r e v i o u s y e a r )
4.81.82.0–0.45.80.22015–164.41.02.5–1.46.12.12014–154.40.73.9–0.25.91.32013–146.90.84.9–0.53.90.52012–13
PE R C E N T A G E CH A N G E ( f r o m p r e v i o u s f i n a n c i a l y e a r )
Health
Furnishings,
household equipment
and servicesHousing
Clothing and
footwear
Alcohol and
tobacco
Food and
non-alcoholic
beverages
CPI GROUPS, Weighted average of eigh t cap i ta l ci t ies —Percentage changes4
22 A B S • CO N S U M E R P R I C E I N D E X • 6 4 0 1 . 0 • SE P QT R 2 0 1 6

0.70.90.20.6–2.3–0.5September0.40.50.0–0.7–1.51.0June
–0.20.63.1–1.0–1.5–2.5March2016
0.40.80.01.6–2.4–1.4December0.50.50.20.8–2.00.1September0.70.30.0–1.4–0.63.4June0.20.25.30.7–1.4–3.4March
20150.21.00.01.0–0.1–2.2December0.50.60.10.6–1.4–0.1September0.50.00.0–0.3–1.7–0.7June0.60.45.1–0.50.21.1March
20140.80.20.02.11.2–0.1December1.20.40.01.90.12.4September0.40.3–0.1–0.80.4–0.9June0.40.75.7–0.80.00.5March
20130.21.50.00.61.30.7December1.40.20.10.90.5–0.8September
2012
PE R C E N T A G E CH A N G E ( f r o m p r e v i o u s qu a r t e r )
1.32.93.30.6–7.5–3.4September1.02.43.30.8–7.2–2.8June1.32.33.30.1–6.4–0.5March
20161.71.85.51.7–6.3–1.4December1.52.05.51.1–4.1–2.2September1.52.15.40.9–3.4–2.4June1.31.85.42.0–4.5–6.2March
20151.72.05.20.8–3.0–1.9December2.31.25.21.9–1.80.2September3.01.05.13.3–0.32.7June2.91.35.12.71.92.5March
20142.71.65.62.41.71.9December2.22.95.60.91.82.7September2.42.75.7–0.12.2–0.5June2.52.95.8–0.51.51.4March
20132.23.16.1–1.71.62.0December2.02.36.1–1.51.41.3September
2012
PE R C E N T A G E CH A N G E ( f r o m co r r e s p o n d i n g qu a r t e r o f p r e v i o u s y e a r )
1.42.24.30.9–6.0–1.72015–161.71.75.41.4–3.2–2.62014–152.61.75.42.31.32.42013–142.32.85.9–0.91.71.12012–13
PE R C E N T A G E CH A N G E ( f r o m p r e v i o u s f i n a n c i a l y e a r )
All groups CPI
Insurance and
financial
servicesEducation
Recreation
and cultureCommunicationTransport
CPI GROUPS, Weighted average of eigh t cap i ta l ci t ies —Percentage changes co n t i n u e d4
A B S • CO N S U M E R P R I C E I N D E X • 6 4 0 1 . 0 • SE P QT R 2 0 1 6 23
(a) Unless otherwise specified, reference period of each index: 2011–12 = 100.0.
115.6108.2110.1107.4111.5112.3116.2115.6118.4September114.4107.0110.8106.0111.5111.2115.1114.5116.7June114.0106.9111.5105.7111.7111.7114.6113.9115.9March
2016113.7106.2112.9104.9113.4110.7114.4113.3115.4December113.6106.1113.3104.5113.7110.6114.3113.2115.1September112.9105.4113.4102.6112.8110.8113.3111.9114.9June112.1105.9113.3102.1112.5112.0112.7110.7113.6March
2015111.2106.4112.4101.7112.4110.0112.4109.7112.6December110.6106.1112.1101.3112.0109.7111.5109.3111.7September
2014
HO U S I N G
98.392.394.794.9104.296.8105.497.295.1September98.095.096.597.4104.996.4104.497.893.7June96.191.794.496.3102.895.0103.795.591.6March
201698.795.498.5102.0106.498.0104.097.894.6December97.195.696.8100.0104.896.4102.194.894.3September98.297.999.7101.4106.099.5101.795.595.8June96.993.998.1101.5105.796.4101.594.993.5March
201598.296.398.7101.8105.399.7101.997.394.4December98.195.896.9100.8104.995.3100.698.295.4September
2014
CL O T H I N G AN D FO O T W E A R
127.1125.3125.1129.6129.3129.1129.4126.5125.2September125.7124.4123.7126.8127.7127.4127.8124.7124.2June124.5122.8122.0125.7125.9126.0126.4124.4122.7March
2016123.4121.7121.3124.8125.1124.6125.9123.2121.4December120.2119.7117.2120.4121.3121.6121.5119.9119.0September118.7118.6115.6118.8119.8119.8119.6118.9117.4June117.3117.2115.0117.6117.7118.4118.6117.5116.0March
2015116.4116.5114.8117.2116.3118.2117.8116.4115.2December114.5113.7112.6115.9114.2115.8115.8114.4113.6September
2014
AL C O H O L AN D TO B A C C O
105.6105.5105.9104.2102.6104.8105.6105.7106.9September103.8103.4103.9102.8102.5102.9103.9103.9104.4June104.1103.7104.4102.9103.4103.1104.4103.8104.7March
2016104.3103.6104.6103.0103.2103.7104.3104.2104.9December104.0103.4103.6102.5102.6103.3103.7104.3104.5September103.9103.3103.5102.4103.3103.3103.5103.7104.7June104.1104.2104.3103.8103.1103.8104.3103.8104.8March
2015103.9104.0104.6103.9103.2103.4103.9103.9104.2December103.8104.2104.6104.0103.0103.8104.0103.7104.0September
2014
FO O D AN D NO N – A L C O H O L I C BE V E R A G E S
Weighted
average of
eight
capital
citiesCanberraDarwinHobartPerthAdelaideBrisbaneMelbourneSydneyQua r t e r s
CPI GROUPS, Index numbers (a )5
24 A B S • CO N S U M E R P R I C E I N D E X • 6 4 0 1 . 0 • SE P QT R 2 0 1 6

(a) Unless otherwise specified, reference period of each index: 2011–12 = 100.0.
89.389.689.489.688.889.289.489.489.3September91.491.591.391.591.091.491.691.591.4June92.892.792.692.792.492.892.992.992.8March
201694.294.294.194.293.994.394.494.394.2December96.596.596.396.496.296.696.796.696.5September98.598.598.498.698.198.598.798.698.5June99.199.299.099.298.899.199.399.299.1March
2015100.5100.5100.4100.5100.1100.5100.6100.5100.4December100.6100.6100.5100.6100.2100.6100.7100.6100.5September
2014
CO M M U N I C A T I O N
97.7100.1101.699.598.398.695.898.696.7September98.298.5101.098.697.998.796.9100.296.9June97.299.7101.499.997.698.096.098.495.6March
201699.7100.4103.3101.399.8100.897.9100.699.2December
101.1101.7103.8102.9101.8102.499.6101.3100.7September101.0101.8104.3101.7100.5102.099.8101.8100.4June
97.798.9103.698.798.298.296.599.096.5March2015
101.1102.1106.1102.6101.2101.8100.3102.999.3December103.4103.8108.3105.0104.2103.8102.6105.1101.5September
2014
TR A N S P O R T
125.2124.6121.6127.9122.7126.4125.3125.7125.3September125.5124.2122.1128.0122.9126.5125.9126.1125.8June122.3121.5118.3123.7120.4122.1122.6123.0122.7March
2016120.0118.4117.8121.7118.3120.9119.7120.3120.3December120.5119.5117.7121.9118.8121.3120.5120.7120.7September120.1118.5117.1121.5118.5121.1120.7120.3120.2June116.9116.5114.1117.5115.8117.7117.6117.1116.9March
2015114.0112.8111.8114.9112.8116.3113.8113.7114.2December115.0114.2113.0115.7113.8117.0115.2114.6115.3September
2014
HE A L T H
105.9110.7108.5102.5105.7105.0107.7104.6106.3September104.7108.7108.0101.7104.7103.3106.9103.7104.8June104.1108.2106.9101.3104.3101.8105.7103.0104.4March
2016104.5108.3107.3102.4105.0102.6105.7103.8104.5December103.9107.5106.9102.4103.8102.4104.7102.9104.5September103.1107.4106.3101.9102.8100.9104.3102.7103.3June102.1105.7105.5101.2102.199.7102.3101.4102.7March
2015102.6105.1105.5100.6102.7101.2103.0102.0103.0December102.1104.1104.3100.0102.499.3101.7100.9103.7September
2014
FU R N I S H I N G S , HO U S E H O L D EQ U I P M E N T AN D SE R V I C E S
Weighted
average of
eight
capital
citiesCanberraDarwinHobartPerthAdelaideBrisbaneMelbourneSydneyQua r t e r s
CPI GROUPS, Index numbers (a ) co n t i n u e d5
A B S • CO N S U M E R P R I C E I N D E X • 6 4 0 1 . 0 • SE P QT R 2 0 1 6 25

(a) Unless otherwise specified, reference period of each index: 2011–12 = 100.0.
110.599.8109.1112.5113.9109.1104.0110.1113.9September109.5100.4111.0113.0110.5107.0103.7109.5113.1June109.0100.1110.8112.5110.1106.6103.4109.3112.3March
2016108.399.5109.8111.1109.2106.2102.4108.7111.6December107.499.2109.4110.5107.5105.3103.1107.1110.9September106.9101.3108.5109.9107.9104.4101.0106.7110.6June106.6100.6108.3109.9107.7104.8101.0105.9110.2March
2015106.4100.3108.1109.8106.7104.3101.3106.3109.8December105.399.8107.2108.1106.3103.5101.4104.6108.2September
2014
I N S U R A N C E AN D F I N A N C I A L SE R V I C E S
124.8119.6122.9121.1125.7123.3124.0123.5127.7September124.6119.3122.9121.1125.3123.3124.0123.1127.5June124.6119.3122.9121.1125.3123.3123.9123.1127.5March
2016120.8115.6118.9118.0121.8120.0120.1118.7123.9December120.8115.6118.9118.0121.8120.0120.1118.7123.9September120.6115.5118.8118.0121.5119.8120.0118.6123.8June120.6115.4118.8118.0121.5119.8120.0118.6123.7March
2015114.5112.1113.8114.9116.5115.2116.1113.9113.7December114.5112.1113.8114.9116.5115.1116.1113.9113.6September
2014
ED U C A T I O N
103.7104.7105.9100.7104.0102.5103.9103.4104.1September103.1104.0103.8100.4104.0101.7102.9103.3103.2June103.8104.5102.0102.9103.4101.5103.1104.8104.0March
2016104.8105.3105.4103.4104.6103.0104.4105.5104.8December103.1103.3106.0100.0103.0101.9103.4103.1103.3September102.3102.7102.5100.1102.7100.8101.8102.3102.6June103.7104.2105.0103.7103.5101.8102.4104.6103.9March
2015103.0103.7107.9101.2103.4101.5102.4103.3103.2December102.0103.3107.7100.2102.2101.1101.7102.2101.8September
2014
RE C R E A T I O N AN D CU L T U R E
Weighted
average of
eight
capital
citiesCanberraDarwinHobartPerthAdelaideBrisbaneMelbourneSydneyQua r t e r s
CPI GROUPS, Index numbers (a ) co n t i n u e d5
26 A B S • CO N S U M E R P R I C E I N D E X • 6 4 0 1 . 0 • SE P QT R 2 0 1 6

0.000.000.000.000.000.000.000.000.00Cleaning, repair and hire of clothing and footwear0.040.020.00–0.010.050.050.050.030.05Accessories0.040.020.00–0.010.050.050.050.040.05Accessories and clothing services
–0.010.00–0.010.000.000.000.00–0.010.00Footwear for infants and children–0.01–0.010.00–0.01–0.010.00–0.010.000.00Footwear for women0.000.000.00–0.020.010.000.000.000.00Footwear for men
–0.01–0.010.00–0.030.00–0.010.00–0.020.01Footwear0.000.000.000.00–0.01–0.010.000.000.01Garments for infants and children
–0.02–0.08–0.05–0.05–0.04–0.01–0.01–0.040.00Garments for women0.00–0.05–0.01–0.02–0.030.000.000.010.00Garments for men
–0.03–0.12–0.06–0.07–0.07–0.02–0.01–0.040.00Garments0.01–0.10–0.06–0.11–0.030.020.03–0.020.05Clothing and footwear
0.080.050.100.200.110.120.100.110.05Tobacco0.080.050.100.200.110.120.100.110.05Tobacco0.020.030.020.020.020.010.030.010.01Beer
–0.010.000.000.000.00–0.01–0.020.010.00Wine0.00–0.010.000.010.000.000.010.000.00Spirits0.010.010.020.030.020.010.020.030.01Alcoholic beverages0.110.060.130.220.130.130.120.130.07Alcohol and tobacco
0.010.040.030.030.000.000.010.000.01Take away and fast foods0.010.050.010.02–0.010.000.010.020.04Restaurant meals0.030.090.040.04–0.01–0.010.030.020.05Meals out and take away foods
–0.01–0.01–0.01–0.010.000.000.000.00–0.02Waters, soft drinks and juices0.00–0.01–0.010.000.00–0.010.00–0.01–0.01Coffee, tea and cocoa
–0.01–0.02–0.02–0.020.000.000.00–0.01–0.03Non-alcoholic beverages0.000.000.010.000.000.010.000.010.01Other food products n.e.c.0.00–0.010.00–0.03–0.01–0.020.010.000.01Snacks and confectionery0.000.000.010.00–0.010.000.000.010.00Oils and fats0.000.010.010.000.000.000.010.010.01Food additives and condiments0.000.000.000.000.000.000.010.000.01Jams, honey and spreads0.000.000.000.000.000.010.000.000.00Eggs0.000.000.01–0.03–0.010.000.020.010.02Food products n.e.c.0.080.060.100.020.040.120.060.090.10Vegetables0.200.200.150.250.040.220.180.210.26Fruit0.280.260.250.280.080.340.240.310.36Fruit and vegetables0.00–0.01–0.01–0.010.00–0.010.00–0.010.00Ice cream and other dairy products0.000.00–0.010.000.000.00–0.01–0.01–0.01Cheese0.000.000.000.010.000.000.000.000.01Milk
–0.01–0.02–0.02–0.01–0.01–0.01–0.01–0.010.00Dairy and related products0.000.000.00–0.02–0.010.000.000.000.02Fish and other seafood0.00–0.01–0.01–0.01–0.01–0.01–0.010.000.00Other meats0.000.010.010.000.00–0.020.000.000.00Poultry0.000.000.020.000.000.010.010.020.01Lamb and goat0.000.000.000.00–0.010.000.00–0.01–0.01Pork0.000.010.010.000.010.000.010.010.01Beef and veal0.000.000.03–0.02–0.03–0.010.01–0.010.02Meat and seafoods0.000.000.000.000.00–0.010.000.000.00Other cereal products0.00–0.010.000.000.010.00–0.010.000.00Breakfast cereals0.01–0.010.000.000.00–0.01–0.01–0.010.01Cakes and biscuits0.000.000.000.000.00–0.010.00–0.01–0.01Bread0.00–0.020.00–0.010.00–0.01–0.010.000.01Bread and cereal products0.300.320.270.230.020.300.270.290.42Food and non-alcoholic beverages
Weighted
average of
eight
capital
citiesCanberraDarwinHobartPerthAdelaideBrisbaneMelbourneSydneyGroup , sub–g r oup and expend i t u r e c l a s s
CONTRIBUT ION TO CHANGE IN ALL GROUPS CPI— Sep Qtr 20166
A B S • CO N S U M E R P R I C E I N D E X • 6 4 0 1 . 0 • SE P QT R 2 0 1 6 27

0.010.000.000.000.010.010.000.000.00Urban transport fares0.010.000.000.000.010.010.000.000.00Urban transport fares0.030.070.000.030.020.030.030.040.01Other services in respect of motor vehicles0.000.000.040.000.00–0.010.03–0.010.02Maintenance and repair of motor vehicles
–0.080.04–0.010.02–0.02–0.05–0.13–0.14–0.08Automotive fuel0.010.01–0.020.020.010.01–0.010.010.01Spare parts and accessories for motor vehicles
–0.010.080.050.020.020.01–0.03–0.090.02Motor vehicles–0.070.200.080.100.04–0.01–0.12–0.19–0.02Private motoring–0.060.200.070.100.04–0.01–0.12–0.19–0.02Transport
0.000.010.000.000.000.000.000.000.00Dental services–0.010.02–0.010.00–0.010.00–0.02–0.01–0.01Medical and hospital services–0.010.030.000.01–0.010.01–0.02–0.01–0.01Medical, dental and hospital services0.000.000.000.000.000.000.000.000.00Therapeutic appliances and equipment
–0.01–0.01–0.02–0.01–0.01–0.01–0.01–0.01–0.01Pharmaceutical products–0.01–0.01–0.02–0.010.00–0.01–0.010.00–0.02Medical products, appliances and equipment–0.020.02–0.02–0.01–0.010.00–0.03–0.01–0.03Health
0.000.000.000.02–0.010.010.010.000.01Other household services0.000.00–0.010.000.010.010.000.000.00Hairdressing and personal grooming services0.040.100.010.000.050.030.050.010.04Child care0.040.100.010.030.050.040.050.020.06Domestic and household services0.000.010.00–0.010.000.00–0.020.000.02Other non-durable household products0.01–0.010.010.00–0.010.020.000.010.01Personal care products0.00–0.010.000.000.00–0.010.01–0.01–0.01Cleaning and maintenance products0.00–0.010.010.00–0.010.02–0.010.000.02Non-durable household products0.010.010.000.010.010.000.000.000.00Tools and equipment for house and garden0.010.020.010.020.020.030.010.010.01Glassware, tableware and household utensils0.000.010.000.020.000.010.000.00–0.01Small electric household appliances0.000.000.00–0.01–0.010.00–0.010.00–0.01Major household appliances0.010.050.010.030.020.020.000.010.00Household appliances, utensils and tools0.030.050.030.030.020.070.020.030.03Household textiles0.030.050.030.030.020.070.020.030.03Household textiles0.000.000.000.000.010.000.010.00–0.01Carpets and other floor coverings0.020.02–0.01–0.010.020.020.010.020.03Furniture0.020.010.00–0.010.030.020.020.020.03Furniture and furnishings0.110.210.050.070.100.160.070.080.13Furnishings, household equipment and services
0.00–0.07–0.010.000.01–0.140.010.030.01Gas and other household fuels0.140.120.000.130.060.350.090.000.27Electricity
–0.020.010.000.020.04–0.100.04–0.01–0.07Water and sewerage0.120.070.000.150.120.110.130.030.20Utilities0.060.140.030.060.060.060.070.090.05Property rates and charges0.010.000.010.010.000.020.000.020.01Maintenance and repair of the dwelling0.080.150.040.070.050.080.070.110.05Other housing0.040.01–0.010.03–0.040.010.050.070.05New dwelling purchase by owner-occupiers0.040.01–0.010.03–0.040.010.050.070.05New dwelling purchase by owner-occupiers0.020.01–0.210.04–0.140.020.010.030.09Rents0.020.01–0.210.04–0.140.020.010.030.09Rents0.260.22–0.190.280.000.210.250.240.40Housing
Weighted
average of
eight
capital
citiesCanberraDarwinHobartPerthAdelaideBrisbaneMelbourneSydneyGroup , sub–g r oup and expend i t u r e c l a s s
CONTRIBUT ION TO CHANGE IN ALL GROUPS CPI— Sep Qtr 2016 co n t i n u e d6
28 A B S • CO N S U M E R P R I C E I N D E X • 6 4 0 1 . 0 • SE P QT R 2 0 1 6
0.80.90.40.70.40.90.70.51.1All groups CPI
0.00–0.03–0.10–0.03–0.010.020.020.020.00Other financial services0.000.010.010.000.010.010.010.000.01Deposit and loan facilities (direct charges)0.01–0.02–0.10–0.030.000.010.020.030.00Financial services0.040.000.010.010.170.080.010.010.04Insurance0.040.000.010.010.170.080.010.010.04Insurance0.05–0.03–0.08–0.020.170.090.020.030.04Insurance and financial services
0.010.000.000.000.010.000.000.010.00Tertiary education0.000.000.000.000.000.000.000.000.00Secondary education0.000.010.000.000.000.000.000.010.00Preschool and primary education0.010.010.000.000.010.000.000.010.00Education0.010.010.000.000.010.000.000.010.00Education
0.010.000.000.010.020.030.00–0.010.01Other recreational, sporting and cultural services0.000.03–0.080.010.010.01–0.010.010.00Sports participation0.000.000.010.000.000.010.000.010.00Veterinary and other services for pets0.010.000.010.020.000.000.000.000.00Pets and related products0.000.000.000.000.010.010.010.000.00Games, toys and hobbies0.000.010.01–0.01–0.020.000.020.00–0.01
Equipment for sports, camping and open-airrecreation
0.020.04–0.040.040.020.060.020.010.03Other recreation, sport and culture0.040.060.040.080.020.030.070.050.06International holiday travel and accommodation0.01–0.020.25–0.08–0.040.040.05–0.020.03Domestic holiday travel and accommodation0.060.040.290.00–0.020.070.110.020.09Holiday travel and accommodation0.000.000.010.010.01–0.010.00–0.010.00Newspapers, magazines and stationery0.010.010.000.010.000.010.000.010.01Books0.010.000.010.030.010.000.000.010.01Newspapers, books and stationery0.000.01–0.020.00–0.01–0.020.000.01–0.01Audio, visual and computing media and services
–0.020.00–0.010.00–0.020.00–0.01–0.03–0.01Audio, visual and computing equipment–0.020.00–0.020.00–0.02–0.02–0.01–0.03–0.02Audio, visual and computing equipment and services0.070.090.250.05–0.010.110.120.010.11Recreation and culture
–0.07–0.06–0.05–0.05–0.07–0.07–0.07–0.07–0.07Telecommunication equipment and services0.000.000.000.000.000.000.000.000.00Postal services
–0.07–0.06–0.06–0.05–0.07–0.07–0.07–0.07–0.07Communication–0.07–0.06–0.06–0.05–0.07–0.07–0.07–0.07–0.07Communication
Weighted
average of
eight
capital
citiesCanberraDarwinHobartPerthAdelaideBrisbaneMelbourneSydneyGroup , sub–g r oup and expend i t u r e c l a s s
CONTRIBUT ION TO CHANGE IN ALL GROUPS CPI— Sep Qtr 2016 co n t i n u e d6
A B S • CO N S U M E R P R I C E I N D E X • 6 4 0 1 . 0 • SE P QT R 2 0 1 6 29
(a) Unless otherwise specified, reference period of each index: 2011–12 = 100.0.
0.000.130.132.70.5112.7112.1109.7Cleaning, repair and hire of clothing and
footwear
0.040.790.756.55.7106.3100.699.8Accessories0.040.920.886.04.9107.2102.2101.1Accessories and clothing services
–0.010.120.134.4–2.699.0101.694.8Footwear for infants and children–0.010.330.341.2–0.893.694.492.5Footwear for women0.000.140.14–0.40.598.698.199.0Footwear for men
–0.010.590.601.5–0.895.896.694.4Footwear0.000.300.303.5–0.498.398.795.0Garments for infants and children
–0.021.341.36–1.0–1.692.393.893.2Garments for women0.000.750.75–1.5–0.6101.7102.3103.3Garments for men
–0.032.382.41–0.6–1.195.896.996.4Garments0.013.903.891.20.398.398.097.1Clothing and footwear
0.083.893.8113.12.3162.9159.2144.0Tobacco0.083.893.8113.12.3162.9159.2144.0Tobacco0.022.542.522.90.8113.9113.0110.7Beer
–0.011.661.67–2.4–0.2102.0102.2104.5Wine0.001.011.011.70.0110.7110.7108.8Spirits0.015.215.200.90.3109.2108.9108.2Alcoholic beverages0.119.119.005.71.1127.1125.7120.2Alcohol and tobacco
0.012.922.911.70.3110.2109.9108.4Take away and fast foods0.013.063.051.40.6108.3107.7106.8Restaurant meals0.035.995.961.50.4109.2108.8107.6Meals out and take away foods
–0.010.880.89–1.4–0.9102.1103.0103.6Waters, soft drinks and juices0.000.290.29–5.1–1.999.6101.5104.9Coffee, tea and cocoa
–0.011.171.18–2.4–1.1101.5102.6104.0Non-alcoholic beverages0.000.450.45–1.71.495.894.597.5Other food products n.e.c.0.000.980.98–1.3–0.3102.2102.5103.5Snacks and confectionery0.000.180.182.30.1102.0101.999.7Oils and fats0.000.300.30–0.71.197.896.798.5Food additives and condiments0.000.150.15–0.21.5105.3103.7105.5Jams, honey and spreads0.000.120.12–0.10.4109.1108.7109.2Eggs0.002.172.17–0.90.4100.7100.3101.6Food products n.e.c.0.081.481.4011.95.9116.7110.2104.3Vegetables0.201.221.024.419.5100.484.096.2Fruit0.282.702.428.411.6108.797.4100.3Fruit and vegetables0.000.370.37–2.1–1.596.898.398.9Ice cream and other dairy products0.000.340.34–2.8–0.8101.9102.7104.8Cheese0.000.410.41–0.30.096.696.696.9Milk
–0.011.111.12–1.7–0.898.299.099.9Dairy and related products0.000.430.432.9–0.2107.4107.6104.4Fish and other seafood0.000.430.430.1–1.3111.2112.7111.1Other meats0.000.470.47–3.4–0.3100.0100.3103.5Poultry0.000.250.258.12.9103.1100.295.4Lamb and goat0.000.390.390.7–1.1110.1111.3109.3Pork0.000.480.488.91.0125.1123.9114.9Beef and veal0.002.452.452.30.0109.5109.5107.0Meat and seafoods0.000.190.19–4.6–0.193.293.397.7Other cereal products0.000.170.17–6.10.893.092.399.0Breakfast cereals0.010.750.74–0.80.1102.1102.0102.9Cakes and biscuits0.000.550.550.9–0.496.196.595.2Bread0.001.661.66–1.20.098.098.099.2Bread and cereal products0.3017.2516.951.51.7105.6103.8104.0Food and non-alcoholic beverages
Jun Qtr 2016 to
Sep Qtr 2016
Sep Qtr
2016
Jun Qtr
2016
Sep Qtr 2015 to
Sep Qtr 2016
Jun Qtr 2016 to
Sep Qtr 2016
Sep Qtr
2016
Jun Qtr
2016
Sep Qtr
2015
CHANGEIN POINTSCONTRIBUTION
CONTRIBUTIONTO TOTAL CPI(ALL GROUPSINDEX POINTS)PERCENTAGE CHANGEINDEX NUMBERS(a)
Group , sub–g r oup and expend i t u r e c l a s s
GROUP, SUB– GROUP AND EXPENDITURE CLASS, Weighted average of eigh t cap i ta l ci t ies7
30 A B S • CO N S U M E R P R I C E I N D E X • 6 4 0 1 . 0 • SE P QT R 2 0 1 6

(a) Unless otherwise specified, reference period of each index: 2011–12 = 100.0.
0.010.800.790.20.3105.5105.2105.3Urban transport fares0.010.800.790.20.3105.5105.2105.3Urban transport fares0.031.711.681.81.5122.9121.1120.7Other services in respect of motor vehicles0.001.861.861.40.4107.8107.4106.3Maintenance and repair of motor vehicles
–0.082.892.97–12.6–2.981.583.993.3Automotive fuel0.011.061.050.80.7106.9106.2106.0
Spare parts and accessories for motorvehicles
–0.012.993.00–1.6–0.694.495.095.9Motor vehicles–0.0710.5010.57–3.7–0.697.197.7100.8Private motoring–0.0611.3011.36–3.4–0.597.798.2101.1Transport
0.000.630.631.20.0110.9110.9109.6Dental services–0.014.674.685.4–0.2135.8136.1128.8Medical and hospital services–0.015.305.315.0–0.2132.3132.5126.0Medical, dental and hospital services0.000.150.150.50.197.397.296.8Therapeutic appliances and equipment
–0.011.171.18–0.3–0.9103.5104.4103.8Pharmaceutical products–0.011.311.32–0.1–0.8102.8103.6102.9Medical products, appliances and equipment–0.026.616.633.9–0.2125.2125.5120.5Health
0.000.820.821.90.5115.1114.5113.0Other household services0.001.001.001.90.5110.5109.9108.4
Hairdressing and personal groomingservices
0.041.061.027.93.6145.4140.4134.7Child care0.042.882.844.11.6122.7120.8117.9Domestic and household services0.001.491.49–0.20.0103.2103.2103.4Other non-durable household products0.011.031.02–1.10.493.993.594.9Personal care products0.000.280.28–0.6–1.196.397.496.9Cleaning and maintenance products0.002.802.80–0.50.198.998.899.4Non-durable household products0.010.280.274.01.1107.2106.0103.1
Tools and equipment for house andgarden
0.010.410.402.12.396.294.094.2Glassware, tableware and household
utensils
0.000.220.22–1.50.094.894.896.2Small electric household appliances0.000.480.480.3–1.099.1100.198.8Major household appliances0.011.381.371.30.699.098.497.7Household appliances, utensils and tools0.030.570.542.55.995.089.792.7Household textiles0.030.570.542.55.995.089.792.7Household textiles0.000.300.302.5–0.1107.2107.3104.6Carpets and other floor coverings0.021.651.633.11.3103.7102.4100.6Furniture0.021.951.933.01.1104.2103.1101.2Furniture and furnishings0.119.589.471.91.1105.9104.7103.9
Furnishings, household equipment andservices
0.000.980.982.0–0.1130.7130.8128.1Gas and other household fuels0.142.682.544.75.4123.7117.4118.1Electricity
–0.021.111.13–1.8–1.8114.0116.1116.1Water and sewerage0.124.774.652.62.5122.6119.6119.5Utilities0.061.741.684.04.0132.1127.0127.0Property rates and charges0.012.272.261.90.5111.3110.8109.2Maintenance and repair of the dwelling0.084.023.942.82.0119.5117.2116.2Other housing0.049.879.831.60.4114.7114.2112.9
New dwelling purchase byowner-occupiers
0.049.879.831.60.4114.7114.2112.9New dwelling purchase by owner-occupiers0.027.587.560.70.3110.7110.4109.9Rents0.027.587.560.70.3110.7110.4109.9Rents0.2626.2425.981.81.0115.6114.4113.6Housing
Jun Qtr 2016 to
Sep Qtr 2016
Sep Qtr
2016
Jun Qtr
2016
Sep Qtr 2015 to
Sep Qtr 2016
Jun Qtr 2016 to
Sep Qtr 2016
Sep Qtr
2016
Jun Qtr
2016
Sep Qtr
2015
CHANGEIN POINTSCONTRIBUTION
CONTRIBUTIONTO TOTAL CPI(ALL GROUPSINDEX POINTS)PERCENTAGE CHANGEINDEX NUMBERS(a)
Group , sub–g r oup and expend i t u r e c l a s s
GROUP, SUB– GROUP AND EXPENDITURE CLASS, Weighted average of eigh t cap i ta l ci t ies
co n t i n u e d7
A B S • CO N S U M E R P R I C E I N D E X • 6 4 0 1 . 0 • SE P QT R 2 0 1 6 31

(a) Unless otherwise specified, reference period of each index: 2011–12 = 100.0.
0.8109.4108.61.30.7109.4108.6108.0All groups CPI
0.003.153.150.80.2107.7107.5106.8Other financial services0.000.760.760.40.6101.7101.1101.3Deposit and loan facilities (direct charges)0.013.913.900.80.3106.5106.2105.7Financial services0.041.761.727.82.5120.5117.6111.8Insurance0.041.761.727.82.5120.5117.6111.8Insurance0.055.675.622.90.9110.5109.5107.4Insurance and financial services
0.011.751.741.70.2122.4122.1120.3Tertiary education0.001.651.654.60.0127.0127.0121.4Secondary education0.000.670.674.60.4126.0125.5120.5Preschool and primary education0.014.074.063.30.2124.8124.6120.8Education0.014.074.063.30.2124.8124.6120.8Education
0.011.341.333.50.3121.4121.0117.3Other recreational, sporting and cultural
services
0.001.121.122.00.3117.0116.6114.7Sports participation0.000.480.484.30.9117.5116.5112.7Veterinary and other services for pets0.010.390.383.41.5101.5100.098.2Pets and related products0.000.660.66–3.20.888.888.191.7Games, toys and hobbies0.000.620.621.3–0.2103.9104.1102.6
Equipment for sports, camping andopen-air recreation
0.024.604.581.90.5109.9109.4107.9Other recreation, sport and culture0.042.602.562.51.9113.4111.3110.6
International holiday travel andaccommodation
0.012.742.730.40.3106.4106.1106.0Domestic holiday travel and
accommodation
0.065.345.281.41.1109.7108.5108.2Holiday travel and accommodation0.000.790.791.3–0.2116.0116.2114.5Newspapers, magazines and stationery0.010.390.381.92.4100.598.198.6Books0.011.181.171.50.6110.3109.6108.7Newspapers, books and stationery0.000.930.93–1.1–0.395.796.096.8
Audio, visual and computing media andservices
–0.020.900.92–8.9–1.864.565.770.8Audio, visual and computing equipment–0.021.831.85–5.0–1.077.378.181.4
Audio, visual and computing equipment andservices
0.0712.9512.880.60.6103.7103.1103.1Recreation and culture
–0.072.582.65–7.9–2.588.390.695.9Telecommunication equipment and
services
0.000.140.14–0.11.0111.2110.1111.3Postal services–0.072.722.79–7.5–2.389.391.496.5Communication–0.072.722.79–7.5–2.389.391.496.5Communication
Jun Qtr 2016 to
Sep Qtr 2016
Sep Qtr
2016
Jun Qtr
2016
Sep Qtr 2015 to
Sep Qtr 2016
Jun Qtr 2016 to
Sep Qtr 2016
Sep Qtr
2016
Jun Qtr
2016
Sep Qtr
2015
CHANGEIN POINTSCONTRIBUTION
CONTRIBUTIONTO TOTAL CPI(ALL GROUPSINDEX POINTS)PERCENTAGE CHANGEINDEX NUMBERS(a)
Group , sub–g r oup and expend i t u r e c l a s s
GROUP, SUB– GROUP AND EXPENDITURE CLASS, Weighted average of eigh t cap i ta l ci t ies
co n t i n u e d7
32 A B S • CO N S U M E R P R I C E I N D E X • 6 4 0 1 . 0 • SE P QT R 2 0 1 6

(b) Unless otherwise specified, reference period of each index: 2011–12 = 100.0.(c) Index numbers are available in the time series spreadsheet 'Table 8. CPI:
Analytical Series, Weighted Average of Eight Capital Cities'.
. . not applicabler revised(a) Refer to paragraphs 11 and 12 of the Explanatory Notes for a description of
these series.
0.56103.81103.251.70.5110.5109.9108.7'Volatile items'0.4388.6788.241.70.5110.8110.3108.9Food and energy0.76104.73103.971.20.7108.5107.7107.2Medical and hospital services0.4577.4977.041.10.6107.4106.8106.2
Housing, Insurance andfinancial services
0.71103.73103.021.20.6109.3108.6108.0Insurance and financial services0.74105.33104.591.30.7108.9108.1107.5Education0.6996.4595.761.40.7110.2109.4108.7Recreation and culture0.82106.68105.861.60.7110.0109.2108.3Communication0.8298.1097.281.80.8110.9110.0108.9Transport0.78102.79102.011.10.7108.5107.7107.3Health0.6599.8299.171.20.6109.7109.0108.4
Furnishings, householdequipment and services
0.4983.1682.671.20.7107.6106.9106.3Housing0.75105.50104.751.40.7109.9109.1108.4Clothing and footwear0.65100.2999.640.90.7108.0107.3107.0Alcohol and tobacco0.4692.1591.691.30.5110.1109.6108.7Food and non-alcoholic beverages
All groups CPI excluding
0.3282.9282.601.20.4107.4107.0106.1Total
0.1233.2733.150.90.4108.8108.4107.8Services0.2049.6549.451.30.4106.4106.0105.0Goods
Market goods and servicesexcluding 'volatile items'
. .. .. .1.70.6110.0109.3108.2Deposit and loan facilities
(indirect charges)
All groups CPI including
0.2548.2247.971.80.5114.0113.4112.0Services component0.5061.1760.671.00.8106.0105.2105.0Goods component
Goods and services series
0.3969.4969.101.70.5113.8113.2111.9Non-tradables0.3739.9139.540.71.0102.5101.5101.8Tradables
International trade exposure series
. .. .. .1.30.3. .. .. .Weighted median(c)
. .. .. .1.70.4. .. .. .Trimmed mean(c)Underlying trend series
. .. .. .1.40.4109.3r108.9r107.8All groups CPI, seasonally adjusted
0.8109.4108.61.30.7109.4108.6108.0All groups CPI
Jun Qtr 2016 to
Sep Qtr 2016
Sep Qtr
2016
Jun Qtr
2016
Sep Qtr 2015 to
Sep Qtr 2016
Jun Qtr 2016 to
Sep Qtr 2016
Sep Qtr
2016
Jun Qtr
2016
Sep Qtr
2015
CHANGEIN POINTSCONTRIBUTION
CONTRIBUTIONTO TOTAL CPI(ALL GROUPS CPIINDEX POINTS)PERCENTAGE CHANGEINDEX NUMBERS(b)
ANALYT ICAL SERIES, Weighted average of eigh t cap i ta l ci t ies (a )8
A B S • CO N S U M E R P R I C E I N D E X • 6 4 0 1 . 0 • SE P QT R 2 0 1 6 33

6 There are 87 expenditure classes (that is, groupings of like items) in the 16th series
CPI and each expenditure class has its own weight, or measure of relative importance. In
calculating the index, price changes for the various expenditure classes are combined
using these weights.
7 Changes in the weighting pattern have been made at approximately six yearly
intervals to take account of changes in household spending patterns. The CPI now
comprises sixteen series of price indexes which have been linked to form a continuous
series. The current and historical weighting patterns for the CPI for the weighted average
of the eight capital cities are published in Consumer Price Index: Historical Weighting
Patterns (1948 to 2011) (cat. no. 6431.0). The 16th series weighting pattern for the
weighted average of eight capital cities and for each of the eight capital cities, as well as
each city's percentage contribution to the weighted average, are also published in the
WE I G H T I N G PA T T E R N
4 The frequency of price collection by item varies as necessary to obtain reliable price
measures. Prices of some items are volatile (i.e. their prices may vary many times each
quarter) and for these items frequent price observations are necessary to obtain a
reliable measure of the average price for the quarter. Each month prices are collected at
regular intervals for goods such as milk, bread, fresh meat and seafood, fresh fruit and
vegetables, alcohol, tobacco, women's outerwear, project homes, motor vehicles, petrol
and holiday travel and accommodation. For most other items, price volatility is not a
problem and prices are collected once a quarter. There are a few items where prices are
changed at infrequent intervals, for example education fees where prices are set once a
year. In these cases, the frequency of price collection is modified accordingly.
5 In order to facilitate a more even spread of field collection workload, the number of
items for which prices are collected quarterly is distributed roughly equally across each
month of each quarter. In all cases, however, individual items are priced in the same
month of each quarter. For example, items for which prices are collected in the first
month of the September quarter, July, are also priced in the first month of subsequent
quarters, namely October, January and April.
PR I C E S
1 The Consumer Price Index (CPI) measures quarterly changes in the price of a 'basket'
of goods and services which account for a high proportion of expenditure by the CPI
population group (i.e. metropolitan households). This 'basket' covers a wide range of
goods and services, arranged in the following eleven groups:
Food and non–alcoholic beverages
Alcohol and tobacco
Clothing and footwear
Housing
Furnishings, household equipment and services
Health
Transport
Communication
Recreation and culture
Education
Insurance and financial services.
2 Capital city indexes used by the CPI are based on the 2006 Australian Standard
Geographical Classification (ASGC) statistical divisions. The capital city indexes measure
price movements over time in each city individually. They do not measure differences in
retail price levels between cities.
3 Further information about the CPI is contained in Consumer Price Index: Concepts,
Sources and Methods, 2011 (cat. no. 6461.0). An updated version reflecting the changes
made during the 16th series review was released on 19 December 2011.
BR I E F DE S C R I P T I O N OF TH E
CP I
34 A B S • CO N S U M E R P R I C E I N D E X • 6 4 0 1 . 0 • SE P QT R 2 0 1 6
E X P L A N A T O R Y N O T E S
11 Various series are presented in Table 8 in this publication to assist users analyse the
CPI. Some of the analytical series are compiled by taking subsets of the CPI basket, and
most are self explanatory, such as 'All groups CPI excluding Food and non-alcoholic
beverages'. (A complete list of CPI groups, sub-groups and expenditure classes is
contained in Tables 6 and 7). Other series and their composition are described below:
All groups CPI, seasonally adjusted: Comprises all components included in the All
groups CPI, seasonally adjusted where seasonality has been identified at the
weighted average of eight capital cities level. Seasonal adjustment factors are
calculated using the history of price changes up to the current quarter CPI and are
revised each quarter.
Where CPI expenditure classes are identified as having a seasonal pattern,
quarterly price changes are estimated on a seasonally adjusted basis. At the
introduction of the 16th series, 62 out of the 87 expenditure classes were
classified as seasonal. A description of which series are currently seasonally
adjusted is published in Appendix 1 of every September quarter issue of
Consumer Price Index, Australia (cat. no. 6401.0), following the annual seasonal
reanalysis.
Underlying trend series, 'Trimmed mean' and 'Weighted median': These are two
analytical measures of trend inflation calculated from the June quarter 2002 using
standard ABS seasonal adjustment techniques. For more information see the
Information Paper: Seasonal Adjustment of Consumer Price Indexes, 2011 (cat. no.
6401.0.55.003). The Trimmed mean and Weighted median are calculated using the
distribution of expenditure classes each quarter derived as follows:
The CPI expenditure classes are ranked from lowest to highest according to the
seasonally adjusted percentage change from the previous quarter.
The seasonally adjusted relative weight of each expenditure class is calculated
based on its previous quarter contribution to the All groups CPI.
AN A L Y T I C A L SE R I E S
8 Movements in indexes from one period to another can be expressed either as
changes in index points or as percentage changes. The following example illustrates the
method of calculating changes in index points and percentage changes between any two
periods:
All groups CPI: Weighted average of eight capital cities. Index numbers:
June Quarter 2012 100.4 (see Table 1)
less June Quarter 2011 99.2 (see Table 1)
Change in index points 1.2
Percentage change 1.2/99.2 x 100 = 1.2% (see Table 2)
9 Percentage changes are calculated to illustrate three different kinds of movements in
index numbers:
movements between consecutive financial years (where the index numbers for
financial years are simple averages of the quarterly index numbers)
movements between corresponding quarters of consecutive years
movements between consecutive quarters.
10 Table 7 provides a detailed analysis, for the weighted average of eight capital cities,
of movements in the CPI since the previous quarter, including information on
movements for groups, sub–groups and expenditure classes. It also shows the
contribution which each makes to the total CPI. For instance, the dairy and related
products sub–group contributed 1.13 index points to the total All groups index number
of 100.4 for the June Quarter 2012. The final column shows contributions to the change
in All Groups index points by each group, sub–group and expenditure class.
AN A L Y S I S OF CP I CH A N G E S
Consumer Price Index: 16th Series Weighting Pattern (cat. no. 6471.0). Both
publications are available on the ABS website <http://www.abs.gov.au>.
WE I G H T I N G PA T T E R N continued
A B S • CO N S U M E R P R I C E I N D E X • 6 4 0 1 . 0 • SE P QT R 2 0 1 6 35
E X P L A N A T O R Y N O T E S continued

The 'Trimmed mean' is calculated by using a weighted average of percentage
change from the previous quarter (seasonally adjusted) from the middle 70 per
cent of the distribution.
The 'Weighted median' is calculated using the percentage change from the
previous quarter (seasonally adjusted) expenditure class at the 50th percentile
of the distribution.
International trade exposure series, Tradables component: Comprises all items
whose prices are largely determined on the world market. For more information,
see paragraph 12 below.
International trade exposure series, Non-tradables component: Comprises all
items not included in the Tradables component.
All groups CPI, goods component: Comprises the Food and non-alcoholic beverages
group (except Restaurant meals); Alcohol and tobacco group; Clothing and footwear
group (except Cleaning, repair and hire of clothing and footwear); Furnishings,
household equipment and services group (except Domestic and household services
sub-group); Utilities, Audio, visual and computing equipment and services, and
Newspapers, books and stationery sub-groups; and New dwelling purchase by
owner-occupiers, Pharmaceutical products, Motor vehicles, Automotive fuel, Spare
parts and accessories for motor vehicles, Equipment for sports, camping and
open-air recreation, Games, toys and hobbies and Pets and related products
expenditure classes.
All groups CPI, services component: Comprises all items not included in the 'All
groups CPI, goods component'. A description of which series are goods or services is
published in Appendix 1 of the September quarter 2011 issue of Consumer Price
Index, Australia (cat. no 6401.0).
All groups CPI including Deposit and loan facilities (indirect charges): One of the
outcomes of the 16th series CPI Review was to remove the indirectly measured
component of the Deposit and loan facilities index from the headline CPI but to
include it in a new analytical series. This index includes the 16th series All groups
CPI plus the indirectly measured component of the Deposit and loan facilities index.
Market goods and services excluding 'volatile items': in addition to the items
excluded from the series 'All groups CPI excluding 'volatile items', also excludes:
Utilities, Property rates and charges, Child care, Health, Other services in respect of
motor vehicles, Urban transport fares, Postal services, and Education.
All groups CPI excluding Insurance and financial services: Reflecting the changing
composition of the CPI, from the September quarter 1989 to the June quarter 1998,
comprises the All groups CPI excluding house insurance, house contents insurance,
vehicle insurance and mortgage interest charges and consumer credit charges; from
the September quarter 1998 to the June quarter 2000 comprises the All groups CPI
excluding house insurance, house contents insurance and vehicle insurance; from
the September quarter 2000 to the June quarter 2005 comprises the All groups CPI
excluding insurance services; from the September quarter 2005 to the June quarter
2011 comprises the All groups CPI excluding Financial and insurance services; from
the September quarter 2011 comprises the All groups CPI excluding Insurance and
financial services.
AN A L Y T I C A L SE R I E S continued
36 A B S • CO N S U M E R P R I C E I N D E X • 6 4 0 1 . 0 • SE P QT R 2 0 1 6
E X P L A N A T O R Y N O T E S continued

14 Seasonally adjusted estimates are derived by estimating and removing systematic
calendar related effects from the original series. In most economic data these calendar
related effects are a combination of the classical seasonal influences (e.g. the effect of the
weather, social traditions or administrative practices such as government charges
increasing on 1 July each year) plus other kinds of calendar related variations, such as
Easter or the proximity of significant days in the year (e.g. Christmas). In the seasonal
adjustment process, both seasonal and other calendar related factors evolve over time to
reflect changes in activity patterns. The seasonally adjusted estimates reflect the
sampling and non–sampling errors to which the original estimates are subject.
15 The CPI uses a concurrent seasonal adjustment methodology to derive the
adjustment factors. This method uses the original time series available at each reference
period to estimate seasonal factors for the current and previous quarters. Concurrent
seasonal adjustment is technically superior to the more traditional method of reanalysing
seasonal patterns once each year because it uses all available data to fine tune the
estimates of the seasonal component each quarter. With concurrent analysis, the
seasonally adjusted series are subject to revision each quarter as the estimates of the
seasonal factors are improved. In most instances, the only significant revisions will be to
the combined adjustment factors for the previous quarter and for the same quarter in
the preceding year as the reference quarter (i.e. if the latest quarter is September quarter
2011 then the most significant revisions will be to June quarter 2011 and September
SE A S O N A L L Y AD J U S T E D
IN D E X E S
13 Published index numbers, except for the underlying trend series, are rounded to
one decimal place. Percentage change movements are calculated from the index
numbers and then rounded to one decimal place. Rounding errors can occur, causing
discrepancies (e.g. when calculating percentage changes of aggregates and their
components). Underlying trend series, 'Trimmed mean' and 'Weighted median' index
numbers are published to four decimal places. Percentage change movements are
calculated from the published index numbers and rounded to one decimal place.
RO U N D I N G
All groups CPI excluding Housing and Insurance and financial services: Reflecting
the changing composition of the CPI, from the September quarter 1989 to the June
quarter 1998, comprises the All groups CPI excluding Housing, house contents
insurance, vehicle insurance and consumer credit charges; from the September
quarter 1998 to the June quarter 2000 comprises the All groups CPI excluding
Housing, house insurance, house contents insurance and vehicle insurance; from
the September quarter 2000 to the June quarter 2005 comprises the All groups CPI
excluding Housing and insurance services; from the September quarter 2005 to the
June quarter 2011 comprises the All groups CPI excluding Housing and Financial
and insurance services; from the September quarter 2011 comprises the All groups
CPI excluding Housing and Insurance and financial services.
All groups CPI excluding food and energy: Comprises the All groups CPI excluding
the Food and non-alcoholic beverages group (except Restaurant meals); Electricity,
Gas and other household fuels; and Automotive fuel.
All groups CPI excluding 'volatile items': Comprises the All groups CPI excluding
Fruit and vegetables and Automotive fuel.
12 The International trade exposure series was reviewed and updated for the 16th
series. There were five changes of classification. 'Cakes and biscuits' and 'Jams, honey and
spreads' were reclassified from non-tradable to tradable. 'Waters, soft drinks and juices',
'Newspapers, magazines and stationery' and 'Pets and related products' were reclassified
from tradable to non-tradable. A description of which series are tradable or non-tradable
is published in Appendix 1 of the September quarter 2011 issue of Consumer Price
Index, Australia (cat. no 6401.0). These changes are included from the September
quarter 2011. The historical tradable and non-tradable series will not be revised.
AN A L Y T I C A L SE R I E S continued
A B S • CO N S U M E R P R I C E I N D E X • 6 4 0 1 . 0 • SE P QT R 2 0 1 6 37
E X P L A N A T O R Y N O T E S continued

20 Current publications and other products released by the ABS are listed on the ABS
website <http://www.abs.gov.au>. The ABS also issues a daily Release Advice on the
website which details products to be released in the week ahead.
21 Users may also wish to refer to the following publications and other data products
that are available free of charge from the ABS website:
Enhancing the Australian CPI: A roadmap, Aug 2015 (cat. no. 6401.0.60.001)
Information Paper: Increasing the Frequency of CPI Expenditure Class Weight
Updates, July 2016 (cat. no. 6401.0.60.002)
A Guide to the Consumer Price Index, 16th Series (cat. no. 6440.0)
Consumer Price Index: Concepts, Sources and Methods, 2011 (cat. no. 6461.0)
RE L A T E D PU B L I C A T I O N S
19 CPI original indexes are revised only in exceptional circumstances, such as to
correct a significant error. As is the case with all price indexes, the index reference period
(i.e. the period in which the index is set equal to 100.0) will be changed periodically. The
index number levels for all periods will be changed by this process and it may also result
in differences, due to rounding, between the percentage changes published on the old
base and those on the new base. Seasonally adjusted indexes (including the Trimmed
mean and Weighted median) for some quarters will be revised as extra quarters are
included in the series analysed for seasonal influences (see paragraphs 14 to 17).
RE V I S I O N S
18 In analysing price movements in Australia, an important consideration is Australia's
performance relative to other countries. However, a simple comparison of All groups (or
headline) CPIs is often inappropriate because of the different measurement approaches
used by countries for certain products, particularly housing and financial and insurance
services. To provide a better basis for international comparisons, the 17th International
Conference of Labour Statisticians adopted a resolution which called for countries to 'if
possible, compile and provide for dissemination to the international community an index
that excludes housing and financial services' in addition to the all-items index.
I N T E R N A T I O N A L
CO M P A R I S O N S
quarter 2010). The seasonal patterns are also reanalysed on an annual basis or when
there are known changes to regular events. This can lead to additional revisions.
16 Autoregressive integrated moving average (ARIMA) modelling can improve the
revision properties of the seasonally adjusted and trend estimates. ARIMA modelling
relies on the characteristics of the series being analysed to project future period data.
The projected values are temporary, intermediate values, that are only used internally to
improve the estimation of the seasonal factors. The projected data do not affect the
original estimates and are discarded at the end of the seasonal adjustment process. From
the December quarter 2012, the Consumer Price Index uses ARIMA modelling where
appropriate for individual time series. The ARIMA model is assessed as part of the annual
reanalysis. For more information on ARIMA modelling see Feature article: Use of ARIMA
modelling to reduce revisions in the October 2004 issue of Australian Economic
Indicators (cat. no. 1350.0).
17 The ABS applies seasonal adjustment to the expenditure class components of the
CPI which are found to be seasonal, and then aggregates the seasonally adjusted and
non–seasonally adjusted components to calculate the All groups CPI, seasonally adjusted,
Trimmed mean and Weighted median estimates. The seasonally adjusted expenditure
class components are available in Table 13 – CPI expenditure classes and selected
analytical series, seasonally adjusted index numbers, weighted average of eight capital
cities. The seasonal factors used to derive these seasonally adjusted indexes are available
in Table 14 – CPI expenditure class, combined seasonal adjustment factors, weighted
average of eight capital cities. For more information about seasonal adjustment of the
CPI please refer to Information Paper: Seasonal Adjustment of Consumer Price Indexes,
2011 (cat. no. 6401.0.55.003).
SE A S O N A L L Y AD J U S T E D
IN D E X E S continued
38 A B S • CO N S U M E R P R I C E I N D E X • 6 4 0 1 . 0 • SE P QT R 2 0 1 6
E X P L A N A T O R Y N O T E S continued

22 As well as the statistics included in this publication, there is more detailed data for
each capital city available on the ABS website. Inquiries should be made to the National
Information and Referral Service on 1300 135 070.
DA T A AV A I L A B L E
Information Paper: Introduction of the 16th Series Australian Consumer Price
Index, 2011 (cat. no. 6470.0)
Information Paper: Outcome of the 16th Series Australian Consumer Price Index
Review, Australia (cat. no. 6469.0)
Consumer Price Index Commodity Classification, Australia, 16th Series, 2011
(cat. no. 6401.0.55.004)
Consumer Price Index: 16th Series Weighting Pattern (cat. no. 6471.0)
Consumer Price Index: Historical Weighting Patterns (1948–2011) (cat. no. 6431.0)
Analytical Living Cost Indexes and Pensioner and Beneficiary Living Cost Index:
16th Series Weighting Patterns (cat. no. 6472.0)
Consumer Price Index: Concordance with Household Expenditure Classification,
Australia (cat. no. 6446.0.55.001)
Information Paper: Seasonal Adjustment of Consumer Price Indexes, 2011
(cat. no. 6401.0.55.003)
Information Paper: Experimental Price Indexes for Financial Services
(cat. no. 6413.0)
Information Paper: The Introduction of Hedonic Price Indexes for Personal
Computers (cat. no. 6458.0)
Analytical Living Cost Indexes for Selected Australian Household Types
(cat. no. 6463.0)
Selected Living Cost Indexes, Australia (cat. no. 6467.0)
Residential Property Price Indexes: Eight Capital Cities (cat. no. 6416.0)
Producer Price Indexes, Australia (cat. no. 6427.0)
International Trade Price Indexes, Australia (cat. no. 6457.0)
Wage Price Index, Australia (cat. no. 6345.0)
RE L A T E D PU B L I C A T I O N S
continued
A B S • CO N S U M E R P R I C E I N D E X • 6 4 0 1 . 0 • SE P QT R 2 0 1 6 39
E X P L A N A T O R Y N O T E S continued
1 The Annual Seasonal Re-analysis (ASR) reviews the seasonal adjustment of the CPI
series in more detail than is possible in the quarterly processing cycle.
2 Following the 2016 ASR, 58 of the 87 expenditure classes are considered seasonal and
will be seasonally adjusted for the Analytical series; 'All Groups CPI, seasonally adjusted'
and 'Underlying trend series - Trimmed mean and Weighted median'. There has been no
change to this set of indexes which are seasonally adjusted.
3 Seasonally adjusted index numbers can be found in 'Table 13. CPI: Group, Expenditure
Class and Selected Analytical Series Index Numbers, Seasonally adjusted, Weighted
Average of Eight Capital Cities' and combined seasonal adjustment factors can be found
in 'Table 14. CPI: Expenditure Class, Combined seasonal adjustment factors, Weighted
Average of Eight Capital Cities'. These tables can be downloaded from the 'Downloads'
tab of this issue on the ABS website <http://www.abs.gov.au>.
4 The following series has had an adjustment introduced due to changes in seasonal
pattern:
Footwear for infants and children, from June quarter 2014.
5 The following series have had trend breaks introduced to reflect one off changes to
price index levels:
Electricity, from September quarter 2015.
Gas and other household fuels, from September quarter 2015.
Tertiary education, from March quarter 2016.
Water and sewerage, from September quarter 2016.
6 Changes to the seasonally adjusted series do not affect the original CPI index series.
7 For more details on the seasonal adjustment of the CPI please refer to the Explanatory
notes of this issue or the Information Paper: Seasonal Adjustment of Consumer Price
Indexes, 2011 (cat. no. 6401.0.55.003).
SE A S O N A L I T Y OF CP I
EX P E N D I T U R E CL A S S E S
40 A B S • CO N S U M E R P R I C E I N D E X • 6 4 0 1 . 0 • SE P QT R 2 0 1 6
A P P E N D I X S E A S O N A L A D J U S T M E N T O F TH E CP I

yyMedical and hospital servicesnnTherapeutic appliances and equipment yyPharmaceutical productsnnOther household servicesnnHairdressing and personal grooming servicesyyChild careyyOther non-durable household productsyyPersonal care products(a)nnCleaning and maintenance productsnnTools and equipment for house and gardenyyGlassware, tableware and household utensilsyySmall electric household appliancesnnMajor household appliancesyyHousehold textilesyyCarpets and other floor coveringsyyFurnitureyyGas and other household fuelsyyElectricityyyWater and sewerageyyProperty rates and chargesyyMaintenance and repair of the dwelling
n nNew dwelling purchase by owner-occupiersyyRentsnnCleaning, repair and hire of clothing and footwearyyAccessoriesyyFootwear for infants and childrenyyFootwear for womennnFootwear for menyyGarments for infants and childrenyyGarments for womenyyGarments for menyyTobacconnBeernnWine(a)nnSpiritsyyTake away and fast foodsnnRestaurant mealsyyWaters, soft drinks and juices
n nCoffee, tea and cocoayyOther food products n.e.c.yySnacks and confectionerynnOils and fatsyyFood additives and condiments
n nJams, honey and spreadsnnEggsyyVegetablesyyFruitnnIce cream and other dairy productsnnCheesennMilkyyFish and other seafoodyyOther meatsnnPoultryyyLamb and goatyyPorkyyBeef and vealyyOther cereal products(a)yyBreakfast cerealsyyCakes and biscuitsnnBread
Seasonally
adjusted
following
2016 ASR
Seasonally
adjusted
prior to
2016 Annual
Seasonal
Reanalysis
(ASR)CP I expend i t u r e c l a s se s
TABLE 1 – SEASONAL ADJUSTMENT OF CPI EXPENDITURE CLASSES
A B S • CO N S U M E R P R I C E I N D E X • 6 4 0 1 . 0 • SE P QT R 2 0 1 6 41
A P P E N D I X S E A S O N A L A D J U S T M E N T O F TH E CP I continued

nnOther financial servicesnnDeposit and loan facilities (direct charges)yyInsurance(a)yyTertiary educationyySecondary educationyyPreschool and primary educationyyOther recreational, sporting and cultural servicesyySports participationyyVeterinary and other services for petsyyPets and related products(a)yyGames, toys and hobbiesnnEquipment for sports, camping and open-air recreationyyInternational holiday travel and accommodationyyDomestic holiday travel and accommodationyyNewspapers, magazines and stationeryyyBooksnnAudio, visual and computing media and servicesnnAudio, visual and computing equipmentnnTelecommunication equipment and servicesnnPostal servicesyyUrban transport faresyyOther services in respect of motor vehiclesnnMaintenance and repair of motor vehiclesnnAutomotive fuelnnSpare parts and accessories for motor vehicles(a)
n nMotor vehiclesyyDental services
Seasonally
adjusted
following
2016 ASR
Seasonally
adjusted
prior to
2016 Annual
Seasonal
Reanalysis
(ASR)CP I expend i t u r e c l a s se s
TABLE 1 – SEASONAL ADJUSTMENT OF CPI EXPENDITURE CLASSESco n t i n u e d
SE A S O N A L I T Y OF CP I
EX P E N D I T U R E CL A S S E S
continued
42 A B S • CO N S U M E R P R I C E I N D E X • 6 4 0 1 . 0 • SE P QT R 2 0 1 6
A P P E N D I X S E A S O N A L A D J U S T M E N T O F TH E CP I continued

www.abs.gov.auWEB ADDRESS
All statistics on the ABS website can be downloaded freeof charge.
F R E E A C C E S S T O S T A T I S T I C S
Client Services, ABS, GPO Box 796, Sydney NSW 2001POST
1300 135 211FAX
1300 135 070PHONE
Our consultants can help you access the full range ofinformation published by the ABS that is available free ofcharge from our website. Information tailored to yourneeds can also be requested as a 'user pays' service.Specialists are on hand to help you with analytical ormethodological advice.
I N F O R M A T I O N A N D R E F E R R A L S E R V I C E
www.abs.gov.au the ABS website is the best place fordata from our publications and information about the ABS.
INTERNET
F O R M O R E I N F O R M A T I O N . . .
© Commonwealth of Australia 2016Produced by the Australian Bureau of Statistics
64
01
.0
•
CO
NS
UM
ER
P
RI
CE
IND
EX
, A
US
TR
AL
IA
•
Se
pt
em
be
r Q
ua
rt
er
20
16
ISSN 1442–3987
Related Documents