Q4 • 2015 Consumer Behavior Across Pay-TV, VOD, PPV, OTT, TVE, Connected Devices, and Content Discovery VIDEO TRENDS REPORT

Welcome message from author
This document is posted to help you gain knowledge. Please leave a comment to let me know what you think about it! Share it to your friends and learn new things together.
Transcript
Q4 • 2015
Consumer Behavior Across Pay-TV, VOD, PPV, OTT, TVE, Connected Devices, and Content Discovery
VIDEO TRENDS REPORT
2
Q4 2015 VIDEO TRENDS REPORT
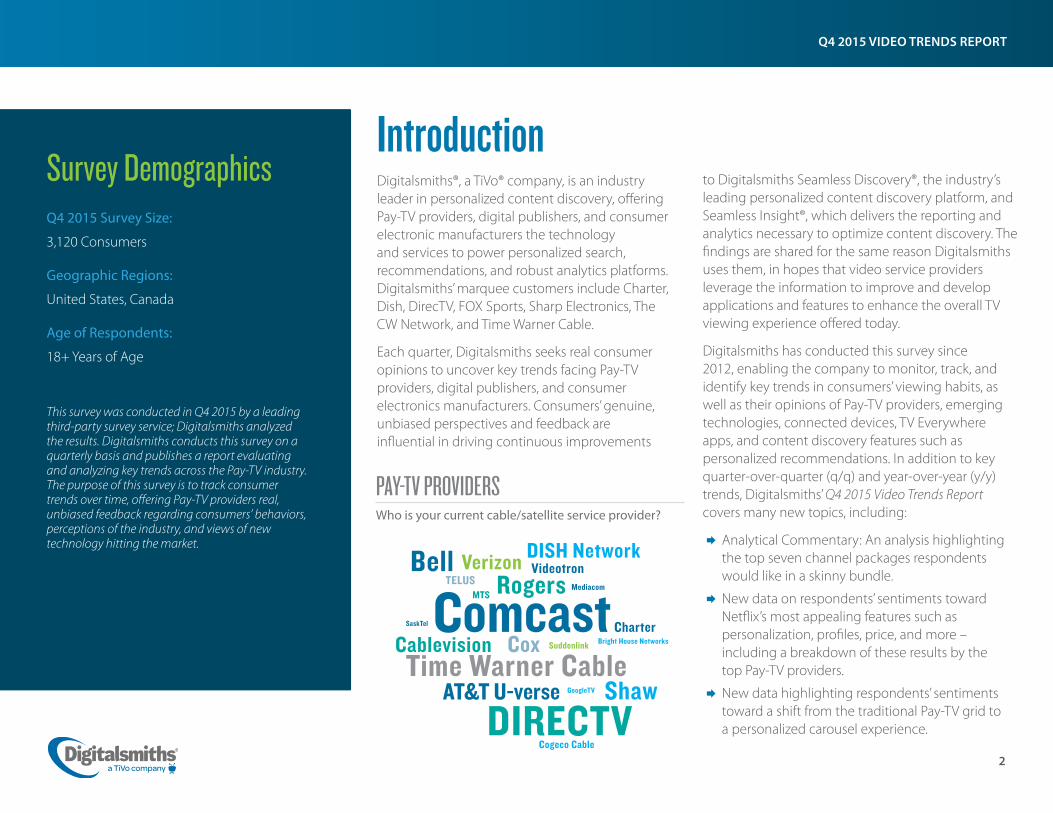
IntroductionDigitalsmiths®, a TiVo® company, is an industry leader in personalized content discovery, offering Pay-TV providers, digital publishers, and consumer electronic manufacturers the technology and services to power personalized search, recommendations, and robust analytics platforms. Digitalsmiths’ marquee customers include Charter, Dish, DirecTV, FOX Sports, Sharp Electronics, The CW Network, and Time Warner Cable.
Each quarter, Digitalsmiths seeks real consumer opinions to uncover key trends facing Pay-TV providers, digital publishers, and consumer electronics manufacturers. Consumers’ genuine, unbiased perspectives and feedback are influential in driving continuous improvements
Survey Demographics Q4 2015 Survey Size:
3,120 Consumers
Geographic Regions:
United States, Canada
Age of Respondents:
18+ Years of Age
This survey was conducted in Q4 2015 by a leading third-party survey service; Digitalsmiths analyzed the results. Digitalsmiths conducts this survey on a quarterly basis and publishes a report evaluating and analyzing key trends across the Pay-TV industry. The purpose of this survey is to track consumer trends over time, offering Pay-TV providers real, unbiased feedback regarding consumers’ behaviors, perceptions of the industry, and views of new technology hitting the market.
to Digitalsmiths Seamless Discovery®, the industry’s leading personalized content discovery platform, and Seamless Insight®, which delivers the reporting and analytics necessary to optimize content discovery. The findings are shared for the same reason Digitalsmiths uses them, in hopes that video service providers leverage the information to improve and develop applications and features to enhance the overall TV viewing experience offered today.
Digitalsmiths has conducted this survey since 2012, enabling the company to monitor, track, and identify key trends in consumers’ viewing habits, as well as their opinions of Pay-TV providers, emerging technologies, connected devices, TV Everywhere apps, and content discovery features such as personalized recommendations. In addition to key quarter-over-quarter (q/q) and year-over-year (y/y) trends, Digitalsmiths’ Q4 2015 Video Trends Report covers many new topics, including:
¨ Analytical Commentary: An analysis highlighting the top seven channel packages respondents would like in a skinny bundle.
¨ New data on respondents’ sentiments toward Netflix’s most appealing features such as personalization, profiles, price, and more – including a breakdown of these results by the top Pay-TV providers.
¨ New data highlighting respondents’ sentiments toward a shift from the traditional Pay-TV grid to a personalized carousel experience.
ComcastDISH Network
Bright House Networks
AT&T U-verse
CharterCablevision
Mediacom
Suddenlink
TELUSVerizon Videotron
Cogeco Cable
GoogleTV
MTS
Cox
DIRECTV
Bell
Time Warner Cable
Rogers
Shaw
SaskTel
PAY-TV PROVIDERSWho is your current cable/satellite service provider?
3
Q4 2015 VIDEO TRENDS REPORT
The State of Pay-TVWhile the majority of this report examines those with a Pay-TV provider and how they interact with their TV offerings, Digitalsmiths first sought to understand the audience without a Pay-TV provider, as well as those who are currently on the fence about leaving their current provider.
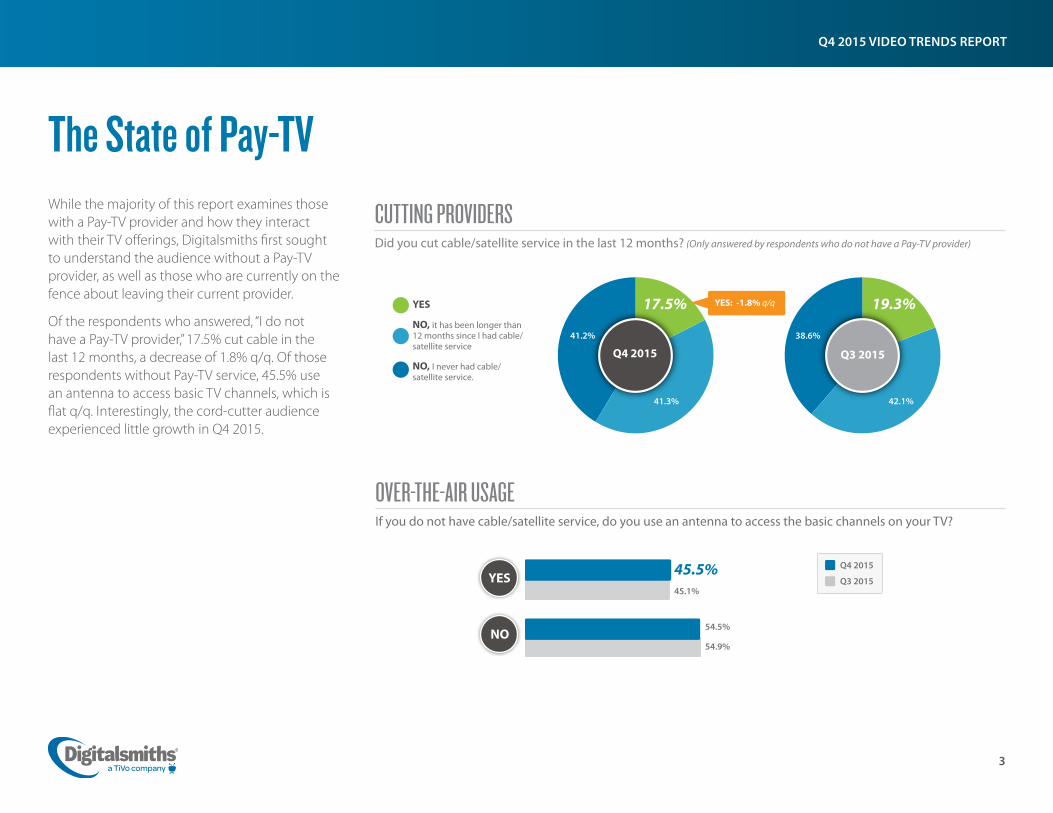
Of the respondents who answered, “I do not have a Pay-TV provider,” 17.5% cut cable in the last 12 months, a decrease of 1.8% q/q. Of those respondents without Pay-TV service, 45.5% use an antenna to access basic TV channels, which is flat q/q. Interestingly, the cord-cutter audience experienced little growth in Q4 2015.
CUTTING PROVIDERSDid you cut cable/satellite service in the last 12 months? (Only answered by respondents who do not have a Pay-TV provider)
41.3%
19.3%
Q4 2015
OVER-THE-AIR USAGEIf you do not have cable/satellite service, do you use an antenna to access the basic channels on your TV?
Q4 2015
Q3 2015
NO
YES45.1%
45.5%
54.9%
54.5%
YES: -1.8% q/q
Q3 2015
YES
NO, it has been longer than 12 months since I had cable/satellite service
NO, I never had cable/satellite service.
17.5%
42.1%
41.2% 38.6%
4
Q4 2015 VIDEO TRENDS REPORT
Q4 2015
The State of Pay-TV
would you consider keeping your existing service if your provider released new functionality that made it easier for you to find something to watch? (For example, if you had shows recommended to you based on your interests so it is easier to find something you “want” to watch on TV.)
Q4 2015NOYES
Do you plan to change cable/satellite providers in the next six months?
YES, planning to SWITCH to an online app or rental service instead of a cable/satellite service
YES, planning to CHANGE cable/satellite providers
YES, planning to CUT cable/satellite service
If YES
MAYBE
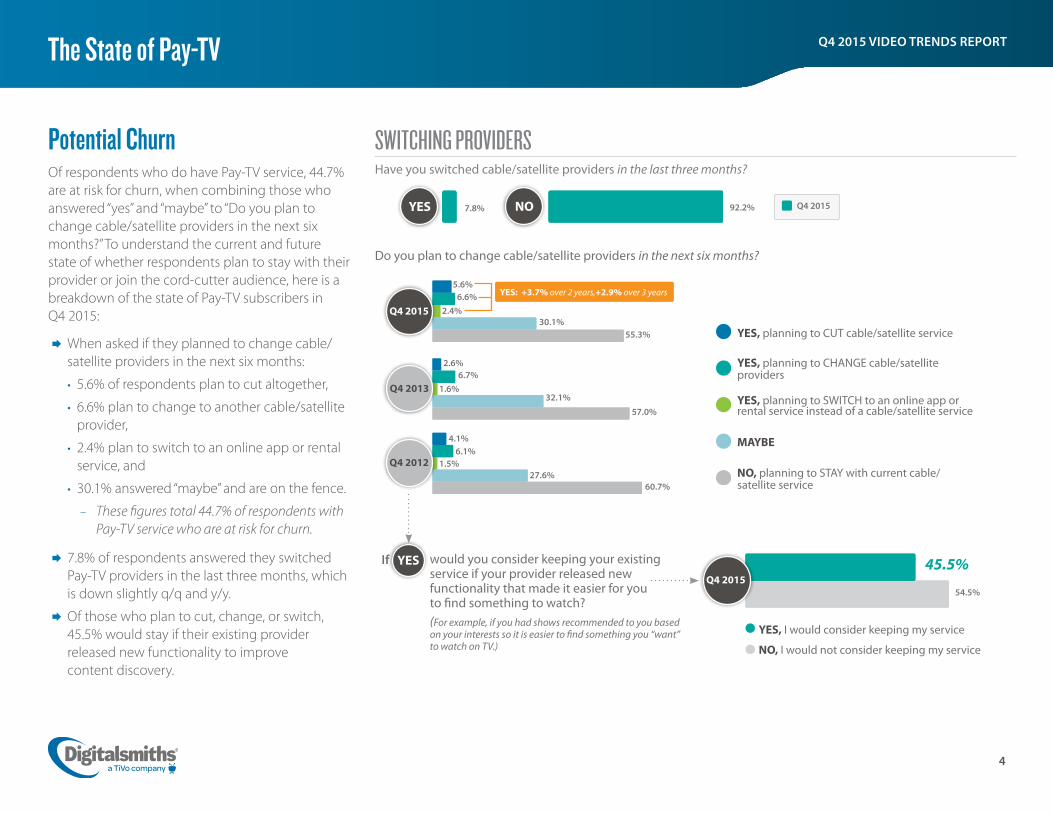
SWITCHING PROVIDERSHave you switched cable/satellite providers in the last three months?
7.8% 92.2%
NO, planning to STAY with current cable/satellite service
5.6%6.6%
2.4%30.1%
55.3%
YES: +3.7% over 2 years,+2.9% over 3 years
54.5%
YES, I would consider keeping my service
NO, I would not consider keeping my service
45.5%
Potential ChurnOf respondents who do have Pay-TV service, 44.7% are at risk for churn, when combining those who answered “yes” and “maybe” to “Do you plan to change cable/satellite providers in the next six months?” To understand the current and future state of whether respondents plan to stay with their provider or join the cord-cutter audience, here is a breakdown of the state of Pay-TV subscribers in Q4 2015:
¨ When asked if they planned to change cable/satellite providers in the next six months:
• 5.6% of respondents plan to cut altogether,
• 6.6% plan to change to another cable/satellite provider,
• 2.4% plan to switch to an online app or rental service, and
• 30.1% answered “maybe” and are on the fence.
– These figures total 44.7% of respondents with Pay-TV service who are at risk for churn.
¨ 7.8% of respondents answered they switched Pay-TV providers in the last three months, which is down slightly q/q and y/y.
¨ Of those who plan to cut, change, or switch, 45.5% would stay if their existing provider released new functionality to improve content discovery.
Q4 2015
Q4 2013
Q4 2012
2.6%6.7%
1.6%32.1%
57.0%
4.1%6.1%
1.5%27.6%
60.7%
5
Q4 2015 VIDEO TRENDS REPORT
$151+ $126 – $150
$101– $125
$76 – $100
$51– $75
<$50
The State of Pay-TV
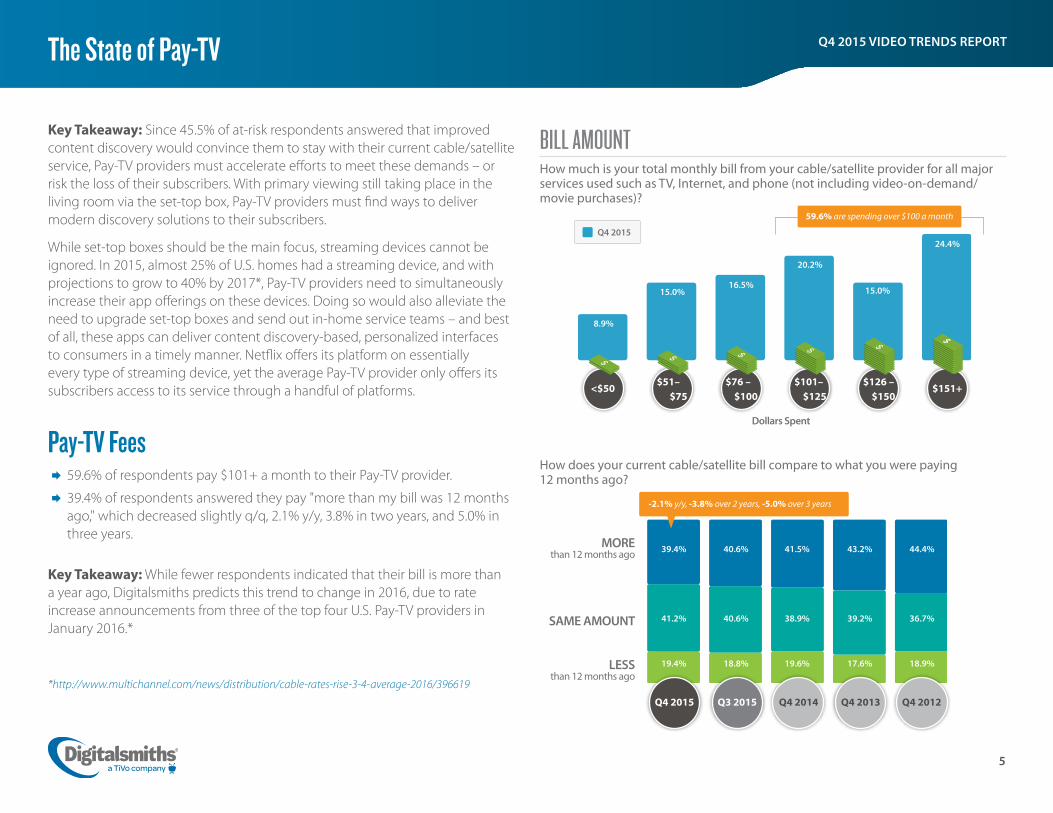
59.6% are spending over $100 a month
BILL AMOUNTHow much is your total monthly bill from your cable/satellite provider for all major services used such as TV, Internet, and phone (not including video-on-demand/movie purchases)?
8.9%
Q4 2015
How does your current cable/satellite bill compare to what you were paying 12 months ago?
MORE than 12 months ago
SAME AMOUNT
LESS than 12 months ago
Q4 2015
Dollars Spent
Key Takeaway: Since 45.5% of at-risk respondents answered that improved content discovery would convince them to stay with their current cable/satellite service, Pay-TV providers must accelerate efforts to meet these demands – or risk the loss of their subscribers. With primary viewing still taking place in the living room via the set-top box, Pay-TV providers must find ways to deliver modern discovery solutions to their subscribers.
While set-top boxes should be the main focus, streaming devices cannot be ignored. In 2015, almost 25% of U.S. homes had a streaming device, and with projections to grow to 40% by 2017*, Pay-TV providers need to simultaneously increase their app offerings on these devices. Doing so would also alleviate the need to upgrade set-top boxes and send out in-home service teams – and best of all, these apps can deliver content discovery-based, personalized interfaces to consumers in a timely manner. Netflix offers its platform on essentially every type of streaming device, yet the average Pay-TV provider only offers its subscribers access to its service through a handful of platforms.
Pay-TV Fees ¨ 59.6% of respondents pay $101+ a month to their Pay-TV provider.
¨ 39.4% of respondents answered they pay "more than my bill was 12 months ago," which decreased slightly q/q, 2.1% y/y, 3.8% in two years, and 5.0% in three years.
Key Takeaway: While fewer respondents indicated that their bill is more than a year ago, Digitalsmiths predicts this trend to change in 2016, due to rate increase announcements from three of the top four U.S. Pay-TV providers in January 2016.*
*http://www.multichannel.com/news/distribution/cable-rates-rise-3-4-average-2016/396619
15.0%16.5%
20.2%
15.0%
24.4%
Q3 2015 Q4 2014 Q4 2013 Q4 2012
41.2% 40.6% 38.9% 39.2% 36.7%
39.4% 40.6% 41.5% 43.2% 44.4%
19.4% 18.8% 19.6% 17.6% 18.9%
-2.1% y/y, -3.8% over 2 years, -5.0% over 3 years
6
Q4 2015 VIDEO TRENDS REPORTThe State of Pay-TV
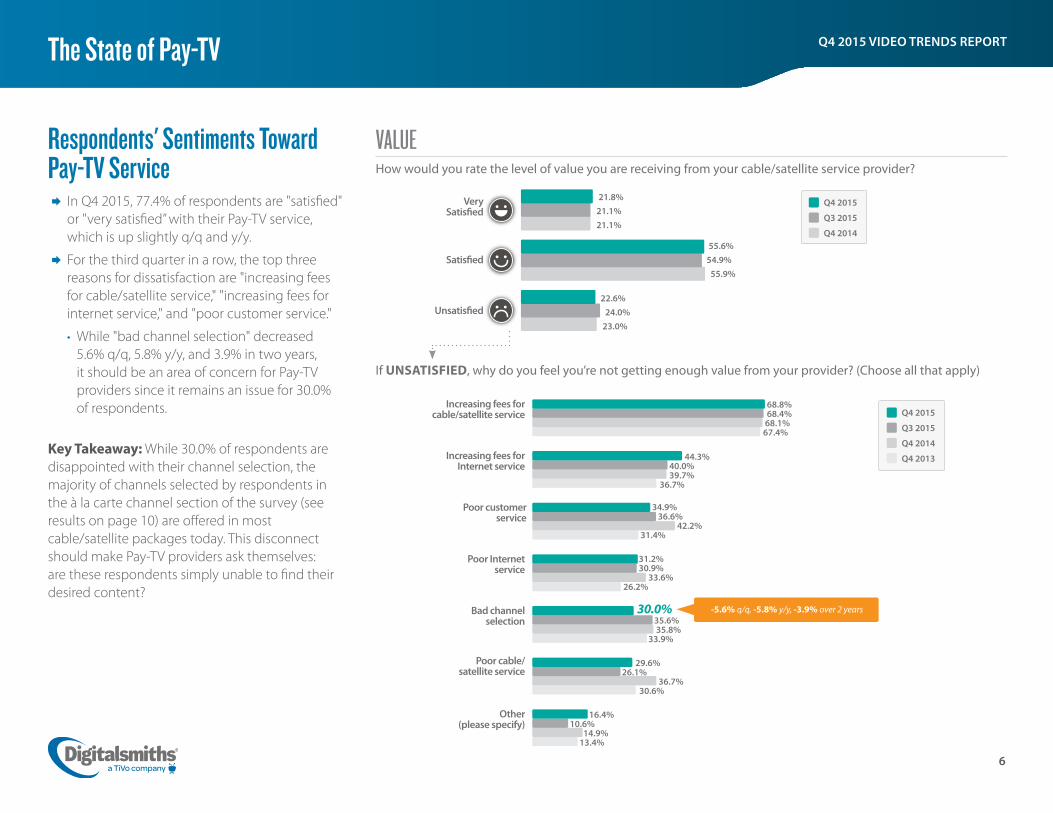
If UNSATISFIED, why do you feel you’re not getting enough value from your provider? (Choose all that apply)
Increasing fees for cable/satellite service
Increasing fees for Internet service
Poor cable/ satellite service
Poor Internet service
Bad channel selection
Poor customer service
Other (please specify)
VALUEHow would you rate the level of value you are receiving from your cable/satellite service provider?
Very Satisfied
Satisfied
Unsatisfied
21.8%21.1%
68.8% 68.4% 68.1% 67.4%
Respondents' Sentiments Toward Pay-TV Service
¨ In Q4 2015, 77.4% of respondents are "satisfied" or "very satisfied” with their Pay-TV service, which is up slightly q/q and y/y.
¨ For the third quarter in a row, the top three reasons for dissatisfaction are "increasing fees for cable/satellite service," "increasing fees for internet service," and "poor customer service."
• While "bad channel selection" decreased 5.6% q/q, 5.8% y/y, and 3.9% in two years, it should be an area of concern for Pay-TV providers since it remains an issue for 30.0% of respondents.
Key Takeaway: While 30.0% of respondents are disappointed with their channel selection, the majority of channels selected by respondents in the à la carte channel section of the survey (see results on page 10) are offered in most cable/satellite packages today. This disconnect should make Pay-TV providers ask themselves: are these respondents simply unable to find their desired content?
Q4 2015
Q3 2015
Q4 201421.1%
55.6%54.9%
55.9%
22.6%24.0%
23.0%
Q4 2015
Q3 2015
Q4 2014
Q4 2013 44.3% 40.0% 39.7% 36.7%
34.9% 36.6% 42.2% 31.4%
31.2% 30.9% 33.6% 26.2%
35.6% 35.8% 33.9%
29.6% 26.1% 36.7% 30.6%
16.4% 10.6% 14.9% 13.4%
-5.6% q/q, -5.8% y/y, -3.9% over 2 years30.0%

7
Q4 2015 VIDEO TRENDS REPORTThe State of Pay-TV
PREMIUM CHANNELSDo you pay for any of the following premium channels through your cable/satellite provider? (choose all that apply)
HBO
Showtime
The Movie Channel/ Network
Sports Package(s)
Cinemax
Starz
None
Other (please
specify)
22.8%
24.0%
15.9%
16.9%
14.6%
14.7%
12.0%
13.2%
9.8%
10.6%
9.1%
10.7%
61.3%
58.2%
3.0%
2.5%
Service Level Adjustments ¨ Similar to previous quarters, those who increased services (17.6%) and decreased services (17.1%) remain relatively the same q/q (see charts on page 8).
• Top Services Added: "Internet," "Premium Channels," and "High Definition (HD)."
• Top Services Cut: "Reduced level of cable/satellite service," "Premium Channels," and "Premium Sports Package(s)." "Premium Sports Package(s)" were cut at a higher rate than they were added.
• Premium Channels: 38.7% of respondents with Pay-TV service pay for premium channels, and the top channels were HBO, Showtime, and The Movie Channel.
– Growth of premium channels is flat q/q, but has decreased 3.1% y/y.
Key Takeaway: Neither premium channel adoption nor respondents who increased services have seen positive growth trends according to y/y and two-year trends. While these are only two metrics that contribute to increasing Average Revenue Per User (ARPU), Digitalsmiths believes that the more saturated subscribers are with their provider’s services, the less likely they are to leave. Therefore, Pay-TV providers should be looking for ways to increase saturation.
One tactic to improve adoption of premium channels, as highlighted in a recent article by Home Media Magazine, was Verizon Communications' program that allows FiOS TV subscribers a 48-hour free trial of a premium channel. Dubbed “Free View,” the program lets subscribers activate a premium channel to see if they like it. Offering a risk-free way to see what a channel has to offer, this tactic helps combat the ever-growing OTT threat.*
Another impressive tactic is Time Warner Cable's offering of a streaming only service on a Roku player in limited, trial markets. By leveraging outside technology to deliver its services to consumers who might already own, or are willing to buy a Roku player, use of existing devices can appeal to both consumers and Pay-TV providers. For consumers, it appeals to those who are tired of paying to lease equipment from their provider; for Pay-TV providers, it removes the need to send out a service truck for an install.
*http://www.homemediamagazine.com/cable/report-says-pay-tv-should-focus-content-recommendation-37498
38.7% pay for premium channels
-3.1% y/y
Q4 2015
Q4 2014

8
Q4 2015 VIDEO TRENDS REPORTThe State of Pay-TV
SERVICE ADJUSTMENTHave you adjusted your level of cable/satellite service in the last 12 months?
What service(s) did you CUT? (choose all that apply)
Q4 2015
What service(s) did you ADD? (choose all that apply)
Internet
Premium Channels (e.g. HBO, Cinemax, etc.)
High Definition (HD)
DVR
Phone
New/Upgraded equipment (e.g., DIRECTV Genie®
or DISH Hopper™)
Premium Sports Package(s)
Other (please specify)
47.3%
41.9%
16.5%
12.7%
12.7%
9.3%
8.1%
5.2%
5.7%
Q4 2015
Increased/added services
Stayed the same
Decreased/removed services
17.8%63.8%
Reduced level of cable/satellite service
Premium Channels (e.g. HBO, Cinemax, etc.)
Premium Sports Package(s)
DVR
Phone
Cut cable/satellite service totally
Internet
New/Upgraded equipment (e.g., DIRECTV Genie or DISH Hopper)
Other (please specify)
34.3%
Q4 2015
Q3 2015
Q4 2014
Q4 2013
18.4%
17.6%65.3%
17.1%
20.4%63.2%
16.4%
18.6%64.8%
16.6%
33.4%
29.0%
19.8%
15.4%
14.5%
14.5%
11.6%

9
Q4 2015 VIDEO TRENDS REPORTThe State of Pay-TV
AWARENESS OF OTT SERVICES Are you familiar with any of the below TV services? (choose all that apply)
Hulu
HBO NOW™
Showtime Subscription
CBS All Access™
Sling TV
PlayStation™ Vue
No, not familiar with these
51.0% 32.4% 18.6% 13.2% 11.4% 9.4% 38.7%
61.3% are aware of these services
-2.0% q/q
Q4 2015
Q3 2015 53.1% 32.4% 16.7% 11.9% 12.0% 8.9% 36.7%
Respondents' Sentiments on Pay-TV Skinny Bundles In Q4 2015, 73.6% of respondents would like to choose only the channels they want to watch. While skinny bundles are the new trend in TV packages, the amount of respondents who would like an à la carte channel option decreased for the fourth quarter in a row. The top five most desired channels among respondents were:
1. Discovery Channel 2. ABC
Additionally, the average price respondents want to pay for self-selected channels is $40.56 per month, or $3.63 per channel, per month.
Key Takeaway: With the introduction of numerous competitive OTT and skinny package services in recent months, it is not surprising that the number of respondents who want an à la carte Pay-TV solution continues to decline; however, 73.6% is still a large population of interested respondents. While new offerings such as Sling TV and Sony’s PlayStation Vue have introduced streaming of limited channels, almost all major Pay-TV providers have a package with 50-70 channels for roughly $49 or less. The question is, do consumers discover these packages through marketing efforts, or are Pay-TV providers using these packages to prevent churn? Although it’s too early to answer these questions with certainty, Digitalsmiths will continue to watch and report on this trend each quarter.
3. CBS 4. History 5. NBC
$10– $20
$21– $30
$31– $40
$41– $50
$51– $60
$61– $70
$71– $80 $81+
CHANNEL PACKAGESWhen purchasing cable/satellite service, you often choose from pre-set channel packages. Would you like the ability to make your own package by selecting ONLY the channels you WANT to watch?
IDEAL COST OF CHANNEL PACKAGEWhat is the MOST you would be willing to pay, per month, for the channels you selected?
79.4%
73.6%76.7%
22.3
%
Q4 2015
17.0
%
14.1
% 18.6
%
11.3
%
5.5% 6.4%
4.8%
Dollars Spent
YES
Q4 2015
Q3 2015
Q2 2015
Average Price: $40.56 per month | $3.63 per channel
Q1 2015 81.6%

10
Q4 2015 VIDEO TRENDS REPORT
DISCOVERY CHANNELABCCBS
HISTORYNBCA&E
NATIONAL GEOGRAPHIC CHANNELFOXHBOPBS
COMEDY CENTRALAMC
FOOD NETWORKTHE WEATHER CHANNEL
CNNANIMAL PLANET
TBSFX
TLCTNT
HGTVSHOWTIME
ESPNUSA NETWORK
SYFYBRAVO
LIFETIMEABC FAMILY
SPIKEDISNEY CHANNEL
CARTOON NETWORKTRAVEL CHANNEL
TCMHALLMARK CHANNEL
MSNBCFOX SPORTS 1
NBC SPORTS NETWORKNFL NETWORK
TV LANDNICKELODEON
E!MTV
FOX NEWS CHANNELTHE CW
TRUTVIFC
OWN (OPRAH WINFREY NETWORK)ADULT SWIM
OXYGENION
CMT (COUNTRY MUSIC CHANNEL)DISNEY JR.
VH1WGN AMERICAMLB NETWORK
NICK JR.ENCORE ACTION
WE TVBET
REELZFOX BUSINESS NETWORK
GOLF CHANNELTEENNICK
THE SPORTSMAN CHANNELQVCHSN
FUSEFYI
VELOCITYESQUIRE NETWORK
SPROUTFUSION
TENNIS CHANNELUNIVISION
OVATION TVTELEMUNDO
DISCOVERY CHANNELABCCBS
HISTORYNBCA&E
NATIONAL GEOGRAPHIC CHANNELFOXHBOPBS
COMEDY CENTRALAMC
FOOD NETWORKTHE WEATHER CHANNEL
CNNANIMAL PLANET
TBSFX
TLCTNT
61.3% 59.9% 56.8% 55.9% 55.3% 52.2% 49.4% 48.4% 48.0% 46.3% 44.1% 42.1% 41.8% 41.4% 40.4% 38.7% 38.4% 38.1%38.0%37.9%
The State of Pay-TV
,which channels would you be interested in including in your TV package? (choose all that apply)If YES
10% 20% 30% 40% 50% 60% 70% 80%
Q4 2015
CHANNEL PACKAGES
11
Q4 2015 VIDEO TRENDS REPORT
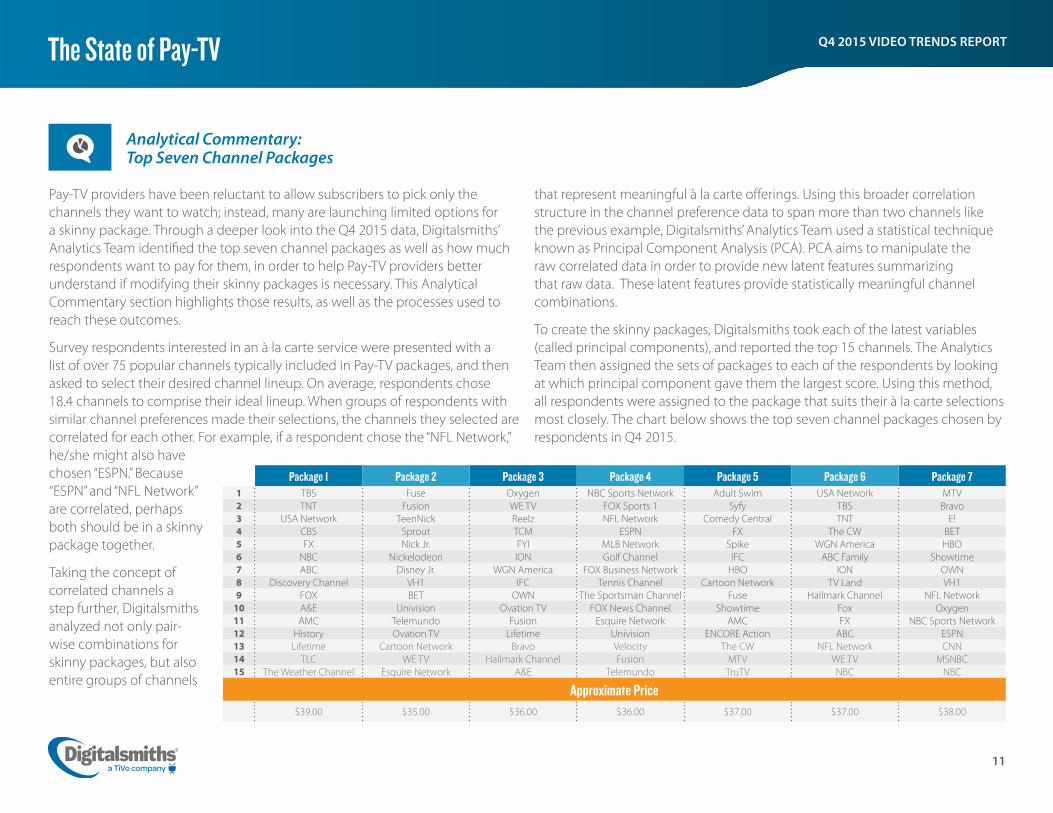
Package 1 Package 2 Package 3 Package 4 Package 5 Package 6 Package 71 TBS Fuse Oxygen NBC Sports Network Adult Swim USA Network MTV2 TNT Fusion WE TV FOX Sports 1 Syfy TBS Bravo3 USA Network TeenNick Reelz NFL Network Comedy Central TNT E!4 CBS Sprout TCM ESPN FX The CW BET5 FX Nick Jr. FYI MLB Network Spike WGN America HBO6 NBC Nickelodeon ION Golf Channel IFC ABC Family Showtime7 ABC Disney Jr. WGN America FOX Business Network HBO ION OWN8 Discovery Channel VH1 IFC Tennis Channel Cartoon Network TV Land VH19 FOX BET OWN The Sportsman Channel Fuse Hallmark Channel NFL Network
10 A&E Univision Ovation TV FOX News Channel Showtime Fox Oxygen11 AMC Telemundo Fusion Esquire Network AMC FX NBC Sports Network12 History Ovation TV Lifetime Univision ENCORE Action ABC ESPN13 Lifetime Cartoon Network Bravo Velocity The CW NFL Network CNN14 TLC WE TV Hallmark Channel Fusion MTV WE TV MSNBC15 The Weather Channel Esquire Network A&E Telemundo TruTV NBC NBC
Approximate Price$39.00 $35.00 $36.00 $36.00 $37.00 $37.00 $38.00
The State of Pay-TV
Analytical Commentary: Top Seven Channel Packages
Pay-TV providers have been reluctant to allow subscribers to pick only the channels they want to watch; instead, many are launching limited options for a skinny package. Through a deeper look into the Q4 2015 data, Digitalsmiths’ Analytics Team identified the top seven channel packages as well as how much respondents want to pay for them, in order to help Pay-TV providers better understand if modifying their skinny packages is necessary. This Analytical Commentary section highlights those results, as well as the processes used to reach these outcomes.
Survey respondents interested in an à la carte service were presented with a list of over 75 popular channels typically included in Pay-TV packages, and then asked to select their desired channel lineup. On average, respondents chose 18.4 channels to comprise their ideal lineup. When groups of respondents with similar channel preferences made their selections, the channels they selected are correlated for each other. For example, if a respondent chose the “NFL Network,” he/she might also have chosen “ESPN.” Because “ESPN” and “NFL Network” are correlated, perhaps both should be in a skinny package together.
Taking the concept of correlated channels a step further, Digitalsmiths analyzed not only pair-wise combinations for skinny packages, but also entire groups of channels
that represent meaningful à la carte offerings. Using this broader correlation structure in the channel preference data to span more than two channels like the previous example, Digitalsmiths’ Analytics Team used a statistical technique known as Principal Component Analysis (PCA). PCA aims to manipulate the raw correlated data in order to provide new latent features summarizing that raw data. These latent features provide statistically meaningful channel combinations.
To create the skinny packages, Digitalsmiths took each of the latest variables (called principal components), and reported the top 15 channels. The Analytics Team then assigned the sets of packages to each of the respondents by looking at which principal component gave them the largest score. Using this method, all respondents were assigned to the package that suits their à la carte selections most closely. The chart below shows the top seven channel packages chosen by respondents in Q4 2015.
12
Q4 2015 VIDEO TRENDS REPORTThe State of Pay-TV
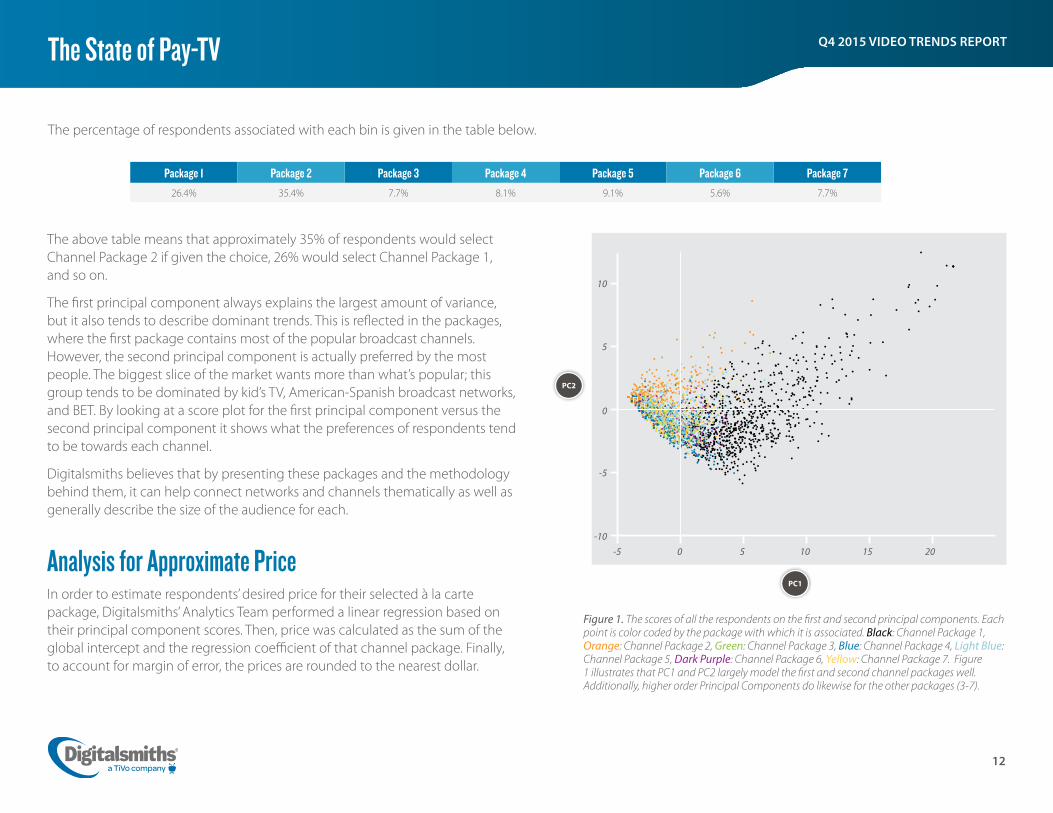
The percentage of respondents associated with each bin is given in the table below.
Package 1 Package 2 Package 3 Package 4 Package 5 Package 6 Package 7
26.4% 35.4% 7.7% 8.1% 9.1% 5.6% 7.7%
The above table means that approximately 35% of respondents would select Channel Package 2 if given the choice, 26% would select Channel Package 1, and so on.
The first principal component always explains the largest amount of variance, but it also tends to describe dominant trends. This is reflected in the packages, where the first package contains most of the popular broadcast channels. However, the second principal component is actually preferred by the most people. The biggest slice of the market wants more than what’s popular; this group tends to be dominated by kid’s TV, American-Spanish broadcast networks, and BET. By looking at a score plot for the first principal component versus the second principal component it shows what the preferences of respondents tend to be towards each channel.
Digitalsmiths believes that by presenting these packages and the methodology behind them, it can help connect networks and channels thematically as well as generally describe the size of the audience for each.
Analysis for Approximate Price In order to estimate respondents’ desired price for their selected à la carte package, Digitalsmiths’ Analytics Team performed a linear regression based on their principal component scores. Then, price was calculated as the sum of the global intercept and the regression coefficient of that channel package. Finally, to account for margin of error, the prices are rounded to the nearest dollar.
PC2
0
5
10
-5
0 5 10 15 20-10
-5
PC1
Figure 1. The scores of all the respondents on the first and second principal components. Each point is color coded by the package with which it is associated. Black: Channel Package 1, Orange: Channel Package 2, Green: Channel Package 3, Blue: Channel Package 4, Light Blue: Channel Package 5, Dark Purple: Channel Package 6, Yellow: Channel Package 7. Figure 1 illustrates that PC1 and PC2 largely model the first and second channel packages well. Additionally, higher order Principal Components do likewise for the other packages (3-7).

13
Q4 2015 VIDEO TRENDS REPORT
CHANNEL SURFINGOn average, how much time a day do you spend searching (channel surfing) or scrolling through the guide looking for something to watch?
TV VIEWINGOn average, how many hours a day do you watch TV?
23.8%
26.4%
16.6%
9.7%
6.2%
8.5%
8.8%
7.1%
20.1%
21.1%
16.5%
10.8%
15.6%
8.8%
<1 hour
1-2 hours
2-3 hours
3-4 hours
4-5 hours
5+ hours
Not on a regular basis
<5 minutes
5-10 minutes
10-20 minutes
20-30 minutes
30-40 minutes
40-50 minutes
60+ minutes
Not on a regular basis
Q4 2015
<1 hour
1-2 hours
2-3 hours
3-4 hours
4-5 hours
5+ hours
Not on a regular
basisQ4 2015
LIVE TV VIEWINGOn average, how much of your daily TV watching is live TV accessed from your channel guide (not DVR’d or recorded shows)?
RECORDED TV VIEWINGOn average, how much of your daily TV viewing time is spent watching shows that you have recorded/DVR’d?
43.8%
24.6%
12.1%
4.9%
2.6%
3.2%
8.8% Q4 2015
<1 hour
1-2 hours
2-3 hours
3-4 hours
4-5 hours
5+ hours
Not on a regular
basis
Q4 2015
29.8%
29.7%
16.0%
7.6%
3.3%
1.7%
3.1%
8.8%
TV Viewing Habits While the bulk of the survey aims to understand respondents’ sentiments toward their Pay-TV providers, as well as identify emerging features and services, it is important to keep a pulse on respondents’ overall TV viewing behaviors. According to the Q4 2015 survey results, per day:
¨ 41.2% of respondents watch 1-3 hours of TV.
¨ 50.2% watch two hours or less of live content.
¨ 68.4% watch two hours or less of DVR'd content.
¨ 45.7% of respondents spend 5-20 minutes channel surfing to find something to watch.
14
Q4 2015 VIDEO TRENDS REPORTTV Viewing Habits
1 2 3 4 5 6 7 8 9 10 11 12 13 14 15 16 17 18 19 20+
Number of Channels
3.4%
4.3%
6.6%
9.6%
16.3
%
10.1
%
5.6% 5.9%
1.9%
17.7
%
0.7%
3.9%
0.5% 0.
9%
5.2%
0.4%
0.4%
0.5%
5.8%
0.3%
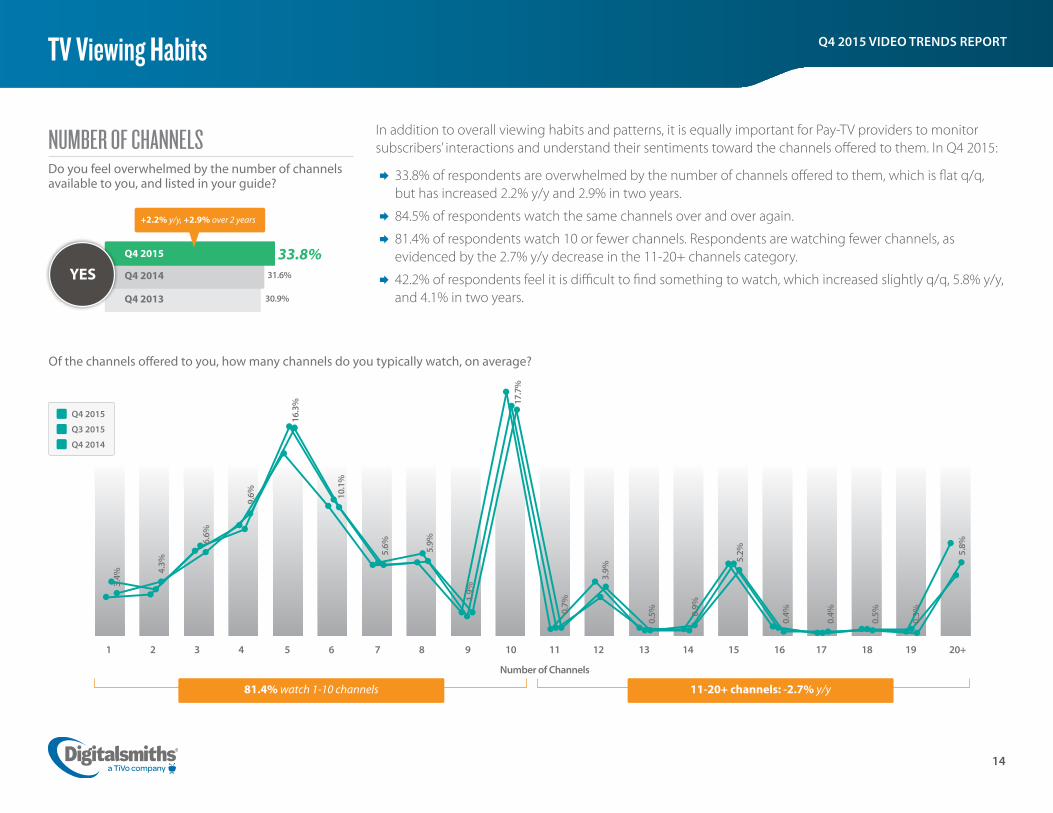
81.4% watch 1-10 channels
Of the channels offered to you, how many channels do you typically watch, on average?
Q4 2015
Q3 2015
Q4 2014
YES 31.6%
Q4 2015
Q4 2014
NUMBER OF CHANNELSDo you feel overwhelmed by the number of channels available to you, and listed in your guide?
+2.2% y/y, +2.9% over 2 years
33.8%
30.9%Q4 2013
11-20+ channels: -2.7% y/y
In addition to overall viewing habits and patterns, it is equally important for Pay-TV providers to monitor subscribers’ interactions and understand their sentiments toward the channels offered to them. In Q4 2015:
¨ 33.8% of respondents are overwhelmed by the number of channels offered to them, which is flat q/q, but has increased 2.2% y/y and 2.9% in two years.
¨ 84.5% of respondents watch the same channels over and over again.
¨ 81.4% of respondents watch 10 or fewer channels. Respondents are watching fewer channels, as evidenced by the 2.7% y/y decrease in the 11-20+ channels category.
¨ 42.2% of respondents feel it is difficult to find something to watch, which increased slightly q/q, 5.8% y/y, and 4.1% in two years.

15
Q4 2015 VIDEO TRENDS REPORTTV Viewing Habits
YES
Q4 2015
VARIETY OF CHANNELSDo you feel you watch the same channels over and over again?
84.5%
NO36.4%
41.8%
EASY TO DISCOVER CONTENTDo you feel it is easy to find something you “want” to watch on TV?
42.2%
-5.8% y/y, -4.1% over 2 years
-3.7% over 2 years
When too many channels are combined with the inability to find something to watch, a better experience is needed. A recent white paper released by Digitalsmiths titled, The War Between OTT and Pay-TV: Best Practices for Pay-TV Providers to Win the War, discusses how and why OTT experiences are more enticing than Pay-TV experiences. The paper also reveals the behind-the-scenes technology efforts and budget that go into powering Netflix’s next-gen, personalized video experiences.
Because many OTT streaming services are largely carousel-driven, Digitalsmiths added a new question on this topic in the Q4 2015 survey. According to respondents, 56.6% would like their
Q4 2014 85.1%
Q4 2015
Q3 2015
Q4 2014
Q4 2013 38.1%
Analytical Commentary: The Cure for Cord-Cutters: Content Discovery & Carousels
Similar to Digitalsmiths’ previous survey results, a key predictor of whether or not a Pay-TV subscriber plans to cut their cable/satellite service is whether or not they consider it easy to find something to watch. New to the Q4 2015 survey was a question asking respondents if they would prefer a carousel-like experience rather than the traditional grid offered by Pay-TV today. After a deeper analysis of respondents' answers to the questions mentioned previously, those who struggle to find content and those most at risk for churn desire a carousel feature – disproportionately more so than other respondents.*
*Both these relationships are statistically significant at a confidence level of 99.9%, using a Fisher’s Exact test.
CHANNEL GUIDEWould you like your channel guide to be changed, so that it’s sorted or categorized into groups/lists of TV shows or movies? For example, “What is on Now”, “Because You Watched This,” “Live Sports On Now.”
YES, I would like my guide to be changed.
YES, but I would like access to both types of guides (channel guide like I have today AND groups/categories of shows).
NO, I am not interested in my guide changing.
43.4%
Q4 2015
37.6%
19.0%
Pay-TV provider to deliver content in a carousel format, such as “What is on now” or “Because you watched.” Although 37.6% of respondents would also like to retain access to the traditional grid, providing an intuitive user experience could convert viewers to solely preferring a carousel model. With more than half of respondents with cable/satellite service open to trying a more content discovery-focused, personalized carousel experience, Pay-TV providers should act quickly on these trends.
Q4 2013 88.2%

16
Q4 2015 VIDEO TRENDS REPORT
The good news is 70.4% of respondents find their PVOD catalog easy to navigate, an increase of 4.4% q/q, 21.6% y/y, and 22.1% over two years.
Revenue-Generating Pay-TV ContentPaid Video-on-Demand (PVOD)Offerings In Q4 2015, 30.0% of respondents ordered one or more PVOD rentals from their Pay-TV provider, an increase of 2.8% over two years. The bulk of respondents (23.5%) order 1-3 PVOD rentals a month.
PVOD CATALOG DISCOVERYDo you feel it’s easy to find a movie you will enjoy in the video-on-demand catalog provided by your cable/satellite provider? (accessed from your guide)
EASY
+4.4% q/q, +21.6% y/y, +22.1% over 2 years
0
1
2
3
4
5
6+
PVOD PURCHASES PER MONTHOn average, how many video-on-demand (movies offered through your provider) purchases does your household make each month? (Movies purchased from on-demand stations provided by your cable/satellite provider. Does NOT include Netflix, Redbox, iTunes®, etc.)
Q4 2015
Q4 2013
70.0% 72.8%
13.2% 12.5%
7.3% 6.1%
3.0% 3.2%
2.6% 2.1%
1.4% 1.3%
2.5% 2.0%
30.0% of respondents order 1 or more VOD rentals
+2.8% over 2 years
Q4 2015Q3 2015Q4 2014Q4 2013
48.3% 48.8%
66.0%
70.4%

17
Q4 2015 VIDEO TRENDS REPORT
11.4%
Revenue-Generating Pay-TV Content
PAY-PER-VIEW EVENTSDo you ever rent Pay-Per-View events from within your cable/satellite service? For example, boxing events, or UFC fights. (NOT MOVIES)
Pay-Per-View (PPV) Purchases In Q4 2015, 11.4% of respondents rented PPV events, a 1.5% increase q/q. Of those respondents, 76.7% order 1-4 PPV events each year, and the largest group (23.3%) order only one per year. However, respondents did order more than in previous quarters, since the 6-11+ purchases category grew 3.7% q/q.
The top three ways in which respondents are made aware of PPV events are by "friends/word of mouth," "the TV shows you watch promote it," and "ads in the channel guide." There were significant q/q increases for many of the answer choices:
¨ “Friends/Word of mouth” (+5.3%)
¨ “Ads in the channel guide” (+3.8%)
¨ “Promotions included in your bill” (+2.9%)
¨ “Email promotions about the event” (+4.1%)
Key Takeaway: Digitalsmiths believes Pay-TV providers could increase the number of homes ordering PPV events by leveraging viewer history and marketing PPV events to targeted audiences based on various data points such as genre. For example, a promotion to rent the music events of Rihanna or Linkin Park should be delivered to subscribers who have previously watched the Grammy Awards® or the MTV Video Music Awards®. This ensures the right promotion is placed in front of the right viewers (i.e., music lovers in this example).
YES9.9%
Q4 2015
Q3 2015
how many Pay-Per-View events do you purchase each year? For example, boxing events, or UFC fights. (NOT MOVIES)
If YES
Purchases
1 2 3 4 5 6 7 8 9 10 11+
76.7% order 1-4 events
23.3
%
21.3
%
16.6
%
15.5
%
5.7% 8.
1%
2.0%
1.7%
1.4%
1.4% 3.
0%
+3.7% q/q
Q4 2015
Q3 2015
How are you made aware of, or hear about upcoming Pay-Per-View events? (choose all that apply)
?
Friends/Word of mouth
The TV shows you watch promote it
Ads in the channel
guide
Promotions included in
your bill
Email promotions
about the event
Other (please
specify)
52.0%
44.4%
29.3%
14.3%
10.8%
7.7%
46.7%
43.9%
33.1%
17.2%
14.9%
3.0% Q4 2015
Q3 2015
+5.3% q/q
+3.8% q/q
+2.9% q/q
+4.1% q/q
+1.5% q/q

18
Q4 2015 VIDEO TRENDS REPORT
Over-the-Top Trends & Cord-Cheating Cord-cheating, a trend Digitalsmiths began tracking in Q2 2013, refers to cable/satellite subscribers who seek on-demand video content from third-party and OTT services as an alternative to their Pay-TV provider’s offerings. Cord-cheating spans a variety of delivery models, including streaming subscription services, or SVOD, such as Netflix and Hulu, as well as pay-per-rental services such as Redbox™ kiosks and iTunes®.
In Q4 2015, 62.0% of respondents with Pay-TV service fall into what Digitalsmiths coined as “cord-cheaters.” Additionally, of the respondents who are cord-cheaters:
¨ 54.6% use a monthly OTT subscription service, a slight decline q/q.
¨ 33.3% use a pay-per-rental service, a decrease of 2.0% q/q.
¨ 25.9% use both OTT subscription and pay-per-rental services, a decrease of 1.2% q/q.
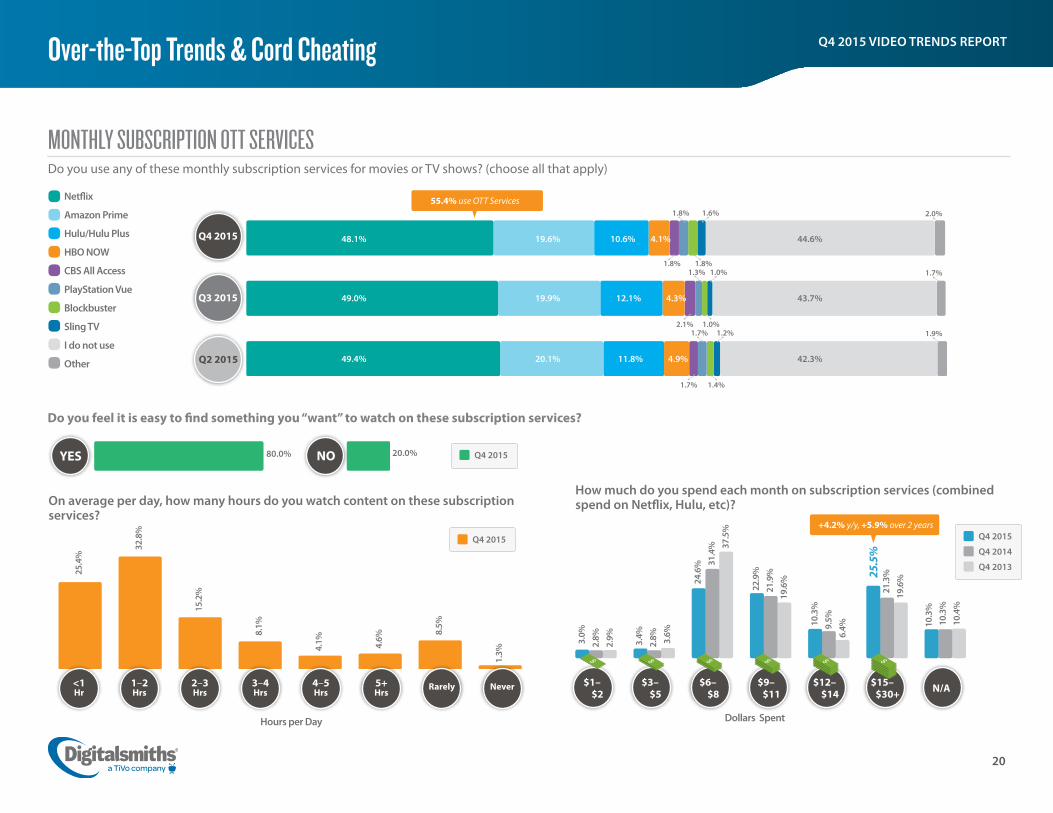
Below is a breakdown of all survey respondents’ adoption, usage, and monthly spend for subscription OTT services (see charts on page 20). In Q4 2015:
¨ 55.4% of all survey respondents have a monthly subscription to an OTT service, which decreased slightly q/q.
• Of those respondents who are cord-cutters or cord-nevers, 59.1% use a monthly subscription service. Again, Netflix (53.0%) and Hulu (13.4%) are the top OTT services used by non-Pay-TV subscribers.
¨ The top three services for all respondents who use these OTT services are Netflix, Amazon Prime® (free streaming of TV shows/movies with Amazon Prime membership), and Hulu.
• The number of respondents who subscribed to Netflix declined for three quarters in a row, but grew 1.7% y/y and 9.1% over two years.
• Amazon Prime increased 2.9% y/y and 8.0% over two years.
• While y/y growth was minimal for Hulu, it did increase 2.9% over two years.
¨ 57.8% of respondents spend $6-14 a month on OTT subscription services.
• Respondents are spending more, since those who spend $15-30+ increased 4.2% y/y and 5.9% over two years.
• 90.2% of respondents who subscribe to monthly OTT subscription services use them on a daily basis.
– The bulk of respondents (58.2%) use these services two hours or less a day.
• 80.0% of OTT subscribers feel it is easy to find something to watch.
Below is a breakdown of all survey respondents’ adoption, usage, and monthly spend for other OTT and third-party pay-per-rental services (see charts on page 19). In Q4 2015:
¨ 34.4% of respondents use a pay-per-rental service such as Amazon Instant Video™, iTunes, Redbox kiosks, etc. Adoption of these services has decreased 1.7% q/q, 3.9% over Q2 2015, and 4.8% over Q1 2015.
• For the fourth quarter in a row, Redbox declined 2.7% q/q, 5.0% over Q2 2015, and 5.3% over Q1 2015.
• Amazon Instant Video increased slightly q/q, 6.2% y/y, and 7.7% over two years.
• iTunes® is flat q/q, with slight decreases over Q2 2015 and Q1 2015 results.
¨ 35.8% of respondents spend $3-11 per month on these services.
• However, 31.6% of respondents do not use these services on a monthly basis, and that category grew 3.8% q/q, 10.4% y/y, and 13.9% over two years.
¨ 51.5% of respondents who use these services watch five hours or less per week – but weekly view time of these services declined 3.3% q/q and 11.4% y/y.

19
Q4 2015 VIDEO TRENDS REPORTOver-the-Top Trends & Cord Cheating
PAY-PER-RENTAL SERVICESDo you rent or purchase movies on Amazon Prime Instant Video, Best Buy’s CinemaNow, iTunes, Redbox kiosks, Vudu? (choose all that apply)
16.2% 13.1% 7.7% 4.9% 3.1% 65.6%
Amazon Instant Video
Redbox Kiosk (at stores)
iTunes
Google Play
YouTube Movies
Vudu
Best Buy’s CinemaNow
Flixster
I do not use these
Other
2.1%
1.4% 2.2%
34.4% use these pay-per-rental services
How much do you spend per month renting movies from these pay-per-rental services?On average, how many hours per week do you watch content on these pay-per-rental services?
Hours per Week
1.0%
Dollars Spent
$1– $2
$3– $5
$6– $8
$9– $11
$12– $14
$15– $30+ N/A
14.
6%
13.5
%
14.
6%
1
7.8%
17.3
%
19
.4%
23.0
%
2
3.9%
11.0
%
12
.9%
1
2.2%
1
5.7%
7.5%
8
.7%
8
.9%
9.9
%
5.7%
6
.6%
6
.4%
5.
1% 1
2.3%
1
1.1%
13.
7%
9.9
%
31.
6%
27.
8%
2
1.2%
17
.7%
Q4 2015
Q3 2015
Q4 2014
Q4 2013
<1 Hr
1–5 Hrs
5–10 Hrs
10–15 Hrs
15–20 Hrs
20+ Hrs
Rarely Never
20.3
%
2
2.4%
20
.0%
31.2
%
34.
6%
37
.5%
6.2%
5.
9%
9.7
%
3.6%
3.
3%
4
.4%
2.4%
3.
0%
3.0%
3.5
%
1.3%
4.0
%
2
5.5%
2
3.5%
17
.7%
7
.3%
6.0
%
3.7%
Q4 2015
Q3 2015
Q4 2014
Q4 2015
Q3 2015
Q2 2015
Q1 2015
15.4% 15.8% 7.7% 4.7% 2.3% 63.9%
1.6%
0.8% 1.5%
1.0%
15.6% 18.1% 9.3% 4.7% 3.3% 61.7%
2.1%
1.2% 1.4%
15.8% 18.4% 9.0% 5.3% 2.6% 60.8%
2.7%
1.1% 1.9%
-1.7% q/q, -3.9% over 2 quarters, -4.8% over 3 quarters
35.8% spend $3-$11 per monthWeekly View Time: -3.3% q/q, -11.4% y/y
20
Q4 2015 VIDEO TRENDS REPORTOver-the-Top Trends & Cord Cheating
48.1% 19.6% 10.6% 4.1% 44.6%
1.8%
1.8% 2.0%
Netflix
Amazon Prime
Hulu/Hulu Plus
HBO NOW
CBS All Access
PlayStation Vue
Blockbuster
Sling TV
I do not use
Other
1.8%
1.6%
MONTHLY SUBSCRIPTION OTT SERVICES Do you use any of these monthly subscription services for movies or TV shows? (choose all that apply)
How much do you spend each month on subscription services (combined spend on Netflix, Hulu, etc)?
Dollars Spent
$1– $2
$3– $5
$6– $8
$9– $11
$12– $14
$15– $30+ N/A
3.0
%
2.8%
2.
9%
Q4 2015
Q4 2014
Q4 2013
25.5
%
+4.2% y/y, +5.9% over 2 years
On average per day, how many hours do you watch content on these subscription services?
<1 Hr
1–2 Hrs
2–3 Hrs
3–4 Hrs
4–5 Hrs
5+ Hrs
Rarely Never
Q4 2015
25.4
%
Hours per Day
Q4 2015NOYES
Do you feel it is easy to find something you “want” to watch on these subscription services?
80.0% 20.0%
3.4
%
2.8%
3
.6%
24.6
%
31.
4%
3
7.5%
2
2.9%
2
1.9%
19.
6%
1
0.3%
9.5
%
6.4%
21
.3%
19.
6%
10.
3%
10.3
%
10.4
%
32.8
%
15.2
%
8.1%
4.1% 4.6%
8.5%
1.3%
55.4% use OTT Services
Q4 2015
Q3 2015
Q2 2015
49.0% 19.9% 12.1% 4.3% 43.7%
1.3% 1.7%1.0%
2.1% 1.0%
49.4% 20.1% 11.8% 4.9% 42.3%
1.7% 1.9%1.2%
1.7% 1.4%

21
Q4 2015 VIDEO TRENDS REPORT
?
Over-the-Top Trends & Cord Cheating
Netflix’s Q4 earnings report shows they added 1.56 million net new subscribers in Q4 2015, which is less than the 1.65 they projected in its Q3 newsletter to its shareholders. Digitalsmiths’ survey results show a similar trend, with Netflix subscriptions declining just shy of 1.0% from Q3 2015 to Q4 2015. Hulu subscriptions were also down 1.5% q/q. Are OTT SVOD services feeling the pain of more competition? While Netflix, Hulu, and Amazon Prime have been around for some time, an emerging threat comes from services such as CBS All Access and HBO Now, who recently announced that it reached 800,000 paid subscriptions at the eight-month mark*. While Netflix holds almost a 40% market share in the United States, the pace at which Netflix has grown could be difficult to sustain.
The Enticement to Cord-Cheaters For the eleventh quarter in a row, dating back to the Q2 2013 survey, the top three reasons for using both OTT and pay-per-rental services are "convenience," "it’s cheaper," and "the ability to watch certain TV shows and whole seasons." The two categories that grew the most were:
¨ “Ability to watch TV/movies on your iPad®/tablet”: 27.8%, increased 1.2% q/q, 3.5% y/y, and 6.4% over two years.
¨ “Ability to watch TV/movies on your Smartphone”: 20.5%, increased 2.3% q/q, 4.7% y/y, and 7.8% over two years.
WHY USE OTT SERVICESWhy do you use these 3rd party rental and/or monthly subscription services such as Amazon, iTunes, Netflix, Vudu, CinemaNow, Blockbuster Online, Redbox, YouTube? (choose all that apply)
56.5% 56.9% 57.0% 59.2%
Cheaper
Ability to watch certain TV shows & whole seasons
Convenience
Better selection
Easier to find what you’re looking for
Ability to watch on iPad®/Tablet
No cable/satellite services
Ability to watch on smartphone
Other*http://www.broadcastingcable.com/news/programming/hbo-now-reports-800000-paid-subscribers/153709
46.5% 49.1% 47.3% 50.1%
43.6% 45.3% 43.0% 38.5%
35.6% 37.8% 31.3% 35.6%
29.2% 32.0% 28.3% 29.6%
27.8% 26.6% 24.3% 21.4%
20.5% 18.2% 15.8% 12.7%
12.8% 12.8% 14.0% 13.1%
8.1% 7.2% 5.4% 4.8%
Q4 2015
Q3 2015
Q4 2014
Q4 2013
22
Q4 2015 VIDEO TRENDS REPORTOver-the-Top Trends & Cord Cheating
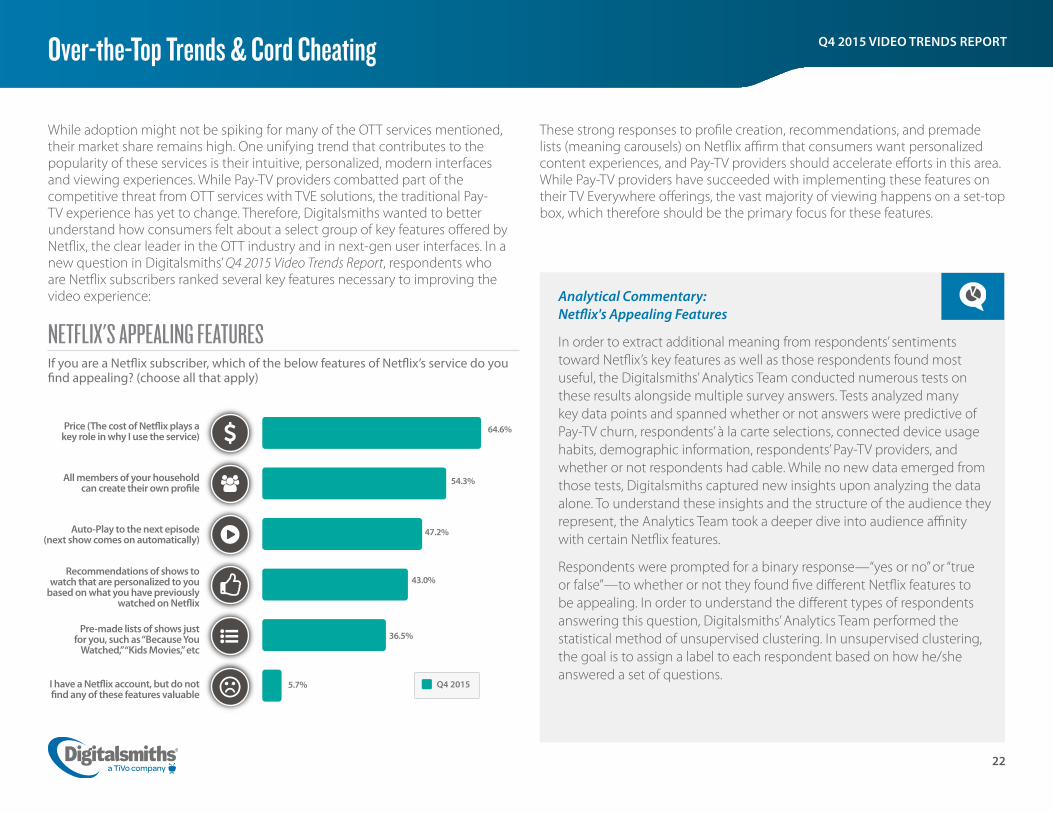
While adoption might not be spiking for many of the OTT services mentioned, their market share remains high. One unifying trend that contributes to the popularity of these services is their intuitive, personalized, modern interfaces and viewing experiences. While Pay-TV providers combatted part of the competitive threat from OTT services with TVE solutions, the traditional Pay-TV experience has yet to change. Therefore, Digitalsmiths wanted to better understand how consumers felt about a select group of key features offered by Netflix, the clear leader in the OTT industry and in next-gen user interfaces. In a new question in Digitalsmiths’ Q4 2015 Video Trends Report, respondents who are Netflix subscribers ranked several key features necessary to improving the video experience:
NETFLIX'S APPEALING FEATURES If you are a Netflix subscriber, which of the below features of Netflix’s service do you find appealing? (choose all that apply)
Q4 2015
64.6%Price (The cost of Netflix plays a key role in why I use the service)
Auto-Play to the next episode (next show comes on automatically)
All members of your household can create their own profile
Recommendations of shows to watch that are personalized to you
based on what you have previously watched on Netflix
Pre-made lists of shows just for you, such as “Because You
Watched,” “Kids Movies,” etc
I have a Netflix account, but do not find any of these features valuable
54.3%
47.2%
43.0%
36.5%
5.7%
These strong responses to profile creation, recommendations, and premade lists (meaning carousels) on Netflix affirm that consumers want personalized content experiences, and Pay-TV providers should accelerate efforts in this area. While Pay-TV providers have succeeded with implementing these features on their TV Everywhere offerings, the vast majority of viewing happens on a set-top box, which therefore should be the primary focus for these features.
Analytical Commentary: Netflix's Appealing Features
In order to extract additional meaning from respondents’ sentiments toward Netflix’s key features as well as those respondents found most useful, the Digitalsmiths’ Analytics Team conducted numerous tests on these results alongside multiple survey answers. Tests analyzed many key data points and spanned whether or not answers were predictive of Pay-TV churn, respondents’ à la carte selections, connected device usage habits, demographic information, respondents’ Pay-TV providers, and whether or not respondents had cable. While no new data emerged from those tests, Digitalsmiths captured new insights upon analyzing the data alone. To understand these insights and the structure of the audience they represent, the Analytics Team took a deeper dive into audience affinity with certain Netflix features.
Respondents were prompted for a binary response—“yes or no” or “true or false”—to whether or not they found five different Netflix features to be appealing. In order to understand the different types of respondents answering this question, Digitalsmiths’ Analytics Team performed the statistical method of unsupervised clustering. In unsupervised clustering, the goal is to assign a label to each respondent based on how he/she answered a set of questions.

23
Q4 2015 VIDEO TRENDS REPORT
Specific to Digitalsmiths’ question on Netflix’s features, it is unclear how many groups the respondents who answered might fall into. This is because when computing five answer choices with two possible values each, the total number of preferences yields 32 permutations. (To put it another way, there are 25=32 ways to answer the question.) However, to have 32 types of preferences is unrealistic. Instead, Digitalsmiths evaluated how many groups should exist using the gap statistic, which is essentially the ratio of what the sum of squared errors of the clustering is, to what it should be if there was no cluster structure to the data (i.e. if it was randomly distributed). By looking at the first local minimum of our gap statistic using K-means clustering, Digitalsmiths’ team designated seven groups. In order to label them, this analysis looked at the frequency with which each group responded to each answer choice.
Group Label% of
RespondentsAvg #
of features
All members of your household can create their
own profile
Price (The cost of
Netflix plays a key role in why I use the service)
Auto-Play to the next episode (next
show comes on automatically)
Pre-made lists of shows just
for you, such as "Because You
Watched," "Kids Movies," etc
Recommendations of shows to watch that
are personalized to you based on what you have
previously watched on Netflix
Netflix is low cost 17.9% 1.6 16.1% 90.4% 8.4% 0.0% 49.0%
Likes everything about Netflix 27.1% 4.7 82.0% 94.7% 100.0% 100.0% 100.0%
Knows the content they want 25.2% 2.8 84.2% 89.1% 77.7% 7.6% 21.0%
Likes Netflix for content discovery only 8.3% 3.3 59.5% 81.0% 0.0% 100.0% 86.0%
Likes Netflix’s profiles 9.8% 1.1 93.0% 0.0% 0.0% 4.9% 6.3%
Enjoys certain functionality 6.3% 2.0 9.8% 25.0% 82.6% 68.5% 9.8%
Doesn’t find anything interesting, from what
survey asked 5.4% 0.0 0.0% 0.0% 0.0% 0.0% 0.0%
Over-the-Top Trends & Cord Cheating
Analytical Commentary: Netflix's Appealing Features, continued
The results prove the plurality of respondents find all of Netflix’s features appealing. Additionally, many respondents are interested in more than one of Netflix’s features. Specifically, 35.4% of respondents, the combination of two groups that have 27.1% and 8.3% of the population, are interested in content discovery, whereas 25.2% know what they want to watch and want to get to it quickly. If getting to desired content quickly is a priority, the content should be surfaced as rapidly as possible. While the “Enjoys Certain Functionality” group is interesting, as it finds content organization desirable through “Pre-made lists of shows just for you such as Because You Watched, Kids Movies, etc." and “Auto-Play to the next episode,” this category may not be quite ready for fully personalized recommendations.
Note: The answer choice, “Doesn’t find anything interesting, from what the survey asked” counted as a feature which is why the last column average for a number of features is 0.0%.
Affinity Toward Netflix's Features
24
Q4 2015 VIDEO TRENDS REPORTOver-the-Top Trends & Cord Cheating
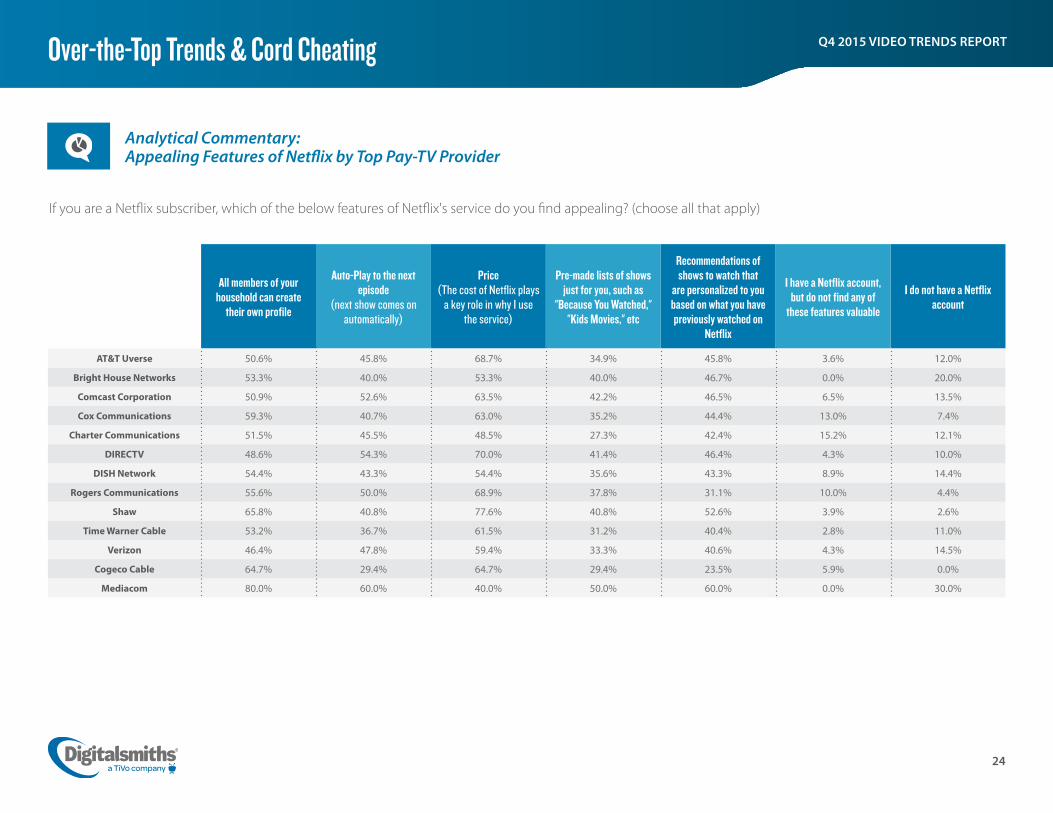
Analytical Commentary: Appealing Features of Netflix by Top Pay-TV Provider
All members of your household can create
their own profile
Auto-Play to the next episode
(next show comes on automatically)
Price (The cost of Netflix plays
a key role in why I use the service)
Pre-made lists of shows just for you, such as
"Because You Watched," "Kids Movies," etc
Recommendations of shows to watch that
are personalized to you based on what you have previously watched on
Netflix
I have a Netflix account, but do not find any of
these features valuable
I do not have a Netflix account
AT&T Uverse 50.6% 45.8% 68.7% 34.9% 45.8% 3.6% 12.0%
Bright House Networks 53.3% 40.0% 53.3% 40.0% 46.7% 0.0% 20.0%
Comcast Corporation 50.9% 52.6% 63.5% 42.2% 46.5% 6.5% 13.5%
Cox Communications 59.3% 40.7% 63.0% 35.2% 44.4% 13.0% 7.4%
Charter Communications 51.5% 45.5% 48.5% 27.3% 42.4% 15.2% 12.1%
DIRECTV 48.6% 54.3% 70.0% 41.4% 46.4% 4.3% 10.0%
DISH Network 54.4% 43.3% 54.4% 35.6% 43.3% 8.9% 14.4%
Rogers Communications 55.6% 50.0% 68.9% 37.8% 31.1% 10.0% 4.4%
Shaw 65.8% 40.8% 77.6% 40.8% 52.6% 3.9% 2.6%
Time Warner Cable 53.2% 36.7% 61.5% 31.2% 40.4% 2.8% 11.0%
Verizon 46.4% 47.8% 59.4% 33.3% 40.6% 4.3% 14.5%
Cogeco Cable 64.7% 29.4% 64.7% 29.4% 23.5% 5.9% 0.0%
Mediacom 80.0% 60.0% 40.0% 50.0% 60.0% 0.0% 30.0%
If you are a Netflix subscriber, which of the below features of Netflix's service do you find appealing? (choose all that apply)
25
Q4 2015 VIDEO TRENDS REPORT
YES, I own a smartphone
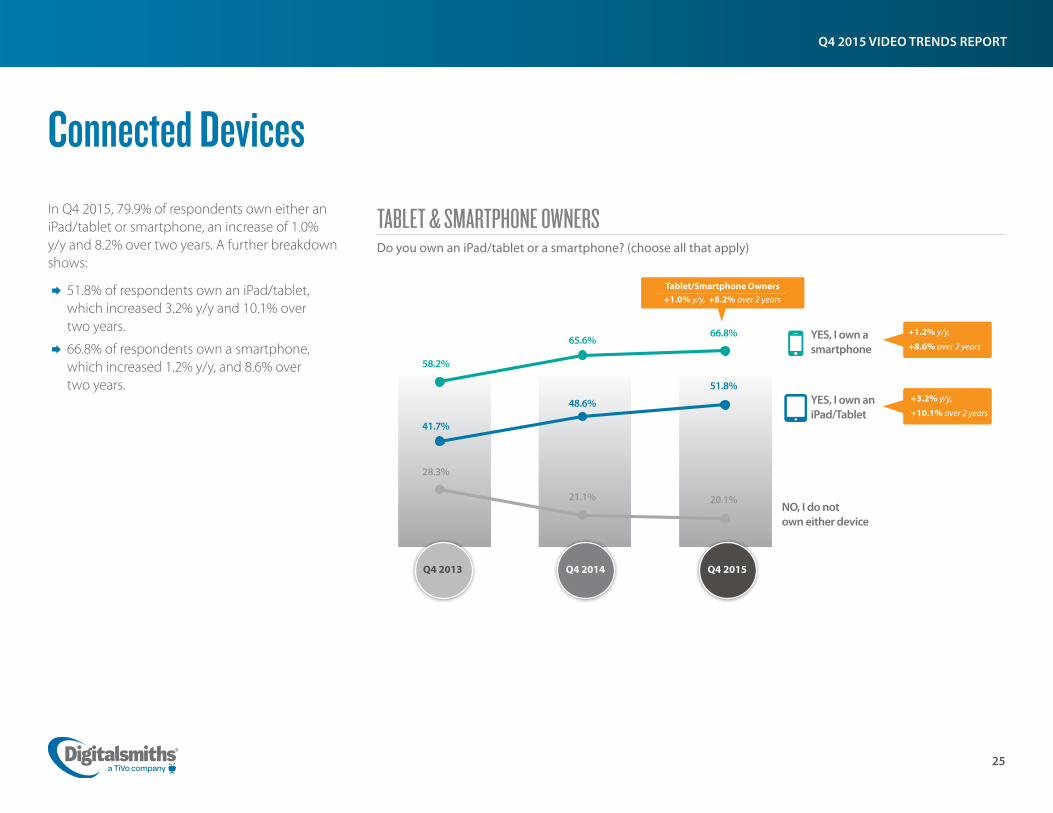
TABLET & SMARTPHONE OWNERSDo you own an iPad/tablet or a smartphone? (choose all that apply)
Connected Devices In Q4 2015, 79.9% of respondents own either an iPad/tablet or smartphone, an increase of 1.0% y/y and 8.2% over two years. A further breakdown shows:
¨ 51.8% of respondents own an iPad/tablet, which increased 3.2% y/y and 10.1% over two years.
¨ 66.8% of respondents own a smartphone, which increased 1.2% y/y, and 8.6% over two years.
NO, I do not own either device
+1.2% y/y,
+8.6% over 2 years
Q4 2015Q4 2014Q4 2013
66.8%
YES, I own an iPad/Tablet
51.8%
20.1%
65.6%
48.6%
21.1%
58.2%
41.7%
28.3%
Tablet/Smartphone Owners +1.0% y/y, +8.2% over 2 years
+3.2% y/y,
+10.1% over 2 years

26
Q4 2015 VIDEO TRENDS REPORT
VIDEO CONTENT ON IPADS/TABLETSDo you watch any of the following video content on your iPad/tablet? (choose all that apply)
iPad/Tablets ¨ Of those respondents who own an iPad/tablet, 37.1% watch video content on their device.
¨ The top three pieces of content watched are "movies," "episodic reruns of TV shows/previous seasons of TV shows," and "TV show and/or movie previews/trailers."
¨ Of those who watch video on their iPad, 90.0% of respondents do so on a weekly basis, and half of those (50.6%) watch two hours or less per week.
• However, overall respondents are watching more content than ever on their iPads since the “1-5+ hours a week” category increased 2.2% q/q, 13.2% y/y, and 17.7% over two years.
On average per week, how often do you watch TV shows, movies, or video content on your iPad/tablet?
RarelyNever 1–2>1 2–3 4–53–4 5+
Hours per Week
1.4%
1.
1%
7
.0%
8
.3%
+2.2% q/q, +13.2% y/y, +17.7% over 2 years
8.6
%
7.8
%
14.1
%
1
5.5%
26.2
%
2
9.5%
2
8.3%
30.
1%
2
4.4%
2
5.8%
21.
6%
18.7
%
15
.3%
1
4.2%
11
.7%
10
.6%
8
.9%
9
.1%
6.
7%
7.0%
6
.2%
4.9
%
4.8%
3.
5% 9
.0%
7.6
%
5.8%
6.3
%
Q4 2015
Movies
Reruns of TV Shows
TV/Movie Previews
News
Sports Clips
Live TV Shows
Sports Events
I own an iPad/tablet, but do not watch TV/Movies on it
I do not own an iPad/tablet
24.5%
14.8%
13.1%
11.7%
9.5%7.2%6.6%
30.2%
32.7%
Connected Devices
Q4 2015
Q3 2015
Q4 2014
Q4 2013

27
Q4 2015 VIDEO TRENDS REPORT
Q4 2015
Connected Devices
VIDEO CONTENT ON SMARTPHONESDo you watch any of the following video content on your smartphone? (choose all that apply)
18.6%
On average per week, how often do you watch TV shows, movies, or video content on your smartphone?
RarelyNever 1–2>1 2–3 4–53–4 5+
Hours per Week
37.4
%
37.1
%
3
9.7%
18
.8%
1
9.1%
20.
6%
20.4
%
22
.6%
20.8
%
9.4
%
9.
8%
8.3%
5.
8%
4.8
%
4.8
%
2.5
%
3.1
%
2.2%
2.2
%
0.8%
1.4
%
3.
5%
2.7
%
2.2%
43.8% watch on a weekly basis
+4.1% over 2 years
Smartphones ¨ Of smartphone owners, 40.3% watch video on the device, an increase of 3.4% over two years.
¨ The top three pieces of content viewed are "movies," "news," and "TV show and/or movie previews/trailers."
• Movies increased 3.4% y/y and 4.7% over two years.
¨ Of smartphone owners, 43.8% watch video on the device on a weekly basis, an increase of 4.1% over two years. The majority of these respondents (29.8%) watch two hours or less a week.
Movies
News
TV/Movie Previews
Sports Clips
Reruns of TV Shows
Sports Events
Live TV Shows
I do not watch videos on my smartphone
16.5%
15.4%
12.5%
12.3%6.5%6.0%
59.7%
Q4 2015Q4 2014Q4 2013
13.9%
15.2%
18.6%
Movies
+3.4% y/y, +4.7% over 2 years
Q4 2015
Q4 2014
Q4 2013
28
Q4 2015 VIDEO TRENDS REPORT
Q4 2015
Connected Devices
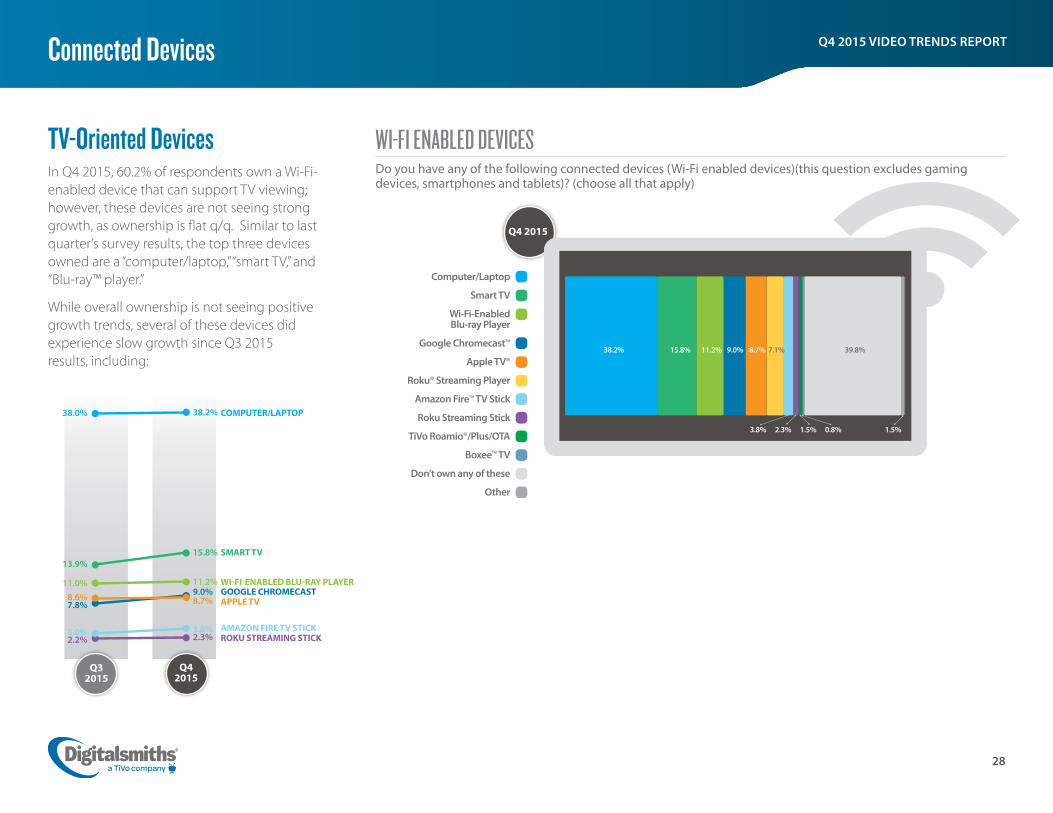
WI-FI ENABLED DEVICES Do you have any of the following connected devices (Wi-Fi enabled devices)(this question excludes gaming devices, smartphones and tablets)? (choose all that apply)
Computer/Laptop
Smart TV
Wi-Fi-Enabled Blu-ray Player
Google Chromecast™
Apple TV®
Roku® Streaming Player
Amazon Fire™ TV Stick
Roku Streaming Stick
TiVo Roamio®/Plus/OTA
Boxee™ TV
Don’t own any of these
Other
3.8% 2.3% 1.5% 0.8% 1.5%
TV-Oriented Devices In Q4 2015, 60.2% of respondents own a Wi-Fi-enabled device that can support TV viewing; however, these devices are not seeing strong growth, as ownership is flat q/q. Similar to last quarter’s survey results, the top three devices owned are a “computer/laptop,” “smart TV,” and “Blu-ray™ player.”
While overall ownership is not seeing positive growth trends, several of these devices did experience slow growth since Q3 2015 results, including:
38.2% 15.8% 11.2% 9.0% 8.7% 7.1% 39.8%
38.0%
Q4 2015
Q3 2015
38.2%
13.9%15.8%
11.0% 11.2%
COMPUTER/LAPTOP
8.6%7.8%
3.0%2.2%
8.7%9.0%
3.8%2.3%
SMART TV
WI-FI-ENABLED BLU-RAY PLAYERGOOGLE CHROMECASTAPPLE TV
AMAZON FIRE TV STICKROKU STREAMING STICK
29
Q4 2015 VIDEO TRENDS REPORTConnected Devices
GAMING CONSOLE OWNERS Do you own any of the following gaming stations? (choose all that apply)
Sony PlayStation™, PlayStation 2, PlayStation 3, PlayStation 4
Nintendo® Wii®
Xbox® 360, Xbox 1
Nintendo Wii® U
Sony PSP™
I do not own a gaming station
Other (please specify)
21.7% 21.2% 20.2% 54.5%
0
Purchases
1 2 3 4+
On average, how many movie/TV show purchases do you make each month from your gaming device?
Do you access your cable/satellite provider’s service through your gaming device to watch TV?
YES
NO, my provider does offer an app, but I do not use it.
NO, my provider does not offer an app for my gaming device.
N/A
Q4 2015
20.0% 16.0%
34.8%29.2%
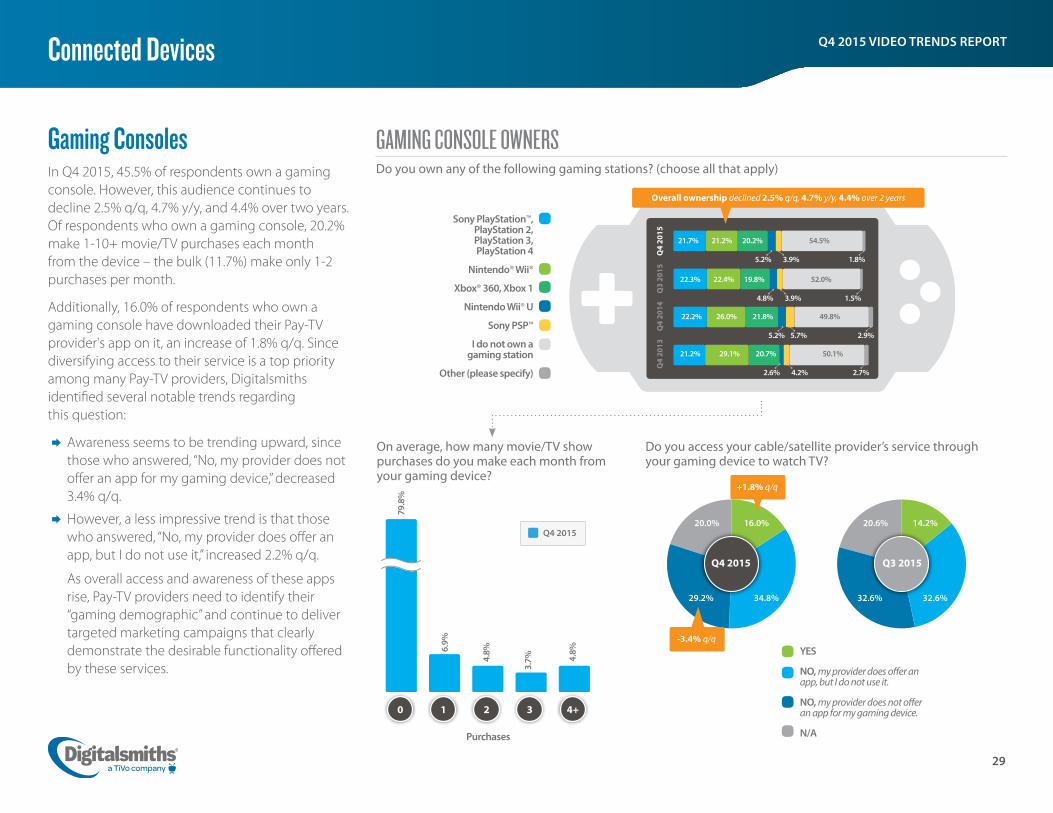
Gaming Consoles In Q4 2015, 45.5% of respondents own a gaming console. However, this audience continues to decline 2.5% q/q, 4.7% y/y, and 4.4% over two years. Of respondents who own a gaming console, 20.2% make 1-10+ movie/TV purchases each month from the device – the bulk (11.7%) make only 1-2 purchases per month.
Additionally, 16.0% of respondents who own a gaming console have downloaded their Pay-TV provider's app on it, an increase of 1.8% q/q. Since diversifying access to their service is a top priority among many Pay-TV providers, Digitalsmiths identified several notable trends regarding this question:
¨ Awareness seems to be trending upward, since those who answered, “No, my provider does not offer an app for my gaming device,” decreased 3.4% q/q.
¨ However, a less impressive trend is that those who answered, “No, my provider does offer an app, but I do not use it,” increased 2.2% q/q.
As overall access and awareness of these apps rise, Pay-TV providers need to identify their “gaming demographic” and continue to deliver targeted marketing campaigns that clearly demonstrate the desirable functionality offered by these services.
Q4
2015
Q3
2015
5.2% 3.9% 1.8%
Overall ownership declined 2.5% q/q, 4.7% y/y, 4.4% over 2 years
Q4 2015
79.8
%
Q3 2015
20.6% 14.2%
32.6%32.6%
+1.8% q/q
Q4
2014
Q4
2013
22.3% 22.4% 19.8% 52.0%
4.8% 3.9% 1.5%
22.2% 26.0% 21.8% 49.8%
5.2% 5.7% 2.9%
21.2% 29.1% 20.7% 50.1%
2.6% 4.2% 2.7%
6.9%
4.8%
3.7% 4.
8%
-3.4% q/q

30
Q4 2015 VIDEO TRENDS REPORT
Pay-TV Providers’ TV Everywhere Offerings (TVE)
State of Awareness In Q4 2015, 40.0% of respondents are aware their Pay-TV provider offers an app to watch content on their iPad/tablet or smartphone, an increase of 3.7% over two years, and 13.6% over three years. Another positive trend for Pay-TV providers is the “I do not know” answer choice decreased 5.5% over two years, and 8.3% over three years.
State of Adoption In Q4 2015, 21.5% of respondents with Pay-TV service have their Pay-TV provider's app on their iPad/tablet or smartphone, a decline of 2.4% q/q, 3.7% y/y, and 4.5% over three years.
Of those respondents who access their Pay-TV provider's TVE solution, 45.4% use it on a weekly basis, an increase of 3.6% q/q. Of weekly users, 21.6% access it 1-3 days a week, and 14.7% access it 6-7 days a week.
TV EVERYWHERE: ADOPTION AND USAGEDo you have your cable/ satellite service provider’s app downloaded on your iPad/tablet or smartphone?
TV EVERYWHERE: AWARENESSDoes your cable/satellite provider offer an app(s) that allows you to watch TV/movies on devices such as a smartphone or an iPad/tablet?
Yes
No
Don’t Know
Weekly (1-7 days)
Days per Week
If how often do you use your cable/satellite provider’s app (days per week)?
YES
Never
-2.4% q/q, -3.7% y/y,
-4.5% over 3 years41.8%
Q4 2013 Q4 2012
40.0%
46.9%
Q4 2015
13.1%+3.7% over 2 years, +13.6% over 3 years
45.4%
52.4%
11.3%
36.3%
55.2%
184%
26.4%
Q3 2015
Q4 2014
Q4 2015
Q4 2013
Q4 2012
21.5%
23.9%25.2%
21.6%
26.0%
YES
Rarely (<1 day)
41.9%
42.3%
12.7%
15.9%
Q4 2015
Q3 2015
+3.6% q/q

31
Q4 2015 VIDEO TRENDS REPORT
Search (you type in a title or topic to
search for)
38.6% 40.2%
TV EVERYWHERE: CONTENT DISCOVERY USAGEDo you leverage any of the following features in your cable/satellite provider’s app? (choose all that apply)
Recommendations (You Might Like This, Similar Titles, Suggested for You, More Like This)
No (These are NOT offered in my cable/satellite provider’s app)
No (These are offered, but I do not
use these features)
41.4%
Pay-TV Providers’ TV Everywhere Offerings (TVE)
State of Engagement With Content Discovery Of the respondents who use their Pay-TV provider's TVE solutions, just over half (50.8%) leverage the content search and/or recommendations offered on these solutions. Engagement with the content discovery functionality in TVE solutions is the highest recorded since Digitalsmiths first included this question in Q2 2015. Specifically, 41.4% of respondents use the search functionality, an increase of 2.8% q/q, and 24.7% use the content recommendations, also up slightly q/q. It's important to focus on the 12.7% of respondents who answered that search and recommendations are not offered, since the majority of North American Pay-TV providers do offer some sort of content discovery functionality in their TVE offerings.
Key Takeaways: Digitalsmiths knows the heavy investment its Pay-TV customers have made toward improving the experience on their TVE offerings; therefore, it’s encouraging to see improvements in awareness, weekly usage, and engagement with the content discovery functionality. Digitalsmiths believes the next phase of TVE involves continued marketing efforts within each provider’s subscriber base, in order to improve overall adoption. Gaining real-time insight into KPIs for these offerings is also key. It will be important to track key metrics such as views and engagement, as well as test new functionality in order to learn, in real-time, how to further optimize these offerings.
Q4 2015
Q3 2015
Q2 2015
24.7% 24.3% 23.4%
12.7% 10.2% 12.7%
39.3% 39.4%
+2.8% q/q
-2.8% q/q, -2.9% over 2 years36.5%

32
Q4 2015 VIDEO TRENDS REPORTPay-TV Providers’ TV Everywhere Offerings (TVE)
TV NETWORK APPS & USAGEDo you have any of the following TV Network apps downloaded on your iPad/tablet and/or Smartphone? (choose all that apply)
CBSABCHBOGoWatchESPNNBCABC FamilyBBCA&EFOX NewsCBCDiscovery ChannelFOXHBO NOWShowtimeComedy CentralFOX SportsDisneyNBC SportsTurner Entertainment (CNN, TNT, CN, TBS, etc.)MSNBCThe CWMTVNickelodeonI do not use any of these appsOther (please specify)
4.6%4.4%4.2%3.8%3.5%3.0%3.0%2.7%2.7%2.6%2.6%2.6%2.6%2.5%2.4%2.2%2.1%2.1%1.7%1.6%1.4%1.2%1.2%
76.2%3.5%
Q4 2015
How often do you use these TV Network Apps?
TV Network Apps
While many of these TV Network Apps are not accessible without a Pay-TV subscription, Digitalsmiths believes video service providers should keep track of which apps consumers use. Staying educated on the user experiences offered by the most popular TV Network Apps ensures that video service providers’ apps offer a competitive experience. In Q4 2015, 23.8% of respondents leverage TV
Network Apps, a 2.0% decline q/q. Similar to last quarter's results, the top five TV Network Apps are: CBS, ABC, HBO GO®, WatchESPN®, and NBC.
Of the respondents who access TV Network Apps, 59.3% do so on a weekly basis, an increase of 3.2% q/q, 2.9% y/y, and 2.5% over two years.
Q3 2015
Q3 2015 Q4 2015
4.5%5.3%5.4%4.0%3.5%3.1%2.2%2.5%2.7%2.7%2.4%3.4%2.6%2.9%3.3%1.8%2.7%2.2%1.9%1.2%1.7%1.7%1.8%
74.2%3.2%
23.8%
25.8%
-2.0% q/q
Weekly (1-7 days)
Days per Week
Never
56.1% 56.4% 56.8%
+3.2% q/q, +2.9% y/y, +2.5% over 2 years
59.3%
Rarely (<1 day)
32.3% 33.7% 37.5% 37.3%
8.4% 10.2% 6.1% 5.9%
Q4 2015
Q3 2015
Q4 2014
Q4 2013
33
Q4 2015 VIDEO TRENDS REPORT
FINDING SOMETHING TO WATCHHow often do you get frustrated when trying to find something to watch on TV?
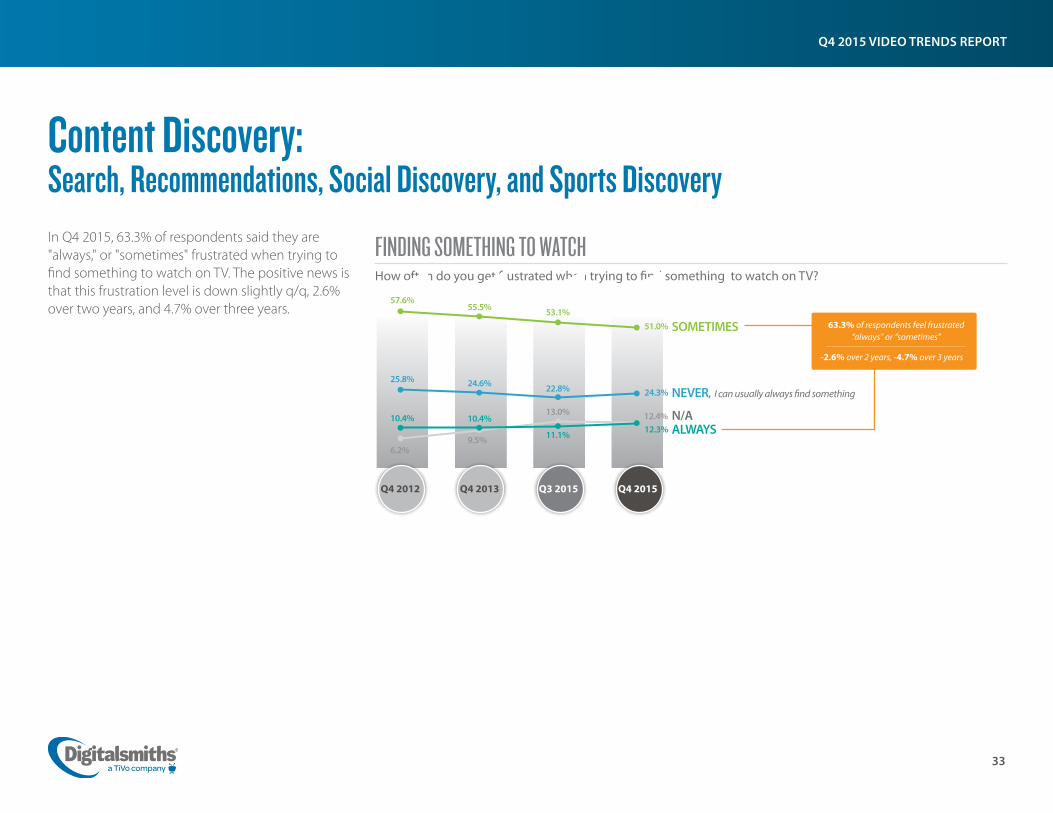
Content Discovery: Search, Recommendations, Social Discovery, and Sports DiscoveryIn Q4 2015, 63.3% of respondents said they are "always," or "sometimes" frustrated when trying to find something to watch on TV. The positive news is that this frustration level is down slightly q/q, 2.6% over two years, and 4.7% over three years.
Q4 2015Q3 2015Q4 2013Q4 2012
51.0%
12.3%
24.3%
12.4%
SOMETIMES
NEVER, I can usually always find something
ALWAYSN/A
-2.6% over 2 years, -4.7% over 3 years
63.3% of respondents feel frustrated “always” or “sometimes”
53.1%55.5%57.6%
22.8%24.6%25.8%
10.4% 10.4%
6.2%9.5% 11.1%
13.0%
34
Q4 2015 VIDEO TRENDS REPORT
SEARCHDo you ever type in a TV show, movie title, or topic into a search box to find something to watch in your cable/satellite guide?
I do not know how to use the search feature
If do you feel the search results are accurate?
82.8%
17.2%
YES If why don’t you use the search functionality offered to you? (choose all that apply)
NO
Search is not offered by my cable/satellite
provider
I am not interested in searching for
TV Shows/Movies
Takes too much time
I only watch a few channels so no need to search
Other
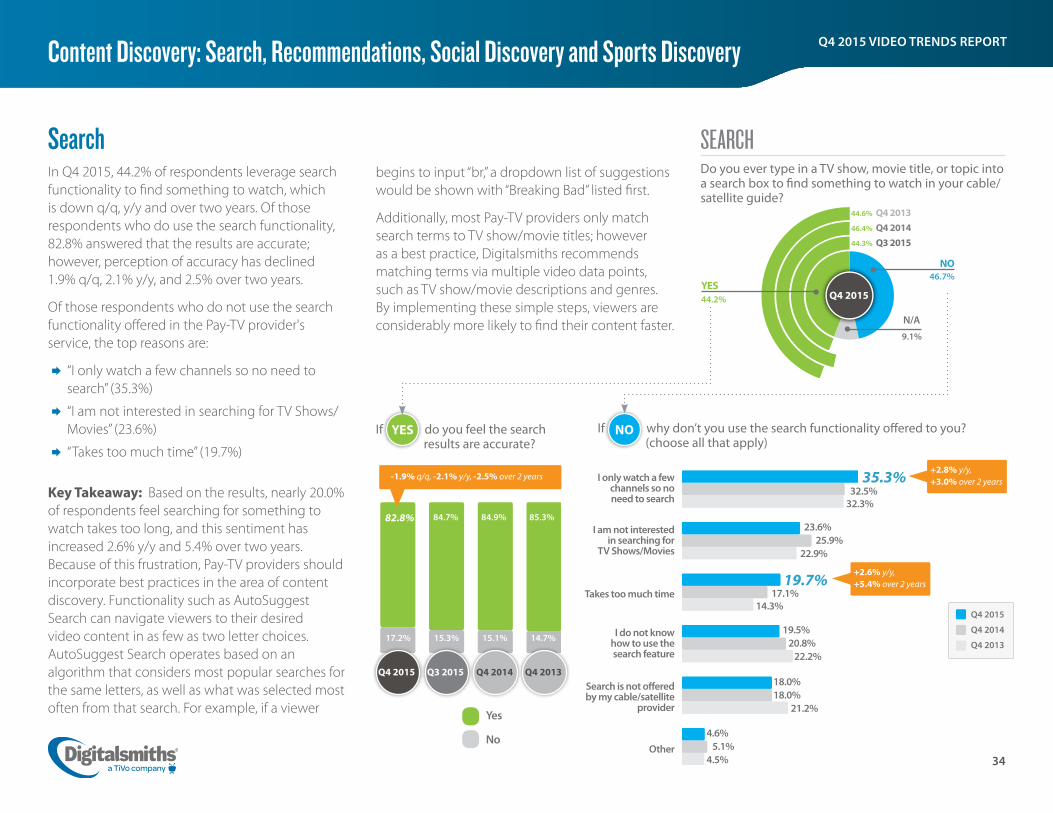
SearchIn Q4 2015, 44.2% of respondents leverage search functionality to find something to watch, which is down q/q, y/y and over two years. Of those respondents who do use the search functionality, 82.8% answered that the results are accurate; however, perception of accuracy has declined 1.9% q/q, 2.1% y/y, and 2.5% over two years.
Of those respondents who do not use the search functionality offered in the Pay-TV provider's service, the top reasons are:
¨ “I only watch a few channels so no need to search” (35.3%)
¨ “I am not interested in searching for TV Shows/Movies” (23.6%)
¨ “Takes too much time” (19.7%)
Key Takeaway: Based on the results, nearly 20.0% of respondents feel searching for something to watch takes too long, and this sentiment has increased 2.6% y/y and 5.4% over two years. Because of this frustration, Pay-TV providers should incorporate best practices in the area of content discovery. Functionality such as AutoSuggest Search can navigate viewers to their desired video content in as few as two letter choices. AutoSuggest Search operates based on an algorithm that considers most popular searches for the same letters, as well as what was selected most often from that search. For example, if a viewer
Content Discovery: Search, Recommendations, Social Discovery and Sports Discovery
Q4 2015
NO
9.1%
N/A
23.6% 25.9% 22.9%
+2.8% y/y, +3.0% over 2 years
+2.6% y/y, +5.4% over 2 years
35.3%
19.7%
32.5% 32.3%
17.1% 14.3%
19.5% 20.8% 22.2%
18.0% 18.0% 21.2%
4.6% 5.1% 4.5%
Q4 2015
Q4 2014
Q4 2013
begins to input “br,” a dropdown list of suggestions would be shown with “Breaking Bad” listed first.
Additionally, most Pay-TV providers only match search terms to TV show/movie titles; however as a best practice, Digitalsmiths recommends matching terms via multiple video data points, such as TV show/movie descriptions and genres. By implementing these simple steps, viewers are considerably more likely to find their content faster.
Q4 2015 Q3 2015 Q4 2014 Q4 2013
Yes
No
15.3% 15.1% 14.7%
84.7% 84.9% 85.3%
YES46.7%
44.2%
44.3% Q3 201546.4% Q4 201444.6% Q4 2013
-1.9% q/q, -2.1% y/y, -2.5% over 2 years
35
Q4 2015 VIDEO TRENDS REPORTContent Discovery: Search, Recommendations, Social Discovery and Sports Discovery
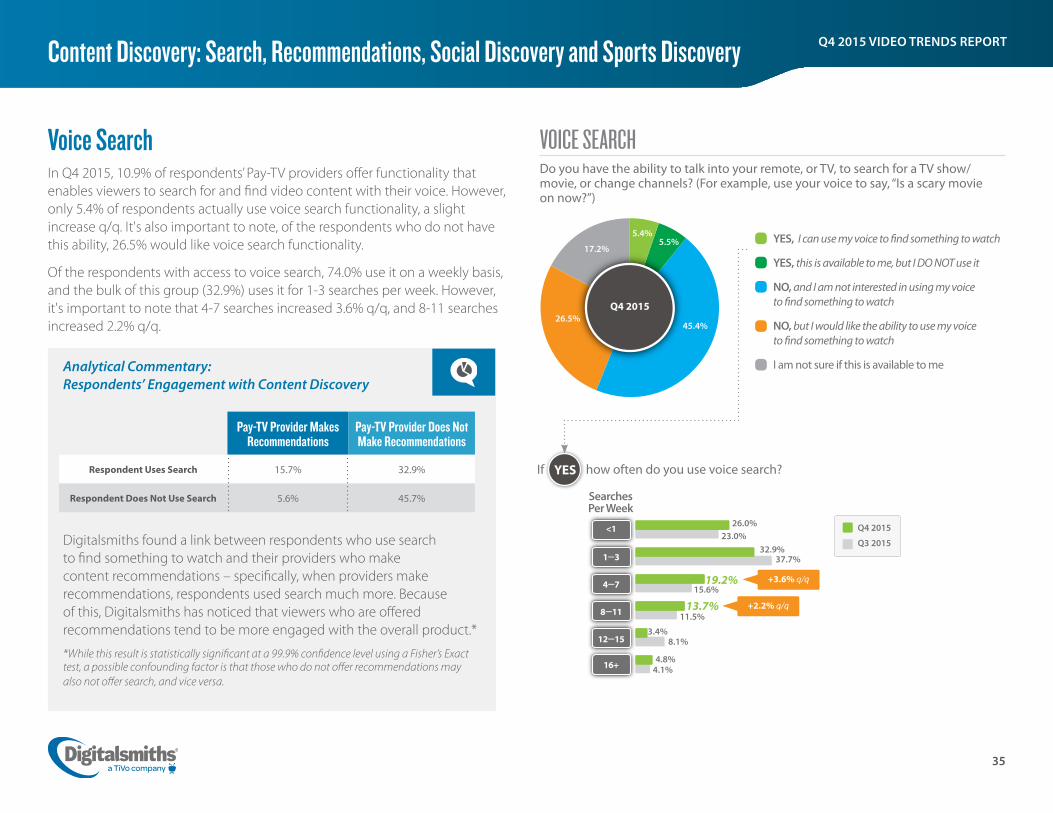
Voice SearchIn Q4 2015, 10.9% of respondents’ Pay-TV providers offer functionality that enables viewers to search for and find video content with their voice. However, only 5.4% of respondents actually use voice search functionality, a slight increase q/q. It's also important to note, of the respondents who do not have this ability, 26.5% would like voice search functionality.
Of the respondents with access to voice search, 74.0% use it on a weekly basis, and the bulk of this group (32.9%) uses it for 1-3 searches per week. However, it's important to note that 4-7 searches increased 3.6% q/q, and 8-11 searches increased 2.2% q/q.
VOICE SEARCHDo you have the ability to talk into your remote, or TV, to search for a TV show/movie, or change channels? (For example, use your voice to say, “Is a scary movie on now?”)
If how often do you use voice search? YES
YES, I can use my voice to find something to watch
YES, this is available to me, but I DO NOT use it
NO, and I am not interested in using my voice to find something to watch
NO, but I would like the ability to use my voice to find something to watch
I am not sure if this is available to me
Q4 2015
5.4%5.5%
45.4%26.5%
17.2%
Searches Per Week
1―3
26.0%
15.6%
11.5%
8.1%
4.1%
23.0%
4―7
8―11
12―15
16+
<1
37.7%32.9%
19.2%
13.7%
3.4%
4.8%
+2.2% q/q
+3.6% q/q
Q4 2015
Q3 2015
Analytical Commentary: Respondents’ Engagement with Content Discovery
Digitalsmiths found a link between respondents who use search to find something to watch and their providers who make content recommendations – specifically, when providers make recommendations, respondents used search much more. Because of this, Digitalsmiths has noticed that viewers who are offered recommendations tend to be more engaged with the overall product.*
*While this result is statistically significant at a 99.9% confidence level using a Fisher’s Exact test, a possible confounding factor is that those who do not offer recommendations may also not offer search, and vice versa.
Pay-TV Provider Makes Recommendations
Pay-TV Provider Does Not Make Recommendations
Respondent Uses Search 15.7% 32.9%
Respondent Does Not Use Search 5.6% 45.7%
36
Q4 2015 VIDEO TRENDS REPORT
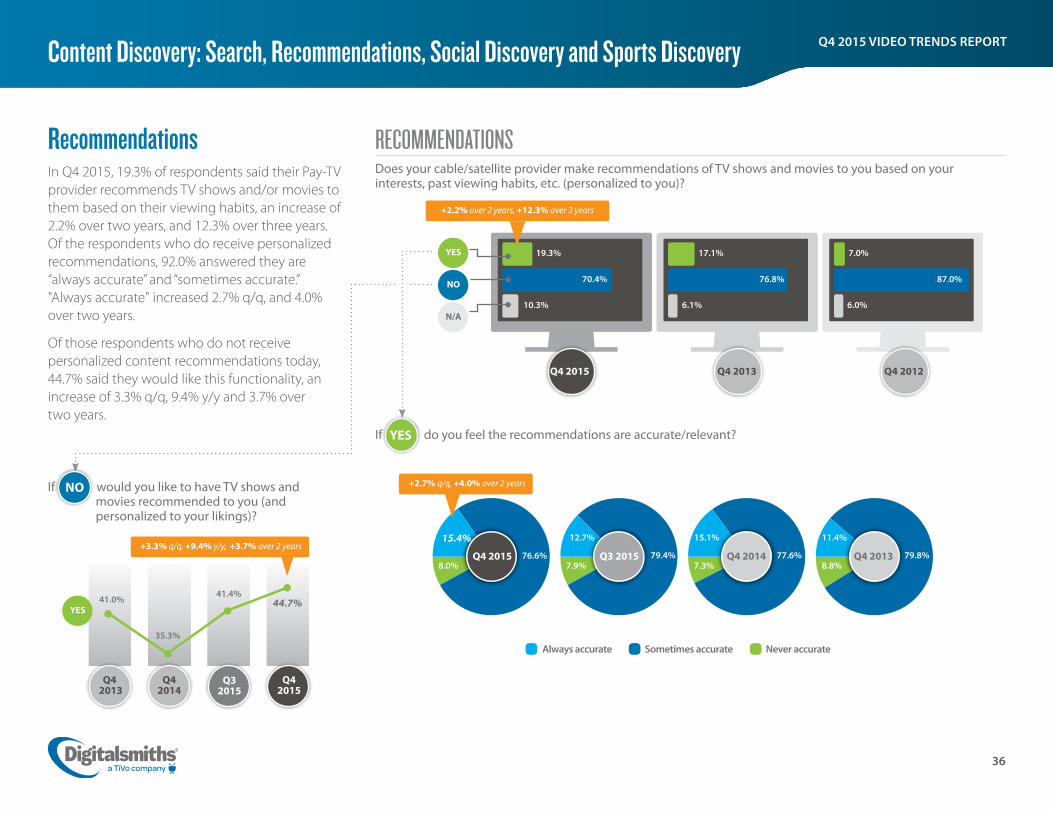
If do you feel the recommendations are accurate/relevant? YES
Content Discovery: Search, Recommendations, Social Discovery and Sports Discovery
RECOMMENDATIONSDoes your cable/satellite provider make recommendations of TV shows and movies to you based on your interests, past viewing habits, etc. (personalized to you)?
Always accurate Sometimes accurate Never accurate
Q4 2015 Q3 2015
12.7%15.4%
79.4%7.9%8.0%
If would you like to have TV shows and movies recommended to you (and personalized to your likings)?
NO
44.7%41.4%
41.0%
RecommendationsIn Q4 2015, 19.3% of respondents said their Pay-TV provider recommends TV shows and/or movies to them based on their viewing habits, an increase of 2.2% over two years, and 12.3% over three years. Of the respondents who do receive personalized recommendations, 92.0% answered they are “always accurate” and “sometimes accurate.” "Always accurate" increased 2.7% q/q, and 4.0% over two years.
Of those respondents who do not receive personalized content recommendations today, 44.7% said they would like this functionality, an increase of 3.3% q/q, 9.4% y/y and 3.7% over two years.
35.3%
+3.3% q/q, +9.4% y/y, +3.7% over 2 yearsQ4 2013
11.4%
8.8%79.8%
Q4 2015
Q3 2015
Q4 2014
Q4 2013
+2.7% q/q, +4.0% over 2 years
YES
YES
NO
N/A
19.3%
70.4%
10.3%
Q4 2015 Q4 2013 Q4 2012
17.1%
76.8%
6.1%
7.0%
87.0%
6.0%
+2.2% over 2 years, +12.3% over 3 years
Q4 2014
15.1%
7.3%77.6%76.6%
37
Q4 2015 VIDEO TRENDS REPORT
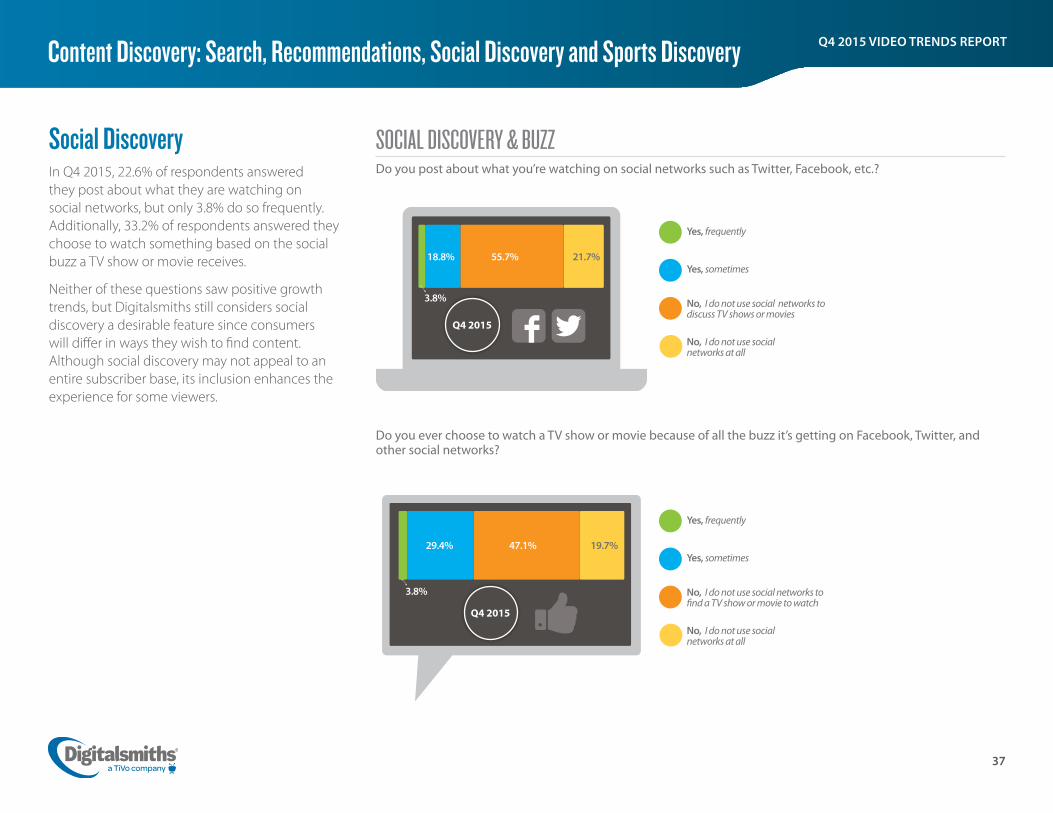
SOCIAL DISCOVERY & BUZZDo you post about what you’re watching on social networks such as Twitter, Facebook, etc.?
Yes, frequently
Yes, sometimes
No, I do not use social networks to discuss TV shows or movies
No, I do not use social networks at all
Do you ever choose to watch a TV show or movie because of all the buzz it’s getting on Facebook, Twitter, and other social networks?
Social DiscoveryIn Q4 2015, 22.6% of respondents answered they post about what they are watching on social networks, but only 3.8% do so frequently. Additionally, 33.2% of respondents answered they choose to watch something based on the social buzz a TV show or movie receives.
Neither of these questions saw positive growth trends, but Digitalsmiths still considers social discovery a desirable feature since consumers will differ in ways they wish to find content. Although social discovery may not appeal to an entire subscriber base, its inclusion enhances the experience for some viewers.
Content Discovery: Search, Recommendations, Social Discovery and Sports Discovery
Yes, frequently
Yes, sometimes
No, I do not use social networks to find a TV show or movie to watch
No, I do not use social networks at all
29.4% 47.1% 19.7%
3.8%
Q4 2015
18.8% 55.7% 21.7%
3.8%
Q4 2015
38
Q4 2015 VIDEO TRENDS REPORT
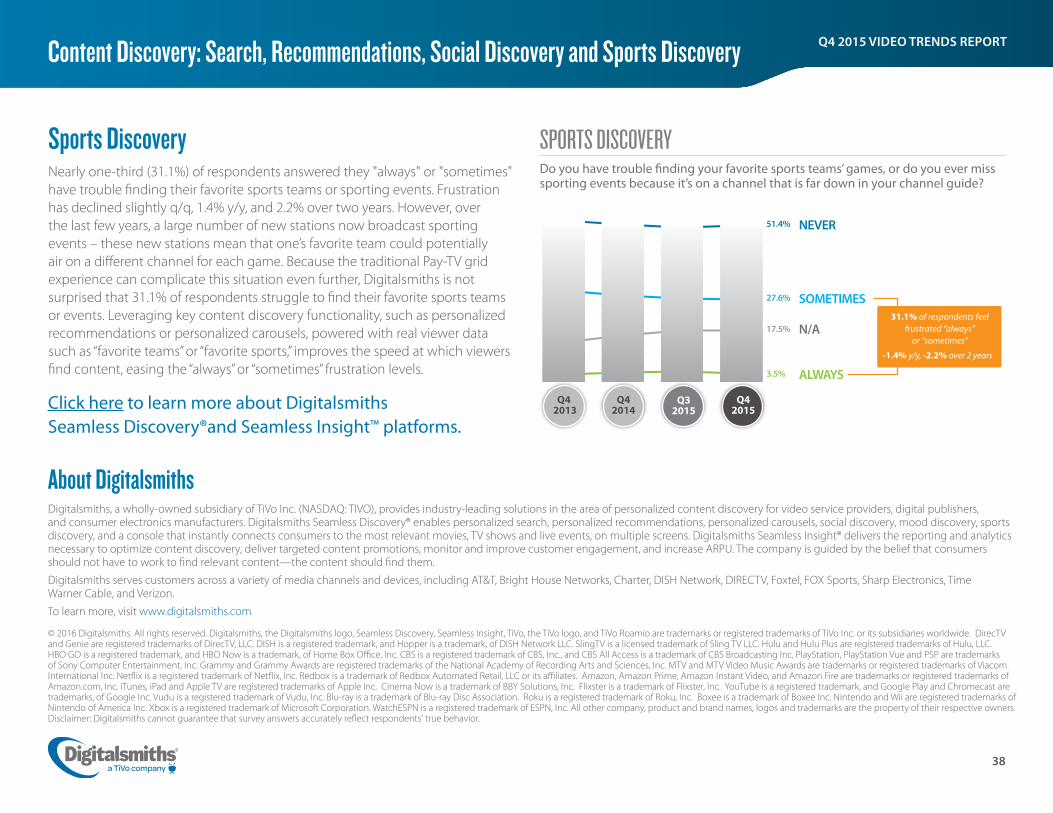
Click here to learn more about Digitalsmiths Seamless Discovery®and Seamless Insight™ platforms.
About Digitalsmiths Digitalsmiths, a wholly-owned subsidiary of TiVo Inc. (NASDAQ: TIVO), provides industry-leading solutions in the area of personalized content discovery for video service providers, digital publishers, and consumer electronics manufacturers. Digitalsmiths Seamless Discovery® enables personalized search, personalized recommendations, personalized carousels, social discovery, mood discovery, sports discovery, and a console that instantly connects consumers to the most relevant movies, TV shows and live events, on multiple screens. Digitalsmiths Seamless Insight® delivers the reporting and analytics necessary to optimize content discovery, deliver targeted content promotions, monitor and improve customer engagement, and increase ARPU. The company is guided by the belief that consumers should not have to work to find relevant content—the content should find them.
Digitalsmiths serves customers across a variety of media channels and devices, including AT&T, Bright House Networks, Charter, DISH Network, DIRECTV, Foxtel, FOX Sports, Sharp Electronics, Time Warner Cable, and Verizon.
To learn more, visit www.digitalsmiths.com
© 2016 Digitalsmiths. All rights reserved. Digitalsmiths, the Digitalsmiths logo, Seamless Discovery, Seamless Insight, TiVo, the TiVo logo, and TiVo Roamio are trademarks or registered trademarks of TiVo Inc. or its subsidiaries worldwide. DirecTV and Genie are registered trademarks of DirecTV, LLC. DISH is a registered trademark, and Hopper is a trademark, of DISH Network LLC. SlingTV is a licensed trademark of Sling TV LLC. Hulu and Hulu Plus are registered trademarks of Hulu, LLC. HBO GO is a registered trademark, and HBO Now is a trademark, of Home Box Office, Inc. CBS is a registered trademark of CBS, Inc., and CBS All Access is a trademark of CBS Broadcasting Inc. PlayStation, PlayStation Vue and PSP are trademarks of Sony Computer Entertainment, Inc. Grammy and Grammy Awards are registered trademarks of the National Academy of Recording Arts and Sciences, Inc. MTV and MTV Video Music Awards are trademarks or registered trademarks of Viacom International Inc. Netflix is a registered trademark of Netflix, Inc. Redbox is a trademark of Redbox Automated Retail, LLC or its affiliates. Amazon, Amazon Prime, Amazon Instant Video, and Amazon Fire are trademarks or registered trademarks of Amazon.com, Inc. iTunes, iPad and Apple TV are registered trademarks of Apple Inc. Cinema Now is a trademark of BBY Solutions, Inc. Flixster is a trademark of Flixster, Inc. YouTube is a registered trademark, and Google Play and Chromecast are trademarks, of Google Inc. Vudu is a registered trademark of Vudu, Inc. Blu-ray is a trademark of Blu-ray Disc Association. Roku is a registered trademark of Roku, Inc. Boxee is a trademark of Boxee Inc. Nintendo and Wii are registered trademarks of Nintendo of America Inc. Xbox is a registered trademark of Microsoft Corporation. WatchESPN is a registered trademark of ESPN, Inc. All other company, product and brand names, logos and trademarks are the property of their respective owners. Disclaimer: Digitalsmiths cannot guarantee that survey answers accurately reflect respondents' true behavior.
SPORTS DISCOVERYDo you have trouble finding your favorite sports teams’ games, or do you ever miss sporting events because it’s on a channel that is far down in your channel guide?
Sports DiscoveryNearly one-third (31.1%) of respondents answered they "always" or "sometimes" have trouble finding their favorite sports teams or sporting events. Frustration has declined slightly q/q, 1.4% y/y, and 2.2% over two years. However, over the last few years, a large number of new stations now broadcast sporting events – these new stations mean that one’s favorite team could potentially air on a different channel for each game. Because the traditional Pay-TV grid experience can complicate this situation even further, Digitalsmiths is not surprised that 31.1% of respondents struggle to find their favorite sports teams or events. Leveraging key content discovery functionality, such as personalized recommendations or personalized carousels, powered with real viewer data such as “favorite teams” or “favorite sports,” improves the speed at which viewers find content, easing the “always” or “sometimes” frustration levels.
Content Discovery: Search, Recommendations, Social Discovery and Sports Discovery
ALWAYS
N/A
SOMETIMES
NEVER51.4%
27.6%
17.5%
3.5%
-1.4% y/y, -2.2% over 2 years
31.1% of respondents feel frustrated “always”
or “sometimes”
Q4 2015
Q3 2015
Q4 2014
Q4 2013
Related Documents