Constraints On Smallholder Dairying In Swaziland; Manzini Region & Surrounding Areas by Sayee Thaba Malima BSc. Agric. Animal Production & Health (University of Swaziland) Thesis Submitted in fulfilment of the requirements of the degree of MASTER OF SCIENCE IN AGRICULTURE In the Discipline of Animal & Poultry Science School of Agricultural Sciences and Agribusiness University of KwaZulu-Natal PIETERMARITZBURG 2005

Welcome message from author
This document is posted to help you gain knowledge. Please leave a comment to let me know what you think about it! Share it to your friends and learn new things together.
Transcript
Constraints On Smallholder Dairying In Swaziland; Manzini Region & Surrounding Areas
by
Sayee Thaba Malima
BSc. Agric. Animal Production & Health (University of Swaziland)
Thesis
Submitted in fulfilment of the requirements of the degree of
MASTER OF SCIENCE IN AGRICULTURE
In the Discipline of Animal & Poultry Science
School of Agricultural Sciences and Agribusiness
University of KwaZulu-Natal
PIETERMARITZBURG
2005

Declaration
I Mr Soyce T. Malima hereby declare that the research reported in this thesis is the
result of my own investigations, except where acknowledged, and has not, in its
entirety or part been previously submitted to any University or Institution for degree
purposes.
Signed 1!1J:--<-
I Prof. Nsahlai, I.V., Chairperson of the supervisory committee, approve release of
this thesis for examination.
11
Acronyms
AI
CIDA
GLM
LH
LSU
MOAC
NEBAL
PCA
RDA's
SDDB
SNL
TDL
TON
UNISWA
UHT
Artificial Insemination
Canadian International Development Agency
Generalised Linear Modelling
Luteinising Hormone
Livestock Unit (A 450kg animal)
Ministry of Agriculture & Co-operatives
Negative Energy Balance
Principal Components Analysis
Rural Development Areas
Swaziland Dairy Development Board
Swazi Nation Land
Title Deed Land
Total Digestible Nutrients
University of Swaziland
Ultra High Temperature Treatment of Milk
III
Summary
Swaziland has long had a disparity between the supply and demand of milk. Even at present
milk production continues to be less than the market demand. The quantitative contribution of
smallholder dairy farmers to local milk production remains unknown because of poor record
keeping. This study was aimed at attaining a clear understanding of the dynamics of
smallholder dairying in Swaziland, including the identification and understanding of the
constraints faced by farmers in dairying, with the hope of devising workable solutions to
them.
A sample of 118 smallholder dairy farms were covered in this study, with a total herd of 306
lactating cows, comprising mainly of Jerseys and Holstein Friesians, with some cross breeds.
There were no significant differences in mean milk yield/cow with respect to farmer gender (P
> 0.05) and Agro-ecological zone location (P > 0.05) of the farms. Milking frequency had a
significant effect on milk yield, since cattle milked once a day had lower (P < 0.05) milk yields
than those milked twice a day. The cattle had extensively long calving intervals i.e. 448 ± 166
days, ranging from 292 to 1082 days. Low milk yield and poor reproductive performance of
cattle were found to be mainly due to poor nutrition, breeding practices and stock quality.
These are primarily a result of insufficient farmer training and inadequate technical
assistance, scarce availability of quality stock, lack of investment resources and market
support that includes favourable milk prices for farmers to make money.
This performance of the Swazi smallholder dairy herd was then evaluated by comparing it to
the performance of a larger, well-managed herd of known pedigree. Lactation records from
252 Jersey cows and 108 Holstein Friesian cows were obtained from Cedara Agricultural
Research Institute, covering the periods; July, 2002 to July, 2004 and November, 2002 to
April, 2004, respectively. Cows were grouped by parity and calving season and the gamma
IV
function proposed by Wood (Y = Anbe-Cn) was used to fit standard lactation curves on group
data. The curve parameters A and b increased with parity, while that of c and s (persistency
of lactation at peak) decreased, producing standard lactation curves save for the Holstein
Friesian summer calvers, which produced atypical curves. The R2 values (goodness of fit)
increased with parity. Animal parity and calving season were found to influence the peak and
shape of the lactation curves and their parameter estimates. The performance of the Swazi
smallholder herd showed a mean deviation of the observed daily milk yield of the Holstein
Friesian breed from the expected yield to be - 3.47 (SO 6.052) kg and that of the Jersey
breed was - 16.92 (SO 5.473) kg. The mean proportional deviation of observed milk yield
from the expected yield for the Holstein Friesian breed was - 0.3 (SO 0.37) and that of the
Jersey breed to be - 0.6 (SD 0.19). The proportional milk yield deviation of the Holstein
Friesian breed can be explained using the equation Y = O.1322(SE = 0.1293) x - 2.3581 (SE
= 0.20639), where x = expected milk yield and Y is the proportional deviation of the observed
milk yield deviation from the expected milk yield. With respect to the smallholder Jersey
breed, no relationship was found that could explain the proportional milk yield deviation. The
smallholder herd was shown to be underperforming, considering the potential for higher milk
yields of the two breeds.
In the quest to gain a greater understanding of the dynamics of smallholder dairying, the
sample of 118 farmers was further analysed using multivariate statistics to categorise them
based on their herd sizes, herd structures, management and success perceptions in dairying.
The analysis produced three clusters (categories): cluster 1 had the largest herd sizes and
poor milk production efficiency; cluster 2 had intermediate herd sizes, the highest number of
farmers and more efficient milk production per cow. This cluster, however, had the highest
proportion of calf mortalities. Cluster 3 had the smallest herd size, the lowest calf to cow ratio
and the second highest calf mortality. Record keeping across all clusters was very poor and
the average milk yield per cow was generally low. Most of the farmers do not appreciate the
importance of annual calving of their cows as an integral part of the success of their dairy
v
projects and winter feed supplementation is very poor across all the clusters. There remains
a great need for the enlightenment of the farmers on the importance of good nutrition,
breeding, calf rearing and record keeping in successful dairying.
vi
Dedication
This thesis is dedicated to my entire family and all my friends in appreciation of their
support, encouragement and prayers throughout the duration of my studies for this
master's programme.
vii
Acknowledgements
I thank Almighty God for blessing me with the opportunity to further my studies, for seeing
me through every phase of this endeavour and for all the people with which He has enriched
my life.
To Prof. IV. Nsahlai, thank you for your guidance, supervision, commitment and patience
with me. You believed in me and have mentored me, working with you has been an honour.
To Mr. B. B. Xaba (MOAC), thank you for your faith in me, in affording me the opportunity to
further my studies and for all the support you have provided me with throughout my studies.
To Dr. R. S. Twala (MOAC), thank you for your faith in me, your support and the literature
you provided for me with for use in my thesis.
Mr. Sylvan Dlamini, (MOAC - Dairy Extension), I'm at a loss for words in expressing my
sincere appreciation to you and your family for your time, effort and sacrifice in working with
me in collecting the data from all the 118 farmers.
Mr. Job Mavuso (SDDB), thank you for your advice, encouragement and provision of
literature for my study.
Dr. A. M. Dlamini (UNISWA), your insight, advice and assistance with literature provision and
suggestion for my study is greatly appreciated.
Mr. Trevor Dugmore (Cedara), I appreciate your assistance in providing me with the lactation
data for my comparative evaluation of the Swazi smallholder herd.
Many thanks to each of the farmers and their families that took their precious time to
participate in this study by providing information on their dairy operations and their insight
into the dairy industry from their perspective.
Vlll
The assistance of the MOAC (Animal Health) staff in locating some of the farms is greatly
appreciated.
lX
Table of Contents
Declaration ..................................... ............ ................................................ ii
Acronyms .......................... ................ ............................. . .... , ..... , ............... iii
Summary .............................................. .................................................... iv
Dedication ................................. ............................................................... vii
Acknowledgements ...................................... . .......................................... " . viii
1.0 A General Introduction To Smallholder Dairying In Swaziland .................. '" .... 1
1.1 Country Background ........................................................................ 1
1.2 History of Dairying In Swaziland ......................................... , ............ .... 3
1.3 Dairy Herd & Stock Acquisition ..... . ........ .......... ............................... .... 6
1.4 Breeding ................ , ........... , ..... ...... ....... , ...................................... 11
1.5 Calf Rearing ................................................................................. 14
1.6 General Animal Health .................................................................... 15
1.7 Grazing & Feeding ......................................................................... 17
1.8 Milk Collection & Marketing .............................................................. 22
1.9 Objectives of The Study ................................ . ............................... .. 25
2.0 Smallholder Dairy Production In Swaziland (Manzini & Surrounding Areas) ...... 27
2.1 Introduction ........... . ...................................................................... 27
2.2 Materials & Methods ......................... , ..... , ....................................... 30
2.3 Results & Discussion ...................................................................... 31
2.3.1 Herd Structure & Composition ................................................... 32
2.3.2 Breeding ................................................... ..........................•. 36
2.3.3 Milking Management. ......................................... '" ............ '" ... 38
2.3.4 Pasture & Fodder .................................................................. .42
2.3.5 Milk yield ......................................... . '" .... .... .. ....................... 45
2.3.6 Milk Marketing & Economics .................... . .... .. ......... .. ..... " ........ .46
2.4 Conclusion ........................................................... · .. · .. · .. · .. · .. · .. · .. · .. 49
3.0 Performance Deviation From Standard Lactation Curves ............................... 51
3.1 Introduction .. . ......... ... . , .. ... ... ......... , . ... ... ..... .. ...... ..... ... . , . .. .. ....... . .. .. 52
3.2 Materials & Methods .............. . ........................... .. ............... . ........... 53
3.2.1 Source of Data ........................ .. ........... ....... .. .......... . ............ .. 53
3.2.2 Fitting of The Model ................................................................. 54
3.2.3 The Swazi Smallholder Herd .... ...................... . .......................... 55
3.3 Results & Discussion .................................... ................................ .. 56
3.3.1 The Cedara Herds ........................................ .. ......................... 56
3.3.2 Comparative Analysis of Smallholder Herd ................................... 60
3.4 Conclusion ................. , ........ . ..... . ........................ ........ , .. . ........... , .. 65
4.0 Typology & Constraint Identification of Smallholder Producers ..... . ................. 68
4.1 Introduction .. ........ ........................................ . ............................... 68
4.2 Materials & Methods ....... ..... .. , ... ... ... '" ... .. . '" ... ............ .... ............ ... 69
4.3 Results & Discussion ..... . ............................................................... 71
4.3.1 Principal Components Analysis ............................ ..................... 75
4.4 Conclusion ..... . ........................................... .................................. 80
5.0 General Discussion, Conclusion & Recommendations ....... .................... ...... 82
5.1 Conclusion & Recommendations .......... ..... ............................ ........ ... 84
References .................. .................. ............. ................................. . 86
Annexure ...... ' " ........ . .. . ........... . .. . .................... . ..... . ............... .. .......... '" .. .. 93
Annex 1 Pictures showing the Feeding, Milking, Fodder Production & Conservation ......... ............... '" ...... '" ........ . ....... '" ... .. .......... '" .. ... 93
List of Tables
Table 1.1 Physiographic Zones of Swaziland ...... ....... , . ........ , .................... . ..... 2
Table 1.2 Profiles of Dairy Farms In Swaziland .......... ..................... ......... ........ 8
Table 1.3 Milk Demand & Supply In Swaziland .. .. .... . ... ................ .... .... .. ..... ..... 8
Table 2.1 Breakdown of The Total Herd Used In The Study .. .. ......................... 33
Table 2.2 Breed Distribution In Smallholder Farms ............... .......................... 33
Table 2.3 Reproductive Performance ... .. ........ , ...... . ... . ........... ..... . . , ....... .. ..... 36
Table 2.4 Daily Milk Yield of Different Breed Combinations .................. ............ 39
Table 2.5 Proportions of Lactating Cows According To Herd Breed Composition And Farms .. . ......................................... . .......................... . .. . .. .. 40
Table 3.1 Lactation Curve Parameters For The Jersey Herd .... , ........................ 58
Table 3.2 Lactation Curve Parameters For The Holstein Friesian Herd ...... '" .. .. .. 58
Table 4.1 Cluster Means of Classification Variables & Group Means For The First Two Discriminant Functions For A 3-Cluster Solution ....... ... ............. 72
Table 4.2 Total Sample Standardised Canonical Coefficients of Discriminant Variables ............... ............. .......... . ....... .......... . ......... .......... .. ... 73
Table 4.3 GLM Procedure Means & Standard Deviations of Each Discriminant Variable In All Three Clusters ...................................................... 74
List of Figures
Figure 2.1 Milk Yield Comparison Between Breeds ...... ...................... ............ .40
Figure 3.1 Lactation Curves of The Cedara Jersey Herd ............................. . .... 60
Figure 3.2a Lactation Curves of Holstein Friesian Herd (Winter Calvers) ............... 62
Figure 3.2b Lactation Curves of Holstein Friesian Herd (Summer Calvers) ...... ...... 62
Figure 3.3a Comparison of Observed & Expected Milk Yield of Holstein Friesian Cows ................................ ............................. . ................... ... .. 63
Figure 3.3b Comparison of Observed & Expected Milk Yield of Jersey Cows ........ . 63
Figure 3.4a Proportional Milk Yield Deviation of The Observed Yield From The Expected (Holstein Friesian) ........... . ............ ........................... ..... 64
Figure 3.4b Proportional Milk Yield Deviation of The Observed Yield From The Expected (Jersey) ... .................... .. ......... . ......... ......................... 64
Figure 3.5 PCA Scatter plot of Performance & Management Variables For The 118 Smallholder Farmers ............................................. ..... . ......... 76
Figure 3.6 PCA Triplot of Farmers (Samples), Herd Structure, management, Performance (Species) & Farmers' Success Perceptions ................. .. 79

Chapter I ,
A General Introduction To Smallholder Dairying And The Dairy Industry In Swaziland
1.0 Introduction
1.1 Country Background
The Kingdom of Swaziland is a sub-tropical country, located on the southeastern portion of
southern Africa between latitudes 25°30' and 27°30'S and longitude 30°45' and 32°07'E. It is
a land locked country, almost entirely surrounded by South Africa save for the eastern
portion bordering Mozambique. The country experiences distinct wet (September - March)
and dry seasons (April - August) each year, with their respective periods varying of late
perhaps due to the El Nine and La Nina phenomena. Swaziland has fairly good soils and a
variety of agro-ecological zones and therefore has a great potential for agriculture. There are
six agro-ecological zones when considering the country's physiography; namely the
Highveld, Upper Middleveld, Lower Middleveld, Eastern Lowveld, Western Lowveld and the
Lubombo plateau (Sweet and Khumalo, 1994). The characteristics of the agro-ecological
zones are shown in Table 1.1.
Administratively, Swaziland is divided into four regions (Hhohho, Manzini, Shiselweni &
Lubombo), which span across the agro-ecological zones. The land tenure system of the
country has two main categories, namely Title Deed Land (TDL) and Swazi Nation Land
(SNL). Swazi Nation Land accounts for a majority of the land and is held by His Majesty The
King in trust of the nation, and administered through chiefs who each have an area of
responsibility, known as a chiefdom. As a result, the individuals or families using the land do
not actually own it (legally) and hence cannot use the land as surety for loan acquisition. In
each chiefdom, a family is allocated enough land to build a homestead and grow crops by
the traditional authorities, the size of which depends on the amount of available land and the
demand for human settlement and crop production. Title deed land on the other hand is
1
owned by individuals and is made up of farms (commercial), urban, suburban and industrial
areas.
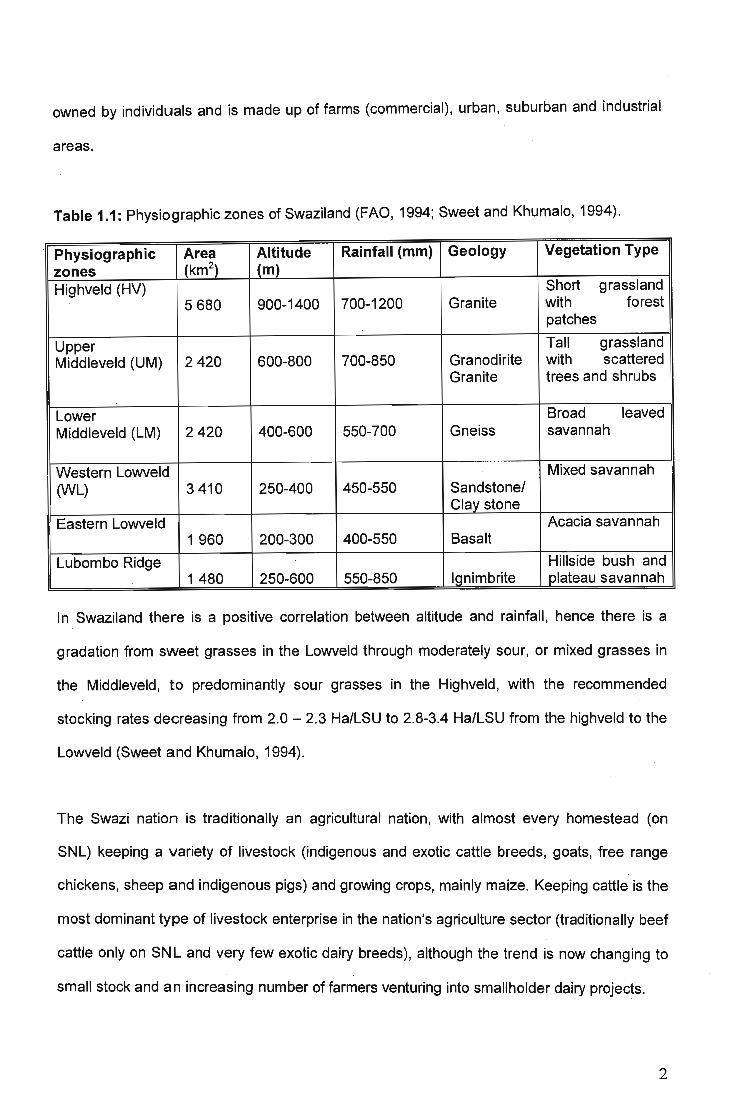
Table 1.1: Physiographic zones of Swaziland (FAO, 1994; Sweet and Khumalo, 1994).
Physiographic Area Altitude Rainfall (mm) Geology Vegetation Type zones (km2
) (m) Highveld (HV) Short grassland
5680 900-1400 700-1200 Granite with forest patches
Upper Tall grassland Middleveld (UM) 2420 600-800 700-850 Granodirite with scattered
Granite trees and shrubs
Lower Broad leaved Middleveld (LM) 2420 400-600 550-700 Gneiss savannah
Western Lowveld Mixed savannah (WL) 3410 250-400 450-550 Sandstonel
Clay stone Eastern Lowveld Acacia savannah
1 960 200-300 400-550 Basalt
Lubombo Ridge Hillside bush and 1480 250-600 550-850 Ignimbrite plateau savannah
In Swaziland there is a positive correlation between altitude and rainfall, hence there is a
gradation from sweet grasses in the Lowveld through moderately sour, or mixed grasses in
the Middleveld, to predominantly sour grasses in the Highveld, with the recommended
stocking rates decreasing from 2.0 - 2.3 Ha/LSU to 2.8-3.4 Ha/LSU from the highveld to the
Lowveld (Sweet and Khumalo, 1994).
The Swazi nation is traditionally an agricultural nation, with almost every homestead (on
SNL) keeping a variety of livestock (indigenous and exotic cattle breeds, goats, free range
chickens, sheep and indigenous pigs) and growing crops, mainly maize. Keeping cattle is the
most dominant type of livestock enterprise in the nation's agriculture sector (traditionally beef
cattle only on SNL and very few exotic dairy breeds), although the trend is now changing to
small stock and an increasing number of farmers venturing into smallholder dairy projects.
2
Some factors that have contributed to the change to small stock are (Personal observation):
• Reduced communal grazing land availability in response to the growing human
population and settlement;
• Increasing health consciousness of the public concerning excessive red meat
consumption;
• The growing popularity of poultry and pigs coupled with market availability for their
products which is driven by government and industry, backed by capital availability
primarily from government's enterprise fund and the regional development fund;
• The lucrative sugar cane production, which has of late led to the conversion of some
communal grazing lands into cane fields by community based farmer groups; and
• Increasing incidence of drought spells in the wet seasons, leading to forage shortage
and loss of productivity in the cattle and stock losses.
The Economic Planning Office (1995) reported that the distribution of cattle between farmers
on SNL and TOL had remained unchanged over the years, with 83% of the total population
of cattle owned by farmers on SNL. In the year 2000, a livestock census draft report by the
Ministry of Agriculture & Co operatives (MOAC) stated that 84.3% of the total cattle
population was still owned by farmers on SNL. This may not be the case in the distant future
given that the human population is still increasing and so is the demand for land, with crop
production and human settlements taking precedence over livestock production (mainly
cattle) as a form of land use on SNL.
1.2 History of dairying in Swaziland
Organised dairying in Swaziland started in the late 1930's although the marketing of locally
produced pasteurised milk only started in the late 1960's (FAO, 1998). Swaziland received
her independence in the year 1968 and a dairy act was enacted (SODB, 2002b). The act
enabled government to establish the Swaziland Dairy Board (SOB) in 1971, a parastatal
organisation tasked with the development and regulation of the dairy industry in the country.
3
The SDB was set to work in collaboration with the MOAC and; as such, augments
government's efforts to promote and sustain the dairy industry in the country (SDDB, 2002b).
In 1979, the SDB, using technical advice and support from the Canadian International
Development Agency (CIDA), established a government owned milk processing and
distribution company (FAO, 1994) also known as the Swaziland Dairy Board - Dairy plant,
located in the Manzini region (Matsapha Industrial site). The SDB was for a long time the
only formal market to which dairy farmers could sell their milk. At this stage the SDS played
many roles i.e. as a milk producer, raw milk buyer & processor, quality controller and industry
regulator.
In the 1970's, MOAC embarked on a drive to improve agricultural production on SNL in both
crop production and livestock farming. This was a donor-funded programme in which the
country was divided into service delivery areas that were termed, rural development areas
(RDA's). The programme consisted of many agricultural projects, which were well funded,
had the needed equipment and staff. One of these projects was the establishment of
organised dairying in the rural areas (FAO, 1996). The original plan was to establish five milk
collection schemes. The smallholder farmers would pool their daily milk yields into the bulk
cooling tankers at the milk collection centres located in the strategic RDA's and from there
the milk would be collected by SDB for processing. The farmers would then be paid
according to the quality and quantity of milk produced. There is, however, only one of these
milk collection schemes and centres that has remained functional to date, the Luyengo
settlement scheme in the Manzini region.
Over time the SOB was able to set up an efficient network of raw milk collection primarily
from large scale commercial and some smallholder farmers, using milk tankers. It
established a high standard of milk processing into high quality products such as pasteurised
milk, culture fermented milk (emasi), yoghurt and dairy juices. The distribution of the finished
products also improved with time, as a good distribution network was established in both the
4
urban and rural areas. The monopoly enjoyed by the dairy board and its aggressive
marketing strategies facilitated its growth and dominance in the Swazi dairy industry. FAO
(1996) identified low milk prices as the main cause for poor development of the smallholder
dairying in the country as well as the failure of smallholder milk collection schemes that had
been set up. In accordance with the dairy act, milk prices were set by MOAC in consultation
with the SOS. The minimum producer price of fresh milk and the maximum wholesale and
retail prices for milk and sour milk (emasi) were those specifically set (FAO, 1996).
The price setting system was not very efficient since there were often delays in the
adjustments of milk prices in response to escalating production costs. This impacted
negatively on local milk production, thereby compelling SOS to rely heavily on imported milk
to meet the market demand. Gazetted milk prices were eventually adjusted in 1990 and from
then were adjusted on an annual basis. In the 1990s, all stakeholders in the dairy industry
agreed that the deregulation of dairy prices would stimulate production and promote
investment in the industry. This would encourage market competition; improve production
and marketing efficiency to the benefit of the consumer. In October 1999, the government
removed the price control of milk and other dairy products but maintains control on import
prices (by imposing levies) to avoid dumping of cheaper foreign dairy products in the country
(SO~S, 2002b). Until February 1997, the SOS refused to allow imports of UHT (sterilised
milk) and fresh milk to competitors in the country. Levies are charged on milk and dairy
product importers into the country to avoid unfair market competition.
To date, Swaziland imports a lot of milk, mostly in the form of milk powder. The main
importers are Cad bury and Family Fun but there are many other smaller companies that
import and distribute milk and dairy products in the country. The imported milk powder is
normally used in the manufacturing of milk-based products like chocolates, sweets,
confectionaries and juices for both the local and export market. The high import levels
present a compe lling case for the improvement of milk production in the country since the
5
market demand exists and is evidently beyond local production levels. In 1998 a restructuring
process of the SDS began in preparation for the separation of the regulatory and commercial
functions leading to the privatisation of the Matsapha dairy plant into a joint venture company
(Parmalat, Swaziland). This process of restructuring and separation was completed at the
end of October 1999. The SOS was renamed to become the Swaziland Dairy Development
Soard (SODS), now with a core function to provide developmental and regulatory services to
the dairy industry from a neutral position. The SODS is furthermore expected to co-ordinate,
harmonise the production and consumption of quality dairy products, and, where necessary,
to regulate the activities of all role-players in the interest of the industry (SODS, 2000b).
The SODS has about four extension officers that work in collaboration with four dairy
extension officers from the MOAC (one in each administrative region). The whole country
therefore has only eight officers designated to educating and advising smallholder dairy
farmers on suitable dairy husbandry practices. The number is insufficient since the MOAC
staff has the added problem of not having enough transport facilities to get to the farmers
and has an increasingly diminishing budget from which to operate.
1.3 Dairy Herd and Stock Acquisition
In the late 1930's, when organised dairying started in Swaziland, it was originally centred on
a private dairy in Manzini. Its main activities were buying cream from a network of depots and
collecting milk from smallholder beef herds along the Manzini-Siteki road (FAO, 1994). The
indigenous Nguni cattle have, for generations, been used as a multipurpose breed by the
Swazi nation i.e. for meat, milk and draught purposes. The Nguni cows produced enough
milk for both calf rearing and feeding the farming families, especially since milk was
abundant during the wet season. Historically the seasonality of milk abundance was not a
problem since the country has always experienced distinct wet and dry seasons. In the wet
season there has always been an abundance of food from the variety of planted field crops
6
(especially maize), vegetables, wild growing fruits and wild vegetables. The harvested grain
and other vegetable crops such as pumpkins etc would either be stored in pit silos (tingungu)
or in cribs and consumed in the winter by the families.
As time went by, exotic breeds of cattle were introduced in the country, both 80S indicus (e.g.
Brahman) and 80S taurus (e.g. Simmental, Jersey, Holstein Friesian), Most of the Nguni
cattle on SNL were crossbred indiscriminately with these breeds, owing to the communal
grazing system practised, hence a non descript breed of cattle emerged from the unplanned
cross breeding. I nbreeding amongst the Nguni breed alone could also not be prevented
under this grazing system, resulting in an increasingly homogenous population of Nguni
cattle. The homogeneity is undoubtedly expected to have had adverse effects on the milk
yielding capacity of the Nguni cattle. On the other hand, the cross breeding would have been
expected to improve milk yield, perhaps if it were in an organised fashion. Vilakati (1994)
reported that Nguni cattle crossbreeds had improved reproductive and maternal
performance, indicating perhaps an improvement in milk yield as well.
The increase in the country's population especially in the urban areas resulted in an
increasing number of milk consumers who did not have their own animals to milk. This in turn
meant that the demand for milk in the formal market increased. The contributors to the formal
milk market have always been a few large-scale commercial farmers on TDL and a number
of smallholder dairy farmers on SNL (Table 1.2). The commercial farms supply the bulk of
the milk collected from Swazi farmers and they either keep Holstein Friesian, Jersey or a
mixture of both breeds. The smallholder farmers on the other hand initially kept the Ng"uni
breed only, but with time have changed to predominantly the Jersey, some Holstein Friesian,
Ayrshire, Guernsey and their cross breeds. The two most popular breeds, however, are the
Jersey and Holstein Friesian, perhaps as a result of their abundance, established history with
farmers and especially the adaptability of t~e Jersey.
7
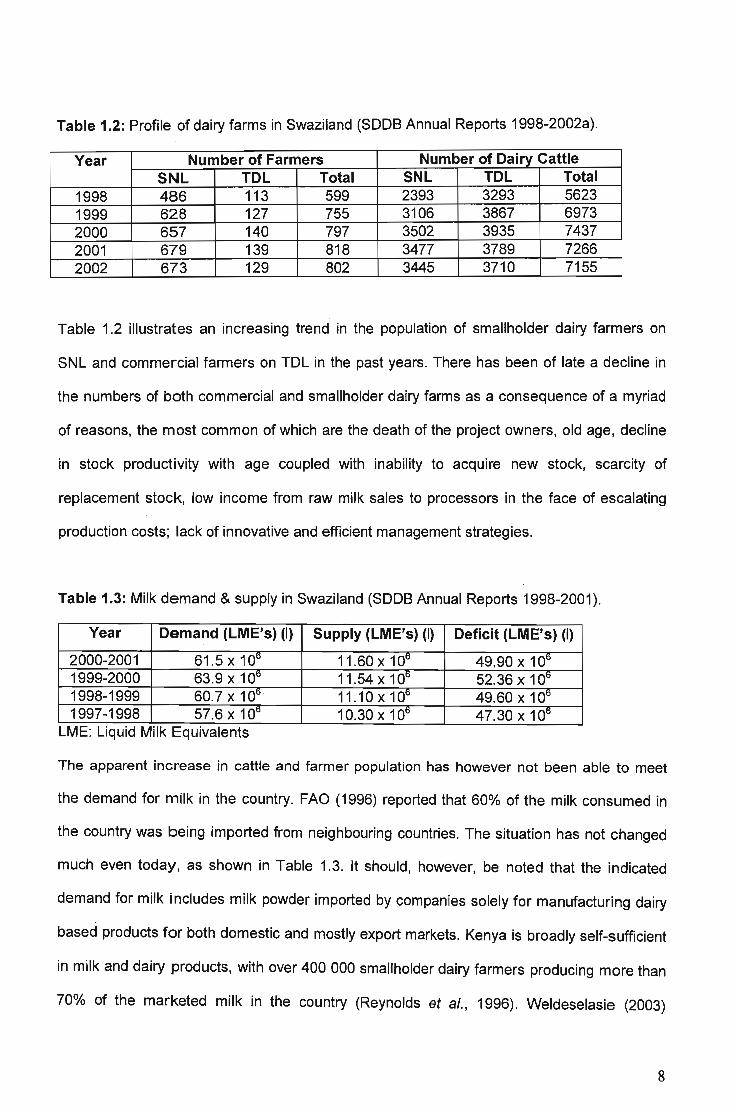
Table 1.2: Profile of dairy farms in Swaziland (SODS Annual Reports 1998-2002a).
Year Number of Farmers Number of Dairy Cattle SNL TDL Total SNL TDL Total
1998 486 113 599 2393 3293 5623 1999 628 127 755 3106 3867 6973 2000 657 140 797 3502 3935 7437 2001 679 139 818 3477 3789 7266 2002 673 129 802 3445 3710 7155
Table 1.2 illustrates an increasing trend in the population of smallholder dairy farmers on
SNL and commercial farmers on TDL in the past years. There has been of late a decline in
the numbers of both commercial and smallholder dairy farms as a consequence of a myriad
of reasons, the most common of which are the death of the project owners, old age, decline
in stock productivity with age coupled with inability to acquire new stock, scarcity of
replacement stock, low income from raw milk sales to processors in the face of escalating
production costs; lack of innovative and efficient management strategies.
Table 1.3: Milk demand & supply in Swaziland (SODS Annual Reports 1998-2001).
Year Demand (LME's) (I) Supply (LME's) (I) Deficit (LME's) (I)
2000-2001 61.5 x 10° 11.60 X 10⁶ 49.90 X 10⁶
1999-2000 63.9 x 10⁶ 11.54 X 10° 52.36 X 10⁶
1998-1999 60.7 x 10⁶ 11.10 X 10° 49.60 X 10tl
1997-1998 57.6 x 10⁶ 10.30 X 10° 47.30 X 10tl
LME: Liquid Milk Equivalents
The apparent increase in cattle and farmer population has however not been able to meet
the demand for milk in the country. FAO (1996) reported that 60% of the milk consumed in
the country was being imported from neighbouring countries. The situation has not changed
much even today, as shown in Table 1.3. It should, however, be noted that the indicated
demand for milk includes milk powder imported by companies solely for manufacturing dairy
based products for both domestic and mostly export markets. Kenya is broadly self-sufficient
in milk and dairy products, with over 400 000 smallholder dairy farmers producing more than
70% of the marketed milk in the country (Reynolds et al., 1996). Weldeselasie (2003)
8
reported that in Ethiopia, small-scale producers supply almost 88% of all urban milk as raw
milk through the informal market and that a few large farms or collective marketing
organizations exist.
1.3.1 Stock Acquisition
Swaziland does not have a functioning dairy breeding facility. The government established
Gege dairy farm for the purpose of training farmers, staff and breeding good quality stock for
the dairy industry. This farm is at present being under-utilised and has not lived up to the
ideal of providing affordable replacement stock of high genetic merit to Swazi farmers. The
reasons for the current situation are the lack of clear-cut government policies that could be
the instrument for the implementation, funding and personnel availability for such a highly
technical and costly project. At present both Jersey and Holstein Friesian cattle are imported
from South Africa and used as replacement stock. These importations are facilitated by the
SODS and MOAC, mostly for smallholder farmers. The farms from which the cattle are
imported are those with pedigree records and registered animals. Most commercial and
some smallholder farmers however privately import their animals from wherever they please,
as long as they meet the import requirements.
There are numerous farmers who want dairy cows to either increase their herd sizes or
replace culled or lost stock. The cost of a pedigree cow is often very high and most farmers
cannot afford to buy more than one cow at a time. When imported, there are extra costs
related to the quarantining of the animals in both countries before and after their importation,
including the feeding and transportation during this period. The transportation costs are
either borne by MOAC or SODS, however, the quarantine costs are either directly borne by
the individual farmers or at times by SDDB. Ideally for the farmers to receive the animals
they need to have already established a pasture, crush pen, milking parlour and received
some education on dairy husbandry. Both the MOAC and SDDB dairy extension staff jointly
9
provide this training and advice. Upon meeting these requirements the farmers are then
registered on the SODS acquisition list and cattle are then sought from willing sellers in
neighbouring South Africa.
The potential problem with this system, however, is that the farmers from which these cattle
are bought are normally still fully engaged in dairy farming and hence would not be expected
to sell their good animals unless the population is beyond what they could cater for. It follows
therefore that some of the animals that are bought through this system are likely to be culls
from these farms, unless that particular farm is selling all its stock and closing down. Some
Swazi farmers who have the resources (financial and transport) bypass both MOAC and
SODS and directly purchase stock from South Africa. These farmers often approach MOAC
and SODS dairy staff looking for hay, feed and advice when the animals have already arrived
and are either starving or ill, having not made the necessary arrangements for their
accommodation. As of December 2002, MOAC has been able to provide a small number of
smallholder farmers with dairy stock from the Gege dairy farm at subsidised prices (below
market cost). These cattle are sold exclusively to smallholder dairy farmers who have met
the same preparation prerequisites imposed on farmers who receive imported stock. The
number of animals sold annually is, however, far below the demand for dairy stock by
smallholder farmers. Hence a sound breeding programme has to be put into place to meet
the demand and to ensure proper implementation, should be well funded and supplied with
the needed technical staff and labour.
According to Alejandrino et al. (1999), in the Philippines, crossbred Holstein Friesian X
Sahiwal dairy cattle have been imported from New Zealand since 1986 and dispersed to
farmers to meet the urgent need for breeding stock. Milk production is mainly carried out by
smallholder farmers and barely meets 5% of the country's milk demand, a factor attributed to
poor dairy breed availability, management of animal nutrition, and breeding as the main
constraints on dairy cattle productivity (Alejandrino et al., 1999).
10
1.4 Breeding
The large and medium scale commercial farmers on TDL primarily rely on artificial
insemination (AI) for their breeding . . Sulls, if any, are kept only to service those cows that
have difficulty conceiving by means of AI. The semen used is normally imported from South
African companies that have catalogues of registered, performance-tested bulls from around
the world. These companies have agents that order and distribute the catalogues and semen
to farmers. This set up is favourable to the commercial farmers since they have the
necessary equipment, capital, skills and (or) have access to personnel with AI skills.
The smallholder farmers on the other hand have fewer animals, less capital, and often poor
or no knowledge of AI. The SODS provides AI services primarily to smallholder farmers. The
problem, however, is that most farmers do not keep breeding records and hence do not even
know when their animals are expected to be on heat and subsequently require servicing. The
terms of the service provision by SODS are that the farmer calls their office once the cow is
detected to be in heat so that they can inseminate her about 8 -12 hours later. The farmer is
also charged according to the class of the bull whose semen is utilised, after having been
given advice on the use of the best bulls that are affordable. The lack of record keeping, heat
detection knowledge, capital and communication difficulties often stifle the AI service
provision programme by SODS. Synchronised oestrus and subsequent AI is an alternative
way to circumvent the poor record keeping and communication but it implies additional costs
of the drugs used, and as a result only a few farmers utilise this service.
Most smallholder farmers prefer the use of bulls for breeding, even though most of them
hardly have enough pasture for their cows to graze on (presumably because the presence of
a bull alleviates the obligation of the farmers to keep track of the oestrous cycle of the cows
for breeding purposes). This is compounded by the fact that there is no breeding centre for
dairy bulls in the country, hence, farmers primarily resort to the use of any dairy male for
breeding.
11
The common practice is that those that can afford to, buy male cull calves from the
commercial farms, rear them and then use them as breeding bulls. Those that can not afford
to buy cull calves resort to borrowing of dairy bulls from neighbours and if unsuccessful they
crossbreed the cow with any available breed to safeguard continued production. The cattle
are at times left open for extended periods of time while the farmers persist to milk them,
even with the dwindling yields.
These poor breeding practices have the effect of regressing the milk production potential of
the resulting generations since the animals are either inbred, reducing their genetic variation
or crossbred with non-dairy breeds. The influential veteran farmers sometimes sell the
resulting crossbreed offspring to the novice aspiring smallholder farmers as purebred dairy
animals since their phenotype to some extent resembles that of the pure breed. Given this
situation, there is a possibility that the numbers of both smallholder dairy farmers and
animals have been seen to be on the increase whilst the total milk production has not
increased proportionally. This could be due in part to the fact that the potential and actual
milk production per animal has declined as a result of a reduction in the genetic potential for
high milk yield. The exotic dairy breeds have been observed to have superior performance
as dairy animals in terms of their milk yields, lactation length and calving intervals when
compared to the indigenous breeds and their crosses (Tambi, 1991; Mutukumira et al., 1996;
Masiteng and van der Westhuizen, 2001; and Weldeselasie, 2003).
InCameroon, Tambi (1991) reported that milk production was not only limited by the poor
performance of the local breeds (Gudalis, White and Red Fulani) but also by the shortage of
high quality exotic and/or crossbred animals. In a case study conducted in the North-eastern
Free State in South Africa, Masiteng and van der Westhuizen (2001) noted that the farmers
keep a variety of breeds, ranging from the indigenous, beef breeds, cross breeds to the
exotic dairy breeds. Under the communal grazing system breeding is mainly by the use of
bulls, of which 68.5% are non-registered, 28.8% are registered and 2.7% of farmers use AI.
12
In Zimbabwe, Mutukumira et al. (1996) reported that the smallholder dairy farmers kept both
the exotic (Red Dane, Jersey and Friesian) and indigenous (Mashona) breeds and their
crosses. Furthermore the Dairy Development project in Zimbabwe provides registered bulls
to the farmers for breeding purposes and occasionally provides AI services. According to
Weldeselasie (2003), in Eritrea most farmers (86.7%) used natural mating, 3.3% used AI and
10% used a corn bination of the two breeding systems. Of those that used natural mating,
only 57% owned bulls while the rest (43%) hired the bulls.
In an attempt to curb the poor breeding situation, in the year 2001, SDDS identified, and
started training key farmers from different communities on the oestrous cycle of cattle, heat
detection and AI. These smallholder farmers were upon training, provided with all the AI
equipment (liquid Nitrogen flasks, semen straws, insemination guns and gloves) with which
to return to their respective communities with the prospect of facilitating easy access to AI
service for farmers within those communities. The fundamental flaws of this programme
have, however, been the extensive distances between the local AI skilled farmers and those
that require AI services, scarcity of transport and telecommunication between the farmers
and their AI skilled colleagues, lack of funds to pay for the semen used for AI and, more
importantly, most farmers have no clue about when their cows are expected to come into
heat and can only recognise the overt signs of heat. Furthermore most of these resource
people are self-employed and therefore involved in a lot ·of activities, either at a personal or
community level, hence they are often not available when needed. An unknown factor,
however, is that of sustaining their motivation to do the work over time since it appears to
merely be a voluntary community service at present.
Sergevoet et al. (2004) reported that there is a significant relationship between behaviour
and the goals and intentions of farmers. Bebe et al., (2003) stated that the breeding
decisions of smaHholder dairy producers in the Kenyan highlands conform to producers'
objectives, which include; the need for increased milk production, adaptability to local feed
13
conditions and diseases and the provision of non-market production, ergo manure,
insurance, financing and the social roles of cattle. Most smallholder farmers in developing
countries favour the cross breeding of the indigenous and exotic dairy cattle breeds in an
attempt to harness the positive traits of the different breeds (Pedersen and Madsen, 1998;
Masiteng and van der Westhuizen, 2001; Bebe et al., 2003; Weldeselasie, 2003; Kahi et al.,
2004). The reasoning being that the indigenous breeds are known to be well adjusted to their
environmental conditions. They are either tolerant or resistant to most of the prevalent
livestock diseases and pests and are generally hardy breeds. The exotic breeds on the other
hand are less adapted to tropical conditions, parasites and diseases, however, they are
known to produce high milk yields.
1.5 Calf Rearing
In the smallholder dairy production system, newborn calves are normally left to nurse on the
dam around the clock for a period ranging from 3 days to a week. The calves are then bottle
fed on either cow milk after milking or on milk replacers and calf starter rations until they are
at least 8 weeks old. Some farmers practise a controlled suckling strategy in which the
calves are allowed to suckle on the dam either twice or three times a day for a limited period
of time after milking. In this system, when milking, the farmer leaves behind a certain volume
of milk in the udder estimated to be enough to feed the calf. Under controlled suckling,
natural weaning (at about 6-10 months of age) is invariably practised by farmers. This
however fosters a strong maternal bond between the dam and the calf, which has been
shown to result in a prolonged postpartum anoestrus period (Bearden and Fuquay, 2000)
and hence longer calving intervals result. The newborn calf is kept within the homestead
while the dam is allowed to go and graze during the day until it is about two to three months
of age and can graze independently.
14
According to Reynolds et a/. (1996) in Kenya the survival rate of calves is affected by the
value placed on them by farmers in that female calves are given more feed than males since
the females are valuable for herd replacements and for sale to other farms. In a Tanzanian
case study, Lyimo et al. (2004) reported that newborn calves were allowed to stay with the
dam and suckle freely for more than four days, after which, they were placed on a restricted
suckling system in which they would be used to stimulate milk let down in the dam and then
allowed to suckle after milking. The calves were gradually weaned at an age of 4-6 months,
as the farmers considered late weaning as a way to reduce nutritional stress and a necessity
for stimulating milk let down before hand milking (Lyimo et a/., 2004).
Lyimo et al. (2004) further observed that while farmers appeared to be aware of the
importance of feeding a balanced ration to growing animals, the quality and quantities of the
provided feed seemed to be influenced by availability (of the feed ingredients) and resource
allocation rather than the need to supply quality feed to the animals, contributing to the low
calf survival and growth rates reported by farmers and key people interviewed.
1.6 General Animal Health
In a serological survey of bovine tick-borne diseases in Swaziland, Jagger et al. (1985) found
African redwater, caused by Babesia bigemina, to be endemic to Swaziland. The tick-borne
diseases, redwater (Bovine babesiosis) and gall sickness (Anaplasmosis) are big challenges
to dairying in Swaziland. The Holstein Friesian breed of cattle appears to be less resistant to
babesiosis than the Jersey breed and the indigenous Nguni breed. The strict weekly dipping
and/or spraying of cattle with acaricides, practised in the country contributes to the
susceptibility of the animals to the diseases since they are hardly exposed to the pathogens
(protozoan parasites) and hence cannot develop and maintain the antibodies at titre levels
required for the animals to gain tolerance to infections (Coetzer et al., 1994; Mkhonta, 1994;
Botha et al., 1996; Malima, 1999). Heartwater (Cowdriosis), a tick borne disease caused by
15
the rickettsia, Cowdria ruminantium (Coetzer et al., 1994) is also a problem to livestock
owners in Swaziland, especially in the highveld areas.
There was a foot and mouth disease outbreak in late 2001 and early 2002 in the Lubombo
and northern Hhohho regions in Swaziland. A lot of farmers lost their stock during this
outbreak and hence some went out of business, especially beef farmers. Legislation states
that state veterinarians should routinely test all dairy animals for bovine tuberculosis and
bovine brucellosis (Brucella abortus) as a prerequisite for the producers to sell their milk for
public consumption. This testing is, however, conducted only on the large-scale commercial
farms that either sell milk to Parmalat or privately package and distribute milk to
supermarkets. Since smallholder farmers do not need licences to sell milk in the informal
market, their animals are seldom tested for these diseases. This is dangerous because both
bovine tuberculosis and brucellosis are zoonotic and can be lethal. Mastitis is a common
problem in most farms but most smallholder farmers know that practising good hygiene and
milking practices go a long way in keeping the disease at bay.
The number of state veterinarians has increased with time in the country, with there being at
least two veterinarians in each of the four administrative regions. These officers are
invariably provided with the necessary transport in the form of government vehicles in order
to facilitate improved service provision to farmers. In addition to veterinarians, there are
veterinary assistants stationed within the communities, who advise farmers on animal health
issues. Some situations, however, do inevitably require the direct attention of a veterinarian
and in these situations; the question becomes whether or not they actually get that service
and how long it takes to receive it. In spite of the present human resource, many smallholder
farmers still express dissatisfaction with the state, animal health service provision. One of the
contributing factors to this state of affairs could be the fact that the veterinary offices are
stationed in the cities and towns, yet most livestock owners live out of town, in the rural
areas. Another factor could be centred on communication, since most smallholder farmers
16
have no telephones through which to contact the veterinary office. Most rely on public
transport to travel extensive distances and by the time they are able to get to the veterinary
office, it is often too late. This communication problem invariably results .in delayed or no
treatment of sick animals. Consequently, more virulent diseases like redwater result in
mortalities and where the animals recover, the farmers incur severe production losses.
According to Weldeselasie (2003), in Eritrea, available animal health (veterinary) services
are thinly spread and ineffective, as are drug availability and distribution, furthermore,
constraints to the successful control of diseases are not technological but related to the
availability and cost of treatment. Comparatively the situation is slightly different in Swaziland
in that veterinary drugs are widely distributed throughout the country through farm input
retailers and farmer co-operative depots. The cost of the drugs is, to some extent, however,
a limiting factor to their accessibility but the fact that state veterinarians are able to dispense
small quantities of medication at cost to farmers offsets the high costs.
1.7 Grazing and Feeding
Swaziland has a number of agro-ecological zones and hence a variation in the agricultural
potential in the different zones. The naturally growing tropical grass species range from the
sweet veld in the Lowveld to the sour veld in the Highveld, resulting from the differences in
rainfall, climate, soil types and pH (Sweet and Khumalo, 1994). Traditionally livestock kept on
SNL would be allowed to graze on the open plains on communal pastures. Herds from
different homesteads would share the vast resource during the day and in the evening the
animals would be kraaled in the homesteads. In the dry season (winter), after grain
harvesting, the animals would be allowed to graze on maize stalks left over in the cropping
fields.
17
Over time, the population of livestock has increased and the pasture resource has
increasingly declined in size as the land is continually being reallocated, primarily for human
settlement and crop production. There has been for some time now a major concern about
overstocking on the communal pastures since there is no existing system of control,
imposing a limit on the number of animals that can be grazed by each homestead in each
chiefdom. The overgrazing has resulted in extensive soil erosion in some areas and
generally a change in the rangeland grass species composition to less palatable increaser
species such as Hyparrhenia hirta and Sporobolus species (Sweet and Khumalo, 1994).
Bushes have encroached into therangelands with an increase in invader alien plant species
such as Lantana camara, Senna didymobotrya and most recently Chromolaena odorata
(Personal observation). The latter spreads rapidly, is extremely versatile and has allelopathic
effects (toxicity) on other vegetation, which result in the inhibition of the growth of grasses
and other plants in their vicinity. Chromolaena is present in South Africa, Swaziland,
Mozambique and possibly Zimbabwe (Zachariades and Goodall, 2002) and impacts
negatively on forestry, pastoral agriculture and natural vegetation (plant) biodiversity (von
Senger et al., 2002; Zachariades and Goodall, 2002). These factors compound the problem
of a diminished grazing resource, as the livestock population (grazers and browsers) in the
country remains high, the majority of which is on SNL.
Smallholder dairy farmers are encouraged to graze their stock privately in their homesteads
(away from the mixed herds in communal rangelands) in order to avoid the extensive walking
distances to grazing areas and watering holes that this system entails. The exotic dairy
breeds are docile and therefore prone to bullying by the more aggressive beef type cattle. In
intensive animal production systems, feed costs are generally acknowledged to make up
anything ranging from 60% to 70% of total production costs. The ideal of the Swazi
smallholder dairy production system is that each farmer should have at least one hectare of
planted pasture per dairy cow. This ideal is hardly ever met, either because of land shortage
or the lack of resources and skills to establish and maintain planted pastures (Ogwang, 1993;
18
Dlamini and Khumalo, 2000). The available land in the homesteads is primarily used for
housing and crop production, both of which take precedence over fodder or pasture
production. As a result there is a limited area of land available for cattle grazing and it is
usually undeveloped, leaving the cattle to graze on naturally growing grass species. A few
smallholder farmers have planted pastures, with the favoured species being Rhodes grass
(Ch/oris gayana) , Kikuyu (Pennisetum c/andestinum) , Italian Rye grass (Lo/ium mu/tiflorum) ,
Paspa/um notatum, Star grass (Cynodon dacty/on) and Elephant grass (Pennisetum
purpureum).
Fodder crops are not commonly grown by most of the farmers and hence in the dry season
the only abundantly available fodder resource is maize stover left over after grain harvesting.
The stoveris utilised in a number of ways; as is, chopped or chopped and mixed with urea
and molasses. Hay is often sought from neighbouring commercial farms or imported from
South Africa with the help of the MOAC and SODS who facilitate transport and scout for hay
retailers. There are a number of potential feed ingredients locally available in the country,
however, not all of them are readily available to smallholder farmers, either because the feed
manufacturing companies and large-scale commercial farmers get first preference in
purchasing them, or because the sources are very far from where the farmers reside and,
hence, imply high transportation costs. These ingredients are often agro-industrial by
products such as molasses, bagasse, sugar cane tops, cottonseed, fruit canning waste (pulp
or pellets), hominy chop, wheaten bran and spent brewer's grain (Taylor and Xaba, 1994).
Hominy chop is the most abundant of these ingredients, since it is a by-product of milling
maize into maize meal, and there are a lot of community based maize hammer mills in the
rural areas (SNL). This hominy chop is often sold cheaper in the rural areas, however, the
millers have begun to increase the prices in response to the increasing demand by farmers.
In Kenya, Reynolds et a/. (1996) reported that about 20% of farmers regularly purchase
fodder and that other roughage sources commonly used include maize stover, banana stems
and roadside grass (a generic term for natural pasture from a variety of sources).
19
The production systems employed by Kenyan smallholder farmers range from stall-fed cut
and-carry systems, supplemented with purchased concentrate feed in areas of high
population density where extensive systems are not possible, to free grazing on unimproved
natural pasture in the more marginal areas (Reynolds et al., 1996). In Eritrea, Weldeselasie
(2003) described a zero grazing production system in which the cattle are kept in barns and
are stall...;fed on forage and commercial dairy concentrate feed. The green forage supply
reportedly consists mainly of green maize and/or barley at milk stage, spinach and other
leafy vegetable wastes and limited quantities of Lucerne and Napier grass. In Asia, feed
resources and nutrition constitute the principal technical constraints to ruminant production
(Devendra and Sevilla, 2002). Rao and Hall (2003) reported that the mixed crop-livestock
systems of India are underpinned by the crop residues, which contribute on average 40-60%
of the total dry matter intake per livestock unit. In most instances, the efforts of smallholder
dairy farmers to establish pastures and/or grow fodder crops are stifled primarily by the fact
that they invariably have very small pieces of land and as a result their dry season milk yields
are generally low and they have to rely on purchased forages for their cattle (Tambi, 1991;
Mutukumira et al. , 1996; Hanyani-Mlambo et al., 1998; Weldeselasie, 2003 and Lyimo et al.,
2004).
Commercial dairy concentrates are recommended for supplementary feeding to lactating
cattle throughout the lactation period in order to meet their energy, protein and mineral
requirements. There are three major animal feed manufacturing factories in Swaziland and
they are all located in the industrial area in Matsapha, in the Manzini region and have
distribution depots in the major towns and cities. Some independent retailers also sell
imported commercial dairy concentrates from South Africa. Some ingredients used in the
formulation of the feeds are obtained from within Swaziland and the majority imported from
South Africa. The high cost of commercial dairy concentrates has led to most smallholder
farmers either diluting the concentrate feed in an attempt to make it last longer or only
feeding concentrates when they have the money to buy them. Weldeselasie (2003) reported
20
that in Eritrea, the smallholder farmers receive the dairy concentrate from the government
run milk-processing plant in quantities commensurate to the amount of milk they supply for
processing. The concentrate feed is commonly mixed with hominy chop on a 1: 1 (volume)
basis or mixed with hominy chop and molasses meal.
The dilution of the concentrate feed in essence deprives the cattle of the required nutrients,
primarily the protein and to some extent energy. Given the desperate nature of the grazing
situation, it follows, therefore, that milk yield would expectedly be negatively affected by the
dilution since the dietary metabolisable energy and protein (ME and MP) are reduced by
diluting the feed by what is primarily a source of fibre. The occasional feeding of
concentrates according to resource availability is highly likely to result in reduced milk yields
from the cattle, even at the most productive phases of lactation. In this situation, the potential
for high milk yield after peak lactation would not be realised, since at this stage, the appetite
of the animal is on the increase and the animal has already used up its body reserves for
milk synthesis. Hence, the diet is required to provide sufficient protein and energy for
maintenance, weight gain and milk synthesis. If these nutritional requirements are not met,
the milk yield would be expected to decline more rapidly than normal and the cow would not
improve in body condition, hence, it may have an extended postpartum anoestrus period.
The prolonged postpartum anoestrus would then result in long calving intervals and either
extended lactation periods (over 305 days) or extended dry periods.
21
1.8 Milk Collection and Marketing
The smallholder dairy farmers milk their cows by hand, mostly twice a day, under a shed or a
milking parlour (accommodating one cow at a time) constructed from concrete blocks. The
animals are normally coerced into milking by providing feed during the milking sessions. The
milk is collected into buckets and is then strained of any foreign matter. The majority of
smallholders do not have milk-cooling facilities and hence either have to sell their milk quickly
or allow it to naturally ferment at room temperature into emasi. The fermentation results in a
loss in volume since the whey is not sold but is strained and either fed to pigs and dogs or
simply discarded. Most farmers sell the milk to their neighbours and those that have vehicles
supply their customers in the urban areas with both fresh milk and emasi. In South Africa,
Masiteng and van der Westhuizen (2001) reported that the smallholder farmers prefer to sell
their milk in their neighbourhoods since the prices there are higher than when milk is sold to
processors. In essence, an increase in production volume beyond the local consumption or
demand compels the farmers to sell the excess milk to processing companies at far lower
prices than they would have received in the informal market. Kaziboni et al. (2004) reported
that during the rainy season, excess milk is discarded due to the lack of bulk cooling facilities
in Nharira-Lancashire, Zimbabwe, which acts as a disincentive to producers and prospective
farmers.
In an attempt to improve dairying, the Swazi government in the early 1990's solicited the help
of the FAO in the preparation of a national dairy development plan. This included setting up
two pilot smallholder milk producer and marketing groups, one in the Hhohho region and
another in Mpaka. The Hhohho milk collection and marketing group (co-operative) is fully
operational and consists of a bulk milk cooling tank, a marketing section for milk and emasi
and a farm input store. The member farmers bring daily milk collections into the pool and
each farmer's contribution is recorded, and when the milk is sold each farmer receives
revenue according to his or her contribution. The formal fresh milk market prices (prices
offered by milk processing companies) are still not favourable to producers and hence both
22
smallholder and large-scale commercial farmers are trying alternative means. The
smallholder farmers prefer the informal market for retailing of dairy produce because of better
prices. a phenomenon that appears to be generally common in Southern Africa (Mutukumira
et al .• 1996; Hanyani-Mlambo et al .• 1998; Masiteng and van der Westhuizen. 2001). In
Cameroon. Tambi (1991) reported that the low milk prices offered to producers' act as a
disincentive for increased investment and production of milk to the farmers. In Swaziland. the
commercial farmers are increasingly adopting the strategy of vertical integration. in which
they practise processing (pasteurising fresh milk and producing emasi). packaging and
distributing dairy produce to supermarkets and other retailers.
The objective of any farming enterprise is that the farmer makes a living from his or her
produce. however the low fresh milk market prices have seen a lot of smallholder and large
scale commercial farmers leave the industry. The option of processing. packaging and
distributing of dairy products is not an easy one for smallholder farmers primarily because of
the small scale of their production set up and the fact that it requires a lot of capital and
resources to which most have no access. The only option is to devise means that will make
the milk collection schemes profitable and then increase their numbers across the country. In
the areas where milk collection schemes (dairy co-operatives) have been established. the
sparse distribution of the member farmers from the collection centre introduces a problem in
the transportation of milk from each homestead to the centre, a problem duly noted by
Hanyani-Mlambo et al. (1998) in Zimbabwe. In addition to the milk transportation problems.
the farmers acknowledge (personal communication) that while selling their milk at the centre
provides a steady substantial revenue. which they can reinvest into procurement of feeds
and veterinary drugs. the price at which milk is sold at the centre is lower than that at which
they sell it at their homesteads to their neighbours. As a result some farmers confessed to
withholding some of their milk from the centre in order that they may make some more
money from their home sales. The fluctuating milk production levels and inconsistent milk
supply to the centre. makes smallholder farmers an unreliable supply source of milk to
23
processors and hence it is difficult for the SDDS and/or MOAC to organise a contract market
for them with milk processing companies.
Farmer cooperatives, by virtue of their collective membership, provide the farmers with a
vantage point in terms of economies of scale and their bargaining power (Morton and
Miheso, 2000). They provide farmers with a reliable market for their daily milk produce as
opposed to hawkers and individual customers, whose milk demand is erratic and is mostly
influenced by the proximity of the farmer to the densely populated urban areas, with high
demand for milk and dairy products in these areas (Hanyani-Mlambo et al., 1998; Morton and
Miheso, 2000). In Central Kenya, Morton and Miheso (2000) observed that farmers are
prepared to accept lower milk prices from co-operatives than they would get elsewhere, if the
package includes: monthly payment which allows budgeting for livestock and other expenses
and a degree of short-term credit to allow access to feed and AI.
In spite of its problems, smallholder dairying remains a worthwhile venture for the
development of rural communities and as a source of income and nutrition for many people
in these rural communities. The onus 'is, however, upon farmers, SDDS and MOAC to create
an environment in which smallholder dairying will become a viable business venture for
farmers. The challenges to achieving this include adequate land allocation to farmers,
training of farmers on dairy husbandry, pasture and fodder production, establishing more milk
collection centres, provision or availability of affordable dairy animals, establishment of sound
breeding programmes, efficient milk collection networks and markets that will bring in
acceptable revenues to the producers. In essence, what has to be achieved is a more
efficient system of smallholder milk production and marketing so as to minimise the
production and marketing costs, while maximising the revenue.
24
1.9 Objectives Of The Study
The SDDS has long established that there is a disparity between the supply and demand of
milk in Swaziland and, as such, the deficit has, and is, continually being made up for by
importing a growing quantity of both liquid and powdered milk into the country. In Swaziland,
there is no documentation of the quantity of milk produced by smallholder farmers and,
hence, their contribution to the local milk market remains unknown. Furthermore, the
potential of smallholder dairy producers and the constraints they face are not fully
understood. The overall objective of this study was to assess the present situation of
smallholder dairying in the country, with special focus on the Manzini region and surrounding
areas. The specific objectives were:
• To better understand the dynamics of smallholder dairying in Swaziland.
• To identify and understand the main constraints on smallholder dairying and to
hopefully devise workable solutions to these constraints.
25

Chapter 11
26
Smallholder Dairy Production In Swaziland; Manzini Region & Surrounding Areas
Abstract
For years, milk production in Swaziland has been, and continues to be, less than the market
demand. The quantitative contribution of smallholder dairy farmers to local milk production
remains unknown because of poor record keeping. A sample of 118 smallholder dairy farms
were covered in this study with total herd of 306 lactating cows, mainly Jerseys and Holstein
Friesians with some cross breeds. There were no significant differences (P > 0.05) in mean
milk yield/cow with respect to farmer gender and agro-ecological zone location of the farms.
Milking frequency had a significant effect on milk yield since cattle milked once a day had
lower (P < 0.05) milk yields than those milked twice a day. The cattle had extensively long
calving intervals i.e. 448± 166 days, ranging from 292 to 1082 days. Low milk yield and poor
reproductive performance of cattle were found to be mainly due to poor nutrition, breeding
practices and stock quality. These are primarily a result of insufficient farmer training and
inadequate technical assistance, scarcity of quality stock, lack of investment resources and
market support with favourable milk prices for farmers to make money.
2.1 Introduction
The Swaziland milk production sector is made up primarily of a few large-scale commercial
farmers (on TDL) and the numerous smallholderfarmers on SNL. According to the SDDS, in
the year 2002 there were 359 (86.51%) smallholder dairy farmers on SNL and 56 (13.49%)
commercial dairy farmers on title deed land (TDL). Amongst the SNL farmers, some keep
dairy animals solely for the purpose of feeding their families whereas others practise dairying
in order to generate income and feed their families. The smallholder farmers normally have a
few animals (1-20 cows) and use a low input type of production system. Land, labour and
27
capital are the scarce resources required for agricultural production. Land and capital
scarcity have a huge negative impact on the production of smallholder dairy farmers.
Swazi smallholder dairy farmers are mainly made up of the following:
1) Working class individuals, who spend most of their time away from the dairy projects (Le.
at work) and either see them in the evenings or only on weekends, relying on either un-'
employed family members or hired staff to look after the animals in their absence.
2) Pensioners, who invest their gratuity and engage themselves in the dairy industry after
their working life. Most of them do not have an idea of how demanding it is to run a dairy
project and are neither mentally nor physically prepared to cope with the amount of work
required of them on a daily basis. Consequently, they resort to hired hands to help and in
most instances the projects eventually flop.
3) A small number of the farmers are self-employed people whose livelihood is solely
dependent on farming, albeit they are involved in multiple agricultural enterprises
(especially maize growing), which tend to take precedence over dairying. Some of these
farmers are also involved in other non-agricultural enterprises.
On SNL, dairy animals are grazed within the farmers' homestead and are not commonly
grazed in communal pastures in order to avoid indiscriminate breeding (ideally) and the
extensive walking distances, which this entails. Consequently the farmer has to convert crop
growing fields within the homestead into pasture. The need for land to produce crops for
human consumption always takes precedence over animal feed production, resulting in very
small areas of land being allocated to pastures. Most smallholder dairy farmers have no
planted pastures and therefore rely on the naturally occurring tropical grasses (natural veld),
most of which are lower in nutritional value than the temperate species. During the dry
season the grass senesces quickly, which leads to lignification and a decline in crude protein
28
content (Roothaert, 2000). The result is then a decline in animal productivity and a loss of
body condition.
Animal nutrition is one of the main constraints faced by the smallholder farmers since they
totally rely on naturally growing grass on limited pieces of land for feeding dairy cows. They
do not grow fodder crops save for the maize stover remaining after grain harvesting. As a
result they have to buy hay and other fodder types to supplement animals in the dry season
and these are not only scarce but also expensive. The commercial dairy concentrates are
also costly, with most farmers having to incur the extra costs of transporting the feed to their
distant homesteads.
Capital resources for investment in the dairy projects in the form of loans are not forthcoming
since the financial institutions normally require the borrower to put forth some form of
collateral before the loan can be granted. Farmers on SNL do not own the land that they use
for production and, hence, cannot use it as surety for loan repayment. Another problem is
that the financial institutions require some form of a business plan, which entails a cash flow
budget and since most of these farmers do not keep any production records it is difficult for
them to receive the help they require.
Most of the milk produced by these farmers is sold in the informal market at a more
favourable price than that offered by the commercial milk processing companies. The
amount of milk they produce can, therefore, not be quantified since only a few of them keep
production records. The problem, however, with the informal market is its seasonal and
inconsistent demand for milk, as it is high in the dry season and low in the wet season. The
reason being that in summer there is an abundance of food from the previous year's harvest
and most consumers change their diets to vegetables and herbs, which are abundant and
mostly free growing at this time of the year as opposed to the winter when they are minimal.
29
The objectives of this study were to define and understand the smallholder dairy production
sector in Swaziland, outlining production constraints faced by the farmers and possibly to
propose solutions that could help improve milk production by smallholder dairy farmers.
2.2 Materials & methods
Swaziland is located in the south-eastern part of Africa between latitudes 25°30' and 27°30'S
and longitude 30°45' and 32°0TE. It is almost entirely surrounded by South Africa save for
the eastern portion bordering Mozambique. The country has four major agro-ecological
zones; namely the Highveld, Middleveld, Lowveld, and the Lubombo plateau. In terms of
physiography, the Middleveld and Lowveld both contain two distinct zones i.e. upper and
lower middleveld (separated by altitude and geology) and eastern and western Lowveld
(separated by geology) (Sweet and Khumalo, 1994). Swaziland therefore has six agro
ecological zones when physiography is taken into consideration. The characteristics of the
agro-ecological zones are shown and discussed in chapter1 (Table 1.1).
A total of 118 randomly selected smallholder dairy farms, mostly on SNL from the Manzini
region were used as data collection stations. Some of the farmers in the study were affiliated
to dairy co-operative societies. The Manzini region was chosen for the study because it has
the highest number of smallholder dairy farmers (SDDB, 2002). Manzini was the logical
choice, given the limitations of time and resources at the time of conducting the study and in
addition it is the hub of the country. The information on farmer location was obtained from the
dairy extension records of the Ministry of Agriculture and that of the Dairy Development
Board. The Manzini region spans over three agro-ecological zones, namely the highveld,
upper middleveld and the lower middleveld. The smallholder dairy farms used in this study
are by location randomly distributed amongst these three agro-ecological zones.
30
Data collection was done between November 2003 and March 2004 by means of a
questionnaire, which was filled in by the researcher upon orally interviewing the farmers and
herdsmen. The farm visits were timed to coincide with the early morning milking time of most
farmers. Observations of the handling and management of the dairy animals were objectively
noted from a technical perspective on each farm as the farmers went about their daily milking
and feeding routines on the farms. The collected data include visit (test) day milk yields,
breeding and reproductive performance records, feeding strategies, milk marketing and
constraints on smallholder dairying. The cattle in this study were at different stages of
lactation, age groups and parity. Due to poor record keeping, detailed breeding data was
obtained only from a few elite record-keeping farmers.
Data analyses of variance (ANOVA) were conducted on GenStat 6th edition (2002) and
descriptive statistical analysis was performed on SAS (2002).
2.3 Results & Discussion
Of the 118 farms, the majority of owners (81.36%) were male and the female farmers were
the minority (18.64%). This is, however, not entirely a true reflection of the actual situation
since most female farmers could have registered their dairy projects in the names of their
husbands even when the husbands aren't actively involved in dairying. This is in conformity
to the old Swazi custom and tradition which hands ownership of any major projects or family
assets to the head of the family. The distribution of the farms by location was such that
50.0%, 32.3% and 17.8% of the respondents originated from the upper middleveld, the
highveld and the lower middleveld, respectively.
The Manzini region is the hub of Swaziland and the upper middleveld almost invariably cuts
through the centre of the country. This part of the country is fairly well developed in terms of
infrastructure, is nearer to town and the industrial area (milk market availability) as well as to
31
feed mills and other farm input retailers. It is however, more densely populated and hence
there is less land available for grazing cattle in the available SNL.
The lower middleveld is more distant from major towns, industrial areas, feed mills as well as
farm input retailers. It is drier (receives less annual rainfall) than the upper middleveld and
highveld. The highveld receives the most annual rainfall and is much cooler than the
middleveld, however, most of the farms here are distant from major towns, feed mills and
other farm input retailers. The grazing land availability problem, however, is inherent in all
agro ecological zones of the country on SNL, with the exception of a few farmers.
2.3.1 Herd Structure And Breed Composition
The total herd of cattle (from 118 farmers) consisted of 306 lactating cows, 85 dry cows, 128
heifers, 248 calves, 41 bullocks and 33 bulls as shown in Table 2.1. The population of
lactating cows in comparison with the number of farmers is very low, giving a mean of 2.6 (3)
cows per farmer. The calves were notably fewer than lactating cows, which raises questions
about the fertility of the cows, the breeding systems, general animal health, nutrition and
possibly the calf rearing skills of some of the farmers.
The commonly kept breed of dairy cattle amongst the smallholder farmers is the Jersey,
followed by the Holstein Friesian and their crosses. A very limited number of farmers also
keep Ayrshire, Guernsey and Brown Swiss breeds. This fact is clearly emphasized by the
breed distribution in Table 2.2. As noted in Table 2.2, most farmers had a variable mix of
pure breeds and crosses that were used for dairying.
32
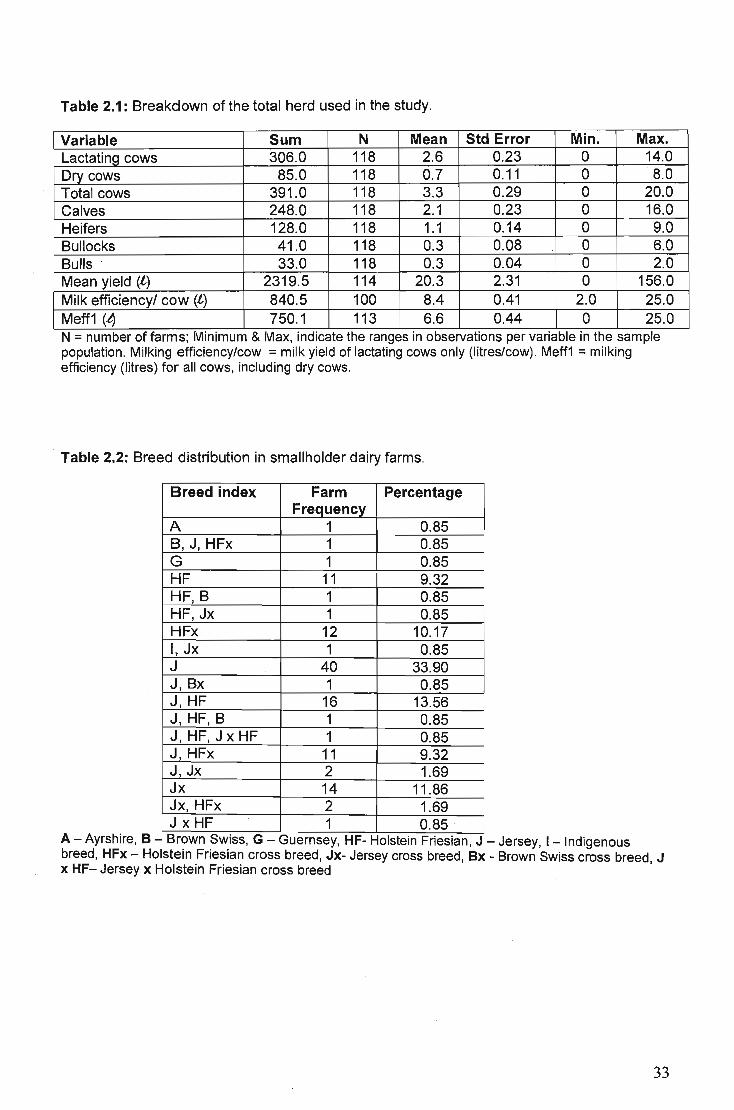
Table 2.1: Breakdown of the total herd used in the study.
Variable Sum N Mean Std Error Min. Max. Lactating cows 306.0 118 2.6 0.23 0 14.0 Dry cows 85.0 118 0.7 0.11 0 8.0 Total cows 391.0 118 3.3 0.29 0 20.0 Calves 248.0 118 2.1 0.23 0 16.0 Heifers 128.0 118 1.1 0.14 0 9.0 Bullocks 41.0 118 0.3 0.08 0 6.0 Bulls 33.0 118 0.3 0.04 0 2.0 Mean yield (t) 2319.5 114 20.3 2.31 0 156.0 Milk efficiency! cow (t) 840.5 100 8.4 0.41 2.0 25.0 Meff1 (4 750.1 113 6.6 0.44 0 25.0 .. N = number of farms; Minimum & Max, indicate the ranges In observations per vanable In the sample population. Milking efficiency/cow = milk yield of lactating cows only (litres/cow). Meff1 = milking efficiency (litres) for all cows, including dry cows.
Table 2.2: Breed distribution in smallholder dairy farms.
Breed index Farm Percentage Frequency
A 1 0.85 B, J, HFx 1 0.85 G 1 0.85 HF 11 9.32 HF, B 1 0.85 HF, Jx 1 0.85 HFx 12 10.17 I, Jx 1 0.85 J 40 33.90 J,Bx 1 0.85 J, HF 16 13.56 J,HF,B 1 0.85 J, HF, J x HF 1 0.85 J, HFx 11 9.32 J,Jx 2 1.69 Jx 14 11.86 Jx, HFx 2 1.69 J x HF 1 0.85
A - Ayrshire, B - Brown SWISS, G - Guernsey, HF- Holsteln Friesian, J - Jersey, I-Indigenous breed, HFx - Holstein Friesian cross breed, Jx- Jersey cross breed, Bx - Brown Swiss cross breed J x HF- Jersey x Holstein Friesian cross breed '
33
The Jersey is the most predominant breed, found in 33.9% of the farms as the sole breed. It
is the most favoured breed because of its hardiness and low maintenance requirements in
addition to the high butterfat content of its milk. The Holstein Friesian breed was found in
9.32% of the farms as the sole breed. Most farmers shy away from this breed because it is
more expensive, less hardy and has higher maintenance requirements compared to the
Jersey. It is, however, a very high milk yielding breed and hence 13.56% of the farmers kept
it in combination with the Jersey breed in an attempt to balance the high milk yield with the
high butter fat content of the Jersey milk. The Ayrshire, Brown Swiss and Guernsey are the
least kept breeds, primarily because of their low popularity and poor stock availability in
Swaziland.
A major factor that contributes to the breed orientation of the Swazi smallholder dairy
industry is that stock acquisition (importation), normally conducted by the SDDB in
collaboration with the MOAC, mainly focuses on Holstein Friesian and Jersey cows (the
abundantly available breeds) from South Africa. An additional factor is that these are the
breeds that the farmers also know and trust.
The poor breeding programmes employed in most of these farms coupled with the desire to
have low maintenance dairy animals (to conform to the low input production system often
practised by smallholder farmers) have resulted in a number of farmers cross breeding the
exotic dairy breeds with indigenous and other tropical breeds such as the Nguni, Brahman
and others. The offspring of these crosses is then used as replacement stock for their
enterprises or sold to other aspiring dairy farmers.
The F1 resulting from this out crossing are much hardier than their exotic parental generation
but do, however, lose the high milk yielding genetic potential possessed by the pure dairy
breeds. If this cross breeding were done strategically, the F1 females would certainly give
higher milk yields under good management than the indigenous breeds. The challenge,
34
however, is that this newly formed crossbreed (F1) could not easily be reproduced en mass
without reducing genetic variation in the F2 generation. The loss of genetic variation would
therefore mean the loss of hybrid vigour, hence, milk yield would likely decrease. A simplistic
solution to this problem is that there would have to be a government-run breeding facility to
constantly supply the farmers with the F1 (crossbreed) heifers as replacement stock. The
farmers would have to exchange their male calves or cash at government revenue offices for
the F1 replacement heifers at an annually revised predetermined cost recovery rate.
The application of such a breeding programme might not be financially viable since it would
require that a breeding facility with a large stud herd be maintained for the production of the
F1 crossbreed. Such a project was at some time attempted by the Swazi government during
which Brahmans were bred with the exotic dairy breeds in government farms. The F1
crosses were then sold to farmers for milk production, however, these animals were then
indiscriminately back-crossed by farmers with other non-dairy breeds, including the
indigenous Nguni and hence the F2 and F3 generations lost their high milk yielding genetic
potential. The Swazi government already has an established dairy farm, whose main
purpose is to train farmers in dairy husbandry as well as provide replacement stock at cost
(below free market prices) to smallholder farmers. One solution would therefore be for
government to restore this farm to its full operational capacity in order to facilitate a more
efficient AI-based breeding programme of the Holstein-Friesian and Jersey breeds to meet
the already existing high demand for these breeds. This would ensure that the farmers
receive replacement stock of high genetic quality and increase milk yields. The AI service
provision programme, currently run by SDDB, and in which, some key farmers in the
communities are trained to be inseminators, would complement this programme.
35
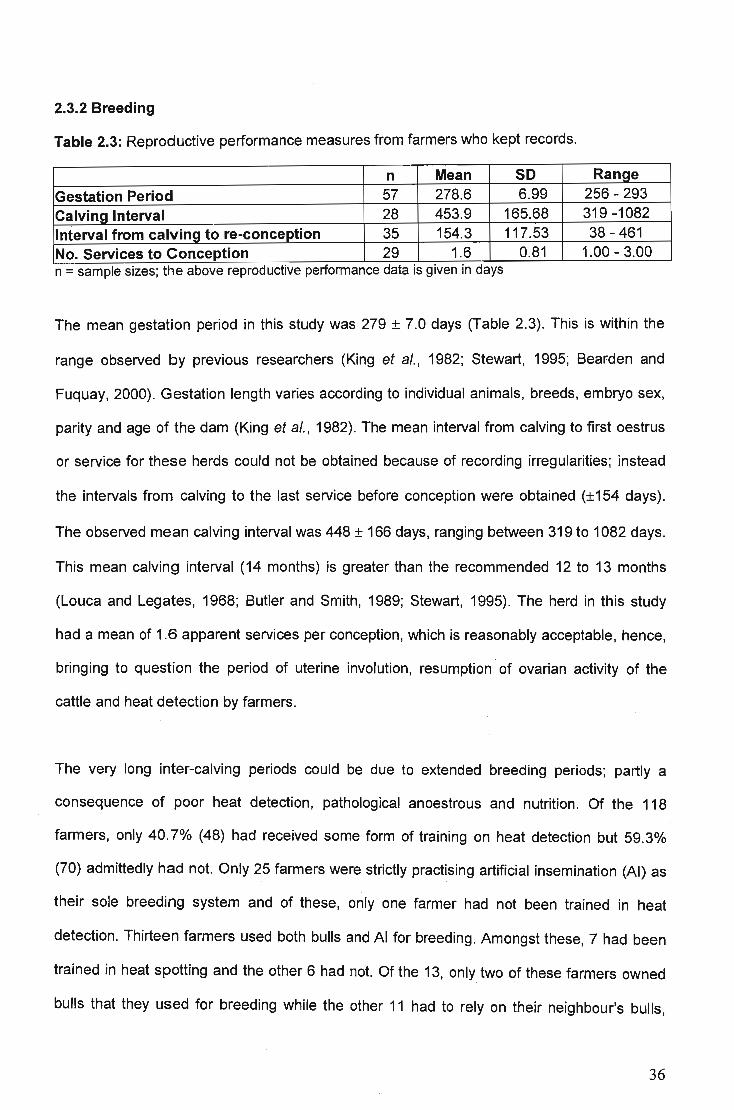
2.3.2 Breeding
Table 2.3: Reproductive performance measures from farmers who kept records.
n Mean SO Range Gestation Period 57 278.6 6.99 256 - 293 Calving Interval 28 453.9 165.68 319 -1082 Interval from calving to re-conception 35 154.3 117.53 38 - 461 No. Services to Conception 29 1.6 0.81 1.00 - 3.00 n = sample sizes; the above reproductive performance data IS given In days
The mean gestation period in this study was 279 ± 7.0 days (Table 2.3). This is within the
range observed by previous researchers (King et al. , 1982; Stewart, 1995; Bearden and
Fuquay, 2000) . Gestation length varies according to individual animals, breeds, embryo sex,
parity and age of the dam (King et al., 1982). The mean interval from calving to first oestrus
or service for these herds could not be obtained because of recording irregularities; instead
the intervals from calving to the last service before conception were obtained (±154 days).
The observed mean calving interval was 448 ± 166 days, ranging between 319 to 1082 days.
This mean calving interval (14 months) is greater than the recommended 12 to 13 months
(Louca and Legates, 1968; Butler and Smith, 1989; Stewart, 1995). The herd in this study
had a mean of 1.6 apparent services per conception, which is reasonably acceptable, hence,
bringing to question the period of uterine involution, resumption of ovarian activity of the
cattle and heat detection by farmers.
The very long inter-calving periods could be due to extended breeding periods; partly a
consequence of poor heat detection, pathological anoestrous and nutrition. Of the 118
farmers, only 40.7% (48) had received some form of training on heat detection but 59.3%
(70) admittedly had not. Only 25 farmers were strictly practising artificial insemination (AI) as
their sole breeding system and of these, only one farmer had not been trained in heat
detection. Thirteen farmers used both bulls and AI for breeding. Amongst these, 7 had been
trained in heat spotting and the other 6 had not. Of the 13, only two of these farmers owned
bulls that they used for breeding while the other 11 had to rely on their neighbour's bulls,
36
which were not necessarily dairy breeds. Eighty farmers (67.8%) of the 118 only used bulls
exclusively for breeding and only 38 (47.5%) of these farmers actually owned the bulls. The
remainder relied on neighbouring dairy farmers to lend them bulls when their cows overtly
manifested heat (standing heat). It is, however, not always possible to get the bull at the
required time, hence, the cows are not serviced at times or are then covered by non-dairy
bulls (beef &/or dual purpose breeds). The unfortunate outcome, however, is that the cows
either have extensively long inter-calving periods and/or the offspring resulting from this
unplanned crossbreeding are used as replacement stock (Table 2.2). Whilst interested
farmers should be provided with training on pertinent aspects of dairy husbandry, they should
be encouraged to use bulls either singly or as a group. The use of AI WOUld, however,
eliminate the extra responsibility of managing and feeding a bull, simultaneously ensuring the
introduction of good genotypes and genetic variation in the herds. The logistics of the AI
programme, currently in use need to be reviewed to enable efficient service provision.
The pre and postpartum condition of the cows and their management (husbandry and
physical environment) have a bearing on their physiology, hence, poor management could
be the cause of poor reproductive performance (delayed uterine involution and resumption of
ovarian activity). Gier and Marion (1968) reported that the shrinkage of the vascular system
and muscular contractions continued to reduce the size of the post-gravid bovine uterus until
it reached a near pregravid size by 40 to 50 days postpartum. Puerperal condition exerts the
most noticeably widespread influence on both the ovarian activity and uterine involution in
postpartum cows, while the level of total digestible nutrients (TON) plays an important role in
the resumption of ovarian activity (El-Din. Zain et al., 1995). Dams without puerperal
complications ovulated earlier (at 22 days) than those encountering puerperal complications
(~ 31 days) (El-Din. Zain et al., 1995). Puerperal disorders (retained foetal membranes,
parturient paresis, reproductive system infections and ovarian cysts) were found to have
detrimental effects on the calving to first oestrus interval, calving to first service interval,
37
calving to conception interval, calving interval, services per conception and conception rate
at first service (Scheidegger et al., 1993; Risco et al., 1994). Negative energy balance
(NEBAL) primarily appears to interfere with the ability of the hypothalamo-hypophyseal axis
to develop the pulsatile luteinising hormone (LH) pattern necessary for fostering ovarian
follicular development and ovulation (Butler and Smith, 1989). The NEBAL is related to lower
fertility (longer postpartum anovulatory period) in dairy cows both through effects exerted in
early lactation and later during the breeding period (Butler, 2003).
The observed postpartum voluntary waiting period is extensive, given that the interval from
calving to the last service before conception was ±154 days, with an average of 1.6 services
to conception. The recommended rebreeding time is on the first oestrus occurring after 45-60
(Stewart, 1995) or 60 days postpartum (Foote, 1978). This voluntary waiting period before
breeding accommodates complete uterine involution and the resumption of normal cyclic
ovarian activity of the postpartum cows, both of which are essential for normal reconception
and gestation. Once initiated, cyclic ovarian activity in postpartum dairy cows seems to
continue regularly, hence the re-establishment of ovulatory cycles early after parturition
assures multiple oestrus cycles prior to the recommended breeding period and therefore has
a positive influence on conception rates (Butler and Smith, 1989).
2.3.3 Milking Management
All the smallholder farmers practise hand milking and the cows are often milked in a shed or
open space. During the milking session, the cows are invariably fed to ensure their
compliance to being milked. Feeding is either on a fixed scale across the herd or for the
duration of the milking session. The cows are fed on a variety of feeds ranging between
commercial dairy concentrate, hominy chop, crushed yellow maize, dairy concentrate mixed
with hominy chop and other home made rations. The cattle voluntarily approach the milking
parlour or shed around the expected milking time, perhaps in anticipation of the feed they will
38
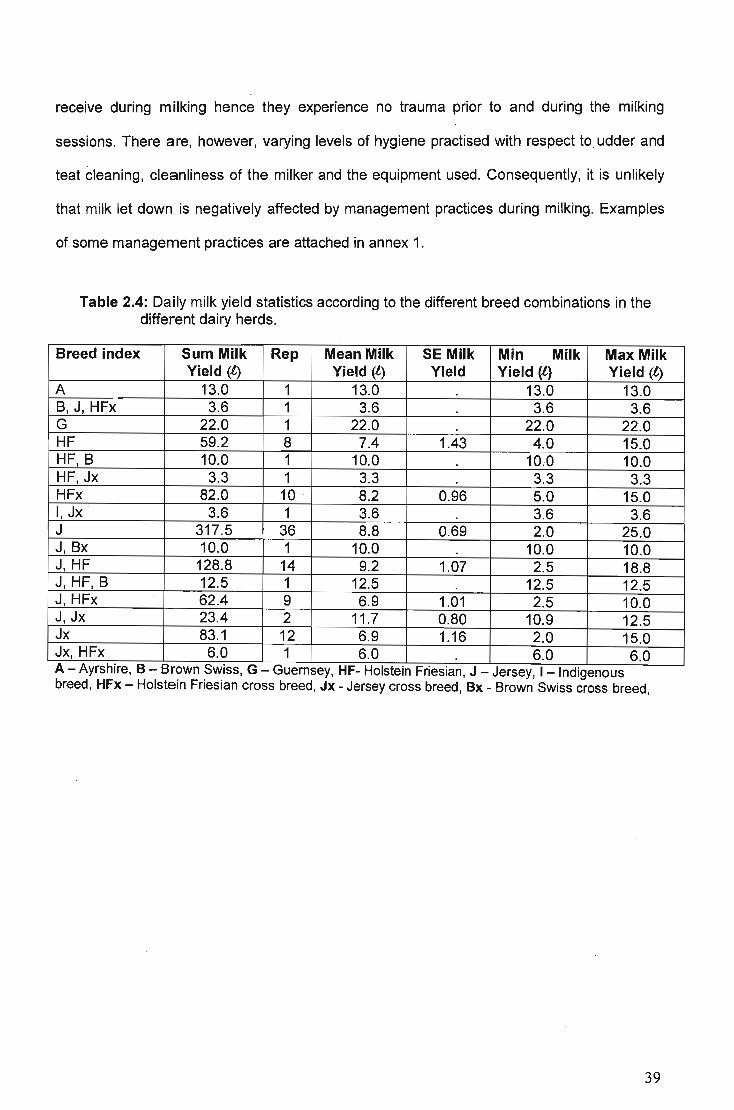
receive during milking hence they experience no trauma prior to and during the milking
sessions. There are, however, varying levels of hygiene practised with respect to. udder and
teat cleaning, cleanliness of the milker and the equipment used. Consequently, it is unlikely
that milk let down is negatively affected by management practices during milking. Examples
of some management practices are attached in annex 1.
Table 2.4: Daily milk yield statistics according to the different breed combinations in the different dairy herds.
Breed index Sum Milk Rep Mean Milk SE Milk Min Milk Max Milk Yield (l) Yield (l) Yield Yield (t) Yield (t)
A 13.0 1 13.0 13.0 13.0 8, J, HFx 3.6 1 3.6 3.6 3.6 G 22.0 1 22.0 22.0 22.0 HF 59.2 8 7.4 1.43 4.0 15.0 HF,8 10.0 1 10.0 10,0 10.0 HF, Jx 3.3 1 3.3 3.3 3.3 HFx 82.0 10 8.2 0.96 5.0 15.0 I, Jx 3.6 1 3.6 3.6 3.6 J 317.5 36 8.8 0.69 2.0 25.0 J, 8x 10.0 1 10.0 10.0 10.0 J, HF 128.8 14 9.2 1.07 2.5 18.8 J, HF, 8 12.5 1 12.5 12.5 12.5 J, HFx 62.4 9 6.9 1.01 2.5 10.0 J, Jx 23.4 2 11.7 0.80 10.9 12.5 Jx 83.1 12 6.9 1.16 2.0 15.0 Jx, HFx 6.0 1 6.0 6.0 6.0 A - AyrshIre, B - Br?wn ~~ISS, G - Guernsey, HF- Holstem Fneslan, J - Jersey, 1- Indigenous breed, HFx - Holstem Fneslan cross breed, Jx - Jersey cross breed, Bx - Brown Swiss cross breed,
39
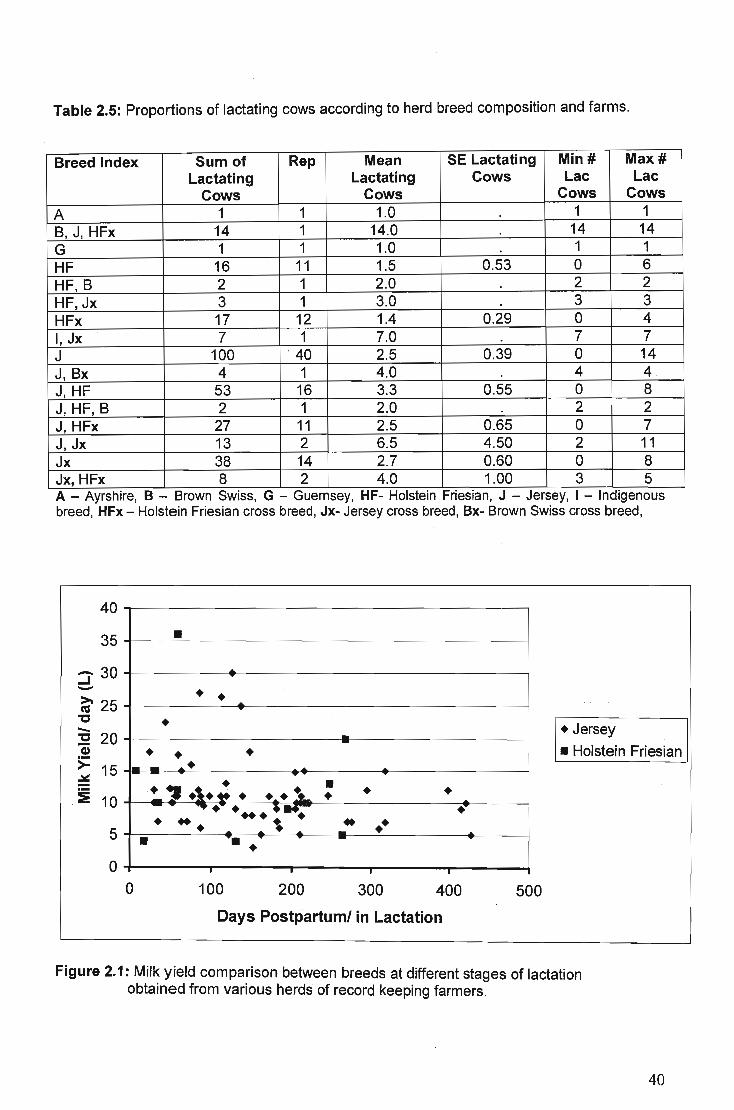
Table 2.5: Proportions of lactating cows according to herd breed composition and farms.
Breed Index Sum of Rep Mean SE Lactating Min# Max# Lactating Lactating Cows Lac Lac
Cows Cows Cows Cows A 1 1 1.0 1 1 B, J, HFx 14 1 14.0 14 14 G 1 1 1.0 1 1 HF 16 11 1.5 0.53 0 6 HF,B 2 1 2.0 2 2 HF,Jx 3 1 3.0 3 3 HFx 17 12 1.4 0.29 0 4 I, Jx 7 1 7.0 7 7 J 100 40 2.5 0.39 0 14 J, Bx 4 1 4.0 4 4 J, HF 53 16 3.3 0.55 0 8 J, HF, B 2 1 2.0 2 2 J, HFx 27 11 2.5 0.65 0 7 J, Jx 13 2 6.5 4.50 2 11 Jx 38 14 2.7 0.60 0 8 Jx, HFx 8 2 4.0 1.00 3 5 A - Ayrshire, B - Brown SWISS, G - Guernsey, HF- Holstem Friesian, J - Jersey, I - Indigenous breed, HFx - Holstein Friesian cross breed, Jx- Jersey cross breed, Bx- Brown Swiss cross breed,
40
35 • - 30 ..J - • ~ 25 • "C • - • Jersey "C 20 --Gi >= • • • • Holstein Friesian
15 !- - • ~ - ....
!. ., .1.; • • ~ .. ~ • • • 10 ~ ......... • • ... \ .. •• 5 .... -• • • -
0 I
0 100 200 300 400 500
Days Postpartum! in Lactation
Figure 2.1: Milk yield comparison between breeds at different stages of lactation obtained from various herds of record keeping farmers.
40
The frequency of milking per day ranged between once daily to twice a day amongst the
smallholder farmers at the time the study was conducted. Most farmers (77.12%) milked their
cows twice a day, while the rest (22.88%) practised once daily milking (usually in the
morning), with the exception of those cows that were being dried off at the time. The farmers
that practised twice a day milking were exclusively those that kept milk yield records. On the
farms where cows were milked once a day, the mean milk yield/cow/day was 5.6 ± 2.85 litres
and where milking was done twice a day, the yield was 9.1 ± 4.08 litres. Cows milked twice a
day had a significantly higher (P< 0.05) mean milk yield/cow/day than those milked once
daily. This is in agreement with reports of increased milk yields with increased milking
frequency (Prosser and Davis, 1992; Bar-Peled et al., 1995), without an increase in dry
matter consumption throughout the entire lactation period, regardless of parity (DePeters et
al., 1985). In the same manner, cows milked 3 times a day had higher milk yields and
lactation persistency compared to those milked twice a day over a 305 day lactation period,
regardless of parity (Amos et al., 1985).
Milking frequency is known to positively influence milk yield in that it encourages secretion in
the mammary gland by milk removal from the teat cistern and also helps in the maintenance
of lactation (galactopoiesis). Under good nutrition and breeding management, the majority of
the cattle should have reasonably high milk yields and long lactation periods (305 days per
year). A number of farmers however reported that some of their cows had about half or less
than half the length of the expected lactation periods (milk yields were so low that it was no
longer worth milking the cows). An unknown proportion of the cows milked once a day were
being dried off in preparation for calving, while the rest had either exceeded a year without
calving due to re-breeding problems or were yielding low amounts of milk as a result of poor
management or both.
41
A large number of the farmers (77.97%) did not keep milk yield records and of the 22.03%
that kept records, some only noted the total milk yield per milking session and others, total
milk yield per day (not the individual milk yield per cow per milking or per day). Since some
farmers kept daily milk yield records per cow and some did not, to accommodate the farmers
that had no records, the present day's milk yields were requested (test day milk yields) since
they could still be remembered. The mean milk yield/cow/day among the farmers that kept
milk yield records was 9.5 ± 4.39 litres and that from non-record keeping farmers was 8.1 ±
3.99 litres, with no significant difference (P> 0.05) between them. The non-record keeping
farmers consisted of both those farmers that practise once daily and twice daily milking.
The mean milk yield/cow/day amongst male farmers was 8.6 ± 4.17 litres and that for female
farmers was 7.5 ± 3.67 litres. The male farmers appeared to have a slightly higher daily
mean milk yield (1litre) per cow than female farmers. This difference is, however, not
significant (P> 0.05). Agro-ecological zone location of farmers had no significant effect (P>
0.05) on milk yield, with mean milk yields/cow/day of 8.1 ± 4.69, 8.4 ± 3.81 and 8.8 ± 4.12
litres for the Highveld, Upper Middleveld and Lower Middleveld, respectively.
2.3.4 Pastures and Fodder
Only 19 (16.1%) of the respondents in this study had some patch of planted pasture, no
greater than 100m2 each in size (estimate). The remaining 99 farmers (83.9%) had no
planted pastures and were totally reliant on naturally growing tropical grass species for
grazing dairy cows. The grass species commonly planted include Rhodes grass (Ch/oris
gayana) , Kikuyu (Pennisetum c/andestinum) , Italian Rye grass (Lolium multiflorum),
Paspa/um notatum, Star grass (Cynodon dacty/on) and Elephant grass (Pennisetum
purpureum).
42
The average available grazing area for cattle in 100 of the homesteads was 2.5 hectares,
ranging from:::; 0.5 Ha to about 8 Ha (estimated area). One group (of five farmers) was
practising a group ranching system in which their animals were exclusively sharing about 15
hectares of range land. Thirteen farmers depended entirely on communal grazing and hence
had to drive their animals over a considerable distance to graze in mixed herds with other
livestock on a daily basis. The available grazing area in this regard is unknown and the grass
species herein are diverse, naturally growing species with a general predominance of
Sporobolus and Hyparrhenia species (general observation).
The observed poor grazing and absence of planted pastures agrees with the findings of
Dlamini and Khumalo, (2000) and Ogwang (1993). Pastures are the cheapest source of feed
for dairy cows and the most efficient feed source when supplemented with commercial dairy
concentrates. There is generally a problem of land availability, which, when coupled with the
fact that whatever available land is primarily used for crop production, results in even less
land available for cattle grazing.
The reliance on naturally growing tropical grasses means that the cattle only have good
grazing in spring and early summer when new, highly nutritious grass shoots emerge as a
result of the early rains and organic nitrogen release in the soil. The limited pasture sizes,
however, mean that there is insufficient grass for cattle to graze on and therefore introduces
a danger of overgrazing of the available pasture resource. If the grazing requirements of the
cattle are not met, the cattle lose condition and productivity in terms milk yield, growth and
reproduction. Under these conditions the supplementary feeding of concentrates by farmers
becomes inefficient since they are merely substituting grass with a more expensive feed. In
the dry season, the tropical grasses senesce and lignify, lOSing nutritional value. During this
season the cattle have even less to graze on and hence require some form of supplementary
feeding.
43
Fodder provision in the dry season was found to be one of the greatest challenges faced by
the smallholder dairy farmers. Eighty-eight farmers (74.6%) claimed to provide hay in the dry
season and of these only a few had actually grown the fodder themselves. The hay is often
purchased from commercial farmers and mostly imported from South Africa with the help of
the MOAC and SODS. There were only 7 (5.9%) farms in which some form of silage was fed
to cattle in the dry season. Most smallholder farmers, however, do not grow any fodder crops
or hay and as a result some stop milking when milk yield dwindles. Only those who can
afford to purchase hay and other fodder types, supplemented with commercial' dairy
concentrates are able to maintain good milk yields. The extensive walking distances covered
by the communally grazing cows increases the daily energy requirements and impacts
negatively on milk yield (Coulon et al., 1998). Dietary energy intake is insufficient due to poor
grazing conditions and nutritional quality of the grazing, and this is exacerbated by extensive
walking to find grazing since the cattle can not increase their dry matter intake enough to
meet their energy needs for production (Coulon and Remond, 1991; Matthewman et al.,
1993; Coulon et al., 1998).
As with previous studies (Dlamini, 1990; Ogwang, 1993; Dlamini and Khumalo, 2000) it was
established that the major constraints to pasture development and fodder conservation were
lack of finances, skills, knowledge, equipment, land and in some instances water availability.
This can partly be mitigated by the planting of winter pastures and fodder crops on croplands
after harvest, since these fields are usually left to lie fallow until the next cropping season. A
major drawback to this suggestion would be the need for irrigation in the dry season when
water resources, capital, skills and equipment are lacking. In the dry season there is an
abundance of maize stover, remaining after grain harvesting and most farmers allow the
cattle to feed on the stover from the fields while some feed it from stalls as is. A few farmers
cut it up into bits and add molasses to increase its palatability. Chopping up the stover and
adding some urea and molasses would increase its intake, milk yields and body condition
throughout the dry season.
44
2.3.5 Milk Yield
The majority of cows shown in Fig. 2.1 that are within the first two hundred days of their
lactation are clustered around 10 litres per day (milk yield) with the exception of only a few.
Considering that these are dairy animals at the productive stage of their lactations, they
would be expected to have higher milk yields than what was observed. The low milk yields
could be explained by the fact that some cows are of poor genetic value in terms of milk yield
or that some are genetically sound animals under poor management. In this case both
factors could apply because some of the cattle have been out crossed with non-dairy breeds
and have hence lost their genetic merit for high milk yields. Some of the cows (pure dairy
breeds) have a genetic potential for high milk yields but cannot perform to their capacity
because they are under poor management.
Peak milk yield in the ruminant animal is attained relatively early during lactation, and this is
followed by a progressive decline so that at the time of "drying off' yield may be reduced by
50% of the maximum value (Wilde and Knight, 1989). In this study there are, in some cases
instances where farmers extended the lactation period beyond 305 days as shown in Fig.
2.1. These cows under extended lactation are either in calf or open, as suggested by the
long calving intervals (Table 2.3). For optimal production, cattle require a dry period of 40-60
days (Swanson, 1965; Coppock et al., 1974; S0rensen and Enevoldsen, 1991; Capuco and
Akers, 1999) and if the dry period either is too short or too long, subsequent milk yield is
reduced (Tucker, 1987). The dry period permits the replacement of damaged or senescent
epithelial cells prior to the ensuing lactation in addition to mammogenesis (Capuco et al.,
1997). In the course of data collection it was gathered that most farmers, especially those
breeding using bulls had no idea of the stage of gestation of their animals and hence some
were being milked until parturition. This means that the cattle either had very short dry
periods or none at all. On the other hand, some of the cows were open (extensively long
calving intervals) during their extended lactation period.
45
Milk yield is determined by secretory epithelial cell numbers and by the secretory activity per
cell (Forsyth, 1986) and the decline in milk yield after peak lactation is due to a decrease in
the number of secretory cells (Wilde and Knight, 1989; Wilde et al., 1999). Continual milking
extends the lactation period by providing a lactation stimulus that maintains the declining milk
production by somewhat delaying secretory cell loss (Wilde and Knight, 1989) even in the
absence of pregnancy. In the recommended dairy practice, there is a significant overlap of
lactation and pregnancy such that the cattle are in late gestation during the drying off period
therefore when milk stasis occurs, the mammogenic and lactogenic stimulation of pregnancy
opposes stimuli for mammary involution (Capuco and Akers, 1999). During pregnancy, there
is a substantial increase in numbers of epithelial cells in the mammary gland. Mammary
epithelial cells also complete their differentiation during pregnancy (Forsyth, 1986). There is
a cascade of hormones responsible for the initiation and maintenance of lactation and
pregnancy is the greatest physiological stimulus for milk yield (Tucker, 2000).
2.3.6 Milk Marketing and Economics
Bergevoet et al. (2004) reported that there is a significant relationship between farmer
behaviour and their goals and intentions. In addition to their love for animals, most
smallholder dairy farmers in this study aim to make money and provide food for their families.
To make a profit, the revenue received from milk sales should exceed the total cost of inputs
and therefore farmers need to sell their milk at favourable prices. Dairy prices were
deregulated in October 1999 in Swaziland (SDDB, 2000); hence, the market forces of
demand and supply currently determine prices. The formal market (major liquid milk
processing company) offers farmers E2/1itre of milk while in the informal market they are able
to sell milk between E3 to E7 per litre (E1 = R1). In a bid to promote smallholder dairy
production (FAO, 1998), milk collection centres were established in strategic dairy
communities by SDDB in conjunction with MOAC. In adherence to the dairy development
46
plan, it would be expected that more milk collection centres are yet to be established
throughout Swaziland.
One prerequisite is the formation of a legally recognised co-operative organisation or
company by the dairy farmers, the objective being to pool their daily milk harvest at the
centre, which is then either collected by the milk processing company once every two to
three days or marketed from the collection centre as fresh milk or emasi (sour milk) . The
major drawbacks to this developmental strategy, however, are two fold;
1. The farmers are often scattered over extensive distances from each other and from
the collection centres, presenting a problem of transporting milk while still fresh from
the homesteads to the centre, twice daily.
2. The other problem is that the farmer groups need to acquire capital, through loans in
order to invest in the needed facilities. The absence of group owned assets to be
used as collateral limits the chances of receiving loans from financial institutions.
Even when funds or opportunities are available for dairy development, the problem of
loan repayment remains since there is always a fluctuation in the number of co
operative members because some pioneering members leave the industry for various
reasons and new ones come in.
Two of the three farmer community groups with bulk milk coolers in the country were covered
in this study. When interviewed, some farmers admitted to withholding some of their milk
from the pooled marketing to the formal market because of the low revenue received. This
milk is then sold from their homesteads or delivered to specific customers in the vicinity. In
most communities there are no formal dairy farmer groups and milk collection centres,
therefore milk is sold from the homesteads, delivered to teachers and nurses in nearby
schools and clinics or delivered to city dwelling customers in buckets by those farmers with
47
vehicles on their way to work. Since the informal market demand is inconsistent and the
farmers have no milk cooling facilities, they are compelled to naturally ferment the remaining
milk at room temperature and sell the sour milk (emasi). The milk is fermented in specially
designed plastic buckets with whey draining taps at the bottom and this results in the loss of
about half the volume of the collected fresh milk (to whey) and hence the loss of potential
income even though the sour milk (emasi) is sometimes sold at about twice the price of fresh
milk.
It was gathered (in the Mayiwane area) that the pooled milk marketing is beneficial to the
farmers in some ways. Records of each farmer's contribution are made on a daily basis and
when the milk is sold, the money is allocated according to the quantity contributed. This
ensures that they are now able to receive substantial weekly revenue as opposed to the
small daily collections made at home, which invariably end up being used for other
household needs instead of being reinvested into the dairy projects. The weekly revenue
now enables the farmers to purchase farm inputs such as dairy concentrate feed, dipping
chemicals (acaricides), veterinary pharmaceuticals, grass seeds etc. Consistent availability
of production inputs in addition to good management practices can result in improved animal
performance in terms of milk yields, reproduction, growth and condition.
A number of commercial dairy farmers have adopted the strategy of on farm milk processing,
packaging and distribution to the major supermarket chain stores in order to increase their
revenue from milk sales. This strategy might not be suitable for smallholder farmers, however
there is a need for the establishment of a more efficient system of milk collection and
transportation to the formal market (major milk processors) as well as the negotiation for milk
selling prices that will be suitable for both the producers and processors to make money from
milk. Before such an exercise is embarked on, however, it is imperative that a study be
48
conducted on the economics of smallholder milk production, storage and transportation to
facilitate informed decision-making.
2.4 Conclusion
Smallholder dairy producers have a potential to contribute greatly to the Swazi dairy industry.
Their poor performance is a result of a myriad of underlying problems, which need to be
resolved for this potential to be realised. There remains a great need for farmers to be
trained on dairy husbandry and fodder production and conservation. The AI provision service
currently in place has to be improved by improving communication between farmers and
inseminators to facilitate timely service provision, as well as increasing the number of
community-based farmers that are trained in artificial insemination. Government can
increase the numbers and genetic quality of heifers and primiparous animals annually sold to
smallholder farmers to meet the local stock demand. An elaborate plan, which integrates an
efficient milk collection and cooling system with a reasonably priced market, has to be put in
place to enable farmers to make some money. The alternative would be to train the farmers
on entrepreneurship and marketing strategies, empowering them to process, package and
sell their milk as a group.
49
Chapter III
50
Performance Deviation From The Standard Lactation Curves: A Case Study Of The Swazi
Smallholder Herd
Abstract
This study was aimed at evaluating the performance of the Swazi smallholder dairy herd by
comparing it to the performance of a larger, well-managed herd of known pedigree. Lactation
records from 252 Jersey cows and 108 Holstein Friesian cows were obtained from Cedara
Agricultural Research Institute, covering the periods; July, 2002 to July, 2004 and November,
2002 to April, 2004, respectively. Cows were grouped by parity and calving season and the
gamma function proposed by Wood (1969) Y = Anbe-cr1, was used to fit standard lactation
curves on group data. The curve parameters A and b increased with parity, while that of c
and s (persistency of lactation at peak) decreased, producing standard lactation curves save
for the Holstein Friesian summer calvers, which produced atypical curves. The R2 values
(goodness of fit) increased with parity. Animal parity and calving season were found to
influence the peak and shape of the lactation curves and their parameter estimates. The
performance of the Swazi smallholder herd showed a mean deviation of the observed daily
milk yield of the Holstein Friesian breed from the expected yield to be - 3.47 (SO 6.052) kg
and that of the Jersey breed was - 16.92 (SO 5.473) kg. The mean proportional deviation of
observed milk yield from the expected yield for the Holstein Friesian breed was - 0.3 (SO
0.37) and that of the Jersey breed was - 0.6 (SO 0.19). The proportional milk yield deviation
of the Holstein Friesian breed can be explained using the equation, Y = O.1322(SE = 0.1293)
x - 2.3581 (SE = 0.20639), where x = expected milk yield and Y is the proportional deviation
of the observed milk yield deviation from the expected milk yield. With respect to the
smallholder Jersey breed, no relationship was found that could explain the proportional milk
yield deviation. The smallholder herd was proved to be underperforming, considering the
potential for higher milk yields of the two breeds.
51
3.1 Introduction
In Swaziland the dairy breeds commonly kept by both large-scale commercial and
smallholder farmers are the Holstein Friesian and Jersey. Among the smallholder dairy
farmers, the most favoured breed is the Jersey, perhaps for its low maintenance
req-uirements, hardiness, adaptability, lower procurement costs and abundance. A number of
these farmers also keep Holstein Friesian dairy cows. The amount of milk produced by
smallholder dairy farms in the country is unknown since production records are not kept and
the milk is marketed privately. In a number of previous studies (Dlamini, 1990; Ogwang,
1993; FAO,1994; FAO, 1996; FAO, 1998; Nhlabatsi, 1994; Dlamini and Khumalo, 2000),
there was an indication, however, that the production levels of these breeds under this
system are below that, which is expected. It is suspected that this is due to the varied
systems of management, feeding and breeding practised, most of which are in conflict with
recommended dairy husbandry.
In an attempt to evaluate the performance of dairy cows under the Swazi smallholder dairy
production system, milk yield records per animal were obtained from the few smallholder
farmers who actually kept some milk yield records. To determine the true production
potential of the smallholder dairy herd, its performance has to be compared to that of a large
herd of known pedigree (preferably the national dairy herd). The performance data of dairy
herds in SW8ziland is undocumented and hence is not readily available. As an alternative,
South African dairy herd performance data were sought, with little success, from the
Agricultural Research Council - Animal Improvement Institute (Mostert et al., 2001). The
objective of this study was to establish standard lactation curves for both the Jersey and
Holstein Friesian breeds. These curves and parameters would then be used as the standard
against which to evaluate the performance of the Swazi smallholder herd since both breeds
and the semen used in AI are exclusively imported from South Africa.
52
3.2 Materials and Methods
3.2.1 Source of Data
The values of parameter estimates of the lactation curve models of the South African
national dairy herds, compiled by the ARC-Animal Improvement Institute (Mostert et al.,
2001) were not available to be used for industrial reasons. Instead, Holstein Friesian breed
data were obtained from Cedara Agricultural Institute with the assistance of Mr. T. Dugmore;
the production data of the Jersey breed were obtained from a farm neighbouring Cedara
Agricultural Institute. The data consisted of records from 252 jersey cows, collected from 18-
07-2002 to 20-07-2004, over 20-test days, providing a maximum of two complete successive
lactation records per animal. Intervals between test dates did not exceed 75 days. The
Holstein Friesian production records had been collected between 15-11-2002 and 22-04-
2004 from Cedara Agricultural Institute, covering 13 test days. Holstein Friesian data were
collected from 108 cows at an average test day interval of 40 days. The criterion for record
inclusion for both breeds was that the lactation should at least be 250 days, therefore,
records fewer than this were excluded from the compilation (excluded records are not part of
the above-mentioned record numbers). Data were separated into two distinct calving
seasons, namely summer (September - March) and winter (April - August). These data
were, in addition, classified according to the parity of the cattle.
The Jersey herd was on a high input level of management. The cows were stall-fed on a high
level of a total mixed ration (TMR) and then allowed to graze for a limited period of time on a
daily basis both in summer and winter. The Holstein Friesian herd, on the other hand, was on
a less intense feeding programme. During the summer season the animals were grazed on
Kikuyu pastures whereas in the winter they were grazed on Italian Rye grass pastures,
supplemented with maize silage and Eragrostis curvula hay. In essence, the plane of
nutrition was higher during the winter season than during summer. In both seasons,
however, the cattle received a supplement of whole soya bean and broken yellow maize,
53
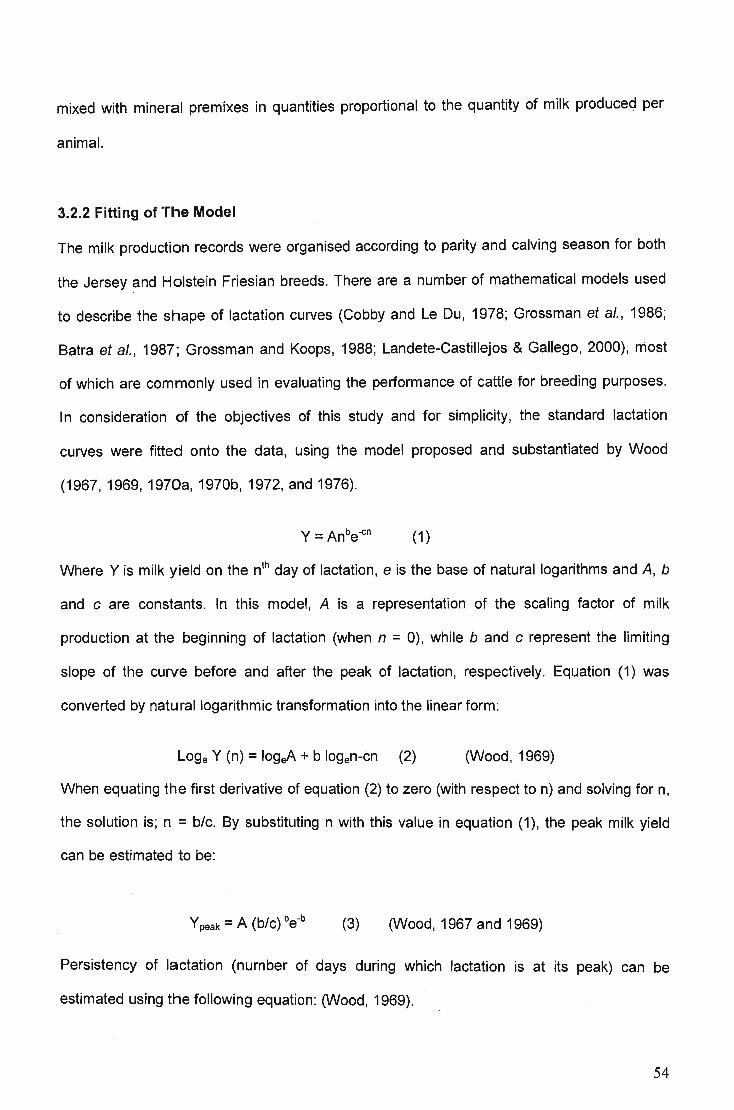
mixed with mineral premixes in quantities proportional to the quantity of milk produced per
animal.
3.2.2 Fitting of The Model
The milk production records were organised according to parity and calving season for both
the Jersey and Holstein Friesian breeds. There are a number of mathematical models used
to describe the shape of lactation curves (Cobby and Le Du, 1978; Grossman et al., 1986;
Batra et al., 1987; Grossman and Koops, 1988; Landete-Castillejos & Gallego, 2000), most
of which are commonly used in evaluating the performance of cattle for breeding purposes.
In consideration of the objectives of this study and for simplicity, the standard lactation
curves were fitted onto the data, using the model proposed and substantiated by Wood
(1967, 1969, 1970a, 1970b, 1972, and 1976).
Y=Anbe-cn (1)
Where Y is milk yield on the dh day of lactation, e is the base of natural logarithms and A, b
and c are constants. In this model, A is a representation of the scaling factor of milk
production at the beginning of lactation (when n = 0), while band c represent the limiting
slope of the curve before and after the peak of lactation, respectively. Equation (1) was
converted by natural logarithmic transformation into the linear form:
Loge Y (n) = 10geA + b logen-en (2) (Wood, 1969)
When equating the first derivative of equation (2) to zero (with respect to n) and solving for n,
the solution is; n = b/c. By substituting n with this value in equation (1), the peak milk yield
can be estimated to be:
Ypeak = A (b/c) be-b (3) (Wood, 1967 and 1969)
Persistency of lactation (number of days during which lactation is at its peak) can be
estimated using the following equation: (Wood, 1969).
54
S = -(b+1) In c (4)
Data were log transformed and multiple linear regression performed using SAS (2002) to
establish the parameter estimates for the constants, A, band c. A similar procedure for
deriving lactation curve parameters has been described by Wood (1967, 1969, 1970a,
1970b, 1972, and 1976) and Collins-Lusweti (1991). Using this procedure, lactation curves
were fitted separately for the Jersey and Holstein Friesian herds, according to calving season
and parity. In the Holstein herd, data on the first and second parity had to be combined due
to a low number of available lactation records for the second parity. Lactation records for the
parities;:: 5 were also combined due to the low number of available records.
3.2.3 The Swazi Smallholder Herd
Since the Swazi smallholder farmers did not have detailed records pertaining to the parity
and lactation stages of their lactating cows, the level of performance evaluation was limited.
From the established lactation curve parameters for both the Jersey and Holstein Friesian
breeds, only the calving season parameters could be used to establish the expected milk
production levels. With respect to the Jersey breed, the mean values of both winter and
summer calving lactation curve parameters were used to establish the lactation curve
(expected milk yields). For Holstein Friesians, only the winter calving parameters were used
because those for summer calving produced atypical lactation curves. The parameters were
used to project the lactation curves showing the expected milk yields for the two breeds
(without respect to parity or calving season). The lactation data of the Swazi smallholder
dairy herd were obtained from only a handful of farmers who kept detailed records and
consisted of 14 records for Holstein Friesians and 68 for Jersey cows. The observed milk
yields for each breed were compared to the expected yields in order to determine the
disparity, if any between the two herds, since the Cedara herd was being used as the
standard against which the performance of the Swazi herd was being evaluated.
55
For each record of the Swazi smallholder herd, the expected (potential) milk yield was
subtracted from the observed milk yield in order to quantify the amount of yield deviation.
The actual difference between the expected and observed yield was then expressed as a
fraction of the expected yield for each record in order to get the proportional yield deviation.
The mean deviations and the standard deviations for each breed were calculated. Linear
regression analysis was used in an attempt to explain the proportional yield deviations,
wherein the proportional deviations were regressed on the expected milk yield. A multiple
regression analysis (SAS, 2002) was further performed by regressing the observed milk yield
on the expected (potential) milk yield and the following dummy variables: milking frequency,
breeding methods, dairy concentrate feeding, winter-feed supplementation and hay feeding
in winter. The effect of these variables was not significant (P> 0.05).
If poor nutritional management is the driving force behind low milk yields, then the deviations
of the observed from the expected milk yield would be low during periods of lactation typically
characterised by low milk yields and high during high-milk yielding periods (early to mid
lactation). This is based on the assumption that an animal would be better able to closely
approach its requirements if subjected to a low plane of nutrition when it is at a low
productive state.
3.3 Results & Discussion
3.3.1 The Cedara Herds
In genetics, the phenotype is said to be a result of genotype and environmental interaction (P
= G+E). It follows therefore that a cow's milk yield level is a result of its genotype and
environmental factors. The environmental factors influencing milk production can be
categorised into fixed environmental and management factors. These factors include animal
age, age at first calving, parity, calving season, stage of lactation, milking frequency,
nutrition, interval from calving to reconception and animal health (Collins-Lusweti, 1991;
56
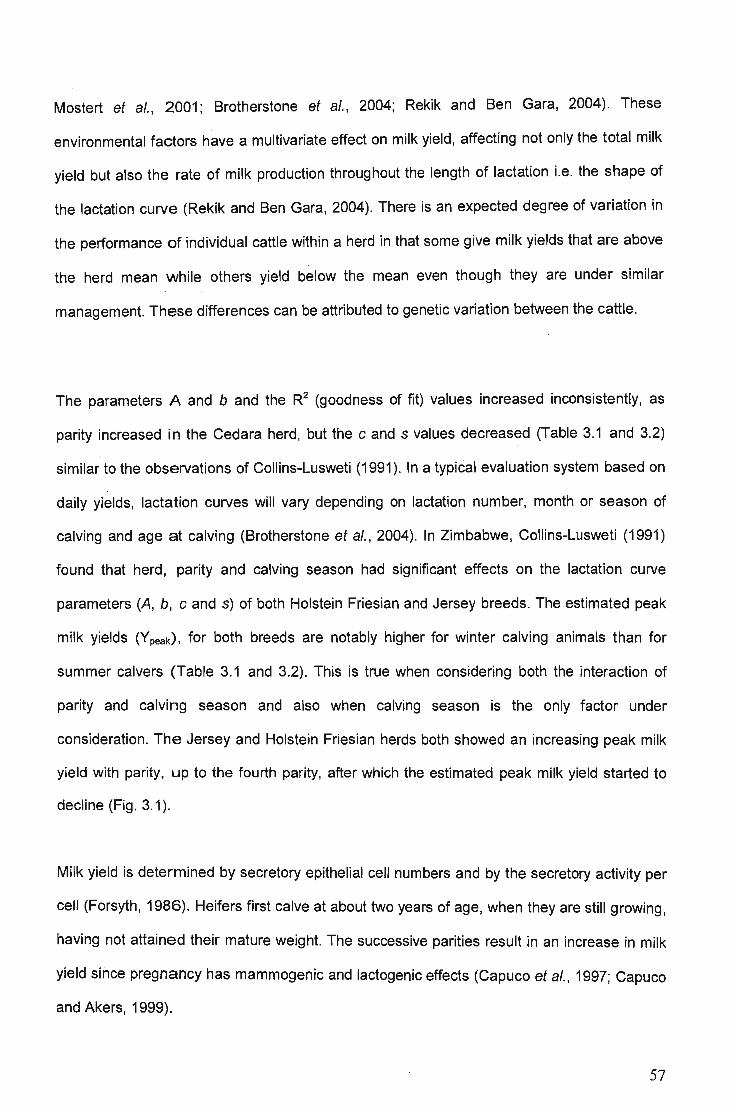
Mostert et al., 2001; Brotherstone et al., 2004; Rekik and Ben Gara, 2004). These
environmental factors have a multivariate effect on milk yield, affecting not only the total milk
yield but also the rate of milk production throughout the length of lactation i.e. the shape of
the lactation curve (Rekik and Ben Gara, 2004). There is an expected degree of variation in
the performance of individual cattle within a herd in that some give milk yields that are above
the herd mean while others yield below the mean even though they are under similar
management. These differences can be attributed to genetic variation between the cattle.
The parameters A and b and the R2 (goodness of fit) values increased inconsistently, as
parity increased in the Cedara herd, but the c and s values decreased (Table 3.1 and 3.2)
similar to the observations of Collins-Lusweti (1991). In a typical evaluation system based on
daily yields, lactation curves will vary depending on lactation number, month or season of
calving and age at calving (Brotherstone et al., 2004). In Zimbabwe, Collins-Lusweti (1991)
found that herd, parity and calving season had significant effects on the lactation curve
parameters (A, b, c and s) of both Holstein Friesian and Jersey breeds. The estimated peak
milk yields (Ypeak), for both breeds are notably higher for winter calving animals than for
summer calvers (Table 3.1 and 3.2). This is true when considering both the interaction of
parity and calving season and also when calving season is the only factor under
consideration. The Jersey and Holstein Friesian herds both showed an increasing peak milk
yield with parity, up to the fourth parity, after which the estimated peak milk yield started to
decline (Fig. 3.1).
Milk yield is determined by secretory epithelial cell numbers and by the secretory activity per
cell (Forsyth, 1986). Heifers first calve at about two years of age, when they are still growing,
having not attained their mature weight. The successive parities result in an increase in milk
yield since pregnancy has mammogenic and lactogenic effects (Capuco et al., 1997; Capuco
and Akers, 1999).
57
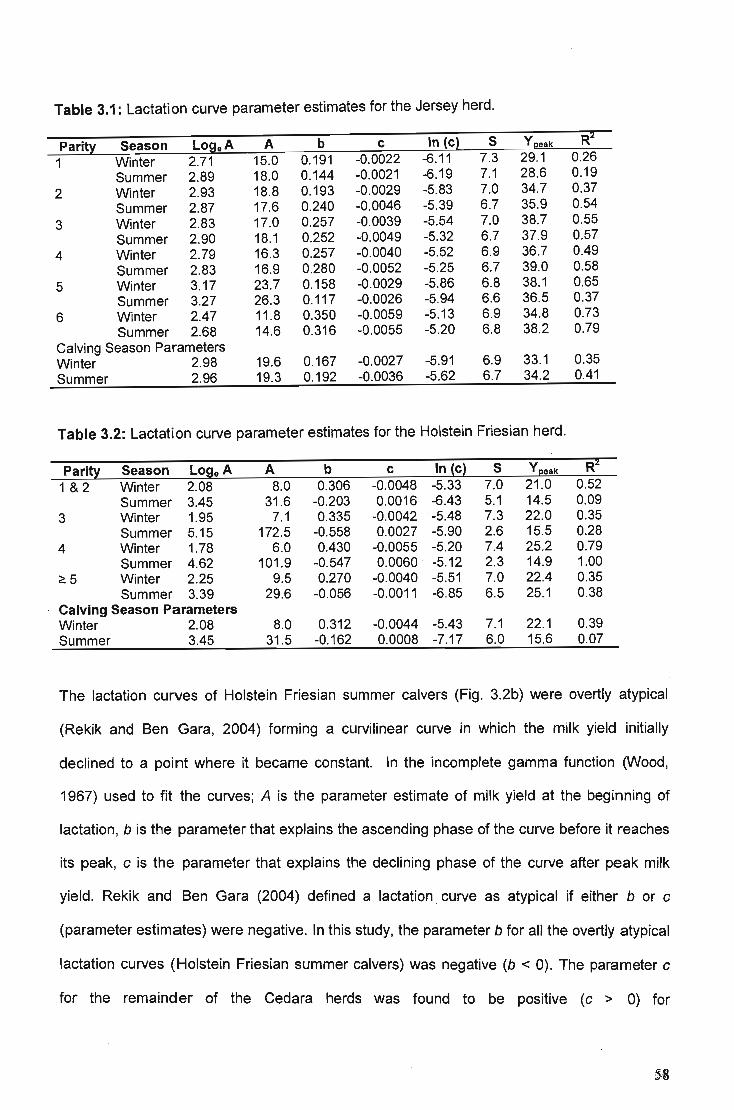
Table 3.1: Lactation curve parameter estimates for the Jersey herd.
R2 Parit~ Season Loge A A b c In (c) S Y2eak
1 Winter 2.71 15.0 0.191 -0.0022 -6.11 7.3 29.1 0.26 Summer 2.89 18.0 0.144 -0.0021 -6.19 7.1 28.6 0.19
2 Winter 2.93 18.8 0.193 -0.0029 -5.83 7.0 34.7 0.37 Summer 2.87 17.6 0.240 -0.0046 -5.39 6.7 35.9 0.54
3 Winter 2.83 17.0 0.257 -0.0039 -5.54 7.0 38.7 0.55 Summer 2.90 18.1 0.252 -0.0049 -5.32 6.7 37.9 0.57
4 Winter 2.79 16.3 0.257 -0.0040 -5.52 6.9 36.7 0.49 Summer 2.83 16.9 0.280 -0.0052 -5.25 6.7 39.0 0.58
5 Winter 3.17 23.7 0.158 -0.0029 -5.86 6.8 38.1 0.65 Summer 3.27 26.3 0.117 -0.0026 -5.94 6.6 36.5 0.37
6 Winter 2.47 11.8 0.350 -0.0059 -5.13 6.9 34.8 0.73 Summer 2.68 14.6 0.316 -0 .0055 -5.20 6.8 38.2 0.79
Calving Season Parameters Winter 2.98 19.6 0.167 -0.0027 -5.91 6.9 33.1 0.35 Summer 2.96 19.3 0.192 -0.0036 -5.62 6.7 34.2 0.41
Table 3.2: Lactation curve parameter estimates for the Holstein Friesian herd.
Parit~ Season Loge A A b c In {c) S Y2eak Rl!
1&2 Winter 2.08 8.0 0.306 -0.0048 -5.33 7.0 21.0 0.52 Summer 3.45 31.6 -0.203 0.0016 -6.43 5.1 14.5 0.09
3 Winter 1.95 7.1 0.335 -0.0042 -5.48 7.3 22.0 0.35 Summer 5.15 172.5 -0.558 0.0027 -5.90 2.6 15.5 0.28
4 Winter 1.78 6.0 0.430 -0.0055 -5.20 7.4 25.2 0.79 Summer 4.62 101.9 -0.547 0.0060 -5.12 2.3 14.9 1.00
;;::5 Winter 2.25 9.5 0.270 -0.0040 -5.51 7.0 22.4 0.35 Summer 3.39 29.6 -0.056 -0.0011 -6.85 6.5 25.1 0.38
Calving Season Parameters Winter 2.08 8.0 0.312 -0.0044 -5.43 7.1 22.1 0.39 Summer 3.45 31.5 -0.162 0.0008 -7.17 6.0 15.6 0.07
The lactation curves of Holstein Friesian summer calvers (Fig. 3.2b) were overtly atypical
(Rekik and Ben Gara, 2004) forming a curvilinear curve in which the milk yield initially
declined to a point where it became constant. In the incomplete gamma function 0Nood,
1967) used to fit the curves; A is the parameter estimate of milk yield at the beginning of
lactation, b is the parameter that explains the ascending phase of the curve before it reaches
its peak, c is the parameter that explains the declining phase of the curve after peak milk
yield. Rekik and Ben Gara (2004) defined a lactation curve as atypical if either b or c
(parameter estimates) were negative. In this study, the parameter b for all the overtly atypical
lactation curves (Holstein Friesian summer calvers) was negative (b < 0). The parameter c
for the remainder of the Cedara herds was found to be positive (c > 0) for
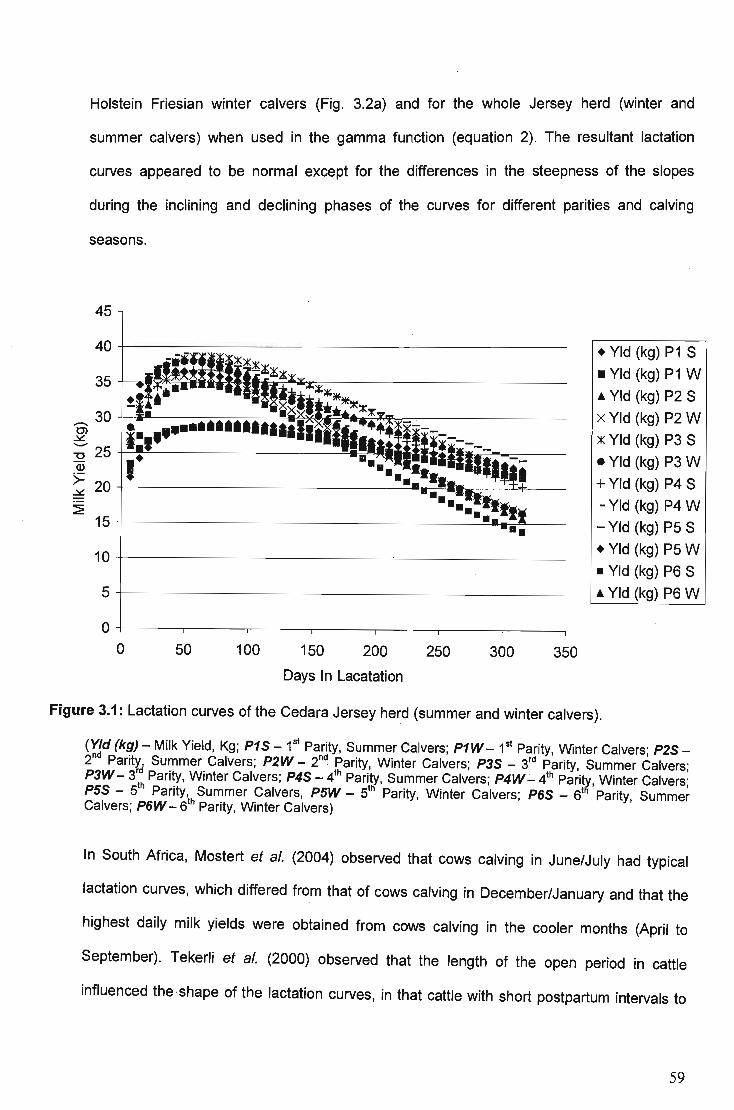
Holstein Friesian winter calvers (Fig. 3.2a) and for the whole Jersey herd (winter and
summer calvers) when used in the gamma function (equation 2). The resultant lactation
curves appeared to be normal except for the differences in the steepness of the slopes
during the inclining and declining phases of the curves for different parities and calving
seasons.
45
40+-----------------------------------------
35~~~~~~~~~----------------
15 +---------------------------------~~~~--
10 +-------------------------~----------------
5+----------------------------------------------
O+-----~----_.----_,r_----,_----,_----_,----_,
o 50 100 150 200 250 300 350
Days In Lacatation
• Yid (kg) P1 S • Yid (kg) P1 W A Yid (kg) P2 S
x Yid (kg) P2 W
::i( Yid (kg) P3 S
• Yid (kg) P3 W + Yid (kg) P4 S - Yid (kg) P4 W
- Yid (kg) P5 S
• Yid (kg) P5 W • Yid (kg) P6 S A Yid (kg) P6 W
Figure 3.1: Lactation curves of the Cedara Jersey herd (summer and winter calvers).
(Yid (kg) - Milk Yield, Kg; P1S - 1st Parity, Summer Calvers; P1W ~ 1st Parity, Winter Calvers; P2S-2
nd Parity Summer Calvers; P2W - 2nd Parity, Winter Calvers; P3S - 3rd Parity, Summer Calvers;
P3W - 3~ Parity, Winter Calvers; P4S - 4th Parity, Summer Calvers; P4W - 4th Parity, Winter Calvers; P5S - 5
th Parity, Summer Calvers, P5W - 5tH Parity, Winter Calvers; P6S - 6tn Parity, Summer
Calvers; P6W - 6th Parity, Winter Calvers)
In South Africa, Mostert et al. (2004) observed that cows calving in June/July had typical
lactation curves, which differed from that of cows calving in December/January and that the
highest daily milk yields were obtained from cows calving in the cooler months (April to
September). Tekerli et al. (2000) observed that the length of the open period in cattle
influenced the shape of the lactation curves, in that cattle with short postpartum intervals to
59
re-conception had lower persistencies than cattle with longer postpartum intervals and the
rate of decrease in milk yield after peak lactation decreased with an increase in the open
period. In concurrence, Brotherstone et al. (2004) observed a 1.50kg increase in average
test day milk yield of multiparous (second or third lactation), Holstein Friesian cows that had
an open period of 150 days in the previous lactation compared to those that were open for
only 50 days.
The atypical lactation curves observed in the Holstein Friesian herd (summer calvers) could
be a factor of management practices employed in the farm. The feeding management
practised on the farm is such that the plane of nutrition is lower in the summer season
(Kikuyu pasture only) than it is in the winter, resulting in an early monotonous decline in the
milk yield of the summer calvers. Subsequently in the winter season, when the plane of
nutrition is increased, the response is either an increase or constant milk yield during what is
supposed to be the declining phase of the lactation.
3.3.2 Comparative Analysis Of The Swazi Smallholder Herd
The lactation curves were viewed as the potential or expected milk yield for the smallholder
herd. The comparison confirms the suspicion that the smallholder herd was generally
performing below the breed potential. Whilst three Holstein Friesian cows performed at or
above the expected level (Figure 3.3a), none of the Jerseys reached their potential. It should,
however be noted that the Holstein Friesian breed normally has a higher potential milk yield
than suggested by the curve. Although some of the Jersey cows performed close to the
expected levels, the majority of the herd performed far below expectation (Figure 3.3b). The
main reason for the underperformance is largely suspected to be the result of substandard
management, mainly poor nutrition and breeding practices.
60
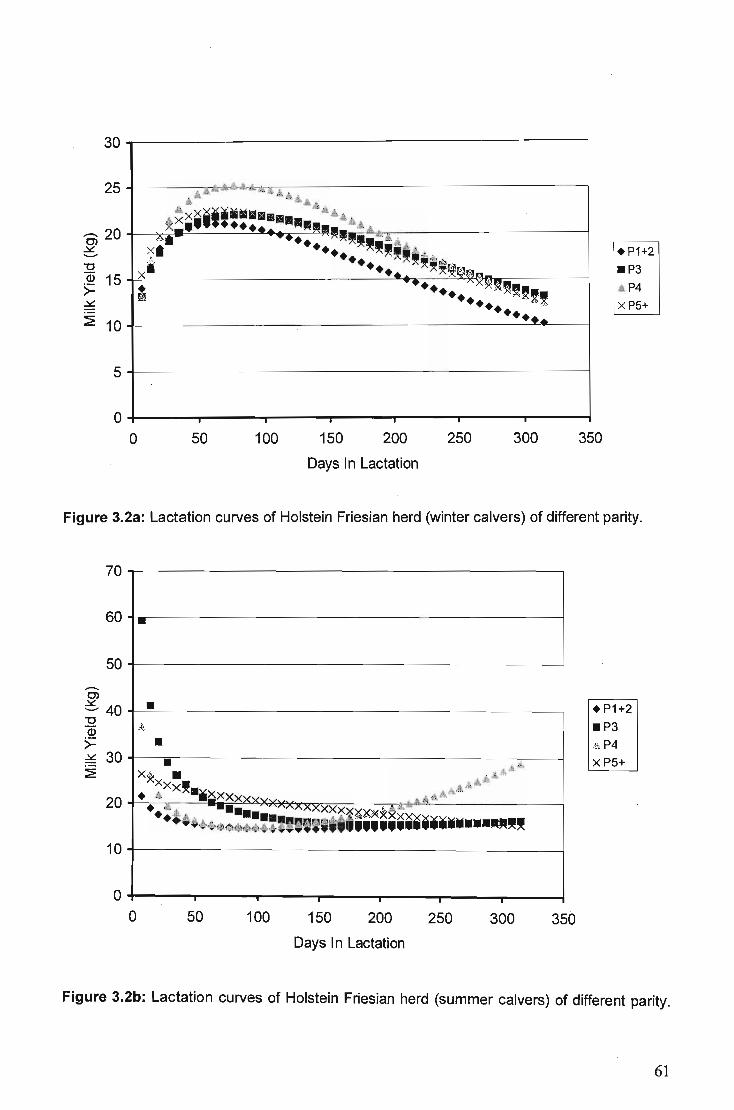
30
25
....... 20 Cl ~ ......... "0 Q) 15 >= .:£
~ 10
5
0 o
" &;~rL~U*« Ill, 1'. ' '. ;&;t. & .....
&;Xi'.~~~~m. ~k.Ak.~. ~~" ........ ·\'1111111.. &a.,t.' j;,
2!. 1III ........ ""~~~'~ ;!;. A :4A x8 ••• ~",~~ . i . •• '$I X · ••• ~~~h:b: •.
• ' •••••• ~x~~I!l!I!! ~l ••• • .......
, T
50 100 150 200 250 300
Days I n Lactation
350
.P1+2
.P3 .l\ P4
X P5+
Figure 3.2a: Lactation curves of Holstein Friesian herd (winter calvers) of different parity.
70
60
50 ....... Cl
c- 40 "0 Q)
>= .:£ 30 ~
20
10
0
I-
• A
• • , .• '1,
x1<x • xx,.. ;1; ~i~ • i~ xXXX~~ .. A li\ , •.• , .. • ;<" ', ••• xxxxxxxxxx ' ~ ~ ;,tJ1.\;
• • . ~ J, , ..... ' ~, cii, ~~~~x xx~ ••• ··4t·$·'~f,jl$4)'~t$\.,~·II""."""'" ........ "''''
. , , o 50 100 150 200 250 300
Days In Lactation
350
.P1+2
.P3 A P4
XP5+
Figure 3.2b: Lactation curves of Holstein Friesian herd (summer calvers) of different parity.
61
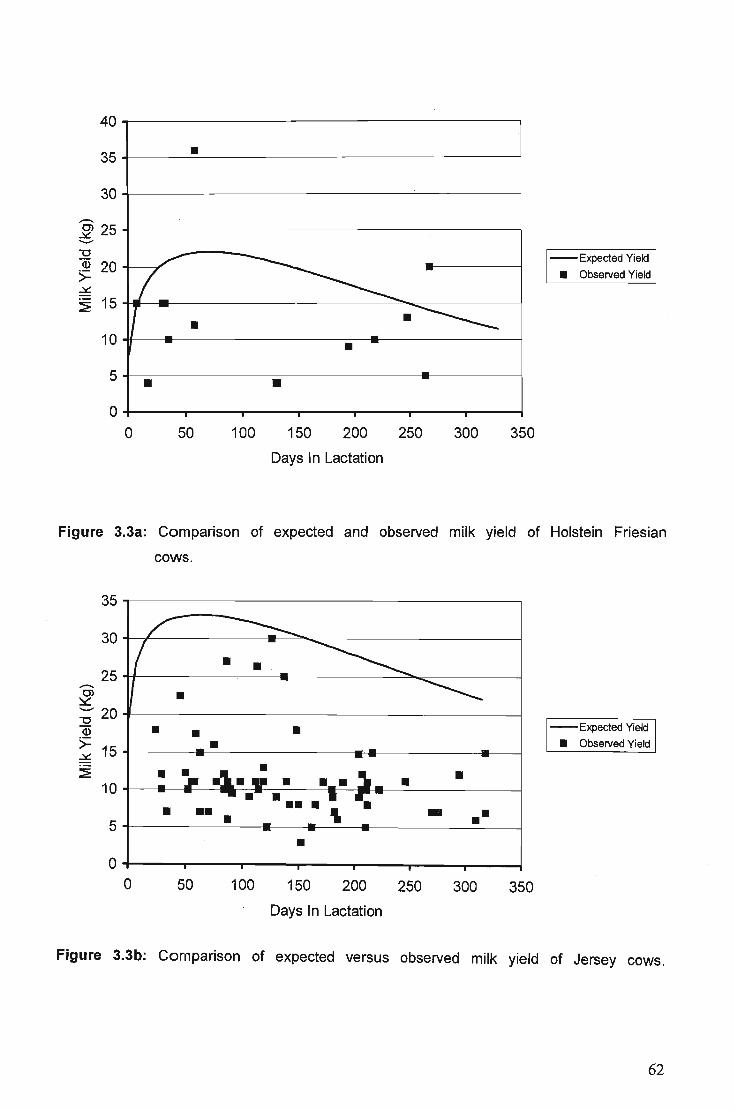
40
35 • 30
.-... ~ 25 -"'C (1) 20
>= ~
~ 15
/""
1-• 10 --
5 • 0
o 50
---- -~
.----------• --• -
• • 100 150 200 250 300
Days I n Lactation
350
-Expected Yield
• Observed Yield
Figure 3.3a: Comparison of expected and observed milk yield of Holstein Friesian
cows.
35~------------------------------------~
30+-+-----------~-=~~----------------~
25~--------~--~.-----------~~------~ .-... 0>
:::..::: - 20 "'C ID >= 15 ~
• • -Expected Yield
• Observed Yield • • ~
10 • •
5 , • - • • • •• •
• 0
0 50 100 150 200 250 300 350 Days In Lactation
Figure 3.3b: Comparison of expected versus observed milk yield of Jersey cows.
62
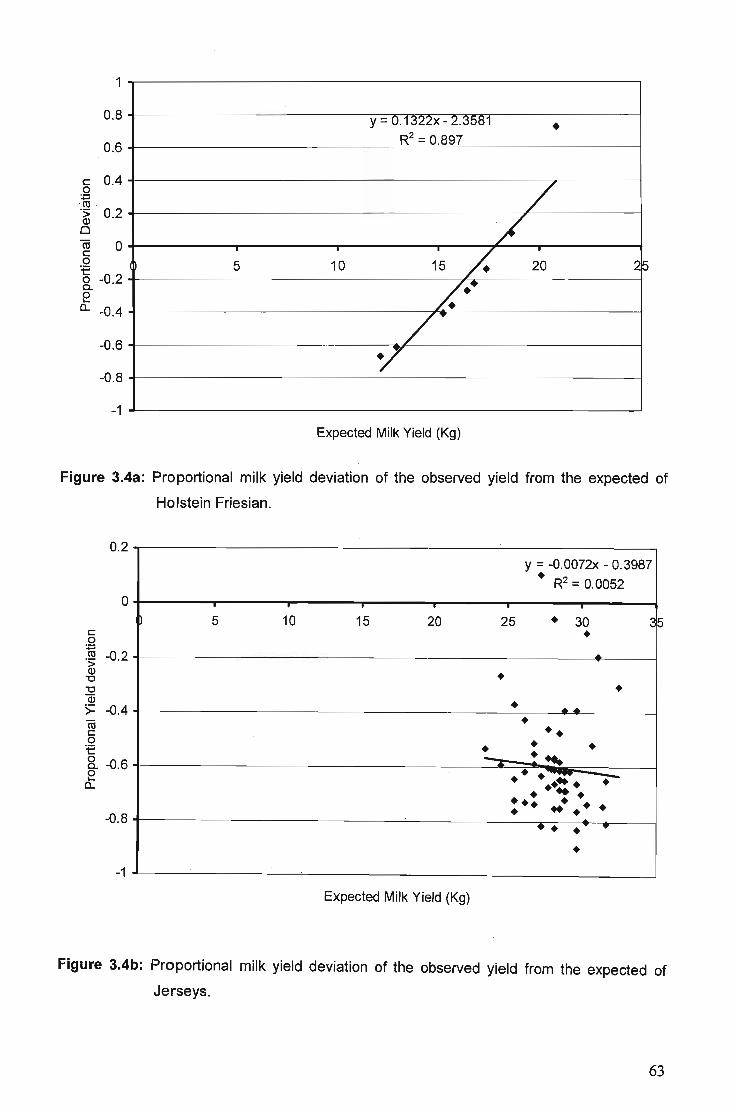
1
0.8 y = 0.1322x - 2.3581 • 0.6 R2 = 0.897
c 0.4 0 :p co · .:; 0.2 <1> 0 ro 0 c 0 :e
-0.2 0 a. e a. -0.4
-0.6
-0.8
/ /
5 10 15 7. 20 2~
/. .. /.
j +/ -1
Expected Milk Yield (Kg)
Figure 3.4a: Proportional milk yield deviation of the observed yield from the expected of
Holstein Friesian.
c o :p
0.2
o
. ~ -0.2 <1> "0 "0 ID >= -0.4 ro c o :e 8.. -0.6 e a.
-0.8
-1
, 5 10 15 20
Expected Milk Yield (Kg)
y = -O.0072x - 0.3987 • R2 = 0.0052
, 25 • 30 2~ •
....
• • • •• • ••
• • • - .~ ... ~ • . ~ ... • • ••• • •• . ... •• • ....
•
Figure 3.4b: Proportional milk yield deviation of the observed yield from the expected of
Jerseys.
63
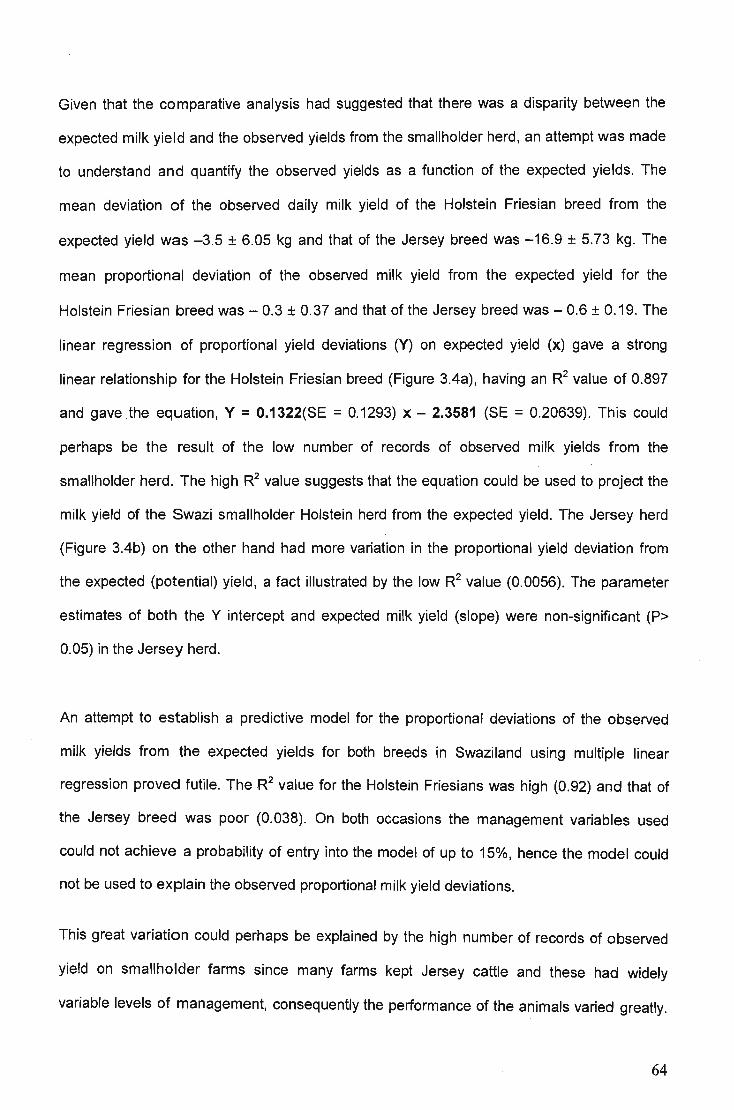
Given that the comparative analysis had suggested that there was a disparity between the
expected milk yield and the observed yields from the smallholder herd, an attempt was made
to understand and quantify the observed yields as a function of the expected yields. The
mean deviation of the observed daily milk yield of the Holstein Friesian breed from the
expected yield was -3.5 ± 6.05 kg and that of the Jersey breed was -16.9 ± 5.73 kg. The
mean proportional deviation of the observed milk yield from the expected yield for the
Holstein Friesian breed was - 0.3 ± 0.37 and that of the Jersey breed was - 0.6 ± 0.19. The
linear regression of proportional yield deviations (Y) on expected yield (x) gave a strong
linear relationship for the Holstein Friesian breed (Figure 3.4a), having an R2 value of 0.897
and gave the equation, Y = O.1322(SE = 0.1293) x - 2.3581 (SE = 0.20639). This could
perhaps be the result of the low number of records of observed milk yields from the
smallholder herd. The high R2 value suggests that the equation could be used to project the
milk yield of the Swazi smallholder Holstein herd from the expected yield. The Jersey herd
(Figure 3.4b) on the other hand had more variation in the proportional yield deviation from
the expected (potential) yield, a fact illustrated by the low R2 value (0.0056). The parameter
estimates of both the Y intercept and expected milk yield (slope) were non-significant (P>
0.05) in the Jersey herd.
An attempt to establish a predictive model for the proportional deviations of the observed
milk yields from the expected yields for both breeds in Swaziland using multiple linear
regression proved futile. TheR2 value for the Holstein Friesians was high (0.92) and that of
the Jersey breed was poor (0.038). On both occasions the management variables used
could not achieve a probability of entry into the model of up to 15%, hence the model could
not be used to explain the observed proportional milk yield deviations.
This great variation could perhaps be explained by the high number of records of observed
yield on smallholder farms since many farms kept Jersey cattle and these had widely
variable levels of management, consequently the performance of the animals varied greatly.
64
A clear example of this is shown in Figure 3.3b, where some cows in early lactation had milk
yields ranging from 5 to 15 kg/day while some in late lactation had the same yield range.
Considering that the cattle are of the same breed, a logical explanation is that most of the
animals that had low milk yields in early lactation were under low levels of management and
that those with high yields in late lactation were under good management. Mostert et al.
(2004) found that the herd, season and age class had an effect on 305-day milk, butterfat
and protein yield, explaining on average 64% and 53% of the variation in the South African
Holstein Friesian .and Jersey breeds, respectively.
It should, however, be noted that the cows in Figures 3.3a and b, were of different age
classes, parity, age at first calving, calving seasons, calving intervals and herds. It has been
established that fixed environmental and management factors have a bearing on the milk
yield of cattle (Collins-Lusweti, 1991; Mostert et al., 2001; Brotherstone et al., 2004; Rekik
and Ben Gara, 2004). Since the only available information about the smallholder herds was
the lactation stage (days in lactation) and the test-day milk yield, the other factors mentioned
above could not be catered for. Although some management factors were known, most were
qualitative and were further found to be poorly associated with the observed milk yields.
3.4 Conclusion
The lactation curves fitted using the data obtained from Cedara and the neighbouring farm,
clearly illustrate the effect of calving season, animal age and herd on the shape of the
lactation curves. These curves can and were acceptably used for the performance evaluation
of the Swazi smallholder dairy herd. The smallholder herd was proved to be
underperforming, considering the potential for higher milk yields of the two breeds. There is a
need to improve the breeding, nutrition and other management aspects of the smallholder
herd. With regard to establishing a prediction model for the Swazi smallholder herd a ,
65
detailed performance evaluation study would have to be conducted on the national herd. The
main obstacle to achieving this, however, would be the fact that the farmers generally do not
keep records; hence accounting for the variation in production levels would remain almost
impossible.
66
Chapter IV
67
Typology And Constraint Identification Of The Swazi-Smallholder Dairy Producers
Abstract
The study was conducted in an effort to understand smallholder dairying in Swaziland and
the constraints faced by farmers in dairying. A sample of 118 smallholder dairy farmers from
Manzini and the surrounding areas was analysed using multivariate statistics to categorise
them based on their herd sizes, herd structures, management and success perceptions in
dairying. The analysis produced three clusters (categories): cluster 1 had the largest herd
sizes and poor milk production efficiency; cluster 2 had intermediate herd sizes, the highest
number of farmers and more efficient milk production per cow. This cluster, however, had the
highest proportion of calf mortalities. Cluster 3 had the smallest herd size, the lowest calf to
cow ratio and the second highest calf mortality. Record keeping across all clusters was very
poor and the average milk yield per cow was generally low. Most of the farmers do not
appreciate the importance of annual calving of their cows as an integral part of the success
of their dairy projects and winter feed supplementation is very poor across all the clusters.
There remains a great need for the enlightenment of the farmers on the importance of good
nutrition, breeding, calf rearing and record keeping in successful dairying.
4.1 Introduction
Swaziland has a growing number of smallholder dairy farmers, however as much as there
are newcomers into the industry, there appears to be a growing trend of what were
considered to be established farmers, leaving the industry (Olamini and Khumalo, 2000 and
extension observation). A number of studies have been conducted in the past (Olamini,
1990; Ogwang, 1993; FAO, 1994; FAO, 1996; FAO, 1998; Dlamini and Khumalo, 2000), with
the aims of understanding the constraints encountered by the smallholder dairy producers.
68
Dlamini (1990) and Ogwang (1993) noted the poor development of planted pastures by
smallholder farmers, owing to the scarcity of land, water, seed, skills, capital, machinery and
poor provision of agricultural extension service. FAO (1996) reported that the demand for
milk had continually exceeded the supply and that imported milk accounted for more than
60% of milk sold in the formal market in the country. Smallholder farmers prefer to sell their
milk privately since the prices offered in the formal market for raw milk are very low
(Nhlabatsi, 1994; FAO, 1996 and 1998; Dlamini and Khumalo, 2000). The efficiency of milk
production per cow is generally very low amongst smallholder farmers and is further
influenced by the high cost of commercial dairy concentrate and poor breeding practices
(Dlamini, 1990; Nhlabatsi, 1994; Dlamini and Khumalo, 2000).
Dairying, amongst other agricultural enterprises, is a source of food and income for most
people in rural Swaziland. This study is part of a comprehensive scrutiny into smallholder
dairying and was aimed at better understanding the types (categories) of smallholder dairy
farmers based on their herd sizes, management systems and success perceptions in the
enterprise. In addition the constraints that hamper the productivity of their enterprises would
be identified in relation to the categories and ultimately suggestions on how the problems can
be overcome, from a comprehensive view of the smallholder dairy industry in the country. In
the previous chapter, the performance of the smallholder herd could not be explained in
terms of regression model based on proportional milk yield deviations, hence further
investigation into cluster analysis to explain it.
4.2 Materials and Methods
In a study aimed at understanding the production system and constraints on smallholder
dairying in Swaziland, a survey was conducted between November 2003 and March 2004. A
total number of 118 smallholder dairy farms were covered, mainly on SNL in the Manzini
region and some surrounding areas. The collected data included visit (test) day milk yields,
69
milking frequency, breeding & reproductive performance records, herd structure, feeding
strategies, milk marketing and constraints on smallholder dairying. In addition, the farmers'
perception of success in smallholder dairying was assessed based on a categorical response
to five measures of farm and herd productivity. These measures were, increased milk yield,
cows calving annually, high milk sales, herd size increase and making money. The farmers
were asked whether or not they agreed with these measures as success indicators and their
individual responses to each measure were categorised on a nominal numerical scale of 1 to
5, with 1 = strongly disagree, 2= disagree, 3= Neutral, 4= Agree and 5= Strongly Agree.
The data were analysed using multivariate statistics. The initial step was the application of a
variable re~uction technique (ACELUS) on six variables (number of lactating cows, dry cows,
calves, heifers, bullocks and bulls) in order to generate canonical variables to be used in a
hierarchical cluster analysis (Ward's method) to determine the appropriate number of
clusters. Two canonical variables were generated and these accounted for 99.98% of the
variation. The pseudo-F, the pseudo-f and the cubic clustering criterion (CCC) were all
unanimous for a 3-cluster solution, which accounted for 91.7% of the variation . These
clusters were further finely adjusted using a non-hierarchical procedure FUSCLUS (SAS,
2002). The validity of these clusters was established using canonical discriminant analysis
on variables not used in clustering (i.e. milking frequency, record keeping, calf mortalities,
calf to cow ratio, breeding management, winter hay feeding, increased milk yield, cows
calving annually, high milk sales, herd size increase and making money) . Milking frequency
was either once or twice a day. Record keeping response was either yes or no (yes= 1; no=
0). Calf mortality was expressed as the actual number of observed calf deaths in each farm ,
irrespective of herd size. Calf to cow ratio = number of live calves as a proportion of the sum
of both lactating and dry cows per farm. Breeding management was given nominal values:
bulls only = 1, AI only = 2, the combined use of bulls and AI = 3. With respect to the practice
of winter hay feeding, the farmers were placed into two categories: winter hay feeding = 1
and no winter hay feeding =0.
70
Principal Components Analysis (ter Braak and Smilauer, 2003) was conducted on the same
data in order to further explore the existing relationships between the variables measured.
The farmers were categorised as samples, the herd dynamics and management were
considered as species and the farmers' perception of success variables were considered to
be supplementary data. A standardised and centred Principal Components Analysis (PCA)
was performed and ordination plots generated to extract the relationships between the
variables. The variables under herd dynamics were: number of lactating cows, heifers, dry
cows, calves, bullocks, bulls, proportion of calves to cows, total milk yield per farm, average
milk yield per cow and proportional calf mortality (calf mortalities expressed as a proportion
of the sum of both the live and dead calves). The management variables included record
keeping, winter hay feeding, breeding methods (management), winter feed supplementation
and dairy concentrate feeding. The success perception variables used remained the same as
described above.
Amongst the management variables, winter-feed supplementation and dairy concentrate
feeding were given nominal variables to represent the different systems of management
practised by the farmers. Winter supplement feeding was categorised as follows: none = 0,
dry fodder = 1, silage and/or pasture = 2, hominy chop, broken or crushed yellow maize and
molasses meal = 3, dry fodder, maize silage and/or fattening ration = 4. The daily
commercial dairy concentrate feeding was aSSigned four categories: None = 0, Yes = 1, Yes
but mixed with other ingredients at home = 2, Occasional commercial dairy concentrate
feeding = 3 and home made rations = 4.
4.3 Results and Discussion
Cluster 1 contains 3.4% of respondents; it has the highest numbers of lactating cows, calves,
dry cows, heifers and bullocks. The farmers in this cluster were also exclusively those that
owned bulls. Cluster 2 contains 77.1 % of respondents; it has an intermediate number of
71
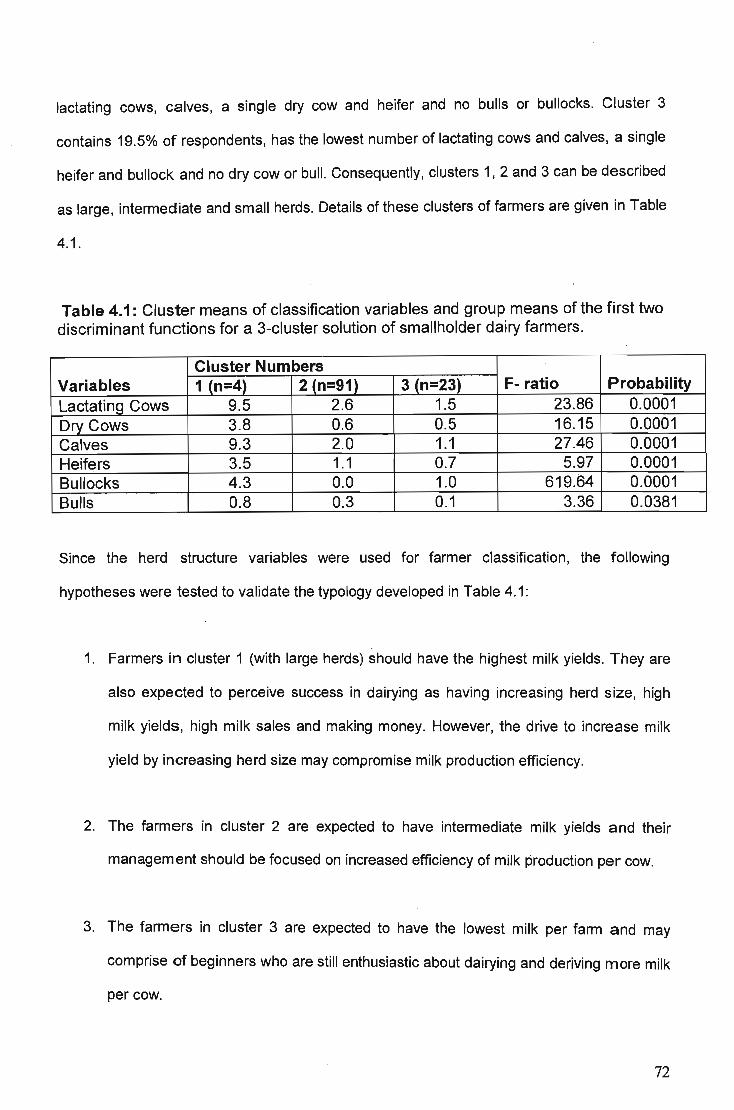
lactating cows, calves, a single dry cow and heifer and no bulls or bullocks. Cluster 3
contains 19.5% of respondents, has the lowest number of lactating cows and calves, a single
heifer and bullock and no dry cow or bull. Consequently, clusters 1, 2 and 3 can be described
as large, intermediate and small herds. Details of these clusters of farmers are given in Table
4.1.
Table 4.1: Cluster means of classification variables and group means of the first two discriminant functions for a 3-cluster solution of smallholder dairy farmers.
Cluster Numbers Variables 1 (n=4) 2 (n=91) 3 (n=23) F- ratio Probability Lactating Cows 9.5 2.6 1.5 23.86 0.0001 Dry Cows 3.8 0.6 0.5 16.15 0.0001 Calves 9.3 2.0 1.1 27.46 0.0001 Heifers 3.5 1.1 0.7 5.97 0.0001 Bullocks 4.3 0.0 1.0 619.64 0.0001 Bulls 0.8 0.3 0.1 3.36 0.0381
Since the herd structure variables were used for farmer classification, the following
hypotheses were tested to validate the typology developed in Table 4.1:
1. Farmers in cluster 1 (with large herds) should have the highest milk yields. They are
also expected to perceive success in dairying as having increasing herd size, high
milk yields, high milk sales and making money. However, the drive to increase milk
yield by increasing herd size may compromise milk production efficiency.
2. The farmers in cluster 2 are expected to have intermediate milk yields and their
management should be focused on increased efficiency of milk production per cow.
3. The farmers in cluster 3 are expected to have the lowest milk per farm and may
comprise of beginners who are still enthusiastic about dairying and deriving more milk
per cow.
72
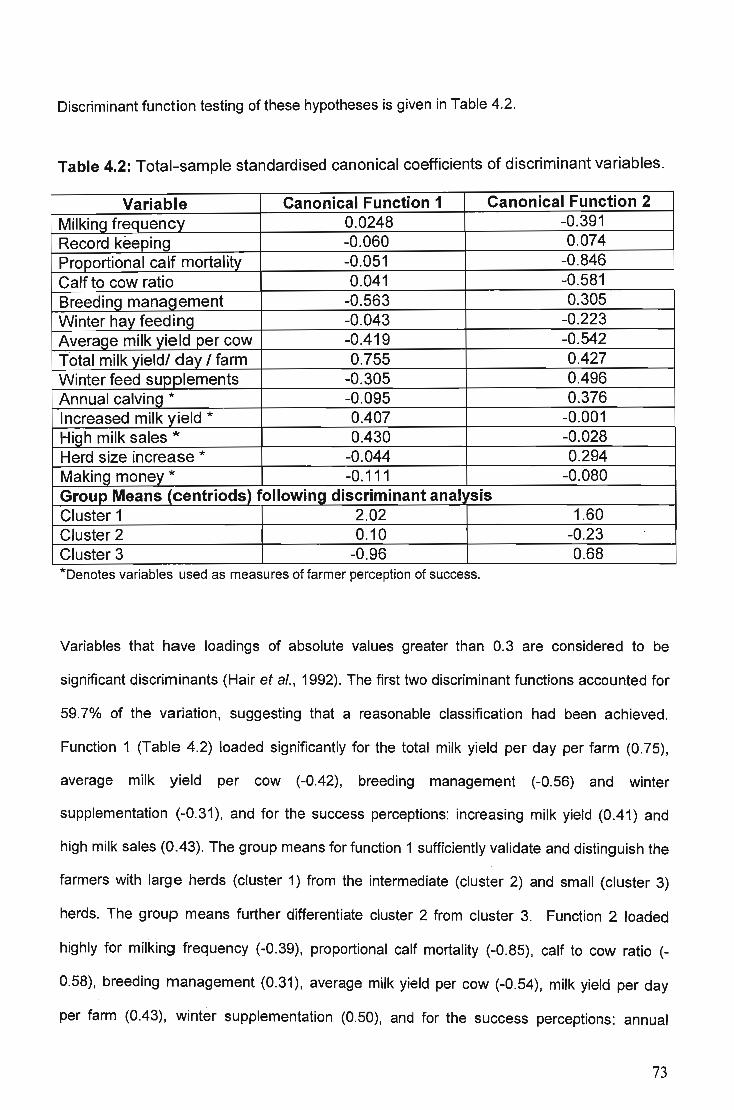
Discriminant function testing of these hypotheses is given in Table 4.2.
Table 4.2: Total-sample standardised canonical coefficients of discriminant variables.
Variable Canonical Function 1 Canonical Function 2 Milking frequency 0.0248 -0.391 Record keeping -0.060 0.074 Proportional calf mortality -0.051 -0.846 Calf to cow ratio 0.041 -0.581 Breeding manag_ement -0.563 0.305 Winter hay feeding -0.043 -0.223 Average milk yield per cow -0.419 -0.542 Total milk yield! dc!y! farm 0.755 0.427 Winter feed supplements -0.305 0.496 Annual calving * -0.095 0.376 Increased milk yield * 0.407 -0.001 High milk sales * 0.430 -0.028 Herd size increase * -0.044 0.294 Making money_ * -0.111 -0.080 Group Means (centriods) following discriminant analvsis Cluster 1 2.02 1.60 Cluster 2 0.10 -0.23 Cluster 3 -0.96 0.68 *Denotes variables used as measures of farmer perception of success.
Variables that have loadings of absolute values greater than 0.3 are considered to be
significant discriminants (Hair et al., 1992). The first two discriminant functions accounted for
59.7% of the variation, suggesting that a reasonable classification had been achieved.
Function 1 (Table 4.2) loaded Significantly for the total milk yield per day per farm (0.75),
average milk yield per cow (-0.42), breeding management (-0.56) and winter
supplementation (-0.31), and for the success perceptions: increasing milk yield (0.41) and
high milk sales (0.43). The .group means for function 1 sufficiently validate and distinguish the
farmers with large herds (cluster 1) from the intermediate (cluster 2) and small (cluster 3)
herds. The group means further differentiate cluster 2 from cluster 3. Function 2 loaded
highly for milking frequency (-0.39), proportional calf mortality (-0.85), calf to cow ratio (_
0.58), breeding management (0.31), average milk yield per cow (-0.54), milk yield per day
per farm (0.43), winter supplementation (0.50), and for the success perceptions: annual
73
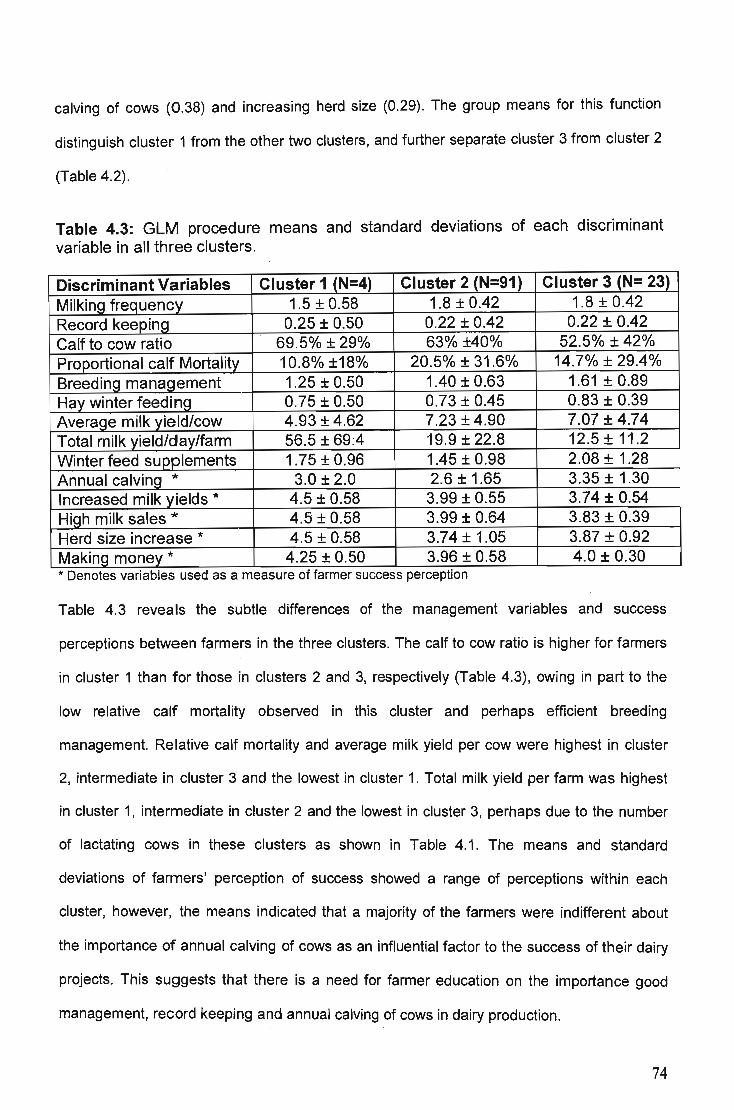
calving of cows (0.38) and increasing herd size (0.29). The group means for this function
distinguish cluster 1 from the other two clusters, and further separate cluster 3 from cluster 2
(Table 4.2).
Table 4.3: GLM procedure means and standard deviations of each discriminant variable in all three clusters.
Discriminant Variables Cluster 1 (N=4) Cluster 2 (N=91) Cluster 3 (N= 23) Milking frequency 1.5 ± 0.58 1.8 ± 0.42 1.8 ± 0.42 Record keeping 0.25 ± 0.50 0.22 ± 0.42 0.22 ± 0.42 Calf to cow ratio 69.5% ± 29% 63% ±40% 52.5% ±42% Proportional calf Mortality 10.8% ±18% 20.5% ± 31.6% 14.7% ± 29.4% Breeding management 1.25 ± 0.50 1.40 ± 0.63 1.61 ± 0.89 Hay winter feeding 0.75 ± 0.50 0.73 ± 0.45 0.83 ± 0.39 Average milk yield/cow 4.93 ± 4.62 7.23 ± 4.90 7.07 ± 4.74 Total milk yield/day/farm 56.5 ± 69.4 19.9 ± 22.8 12.5 ± 11 .2 Winter feed supplements 1.75 ± 0.96 1.45 ± 0.98 2.08 ± 1.28 Annual calving * 3.0 ±2.0 2.6 ± 1.65 3.35 ± 1.30 Increased milk yields * 4.5 ± 0.58 3.99 ± 0.55 3.74 ± 0.54 High milk sales * 4.5 ± 0.58 3.99 ± 0.64 3.83 ± 0.39 Herd size increase * 4.5 ± 0.58 3.74 ± 1.05 3.87 ± 0.92 Making money * 4.25 ± 0.50 3.96 ± 0.58 4.0 ± 0.30 * Denotes vanables used as a measure of farmer success perception
Table 4.3 reveals the subtle differences of the management variables and success
perceptions between farmers in the three clusters. The calf to cow ratio is higher for farmers
in cluster 1 than for those in clusters 2 and 3, respectively (Table 4.3), owing in part to the
low relative calf mortality observed in this cluster and perhaps efficient breeding
management. Relative calf mortality and average milk yield per cow were highest in cluster
2, intermediate in cluster 3 and the lowest in cluster 1. Total milk yield per farm was highest
in cluster 1, intermediate in cluster 2 and the lowest in cluster 3, perhaps due to the number
of lactating cows in these clusters as shown in Table 4.1. The means and standard
deviations of farmers' perception of success showed a range of perceptions within each
cluster, however, the means indicated that a majority of the farmers were indifferent about
the importance of annual calving of cows as an influential factor to the success of their dairy
projects. This suggests that there is a need for farmer education on the importance good
management, record keeping and annual calving of cows in dairy production.
74
4.3.1 Principal Components Analysis (PCA)
The peA correlation matrix revealed that among the variables used to measure farmer
perception of success, annual calving of cows was very poorly correlated to milk yields, milk
sales, herd size increase and making money (0.27, 0.24, 0.40 and 0.23, respectively). This
indicates that the majority of the respondents do not associate annual calving of cows to the
above-mentioned measures of success. This is perhaps one reason for the poor reproductive
performance and consequently poor milk yields among the smallholder farmers. Interestingly,
the respondents' success perception shows high positive correlations of milk sales, herd size
increase and making money to milk yield (0.55, 053 and 0.60, respectively). High milk sales,
was further found to be strongly correlated to making money (0.79) and increases in herd
size (0.54). The correlation between herd size increase and making money was 0.57. These
relationships are graphically illustrated in Figure 3.5 (PCA scatter plot). Expectedly, farmers
are aware that they need higher milk yields and efficient milk marketing in order to make .
money in dairying. Their means of increasing milk yield, however, appears to be exclusively
by increasing the number of lactating cows rather than improving milk production efficiency
per cow. In what appears to be a conundrum, increasing the herd size is highly correlated to
making money, whereas on the other hand the annual calving of cows is poorly correlated to
making money and the other measures of success. The question that arises then is how the
farmers manage to increase their herd sizes, considering the poor reproductive performance
of their stock. The only plausible answer would perhaps be that they mainly rely on the
acquisition of stock from other sources in order to increase their own herds in the drive to
make money.
75
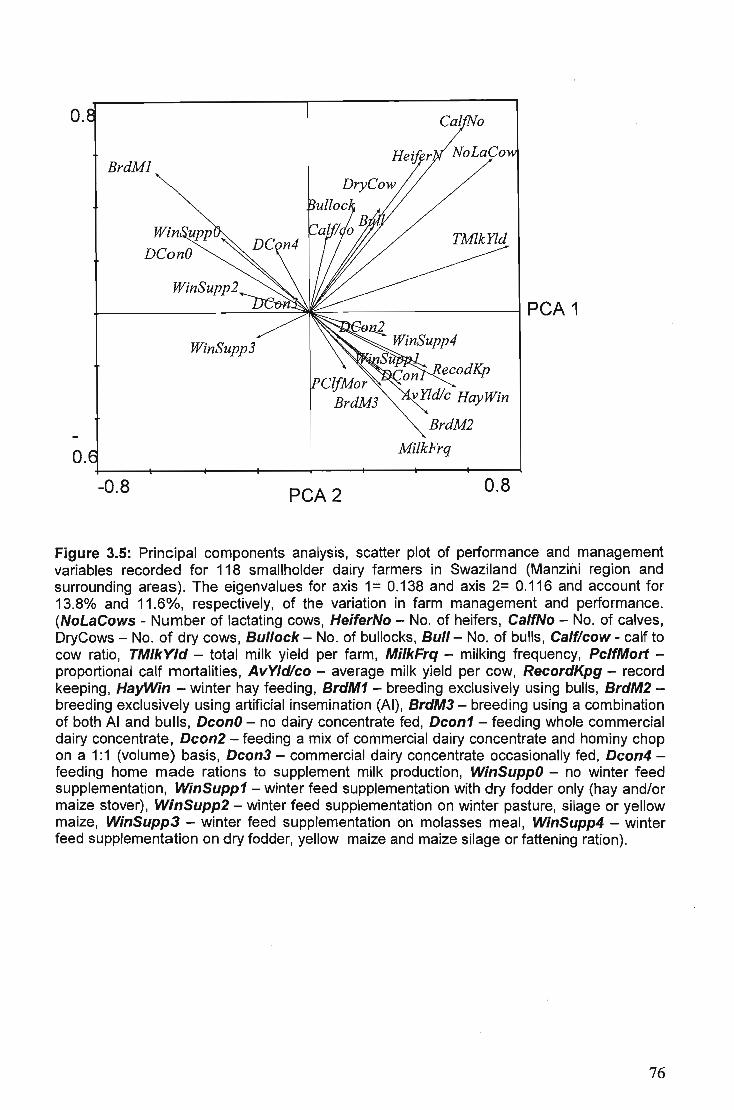
o. Cal 0
BrdMl
TMlkYld
WinSupp2
~----------~~~~------------~PCA1
WinSupp3
o. MilkFrq
-0.8 PCA2 0.8
Figure 3.5: Principal components analysis, scatter plot of performance and management variables recorded for 118 smallholder dairy farmers in Swaziland (Manzini region and surrounding areas). The eigenvalues for axis 1 = 0.138 and axis 2= 0.116 and account for 13.8% and 11.6%, respectively, of the variation in farm management and performance. (NoLaCows - Number of lactating cows, HeiferNo - No. of heifers, Calf No - No. of calves, DryCows - No. of dry cows, Bullock - No. of bullocks, Bull- No. of bulls, Calf/cow - calf to cow ratio, TMlkYld - total milk yield per farm, MilkFrq - milking frequency, PclfMort -proportional calf mortalities, AvYldlco - average milk yield per cow, RecordKpg - record keeping, HayWin - winter hay feeding, BrdM1 - breeding exclusively using bulls, BrdM2-breeding exclusively using artificial insemination (AI), BrdM3 - breeding using a combination of both AI and bulls, DconO - no dairy concentrate fed, Dcon1 - feeding whole commercial dairy concentrate, Dcon2 - feeding a mix of commercial dairy concentrate and hominy chop on a 1:1 (volume) basis, Dcon3 - commercial dairy concentrate occasionally fed, Dcon4-feeding home made rations to supplement milk production, WinSuppO - no winter feed supplementation, WinSupp1 - winter feed supplementation with dry fodder only (hay and/or maize stover), WinSupp2 - winter feed supplementation on winter pasture, silage or yellow maize, WinSupp3 - winter feed supplementation on molasses meal, WinSupp4 - winter feed supplementation on dry fodder, yellow maize and maize silage or fattening ration).
76
A plot of loadings of management and performance variables in the PGA, (Figure 3.5)
reveals that the farmers that had the most number of lactating cows also had higher total milk
yields per farm (TMlkYId). These farms also had higher numbers of calves, heifers, dry cows,
bullocks and bulls. In accordance with the findings of Weldeselasie (2003), average milk
yield per cow (AvYld/co) however appears to be positively but very poorly correlated to both
total milk yield per farm (TMlkYId) and number of lactating cows (NoLaCows) , indicating that
the efficiency of milk yield per cow is not significantly related to the number of lactating cows
on the farm. This relates to the trends revealed by clustering (Table 4.1 and 4.3),
emphasising that the farmers' approach to increasing milk yields is by increasing the number
of lactating cows as opposed to improving the milk production efficiency per cow. This
confirms the above argument on success perceptions of the farmers and further concurs with
the observations of Weldeselasie (2003). Bergevoet et al. (2004) reported that there is a
significant relationship between behaviour and the goals and intentions of farmers, a point
clearly illustrated above. On the other hand the ordination plot shows a high positive
correlation of average milk yield per cow to two out of the three breeding systems practised
i.e. exclusively AI (BrdM2) and a combination of both AI and bulls (BrdM3).
The third method, breeding exclusively using bulls (BrdM1) is highly negatively correlated to
average milk yield per cow (AvYld/co) . This could be a result of the fact that the farmers that
practice this breeding method (BrdM1) invariably employed poor farm management
practises, a fact validated by the high negative correlation of BrdM1 to milking frequency
(MilkFrq) , winter hay feeding (HayWin) , record keeping (RecodKpg) and good winter-feed
supplementation (WinSupp), which are all highly positively correlated to average milk yield
per cow (AvYld/co). In contrast, Weldeselasie (2003) observed that in Eritrea, average milk
yield/cow/day was significantly influenced by farmer location but not by herd size, access to
health services or the farmer's status.
77
The farms that fed whole commercial dairy concentrates (Dcon1) and those that fed the
commercial concentrates mixed with hominy chop (Dcon2) on a 1: 1 (volume) basis had
higher average milk yield per cow than those that either did not feed any dairy concentrates
(DconO) , occasionally fed commercial dairy concentrates (Dcon3) or fed home made rations
to lactating cows (Dcon4). The implication, therefore, is that the farms with high average milk
yield per cow are those with high or efficient levels of management. Weldeselasie (2003)
reported that all the farmers fed commercial dairy concentrate as a supplement to the forage
and fodder they had either grown or bought. The Swazi smallholder dairy farmers on the
other hand do not ordinarily provide fodder and forage, save for naturally growing grass and
maize stover remaining after grain harvesting. The main constraints on these being the
scarcity of land, water and skills for fodder production and conservation. In addition to these,
the availability of fodder for sale is very scarce and expensive.
Relative calf mortality (PCIfMort) has a very low negative correlation to both calf numbers
(Calf No) and the number of lactating cows (NoLaCows). The high relative calf mortalities
observed in clusters 2 and 3 (Table 4.3) are primarily due to the low number of calves that
these groups of farmers had (Table 4.1). Since relative calf mortality was calculated as a
proportion of the total number of calves in each farm, those farms that had a few calves and
had lost calves were consequently shown to have higher percentage calf mortalities. Milking
frequency is, however, positively correlated to calf mortality, implying perhaps that the calf
rearing skills of some of the farmers that milk twice daily are not up to standard. It is also
possible that the farmers focus more on increasing milk yield and in the process obliviously
sacrifice the calves since a number of them practice controlled suckling of calves on the
dams after each milking session. According to Ryle and 0rskov (1990), suckling can
increase milk yields and may reduce the incidence of mastitis, as well as prolong lactation.
This, therefore, implies that the farmers need to be educated on how to efficiently practise
controlled suckling so as to achieve its beneficial effects.
78
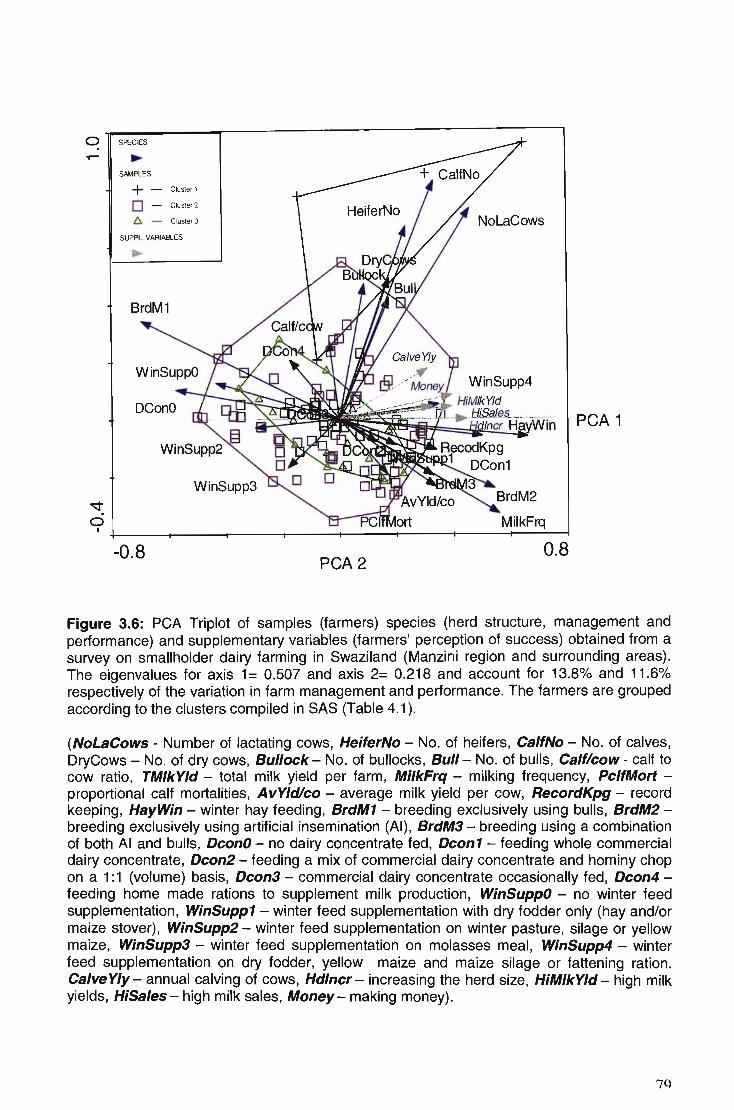
o SPECIES
T""" ..
-.:;t
o
SAMPLES
+ - Cluster 1
o - Cluster 2
f). - C lusler 3
SUPPL VARIAB-ES
WinSupp3
WinSupp4
I +-----~----~----~----~----~----_r----_T--~~
-0.8 PCA2
0.8
PCA 1
Figure 3.6: PCA Triplot of samples (farmers) species (herd structure, management and performance) and supplementary variables (farmers' perception of success) obtained from a survey on smallholder dairy farming in Swaziland (Manzini region and surrounding areas). The eigenvalues for axis 1 = 0.507 and axis 2= 0.218 and account for 13.8% and 11.6% respectively of the variation in farm management and performance. The farmers are grouped according to the clusters compiled in SAS (Table 4.1).
(NoLaCows - Number of lactating cows, HeiferNo - No. of heifers, Calf No - No. of calves, DryCows - No. of dry cows, Bullock - No. of bullocks, Bull- No. of bulls, Calf/cow - calf to cow ratio, TMlkYld - total milk yield per farm, MilkFrq - milking frequency, PclfMortproportional calf mortalities, AvYldlco - average milk yield per cow, RecordKpg - record keeping, HayWin - winter hay feeding, BrdM1 - breeding exclusively using bulls, BrdM2-breeding exclusively using artificial insemination (AI), BrdM3 - breeding using a combination of both AI and bulls, DconO - no dairy concentrate fed, Dcon1 - feeding whole commercial dairy concentrate, Dcon2 - feeding a mix of commercial dairy concentrate and hominy chop on a 1:1 (volume) basis, Dcon3 - commercial dairy concentrate occasionally fed, Dcon4 -feeding home made rations to supplement milk production, WinSuppO - no winter feed supplementation, WinSupp1 - winter feed supplementation with dry fodder only (hay and/or maize stover), WinSupp2 - winter feed supplementation on winter pasture, silage or yellow maize, WinSupp3 - winter feed supplementation on molasses meal, WinSupp4 - winter feed supplementation on dry fodder, yellow maize and maize silage or fattening ration. Calve Yly - annual calving of cows, Hdlncr - increasing the herd size, HiMlkYld - high milk yields, HiSales- high milk sales, Money- making money) .
7Q
All the supplementary variables (success perceptions of farmers) were strongly positively
correlated to PCA axis 1 and not to axis 2, save for CalveYly (annual calving of cows), which
was positively correlated to both PCA axis 1 & 2 (Figure 3.6). The PCA triplot (Figure 3.6)
shows the farmer clusters in relation to the herd structure, management, performance and
success perception variables measured in the field. The above PCA triplot revealed some
similarities between some members of the different clusters in relation to certain
management variables, especially members of clusters 2 and 3. Clusters 2 and 3 appear to
be very similar, primarily because of the small differences in their herd structures as opposed
to cluster 1, which is overtly different mainly due to the large herd sizes of the farms in this
cluster. These similarities are also shown in the subtle differences in the means of both
management and farmer success perception variables for clusters 2 and 3 in Table 4.3.
4.4 Conclusion
The Swazi smallholder dairy farmers can conclusively be classified into three groups, based
mainly on their herd structures, sizes, management systems and success perceptions in
dairying. The majority of farmers have intermediate herd sizes and high relative calf mortality.
The average milk yield per cow is very low across all clusters and there is poor nutritional
supplementation of the animals in the dry season. Most farmers appear to be indifferent
about the importance of annual calving of cows to their dairy enterprises. There is evidently a
great need for the enlightenment of the farmers on the importance of good nutrition, breeding
and calf rearing to the success of their dairy projects. Record keeping is an abstract concept
to most of the farmers, since they see it as just a waste of time. As record keeping is an
integral part of good management, it is imperative that the farmers be helped to appreciate
the essential and practical nature of record keeping in dairying. This, from a business
perspective would enable them to easily account for invested resources, production levels
and revenue received.
80
Chapter V
81
5.0 General Discussion And Conclusion
Swaziland has long had a disparity between the supply and demand of milk and while the
quantitative contribution of the large and medium scale commercial farmers to milk supply in
the country is known, that of smallholder farmers has remained virtually unknown and hence
open to speculation. Although this study was not aimed at quantifying the milk production
capacity of smallholder farmers, the productivity of their cattle was evaluated and was found
to be below expectation, emanating from a myriad of reasons. There is generally low milk
production efficiency per cow, which farmers appear to compensate for by increasing the
numbers of lactating animals. Given the fact that land and feed are scarce and both costly
resources, increasing animal numbers has the potential to further exacerbate the problem.
The solution would be to improve the milk-yielding efficiency per cow by acquiring cows of
high genetic merit and good management of their breeding and nutrition.
The major constraints to smallholder dairying in Swaziland were identified to be: poor
knowledge of appropriate dairy husbandry practices, inadequate extension service provision,
poor animal nutrition, high costs of feed, poor pasture & fodder production, land availability
and ownership, dairy stock availability, poor heat detection, poor breeding systems, calf
rearing practices, unfavourable milk prices in the formal market and poor organisation and
infrastructure in the informal milk market. The poor breeding systems (Le. heavy reliance on
natural breeding using unregistered dairy and non-dairy bulls) are a result of the fact that
most farmers do not own bulls and there is poor AI service utilisation due to poor record
keeping, poor communication with AI technicians and poor heat detection. The marketing of
milk in the informal market means that the farmers get paid in small amounts daily and as a
result end up using the revenue for household expenses and ultimately do not have enough
money to purchase dairy concentrates, hence the intermittent and transient feeding of
supplements.
82
There was generally poor pasture establishment, fodder production and conservation on
most farms. Pasture and fodder are both considerably a cheaper source of nutrition than the
feeding of total mixed rations or the substitute feeding of dairy concentrates, which some
farmers were observed to be practising. The most commonly fed fodder type is maize stover,
since almost every homestead grows maize in the wet season. The feeding of dairy
concentrates is primarily limited by cost and availability. The feed manufacturing factories
and retailers are concentrated in the hub of the country (Matsapha in the Manzini region) and
the major towns and cities, respectively. On the other hand, the majority of farmers are
located in the rural areas, which in turn are distant from the feed supply sources, making it
difficult and expensive for farmers to access dairy concentrates. Although some feed supply
depots, belonging to some feed manufacturers are present in some rural areas, they are still
considerably far from most smallholder farmers. The farmer co-operative depots also retail
animal feed but often run out of stock or do not have fresh feed because of the inconsistent
feed demand from smallholder farmers, owing to their lack of finances and transport.
Previous studies (Dlamini, 1990; Ogwang, 1993; Dlamini & Khumalo, 2000) on Swazi
smallholder dairyi ng have ascertained that the major constraints to pasture development and
fodder conservation are the lack of finances, skills, knowledge, equipment, and land and in
some instances water scarcity. While some farmers try to establish pastures, fodder
production and conservation on the other hand have been and presently remain a foreign
concept to Swazi smallholder farmers, a practise that has never been a part of traditional
livestock farming in Swaziland. Traditionally, after the harvesting of maize cobs, the stover
would be left behind and cattle are allowed to graze on it. The active production and
conservation of fodder is an involving and labour intensive process, to which many farmers
may be reluctant to commit. In addition to the absence of fodder production practices,
besides grasses, hardly any research has been conducted to determine the types of fodder
crops and cultivars suitable for rain-fed production in the different agro-ecological zones of
83
Swaziland. The cultivation of such crops would be most suitable in the dry season, when
ordinarily the crop fields remain fallow after the harvesting of maize grain.
5.1 Conclusion & Recommendations
In order to improve the current state of affairs in smallholder dairying, there has to be a
concerted effort from all stake holders in the industry geared towards improvement. The level
of extension service currently provided by the government and SODS has to be intensified,
with the two organisations working in close collaboration to educate and advise farmers,
including regular farm visits. A great deal of effort has to go into educating farmers on proper
dairy husbandry practices, cattle reproduction and heat detection, record keeping, calf
rearing and the importance of good nutrition (including pasture and fodder production and
feeding). The issue of stock availability can be addressed by the establishment of an efficient
breeding system at the Gege government dairy farm, as originally envisaged to provide
pedigree animals to smallholder farmers at reasonably low cost. This exercise would be
similar to the well established and ongoing national beef herd improvement breeding project,
which is implemented through the loaning of pedigree bulls to individual farmers, both
smallholders and ranchers.
The AI service provision should be improved, either by increasing the number of SODS
technicians or by increasing the numbers of AI skilled farmers to provide service efficiently in
their communities. If the latter is to work efficiently, there needs to be a review of the current
community based AI service provision, to ensure that the flaws of the programme are
rectified and incentives are provided for the AI skilled farmers who provide the service. In
addition to improving the AI service provision, the establishment of more milk collection
centres has the potential to boost milk production. This is, however, on condition that
improvements are made in the organisation of farmers into co-operative societies, the ·
location of the milk collection centres, milk collection systems and the prices at which the
84
milk and its products are sold, so as to improve the revenue of farmers and ensure the
sustainability of such business ventures.
Dairying, like every agricultural enterprise is a business venture and hence the farmers are
engaged in farming mainly to make money. In Swaziland the price of milk is subject to the
market forces of demand and supply, hence farmers have no control over it and at present
find it unfavourable to them. Given that smallholder farmers do not have the advantage of
economies of scale in their production, an alternative way to keep them in business is by
increasing the efficiency of milk production. In animal production, feed costs are generally
known to account for about 70% of total production costs. It follows therefore that a reduction
in feed expenditure without compromise on quality and quantity could greatly increase the
efficiency of production. This can be achieved by placing the cattle on a basal diet of pasture
and fodder, with commercial dairy concentrate fed specifically as a supplement and not the
substitution type feeding currently practised by many farmers.
As much as the current and previous studies have helped shed some light into the dynamics
of smallholder dairying in Swaziland, it would be advisable that further studies be conducted
on the different aspects of dairying in order for a clear understanding of the system to be
achieved. On an economic perspective, establishing the optimum size and level of operation
at which smallholder farmers would break even in their enterprises is vital if they are to be
advised on how best to make money in the industry. In addition, understanding the dynamics
of the current milk marketing channels and systems can perhaps lead to the realisation of
how best to market the produced milk and suggest possible value adding operations
(processing, packaging & distribution) prior to marketing. Adaptive research should be
conducted on the possible fodder crops that can be grown either through intercropping or
during the dry season in the different agro-ecological zones for dry season consumption, so
as to improve the nutrition of the cattle in the dry season.
85
References
Alejandrino A. L., C. O. Asaad, B. Malabayabas, A C. De Vera, M. S. Herrera, C. C.
Deocaris, L. M. Ignacio, L. P. Palo. 1999. Constraints on dairy cattle productivity
at the smallholder level in the Philippines. Preventative Vet. Med. 38: 167-178.
Amos, H. E., T. Kiser, and M. Loewenstein.1985. Influence of milking frequency on
productive and reproductive efficiencies of dairy cows. J. Dairy Sci. 68: 732-
739.
Bar-Peled, U., E. Malatz, I. Bruckental, Y. Folman, Y. Kali, H. Gacitua, AR Lehrer,
C.H. Knight, B. Robinzon, H. Voet and H. Tagari. 1995. Relationship between
frequent milking or suckling in early lactation and milk production of high
producing cows. J. Dairy Sci. 78: 2726-2736.
Batra, T.R, C.Y. Lin, A J. McAllister, A J. Lee, G. L. Roy, J. A Veseley, J. M.
Wauthy, and K. A Winter. 1987. Multitrait estimation of genetic parameters of
lactation curves in Holstein heifers. J. Dairy Sci. 70: 2105-2111.
Bearden, H.J. & Fuquay, J.W. The Oestrus Cycle. Applied Animal Reproduction (5th
edition) Mississippi State University. Prentice Hall, Inc. 2000
Bebe, B.O., H. M. J. Udo, G. J. Rowlands and W. Thorpe. 2003. Smallholder dairy
systems in the Kenya highlands: breed preferences and breeding practices.
Livestock Prod. Sci. 82: 117-127.
Bergevoet, RH.M., C.J.M. Ondersteijn, H.W. Saatkamp, C.M.J., van Woerkum and
RB.M. Huirne. 2004. Entrepreneurial behaviour of Dutch dairy farmers under a
milk quota system: goals, objectives and attitudes. Agricultural Systems 80: 1-
21.
Botha, W. J. S., H. G., Jaeger, H., Aitchison and W. H. Stoltsz. 1996. Ondersterpoort
Biological Products Manual (National Department of Agriculture) South Africa. p
48-53.
86
Brotherstone, S., R Thompson and I. M. S. White. 2004. Effects of pregnancy on
daily milk yield of Holstein-Friesian dairy cattle. Livestock Prod. Sci. 87: 265-
269.
Butler, W. R 2003. Energy balance relationships with follicular development,
ovulation and fertility in postpartum dairy cows. Livestock Prod. Sci. 38: 211-
218.
Butler, W. R, and RD. Smith. 1989. Interrelationships between energy balance and
postpartum reproductive function in dairy cattle. J. Dairy Sci. 72: 767-783
Capuco, A. V. and R M. Akers. 1999. Mammary involution in dairy animals. J.
Mammary Gland BioI. Neoplasia 4: 137-144.
Capuco, A. V., R. M. Akers and J. J. Smith. 1997. Mammary growth in Holstein cows
during the dry period: Quantification of nucleic acids and histology. J. Dairy Sci.
80: 477-487.
Cobby, J. M., and Y. P. L. Le Du . 1978. On fitting curves to lactation data. Anim.
Prod. 26: 127-133.
Coetzer, J. A. W., G. R Thomson and R C. Tustin. 1994. Infectious diseases of
livestock with special reference to Southern Africa. (VoI.1). Oxford University
Press. Cape Town. Oxford New York.
Collins-Lusweti, E. 1991. Lactation curves of Holstein-Friesian and Jersey cows in
Zimbabwe. S. Afr. J. Anim. Sci. 21: 11-15.
Coppock, C. E., R W. Everett, R P. Natzke, and H. R. Ainslie. 1974. Effect of dry
period length on Holstein milk production and selected disorders at parturition.
J. Dairy Sci. 57: 712-718.
Coulon, J. B., and B. Remond, 1991. Variations in milk protein content in response to
the level of energy supply to the dairy cow: A review. Livestock Prod. Sci. 29:
31-47.
87
Coulon, J. B., P. Pradel, T. Cochard, and B. Poutrel, 1998. Effect of extreme walking
conditions for dairy cows on milk yield, chemical composition, and somatic cell
count. J. Dairy Sci. 81: 994-1003.
De Peters , E. J., N. E. Smith, and J. Acedo-Rico. 1985. Three or two times daily
milking of older cows and first lactation cows for entire lactations. J. Dairy Sci.
68: 123-132.
Devendra, C., and C. C. Sevilla. 2002. Availability and use of feed resources in crop
animal systems in Asia. Agricultural Systems. 71 : 59-73.
Dlamini, A. M., and G.z. Khumalo. 2000. Evaluation of the performance of the small
scale dairy sector on Swazi nation Land. (University of Swaziland). A final
project report commissioned by the Swaziland Farmer Development Foundation
under the consortium of NGO's Drought mitigation programme (Sponsored by
the EU).
Dlamini, S. M. 1990. The management practices on small-scale dairy farms in
Swaziland. BSc Dissertation, Faculty of Agriculture, University of Swaziland.
Economic Planning Office (1995). Swaziland development plan 1994/95 - 199617.
Ministry of Economic Planning and Development.
El-Din. Zain A., T. Nakao, M. Abdel Raouf, M. Moriyoshi, K. Kawata, and Y. Moritsu.
1995. Factors in the resumption of ovarian activity and uterine involution in
postpartum dairy cows. Anim. Reprod. Sci. 38: 203-214
FAO, 1994. Livestock sub-sector review and range survey (Swaziland)
AG: TCP/SWN2353 Main report Vol. 1 Livestock sub-sector. Rome, 1994.
FAO, 1994. Livestock sub-sector review and range survey (Swaziland) Vol. 3
AG: TCP/SWN2353 Working Papers 1-8: 7 Dairy Development: 1-10.
88
· FAO, 1996. Preparation of a national dairy development plan and establishment of
model smallholder marketing groups (Swaziland). TCP/SWN4553. Field
Document 8. Policy and strategy issues in dairy sub-sector development. A
study contributing to the national dairy development plan.
FAO, 1998. Swaziland small-scale dairy development programme. Identification
Report. Report No. 98/008 IC-SWA. FAO Investment Centre Division.
Foote, R. H. 1978. Reproductive performance problems in New York dairy herds.
Search, 8: 1. Cornell University Agr. Exp. Sta.
Forsyth, I. A. 1986. Variation among species in the endocrine control of mammary
growth and function: The roles of prolactin, growth hormone and placental
lactogen. J . Dairy Sci. 69: 886-903.
GenStat Sixth Edition (Release 6.1) GenStat Procedure Library Release PL 14
(PClWindows 2000) Copyright 2002, Lawes Agricultural Trust (Rothamsted
Experimental Station). Harpenden, Hertfordshire, UK.
Gier, H. T., and G. B. Marion. 1968. Uterus of the cow after parturition: Involutional
changes. American J. Vet. Res. 29: 83-96.
Grossman, M., A. L. Kuck, and H. W. Norton. 1986. Lactation curves of purebred and
crossbred dairy cattle. J. Dairy Sci. 69: 195-203.
Grossman, M., and W. J. Koops. 1988. Multiphasic analysis of lactation curves in
dairy cattle. J. Dairy Sci. 71: 1598-1608.
Hair, J., R. Anderson, R. Tatham and W. Black. 1992. Multivariate data analysis, 3rd
Edition. Macmillan Publishing Co., New York, USA, 544pp.
Hanyani-Mlambo, B. T., S. Sibanda and V. 0stergarrd. 1998. Socio-economic
aspects of smallholder dairying in Zimbabwe. Livestock Res. for Rural Dev., 10:
No. 2. http://www.cipav.org.collrrd/
Jagger, T. D., P. A. Wedderburn, B. McCartan and A. G. Hunter. 1985. Veterinary
expedition to Swaziland. University of Edinburgh.
89
Kahi, A. K., G. Nitter and C. F. Gall. 2004. Developing breeding schemes for pasture
based dairy production systems in Kenya 11. Evaluation of alternative objectives
and schemes using a two-tier nucleus and young bull system. Livestock Prod.
Sci. 88: 179-192.
Kaziboni, S., N. T. Kusina, S. Sibanda, S. Makuza, O. Nyoni, and E. Bhebhe. 2004.
Performance of artificial insemination in smallholder dairies of Nharira
Lancashire in Zimbabwe. Livestock Res. for Rural Dev., 16: No. 4.
http://www.cipav.org.co/lrrd/
King, K. K., G. E. Siedel, Jr., and R. P. Elsden. 1982. Factors affecting gestation
length in bovine embryo transfer recipients. Theriogenology 17: 92.
Landete-Castillejos, T., and L. Gallego. 2000. Technical note: The ability of
mathematical models to describe the shape of lactation curves. J. Anim. Sci. 78:
3010-3013.
Louca, A. and Legates J.E. 1968. Production losses in dairy cattle due to days open.
J. Dairy Sci. 51: 573-583.
Lyimo, H. L. N., L. A. Mtenga, A. E. Kimambo, T. Hvelplund, G. H. Laswai and M. R.
Weisbjerg. 2004. A survey on calf feeding systems, problems and improvement
options available for the smallholder dairy farmers of Turiani in Tanzania.
Livestock Res. for Rural Dev. 16: No. 4. Article 23. http://www.cipav.org.co/lrrd/
Malima, B. T. 1999. Cattle mortalities caused by redwater (Bovine Babesiosis) in
Swaziland In 1994-1998. BSc Dissertation. Faculty of Agriculture. University of
Swaziland.
Masiteng, T. J., and C. van der Westhuizen. 2001. Extension needs of small-scale
dairy farmers in the north-eastern Free State. S. Afr. J. Agric. Ext. 30: 75-88.
Matthewman, R.W., J. D. Oldham, and G. W. Horgan, 1993. A note on the effect of
sustained exercise on straw intake and body weight in lactating cattle. Amin.
Prod. 57: 491-494.
90
Ministry Of Agriculture & Co operatives (MOAC), 2000. Swaziland livestock census
draft report. Livestock Marketing Section, Department of Veterinary & Livestock
Services.
Mkhonta, M. M. M. 1994. Cases of cattle diseases diagnosed in the smear laboratory
and the central veterinary diagnostic laboratory in Swaziland. BSc Dissertation,
Faculty of Agriculture, University of Swaziland.
Morton, J. and V. Miheso. 2000. Perceptions of livestock service delivery among
smallholder dairy producers: case studies from Central Kenya. Livestock Res.
For Rural Dev., 12: No. 2. pp 1-13.
Mostert, B. E., H. E. Theron and F. H. J. Kanfer. 2001. The effect of calving season
and age at calving on production traits of South African dairy cattle. S. Afr. J.
Anim. Sci. 21: 11-15.
Mutukumira, A. N., D. M. J. Dube, E. G. Mupunga and S. B. Feresu. 1996.
Smallholder milk production, milk handling and utilisation: A case study from the
Nharira/Lancaster farming area, Zimbabwe. Livestock Res. for Rural Dev., 8:
No. 1: http://www.cipav.org.co/lrrd/
Nhlabatsi, N. N. 1994. A study of the characteristics and productivity of small-scale
dairy farmers in Swaziland. BSc Dissertation. Faculty of Agriculture, University
of Swaziland.
Ogwang, B. H. 1993. Constraints to the development of improved pastures for small
scale dairy farmers in Swaziland. Uniswa J. of Agric. 2: 70-75.
Pedersen, C. and J. Madsen. 1998. Constraints and opportunities for improved milk
production and calf rearing in Sanyati communal farming area, Zimbabwe.
Livestock Res. for Rural Dev., 10: No.1. http://www.cipav.org.co/lrrd/
Prosser, C. G. and S.R. Davis, 1992. Milking frequency alters the yield and
mammary blood flow response to intra-mammary infusion of insulin-like growth
factor-I in the goat. J. Endocrinology 135: 311-316.
91
Rao, P. P., and A. J. Hall. 2003. Importance of crop residues in crop-livestock
systems in India and farmers' perceptions of fodder quality in coarse cereals.
Field Crops Research. 84: 189-198.
Rekik, B. and A. Ben Gara. 2004. Factors affecting the occurrence of atypical
lactations for Holstein Friesian cows. Livestock Prod. Sci. 87: 245-250.
Reynolds L., T. Mertz and J. Kiptarus. 1996. Smallholder dairy production in Kenya.
Wld Anim. Rev., 87: pp. 66-73.
Risco, C.A., M. Drost, W.W. Thatcher, J. Savio and M.J. Thatcher. 1994. Effects of
calving-related disorders on prostaglandin, calcium, ovarian activity and uterine
involution in postpartum dairy cows. Theriogenology 42: 183-203.
Roothaert, R. L. 2000. The potential of indigenous and naturalised fodder trees and
shrubs for intensive use in central Kenya. Doctoral thesis. Wageningen
University, The Netherlands.
Ryle, M. and E. R. 0rskov. 1990. On milk yields and calf rearing. Livestock Research
For Rural Development. Vol. 2. No. 3. http://www.cipav.org.collrrd/
SAS ®, 2002. SAS user's guide: Statistics, Version 8 for Windows. SAS Institute Inc.,
Cary, North California, USA.
Scheidegger, G. A., R. P. Melendez, A. M. Duchens, H. J. Austin. 1993. Retained
foetal membranes and other puerperal reproductive disorders and their effect
on postpartum fertility in Holstein cattle. Avances en Ciencias Veterinarias. 8:
18-23.
SDDB, 1998. Swaziland Dairy Development Board, Annual Report. 1998.
SDDB, 1999. Swaziland Dairy Development Board, Annual Report. 1999.
SDDB, 2000. Swaziland Dairy Development Board, Annual Report. 2000.
SDDB, 2001. Swaziland Dairy Development Board, Annual Report. 2001.
92
SDDB, 2002a. Swaziland Dairy Development Board, Annual Report. 2002.
SDDB, 2002b. Progress report on the board's short-term objectives for dairy
development. Swaziland Dairy Development Board. Unpublished report.
August-November, 2002.
SC2lrensen, J.T. and C. Enevoldsen. 1991. Effect of dry period length on milk production in subsequent lactation. J. Dairy Sci. 74: 1277-12B3.
Stewart, P. G. 1995. Dairy herd structure/dairy herd dynamics. Dairying in KwaZulu
Natal. Agricultural production guidelines for KwaZulu-Natal. KZN Department of
Agriculture. 2.3: 69-75
Swanson, E. W. 1965. Comparing continuous milking with sixty-day dry periods in
successive lactations. J. Dairy Sci. 48: 1205-1209.
Sweet, R. J., and S. Khumalo. 1994. Range resources and grazing potentials in
Swaziland. FAO, TCP/SWAl2353 Field document 1. Livestock Sub-sector
review and range resources survey. Ministry of Agriculture & Co operatives,
Swaziland.
Tambi, E. N. 1991. Dairy production in Cameroon: growth, development, problems
and solutions. Wld Anim. Rev., 167: 38-48.
Taylor, M. and B. B. Xaba. 1994. Non-range livestock feed resources. Livestock Sub
sector review and range survey (Swaziland). AG: TCP/SWAl2353 Working
Paper No. 4. FAO. Rome. 1994.
Tekerli, M., Akinci, Z., Dogan, I., and Akcan, A. 2000. Factors affecting the shape of
lactation curves of Holstein cows from the Balikesir province of Turkey. J. Dairy
Sci. 83: 1381-1386.
ter Braak, C. J. F. and P. Smilauer. 2003. CANOCO for Windows, Version 4.51,
2003. Biometris - Plant Research International, Wageningen, The Netherlands.
Tucker, H. A. 1987. Quantitative estimates of mammary growth during various
physiological states: A review. J. Dairy Sci. 70: 1958-1966.
93
Tucker, H. A. 2000. Hormones, mammary growth, and lactation: a 41-year
perspective. J. Dairy Sci. 83: 874 - 884.
Vilakati, D. 1994. National cattle breeding programme. Livestock sub-sector review
and range survey (Swaziland). AG: TCP/SWAl2353. Working Paper No. 6.
FAO. Rome. 1994.
von Senger, I. , N. P. Barker and C. Zachariades. 2002. Preliminary phylogeography
of Chromolaena odorata: Finding the origin of a South African weed.
Proceedings of the fifth international workshop on biological control and
management of Chromolaena odorata, Durban, South Africa, 23 - 25 October
2000, Zachariades, C., R. Muniappan and L. W. Strathie (eds). ARC - PPRI
(2002) pp. 90-99.
Weldeselasie, A. M., 2003. Dairy constraint analysis in Eritrea, with special emphasis
on Asmara and surrounding dairy farms. MSc Thesis. University of Natal,
Pietermaritzburg, South Africa.
Wilde, C. J. and C. H. Knight. 1989. Metabolic adaptations in mammary gland during
the declining phase of lactation. J. Dairy Sci. 72: 1679-1692.
Wilde, C. J., C. H. Knight, and D. J. Flint. 1999. Control of milk secretion and
apoptosis during mammary involution. J. Mammary Gland BioI. Neoplasia. 4:
NO.2. 129-136.
Wood, P.D.P. 1967. Algebraic model of the lactation curve in cattle. Nature (London)
216: 164-165.
Wood, P.D.P. 1969. Factors affecting the shape of the lactation curve in cattle. Anim.
Prod. 11: 307-316.
Wood, P.D.P. 1970a. A note on the estimation of total lactation yield from production
on a single day. Anim. Prod. 19: 393.
Wood, P.D.P. 1970b. A note on the repeatability of parameters of the lactation curve
in cattle. Anim. Prod. 12: 535-538.
94
Wood, P.D.P. 1972. A note on seasonal fluctuations in milk production. Anim. Prod.
15: 89-92.
Wood, P.D.P. 1976. Algebraic models of the lactation curves for milk, fat and protein
production, with estimates of seasonal variation. Anim. Prod. 22: 35-40.
Zachariades, C. and J. M. Goodall. 2002. Distribution, impact and management of
Chromo/aena odorata in Southern Africa. Proceedings of the fifth international
workshop on biological control and management of Chromo/aena odorata,
Durban, South Africa, 23 - 25 October 2000, Zachariades, C., R. Muniappan
and L. W. Strathie (eds). ARC - PPRI (2002) pp. 34-39.
95
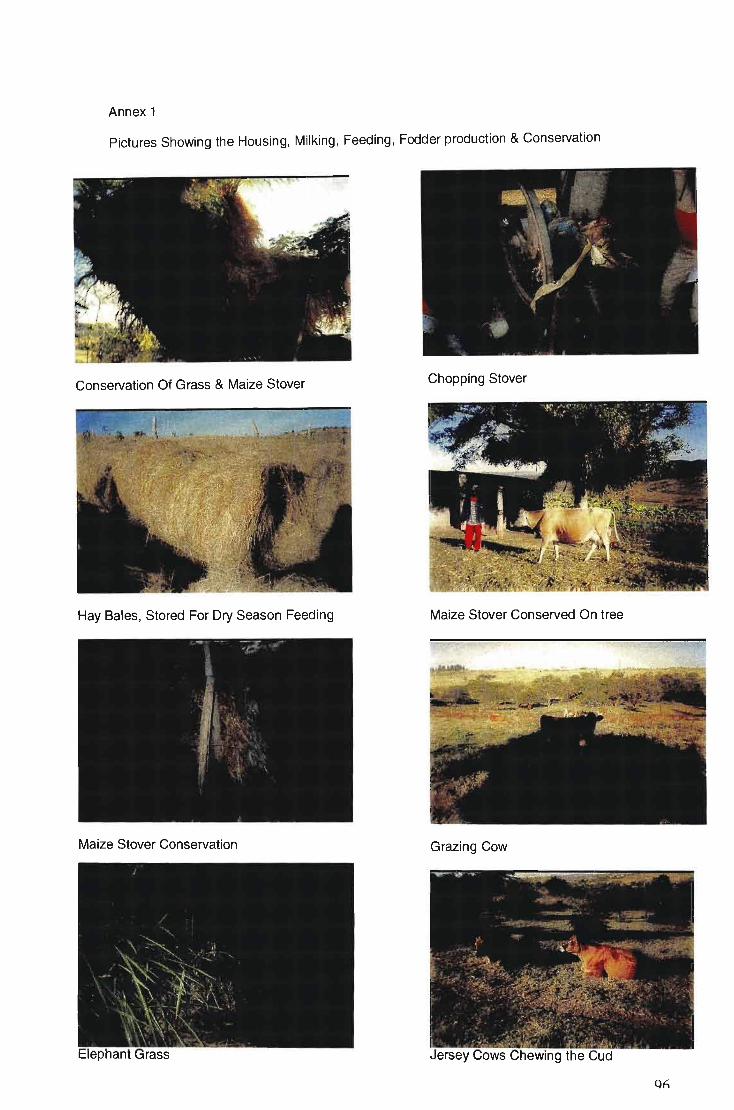
Annex 1
Pictures Showing the Housing, Milking, Feeding, Fodder production & Conservation
Conservation Of Grass & Maize Stover Chopping Stover
Hay Bales, Stored For Dry Season Feeding Maize Stover Conserved On tree
Maize Stover Conservation Grazing Cow
Qfi
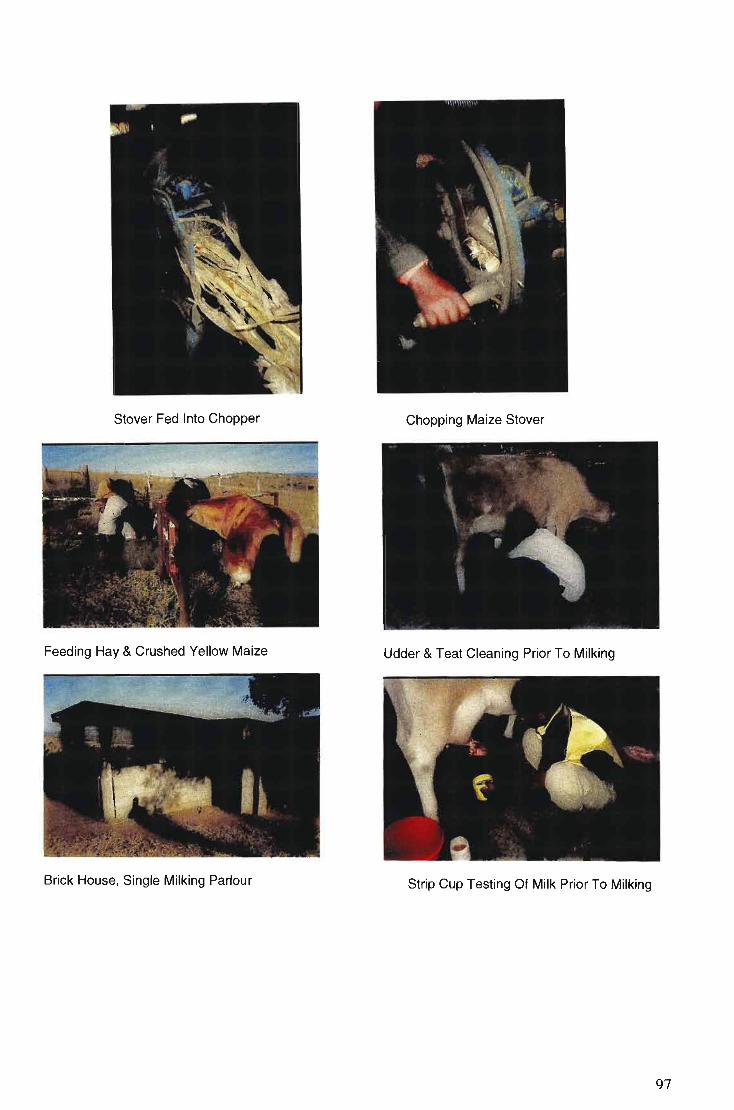
Stover Fed Into Chopper Chopping Maize Stover
Feeding Hay & Crushed Yellow Maize Udder & Teat Cleaning Prior To Milking
Brick House, Single Milking Parlour Strip Cup Testing Of Milk Prior To Milking
97
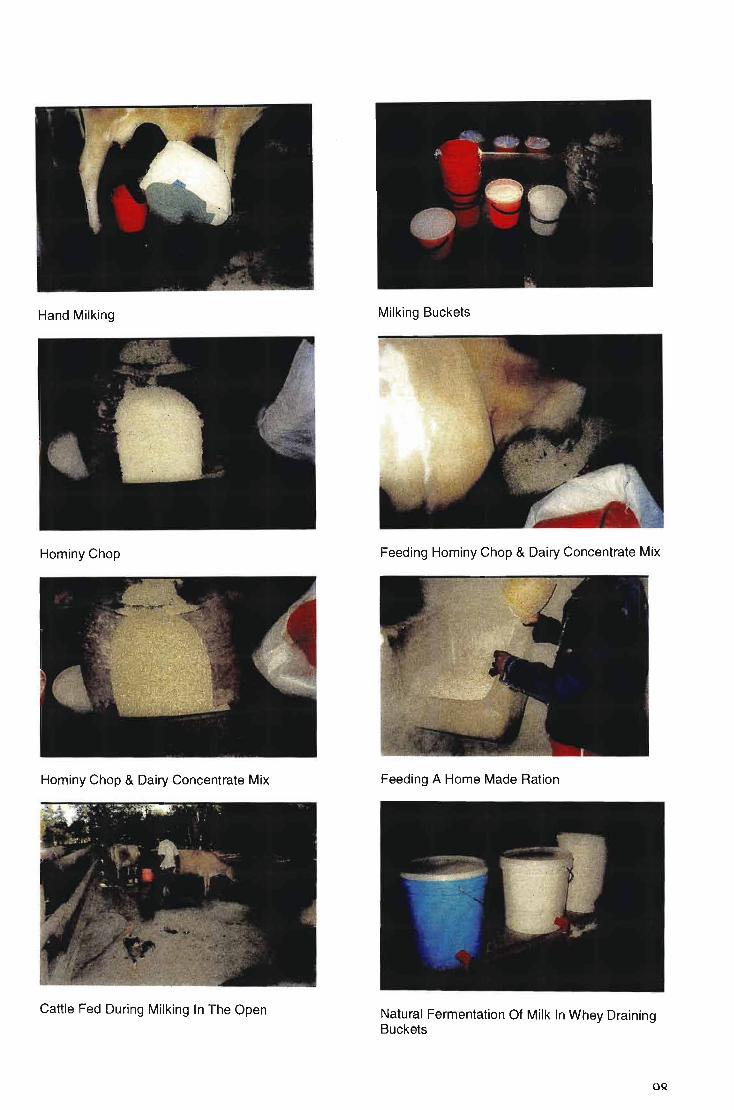
Hand Milking
Hominy Chop
Hominy Chop & Dairy Concentrate Mix
Cattle Fed During Milking In The Open
Milking Buckets
Feeding Hominy Chop & Dairy Concentrate Mix
Feeding A Home Made Ration
Natural Fermentation Of Milk In Whey Draining Buckets
OQ
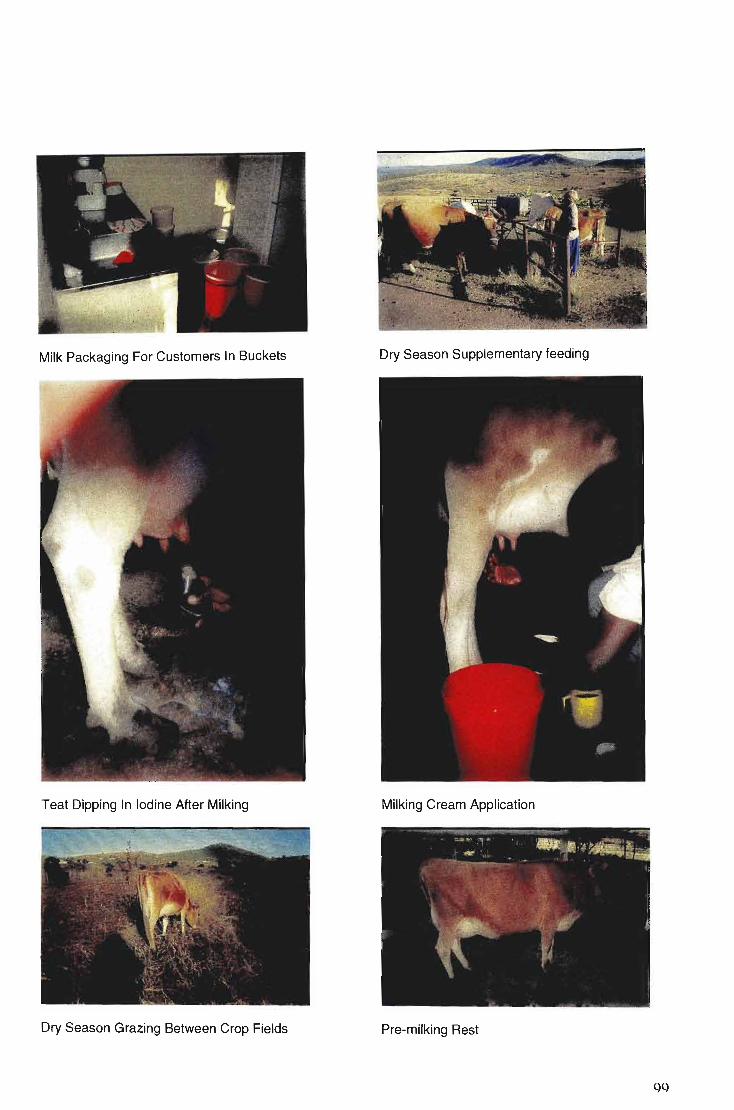
Milk Packaging For Customers In Buckets Dry Season Supplementary feeding
Teat Dipping In Iodine After Milking Milking Cream Application
Dry Season Grazing Between Crop Fields Pre-milking Rest
Related Documents


![SWAZILAND GOVERNMENT GAZETTE EXTRAORDINARY - Swaziland Competition … Commission Regulations... · SWAZILAND GOVERNMENT GAZETTE EXTRAORDINARY VOL. XLVIII] ... \ THE COMPETITION ACT,](https://static.cupdf.com/doc/110x72/5ad0acb57f8b9a8b1e8e2be8/swaziland-government-gazette-extraordinary-swaziland-competition-commission.jpg)