SUPPLY CHAIN FIT Constituents and Performance Outcomes Inaugural Dissertation for Obtainment of the Degree Doctor rerum politicarum (DR. RER. POL.) Written by: Pan Theo Grosse-Ruyken Schürbungert 9, 8057 Zurich, Switzerland Submitted to: WHU – Otto Beisheim School of Management Referee: Prof. Dr. Stephan M. Wagner Chair of Logistics Management Department of Management, Technology, and Economics Swiss Federal Institute of Technology Zurich Co-Referee: Prof. Dr. Dr. h. c. Jürgen Weber Institute of Management Accounting and Control (IMC) WHU – Otto Beisheim School of Management Zurich, December 2009

Welcome message from author
This document is posted to help you gain knowledge. Please leave a comment to let me know what you think about it! Share it to your friends and learn new things together.
Transcript
SUPPLY CHAIN FIT Constituents and Performance Outcomes
Inaugural Dissertation for Obtainment of the Degree Doctor rerum politicarum (DR. RER. POL.)
Written by:
Pan Theo Grosse-Ruyken Schürbungert 9, 8057 Zurich, Switzerland
Submitted to:
WHU – Otto Beisheim School of Management
Referee:
Prof. Dr. Stephan M. Wagner Chair of Logistics Management
Department of Management, Technology, and Economics Swiss Federal Institute of Technology Zurich
Co-Referee:
Prof. Dr. Dr. h. c. Jürgen Weber Institute of Management Accounting and Control (IMC)
WHU – Otto Beisheim School of Management
Zurich, December 2009

i
Contents
Contents ........................................................................................................................... i
List of Figures ......................................................................................................................... v
List of Tables ......................................................................................................................... vi
List of Abbreviations ........................................................................................................... vii
Chapter I Introduction and Research Overview .......................................................... 1
1. Introduction .................................................................................................................... 1
2. Supply chain management, challenges and fit constituents ........................................... 6
2.1. Supply chain management .................................................................................... 8
2.1.1. The objective of supply chain management ............................................ 10
2.1.2. Supply chain drivers ................................................................................ 12
2.2. Supply chain challenges ...................................................................................... 13
2.2.1. Core challenges ....................................................................................... 14
2.2.2. Additional stresses .................................................................................. 17
2.3. Strategic fit .......................................................................................................... 20
2.3.1. Demand and supply uncertainty spectrum .............................................. 21
2.3.2. Supply chain capabilities ......................................................................... 23
2.3.3. Zone of strategic fit ................................................................................. 25
2.3.4. Obstacles ................................................................................................. 28
3. Research questions ....................................................................................................... 29
3.1. Research question I ............................................................................................. 30
ii
3.2. Research question II ............................................................................................ 32
3.3. Research question III ........................................................................................... 34
4. Empirical basis ............................................................................................................. 36
4.1. Studies I and II .................................................................................................... 38
4.1.1. Data collection procedure ....................................................................... 38
4.1.2. Sample characteristics ............................................................................. 40
4.1.3. Data examination .................................................................................... 41
4.2. Study III .............................................................................................................. 42
4.2.1. Data collection procedure ....................................................................... 42
4.2.2. Sample characteristics ............................................................................. 42
4.2.3. Data examination .................................................................................... 44
Chapter II The Bottom Line Impact of Supply Chain Management ......................... 46
1. Theoretical background and hypotheses ...................................................................... 46
1.1. Configurational approach .................................................................................... 47
1.2. Supply chain fit ................................................................................................... 48
1.3. Consequences of a supply chain fit ..................................................................... 52
2. Methodology ................................................................................................................ 54
2.1. Data sample and procedure ................................................................................. 54
2.2. Measures ............................................................................................................. 54
3. Statistical analysis and results ...................................................................................... 59
3.1. Reliability and validity ........................................................................................ 59
3.2. Regression model estimation and hypotheses testing ......................................... 62
3.3. Post-hoc analysis ................................................................................................. 63
4. Discussion and implications ......................................................................................... 66
iii
Chapter III Supply Chain Design Efficiency: Benchmarking Supply Chains in
Manufacturing Firms ................................................................................... 69
1. Theoretical background ................................................................................................ 69
1.1. Configurational approach .................................................................................... 70
1.2. Supply chain design spectrum ............................................................................. 70
1.3. Data Envelopment Analysis as a benchmarking tool .......................................... 72
2. Methodology ................................................................................................................ 74
2.1. Data sample and procedure ................................................................................. 74
2.2. Measures ............................................................................................................. 75
3. Statistical analysis and results ...................................................................................... 77
3.1. Reliability and validity ........................................................................................ 77
3.2. Data Envelopment Analysis results .................................................................... 79
4. Discussion and implications ......................................................................................... 82
Chapter IV Exploring Sourcing Flexibility, Supply Chain Performance and
Product Performance ................................................................................... 86
1. Theoretical background and hypotheses ...................................................................... 86
1.1. Sourcing flexibility .............................................................................................. 86
1.2. Conceptual framework ........................................................................................ 88
2. Methodology ................................................................................................................ 92
2.1. Data sample and procedure ................................................................................. 92
2.2. Measures ............................................................................................................. 92
3. Statistical analysis and results ...................................................................................... 97
3.1. Reliability and validity ........................................................................................ 97
3.2. Structural model estimation and hypotheses testing ......................................... 101
4. Discussion and implications ....................................................................................... 103

iv
Chapter V Summary, Limitations, and Outlook ........................................................ 105
1. Summary and review of the research questions ......................................................... 105
1.1. Research question I ........................................................................................... 107
1.2. Research question II .......................................................................................... 108
1.3. Research question III ......................................................................................... 110
2. Major academic contributions .................................................................................... 112
3. Major implications for practice .................................................................................. 113
4. Limitations .................................................................................................................. 115
4.1. Data gathering and statistical analysis .............................................................. 116
4.2. Conceptual frameworks .................................................................................... 118
5. Directions for future research ..................................................................................... 119
5.1. Model extensions and alternative underpinnings .............................................. 119
5.2. Cross-country effects ........................................................................................ 123
5.3. Longitudinal research design ............................................................................ 124
6. Outlook ....................................................................................................................... 124
References ...................................................................................................................... 126
Appendix ...................................................................................................................... 140
v
List of Figures
Figure 1: Supply chain decision-making framework 7
Figure 2: Supply chain management framework and its components 10
Figure 3: Pictorial of hierarchy of supply chain challenges 14
Figure 4: Fit and misfit matrix 25
Figure 5: Zone of strategic fit 27
Figure 6: Overview of research questions 30
Figure 7: Empirical basis of research questions 38
Figure 8: Achieving a fit in the supply chain 51
Figure 9: Conceptual framework I 52
Figure 10: Overview of fit and misfit firms 64
Figure 11: Financial performance of fit firms and misfit counterparts 65
Figure 12: Conceptual framework II 74
Figure 13: DEA supply chain design efficiency frontier line 81
Figure 14: SCDE and ROCE 82
Figure 15: Conceptual framework III 89
vi
List of Tables
Table 1: Generic product profiles 22
Table 2: Generic supply chain design profiles 24
Table 3: Breakdown of sample I composition 40
Table 4: Respondent work experience of sample I 41
Table 5: Breakdown of sample II composition 43
Table 6: Respondent work experience of sample II 44
Table 7: Measures of constructs I 55
Table 8: Factor analysis results and measurement statistics I 60
Table 9: Inter-construct correlations and AVE I 61
Table 10: Results of model estimation I (OLS regression) 63
Table 11: Measures of constructs II 75
Table 12: Factor analysis results and measurement statistics II 78
Table 13: Inter-construct correlations and AVE II 79
Table 14: Results of model estimation II (DEA) 80
Table 15: Measures of constructs III 93
Table 16: Factor analysis results and measurement statistics III a 98
Table 17: Inter-construct correlations and AVE III 99
Table 18: Factor analysis results and measurement statistics III b 100
Table 19: Results of model estimation III a (SEM) 101
Table 20: Results of model estimation III b (SEM) 103

vii
List of Abbreviations
A Austria ANOVA Analysis of variance AVE Average variance extracted CCC Cash conversion cycle CFA Confirmatory factor analysis CFI Comparative fit index CFO Chief financial officer CH Switzerland DEA Data envelopment analysis df Degrees of freedom DMU Decision making unit EBIT Earnings before interest and tax ERP Enterprise resource planning F France G Germany GFI Goodness of fit index IR Indicator reliability IT Information technology KPI Key performance indicators M Mean ( x) MANOVA Multivariate analysis of variance ML Maximum likelihood NNFI Non-normed fit index (also TLI) OEM Original equipment manufacturer OLS Ordinary least squares RMSEA Root mean square error of approximation ROA Return on assets ROCE Return on capital employed SCDE Supply chain design efficiency SCF Supply chain fit SCM Supply chain management SD Standard deviation (sx) SE Standard error SEM Structural equation modeling SG Sales growth TLI Tucker-Lewis Index (also NNFI) UK United Kingdom US United States (of America) USA United States of America VIF Variance inflation factor Cues to abbreviations of items and constructs are provided in the Appendix.
Chapter I: Introduction and Research Overview 1
Chapter I Introduction and Research Overview
1. Introduction
Increasing recognition is being placed, both in academia and in industry, on effective supply
chain management. A famous quote from the work of Charles Darwin notes that “it is not the
strongest species that survive, nor the most intelligent, but the ones most responsive to
change”. Viewing effective supply chain management in light of this perspective, what does
“most responsive” mean? Academics and practitioners agree that functional products are best
delivered via physically-efficient supply chains, while innovative products are best delivered
via market responsive supply chains. However, to date, only a few firms have systematically
adjusted their supply chain strategies according to this argument. Instead of carrying only one
product line, firms deliver a number of both functional and innovative products in parallel
complicating the alignment of supply chain portfolios with product portfolios. Furthermore,
as firms adopt new product lines, enter new markets, build new warehouses and production
plants, and lose the protection of traditional industry barriers, formulating the right supply
chain strategy is the utmost challenge. First, more competition means price and margin
pressure due to the increased commoditization of products and services. Second, there is
more variation in customer needs. The competitive mandate is to serve customers faster,
better, and at lower cost. Hence, one of the major leverage factors to effective supply chain
management is the “fit” between supply chain strategy and supply chain design variables
Chapter I: Introduction and Research Overview 2
(Grosse-Ruyken and Wagner, 2009a; 2009b; Chopra and Meindl, 2009; Wagner and Grosse-
Ruyken, 2008; Lee 2002; Fisher, 1997).
Cash is the lifeblood of every business (Pike and Neale, 1999) and successful supply
chain management comes down to the ability to create shareholder value (Wagner and
Locker, 2009; Pohlen and Coleman, 2005; Lambert and Pohlen, 2001). Several recent studies
have found a direct link between excellent supply chain management and profitability (e.g.,
Dehning et al., 2007; Hendricks and Singhal, 2005; Droge et al., 2004; D’Avanzo et al.,
2003; Vickery et al., 2003; Timme and Williams-Timme, 2000). Nonetheless, supply chain
metrics are not explicitly linked to shareholder value (Hartley-Urquhart, 2006; Ketchen and
Giunipero, 2004; Ellram and Liu, 2002; Stemmler, 2002). Whereas numerous concepts and
technologies have been applied to optimize and to improve the supply chain (e.g., Ellram and
Cousins, 2007; Hausmann, 2003; Cooper et al., 1997; Ellram, 1991), analysis of the match
between product types and the employed supply chain strategies has so far not been sufficient
to assist decision-making in supply chain management (Grosse-Ruyken and Wagner, 2009b;
Selldin and Olhager, 2007; Ketchen and Giunipero, 2004). Until today, researchers in the
field of supply chain management, procurement, and finance have focused on the efficient
configuration of operational processes and allocation of scarce resources by relying on the
assumptions of neoclassical or new institutional economic theory. However, insights from all
three disciplines have not been systematically integrated. Few firms structure their supply
chain drivers effectively and achieve a fit between product types and supply chain strategies
(Li and Brien, 2001; Stock et al., 2000; Doty et al., 1993). Furthermore, failure to categorize
products in relation to supply chain management strategies is still not unusual in various
industries. Even more important, the financial impact of theoretically ideal supply chain
Chapter I: Introduction and Research Overview 3
management frameworks (Chopra and Meindl, 2009; Lee, 2002; Fisher, 1997), or in other
words, the bottom line impact of supply chain management, has not been sufficiently
investigated. This presents an open field for research. In order to fill this research gap, this
dissertation is built on three research questions:
First, from a strategic perspective, we look at the bottom line impact of supply chain
management, i.e., the impact of a fit in the supply chain on a firm’s financial success. The
impact of a supply chain fit, so far, has neither been quantified by firms nor documented in
the literature. Configurational theory suggests that higher performance can be realized if a
firm achieves a perfect “fit.” As such, supply chain fit, i.e., strategic consistencies between
demand aspects of the underlying product and supply chain design, is a major leverage factor
in a firm’s financial success. However, many firms struggle to achieve the ideal supply chain
fit. Increased uncertainty of implied demand is often not served by sufficient supply chain
responsiveness.
Second, from a tactical perspective, we investigate how supply chain designs perform in
terms of Return on Capital Employed (ROCE). When designing supply chains, firms face the
competing demands of increased physically-efficiency and improved market responsiveness.
As a result, an optimal supply chain design will serve as a lever in making or breaking firms.
Benchmarking supply chain designs enables firms to evaluate the potential of their supply
chain and become best-in-class. Despite many studies on supply chain improvement and
optimization, there is little research on integrated finance-supply chain management. We fill
this gap by using Data Envelopment Analysis (DEA) to benchmark supply chain designs in
terms of ROCE.

Chapter I: Introduction and Research Overview 4
Third, from an operational perspective, we explore the required level of sourcing
flexibility, i.e., the capability of a firm’s procurement processes to respond or react rapidly to
changing supply requirements, which is one of the building blocks of supply chain
responsiveness. In today’s decentralized supply chains, firms depend on their suppliers to
create a large share of the value of their products. For this reason, understanding the causes
and consequences of sourcing flexibility is critical. We show that supplier selection and
information systems at the buyer-supplier interface positively influence sourcing flexibility.
Sourcing flexibility, in turn, is curvilinearly (U-shaped) related to supply chain performance.
Firms with either low or high levels of sourcing flexibility exhibit high supply chain
performance, whereas medium levels of sourcing flexibility hinder that performance. In other
words, the “stuck in the middle” phenomenon, which is frequently observed in areas of
strategy and organization, is also evident in procurement decisions. Finally, sourcing
flexibility positively influences the business performance of a product (“product
performance”), such as its sales growth rate, market share, and profitability. The strong and
positive relationship between sourcing flexibility and supply chain and product performances
underscores that sourcing flexibility merits procurement managers’ attention in supplier
selection and procurement decisions. However, a mismatch between sourcing flexibility and
product and supply chain characteristics can be detrimental to performance. A clear
understanding of these factors is therefore crucial.
In summary, an effective supply chain management supports a business in both good
times and bad. Increasing implied uncertainty from customers and supply sources is best
served by increasing responsiveness from the supply chain. Hereby, firms should align their
competitive strategy (and resulting implied uncertainty) and supply chain strategy (and

Chapter I: Introduction and Research Overview 5
resulting responsiveness) as closely as possible (Chopra and Meindl, 2009). Lee and
Billington (1993) identify three sources of uncertainty: demand (volume and mix), process
(yield, machine downtimes, transportation reliabilities), and supply (part quality, delivery
reliability). Clearly, cost, time and uncertainty are important in different degrees to all supply
chains. However, if one aspect dominates, this helps to simplify the complex challenge of
developing appropriate strategies for supply chain design. This dissertation focuses on the
design of supply chains in which demand uncertainty is key challenge.
It is important to understand that the desired level of responsiveness required across the
supply chain may be attained by assigning different levels of responsiveness and efficiency to
each stage of the supply chain. High-performing supply chains have four distinguishing
characteristics (Chopra and Meindl. 2009; Stock et al., 2000; Lee and Billington, 1993):
They support, enhance, and are an integral part of a firm’s competitive business
strategy.
They leverage a distinctive supply chain operating model/strategy to sustain
competitiveness.
They execute well against a balanced set of operational performance objectives and
metrics to attain the optimal responsiveness.
They focus on logistics (facilities, inventory, and transportation) and cross-functional
(information, sourcing, and pricing) drivers that reinforce one another to support the
operating model and best achieve operational objectives.
This dissertation takes these issues into consideration and addresses the constituents and
performance outcomes of effective supply chain management. The purpose of this
dissertation is to further the impact of the phenomenon of supply chain fit.
Chapter I: Introduction and Research Overview 6
The remainder of this dissertation is structured as follows. The subsequent sections of this
chapter offer an overview of the understanding of supply chain management, its current
challenges and fit constituents. Then, the three core research questions of this dissertation are
outlined. The research design and methodology used to investigate the delineated research
questions are then presented. Chapter II focuses on the impact of a fit in the supply chain on a
firm’s financial success (research question I). Chapter III sheds light on supply chain design
efficiency (research question II). Chapter IV investigates the relationship among sourcing
flexibility, supply chain performance and product performance (research question III).
Finally, Chapter V brings together the results of the previous chapters, summarizes the
research results, and puts special emphasis on key academic and practically relevant findings.
2. Supply chain management, challenges and fit constituents
The past decades have seen an increasing recognition of the importance of supply chain
management. Nevertheless, there is still no commonly agreed-upon terminology. As a
consistent use of terms is essential, this section presents a short overview of supply chain
management and its constituents as well as defines the terms which constitute the basis of this
dissertation. Figure 1 illustrates the nomenclature and how these terms are connected.
Chapter I: Introduction and Research Overview 7
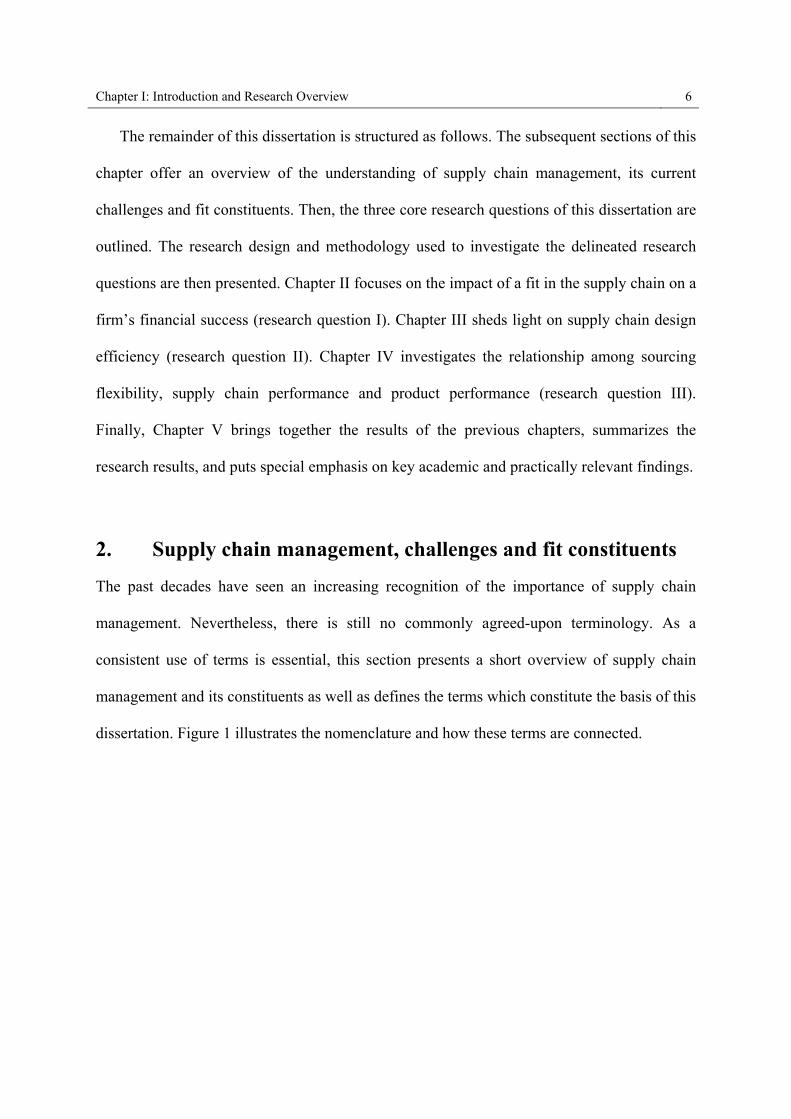
Figure 1: Supply chain decision-making framework
Strategic FitCompetitive Strategy
Supply Chain Strategy
Efficiency Responsiveness
Information Sourcing PricingCross Functional
Drivers
Logistical DriversFacilities TransportationInventory
Supply Chain Design
Supply Chain Fit
Note. Framework adapted from Chopra and Meindl (2009).
Supply chain strategy attempts to achieve an optimal balance between efficiency and
responsiveness that fits the competitive strategy of the manufacturing firm and meets
customer needs. To reach that goal, the right combination of logistical and cross-functional
drivers is required. For each driver, supply chain executives have to make a trade-off between
efficiency and responsiveness based on interaction with the other drivers of the supply chain.
The combined impact of these drivers, i.e., the supply chain design, determines the
responsiveness and the profits of the entire supply chain. The responsiveness trade-offs must
be solved depending on the characteristics of the underlying product, so that the right supply
chain is designed for the product (Fisher, 1997). If firms strike the right balance between
efficiency and responsiveness that match the demand aspects of the product, supply chain fit
is achieved. Furthermore, is the supply chain strategy aligned to the competitive strategy, a
Chapter I: Introduction and Research Overview 8
firm executes strategic fit. In the following, these terms will be derived from the pertinent
literature, discussed, and defined.
2.1. Supply chain management
Supply chain management, with its emphasis on linkages among value-adding activities in
the chain, is perhaps the most significant development in business management since the
early 1980s when U.S. firms began adopting the just-in-time concept. The understanding of
supply chain management has developed over time and evolved differently across countries.
The idea of supply chain management is anchored in the USA with the transfer of logistic
principles from military to business operations. Secretary of War Elihu Root observed that for
Americans the difficulties of making war lay not in the raising of soldiers, but in equipping,
supplying, and transporting them. The evolution of modern warfare since 1898 amply
demonstrates the truth of Root’s observation. The scale and scope of modern wars, rapidly
changing technology, and new military doctrines involving the rapid movement of large
forces over great distances have made logistics the key to modern warfare. The development
of modern technology and the necessity of worldwide operations after 1898 thrust logisticians
into a new era of specialization, which lasted roughly until the end of World War II. The
relatively simple logistical tasks and organizations that had met the needs of earlier times
became much more complex, requiring more and better trained personnel, larger and more
diverse logistical organizations, and greater management and control. The era of
specialization overlapped with the last phase, the era of integration, which began before
World War II and continues today. In this phase, the quantity of equipment is not the key
success factor; getting the right equipment in the right quantity to the right place at the right
time is indeed. But in order to manage these processes efficiently, it is necessary to take a
Chapter I: Introduction and Research Overview 9
holistic perspective along the supply chain, by integrating both internal functions (e.g.,
procurement, production, and marketing) and external actors (e.g., suppliers and customers)
through collaboration and relationship management (Weber, 2002).
Weber (2002) notes that the development of logistics towards supply chain management
is based on a four-phase approach whereby the logistics know-how and the path-dependency
increase from phase to phase. Hereby the first two phases are mainly determined by
efficiency optimizations of logistics processes in terms of specialization and coordination of
material flows; in the next two upcoming phases, logistics breaks out of its operational
borders and focuses additionally (Weber, 1999) on holistic leadership functions by managing
the whole supply chain flows – our modern understanding of supply chain management
(Weber, 2002; Weber and Kummer, 1998).
Numerous definitions of a supply chain exist, and while they may differ in terminology,
they are reasonably consistent in meaning. Following Mentzer (2001), supply chain
management is defined as “the systemic, strategic coordination of the traditional business
functions within a particular firm and across businesses within the supply chain, for the
purposes of improving the long-term performance of the individual firms and the supply
chain as a whole” (Mentzer, 2001, p. 18). The supply chain consists of all parties involved,
directly or indirectly, in fulfilling a customer (consumer) request through the manufacturer’s
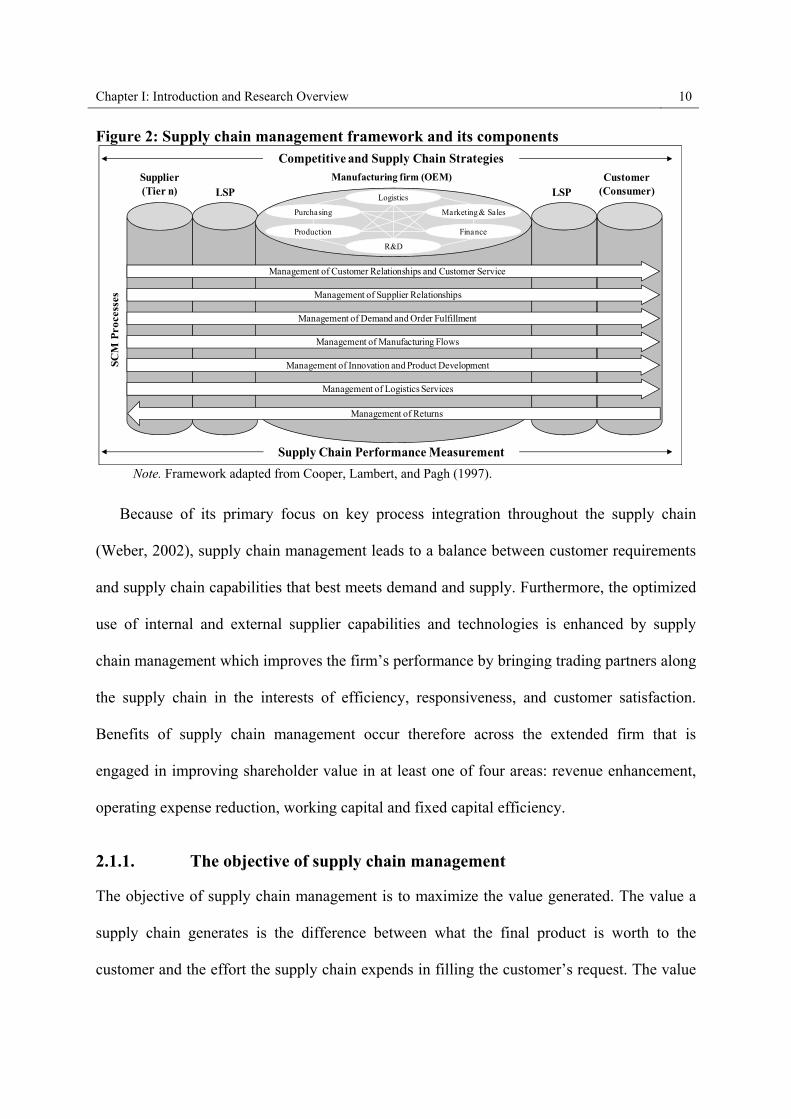
(OEM’s) goods and services that are created in the SCM processes (Figure 2). It is important
to note that supply chains are dynamic and require the constant flow of information, product,
and funds.
Chapter I: Introduction and Research Overview 10
Figure 2: Supply chain management framework and its components
Logistics
Marketing & Sales
Finance
R&D
Production
Purchasing
Manufacturing firm (OEM)
LSPCustomer
(Consumer)LSPSupplier(Tier n)
SCM
Pro
cess
es
Management of Customer Relationships and Customer Service
Management of Demand and Order Fulfillment
Management of Manufacturing Flows
Management of Logistics Services
Management of Supplier Relationships
Management of Innovation and Product Development
Competitive and Supply Chain Strategies
Supply Chain Performance Measurement
Management of Returns
Note. Framework adapted from Cooper, Lambert, and Pagh (1997).
Because of its primary focus on key process integration throughout the supply chain
(Weber, 2002), supply chain management leads to a balance between customer requirements
and supply chain capabilities that best meets demand and supply. Furthermore, the optimized
use of internal and external supplier capabilities and technologies is enhanced by supply
chain management which improves the firm’s performance by bringing trading partners along
the supply chain in the interests of efficiency, responsiveness, and customer satisfaction.
Benefits of supply chain management occur therefore across the extended firm that is
engaged in improving shareholder value in at least one of four areas: revenue enhancement,
operating expense reduction, working capital and fixed capital efficiency.
2.1.1. The objective of supply chain management
The objective of supply chain management is to maximize the value generated. The value a
supply chain generates is the difference between what the final product is worth to the
customer and the effort the supply chain expends in filling the customer’s request. The value
Chapter I: Introduction and Research Overview 11
for most commercial supply chains will be strongly correlated with supply chain profitability,
the difference between revenue generated from the customer and the overall costs across the
supply chain. Supply chain profitability is the total profit to be shared across all supply chain
stages. It is clear, but noteworthy that for any supply chain, there is only one source of
revenue: the customer. All flows of information, product, or funds generate costs within the
supply chain. Therefore the appropriate management of these flows is a key to supply chain
success, reducing system-wide costs while maintaining required service levels (e.g., Mentzer
et al., 2001; Simchi-Levi et al., 2000; Lee and Billington, 1993).
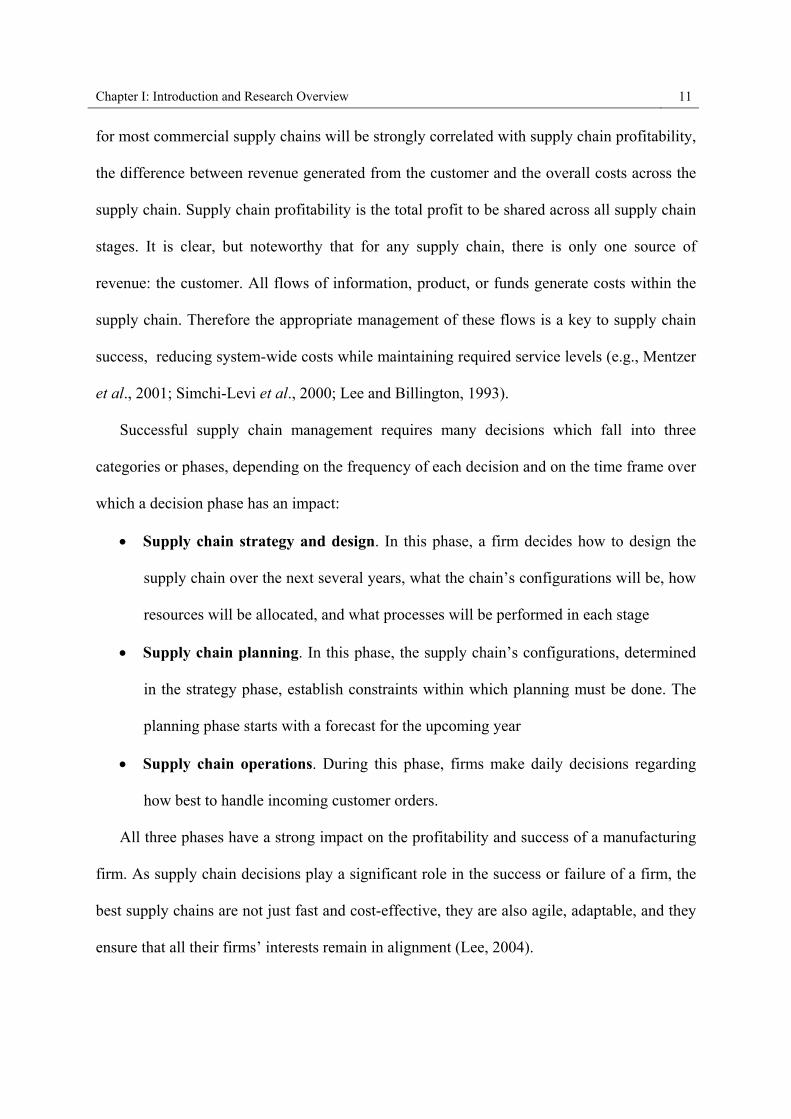
Successful supply chain management requires many decisions which fall into three
categories or phases, depending on the frequency of each decision and on the time frame over
which a decision phase has an impact:
Supply chain strategy and design. In this phase, a firm decides how to design the
supply chain over the next several years, what the chain’s configurations will be, how
resources will be allocated, and what processes will be performed in each stage
Supply chain planning. In this phase, the supply chain’s configurations, determined
in the strategy phase, establish constraints within which planning must be done. The
planning phase starts with a forecast for the upcoming year
Supply chain operations. During this phase, firms make daily decisions regarding
how best to handle incoming customer orders.
All three phases have a strong impact on the profitability and success of a manufacturing
firm. As supply chain decisions play a significant role in the success or failure of a firm, the
best supply chains are not just fast and cost-effective, they are also agile, adaptable, and they
ensure that all their firms’ interests remain in alignment (Lee, 2004).

Chapter I: Introduction and Research Overview 12
2.1.2. Supply chain drivers
In reaching the balance between efficiency and responsiveness that best meets the needs of
the firm’s competitive strategy, logistical and cross-functional drivers of supply chain
management (facilities, inventory, transportation, information, sourcing, and pricing) must be
aligned and adapted, as they interact with each other (see Figure 1). As a result, the structure
of these drivers, which constitutes the underlying supply chain design of a manufacturing
firm, determines if and how effective supply chain management is achieved across the supply
chain. It is important to emphasize that the logistical and cross-functional drivers interact
with each other determining the performance of the supply chain (Chopra and Meindl, 2009):
Facilities. Facilities are the actual physical locations, production and/or storage sites,
in the supply chain network where decisions regarding role, location, capacity, and
flexibility of facilities have a significant impact on the performance of the supply
chain.
Inventory. Inventory includes all raw materials, work in process, and finished goods
within a supply chain. Decisions about inventory levels can dramatically alter the
supply chain’s efficiency and responsiveness.
Transportation. Transportation entails moving inventory from point to point in the
supply chain. This can be done in many combinations of modes and routes, each with
its own performance characteristics and hence affecting the supply chain’s efficiency
and responsiveness.
Information. Information sharing and coordination is one of the biggest performance
drivers within the supply chain because it directly affects each of the other drivers.
Information consists of data and analysis regarding the logistic driver’s facilities,
Chapter I: Introduction and Research Overview 13
inventory, and transportation as well as of prices, costs, and customers throughout the
supply chain.
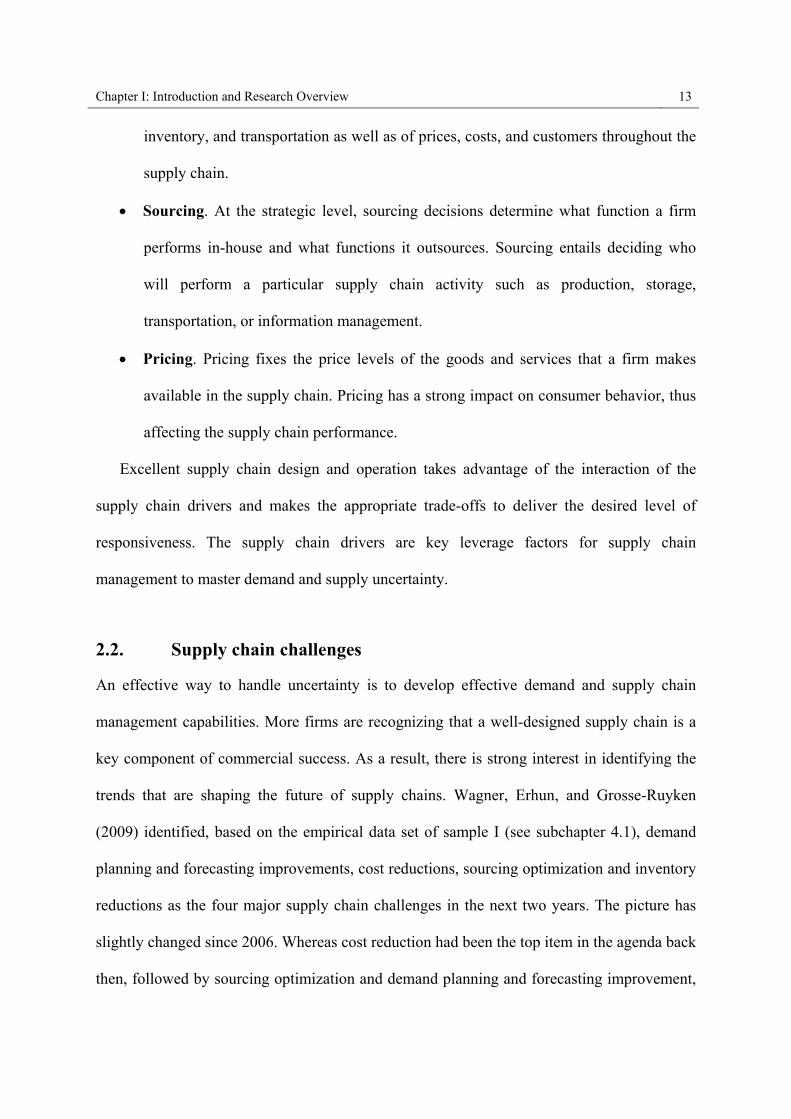
Sourcing. At the strategic level, sourcing decisions determine what function a firm
performs in-house and what functions it outsources. Sourcing entails deciding who
will perform a particular supply chain activity such as production, storage,
transportation, or information management.
Pricing. Pricing fixes the price levels of the goods and services that a firm makes
available in the supply chain. Pricing has a strong impact on consumer behavior, thus
affecting the supply chain performance.
Excellent supply chain design and operation takes advantage of the interaction of the
supply chain drivers and makes the appropriate trade-offs to deliver the desired level of
responsiveness. The supply chain drivers are key leverage factors for supply chain
management to master demand and supply uncertainty.
2.2. Supply chain challenges
An effective way to handle uncertainty is to develop effective demand and supply chain
management capabilities. More firms are recognizing that a well-designed supply chain is a
key component of commercial success. As a result, there is strong interest in identifying the
trends that are shaping the future of supply chains. Wagner, Erhun, and Grosse-Ruyken
(2009) identified, based on the empirical data set of sample I (see subchapter 4.1), demand
planning and forecasting improvements, cost reductions, sourcing optimization and inventory
reductions as the four major supply chain challenges in the next two years. The picture has
slightly changed since 2006. Whereas cost reduction had been the top item in the agenda back
then, followed by sourcing optimization and demand planning and forecasting improvement,

Chapter I: Introduction and Research Overview 14
the latter one is now regarded as a top priority for manufacturing firms. Figure 3 gives an
overview of current challenges in supply chain management.
Figure 3: Pictorial of hierarchy of supply chain challenges
8%
7%
22%
24%
26%
27%
31%
33%
40%
42%
46%
48%
Others
Reverse Logistics Optimization
Know-how Enhancement of Employees
Consolidation of Facilities
Outbound Transportation Optimization
Inbound Transportation Optimization
Network Optimization
Customer Service Improvement
Inventory Reduction
Sourcing Optimization
Cost Reduction
Demand Planning & Forecasting Improvement
Note. Multiple nominations were possible. N = 259.
2.2.1. Core challenges
Supply chain executives identified four core supply chain challenges which are described in
the following.
Demand planning and forecasting improvement. Aligning demand and supply in
today’s complex and dynamic manufacturing environment remains challenging at best. As
sources and capacities for manufacturing have increased, many firms have moved away from
focusing solely on plant-level production planning. They adopt demand-driven approaches so
that they can cope with changing customer demand more efficiently. Still, many
manufacturing firms spend an inordinate amount of time and resources for better demand
prediction. Yet, in spite of the significant investment, static forecasts are often out of date
within hours of creation, questioning the real value of traditional planning tools as it relates to
near-term demand volatility. Not surprisingly, 48% of the 259 respondents identified demand
planning and forecasting improvement as the top priority in 2009 and 2010 for manufacturing
Chapter I: Introduction and Research Overview 15
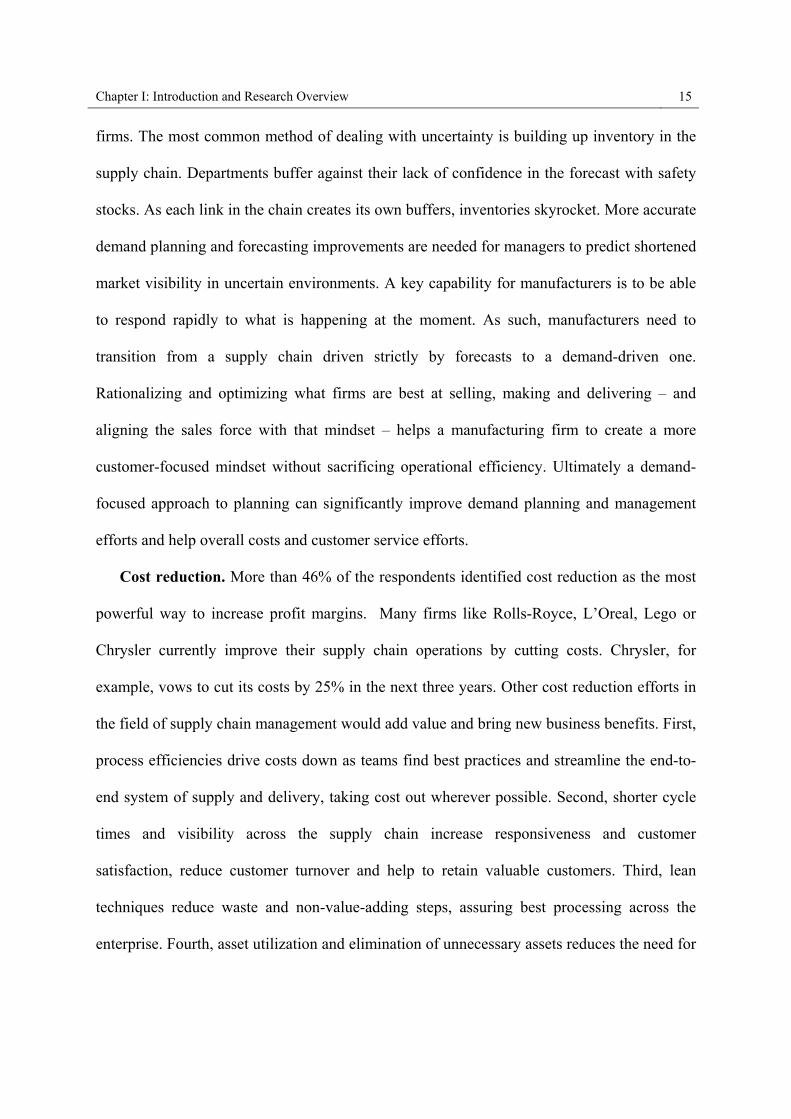
firms. The most common method of dealing with uncertainty is building up inventory in the
supply chain. Departments buffer against their lack of confidence in the forecast with safety
stocks. As each link in the chain creates its own buffers, inventories skyrocket. More accurate
demand planning and forecasting improvements are needed for managers to predict shortened
market visibility in uncertain environments. A key capability for manufacturers is to be able
to respond rapidly to what is happening at the moment. As such, manufacturers need to
transition from a supply chain driven strictly by forecasts to a demand-driven one.
Rationalizing and optimizing what firms are best at selling, making and delivering – and
aligning the sales force with that mindset – helps a manufacturing firm to create a more
customer-focused mindset without sacrificing operational efficiency. Ultimately a demand-
focused approach to planning can significantly improve demand planning and management
efforts and help overall costs and customer service efforts.
Cost reduction. More than 46% of the respondents identified cost reduction as the most
powerful way to increase profit margins. Many firms like Rolls-Royce, L’Oreal, Lego or
Chrysler currently improve their supply chain operations by cutting costs. Chrysler, for
example, vows to cut its costs by 25% in the next three years. Other cost reduction efforts in
the field of supply chain management would add value and bring new business benefits. First,
process efficiencies drive costs down as teams find best practices and streamline the end-to-
end system of supply and delivery, taking cost out wherever possible. Second, shorter cycle
times and visibility across the supply chain increase responsiveness and customer
satisfaction, reduce customer turnover and help to retain valuable customers. Third, lean
techniques reduce waste and non-value-adding steps, assuring best processing across the
enterprise. Fourth, asset utilization and elimination of unnecessary assets reduces the need for
Chapter I: Introduction and Research Overview 16
working capital. Finally, lower inventory levels that more closely meet the actual demand
will reduce working capital needs and minimize carrying costs.
Sourcing optimization. As many firms step back and examine their core competencies,
they realize that outsourcing non-core products and activities to suppliers creates synergies
that can reduce costs, shorten lead-time or improve service. Although significant economic
benefits can be realized from outsourcing all or parts of the supply chain processes, without
the right systems, processes and supplier management competencies, such efforts bear very
high risk (Wagner and Bode, 2008). In a heavily outsourced environment, manufacturing
firms need to put more systems in place to compensate for the fact that they can no longer
control the entire operations inside the firm boundaries. In an outsourced supply chain
environment, the need for excellent inter-firm and intra-firm information flows (e.g., between
the firm and its suppliers) becomes a high priority. Over 100,000 new product introductions
per year which the German sportswear giant Adidas delivers worldwide, is a good example of
how complex and challenging purchasing decisions are to handle such volumes through the
supply chains.
Inventory reduction. As demand and supply in the value chain do not match perfectly
per se, inventories are needed as buffers between supply chain stages. Inventory can be
essential for maintaining a steady flow of production and high capacity utilization. The
amount of time required to convert purchased materials and parts into finished products
depends on the magnitude of these inventories. But with the widespread use of just-in-time or
just-in-sequence deliveries and vendor-managed inventories as well as just-in-time or just-in-
sequence production, firms can operate with minimal levels of inventory. This made supply
chain and operations managers aware that inventories prevent the discovery of problems in
Chapter I: Introduction and Research Overview 17
the supply chain and on the shop floor and can be detrimental to productivity. As a
consequence, these managers commonly take inventory levels as indicators for process
capability and efficiency. Inventory reductions can significantly reduce costs, however they
also expose defects in the manufacturing process, forcing managers and workers to eliminate
(rather than accommodate) sources of process variability. Inventory reductions can also result
in productivity gains, and might serve as an indicator that process variability has been
reduced and that less buffer stock is required. A 10% reduction in inventory leads for
example with a lag of about one year to an average labor productivity gain of about 1%
(Lieberman and Demeester, 1999). In combination, inventory reduction will remain a
challenging task in the upcoming years, as 40% of the respondents approve.
2.2.2. Additional stresses
Challenges in supply chain management are manifold. Besides the four top challenges
described above, manufacturing firms pay close attention to a number of other issues.
Customer service improvement. Customer service efforts were approved by 33% of the
respondents. Logistics is concerned with the timely and accurate flow of finished goods from
the production line to the customers. Customer service levels directly depend on the
performance of the logistics system of the firm. Customer service may also represent the best
opportunity for a firm to increase its market penetration and profitability. Therefore, excellent
customer service helps to achieve a close interaction with customers to fulfill specific
requirements and in reverse to be able to penetrate higher margins and achieve higher
customer loyalty.
Network optimization. More than ever, value creation occurs in networks consisting of
suppliers, manufacturing sites and logistic service facilities. As a consequence, a precise

Chapter I: Introduction and Research Overview 18
management of the global supply chain network is a prerequisite for a timely market
introduction of new products, smooth product ramp-ups, high delivery capability and quick
response to customer demand. However, as firms grow over time and expand their supply
chain network, it might happen one day that the network is not optimal anymore. To avoid
bottlenecks, redundancies and other suboptimal structures that decrease the overall
performance, 31% of the respondents will further focus on network optimization.
Consolidation of facilities as well as inbound and outbound optimization. Closely
related to network optimization is the consolidation of facilities as well as the inbound and
the outbound transportation optimization. Typical business drivers for facility consolidation
are changes in volumes required by the customers in regional markets, product line
extensions, mergers, acquisitions or divestiture of product lines. In order to ameliorate
suboptimal network systems, consolidation of facilities helps. In that context, new network
nodes emerge, for example, through the implementation of lead production facilities or
regional distribution centers that optimize inbound and outbound transportation. Inbound
transportation optimization is designed to create optimal inbound material shipments and
loads to assembly and component facilities. Optimal plans must be created considering
potential supply chain constraints. Outbound transportation and logistics is at the other side of
the process of managing and optimizing the outbound shipment of vehicles from assembly
plants through consolidation hubs to distributors or customers.
Know-how enhancement of employees. The right employee training, development and
education provides significant payoffs for the employer. Hence the hiring, training and
retention of qualified employee is high on the agenda of many firms. In the coming years,
22% of the firms plan to enhance the “supply chain knowledge” of their employees. Better
Chapter I: Introduction and Research Overview 19
and well-trained employees – blue- and white-collar alike – are the basis for supply chain
innovations, increasing process efficiencies, the ability to adapt to new technologies, and last
but not least, higher job satisfaction, employee motivation and reduced employee turnover.
Qualified people who understand the business of running supply chains are scarce.
Reverse logistics optimization. In many countries, new laws require firms to implement
reverse logistics systems, for example, for electronic equipment. Since the reverse supply
chain consists of three separate entities – the assembly plant, the disassembly plant and the
recycling plant – operations have to be planned from a larger perspective that comprises those
three entities. From the supply of products to collection, dismantling and reuse, the inventory
of products and components must be properly maintained and inventory policies in reverse
supply chains must be altered in terms of the level and location of buffer stocks. Since
reverse logistics optimization is seen by a relatively small number of the respondents as a key
supply chain driver, firms still seem to react to fulfill the required reverse logistics activities,
but to a lesser degree see reverse logistics as a means for differentiation or cost reduction.
Others. Finally, value creation through “other” improvement initiatives, such as
consolidation of outbound distribution networks or ERP system implementations, were also
considered as a challenge supply chain and operations managers will tackle in the next two
years.
Developing, selling, manufacturing and delivering customized products can be a
challenge for the best organizations. Customers will only be satisfied and buy again if service
and price are aligned with their expectations. Supply chain management plays a crucial role
in meeting these expectations. An inefficient and poorly functioning supply chain can
negatively impact every aspect of an organization, jeopardizing the long-term performance
Chapter I: Introduction and Research Overview 20
and success of a business. Manufacturing firms that re-evaluate how the current supply chain
strategies and structures – including infrastructure, technologies, processes and organizational
structures – support their business must continuously adapt to changing customer preferences
and competitive environments. In the end, business strategy and supply chain strategy must
match and support each other to achieve a high supply chain performance.
2.3. Strategic fit
For any firm to be successful, its supply chain strategy must be aligned with its competitive
strategy. Strategic fit refers to consistency between the customer priorities which the
competitive strategy hopes to satisfy and the supply chain capabilities which the supply chain
strategy aims to build. Few tasks are more difficult for the top management of a firm than
achieving supply chain fit, i.e., the job of aligning the supply chain design to the specific
demand aspects of the underlying product which implies achieving supply chain fit and to
make sure that all core functionalities are in line with the overall competitive strategy
(“strategic fit”). If an alignment between supply chain strategy and its supply chain design is
not achieved, supply chain misfit occurs. It results in different functions within the firm and
stages across the supply chain targeting different customer priorities. The question is how the
supply chain drivers should be designed to achieve supply chain fit. In other words, what
does a firm need to do to achieve that all-important supply chain fit?
A competitive strategy will implicitly or explicitly specify one or more customer
segments that a firm hopes to satisfy with its product. To achieve supply chain fit, a firm
must ensure that its supply chain capabilities (supply chain design) support its ability to
satisfy with its product(s) the targeted customer segments. To achieve a fit, the following
three steps are crucial.

Chapter I: Introduction and Research Overview 21
2.3.1. Demand and supply uncertainty spectrum
Firms must understand the customer needs for each targeted segment and the uncertainty that
the supply chain faces in satisfying these needs. A powerful but simple way to characterize a
product, when seeking to devise the right supply chain strategy, is to look into its underlying
uncertainty spectrum. It specifies the two key uncertainties: demand and supply. Demand
uncertainty is linked to the predictability of the demand for the product. Fisher (1997)
categorizes products as functional (standardized), with predictable demand, or innovative
(individualized, customized, or fashionable), with unpredictable demand. Product
characteristics vary in terms of demand predictability, life-cycle length, product variety,
service, lead-times and specific market requirements. Fashion apparel, high-end laptops, the
latest integrated circuits, and mass customized goods are examples of innovative products;
consumable household items, food, oil and gas, and everyday clothing are examples of
functional products. Functional products have less variety than innovative products, where
variety is implicit in the fashion-oriented nature of the product or the rapid introduction of
new product launches due to advancements in technology. Demand for functional products is
much easier to forecast than the demand for innovative products. Due to the differences in
product life-cycle and the nature of the product, functional products tend to have lower
product profit margins, but the cost of obsolescence is low; innovative products tend to have
higher product profit margins, but the cost of obsolescence is high. The demand aspects of a
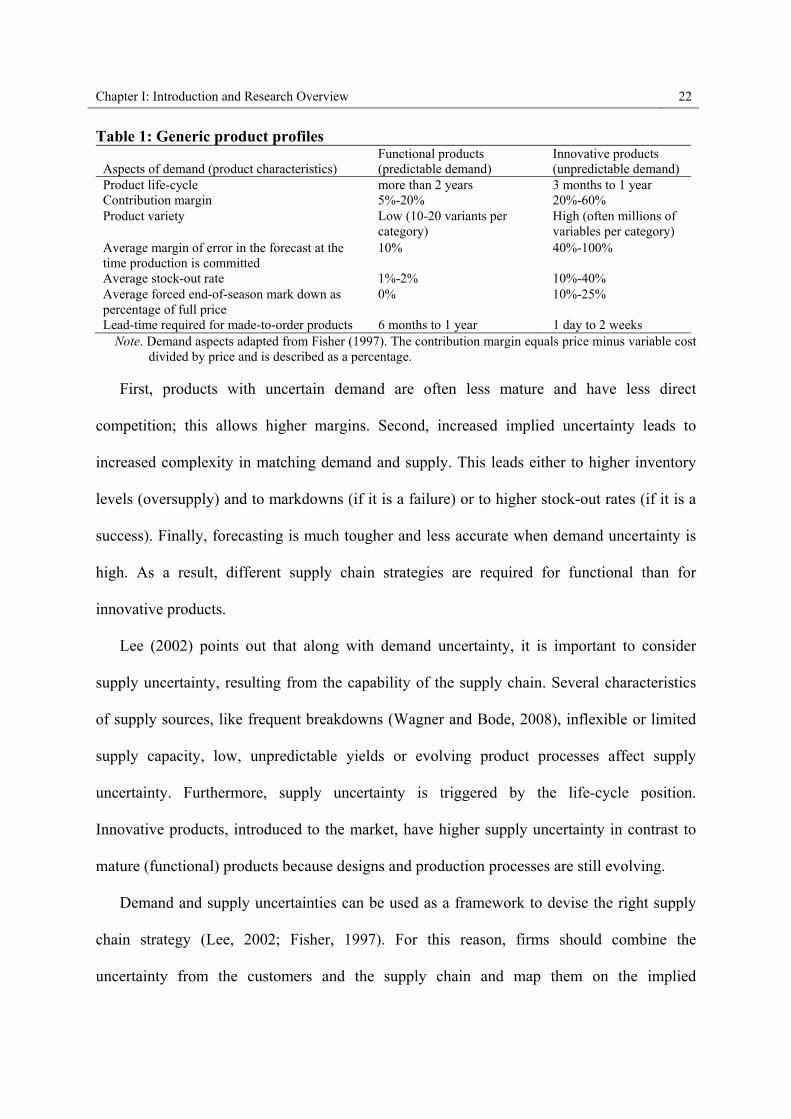
product listed by Fisher (1997) as shown in Table 1 point out that implied demand
uncertainty is often correlated with other aspects of demand.
Chapter I: Introduction and Research Overview 22
Table 1: Generic product profiles
Aspects of demand (product characteristics) Functional products (predictable demand)
Innovative products (unpredictable demand)
Product life-cycle more than 2 years 3 months to 1 year Contribution margin 5%-20% 20%-60% Product variety Low (10-20 variants per
category) High (often millions of variables per category)
Average margin of error in the forecast at the time production is committed
10% 40%-100%
Average stock-out rate 1%-2% 10%-40% Average forced end-of-season mark down as percentage of full price
0% 10%-25%
Lead-time required for made-to-order products 6 months to 1 year 1 day to 2 weeks Note. Demand aspects adapted from Fisher (1997). The contribution margin equals price minus variable cost
divided by price and is described as a percentage. First, products with uncertain demand are often less mature and have less direct
competition; this allows higher margins. Second, increased implied uncertainty leads to
increased complexity in matching demand and supply. This leads either to higher inventory
levels (oversupply) and to markdowns (if it is a failure) or to higher stock-out rates (if it is a
success). Finally, forecasting is much tougher and less accurate when demand uncertainty is
high. As a result, different supply chain strategies are required for functional than for
innovative products.
Lee (2002) points out that along with demand uncertainty, it is important to consider
supply uncertainty, resulting from the capability of the supply chain. Several characteristics
of supply sources, like frequent breakdowns (Wagner and Bode, 2008), inflexible or limited
supply capacity, low, unpredictable yields or evolving product processes affect supply
uncertainty. Furthermore, supply uncertainty is triggered by the life-cycle position.
Innovative products, introduced to the market, have higher supply uncertainty in contrast to
mature (functional) products because designs and production processes are still evolving.
Demand and supply uncertainties can be used as a framework to devise the right supply
chain strategy (Lee, 2002; Fisher, 1997). For this reason, firms should combine the
uncertainty from the customers and the supply chain and map them on the implied
Chapter I: Introduction and Research Overview 23
uncertainty spectrum of the underlying product. This helps the firm to identify the extent of
the unpredictability of demand, disruption, and delay that for which the supply chain must be
prepared. Based on that result, the firm can design its supply chain drivers accordingly to
provide the optimal supply chain capabilities to best meet demand in that uncertain
environment.
2.3.2. Supply chain capabilities
Supply chains have many characteristics that affect their physically-efficiency and market
responsiveness. The supply chain drivers, which build supply chain capability, are the design
tools for the supply chain structure to deliver the product through the chain in an optimal
manner. The responsiveness spectrum of a supply chain includes the ability of a supply chain
to fill a wide range of quantities, to meet requested, often very tight lead-times and/or high
service levels, handle large varieties of products to create innovative products. As
responsiveness is unfortunately not free (e.g., a wider range of varieties and/or quantities
demanded increases capacity and complexity increases costs), firms have to focus on supply
chain efficiency. For every strategic choice to increase responsiveness, additional costs which
lower efficiency are incurred. As a consequence, with respect to the product which is
supplied through the chain, an effective supply chain has to be designed. Depending on the
underlying product or main product line of a manufacturing firm which is transformed
through the value chain, either a physically-efficient supply chain or a market responsive
supply chain is required with respect to its resource and inventory strategy as well as overall
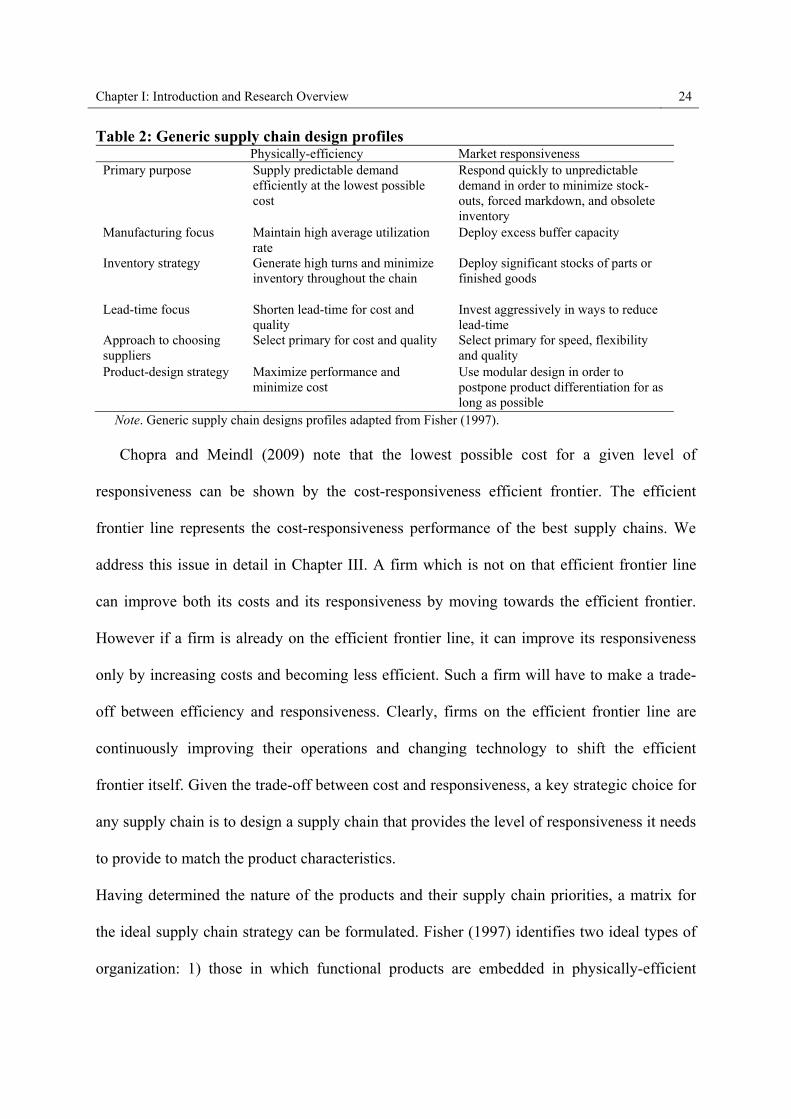
objectives. Both generic supply chain designs listed by Fisher (1997) are shown in Table 2.
Chapter I: Introduction and Research Overview 24
Table 2: Generic supply chain design profiles Physically-efficiency Market responsiveness Primary purpose Supply predictable demand
efficiently at the lowest possible cost
Respond quickly to unpredictable demand in order to minimize stock-outs, forced markdown, and obsolete inventory
Manufacturing focus Maintain high average utilization rate
Deploy excess buffer capacity
Inventory strategy Generate high turns and minimize inventory throughout the chain
Deploy significant stocks of parts or finished goods
Lead-time focus Shorten lead-time for cost and quality
Invest aggressively in ways to reduce lead-time
Approach to choosing suppliers
Select primary for cost and quality Select primary for speed, flexibility and quality
Product-design strategy Maximize performance and minimize cost
Use modular design in order to postpone product differentiation for as long as possible
Note. Generic supply chain designs profiles adapted from Fisher (1997).
Chopra and Meindl (2009) note that the lowest possible cost for a given level of
responsiveness can be shown by the cost-responsiveness efficient frontier. The efficient
frontier line represents the cost-responsiveness performance of the best supply chains. We
address this issue in detail in Chapter III. A firm which is not on that efficient frontier line
can improve both its costs and its responsiveness by moving towards the efficient frontier.
However if a firm is already on the efficient frontier line, it can improve its responsiveness
only by increasing costs and becoming less efficient. Such a firm will have to make a trade-
off between efficiency and responsiveness. Clearly, firms on the efficient frontier line are
continuously improving their operations and changing technology to shift the efficient
frontier itself. Given the trade-off between cost and responsiveness, a key strategic choice for
any supply chain is to design a supply chain that provides the level of responsiveness it needs
to provide to match the product characteristics.
Having determined the nature of the products and their supply chain priorities, a matrix for
the ideal supply chain strategy can be formulated. Fisher (1997) identifies two ideal types of
organization: 1) those in which functional products are embedded in physically-efficient

Chapter I: Introduction and Research Overview 25
supply chains with a strong focus on cost minimization, high inventory turnovers and high
average utilization rates; and 2) organizations where innovative (customized) products (which
sell often for a single season) are supplied through market responsive supply chains with
extra buffer inventory capacity, high flexibility requirements and a capability for market
processing information. The two other types are “mismatch” or “misfit.” The four types are
depicted in Figure 4.
Figure 4: Fit and misfit matrix
Su
pp
ly c
hai
n d
esig
n p
rofi
les
Product profiles
Functionalproduct
Innovativeproduct
Efficientdesign
Responsivedesign
Fit Misfit
Misfit Fit
Note. Framework adapted from Fisher (1997).
2.3.3. Zone of strategic fit
As customer preferences and product demand aspects are always in flux, creating a supply
chain fit can only be temporary. Managers must be aware that supply chain fit is a dynamic
concept, not a static optimization project. In many firms, different departments devise
competitive and functional strategies. Without proper communication, i.e. information
sharing and coordination, between the departments and coordination by C-level executives,
these strategies are not likely to achieve supply chain fit. For many firms, the failure to

Chapter I: Introduction and Research Overview 26
achieve supply chain fit is a key reason for their inability to succeed as they lack strategic fit
(Chopra and Meindl, 2009).
To achieve strategic fit, firms must take three steps. First, they need to understand the
demand and supply uncertainty of their underlying product(s); second, they need to build a
supply chain with the right capabilities, and third they need to ensure that the degree of
supply chain responsiveness is consistent with the implied uncertainty and aligned with the
overall competitive strategy. The goal is to “target high responsiveness for a supply chain
facing high implied uncertainty, and efficiency for a supply chain facing low implied
uncertainty” (Chopra and Meindl, 2009, p. 32). This relationship is represented by the zone of
strategic fit illustrated in Figure 5.

Chapter I: Introduction and Research Overview 27
Figure 5: Zone of strategic fit
Responsiveness spectrum
Implied uncertainty spectrum
Responsivesupply chain
Efficientsupply chain
Functional products(predictable demand)
Innovative products(unpredictable demand)
Note. Framework adopted from Chopra and Meindl (2009).
Strategic fit is achieved if the ideal consistency among the multiple dimensions of the
demand aspects of a firm’s product and its embedded supply chain design, i.e., supply chain
fit, is reached, and aligned with the overall competitive strategy. Our definition of supply
chain fit extends the generic framework of Fisher (1997) in two dimensions. First, there is not
always an either-or-strategy, but rather a mixed strategy which reflects the major stake of
supply chains (Selldin and Olhager, 2007). Second, most products are neither clearly
functional (standardized) nor innovative (customized), for example, automotive or apparel
products, mastering cost effectiveness on one hand and on the other hand dealing with high
product variety. As a result, there are multiple ideal supply chain fit constellations along the
efficient frontier line, depending on the business model and the competitive strategy.
Chapter I: Introduction and Research Overview 28
2.3.4. Obstacles
A firm’s ability to find the balance between physically-efficiency and market responsiveness
that best matches the customer needs is key to achieve supply chain fit. In deciding where
this balance should be located on the responsiveness spectrum, firms face tremendous supply
chain challenges (Wagner et al., 2010a; Wagner et al., 2009) and numerous obstacles
(Chopra and Meindl, 2009):
Strategy execution. Creating a successful supply chain strategy is not easy; executing
it difficulties even less so. Toyota’s production system, which is a supply chain
strategy, has been known and understood, but it has been a competitive advantage for
more than two decades (Lee et al., 2005). Its brilliant strategy has been figured out by
its competitors; however those firms had difficulty in replicating this strategy. Many
high-potentials at all levels of the organization are needed to build and carry out a
successful supply chain strategy.
Global supply chain management. The benefits of global supply chains are evident,
such as the ability to source suppliers worldwide and to obtain better or less expensive
goods. The drawbacks, however, are longer distances as facilities within the supply
chain are father apart, making coordination much harder and increased competition,
as once-protected firms have to compete worldwide, thus forcing firms to put more
strain on supply chains and thus more precisely balancing out their trade-offs.
Customer demand. Customers today demand faster fulfillment, better quality and
sophisticated design, and better performing products for the same price than they did
years ago. The remarkable growth in customer demands urges supply chains to
provide more and to perform better to maintain their business.
Chapter I: Introduction and Research Overview 29
Product life-cycles. Shorter product life-cycles makes the job of achieving supply
chain fit much harder as the supply chain must constantly adapt to produce and
deliver new customized products while coping with these products’ demand
uncertainty. Shorter life-cycles and increased uncertainty, combined with a smaller
window of opportunity within the supply chain to achieve supply chain fit has put
additional pressure on supply chains to coordinate and match supply to demand.
Variety of products. The increase in product variety complicates the accuracy of
demand and forecast planning, which often tends to raise uncertainty; uncertainty
frequently results in increased costs and decreased responsiveness within the supply
chain.
Supply chain ownership. Most firms are less vertically integrated than they were
decades ago, taking advantage of supplier and customer competencies. However, this
has made managing the supply chain more difficult as different interests and policies
of supply chain partners increase the complexity of coordination, thus reducing the
profitability of the overall supply chain and the chance to achieve strategic fit..
Those obstacles described above make it clear that achieving strategic fit is a major
challenge. Supply chain management plays hereby a major factor in the success or failure of
firms (e.g., Wagner et al., 2010a; Wagner et al., 2009; Chopra and Meindl, 2009; Mentzer,
2001; Lee, 2002; Simchi-Levi et al., 2000).
3. Research questions
This dissertation consists of three chapters (Chapter II, Chapter III, and Chapter IV) each of
which answers a particular research question. Top management must commit to

Chapter I: Introduction and Research Overview 30
understanding the effects of supply chain management on financial performance. The three
conceptual frameworks developed and tested in each of these chapters take unique
perspectives on the theme of this dissertation: the phenomenon of supply chain fit, its
constituents and performance outcomes and their relevance to the research on supply chain
management. Figure 6 illustrates the three core research questions under investigation and
their relationship with each other.
Figure 6: Overview of research questions
Strategic FitCompetitive Strategy
Supply Chain Strategy
Efficiency Responsiveness
Information Sourcing PricingCross Functional
Drivers
Logistical DriversFacilities TransportationInventory
Supply Chain Design
Supply Chain Fit
Question II
Question III
Question I
Note. The supply chain strategy must be aligned to the competitive strategy to achieve strategic fit. Supply
chain fit is defined as the ideal strategic consistency among the multiple dimensions of the demand aspects of a firm’s product and its embedded supply chain design and is a prerequisite for obtaining strategic fit.
3.1. Research question I
Supply chain fit, i.e., strategic consistencies between demand aspects of the underlying
product and the underlying supply chain design, is a major leverage factor in a firm’s success
and is receiving increased attention from both academia and business. However, managing
dynamic supply chains either with functional products or with innovative products is difficult
Chapter I: Introduction and Research Overview 31
(Slone et al., 2007), i.e., increased implied demand uncertainty is often not served by
sufficient supply chain responsiveness (Chopra and Meindl, 2009; Thonemann et al., 2007).
For instance, a lack of supply chain fit among carmakers and parts suppliers in the U.S.
automotive industry costs more than USD 10 billion each year. If the entire industry reached
a supply chain fit, it could save USD 8 billion (Hensley and Knupf, 2005). Indicators of a
lack of supply chain fit are manifold, and include degraded customer service, excessive
inventory, escalating costs, and declining profitability. For instance, despite heavy
investments in supply chain technology, Cisco Systems had to write off over USD 2 billion in
excess inventory in 2001 (Bailen, 2001) due to a clear lack of supply chain fit, estimated
costs of markdowns in US department stores are oftentimes up to 40%, and stock-outs
account for 30% of retail sales (Hausman and Thorbeck, 2007). In other words, getting the
right (new) product to the right (new) place at the right time at the right price, the traditional
touchstones of supply chain success, remains a challenging, cost-intensive, and frequently
multi-faceted goal (Fisher et al., 2000).
Operational measures such as speed, cost, quality, innovativeness and flexibility are often
the dependent variables of choice in supply chain studies (e.g., McKone et al., 2001).
“Scholars often argue that supply chain management has “bottom line” impact via such
metrics, but the case for such relationships is based largely on assertion rather than
demonstration. Thus, there is a great need for research establishing how and to what extent
supply chain activities directly and indirectly shape firm profits and stock price.” (Ketchen
and Giunipero, 2004, p. 54).
Although it is intuitive that a supply chain fit is likely to have a positive impact on
profitability, there is little systematic analysis and documentation of the magnitude of this

Chapter I: Introduction and Research Overview 32
impact in the literature. Most of the evidence that we have seen in literature is either
anecdotal or based on case studies. Only some initial research has emerged, among others
Vickery, Jayaram, Droge, and Calantone (2003) who investigate the link between supply
chain integration and financial performance due to an improved customer service, Droge,
Jayaram, and Vickery (2004) who indicate that an overall firm performance can be increased
by integrating practices leading to a better time-based performance, or Dehning, Richardson,
and Zmud (2007) who argue that excellent IT-based supply chain management systems
increase process efficiency and hence the financial performance effects. In response to this
call, we investigate in Chapter II the link between supply chain fit and firm’s financial
success. This leads to research question I:
Question I: Does supply chain fit have a significant impact on a firm’s financial
success and if so, which supply chain fit constituents are of relevance?
3.2. Research question II
Designing supply chain is one of the most strategic and challenging tasks of supply chain
management (Delfmann and Klaas-Wissing, 2007). Excellent supply chain designs, among
others at Zara, Procter & Gamble, Wal-Mart or Toyota, serve as competitive weapons.
However, many firms still struggle with the design of efficient supply chains. For instance,
supply chain design problems have contributed to a two-year delay at Boeing, the largest U.S.
manufacturer of commercial jetliners and military aircraft. However, it is still not clear
whether the breakdown of the “Dreamliner design” and its manufacturing was a matter of
communication, execution or something else (Smock, 2009). Many other recent publications
have highlighted the importance of supply chain design. For example, Danone was able to
boost its sales growth by 8% to 12% by improving its quality, service, availability and
Chapter I: Introduction and Research Overview 33
freshness (“market responsiveness”) (Loderhose, 2008). Chrysler aims to improve its supply
chain operations to cut supply chain costs (“physically-efficiency”) by 25% in the next three
years (Gupta and Orlofsky, 2008). Typically, firms producing and selling standardized
(functional) products operate in mature industry segments in which pressure on profit
margins is strong and competitive intensity is high. In contrast, customized (innovative)
products are made in an environment of lower competitive intensity, on the basis of
innovation and product variety (Lee, 2002; Christopher and Towill, 2000; Fisher, 1997). As
supply chain inefficiencies harm the competitiveness of firms through effects on both cost
(physical-efficiency) and time (market responsiveness), the design of the supply chain is of
utmost importance. Although many studies have captured the importance of supply chain
decisions about design and capabilities (Lee, 2004; Lee, 2002; Christopher and Towill, 2000;
Fisher, 1997), far less attention has been given to its impact on profitability (Hausman and
Thorbeck, 2007; Thonemann et al., 2007; Hendricks and Singhal, 2005).
So far, supply chain design efficiency has not been benchmarked either in the literature or
in practice. As a result, it is unknown how firms succeed in striking the right balance between
physically-efficiency and market responsiveness of their supply chains in terms of
profitability. Chapter III fills this gap by using Data Envelopment Analysis (DEA) to
integrate supply chain design into an overall benchmark of financial profitability in terms of
ROCE. This leads to research question II:
Question II: How do supply chain designs perform in terms of Return on Capital
Employed, and which supply chain design types are of relevance?

Chapter I: Introduction and Research Overview 34
3.3. Research question III
As explained in the previous section, logistics and cross-functional drivers should be
designed so that a requested flexibility within the supply chain can meet customer demands.
Flexibility is often seen as a firm’s ability to match production to stochastic market demand
and uncertainty. It is also closely linked to the firm’s ability to provide customized (niche or
innovative) products to the consumer. There is no formal definition of the specific
dimensions which are needed to measure flexibility (D’Souza and Williams, 2000; Koste and
Malhotra, 1999; Upton, 1994; Gupta and Somers, 1992; Sethi and Sethi, 1990; Slack, 1987;
1983). Flexibility can be exhibited in different ways. A firm that has a higher output than
another firm, given limited time and resources, exhibits a higher (manufacturing) flexibility.
A firm that delivers its products more quickly to its downstream partners, for example by
aircraft, might exhibit higher (logistics) flexibility. A firm which can rely on a supplier
portfolio allowing changing delivery frequencies, order sizes or frequent changes of volume
allocation among them might exhibit a higher (sourcing) flexibility. In other words, flexibility
consists of a supply chain’s agility, adaptability, and responsiveness to the needs of its users
(Youndt et al., 1996). Slack (1983) defines flexibility as ‘‘the range of states a system can
adopt, the cost of moving from one state to another, and the time which is necessary to move
from one state to another’’ and extends it later (1987) to ”the ease (in terms of cost, time, or
both) with which changes can be made within the capability envelope”. Products which are
delivered more quickly will be more expensive and vice versa. Hence flexibility can be
composed of two dimensions: range and adaptability in which firms can change or react with
little penalty in time, cost or both providing the requested performance to its partners (Koste
and Malhotra, 1999; Upton, 1994). The first dimension of flexibility is the number of
Chapter I: Introduction and Research Overview 35
different states (range) which a firm can exercise (Upton, 1994; Slack, 1983) based on
existing resources which exclude the option that “range can be increased by simply investing
additional resources, in which case it would be a transient attribute” (Swafford et al., 2006,
pp. 173-174). The second dimension of flexibility is adaptability (Koste and Malhotra, 1999;
Bordoloi et al., 1999), which is the ability of a firm to shift from one state to another state in
a timely and cost effective manner in order to modify supply network to strategies,
technologies, and products as well as to adjust the supply chain’s design (Lee, 2004).
Manufacturing firms increasingly outsource many of their production activities to their
suppliers. As a result, the average cost of purchased materials, components, and services
across all manufacturing firms frequently exceeds 60% to 70% of the total cost of operations
(Leenders et al., 2006; Wagner, 2006). In such an environment, sourcing flexibility, i.e., “the
availability of a range of options and the ability of the purchasing process to effectively
exploit them so as to respond to changing requirements related to the supply of purchased
components” (Swafford et al., 2006, p. 174), is central to the success of firms that face
environmental or market uncertainties. Firms can save millions of dollars by adapting the
responsiveness of their supply chains through sourcing flexibility to reduce stock-outs and
inventory in their supply chains, shorten lead-times, and improve the quality of their
products. For example, by practicing sourcing flexibility, Zara, the Spanish fashion retailer, is
able to limit its sales at markdown prices to 15%–20% of the total sales, compared to 30%–
40% for its European peers (Cachon and Swinney, 2009; Ghemawat and Nueno, 2003). As
such, sourcing flexibility is one of the fundamental characteristics of an agile supply chain.
However, as important as it is, the link between sourcing flexibility and a firm’s product and
supply chain success has not yet been established. More and Babu (2008, p. 40) state that, in

Chapter I: Introduction and Research Overview 36
the literature, “the empirical justification of the benefits of implementing flexible supply
chains is rare and in-depth empirical studies are lacking.” Consequently, such knowledge
would support better supply chain design decision making.
In response to this call, in Chapter IV we investigate the impact of sourcing flexibility on
supply chain and product performance. In this context, the composition of a firm’s supplier
portfolio is essential to achieving the sourcing flexibility that is desirable in terms of
efficiency (cost) and responsiveness (agility). A high degree of sourcing flexibility in the
supply chain enables greater supply chain agility. However, sourcing flexibility comes at a
cost and therefore does not automatically result in higher profitability due to increased
responsiveness. This trade-off needs to be explored to reach definitive conclusions on the
relationship between sourcing flexibility and performance. In summary, the research question
III is:
Question III: Does sourcing flexibility have a significant impact on supply chain
and product performance and if so, which degree of sourcing
flexibility sources is required for high supply chain performance and
product performance?
4. Empirical basis
In order to investigate these research questions, theory-driven models were hypothesized
which were subsequently tested on a broad empirical basis. Hence, for Studies I, II and III,
large-scale data collection was conducted. Considerable attention was paid to the design of
the survey instrument, the ease of use, the burden on the respondents, and the maintenance of
the respondents’ interest until the survey was completed (Dillman, 2007). Therefore, a

Chapter I: Introduction and Research Overview 37
preliminary questionnaire was drafted with measurement scales and indexes which were
based on existing research. Furthermore, we ensured general ease of understanding for
respondents and construct validity. Therefore, the survey instrument was pre-tested with
executives and managers who were asked to review the questionnaire for readability,
ambiguity and completeness (Dillman, 2007). Several academics were asked to review the
survey items for ambiguity and clarity, and to evaluate whether individual items appeared to
be appropriate measures of their respective constructs (DeVellis, 2003). Several minor
changes were made to the survey instrument based on the pretest. Moreover, the survey
instrument incorporated the recommendations of Podsakoff, MacKenzie, Lee, and Podsakoff
(2003) for reducing common method bias. Accordingly, the respondents were offered
anonymity and confidentiality to reduce the chances of responses that are socially desirable,
lenient, or consistent with how respondents believe researchers want them to respond. In
addition, the respondents were informed that there are no correct or incorrect answers and to
respond as honestly as possible to reduce evaluation apprehension.
All three studies were conducted by means of an internet-based survey. The internet-
based survey was sent out three times, first to the USA and the UK, second to the German-
speaking countries Germany, Austria and Switzerland, and third to France. Therefore, the
English questionnaire was translated into German and French by two native speakers and
then was back translated into English by two other people. Any differences that emerged
were reconciled by these translators.
After these changes were completed, the survey was finalized and mailed. We mailed the
survey only to targeted key professionals in the area of logistics and supply chain
management. We focused on the largest firms in the USA and Europe. With the support of

Chapter I: Introduction and Research Overview 38
Stanford alumni and a service provider, 1,834 contact details were obtained. Figure 7 depicts
the data collection efforts which reflect our empirical basis.
Figure 7: Empirical basis of research questions
Study I
• Empirical basis for research question I• N = 259 (sample I)• Response rate = 14.12% (259/1834)• USA, UK, Germany, Austria, Switzerland and France
Study II
• Empirical basis for research question II• N = 259 (sample I)• Response rate = 14.12% (259/1834)• USA, UK, Germany, Austria, Switzerland and France
Study III
• Empirical basis for research question III• N = 336 (sample II)• Response rate = 18.32% (336/1834)• USA, UK, Germany, Austria, Switzerland and France
All three studies are out of the same cross-sectional sample, however while Studies I and
II were examined on the basis of sample I (259 manufacturing firms), Study III was
investigated on the basis of sample II (336 manufacturing firms). The reason is that out of the
cross-sectional sample we could only obtain secondary data from Bloomberg and Thomson
Reuters for 259 manufacturing firms listed on the stock exchanges in the USA and/or Europe.
4.1. Studies I and II
4.1.1. Data collection procedure
Research questions I and II and hence Studies I and II are based on sample I: on the cross-
sectional sample of 1,834 firms which was conducted in the USA, the UK, Germany, Austria,
Switzerland and France during September 2007 and April 2008. The sample, with 336 usable
Chapter I: Introduction and Research Overview 39
responses, was used and could be split into 77 private and 259 public manufacturing firms.
All contact addresses from public firms which were obtained from Stanford alumni,
Department of Management Science and Engineering and with the help of a service provider
who contacted the biggest manufacturing firms in the USA and Europe to get in contact with
business, supply chain, logistics and procurement executives were screened for key
performance indicators. The unit of analysis in Studies I and II is the main product line,
defined as the current sales (revenue) driver of the firm and its underlying supply chain.
Studies I and II targeted single well-informed respondents (Kumar et al., 1993; Phillips,
1981), i.e., senior managers in the purchasing or supply chain department, who are likely to
have an overarching, boundary-spanning view of their firms’ supply networks and supplier
activities (Hallenbeck et al., 1999).
The invitations to participate in the survey were sent by personalized emails containing a
link to the internet-based survey. On average, the questionnaire in Studies I and II took 20.7
minutes to complete. Considerable efforts were made to achieve a good response rate. A
composite summary of the results was offered in addition to participation in a lottery.
Following Dillman’s Total Design Method (Dillman, 2007), initial mailings were followed
by reminders, with follow-up phone calls or second mailings, as necessary. Survey
respondents were asked to answer each question using a 5-point Likert scale (1—low, 5—
high) based on the characteristics of their business unit relative to their major competitors.
The mailing and two follow-ups generated 400 responses (21.81%) in September 2007 and
April 2008, which is above the recommended rule-of-thumb baseline minimum of 20% for
empirical studies (Malhotra and Grover, 1998) even though several other studies subscribe to
the philosophy that there is no generally accepted minimum response rate (Fowler, 1993).

Chapter I: Introduction and Research Overview 40
However out of our sample, we could only obtain secondary data for 259 firms, i.e., all key
performance indicators (KPIs) which we requested to calculate among others ROCE, sales or
margin averages, yielding an effective response rate of 14.12% (259/1834). Hence, sample I
covers 259 manufacturing firms from a wide range of industries listed on the stock exchange
in the USA and/or Europe.
4.1.2. Sample characteristics
Approximately 61% of respondents were C-level executives, vice presidents, directors or
department heads, mainly in supply chain management (41%), logistics (19%), production
and procurement (17%), general management (10%) and closely related logistics fields
(13%). These respondents are likely to possess an overarching, boundary-spanning view of
their firms’ upstream and downstream activities pertaining to their firms’ main product lines.
A detailed breakdown is provided in Table 3.
Table 3: Breakdown of sample I composition Industry Sector N % Number of Employees N %
Aerospace & Defense 24 9.27 < 100 3 1.16Automotive & Parts 29 11.20 100-499 20 7.72Chemicals 16 6.18 500-999 17 6.56Construction & Materials 14 5.41 1,000-4,999 52 20.08Electricity 4 1.54 5,000-9,999 40 15.44Electronic & Electrical Equipment 28 10.81 > 10,000 127 49.04
Food & Beverages 19 7.34 Respondent Job Title N %
Forestry & Paper 5 1.93 CxO/Vice President 37 14.29Household Goods & Personal Goods 26 10.04 Director/Department Head 122 47.10Industrial Metals 10 3.86 Manager 64 24.71Machinery & Plant Engineering 24 9.27 Team Leader 18 6.95Medical Equipment 10 3.86 Others 18 6.95
Mining 4 1.54 Respondent Function N %
Oil & Gas 6 2.32 Supply Chain Management 106 40.93Pharmaceuticals & Biotechnology 12 4.63 General Management 27 10.42Technology Hardware & Equipment 17 6.56 Logistics 48 18.53Textiles 11 4.25 Purchasing 24 9.27 Production/Manufacturing 20 7.72
TOTAL 259 Others 34 13.13
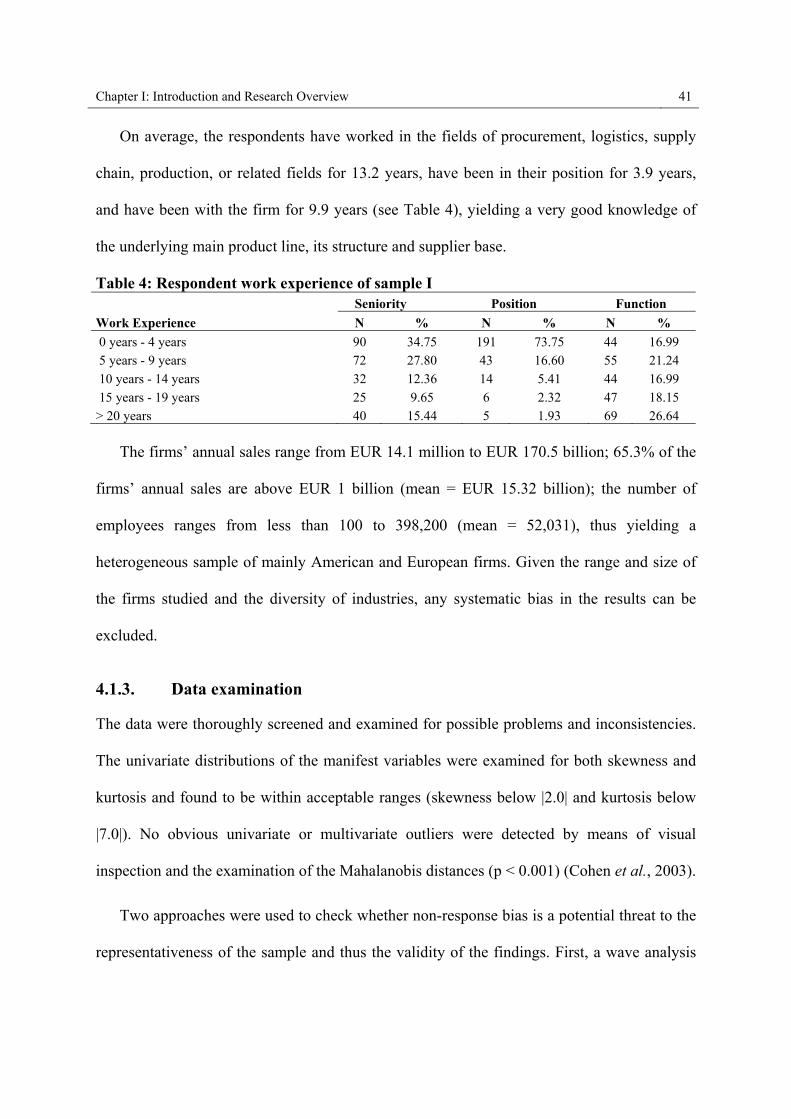
Chapter I: Introduction and Research Overview 41
On average, the respondents have worked in the fields of procurement, logistics, supply
chain, production, or related fields for 13.2 years, have been in their position for 3.9 years,
and have been with the firm for 9.9 years (see Table 4), yielding a very good knowledge of
the underlying main product line, its structure and supplier base.
Table 4: Respondent work experience of sample I Seniority Position Function
Work Experience N % N % N %
0 years - 4 years 90 34.75 191 73.75 44 16.99 5 years - 9 years 72 27.80 43 16.60 55 21.24
10 years - 14 years 32 12.36 14 5.41 44 16.99
15 years - 19 years 25 9.65 6 2.32 47 18.15 > 20 years 40 15.44 5 1.93 69 26.64
The firms’ annual sales range from EUR 14.1 million to EUR 170.5 billion; 65.3% of the
firms’ annual sales are above EUR 1 billion (mean = EUR 15.32 billion); the number of
employees ranges from less than 100 to 398,200 (mean = 52,031), thus yielding a
heterogeneous sample of mainly American and European firms. Given the range and size of
the firms studied and the diversity of industries, any systematic bias in the results can be
excluded.
4.1.3. Data examination
The data were thoroughly screened and examined for possible problems and inconsistencies.
The univariate distributions of the manifest variables were examined for both skewness and
kurtosis and found to be within acceptable ranges (skewness below |2.0| and kurtosis below
|7.0|). No obvious univariate or multivariate outliers were detected by means of visual
inspection and the examination of the Mahalanobis distances (p < 0.001) (Cohen et al., 2003).
Two approaches were used to check whether non-response bias is a potential threat to the
representativeness of the sample and thus the validity of the findings. First, a wave analysis
Chapter I: Introduction and Research Overview 42
was conducted, based on the assumption that late respondents are similar to non-respondents
(Armstrong and Overton, 1977). t-tests at the 5% level yielded no statistically significant
differences among the responses from early (initial invitation email wave) versus late (second
and third reminder email wave) respondents on all 38 items as well as on a few key
demographic variables. Second, the sample of respondents was compared to a sample of 100
randomly selected non-responding firms drawn from the initial sample (N = 1,834) in terms
of annual sales and employees in 2006 (Wagner and Kemmerling, 2010). The data were
gathered from Bloomberg and Thomson Reuters. For both variables, no mean differences
between respondents and non-respondents were found to be significant according to the
performed t-tests (p < 0.05). In sum, although these results do not rule out the possibility of
non-response bias, they suggest that non-response bias may not be a problem. Thus, we
conclude that non-response bias is not present and preceded the data analysis as described in
subsequent sections.
4.2. Study III
4.2.1. Data collection procedure
The data collection procedure of Study III is the same as for Studies I and II. The mailing and
two follow-ups generated in total 336 usable responses, yielding an effective response rate of
18.32% (336/1834).
4.2.2. Sample characteristics
Approximately 64% of respondents are C-level executives, vice presidents, directors, or
department heads, primarily in supply chain management (38%), general management (26%),
logistics (18%), purchasing (10%), and production (8%). These respondents are likely to
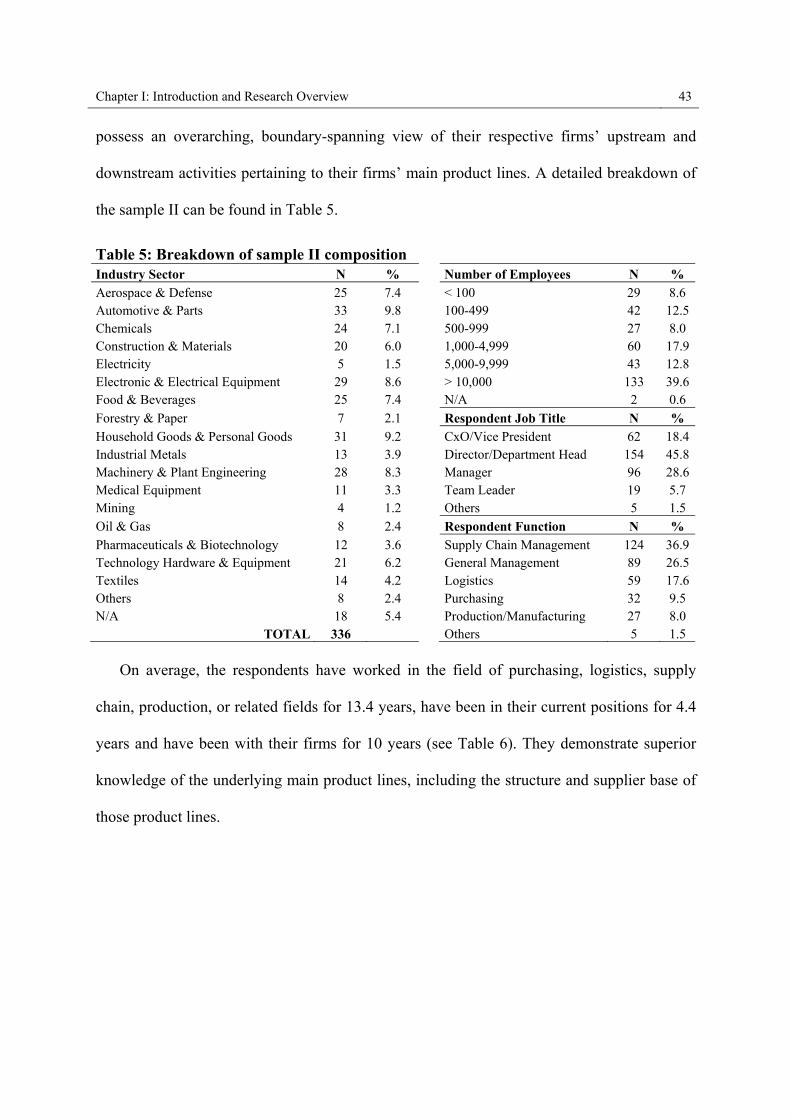
Chapter I: Introduction and Research Overview 43
possess an overarching, boundary-spanning view of their respective firms’ upstream and
downstream activities pertaining to their firms’ main product lines. A detailed breakdown of
the sample II can be found in Table 5.
Table 5: Breakdown of sample II composition Industry Sector N % Number of Employees N % Aerospace & Defense 25 7.4 < 100 29 8.6 Automotive & Parts 33 9.8 100-499 42 12.5Chemicals 24 7.1 500-999 27 8.0 Construction & Materials 20 6.0 1,000-4,999 60 17.9Electricity 5 1.5 5,000-9,999 43 12.8Electronic & Electrical Equipment 29 8.6 > 10,000 133 39.6Food & Beverages 25 7.4 N/A 2 0.6
Forestry & Paper 7 2.1 Respondent Job Title N % Household Goods & Personal Goods 31 9.2 CxO/Vice President 62 18.4Industrial Metals 13 3.9 Director/Department Head 154 45.8Machinery & Plant Engineering 28 8.3 Manager 96 28.6Medical Equipment 11 3.3 Team Leader 19 5.7 Mining 4 1.2 Others 5 1.5 Oil & Gas 8 2.4 Respondent Function N % Pharmaceuticals & Biotechnology 12 3.6 Supply Chain Management 124 36.9Technology Hardware & Equipment 21 6.2 General Management 89 26.5Textiles 14 4.2 Logistics 59 17.6Others 8 2.4 Purchasing 32 9.5 N/A 18 5.4 Production/Manufacturing 27 8.0
TOTAL 336 Others 5 1.5
On average, the respondents have worked in the field of purchasing, logistics, supply
chain, production, or related fields for 13.4 years, have been in their current positions for 4.4
years and have been with their firms for 10 years (see Table 6). They demonstrate superior
knowledge of the underlying main product lines, including the structure and supplier base of
those product lines.
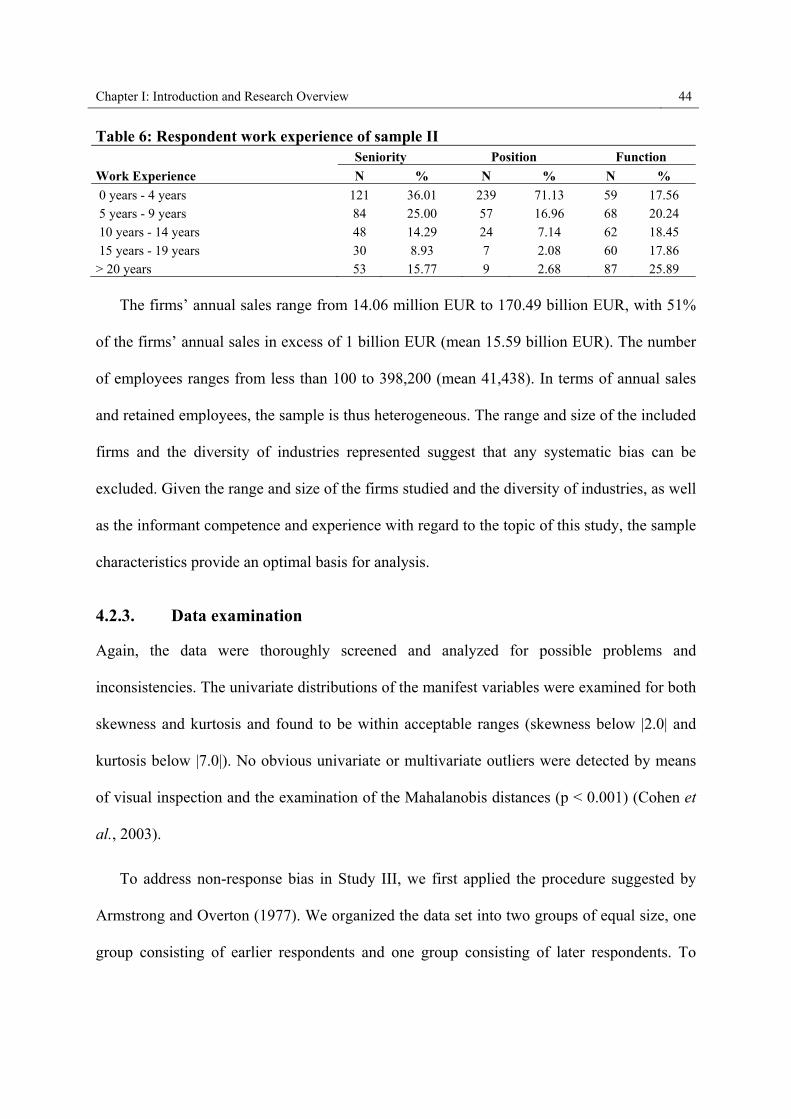
Chapter I: Introduction and Research Overview 44
Table 6: Respondent work experience of sample II Seniority Position Function
Work Experience N % N % N %
0 years - 4 years 121 36.01 239 71.13 59 17.56 5 years - 9 years 84 25.00 57 16.96 68 20.24
10 years - 14 years 48 14.29 24 7.14 62 18.45
15 years - 19 years 30 8.93 7 2.08 60 17.86 > 20 years 53 15.77 9 2.68 87 25.89
The firms’ annual sales range from 14.06 million EUR to 170.49 billion EUR, with 51%
of the firms’ annual sales in excess of 1 billion EUR (mean 15.59 billion EUR). The number
of employees ranges from less than 100 to 398,200 (mean 41,438). In terms of annual sales
and retained employees, the sample is thus heterogeneous. The range and size of the included
firms and the diversity of industries represented suggest that any systematic bias can be
excluded. Given the range and size of the firms studied and the diversity of industries, as well
as the informant competence and experience with regard to the topic of this study, the sample
characteristics provide an optimal basis for analysis.
4.2.3. Data examination
Again, the data were thoroughly screened and analyzed for possible problems and
inconsistencies. The univariate distributions of the manifest variables were examined for both
skewness and kurtosis and found to be within acceptable ranges (skewness below |2.0| and
kurtosis below |7.0|). No obvious univariate or multivariate outliers were detected by means
of visual inspection and the examination of the Mahalanobis distances (p < 0.001) (Cohen et
al., 2003).
To address non-response bias in Study III, we first applied the procedure suggested by
Armstrong and Overton (1977). We organized the data set into two groups of equal size, one
group consisting of earlier respondents and one group consisting of later respondents. To
Chapter I: Introduction and Research Overview 45
identify potential statistically significant differences between the two groups, we performed t-
tests on the groups’ responses. The t-tests (p < 0.05) yielded no statistically significant mean
differences among all items used in our models. In addition, we tested for significant
differences between firm size and industry clusters. Again, no statistically significant
differences were identified. Second, we sampled from the population that did not respond to
the original survey (non-respondents), contacted that sample by phone, and asked them to
complete the survey (Wagner and Kemmerling, 2010; Mentzer and Flint, 1997). The
responses from 52 non-respondents were compared to the data of respondents; t-test results
did not reveal statistically significant differences. These tests suggest that non-response bias
is not a problem in our study.
Chapter II: The Bottom Line Impact of Supply Chain Management 46
Chapter II The Bottom Line Impact of Supply Chain Management
This chapter investigates the bottom line impact of supply chain management, in particular
the link between supply chain fit and a firm’s financial success. In this chapter, the bottom
line impact of supply chain management is restricted to the phenomenon of supply chain fit, a
fit between demand aspects of a product and its supply chain design profile as described in
Chapter I. The ideas posited in this research have support from the configurational literature
(in a supply chain context), from the generic product and supply chain design profiles of
Fisher (1997) as well as from the strategic fit concept of Chopra and Meindl (2009).
It is organized as follows: In Section 1, we begin by introducing the theoretical
development of the conceptual framework and develop the constructs and core hypotheses
within this framework. We then present in Sections 2 the psychometric development of the
constructs, followed by regression analyses in Section 3. We discuss in Section 4 ensuing
results as well as managerial and research implications.
1. Theoretical background and hypotheses
Based on the nomenclature outlined in the previous chapter, the relevant literature, selected
theories, a conceptual framework, and hypotheses are developed in the following. Three basic
premises underlie the proposed conceptual framework. The first is that certain supply chain
design configurations are drivers of supply chain responsiveness. Second, products can be
Chapter II: The Bottom Line Impact of Supply Chain Management 47
classified mainly into two groups: functional products with predictable demand and hence a
low implied demand uncertainty and innovative products with unpredictable demand and
hence a high implied demand uncertainty. And the third is that there is a relationship between
these drivers which impact in the financial performance of a firm.
1.1. Configurational approach
A basic element of supply chain management is the holistic or system view. Following this
perspective, especially on a strategic level, supply chain management has to analyze the
supply chain as a whole. The configurational approach is one method for realizing this
(Neher, 2005). Configuration theory considers holistic configurations, or gestalts, of design
elements (Miles and Snow, 1978). Hence it extends the traditional approach in strategic
management research which strictly divides the concept of strategy between “how strategy is
formed” (process) and “which decisions are taken” (content). In particular for supply chain
management, in addition to content and process, the internal and external environmental
context of the organization plays an important role for decision-making and should therefore
be incorporated (Ketchen et al., 1996).
The increased effectiveness is attributed to the internal consistency, or fit, among
strategic, structural, and contextual patterns. Two well-known examples of configurational
theories are Mintzberg’s (1983; 1979) theory of organizational structure and Miles and
Snow’s theory (1978) of strategy, structure, and process. Both examples posit that a firm that
approximates one of its ideal types is hypothesized to be more effective; an “ideal type”
(McKinney, 1966) is a theoretical construct to represent a holistic configuration of
organizational factors. Miles and Snow (1978) identify four ideal types of firm: the defender,
the prospector, the analyzer, and the reactor. Each of these types is a unique configuration of

Chapter II: The Bottom Line Impact of Supply Chain Management 48
contextual, structural, and strategic factors. Miles and Snow’s typology, which was
transferred to the supply chain context (Hult et al., 2006) posits that at least three of these
ideal types – prospector, defender and analyzer – represent effective forms of firms.
For the purpose of this research, configuration theory is used as theoretical support for the
underlying assumption that a firm with supply chain fit will achieve higher firm performance,
i.e., supply chain management has a bottom line impact on firm’s financial success. As
configurations are constellations of design elements that occur together because their
interdependence makes them fall into patterns (Meyer et al., 1993a), strategic consistencies
between demand aspects of the underlying product and its supply chain design posits that
high organizational efficiency and performance result when firms consider the context in
which strategy is crafted and implemented. Hence, the better a supply chain matches an ideal
configuration, the better the financial performance.
1.2. Supply chain fit
Following the reasoning of Chopra and Meindl (2009), we define, as indicated earlier, supply
chain fit as the ideal strategic consistency between the multiple dimensions of the
innovativeness of a firm’s product (product demand aspect) and its embedded supply chain
responsiveness (supply chain design aspect), which, in turn, must be aligned with the overall
competitive strategy. Appropriateness of a firm’s strategy can be defined in terms of its fit,
match, or congruence with the environmental contingencies facing the firm (Andrews, 1971).
A competitive strategy will implicitly or explicitly specify one or more customer segments
that a firm hopes to satisfy with its product(s). To avoid supply chain misfits, a firm must
ensure that its competitive strategy is aligned to its supply chain strategy (Chopra and
Meindl, 2009; Presutti and Mawhinney, 2007; Lee, 2004) and that its supply chain

Chapter II: The Bottom Line Impact of Supply Chain Management 49
capabilities support its ability to satisfy the targeted customer segments. As customer
preferences and consequently demand aspects of products are always in flux, any supply
chain fit can only be temporary, i.e., supply chain fit is a dynamic concept. If inconsistencies
between demand aspects of the product and the supply chain design occur, and if necessary
adaptations do not take place or are not executed on time, a firm will likely exhibit a lack of
supply chain fit and lose its competitive edge over time. Failure to achieve supply chain fit is
a key reason for the failure of many firms (Chopra and Meindl, 2009). In contrast, Toyota’s
production system (TPS) for example has been a competitive advantage for more than two
decades (Lee et al., 2005). Its brilliant supply chain strategy has been figured out by all
competitors, but they failed to emulate such a fit. The core of this strategic approach is
mainly based on a fit between their product and supply chain configurations as much as (and
this might be different from competitors) to which extend those configurations are managed
and aligned to the overall competitive strategy, i.e., supply chain management at Toyota and
their unorthodox manufacturing system TPS works continuously in tandem (Shook, 2009;
Takeuchi et al., 2008).
When organizational configurations fit or are similar to the ideal type, effectiveness is at
its highest because of the greatest possible fit among contextual, structural, and strategic
factors (Meyer et al., 1993b). Fisher (1997) describes optimal configurations in terms of
demand aspects of a product (determining the implied uncertainty spectrum) and
differentiates between functional products, with predictable demand, and innovative products,
with unpredictable demand. Demand aspects of a product vary in terms of demand
predictability, life-cycle length, product variety, service, lead-times and specific market
requirements. With a predictable demand environment (low implied uncertainty), a supply

Chapter II: The Bottom Line Impact of Supply Chain Management 50
chain configuration focusing on a physically-efficient supply chain is considered as most
appropriate, whereas in case of an unpredictable demand environment (high implied
uncertainty), a market responsive supply chain with extra buffer inventory capacity, high
flexibility requirements and a capability for market processing information fits better. The
generic product and supply chain design portfolios listed by Fisher (1997) are included in
Tables 1 and 2.
In acknowledging that there is more than one way to succeed in each type of setting, the
configurational approach accommodates the important concept of equifinality. A supply
chain fit can hence also be achieved by following a mixed strategy in the underlying supply
chain design. This extends Fisher’s (1997) framework, because the diametrical request of a
match or fit is given up. Since not all products are clearly functional or innovative, mastering
cost effectiveness and dealing with high product variety are both required. A mixed strategy
reflects also the majority of supply chains (Selldin and Olhager, 2007). Pursuing either a
technological innovation or a niche strategy with an innovative product and a responsive
strategy could enable a firm to succeed in an environment with high implied demand
uncertainty. However, neither strategic approach will work unless it is embedded in a pattern
of coherent organizational processes and structures (Meyer et al., 1993a; Meyer et al.,
1993b). Key is to ensure that the degree of supply chain responsiveness is consistent with the
implied uncertainty and aligned to the overall competitive strategy.
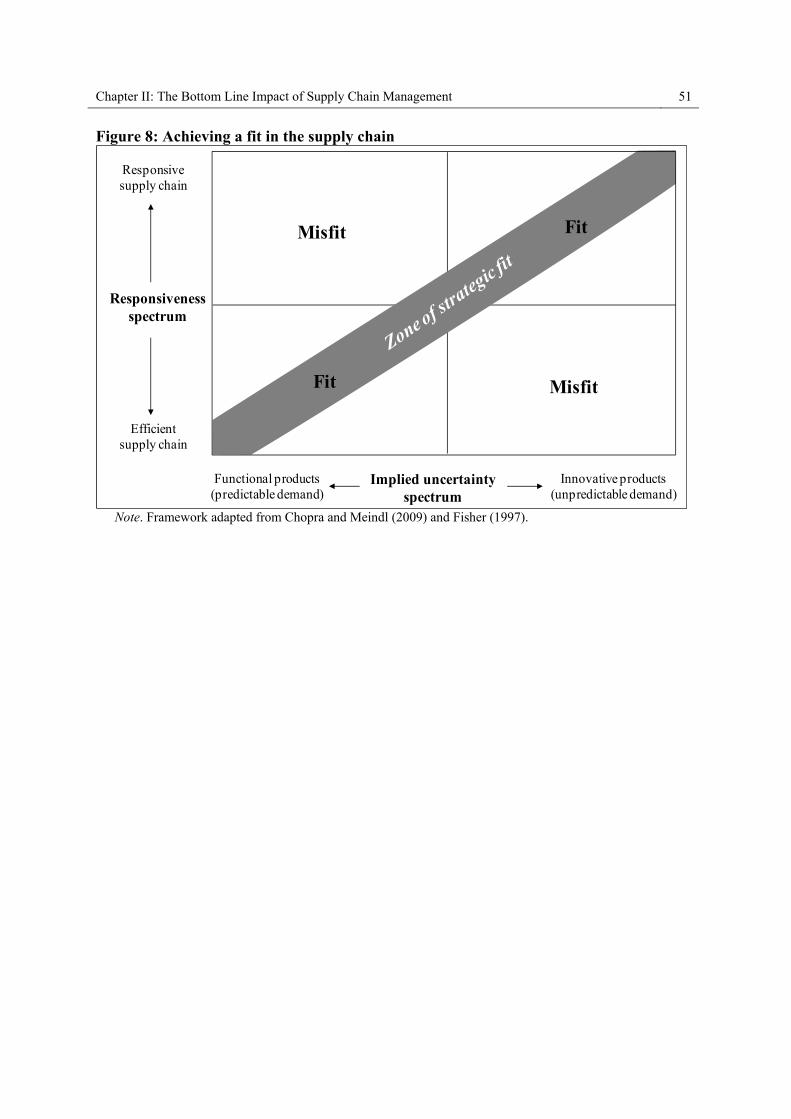
Chapter II: The Bottom Line Impact of Supply Chain Management 51
Figure 8: Achieving a fit in the supply chain
Responsiveness spectrum
Implied uncertainty spectrum
Responsivesupply chain
Efficientsupply chain
Functional products(predictable demand)
Innovative products(unpredictable demand)
Misfit
MisfitFit
Fit
Note. Framework adapted from Chopra and Meindl (2009) and Fisher (1997).

Chapter II: The Bottom Line Impact of Supply Chain Management 52
1.3. Consequences of a supply chain fit
To explore the consequences of a supply chain fit on a firm’s financial success, we develop a
conceptual framework, displayed in Figure 9.
Figure 9: Conceptual framework I
ROCE
ROA
Supply Chain Fit
Sales Growth
EBIT Margin
H2I (+)
H3I (+)
H4I (+)
H1I (+)
Note. (+) indicates a positive relationship. H1
I represents the hypothesized positive relationship between
supply chain fit and ROCE, H2I between supply chain fit and ROA, H3
I between supply chain fit and
Sales Growth, and H4I represents the hypothesized positive relationship between supply chain fit and
EBIT Margin. The concept of fit, a core concept in normative models of strategy formulation, has
traditionally been viewed as having desirable performance implications (Ginsberg and
Venkatraman, 1985). In this context, supply chain fits are likely to positively affect the firm’s
short- and long-term revenue, cost and asset streams, i.e., its ROCE, ROA, Sales Growth as
well as EBIT Margin (Chopra and Meindl, 2009; Selldin and Olhager, 2007; Thonemann et
al., 2007; Simchi-Levi et al., 2000; Fisher, 1997; Van de Ven and Darzin, 1985).
On the revenue side, supply chain fit helps firms capitalizing on strong market demand
due to low stock-outs avoiding loss in net sales and market share, influencing directly Sales
Growth. Furthermore, the availability of products and higher logistics service-levels due to
fits will generate as a consequence higher EBIT Margins, higher customer satisfaction and
customer loyalty, and higher reputation of the manufacturing firm.
Chapter II: The Bottom Line Impact of Supply Chain Management 53
On the cost side, the decreased costs associated with supply chain fit derive from higher
inventory turnovers, higher utilization rates, and shorter lead-times impacting ROCE and
ROA. Costs associated with expediting, premium freight, obsolete inventory, additional
marketing expenses, and penalties paid to the customer to recover loyalty can be avoided,
increasing the firm’s profitability.
On the asset side, the degree of centralization of the manufacturing footprint and logistics
network has an impact on the asset base of a firm, which directly influences ROA. The
inventory management, allocation and turnover affect its working capital. It is impossible to
assess profits or profit growth accurately without relating them to the amount of funds
(capital) that were employed in making profits. If a firm manages to achieve a ROA with
fewer assets, the productivity of the supply chain increases since less capital is required to
achieve the same output. With strategic decisions on the supply chain, firms have a direct
influence on the productivity of a firm’s asset base (asset turn) and the EBIT Margin.
As supply chain fit affects revenues, costs, and asset utilization of manufacturing firms,
i.e., the key drivers of short- and long-term profitability in terms of ROCE, ROA, Sales
Growth and EBIT Margin, we hypothesize that:
Hypothesis H1I: Supply Chain Fit will be positively associated with ROCE
Hypothesis H2I: Supply Chain Fit will be positively associated with ROA
Hypothesis H3I: Supply Chain Fit will be positively associated with Sales
Growth
Hypothesis H4I: Supply Chain Fit will be positively associated with EBIT
Margin
Chapter II: The Bottom Line Impact of Supply Chain Management 54
2. Methodology
2.1. Data sample and procedure
The proposed hypotheses were tested on a broad-empirical basis using the data from sample
I. The data collection procedure, the sample characteristics, as well as the statistical data
examination are described in detail in Chapter I.
2.2. Measures
Respondents were asked to indicate (1) the underlying product or product line; when it was
introduced to the market and when a new version/update will be implemented; (2) the
characteristics of the underlying product; and (3) how their supply chains were structured.
These aspects represent a proxy for the (in)consistency between product innovativeness and
supply chain responsiveness. Survey respondents were also asked to answer each question
using a 5-point scale (1—low, 5—high) based on the characteristics of their business unit
relative to their major competitors (Rensis, 1932). All items were scored so that higher
numbers reflect increases in the underlying constructs. Translations of the individual scale
items, response cues for each measure, and descriptive statistics are listed in Table 7.
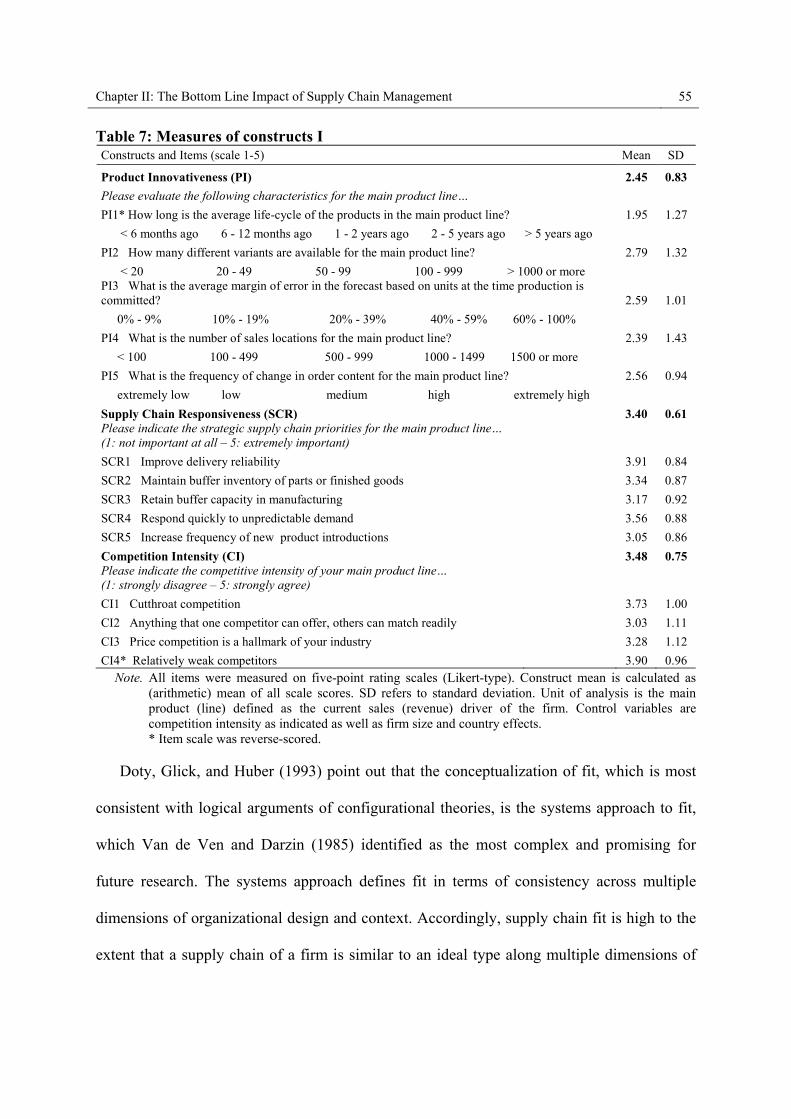
Chapter II: The Bottom Line Impact of Supply Chain Management 55
Table 7: Measures of constructs I Constructs and Items (scale 1-5) Mean SD
Product Innovativeness (PI) 2.45 0.83
Please evaluate the following characteristics for the main product line…
PI1* How long is the average life-cycle of the products in the main product line? 1.95 1.27
� < 6 months ago � 6 - 12 months ago � 1 - 2 years ago � 2 - 5 years ago � > 5 years ago
PI2 How many different variants are available for the main product line? 2.79 1.32
� < 20 � 20 - 49 � 50 - 99 � 100 - 999 � > 1000 or more PI3 What is the average margin of error in the forecast based on units at the time production is committed? 2.59 1.01
� 0% - 9% � 10% - 19% � 20% - 39% � 40% - 59% � 60% - 100%
PI4 What is the number of sales locations for the main product line? 2.39 1.43
� < 100 � 100 - 499 � 500 - 999 � 1000 - 1499 � 1500 or more
PI5 What is the frequency of change in order content for the main product line? 2.56 0.94
� extremely low � low � medium � high � extremely high
Supply Chain Responsiveness (SCR) 3.40 0.61 Please indicate the strategic supply chain priorities for the main product line… (1: not important at all – 5: extremely important)
SCR1 Improve delivery reliability 3.91 0.84
SCR2 Maintain buffer inventory of parts or finished goods 3.34 0.87
SCR3 Retain buffer capacity in manufacturing 3.17 0.92
SCR4 Respond quickly to unpredictable demand 3.56 0.88
SCR5 Increase frequency of new product introductions 3.05 0.86
Competition Intensity (CI) 3.48 0.75 Please indicate the competitive intensity of your main product line… (1: strongly disagree – 5: strongly agree)
CI1 Cutthroat competition 3.73 1.00
CI2 Anything that one competitor can offer, others can match readily 3.03 1.11
CI3 Price competition is a hallmark of your industry 3.28 1.12
CI4* Relatively weak competitors 3.90 0.96 Note. All items were measured on five-point rating scales (Likert-type). Construct mean is calculated as
(arithmetic) mean of all scale scores. SD refers to standard deviation. Unit of analysis is the main product (line) defined as the current sales (revenue) driver of the firm. Control variables are competition intensity as indicated as well as firm size and country effects.
* Item scale was reverse-scored. Doty, Glick, and Huber (1993) point out that the conceptualization of fit, which is most
consistent with logical arguments of configurational theories, is the systems approach to fit,
which Van de Ven and Darzin (1985) identified as the most complex and promising for
future research. The systems approach defines fit in terms of consistency across multiple
dimensions of organizational design and context. Accordingly, supply chain fit is high to the
extent that a supply chain of a firm is similar to an ideal type along multiple dimensions of

Chapter II: The Bottom Line Impact of Supply Chain Management 56
the underlying product. Assessing lack of supply chain fit as conceptualized in the systems
approach requires measuring the deviations of the supply chain of a real firm from the supply
chain of one or more ideal-type firms. The ideal types are represented by multivariate ideal
profiles that provide the correspondence between the verbal descriptions of the ideal types
and the measures used to assess real firms. Real firms’ deviations from ideal types of supply
chains can be assessed with analysis of the underlying product innovativeness and of the
corresponding supply chain responsiveness (Lee, 2002; Fisher, 1997). The numerical
examples for our product innovativeness and supply chain responsiveness measures listed by
Fisher (1997) were transformed into five-step Likert scales where the specific numerical
targets appeared at the respective endpoints of the five-step scale (Selldin and Olhager,
2007).
Supply chain fit (SCF) is calculated as the difference between the standardized product
innovativeness (PI) and the standardized supply chain responsiveness (SCR). Similar
procedures were already applied, for example by Siguaw, Brown, and Widing (1994) who
measured the influence of the market orientation of a firm on sales force behavior and
attitudes. Certainly, this proxy for supply chain fit does not measure the exact current amount
of supply chain fit a firm achieves due to consistencies between its supply chain design and
the underlying product (which is arguably almost impossible to obtain), but it may serve as an
acceptable approximation. The product innovativeness (PI) measure consists of five items
(Fisher, 1997) that capture the demand aspects of the product. The product life-cycle (PI1) is
the length of time between the introduction of the product to the market and its removal from
the market. For firms it is often necessary to stretch the product line into a “product family”
of a significant number of variants (PI2) with respect to changing customer requirements and

Chapter II: The Bottom Line Impact of Supply Chain Management 57
market segmentation. The average forecast error (PI3) of the main product line is defined as
the deviation of the forecasted quantity (units) from the actual quantity needed at the time
production is committed: Forecast Error = absolute value of (Actual – Forecast). Next, sales
locations (PI4) are trading platforms in which goods and/or services reach customers and
potential customers. It is assumed that the higher the number of sales locations, the better the
firm’s ability to provide widespread and/or intensive sales (and distribution) coverage.
Changes in order content (PI5) take place if the order is changed in terms of content, size,
delivery time or other patterns. The supply chain responsiveness (SCR) measure also consists
of five items that capture the supply chain design (Fisher, 1997): delivery reliability (SCR1),
buffer inventory of parts or finished goods (SCR2), buffer capacity in manufacturing (SCR3),
quick response to unpredictable demand (SCR4) and frequency of new product introductions
(SCR5). Respondents were hereby asked to indicate the strategic supply chain priority of
their supply chain design. We defined the strategic supply chain priority as the primary
purpose of the firm in designing the supply chain with regard to the needs of the main
product (line).
Profitability was measured by four key performance indicators (KPIs): ROCE, ROA,
Sales Growth, and EBIT Margin. ROCE is an excellent measure for the returns that a firm is
realizing from its capital employed. The ratio can be seen as representing the efficiency with
which capital is being utilized to generate revenue. It is commonly used as a measure for
comparing the performance between businesses and for assessing whether a business is
generating enough returns to pay for its cost of capital. We define ROCE as follows: ROCE =
EBIT / Capital employed. Capital employed is herein defined as: Net fixed assets + Current
assets – Current liabilities. Goodwill and intangible assets are excluded. ROA shows how

Chapter II: The Bottom Line Impact of Supply Chain Management 58
effectively a firm utilized its assets in generating profits. ROA is defined as: ROA = Net
income / Total assets. ROA gives an idea as to how efficient management is at using its assets
to generate earnings. In other words, the ROA percentage shows how profitable a firm’s
assets are in generating revenue. Sales Growth indicates how fast and how strong a
manufacturing firm increases in sales over a specific period. It was calculated as follows:
Sales Growth = [(sales in 2006 – sales in 2004) / sales in 2004]. EBIT Margin helps
evaluating how a firm has grown over time. It is defined as: EBIT Margin = EBIT / net
revenue. Secondary data for all KPIs were obtained from Bloomberg and Thomson Reuters.
To eliminate undesirable sources of variance, we included control variables which may
influence and confound the relationships of the key variables in our model. First, firm size is
an important structural variable. Larger firms might have more market penetration power
than smaller ones and thus be more profitable. Smaller firms, in contrast, might be more
innovative, and therefore more profitable. Firm size was measured by a single item asking
respondents for the number of employees at their firm; this was double-checked against
secondary data. Second, competitive intensity, the extent to which a firm perceives its
competition to be intense and the extent to which it competes to retain its market share, is
another important structural variable with potential impact on profitability. It was captured by
four items asking respondents for the intensity of rivalry among firms in the industry. We
employed the scale used by Jaworski and Kohli (1993). Third, we eliminated country effects.
Economic, political, and cultural differences influence the strategic and operational
possibilities of firms and therefore might influence profitability. Following the procedure
suggested by Cohen, Cohen, West, and Aiken (2003, pp. 303-307), the responses from the
UK were coded as the variable “Country UK”, responses from France were coded as the

Chapter II: The Bottom Line Impact of Supply Chain Management 59
variable “Country France”, and responses from the German-speaking countries were coded as
the variable “Country Germany”. Finally, responses from the U.S. were used as the baseline.
3. Statistical analysis and results
3.1. Reliability and validity
Before testing our core hypotheses, we first assessed the reliability and validity of the
reflective constructs and the underlying items, followed by the assessment of the structural
relationships, i.e., the relationships among the constructs. This ensures reliable and valid
measures of constructs before attempting to draw conclusions about the nature of the
construct relationships (Anderson and Gerbing, 1988). The independent variable supply chain
fit is building on two reflective constructs (product innovativeness and supply chain
responsiveness). We assessed the reliability and validity of the reflective constructs using
confirmatory factor analysis (CFA) (Bagozzi et al., 1991). Hereby product innovativeness,
supply chain responsiveness and the control variable (competitive intensity) were included
into one three-factor CFA model. As there were no indications of the presence of multivariate
non-normality (normalized Mardia coefficient estimate of 1.32), the model was estimated
with Amos 16.0 using the maximum likelihood estimation method.

Chapter II: The Bottom Line Impact of Supply Chain Management 60
Table 8: Factor analysis results and measurement statistics I Constructs and items (scale 1-5)
Cronbach alpha
Total variance
explained
Commun-alities
Item-to-total
correlation
Composite reliability
AVE Factor loading
t-value
SE IR
Product Innovativeness (PI) 0.718 0.482 0.860 0.566
PI1 0.385 0.424 0.621 -a -b 0.457PI2 0.364 0.398 0.603 5.373 0.178 0.395PI3 0.511 0.524 0.715 6.357 0.147 0.667PI4 0.630 0.573 0.794 6.186 0.278 0.628PI5 0.523 0.518 0.723 5.805 0.171 0.748Supply Chain Responsiveness (SCR) 0.744 0.499 0.874 0.597
SCR1 0.253 0.329 0.503 -a -b 0.269SCR2 0.521 0.516 0.722 4.862 0.382 0.624SCR3 0.654 0.622 0.809 5.035 0.475 0.726SCR4 0.580 0.575 0.762 5.075 0.377 0.647SCR5 0.487 0.500 0.698 4.841 0.344 0.553
Competition Intensity (CI) 0.686 0.518 0.810 0.536
CI1 0.553 0.497 0.847 -a -b 0.52 CI2 0.613 0.533 0.931 7.024 0.200 0.598CI3 0.616 0.541 0.404 6.887 0.219 0.576CI4 0.289 0.312 0.904 4.709 0.134 0.298
Note. All items were measured on five-point rating scales (Likert-type). SE refers to standard error from the unstandardized solution, AVE refers to average variance extracted, and IR refers to indicator reliability (Fornell and Larcker, 1981).
a t-values are from the unstandardized solution; all are significant at the 0.001 level (two-tailed). b Factor loading was fixed at 1.0 for identification purposes.
The CFA results depicted in Table 8 indicate acceptable psychometric properties for all
constructs. Composite reliabilities and average variances extracted for all constructs reach the
common cut-off values of 0.70 (Nunnally and Bernstein, 1994) and 0.50 (Bagozzi and Yi,
1988; Fornell and Larcker, 1981), indicating construct validity. Without exception, each item
loaded on its hypothesized construct with large loadings, significant at the 99% confidence
interval, which represents a high level of item validity. This high level of item reliability
implies that the items are strongly influenced by the construct they are measuring and
indicates that sets of items used to capture the construct are unidimensional.

Chapter II: The Bottom Line Impact of Supply Chain Management 61
Overall, the results demonstrate acceptable levels of fit for all reflective constructs (Hair
et al., 2006): Chi-square 2/df = 1.998 (2(74) = 147.860, p < 0.001), CFI (Comparative Fit
Index) = 0.907, NNFI (TLI) (Non-Normed Fit Index also known as Tucker-Lewis Index) =
0.886, GFI (Goodness of Fit Index) = 0.922, and RMSEA (Root Mean Square Error of
Approximation) = 0.062 (90% confidence interval = [0.047, 0.077]). For CFI, values above
0.95 indicate a good fit; acceptable values for NNFI and GFI are above 0.9 and for RMSEA
below 0.07 (Steiger, 2007; Hair et al., 2006).
The estimates of the CFA model also allow us to assess convergent and discriminant
validity. Inter-construct correlations and squared correlations are provided in Table 9. All the
results are within acceptable ranges, indicating convergent and discriminant validity of our
reflective constructs as measured by their items (Fornell and Larcker, 1981). As the
dependent variable is based on objective secondary data, the concern regarding common
method bias can be discarded.
Table 9: Inter-construct correlations and AVE I Mean SD (1) (2) (3) (4) (5) (6) (7) (8) (9) (10)
(1) ROCE 0.20 0.21 1.000 0.490 0.030 0.430 0.020 0.010 0.000 0.000 0.010 0.010 (2) ROA 0.08 0.07 0.70** 1.000 0.100 0.600 0.030 0.000 0.000 0.000 0.020 0.010 (3) SG 0.09 0.11 0.17** 0.31** 1.000 0.070 0.020 0.010 0.000 0.000 0.010 0.010 (4) EBIT-M 0.08 0.07 0.66** 0.78** 0.26** 1.000 0.020 0.050 0.010 0.010 0.020 0.020 (5) SCF 0.00 1.00 0.14* 0.18** 0.14* 0.14* 1.000 0.010 0.000 0.000 0.000 0.010 (6) FS 52,031 88,308 0.090 0.050 -0.080 0.22** 0.110 1.000 0.040 0.110 0.000 0.040 (7) C-F N/A N/A 0.070 0.020 0.030 0.120 -0.040 0.19** 1.000 0.020 0.170 0.000 (8) C-UK N/A N/A -0.070 -0.050 -0.030 -0.100 0.000 -0.33** -0.12* 1.000 0.050 0.010 (9) C-G N/A N/A -0.100 -0.13* -0.100 -0.15* -0.070 -0.060 -0.42** -0.22** 1.000 0.010 (10) CI 3.49 0.76 -0.100 -0.100 -0.110 -0.13* 0.120 0.19** 0.030 -0.100 -0.070 1.000
Note. Pearson correlation coefficients are below the diagonal, and squared correlations (shared variance) are
above the diagonal; N/A = not applicable; SD refers to standard deviation. AVE of single items is 1. For discriminant validity above-diagonal elements should be smaller than on-diagonal elements.
** Significant at the 0.01 level (two-tailed). * Significant at the 0.05 level (two-tailed). Abbreviations: ROCE: Return on Capital Employed, ROA: Return on Assets, SG: Sales Growth,
EBIT-M: EBIT Margin, SCF: Supply Chain Fit, FS: Firm Size, C-F: Country France, C-UK: Country UK, C-G: German speaking countries, CI: Competition Intensity.

Chapter II: The Bottom Line Impact of Supply Chain Management 62
3.2. Regression model estimation and hypotheses testing
In order to test our developed hypotheses, four linear models were estimated by means of
ordinary least square (OLS) regression models as follows:
H1I: ROCE = α + β1FS + β2F + β3UK + β4G + β5CI + β6SCF + e
H2 I: ROA = α + β1FS + β2F + β3UK + β4G + β5CI + β6SCF + e
H3 I: EBIT Margin = α + β1FS + β2F + β3UK + β4G + β5CI + β6SCF + e
H4 I: Sales Growth = α + β1FS + β2F + β3UK + β4G + β5CI + β6SCF + e
Performance variables were first regressed on control variables and then the independent
variable SCF was entered. The critical assumptions underlying OLS regression analysis were
checked, i.e., (1) the residuals are normally distributed; (2) the residuals are of constant
variance (homoscedasticitiy) over sets of values of the independent construct; and (3)
multicollinearity of the independent construct is within an acceptable range (Cohen et al.,
2003). To this end, the regression model was subjected to a visual residual analysis using
normal Q-Q plots: No obvious outliers were detected and residuals appeared to be
approximately normally distributed. Homoscedasticity was checked using the Breusch-Pagan
test (sum of explained squares = 47.91, LM = 17.95, p = 0.00053) which did not indicate a
serious problem with heteroscedasticity. The bivariate correlations between the independent
variables as well as variance inflation factors (VIF) were within acceptable ranges (i.e.,
bivariate correlation < 0.70 and VIF < 10). The largest VIF was 1.35, thus indicating that
multicollinearity did not pose a serious problem to the regression analysis. In summary, the
conducted tests provided no grounds to assume the inappropriateness of the chosen method.

Chapter II: The Bottom Line Impact of Supply Chain Management 63
All hypotheses (H1I, H2
I, H3I, and H4
I) are supported. Our results indicate that supply
chain fit has a significant positive impact on a firm’s financial success, i.e., on ROCE (β =
0.143; R2 change = 0.020**), on ROA (β = 0.175; R2 change = 0.030***), on Sales Growth
(β = 0.157; R2 change = 0.024**) and on EBIT Margin (β = 0.132; R2 change = 0.017**).
Table 10 reports the results of the regression analysis with standardized parameter estimates.
Table 10: Results of model estimation I (OLS regression) Independent variables Dependent variables
ROCE ROA Sales Growth EBIT Margin Model 1 Model 2 Model 1 Model 2 Model 1 Model 2 Model 1 Model 2
Control variables Firm Size 0.087 0.069 0.042 0.022 -0.105 -0.120* 0.213*** 0.201*** Country France -0.008 0.009 -0.076 -0.057 -0.02 -0.004 0.002 0.017 Country UK -0.079 -0.081 -0.102 -0.103 -0.115 -0.115 -0.079 -0.079 Country Germany -0.123* -0.109 -0.188*** -0.171** -0.143* -0.125* -0.163** -0.149** Competition Intensity
-0.136** -0.149** -0.126** -0.142** -0.112* -0.127** -0.191*** -0.204***
Predictor variable .
Supply Chain Fit 0.143** 0.175*** 0.157** 0.132**
R2 0.038 0.058 0.043 0.073 0.038 0.062 0.103 0.120 R2 change 0.020** 0.030*** 0.024** 0.017** F 1.963* 2.519** 2.218* 3.225*** 1.929* 2.670** 5.713*** 5.613***
Note. Beta refers to standardized OLS regression estimates.
*** Significant at the 0.01 level (one-tailed).
** Significant at the 0.05 level (one-tailed).
* Significant at the 0.1 level (one-tailed).
3.3. Post-hoc analysis
In order to derive additional insight, we conducted a post-hoc analysis to be able to
differentiate between firms with a supply chain fit and firms without a supply chain fit and to
investigate the performance outcomes of both groups. First, the data sample was split into
two groups with respect to supply chain responsiveness. The first group (“fit firms”)
comprised all cases with +/- one standard deviation (0.61) around the arithmetic mean (N =
163). The second group (“misfit firms”) constitutes of the remaining data points (N = 96). In

Chapter II: The Bottom Line Impact of Supply Chain Management 64
a second step, we categorized both groups (fit firms and misfit firms) into functional (N =
200) and innovative product lines (N = 59) by following the classification provided by Fisher
(1997), see Tables 1 and Table 2. Furthermore we double-checked issuing results with the
descriptions of the main product line (“what is the main product line of your firm”), with the
indicated product life-cycle length and “when an updated version or new product (line) will
be implemented”. Finally, an external expert team validated the sample of supply chain fit
firms and their counterparts. An overview is shown in Figure 10.
Figure 10: Overview of fit and misfit firms
Su
pp
ly c
hai
n d
esig
n p
rofi
les
Product profiles
Functionalproduct
Innovativeproduct
Efficientdesign
Responsivedesign
127(Fit)
23(Misfit )
73(Misfit)
36(Fit)
∑ = 150
∑ = 109
∑ ∑ = 259∑ = 200 ∑ = 59
The results are evident: Firms adapting their supply chain to the demand aspects of the
product achieve superior profitability, i.e., up to 100% higher profits. Our results indicate that
their Return on Assets (ROA) is 5 percentage points higher for firms with functional products
and 4 percentage points higher for firms with innovative products compared to those firms
without supply chain fit. Fit firms achieve also with functional products 12 percentage points
higher Return on Capital Employed (ROCE) results, 16 percentage points higher with
innovative products compared to their misfit counterparts. Moreover fit firms outperform

Chapter II: The Bottom Line Impact of Supply Chain Management 65
misfit firms with 4 percentage points higher Sales Growth rates for both product types and
with 4 percentage points higher EBIT Margins for fit firms with functional products and 2
percentage points higher EBIT Margins for fit firms with innovative products. A summary in
presented in Figure 11.
Figure 11: Financial performance of fit firms and misfit counterparts
0%
5%
10%
15%
20%
25%
30%
ROCE ROA Sales Growth EBIT Margin
Functional products
Fit Misfit
0%
5%
10%
15%
20%
25%
30%
ROCE ROA Sales Growth EBIT Margin
Innovative products
Fit Misfit
24%
12%10%
5%
11%
7%
10%
6%
30%
14%
9%
5%
12%
8%10%
8%
Note. Average KPIs (2004-2006) of functional products (N = 200) and innovative
products (N = 59).
Nevertheless, the benefits of supply chain fit have still not yet reached about 37% of firms
with functional products and 39% of firms with innovative products. A cross-country
comparison among major industrial countries shows that firms in the U.S. are well ahead of
Chapter II: The Bottom Line Impact of Supply Chain Management 66
their European counterparts by a 15% higher share of firms with a better understanding of
supply chain fit. Firms headquartered in the U.S. show with 73% the highest share of fit
firms, probably as the development of supply chain management had its origin here and in
contrast to the U.S., Europe is culturally much more fragmented. Hence European firms have
to catch up with only 58% of fit firms on average, among which firms based in the UK are
closest to their U.S. counterparts with 71%.
4. Discussion and implications
Results indicate that supply chain management has a significant bottom line impact on a
firm’s financial success. Firms that achieve a supply chain fit outperform in terms of
profitability in all industries their counterparts, indicating that supply chain fit is a huge
financial leverage factor. True, supply chain fit explains a rather small portion of the variance
in the dependent variable but this is not surprisingly a clear indication that beyond the scope
of the estimated regression model (which represents partial models) there are more factors
that drive financial success. From the perspective of operational management, the benefits of
a fit in the supply chain can hardly be quantified and are oftentimes indispensable: A fit
prevents firms from reputation and credibility damages including further negative
downstream impacts in terms of lead-times, service levels, innovativeness, and quality
patterns.
Firms have to realize that the impact of supply chain management is much bigger than its
impact beyond the “classical” logistics performance indicators, like delivery performance.
Several managerial implications can be deducted from mastering supply chain challenges and
managing the supply chain towards profitability:

Chapter II: The Bottom Line Impact of Supply Chain Management 67
Supply chain management must be anchored in the top management. The financial
potential of supply chain fit makes a strong case for the identification and investigation of the
underlying factors in achieving supply chain fit. Maintaining a supply chain fit affects
revenues, costs and assets. A supply chain fitting the respective demand aspects of the
product will result in perfect order fulfillment, providing goods on time and in full.
Customers can be adequately satisfied at any time and revenues can be increased. A supply
chain fit also affects a firm’s cost base. An optimum production and warehouse footprint in
combination with lean distribution processes keep logistics and supply chain administration
costs at a minimum level assure the required service levels. Therefore, supply chain managers
should make sure that the top management realizes the impact of operational decisions on a
firm’s financial success. As a consequence, supply chain management merits to be anchored
in the top-management of manufacturing firms.
Firms need to understand the demand and the supply chain design aspects of the business
model they are operating. As the degree of supply chain fit determines financial performance,
firms need to assess their products (and competitive strategy) and devise the supply chain
strategy accordingly. The best supply chains are not only fast and cost-effective, but also
agile and adaptable enough to ensure that all of a firms’ interests stay aligned. A common
source of error: in many industries the degree of the diversity of product portfolios has
considerably increased. Firms that used to manufacture few product variants in large-scale
productions, nowadays manufacture numerous variants in increasingly smaller batches. In
many cases however, the supply chain has not been adapted to the changed requirements and
is still tailored towards mass production. The necessary responsiveness is often generated by
a too high level of inventories. Firms with innovative products that do not achieve supply

Chapter II: The Bottom Line Impact of Supply Chain Management 68
chain fit, focus more on physically-efficient supply chain design characteristics. They are too
cost-oriented in their supply chain design with a low focus on responsiveness. Firms need to
realize that a lack of supply chain fit will not only significantly decrease profitability, but it
also gives away the “value of alignment” which might further affect the reliability and
robustness of a supply chain. Therefore, firms need to understand clearly the demand and the
supply chain design aspects of the business model (cost-oriented versus differentiation-
oriented) they are operating.
Supply chain fit is a dynamic concept. Customer preferences are always in a state of flux
and continuously bring up new requirements for delivery lead-times, service and product
demand. Their expectations must be on the watch list of supply chain managers. Firms will
master these challenges successfully when their supply chains can keep up with the alternated
market conditions. Thus a major guiding principle is responsiveness in the supply chain
design tracking and fitting to dynamically alternating demand aspects of the product and
supporting the business model along the product life-cycle. As a consequence, firms need to
continuously adapt their dynamic supply chains. Radical and regular transformations occur
which change the current setting of the firm and as a hence the current supply chain fit. As
the interdependence makes them fall into patterns, new configurations arise. Supply chain
managers need to consider continuously occurring transformations, even the smallest ones,
and adapt the design elements of the supply chain to the new constellations. By doing so, the
consistency between supply chain and product aspects stay aligned and inconsistencies can be
avoided safeguarding supply chain fit. Unfortunately, as indicated, up to 39% of firms do
simply not master transformations in supply chains to an optimal level in terms of physicalyl-
efficiency and market responsiveness and stuck as a result oftentimes in supply chain misfits.

Chapter III: Supply Chain Design Efficiency: Benchmarking Supply Chains in Manufacturing Firms 69
Chapter III Supply Chain Design Efficiency: Benchmarking Supply Chains in Manufacturing Firms
Based on the data gathered in sample I, this chapter investigates using the benchmarking tool
Data Envelopment Analysis (DEA) supply chain design efficiency, an optimal combination of
physically-efficient and market responsive supply chain designs profiles aiming to achieve
high ROCE results.
In Section 1, we present the theoretical background, followed by the methodology
including the psychometric development of the constructs in Section 2. In Section 3, the
statistics analysis as well as the DEA results is provided. A discussion of the ensuing results
as well as managerial implications is presented in Section 4.
1. Theoretical background
In line with the reasoning of configuration theory, we introduce the concept of supply chain
design efficiency of a manufacturing firm. We define supply chain design efficiency as the
optimal configuration in a supply chain between physically-efficient and market responsive
design patterns to increase profitability in terms of ROCE. Following Fine (1998), we
evaluated supply chain designs for their effectiveness in improving ROCE.

Chapter III: Supply Chain Design Efficiency: Benchmarking Supply Chains in Manufacturing Firms 70
1.1. Configurational approach
As we already described in Chapter II, the configurational approach considers holistic
configurations, or gestalts, of design elements (Miles and Snow, 1978). Hence it extends, as
mentioned above, the traditional approach in strategic management research which strictly
divides the concept of strategy between “how strategy is formed” (process) and “which
decisions are taken” (content). In particular for supply chain management, in addition to
content and process, the internal and external environmental context of the organization plays
an important role for decision-making and should therefore be incorporated (Ketchen et al.,
1996). The increased effectiveness is attributed to the internal consistency, or fit, among
strategic, structural, and contextual patterns.
For the purpose of this research, the configurational approach is used as theoretical
support for the underlying assumption that different supply chain design types emerge which
display a common profile, i.e., configuration. Hence, the closer a supply chain design
matches an ideal constellation, the better the financial performance.
1.2. Supply chain design spectrum
Our supply chain design spectrum is rooted in the understanding that supply chains ought to
not only be fast and cost-effective; but they must also be “triple-A” supply chains, i.e., they
must be agile, adaptable, and aligned (Lee, 2004). To build triple-A supply chains and to
generate competitive advantages, the design of supply chains in today’s competitive
environment are one of the most important and difficult challenges faced by managers (Reeve
and Srinivasan, 2005; Tagras and Lee, 1992). A competitive strategy will implicitly, or
explicitly, specify one or more customer segments that a firm hopes to satisfy with its
Chapter III: Supply Chain Design Efficiency: Benchmarking Supply Chains in Manufacturing Firms 71
product(s) and its supply chain design(s). Therefore, there is no “one size fits all” model;
rather, each supply chain is unique in its supply chain design needs.
In stressing the need to distinguish between conflicting supply chain designs, Fisher
(1997) categorized products into functional products, with predictable demand, and
innovative products, with unpredictable demand. Product characteristics vary in terms of
demand predictability, life-cycle length, product variety, service, lead-times and specific
market requirements. With respect to the product supplied through the chain, an effective
supply chain has to be designed. Depending on the underlying product, either a physically-
efficient supply chain, or a market responsive supply chain, is required with respect to its
resource and inventory strategy, as well as the overall objectives.
Having determined the nature of the products and their supply chain priorities, a matrix
for the ideal supply chain strategy can be formulated. Two ideal types (“fit”) can be
identified. The first type is organizations in which functional (standardized) products are
embedded in physically-efficient supply chains with a strong focus on cost minimization,
high inventory turnovers and high average utilization rates. The second type is firms where
innovative (customized) products (which sell often for a single season) are supplied through
market responsive supply chains with extra buffer inventory capacity, high flexibility
requirements and a capability for market processing information. All other types are less
effective (Fisher, 1997) whereas those with functional products and a responsive supply chain
and vice versa, innovative products with a physicalyl-efficient supply chain are regarded as
mismatches (“misfit”). Other supply chain classifications which differentiate for example
between built-to-stock, configure-to-order, build-to-order, and engineered-to-order supply
chains (Reeve and Srinivasan, 2005) can be respectively adapted into Figure 4 which
Chapter III: Supply Chain Design Efficiency: Benchmarking Supply Chains in Manufacturing Firms 72
provides a breakdown of fit and misfit constellations between supply chain design and
demand aspects of a product (product characteristics).
Nowadays however, a mixed (leagile, hybrid) strategy reflects the major stake of supply
chains (Selldin and Olhager, 2007; Goldsby et al., 2006), rather than an “either-or-strategy”
and hence, as described in Chapter I, there are a multiple of ideal supply chain design
constellations along the efficient frontier line, depending on the business model and the
overall competitive strategy.
1.3. Data Envelopment Analysis as a benchmarking tool
Supply chain strategy strikes to achieve an optimal balance between physically-efficiency
(cost effectiveness) and market responsiveness that fits with the competitive strategy of the
manufacturing firm. Balancing physical-efficiency and market responsiveness in supply
chains represents a strategic decision. While some supply chain executives place more
emphasis on physically-efficiency, others focus on market responsiveness. As a consequence,
we need to take this trade-off into account when assessing supply chain designs.
We employ Data Envelopment Analysis (DEA), also referred to as the CCR model, after
Charnes, Cooper, and Rhodes (1978), for benchmarking supply chain designs. DEA has been
frequently used in the supply chain management and marketing literature (e.g., Eggert et al.,
2009; Yu and Lin, 2008; Humphreys et al., 2005; Metters et al., 1999; Schefcyzk, 1993).
DEA lends itself particularly to contexts where researchers assess efficiency by way of
benchmarking managerial actions against a best-in-class standard. In our research, we
compared supply chain designs against a best-in-class benchmark. The enveloped data all
differ with respect to the degree of physically-efficiency and the degree of market
responsiveness in the given supply chain design of a manufacturing firm.
Chapter III: Supply Chain Design Efficiency: Benchmarking Supply Chains in Manufacturing Firms 73
The benchmarking methodology DEA, which measures the relative efficiency of
Decision Making Units (DMU), is based on linear programming. It is a non-parametric
programming approach to frontier estimation which cannot provide absolute efficiencies,
only efficiencies relative to the data considered. The DEA does not require the existence of a
particular function to specify the relationships, or trade-offs, among the performance
measures in the computation of efficiency (Eggert et al., 2009; Wong and Wong, 2007;
Steward, 1996).
DEA identifies peer groups of firms that follow a similar supply chain design
constellation. Data points in the efficient frontier are not dominated by relationships
following the same strategy. These data points form an efficiency frontier together, extended
to both axes. Consequently, those points are considered 100% efficient with regard to the
respective supply chain design. Although they follow different supply chain design strategies,
they are each considered to be best-in-class. All other constellations not situated on the
efficient frontier are not Pareto-optimal. A firm which is not on that efficient frontier line can
improve both its physicalyl-efficiency and its market responsiveness by moving towards the
efficient frontier achieving highest ROCE results (see Figure 12). However, a firm on the
efficient frontier line can improve its responsiveness by increasing costs and becoming less
efficient, unless it succeeds to improve its operations and change technology to shift the
efficient frontier itself. Due to the linear program formulation, the efficiency scores ranges
from 0% to 100%.
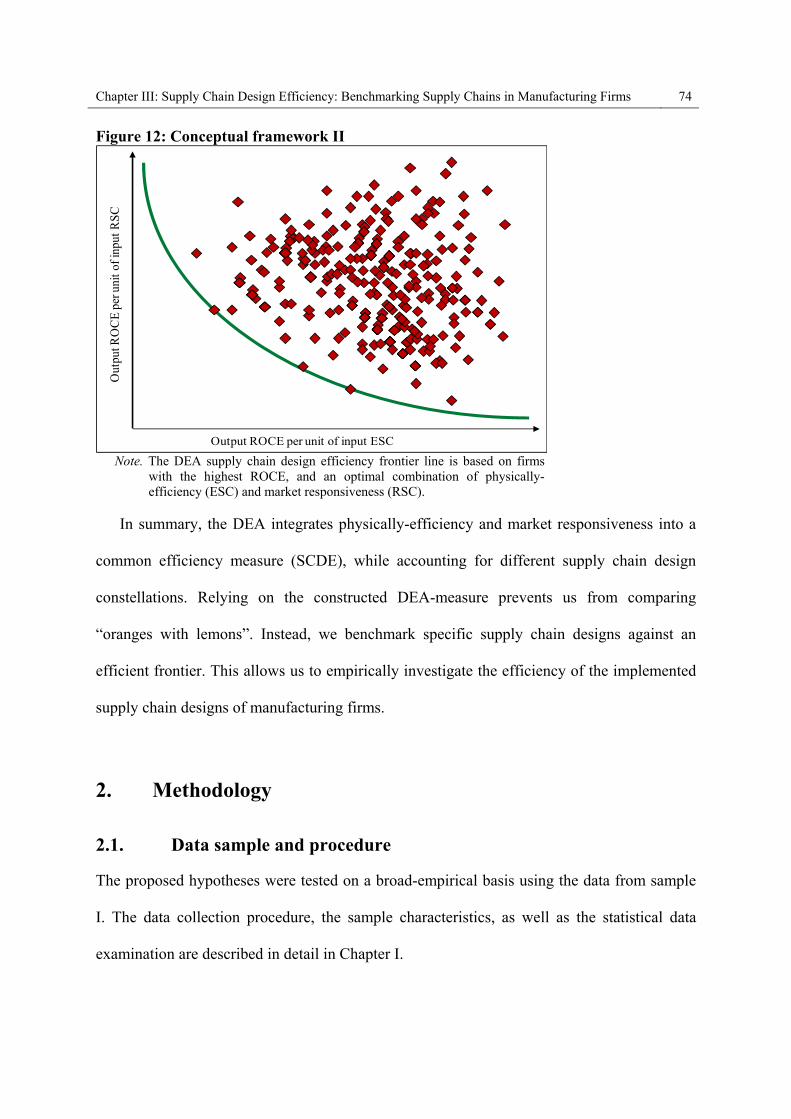
Chapter III: Supply Chain Design Efficiency: Benchmarking Supply Chains in Manufacturing Firms 74
Figure 12: Conceptual framework II
Output ROCE per unit of input ESC
Out
put R
OC
E p
er u
nito
finp
utR
SC
Note. The DEA supply chain design efficiency frontier line is based on firms
with the highest ROCE, and an optimal combination of physically-efficiency (ESC) and market responsiveness (RSC).
In summary, the DEA integrates physically-efficiency and market responsiveness into a
common efficiency measure (SCDE), while accounting for different supply chain design
constellations. Relying on the constructed DEA-measure prevents us from comparing
“oranges with lemons”. Instead, we benchmark specific supply chain designs against an
efficient frontier. This allows us to empirically investigate the efficiency of the implemented
supply chain designs of manufacturing firms.
2. Methodology
2.1. Data sample and procedure
The proposed hypotheses were tested on a broad-empirical basis using the data from sample
I. The data collection procedure, the sample characteristics, as well as the statistical data
examination are described in detail in Chapter I.

Chapter III: Supply Chain Design Efficiency: Benchmarking Supply Chains in Manufacturing Firms 75
2.2. Measures
To generate our constructs and facilitate our analysis, survey respondents were asked to
answer each question using a 5-point Likert scale (1—low, 5—high), based on the
characteristics of their business unit relative to their major competitors and indicate the
strategic supply chain priorities for the main product line illustrating the implemented degree
of supply chain responsiveness. All items were scored (1—not important at all, 5—extremely
important), such that higher scale points reflected increases in the underlying constructs (see
Table 11).
Table 11: Measures of constructs II Constructs and Items (scale 1-5) Mean SD
Efficient Supply Chain (ESC) 3.84 0.82
Please indicate the strategic supply chain priorities for the main product line…
ESC1 Minimize total supply chain costs 4.07 0.96
ESC2 Generate high turns and minimize inventory throughout the supply chain 3.88 0.97
ESC3 Maintain high average utilization rate in the supply chain 3.60 0.96
Responsive Supply Chain (RSC) 3.28 0.67
Please indicate the strategic supply chain priorities for the main product line…
RSC1 Maintain buffer inventory of parts or finished goods 3.34 0.88
RSC2 Retain buffer capacity in manufacturing 3.17 0.92
RSC3 Respond quickly to unpredictable demand 3.56 0.88
RSC4 Increase frequency of new product introductions 3.06 0.87 Note. SD refers to standard deviation.
We relied on existing supply chain management constructs to measure both supply chain
design types, proposed by Selldin and Olhager (2007). Both measures permit us to see, to
what extent firms view both specific supply chain design types as alternatives (mutually
exclusive) or if they regard these as complementary.
The efficient supply chain measure consists of three indicators that capture the degree of
physically-efficiency of the supply chain design: minimal supply chain costs (ESC1), a high
inventory turnover and low inventory stocks (ESC2) as well as a high average utilization rate

Chapter III: Supply Chain Design Efficiency: Benchmarking Supply Chains in Manufacturing Firms 76
(ESC3). Respondents were asked to indicate the strategic supply chain priority of their supply
chain structure which we defined as the primary purpose of the firm in structuring the supply
chain with regards to the needs of the main product line.
The responsive supply chain measure consists of four indicators that capture the degree of
market responsiveness of the supply chain structure: maintain the buffer inventory of parts or
finished goods (RSC1), retain the buffer capacity in manufacturing (RSC2), response quickly
to unpredictable demand (RSC3), and increase frequency of new product introductions
(RSC4). In contexts where demand is volatile and the customer requirement for variety is
high, a much higher level of responsiveness, or agility, is required (Christopher and Towill,
2000).
The ROCE measure is an excellent measure for the returns that a firm is realizing from its
capital employed. The ratio can be seen as representing the efficiency with which capital is
being utilized to generate revenue. It is commonly used as a measure for comparing the
performance between businesses and for assessing whether a business generates enough
returns to pay for its cost of capital. We define ROCE as follows: ROCE = EBIT / Capital
employed. Capital employed is hereby defined as: Net fixed assets + Current assets – Current
liabilities. Assets are not considering goodwill and intangible assets. Note that ROCE should
always be higher than the rate at which the firm borrows; otherwise, any increase in
borrowing will reduce shareholders' earnings. Objective secondary data for our ROCE
calculation were obtained from Bloomberg and Thomson Reuters.
Chapter III: Supply Chain Design Efficiency: Benchmarking Supply Chains in Manufacturing Firms 77
3. Statistical analysis and results
3.1. Reliability and validity
We assessed the reliability and validity of both reflective constructs using a covariance-based
confirmatory factor analysis (CFA) (Bagozzi et al., 1991). As there were no indications of the
presence of multivariate non-normality, the model was estimated with Amos 16.0 using the
maximum likelihood estimation method.
The CFA results, depicted in Table 12, indicate adequate psychometric properties for both
constructs. The Cronbach alpha and average variances extracted (AVE) for all constructs
reach the common cut-off values of 0.70 (Nunnally and Bernstein, 1994) and 0.50 (Bagozzi
and Yi, 1988; Fornell and Larcker, 1981), indicating construct validity. Without exception,
each item loaded on its hypothesized construct with large loadings, significant at the 99%
confidence interval, representing a high level of item validity. This high level of item validity
implies that the items are strongly influenced by the construct they are measuring and
indicates that sets of items used to capture the construct are uni-dimensional.
Overall, the results demonstrate adequate levels of fit for both constructs (Hair et al.,
2006). Chi-square 2/df = 1.290 (2(13) = 16.76; p insignificant at 0.210), CFI (Comparative
Fit Index) = 0.993, NNFI (TLI) (Non-Normed Fit Index, also known as Tucker-Lewis Index)
= 0.988, GFI (Goodness of Fit Index) = 0.982, and the RMSEA (Root Mean Square Error of
Approximation) = 0.034. For the CFI, values above 0.95 indicate a good fit; acceptable
values for NNFI and GFI are above 0.9 and for RMSEA below 0.05 (Hair et al., 2006).

Chapter III: Supply Chain Design Efficiency: Benchmarking Supply Chains in Manufacturing Firms 78
Table 12: Factor analysis results and measurement statistics II Constructs and items (scale 1-5)
Cronbach alpha
Total variance
explained
Commun-alities
Item-to-total
correlation
Composite reliability
AVE Factor loading
t -value
SE IR
Efficient Supply Chain (ESC) 0.814 0.728 0.810 0.587ESC1 0.735 0.670 0.813 -a -b 0.481ESC2 0.751 0.685 0.839 10.693 0.980 0.523ESC3 0.701 0.639 0.808 10.435 0.890 1.000Responsive Supply Chain (RSC) 0.760 0.581 0.834 0.563RSC1 0.565 0.542 0.667 -a -b 0.452RSC2 0.691 0.647 0.780 9.056 0.144 0.619RSC3 0.571 0.548 0.654 7.817 0.128 0.460RSC4 0.499 0.495 0.589 7.171 0.119 1.000
Note. All items were measured on five-point rating scales (Likert-type). SE refers to standard error from the unstandardized solution, AVE refers to average variance extracted, and IR refers to indicator reliability (Fornell and Larcker, 1981).
a t-values are from the unstandardized solution; all are significant at the 0.001 level (two-tailed). b Factor loading was fixed at 1.0 for identification purposes.
The estimates of the CFA model allow us to assess convergent and discriminant validity.
Results of inter-construct correlations, average variances extracted (AVE), and squared
correlations, were within the appropriate ranges. Each construct extracted a variance that is
larger than the highest variance it shares with the other construct, indicating support for the
convergent and discriminant validity of both constructs, as measured by their items (Fornell
and Larcker, 1981). Multicollinearity for our constructs was not a serious hindrance to the
study’s validity, because none of the relevant checks (eigenvalues, variance inflation factor,
or the condition index) suggested multicollinearity (Hair et al., 2006). Nor was there any
evidence of heteroscedasticity detected. Finally, the outlier analysis did not indicate extreme
values. As the dependent variable is based on objective secondary data, the concern regarding
common method bias can be discarded. Inter-construct correlations and AVE are presented in
Table 13.

Chapter III: Supply Chain Design Efficiency: Benchmarking Supply Chains in Manufacturing Firms 79
Table 13: Inter-construct correlations and AVE II Mean SD (1) (2) (3)
(1) ESC 3.84 0.82 0.587 0.024 0.007
(2) RSC 3.28 0.67 -0.156* 0.563 0.002
(3) ROCE 0.20 0.21 0.081 0.045 1.000
Note. Pearson correlation coefficients are below the diagonal, and squared correlations (shared variance) are above the diagonal. SD refers to standard deviation; ESC refers to a physically-efficient supply chain and RSC to a market responsive supply chain design. Average variance extracted (AVE) is on-diagonal. AVE of single items is 1. For discriminant validity above-diagonal elements should be smaller than on-diagonal elements.
* Significant at the 0.05 level (two-tailed).
3.2. Data Envelopment Analysis results
The average supply chain design efficiency obtained in our sample was 46.83%, with a
standard deviation of 15.28%. Supply chain design efficiency scores displayed high levels of
variations. Firms on the efficient frontier line achieved the highest ROCE for their given level
of inputs, i.e., largest ROCE/RSC, largest ROCE/EFC or largest convex combinations of
ROCE/RSC and ROCE/EFC. Only four manufacturing firms, i.e., less than 2% of our
sample, were evaluated as fully efficient (see Table 14). The 25 percentile is 37.18, the 50
percentile is 43.87 and 75 percentile is 53.

Chapter III: Supply Chain Design Efficiency: Benchmarking Supply Chains in Manufacturing Firms 80
Table 14: Results of model estimation II (DEA) DMU Inputs Output Efficiency
# ESC RSC ROCE SCDE
1 4.000 1.250 0.800 1.000 2 3.000 3.000 1.530 1.000 3 1.670 4.750 1.530 1.000 4 4.330 2.500 1.520 1.000 5 4.330 2.750 1.520 0.942 6 2.330 3.750 1.400 0.933 7 4.000 2.250 1.230 0.898 8 3.330 1.250 0.700 0.891
9 3.670 1.500 0.780 0.834
251 4.330 3.750 0.460 0.231 252 4.000 4.000 0.470 0.230 253 3.670 3.750 0.420 0.222 254 4.330 2.250 0.300 0.218 255 4.000 3.000 0.360 0.216 256 4.330 2.750 0.290 0.180 257 3.670 3.500 0.300 0.166 258 3.670 3.750 0.300 0.159 259 2.670 2.750 0.000 0.000
Note. Input variables represent the physically-efficiency and market responsiveness of the underlying supply chain design of the Decision Making Unit (DMU). Output variable is ROCE. Efficiency (DEA results) is shown by the supply chain design efficiency score (SCDE). N = 259.
Results indicate that the majority of the underlying manufacturing firms did not attain an
optimal supply chain design combination of the characteristics from both supply chain design
types while maintaining an excellent ROCE; they reach either higher physically-efficiency
(ESC) elements or higher market responsiveness (RSC), or both, in their supply chain design,
however, at the expense of lower ROCE results. In contrast, firms on the efficient frontier
line achieve an extreme well fit in their supply chain design: Either they have very low
attributes of physically-efficient supply chain design elements (ESC) and high attributes of
market responsive supply chain design elements (RSC), for example data point U198 (ESC is
in average 1.6 and RSC is in average 4.7), or vice versa, i.e., data point U48 (ESC is in
average 4.0 and RSC is in average 1.25) or U238 (ESC is in average 4.3 and RSC is in

Chapter III: Supply Chain Design Efficiency: Benchmarking Supply Chains in Manufacturing Firms 81
average 2.5); or physically-efficient supply chain design elements and market responsive
supply chain design elements are balanced out, for example data point U128 (both ESC and
RSC are in average 3.0). The efficient frontier line SCDE is displayed in Figure 13.
Figure 13: DEA supply chain design efficiency frontier line
Degree of physically-efficient supply chain
Deg
ree
ofm
arke
tre
spon
sive
supp
lych
ain
Note. The DEA supply chain design efficiency frontier line is based on firms
with the highest ROCE, and an optimal combination of physically-efficiency and market responsiveness. The X-axis and Y-axis represent CCR results based on quotients of output to inputs (ROCE/ESC and ROCE/RSC or combinations of both). N = 259.
Our results indicate that the ROCE of a manufacturing firm increases significantly with
higher supply chain design efficiency (SCDE). This is indicated in Figure 14. The top 25%
SCDE firms achieve on average a ROCE of 44.81% compared to the worst 25% SCDE firms
with a ROCE of 2.67%, i.e., a ROCE increase of 15.78.

Chapter III: Supply Chain Design Efficiency: Benchmarking Supply Chains in Manufacturing Firms 82
Figure 14: SCDE and ROCE
Note. SCDE refers to supply chain design efficiency. N = 259.
4. Discussion and implications
Achieving supply chain excellence requires firms to concentrate their resources on what they
do best and on what provides them with the highest ROCE. As mentioned previously, firms
are struggling to improve their supply chain operations, recognizing the increasing
importance of finding the best process and supply chain for their products (Chopra and
Meindl, 2009; Selldin and Olhager, 2007). While the merits of an excellent supply chain
design are straightforward, it was still unknown how well the evidence correlates with actual
performance. Against this background, our research offers several interesting contributions.
First, by adopting the firm’s perspective and drawing upon configuration theory, we
introduced the concept of supply chain design efficiency as a combination of two supply
chain design types: physically-efficiency and market responsiveness. We demonstrated how
supply chain design efficiency may not only be conceptually described, but also empirically

Chapter III: Supply Chain Design Efficiency: Benchmarking Supply Chains in Manufacturing Firms 83
measured. To this end, we introduced DEA as an appropriate methodology to operationalize
the construct (Charnes et al., 1978). Second, our study revealed that supply chain design
efficiency provides an interesting metric for assisting managers in their decision-making
process. Instead of comparing the supply chains of manufacturing across the board, our
approach provides a basis for comparing supply chain designs against their best-in-class
benchmark, i.e., to investigate supply chains within their specific design context. By
calculating an efficiency score between 0% and 100%, our measure allows managers to
evaluate the potential for improvement of any given supply chain design. Finally, results
suggest that many supply chains display a potential for increasing efficiency. The mean score
of supply chain design efficiency was 46.83%, however, less than 2% of the supply chain
designs we investigated were fully efficient. Hence, from a managerial perspective, the
findings suggest that a vast majority of supply chains still offer avenues for further improving
existing supply chain designs, from which several managerial implications can be deduced:
Supply chain design is a strategic weapon. In contrast to products, design and processes
are tough to imitate. Toyota’s production system, which is a supply chain design strategy, has
been known and understood, but it has been a competitive advantage for over two decades for
Toyota (Lee et al., 2005). Competitors have learned about its brilliant strategy, but they have
failed to achieve it. As a result, Toyota’s supply chain design strategy served as an excellent
strategic weapon. Today, the best supply chains are not only physically-efficient (cost-
effective) and market responsive (fast), but also agile and adaptable to ensure that all firms’
interests stay aligned (Lee, 2004). Therefore, firms need to understand which supply chain
designs are required regarding the environment in which they are operating to best meet
supply and demand. A manufacturing firm has multiple strategic choices; it can emphasize

Chapter III: Supply Chain Design Efficiency: Benchmarking Supply Chains in Manufacturing Firms 84
physically-efficiency in the supply chain design, market responsiveness, or seek
improvements in both. The latter improvement is not subject to a trade-off; rather, the
attributes are simultaneously attainable (Selldin and Olhager, 2007). Similar approaches on
how to optimize perceived trade-offs between product ranges and costs, or between
productivity and flexibility, are described by Schmenner and Swink (1998), Grubbströn and
Olhager (1997) or Hayes and Pisano (1996). The product range, or flexibility dimension,
corresponds to the market responsive supply chain, whereas costs or productivity dimensions
correspond to the physically-efficient supply chain. Excellent supply chains are likely to have
attributes that support both strong physically-efficient functions in delivering goods and a
strong market mediation function for conveying information.
Supply chain design is a financial leverage factor. It is impossible to assess profits or
profit growth properly without relating them to the amount of funds (capital) that were
employed in making profits. With strategic decisions on the supply chain design, firms
directly influence the two main drivers for ROCE improvement: the productivity of a firm’s
asset base (asset turn) and the EBIT Margin. On the one hand, as indicated, the degree of
centralization of the manufacturing footprint and logistics network has an impact on the asset
base of a firm, which directly influences ROCE. The inventory management and inventory
allocation of the manufacturing impacts its working capital. On the other hand, an optimized
cost structure for supply chain processes and an optimum logistics service-level will increase
the EBIT Margin. Therefore, supply chain design efficiency is a financial leveraging factor.
The four top supply chains on the efficient frontier line outperform their counterparts by 3.87
higher ROCE results.
Chapter III: Supply Chain Design Efficiency: Benchmarking Supply Chains in Manufacturing Firms 85
Supply chain design is a holistic challenge. Our results indicate that the supply chain
design efficiency is 46.83%. This leaves a vast room for improvement. Benchmarking supply
chain designs enables firms to evaluate the potential of their supply chain. Nevertheless,
supply chain management must incorporate a holistic stance. Manufacturing firms may not
always experience the opportunity or the resources to create an optimal supply chain design
for their products. Oftentimes, firms have to manage within existing supply chain designs or
other upstream/downstream parties that dominate the supply chain. As a result, not all firms
may be capable of designing supply chains of their choice. However, only if supply chains
are designed in an optimally efficient mode, a supply chain design will deliver high financial
performance. Hence, all supply chain parties must optimize their operations from a holistic
stance and design the supply chain using unique patterns fitting the overall competitive
strategy to become leaders in their industries by shedding millions of dollars of inefficiencies
from their supply chains.

Chapter IV: Exploring Sourcing Flexibility, Supply Chain Performance and Product Performance 86
Chapter IV Exploring Sourcing Flexibility, Supply Chain Performance and Product Performance
This chapter presents research that examines the relationship among sourcing flexibility,
supply chain performance and product performance. In Section 1, we develop the conceptual
framework and the hypotheses. In Section 2, we discuss shortly the process of data collection
and detail the measures and control variables used in the survey. In Section 3, reliability and
validity of constructs are examined, followed by a multivariate statistical analysis and a
discussion of the ensuing results in Section 4.
1. Theoretical background and hypotheses
1.1. Sourcing flexibility
As described in research question III, manufacturing firms increasingly outsource many of
their production activities to their suppliers. As a result, the average cost of purchased
materials, components, and services across all manufacturing firms frequently exceeds 60%
to 70% of the total cost of operations (Leenders et al., 2006; Wagner, 2006). In such an
environment, sourcing flexibility, i.e., “the availability of a range of options and the ability of
the purchasing process to effectively exploit them so as to respond to changing requirements
related to the supply of purchased components” (Swafford et al., 2006, p. 174), is central to
the success of firms that face environmental or market uncertainties. Firms can save millions

Chapter IV: Exploring Sourcing Flexibility, Supply Chain Performance and Product Performance 87
of dollars by adapting the responsiveness of their supply chains through sourcing flexibility
to reduce stock-outs and inventory in their supply chains, shorten lead-times, increase quality
of their products, etc. For example, by practicing sourcing flexibility, Zara, the Spanish
fashion retailer, is able to limit its sales at markdown prices to 15%–20% of the total sales,
compared to 30%–40% for its European peers (Cachon and Swinney, 2009; Ghemawat and
Nueno, 2003). As such, sourcing flexibility is one of the fundamental characteristics of an
agile supply chain. However, as important as it is, the link between sourcing flexibility and a
firm’s product and supply chain success has not yet been established.
Research question III is the first attempt to empirically investigate the impact of sourcing
flexibility on supply chain performance and the business performance of the product (which
we call “product performance” in the rest of the paper). Although many studies have captured
the importance of flexibility, in particular manufacturing flexibility (Vokurka and O’Leary-
Kelly, 2000; Koste and Malhotra, 1999; Burgess, 1994; Upton, 1994; Youssef, 1994; Gerwin,
1993; 1987; Slack, 1987; 1983), far less attention has been given to sourcing flexibility
(Swafford et al., 2006; Sharifi and Zhang, 1999; Goldman et al., 1994). In the literature on
flexibility and uncertainty, the notion “the greater the flexibility, the better the performance”
(Swamidass and Newell, 1987, p. 512) often stems from intuitive expectations. Nevertheless,
prior studies have been unable to find conclusive results on the link between various building
blocks of supply chain flexibility and performance (Fantazy et al., 2009; Pagell and Krause,
2004). As such, More and Babu (2008, p. 40) state that, in the literature, “the empirical
justification of the benefits of implementing flexible supply chains is rare and in-depth
empirical studies are lacking.”
Chapter IV: Exploring Sourcing Flexibility, Supply Chain Performance and Product Performance 88
In response to this call, we perform a survey-based empirical study of the impact of
sourcing flexibility on supply chain and product performance. Sourcing flexibility must
match a buyer’s requirements with respect to product quantities, product mix, delivery
schedules, etc., and must ultimately support a firm’s supply chain strategy (Yazlali and
Erhun, 2007; Childerhouse et al., 2002; Christopher and Towill, 2001; Li and O’Brien, 2001;
Fisher, 1997). A commonly accepted principle for product–supply chain match states that
standardized (functional) products with stable demands should be supplied by a physically-
efficient supply chain, while customized (innovative) products with stochastic demands in
uncertain environments and markets should be supplied by a market responsive or agile
supply chain (Lee, 2002; Christopher and Towill, 2000; Fisher, 1997). While supply chain
agility has many diverse components, we focus on sourcing flexibility. In this context, the
composition of a firm’s supplier portfolio is essential to achieving the sourcing flexibility that
is desirable in terms of physically-efficiency (cost) and market responsiveness (agility). A
high degree of sourcing flexibility in the supply chain enables greater supply chain agility.
However, sourcing flexibility comes at a cost and therefore does not automatically result in
higher profitability due to increased responsiveness. This trade-off needs to be investigated in
order to reach definitive conclusions concerning the relationship between sourcing flexibility
and performance.
1.2. Conceptual framework
To explore this relationship, we develop a conceptual framework, displayed in Figure 15. For
the effective management of buyer-supplier relationships, firms need to choose the
appropriate level of cooperation (from arm’s length to coordinated relationships) and adapt
suitable management practices (Bensaou, 1999; Lambert et al., 1996; Anderson and Narus,
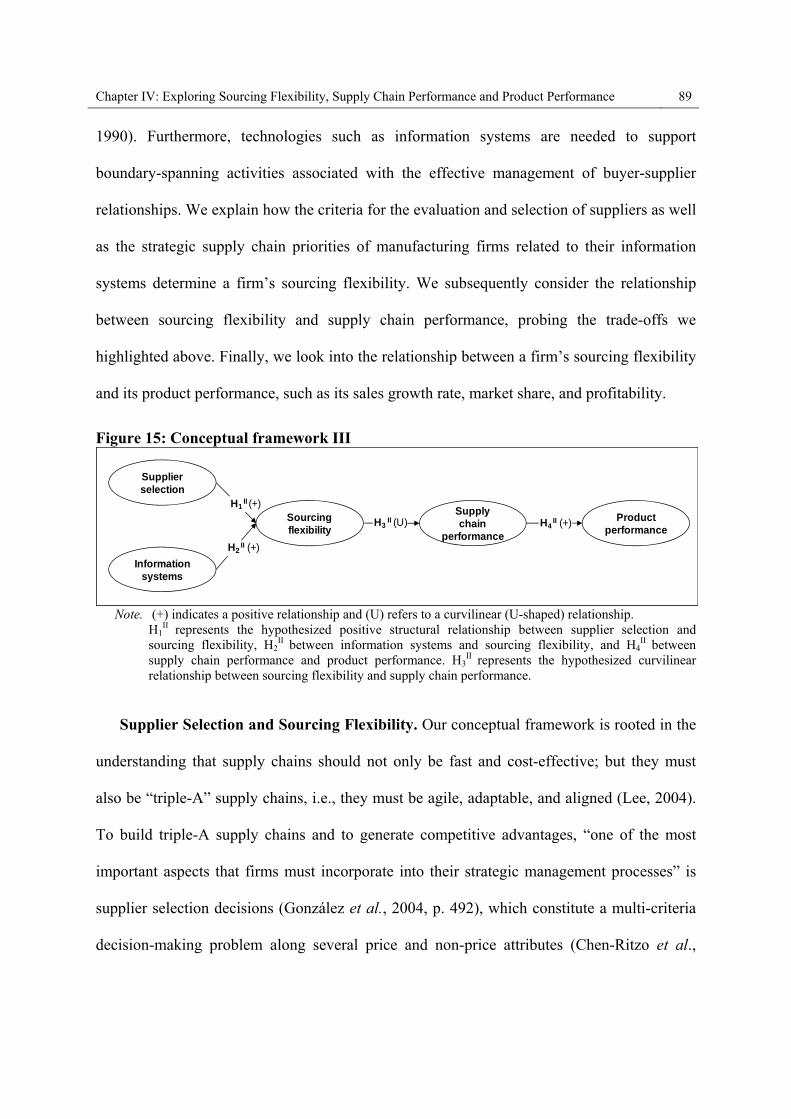
Chapter IV: Exploring Sourcing Flexibility, Supply Chain Performance and Product Performance 89
1990). Furthermore, technologies such as information systems are needed to support
boundary-spanning activities associated with the effective management of buyer-supplier
relationships. We explain how the criteria for the evaluation and selection of suppliers as well
as the strategic supply chain priorities of manufacturing firms related to their information
systems determine a firm’s sourcing flexibility. We subsequently consider the relationship
between sourcing flexibility and supply chain performance, probing the trade-offs we
highlighted above. Finally, we look into the relationship between a firm’s sourcing flexibility
and its product performance, such as its sales growth rate, market share, and profitability.
Figure 15: Conceptual framework III
Supplier selection
Supply chain
performance
Product performance
Information systems
Sourcing flexibility
H1 II (+)
H2 II (+)
H3II (U) H4
II (+)
Note. (+) indicates a positive relationship and (U) refers to a curvilinear (U-shaped) relationship.
H1II
represents the hypothesized positive structural relationship between supplier selection and sourcing flexibility, H2
II between information systems and sourcing flexibility, and H4
II between
supply chain performance and product performance. H3II
represents the hypothesized curvilinear relationship between sourcing flexibility and supply chain performance.
Supplier Selection and Sourcing Flexibility. Our conceptual framework is rooted in the
understanding that supply chains should not only be fast and cost-effective; but they must
also be “triple-A” supply chains, i.e., they must be agile, adaptable, and aligned (Lee, 2004).
To build triple-A supply chains and to generate competitive advantages, “one of the most
important aspects that firms must incorporate into their strategic management processes” is
supplier selection decisions (González et al., 2004, p. 492), which constitute a multi-criteria
decision-making problem along several price and non-price attributes (Chen-Ritzo et al.,
Chapter IV: Exploring Sourcing Flexibility, Supply Chain Performance and Product Performance 90
2005; Ghodsypour and O’Brien, 1998). Our first hypothesis posits that supplier selection
positively impacts agility:
Hypothesis H1II: Supplier selection is positively associated with sourcing
flexibility.
Information Systems and Sourcing Flexibility. The integration of information systems
across organizational boundaries at multiple process and functional levels can allow firms to
increase flexibility and reduce costs (Hill and Scudder, 2002; Frohlich and Westbrook, 2001;
Holland and Lockett, 1997). For example, increased visibility through point-of-sales data can
help suppliers to predict demand. As such, the availability of precise and timely information
can help firms align production schedules with actual usage rather than sales or shipments.
On one hand, this alignment of information provides comparative efficiency through lower
inventory and coordination costs, and shorter, more reliable response times (Dai and
Kauffman, 2002; Clemons et al., 1993). On the other hand, information systems can enable
firms to establish one-to-many linkages and to enhance sourcing leverage by altering search-
related costs (Choudhury, 1997; Bakos and Brynjolfsson, 1993). Both are key in enabling a
firm to act and react quickly and more efficiently, and thus decrease demand distortion,
reduce lead-times, and increase sourcing flexibility (Lee et al., 1997). A suitable information
system is therefore not only necessary to ensure smooth flows of materials along the value
chain, but the corresponding strong information links with suppliers in the firm’s portfolio
improve sourcing flexibility. Therefore, we hypothesize:
Hypothesis H2II: Information systems are positively associated with sourcing
flexibility.

Chapter IV: Exploring Sourcing Flexibility, Supply Chain Performance and Product Performance 91
Sourcing Flexibility and Supply Chain Performance. Supply chain performance is a
result of the supply chain’s ability to respond quickly and effectively to a changing
marketplace (Chopra and Meindl, 2009). The effects of demand variability can be mitigated
either by increasing capacity or increasing the (sourcing) flexibility of available capacity
(Iravani et al., 2005). We investigate how sourcing flexibility affects supply chain
performance. Sourcing flexibility improves an organization’s responsiveness and customer
satisfaction by enabling the procurement managers to adapt the product mix, product
quantities, delivery schedules, etc. to short-term requirements for the manufacturing
operations or from outside customers (Narasimhan et al., 2001). However, extant research
posits that the relationship between supply chain flexibility and performance is not linear
(Tang and Tomlin, 2008). Firms tend to emphasize sourcing flexibility to best meet customer
requirements in environments with high uncertainty. In contrast, firms operating in
predictable environments might exercise less sourcing flexibility to minimize total costs.
Firms in both situations can achieve high supply performance. Therefore, we hypothesize:
Hypothesis H3II: Sourcing flexibility has a curvilinear (U-shaped) relationship
with supply chain performance
Supply Chain Performance and Product Performance. The better the supply chain
performance, the better the involved products will penetrate the market. We therefore posit
that supply chain performance positively affects product performance in terms of sales
growth, market share, and profitability. Thus, we hypothesize that:
Hypothesis H4 II: Supply chain performance is positively associated with product
performance.
Chapter IV: Exploring Sourcing Flexibility, Supply Chain Performance and Product Performance 92
To test these hypotheses, which form the backbone of our conceptual framework, we
contacted executives in manufacturing firms in the U.S. and Europe via a survey.
2. Methodology
2.1. Data sample and procedure
The proposed hypotheses were tested on a broad-empirical basis using the data from sample
II. The data collection procedure, the sample characteristics, as well as the statistical data
examination including non-response bias concerns are described in detail in Chapter I.
2.2. Measures
To generate our constructs and facilitate our analysis, we employ six measures: supplier
selection, information systems, sourcing flexibility, supply chain performance, product
performance as well as the control variable competition intensity (see Table 15).
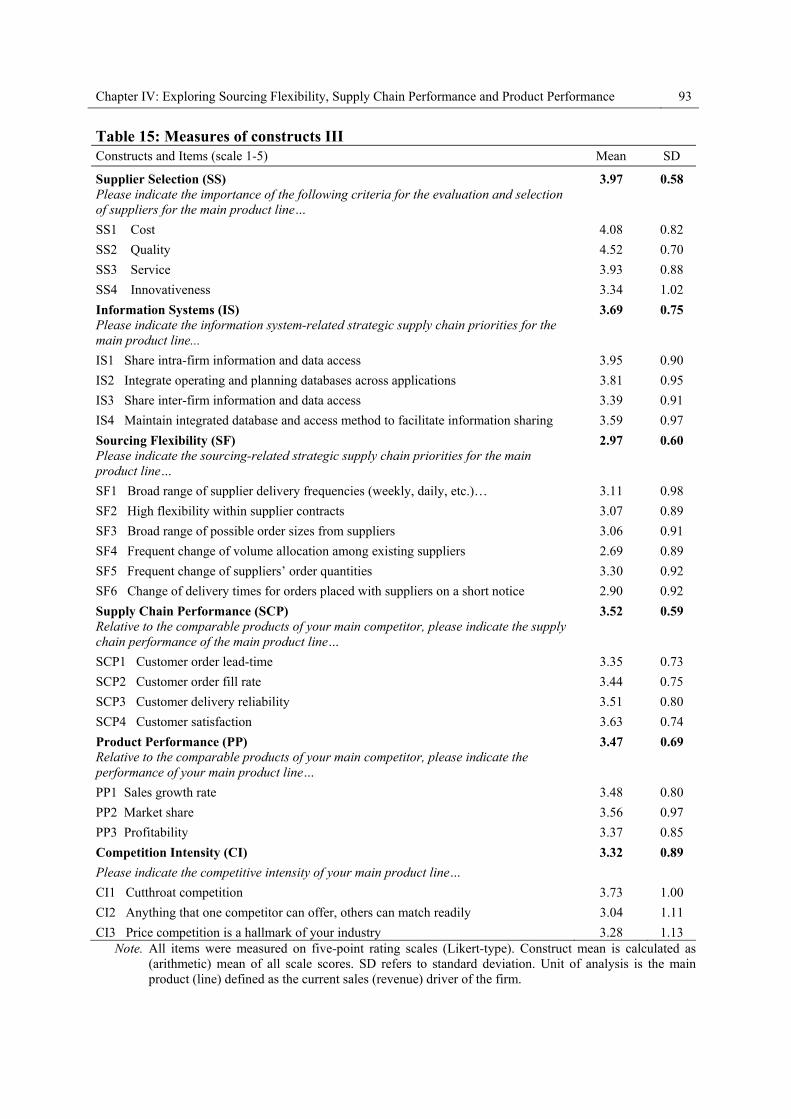
Chapter IV: Exploring Sourcing Flexibility, Supply Chain Performance and Product Performance 93
Table 15: Measures of constructs III Constructs and Items (scale 1-5) Mean SD
Supplier Selection (SS) 3.97 0.58 Please indicate the importance of the following criteria for the evaluation and selection of suppliers for the main product line…
SS1 Cost 4.08 0.82
SS2 Quality 4.52 0.70
SS3 Service 3.93 0.88
SS4 Innovativeness 3.34 1.02
Information Systems (IS) 3.69 0.75 Please indicate the information system-related strategic supply chain priorities for the main product line...
IS1 Share intra-firm information and data access 3.95 0.90
IS2 Integrate operating and planning databases across applications 3.81 0.95
IS3 Share inter-firm information and data access 3.39 0.91
IS4 Maintain integrated database and access method to facilitate information sharing 3.59 0.97
Sourcing Flexibility (SF) 2.97 0.60 Please indicate the sourcing-related strategic supply chain priorities for the main product line…
SF1 Broad range of supplier delivery frequencies (weekly, daily, etc.)… 3.11 0.98
SF2 High flexibility within supplier contracts 3.07 0.89
SF3 Broad range of possible order sizes from suppliers 3.06 0.91
SF4 Frequent change of volume allocation among existing suppliers 2.69 0.89
SF5 Frequent change of suppliers’ order quantities 3.30 0.92
SF6 Change of delivery times for orders placed with suppliers on a short notice 2.90 0.92
Supply Chain Performance (SCP) 3.52 0.59 Relative to the comparable products of your main competitor, please indicate the supply chain performance of the main product line…
SCP1 Customer order lead-time 3.35 0.73
SCP2 Customer order fill rate 3.44 0.75
SCP3 Customer delivery reliability 3.51 0.80
SCP4 Customer satisfaction 3.63 0.74
Product Performance (PP) 3.47 0.69 Relative to the comparable products of your main competitor, please indicate the performance of your main product line…
PP1 Sales growth rate 3.48 0.80
PP2 Market share 3.56 0.97
PP3 Profitability 3.37 0.85
Competition Intensity (CI) 3.32 0.89
Please indicate the competitive intensity of your main product line…
CI1 Cutthroat competition 3.73 1.00
CI2 Anything that one competitor can offer, others can match readily 3.04 1.11
CI3 Price competition is a hallmark of your industry 3.28 1.13 Note. All items were measured on five-point rating scales (Likert-type). Construct mean is calculated as
(arithmetic) mean of all scale scores. SD refers to standard deviation. Unit of analysis is the main product (line) defined as the current sales (revenue) driver of the firm.

Chapter IV: Exploring Sourcing Flexibility, Supply Chain Performance and Product Performance 94
The selection of suppliers is a multi-criteria decision-making problem along several price
and non-price attributes (Wagner and Friedl, 2007; Chen-Ritzo et al., 2005; Ghodsypour and
O’Brien, 1998). It is impossible to list all the criteria that are applicable during the selection
process; many of these criteria cannot even easily be quantified. However, some key
indicators, such as cost, quality, service, and innovativeness, help buyers configure their
supplier base to achieve the desired sourcing flexibility.
The supplier selection measure consists of these four items. The primary purpose of
efficient firms is to supply at the lowest possible cost (Fisher, 1997). Thus, the supplier’s
price (i.e., the cost for the buyer) is a critical criterion for supplier selection. The quality of
the products is of utmost importance in building strategic buyer-supplier partnerships (Hsu et
al., 2006; Kannan and Tan, 2002; Ellram, 1990) and in satisfying buyer requirements. The
service the supplier provides in terms of delivery reliability, quantity, lead-times, flexibility,
and speed to cover the firm’s total requirements is yet another factor in supplier selection.
Finally, innovativeness increasingly becomes a key capability of suppliers. No firm can
develop all important new technologies in-house, and firms need to manage their suppliers so
as to ensure vital technology transfers (Ulrich and Ellison, 2005).
The information systems measure captures the extent to which the information systems of
an organization are integrated, enabling a firm to enhance efficiencies of boundary-spanning
activities. Communication frequency, intensity, and coordination through information
systems build stronger buyer-supplier partnerships, increase channel effectiveness and
efficiency, and ensure that there are no information delays (Anand and Goyal, 2009; Croson
and Donohue, 2003; Mohr and Nevin, 1990). Information systems enable each channel entity
to be informed immediately by providing accurate, thorough, and timely information about
Chapter IV: Exploring Sourcing Flexibility, Supply Chain Performance and Product Performance 95
current and expected conditions. In our survey, we applied the scale used by Rodrigues,
Stank, and Lynch (2004) and considered four items to create the information systems
construct (i.e., whether the firms share intra-firm information and data access; integrate
operating and planning databases across applications; share inter-firm information and data
access; and maintain integrated database and access method to facilitate information sharing).
The sourcing flexibility measure represents the available options for ensuring material
availability to support changing manufacturing needs (range) and reflects the ease with which
the firm can exercise these options (adaptability) (Koste and Malhotra, 1999; Upton, 1994).
First, the options can be described as the extent to which a firm can influence or benefit from
the supplier’s available capacity as well as short and/or variable supplier lead-times. Second,
sourcing flexibility covers the extent to which a firm can tap into suppliers’ ability to deal
with volume requirements, changes in part specifications, and the quantity and timing of
orders in response to the uncertainty in material requirements. We incorporated these factors
into our survey with six questions (on delivery frequency, contract, order size, and volume
allocation flexibility, and flexibility in changing order quantities and delivery times); we
adapted Swafford, Gosh, and Murthy (2006) as well as Narasimhan and Das (1999) to create
the sourcing flexibility construct.
The supply chain performance measure, which we adapted from Beamon (1999) and
Rodrigues, Stank, and Lynch (2004), concerns the extended supply chain’s activities in
meeting end-customer requirements, expressed in customer satisfaction, product availability,
on-time delivery, and inventory and capacity in the supply chain needed to deliver that
performance. Finally, the product performance measure captures the product’s performance
Chapter IV: Exploring Sourcing Flexibility, Supply Chain Performance and Product Performance 96
relative to the main competitor in terms of growth, market share, and profitability (Joshi and
Sharna, 2004).
To eliminate undesirable sources of variance, we included control variables that may
influence and confound the relationships of the key variables in our model. First, firm size is
an important structural variable. Larger firms might have more market penetration power
than smaller ones and thus might be more profitable. Smaller firms, in contrast, might be
more innovative, and therefore more profitable. Firm size was measured by a single item
asking respondents for the number of employees at their firm; this was double-checked
against secondary data. Second, competitive intensity, the extent to which a firm perceives its
competition to be intense and the extent to which it competes to retain its market share, is
another important structural variable with potential impact on profitability. It was captured by
four items asking respondents for the intensity of rivalry among firms in the industry. We
employed the scale used by Jaworski and Kohli (1993). Third, we eliminated country effects.
Economic, political, and cultural differences influence the strategic and operational
possibilities of firms and therefore might influence profitability. Following the procedure
suggested by Cohen, Cohen, West, and Aiken (2003, pp. 303-307), the responses from the
UK were coded as the variable “Country UK”, responses from France were coded as the
variable “Country France”, and responses from the German-speaking countries were coded as
the variable “Country Germany”. Finally, responses from the U.S. were used as the baseline.
Chapter IV: Exploring Sourcing Flexibility, Supply Chain Performance and Product Performance 97
3. Statistical analysis and results
3.1. Reliability and validity
Before testing our core hypotheses, we first assessed the reliability and validity of the
reflective constructs and the underlying items, followed by the assessment of the structural
relationships, i.e., the relationships among the constructs. This ensures reliable and valid
measures of constructs before attempting to draw conclusions about the nature of the
construct relationships (Anderson and Gerbing, 1988). Our model consists of five reflective
constructs (information systems, sourcing flexibility, supply chain performance, product
performance, and competitive intensity) and one formative construct (supplier selection). The
formative construct for supplier selection is appropriate because the performance and
capabilities of a supplier in terms of cost, quality, service, and innovativeness result in an
index that supports the buyer’s supplier selection decision based on various dimensions that
do not necessarily show strong mutual correlations.
Reflective and formative constructs must be validated separately (Diamantopoulos and
Siguaw, 2006; Diamantopoulos and Winklhofer, 2001; Hulland, 1999; Chin, 1998; Fornell
and Cha, 1994). We assessed the reliability and validity of the reflective constructs using
confirmatory factor analysis (CFA) (Bagozzi et al., 1991). All constructs, including the
control variable (competitive intensity), were included in one five-factor CFA model. As
there were no indications of the presence of multivariate non-normality, the model was
estimated with Amos 16.0 using the maximum likelihood estimation method (see Table 16).
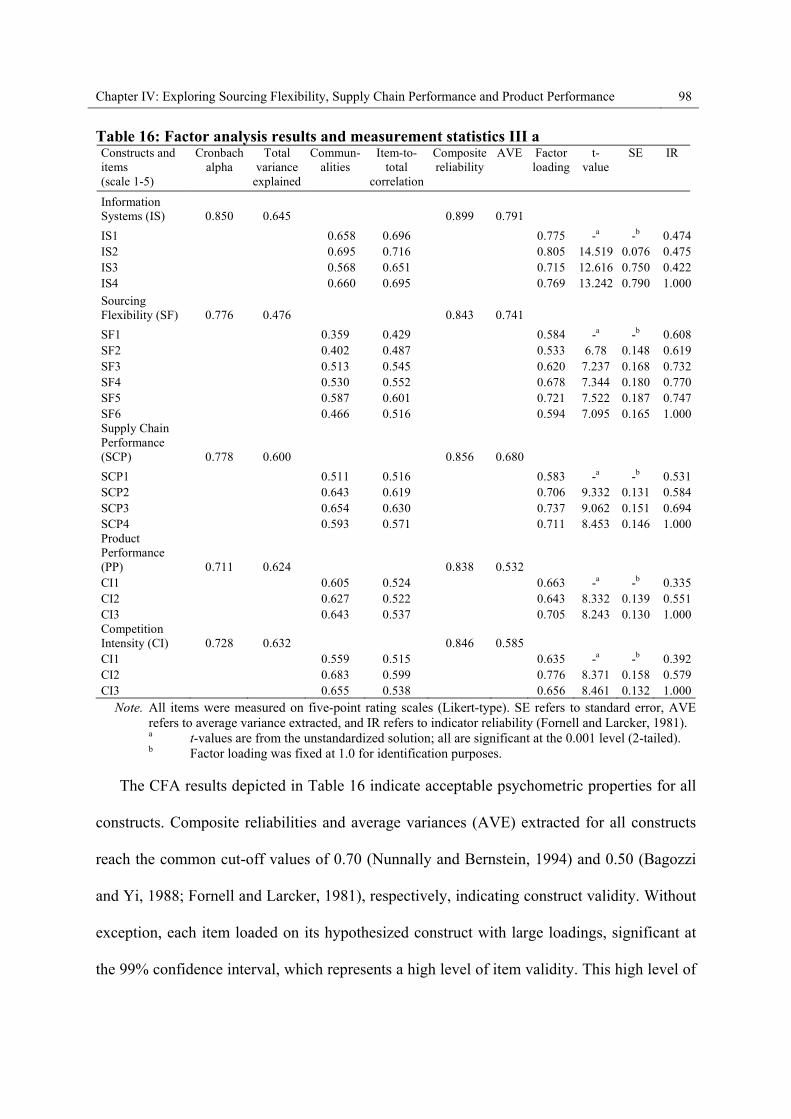
Chapter IV: Exploring Sourcing Flexibility, Supply Chain Performance and Product Performance 98
Table 16: Factor analysis results and measurement statistics III a Constructs and items (scale 1-5)
Cronbach alpha
Total variance
explained
Commun-alities
Item-to-total
correlation
Composite reliability
AVE Factor loading
t-value
SE IR
Information Systems (IS) 0.850 0.645 0.899 0.791
IS1 0.658 0.696 0.775 -a -b 0.474IS2 0.695 0.716 0.805 14.519 0.076 0.475IS3 0.568 0.651 0.715 12.616 0.750 0.422IS4 0.660 0.695 0.769 13.242 0.790 1.000
Sourcing Flexibility (SF) 0.776 0.476 0.843 0.741
SF1 0.359 0.429 0.584 -a -b 0.608SF2 0.402 0.487 0.533 6.78 0.148 0.619SF3 0.513 0.545 0.620 7.237 0.168 0.732SF4 0.530 0.552 0.678 7.344 0.180 0.770SF5 0.587 0.601 0.721 7.522 0.187 0.747SF6 0.466 0.516 0.594 7.095 0.165 1.000Supply Chain Performance (SCP) 0.778 0.600 0.856 0.680
SCP1 0.511 0.516 0.583 -a -b 0.531SCP2 0.643 0.619 0.706 9.332 0.131 0.584SCP3 0.654 0.630 0.737 9.062 0.151 0.694SCP4 0.593 0.571 0.711 8.453 0.146 1.000Product Performance (PP) 0.711 0.624 0.838 0.532CI1 0.605 0.524 0.663 -a -b 0.335CI2 0.627 0.522 0.643 8.332 0.139 0.551CI3 0.643 0.537 0.705 8.243 0.130 1.000Competition Intensity (CI) 0.728 0.632 0.846 0.585CI1 0.559 0.515 0.635 -a -b 0.392CI2 0.683 0.599 0.776 8.371 0.158 0.579CI3 0.655 0.538 0.656 8.461 0.132 1.000
Note. All items were measured on five-point rating scales (Likert-type). SE refers to standard error, AVE refers to average variance extracted, and IR refers to indicator reliability (Fornell and Larcker, 1981).
a t-values are from the unstandardized solution; all are significant at the 0.001 level (2-tailed). b Factor loading was fixed at 1.0 for identification purposes. The CFA results depicted in Table 16 indicate acceptable psychometric properties for all
constructs. Composite reliabilities and average variances (AVE) extracted for all constructs
reach the common cut-off values of 0.70 (Nunnally and Bernstein, 1994) and 0.50 (Bagozzi
and Yi, 1988; Fornell and Larcker, 1981), respectively, indicating construct validity. Without
exception, each item loaded on its hypothesized construct with large loadings, significant at
the 99% confidence interval, which represents a high level of item validity. This high level of
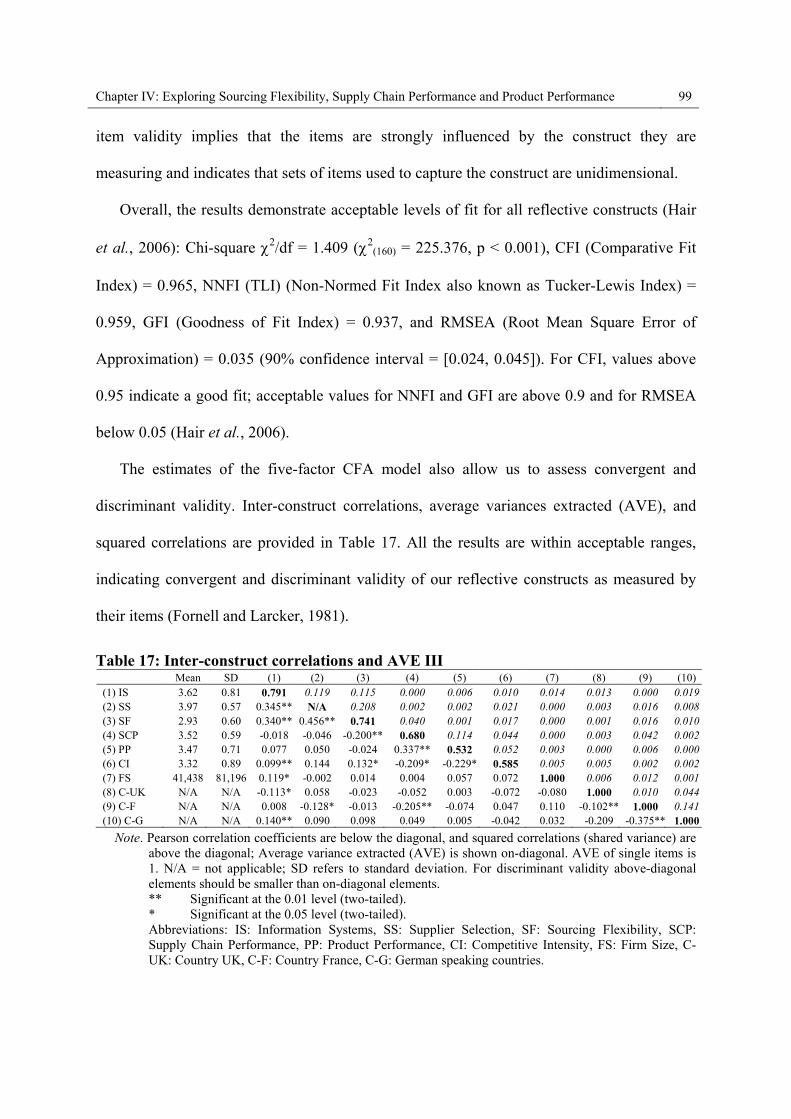
Chapter IV: Exploring Sourcing Flexibility, Supply Chain Performance and Product Performance 99
item validity implies that the items are strongly influenced by the construct they are
measuring and indicates that sets of items used to capture the construct are unidimensional.
Overall, the results demonstrate acceptable levels of fit for all reflective constructs (Hair
et al., 2006): Chi-square 2/df = 1.409 (2(160) = 225.376, p < 0.001), CFI (Comparative Fit
Index) = 0.965, NNFI (TLI) (Non-Normed Fit Index also known as Tucker-Lewis Index) =
0.959, GFI (Goodness of Fit Index) = 0.937, and RMSEA (Root Mean Square Error of
Approximation) = 0.035 (90% confidence interval = [0.024, 0.045]). For CFI, values above
0.95 indicate a good fit; acceptable values for NNFI and GFI are above 0.9 and for RMSEA
below 0.05 (Hair et al., 2006).
The estimates of the five-factor CFA model also allow us to assess convergent and
discriminant validity. Inter-construct correlations, average variances extracted (AVE), and
squared correlations are provided in Table 17. All the results are within acceptable ranges,
indicating convergent and discriminant validity of our reflective constructs as measured by
their items (Fornell and Larcker, 1981).
Table 17: Inter-construct correlations and AVE III Mean SD (1) (2) (3) (4) (5) (6) (7) (8) (9) (10)
(1) IS 3.62 0.81 0.791 0.119 0.115 0.000 0.006 0.010 0.014 0.013 0.000 0.019(2) SS 3.97 0.57 0.345** N/A 0.208 0.002 0.002 0.021 0.000 0.003 0.016 0.008(3) SF 2.93 0.60 0.340** 0.456** 0.741 0.040 0.001 0.017 0.000 0.001 0.016 0.010(4) SCP 3.52 0.59 -0.018 -0.046 -0.200** 0.680 0.114 0.044 0.000 0.003 0.042 0.002(5) PP 3.47 0.71 0.077 0.050 -0.024 0.337** 0.532 0.052 0.003 0.000 0.006 0.000(6) CI 3.32 0.89 0.099** 0.144 0.132* -0.209* -0.229* 0.585 0.005 0.005 0.002 0.002(7) FS 41,438 81,196 0.119* -0.002 0.014 0.004 0.057 0.072 1.000 0.006 0.012 0.001(8) C-UK N/A N/A -0.113* 0.058 -0.023 -0.052 0.003 -0.072 -0.080 1.000 0.010 0.044(9) C-F N/A N/A 0.008 -0.128* -0.013 -0.205** -0.074 0.047 0.110 -0.102** 1.000 0.141(10) C-G N/A N/A 0.140** 0.090 0.098 0.049 0.005 -0.042 0.032 -0.209 -0.375** 1.000
Note. Pearson correlation coefficients are below the diagonal, and squared correlations (shared variance) are above the diagonal; Average variance extracted (AVE) is shown on-diagonal. AVE of single items is 1. N/A = not applicable; SD refers to standard deviation. For discriminant validity above-diagonal elements should be smaller than on-diagonal elements.
** Significant at the 0.01 level (two-tailed). * Significant at the 0.05 level (two-tailed). Abbreviations: IS: Information Systems, SS: Supplier Selection, SF: Sourcing Flexibility, SCP:
Supply Chain Performance, PP: Product Performance, CI: Competitive Intensity, FS: Firm Size, C-UK: Country UK, C-F: Country France, C-G: German speaking countries.

Chapter IV: Exploring Sourcing Flexibility, Supply Chain Performance and Product Performance 100
As opposed to items measuring reflective constructs that should be highly correlated,
there are no expectations on items in formative constructs; they can have positive, negative,
or zero correlations (Bollen and Lennox, 1991). Therefore, the traditional measures of item
and factor reliability assumption of unidimensionality does not apply (Chin, 1998). A
statistical way to circumvent this problem is to use the latent variable partial least square
(PLS) estimation method to derive “optimal factor weights” for the formative measurement
model (see Table 18). Except for the t-statistics for service indicator (SS3), all test results are
within acceptable limits. In order not to compromise on the generality of our modeling
(including measurement approach), we retain the SS3 even though it does not contribute
substantially to the measurement of supplier selection.
Table 18: Factor analysis results and measurement statistics III b Construct and items (scale 1-5)
Number of items
Factor weights
t-values VIF Condition index
Supplier Selection (SS) 4
SS1 Cost 0.762 9.653 1.070 8.477
SS2 Quality 0.272 2.305 1.379 12.030
SS3 Service -0.012 0.142 1.407 16.053
SS4 Innovativeness 0.405 3.463 1.166 21.670
Note. All items were measured on five-point rating scales (Likert-type). Absolute t-values are shown. VIF refers to variance inflation factor.
Multicollinearity for our constructs was not a serious hindrance to the study’s validity
because none of the relevant checks (eigenvalues, variance inflation factor, condition index)
suggested multicollinearity (Hair et al., 2006). Nor was any evidence of heteroscedasticity
detected. Finally, outlier analysis did not indicate extreme values.
To examine the potential for common method bias, Harman’s one-factor test was applied
(Podsakoff et al., 2003). All 20 items in reflective constructs used in the measurement models
were subjected to a principal component factor analysis using the Kaiser-criterion which
yielded, as hypothesized, five factors with the first factor accounting for a proportion of

Chapter IV: Exploring Sourcing Flexibility, Supply Chain Performance and Product Performance 101
20.4% of the cumulative variance explained by the five factors (60%). This is substantially
below the threshold of 50% proposed by Podsakoff and Organ (1986), thus suggesting the
absence of a significant common method bias effect.
3.2. Structural model estimation and hypotheses testing
We analyzed the hypothesized positive structural relationships between supplier selection and
sourcing flexibility H1II, information systems and sourcing flexibility H2
II, and supply chain
performance and product performance H4II; and the hypothesized curvilinear relationship H3
II
between sourcing flexibility and supply chain performance. In this section, we provide the
details of our analysis; Table 19 summarizes the results of the hypotheses tests that we
performed.
Table 19: Results of model estimation III a (SEM) Hypothesized relationship Independent variables Dependent variables
Beta t-value f2 R2 Support of hypothesis
Supplier Selection Sourcing Flexibility 0.378*** 7.425 0.141 0.227 H1II: yes
Information Systems Sourcing Flexibility 0.188*** 3.641 0.180 0.138 H2II: yes
(Sourcing Flexibility)2 Supply Chain Performance 0.433*** 8.667 0.060 0.268 H3
II: yesSupply Chain Performance
Product Performance 0.325*** 6.485 0.022 0.127 H4
II: yesNote. Beta refers to standardized OLS regression estimates. Absolute t-values are shown. f2 refers to effect
size.
*** Significant at the 0.01 level (one-tailed).
To test H1II, H2
II, and H4II, we used variance-based PLS structural equation modeling
because it allows for the inclusion of reflective and formative constructs (Lohnmöller, 1989;
Wold, 1980). Furthermore, in contrast to commonly employed covariance-based structural
equation modeling, in the variance-based structural equation modeling, the independent
variables are approximated as exact linear combinations of dependent variables, which
provides an exact definition of the component scores, avoids the indeterminacy problem, and

Chapter IV: Exploring Sourcing Flexibility, Supply Chain Performance and Product Performance 102
precludes parameter identification problems (Bollen and Lennox, 1991; Fornell and
Bookstein, 1982). However, with the variance-based structural equation modeling (whose
objective is prediction), no overall fit indices can be reported; a price should be paid for the
inclusion of reflective and formative constructs.
The primary objective of PLS analysis is the minimization of error which is equivalent to
the maximization of variance explained in all endogenous constructs. The degree to which
any particular PLS model accomplishes this objective can be determined by examining the
variance explained (R2) values for the dependent (endogenous) constructs. With the effect
size f2 and the change in R2, we evaluated whether the impact of a particular independent
latent variable on a dependent latent variable has substantive impact (Cohen, 1988). We
calculated the statistical significance level of the parameter estimates and the standard errors
using 500 bootstrapping runs. The results in Table 19 show that each of the endogenous
constructs has a significant impact (p < 0.001) on its associated exogenous constructs,
providing support for hypotheses H1II (β = 0.378), H2
II (β = 0.188), and H4II (β = 0.325).
Thus, we find empirical support that supplier selection and information exchange among
buyers and suppliers can result in significant sourcing flexibility improvements, and that
supply chain performance positively affects a product’s performance in the market.
Furthermore, R2 values range from 0.127 to 0.227, indicating a high variance explained for
all dependent constructs.
To test H3II, i.e., the quadratic effects of sourcing flexibility on supply chain performance,
we performed hierarchical regression analyses (see Table 20). By adding the squared term of
sourcing flexibility to the hierarchical multiple regression analysis, a significantly higher
variance can be explained (R2 = 0.268). The curvilinear effect demonstrates a U-shaped
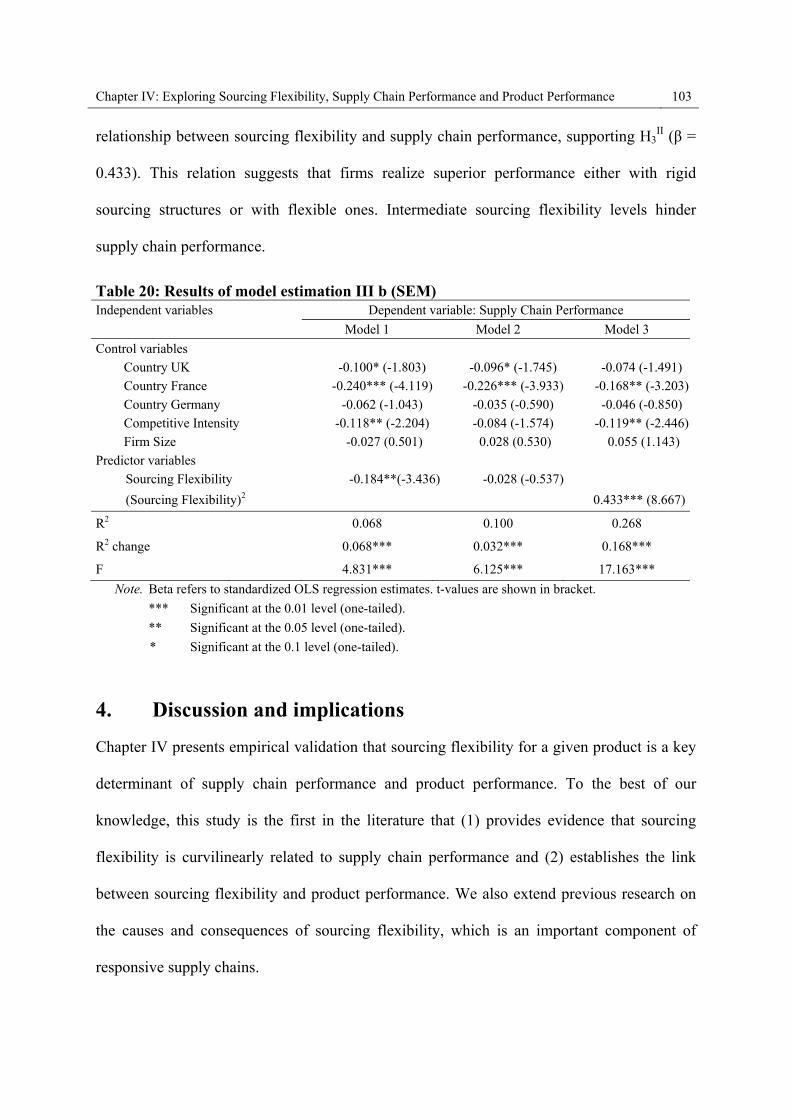
Chapter IV: Exploring Sourcing Flexibility, Supply Chain Performance and Product Performance 103
relationship between sourcing flexibility and supply chain performance, supporting H3II (β =
0.433). This relation suggests that firms realize superior performance either with rigid
sourcing structures or with flexible ones. Intermediate sourcing flexibility levels hinder
supply chain performance.
Table 20: Results of model estimation III b (SEM) Independent variables Dependent variable: Supply Chain Performance
Model 1 Model 2 Model 3
Control variables
Country UK -0.100* (-1.803) -0.096* (-1.745) -0.074 (-1.491)
Country France -0.240*** (-4.119) -0.226*** (-3.933) -0.168** (-3.203)
Country Germany -0.062 (-1.043) -0.035 (-0.590) -0.046 (-0.850)
Competitive Intensity -0.118** (-2.204) -0.084 (-1.574) -0.119** (-2.446)
Firm Size -0.027 (0.501) 0.028 (0.530) 0.055 (1.143)
Predictor variables
Sourcing Flexibility -0.184**(-3.436) -0.028 (-0.537)
(Sourcing Flexibility)2 0.433*** (8.667)
R2 0.068 0.100 0.268
R2 change 0.068*** 0.032*** 0.168***
F 4.831*** 6.125*** 17.163***
Note. Beta refers to standardized OLS regression estimates. t-values are shown in bracket.
*** Significant at the 0.01 level (one-tailed).
** Significant at the 0.05 level (one-tailed).
* Significant at the 0.1 level (one-tailed).
4. Discussion and implications
Chapter IV presents empirical validation that sourcing flexibility for a given product is a key
determinant of supply chain performance and product performance. To the best of our
knowledge, this study is the first in the literature that (1) provides evidence that sourcing
flexibility is curvilinearly related to supply chain performance and (2) establishes the link
between sourcing flexibility and product performance. We also extend previous research on
the causes and consequences of sourcing flexibility, which is an important component of
responsive supply chains.

Chapter IV: Exploring Sourcing Flexibility, Supply Chain Performance and Product Performance 104
The curvilinear relation between sourcing flexibility and supply chain performance
suggests that firms can realize high supply chain performance if their sourcing arrangements
(i.e., contracts) with suppliers are either rigid or allow for flexible sourcing of products in
terms of product quantities, product mix, delivery schedules, etc. One reason for this
phenomenon may stem from Fisher’s (1997) distinction between efficient and responsive
supply chains. On one hand, firms in heterogeneous or unpredictable environments that offer
customized products are better positioned for achieving high supply chain and product
performance with more modular or flexible supply chain structures. This is in line with the
results of Schilling and Steensma (2001) and Hitt, Keats, and DeMarie (1998) who suggest
that firms will require strategic flexibility to survive in a global environment. On the other
hand, firms that operate in homogeneous markets and offer standardized products can achieve
a high supply chain performance only if costs are controlled tightly and sourcing flexibility is
limited to a minimum. For firms in between, more flexibility may hinder the supply chain
performance by creating a mismatch between product and supply chain characteristics. This
“stuck in the middle” phenomenon is frequently observed in other areas of strategy and
organization (e.g., Bouquet et al., 2009; Dess and Davis, 1984; Hambrick, 1983), and we
have present in Chapter IV empirical evidence that it is also evident in procurement
decisions.

Chapter V: Summary, Limitations, and Outlook 105
Chapter V Summary, Limitations, and Outlook
This chapter summarizes the previous chapters and presents the theoretical and managerial
implications of the results and the models, as tested in Chapters II, III, and IV. It begins with
a summary of the main results with regard to the three research questions stated in the
introductory chapter. Next, a delineation of the main academic contributions and the most
relevant managerial implications is provided. Finally, major limitations are listed and
directions for future research are identified.
1. Summary and review of the research questions
As described in Chapter I, scholars and practitioners have put the topic of effective supply
chain strategy and management on their agendas. In recent years, the interest in this issue has
gained momentum, driven by three factors: (1) higher implied demand uncertainty due to
tougher competition, product plurality and globalization of supply chains and markets,
amongst others; (2) prevalence of increasingly complex, tightly coupled and responsive
supply chain design requirements; and (3) inter-, intra-organizational and external challenges,
obstacles and trade-offs within supply chains. Anecdotes, theoretical frameworks and case
studies convey how a fit in the supply chain can have positive consequences for global
operating manufacturing firms. The bulk of supply chain strategy research has relied heavily
on these examples and on case study methodologies, yet often with rhetorical or vague
suggestions that lack quantitative substantiation. Given these circumstances, the purpose of
Chapter V: Summary, Limitations, and Outlook 106
this dissertation was to study the phenomenon of supply chain fit, its constituents and
performance outcomes in more detail in order to enhance the current understanding.
First, the literature was reviewed in Chapter I. Particular emphasis was placed on the
clarification of the terms relevant in the domain of supply chain management, encompassing
the generic product and supply chain design profiles of Fisher (1997) as well as the concepts
of strategic fit, supply chain fit and supply chain design efficiency, all of which were
discussed and defined in the context of the literature. In addition, the traditional classification
of a fit or match in the supply chain (Fisher, 1997) was extended in the way that the
proclaimed diametrical setting was amplified with a multiple portfolio approach of ideal
supply chain fit constellations along the efficient frontier line, depending on the business
model and the overall competitive strategy. The clarification of this nomenclature served as
starting point for the subsequent chapters.
The research presented in this dissertation follows a theory-driven, large-scale empirical
approach and is based on samples I and II. Data were gathered by means of an internet-based
survey of executives in the German-speaking countries of Germany, Switzerland, and
Austria, in addition to the USA, the UK, and France. In Chapter I, research questions I, II and
III were described, with the applied data collection procedures and the characteristics of the
drawn samples. The obtained data sets (sample I: N = 259; sample II: N = 336) constitute a
rich empirical basis for the investigation of the three research questions outlined in Section 3
of Chapter I.
These research questions were investigated in Chapters II, III, and IV. Relying on three
model-based approaches and by applying several major theoretical concepts, this dissertation

Chapter V: Summary, Limitations, and Outlook 107
makes an original contribution to the research. In the following, the major results are
summarized.
1.1. Research question I
Research question I highlights the strategic role of supply chain management and the bottom
line impact of supply chain management practices on the firm’s performance. In Chapter II,
research question I investigated the following relationship:
Question I: Does supply chain fit have a significant impact on a firm’s financial
success and if so, which supply chain fit constituents are of relevance?
Holistically framed fit-performance relationships involving strategy, firm, and
environment, a conceptualization consistent with many organizational theories, in particular
those that identify a typology of effective organizational configurations (e.g., Mintzberg,
1983; Porter, 1980; Burns and Stalker, 1961) are central to strategic supply chain
management. To answer research question I and to understand the relationship between
product and supply chain profiles as well as among supply chain design, supply chain
strategy, and the competitive strategy of a firm, the research presented in Chapter II draws
from configurational theory: when organizational configurations fit or are similar to the ideal
type, effectiveness is at its highest because of the greatest possible fit among contextual,
structural, and strategic factors (Meyer et al., 1993b). Based on this theory, the central idea
behind the conceptual framework was that a fit in the supply chain leads to higher financial
performance.
Following the concept of strategic fit (Chopra and Meindl, 2009), the generic product and
supply chain profiles (Fisher, 1997) were proposed as relevant for achieving fit in the supply
Chapter V: Summary, Limitations, and Outlook 108
chain. Subsequently, hypotheses were formulated that relate supply chain fit to a firm’s
financial success in terms of ROCE, ROA as well as EBIT Margin and Sales Growth. Supply
chain fit was measured by asking the respondents to indicate the demand aspects of the
product as well as accordingly the supply chain design aspects.
With regard to research question I, the findings from the four linear models estimated by
OLS regression support the assumption that a fit in the supply chain affects the financial
success of a firm. Hence, supply chain fit can be conceived as financial driver of a firm. The
results reveal that supply chain fit, building upon the constituents of the demand aspects of a
product and its supply chain design, directly affect ROCE, ROA, EBIT Margin, and Sales
Growth. The conducted post-hoc analysis supports the financial leverage impact of supply
chain fit. Nonetheless, supply chain fit only marginally explained the variance in firm
performance, i.e., ROCE, ROA, EBIT Margin and Sales Growth. This calls for a further
investigation of supply chain fit in the light of a firm’s financial success.
1.2. Research question II
By adopting the firm’s perspective and drawing upon configuration theory, research question
II explored the relationship between supply chain design and a firm’s financial success in
terms of ROCE. Achieving supply chain design efficiency requires firms to concentrate their
resources on what they do best and on what provides them with the highest ROCE. While the
merits of an excellent supply chain design are straightforward, it was still not clear how well
the evidence correlate with actual performance. Hence, research question II was formulated
as:

Chapter V: Summary, Limitations, and Outlook 109
Question II: How do supply chain designs perform in terms of Return on Capital
Employed, and which supply chain design types are of relevance?
To answer this question, we introduced the concept of supply chain design efficiency as a
combination of two supply chain design types: physically-efficiency and market
responsiveness. We demonstrated how supply chain design efficiency may not only be
conceptually described, but also empirically measured. To this end, we used DEA as an
appropriate methodology to operationalize the constructs (Charnes et al., 1978). Instead of
comparing the supply chains of manufacturing across the board, the DEA approach provides
a basis for comparing supply chain designs against their best-in-class benchmark, i.e., to
investigate supply chains within their specific design context. By calculating an efficiency
score between 0% and 100%, our measure allows to evaluate the potential for improvement
of any given supply chain design. Results indicate that many supply chains display a potential
for increasing efficiency. The mean score of supply chain design efficiency was 46.83%,
however, less than 2% of the supply chain designs we investigated were fully efficient. The
task of supply chain management is to design supply chains that fit best to the unique
requirements of the manufacturing firm to best meet demand and supply. As we noted
previously, top management needs to develop an appreciation of how an effectively managed
supply chain design contributes to overall financial performance.
Instead of focusing on how Zara, Wal-Mart, Procter & Gamble, Toyota, or other best-in-
class firms are using their own supply chains to dominate the competition, firms should look
at what all top-performing supply chains have in common on a broader basic level. By
developing an understanding of the traits that underlie high-functioning supply chains, firms
will be well on their way to building their own models for supply chain design efficiency. At
Chapter V: Summary, Limitations, and Outlook 110
the very least, this pattern of results should stimulate some revisions and future research for
the investigated link.
1.3. Research question III
As indicated in Chapter IV, far less attention has been given to sourcing flexibility (Swafford
et al., 2006; Sharifi and Zhang, 1999; Goldman et al., 1994), a key cross-functional driver
(see Chapter I). Prior studies have been unable to find conclusive results on the link between
the building blocks of supply chain responsiveness and performance (Fantazy et al., 2009;
Pagell and Krause, 2004). As such, More and Babu (2008, p. 40) state that, in the literature,
“the empirical justification of the benefits of implementing flexible supply chains is rare and
in-depth empirical studies are lacking.” In response, research question III was formulated as
follows:
Question III: Does sourcing flexibility have a significant impact on supply chain
and product performance and if so, which degree of sourcing
flexibility sources is required for superior supply chain and product
performance?
A major building block of supply chain responsiveness is sourcing flexibility (Swafford et
al., 2006). This research suggested that sourcing flexibility is stimulated by information
sharing as well as by supplier selection and that sourcing flexibility has an impact on supply
chain performance which in turn affects product performance. Building upon these central
hypotheses, a covariance-based structural equation modeling technique was used to analyze
the model with data from sample II. The results offer several original insights and make
several scholarly and managerial contributions. In detail, the results show that supplier
Chapter V: Summary, Limitations, and Outlook 111
selection has a significant impact on sourcing flexibility. This is critical when a firm facing
with uncertain market conditions relies on its suppliers to adjust material supply in response
to unexpected changes in customer orders for manufactured products. Consequently, firms
requiring higher levels of responsiveness put more emphasis on rigorous supplier selection
along various criteria. Similarly, Swafford, Ghosh, and Murthy (2006) note that within
sourcing flexibility, key determinants of range of flexibility are the extent to which supplier
lead-time can be changed and the extent to which supplier capacity can be influenced when a
firm faces sudden changes in customer demand. Furthermore, results indicate that an
increased information exchange through implemented information systems between buyers
and suppliers on multiple levels can result in significant improvements in sourcing flexibility.
Thus, a greater level of external integration can support better management of collaborative
relationships and enable firms to achieve higher efficiency. This also supports the findings of
Cachon and Fisher (2000) and Krajewski and Wei (2000). Finally, empirical evidence
provides a U-shaped relationship between sourcing flexibility and supply chain performance.
The average cost of purchased materials, components, and services across all
manufacturing firms frequently exceeds 60% or even 70% of the total cost of operations
(Leenders et al., 2006; Wagner, 2006). In light of this enormous amount of business which is
outsourced to suppliers, the results of research question III should urge managers to take
sourcing flexibility into account more frequently when making supplier selection and
sourcing decisions. Sourcing flexibility is a key factor for supply chain and product
performance and merits researchers’ and managers’ attention.
Chapter V: Summary, Limitations, and Outlook 112
2. Major academic contributions
The research presented in this dissertation contributes to the academic discussion in multiple
ways. As the specific findings and research implications have already been extensively
discussed in Chapters II, III and IV, this section focuses on more general aspects. By using
survey data with a large number of respondents, and by developing and testing theory-driven
conceptual models, this dissertation moves beyond the case-based and normative research
that dominates the literature on supply chain fit.
First, we fill a gap in the operations management literature on the bottom line impact of
supply chain management on firm performance. Supply chain management literature has so
far focused more on efficiency improvement and cost reduction in supply chain operations
(e.g., Kopczak and Johnson, 2003; Aviv, 2001), and less on the phenomenon of supply chain
fit. This could be because, in contrast to efficiency, it is much harder to place a value on
supply chain fit. By associating supply chain fit with firm performance, we provide an
estimate of the value of a supply chain fit.
Second, although numerous classifications like the strategic fit concept of Chopra and
Meindl (2009) as well as the generic product and supply chain profiles of Fisher (1997)
which are in line with the reasoning of strategic management literature (Porter, 1980) or
Mintzberg’s (1983; 1979) theory of organizational structure and Miles and Snow’s (1978)
theory of strategy, structure, and process have been proposed, empirical studies have so far
neglected to take the phenomenon of supply chain fit sufficiently into consideration. This
dissertation moves beyond these conceptual classifications and provides evidence that supply
chain management research can benefit from configurational approaches (instead of
Chapter V: Summary, Limitations, and Outlook 113
relationships between single constructs). Chapters II and III provide important contributions
to the academic discussion which may serve as a starting point for further studies.
Finally, the evidence presented in this paper contributes to recent research to quantify the
impact of supply chain management strategies. One core research stream focuses on
mathematical models aiming to understand how alternate ways of managing supply chains
impact capital and operating costs, service, and inventory levels (e.g., Erhun et al., 2008;
Taylor, 2002; Aviv, 2001; Cachon and Fisher, 2000). The second core research stream
empirically examines the relationship between supply chain practice and performance (e.g.,
Frohlich and Westbrook, 2001; Shin et al., 2000; Swamidass and Newell, 1987). Despite
significant research in this field, most of the evidence is based on self-reported data.
Therefore, it is still not clear how well the evidence correlates to actual performance. Here we
extended recent research which has begun to use secondary data (e.g., Hendricks and Singhal,
2005) and link effective supply chain management, i.e., supply chain fit, to a firm’s financial
success. Furthermore, our multi-method approach, i.e., primary subjective data from the
survey and secondary objective financial data helps to overcome methodological problems
(e.g., common method bias) and to establish relevance of supply chain management research
by demonstrating how the research outputs apply to practice which hint numerous directions
for future research.
3. Major implications for practice
The insights from the presented conceptual frameworks provide significant implications for
practitioners. As most of them have already been discussed, only a summary of major and
comprehensive implications is given.

Chapter V: Summary, Limitations, and Outlook 114
Supply chain management. Effective supply chain management comes in line with
achieving supply chain fit, a prerequisite for strategic fit as described in Chapter II. Our
results can be taken as indications that supply chain fit is a relevant contextual variable for
strategic supply chain decision-making. Borrowing from strategic management literature and
configurational theory, this leads to the need to reevaluate the fit between supply chain design
and the demand aspects of the product. A certain supply chain design may perform well at
one stage of the product life-cycle, but probably not (necessarily) during the whole product
life-cycle, as Chapter III indicates. Therefore, supply chain designs should be (re-)assessed in
the light of supply chain fit.
At the heart of this dissertation we claim that firms have to realize the bottom line impact
of supply chain management because the impact of supply chain management is significant
and too substantial in terms of ROCE, ROA, Sales Growth and EBIT Margin than its impact
beyond the “classical” logistics performance indicators, like delivery performance. This
makes a strong support that supply chain management must be anchored in the top
management. Only then, the obstacles, challenges and trade-offs in the supply chains can be
managed in an optimal manner. Therefore, a promising approach might be the creation of a
Chief Supply Chain Officer who not only steers the supply chain management operations and
monitors the firm’s supply chain fit, but who also engages in forming a “fit management
culture”.
Supply chain fit constituents. As the degree of supply chain fit impacts the financial
performance, firms need to assess their products (and competitive strategy) and devise the
supply chain strategy accordingly. Lee (2002) mentions that the best supply chains are not
only cost-effective (physically-efficient) and fast (market responsive), but also agile and
Chapter V: Summary, Limitations, and Outlook 115
adaptable enough to ensure that all of a firm’s interests stay aligned. The message for
managers is: achieve consistency between demand aspects of your product and your supply
chain design and align it to the competitive strategy. Although this message may appear
rather abstract in research terminology, Chapter II and Chapter III explained how supply
chain fit can be achieved (see also Chapter I) and how supply chain designs can be
benchmarked, a first original approach to get transparency of the own supply chain design
efficiency. While most of the popular supply chain management literature devotes a
significant space to supply chain strategy issues, it provides poor analysis of alternative
supply chain designs in the light of their relative advantages with regard to supply chain fit.
Prioritization of supply chain drivers. Logistics as well as cross-functional drivers are
the engines for designing supply chains. As such, prioritization of supply chain drivers is key
to achieve supply chain fit. As all supply chain drivers work simultaneously and depend on
each other, each driver has to be analyzed in order to balance out and optimize all logistics
and cross-functional drivers from a holistic perspective. Algere, Lapiedra, and Chiva (2006)
note that firms might speed up their execution of options, given limited time and resources,
instead of increasing the range of options at the expense of adaptability. The findings of
Chapter IV should further encourage managers conceive supply chain drivers, for example
sourcing flexibility, as opportunities for improvement and to leverage this potential towards
achieving supply chain fit.
4. Limitations
As with any empirical research, the results of this dissertation have to be assessed in light of
the constraints under which the data was gathered and analyzed.
Chapter V: Summary, Limitations, and Outlook 116
4.1. Data gathering and statistical analysis
First, this dissertation concentrated on a complex area in supply chain management research.
Thus, the constructs developed and validated in this dissertation need to be more rigorously
defined, and their measures tested further for reliability and validity. Solid statistical results
obtained from the estimated confirmatory factor analysis models provide good indications for
the factorial structure. However, the validation of scales is an inexact and iterative process.
Thus, the construct validity can only be accomplished through a series of studies that further
refine and test the measures across populations and settings. A more profound investigation
of the nomological network of the constructs developed in this dissertation, mainly for supply
chain fit (SCF), might yield a more parsimonious set of constructs, i.e., a more sophisticated
proxy for supply chain fit might capture the fit in the supply chain more precisely.
Second, the models should be validated on other samples, if the findings are to be
generalized to the population of firms. For example, the models investigated in Chapters II,
III and IV were tested with data gathered from manufacturing firms in the USA, the UK,
France, Germany, Austria and Switzerland. However, besides these efforts, this raises still the
question whether the model would be validated with samples from other countries and/or
regions, like Asia or South America. Likewise, all three studies focused on manufacturing
firms. Replications with other industries than the herein reported ones, like logistics service
providers or retailers, would be a consequential next step.
Third, we followed the compromise adopted by many researchers (e.g., Swafford et al.,
2006; Pagell and Krause, 2004) and used the same data to purify and validate our measures
and then to test the hypotheses. While this was an important design step keeping the samples
manageable, this includes the threat of a potential single informant bias which cannot
Chapter V: Summary, Limitations, and Outlook 117
completely be ruled out. Hence, the opportunity to survey multiple key informants (Wagner
et al., 2010b) per firm, i.e., to establish inter-rater reliability, was abandoned.
Fourth, another limitation arises from the fact that for the estimated model of research
question III (Chapter IV) both explanatory and outcome variables are based on self-reports.
This raises the problem of common method variance in which the independent and dependent
variables are hardly distinguishable (Bollen and Paxton, 1998; Podsakoff and Organ, 1986;
Phillips, 1981). Despite the encouraging tests reported herein, the problem of common
method variance cannot be completely ruled out. Hence, a bias arising from common method
variance may be a greater problem for the results in Chapter IV were the outcome variable
supply chain performance and product performance may be vulnerable to a subjective
perceptual measurement. In contrast, the results of Chapters II and III are stable against this
issue, since the usage of objective secondary data for the outcome variables eliminates the
concern of common method bias.
Fifth, the response rates of the survey (sample I: 14.12%; sample II: 18.32%) might be a
potential weakness even though many recent studies in the field of supply chain management
have also struggled receiving good response rates (e.g., Bode, 2008; Gibson et al., 2005;
Sinkovics and Roath, 2004) and several other studies subscribe to the philosophy that there is
no generally accepted minimum response rate (Fowler, 1993). Despite encouraging results of
non response bias tests reported herein, the possibility cannot be completely dismissed.
Finally, as this research is cross-sectional, it cannot establish causality among variables.
Although the performed tests did not provide an indication of recall issues, regency bias
might still exist. Only a longitudinal research design could confirm causality or evolutions of
key variables over time.
Chapter V: Summary, Limitations, and Outlook 118
4.2. Conceptual frameworks
Apart from these limitations associated with the empirical approach, the three conceptual
frameworks and their testing exhibit limitations.
In Chapters II and IV, the rather low coefficients of determination (R2) in all the
estimated models indicate that partial models were investigated. Obviously, various factors
hold predictive power for the investigated dependent variables that were omitted in the
conceptual frameworks. This has to be taken under consideration when interpreting the
results.
Furthermore, in Chapter IV, the downstream-oriented supply chain performance
measure from Beamon (1999) and Rodrigues, Stank, and Lynch (2004) was used. For this
reason, this scale cannot perform a more detailed examination of how souring flexibility
affect other elements of supply chain performance. The limitation regarding performance
measurement might be eliminated if a broader performance measurement approach, i.e.,
“adaptability of a firm, market and financial success,” would have been taken under
consideration (Weber and Schäffer, 2006, p. 420).
Chapter II discussed only a selection of product demand aspects which were based on the
generic product and supply chain design profiles of Fisher (1997). The low coefficients of
determination make a strong case for the further exploration of supply chain fit and its
constituents. A more precise operationalization of supply chain design variables which are
relevant to capture the degree of responsiveness together with an investigation of their
relationship to product demand aspects would be of high managerial relevance. A deeper
knowledge of how supply chain design variables increase or decrease supply chain design
Chapter V: Summary, Limitations, and Outlook 119
efficiency and consequently affect supply chain fit would give managers important
information for their decisions about supply chain design.
With regard to the conceptualization of Chapter III, it is noteworthy that the results are
correlated to the limits of DEA, which measures the relative efficiency of Decision Making
Units. This non-parametric programming approach to frontier estimation cannot provide
absolute efficiencies, only efficiencies relative to the data considered.
5. Directions for future research
Apart from tying in with the limitations cited above, several further avenues for future
research seem promising. The following aspects should stimulate research interest and
encourage further research in the field of supply chain management.
5.1. Model extensions and alternative underpinnings
First, the phenomenon of supply chain fit should be applied to other supply chain
management areas. This dissertation focused on the design of a supply chain in which
demand uncertainty is the key challenge. It would be interesting to apply the phenomenon of
supply chain fit to the two other sources of uncertainty: process and supply (Lee and
Billington, 1993). Furthermore, the supply chain fit concept could also be applied in
particular to supply chain finance. An important supply chain management goal is to achieve
an optimized working capital management in order to activate tied capital which is frozen in
account receivables and payables as well as in inventories. The ability to deliver at anytime is
often a top priority for firms and leads to high inventories and stocks, i.e., the tied capital is
not optimized (Grosse-Ruyken et al., 2008) which increases the potential of bankruptcy of
Chapter V: Summary, Limitations, and Outlook 120
supply chains in economic recessions. This domino effect is intensified if a holistic approach
taking the whole supply chain into consideration is missing to release tied-up capital, i.e.,
capital which is for example frozen in inventory. Thus, each working-capital management
decision should consider all upstream and downstream partners within the supply chain,
especially regarding the management of the Cash Conversion Cycle (CCC), which measures
the number of days a firm takes to convert resource inputs into actual cash, a key
measurement of a firm’s performance in this regard. In contrast to current mainstream, the
optimal level of CCC for responsive supply chains could be seen from a holistic “fit stance”
concluding that a strong working-capital system depends on the business model, its specific
supply chain design configurations and risk aspects within the supply chain. Hence, further
investigations of optimal working capital management strategies from a “holistic fit stance”
considering the financial and operational trade-offs in addition to the risk aspects would be of
high relevance.
Second, it is difficult to determine the cause of an observed transformation change, and
whether the response to it is based on learning, such as understanding the relationship of that
response (Fiol and Lyles, 1985) to the experienced (in)consistency of demand aspects of the
product and supply chain design variables. As a lack of supply chain fit does not appear
overnight but evolves over time, there is a constant threat that misfits do not receive sufficient
management attention. Managers generally do not get credit for preventing potential misfits,
especially since the potential consequences are not known in advance. Therefore, it can be
estimated that over the course of time firms simply neglect the supply chain design aspects
and underestimate both the tangible and intangible benefits of achieving supply chain fit.
Chapter V: Summary, Limitations, and Outlook 121
Further investigations are necessary to deepen the knowledge and to monitor better the
supply chain fit along the product life-cycle.
Third, selecting an ideal configuration is a complex balancing act. It would be interesting
to figure out if managers avoid the blandness or chaos of too little configuration while
skirting the obsession of too much. Basically, the appropriate level of configuration depends
on the implied uncertainty spectrum. The more changing and uncertain the environment, the
more loosely coupled the elements of the supply chain of a firm may have to be (Miller,
1993). “Excellent wines have complexity and nuance, blending together different tastes into a
harmonious balance. They avoid clashing cacophonies of flavors as well as the strident
dominance of a single sharp note” (Miller, 1996, p. 511).
Fourth, Fine (1998) and Randall (2001) point out that supply chain decisions are often
more capitally intensive and longer lived than product line decisions, suggesting limitations
for an optimal supply chain design fitting each product iteration. Hence, it would be
interesting to investigate patterns of how supply chain design can dynamically be adapted and
aligned, fitting, to a high degree, to every product iteration, extending the results of Randall,
Morgan, and Morton (2003) to safeguard supply chain fit in each product iteration.
Fifth, collecting data from both sides of the relationship dyad, or even investigating triad-
relationships, would be an interesting and promising task for future research with respect to
supply chain fit. Various factors such as the comparative level of each firm’s dependence can
only be examined by using such dyadic or triadic data.
Sixth, in Chapter IV we restricted ourselves to production-related sourcing flexibility;
other activities may be outsourced for different reasons. In addition, we focused on sourcing
flexibility. However, logistics flexibility and/or manufacturing flexibility might have

Chapter V: Summary, Limitations, and Outlook 122
significant explanatory power in terms of profitability. Further investigations would be
promising.
Finally, in all chapters the configuration view was used to underpin the phenomenon of
supply chain fit and its constituents. The configurational theory is based on contingency
theory and strategic choice theory. The contingency approach contends that there is an
association between environmental factors and organizational structure. If the environment
changes, then the organizational structure changes as well (deterministic view of contingency
theory) or should be adapted by decision-makers (strategic choice theory). In any case, a
strategic fit between environmental factors and organizational structure leads to superior
performance. Configuration theory is based on the former theories but addresses successful
organizational patterns as indicated in Chapters II and III. The idea is that, given certain
environmental factors, groups of firms and supply chains emerge that display a common
profile, i.e., configuration, of conceptually independent characteristics. Hence, the closer a
supply chain matches an ideal constellation, the better the performance. However, these
environment-structure-performance configurations have not been investigated before against
a background of supply chain fit. This dissertation provides a first step into that research
direction by adding the fit dimension to supply chain configurations. It would be a promising
research field to elaborate a set of dimensions and variables for the description of
constellations which take all aspects of supply chain management into account, i.e., better
supply chain fit predictors and scales to identify determinants based on specified industry
requirements have to be developed and continuously updated in order to maintain a high level
of supply chain fit. For this reason, a complete set of factors should be included in the
descriptions of ideal types for the respective industry. At minimum, ideal types should be

Chapter V: Summary, Limitations, and Outlook 123
described in terms of the imperatives which drive firms in supply chain management toward
certain configurations (Miller, 1986).
5.2. Cross-country effects
Given globalization and the increasing importance of international business, the
transferability of models, theories, and practices across national borders and national cultures
has become an important issue in the academic and business world. Comparing two or more
data sets is an essential means of discovering peculiarity or universality of methods,
attributes, theories or practices.
Hence, we put tremendous efforts to obtain data from different European countries
(France, UK, Germany, Austria and Switzerland) and the USA. Nevertheless, it is important
to note that the results may not generalize to all countries. Differences in buyer-supplier
relationships or different supply chain management perceptions may vary among countries.
Therefore, for the investigation of supply chain fit, three of Hofstede’s (2003) five
dimensions of cultural difference (power distance, uncertainty avoidance, individualism
versus collectivism, masculinity versus femininity, long-term versus short-term orientation)
can be expected to be of particular importance in the context of supply chain fit: uncertainty
avoidance, masculinity versus femininity and long-term versus short-term orientation. For
instance, supply chain managers in the USA could be expected to focus differently on supply
chain design because of their short term-orientation, in contrast to more long-term oriented
Japanese counterparts.
Chapter V: Summary, Limitations, and Outlook 124
5.3. Longitudinal research design
All three studies investigating research questions I, II and III are longitudinal and hence
preclude establishing a strong claim of causality in the estimated models. Many of the
investigated aspects and theories are highly dynamic, such as the configurational perspective
on supply chain fit. Such aspects cannot be fully examined in a cross-sectional study, but
should be addressed with a longitudinal approach. Certainly, a longitudinal research design
would enhance the knowledge of how firms adjust over time to maintain a high level of
supply chain fit and how their supply chain designs are adjusted to changes in demand.
Further insights into the trade-offs between physically-efficiency and market responsiveness
could be gathered and assist in understanding the bottom line impact of supply chain
management on firm performance. Similarly, it would be useful to conduct in-depth case
studies of firms over time within a specific industry so as to understand the industry specific
demand aspects and supply chain design processes that lead to supply chain fit.
6. Outlook
This dissertation makes an important contribution to the understanding of the bottom line
impact of effective supply chain management in terms of supply chain fit, its constituents and
performance outcomes. It offers several unique insights into supply chain management and
deepens the knowledge of supply chain fit, and, hence contributes to the academic discussion
in the operational field and offers strong and relevant implications for practitioners from a
strategic, tactical and operational perspective.
Although this dissertation investigated important questions and produced valuable
answers, there is ample room for further research. This dissertation has laid the groundwork

Chapter V: Summary, Limitations, and Outlook 125
for the investigation of appealing and motivating research questions. Further investigating
those questions and to find original answers will be an intriguing and rewarding task for
researchers and mangers alike, following a statement of Johann Wolfgang von Goethe that
being “pleased with one’s limits is a wretched state”, in particular in the dynamic field of
supply chain management.
References 126
References
Algere, J., Lapiedra, R., Chiva, R., 2006. A measurement scale for product innovation performance. European Journal of Innovation Management 9 (4), 333-346.
Anand, K., Goyal, M., 2009. Strategic information management under leakage in a supply
chain. Management Science 55 (3), 438-452. Anderson, J.C., Narus, J.A., 1990. A model of distributor firm and manufacturer firm
working partnerships. Journal of Marketing Research 54 (1), 42-58. Anderson, J.C., Gerbing, D.W., 1988. Structural equation modeling in practice: A review and
recommended two-step approach. Psychological Bulletin 103 (3), 411-423. Andrews, K.R., 1971. The concept of corporate strategy. Homewood, IL: Dow Jones Irwin. Armstrong, J.S., Overton, T.S., 1977. Estimating non-response bias in mail surveys. Journal
of Marketing Research 14 (3), 396-402. Aviv, Y., 2001. The effect of collaborative forecasting on supply chain performance.
Management Science 47 (10), 1326-1343. Bagozzi, R.P., Yi, W., Phillips, L.W., 1991. Assessing construct validity in organizational
research. Administrative Science Quarterly 36 (3), 421-458. Bagozzi, R.P., Yi, Y., 1988. On the evaluation of structural equation models. Journal of the
Academy of Marketing Science 16 (1), 74-97. Bailen, H., 2001. Leveraging the digital supply chain will help improve performance. Mercer
Management Consulting, Inc. Bakos, Y.J., Brynjolfsson, E., 1993. From vendors to partners: The role of information
technology and incomplete contracts in buyer-supplier relationships. Journal of Organizational Computing and Electronic Commerce 3 (3), 301-328.
Beamon, B.M., 1999. Measuring supply chain performance. International Journal of
Operations and Production Management 19 (3), 275-292. Bensaou, M., 1999. Portfolio of buyer-supplier relationships. MIT Sloan Management Review
40 (4), 35-44.
References 127
Bode, C., 2008. Causes and effects of supply chain disruptions. Dissertation. WHU – Otto Beisheim School of Management, Vallendar, Germany, 1-155.
Bollen, K.A., Lennox, R., 1991. Conventional wisdom on measurement: A structural
equation perspective. Psychological Bulletin 110 (2), 305-314. Bollen, K.A., Paxton, P., 1998. Detection and determinants of bias in subjective measures.
American Sociological Review 63 (3), 465-478. Bordoloi, S.K., Cooper, W.W., Matsuo, H., 1999. Flexibility, adaptability, and efficiency in
manufacturing systems. Production and Operations Management 2 (2), 133-149. Bouquet, C., Crane, A., Deutsch, Y., 2009. The trouble with being average. MIT Sloan
Management Review 50 (3), 79-80. Burgess, T.F., 1994. Making the leap to agility: Defining and achieving agile manufacturing
through business process redesign and business network redesign. International Journal of Operations and Production Management 14 (11), 23-34.
Burns, T., Stalker, G.M., 1961. The management of innovation. NY: Barnes & Noble. Cachon, G.P., Swinney, R., 2009. Purchasing, pricing, and quick response in the presence of
strategic consumers. Management Science 55 (3), 497-511. Cachon, G.P., Fisher, M., 2000. Supply chain inventory management and the value of shared
information. Management Science 46 (8), 1032-1048. Charnes, A., Cooper, W.W., Rhodes, E., 1978. Measuring the efficiency of decision making
units. European Journal of Operational Research 2 (4), 429-444. Chen-Ritzo, C.-H., Harrison, T.P., Kwasnica, A.M., Thomas, D.J., 2005. Better, faster,
cheaper: An experimental analysis of a multiattribute reverse auction mechanism with restricted information feedback. Management Science 51 (12), 1753-1762.
Childerhouse, P., Aitken, J., Towill, D.R., 2002. Analysis and design of focused demand
chains. Journal of Operations Management 20 (6), 675-689. Chin, W.W., 1998. The partial least squares approach for structural equation modeling. In:
Marcoulides, G.A. (ed.) Modern methods for business research. Mahwah, NJ: Lawrence Erlbaum Associates, 1998, 295-336.
Chopra, S., Meindl, P., 2009. Supply chain management – Strategy, planning, and operation.
4th ed., Upper Saddle River, NY: Pearson Education. Choudhury, V., 1997. Strategic choices in development of inter-organizational information
systems. Information Systems Research 8 (1), 1-24.
References 128
Christopher, M., Towill, D.R., 2001. An integrated model for the design of agile supply chains. International Journal of Physical Distribution and Logistics Management 31 (4), 235-246.
Christopher, M., Towill, D.R., 2000. Supply chain migration from lean to agile and
customized. Journal of Supply Chain Management 5 (4), 206-213. Clemons, E.K., Reddi, S.P., Row, M.C., 1993. The impact of information technology on the
organization activity: The move to the middle hypothesis. Journal of Management Information Systems 10 (2), 9-35.
Cohen, J., Cohen, P., West, S.G., Aiken, L.S., 2003. Applied multiple regression/correlation
analysis for the behavioral sciences. 3rd ed., Hillsdale, NJ: Erlbaum. Cohen, J., 1988. Statistical power analysis for the behavioral sciences. 2nd ed., Hillsdale, NJ:
Erlbaum. Cooper, M.C., Lambert, D.M, Pagh, J.D., 1997. Supply chain management: More than a new
name for logistics. International Journal of Logistics Management 8 (1), 1-13. Croson, R., Donohue, K., 2003. Impact of POS data sharing on supply chain management:
An experimental study. Production and Operations Management 12 (1), 1-11. D’Avanzo, R., Von Lewinski, H., Van Wassenhove, L., 2003. The link between supply chain
and financial performance. Supply Chain Management Review 7 (11-12), 40-47. D’Souza, D.E., Williams, F.P., 2000. Toward a taxonomy of manufacturing flexibility
dimensions. Journal of Operations Management 18 (5), 577-593. Dai, Q., Kauffman, R.J., 2002. Business models for Internet based B2B electronic markets.
International Journal of Electronic Commerce 6 (4), 41-72. Dehning, B., Richardson, V.J., Zmud, R.W., 2007. The financial performance effects of IT-
based supply chain management systems in manufacturing firms. Journal of Operations Management 25 (4), 806-824.
Delfmann, W., Klaas-Wissing, T., 2007. Strategic supply chain design: Theory, concepts, and
applications. Köln: Kölner Wissenschaftsverlag. Dess, G.G., Davis, P.S., 1984. Porter’s (1980) generic strategies as determinants of strategic
group membership and organizational performance. Academy of Management Journal 27 (3), 467-488.
DeVellis, R.F., 2003. Scale development: Theory and applications. 2nd ed., Thousand Oaks,
CA: Sage Publications.

References 129
Diamantopoulos, A., Siguaw, J.A., 2006. Formative versus reflective indicators in organizational measure development: A comparison and empirical illustration. British Journal of Management 17 (4), 263-282.
Diamantopoulos, A., Winklhofer, H.M., 2001. Index construction with formative indicators:
An alternative to scale development. Journal of Marketing Research 38 (2), 269-277. Dillman, D.A., 2007. Mail and Internet surveys: The tailored design method 2007 – Update
with new Internet, visual, and mixed-mode guide. 2nd ed., NY: John Wiley & Sons. Doty, D.H., Glick, W.H., Huber, G.P., 1993. Fit, equifinality, and organizational
effectiveness: A test of two configurational theories. Academy of Management Journal 36 (6), 1196-1250.
Droge, C., Jayaram, J., Vickery, S.K., 2004. The effects of internal versus external integration
practices on time-based performance and overall firm performance. Journal of Operations Management 22 (6), 557-573.
Eggert, A., Ulaga, W., Hollmann, S., 2009. Benchmarking the impact of customer share in
key-supplier relationships. Journal of Business and Industrial Marketing 24 (3), 154-160.
Ellram, L.M., Cousins, P., 2007. Supply Management. In: Mentzer, J.T., Myers, M.B., Stank,
T.P. (eds.): Handbook of global supply chain management. Thousand Oaks, CA: Sage Publications, 2007.
Ellram, L.M., Liu, B., 2002. The financial impact of supply management. Supply Chain
Management Review 6 (6), 30-37. Ellram, L.M., 1991. Supply chain management: The industrial organization perspective.
International Journal of Physical Distribution and Logistics Management 21 (1), 13-22.
Ellram, L.M., 1990. The supplier selection decision in strategic partnerships. Journal of
Purchasing and Material Management 26 (1), 8-15. Erhun, F., Keskinocak, P., Tayur, S., 2008. Dynamic procurement, quantity discounts, and
supply chain efficiency. Production and Operations Management 17 (5), 1-8. Fantazy, K.A., Kumar, V., Kumar, U., 2009. An empirical study of the relationships among
strategy, flexibility, and performance in the supply chain context. Supply Chain Management: An International Journal 14 (3), 177-188.
Fine, C.H., 1998. Clockspeed: Winning industry control in the age of temporary advantage.
NY: Perseus Books.
References 130
Fiol, C.M., Lyles, M.A., 1985. Organizational learning. Academy of Management Review 10 (4), 803-813.
Fisher, M.L., Raman, A., McClelland, A.S., 2000. Rocket science retailing is almost here:
Are you ready? Harvard Business Review 78 (4), 115-124. Fisher, M.L., 1997. What is the right supply chain for your product? Harvard Business
Review 75 (2), 105-116. Fornell, C., Cha, J., 1994. Partial least squares. In: Bagozzi, R.P. (ed.): Advanced methods of
marketing research. Cambridge, MA: Blackwell, 1994, 52-78. Fornell, C., Bookstein, F.L., 1982. Two structural equation models: LISREL and PLS applied
to consumer exit-voice theory. Journal of Marketing Research 19 (4), 440-452. Fornell, C., Larcker, D.F., 1981. Evaluating structural equation models with unobservable
variables and measurement error. Journal of Marketing Research 18 (1), 39-50. Fowler, J.F., 1993. Survey research methods. 2nd ed., Newbury Park, CA: Sage Publications. Frohlich, M.T., Westbrook, R., 2001. Arcs of integration: An international study of supply
chain strategies. Journal of Operations Management 19 (2), 185-200. Gerwin, D., 1993. Manufacturing flexibility: A strategic perspective. Management Science 39
(4), 395-410. Gerwin, D., 1987. An agenda for research on the flexibility on manufacturing processes.
International Journal of Operations and Production Management 7 (1), 38-49. Ghemawat, P., Nueno, J.L., 2003. ZARA: Fast fashion. Case Study 9-703-497. Harvard
Business School, Boston, MA, 1-35. Ghodsypour, S.H., O’Brien, C., 1998. A decision support system for supplier selection using
an integrated analytic hierarchy process and linear programming. International Journal of Production Economics 56-57 (1), 199-212.
Gibson, B.J., Mentzer, J.T., Cook, R.C., 2005. Supply chain management: The pursuit of a
consensus definition. Journal of Business Logistics 26 (2), 17-25. Ginsberg, A., Venkatraman, N., 1985. Contingency perspectives of organizational strategy: A
critical review of the empirical research. Academy of Management Review 10 (3), 421-434.
Goldman, S.L., Nagel, R.N., Preiss, K., 1994. Agile competitors and virtual organizations:
Strategies for enriching the customer. NY: Van Nostrand Reinhold.
References 131
Goldsby, T.J., Griffis, S.E., Roath, A.S., 2006. Modeling lean, agile, and leagile supply chain strategies. Journal of Business Logistics 27 (1), 57-80.
González, M.E., Quesada, G., Monge, C.A.M., 2004. Determining the importance of the
supplier selection process in manufacturing: A case study. International Journal of Physical Distribution and Logistics Management 34 (6), 492-504.
Grosse-Ruyken, P.T., Wagner, S.M., 2009a. Supply-Finanzierung – Ein Hebel zum
Unternehmenserfolg. Beschaffungsmanagement 43 (357), 16-17. Grosse-Ruyken, P.T., Wagner, S.M., 2009b. Kapitalbindung in Wertschöpfungsketten.
Industrie Management 25 (6), 45-48. Grosse-Ruyken, P.T., Wagner, S.M., Lee, W.-F., 2008. Improving firm performance through
value-driven supply chain management: A Cash Conversion Cycle approach. Baltic Management Review 3 (1), 53-69.
Grubbström, R.W., Olhager, J., 1997. Productivity and flexibility: Fundamental relations
between two major properties and performance measures of the production system. International Journal of Production Economics 52 (1), 73-82.
Gupta, P., Orlofsky, S., 2008. Chrysler aims to cut supply chain costs by 25 pct, Reuters.
Available at http://www.earthtimes.org/articles/show/226016,chrysler-aims-to-cut-supply-chain-costs-by-25-pct.html (10/12/2009).
Gupta, Y.P., Somers, T.M., 1992. The measurement of manufacturing flexibility. European
Journal of Operational Research 60 (2), 166-182. Hair, J.F., Black, W.C., Babin, B., Anderson, R.E., Tatham, R.L., 2006. Multivariate data
analysis. 6th ed., Upper Saddle River, NJ: Prentice Hall. Hallenbeck, G.S., Jr., Hautaluoma, J.E., Bates, S.C., 1999. The benefits of multiple
boundary-spanning roles in purchasing. Journal of Supply Chain Management 35 (2), 38-43.
Hambrick, D.C., 1983. High profit strategies in mature capital goods industries: A
contingency approach. Academy of Management Journal 26 (4), 687-707. Hartley-Urquhart, R., 2006. Managing the financial supply chain. Supply Chain Management
Review 3 (6), 18-25. Hausman, W.H., Thorbeck, J.S., 2007. Fast fashion: Linking supply chain performance to
financial metrics. Working Paper. Stanford University, Stanford, CA, 1-25. Hausman, W.H., 2004. Supply chain performance measures. NY: Springer Science & Media
Inc.

References 132
Hausman, W.H., 2003. Supply chain performance measures. In: Billington, C., Harrison, T., Lee, H.L., Neale, J. (eds.): The practice of supply chain management, Norwell, MA: Kluwer Academic Publishers, 2003, 61-76.
Hayes, R.H., Pisano, G., 1996. Manufacturing strategy: At the intersection of two paradigm
shifts. Production and Operations Management 5 (1), 25-41. Hendricks, K.B., Singhal, V.R., 2005. Association between supply chain glitches and
operating performance. Management Science 51 (5), 695-711. Hensley, R., Knupf, S.M., 2005. Carmakers and parts suppliers can capture huge savings, but
only by working together more closely. McKinsey Quarterly 3 (June 2005), 115. Hill, C.A., Scudder, G.D., 2002. The use of electronic data interchange for supply chain
coordination in the food industry. Journal of Operations Management 20 (4), 375-387. Hitt, M.A., Keats, B.W., DeMarie, S.M., 1998. Navigating in the new competitive landscape:
Building strategic flexibility and competitive advantage in the 21st century. Academy of Management Executive 12 (4), 22-42.
Hofstede, G.H., 2003. Culture’s consequences: Comparing values, behaviours, institutions,
and organizations across nations. 2nd ed., Thousand Oaks, CA: Sage Publications. Holland, C.P., Lockett, G., 1997. Mixed mode network structures: The strategic use of
electronic communication by organizations. Organization Science 8 (5), 475-488. Hsu, C.-C., Kannan, V.R., Leong, G.K., Tan, K.-C., 2006. Supplier selection construct:
Instrument development and validation. International Journal of Logistics Management 17 (2), 213-239.
Hulland, J., 1999. Use of partial least squares (PLS) in strategic management research: A
review of four recent studies. Strategic Management Journal 20 (2), 195-204. Hult, G.T., Ketchen, D.J., Jr., Cavusgil, S.T., Calantone, R.J., 2006. Knowledge as a strategic
resource in supply chains. Journal of Operations Management 24 (5), 458-475. Humphreys, P., Huang, G., Cadden, T., 2005. A web-based supplier evaluation tool for the
product development process. Industrial Management and Data Systems 105 (2), 147-163.
Iravani, S.M., Van Oyen, M.P., Sims, K.T., 2005. Structural flexibility: A new perspective on
the design of manufacturing and service operations. Management Science 51 (2), 151-166.
Jaworski, B.J., Kohli, A.K., 1993. Market orientation: Antecedents and consequences.
Journal of Marketing 57 (3), 53-70.
References 133
Joshi, A.W., Sharna, S., 2004. Customer knowledge development: Antecedents and impact on new product performance. Journal of Marketing 68 (4), 47-59.
Kannan, V.R., Tan, K.-C., 2002. Supplier selection and assessment: Their impact on business
performance. Journal of Supply Chain Management 38 (4), 11-22. Ketchen, D.J., Jr., Giunipero, L.C., 2004. The intersection of strategic management and
supply chain management. Industrial Marketing Management 33 (1), 51-56. Ketchen, D.J., Jr., Thomas, J.B., McDaniel, R.B., Jr., 1996. Process, content and context:
Synergistic effects on organizational performance. Journal of Management 22 (2), 231-257.
Kopczak, L.R., Johnson, M.E., 2003. The supply chain management effect. Sloan
Management Review 44 (3), 27-34. Koste, L.L., Malhotra, M.K., 1999. A theoretical framework for analyzing the dimensions of
manufacturing flexibility. Journal of Operations Management 18 (1), 75-93. Krajewski, L.J., Wei, J.C.-Y., 2000. The value of production schedule integration in supply
chains. Decision Sciences 32 (4), 601-634. Kumar, N., Stern, L.W., Anderson, J.C., 1993. Conducting interorganizational research using
key informants. Academy of Management Journal 36 (6), 1633-1651. Lambert, D., Pohlen, T., 2001. Supply Chain Metrics. International Journal of Logistics
Management 12 (1), 1-19. Lambert, D.M., Emmelhainz, M.A., Gardner, J.T., 1996. Developing and implementing
supply chain partnerships. International Journal of Logistics Management 7 (2), 1-18. Lee, H.L., Peleg, B., Whang, S., 2005. Toyota: Demand change management. Global Supply
Chain Management Forum. Stanford University, Stanford, CA. Lee, H.L., 2004. The triple-A supply chain. Harvard Business Review 82 (10), 102-112. Lee, H.L., 2002. Aligning supply chain strategies with product uncertainties. California
Management Review 44 (3), 105-119. Lee, H.L., Padmanabhan, P., Whang, S., 1997. Bullwhip effect in a supply chain. MIT Sloan
Management Review 38 (4), 93-102. Lee, H.L., Billington, C., 1993. Material management in decentralized supply chains.
Operations Research 41 (5), 835-847. Leenders, M., Johnson, P.F., Flynn, A., Fearon, H.E., 2006. Purchasing and supply
management. 13th ed., NY: McGraw-Hill.
References 134
Li, D., O’Brien, C., 2001. A quantitative analysis of relationships between product types and supply chain strategies. International Journal of Production Economics 73 (1), 29-39.
Lieberman, M.B., Demeester, L., 1999. Inventory reduction and productivity growth:
Linkages in the Japanese automotive industry. Management Science 45 (4), 466-485. Loderhose, B., 2008. Danone will schnelleren Durchlauf – Cross Docking plus
lieferantengesteuerte Disposition bringen Joghurt & Co. frischer ins Handelsregal, Lebensmittel Zeitung.
Lohnmöller, J.B., 1989. Latent variable path modeling with partial least squares. NY:
Springer. Malhotra, M.K., Grover, V., 1998. An assessment of survey research in POM: From
constructs to theory. Journal of Operations Management 16 (4), 407-425. McKinney, J.C., 1966. Constructive typology and social theory. NY: Appleton Century
Crofts. McKone, K.E., Schroeder, R.G., Cua, K.O., 2001. The impact of total productive
maintenance practices on manufacturing performance. Journal of Operations Management 19 (1), 39-58.
Mentzer, J.T., Flint, D.J., 1997. Validity in logistics research. Journal of Business Logistics
18 (1), 199-216. Mentzer, J.T., DeWitt, W., Keebler, J.S., Min, S., Nix, N.W., Smith, C.D., Zacharia, Z.G.,
2001. Defining supply chain management. Journal of Business Logistics 22 (2), 1-25. Metters, R.D., Frei, F.X., Vargas, V.A., 1999. Measurement of multiple sites in service firms
with Data Envelopment Analysis. Production and Operations Management 8 (3), 264-281.
Meyer, A.D., Goes, J.B., Brooks, G.R., 1993a. Firms reacting to hyperturbulence. NY:
Oxford University Press. Meyer, A.D., Tsui, A.S., Hinggs, C.R., 1993b. Configurational approaches to organizational
analysis. Academy of Management Journal 36 (6), 1175-1195. Miles, R.E., Snow, G.G., 1978. Organizational strategy, structure and process. NY: McGraw
Hill. Miller, D., 1996. Configurations revisited. Strategic Management Journal 17 (7), 505-512. Miller, D., 1993. The architecture of simplicity. Academy of Management Review 18 (1),
116-138.
References 135
Miller, D., 1986. Configurations of strategy and structure: Towards a synthesis. Strategic Management Journal 7 (3), 233-249.
Mintzberg, H., 1983. Structure in fives: Designing effective firms. NY: Prentice Hall. Mintzberg, H., 1979. The structuring of firms. NY: Prentice Hall. Mohr, J.J., Nevin, J.R., 1990. Communication strategies in marketing channels: A theoretical
perspective. Journal of Marketing 54 (4), 36-51. More, D., Babu, A.S., 2008. Supply chain flexibility: A state-of-the-art survey. International
Journal of Services and Operations Management 5 (1) 29-65. Narasimhan, R., Jayaram, J., Carter, J.R., 2001. An empirical examination of the underlying
dimensions of purchasing competence. Production and Operations Management 10 (1), 1-15.
Narasimhan, R., Das, A., 1999. An empirical investigation of the contribution of strategic
sourcing to manufacturing flexibilities and performance. Decision Sciences 30 (3), 683-718.
Neher, A., 2005. The configurational approach in supply chain management. In: Kotzab, H.,
Seuring, S., Müller, M., Reiner, G. (eds.), Research methodologies in supply chain management. Heidelberg: Physica-Verlag HD, 2005, 75-89.
Nunnally, J.C., Bernstein, I.H., 1994. Psychometric theory. 3rd ed., NY: McGraw-Hill. Pagell, M., Krause, D.R., 2004. Re-exploring the relationship between flexibility and the
external environment. Journal of Operations Management 21 (6), 629-649. Phillips, L.W., 1981. Assessing measurement error in key informant reports: A
methodological note on organizational analysis in marketing. Journal of Marketing Research 18 (4), 395-415.
Pohlen, T., Coleman, B., 2005. Evaluating internal operations and supply chain performance
using EVA and ABC. S.A.M. Advanced Management Journal 70 (2), 45-58. Pike, R., Neale, B., 1999. Corporate Finance and Investment: Decision and Strategies. 2nd
ed., NY: Prentice Hall. Podsakoff, P.M., MacKenzie, S.B., Lee, J.-Y., Podsakoff, N.P., 2003. Common method
biases in behavioral research: A critical review of the literature and recommended remedies. Journal of Applied Psychology 88 (5), 879-903.
Podsakoff, P.M., Organ, D.W., 1986. Self-reports in organizational research: Problems and
prospects. Journal of Management 12 (4), 531-544.
References 136
Porter, M.E., 1980. Competitive strategy: Techniques for analyzing industries and competitors. NY: Free Press.
Presutti, W.D., Jr., Mawhinney, J.R., 2007. The supply chain-finance link. Supply Chain
Management Review 11 (6), 32-38. Randall, T.R., Morgan, R.M., Morton, A.R., 2003. Efficient versus responsive supply chain
choice: An empirical examination of influential factors. Journal of Product Innovation Management 20 (6), 430-443.
Randall, T.R., 2001. The path-dependent effects of product line choice on the evolution of
product lines. Working Paper. University of Utah, Salt Lake County, UT. Reeve, J.M., Srinivasan, M.M., 2005. Which supply chain design is right for you? Supply
Chain Management Review 9 (4), 50-57. Rensis, L.R., 1932. A technique for the measurement of attitudes. NY: McGraw Hill. Rodrigues, A.M., Stank, T.P., Lynch, D.F., 2004. Linking strategy: Structure, process and
performance in integrated logistics. Journal of Business Logistics 25 (2), 65-94. Schefcyzk, M., 1993. Industrial benchmarking: A case study of performance analysis
techniques. International Journal of Production Economics 32 (1), 1-11. Schilling, M.A., Steensma, H.K., 2001. The use of modular organizational forms: An
industry-level analysis. Academy of Management Journal 44 (6), 1149-1168. Schmenner, R.W., Swink, M.L., 1998. On theory in operations management. Journal of
Operations Management 17 (1), 97-113. Selldin, E., Olhager, J., 2007. Linking products with supply chains: Testing Fisher’s model.
Supply Chain Management: An International Journal 12 (1), 42-51. Sethi, A.K., Sethi, S.P., 1990. Flexibility in manufacturing: A survey. International Journal
of Flexible Manufacturing Systems 2 (4), 289-328. Sharifi, H., Zhang, Z., 1999. A methodology for achieving agility in manufacturing
organisations: An introduction. International Journal of Production Economics 67 (1-2), 7-22.
Shin, H., Collier, D.A., Wilson, D.D., 2000. Supply management orientation and
supplier/buyer performance. Journal of Operations Management 18 (3), 317-333. Shook, J., 2009. Toyota’s secret: The A3 report. MIT Sloan Management Review 50 (4), 30-
33.

References 137
Siguaw, J.A., Brown, G., Widing, R.E., II, 1994. The influence of market orientation of the firm on sales force behavior and attitudes. Journal of Marketing Research, 31 (1), 106-116.
Simchi-Levi, D., Kaminsky, P., Simchi-Levi, E., 2000. Designing and managing the supply
chain. NY: Irwin McGraw Hill. Sinkovics, R.R., Roath. A.S., 2004. Strategic orientation, capabilities, and performance in
manufacturer-3PL relationships. Journal of Business Logistics 35 (2), 43-64. Slack, N., 1987. The flexibility of manufacturing systems. International Journal of
Operations and Production Management 7 (4), 35-45. Slack, N., 1983. Flexibility as a manufacturing objective. International Journal of Operations
and Production Management 3 (3), 4-13. Slone, R.E., Mentzer, J.T., Dittmann, J.P., 2007. Are you the weakest link in your company’s
supply chain? Harvard Business Review 85 (9), 116-127 Smock, D., 2009. What's causing huge delays for the Boeing 787 Dreamliner? From
outsourced design engineering, to composites technology, there are many possible reasons for the holdup. Design News 64 (9), 31-34.
Steiger, J.H., 2007. Understanding the limitations of global fit assessment in structural
equations modeling. Personality and Individual Differences 42 (5), 893-898. Stemmler, L., 2003. The role of finance in supply chain management. In: Seuring, S.,
Goldbach, M. (eds.): Cost management in supply chains. Heidelberg: Physica-Verlag HD, 2002, 165-176.
Steward, T.J., 1996. Relationships between Data Envelopment Analysis and multicriteria
decision analysis. Journal of the Operational Research Society 47 (5), 654-665. Stock, G.N., Greis, N.P., Kasarda, J.D., 2000. Enterprise logistics and supply chain structure:
The role of fit. Journal of Operations Management 18 (5), 531-547. Swafford, P.M., Ghosh, S., Murthy, N., 2006. Antecedents of supply chain agility of a firm:
Scale development and model testing. Journal of Operations Management 24 (2), 170-188.
Swamidass, P.M., Newell, W.T., 1987. Manufacturing strategy, environmental uncertainty
and performance: A path analytic model. Management Science 33 (4), 509-524. Tagras, G., Lee, H.L., 1992. Economic models for vendor evaluation with quality cost
analysis. Working paper. Stanford University, Stanford, CA, 1-13.
References 138
Takeuchi, H., Osono, E., Shimizu, N., 2008. The contradictions that drive Toyota’s success. Harvard Business Review 86 (6), 96-105.
Tang, C.S., Tomlin, B., 2008. The power of flexibility for mitigating supply chain risks.
International Journal of Production Economics 116 (1), 12-27. Taylor, T.A., 2002. Supply chain coordination under channel rebates with sales effort effects.
Management Science 48 (8), 992-1007. Thonemann, U., Behrenback, K., Brinkhoff, A., Großpietsch, J., Küpper, J., Merschmann, U.,
2007. Der Weg zum Supply-Chain-Champion. Harte Fakten zu weichen Themen. Landsberg am Lech, Germany: mi-Verlag.
Timme, S., Williams-Timme, C., 2000. The financial supply chain management connection.
Supply Chain Management Review 4 (5-6), 32-42. Ulrich, K.T., Ellison, D.J., 2005. Beyond make-buy: Internalization and integration of design
and production. Production and Operations Management 14 (3), 315-330. Upton, D.M., 1994. The management of manufacturing flexibility. California Management
Review 36 (2), 72-89. Van de Ven, A.H., Darzin, R., 1985. The concept of fit in contingency theory. Greenwich,
CT: JAP Press. Vickery, S.K., Jayaram, J., Droge, C., Calantone, R., 2003. The effects of an integrative
supply chain strategy on customer service and financial performance: An analysis of direct versus indirect relationships. Journal of Operations Management 21 (5), 523-539.
Vokurka, R.J., O’Leary-Kelly, S.W., 2000. A review of empirical research on manufacturing
flexibility. Journal of Operations Management 18 (4), 485-501. Wagner, S.M., Grosse-Ruyken, P.T., Jönke, R., 2010a. Projekte im Supply Chain
Management – Prioritäten und Ergebnisse. Supply Chain Management 10 (1), (in press).
Wagner, S.M., Rau, C.H., Lindemann, E., 2010b. Multiple informant methodology: A critical
review and recommendations. Sociological Methods & Research 38 (4), (in press). Wagner, S.M., Kemmerling, R., 2010. Handling nonresponse in logistics research. Journal of
Business Logistics 31 (2), (in press). Wagner, S.M., Erhun, F., Grosse-Ruyken, P.T., 2009. Dressing for the weather: Top supply
chain challenges motivate action. Industrial Engineer 41 (2), 29-33.

References 139
Wagner, S.M., Locker, A., 2009. Logistik und Finanzen: Stärkeres Zusammenwachsen ist nötig. Handelszeitung, Special “Logistik” 148 (6), 51.
Wagner, S.M., Bode, C., 2008. An empirical examination of supply chain performance along
several dimensions of risk. Journal of Business Logistics 29 (1), 307-325. Wagner, S.M., Grosse-Ruyken, P.T., 2008. Flexibilität kann das Lager ersetzen.
Handelszeitung, Special “Logistik” 147 (40), 71. Wagner, S.M., Friedl, G., 2007. Supplier switching decisions. European Journal of
Operational Research 183 (2), 700-717. Wagner, S.M., 2006. A firm’s responses to deficient suppliers and competitive advantage.
Journal of Business Research 59 (6), 686-695. Weber, J., Schäffer, U., 2006. Einführung in das Controlling. 11th ed., Stuttgart, Germany:
Schäffer-Poeschel Verlag. Weber, J., 2002. Logistikkostenrechnung. 2nd ed., Berlin, Germany: Springer Verlag. Weber, J., 1999. Stand und Entwicklungsperspektiven des Logistik-Controlling. Working
Paper. WHU – Otto Beisheim School of Management, Vallendar, Germany. Weber, J., Kummer, S., 1998. Logistikmanagement. 2nd ed., Stuttgart, Germany: Springer
Verlag. Wold, H., 1980. Model construction and evaluation when theoretical knowledge is scarce:
Theory and applications of PLS. In: Kmenta, J., Ramsey, J.B. (eds.), Evaluation of econometric models. NY: Academic Press, 1980, 47-74.
Wong, W.P., Wong, K.Y., 2007. Supply chain performance measurement system using DEA
modeling. Industrial Management & Data Systems 107 (3), 361-381. Yazlali, Ö., Erhun, F., 2007. Relating the multiple supply problem to quantity flexibility
contracts. Operations Research Letters 35 (6), 767-772. Youndt, M.A., Snell, S.A., Dean, J.W., Lepak, D.P., 1996. Human resource management:
Manufacturing strategy and firm performance. Academy of Management Journal 39 (4), 836-866.
Youssef, M.A., 1994. Agile manufacturing: The battle ground for competition in the 1990s
and beyond. International Journal of Operations and Production Management 14 (11), 4-6.
Yu, M.M., Lin, E., 2008. Efficiency and effectiveness in railway performance using a multi-
activity network DEA model. Omega 36 (6), 1005-1017.
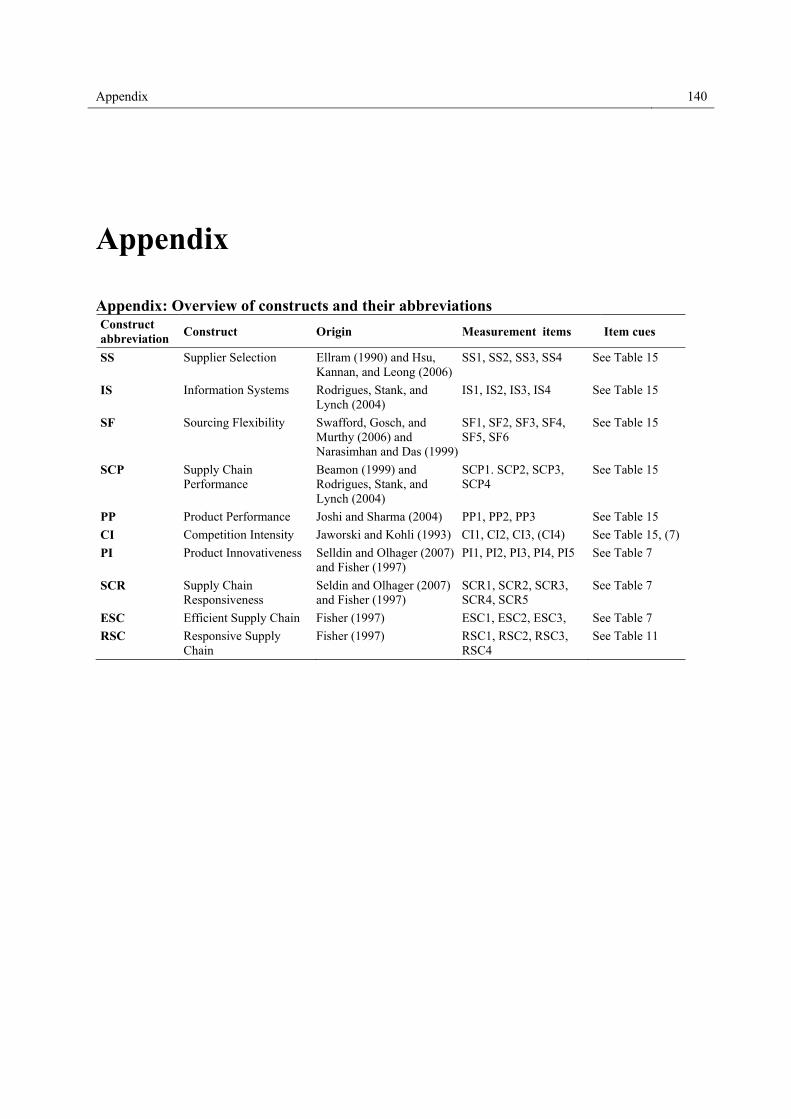
Appendix 140
Appendix
Appendix: Overview of constructs and their abbreviations Construct abbreviation
Construct Origin Measurement items Item cues
SS Supplier Selection Ellram (1990) and Hsu, Kannan, and Leong (2006)
SS1, SS2, SS3, SS4 See Table 15
IS Information Systems Rodrigues, Stank, and Lynch (2004)
IS1, IS2, IS3, IS4 See Table 15
SF Sourcing Flexibility Swafford, Gosch, and Murthy (2006) and Narasimhan and Das (1999)
SF1, SF2, SF3, SF4, SF5, SF6
See Table 15
SCP Supply Chain Performance
Beamon (1999) and Rodrigues, Stank, and Lynch (2004)
SCP1. SCP2, SCP3, SCP4
See Table 15
PP Product Performance Joshi and Sharma (2004) PP1, PP2, PP3 See Table 15
CI Competition Intensity Jaworski and Kohli (1993) CI1, CI2, CI3, (CI4) See Table 15, (7)
PI Product Innovativeness Selldin and Olhager (2007) and Fisher (1997)
PI1, PI2, PI3, PI4, PI5 See Table 7
SCR Supply Chain Responsiveness
Seldin and Olhager (2007) and Fisher (1997)
SCR1, SCR2, SCR3, SCR4, SCR5
See Table 7
ESC Efficient Supply Chain Fisher (1997) ESC1, ESC2, ESC3, See Table 7
RSC Responsive Supply Chain
Fisher (1997) RSC1, RSC2, RSC3, RSC4
See Table 11
Related Documents