Project Name: Westside Subway Extension Cell Pressure: 75.0 psi Project No: 4953-10-1561 Back Pressure : 30.0 psi Test Pit: G-144 Consolidation Pressure : 45.0 psi Depth(ft): 75.5 Initial Sample Height: 4.667 in Sample No.: 22 Initial Area of Sample: 5.371 sq. in. Sample Type: Mod. Cal. Final Sample Ht.* (L): 4.666 in Sample Description: Brown Lean Clay w/ sand Final Sample Area (A)*: 5.300 sq. in. Induced OCR= 1.0 Cell Load Axial Back Deviator Axial Pore Shear Normal Pressure Deformation Pressure Stress Strain Pressure Stress Stress Change q' p' (S1-S3) (S1-S3)/2 (S1'+S3')/2 (psi) (lbs) (in) (psi) (ksf) (%) (ksf) (ksf) (ksf) 75.0 0 0.000 30.1 0.00 0.00 0.00 0.00 6.48 75.0 94 0.004 38.2 2.55 0.09 1.17 1.28 6.59 75.0 163 0.011 43.7 4.42 0.24 1.97 2.21 6.72 75.0 209 0.018 47.2 5.66 0.38 2.46 2.83 6.85 75.0 247 0.025 49.6 6.68 0.53 2.81 3.34 7.01 75.0 280 0.031 51.4 7.56 0.66 3.07 3.78 7.19 75.0 307 0.038 52.7 8.27 0.81 3.26 4.14 7.35 75.0 331 0.045 53.8 8.91 0.96 3.41 4.45 7.52 75.0 350 0.052 54.5 9.40 1.10 3.52 4.70 7.67 75.0 365 0.058 54.9 9.79 1.24 3.58 4.90 7.80 75.0 377 0.065 55.2 10.10 1.39 3.62 5.05 7.91 75.0 387 0.071 55.3 10.35 1.53 3.63 5.18 8.02 75.0 396 0.078 55.3 10.58 1.68 3.63 5.29 8.14 75.0 403 0.086 55.2 10.75 1.83 3.63 5.37 8.23 75.0 410 0.092 55.1 10.92 1.98 3.61 5.46 8.33 75.0 416 0.099 54.9 11.06 2.12 3.58 5.53 8.43 75.0 421 0.106 54.7 11.18 2.27 3.55 5.59 8.52 75.0 426 0.114 54.5 11.29 2.43 3.52 5.65 8.61 75.0 431 0.121 54.3 11.41 2.59 3.48 5.70 8.70 75.0 436 0.128 54.0 11.52 2.75 3.45 5.76 8.79 75.0 440 0.136 53.8 11.61 2.92 3.41 5.80 8.87 75.0 444 0.143 53.5 11.69 3.07 3.38 5.85 8.95 75.0 448 0.151 53.3 11.78 3.24 3.34 5.89 9.03 75.0 452 0.158 53.0 11.86 3.39 3.30 5.93 9.11 75.0 456 0.165 52.8 11.95 3.53 3.27 5.98 9.19 75.0 460 0.172 52.5 12.04 3.69 3.23 6.02 9.27 75.0 463 0.179 52.2 12.10 3.84 3.19 6.05 9.33 75.0 467 0.186 52.0 12.18 3.98 3.16 6.09 9.42 75.0 470 0.192 51.7 12.24 4.12 3.12 6.12 9.48 75.0 474 0.199 51.5 12.33 4.27 3.09 6.16 9.56 75.0 476 0.206 51.2 12.36 4.42 3.05 6.18 9.61 75.0 480 0.214 51.0 12.44 4.58 3.01 6.22 9.69 75.0 483 0.220 50.7 12.50 4.71 2.98 6.25 9.75 CONSOLIDATED UNDRAINED TRIAXIAL TEST WITH PORE PRESSURE MEASUREMENT Figure F-2.229

Welcome message from author
This document is posted to help you gain knowledge. Please leave a comment to let me know what you think about it! Share it to your friends and learn new things together.
Transcript

Project Name: Westside Subway Extension Cell Pressure: 75.0 psi
Project No: 4953-10-1561 Back Pressure : 30.0 psi
Test Pit: G-144 Consolidation Pressure : 45.0 psi
Depth(ft): 75.5 Initial Sample Height: 4.667 in
Sample No.: 22 Initial Area of Sample: 5.371 sq. in.
Sample Type: Mod. Cal. Final Sample Ht.* (L): 4.666 in
Sample Description: Brown Lean Clay w/ sand Final Sample Area (A)*: 5.300 sq. in.
Induced OCR= 1.0
Cell Load Axial Back Deviator Axial Pore Shear Normal
Pressure Deformation Pressure Stress Strain Pressure Stress Stress
Change q' p'
(S1-S3) (S1-S3)/2 (S1'+S3')/2
(psi) (lbs) (in) (psi) (ksf) (%) (ksf) (ksf) (ksf)
75.0 0 0.000 30.1 0.00 0.00 0.00 0.00 6.48
75.0 94 0.004 38.2 2.55 0.09 1.17 1.28 6.59
75.0 163 0.011 43.7 4.42 0.24 1.97 2.21 6.72
75.0 209 0.018 47.2 5.66 0.38 2.46 2.83 6.85
75.0 247 0.025 49.6 6.68 0.53 2.81 3.34 7.01
75.0 280 0.031 51.4 7.56 0.66 3.07 3.78 7.19
75.0 307 0.038 52.7 8.27 0.81 3.26 4.14 7.35
75.0 331 0.045 53.8 8.91 0.96 3.41 4.45 7.52
75.0 350 0.052 54.5 9.40 1.10 3.52 4.70 7.67
75.0 365 0.058 54.9 9.79 1.24 3.58 4.90 7.80
75.0 377 0.065 55.2 10.10 1.39 3.62 5.05 7.91
75.0 387 0.071 55.3 10.35 1.53 3.63 5.18 8.02
75.0 396 0.078 55.3 10.58 1.68 3.63 5.29 8.14
75.0 403 0.086 55.2 10.75 1.83 3.63 5.37 8.23
75.0 410 0.092 55.1 10.92 1.98 3.61 5.46 8.33
75.0 416 0.099 54.9 11.06 2.12 3.58 5.53 8.43
75.0 421 0.106 54.7 11.18 2.27 3.55 5.59 8.52
75.0 426 0.114 54.5 11.29 2.43 3.52 5.65 8.61
75.0 431 0.121 54.3 11.41 2.59 3.48 5.70 8.70
75.0 436 0.128 54.0 11.52 2.75 3.45 5.76 8.79
75.0 440 0.136 53.8 11.61 2.92 3.41 5.80 8.87
75.0 444 0.143 53.5 11.69 3.07 3.38 5.85 8.95
75.0 448 0.151 53.3 11.78 3.24 3.34 5.89 9.03
75.0 452 0.158 53.0 11.86 3.39 3.30 5.93 9.11
75.0 456 0.165 52.8 11.95 3.53 3.27 5.98 9.19
75.0 460 0.172 52.5 12.04 3.69 3.23 6.02 9.27
75.0 463 0.179 52.2 12.10 3.84 3.19 6.05 9.33
75.0 467 0.186 52.0 12.18 3.98 3.16 6.09 9.42
75.0 470 0.192 51.7 12.24 4.12 3.12 6.12 9.48
75.0 474 0.199 51.5 12.33 4.27 3.09 6.16 9.5675.0 476 0.206 51.2 12.36 4.42 3.05 6.18 9.61
75.0 480 0.214 51.0 12.44 4.58 3.01 6.22 9.69
75.0 483 0.220 50.7 12.50 4.71 2.98 6.25 9.75
CONSOLIDATED UNDRAINED TRIAXIAL TEST WITH PORE PRESSURE MEASUREMENT
Figure F-2.229

Project Name: Westside Subway Extension Cell Pressure: 90.0 psi
Project No: 4953-10-1561 Back Pressure : 30.0 psi
Test Pit: G-144 Consolidation Pressure : 60.0 psi
Depth(ft): 75.5 Initial Sample Height: 4.667 in
Sample No.: 22 Initial Area of Sample: 5.371 sq. in.
Sample Type: Mod. Cal. Final Sample Ht.* (L): 4.664 in
Sample Description: Brown Lean Clay w/ sand Final Sample Area (A)*: 5.335 sq. in.
Induced OCR= 1.0
Cell Load Axial Back Deviator Axial Pore Shear Normal
Pressure Deformation Pressure Stress Strain Pressure Stress Stress
Change q' p'
(S1-S3) (S1-S3)/2 (S1'+S3')/2
(psi) (lbs) (in) (psi) (ksf) (%) (ksf) (ksf) (ksf)
90.0 0 0.000 30.0 0.00 0.00 0.00 0.00 8.64
90.0 154 0.006 34.5 4.16 0.13 0.65 2.08 10.07
90.0 221 0.012 37.5 5.96 0.26 1.08 2.98 10.54
90.0 283 0.018 40.7 7.60 0.39 1.54 3.80 10.90
90.0 332 0.024 43.4 8.91 0.51 1.93 4.46 11.16
90.0 376 0.030 45.9 10.08 0.64 2.29 5.04 11.39
90.0 416 0.036 48.2 11.13 0.77 2.62 5.57 11.59
90.0 453 0.042 50.2 12.11 0.90 2.91 6.06 11.78
90.0 484 0.048 51.9 12.92 1.03 3.15 6.46 11.95
90.0 506 0.054 53.1 13.50 1.16 3.32 6.75 12.07
90.0 524 0.060 54.0 13.95 1.29 3.45 6.97 12.16
90.0 567 0.090 55.5 15.02 1.93 3.68 7.51 12.47
90.0 575 0.100 55.5 15.18 2.14 3.68 7.59 12.55
90.0 591 0.128 55.0 15.52 2.75 3.60 7.76 12.80
90.0 608 0.172 53.6 15.81 3.69 3.40 7.90 13.14
90.0 622 0.220 52.2 16.00 4.72 3.20 8.00 13.44
90.0 634 0.265 50.9 16.14 5.69 3.00 8.07 13.71
90.0 645 0.310 49.5 16.26 6.64 2.81 8.13 13.96
90.0 655 0.357 48.1 16.32 7.65 2.60 8.16 14.19
90.0 664 0.402 46.9 16.38 8.62 2.43 8.19 14.40
90.0 673 0.447 46.2 16.43 9.58 2.33 8.22 14.53
90.0 681 0.494 45.2 16.43 10.59 2.18 8.21 14.67
90.0 687 0.537 44.1 16.41 11.52 2.03 8.21 14.82
90.0 696 0.583 43.1 16.43 12.50 1.88 8.21 14.97
90.0 701 0.629 42.1 16.37 13.50 1.74 8.19 15.09
90.0 706 0.673 41.1 16.30 14.43 1.60 8.15 15.19
90.0 712 0.719 40.3 16.26 15.42 1.48 8.13 15.30
90.0 717 0.765 39.4 16.18 16.40 1.36 8.09 15.37
90.0 723 0.808 38.6 16.12 17.33 1.24 8.06 15.46
90.0 728 0.855 37.8 16.05 18.33 1.13 8.03 15.5490.0 732 0.899 36.9 15.94 19.29 1.00 7.97 15.61
90.0 737 0.945 36.2 15.85 20.25 0.89 7.93 15.68
90.0 742 0.991 35.8 15.77 21.25 0.83 7.89 15.70
90.0 746 1.035 35.2 15.66 22.19 0.75 7.83 15.72
CONSOLIDATED UNDRAINED TRIAXIAL TEST WITH PORE PRESSURE MEASUREMENT
Figure F-2.230

LEGEND: CONFINING PRESSURES= ○ 30 psi □ 45 psi ∆ 60 psi
Project Name: Westside Subway Extension Sample Type: Mod. Cal.
Project No.: 4953-10-1561 Sample Description: Brown Lean Clay w/ sand
Test Pit: G-144 Avg. Dry Unit Weight (pcf): 112.3
Sample No.: 22 Avg. Initial Moisture Content (%): 16.7
Depth (ft): 75.5 Confining Pressure: 30.0, 45.0, 60.0 psi
CU TRIAXIAL MULTI-STAGE TEST WITH PORE PRESSURE MEASUREMENTASTM D 4767
0
5
10
15
20
0 5 10 15 20 25 30 35 40
NORMAL STRESS, P' (ksf)
SH
EA
R S
TR
ES
S, q
' (ks
f)
0.0
2.0
4.0
6.0
8.0
10.0
12.0
14.0
16.0
18.0
20.0
0.0 5.0 10.0 15.0 20.0
AXIAL STRAIN (Percent)
DE
VIA
TO
R S
TR
ES
S (
ksf)
-4.0
-3.0
-2.0
-1.0
0.0
1.0
2.0
3.0
4.0
0.0 5.0 10.0 15.0 20.0
AXIAL STRAIN (Percent)C
HA
NG
E I
N P
OR
E W
AT
ER
PR
ES
SU
RE
(ks
f)
Figure F-2.231
LEGEND: CONFINING PRESSURES= ○ 30 psi □ 45 psi ∆ 60 psi
Project Name: Westside Subway Extension Sample Type: Mod. Cal.Project No.: 4953-10-1561 Sample Description: Brown Lean Clay w/ sandTest Pit: G-144 Avg. Dry Unit Weight (pcf): 112.3Sample No.: 22 Avg. Initial Moisture Content (%): 16.7Depth (ft): 75.5 Confining Pressure: 30.0, 45.0, 60.0 psi
CU TRIAXIAL MULTI-STAGE TEST WITH PORE PRESSURE MEASUREMENTASTM D 4767
0
5
10
15
0 5 10 15 20 25 30
NORMAL STRESS (ksf)
SH
EA
R S
TR
ES
S (
ksf)
φ=27°
φ'= 30°
0
5
10
15
20
0 5 10 15 20 25 30 35 40 p' (ksf)
q' (
ksf)
C= 0.40 ksfC'= 1.40 ksf
Failure Criteria: 5% Axial Strain
Figure F-2.232
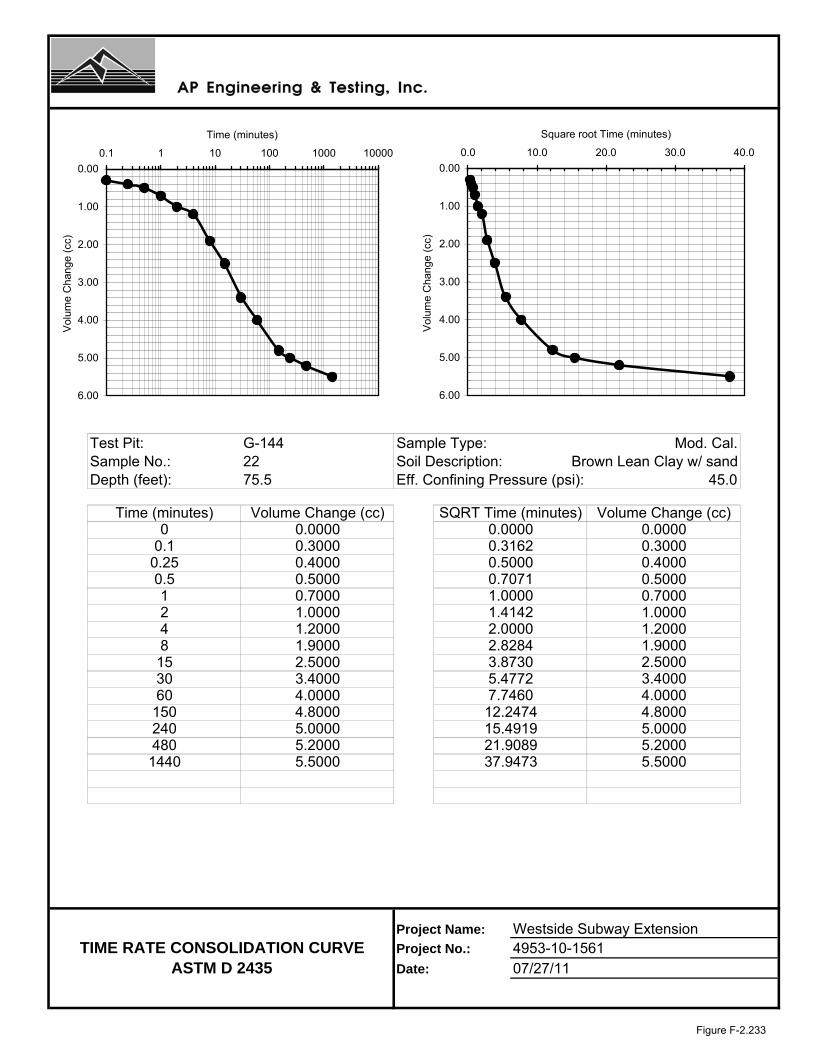
Test Pit: G-144 Sample Type: Mod. Cal.Sample No.: 22 Soil Description: Brown Lean Clay w/ sandDepth (feet): 75.5 Eff. Confining Pressure (psi): 45.0
Project Name: Westside Subway ExtensionProject No.: 4953-10-1561Date: 07/27/11
5.5000
150240480
37.9473
8153060
0.250.512
0.3000
Time (minutes) Volume Change (cc)0.00000.3000
00.1
SQRT Time (minutes) Volume Change (cc)0.0000 0.0000
2.82843.87305.4772
0.31620.50000.70711.00001.4142
0.4000
4.0000
1.20001.90002.50003.4000
7.7460
2.00001.2000
TIME RATE CONSOLIDATION CURVE
2.50003.40004.0000
5.00005.2000
4
ASTM D 2435
4.80005.00005.2000
12.247415.491921.9089
1440 5.5000
4.8000
0.50000.70001.0000
1.9000
0.40000.50000.70001.0000
0.00
1.00
2.00
3.00
4.00
5.00
6.00
0.1 1 10 100 1000 10000
Time (minutes)
Vol
ume
Cha
nge
(cc)
0.00
1.00
2.00
3.00
4.00
5.00
6.00
0.0 10.0 20.0 30.0 40.0
Square root Time (minutes)
Vol
ume
Cha
nge
(cc)
Figure F-2.233

Test Procedure: ASTM D 4767
Project Name: Westside Subway Extension Tested by: ST Date: 07-22-11
Project No.: 4953-10-1561 Input Data by: KM Date: 08-03-11
Test Pit: G-145 Reviewed by: AP Date: 08-03-11
Sample No.: 1 Sample Description: Sandy Clay
Depth(ft): 10.5
Sample Type: Mod. Cal. Confining Pressure = 5.0 psi
Diameter (in) 2.615 2.615 2.615 Avg. = 2.615
Height (in) 4.746 4.746 4.746 Avg. = 4.746
BEFORE CONSOLIDATION AFTER CONSOLIDATION
Area (in²) 5.371 5.405
Moisture Content (%) 18.84 23.48
Wet Weight (gms) 294.10 1003.62
Dry Weight (gms) 271.20 841.62
Container Weight (gms) 149.67 151.61
Density and Saturation
Wet Weight (gms) 830.48
Container Weight (gms) 0.00
Wet Density (pcf) 124.1
Dry Density (pcf) 104.4
Initial Void Ratio 0.613
% Saturation 83.0
Assumed Specific Gravity = 2.70
Back Pressure Saturation
B Value (%) = 96 Change in Ht. of the Specimen (in)= 0
Consolidation
Cell Pressure (psi) = 45.0 Initial Burette Ht.(cm)= 74.1
Back Pressure(psi) = 40.0 Final Burette Ht.(cm)= 73.0
Eff. Consol. Stress (psi) = 5.0 Final Height (in)= 4.704
Induced OCR = 1.0 Initial Volume (cu.in)= 25.489
Change in Ht. of Specimen (in) = 0.0424 Final Volume (cu.in) = 25.422
Shear At Failure
Rate of Deformation (in/min)= 0.005 Deviator Stress (ksf) = 2.07
Time to 50% primary Consolidation (min) = 5 Eff. Minor Principal stress (ksf) = 0.42
Failure Mode: Bulging Failure Eff. Major Principal stress (ksf) = 2.49
Axial Strain (%) = 5.34
CONSOLIDATED UNDRAINED TRIAXIAL TEST WITH PORE PRESSURE MEASUREMENT
Figure F-2.234

Test Procedure: ASTM D 4767
Project Name: Westside Subway Extension Tested by: ST Date: 07-22-11
Project No.: 4953-10-1561 Input Data by: KM Date: 08-03-11
Test Pit: G-145 Reviewed by: AP Date: 08-03-11
Sample No.: 1 Sample Description: Sandy Clay
Depth(ft): 10.5
Sample Type: Mod. Cal. Confining Pressure = 10.0 psi
Diameter (in) 2.615 2.615 2.615 Avg. = 2.615
Height (in) 4.746 4.746 4.746 Avg. = 4.746
BEFORE CONSOLIDATION AFTER CONSOLIDATION
Area (in²) 5.371 5.285
Moisture Content (%) 18.84 23.48
Wet Weight (gms) 294.10 1003.62
Dry Weight (gms) 271.20 841.62
Container Weight (gms) 149.67 151.61
Density and Saturation
Wet Weight (gms) 830.48
Container Weight (gms) 0.00
Wet Density (pcf) 124.1
Dry Density (pcf) 104.4
Initial Void Ratio 0.613
% Saturation 83.0
Assumed Specific Gravity = 2.70
Back Pressure Saturation
B Value (%) = 96 Change in Ht. of the Specimen (in)= 0
Consolidation
Cell Pressure (psi) = 50.0 Initial Burette Ht.(cm)= 73.0
Back Pressure(psi) = 40.0 Final Burette Ht.(cm)= 66.3
Eff. Consol. Stress (psi) = 10.0 Final Height (in)= 4.746
Induced OCR= 1.0 Initial Volume (cu.in)= 25.489
Change in Ht. of Specimen (in) = 0.0000 Final Volume (cu.in) = 25.081
Shear At Failure
Rate of Deformation (in/min)= 0.005 Deviator Stress (ksf) = 3.18
Time to 50% primary Consolidation = 5 Eff. Minor Principal stress (ksf) = 1.02
Failure Mode: Bulging Failure Eff. Major Principal stress (ksf) = 4.20
Axial Strain (%) = 5.28
CONSOLIDATED UNDRAINED TRIAXIAL TEST WITH PORE PRESSURE MEASUREMENT
Figure F-2.235

Test Procedure: ASTM D 4767
Project Name: Westside Subway Extension Tested by: ST Date: 07-22-11
Project No.: Input Data by: KM Date: 08-03-11
Test Pit: G-145 Reviewed by: AP Date: 08-03-11
Sample No.: 1 Sample Description: Sandy Clay
Depth(ft): 10.5
Sample Type: Mod. Cal. Confining Pressure = 20.0 psi
Diameter (in) 2.615 2.615 2.615 Avg. = 2.615
Height (in) 4.746 4.746 4.746 Avg. = 4.746
BEFORE CONSOLIDATION AFTER CONSOLIDATION
Area (in²) 5.371 8.747
Moisture Content (%) 18.84 23.48
Wet Weight (gms) 294.10 1003.62
Dry Weight (gms) 271.20 841.62
Container Weight (gms) 149.67 151.61
Density and Saturation
Wet Weight (gms) 830.48
Container Weight (gms) 0.00
Wet Density (pcf) 124.1
Dry Density (pcf) 104.4
Initial Void Ratio 0.613
% Saturation 83.0
Assumed Specific Gravity = 2.70
Back Pressure Saturation
B Value (%) = 96 Change in Ht. of the Specimen (in)= 0
Consolidation
Cell Pressure (psi) = 60.0 Initial Burette Ht.(cm)= 66.3
Back Pressure(psi) = 40.0 Final Burette Ht.(cm)= 328.9
Eff. Consol. Stress (psi) = 20.0 Final Height (in)= 4.746
Induced OCR = 1.0 Initial Volume (cu.in)= 25.489
Change in Ht. of Specimen (in) = 0.0000 Final Volume (cu.in) = 41.511
Shear At Failure
Rate of Deformation (in/min)= 0.005 Deviator Stress (ksf) = 4.92
Time to 50% primary Consolidation = 5 Eff. Minor Principal stress (ksf) = 1.99
Failure Mode: Bulging Failure Eff. Major Principal stress (ksf) = 6.91
Axial Strain (%) = 5.64
CONSOLIDATED UNDRAINED TRIAXIAL TEST WITH PORE PRESSURE MEASUREMENT
4953-10-1561
Figure F-2.236
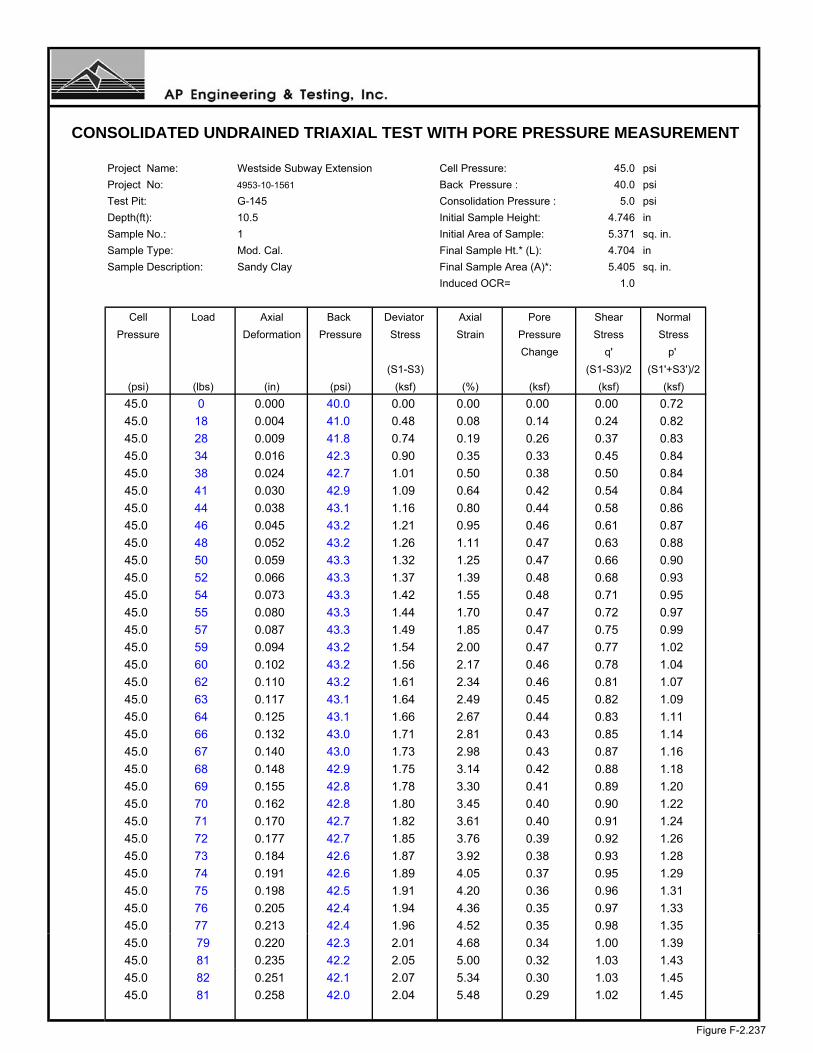
Project Name: Westside Subway Extension Cell Pressure: 45.0 psi
Project No: 4953-10-1561 Back Pressure : 40.0 psi
Test Pit: G-145 Consolidation Pressure : 5.0 psi
Depth(ft): 10.5 Initial Sample Height: 4.746 in
Sample No.: 1 Initial Area of Sample: 5.371 sq. in.
Sample Type: Mod. Cal. Final Sample Ht.* (L): 4.704 in
Sample Description: Sandy Clay Final Sample Area (A)*: 5.405 sq. in.
Induced OCR= 1.0
Cell Load Axial Back Deviator Axial Pore Shear Normal
Pressure Deformation Pressure Stress Strain Pressure Stress Stress
Change q' p'
(S1-S3) (S1-S3)/2 (S1'+S3')/2
(psi) (lbs) (in) (psi) (ksf) (%) (ksf) (ksf) (ksf)
45.0 0 0.000 40.0 0.00 0.00 0.00 0.00 0.72
45.0 18 0.004 41.0 0.48 0.08 0.14 0.24 0.82
45.0 28 0.009 41.8 0.74 0.19 0.26 0.37 0.83
45.0 34 0.016 42.3 0.90 0.35 0.33 0.45 0.84
45.0 38 0.024 42.7 1.01 0.50 0.38 0.50 0.84
45.0 41 0.030 42.9 1.09 0.64 0.42 0.54 0.84
45.0 44 0.038 43.1 1.16 0.80 0.44 0.58 0.86
45.0 46 0.045 43.2 1.21 0.95 0.46 0.61 0.87
45.0 48 0.052 43.2 1.26 1.11 0.47 0.63 0.88
45.0 50 0.059 43.3 1.32 1.25 0.47 0.66 0.90
45.0 52 0.066 43.3 1.37 1.39 0.48 0.68 0.93
45.0 54 0.073 43.3 1.42 1.55 0.48 0.71 0.95
45.0 55 0.080 43.3 1.44 1.70 0.47 0.72 0.97
45.0 57 0.087 43.3 1.49 1.85 0.47 0.75 0.99
45.0 59 0.094 43.2 1.54 2.00 0.47 0.77 1.02
45.0 60 0.102 43.2 1.56 2.17 0.46 0.78 1.04
45.0 62 0.110 43.2 1.61 2.34 0.46 0.81 1.07
45.0 63 0.117 43.1 1.64 2.49 0.45 0.82 1.09
45.0 64 0.125 43.1 1.66 2.67 0.44 0.83 1.11
45.0 66 0.132 43.0 1.71 2.81 0.43 0.85 1.14
45.0 67 0.140 43.0 1.73 2.98 0.43 0.87 1.16
45.0 68 0.148 42.9 1.75 3.14 0.42 0.88 1.18
45.0 69 0.155 42.8 1.78 3.30 0.41 0.89 1.20
45.0 70 0.162 42.8 1.80 3.45 0.40 0.90 1.22
45.0 71 0.170 42.7 1.82 3.61 0.40 0.91 1.24
45.0 72 0.177 42.7 1.85 3.76 0.39 0.92 1.26
45.0 73 0.184 42.6 1.87 3.92 0.38 0.93 1.28
45.0 74 0.191 42.6 1.89 4.05 0.37 0.95 1.29
45.0 75 0.198 42.5 1.91 4.20 0.36 0.96 1.31
45.0 76 0.205 42.4 1.94 4.36 0.35 0.97 1.33
45.0 77 0.213 42.4 1.96 4.52 0.35 0.98 1.35
45.0 79 0.220 42.3 2.01 4.68 0.34 1.00 1.39
45.0 81 0.235 42.2 2.05 5.00 0.32 1.03 1.43
45.0 82 0.251 42.1 2.07 5.34 0.30 1.03 1.45
45.0 81 0.258 42.0 2.04 5.48 0.29 1.02 1.45
CONSOLIDATED UNDRAINED TRIAXIAL TEST WITH PORE PRESSURE MEASUREMENT
Figure F-2.237
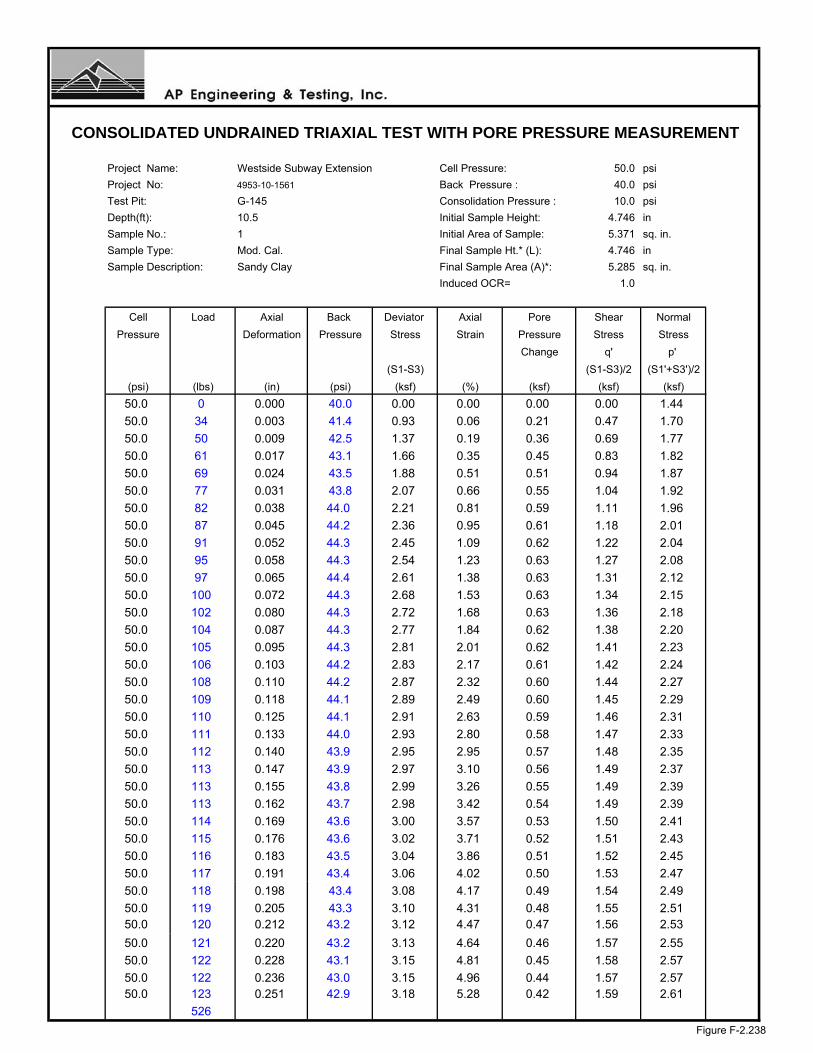
Project Name: Westside Subway Extension Cell Pressure: 50.0 psi
Project No: 4953-10-1561 Back Pressure : 40.0 psi
Test Pit: G-145 Consolidation Pressure : 10.0 psi
Depth(ft): 10.5 Initial Sample Height: 4.746 in
Sample No.: 1 Initial Area of Sample: 5.371 sq. in.
Sample Type: Mod. Cal. Final Sample Ht.* (L): 4.746 in
Sample Description: Sandy Clay Final Sample Area (A)*: 5.285 sq. in.
Induced OCR= 1.0
Cell Load Axial Back Deviator Axial Pore Shear Normal
Pressure Deformation Pressure Stress Strain Pressure Stress Stress
Change q' p'
(S1-S3) (S1-S3)/2 (S1'+S3')/2
(psi) (lbs) (in) (psi) (ksf) (%) (ksf) (ksf) (ksf)
50.0 0 0.000 40.0 0.00 0.00 0.00 0.00 1.44
50.0 34 0.003 41.4 0.93 0.06 0.21 0.47 1.70
50.0 50 0.009 42.5 1.37 0.19 0.36 0.69 1.77
50.0 61 0.017 43.1 1.66 0.35 0.45 0.83 1.82
50.0 69 0.024 43.5 1.88 0.51 0.51 0.94 1.87
50.0 77 0.031 43.8 2.07 0.66 0.55 1.04 1.92
50.0 82 0.038 44.0 2.21 0.81 0.59 1.11 1.96
50.0 87 0.045 44.2 2.36 0.95 0.61 1.18 2.01
50.0 91 0.052 44.3 2.45 1.09 0.62 1.22 2.04
50.0 95 0.058 44.3 2.54 1.23 0.63 1.27 2.08
50.0 97 0.065 44.4 2.61 1.38 0.63 1.31 2.12
50.0 100 0.072 44.3 2.68 1.53 0.63 1.34 2.15
50.0 102 0.080 44.3 2.72 1.68 0.63 1.36 2.18
50.0 104 0.087 44.3 2.77 1.84 0.62 1.38 2.20
50.0 105 0.095 44.3 2.81 2.01 0.62 1.41 2.23
50.0 106 0.103 44.2 2.83 2.17 0.61 1.42 2.24
50.0 108 0.110 44.2 2.87 2.32 0.60 1.44 2.27
50.0 109 0.118 44.1 2.89 2.49 0.60 1.45 2.29
50.0 110 0.125 44.1 2.91 2.63 0.59 1.46 2.31
50.0 111 0.133 44.0 2.93 2.80 0.58 1.47 2.33
50.0 112 0.140 43.9 2.95 2.95 0.57 1.48 2.35
50.0 113 0.147 43.9 2.97 3.10 0.56 1.49 2.37
50.0 113 0.155 43.8 2.99 3.26 0.55 1.49 2.39
50.0 113 0.162 43.7 2.98 3.42 0.54 1.49 2.39
50.0 114 0.169 43.6 3.00 3.57 0.53 1.50 2.41
50.0 115 0.176 43.6 3.02 3.71 0.52 1.51 2.43
50.0 116 0.183 43.5 3.04 3.86 0.51 1.52 2.45
50.0 117 0.191 43.4 3.06 4.02 0.50 1.53 2.47
50.0 118 0.198 43.4 3.08 4.17 0.49 1.54 2.49
50.0 119 0.205 43.3 3.10 4.31 0.48 1.55 2.5150.0 120 0.212 43.2 3.12 4.47 0.47 1.56 2.53
50.0 121 0.220 43.2 3.13 4.64 0.46 1.57 2.55
50.0 122 0.228 43.1 3.15 4.81 0.45 1.58 2.57
50.0 122 0.236 43.0 3.15 4.96 0.44 1.57 2.5750.0 123 0.251 42.9 3.18 5.28 0.42 1.59 2.61
526
CONSOLIDATED UNDRAINED TRIAXIAL TEST WITH PORE PRESSURE MEASUREMENT
Figure F-2.238
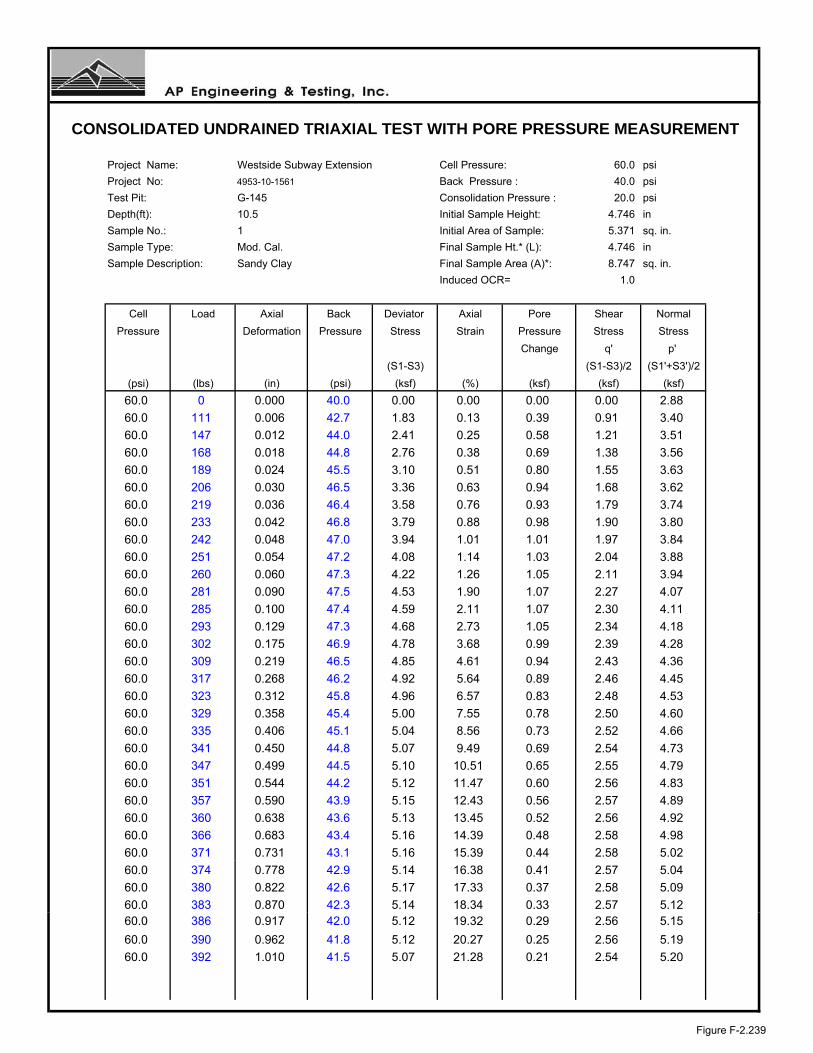
Project Name: Westside Subway Extension Cell Pressure: 60.0 psi
Project No: 4953-10-1561 Back Pressure : 40.0 psi
Test Pit: G-145 Consolidation Pressure : 20.0 psi
Depth(ft): 10.5 Initial Sample Height: 4.746 in
Sample No.: 1 Initial Area of Sample: 5.371 sq. in.
Sample Type: Mod. Cal. Final Sample Ht.* (L): 4.746 in
Sample Description: Sandy Clay Final Sample Area (A)*: 8.747 sq. in.
Induced OCR= 1.0
Cell Load Axial Back Deviator Axial Pore Shear Normal
Pressure Deformation Pressure Stress Strain Pressure Stress Stress
Change q' p'
(S1-S3) (S1-S3)/2 (S1'+S3')/2
(psi) (lbs) (in) (psi) (ksf) (%) (ksf) (ksf) (ksf)
60.0 0 0.000 40.0 0.00 0.00 0.00 0.00 2.88
60.0 111 0.006 42.7 1.83 0.13 0.39 0.91 3.40
60.0 147 0.012 44.0 2.41 0.25 0.58 1.21 3.51
60.0 168 0.018 44.8 2.76 0.38 0.69 1.38 3.56
60.0 189 0.024 45.5 3.10 0.51 0.80 1.55 3.63
60.0 206 0.030 46.5 3.36 0.63 0.94 1.68 3.62
60.0 219 0.036 46.4 3.58 0.76 0.93 1.79 3.74
60.0 233 0.042 46.8 3.79 0.88 0.98 1.90 3.80
60.0 242 0.048 47.0 3.94 1.01 1.01 1.97 3.84
60.0 251 0.054 47.2 4.08 1.14 1.03 2.04 3.88
60.0 260 0.060 47.3 4.22 1.26 1.05 2.11 3.94
60.0 281 0.090 47.5 4.53 1.90 1.07 2.27 4.07
60.0 285 0.100 47.4 4.59 2.11 1.07 2.30 4.11
60.0 293 0.129 47.3 4.68 2.73 1.05 2.34 4.18
60.0 302 0.175 46.9 4.78 3.68 0.99 2.39 4.28
60.0 309 0.219 46.5 4.85 4.61 0.94 2.43 4.36
60.0 317 0.268 46.2 4.92 5.64 0.89 2.46 4.45
60.0 323 0.312 45.8 4.96 6.57 0.83 2.48 4.53
60.0 329 0.358 45.4 5.00 7.55 0.78 2.50 4.60
60.0 335 0.406 45.1 5.04 8.56 0.73 2.52 4.66
60.0 341 0.450 44.8 5.07 9.49 0.69 2.54 4.73
60.0 347 0.499 44.5 5.10 10.51 0.65 2.55 4.79
60.0 351 0.544 44.2 5.12 11.47 0.60 2.56 4.83
60.0 357 0.590 43.9 5.15 12.43 0.56 2.57 4.89
60.0 360 0.638 43.6 5.13 13.45 0.52 2.56 4.92
60.0 366 0.683 43.4 5.16 14.39 0.48 2.58 4.98
60.0 371 0.731 43.1 5.16 15.39 0.44 2.58 5.02
60.0 374 0.778 42.9 5.14 16.38 0.41 2.57 5.04
60.0 380 0.822 42.6 5.17 17.33 0.37 2.58 5.09
60.0 383 0.870 42.3 5.14 18.34 0.33 2.57 5.1260.0 386 0.917 42.0 5.12 19.32 0.29 2.56 5.15
60.0 390 0.962 41.8 5.12 20.27 0.25 2.56 5.19
60.0 392 1.010 41.5 5.07 21.28 0.21 2.54 5.20
CONSOLIDATED UNDRAINED TRIAXIAL TEST WITH PORE PRESSURE MEASUREMENT
Figure F-2.239
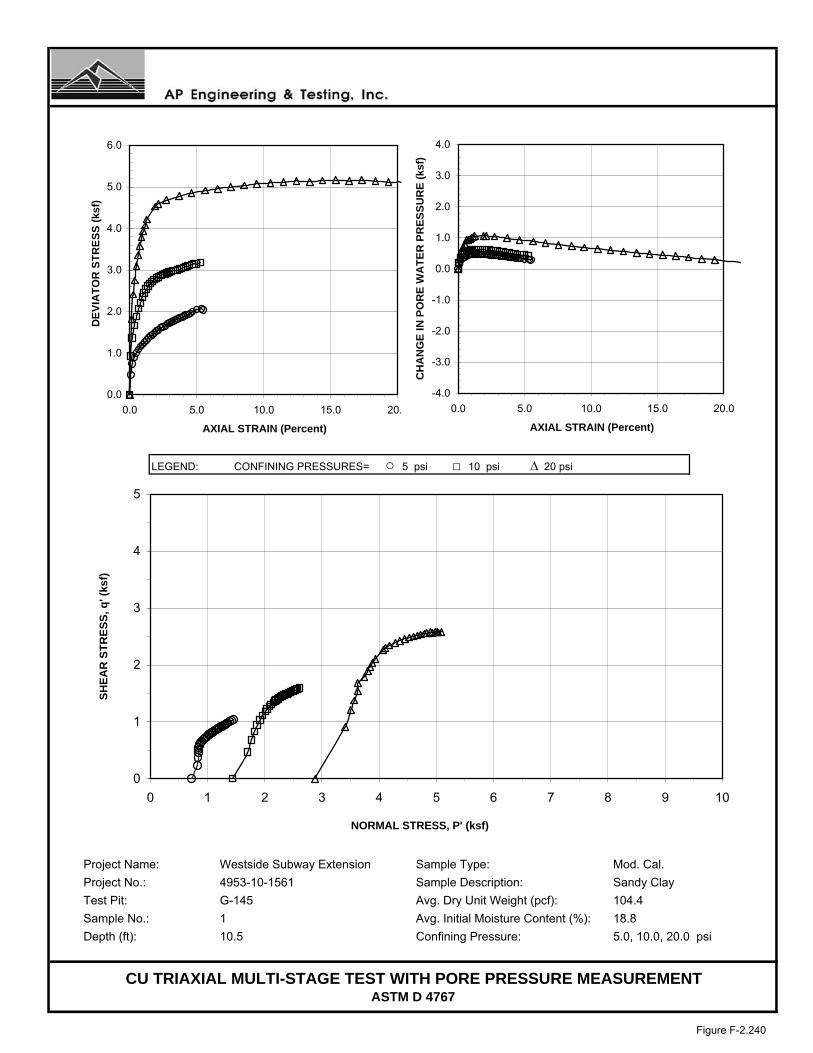
LEGEND: CONFINING PRESSURES= ○ 5 psi □ 10 psi ∆ 20 psi
Project Name: Westside Subway Extension Sample Type: Mod. Cal.
Project No.: 4953-10-1561 Sample Description: Sandy Clay
Test Pit: G-145 Avg. Dry Unit Weight (pcf): 104.4
Sample No.: 1 Avg. Initial Moisture Content (%): 18.8
Depth (ft): 10.5 Confining Pressure: 5.0, 10.0, 20.0 psi
CU TRIAXIAL MULTI-STAGE TEST WITH PORE PRESSURE MEASUREMENTASTM D 4767
0
1
2
3
4
5
0 1 2 3 4 5 6 7 8 9 10
NORMAL STRESS, P' (ksf)
SH
EA
R S
TR
ES
S, q
' (ks
f)
0.0
1.0
2.0
3.0
4.0
5.0
6.0
0.0 5.0 10.0 15.0 20.0
AXIAL STRAIN (Percent)
DE
VIA
TO
R S
TR
ES
S (
ksf)
-4.0
-3.0
-2.0
-1.0
0.0
1.0
2.0
3.0
4.0
0.0 5.0 10.0 15.0 20.0
AXIAL STRAIN (Percent)C
HA
NG
E I
N P
OR
E W
AT
ER
PR
ES
SU
RE
(ks
f)
Figure F-2.240

LEGEND: CONFINING PRESSURES= ○ 5 psi □ 10 psi ∆ 20 psi
Project Name: Westside Subway Extension Sample Type: Mod. Cal.Project No.: 4953-10-1561 Sample Description: Sandy ClayTest Pit: G-145 Avg. Dry Unit Weight (pcf): 104.4Sample No.: 1 Avg. Initial Moisture Content (%): 18.8Depth (ft): 10.5 Confining Pressure: 5.0, 10.0, 20.0 psi
CU TRIAXIAL MULTI-STAGE TEST WITH PORE PRESSURE MEASUREMENTASTM D 4767
0
1
2
3
4
5
0 1 2 3 4 5 6 7 8 9 10
NORMAL STRESS (ksf)
SH
EA
R S
TR
ES
S (
ksf)
φ=23°
φ'= 29°
0
1
2
3
4
5
0 1 2 3 4 5 6 7 8 9 10 p' (ksf)
q' (
ksf)
C= 0.40 ksfC'= 0.35 ksf
Failure Criteria: 5% Axial Strain
Figure F-2.241

Test Pit: G-145 Sample Type: Mod. Cal.Sample No.: 1 Soil Description: Sandy ClayDepth (feet): 10.5 Eff. Confining Pressure (psi): 10.0
Project Name: Westside Subway ExtensionProject No.: 4953-10-1561Date: 07/22/11
6.7000
102240480
32.0000
8153060
0.250.512
0.5000
Time (minutes) Volume Change (cc)0.00000.5000
00.1
SQRT Time (minutes) Volume Change (cc)0.0000 0.0000
2.82843.87305.4772
0.31620.50000.70711.00001.4142
0.7000
5.5000
2.20003.10003.90005.1000
7.7460
2.00002.2000
TIME RATE CONSOLIDATION CURVE
3.90005.10005.5000
6.27126.5700
4
ASTM D 2435
6.00006.27126.5700
10.099515.491921.9089
1024 6.7000
6.0000
0.90001.20001.7000
3.1000
0.70000.90001.20001.7000
0.00
1.00
2.00
3.00
4.00
5.00
6.00
7.00
8.00
0.1 1 10 100 1000 10000
Time (minutes)
Vol
ume
Cha
nge
(cc)
0.00
1.00
2.00
3.00
4.00
5.00
6.00
7.00
8.00
0.0 5.0 10.0 15.0 20.0 25.0 30.0 35.0
Square root Time (minutes)
Vol
ume
Cha
nge
(cc)
Figure F-2.242

Test Procedure: ASTM D 4767
Project Name: Westside Subway Extension Tested by: ST Date: 07-24-11
Project No.: 4953-10-1561 Input Data by: KM Date: 08-03-11
Test Pit: G-145 Reviewed by: AP Date: 08-03-11
Sample No.: 12 Sample Description: Sandy Clay
Depth(ft): 65.5
Sample Type: Mod. Cal. Confining Pressure = 20.0 psi
Diameter (in) 2.615 2.615 2.615 Avg. = 2.615
Height (in) 5.020 5.020 5.020 Avg. = 5.020
BEFORE CONSOLIDATION AFTER CONSOLIDATION
Area (in²) 5.371 5.295
Moisture Content (%) 14.84 19.68
Wet Weight (gms) 23.62 1057.61
Dry Weight (gms) 21.95 908.61
Container Weight (gms) 10.70 151.66
Density and Saturation
Wet Weight (gms) 905.91
Container Weight (gms) 0.00
Wet Density (pcf) 128.0
Dry Density (pcf) 111.5
Initial Void Ratio 0.512
% Saturation 78.3
Assumed Specific Gravity = 2.70
Back Pressure Saturation
B Value (%) = 94 Change in Ht. of the Specimen (in)= 0
Consolidation
Cell Pressure (psi) = 60.0 Initial Burette Ht.(cm)= 76.3
Back Pressure(psi) = 40.0 Final Burette Ht.(cm)= 63.2
Eff. Consol. Stress (psi) = 20.0 Final Height (in)= 4.941
Induced OCR = 1.0 Initial Volume (cu.in)= 26.961
Change in Ht. of Specimen (in) = 0.0787 Final Volume (cu.in) = 26.162
Shear At Failure
Rate of Deformation (in/min)= 0.006 Deviator Stress (ksf) = 4.84
Time to 50% primary Consolidation (min) = 4 Eff. Minor Principal stress (ksf) = 1.36
Failure Mode: Bulging Failure Eff. Major Principal stress (ksf) = 6.19
Axial Strain (%) = 5.18
CONSOLIDATED UNDRAINED TRIAXIAL TEST WITH PORE PRESSURE MEASUREMENT
Figure F-2.243

Test Procedure: ASTM D 4767
Project Name: Westside Subway Extension Tested by: ST Date: 07-24-11
Project No.: 4953-10-1561 Input Data by: KM Date: 08-03-11
Test Pit: G-145 Reviewed by: AP Date: 08-03-11
Sample No.: 12 Sample Description: Sandy Clay
Depth(ft): 65.5
Sample Type: Mod. Cal. Confining Pressure = 40.0 psi
Diameter (in) 2.615 2.615 2.615 Avg. = 2.615
Height (in) 5.020 5.020 5.020 Avg. = 5.020
BEFORE CONSOLIDATION AFTER CONSOLIDATION
Area (in²) 5.371 5.331
Moisture Content (%) 14.84 19.68
Wet Weight (gms) 23.62 1057.61
Dry Weight (gms) 21.95 908.61
Container Weight (gms) 10.70 151.66
Density and Saturation
Wet Weight (gms) 905.91
Container Weight (gms) 0.00
Wet Density (pcf) 128.0
Dry Density (pcf) 111.5
Initial Void Ratio 0.512
% Saturation 78.3
Assumed Specific Gravity = 2.70
Back Pressure Saturation
B Value (%) = 94 Change in Ht. of the Specimen (in)= 0
Consolidation
Cell Pressure (psi) = 80.0 Initial Burette Ht.(cm)= 60.0
Back Pressure(psi) = 40.0 Final Burette Ht.(cm)= 56.7
Eff. Consol. Stress (psi) = 40.0 Final Height (in)= 5.020
Induced OCR= 1.0 Initial Volume (cu.in)= 26.961
Change in Ht. of Specimen (in) = 0.0000 Final Volume (cu.in) = 26.760
Shear At Failure
Rate of Deformation (in/min)= 0.006 Deviator Stress (ksf) = 9.84
Time to 50% primary Consolidation = 4 Eff. Minor Principal stress (ksf) = 3.58
Failure Mode: Bulging Failure Eff. Major Principal stress (ksf) = 13.42
Axial Strain (%) = 5.11
CONSOLIDATED UNDRAINED TRIAXIAL TEST WITH PORE PRESSURE MEASUREMENT
Figure F-2.244

Test Procedure: ASTM D 4767
Project Name: Westside Subway Extension Tested by: ST Date: 07-24-11
Project No.: Input Data by: KM Date: 08-03-11
Test Pit: G-145 Reviewed by: AP Date: 08-03-11
Sample No.: 12 Sample Description: Sandy Clay
Depth(ft): 65.5
Sample Type: Mod. Cal. Confining Pressure = 60.0 psi
Diameter (in) 2.615 2.615 2.615 Avg. = 2.615
Height (in) 5.020 5.020 5.020 Avg. = 5.020
BEFORE CONSOLIDATION AFTER CONSOLIDATION
Area (in²) 5.371 5.271
Moisture Content (%) 14.84 19.68
Wet Weight (gms) 23.62 1057.61
Dry Weight (gms) 21.95 908.61
Container Weight (gms) 10.70 151.66
Density and Saturation
Wet Weight (gms) 905.91
Container Weight (gms) 0.00
Wet Density (pcf) 128.0
Dry Density (pcf) 111.5
Initial Void Ratio 0.512
% Saturation 78.3
Assumed Specific Gravity = 2.70
Back Pressure Saturation
B Value (%) = 94 Change in Ht. of the Specimen (in)= 0
Consolidation
Cell Pressure (psi) = 100.0 Initial Burette Ht.(cm)= 53.5
Back Pressure(psi) = 40.0 Final Burette Ht.(cm)= 45.3
Eff. Consol. Stress (psi) = 60.0 Final Height (in)= 5.020
Induced OCR = 1.0 Initial Volume (cu.in)= 26.961
Change in Ht. of Specimen (in) = 0.0000 Final Volume (cu.in) = 26.461
Shear At Failure
Rate of Deformation (in/min)= 0.006 Deviator Stress (ksf) = 15.45
Time to 50% primary Consolidation = 4 Eff. Minor Principal stress (ksf) = 6.59
Failure Mode: Bulging Failure Eff. Major Principal stress (ksf) = 22.04
Axial Strain (%) = 4.20
CONSOLIDATED UNDRAINED TRIAXIAL TEST WITH PORE PRESSURE MEASUREMENT
4953-10-1561
Figure F-2.245

Project Name: Westside Subway Extension Cell Pressure: 60.0 psi
Project No: 4953-10-1561 Back Pressure : 40.0 psi
Test Pit: G-145 Consolidation Pressure : 20.0 psi
Depth(ft): 65.5 Initial Sample Height: 5.020 in
Sample No.: 12 Initial Area of Sample: 5.371 sq. in.
Sample Type: Mod. Cal. Final Sample Ht.* (L): 4.941 in
Sample Description: Sandy Clay Final Sample Area (A)*: 5.295 sq. in.
Induced OCR= 1.0
Cell Load Axial Back Deviator Axial Pore Shear Normal
Pressure Deformation Pressure Stress Strain Pressure Stress Stress
Change q' p'
(S1-S3) (S1-S3)/2 (S1'+S3')/2
(psi) (lbs) (in) (psi) (ksf) (%) (ksf) (ksf) (ksf)
60.0 0 0.000 40.0 0.00 0.00 0.00 0.00 2.88
60.0 48 0.006 40.9 1.29 0.12 0.12 0.65 3.40
60.0 68 0.013 42.0 1.83 0.26 0.28 0.92 3.51
60.0 78 0.021 43.1 2.10 0.42 0.44 1.05 3.48
60.0 86 0.028 44.2 2.33 0.57 0.60 1.17 3.45
60.0 93 0.035 45.1 2.50 0.70 0.73 1.25 3.39
60.0 98 0.042 46.0 2.63 0.86 0.86 1.31 3.34
60.0 101 0.049 46.7 2.73 1.00 0.96 1.36 3.28
60.0 105 0.058 47.4 2.82 1.16 1.06 1.41 3.23
60.0 109 0.065 47.9 2.92 1.31 1.14 1.46 3.20
60.0 113 0.071 48.4 3.02 1.44 1.21 1.51 3.18
60.0 115 0.079 48.8 3.08 1.60 1.27 1.54 3.15
60.0 119 0.086 49.2 3.17 1.74 1.32 1.59 3.15
60.0 123 0.093 49.5 3.27 1.89 1.37 1.63 3.15
60.0 126 0.101 49.8 3.36 2.04 1.40 1.68 3.16
60.0 129 0.108 50.0 3.43 2.19 1.44 1.71 3.16
60.0 131 0.115 50.2 3.49 2.34 1.46 1.74 3.16
60.0 135 0.123 50.4 3.58 2.49 1.49 1.79 3.18
60.0 138 0.131 50.5 3.64 2.65 1.50 1.82 3.20
60.0 141 0.138 50.6 3.73 2.79 1.52 1.87 3.23
60.0 143 0.145 50.7 3.76 2.93 1.53 1.88 3.23
60.0 146 0.153 50.7 3.85 3.10 1.54 1.93 3.27
60.0 149 0.160 50.8 3.91 3.25 1.55 1.96 3.29
60.0 151 0.168 50.8 3.97 3.39 1.56 1.99 3.31
60.0 154 0.175 50.9 4.03 3.54 1.56 2.02 3.34
60.0 156 0.183 50.9 4.09 3.70 1.56 2.05 3.37
60.0 159 0.190 50.9 4.15 3.84 1.56 2.08 3.39
60.0 161 0.197 50.9 4.21 3.98 1.56 2.11 3.42
60.0 165 0.204 50.9 4.30 4.13 1.56 2.15 3.47
60.0 168 0.212 50.8 4.36 4.28 1.56 2.18 3.50
60.0 171 0.219 50.8 4.45 4.42 1.55 2.23 3.55
60.0 175 0.226 50.8 4.54 4.58 1.55 2.27 3.60
60.0 178 0.234 50.7 4.60 4.73 1.54 2.30 3.64
60.0 181 0.241 50.7 4.69 4.87 1.54 2.34 3.69
60.0 188 0.256 50.6 4.84 5.18 1.52 2.42 3.78
CONSOLIDATED UNDRAINED TRIAXIAL TEST WITH PORE PRESSURE MEASUREMENT
Figure F-2.246

Project Name: Westside Subway Extension Cell Pressure: 80.0 psi
Project No: 4953-10-1561 Back Pressure : 40.0 psi
Test Pit: G-145 Consolidation Pressure : 40.0 psi
Depth(ft): 65.5 Initial Sample Height: 5.020 in
Sample No.: 12 Initial Area of Sample: 5.371 sq. in.
Sample Type: Mod. Cal. Final Sample Ht.* (L): 5.020 in
Sample Description: Sandy Clay Final Sample Area (A)*: 5.331 sq. in.
Induced OCR= 1.0
Cell Load Axial Back Deviator Axial Pore Shear Normal
Pressure Deformation Pressure Stress Strain Pressure Stress Stress
Change q' p'
(S1-S3) (S1-S3)/2 (S1'+S3')/2
(psi) (lbs) (in) (psi) (ksf) (%) (ksf) (ksf) (ksf)
80.0 0 0.000 40.0 0.00 0.00 0.00 0.00 5.76
80.0 90 0.004 41.4 2.43 0.09 0.21 1.21 6.77
80.0 137 0.011 43.2 3.69 0.21 0.46 1.85 7.14
80.0 169 0.018 44.9 4.55 0.35 0.70 2.27 7.33
80.0 193 0.024 46.3 5.19 0.47 0.91 2.59 7.44
80.0 211 0.031 47.6 5.67 0.61 1.10 2.83 7.49
80.0 226 0.038 48.8 6.06 0.75 1.26 3.03 7.53
80.0 239 0.044 49.7 6.40 0.87 1.40 3.20 7.56
80.0 248 0.051 50.6 6.63 1.01 1.52 3.32 7.55
80.0 257 0.058 51.3 6.86 1.15 1.63 3.43 7.56
80.0 264 0.064 52.0 7.04 1.27 1.72 3.52 7.56
80.0 272 0.070 52.5 7.24 1.40 1.80 3.62 7.58
80.0 278 0.077 53.0 7.39 1.54 1.87 3.70 7.59
80.0 284 0.084 53.4 7.54 1.68 1.93 3.77 7.60
80.0 289 0.091 53.8 7.67 1.81 1.98 3.83 7.61
80.0 294 0.098 54.1 7.79 1.96 2.03 3.89 7.63
80.0 299 0.106 54.4 7.91 2.11 2.07 3.95 7.65
80.0 304 0.114 54.6 8.03 2.27 2.10 4.01 7.67
80.0 309 0.121 54.8 8.15 2.40 2.13 4.07 7.70
80.0 313 0.129 55.0 8.24 2.56 2.16 4.12 7.72
80.0 318 0.136 55.1 8.36 2.71 2.18 4.18 7.76
80.0 322 0.144 55.2 8.45 2.86 2.19 4.22 7.79
80.0 326 0.151 55.3 8.54 3.01 2.21 4.27 7.82
80.0 330 0.157 55.4 8.64 3.13 2.22 4.32 7.86
80.0 334 0.164 55.5 8.73 3.27 2.23 4.36 7.90
80.0 338 0.171 55.5 8.82 3.41 2.23 4.41 7.93
80.0 342 0.178 55.5 8.91 3.55 2.24 4.46 7.98
80.0 346 0.184 55.6 9.00 3.67 2.24 4.50 8.02
80.0 351 0.191 55.6 9.12 3.81 2.24 4.56 8.08
80.0 355 0.198 55.6 9.21 3.94 2.24 4.61 8.1380.0 359 0.204 55.5 9.30 4.07 2.24 4.65 8.17
80.0 363 0.212 55.5 9.39 4.22 2.23 4.70 8.22
80.0 371 0.227 55.4 9.57 4.52 2.22 4.78 8.33
80.0 378 0.242 55.3 9.72 4.82 2.20 4.86 8.4280.0 384 0.257 55.1 9.84 5.11 2.18 4.92 8.50
CONSOLIDATED UNDRAINED TRIAXIAL TEST WITH PORE PRESSURE MEASUREMENT
Figure F-2.247

Project Name: Westside Subway Extension Cell Pressure: 100.0 psi
Project No: 4953-10-1561 Back Pressure : 40.0 psi
Test Pit: G-145 Consolidation Pressure : 60.0 psi
Depth(ft): 65.5 Initial Sample Height: 5.020 in
Sample No.: 12 Initial Area of Sample: 5.371 sq. in.
Sample Type: Mod. Cal. Final Sample Ht.* (L): 5.020 in
Sample Description: Sandy Clay Final Sample Area (A)*: 5.271 sq. in.
Induced OCR= 1.0
Cell Load Axial Back Deviator Axial Pore Shear Normal
Pressure Deformation Pressure Stress Strain Pressure Stress Stress
Change q' p'
(S1-S3) (S1-S3)/2 (S1'+S3')/2
(psi) (lbs) (in) (psi) (ksf) (%) (ksf) (ksf) (ksf)
100.0 0 0.000 40.0 0.00 0.00 0.00 0.00 8.64
100.0 179 0.006 41.9 4.89 0.12 0.27 2.44 10.81
100.0 236 0.012 43.0 6.43 0.24 0.43 3.21 11.42
100.0 286 0.018 44.1 7.79 0.36 0.60 3.90 11.94
100.0 328 0.024 45.1 8.91 0.48 0.74 4.45 12.35
100.0 366 0.030 46.2 9.95 0.60 0.89 4.97 12.73
100.0 395 0.036 47.0 10.72 0.72 1.01 5.36 12.99
100.0 420 0.042 47.8 11.39 0.84 1.12 5.69 13.21
100.0 441 0.048 48.5 11.93 0.96 1.22 5.97 13.38
100.0 457 0.054 49.1 12.36 1.08 1.31 6.18 13.51
100.0 473 0.060 49.7 12.75 1.20 1.40 6.38 13.62
100.0 518 0.090 51.8 13.88 1.79 1.69 6.94 13.89
100.0 527 0.100 52.2 14.10 1.99 1.76 7.05 13.93
100.0 542 0.123 53.0 14.44 2.44 1.87 7.22 13.99
100.0 567 0.168 53.9 14.97 3.34 2.00 7.49 14.12
100.0 590 0.211 54.3 15.45 4.20 2.05 7.73 14.31
100.0 608 0.258 54.3 15.74 5.13 2.05 7.87 14.46
100.0 625 0.301 54.0 16.04 6.00 2.02 8.02 14.64
100.0 640 0.346 53.6 16.28 6.89 1.96 8.14 14.82
100.0 652 0.392 53.1 16.41 7.81 1.88 8.20 14.96
100.0 666 0.437 52.5 16.61 8.70 1.80 8.31 15.14
100.0 677 0.482 51.9 16.71 9.60 1.71 8.36 15.29
100.0 687 0.527 51.2 16.79 10.51 1.62 8.39 15.42
100.0 699 0.571 50.6 16.93 11.37 1.52 8.47 15.58
100.0 707 0.617 49.9 16.93 12.29 1.43 8.46 15.68
100.0 716 0.662 49.2 16.99 13.19 1.33 8.50 15.80
100.0 727 0.706 48.7 17.07 14.06 1.25 8.54 15.93
100.0 734 0.752 48.1 17.04 14.98 1.16 8.52 16.00
100.0 743 0.797 47.4 17.07 15.87 1.07 8.53 16.10
100.0 752 0.841 46.8 17.11 16.76 0.98 8.55 16.21100.0 757 0.887 46.2 17.02 17.67 0.89 8.51 16.26
100.0 767 0.932 45.6 17.06 18.57 0.80 8.53 16.37
100.0 773 0.977 45.0 17.01 19.47 0.72 8.50 16.43
100.0 778 1.023 44.4 16.91 20.38 0.64 8.46 16.46
CONSOLIDATED UNDRAINED TRIAXIAL TEST WITH PORE PRESSURE MEASUREMENT
Figure F-2.248

LEGEND: CONFINING PRESSURES= ○ 20 psi □ 40 psi ∆ 60 psi
Project Name: Westside Subway Extension Sample Type: Mod. Cal.
Project No.: 4953-10-1561 Sample Description: Sandy Clay
Test Pit: G-145 Avg. Dry Unit Weight (pcf): 111.5
Sample No.: 12 Avg. Initial Moisture Content (%): 14.8
Depth (ft): 65.5 Confining Pressure: 20.0, 40.0, 60.0 psi
CU TRIAXIAL MULTI-STAGE TEST WITH PORE PRESSURE MEASUREMENTASTM D 4767
0
5
10
15
20
0 5 10 15 20 25 30 35 40
NORMAL STRESS, P' (ksf)
SH
EA
R S
TR
ES
S, q
' (ks
f)
0.0
2.0
4.0
6.0
8.0
10.0
12.0
14.0
16.0
18.0
20.0
0.0 5.0 10.0 15.0 20.0
AXIAL STRAIN (Percent)
DE
VIA
TO
R S
TR
ES
S (
ksf)
-4.0
-3.0
-2.0
-1.0
0.0
1.0
2.0
3.0
4.0
0.0 5.0 10.0 15.0 20.0
AXIAL STRAIN (Percent)C
HA
NG
E I
N P
OR
E W
AT
ER
PR
ES
SU
RE
(ks
f)
Figure F-2.249
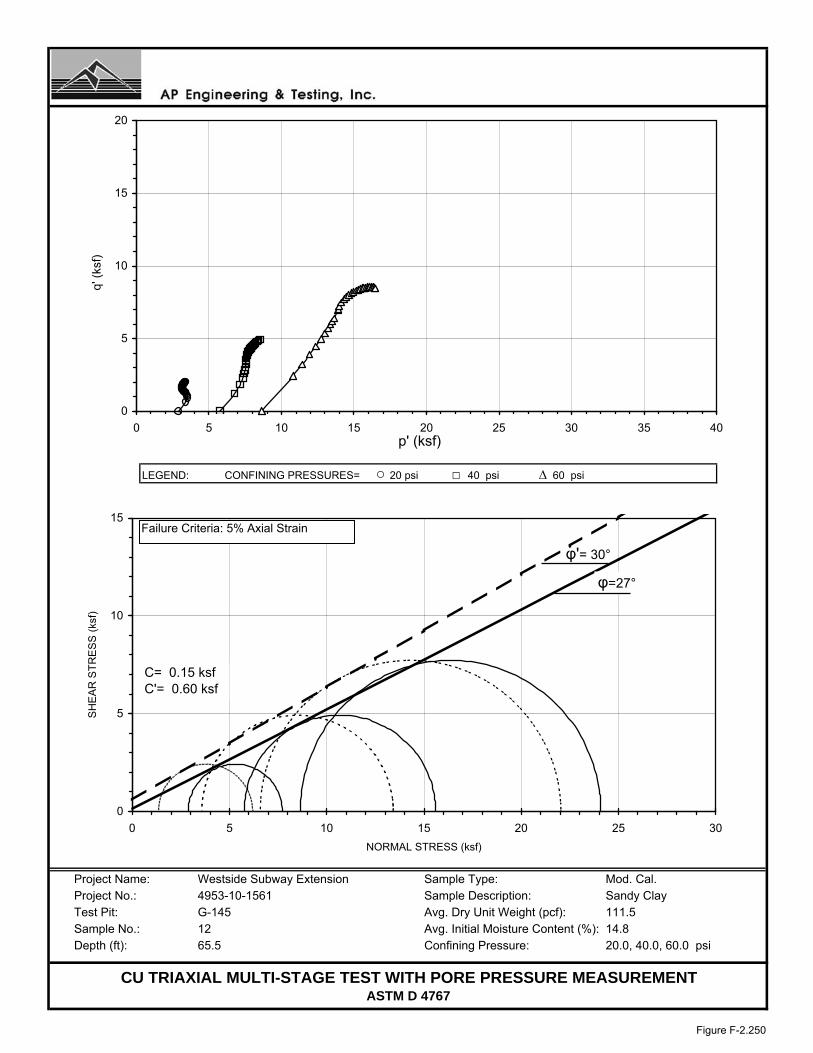
LEGEND: CONFINING PRESSURES= ○ 20 psi □ 40 psi ∆ 60 psi
Project Name: Westside Subway Extension Sample Type: Mod. Cal.Project No.: 4953-10-1561 Sample Description: Sandy ClayTest Pit: G-145 Avg. Dry Unit Weight (pcf): 111.5Sample No.: 12 Avg. Initial Moisture Content (%): 14.8Depth (ft): 65.5 Confining Pressure: 20.0, 40.0, 60.0 psi
CU TRIAXIAL MULTI-STAGE TEST WITH PORE PRESSURE MEASUREMENTASTM D 4767
0
5
10
15
0 5 10 15 20 25 30
NORMAL STRESS (ksf)
SH
EA
R S
TR
ES
S (
ksf)
φ=27°
φ'= 30°
0
5
10
15
20
0 5 10 15 20 25 30 35 40 p' (ksf)
q' (
ksf)
C= 0.15 ksfC'= 0.60 ksf
Failure Criteria: 5% Axial Strain
Figure F-2.250

Test Pit: G-145 Sample Type: Mod. Cal.Sample No.: 12 Soil Description: Sandy ClayDepth (feet): 65.5 Eff. Confining Pressure (psi): 40.0
Project Name: Westside Subway ExtensionProject No.: 4953-10-1561Date: 07/24/11
1.60002.00002.50003.5000
2.00002.50003.5000
6.5000
ASTM D 2435
9.30009.50009.6000
10.954515.491921.9089
1440 10.0000
9.30007.7460
2.00004.7000
TIME RATE CONSOLIDATION CURVE
7.60008.60008.9000
9.50009.6000
4
8.9000
4.70006.50007.60008.6000
0.0000
2.82843.87305.4772
0.31620.50000.70711.00001.4142
1.60001.3000
Time (minutes) Volume Change (cc)0.00001.3000
00.1
SQRT Time (minutes) Volume Change (cc)0.0000
0.250.512
8153060
120240480
37.9473 10.0000
0.00
2.00
4.00
6.00
8.00
10.00
12.00
0.1 1 10 100 1000 10000
Time (minutes)
Vol
ume
Cha
nge
(cc)
0.00
2.00
4.00
6.00
8.00
10.00
12.00
0.0 10.0 20.0 30.0 40.0
Square root Time (minutes)
Vol
ume
Cha
nge
(cc)
Figure F-2.251

Test Procedure: ASTM D 4767
Project Name: West Subway Extension Tested by: AP Date: 06-01-11
Project No.: 4953-10-1561 Input Data by: KM Date: 06-15-11
Test Pit: G-156 Reviewed by: AP Date: 06-15-11
Sample No.: - Sample Description: Dark Yellowish Brown Clay
Depth(ft): 38
Sample Type: Mod. Cal. Confining Pressure = 15.0 psi
Diameter (in) 2.610 2.610 2.610 Avg. = 2.610
Height (in) 5.725 5.725 5.725 Avg. = 5.725
BEFORE CONSOLIDATION AFTER CONSOLIDATION
Area (in²) 5.350 5.297
Moisture Content (%) 17.33 20.93
Wet Weight (gms) 87.11 1198.75
Dry Weight (gms) 81.73 1016.64
Container Weight (gms) 50.68 146.46
Density and Saturation
Wet Weight (gms) 1030.66
Container Weight (gms) 0.00
Wet Density (pcf) 128.2
Dry Density (pcf) 109.3
Initial Void Ratio 0.542
% Saturation 86.3
Assumed Specific Gravity = 2.70
Back Pressure Saturation
B Value (%) = 94 Change in Ht. of the Specimen (in)= 0
Consolidation
Cell Pressure (psi) = 45.0 Initial Burette Ht.(cm)= 70.6
Back Pressure(psi) = 30.0 Final Burette Ht.(cm)= 63.4
Eff. Consol. Stress (psi) = 15.0 Final Height (in)= 5.700
Induced OCR = 1.0 Initial Volume (cu.in)= 30.630
Change in Ht. of Specimen (in) = 0.0249 Final Volume (cu.in) = 30.191
Shear At Failure
Rate of Deformation (in/min)= 0.008 Deviator Stress (ksf) = 4.98
Time to 50% primary Consolidation (min) = 3 Eff. Minor Principal stress (ksf) = 1.15
Failure Mode: Bulging Failure Eff. Major Principal stress (ksf) = 6.13
Axial Strain (%) = 5.26
CONSOLIDATED UNDRAINED TRIAXIAL TEST WITH PORE PRESSURE MEASUREMENT
Figure F-2.252

Test Procedure: ASTM D 4767
Project Name: West Subway Extension Tested by: AP Date: 06-01-11
Project No.: 4953-10-1561 Input Data by: KM Date: 06-15-11
Test Pit: G-156 Reviewed by: AP Date: 06-15-11
Sample No.: - Sample Description: Dark Yellowish Brown Clay
Depth(ft): 38
Sample Type: Mod. Cal. Confining Pressure = 25.0 psi
Diameter (in) 2.610 2.610 2.610 Avg. = 2.610
Height (in) 5.725 5.725 5.725 Avg. = 5.725
BEFORE CONSOLIDATION AFTER CONSOLIDATION
Area (in²) 5.350 5.321
Moisture Content (%) 17.33 20.93
Wet Weight (gms) 87.11 1198.75
Dry Weight (gms) 81.73 1016.64
Container Weight (gms) 50.68 146.46
Density and Saturation
Wet Weight (gms) 1030.66
Container Weight (gms) 0.00
Wet Density (pcf) 128.2
Dry Density (pcf) 109.3
Initial Void Ratio 0.542
% Saturation 86.3
Assumed Specific Gravity = 2.70
Back Pressure Saturation
B Value (%) = 94 Change in Ht. of the Specimen (in)= 0
Consolidation
Cell Pressure (psi) = 55.0 Initial Burette Ht.(cm)= 63.3
Back Pressure(psi) = 30.0 Final Burette Ht.(cm)= 58.0
Eff. Consol. Stress (psi) = 25.0 Final Height (in)= 5.696
Induced OCR= 1.0 Initial Volume (cu.in)= 30.630
Change in Ht. of Specimen (in) = 0.0294 Final Volume (cu.in) = 30.307
Shear At Failure
Rate of Deformation (in/min)= 0.008 Deviator Stress (ksf) = 7.37
Time to 50% primary Consolidation = 3 Eff. Minor Principal stress (ksf) = 2.16
Failure Mode: Bulging Failure Eff. Major Principal stress (ksf) = 9.54
Axial Strain (%) = 5.10
CONSOLIDATED UNDRAINED TRIAXIAL TEST WITH PORE PRESSURE MEASUREMENT
Figure F-2.253

Test Procedure: ASTM D 4767
Project Name: West Subway Extension Tested by: AP Date: 06-01-11
Project No.: Input Data by: KM Date: 06-15-11
Test Pit: G-156 Reviewed by: AP Date: 06-15-11
Sample No.: - Sample Description: Dark Yellowish Brown Clay
Depth(ft): 38
Sample Type: Mod. Cal. Confining Pressure = 35.0 psi
Diameter (in) 2.610 2.610 2.610 Avg. = 2.610
Height (in) 5.725 5.725 5.725 Avg. = 5.725
BEFORE CONSOLIDATION AFTER CONSOLIDATION
Area (in²) 5.350 5.323
Moisture Content (%) 17.33 20.93
Wet Weight (gms) 87.11 1198.75
Dry Weight (gms) 81.73 1016.64
Container Weight (gms) 50.68 146.46
Density and Saturation
Wet Weight (gms) 1030.66
Container Weight (gms) 0.00
Wet Density (pcf) 128.2
Dry Density (pcf) 109.3
Initial Void Ratio 0.542
% Saturation 86.3
Assumed Specific Gravity = 2.70
Back Pressure Saturation
B Value (%) = 94 Change in Ht. of the Specimen (in)= 0
Consolidation
Cell Pressure (psi) = 65.0 Initial Burette Ht.(cm)= 58.0
Back Pressure(psi) = 30.0 Final Burette Ht.(cm)= 54.5
Eff. Consol. Stress (psi) = 35.0 Final Height (in)= 5.714
Induced OCR = 1.0 Initial Volume (cu.in)= 30.630
Change in Ht. of Specimen (in) = 0.0110 Final Volume (cu.in) = 30.416
Shear At Failure
Rate of Deformation (in/min)= 0.008 Deviator Stress (ksf) = 10.70
Time to 50% primary Consolidation = 3 Eff. Minor Principal stress (ksf) = 4.25
Failure Mode: Bulging Failure Eff. Major Principal stress (ksf) = 14.95
Axial Strain (%) = 16.37
CONSOLIDATED UNDRAINED TRIAXIAL TEST WITH PORE PRESSURE MEASUREMENT
4953-10-1561
Figure F-2.254

Project Name: West Subway Extension Cell Pressure: 45.0 psi
Project No: 4953-10-1561 Back Pressure : 30.0 psi
Test Pit: G-156 Consolidation Pressure : 15.0 psi
Depth(ft): 38 Initial Sample Height: 5.725 in
Sample No.: - Initial Area of Sample: 5.350 sq. in.
Sample Type: Mod. Cal. Final Sample Ht.* (L): 5.700 in
Sample Description: Dark Yellowish Brown Clay Final Sample Area (A)*: 5.297 sq. in.
Induced OCR= 1.0
Cell Load Axial Back Deviator Axial Pore Shear Normal
Pressure Deformation Pressure Stress Strain Pressure Stress Stress
Change q' p'
(S1-S3) (S1-S3)/2 (S1'+S3')/2
(psi) (lbs) (in) (psi) (ksf) (%) (ksf) (ksf) (ksf)
45.0 0 0.000 30.0 0.00 0.00 0.00 0.00 2.16
45.0 24 0.006 31.2 0.66 0.11 0.17 0.33 2.32
45.0 45 0.012 32.3 1.22 0.21 0.33 0.61 2.44
45.0 59 0.018 33.2 1.59 0.32 0.46 0.79 2.49
45.0 69 0.024 33.9 1.87 0.42 0.56 0.93 2.53
45.0 77 0.030 34.5 2.08 0.53 0.65 1.04 2.55
45.0 85 0.036 35.1 2.30 0.63 0.73 1.15 2.58
45.0 93 0.042 35.6 2.51 0.74 0.81 1.26 2.61
45.0 98 0.048 35.8 2.64 0.84 0.84 1.32 2.64
45.0 102 0.054 36.1 2.76 0.95 0.88 1.38 2.66
45.0 108 0.060 36.5 2.91 1.05 0.94 1.45 2.68
45.0 114 0.080 36.8 3.05 1.40 0.98 1.53 2.71
45.0 124 0.100 37.3 3.32 1.75 1.05 1.66 2.77
45.0 145 0.150 37.7 3.84 2.63 1.11 1.92 2.97
45.0 162 0.200 37.5 4.25 3.51 1.08 2.13 3.21
45.0 179 0.250 37.2 4.66 4.39 1.04 2.33 3.45
45.0 193 0.300 37.0 4.98 5.26 1.01 2.49 3.64
CONSOLIDATED UNDRAINED TRIAXIAL TEST WITH PORE PRESSURE MEASUREMENT
Figure F-2.255

Project Name: West Subway Extension Cell Pressure: 55.0 psi
Project No: 4953-10-1561 Back Pressure : 30.0 psi
Test Pit: G-156 Consolidation Pressure : 25.0 psi
Depth(ft): 38 Initial Sample Height: 5.725 in
Sample No.: - Initial Area of Sample: 5.350 sq. in.
Sample Type: Mod. Cal. Final Sample Ht.* (L): 5.696 in
Sample Description: Dark Yellowish Brown Clay Final Sample Area (A)*: 5.321 sq. in.
Induced OCR= 1.0
Cell Load Axial Back Deviator Axial Pore Shear Normal
Pressure Deformation Pressure Stress Strain Pressure Stress Stress
Change q' p'
(S1-S3) (S1-S3)/2 (S1'+S3')/2
(psi) (lbs) (in) (psi) (ksf) (%) (ksf) (ksf) (ksf)
55.0 0 0.000 30.0 0.00 0.00 0.00 0.00 3.60
55.0 58 0.006 31.9 1.57 0.11 0.27 0.78 4.11
55.0 85 0.012 33.1 2.30 0.21 0.45 1.15 4.30
55.0 105 0.018 34.1 2.83 0.32 0.59 1.42 4.43
55.0 115 0.022 34.6 3.10 0.38 0.66 1.55 4.49
55.0 135 0.030 35.8 3.63 0.52 0.83 1.82 4.59
55.0 159 0.041 37.2 4.27 0.72 1.03 2.14 4.70
55.0 179 0.053 38.3 4.80 0.93 1.20 2.40 4.80
55.0 194 0.064 39.1 5.19 1.11 1.31 2.60 4.88
55.0 205 0.076 39.7 5.47 1.33 1.39 2.74 4.94
55.0 213 0.087 40.0 5.68 1.53 1.44 2.84 5.00
55.0 220 0.099 40.3 5.85 1.74 1.48 2.93 5.05
55.0 226 0.111 40.4 6.00 1.95 1.50 3.00 5.10
55.0 231 0.124 40.5 6.12 2.17 1.51 3.06 5.15
55.0 236 0.135 40.5 6.23 2.38 1.52 3.12 5.20
55.0 241 0.147 40.6 6.35 2.58 1.52 3.18 5.26
55.0 245 0.159 40.6 6.45 2.79 1.52 3.22 5.30
55.0 249 0.171 40.6 6.54 3.00 1.52 3.27 5.35
55.0 254 0.182 40.6 6.65 3.20 1.52 3.33 5.41
55.0 258 0.194 40.5 6.74 3.41 1.52 3.37 5.45
55.0 262 0.206 40.5 6.83 3.62 1.51 3.42 5.50
55.0 266 0.218 40.5 6.92 3.82 1.51 3.46 5.56
55.0 270 0.231 40.4 7.01 4.05 1.50 3.51 5.61
55.0 274 0.243 40.3 7.10 4.26 1.49 3.55 5.66
55.0 277 0.255 40.2 7.16 4.47 1.47 3.58 5.71
55.0 281 0.266 40.2 7.25 4.68 1.46 3.62 5.76
55.0 284 0.278 40.1 7.31 4.89 1.45 3.66 5.80
55.0 287 0.290 40.0 7.37 5.10 1.44 3.69 5.85
55.0 282 0.301 39.7 7.23 5.28 1.40 3.61 5.81
CONSOLIDATED UNDRAINED TRIAXIAL TEST WITH PORE PRESSURE MEASUREMENT
Figure F-2.256

Project Name: West Subway Extension Cell Pressure: 65.0 psi
Project No: 4953-10-1561 Back Pressure : 30.0 psi
Test Pit: G-156 Consolidation Pressure : 35.0 psi
Depth(ft): 38 Initial Sample Height: 5.725 in
Sample No.: - Initial Area of Sample: 5.350 sq. in.
Sample Type: Mod. Cal. Final Sample Ht.* (L): 5.714 in
Sample Description: Dark Yellowish Brown Clay Final Sample Area (A)*: 5.323 sq. in.
Induced OCR= 1.0
Cell Load Axial Back Deviator Axial Pore Shear Normal
Pressure Deformation Pressure Stress Strain Pressure Stress Stress
Change q' p'
(S1-S3) (S1-S3)/2 (S1'+S3')/2
(psi) (lbs) (in) (psi) (ksf) (%) (ksf) (ksf) (ksf)
65.0 0 0.000 30.0 0.00 0.00 0.00 0.00 5.04
65.0 90 0.006 32.7 2.43 0.11 0.39 1.22 5.87
65.0 131 0.012 34.5 3.54 0.21 0.65 1.77 6.16
65.0 135 0.018 35.8 3.64 0.32 0.83 1.82 6.03
65.0 190 0.024 37.3 5.12 0.42 1.05 2.56 6.55
65.0 255 0.048 40.6 6.84 0.84 1.53 3.42 6.93
65.0 281 0.060 41.8 7.52 1.05 1.70 3.76 7.10
65.0 309 0.080 43.1 8.24 1.40 1.89 4.12 7.27
65.0 328 0.106 43.6 8.71 1.86 1.95 4.35 7.44
65.0 343 0.146 43.4 9.04 2.56 1.93 4.52 7.63
65.0 355 0.185 43.1 9.29 3.23 1.88 4.65 7.81
65.0 367 0.224 42.6 9.54 3.91 1.82 4.77 7.99
65.0 375 0.264 42.2 9.68 4.63 1.76 4.84 8.12
65.0 383 0.304 41.8 9.81 5.31 1.70 4.91 8.25
65.0 392 0.342 41.4 9.97 5.99 1.63 4.98 8.39
65.0 398 0.382 40.9 10.05 6.69 1.57 5.02 8.49
65.0 405 0.422 40.5 10.15 7.38 1.51 5.07 8.60
65.0 413 0.461 40.1 10.27 8.07 1.45 5.14 8.72
65.0 418 0.501 39.7 10.32 8.77 1.39 5.16 8.80
65.0 424 0.541 39.3 10.38 9.47 1.34 5.19 8.90
65.0 430 0.580 38.9 10.45 10.14 1.28 5.23 8.99
65.0 435 0.620 38.5 10.49 10.84 1.22 5.25 9.06
65.0 440 0.659 38.1 10.53 11.54 1.17 5.26 9.14
65.0 446 0.698 37.7 10.59 12.22 1.11 5.30 9.22
65.0 450 0.738 37.3 10.60 12.91 1.06 5.30 9.29
65.0 454 0.778 37.0 10.61 13.62 1.00 5.30 9.34
65.0 459 0.817 36.6 10.64 14.29 0.95 5.32 9.41
65.0 464 0.856 36.2 10.67 14.98 0.89 5.34 9.48
65.0 467 0.897 35.9 10.65 15.69 0.84 5.33 9.52
65.0 473 0.935 35.5 10.70 16.37 0.79 5.35 9.6065.0 476 0.974 35.2 10.68 17.04 0.75 5.34 9.63
65.0 479 1.014 34.9 10.66 17.75 0.70 5.33 9.67
65.0 484 1.053 34.5 10.68 18.43 0.65 5.34 9.73
65.0 488 1.092 34.2 10.68 19.12 0.60 5.34 9.78
65.0 490 1.133 33.8 10.63 19.82 0.55 5.31 9.81
CONSOLIDATED UNDRAINED TRIAXIAL TEST WITH PORE PRESSURE MEASUREMENT
Figure F-2.257

LEGEND: CONFINING PRESSURES= ○ 15 psi □ 25 psi ∆ 35 psi
Project Name: West Subway Extension Sample Type: Mod. Cal.
Project No.: 4953-10-1561 Sample Description: Dark Yellowish Brown Clay
Test Pit: G-156 Avg. Dry Unit Weight (pcf): 109.3
Sample No.: - Avg. Initial Moisture Content (%): 17.3
Depth (ft): 38 Confining Pressure: 15.0, 25.0, 35.0 psi
CU TRIAXIAL MULTI-STAGE TEST WITH PORE PRESSURE MEASUREMENTASTM D 4767
0
1
2
3
4
5
6
7
8
0 1 2 3 4 5 6 7 8 9 10 11 12 13 14 15 16
NORMAL STRESS, P' (ksf)
SH
EA
R S
TR
ES
S, q
' (ks
f)
0.0
2.0
4.0
6.0
8.0
10.0
12.0
14.0
0.0 5.0 10.0 15.0 20.0
AXIAL STRAIN (Percent)
DE
VIA
TO
R S
TR
ES
S (
ksf)
-1.0
0.0
1.0
2.0
3.0
4.0
5.0
0.0 5.0 10.0 15.0 20.0
AXIAL STRAIN (Percent)C
HA
NG
E I
N P
OR
E W
AT
ER
PR
ES
SU
RE
(ks
f)
Figure F-2.258

LEGEND: CONFINING PRESSURES= ○ 15 psi □ 25 psi ∆ 35 psi
Project Name: West Subway Extension Sample Type: Mod. Cal.Project No.: 4953-10-1561 Sample Description: Dark Yellowish Brown ClayTest Pit: G-156 Avg. Dry Unit Weight (pcf): 109.3Sample No.: - Avg. Initial Moisture Content (%): 17.3Depth (ft): 38 Confining Pressure: 15.0, 25.0, 35.0 psi
CU TRIAXIAL MULTI-STAGE TEST WITH PORE PRESSURE MEASUREMENTASTM D 4767
0
1
2
3
4
5
6
7
8
9
10
11
0 1 2 3 4 5 6 7 8 9 10 11 12 13 14 15 16 17 18 19 20 21 22
NORMAL STRESS (ksf)
SH
EA
R S
TR
ES
S (
ksf) φ=29°
φ'= 30°
0
1
2
3
4
5
6
7
8
9
10
0 1 2 3 4 5 6 7 8 9 10 11 12 13 14 15 16 17 18 19 20 p' (ksf)
q' (
ksf)
C= 0.25 ksfC'= 0.70 ksf
Failure Criteria: 5% Axial Strain
Figure F-2.259

Test Pit: G-156 Sample Type: Mod. Cal.Sample No.: - Soil Description: Dark Yellowish Brown ClayDepth (feet): 38 Eff. Confining Pressure (psi): 25.0
Project Name: West Subway ExtensionProject No.: 4953-10-1561Date: 06/01/11
0.60000.80001.00001.1000
0.80001.00001.1000
1.6000
ASTM D 2435
3.20004.20004.8000
10.954515.491921.9089
1440 5.3000
3.20007.7460
2.00001.3000
TIME RATE CONSOLIDATION CURVE
1.90002.10002.6000
4.20004.8000
4
2.6000
1.30001.60001.90002.1000
0.0000
2.82843.87305.4772
0.31620.50000.70711.00001.4142
0.60000.3000
Time (minutes) Volume Change (cc)0.00000.3000
00.1
SQRT Time (minutes) Volume Change (cc)0.0000
0.250.512
8153060
120240480
37.9473 5.3000
0.00
1.00
2.00
3.00
4.00
5.00
6.00
0.1 1 10 100 1000 10000
Time (minutes)
Vol
ume
Cha
nge
(cc)
0.00
1.00
2.00
3.00
4.00
5.00
6.00
0.0 10.0 20.0 30.0 40.0
Square root Time (minutes)
Vol
ume
Cha
nge
(cc)
Figure F-2.260

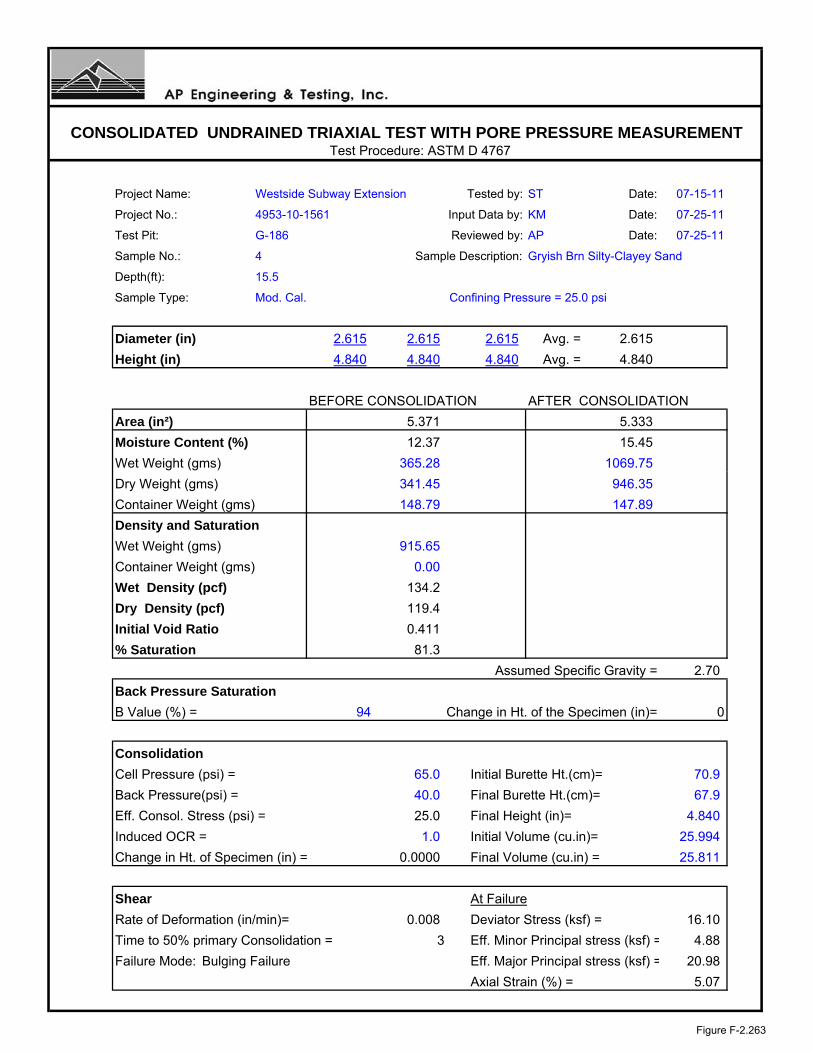
Test Procedure: ASTM D 4767
Project Name: Westside Subway Extension Tested by: ST Date: 07-15-11
Project No.: 4953-10-1561 Input Data by: KM Date: 07-25-11
Test Pit: G-186 Reviewed by: AP Date: 07-25-11
Sample No.: 4 Sample Description: Gryish Brn Silty-Clayey Sand
Depth(ft): 15.5
Sample Type: Mod. Cal. Confining Pressure = 5.0 psi
Diameter (in) 2.615 2.615 2.615 Avg. = 2.615
Height (in) 4.840 4.840 4.840 Avg. = 4.840
BEFORE CONSOLIDATION AFTER CONSOLIDATION
Area (in²) 5.371 5.382
Moisture Content (%) 12.37 15.45
Wet Weight (gms) 365.28 1069.75
Dry Weight (gms) 341.45 946.35
Container Weight (gms) 148.79 147.89
Density and Saturation
Wet Weight (gms) 915.65
Container Weight (gms) 0.00
Wet Density (pcf) 134.2
Dry Density (pcf) 119.4
Initial Void Ratio 0.411
% Saturation 81.3
Assumed Specific Gravity = 2.70
Back Pressure Saturation
B Value (%) = 94 Change in Ht. of the Specimen (in)= 0
Consolidation
Cell Pressure (psi) = 45.0 Initial Burette Ht.(cm)= 75.2
Back Pressure(psi) = 40.0 Final Burette Ht.(cm)= 74.7
Eff. Consol. Stress (psi) = 5.0 Final Height (in)= 4.825
Induced OCR = 1.0 Initial Volume (cu.in)= 25.994
Change in Ht. of Specimen (in) = 0.0154 Final Volume (cu.in) = 25.964
Shear At Failure
Rate of Deformation (in/min)= 0.008 Deviator Stress (ksf) = 5.76
Time to 50% primary Consolidation (min) = 3 Eff. Minor Principal stress (ksf) = 1.71
Failure Mode: Bulging Failure Eff. Major Principal stress (ksf) = 7.47
Axial Strain (%) = 5.13
CONSOLIDATED UNDRAINED TRIAXIAL TEST WITH PORE PRESSURE MEASUREMENT
Figure F-2.261

Test Procedure: ASTM D 4767
Project Name: Westside Subway Extension Tested by: ST Date: 07-15-11
Project No.: 4953-10-1561 Input Data by: KM Date: 07-25-11
Test Pit: G-186 Reviewed by: AP Date: 07-25-11
Sample No.: 4 Sample Description: Gryish Brn Silty-Clayey Sand
Depth(ft): 15.5
Sample Type: Mod. Cal. Confining Pressure = 15.0 psi
Diameter (in) 2.615 2.615 2.615 Avg. = 2.615
Height (in) 4.840 4.840 4.840 Avg. = 4.840
BEFORE CONSOLIDATION AFTER CONSOLIDATION
Area (in²) 5.371 5.324
Moisture Content (%) 12.37 15.45
Wet Weight (gms) 365.28 1069.75
Dry Weight (gms) 341.45 946.35
Container Weight (gms) 148.79 147.89
Density and Saturation
Wet Weight (gms) 915.65
Container Weight (gms) 0.00
Wet Density (pcf) 134.2
Dry Density (pcf) 119.4
Initial Void Ratio 0.411
% Saturation 81.3
Assumed Specific Gravity = 2.70
Back Pressure Saturation
B Value (%) = 94 Change in Ht. of the Specimen (in)= 0
Consolidation
Cell Pressure (psi) = 55.0 Initial Burette Ht.(cm)= 74.7
Back Pressure(psi) = 40.0 Final Burette Ht.(cm)= 71.0
Eff. Consol. Stress (psi) = 15.0 Final Height (in)= 4.840
Induced OCR= 1.0 Initial Volume (cu.in)= 25.994
Change in Ht. of Specimen (in) = 0.0000 Final Volume (cu.in) = 25.769
Shear At Failure
Rate of Deformation (in/min)= 0.008 Deviator Stress (ksf) = 10.98
Time to 50% primary Consolidation = 3 Eff. Minor Principal stress (ksf) = 3.39
Failure Mode: Bulging Failure Eff. Major Principal stress (ksf) = 14.37
Axial Strain (%) = 5.15
CONSOLIDATED UNDRAINED TRIAXIAL TEST WITH PORE PRESSURE MEASUREMENT
Figure F-2.262
Test Procedure: ASTM D 4767
Project Name: Westside Subway Extension Tested by: ST Date: 07-15-11
Project No.: Input Data by: KM Date: 07-25-11
Test Pit: G-186 Reviewed by: AP Date: 07-25-11
Sample No.: 4 Sample Description: Gryish Brn Silty-Clayey Sand
Depth(ft): 15.5
Sample Type: Mod. Cal. Confining Pressure = 25.0 psi
Diameter (in) 2.615 2.615 2.615 Avg. = 2.615
Height (in) 4.840 4.840 4.840 Avg. = 4.840
BEFORE CONSOLIDATION AFTER CONSOLIDATION
Area (in²) 5.371 5.333
Moisture Content (%) 12.37 15.45
Wet Weight (gms) 365.28 1069.75
Dry Weight (gms) 341.45 946.35
Container Weight (gms) 148.79 147.89
Density and Saturation
Wet Weight (gms) 915.65
Container Weight (gms) 0.00
Wet Density (pcf) 134.2
Dry Density (pcf) 119.4
Initial Void Ratio 0.411
% Saturation 81.3
Assumed Specific Gravity = 2.70
Back Pressure Saturation
B Value (%) = 94 Change in Ht. of the Specimen (in)= 0
Consolidation
Cell Pressure (psi) = 65.0 Initial Burette Ht.(cm)= 70.9
Back Pressure(psi) = 40.0 Final Burette Ht.(cm)= 67.9
Eff. Consol. Stress (psi) = 25.0 Final Height (in)= 4.840
Induced OCR = 1.0 Initial Volume (cu.in)= 25.994
Change in Ht. of Specimen (in) = 0.0000 Final Volume (cu.in) = 25.811
Shear At Failure
Rate of Deformation (in/min)= 0.008 Deviator Stress (ksf) = 16.10
Time to 50% primary Consolidation = 3 Eff. Minor Principal stress (ksf) = 4.88
Failure Mode: Bulging Failure Eff. Major Principal stress (ksf) = 20.98
Axial Strain (%) = 5.07
CONSOLIDATED UNDRAINED TRIAXIAL TEST WITH PORE PRESSURE MEASUREMENT
4953-10-1561
Figure F-2.263
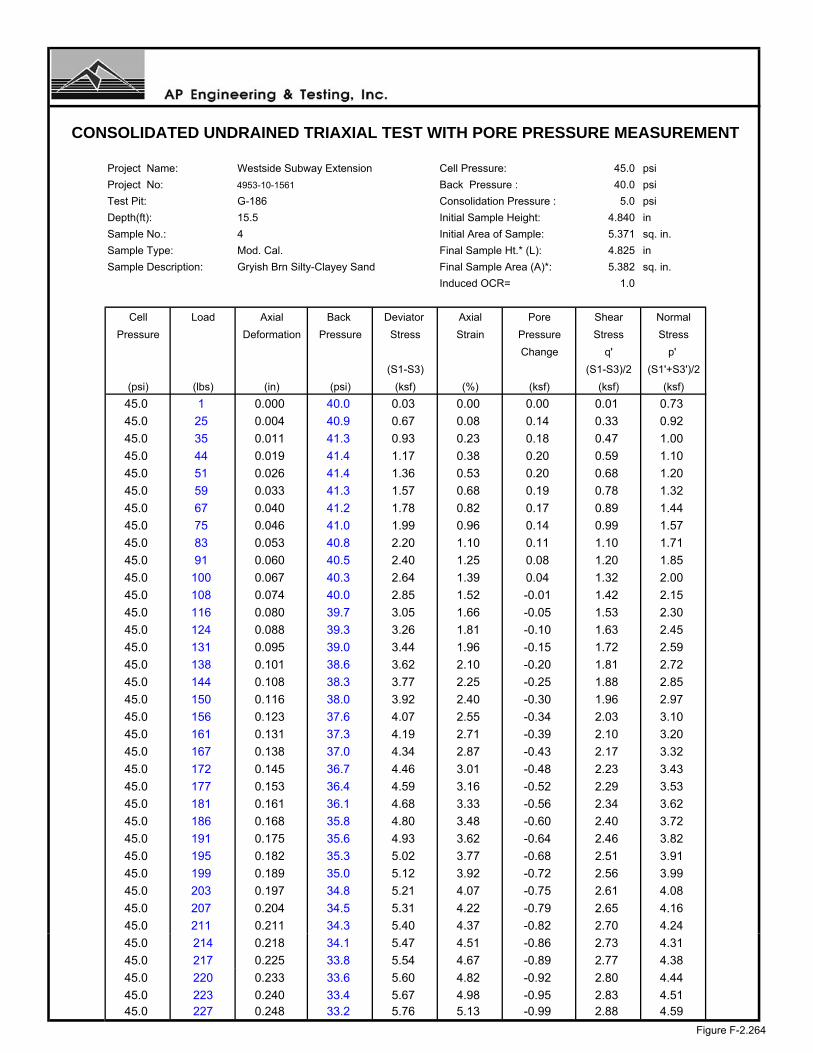
Project Name: Westside Subway Extension Cell Pressure: 45.0 psi
Project No: 4953-10-1561 Back Pressure : 40.0 psi
Test Pit: G-186 Consolidation Pressure : 5.0 psi
Depth(ft): 15.5 Initial Sample Height: 4.840 in
Sample No.: 4 Initial Area of Sample: 5.371 sq. in.
Sample Type: Mod. Cal. Final Sample Ht.* (L): 4.825 in
Sample Description: Gryish Brn Silty-Clayey Sand Final Sample Area (A)*: 5.382 sq. in.
Induced OCR= 1.0
Cell Load Axial Back Deviator Axial Pore Shear Normal
Pressure Deformation Pressure Stress Strain Pressure Stress Stress
Change q' p'
(S1-S3) (S1-S3)/2 (S1'+S3')/2
(psi) (lbs) (in) (psi) (ksf) (%) (ksf) (ksf) (ksf)
45.0 1 0.000 40.0 0.03 0.00 0.00 0.01 0.73
45.0 25 0.004 40.9 0.67 0.08 0.14 0.33 0.92
45.0 35 0.011 41.3 0.93 0.23 0.18 0.47 1.00
45.0 44 0.019 41.4 1.17 0.38 0.20 0.59 1.10
45.0 51 0.026 41.4 1.36 0.53 0.20 0.68 1.20
45.0 59 0.033 41.3 1.57 0.68 0.19 0.78 1.32
45.0 67 0.040 41.2 1.78 0.82 0.17 0.89 1.44
45.0 75 0.046 41.0 1.99 0.96 0.14 0.99 1.57
45.0 83 0.053 40.8 2.20 1.10 0.11 1.10 1.71
45.0 91 0.060 40.5 2.40 1.25 0.08 1.20 1.85
45.0 100 0.067 40.3 2.64 1.39 0.04 1.32 2.00
45.0 108 0.074 40.0 2.85 1.52 -0.01 1.42 2.15
45.0 116 0.080 39.7 3.05 1.66 -0.05 1.53 2.30
45.0 124 0.088 39.3 3.26 1.81 -0.10 1.63 2.45
45.0 131 0.095 39.0 3.44 1.96 -0.15 1.72 2.59
45.0 138 0.101 38.6 3.62 2.10 -0.20 1.81 2.72
45.0 144 0.108 38.3 3.77 2.25 -0.25 1.88 2.85
45.0 150 0.116 38.0 3.92 2.40 -0.30 1.96 2.97
45.0 156 0.123 37.6 4.07 2.55 -0.34 2.03 3.10
45.0 161 0.131 37.3 4.19 2.71 -0.39 2.10 3.20
45.0 167 0.138 37.0 4.34 2.87 -0.43 2.17 3.32
45.0 172 0.145 36.7 4.46 3.01 -0.48 2.23 3.43
45.0 177 0.153 36.4 4.59 3.16 -0.52 2.29 3.53
45.0 181 0.161 36.1 4.68 3.33 -0.56 2.34 3.62
45.0 186 0.168 35.8 4.80 3.48 -0.60 2.40 3.72
45.0 191 0.175 35.6 4.93 3.62 -0.64 2.46 3.82
45.0 195 0.182 35.3 5.02 3.77 -0.68 2.51 3.91
45.0 199 0.189 35.0 5.12 3.92 -0.72 2.56 3.99
45.0 203 0.197 34.8 5.21 4.07 -0.75 2.61 4.08
45.0 207 0.204 34.5 5.31 4.22 -0.79 2.65 4.16
45.0 211 0.211 34.3 5.40 4.37 -0.82 2.70 4.24
45.0 214 0.218 34.1 5.47 4.51 -0.86 2.73 4.31
45.0 217 0.225 33.8 5.54 4.67 -0.89 2.77 4.38
45.0 220 0.233 33.6 5.60 4.82 -0.92 2.80 4.44
45.0 223 0.240 33.4 5.67 4.98 -0.95 2.83 4.5145.0 227 0.248 33.2 5.76 5.13 -0.99 2.88 4.59
CONSOLIDATED UNDRAINED TRIAXIAL TEST WITH PORE PRESSURE MEASUREMENT
Figure F-2.264

Project Name: Westside Subway Extension Cell Pressure: 55.0 psi
Project No: 4953-10-1561 Back Pressure : 40.0 psi
Test Pit: G-186 Consolidation Pressure : 15.0 psi
Depth(ft): 15.5 Initial Sample Height: 4.840 in
Sample No.: 4 Initial Area of Sample: 5.371 sq. in.
Sample Type: Mod. Cal. Final Sample Ht.* (L): 4.840 in
Sample Description: Gryish Brn Silty-Clayey Sand Final Sample Area (A)*: 5.324 sq. in.
Induced OCR= 1.0
Cell Load Axial Back Deviator Axial Pore Shear Normal
Pressure Deformation Pressure Stress Strain Pressure Stress Stress
Change q' p'
(S1-S3) (S1-S3)/2 (S1'+S3')/2
(psi) (lbs) (in) (psi) (ksf) (%) (ksf) (ksf) (ksf)
55.0 0 0.000 40.1 0.00 0.00 0.00 0.00 2.16
55.0 66 0.004 41.8 1.78 0.08 0.23 0.89 2.82
55.0 104 0.010 42.1 2.81 0.20 0.28 1.40 3.28
55.0 138 0.017 41.8 3.72 0.36 0.24 1.86 3.78
55.0 171 0.024 41.2 4.60 0.50 0.15 2.30 4.31
55.0 204 0.031 40.5 5.48 0.64 0.06 2.74 4.84
55.0 234 0.038 39.9 6.28 0.79 -0.04 3.14 5.34
55.0 259 0.046 39.3 6.94 0.95 -0.12 3.47 5.75
55.0 279 0.052 38.8 7.47 1.07 -0.19 3.73 6.09
55.0 295 0.060 38.3 7.88 1.23 -0.26 3.94 6.36
55.0 308 0.067 37.9 8.22 1.37 -0.32 4.11 6.59
55.0 319 0.073 37.5 8.50 1.50 -0.38 4.25 6.79
55.0 328 0.080 37.1 8.72 1.66 -0.44 4.36 6.96
55.0 336 0.087 36.7 8.92 1.80 -0.49 4.46 7.11
55.0 343 0.095 36.4 9.10 1.96 -0.54 4.55 7.25
55.0 349 0.102 36.0 9.24 2.11 -0.59 4.62 7.37
55.0 355 0.109 35.7 9.39 2.25 -0.64 4.69 7.49
55.0 360 0.117 35.4 9.50 2.42 -0.68 4.75 7.59
55.0 366 0.125 35.1 9.64 2.57 -0.72 4.82 7.70
55.0 371 0.132 34.8 9.76 2.72 -0.76 4.88 7.80
55.0 375 0.140 34.6 9.85 2.89 -0.80 4.92 7.88
55.0 380 0.147 34.3 9.97 3.04 -0.84 4.98 7.98
55.0 385 0.155 34.1 10.08 3.19 -0.87 5.04 8.07
55.0 389 0.162 33.8 10.17 3.35 -0.90 5.08 8.15
55.0 393 0.169 33.6 10.26 3.50 -0.94 5.13 8.23
55.0 397 0.176 33.4 10.35 3.64 -0.97 5.17 8.30
55.0 401 0.183 33.2 10.44 3.78 -1.00 5.22 8.38
55.0 405 0.190 33.0 10.52 3.93 -1.03 5.26 8.45
55.0 408 0.198 32.8 10.58 4.08 -1.06 5.29 8.51
55.0 411 0.205 32.6 10.65 4.24 -1.08 5.32 8.5755.0 414 0.212 32.4 10.71 4.38 -1.11 5.35 8.62
55.0 417 0.219 32.2 10.77 4.52 -1.14 5.38 8.68
55.0 420 0.227 32.0 10.83 4.69 -1.16 5.41 8.74
55.0 423 0.234 31.9 10.89 4.83 -1.19 5.44 8.7955.0 426 0.242 31.7 10.95 4.99 -1.21 5.47 8.84
55.0 428 0.249 31.6 10.98 5.15 -1.23 5.49 8.88
CONSOLIDATED UNDRAINED TRIAXIAL TEST WITH PORE PRESSURE MEASUREMENT
Figure F-2.265

Project Name: Westside Subway Extension Cell Pressure: 65.0 psi
Project No: 4953-10-1561 Back Pressure : 40.0 psi
Test Pit: G-186 Consolidation Pressure : 25.0 psi
Depth(ft): 15.5 Initial Sample Height: 4.840 in
Sample No.: 4 Initial Area of Sample: 5.371 sq. in.
Sample Type: Mod. Cal. Final Sample Ht.* (L): 4.840 in
Sample Description: Gryish Brn Silty-Clayey Sand Final Sample Area (A)*: 5.333 sq. in.
Induced OCR= 1.0
Cell Load Axial Back Deviator Axial Pore Shear Normal
Pressure Deformation Pressure Stress Strain Pressure Stress Stress
Change q' p'
(S1-S3) (S1-S3)/2 (S1'+S3')/2
(psi) (lbs) (in) (psi) (ksf) (%) (ksf) (ksf) (ksf)
65.0 0 0.000 40.0 0.00 0.00 0.00 0.00 3.60
65.0 103 0.006 42.7 2.78 0.12 0.39 1.39 4.60
65.0 155 0.012 43.3 4.17 0.25 0.47 2.09 5.21
65.0 209 0.018 43.0 5.62 0.37 0.43 2.81 5.98
65.0 249 0.024 42.3 6.69 0.50 0.33 3.35 6.62
65.0 298 0.030 41.5 8.00 0.62 0.21 4.00 7.39
65.0 340 0.036 40.5 9.11 0.74 0.08 4.56 8.08
65.0 382 0.042 39.7 10.23 0.87 -0.04 5.11 8.75
65.0 420 0.048 38.9 11.23 0.99 -0.16 5.61 9.37
65.0 452 0.054 38.2 12.07 1.12 -0.26 6.03 9.89
65.0 474 0.060 37.7 12.64 1.24 -0.33 6.32 10.25
65.0 535 0.090 35.6 14.18 1.86 -0.62 7.09 11.31
65.0 547 0.100 35.1 14.46 2.07 -0.70 7.23 11.53
65.0 588 0.154 33.2 15.37 3.19 -0.97 7.69 12.26
65.0 611 0.200 32.1 15.82 4.12 -1.14 7.91 12.65
65.0 628 0.246 31.1 16.10 5.07 -1.28 8.05 12.93
65.0 643 0.292 30.4 16.32 6.03 -1.38 8.16 13.14
65.0 656 0.338 29.8 16.48 6.99 -1.47 8.24 13.31
65.0 667 0.384 29.3 16.58 7.94 -1.54 8.29 13.43
65.0 678 0.430 28.9 16.68 8.88 -1.59 8.34 13.53
65.0 688 0.476 28.6 16.75 9.83 -1.64 8.38 13.61
65.0 697 0.522 28.4 16.79 10.78 -1.67 8.40 13.66
65.0 708 0.567 28.2 16.88 11.71 -1.69 8.44 13.73
65.0 716 0.613 28.2 16.89 12.66 -1.70 8.44 13.74
65.0 726 0.659 28.1 16.93 13.62 -1.72 8.47 13.78
65.0 737 0.705 28.0 17.00 14.56 -1.73 8.50 13.83
65.0 746 0.751 27.9 17.02 15.51 -1.74 8.51 13.85
65.0 758 0.796 27.8 17.10 16.45 -1.75 8.55 13.90
65.0 767 0.841 27.7 17.11 17.38 -1.77 8.56 13.92
65.0 776 0.888 27.6 17.11 18.34 -1.78 8.56 13.9465.0 786 0.933 27.5 17.13 19.27 -1.79 8.57 13.96
65.0 795 0.978 27.5 17.13 20.20 -1.80 8.56 13.97
65.0 804 1.024 27.4 17.12 21.15 -1.81 8.56 13.97
CONSOLIDATED UNDRAINED TRIAXIAL TEST WITH PORE PRESSURE MEASUREMENT
Figure F-2.266

LEGEND: CONFINING PRESSURES= ○ 5 psi □ 15 psi ∆ 25 psi
Project Name: Westside Subway Extension Sample Type: Mod. Cal.
Project No.: 4953-10-1561 Sample Description: Gryish Brn Silty-Clayey Sand
Test Pit: G-186 Avg. Dry Unit Weight (pcf): 119.4
Sample No.: 4 Avg. Initial Moisture Content (%): 12.4
Depth (ft): 15.5 Confining Pressure: 5.0, 15.0, 25.0 psi
CU TRIAXIAL MULTI-STAGE TEST WITH PORE PRESSURE MEASUREMENTASTM D 4767
0
5
10
15
20
0 5 10 15 20 25 30 35 40
NORMAL STRESS, P' (ksf)
SH
EA
R S
TR
ES
S, q
' (ks
f)
0.0
2.0
4.0
6.0
8.0
10.0
12.0
14.0
16.0
18.0
20.0
0.0 5.0 10.0 15.0 20.0
AXIAL STRAIN (Percent)
DE
VIA
TO
R S
TR
ES
S (
ksf)
-4.0
-3.0
-2.0
-1.0
0.0
1.0
2.0
3.0
4.0
0.0 5.0 10.0 15.0 20.0
AXIAL STRAIN (Percent)C
HA
NG
E I
N P
OR
E W
AT
ER
PR
ES
SU
RE
(ks
f)
Figure F-2.267
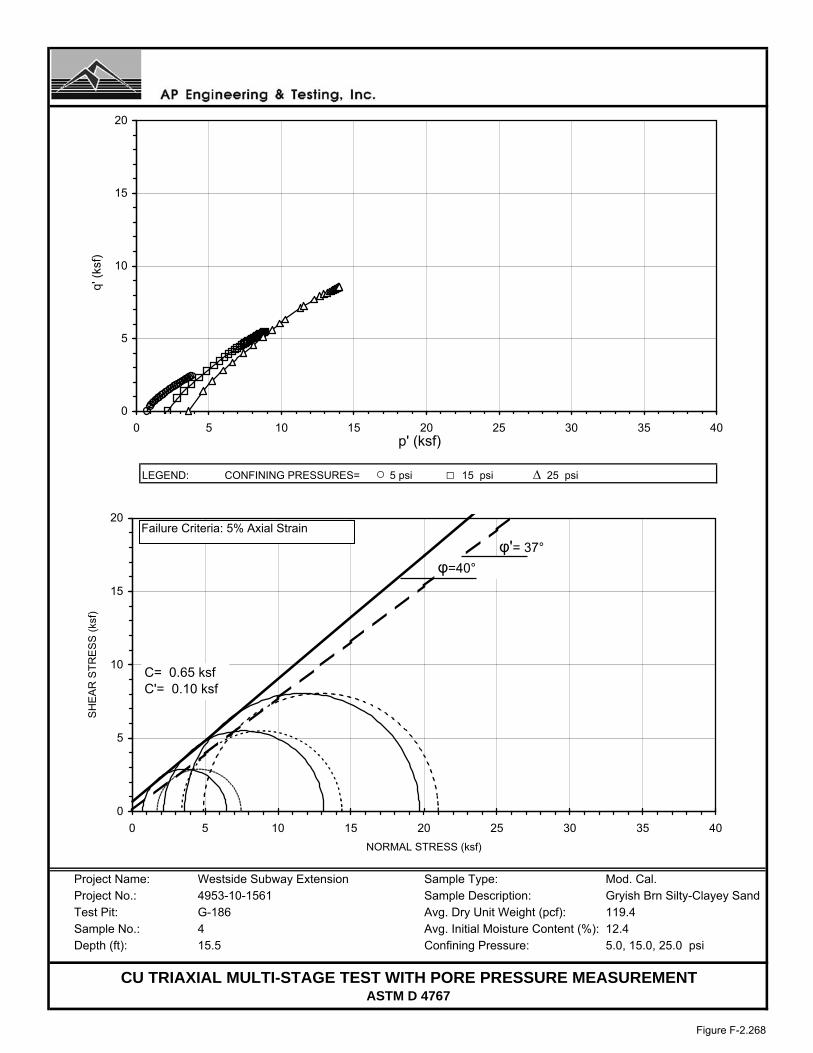
LEGEND: CONFINING PRESSURES= ○ 5 psi □ 15 psi ∆ 25 psi
Project Name: Westside Subway Extension Sample Type: Mod. Cal.Project No.: 4953-10-1561 Sample Description: Gryish Brn Silty-Clayey SandTest Pit: G-186 Avg. Dry Unit Weight (pcf): 119.4Sample No.: 4 Avg. Initial Moisture Content (%): 12.4Depth (ft): 15.5 Confining Pressure: 5.0, 15.0, 25.0 psi
CU TRIAXIAL MULTI-STAGE TEST WITH PORE PRESSURE MEASUREMENTASTM D 4767
0
5
10
15
20
0 5 10 15 20 25 30 35 40
NORMAL STRESS (ksf)
SH
EA
R S
TR
ES
S (
ksf)
φ=40°
φ'= 37°
0
5
10
15
20
0 5 10 15 20 25 30 35 40 p' (ksf)
q' (
ksf)
C= 0.65 ksfC'= 0.10 ksf
Failure Criteria: 5% Axial Strain
Figure F-2.268

Test Pit: G-186 Sample Type: Mod. Cal.Sample No.: 4 Soil Description: Gryish Brn Silty-Clayey SandDepth (feet): 15.5 Eff. Confining Pressure (psi): 15.0
Project Name: Westside Subway ExtensionProject No.: 4953-10-1561Date: 07/15/11
3.7000
120240480
37.4700
8153060
0.250.512
0.9000
Time (minutes) Volume Change (cc)0.00000.9000
00.1
SQRT Time (minutes) Volume Change (cc)0.0000 0.0000
2.82843.87305.4772
0.31620.50000.70711.00001.4142
1.2000
3.5000
3.10003.30003.40003.4700
7.7460
2.00003.1000
TIME RATE CONSOLIDATION CURVE
3.40003.47003.5000
3.60003.6400
4
ASTM D 2435
3.57003.60003.6400
10.954515.491921.9089
1404 3.7000
3.5700
1.80002.50002.8000
3.3000
1.20001.80002.50002.8000
0.00
0.50
1.00
1.50
2.00
2.50
3.00
3.50
4.00
0.1 1 10 100 1000 10000
Time (minutes)
Vol
ume
Cha
nge
(cc)
0.00
0.50
1.00
1.50
2.00
2.50
3.00
3.50
4.00
0.0 10.0 20.0 30.0 40.0
Square root Time (minutes)
Vol
ume
Cha
nge
(cc)
Figure F-2.269

Test Procedure: ASTM D 4767
Project Name: Westside Subway Extension Tested by: ST Date: 07-16-11
Project No.: 4953-10-1561 Input Data by: KM Date: 07-25-11
Test Pit: G-186 Reviewed by: AP Date: 07-25-11
Sample No.: 10 Sample Description: Olive Sandy Silt
Depth(ft): 35.5
Sample Type: Mod. Cal. Confining Pressure = 15.0 psi
Diameter (in) 2.615 2.615 2.615 Avg. = 2.615
Height (in) 5.690 5.690 5.690 Avg. = 5.690
BEFORE CONSOLIDATION AFTER CONSOLIDATION
Area (in²) 5.371 5.334
Moisture Content (%) 16.90 19.67
Wet Weight (gms) 75.36 1143.92
Dry Weight (gms) 71.69 980.52
Container Weight (gms) 49.97 149.81
Density and Saturation
Wet Weight (gms) 959.28
Container Weight (gms) 0.00
Wet Density (pcf) 119.6
Dry Density (pcf) 102.3
Initial Void Ratio 0.647
% Saturation 70.5
Assumed Specific Gravity = 2.70
Back Pressure Saturation
B Value (%) = 94 Change in Ht. of the Specimen (in)= 0
Consolidation
Cell Pressure (psi) = 65.0 Initial Burette Ht.(cm)= 77.0
Back Pressure(psi) = 50.0 Final Burette Ht.(cm)= 70.8
Eff. Consol. Stress (psi) = 15.0 Final Height (in)= 5.658
Induced OCR = 1.0 Initial Volume (cu.in)= 30.559
Change in Ht. of Specimen (in) = 0.0318 Final Volume (cu.in) = 30.181
Shear At Failure
Rate of Deformation (in/min)= 0.008 Deviator Stress (ksf) = 5.78
Time to 50% primary Consolidation (min) = 3 Eff. Minor Principal stress (ksf) = 1.91
Failure Mode: Bulging Failure Eff. Major Principal stress (ksf) = 7.69
Axial Strain (%) = 5.32
CONSOLIDATED UNDRAINED TRIAXIAL TEST WITH PORE PRESSURE MEASUREMENT
Figure F-2.270

Test Procedure: ASTM D 4767
Project Name: Westside Subway Extension Tested by: ST Date: 07-16-11
Project No.: 4953-10-1561 Input Data by: KM Date: 07-25-11
Test Pit: G-186 Reviewed by: AP Date: 07-25-11
Sample No.: 10 Sample Description: Olive Sandy Silt
Depth(ft): 35.5
Sample Type: Mod. Cal. Confining Pressure = 30.0 psi
Diameter (in) 2.615 2.615 2.615 Avg. = 2.615
Height (in) 5.690 5.690 5.690 Avg. = 5.690
BEFORE CONSOLIDATION AFTER CONSOLIDATION
Area (in²) 5.371 5.281
Moisture Content (%) 16.90 19.67
Wet Weight (gms) 75.36 1143.92
Dry Weight (gms) 71.69 980.52
Container Weight (gms) 49.97 149.81
Density and Saturation
Wet Weight (gms) 959.28
Container Weight (gms) 0.00
Wet Density (pcf) 119.6
Dry Density (pcf) 102.3
Initial Void Ratio 0.647
% Saturation 70.5
Assumed Specific Gravity = 2.70
Back Pressure Saturation
B Value (%) = 94 Change in Ht. of the Specimen (in)= 0
Consolidation
Cell Pressure (psi) = 80.0 Initial Burette Ht.(cm)= 70.7
Back Pressure(psi) = 50.0 Final Burette Ht.(cm)= 62.3
Eff. Consol. Stress (psi) = 30.0 Final Height (in)= 5.690
Induced OCR= 1.0 Initial Volume (cu.in)= 30.559
Change in Ht. of Specimen (in) = 0.0000 Final Volume (cu.in) = 30.047
Shear At Failure
Rate of Deformation (in/min)= 0.008 Deviator Stress (ksf) = 13.52
Time to 50% primary Consolidation = 3 Eff. Minor Principal stress (ksf) = 4.45
Failure Mode: Bulging Failure Eff. Major Principal stress (ksf) = 17.98
Axial Strain (%) = 5.37
CONSOLIDATED UNDRAINED TRIAXIAL TEST WITH PORE PRESSURE MEASUREMENT
Figure F-2.271

Test Procedure: ASTM D 4767
Project Name: Westside Subway Extension Tested by: ST Date: 07-16-11
Project No.: Input Data by: KM Date: 07-25-11
Test Pit: G-186 Reviewed by: AP Date: 07-25-11
Sample No.: 10 Sample Description: Olive Sandy Silt
Depth(ft): 35.5
Sample Type: Mod. Cal. Confining Pressure = 45.0 psi
Diameter (in) 2.615 2.615 2.615 Avg. = 2.615
Height (in) 5.690 5.690 5.690 Avg. = 5.690
BEFORE CONSOLIDATION AFTER CONSOLIDATION
Area (in²) 5.371 5.309
Moisture Content (%) 16.90 19.67
Wet Weight (gms) 75.36 1143.92
Dry Weight (gms) 71.69 980.52
Container Weight (gms) 49.97 149.81
Density and Saturation
Wet Weight (gms) 959.28
Container Weight (gms) 0.00
Wet Density (pcf) 119.6
Dry Density (pcf) 102.3
Initial Void Ratio 0.647
% Saturation 70.5
Assumed Specific Gravity = 2.70
Back Pressure Saturation
B Value (%) = 94 Change in Ht. of the Specimen (in)= 0
Consolidation
Cell Pressure (psi) = 95.0 Initial Burette Ht.(cm)= 62.4
Back Pressure(psi) = 50.0 Final Burette Ht.(cm)= 56.6
Eff. Consol. Stress (psi) = 45.0 Final Height (in)= 5.690
Induced OCR = 1.0 Initial Volume (cu.in)= 30.559
Change in Ht. of Specimen (in) = 0.0000 Final Volume (cu.in) = 30.206
Shear At Failure
Rate of Deformation (in/min)= 0.008 Deviator Stress (ksf) = 21.22
Time to 50% primary Consolidation = 3 Eff. Minor Principal stress (ksf) = 6.87
Failure Mode: Bulging Failure Eff. Major Principal stress (ksf) = 28.09
Axial Strain (%) = 5.31
CONSOLIDATED UNDRAINED TRIAXIAL TEST WITH PORE PRESSURE MEASUREMENT
4953-10-1561
Figure F-2.272
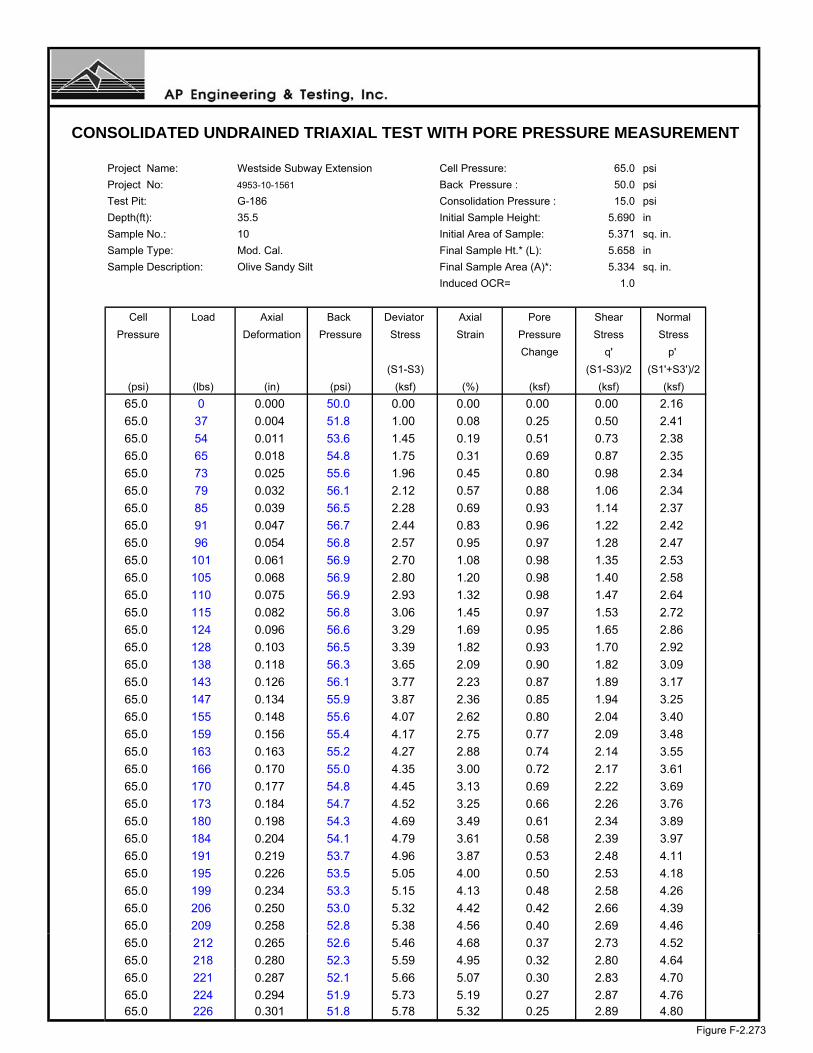
Project Name: Westside Subway Extension Cell Pressure: 65.0 psi
Project No: 4953-10-1561 Back Pressure : 50.0 psi
Test Pit: G-186 Consolidation Pressure : 15.0 psi
Depth(ft): 35.5 Initial Sample Height: 5.690 in
Sample No.: 10 Initial Area of Sample: 5.371 sq. in.
Sample Type: Mod. Cal. Final Sample Ht.* (L): 5.658 in
Sample Description: Olive Sandy Silt Final Sample Area (A)*: 5.334 sq. in.
Induced OCR= 1.0
Cell Load Axial Back Deviator Axial Pore Shear Normal
Pressure Deformation Pressure Stress Strain Pressure Stress Stress
Change q' p'
(S1-S3) (S1-S3)/2 (S1'+S3')/2
(psi) (lbs) (in) (psi) (ksf) (%) (ksf) (ksf) (ksf)
65.0 0 0.000 50.0 0.00 0.00 0.00 0.00 2.16
65.0 37 0.004 51.8 1.00 0.08 0.25 0.50 2.41
65.0 54 0.011 53.6 1.45 0.19 0.51 0.73 2.38
65.0 65 0.018 54.8 1.75 0.31 0.69 0.87 2.35
65.0 73 0.025 55.6 1.96 0.45 0.80 0.98 2.34
65.0 79 0.032 56.1 2.12 0.57 0.88 1.06 2.34
65.0 85 0.039 56.5 2.28 0.69 0.93 1.14 2.37
65.0 91 0.047 56.7 2.44 0.83 0.96 1.22 2.42
65.0 96 0.054 56.8 2.57 0.95 0.97 1.28 2.47
65.0 101 0.061 56.9 2.70 1.08 0.98 1.35 2.53
65.0 105 0.068 56.9 2.80 1.20 0.98 1.40 2.58
65.0 110 0.075 56.9 2.93 1.32 0.98 1.47 2.64
65.0 115 0.082 56.8 3.06 1.45 0.97 1.53 2.72
65.0 124 0.096 56.6 3.29 1.69 0.95 1.65 2.86
65.0 128 0.103 56.5 3.39 1.82 0.93 1.70 2.92
65.0 138 0.118 56.3 3.65 2.09 0.90 1.82 3.09
65.0 143 0.126 56.1 3.77 2.23 0.87 1.89 3.17
65.0 147 0.134 55.9 3.87 2.36 0.85 1.94 3.25
65.0 155 0.148 55.6 4.07 2.62 0.80 2.04 3.40
65.0 159 0.156 55.4 4.17 2.75 0.77 2.09 3.48
65.0 163 0.163 55.2 4.27 2.88 0.74 2.14 3.55
65.0 166 0.170 55.0 4.35 3.00 0.72 2.17 3.61
65.0 170 0.177 54.8 4.45 3.13 0.69 2.22 3.69
65.0 173 0.184 54.7 4.52 3.25 0.66 2.26 3.76
65.0 180 0.198 54.3 4.69 3.49 0.61 2.34 3.89
65.0 184 0.204 54.1 4.79 3.61 0.58 2.39 3.97
65.0 191 0.219 53.7 4.96 3.87 0.53 2.48 4.11
65.0 195 0.226 53.5 5.05 4.00 0.50 2.53 4.18
65.0 199 0.234 53.3 5.15 4.13 0.48 2.58 4.26
65.0 206 0.250 53.0 5.32 4.42 0.42 2.66 4.39
65.0 209 0.258 52.8 5.38 4.56 0.40 2.69 4.46
65.0 212 0.265 52.6 5.46 4.68 0.37 2.73 4.52
65.0 218 0.280 52.3 5.59 4.95 0.32 2.80 4.64
65.0 221 0.287 52.1 5.66 5.07 0.30 2.83 4.70
65.0 224 0.294 51.9 5.73 5.19 0.27 2.87 4.7665.0 226 0.301 51.8 5.78 5.32 0.25 2.89 4.80
CONSOLIDATED UNDRAINED TRIAXIAL TEST WITH PORE PRESSURE MEASUREMENT
Figure F-2.273

Project Name: Westside Subway Extension Cell Pressure: 80.0 psi
Project No: 4953-10-1561 Back Pressure : 50.0 psi
Test Pit: G-186 Consolidation Pressure : 30.0 psi
Depth(ft): 35.5 Initial Sample Height: 5.690 in
Sample No.: 10 Initial Area of Sample: 5.371 sq. in.
Sample Type: Mod. Cal. Final Sample Ht.* (L): 5.690 in
Sample Description: Olive Sandy Silt Final Sample Area (A)*: 5.281 sq. in.
Induced OCR= 1.0
Cell Load Axial Back Deviator Axial Pore Shear Normal
Pressure Deformation Pressure Stress Strain Pressure Stress Stress
Change q' p'
(S1-S3) (S1-S3)/2 (S1'+S3')/2
(psi) (lbs) (in) (psi) (ksf) (%) (ksf) (ksf) (ksf)
80.0 6 0.000 50.0 0.16 0.00 0.00 0.08 4.40
80.0 99 0.004 51.8 2.70 0.08 0.26 1.35 5.41
80.0 157 0.011 53.4 4.27 0.19 0.48 2.14 5.98
80.0 200 0.018 54.3 5.44 0.31 0.61 2.72 6.43
80.0 234 0.024 54.7 6.35 0.42 0.68 3.18 6.82
80.0 264 0.031 55.0 7.16 0.54 0.71 3.58 7.19
80.0 311 0.044 55.1 8.42 0.78 0.73 4.21 7.79
80.0 329 0.051 55.1 8.89 0.89 0.73 4.45 8.03
80.0 344 0.058 55.1 9.28 1.02 0.72 4.64 8.24
80.0 356 0.064 55.0 9.60 1.13 0.71 4.80 8.41
80.0 368 0.071 54.8 9.91 1.24 0.69 4.96 8.58
80.0 377 0.077 54.7 10.14 1.36 0.67 5.07 8.72
80.0 386 0.084 54.5 10.37 1.48 0.65 5.19 8.85
80.0 402 0.098 54.2 10.77 1.72 0.60 5.39 9.11
80.0 409 0.106 54.0 10.95 1.86 0.57 5.47 9.22
80.0 417 0.113 53.8 11.15 1.99 0.55 5.57 9.35
80.0 429 0.128 53.4 11.43 2.25 0.49 5.72 9.55
80.0 434 0.136 53.3 11.55 2.39 0.47 5.78 9.63
80.0 439 0.143 53.1 11.67 2.51 0.44 5.84 9.72
80.0 449 0.157 52.7 11.91 2.77 0.39 5.95 9.89
80.0 453 0.165 52.5 12.00 2.89 0.36 6.00 9.96
80.0 461 0.178 52.1 12.18 3.13 0.31 6.09 10.10
80.0 466 0.184 52.0 12.30 3.24 0.28 6.15 10.19
80.0 474 0.197 51.6 12.48 3.47 0.22 6.24 10.33
80.0 478 0.204 51.4 12.57 3.59 0.20 6.28 10.40
80.0 487 0.219 51.0 12.77 3.84 0.15 6.38 10.56
80.0 491 0.226 50.9 12.86 3.98 0.12 6.43 10.63
80.0 494 0.234 50.7 12.92 4.11 0.10 6.46 10.68
80.0 502 0.249 50.4 13.09 4.38 0.05 6.55 10.82
80.0 505 0.256 50.2 13.15 4.50 0.02 6.58 10.8780.0 508 0.263 50.0 13.21 4.63 0.00 6.61 10.93
80.0 514 0.278 49.7 13.33 4.89 -0.05 6.67 11.03
80.0 517 0.285 49.5 13.39 5.02 -0.07 6.70 11.08
80.0 522 0.298 49.2 13.49 5.24 -0.11 6.74 11.1880.0 524 0.305 49.1 13.52 5.37 -0.13 6.76 11.22
CONSOLIDATED UNDRAINED TRIAXIAL TEST WITH PORE PRESSURE MEASUREMENT
Figure F-2.274
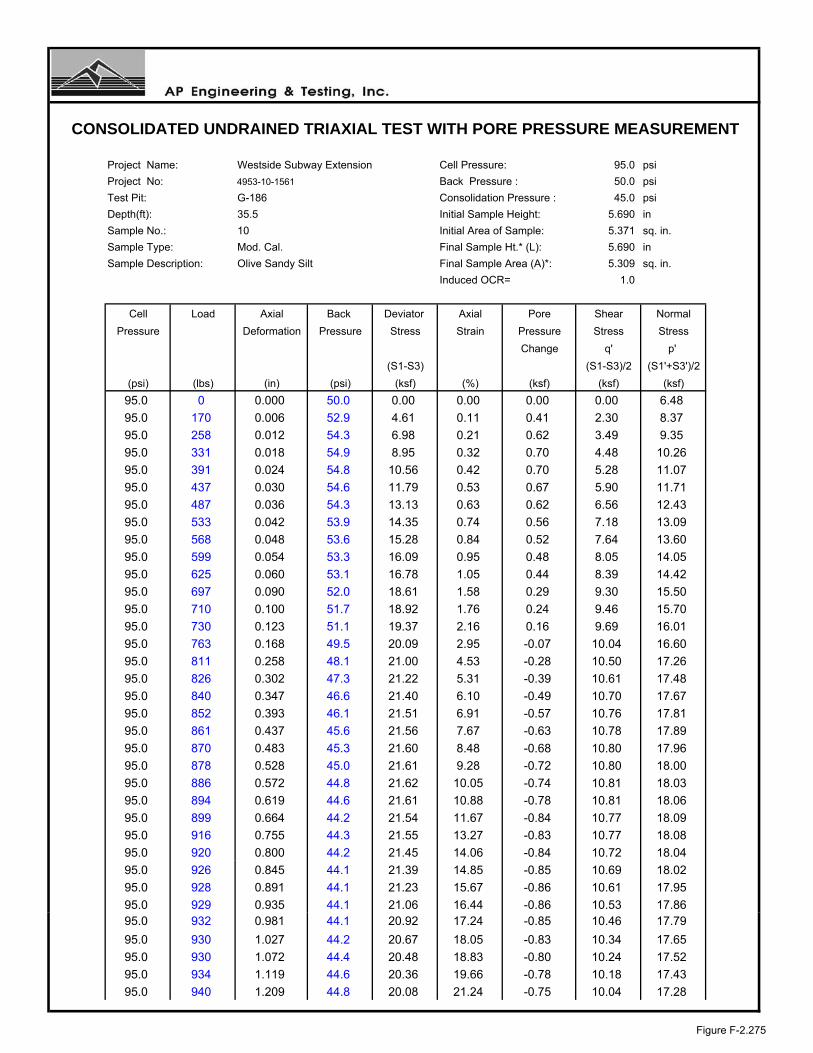
Project Name: Westside Subway Extension Cell Pressure: 95.0 psi
Project No: 4953-10-1561 Back Pressure : 50.0 psi
Test Pit: G-186 Consolidation Pressure : 45.0 psi
Depth(ft): 35.5 Initial Sample Height: 5.690 in
Sample No.: 10 Initial Area of Sample: 5.371 sq. in.
Sample Type: Mod. Cal. Final Sample Ht.* (L): 5.690 in
Sample Description: Olive Sandy Silt Final Sample Area (A)*: 5.309 sq. in.
Induced OCR= 1.0
Cell Load Axial Back Deviator Axial Pore Shear Normal
Pressure Deformation Pressure Stress Strain Pressure Stress Stress
Change q' p'
(S1-S3) (S1-S3)/2 (S1'+S3')/2
(psi) (lbs) (in) (psi) (ksf) (%) (ksf) (ksf) (ksf)
95.0 0 0.000 50.0 0.00 0.00 0.00 0.00 6.48
95.0 170 0.006 52.9 4.61 0.11 0.41 2.30 8.37
95.0 258 0.012 54.3 6.98 0.21 0.62 3.49 9.35
95.0 331 0.018 54.9 8.95 0.32 0.70 4.48 10.26
95.0 391 0.024 54.8 10.56 0.42 0.70 5.28 11.07
95.0 437 0.030 54.6 11.79 0.53 0.67 5.90 11.71
95.0 487 0.036 54.3 13.13 0.63 0.62 6.56 12.43
95.0 533 0.042 53.9 14.35 0.74 0.56 7.18 13.09
95.0 568 0.048 53.6 15.28 0.84 0.52 7.64 13.60
95.0 599 0.054 53.3 16.09 0.95 0.48 8.05 14.05
95.0 625 0.060 53.1 16.78 1.05 0.44 8.39 14.42
95.0 697 0.090 52.0 18.61 1.58 0.29 9.30 15.50
95.0 710 0.100 51.7 18.92 1.76 0.24 9.46 15.70
95.0 730 0.123 51.1 19.37 2.16 0.16 9.69 16.01
95.0 763 0.168 49.5 20.09 2.95 -0.07 10.04 16.60
95.0 811 0.258 48.1 21.00 4.53 -0.28 10.50 17.26
95.0 826 0.302 47.3 21.22 5.31 -0.39 10.61 17.48
95.0 840 0.347 46.6 21.40 6.10 -0.49 10.70 17.67
95.0 852 0.393 46.1 21.51 6.91 -0.57 10.76 17.81
95.0 861 0.437 45.6 21.56 7.67 -0.63 10.78 17.89
95.0 870 0.483 45.3 21.60 8.48 -0.68 10.80 17.96
95.0 878 0.528 45.0 21.61 9.28 -0.72 10.80 18.00
95.0 886 0.572 44.8 21.62 10.05 -0.74 10.81 18.03
95.0 894 0.619 44.6 21.61 10.88 -0.78 10.81 18.06
95.0 899 0.664 44.2 21.54 11.67 -0.84 10.77 18.09
95.0 916 0.755 44.3 21.55 13.27 -0.83 10.77 18.08
95.0 920 0.800 44.2 21.45 14.06 -0.84 10.72 18.04
95.0 926 0.845 44.1 21.39 14.85 -0.85 10.69 18.02
95.0 928 0.891 44.1 21.23 15.67 -0.86 10.61 17.95
95.0 929 0.935 44.1 21.06 16.44 -0.86 10.53 17.8695.0 932 0.981 44.1 20.92 17.24 -0.85 10.46 17.79
95.0 930 1.027 44.2 20.67 18.05 -0.83 10.34 17.65
95.0 930 1.072 44.4 20.48 18.83 -0.80 10.24 17.52
95.0 934 1.119 44.6 20.36 19.66 -0.78 10.18 17.43
95.0 940 1.209 44.8 20.08 21.24 -0.75 10.04 17.28
CONSOLIDATED UNDRAINED TRIAXIAL TEST WITH PORE PRESSURE MEASUREMENT
Figure F-2.275

LEGEND: CONFINING PRESSURES= ○ 15 psi □ 30 psi ∆ 45 psi
Project Name: Westside Subway Extension Sample Type: Mod. Cal.
Project No.: 4953-10-1561 Sample Description: Olive Sandy Silt
Test Pit: G-186 Avg. Dry Unit Weight (pcf): 102.3
Sample No.: 10 Avg. Initial Moisture Content (%): 16.9
Depth (ft): 35.5 Confining Pressure: 15.0, 30.0, 45.0 psi
CU TRIAXIAL MULTI-STAGE TEST WITH PORE PRESSURE MEASUREMENTASTM D 4767
0
5
10
15
20
25
30
0 5 10 15 20 25 30 35 40 45 50 55 60
NORMAL STRESS, P' (ksf)
SH
EA
R S
TR
ES
S, q
' (ks
f)
0.0
5.0
10.0
15.0
20.0
25.0
30.0
0.0 5.0 10.0 15.0 20.0
AXIAL STRAIN (Percent)
DE
VIA
TO
R S
TR
ES
S (
ksf)
-4.0
-3.0
-2.0
-1.0
0.0
1.0
2.0
3.0
4.0
0.0 5.0 10.0 15.0 20.0
AXIAL STRAIN (Percent)C
HA
NG
E I
N P
OR
E W
AT
ER
PR
ES
SU
RE
(ks
f)
Figure F-2.276

LEGEND: CONFINING PRESSURES= ○ 15 psi □ 30 psi ∆ 45 psi
Project Name: Westside Subway Extension Sample Type: Mod. Cal.Project No.: 4953-10-1561 Sample Description: Olive Sandy SiltTest Pit: G-186 Avg. Dry Unit Weight (pcf): 102.3Sample No.: 10 Avg. Initial Moisture Content (%): 16.9Depth (ft): 35.5 Confining Pressure: 15.0, 30.0, 45.0 psi
CU TRIAXIAL MULTI-STAGE TEST WITH PORE PRESSURE MEASUREMENTASTM D 4767
0
5
10
15
20
0 5 10 15 20 25 30 35 40
NORMAL STRESS (ksf)
SH
EA
R S
TR
ES
S (
ksf)
φ=38°
φ'= 36.5°
0
5
10
15
20
25
30
0 5 10 15 20 25 30 35 40 45 50 55 60 p' (ksf)
q' (
ksf)
C= 0.10 ksfC'= 0.10 ksf
Failure Criteria: 5% Axial Strain
Figure F-2.277

Test Pit: G-186 Sample Type: Mod. Cal.Sample No.: 10 Soil Description: Olive Sandy SiltDepth (feet): 35.5 Eff. Confining Pressure (psi): 30.0
Project Name: Westside Subway ExtensionProject No.: 4953-10-1561Date: 07/16/11
8.4000
120240480
38.0132
8153060
0.250.512
2.5000
Time (minutes) Volume Change (cc)0.00002.5000
00.1
SQRT Time (minutes) Volume Change (cc)0.0000 0.0000
2.82843.87305.4772
0.31620.50000.70711.00001.4142
4.6000
8.1000
7.50007.60007.90007.9000
7.7460
2.00007.5000
TIME RATE CONSOLIDATION CURVE
7.90007.90008.1000
8.40008.4000
4
ASTM D 2435
8.30008.40008.4000
10.954515.491921.9089
1445 8.4000
8.3000
5.80006.80007.2000
7.6000
4.60005.80006.80007.2000
0.00
1.00
2.00
3.00
4.00
5.00
6.00
7.00
8.00
9.00
0.1 1 10 100 1000 10000
Time (minutes)
Vol
ume
Cha
nge
(cc)
0.00
1.00
2.00
3.00
4.00
5.00
6.00
7.00
8.00
9.00
10.00
0.0 10.0 20.0 30.0 40.0
Square root Time (minutes)
Vol
ume
Cha
nge
(cc)
Figure F-2.278

Test Procedure: ASTM D 4767
Project Name: Westside Subway Extension Tested by: ST Date: 07-17-11
Project No.: 4953-10-1561 Input Data by: KM Date: 07-25-11
Test Pit: G-186 Reviewed by: AP Date: 07-25-11
Sample No.: 17 Sample Description: Strong Brown Clayey Sand
Depth(ft): 65.5
Sample Type: Mod. Cal. Confining Pressure = 20.0 psi
Diameter (in) 2.615 2.615 2.615 Avg. = 2.615
Height (in) 6.024 6.024 6.024 Avg. = 6.024
BEFORE CONSOLIDATION AFTER CONSOLIDATION
Area (in²) 5.371 5.337
Moisture Content (%) 15.06 15.46
Wet Weight (gms) 397.48 1295.70
Dry Weight (gms) 379.33 1142.00
Container Weight (gms) 258.83 147.83
Density and Saturation
Wet Weight (gms) 1149.30
Container Weight (gms) 0.00
Wet Density (pcf) 135.3
Dry Density (pcf) 117.6
Initial Void Ratio 0.433
% Saturation 94.0
Assumed Specific Gravity = 2.70
Back Pressure Saturation
B Value (%) = 95 Change in Ht. of the Specimen (in)= 0
Consolidation
Cell Pressure (psi) = 50.0 Initial Burette Ht.(cm)= 83.1
Back Pressure(psi) = 30.0 Final Burette Ht.(cm)= 76.3
Eff. Consol. Stress (psi) = 20.0 Final Height (in)= 5.984
Induced OCR = 1.0 Initial Volume (cu.in)= 32.353
Change in Ht. of Specimen (in) = 0.0397 Final Volume (cu.in) = 31.938
Shear At Failure
Rate of Deformation (in/min)= 0.008 Deviator Stress (ksf) = 10.80
Time to 50% primary Consolidation (min) = 3 Eff. Minor Principal stress (ksf) = 2.35
Failure Mode: Bulging Failure Eff. Major Principal stress (ksf) = 13.16
Axial Strain (%) = 5.11
CONSOLIDATED UNDRAINED TRIAXIAL TEST WITH PORE PRESSURE MEASUREMENT
Figure F-2.279

Test Procedure: ASTM D 4767
Project Name: Westside Subway Extension Tested by: ST Date: 07-17-11
Project No.: 4953-10-1561 Input Data by: KM Date: 07-25-11
Test Pit: G-186 Reviewed by: AP Date: 07-25-11
Sample No.: 17 Sample Description: Strong Brown Clayey Sand
Depth(ft): 65.5
Sample Type: Mod. Cal. Confining Pressure = 40.0 psi
Diameter (in) 2.615 2.615 2.615 Avg. = 2.615
Height (in) 6.024 6.024 6.024 Avg. = 6.024
BEFORE CONSOLIDATION AFTER CONSOLIDATION
Area (in²) 5.371 5.310
Moisture Content (%) 15.06 15.46
Wet Weight (gms) 397.48 1295.70
Dry Weight (gms) 379.33 1142.00
Container Weight (gms) 258.83 147.83
Density and Saturation
Wet Weight (gms) 1149.30
Container Weight (gms) 0.00
Wet Density (pcf) 135.3
Dry Density (pcf) 117.6
Initial Void Ratio 0.433
% Saturation 94.0
Assumed Specific Gravity = 2.70
Back Pressure Saturation
B Value (%) = 95 Change in Ht. of the Specimen (in)= 0
Consolidation
Cell Pressure (psi) = 70.0 Initial Burette Ht.(cm)= 76.2
Back Pressure(psi) = 30.0 Final Burette Ht.(cm)= 70.2
Eff. Consol. Stress (psi) = 40.0 Final Height (in)= 6.024
Induced OCR= 1.0 Initial Volume (cu.in)= 32.353
Change in Ht. of Specimen (in) = 0.0000 Final Volume (cu.in) = 31.987
Shear At Failure
Rate of Deformation (in/min)= 0.008 Deviator Stress (ksf) = 22.62
Time to 50% primary Consolidation = 3 Eff. Minor Principal stress (ksf) = 6.20
Failure Mode: Bulging Failure Eff. Major Principal stress (ksf) = 28.82
Axial Strain (%) = 5.00
CONSOLIDATED UNDRAINED TRIAXIAL TEST WITH PORE PRESSURE MEASUREMENT
Figure F-2.280

Test Procedure: ASTM D 4767
Project Name: Westside Subway Extension Tested by: ST Date: 07-17-11
Project No.: Input Data by: KM Date: 07-25-11
Test Pit: G-186 Reviewed by: AP Date: 07-25-11
Sample No.: 17 Sample Description: Strong Brown Clayey Sand
Depth(ft): 65.5
Sample Type: Mod. Cal. Confining Pressure = 60.0 psi
Diameter (in) 2.615 2.615 2.615 Avg. = 2.615
Height (in) 6.024 6.024 6.024 Avg. = 6.024
BEFORE CONSOLIDATION AFTER CONSOLIDATION
Area (in²) 5.371 5.304
Moisture Content (%) 15.06 15.46
Wet Weight (gms) 397.48 1295.70
Dry Weight (gms) 379.33 1142.00
Container Weight (gms) 258.83 147.83
Density and Saturation
Wet Weight (gms) 1149.30
Container Weight (gms) 0.00
Wet Density (pcf) 135.3
Dry Density (pcf) 117.6
Initial Void Ratio 0.433
% Saturation 94.0
Assumed Specific Gravity = 2.70
Back Pressure Saturation
B Value (%) = 95 Change in Ht. of the Specimen (in)= 0
Consolidation
Cell Pressure (psi) = 90.0 Initial Burette Ht.(cm)= 70.2
Back Pressure(psi) = 30.0 Final Burette Ht.(cm)= 63.6
Eff. Consol. Stress (psi) = 60.0 Final Height (in)= 6.024
Induced OCR = 1.0 Initial Volume (cu.in)= 32.353
Change in Ht. of Specimen (in) = 0.0000 Final Volume (cu.in) = 31.951
Shear At Failure
Rate of Deformation (in/min)= 0.008 Deviator Stress (ksf) = 30.47
Time to 50% primary Consolidation = 3 Eff. Minor Principal stress (ksf) = 8.33
Failure Mode: Bulging Failure Eff. Major Principal stress (ksf) = 38.80
Axial Strain (%) = 3.40
CONSOLIDATED UNDRAINED TRIAXIAL TEST WITH PORE PRESSURE MEASUREMENT
4953-10-1561
Figure F-2.281
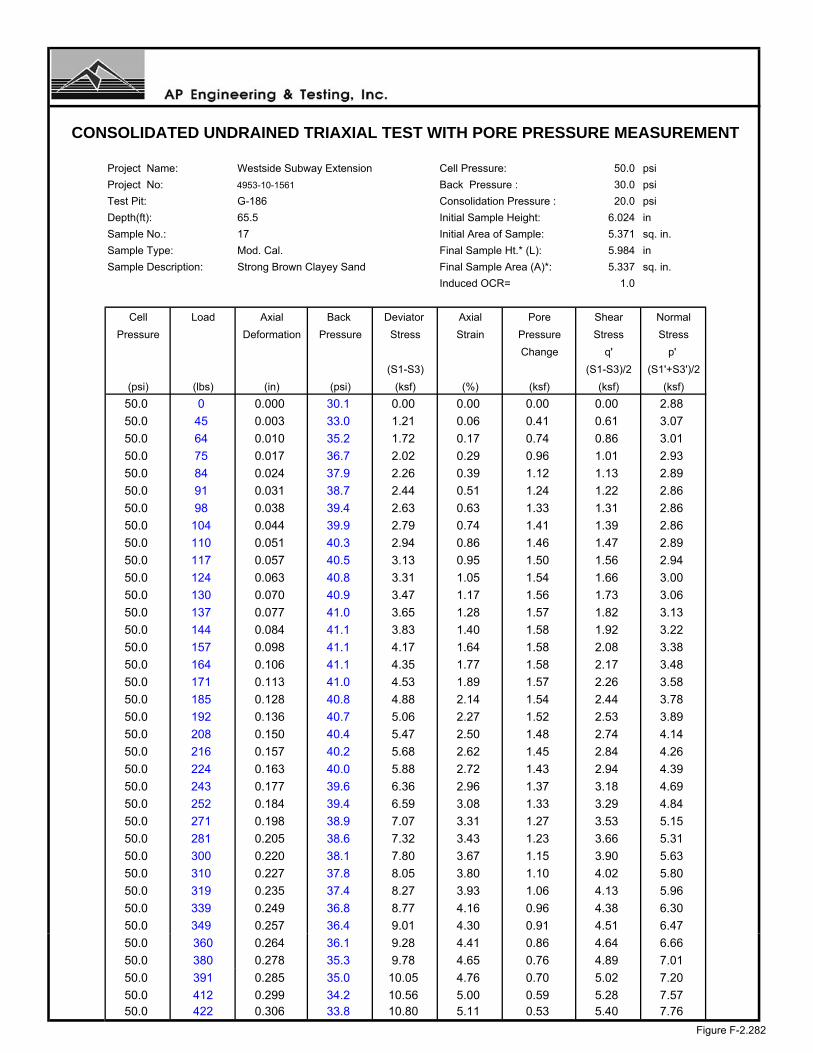
Project Name: Westside Subway Extension Cell Pressure: 50.0 psi
Project No: 4953-10-1561 Back Pressure : 30.0 psi
Test Pit: G-186 Consolidation Pressure : 20.0 psi
Depth(ft): 65.5 Initial Sample Height: 6.024 in
Sample No.: 17 Initial Area of Sample: 5.371 sq. in.
Sample Type: Mod. Cal. Final Sample Ht.* (L): 5.984 in
Sample Description: Strong Brown Clayey Sand Final Sample Area (A)*: 5.337 sq. in.
Induced OCR= 1.0
Cell Load Axial Back Deviator Axial Pore Shear Normal
Pressure Deformation Pressure Stress Strain Pressure Stress Stress
Change q' p'
(S1-S3) (S1-S3)/2 (S1'+S3')/2
(psi) (lbs) (in) (psi) (ksf) (%) (ksf) (ksf) (ksf)
50.0 0 0.000 30.1 0.00 0.00 0.00 0.00 2.88
50.0 45 0.003 33.0 1.21 0.06 0.41 0.61 3.07
50.0 64 0.010 35.2 1.72 0.17 0.74 0.86 3.01
50.0 75 0.017 36.7 2.02 0.29 0.96 1.01 2.93
50.0 84 0.024 37.9 2.26 0.39 1.12 1.13 2.89
50.0 91 0.031 38.7 2.44 0.51 1.24 1.22 2.86
50.0 98 0.038 39.4 2.63 0.63 1.33 1.31 2.86
50.0 104 0.044 39.9 2.79 0.74 1.41 1.39 2.86
50.0 110 0.051 40.3 2.94 0.86 1.46 1.47 2.89
50.0 117 0.057 40.5 3.13 0.95 1.50 1.56 2.94
50.0 124 0.063 40.8 3.31 1.05 1.54 1.66 3.00
50.0 130 0.070 40.9 3.47 1.17 1.56 1.73 3.06
50.0 137 0.077 41.0 3.65 1.28 1.57 1.82 3.13
50.0 144 0.084 41.1 3.83 1.40 1.58 1.92 3.22
50.0 157 0.098 41.1 4.17 1.64 1.58 2.08 3.38
50.0 164 0.106 41.1 4.35 1.77 1.58 2.17 3.48
50.0 171 0.113 41.0 4.53 1.89 1.57 2.26 3.58
50.0 185 0.128 40.8 4.88 2.14 1.54 2.44 3.78
50.0 192 0.136 40.7 5.06 2.27 1.52 2.53 3.89
50.0 208 0.150 40.4 5.47 2.50 1.48 2.74 4.14
50.0 216 0.157 40.2 5.68 2.62 1.45 2.84 4.26
50.0 224 0.163 40.0 5.88 2.72 1.43 2.94 4.39
50.0 243 0.177 39.6 6.36 2.96 1.37 3.18 4.69
50.0 252 0.184 39.4 6.59 3.08 1.33 3.29 4.84
50.0 271 0.198 38.9 7.07 3.31 1.27 3.53 5.15
50.0 281 0.205 38.6 7.32 3.43 1.23 3.66 5.31
50.0 300 0.220 38.1 7.80 3.67 1.15 3.90 5.63
50.0 310 0.227 37.8 8.05 3.80 1.10 4.02 5.80
50.0 319 0.235 37.4 8.27 3.93 1.06 4.13 5.96
50.0 339 0.249 36.8 8.77 4.16 0.96 4.38 6.30
50.0 349 0.257 36.4 9.01 4.30 0.91 4.51 6.47
50.0 360 0.264 36.1 9.28 4.41 0.86 4.64 6.66
50.0 380 0.278 35.3 9.78 4.65 0.76 4.89 7.01
50.0 391 0.285 35.0 10.05 4.76 0.70 5.02 7.20
50.0 412 0.299 34.2 10.56 5.00 0.59 5.28 7.5750.0 422 0.306 33.8 10.80 5.11 0.53 5.40 7.76
CONSOLIDATED UNDRAINED TRIAXIAL TEST WITH PORE PRESSURE MEASUREMENT
Figure F-2.282
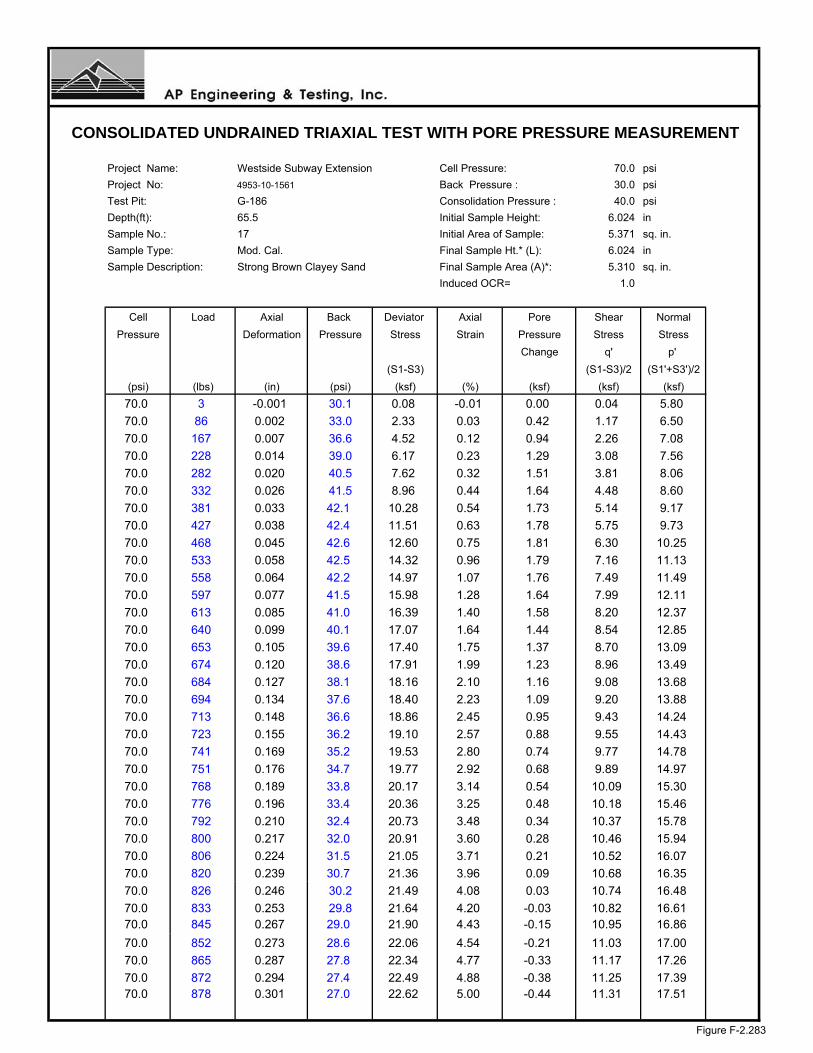
Project Name: Westside Subway Extension Cell Pressure: 70.0 psi
Project No: 4953-10-1561 Back Pressure : 30.0 psi
Test Pit: G-186 Consolidation Pressure : 40.0 psi
Depth(ft): 65.5 Initial Sample Height: 6.024 in
Sample No.: 17 Initial Area of Sample: 5.371 sq. in.
Sample Type: Mod. Cal. Final Sample Ht.* (L): 6.024 in
Sample Description: Strong Brown Clayey Sand Final Sample Area (A)*: 5.310 sq. in.
Induced OCR= 1.0
Cell Load Axial Back Deviator Axial Pore Shear Normal
Pressure Deformation Pressure Stress Strain Pressure Stress Stress
Change q' p'
(S1-S3) (S1-S3)/2 (S1'+S3')/2
(psi) (lbs) (in) (psi) (ksf) (%) (ksf) (ksf) (ksf)
70.0 3 -0.001 30.1 0.08 -0.01 0.00 0.04 5.80
70.0 86 0.002 33.0 2.33 0.03 0.42 1.17 6.50
70.0 167 0.007 36.6 4.52 0.12 0.94 2.26 7.08
70.0 228 0.014 39.0 6.17 0.23 1.29 3.08 7.56
70.0 282 0.020 40.5 7.62 0.32 1.51 3.81 8.06
70.0 332 0.026 41.5 8.96 0.44 1.64 4.48 8.60
70.0 381 0.033 42.1 10.28 0.54 1.73 5.14 9.17
70.0 427 0.038 42.4 11.51 0.63 1.78 5.75 9.73
70.0 468 0.045 42.6 12.60 0.75 1.81 6.30 10.25
70.0 533 0.058 42.5 14.32 0.96 1.79 7.16 11.13
70.0 558 0.064 42.2 14.97 1.07 1.76 7.49 11.49
70.0 597 0.077 41.5 15.98 1.28 1.64 7.99 12.11
70.0 613 0.085 41.0 16.39 1.40 1.58 8.20 12.37
70.0 640 0.099 40.1 17.07 1.64 1.44 8.54 12.85
70.0 653 0.105 39.6 17.40 1.75 1.37 8.70 13.09
70.0 674 0.120 38.6 17.91 1.99 1.23 8.96 13.49
70.0 684 0.127 38.1 18.16 2.10 1.16 9.08 13.68
70.0 694 0.134 37.6 18.40 2.23 1.09 9.20 13.88
70.0 713 0.148 36.6 18.86 2.45 0.95 9.43 14.24
70.0 723 0.155 36.2 19.10 2.57 0.88 9.55 14.43
70.0 741 0.169 35.2 19.53 2.80 0.74 9.77 14.78
70.0 751 0.176 34.7 19.77 2.92 0.68 9.89 14.97
70.0 768 0.189 33.8 20.17 3.14 0.54 10.09 15.30
70.0 776 0.196 33.4 20.36 3.25 0.48 10.18 15.46
70.0 792 0.210 32.4 20.73 3.48 0.34 10.37 15.78
70.0 800 0.217 32.0 20.91 3.60 0.28 10.46 15.94
70.0 806 0.224 31.5 21.05 3.71 0.21 10.52 16.07
70.0 820 0.239 30.7 21.36 3.96 0.09 10.68 16.35
70.0 826 0.246 30.2 21.49 4.08 0.03 10.74 16.48
70.0 833 0.253 29.8 21.64 4.20 -0.03 10.82 16.6170.0 845 0.267 29.0 21.90 4.43 -0.15 10.95 16.86
70.0 852 0.273 28.6 22.06 4.54 -0.21 11.03 17.00
70.0 865 0.287 27.8 22.34 4.77 -0.33 11.17 17.26
70.0 872 0.294 27.4 22.49 4.88 -0.38 11.25 17.3970.0 878 0.301 27.0 22.62 5.00 -0.44 11.31 17.51
CONSOLIDATED UNDRAINED TRIAXIAL TEST WITH PORE PRESSURE MEASUREMENT
Figure F-2.283

Project Name: Westside Subway Extension Cell Pressure: 90.0 psi
Project No: 4953-10-1561 Back Pressure : 30.0 psi
Test Pit: G-186 Consolidation Pressure : 60.0 psi
Depth(ft): 65.5 Initial Sample Height: 6.024 in
Sample No.: 17 Initial Area of Sample: 5.371 sq. in.
Sample Type: Mod. Cal. Final Sample Ht.* (L): 6.024 in
Sample Description: Strong Brown Clayey Sand Final Sample Area (A)*: 5.304 sq. in.
Induced OCR= 1.0
Cell Load Axial Back Deviator Axial Pore Shear Normal
Pressure Deformation Pressure Stress Strain Pressure Stress Stress
Change q' p'
(S1-S3) (S1-S3)/2 (S1'+S3')/2
(psi) (lbs) (in) (psi) (ksf) (%) (ksf) (ksf) (ksf)
90.0 0 0.000 30.0 0.00 0.00 0.00 0.00 8.64
90.0 212 0.006 32.9 5.75 0.10 0.42 2.88 11.10
90.0 319 0.012 35.0 8.64 0.20 0.71 4.32 12.25
90.0 407 0.018 36.5 11.02 0.30 0.94 5.51 13.21
90.0 488 0.024 37.7 13.20 0.40 1.10 6.60 14.14
90.0 573 0.030 38.6 15.48 0.50 1.23 7.74 15.15
90.0 671 0.036 39.3 18.11 0.60 1.34 9.05 16.36
90.0 723 0.042 39.6 19.49 0.70 1.38 9.75 17.01
90.0 815 0.048 39.9 21.95 0.80 1.43 10.98 18.19
90.0 877 0.054 40.0 23.60 0.90 1.44 11.80 19.00
90.0 922 0.060 39.9 24.78 1.00 1.43 12.39 19.60
90.0 1038 0.090 38.4 27.76 1.49 1.21 13.88 21.31
90.0 1056 0.100 37.7 28.19 1.66 1.11 14.10 21.62
90.0 1126 0.162 34.2 29.75 2.69 0.60 14.87 22.91
90.0 1162 0.205 32.2 30.47 3.40 0.31 15.24 23.57
90.0 1190 0.251 30.4 30.96 4.16 0.05 15.48 24.07
90.0 1214 0.295 28.8 31.35 4.90 -0.18 15.67 24.49
90.0 1237 0.338 27.4 31.70 5.61 -0.37 15.85 24.86
90.0 1251 0.384 26.2 31.80 6.38 -0.55 15.90 25.09
90.0 1267 0.427 25.2 31.96 7.09 -0.70 15.98 25.31
90.0 1281 0.471 24.3 32.06 7.82 -0.83 16.03 25.50
90.0 1292 0.517 23.4 32.07 8.57 -0.95 16.04 25.63
90.0 1303 0.560 22.6 32.09 9.29 -1.07 16.04 25.75
90.0 1315 0.604 21.9 32.12 10.03 -1.17 16.06 25.87
90.0 1331 0.692 20.6 31.99 11.49 -1.36 15.99 25.99
90.0 1340 0.737 20.0 31.93 12.24 -1.44 15.96 26.04
90.0 1347 0.783 19.5 31.82 12.99 -1.51 15.91 26.06
90.0 1355 0.825 19.0 31.75 13.70 -1.59 15.87 26.10
90.0 1363 0.871 18.5 31.66 14.45 -1.66 15.83 26.13
90.0 1369 0.915 18.2 31.52 15.19 -1.70 15.76 26.1090.0 1376 0.958 17.8 31.42 15.90 -1.75 15.71 26.10
90.0 1384 1.004 17.5 31.32 16.66 -1.81 15.66 26.10
90.0 1396 1.091 16.7 31.04 18.11 -1.91 15.52 26.07
90.0 1401 1.137 16.4 30.86 18.87 -1.96 15.43 26.03
90.0 1413 1.224 15.9 30.57 20.31 -2.03 15.28 25.95
CONSOLIDATED UNDRAINED TRIAXIAL TEST WITH PORE PRESSURE MEASUREMENT
Figure F-2.284

LEGEND: CONFINING PRESSURES= ○ 20 psi □ 40 psi ∆ 60 psi
Project Name: Westside Subway Extension Sample Type: Mod. Cal.
Project No.: 4953-10-1561 Sample Description: Strong Brown Clayey Sand
Test Pit: G-186 Avg. Dry Unit Weight (pcf): 117.6
Sample No.: 17 Avg. Initial Moisture Content (%): 15.1
Depth (ft): 65.5 Confining Pressure: 20.0, 40.0, 60.0 psi
CU TRIAXIAL MULTI-STAGE TEST WITH PORE PRESSURE MEASUREMENTASTM D 4767
0
5
10
15
20
25
30
0 5 10 15 20 25 30 35 40 45 50 55 60
NORMAL STRESS, P' (ksf)
SH
EA
R S
TR
ES
S, q
' (ks
f)
0.0
5.0
10.0
15.0
20.0
25.0
30.0
35.0
40.0
0.0 5.0 10.0 15.0 20.0
AXIAL STRAIN (Percent)
DE
VIA
TO
R S
TR
ES
S (
ksf)
-4.0
-3.0
-2.0
-1.0
0.0
1.0
2.0
3.0
4.0
0.0 5.0 10.0 15.0 20.0
AXIAL STRAIN (Percent)C
HA
NG
E I
N P
OR
E W
AT
ER
PR
ES
SU
RE
(ks
f)
Figure F-2.285
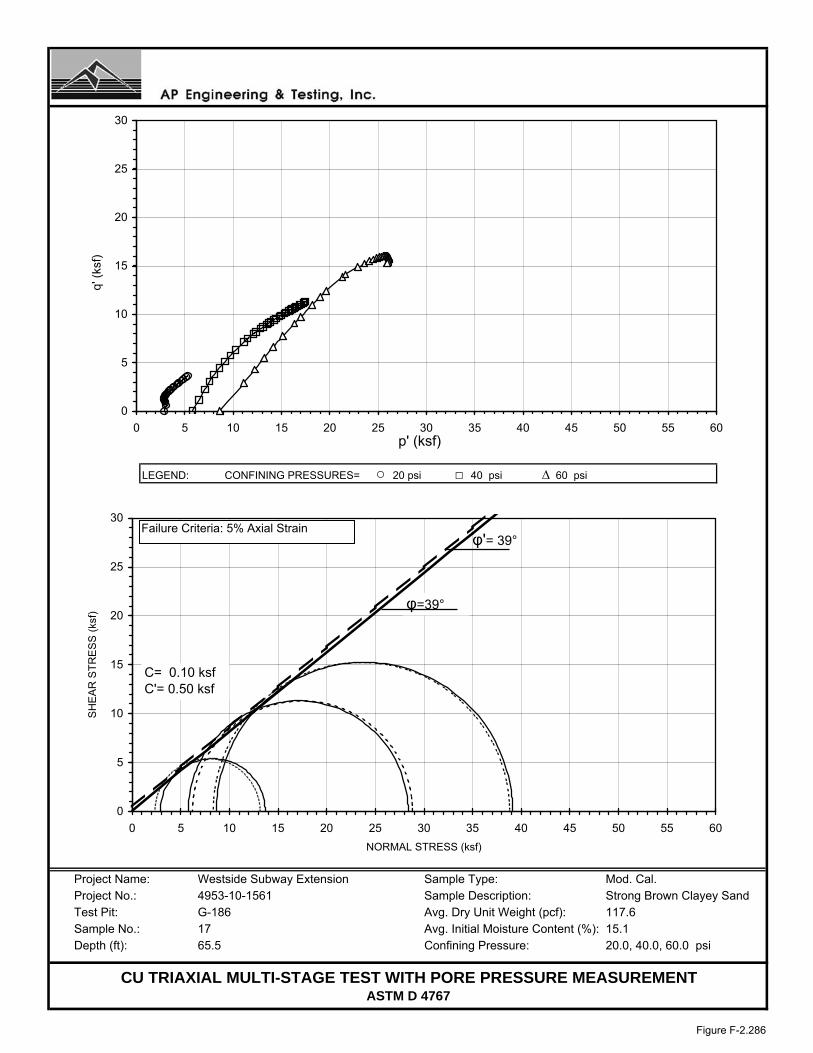
LEGEND: CONFINING PRESSURES= ○ 20 psi □ 40 psi ∆ 60 psi
Project Name: Westside Subway Extension Sample Type: Mod. Cal.Project No.: 4953-10-1561 Sample Description: Strong Brown Clayey SandTest Pit: G-186 Avg. Dry Unit Weight (pcf): 117.6Sample No.: 17 Avg. Initial Moisture Content (%): 15.1Depth (ft): 65.5 Confining Pressure: 20.0, 40.0, 60.0 psi
CU TRIAXIAL MULTI-STAGE TEST WITH PORE PRESSURE MEASUREMENTASTM D 4767
0
5
10
15
20
25
30
0 5 10 15 20 25 30 35 40 45 50 55 60
NORMAL STRESS (ksf)
SH
EA
R S
TR
ES
S (
ksf)
φ=39°
φ'= 39°
0
5
10
15
20
25
30
0 5 10 15 20 25 30 35 40 45 50 55 60 p' (ksf)
q' (
ksf)
C= 0.10 ksfC'= 0.50 ksf
Failure Criteria: 5% Axial Strain
Figure F-2.286

Test Pit: G-186 Sample Type: Mod. Cal.Sample No.: 17 Soil Description: Strong Brown Clayey SandDepth (feet): 65.5 Eff. Confining Pressure (psi): 40.0
Project Name: Westside Subway ExtensionProject No.: 4953-10-1561Date: 07/17/11
6.0000
120240492
38.1707
8153060
0.250.512
0.8000
Time (minutes) Volume Change (cc)0.00000.8000
00.1
SQRT Time (minutes) Volume Change (cc)0.0000 0.0000
2.82843.87305.4772
0.31620.50000.70711.00001.4142
1.2000
5.1000
2.80003.50004.20004.7000
7.7460
2.00002.8000
TIME RATE CONSOLIDATION CURVE
4.20004.70005.1000
5.55005.8200
4
ASTM D 2435
5.30005.55005.8200
10.954515.491922.1811
1457 6.0000
5.3000
1.40001.70002.2000
3.5000
1.20001.40001.70002.2000
0.00
1.00
2.00
3.00
4.00
5.00
6.00
7.00
0.1 1 10 100 1000 10000
Time (minutes)
Vol
ume
Cha
nge
(cc)
0.00
1.00
2.00
3.00
4.00
5.00
6.00
7.00
8.00
9.00
10.00
0.0 10.0 20.0 30.0 40.0 50.0
Square root Time (minutes)
Vol
ume
Cha
nge
(cc)
Figure F-2.287

Test Procedure: ASTM D 4767
Project Name: Westside Subway Extension Tested by: ST Date: 08-09-11
Project No.: 4953-10-1561 Input Data by: KM Date: 08-17-11
Test Pit: G-189 Reviewed by: AP Date: 08-17-11
Sample No.: 3 Sample Description: Silty Sand
Depth(ft): 15.5
Sample Type: Mod. Cal. Confining Pressure = 5.0 psi
Diameter (in) 2.620 2.620 2.620 Avg. = 2.620
Height (in) 5.892 5.892 5.892 Avg. = 5.892
BEFORE CONSOLIDATION AFTER CONSOLIDATION
Area (in²) 5.391 5.406
Moisture Content (%) 7.11 11.27
Wet Weight (gms) 301.13 1321.24
Dry Weight (gms) 284.44 1202.44
Container Weight (gms) 49.82 148.53
Density and Saturation
Wet Weight (gms) 1078.14
Container Weight (gms) 0.00
Wet Density (pcf) 129.3
Dry Density (pcf) 120.7
Initial Void Ratio 0.396
% Saturation 48.5
Assumed Specific Gravity = 2.70
Back Pressure Saturation
B Value (%) = 94 Change in Ht. of the Specimen (in)= 0
Consolidation
Cell Pressure (psi) = 45.0 Initial Burette Ht.(cm)= 73.8
Back Pressure(psi) = 40.0 Final Burette Ht.(cm)= 71.6
Eff. Consol. Stress (psi) = 5.0 Final Height (in)= 5.851
Induced OCR = 1.0 Initial Volume (cu.in)= 31.765
Change in Ht. of Specimen (in) = 0.0408 Final Volume (cu.in) = 31.631
Shear At Failure
Rate of Deformation (in/min)= 0.008 Deviator Stress (ksf) = 6.10
Time to 50% primary Consolidation (min) = 3 Eff. Minor Principal stress (ksf) = 1.40
Failure Mode: Bulging Failure Eff. Major Principal stress (ksf) = 7.50
Axial Strain (%) = 5.06
CONSOLIDATED UNDRAINED TRIAXIAL TEST WITH PORE PRESSURE MEASUREMENT
Figure F-2.288

Test Procedure: ASTM D 4767
Project Name: Westside Subway Extension Tested by: ST Date: 08-09-11
Project No.: 4953-10-1561 Input Data by: KM Date: 08-17-11
Test Pit: G-189 Reviewed by: AP Date: 08-17-11
Sample No.: 3 Sample Description: Silty Sand
Depth(ft): 15.5
Sample Type: Mod. Cal. Confining Pressure = 15.0 psi
Diameter (in) 2.620 2.620 2.620 Avg. = 2.620
Height (in) 5.892 5.892 5.892 Avg. = 5.892
BEFORE CONSOLIDATION AFTER CONSOLIDATION
Area (in²) 5.391 5.351
Moisture Content (%) 7.11 11.27
Wet Weight (gms) 301.13 1321.24
Dry Weight (gms) 284.44 1202.44
Container Weight (gms) 49.82 148.53
Density and Saturation
Wet Weight (gms) 1078.14
Container Weight (gms) 0.00
Wet Density (pcf) 129.3
Dry Density (pcf) 120.7
Initial Void Ratio 0.396
% Saturation 48.5
Assumed Specific Gravity = 2.70
Back Pressure Saturation
B Value (%) = 94 Change in Ht. of the Specimen (in)= 0
Consolidation
Cell Pressure (psi) = 55.0 Initial Burette Ht.(cm)= 71.7
Back Pressure(psi) = 40.0 Final Burette Ht.(cm)= 67.8
Eff. Consol. Stress (psi) = 15.0 Final Height (in)= 5.892
Induced OCR= 1.0 Initial Volume (cu.in)= 31.765
Change in Ht. of Specimen (in) = 0.0000 Final Volume (cu.in) = 31.528
Shear At Failure
Rate of Deformation (in/min)= 0.008 Deviator Stress (ksf) = 11.10
Time to 50% primary Consolidation = 3 Eff. Minor Principal stress (ksf) = 2.85
Failure Mode: Bulging Failure Eff. Major Principal stress (ksf) = 13.95
Axial Strain (%) = 5.15
CONSOLIDATED UNDRAINED TRIAXIAL TEST WITH PORE PRESSURE MEASUREMENT
Figure F-2.289

Test Procedure: ASTM D 4767
Project Name: Westside Subway Extension Tested by: ST Date: 08-09-11
Project No.: Input Data by: KM Date: 08-17-11
Test Pit: G-189 Reviewed by: AP Date: 08-17-11
Sample No.: 3 Sample Description: Silty Sand
Depth(ft): 15.5
Sample Type: Mod. Cal. Confining Pressure = 25.0 psi
Diameter (in) 2.620 2.620 2.620 Avg. = 2.620
Height (in) 5.892 5.892 5.892 Avg. = 5.892
BEFORE CONSOLIDATION AFTER CONSOLIDATION
Area (in²) 5.391 5.365
Moisture Content (%) 7.11 11.27
Wet Weight (gms) 301.13 1321.24
Dry Weight (gms) 284.44 1202.44
Container Weight (gms) 49.82 148.53
Density and Saturation
Wet Weight (gms) 1078.14
Container Weight (gms) 0.00
Wet Density (pcf) 129.3
Dry Density (pcf) 120.7
Initial Void Ratio 0.396
% Saturation 48.5
Assumed Specific Gravity = 2.70
Back Pressure Saturation
B Value (%) = 94 Change in Ht. of the Specimen (in)= 0
Consolidation
Cell Pressure (psi) = 65.0 Initial Burette Ht.(cm)= 67.8
Back Pressure(psi) = 40.0 Final Burette Ht.(cm)= 65.3
Eff. Consol. Stress (psi) = 25.0 Final Height (in)= 5.892
Induced OCR = 1.0 Initial Volume (cu.in)= 31.765
Change in Ht. of Specimen (in) = 0.0000 Final Volume (cu.in) = 31.613
Shear At Failure
Rate of Deformation (in/min)= 0.008 Deviator Stress (ksf) = 15.55
Time to 50% primary Consolidation = 3 Eff. Minor Principal stress (ksf) = 4.18
Failure Mode: Bulging Failure Eff. Major Principal stress (ksf) = 19.72
Axial Strain (%) = 5.34
CONSOLIDATED UNDRAINED TRIAXIAL TEST WITH PORE PRESSURE MEASUREMENT
4953-10-1561
Figure F-2.290

Project Name: Westside Subway Extension Cell Pressure: 45.0 psi
Project No: 4953-10-1561 Back Pressure : 40.0 psi
Test Pit: G-189 Consolidation Pressure : 5.0 psi
Depth(ft): 15.5 Initial Sample Height: 5.892 in
Sample No.: 3 Initial Area of Sample: 5.391 sq. in.
Sample Type: Mod. Cal. Final Sample Ht.* (L): 5.851 in
Sample Description: Silty Sand Final Sample Area (A)*: 5.406 sq. in.
Induced OCR= 1.0
Cell Load Axial Back Deviator Axial Pore Shear Normal
Pressure Deformation Pressure Stress Strain Pressure Stress Stress
Change q' p'
(S1-S3) (S1-S3)/2 (S1'+S3')/2
(psi) (lbs) (in) (psi) (ksf) (%) (ksf) (ksf) (ksf)
45.0 2 0.000 40.1 0.05 0.00 0.00 0.03 0.75
45.0 28 0.004 40.7 0.75 0.06 0.09 0.37 1.00
45.0 36 0.009 41.2 0.96 0.15 0.17 0.48 1.03
45.0 42 0.014 41.6 1.12 0.25 0.21 0.56 1.06
45.0 47 0.020 41.8 1.25 0.33 0.25 0.62 1.10
45.0 51 0.025 42.0 1.35 0.43 0.27 0.68 1.13
45.0 56 0.031 42.1 1.48 0.52 0.28 0.74 1.18
45.0 60 0.037 42.1 1.59 0.63 0.29 0.79 1.22
45.0 65 0.043 42.2 1.72 0.73 0.30 0.86 1.28
45.0 70 0.048 42.2 1.85 0.82 0.30 0.92 1.34
45.0 74 0.053 42.2 1.95 0.91 0.30 0.98 1.40
45.0 80 0.059 42.1 2.11 1.00 0.30 1.05 1.48
45.0 86 0.064 42.1 2.27 1.09 0.29 1.13 1.56
45.0 92 0.069 42.0 2.42 1.18 0.28 1.21 1.65
45.0 99 0.075 41.9 2.60 1.27 0.27 1.30 1.75
45.0 118 0.090 41.6 3.09 1.54 0.22 1.55 2.05
45.0 139 0.113 40.9 3.63 1.93 0.12 1.82 2.41
45.0 146 0.125 40.6 3.81 2.13 0.07 1.90 2.56
45.0 154 0.137 40.2 4.01 2.33 0.01 2.00 2.71
45.0 162 0.148 39.8 4.21 2.53 -0.04 2.10 2.86
45.0 169 0.160 39.4 4.38 2.73 -0.10 2.19 3.01
45.0 176 0.171 39.0 4.55 2.93 -0.15 2.28 3.15
45.0 183 0.183 38.7 4.72 3.12 -0.21 2.36 3.29
45.0 190 0.194 38.3 4.89 3.31 -0.26 2.45 3.43
45.0 198 0.204 37.9 5.09 3.49 -0.31 2.55 3.58
45.0 206 0.215 37.6 5.29 3.68 -0.36 2.64 3.72
45.0 213 0.226 37.2 5.45 3.86 -0.41 2.73 3.86
45.0 218 0.238 36.9 5.57 4.06 -0.46 2.79 3.96
45.0 223 0.249 36.6 5.69 4.26 -0.50 2.84 4.07
45.0 227 0.261 36.3 5.78 4.47 -0.55 2.89 4.16
45.0 232 0.273 36.0 5.89 4.67 -0.59 2.95 4.26
45.0 237 0.284 35.7 6.01 4.86 -0.64 3.00 4.36
45.0 241 0.296 35.4 6.10 5.06 -0.68 3.05 4.45
CONSOLIDATED UNDRAINED TRIAXIAL TEST WITH PORE PRESSURE MEASUREMENT
Figure F-2.291
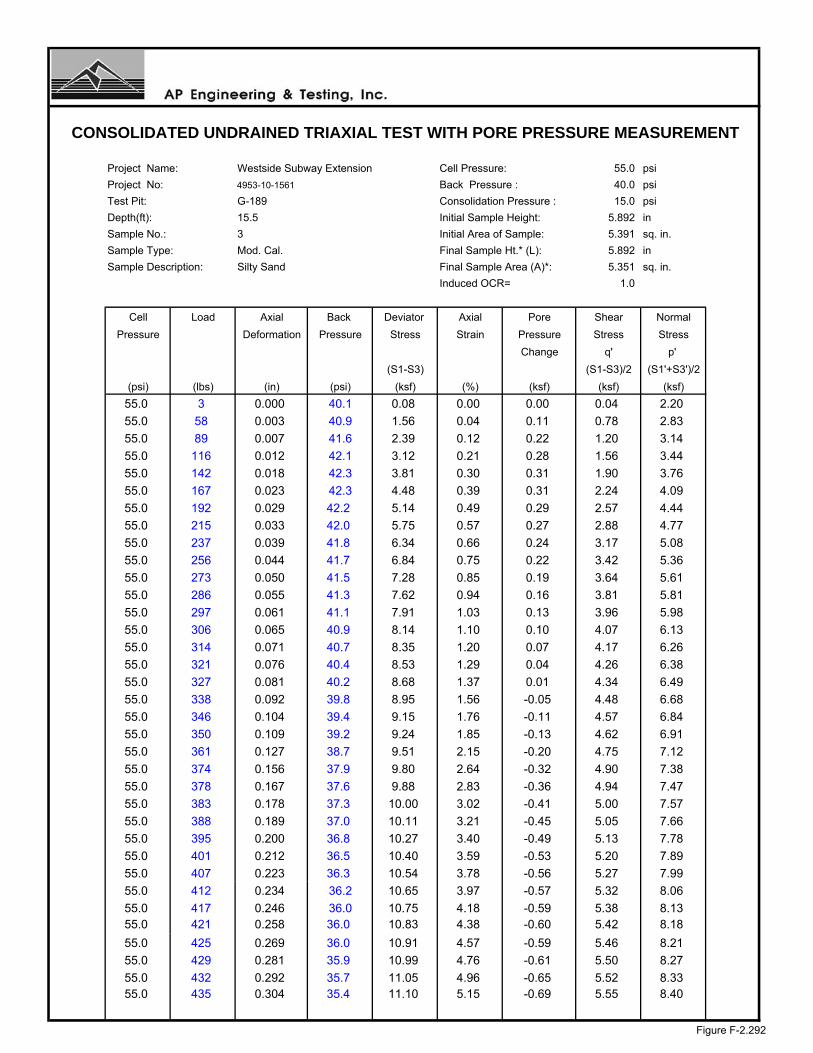
Project Name: Westside Subway Extension Cell Pressure: 55.0 psi
Project No: 4953-10-1561 Back Pressure : 40.0 psi
Test Pit: G-189 Consolidation Pressure : 15.0 psi
Depth(ft): 15.5 Initial Sample Height: 5.892 in
Sample No.: 3 Initial Area of Sample: 5.391 sq. in.
Sample Type: Mod. Cal. Final Sample Ht.* (L): 5.892 in
Sample Description: Silty Sand Final Sample Area (A)*: 5.351 sq. in.
Induced OCR= 1.0
Cell Load Axial Back Deviator Axial Pore Shear Normal
Pressure Deformation Pressure Stress Strain Pressure Stress Stress
Change q' p'
(S1-S3) (S1-S3)/2 (S1'+S3')/2
(psi) (lbs) (in) (psi) (ksf) (%) (ksf) (ksf) (ksf)
55.0 3 0.000 40.1 0.08 0.00 0.00 0.04 2.20
55.0 58 0.003 40.9 1.56 0.04 0.11 0.78 2.83
55.0 89 0.007 41.6 2.39 0.12 0.22 1.20 3.14
55.0 116 0.012 42.1 3.12 0.21 0.28 1.56 3.44
55.0 142 0.018 42.3 3.81 0.30 0.31 1.90 3.76
55.0 167 0.023 42.3 4.48 0.39 0.31 2.24 4.09
55.0 192 0.029 42.2 5.14 0.49 0.29 2.57 4.44
55.0 215 0.033 42.0 5.75 0.57 0.27 2.88 4.77
55.0 237 0.039 41.8 6.34 0.66 0.24 3.17 5.08
55.0 256 0.044 41.7 6.84 0.75 0.22 3.42 5.36
55.0 273 0.050 41.5 7.28 0.85 0.19 3.64 5.61
55.0 286 0.055 41.3 7.62 0.94 0.16 3.81 5.81
55.0 297 0.061 41.1 7.91 1.03 0.13 3.96 5.98
55.0 306 0.065 40.9 8.14 1.10 0.10 4.07 6.13
55.0 314 0.071 40.7 8.35 1.20 0.07 4.17 6.26
55.0 321 0.076 40.4 8.53 1.29 0.04 4.26 6.38
55.0 327 0.081 40.2 8.68 1.37 0.01 4.34 6.49
55.0 338 0.092 39.8 8.95 1.56 -0.05 4.48 6.68
55.0 346 0.104 39.4 9.15 1.76 -0.11 4.57 6.84
55.0 350 0.109 39.2 9.24 1.85 -0.13 4.62 6.91
55.0 361 0.127 38.7 9.51 2.15 -0.20 4.75 7.12
55.0 374 0.156 37.9 9.80 2.64 -0.32 4.90 7.38
55.0 378 0.167 37.6 9.88 2.83 -0.36 4.94 7.47
55.0 383 0.178 37.3 10.00 3.02 -0.41 5.00 7.57
55.0 388 0.189 37.0 10.11 3.21 -0.45 5.05 7.66
55.0 395 0.200 36.8 10.27 3.40 -0.49 5.13 7.78
55.0 401 0.212 36.5 10.40 3.59 -0.53 5.20 7.89
55.0 407 0.223 36.3 10.54 3.78 -0.56 5.27 7.99
55.0 412 0.234 36.2 10.65 3.97 -0.57 5.32 8.06
55.0 417 0.246 36.0 10.75 4.18 -0.59 5.38 8.1355.0 421 0.258 36.0 10.83 4.38 -0.60 5.42 8.18
55.0 425 0.269 36.0 10.91 4.57 -0.59 5.46 8.21
55.0 429 0.281 35.9 10.99 4.76 -0.61 5.50 8.27
55.0 432 0.292 35.7 11.05 4.96 -0.65 5.52 8.3355.0 435 0.304 35.4 11.10 5.15 -0.69 5.55 8.40
CONSOLIDATED UNDRAINED TRIAXIAL TEST WITH PORE PRESSURE MEASUREMENT
Figure F-2.292

Project Name: Westside Subway Extension Cell Pressure: 65.0 psi
Project No: 4953-10-1561 Back Pressure : 40.0 psi
Test Pit: G-189 Consolidation Pressure : 25.0 psi
Depth(ft): 15.5 Initial Sample Height: 5.892 in
Sample No.: 3 Initial Area of Sample: 5.391 sq. in.
Sample Type: Mod. Cal. Final Sample Ht.* (L): 5.892 in
Sample Description: Silty Sand Final Sample Area (A)*: 5.365 sq. in.
Induced OCR= 1.0
Cell Load Axial Back Deviator Axial Pore Shear Normal
Pressure Deformation Pressure Stress Strain Pressure Stress Stress
Change q' p'
(S1-S3) (S1-S3)/2 (S1'+S3')/2
(psi) (lbs) (in) (psi) (ksf) (%) (ksf) (ksf) (ksf)
65.0 0 0.000 40.0 0.00 0.00 0.00 0.00 3.60
65.0 109 0.006 41.7 2.92 0.10 0.24 1.46 4.82
65.0 164 0.012 42.6 4.39 0.20 0.38 2.20 5.42
65.0 213 0.018 43.1 5.70 0.31 0.44 2.85 6.01
65.0 261 0.024 43.1 6.98 0.41 0.45 3.49 6.64
65.0 304 0.030 43.0 8.12 0.51 0.44 4.06 7.22
65.0 352 0.036 42.8 9.39 0.61 0.40 4.69 7.89
65.0 395 0.042 42.5 10.53 0.71 0.36 5.26 8.50
65.0 428 0.048 42.2 11.39 0.81 0.32 5.70 8.98
65.0 452 0.054 41.9 12.02 0.92 0.27 6.01 9.34
65.0 472 0.060 41.6 12.54 1.02 0.23 6.27 9.64
65.0 521 0.090 40.5 13.77 1.53 0.07 6.88 10.42
65.0 531 0.100 40.2 14.01 1.70 0.02 7.00 10.58
65.0 549 0.131 39.3 14.41 2.22 -0.10 7.20 10.90
65.0 568 0.177 38.3 14.79 3.01 -0.25 7.39 11.24
65.0 583 0.222 37.4 15.06 3.76 -0.37 7.53 11.50
65.0 600 0.269 36.7 15.37 4.56 -0.48 7.68 11.76
65.0 612 0.314 36.0 15.55 5.34 -0.58 7.77 11.95
65.0 627 0.361 35.4 15.80 6.12 -0.66 7.90 12.16
65.0 640 0.408 34.9 15.99 6.92 -0.74 7.99 12.33
65.0 651 0.453 34.4 16.13 7.68 -0.81 8.06 12.48
65.0 666 0.499 33.9 16.36 8.48 -0.87 8.18 12.65
65.0 677 0.548 33.5 16.48 9.30 -0.93 8.24 12.77
65.0 687 0.593 33.1 16.58 10.06 -0.99 8.29 12.88
65.0 703 0.640 32.8 16.82 10.87 -1.04 8.41 13.05
65.0 714 0.688 32.3 16.93 11.67 -1.11 8.46 13.17
65.0 725 0.733 32.0 17.04 12.45 -1.16 8.52 13.27
65.0 737 0.781 31.7 17.16 13.25 -1.20 8.58 13.38
65.0 747 0.827 31.3 17.23 14.04 -1.25 8.62 13.47
65.0 758 0.873 31.0 17.33 14.82 -1.29 8.66 13.5665.0 771 0.919 30.7 17.46 15.60 -1.33 8.73 13.67
65.0 780 0.966 30.5 17.50 16.39 -1.37 8.75 13.73
65.0 797 1.011 30.2 17.72 17.16 -1.41 8.86 13.87
65.0 821 1.103 29.7 17.91 18.72 -1.48 8.95 14.03
65.0 861 1.240 29.0 18.25 21.04 -1.58 9.12 14.31
CONSOLIDATED UNDRAINED TRIAXIAL TEST WITH PORE PRESSURE MEASUREMENT
Figure F-2.293

LEGEND: CONFINING PRESSURES= ○ 5 psi □ 15 psi ∆ 25 psi
Project Name: Westside Subway Extension Sample Type: Mod. Cal.
Project No.: 4953-10-1561 Sample Description: Silty Sand
Test Pit: G-189 Avg. Dry Unit Weight (pcf): 120.7
Sample No.: 3 Avg. Initial Moisture Content (%): 7.1
Depth (ft): 15.5 Confining Pressure: 5.0, 15.0, 25.0 psi
CU TRIAXIAL MULTI-STAGE TEST WITH PORE PRESSURE MEASUREMENTASTM D 4767
0
5
10
15
20
0 5 10 15 20 25 30 35 40
NORMAL STRESS, P' (ksf)
SH
EA
R S
TR
ES
S, q
' (ks
f)
0.0
2.0
4.0
6.0
8.0
10.0
12.0
14.0
16.0
18.0
20.0
0.0 5.0 10.0 15.0 20.0
AXIAL STRAIN (Percent)
DE
VIA
TO
R S
TR
ES
S (
ksf)
-4.0
-3.0
-2.0
-1.0
0.0
1.0
2.0
3.0
4.0
0.0 5.0 10.0 15.0 20.0
AXIAL STRAIN (Percent)C
HA
NG
E I
N P
OR
E W
AT
ER
PR
ES
SU
RE
(ks
f)
Figure F-2.294

LEGEND: CONFINING PRESSURES= ○ 5 psi □ 15 psi ∆ 25 psi
Project Name: Westside Subway Extension Sample Type: Mod. Cal.Project No.: 4953-10-1561 Sample Description: Silty SandTest Pit: G-189 Avg. Dry Unit Weight (pcf): 120.7Sample No.: 3 Avg. Initial Moisture Content (%): 7.1Depth (ft): 15.5 Confining Pressure: 5.0, 15.0, 25.0 psi
CU TRIAXIAL MULTI-STAGE TEST WITH PORE PRESSURE MEASUREMENTASTM D 4767
0
5
10
15
0 5 10 15 20 25 30
NORMAL STRESS (ksf)
SH
EA
R S
TR
ES
S (
ksf)
φ=38.5°
φ'= 39°
0
5
10
15
20
0 5 10 15 20 25 30 35 40 p' (ksf)
q' (
ksf)
C= 0.90 ksfC'= 0.30 ksf
Failure Criteria: 5% Axial Strain
Figure F-2.295

Test Pit: G-189 Sample Type: Mod. Cal.Sample No.: 3 Soil Description: Silty SandDepth (feet): 15.5 Eff. Confining Pressure (psi): 15.0
Project Name: Westside Subway ExtensionProject No.: 4953-10-1561Date: 08/09/11
4.2000
120240480
35.9722
8153060
0.250.512
2.3000
Time (minutes) Volume Change (cc)0.00002.3000
00.1
SQRT Time (minutes) Volume Change (cc)0.0000 0.0000
2.82843.87305.4772
0.31620.50000.70711.00001.4142
3.1000
4.0000
3.60003.70003.80003.9000
7.7460
2.00003.6000
TIME RATE CONSOLIDATION CURVE
3.80003.90004.0000
4.00004.1000
4
ASTM D 2435
4.00004.00004.1000
10.954515.491921.9089
1294 4.2000
4.0000
3.40003.50003.6000
3.7000
3.10003.40003.50003.6000
0.00
1.00
2.00
3.00
4.00
5.00
0.1 1 10 100 1000 10000
Time (minutes)
Vol
ume
Cha
nge
(cc)
0.00
1.00
2.00
3.00
4.00
5.00
0.0 10.0 20.0 30.0 40.0
Square root Time (minutes)
Vol
ume
Cha
nge
(cc)
Figure F-2.296

Test Procedure: ASTM D 4767
Project Name: Westside Subway Extension Tested by: ST Date: 08-10-11
Project No.: 4953-10-1561 Input Data by: KM Date: 08-17-11
Test Pit: G-189 Reviewed by: AP Date: 08-17-11
Sample No.: 11 Sample Description: Sandy Silt
Depth(ft): 55.5
Sample Type: Mod. Cal. Confining Pressure = 20.0 psi
Diameter (in) 2.625 2.625 2.625 Avg. = 2.625
Height (in) 5.714 5.714 5.714 Avg. = 5.714
BEFORE CONSOLIDATION AFTER CONSOLIDATION
Area (in²) 5.412 5.345
Moisture Content (%) 26.96 23.04
Wet Weight (gms) 70.56 1132.62
Dry Weight (gms) 66.34 948.08
Container Weight (gms) 50.69 147.22
Density and Saturation
Wet Weight (gms) 1009.39
Container Weight (gms) 0.00
Wet Density (pcf) 124.3
Dry Density (pcf) 97.9
Initial Void Ratio 0.720
% Saturation 101.1
Assumed Specific Gravity = 2.70
Back Pressure Saturation
B Value (%) = 96 Change in Ht. of the Specimen (in)= 0
Consolidation
Cell Pressure (psi) = 50.0 Initial Burette Ht.(cm)= 88.7
Back Pressure(psi) = 30.0 Final Burette Ht.(cm)= 75.4
Eff. Consol. Stress (psi) = 20.0 Final Height (in)= 5.633
Induced OCR = 1.0 Initial Volume (cu.in)= 30.924
Change in Ht. of Specimen (in) = 0.0806 Final Volume (cu.in) = 30.112
Shear At Failure
Rate of Deformation (in/min)= 0.008 Deviator Stress (ksf) = 5.32
Time to 50% primary Consolidation (min) = 3 Eff. Minor Principal stress (ksf) = 1.34
Failure Mode: Bulging Failure Eff. Major Principal stress (ksf) = 6.66
Axial Strain (%) = 5.23
CONSOLIDATED UNDRAINED TRIAXIAL TEST WITH PORE PRESSURE MEASUREMENT
Figure F-2.297

Test Procedure: ASTM D 4767
Project Name: Westside Subway Extension Tested by: ST Date: 08-10-11
Project No.: 4953-10-1561 Input Data by: KM Date: 08-17-11
Test Pit: G-189 Reviewed by: AP Date: 08-17-11
Sample No.: 11 Sample Description: Sandy Silt
Depth(ft): 55.5
Sample Type: Mod. Cal. Confining Pressure = 35.0 psi
Diameter (in) 2.625 2.625 2.625 Avg. = 2.625
Height (in) 5.714 5.714 5.714 Avg. = 5.714
BEFORE CONSOLIDATION AFTER CONSOLIDATION
Area (in²) 5.412 5.301
Moisture Content (%) 26.96 23.04
Wet Weight (gms) 70.56 1132.62
Dry Weight (gms) 66.34 948.08
Container Weight (gms) 50.69 147.22
Density and Saturation
Wet Weight (gms) 1009.39
Container Weight (gms) 0.00
Wet Density (pcf) 124.3
Dry Density (pcf) 97.9
Initial Void Ratio 0.720
% Saturation 101.1
Assumed Specific Gravity = 2.70
Back Pressure Saturation
B Value (%) = 96 Change in Ht. of the Specimen (in)= 0
Consolidation
Cell Pressure (psi) = 65.0 Initial Burette Ht.(cm)= 76.1
Back Pressure(psi) = 30.0 Final Burette Ht.(cm)= 65.7
Eff. Consol. Stress (psi) = 35.0 Final Height (in)= 5.714
Induced OCR= 1.0 Initial Volume (cu.in)= 30.924
Change in Ht. of Specimen (in) = 0.0000 Final Volume (cu.in) = 30.289
Shear At Failure
Rate of Deformation (in/min)= 0.008 Deviator Stress (ksf) = 9.74
Time to 50% primary Consolidation = 3 Eff. Minor Principal stress (ksf) = 3.25
Failure Mode: Bulging Failure Eff. Major Principal stress (ksf) = 12.98
Axial Strain (%) = 5.20
CONSOLIDATED UNDRAINED TRIAXIAL TEST WITH PORE PRESSURE MEASUREMENT
Figure F-2.298

Test Procedure: ASTM D 4767
Project Name: Westside Subway Extension Tested by: ST Date: 08-10-11
Project No.: Input Data by: KM Date: 08-17-11
Test Pit: G-189 Reviewed by: AP Date: 08-17-11
Sample No.: 11 Sample Description: Sandy Silt
Depth(ft): 55.5
Sample Type: Mod. Cal. Confining Pressure = 50.0 psi
Diameter (in) 2.625 2.625 2.625 Avg. = 2.625
Height (in) 5.714 5.714 5.714 Avg. = 5.714
BEFORE CONSOLIDATION AFTER CONSOLIDATION
Area (in²) 5.412 5.331
Moisture Content (%) 26.96 23.04
Wet Weight (gms) 70.56 1132.62
Dry Weight (gms) 66.34 948.08
Container Weight (gms) 50.69 147.22
Density and Saturation
Wet Weight (gms) 1009.39
Container Weight (gms) 0.00
Wet Density (pcf) 124.3
Dry Density (pcf) 97.9
Initial Void Ratio 0.720
% Saturation 101.1
Assumed Specific Gravity = 2.70
Back Pressure Saturation
B Value (%) = 96 Change in Ht. of the Specimen (in)= 0
Consolidation
Cell Pressure (psi) = 80.0 Initial Burette Ht.(cm)= 65.7
Back Pressure(psi) = 30.0 Final Burette Ht.(cm)= 58.0
Eff. Consol. Stress (psi) = 50.0 Final Height (in)= 5.712
Induced OCR = 1.0 Initial Volume (cu.in)= 30.924
Change in Ht. of Specimen (in) = 0.0017 Final Volume (cu.in) = 30.454
Shear At Failure
Rate of Deformation (in/min)= 0.008 Deviator Stress (ksf) = 13.72
Time to 50% primary Consolidation = 3 Eff. Minor Principal stress (ksf) = 5.30
Failure Mode: Bulging Failure Eff. Major Principal stress (ksf) = 19.02
Axial Strain (%) = 4.64
CONSOLIDATED UNDRAINED TRIAXIAL TEST WITH PORE PRESSURE MEASUREMENT
4953-10-1561
Figure F-2.299
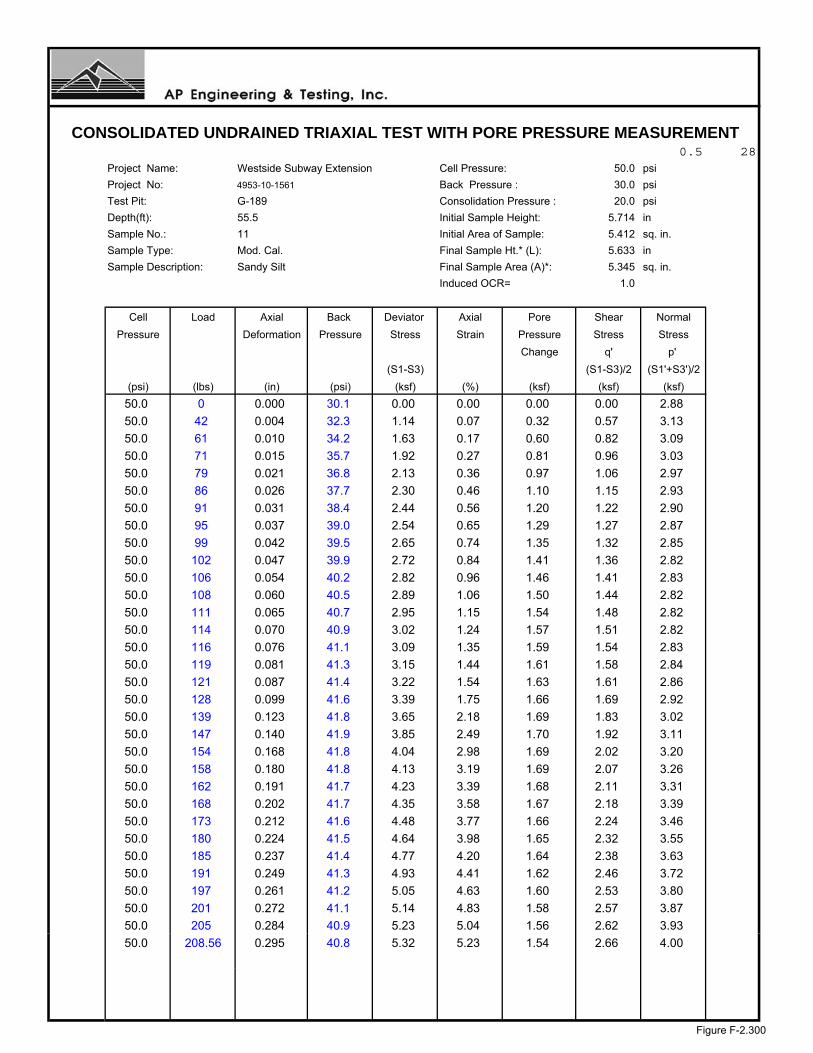
0.5 28Project Name: Westside Subway Extension Cell Pressure: 50.0 psi
Project No: 4953-10-1561 Back Pressure : 30.0 psi
Test Pit: G-189 Consolidation Pressure : 20.0 psi
Depth(ft): 55.5 Initial Sample Height: 5.714 in
Sample No.: 11 Initial Area of Sample: 5.412 sq. in.
Sample Type: Mod. Cal. Final Sample Ht.* (L): 5.633 in
Sample Description: Sandy Silt Final Sample Area (A)*: 5.345 sq. in.
Induced OCR= 1.0
Cell Load Axial Back Deviator Axial Pore Shear Normal
Pressure Deformation Pressure Stress Strain Pressure Stress Stress
Change q' p'
(S1-S3) (S1-S3)/2 (S1'+S3')/2
(psi) (lbs) (in) (psi) (ksf) (%) (ksf) (ksf) (ksf)
50.0 0 0.000 30.1 0.00 0.00 0.00 0.00 2.88
50.0 42 0.004 32.3 1.14 0.07 0.32 0.57 3.13
50.0 61 0.010 34.2 1.63 0.17 0.60 0.82 3.09
50.0 71 0.015 35.7 1.92 0.27 0.81 0.96 3.03
50.0 79 0.021 36.8 2.13 0.36 0.97 1.06 2.97
50.0 86 0.026 37.7 2.30 0.46 1.10 1.15 2.93
50.0 91 0.031 38.4 2.44 0.56 1.20 1.22 2.90
50.0 95 0.037 39.0 2.54 0.65 1.29 1.27 2.87
50.0 99 0.042 39.5 2.65 0.74 1.35 1.32 2.85
50.0 102 0.047 39.9 2.72 0.84 1.41 1.36 2.82
50.0 106 0.054 40.2 2.82 0.96 1.46 1.41 2.83
50.0 108 0.060 40.5 2.89 1.06 1.50 1.44 2.82
50.0 111 0.065 40.7 2.95 1.15 1.54 1.48 2.82
50.0 114 0.070 40.9 3.02 1.24 1.57 1.51 2.82
50.0 116 0.076 41.1 3.09 1.35 1.59 1.54 2.83
50.0 119 0.081 41.3 3.15 1.44 1.61 1.58 2.84
50.0 121 0.087 41.4 3.22 1.54 1.63 1.61 2.86
50.0 128 0.099 41.6 3.39 1.75 1.66 1.69 2.92
50.0 139 0.123 41.8 3.65 2.18 1.69 1.83 3.02
50.0 147 0.140 41.9 3.85 2.49 1.70 1.92 3.11
50.0 154 0.168 41.8 4.04 2.98 1.69 2.02 3.20
50.0 158 0.180 41.8 4.13 3.19 1.69 2.07 3.26
50.0 162 0.191 41.7 4.23 3.39 1.68 2.11 3.31
50.0 168 0.202 41.7 4.35 3.58 1.67 2.18 3.39
50.0 173 0.212 41.6 4.48 3.77 1.66 2.24 3.46
50.0 180 0.224 41.5 4.64 3.98 1.65 2.32 3.55
50.0 185 0.237 41.4 4.77 4.20 1.64 2.38 3.63
50.0 191 0.249 41.3 4.93 4.41 1.62 2.46 3.72
50.0 197 0.261 41.2 5.05 4.63 1.60 2.53 3.80
50.0 201 0.272 41.1 5.14 4.83 1.58 2.57 3.87
50.0 205 0.284 40.9 5.23 5.04 1.56 2.62 3.93
50.0 208.56 0.295 40.8 5.32 5.23 1.54 2.66 4.00
CONSOLIDATED UNDRAINED TRIAXIAL TEST WITH PORE PRESSURE MEASUREMENT
Figure F-2.300

0.5 28Project Name: Westside Subway Extension Cell Pressure: 65.0 psi
Project No: 4953-10-1561 Back Pressure : 30.0 psi
Test Pit: G-189 Consolidation Pressure : 35.0 psi
Depth(ft): 55.5 Initial Sample Height: 5.714 in
Sample No.: 11 Initial Area of Sample: 5.412 sq. in.
Sample Type: Mod. Cal. Final Sample Ht.* (L): 5.714 in
Sample Description: Sandy Silt Final Sample Area (A)*: 5.301 sq. in.
Induced OCR= 1.0
Cell Load Axial Back Deviator Axial Pore Shear Normal
Pressure Deformation Pressure Stress Strain Pressure Stress Stress
Change q' p'
(S1-S3) (S1-S3)/2 (S1'+S3')/2
(psi) (lbs) (in) (psi) (ksf) (%) (ksf) (ksf) (ksf)
65.0 0 0.000 30.0 0.00 0.00 0.00 0.00 5.04
65.0 27 0.000 32.1 0.73 0.01 0.30 0.37 5.11
65.0 85 0.005 36.3 2.31 0.09 0.90 1.15 5.29
65.0 121 0.012 39.0 3.28 0.21 1.29 1.64 5.39
65.0 147 0.019 40.9 3.98 0.33 1.57 1.99 5.46
65.0 167 0.026 42.2 4.52 0.45 1.76 2.26 5.54
65.0 185 0.033 43.2 5.00 0.58 1.90 2.50 5.64
65.0 200 0.040 43.9 5.39 0.70 2.00 2.70 5.73
65.0 213 0.047 44.5 5.74 0.82 2.08 2.87 5.83
65.0 224 0.054 44.9 6.03 0.95 2.15 3.01 5.91
65.0 233 0.061 45.2 6.26 1.06 2.19 3.13 5.98
65.0 241 0.068 45.5 6.47 1.19 2.22 3.23 6.05
65.0 249 0.074 45.6 6.68 1.30 2.25 3.34 6.13
65.0 255 0.080 45.7 6.83 1.40 2.27 3.42 6.19
65.0 261 0.087 45.8 6.98 1.52 2.28 3.49 6.25
65.0 277 0.108 45.9 7.38 1.89 2.28 3.69 6.45
65.0 286 0.122 45.8 7.60 2.14 2.27 3.80 6.57
65.0 294 0.138 45.6 7.79 2.41 2.25 3.90 6.69
65.0 303 0.152 45.4 8.01 2.67 2.22 4.01 6.82
65.0 311 0.167 45.2 8.20 2.92 2.19 4.10 6.95
65.0 319 0.181 44.9 8.39 3.17 2.15 4.20 7.08
65.0 327 0.195 44.7 8.58 3.42 2.11 4.29 7.22
65.0 334 0.209 44.4 8.74 3.65 2.07 4.37 7.34
65.0 342 0.223 44.1 8.93 3.90 2.03 4.46 7.47
65.0 349 0.237 43.8 9.09 4.14 1.99 4.54 7.60
65.0 357 0.253 43.5 9.27 4.42 1.94 4.63 7.73
65.0 364 0.268 43.1 9.42 4.68 1.89 4.71 7.86
65.0 371 0.282 42.8 9.58 4.93 1.84 4.79 7.99
65.0 378 0.297 42.4 9.74 5.20 1.79 4.87 8.12
CONSOLIDATED UNDRAINED TRIAXIAL TEST WITH PORE PRESSURE MEASUREMENT
Figure F-2.301

0.5 28Project Name: Westside Subway Extension Cell Pressure: 80.0 psi
Project No: 4953-10-1561 Back Pressure : 30.0 psi
Test Pit: G-189 Consolidation Pressure : 50.0 psi
Depth(ft): 55.5 Initial Sample Height: 5.714 in
Sample No.: 11 Initial Area of Sample: 5.412 sq. in.
Sample Type: Mod. Cal. Final Sample Ht.* (L): 5.712 in
Sample Description: Sandy Silt Final Sample Area (A)*: 5.331 sq. in.
Induced OCR= 1.0
Cell Load Axial Back Deviator Axial Pore Shear Normal
Pressure Deformation Pressure Stress Strain Pressure Stress Stress
Change q' p'
(S1-S3) (S1-S3)/2 (S1'+S3')/2
(psi) (lbs) (in) (psi) (ksf) (%) (ksf) (ksf) (ksf)
80.0 0 0.000 30.0 0.00 0.00 0.00 0.00 7.20
80.0 119 0.006 38.3 3.21 0.11 1.19 1.60 7.61
80.0 175 0.012 42.0 4.71 0.21 1.73 2.35 7.83
80.0 210 0.018 44.0 5.65 0.32 2.01 2.82 8.01
80.0 240 0.024 45.3 6.46 0.42 2.20 3.23 8.24
80.0 268 0.030 46.2 7.21 0.53 2.33 3.60 8.47
80.0 292 0.036 46.7 7.83 0.63 2.41 3.91 8.70
80.0 314 0.042 47.2 8.42 0.74 2.47 4.21 8.94
80.0 338 0.048 47.5 9.06 0.84 2.52 4.53 9.21
80.0 362 0.054 47.7 9.68 0.95 2.55 4.84 9.49
80.0 379 0.060 47.9 10.13 1.05 2.57 5.06 9.69
80.0 440 0.090 47.8 11.70 1.58 2.56 5.85 10.49
80.0 452 0.100 47.6 11.99 1.75 2.54 5.99 10.66
80.0 498 0.173 45.7 13.04 3.03 2.26 6.52 11.46
80.0 518 0.218 44.4 13.45 3.81 2.08 6.72 11.85
80.0 533 0.265 43.2 13.72 4.64 1.90 6.86 12.16
80.0 545 0.311 42.1 13.93 5.44 1.74 6.97 12.42
80.0 558 0.356 41.0 14.13 6.23 1.58 7.07 12.69
80.0 566 0.403 39.9 14.21 7.06 1.43 7.11 12.87
80.0 573 0.449 39.0 14.27 7.85 1.30 7.13 13.04
80.0 581 0.495 38.1 14.34 8.67 1.17 7.17 13.20
80.0 588 0.542 37.3 14.37 9.49 1.06 7.18 13.33
80.0 596 0.587 36.7 14.44 10.28 0.96 7.22 13.46
80.0 605 0.635 36.1 14.52 11.11 0.87 7.26 13.59
80.0 611 0.680 35.5 14.54 11.91 0.79 7.27 13.68
80.0 620 0.726 34.9 14.62 12.71 0.70 7.31 13.81
80.0 626 0.773 34.3 14.63 13.53 0.62 7.31 13.89
80.0 633 0.819 33.9 14.64 14.33 0.56 7.32 13.96
80.0 642 0.865 33.4 14.71 15.14 0.49 7.35 14.07
80.0 648 0.911 32.9 14.71 15.96 0.42 7.36 14.1380.0 655 0.957 32.5 14.73 16.75 0.37 7.37 14.20
80.0 663 1.003 32.1 14.77 17.56 0.31 7.39 14.28
80.0 669 1.049 31.7 14.74 18.37 0.25 7.37 14.33
80.0 680 1.141 31.0 14.71 19.98 0.14 7.35 14.41
80.0 680 1.233 30.5 14.41 21.58 0.07 7.21 14.34
CONSOLIDATED UNDRAINED TRIAXIAL TEST WITH PORE PRESSURE MEASUREMENT
Figure F-2.302

LEGEND: CONFINING PRESSURES= ○ 20 psi □ 35 psi ∆ 50 psi
Project Name: Westside Subway Extension Sample Type: Mod. Cal.
Project No.: 4953-10-1561 Sample Description: Sandy Silt
Test Pit: G-189 Avg. Dry Unit Weight (pcf): 97.9
Sample No.: 11 Avg. Initial Moisture Content (%): 27.0
Depth (ft): 55.5 Confining Pressure: 20.0, 35.0, 50.0 psi
CU TRIAXIAL MULTI-STAGE TEST WITH PORE PRESSURE MEASUREMENTASTM D 4767
0
5
10
15
20
0 5 10 15 20 25 30 35 40
NORMAL STRESS, P' (ksf)
SH
EA
R S
TR
ES
S, q
' (ks
f)
0.0
2.0
4.0
6.0
8.0
10.0
12.0
14.0
16.0
18.0
20.0
0.0 5.0 10.0 15.0 20.0
AXIAL STRAIN (Percent)
DE
VIA
TO
R S
TR
ES
S (
ksf)
-4.0
-3.0
-2.0
-1.0
0.0
1.0
2.0
3.0
4.0
0.0 5.0 10.0 15.0 20.0
AXIAL STRAIN (Percent)C
HA
NG
E I
N P
OR
E W
AT
ER
PR
ES
SU
RE
(ks
f)
Figure F-2.303
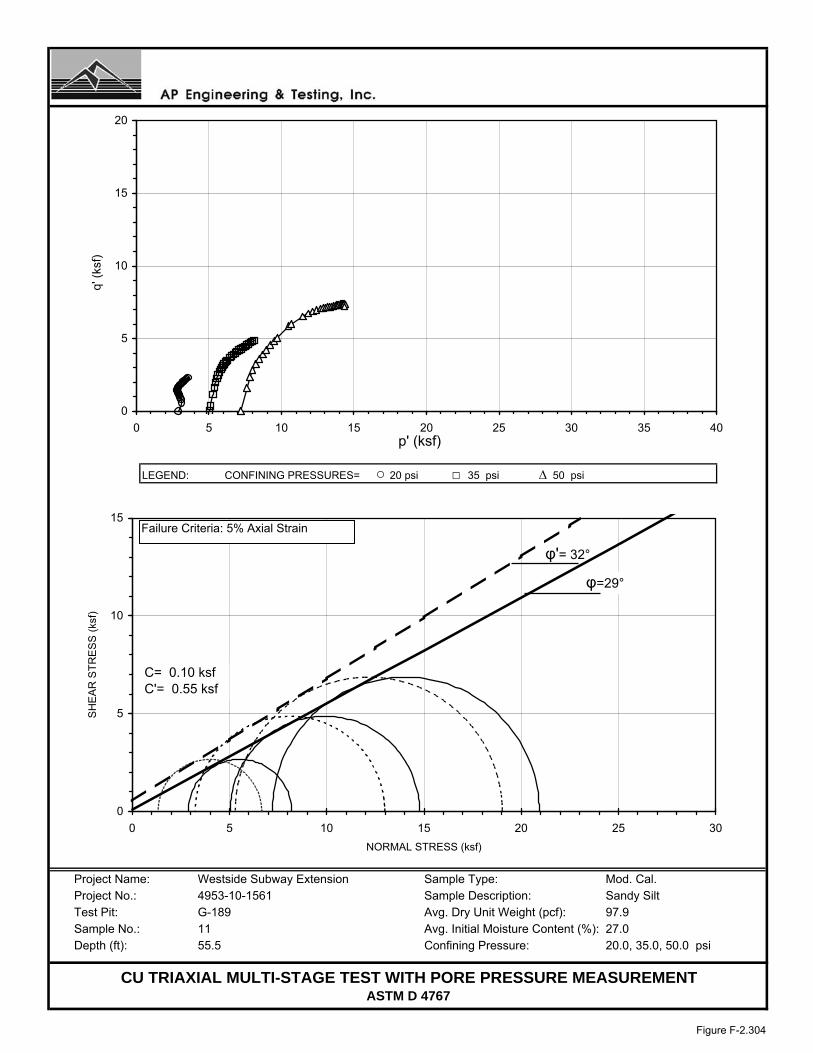
LEGEND: CONFINING PRESSURES= ○ 20 psi □ 35 psi ∆ 50 psi
Project Name: Westside Subway Extension Sample Type: Mod. Cal.Project No.: 4953-10-1561 Sample Description: Sandy SiltTest Pit: G-189 Avg. Dry Unit Weight (pcf): 97.9Sample No.: 11 Avg. Initial Moisture Content (%): 27.0Depth (ft): 55.5 Confining Pressure: 20.0, 35.0, 50.0 psi
CU TRIAXIAL MULTI-STAGE TEST WITH PORE PRESSURE MEASUREMENTASTM D 4767
0
5
10
15
0 5 10 15 20 25 30
NORMAL STRESS (ksf)
SH
EA
R S
TR
ES
S (
ksf)
φ=29°
φ'= 32°
0
5
10
15
20
0 5 10 15 20 25 30 35 40 p' (ksf)
q' (
ksf)
C= 0.10 ksfC'= 0.55 ksf
Failure Criteria: 5% Axial Strain
Figure F-2.304

Test Pit: G-189 Sample Type: Mod. Cal.Sample No.: 11 Soil Description: Sandy SiltDepth (feet): 55.5 Eff. Confining Pressure (psi): 35.0
Project Name: Westside Subway ExtensionProject No.: 4953-10-1561Date: 08/10/11
10.300038.6911 10.4000
120240480
30.6105
9163160
1.1000
Time (minutes) Volume Change (cc)0.00001.1000
00.1
SQRT Time (minutes) Volume Change (cc)0.0000 0.0000
3.00004.00005.5678
0.31620.50000.70711.00001.4142
1.6000
9.6000
6.20008.00008.80009.3000
7.7460
2.00006.2000
TIME RATE CONSOLIDATION CURVE
8.80009.30009.6000
9.900010.0000
4
ASTM D 2435
9.80009.900010.0000
10.954515.491921.9089
937 10.3000
9.8000
2.20003.10004.4000
8.0000
10.40001497
1.60002.20003.10004.4000
0.250.512
0.00
2.00
4.00
6.00
8.00
10.00
12.00
0.1 1 10 100 1000 10000
Time (minutes)
Vol
ume
Cha
nge
(cc)
0.00
2.00
4.00
6.00
8.00
10.00
12.00
0.0 10.0 20.0 30.0 40.0 50.0
Square root Time (minutes)
Vol
ume
Cha
nge
(cc)
Figure F-2.305

Test Procedure: ASTM D 4767
Project Name: Westside Subway Extension Tested by: ST Date: 08-13-11
Project No.: 4953-10-1561 Input Data by: KM Date: 08-17-11
Test Pit: G-190 Reviewed by: AP Date: 08-17-11
Sample No.: 8 Sample Description: Clayey Sand
Depth(ft): 35.5
Sample Type: Mod. Cal. Confining Pressure = 15.0 psi
Diameter (in) 2.604 2.604 2.604 Avg. = 2.604
Height (in) 5.890 5.890 5.890 Avg. = 5.890
BEFORE CONSOLIDATION AFTER CONSOLIDATION
Area (in²) 5.326 5.255
Moisture Content (%) 14.73 16.46
Wet Weight (gms) 11.04 1260.90
Dry Weight (gms) 9.95 1103.92
Container Weight (gms) 2.55 150.02
Density and Saturation
Wet Weight (gms) 1106.27
Container Weight (gms) 0.00
Wet Density (pcf) 134.4
Dry Density (pcf) 117.1
Initial Void Ratio 0.439
% Saturation 90.6
Assumed Specific Gravity = 2.70
Back Pressure Saturation
B Value (%) = 94 Change in Ht. of the Specimen (in)= 0
Consolidation
Cell Pressure (psi) = 45.0 Initial Burette Ht.(cm)= 78.9
Back Pressure(psi) = 30.0 Final Burette Ht.(cm)= 71.9
Eff. Consol. Stress (psi) = 15.0 Final Height (in)= 5.888
Induced OCR = 1.0 Initial Volume (cu.in)= 31.368
Change in Ht. of Specimen (in) = 0.0020 Final Volume (cu.in) = 30.941
Shear At Failure
Rate of Deformation (in/min)= 0.005 Deviator Stress (ksf) = 6.68
Time to 50% primary Consolidation (min) = 5 Eff. Minor Principal stress (ksf) = 1.67
Failure Mode: Bulging Failure Eff. Major Principal stress (ksf) = 8.35
Axial Strain (%) = 5.10
CONSOLIDATED UNDRAINED TRIAXIAL TEST WITH PORE PRESSURE MEASUREMENT
Figure F-2.306

Test Procedure: ASTM D 4767
Project Name: Westside Subway Extension Tested by: ST Date: 08-13-11
Project No.: 4953-10-1561 Input Data by: KM Date: 08-17-11
Test Pit: G-190 Reviewed by: AP Date: 08-17-11
Sample No.: 8 Sample Description: Clayey Sand
Depth(ft): 35.5
Sample Type: Mod. Cal. Confining Pressure = 30.0 psi
Diameter (in) 2.604 2.604 2.604 Avg. = 2.604
Height (in) 5.890 5.890 5.890 Avg. = 5.890
BEFORE CONSOLIDATION AFTER CONSOLIDATION
Area (in²) 5.326 5.260
Moisture Content (%) 14.73 16.46
Wet Weight (gms) 11.04 1260.90
Dry Weight (gms) 9.95 1103.92
Container Weight (gms) 2.55 150.02
Density and Saturation
Wet Weight (gms) 1106.27
Container Weight (gms) 0.00
Wet Density (pcf) 134.4
Dry Density (pcf) 117.1
Initial Void Ratio 0.439
% Saturation 90.6
Assumed Specific Gravity = 2.70
Back Pressure Saturation
B Value (%) = 94 Change in Ht. of the Specimen (in)= 0
Consolidation
Cell Pressure (psi) = 60.0 Initial Burette Ht.(cm)= 71.9
Back Pressure(psi) = 30.0 Final Burette Ht.(cm)= 65.6
Eff. Consol. Stress (psi) = 30.0 Final Height (in)= 5.890
Induced OCR= 1.0 Initial Volume (cu.in)= 31.368
Change in Ht. of Specimen (in) = 0.0000 Final Volume (cu.in) = 30.984
Shear At Failure
Rate of Deformation (in/min)= 0.005 Deviator Stress (ksf) = 13.19
Time to 50% primary Consolidation = 5 Eff. Minor Principal stress (ksf) = 4.17
Failure Mode: Bulging Failure Eff. Major Principal stress (ksf) = 17.36
Axial Strain (%) = 5.14
CONSOLIDATED UNDRAINED TRIAXIAL TEST WITH PORE PRESSURE MEASUREMENT
Figure F-2.307

Test Procedure: ASTM D 4767
Project Name: Westside Subway Extension Tested by: ST Date: 08-13-11
Project No.: Input Data by: KM Date: 08-17-11
Test Pit: G-190 Reviewed by: AP Date: 08-17-11
Sample No.: 8 Sample Description: Clayey Sand
Depth(ft): 35.5
Sample Type: Mod. Cal. Confining Pressure = 45.0 psi
Diameter (in) 2.604 2.604 2.604 Avg. = 2.604
Height (in) 5.890 5.890 5.890 Avg. = 5.890
BEFORE CONSOLIDATION AFTER CONSOLIDATION
Area (in²) 5.326 5.284
Moisture Content (%) 14.73 16.46
Wet Weight (gms) 11.04 1260.90
Dry Weight (gms) 9.95 1103.92
Container Weight (gms) 2.55 150.02
Density and Saturation
Wet Weight (gms) 1106.27
Container Weight (gms) 0.00
Wet Density (pcf) 134.4
Dry Density (pcf) 117.1
Initial Void Ratio 0.439
% Saturation 90.6
Assumed Specific Gravity = 2.70
Back Pressure Saturation
B Value (%) = 94 Change in Ht. of the Specimen (in)= 0
Consolidation
Cell Pressure (psi) = 75.0 Initial Burette Ht.(cm)= 65.6
Back Pressure(psi) = 30.0 Final Burette Ht.(cm)= 61.6
Eff. Consol. Stress (psi) = 45.0 Final Height (in)= 5.890
Induced OCR = 1.0 Initial Volume (cu.in)= 31.368
Change in Ht. of Specimen (in) = 0.0000 Final Volume (cu.in) = 31.124
Shear At Failure
Rate of Deformation (in/min)= 0.005 Deviator Stress (ksf) = 18.14
Time to 50% primary Consolidation = 5 Eff. Minor Principal stress (ksf) = 6.18
Failure Mode: Bulging Failure Eff. Major Principal stress (ksf) = 24.32
Axial Strain (%) = 4.89
CONSOLIDATED UNDRAINED TRIAXIAL TEST WITH PORE PRESSURE MEASUREMENT
4953-10-1561
Figure F-2.308

Project Name: Westside Subway Extension Cell Pressure: 45.0 psi
Project No: 4953-10-1561 Back Pressure : 30.0 psi
Test Pit: G-190 Consolidation Pressure : 15.0 psi
Depth(ft): 35.5 Initial Sample Height: 5.890 in
Sample No.: 8 Initial Area of Sample: 5.326 sq. in.
Sample Type: Mod. Cal. Final Sample Ht.* (L): 5.888 in
Sample Description: Clayey Sand Final Sample Area (A)*: 5.255 sq. in.
Induced OCR= 1.0
Cell Load Axial Back Deviator Axial Pore Shear Normal
Pressure Deformation Pressure Stress Strain Pressure Stress Stress
Change q' p'
(S1-S3) (S1-S3)/2 (S1'+S3')/2
(psi) (lbs) (in) (psi) (ksf) (%) (ksf) (ksf) (ksf)
45.0 0 0.001 30.1 0.00 0.01 0.00 0.00 2.16
45.0 13 0.004 31.4 0.35 0.07 0.18 0.18 2.15
45.0 17 0.010 31.3 0.47 0.18 0.17 0.23 2.22
45.0 26 0.016 31.3 0.70 0.28 0.18 0.35 2.33
45.0 27 0.022 31.3 0.74 0.37 0.17 0.37 2.36
45.0 33 0.028 31.3 0.89 0.48 0.16 0.44 2.44
45.0 36 0.034 31.4 0.97 0.57 0.19 0.49 2.46
45.0 42 0.040 31.9 1.13 0.67 0.26 0.57 2.47
45.0 44 0.045 33.3 1.20 0.77 0.46 0.60 2.30
45.0 54 0.051 34.5 1.47 0.86 0.63 0.73 2.26
45.0 61 0.056 35.4 1.66 0.96 0.76 0.83 2.23
45.0 67 0.062 36.1 1.82 1.05 0.86 0.91 2.21
45.0 72 0.067 36.6 1.95 1.14 0.94 0.98 2.20
45.0 77 0.072 37.1 2.08 1.23 1.00 1.04 2.20
45.0 82 0.078 37.4 2.22 1.32 1.05 1.11 2.22
45.0 87 0.082 37.7 2.35 1.40 1.09 1.18 2.24
45.0 101 0.097 38.2 2.72 1.65 1.17 1.36 2.35
45.0 110 0.108 38.4 2.96 1.84 1.19 1.48 2.45
45.0 125 0.126 38.4 3.35 2.13 1.19 1.68 2.64
45.0 140 0.143 38.3 3.74 2.42 1.17 1.87 2.86
45.0 155 0.160 38.0 4.13 2.72 1.13 2.07 3.09
45.0 169 0.177 37.6 4.49 3.00 1.08 2.25 3.33
45.0 183 0.193 37.2 4.85 3.28 1.01 2.43 3.57
45.0 197 0.209 36.6 5.21 3.55 0.94 2.60 3.82
45.0 209 0.226 36.1 5.51 3.83 0.86 2.75 4.05
45.0 220 0.243 35.5 5.78 4.12 0.78 2.89 4.27
45.0 228 0.254 35.1 5.98 4.32 0.72 2.99 4.43
45.0 232 0.260 34.9 6.08 4.42 0.69 3.04 4.51
45.0 236 0.266 34.7 6.18 4.51 0.66 3.09 4.58
45.0 239 0.271 34.5 6.25 4.61 0.64 3.12 4.65
45.0 243 0.277 34.3 6.35 4.71 0.61 3.17 4.73
45.0 246 0.283 34.1 6.42 4.81 0.58 3.21 4.79
45.0 250 0.289 33.9 6.51 4.90 0.55 3.26 4.87
45.0 254 0.294 33.7 6.61 5.00 0.52 3.31 4.95
45.0 257 0.300 33.5 6.68 5.10 0.49 3.34 5.01
CONSOLIDATED UNDRAINED TRIAXIAL TEST WITH PORE PRESSURE MEASUREMENT
Figure F-2.309
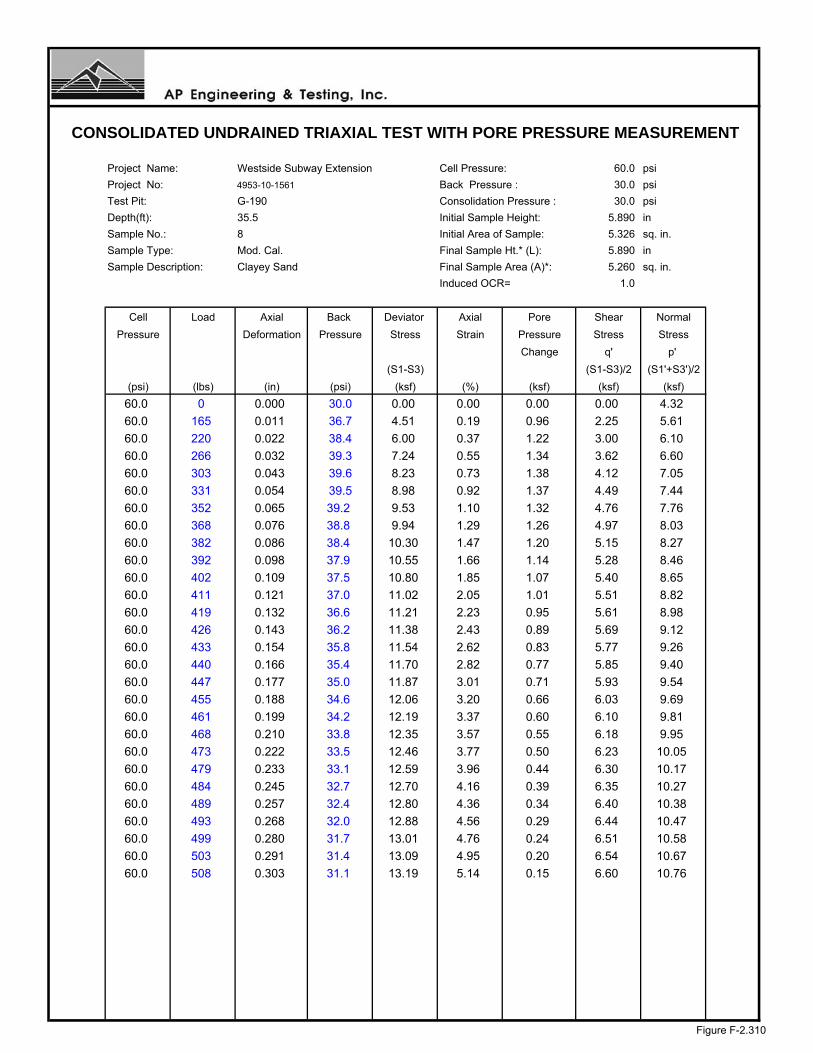
Project Name: Westside Subway Extension Cell Pressure: 60.0 psi
Project No: 4953-10-1561 Back Pressure : 30.0 psi
Test Pit: G-190 Consolidation Pressure : 30.0 psi
Depth(ft): 35.5 Initial Sample Height: 5.890 in
Sample No.: 8 Initial Area of Sample: 5.326 sq. in.
Sample Type: Mod. Cal. Final Sample Ht.* (L): 5.890 in
Sample Description: Clayey Sand Final Sample Area (A)*: 5.260 sq. in.
Induced OCR= 1.0
Cell Load Axial Back Deviator Axial Pore Shear Normal
Pressure Deformation Pressure Stress Strain Pressure Stress Stress
Change q' p'
(S1-S3) (S1-S3)/2 (S1'+S3')/2
(psi) (lbs) (in) (psi) (ksf) (%) (ksf) (ksf) (ksf)
60.0 0 0.000 30.0 0.00 0.00 0.00 0.00 4.32
60.0 165 0.011 36.7 4.51 0.19 0.96 2.25 5.61
60.0 220 0.022 38.4 6.00 0.37 1.22 3.00 6.10
60.0 266 0.032 39.3 7.24 0.55 1.34 3.62 6.60
60.0 303 0.043 39.6 8.23 0.73 1.38 4.12 7.05
60.0 331 0.054 39.5 8.98 0.92 1.37 4.49 7.44
60.0 352 0.065 39.2 9.53 1.10 1.32 4.76 7.76
60.0 368 0.076 38.8 9.94 1.29 1.26 4.97 8.03
60.0 382 0.086 38.4 10.30 1.47 1.20 5.15 8.27
60.0 392 0.098 37.9 10.55 1.66 1.14 5.28 8.46
60.0 402 0.109 37.5 10.80 1.85 1.07 5.40 8.65
60.0 411 0.121 37.0 11.02 2.05 1.01 5.51 8.82
60.0 419 0.132 36.6 11.21 2.23 0.95 5.61 8.98
60.0 426 0.143 36.2 11.38 2.43 0.89 5.69 9.12
60.0 433 0.154 35.8 11.54 2.62 0.83 5.77 9.26
60.0 440 0.166 35.4 11.70 2.82 0.77 5.85 9.40
60.0 447 0.177 35.0 11.87 3.01 0.71 5.93 9.54
60.0 455 0.188 34.6 12.06 3.20 0.66 6.03 9.69
60.0 461 0.199 34.2 12.19 3.37 0.60 6.10 9.81
60.0 468 0.210 33.8 12.35 3.57 0.55 6.18 9.95
60.0 473 0.222 33.5 12.46 3.77 0.50 6.23 10.05
60.0 479 0.233 33.1 12.59 3.96 0.44 6.30 10.17
60.0 484 0.245 32.7 12.70 4.16 0.39 6.35 10.27
60.0 489 0.257 32.4 12.80 4.36 0.34 6.40 10.38
60.0 493 0.268 32.0 12.88 4.56 0.29 6.44 10.47
60.0 499 0.280 31.7 13.01 4.76 0.24 6.51 10.58
60.0 503 0.291 31.4 13.09 4.95 0.20 6.54 10.67
60.0 508 0.303 31.1 13.19 5.14 0.15 6.60 10.76
CONSOLIDATED UNDRAINED TRIAXIAL TEST WITH PORE PRESSURE MEASUREMENT
Figure F-2.310

Project Name: Westside Subway Extension Cell Pressure: 75.0 psi
Project No: 4953-10-1561 Back Pressure : 30.0 psi
Test Pit: G-190 Consolidation Pressure : 45.0 psi
Depth(ft): 35.5 Initial Sample Height: 5.890 in
Sample No.: 8 Initial Area of Sample: 5.326 sq. in.
Sample Type: Mod. Cal. Final Sample Ht.* (L): 5.890 in
Sample Description: Clayey Sand Final Sample Area (A)*: 5.284 sq. in.
Induced OCR= 1.0
Cell Load Axial Back Deviator Axial Pore Shear Normal
Pressure Deformation Pressure Stress Strain Pressure Stress Stress
Change q' p'
(S1-S3) (S1-S3)/2 (S1'+S3')/2
(psi) (lbs) (in) (psi) (ksf) (%) (ksf) (ksf) (ksf)
75.0 0 0.000 30.0 0.00 0.00 0.00 0.00 6.48
75.0 186 0.006 36.8 5.06 0.10 0.98 2.53 8.03
75.0 263 0.012 39.0 7.15 0.20 1.30 3.58 8.76
75.0 318 0.018 40.2 8.64 0.31 1.47 4.32 9.33
75.0 361 0.024 40.9 9.80 0.41 1.57 4.90 9.81
75.0 406 0.030 41.3 11.01 0.51 1.63 5.50 10.36
75.0 444 0.036 41.5 12.03 0.61 1.65 6.01 10.84
75.0 483 0.042 41.5 13.07 0.71 1.65 6.53 11.36
75.0 514 0.048 41.3 13.89 0.81 1.63 6.95 11.80
75.0 541 0.054 40.9 14.61 0.92 1.57 7.30 12.21
75.0 557 0.060 40.5 15.02 1.02 1.52 7.51 12.48
75.0 606 0.090 38.5 16.26 1.53 1.22 8.13 13.39
75.0 615 0.100 37.9 16.47 1.70 1.14 8.24 13.58
75.0 657 0.176 35.0 17.37 2.98 0.72 8.69 14.44
75.0 673 0.212 34.0 17.68 3.60 0.58 8.84 14.74
75.0 689 0.249 33.0 17.98 4.22 0.43 8.99 15.04
75.0 700 0.288 32.1 18.14 4.89 0.30 9.07 15.25
75.0 712 0.325 31.2 18.33 5.52 0.18 9.17 15.47
75.0 725 0.362 30.5 18.54 6.14 0.07 9.27 15.68
75.0 735 0.400 29.8 18.67 6.79 -0.03 9.33 15.85
75.0 757 0.474 28.5 18.97 8.05 -0.21 9.48 16.18
75.0 769 0.512 28.0 19.13 8.70 -0.29 9.57 16.34
75.0 778 0.550 27.5 19.22 9.33 -0.36 9.61 16.45
75.0 789 0.587 27.0 19.36 9.96 -0.43 9.68 16.59
75.0 800 0.624 26.6 19.49 10.59 -0.49 9.75 16.71
75.0 808 0.663 26.2 19.54 11.26 -0.54 9.77 16.79
75.0 816 0.700 25.8 19.59 11.88 -0.60 9.80 16.88
75.0 827 0.736 25.5 19.72 12.50 -0.65 9.86 16.99
75.0 834 0.775 25.2 19.74 13.15 -0.70 9.87 17.05
75.0 842 0.812 24.8 19.78 13.79 -0.74 9.89 17.1175.0 850 0.849 24.5 19.82 14.42 -0.79 9.91 17.18
75.0 859 0.887 24.3 19.88 15.06 -0.83 9.94 17.25
75.0 864 0.925 24.1 19.85 15.71 -0.86 9.92 17.26
75.0 870 0.962 23.8 19.83 16.34 -0.89 9.92 17.29
75.0 907 1.225 22.3 19.58 20.79 -1.10 9.79 17.37
CONSOLIDATED UNDRAINED TRIAXIAL TEST WITH PORE PRESSURE MEASUREMENT
Figure F-2.311

LEGEND: CONFINING PRESSURES= ○ 15 psi □ 30 psi ∆ 45 psi
Project Name: Westside Subway Extension Sample Type: Mod. Cal.
Project No.: 4953-10-1561 Sample Description: Clayey Sand
Test Pit: G-190 Avg. Dry Unit Weight (pcf): 117.1
Sample No.: 8 Avg. Initial Moisture Content (%): 14.7
Depth (ft): 35.5 Confining Pressure: 15.0, 30.0, 45.0 psi
CU TRIAXIAL MULTI-STAGE TEST WITH PORE PRESSURE MEASUREMENTASTM D 4767
0
5
10
15
20
0 5 10 15 20 25 30 35 40
NORMAL STRESS, P' (ksf)
SH
EA
R S
TR
ES
S, q
' (ks
f)
0.0
2.0
4.0
6.0
8.0
10.0
12.0
14.0
16.0
18.0
20.0
0.0 5.0 10.0 15.0 20.0
AXIAL STRAIN (Percent)
DE
VIA
TO
R S
TR
ES
S (
ksf)
-4.0
-3.0
-2.0
-1.0
0.0
1.0
2.0
3.0
4.0
0.0 5.0 10.0 15.0 20.0
AXIAL STRAIN (Percent)C
HA
NG
E I
N P
OR
E W
AT
ER
PR
ES
SU
RE
(ks
f)
Figure F-2.312

LEGEND: CONFINING PRESSURES= ○ 15 psi □ 30 psi ∆ 45 psi
Project Name: Westside Subway Extension Sample Type: Mod. Cal.Project No.: 4953-10-1561 Sample Description: Clayey SandTest Pit: G-190 Avg. Dry Unit Weight (pcf): 117.1Sample No.: 8 Avg. Initial Moisture Content (%): 14.7Depth (ft): 35.5 Confining Pressure: 15.0, 30.0, 45.0 psi
CU TRIAXIAL MULTI-STAGE TEST WITH PORE PRESSURE MEASUREMENTASTM D 4767
0
5
10
15
0 5 10 15 20 25 30
NORMAL STRESS (ksf)
SH
EA
R S
TR
ES
S (
ksf)
φ=34.5°
φ'= 34°
0
5
10
15
20
0 5 10 15 20 25 30 35 40 p' (ksf)
q' (
ksf)
C= 0.30 ksfC'= 0.70 ksf
Failure Criteria: 5% Axial Strain
Figure F-2.313

Test Pit: G-190 Sample Type: Mod. Cal.Sample No.: 8 Soil Description: Clayey SandDepth (feet): 35.5 Eff. Confining Pressure (psi): 30.0
Project Name: Westside Subway ExtensionProject No.: 4953-10-1561Date: 08/13/11
6.5200
120240300
31.2890
8153060
0.250.512
0.5000
Time (minutes) Volume Change (cc)0.00000.5000
00.1
SQRT Time (minutes) Volume Change (cc)0.0000 0.0000
2.82843.87305.4772
0.31620.50000.70711.00001.4142
0.8000
5.9000
2.80003.90004.60005.3000
7.7460
2.00002.8000
TIME RATE CONSOLIDATION CURVE
4.60005.30005.9000
6.31006.3200
4
ASTM D 2435
6.10006.31006.3200
10.954515.491917.3205
979 6.5200
6.1000
1.20001.60002.1000
3.9000
0.80001.20001.60002.1000
0.00
1.00
2.00
3.00
4.00
5.00
6.00
7.00
0.1 1 10 100 1000 10000
Time (minutes)
Vol
ume
Cha
nge
(cc)
0.00
2.00
4.00
6.00
8.00
10.00
12.00
0.0 5.0 10.0 15.0 20.0 25.0 30.0 35.0
Square root Time (minutes)
Vol
ume
Cha
nge
(cc)
Figure F-2.314

Test Procedure: ASTM D 4767
Project Name: Westside Subway Extension Tested by: ST Date: 08-10-11
Project No.: 4953-10-1561 Input Data by: KM Date: 08-17-11
Test Pit: G-190 Reviewed by: AP Date: 08-17-11
Sample No.: 18 Sample Description: Sandy Lean Clay
Depth(ft): 65.5
Sample Type: Mod. Cal. Confining Pressure = 25.0 psi
Diameter (in) 2.615 2.615 2.615 Avg. = 2.615
Height (in) 5.799 5.799 5.799 Avg. = 5.799
BEFORE CONSOLIDATION AFTER CONSOLIDATION
Area (in²) 5.371 5.312
Moisture Content (%) 18.79 17.83
Wet Weight (gms) 1074.38 1216.79
Dry Weight (gms) 904.42 1055.51
Container Weight (gms) 0.00 151.09
Density and Saturation
Wet Weight (gms) 1074.38
Container Weight (gms) 0.00
Wet Density (pcf) 131.4
Dry Density (pcf) 110.6
Initial Void Ratio 0.523
% Saturation 97.0
Assumed Specific Gravity = 2.70
Back Pressure Saturation
B Value (%) = 95 Change in Ht. of the Specimen (in)= 0
Consolidation
Cell Pressure (psi) = 55.0 Initial Burette Ht.(cm)= 75.5
Back Pressure(psi) = 30.0 Final Burette Ht.(cm)= 64.7
Eff. Consol. Stress (psi) = 25.0 Final Height (in)= 5.739
Induced OCR = 1.0 Initial Volume (cu.in)= 31.145
Change in Ht. of Specimen (in) = 0.0603 Final Volume (cu.in) = 30.486
Shear At Failure
Rate of Deformation (in/min)= 0.005 Deviator Stress (ksf) = 9.61
Time to 50% primary Consolidation (min) = 5 Eff. Minor Principal stress (ksf) = 1.81
Failure Mode: Bulging Failure Eff. Major Principal stress (ksf) = 11.42
Axial Strain (%) = 5.31
CONSOLIDATED UNDRAINED TRIAXIAL TEST WITH PORE PRESSURE MEASUREMENT
Figure F-2.315

Test Procedure: ASTM D 4767
Project Name: Westside Subway Extension Tested by: ST Date: 08-10-11
Project No.: 4953-10-1561 Input Data by: KM Date: 08-17-11
Test Pit: G-190 Reviewed by: AP Date: 08-17-11
Sample No.: 18 Sample Description: Sandy Lean Clay
Depth(ft): 65.5
Sample Type: Mod. Cal. Confining Pressure = 40.0 psi
Diameter (in) 2.615 2.615 2.615 Avg. = 2.615
Height (in) 5.799 5.799 5.799 Avg. = 5.799
BEFORE CONSOLIDATION AFTER CONSOLIDATION
Area (in²) 5.371 5.296
Moisture Content (%) 18.79 17.83
Wet Weight (gms) 1074.38 1216.79
Dry Weight (gms) 904.42 1055.51
Container Weight (gms) 0.00 151.09
Density and Saturation
Wet Weight (gms) 1074.38
Container Weight (gms) 0.00
Wet Density (pcf) 131.4
Dry Density (pcf) 110.6
Initial Void Ratio 0.523
% Saturation 97.0
Assumed Specific Gravity = 2.70
Back Pressure Saturation
B Value (%) = 95 Change in Ht. of the Specimen (in)= 0
Consolidation
Cell Pressure (psi) = 70.0 Initial Burette Ht.(cm)= 64.8
Back Pressure(psi) = 30.0 Final Burette Ht.(cm)= 57.7
Eff. Consol. Stress (psi) = 40.0 Final Height (in)= 5.799
Induced OCR= 1.0 Initial Volume (cu.in)= 31.145
Change in Ht. of Specimen (in) = 0.0000 Final Volume (cu.in) = 30.712
Shear At Failure
Rate of Deformation (in/min)= 0.005 Deviator Stress (ksf) = 15.84
Time to 50% primary Consolidation = 5 Eff. Minor Principal stress (ksf) = 4.51
Failure Mode: Bulging Failure Eff. Major Principal stress (ksf) = 20.35
Axial Strain (%) = 5.20
CONSOLIDATED UNDRAINED TRIAXIAL TEST WITH PORE PRESSURE MEASUREMENT
Figure F-2.316

Test Procedure: ASTM D 4767
Project Name: Westside Subway Extension Tested by: ST Date: 08-10-11
Project No.: Input Data by: KM Date: 08-17-11
Test Pit: G-190 Reviewed by: AP Date: 08-17-11
Sample No.: 18 Sample Description: Sandy Lean Clay
Depth(ft): 65.5
Sample Type: Mod. Cal. Confining Pressure = 55.0 psi
Diameter (in) 2.615 2.615 2.615 Avg. = 2.615
Height (in) 5.799 5.799 5.799 Avg. = 5.799
BEFORE CONSOLIDATION AFTER CONSOLIDATION
Area (in²) 5.371 5.322
Moisture Content (%) 18.79 17.83
Wet Weight (gms) 1074.38 1216.79
Dry Weight (gms) 904.42 1055.51
Container Weight (gms) 0.00 151.09
Density and Saturation
Wet Weight (gms) 1074.38
Container Weight (gms) 0.00
Wet Density (pcf) 131.4
Dry Density (pcf) 110.6
Initial Void Ratio 0.523
% Saturation 97.0
Assumed Specific Gravity = 2.70
Back Pressure Saturation
B Value (%) = 95 Change in Ht. of the Specimen (in)= 0
Consolidation
Cell Pressure (psi) = 85.0 Initial Burette Ht.(cm)= 57.8
Back Pressure(psi) = 30.0 Final Burette Ht.(cm)= 53.2
Eff. Consol. Stress (psi) = 55.0 Final Height (in)= 5.799
Induced OCR = 1.0 Initial Volume (cu.in)= 31.145
Change in Ht. of Specimen (in) = 0.0000 Final Volume (cu.in) = 30.864
Shear At Failure
Rate of Deformation (in/min)= 0.005 Deviator Stress (ksf) = 21.51
Time to 50% primary Consolidation = 5 Eff. Minor Principal stress (ksf) = 6.54
Failure Mode: Bulging Failure Eff. Major Principal stress (ksf) = 28.05
Axial Strain (%) = 4.57
CONSOLIDATED UNDRAINED TRIAXIAL TEST WITH PORE PRESSURE MEASUREMENT
4953-10-1561
Figure F-2.317
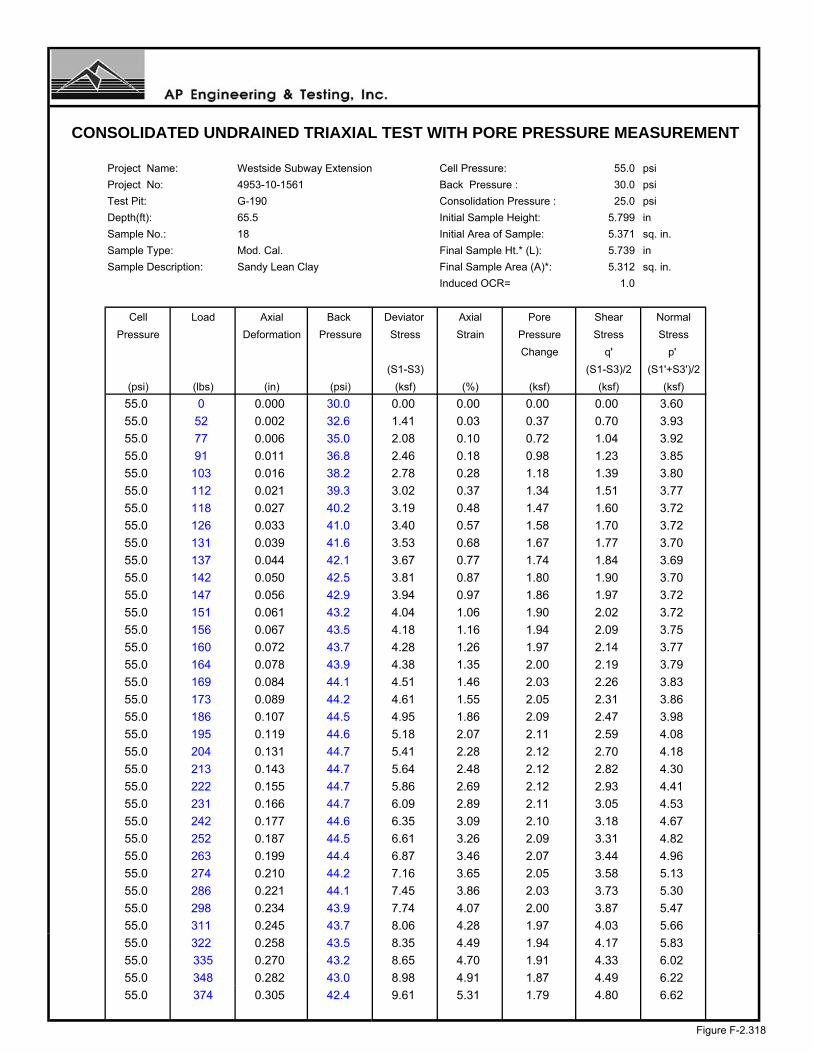
Project Name: Westside Subway Extension Cell Pressure: 55.0 psi
Project No: 4953-10-1561 Back Pressure : 30.0 psi
Test Pit: G-190 Consolidation Pressure : 25.0 psi
Depth(ft): 65.5 Initial Sample Height: 5.799 in
Sample No.: 18 Initial Area of Sample: 5.371 sq. in.
Sample Type: Mod. Cal. Final Sample Ht.* (L): 5.739 in
Sample Description: Sandy Lean Clay Final Sample Area (A)*: 5.312 sq. in.
Induced OCR= 1.0
Cell Load Axial Back Deviator Axial Pore Shear Normal
Pressure Deformation Pressure Stress Strain Pressure Stress Stress
Change q' p'
(S1-S3) (S1-S3)/2 (S1'+S3')/2
(psi) (lbs) (in) (psi) (ksf) (%) (ksf) (ksf) (ksf)
55.0 0 0.000 30.0 0.00 0.00 0.00 0.00 3.60
55.0 52 0.002 32.6 1.41 0.03 0.37 0.70 3.93
55.0 77 0.006 35.0 2.08 0.10 0.72 1.04 3.92
55.0 91 0.011 36.8 2.46 0.18 0.98 1.23 3.85
55.0 103 0.016 38.2 2.78 0.28 1.18 1.39 3.80
55.0 112 0.021 39.3 3.02 0.37 1.34 1.51 3.77
55.0 118 0.027 40.2 3.19 0.48 1.47 1.60 3.72
55.0 126 0.033 41.0 3.40 0.57 1.58 1.70 3.72
55.0 131 0.039 41.6 3.53 0.68 1.67 1.77 3.70
55.0 137 0.044 42.1 3.67 0.77 1.74 1.84 3.69
55.0 142 0.050 42.5 3.81 0.87 1.80 1.90 3.70
55.0 147 0.056 42.9 3.94 0.97 1.86 1.97 3.72
55.0 151 0.061 43.2 4.04 1.06 1.90 2.02 3.72
55.0 156 0.067 43.5 4.18 1.16 1.94 2.09 3.75
55.0 160 0.072 43.7 4.28 1.26 1.97 2.14 3.77
55.0 164 0.078 43.9 4.38 1.35 2.00 2.19 3.79
55.0 169 0.084 44.1 4.51 1.46 2.03 2.26 3.83
55.0 173 0.089 44.2 4.61 1.55 2.05 2.31 3.86
55.0 186 0.107 44.5 4.95 1.86 2.09 2.47 3.98
55.0 195 0.119 44.6 5.18 2.07 2.11 2.59 4.08
55.0 204 0.131 44.7 5.41 2.28 2.12 2.70 4.18
55.0 213 0.143 44.7 5.64 2.48 2.12 2.82 4.30
55.0 222 0.155 44.7 5.86 2.69 2.12 2.93 4.41
55.0 231 0.166 44.7 6.09 2.89 2.11 3.05 4.53
55.0 242 0.177 44.6 6.35 3.09 2.10 3.18 4.67
55.0 252 0.187 44.5 6.61 3.26 2.09 3.31 4.82
55.0 263 0.199 44.4 6.87 3.46 2.07 3.44 4.96
55.0 274 0.210 44.2 7.16 3.65 2.05 3.58 5.13
55.0 286 0.221 44.1 7.45 3.86 2.03 3.73 5.30
55.0 298 0.234 43.9 7.74 4.07 2.00 3.87 5.47
55.0 311 0.245 43.7 8.06 4.28 1.97 4.03 5.66
55.0 322 0.258 43.5 8.35 4.49 1.94 4.17 5.83
55.0 335 0.270 43.2 8.65 4.70 1.91 4.33 6.02
55.0 348 0.282 43.0 8.98 4.91 1.87 4.49 6.22
55.0 374 0.305 42.4 9.61 5.31 1.79 4.80 6.62
CONSOLIDATED UNDRAINED TRIAXIAL TEST WITH PORE PRESSURE MEASUREMENT
Figure F-2.318
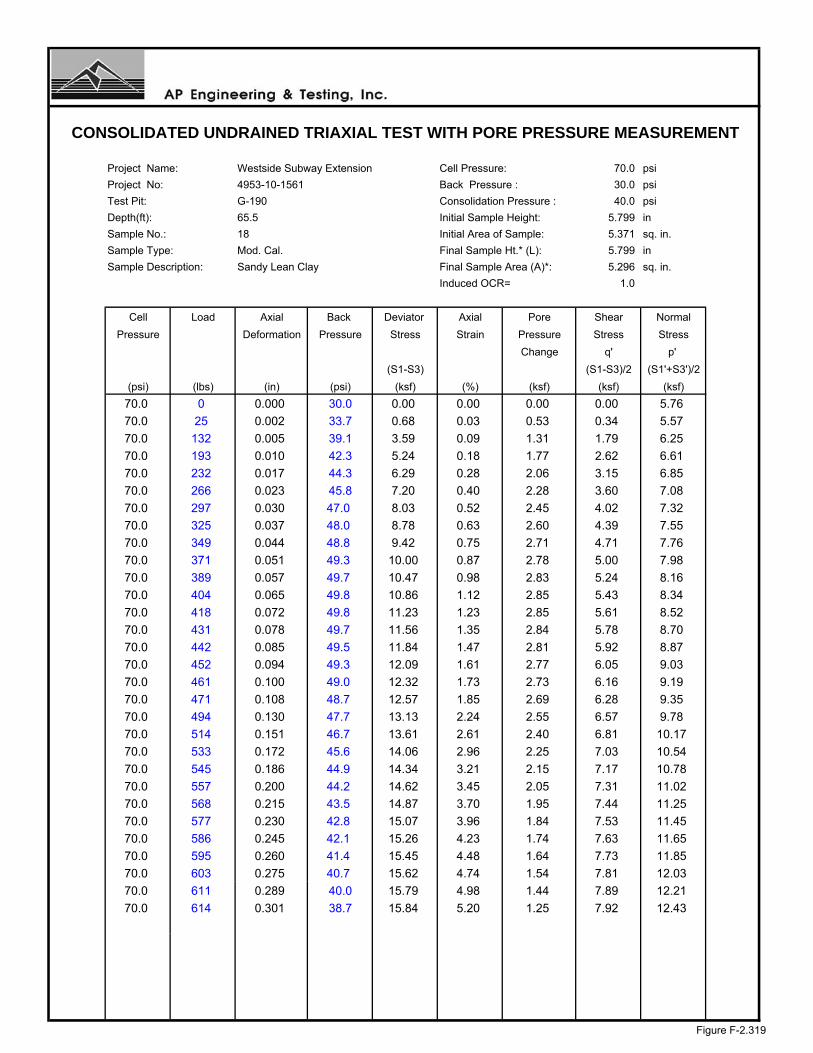
Project Name: Westside Subway Extension Cell Pressure: 70.0 psi
Project No: 4953-10-1561 Back Pressure : 30.0 psi
Test Pit: G-190 Consolidation Pressure : 40.0 psi
Depth(ft): 65.5 Initial Sample Height: 5.799 in
Sample No.: 18 Initial Area of Sample: 5.371 sq. in.
Sample Type: Mod. Cal. Final Sample Ht.* (L): 5.799 in
Sample Description: Sandy Lean Clay Final Sample Area (A)*: 5.296 sq. in.
Induced OCR= 1.0
Cell Load Axial Back Deviator Axial Pore Shear Normal
Pressure Deformation Pressure Stress Strain Pressure Stress Stress
Change q' p'
(S1-S3) (S1-S3)/2 (S1'+S3')/2
(psi) (lbs) (in) (psi) (ksf) (%) (ksf) (ksf) (ksf)
70.0 0 0.000 30.0 0.00 0.00 0.00 0.00 5.76
70.0 25 0.002 33.7 0.68 0.03 0.53 0.34 5.57
70.0 132 0.005 39.1 3.59 0.09 1.31 1.79 6.25
70.0 193 0.010 42.3 5.24 0.18 1.77 2.62 6.61
70.0 232 0.017 44.3 6.29 0.28 2.06 3.15 6.85
70.0 266 0.023 45.8 7.20 0.40 2.28 3.60 7.08
70.0 297 0.030 47.0 8.03 0.52 2.45 4.02 7.32
70.0 325 0.037 48.0 8.78 0.63 2.60 4.39 7.55
70.0 349 0.044 48.8 9.42 0.75 2.71 4.71 7.76
70.0 371 0.051 49.3 10.00 0.87 2.78 5.00 7.98
70.0 389 0.057 49.7 10.47 0.98 2.83 5.24 8.16
70.0 404 0.065 49.8 10.86 1.12 2.85 5.43 8.34
70.0 418 0.072 49.8 11.23 1.23 2.85 5.61 8.52
70.0 431 0.078 49.7 11.56 1.35 2.84 5.78 8.70
70.0 442 0.085 49.5 11.84 1.47 2.81 5.92 8.87
70.0 452 0.094 49.3 12.09 1.61 2.77 6.05 9.03
70.0 461 0.100 49.0 12.32 1.73 2.73 6.16 9.19
70.0 471 0.108 48.7 12.57 1.85 2.69 6.28 9.35
70.0 494 0.130 47.7 13.13 2.24 2.55 6.57 9.78
70.0 514 0.151 46.7 13.61 2.61 2.40 6.81 10.17
70.0 533 0.172 45.6 14.06 2.96 2.25 7.03 10.54
70.0 545 0.186 44.9 14.34 3.21 2.15 7.17 10.78
70.0 557 0.200 44.2 14.62 3.45 2.05 7.31 11.02
70.0 568 0.215 43.5 14.87 3.70 1.95 7.44 11.25
70.0 577 0.230 42.8 15.07 3.96 1.84 7.53 11.45
70.0 586 0.245 42.1 15.26 4.23 1.74 7.63 11.65
70.0 595 0.260 41.4 15.45 4.48 1.64 7.73 11.85
70.0 603 0.275 40.7 15.62 4.74 1.54 7.81 12.03
70.0 611 0.289 40.0 15.79 4.98 1.44 7.89 12.21
70.0 614 0.301 38.7 15.84 5.20 1.25 7.92 12.43
CONSOLIDATED UNDRAINED TRIAXIAL TEST WITH PORE PRESSURE MEASUREMENT
Figure F-2.319
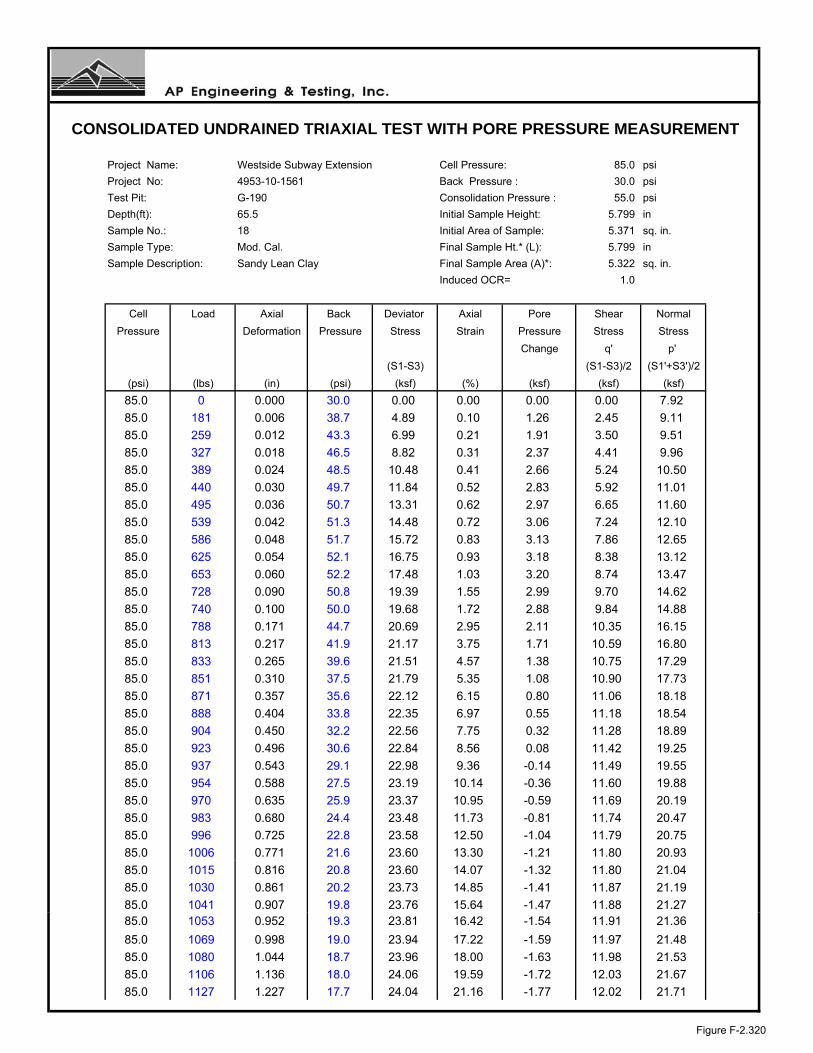
Project Name: Westside Subway Extension Cell Pressure: 85.0 psi
Project No: 4953-10-1561 Back Pressure : 30.0 psi
Test Pit: G-190 Consolidation Pressure : 55.0 psi
Depth(ft): 65.5 Initial Sample Height: 5.799 in
Sample No.: 18 Initial Area of Sample: 5.371 sq. in.
Sample Type: Mod. Cal. Final Sample Ht.* (L): 5.799 in
Sample Description: Sandy Lean Clay Final Sample Area (A)*: 5.322 sq. in.
Induced OCR= 1.0
Cell Load Axial Back Deviator Axial Pore Shear Normal
Pressure Deformation Pressure Stress Strain Pressure Stress Stress
Change q' p'
(S1-S3) (S1-S3)/2 (S1'+S3')/2
(psi) (lbs) (in) (psi) (ksf) (%) (ksf) (ksf) (ksf)
85.0 0 0.000 30.0 0.00 0.00 0.00 0.00 7.92
85.0 181 0.006 38.7 4.89 0.10 1.26 2.45 9.11
85.0 259 0.012 43.3 6.99 0.21 1.91 3.50 9.51
85.0 327 0.018 46.5 8.82 0.31 2.37 4.41 9.96
85.0 389 0.024 48.5 10.48 0.41 2.66 5.24 10.50
85.0 440 0.030 49.7 11.84 0.52 2.83 5.92 11.01
85.0 495 0.036 50.7 13.31 0.62 2.97 6.65 11.60
85.0 539 0.042 51.3 14.48 0.72 3.06 7.24 12.10
85.0 586 0.048 51.7 15.72 0.83 3.13 7.86 12.65
85.0 625 0.054 52.1 16.75 0.93 3.18 8.38 13.12
85.0 653 0.060 52.2 17.48 1.03 3.20 8.74 13.47
85.0 728 0.090 50.8 19.39 1.55 2.99 9.70 14.62
85.0 740 0.100 50.0 19.68 1.72 2.88 9.84 14.88
85.0 788 0.171 44.7 20.69 2.95 2.11 10.35 16.15
85.0 813 0.217 41.9 21.17 3.75 1.71 10.59 16.80
85.0 833 0.265 39.6 21.51 4.57 1.38 10.75 17.29
85.0 851 0.310 37.5 21.79 5.35 1.08 10.90 17.73
85.0 871 0.357 35.6 22.12 6.15 0.80 11.06 18.18
85.0 888 0.404 33.8 22.35 6.97 0.55 11.18 18.54
85.0 904 0.450 32.2 22.56 7.75 0.32 11.28 18.89
85.0 923 0.496 30.6 22.84 8.56 0.08 11.42 19.25
85.0 937 0.543 29.1 22.98 9.36 -0.14 11.49 19.55
85.0 954 0.588 27.5 23.19 10.14 -0.36 11.60 19.88
85.0 970 0.635 25.9 23.37 10.95 -0.59 11.69 20.19
85.0 983 0.680 24.4 23.48 11.73 -0.81 11.74 20.47
85.0 996 0.725 22.8 23.58 12.50 -1.04 11.79 20.75
85.0 1006 0.771 21.6 23.60 13.30 -1.21 11.80 20.93
85.0 1015 0.816 20.8 23.60 14.07 -1.32 11.80 21.04
85.0 1030 0.861 20.2 23.73 14.85 -1.41 11.87 21.19
85.0 1041 0.907 19.8 23.76 15.64 -1.47 11.88 21.2785.0 1053 0.952 19.3 23.81 16.42 -1.54 11.91 21.36
85.0 1069 0.998 19.0 23.94 17.22 -1.59 11.97 21.48
85.0 1080 1.044 18.7 23.96 18.00 -1.63 11.98 21.53
85.0 1106 1.136 18.0 24.06 19.59 -1.72 12.03 21.67
85.0 1127 1.227 17.7 24.04 21.16 -1.77 12.02 21.71
CONSOLIDATED UNDRAINED TRIAXIAL TEST WITH PORE PRESSURE MEASUREMENT
Figure F-2.320

LEGEND: CONFINING PRESSURES= ○ 25 psi □ 40 psi ∆ 55 psi
Project Name: Westside Subway Extension Sample Type: Mod. Cal.
Project No.: 4953-10-1561 Sample Description: Sandy Lean Clay
Test Pit: G-190 Avg. Dry Unit Weight (pcf): 110.6
Sample No.: 18 Avg. Initial Moisture Content (%): 18.8
Depth (ft): 65.5 Confining Pressure: 25.0, 40.0, 55.0 psi
CU TRIAXIAL MULTI-STAGE TEST WITH PORE PRESSURE MEASUREMENTASTM D 4767
0
5
10
15
20
0 5 10 15 20 25 30 35 40
NORMAL STRESS, P' (ksf)
SH
EA
R S
TR
ES
S, q
' (ks
f)
0.0
5.0
10.0
15.0
20.0
25.0
30.0
0.0 5.0 10.0 15.0 20.0
AXIAL STRAIN (Percent)
DE
VIA
TO
R S
TR
ES
S (
ksf)
-4.0
-3.0
-2.0
-1.0
0.0
1.0
2.0
3.0
4.0
0.0 5.0 10.0 15.0 20.0
AXIAL STRAIN (Percent)C
HA
NG
E I
N P
OR
E W
AT
ER
PR
ES
SU
RE
(ks
f)
Figure F-2.321

LEGEND: CONFINING PRESSURES= ○ 25 psi □ 40 psi ∆ 55 psi
Project Name: Westside Subway Extension Sample Type: Mod. Cal.Project No.: 4953-10-1561 Sample Description: Sandy Lean ClayTest Pit: G-190 Avg. Dry Unit Weight (pcf): 110.6Sample No.: 18 Avg. Initial Moisture Content (%): 18.8Depth (ft): 65.5 Confining Pressure: 25.0, 40.0, 55.0 psi
CU TRIAXIAL MULTI-STAGE TEST WITH PORE PRESSURE MEASUREMENTASTM D 4767
0
5
10
15
0 5 10 15 20 25 30
NORMAL STRESS (ksf)
SH
EA
R S
TR
ES
S (
ksf)
φ=35°
φ'= 34°
0
5
10
15
20
0 5 10 15 20 25 30 35 40 p' (ksf)
q' (
ksf)
C= 0.10 ksfC'= 1.20 ksf
Failure Criteria: 5% Axial Strain
Figure F-2.322

Test Pit: G-190 Sample Type: Mod. Cal.Sample No.: 18 Soil Description: Sandy Lean ClayDepth (feet): 65.5 Eff. Confining Pressure (psi): 40.0
Project Name: Westside Subway ExtensionProject No.: 4953-10-1561Date: 08/10/11
1.60001.80002.30002.9000
1.80002.30002.9000
4.9000
ASTM D 2435
7.06007.23007.4000
10.954515.491921.9089
997 7.5700
7.06007.7460
2.00003.8000
TIME RATE CONSOLIDATION CURVE
5.60006.30006.8000
7.23007.4000
4
6.8000
3.80004.90005.60006.3000
0.0000
2.82843.87305.4772
0.31620.50000.70711.00001.4142
1.60001.3000
Time (minutes) Volume Change (cc)0.00001.3000
00.1
SQRT Time (minutes) Volume Change (cc)0.0000
0.250.512
8153060
120240480
31.5753 7.5700
0.00
1.00
2.00
3.00
4.00
5.00
6.00
7.00
8.00
0.1 1 10 100 1000 10000
Time (minutes)
Vol
ume
Cha
nge
(cc)
0.00
2.00
4.00
6.00
8.00
10.00
12.00
0.0 5.0 10.0 15.0 20.0 25.0 30.0 35.0
Square root Time (minutes)
Vol
ume
Cha
nge
(cc)
Figure F-2.323

Test Procedure: ASTM D 4767
Project Name: Westside Subway Extension Tested by: ST Date: 08-09-11
Project No.: 4953-10-1561 Input Data by: KM Date: 08-17-11
Test Pit: G-190 Reviewed by: AP Date: 08-17-11
Sample No.: 21 Sample Description: Lean Clay with sand
Depth(ft): 75.5
Sample Type: Mod. Cal. Confining Pressure = 30.0 psi
Diameter (in) 2.620 2.620 2.620 Avg. = 2.620
Height (in) 4.724 4.724 4.724 Avg. = 4.724
BEFORE CONSOLIDATION AFTER CONSOLIDATION
Area (in²) 5.391 5.252
Moisture Content (%) 21.85 20.13
Wet Weight (gms) 104.74 999.49
Dry Weight (gms) 94.94 856.66
Container Weight (gms) 50.08 147.29
Density and Saturation
Wet Weight (gms) 858.47
Container Weight (gms) 0.00
Wet Density (pcf) 128.4
Dry Density (pcf) 105.4
Initial Void Ratio 0.599
% Saturation 98.5
Assumed Specific Gravity = 2.70
Back Pressure Saturation
B Value (%) = 94 Change in Ht. of the Specimen (in)= 0
Consolidation
Cell Pressure (psi) = 60.0 Initial Burette Ht.(cm)= 90.2
Back Pressure(psi) = 30.0 Final Burette Ht.(cm)= 79.2
Eff. Consol. Stress (psi) = 30.0 Final Height (in)= 4.721
Induced OCR = 1.0 Initial Volume (cu.in)= 25.468
Change in Ht. of Specimen (in) = 0.0027 Final Volume (cu.in) = 24.797
Shear At Failure
Rate of Deformation (in/min)= 0.008 Deviator Stress (ksf) = 11.06
Time to 50% primary Consolidation (min) = 3 Eff. Minor Principal stress (ksf) = 2.66
Failure Mode: Bulging Failure Eff. Major Principal stress (ksf) = 13.72
Axial Strain (%) = 5.37
CONSOLIDATED UNDRAINED TRIAXIAL TEST WITH PORE PRESSURE MEASUREMENT
Figure F-2.324

Test Procedure: ASTM D 4767
Project Name: Westside Subway Extension Tested by: ST Date: 08-09-11
Project No.: 4953-10-1561 Input Data by: KM Date: 08-17-11
Test Pit: G-190 Reviewed by: AP Date: 08-17-11
Sample No.: 21 Sample Description: Lean Clay with sand
Depth(ft): 75.5
Sample Type: Mod. Cal. Confining Pressure = 45.0 psi
Diameter (in) 2.620 2.620 2.620 Avg. = 2.620
Height (in) 4.724 4.724 4.724 Avg. = 4.724
BEFORE CONSOLIDATION AFTER CONSOLIDATION
Area (in²) 5.391 5.302
Moisture Content (%) 21.85 20.13
Wet Weight (gms) 104.74 999.49
Dry Weight (gms) 94.94 856.66
Container Weight (gms) 50.08 147.29
Density and Saturation
Wet Weight (gms) 858.47
Container Weight (gms) 0.00
Wet Density (pcf) 128.4
Dry Density (pcf) 105.4
Initial Void Ratio 0.599
% Saturation 98.5
Assumed Specific Gravity = 2.70
Back Pressure Saturation
B Value (%) = 94 Change in Ht. of the Specimen (in)= 0
Consolidation
Cell Pressure (psi) = 75.0 Initial Burette Ht.(cm)= 79.2
Back Pressure(psi) = 30.0 Final Burette Ht.(cm)= 72.3
Eff. Consol. Stress (psi) = 45.0 Final Height (in)= 4.724
Induced OCR= 1.0 Initial Volume (cu.in)= 25.468
Change in Ht. of Specimen (in) = 0.0000 Final Volume (cu.in) = 25.047
Shear At Failure
Rate of Deformation (in/min)= 0.008 Deviator Stress (ksf) = 18.14
Time to 50% primary Consolidation = 3 Eff. Minor Principal stress (ksf) = 5.99
Failure Mode: Bulging Failure Eff. Major Principal stress (ksf) = 24.13
Axial Strain (%) = 5.38
CONSOLIDATED UNDRAINED TRIAXIAL TEST WITH PORE PRESSURE MEASUREMENT
Figure F-2.325
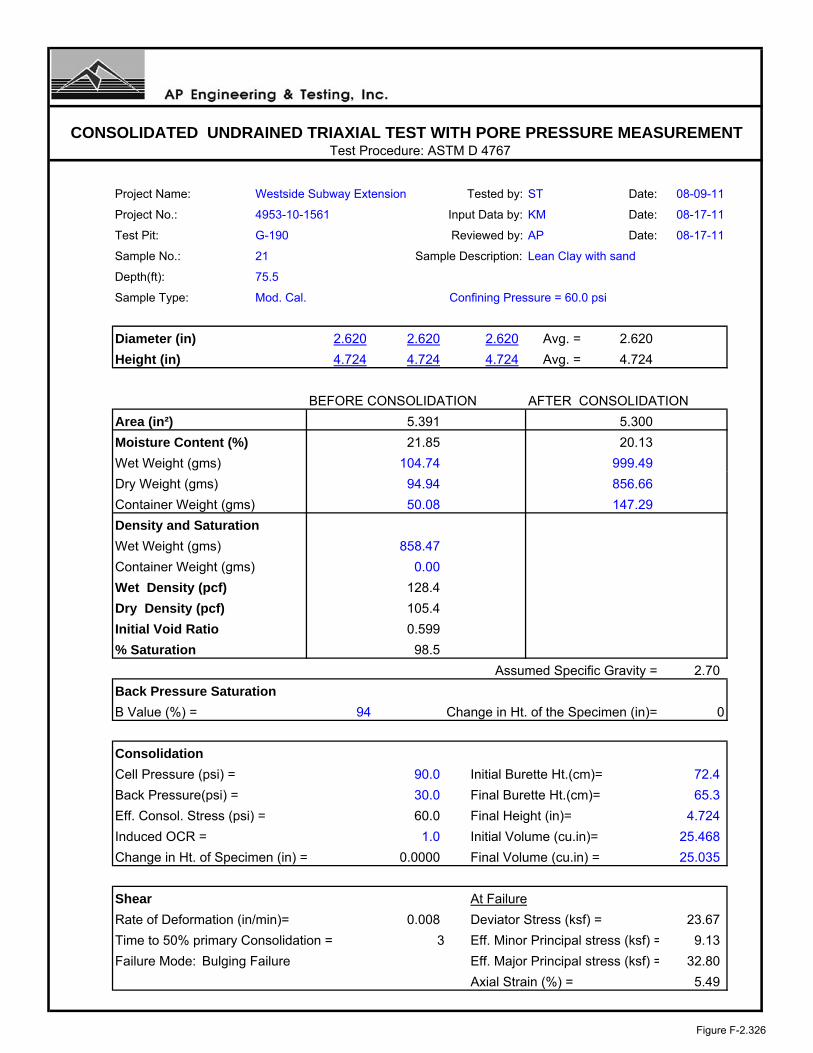
Test Procedure: ASTM D 4767
Project Name: Westside Subway Extension Tested by: ST Date: 08-09-11
Project No.: Input Data by: KM Date: 08-17-11
Test Pit: G-190 Reviewed by: AP Date: 08-17-11
Sample No.: 21 Sample Description: Lean Clay with sand
Depth(ft): 75.5
Sample Type: Mod. Cal. Confining Pressure = 60.0 psi
Diameter (in) 2.620 2.620 2.620 Avg. = 2.620
Height (in) 4.724 4.724 4.724 Avg. = 4.724
BEFORE CONSOLIDATION AFTER CONSOLIDATION
Area (in²) 5.391 5.300
Moisture Content (%) 21.85 20.13
Wet Weight (gms) 104.74 999.49
Dry Weight (gms) 94.94 856.66
Container Weight (gms) 50.08 147.29
Density and Saturation
Wet Weight (gms) 858.47
Container Weight (gms) 0.00
Wet Density (pcf) 128.4
Dry Density (pcf) 105.4
Initial Void Ratio 0.599
% Saturation 98.5
Assumed Specific Gravity = 2.70
Back Pressure Saturation
B Value (%) = 94 Change in Ht. of the Specimen (in)= 0
Consolidation
Cell Pressure (psi) = 90.0 Initial Burette Ht.(cm)= 72.4
Back Pressure(psi) = 30.0 Final Burette Ht.(cm)= 65.3
Eff. Consol. Stress (psi) = 60.0 Final Height (in)= 4.724
Induced OCR = 1.0 Initial Volume (cu.in)= 25.468
Change in Ht. of Specimen (in) = 0.0000 Final Volume (cu.in) = 25.035
Shear At Failure
Rate of Deformation (in/min)= 0.008 Deviator Stress (ksf) = 23.67
Time to 50% primary Consolidation = 3 Eff. Minor Principal stress (ksf) = 9.13
Failure Mode: Bulging Failure Eff. Major Principal stress (ksf) = 32.80
Axial Strain (%) = 5.49
CONSOLIDATED UNDRAINED TRIAXIAL TEST WITH PORE PRESSURE MEASUREMENT
4953-10-1561
Figure F-2.326

Project Name: Westside Subway Extension Cell Pressure: 60.0 psi
Project No: 4953-10-1561 Back Pressure : 30.0 psi
Test Pit: G-190 Consolidation Pressure : 30.0 psi
Depth(ft): 75.5 Initial Sample Height: 4.724 in
Sample No.: 21 Initial Area of Sample: 5.391 sq. in.
Sample Type: Mod. Cal. Final Sample Ht.* (L): 4.721 in
Sample Description: Lean Clay with sand Final Sample Area (A)*: 5.252 sq. in.
Induced OCR= 1.0
Cell Load Axial Back Deviator Axial Pore Shear Normal
Pressure Deformation Pressure Stress Strain Pressure Stress Stress
Change q' p'
(S1-S3) (S1-S3)/2 (S1'+S3')/2
(psi) (lbs) (in) (psi) (ksf) (%) (ksf) (ksf) (ksf)
60.0 0 0.000 30.0 0.00 0.00 0.00 0.00 4.32
60.0 39 0.004 33.5 1.08 0.09 0.50 0.54 4.35
60.0 64 0.011 33.9 1.76 0.22 0.56 0.88 4.64
60.0 75 0.017 33.9 2.06 0.35 0.56 1.03 4.80
60.0 86 0.023 34.1 2.35 0.49 0.58 1.18 4.91
60.0 92 0.029 34.4 2.50 0.61 0.63 1.25 4.94
60.0 104 0.034 37.6 2.84 0.72 1.10 1.42 4.64
60.0 115 0.039 40.1 3.13 0.83 1.45 1.56 4.43
60.0 131 0.045 41.8 3.56 0.95 1.70 1.78 4.40
60.0 145 0.050 43.1 3.93 1.07 1.88 1.97 4.40
60.0 155 0.056 44.0 4.20 1.19 2.02 2.10 4.40
60.0 165 0.062 44.7 4.46 1.31 2.12 2.23 4.43
60.0 174 0.068 45.2 4.70 1.43 2.19 2.35 4.47
60.0 181 0.072 45.6 4.89 1.53 2.25 2.45 4.51
60.0 189 0.078 45.9 5.09 1.66 2.30 2.54 4.57
60.0 196 0.084 46.2 5.29 1.77 2.33 2.64 4.64
60.0 204 0.090 46.3 5.48 1.90 2.35 2.74 4.71
60.0 211 0.095 46.4 5.68 2.00 2.36 2.84 4.79
60.0 219 0.100 46.5 5.87 2.11 2.37 2.94 4.89
60.0 240 0.116 46.4 6.42 2.46 2.36 3.21 5.17
60.0 263 0.134 46.3 6.99 2.83 2.34 3.50 5.48
60.0 285 0.152 45.9 7.56 3.21 2.29 3.78 5.81
60.0 309 0.169 45.4 8.16 3.57 2.21 4.08 6.19
60.0 333 0.186 44.7 8.76 3.94 2.12 4.38 6.58
60.0 357.5 0.203 44.0 9.38 4.29 2.02 4.69 6.99
60.0 380 0.219 43.3 9.93 4.64 1.91 4.97 7.38
60.0 404 0.236 42.4 10.52 5.01 1.79 5.26 7.79
60.0 426 0.253 41.6 11.06 5.37 1.66 5.53 8.19
CONSOLIDATED UNDRAINED TRIAXIAL TEST WITH PORE PRESSURE MEASUREMENT
Figure F-2.327

Project Name: Westside Subway Extension Cell Pressure: 75.0 psi
Project No: 4953-10-1561 Back Pressure : 30.0 psi
Test Pit: G-190 Consolidation Pressure : 45.0 psi
Depth(ft): 75.5 Initial Sample Height: 4.724 in
Sample No.: 21 Initial Area of Sample: 5.391 sq. in.
Sample Type: Mod. Cal. Final Sample Ht.* (L): 4.724 in
Sample Description: Lean Clay with sand Final Sample Area (A)*: 5.302 sq. in.
Induced OCR= 1.0
Cell Load Axial Back Deviator Axial Pore Shear Normal
Pressure Deformation Pressure Stress Strain Pressure Stress Stress
Change q' p'
(S1-S3) (S1-S3)/2 (S1'+S3')/2
(psi) (lbs) (in) (psi) (ksf) (%) (ksf) (ksf) (ksf)
75.0 0 0.000 30.0 0.00 0.00 0.00 0.00 6.48
75.0 112 0.005 37.0 3.04 0.11 1.01 1.52 6.99
75.0 181 0.011 41.0 4.90 0.24 1.58 2.45 7.35
75.0 233 0.018 43.1 6.30 0.39 1.88 3.15 7.75
75.0 278 0.025 44.1 7.51 0.52 2.03 3.76 8.21
75.0 319 0.032 44.6 8.61 0.67 2.10 4.30 8.68
75.0 357 0.038 44.8 9.62 0.80 2.14 4.81 9.15
75.0 390 0.044 45.0 10.49 0.94 2.15 5.25 9.57
75.0 420 0.051 45.0 11.28 1.09 2.16 5.64 9.96
75.0 445 0.058 44.9 11.94 1.23 2.15 5.97 10.30
75.0 466 0.064 44.8 12.48 1.36 2.13 6.24 10.59
75.0 484 0.071 44.6 12.95 1.49 2.11 6.47 10.85
75.0 500 0.077 44.4 13.36 1.64 2.07 6.68 11.09
75.0 514 0.084 44.0 13.71 1.78 2.02 6.86 11.31
75.0 526 0.091 43.7 14.01 1.93 1.97 7.00 11.52
75.0 538 0.098 43.3 14.31 2.07 1.91 7.15 11.72
75.0 558 0.112 42.4 14.80 2.37 1.78 7.40 12.09
75.0 577 0.127 41.5 15.25 2.69 1.65 7.62 12.45
75.0 595 0.140 40.6 15.68 2.97 1.52 7.84 12.80
75.0 611 0.155 39.6 16.05 3.29 1.38 8.02 13.12
75.0 627 0.169 38.7 16.42 3.58 1.25 8.21 13.44
75.0 642 0.183 37.8 16.76 3.88 1.12 8.38 13.74
75.0 657 0.197 36.9 17.10 4.17 0.99 8.55 14.04
75.0 670 0.211 36.0 17.38 4.47 0.86 8.69 14.31
75.0 683 0.225 35.1 17.67 4.75 0.73 8.83 14.58
75.0 694 0.239 34.2 17.89 5.07 0.61 8.95 14.82
75.0 706 0.254 33.4 18.14 5.38 0.49 9.07 15.06
CONSOLIDATED UNDRAINED TRIAXIAL TEST WITH PORE PRESSURE MEASUREMENT
Figure F-2.328

Project Name: Westside Subway Extension Cell Pressure: 90.0 psi
Project No: 4953-10-1561 Back Pressure : 30.0 psi
Test Pit: G-190 Consolidation Pressure : 60.0 psi
Depth(ft): 75.5 Initial Sample Height: 4.724 in
Sample No.: 21 Initial Area of Sample: 5.391 sq. in.
Sample Type: Mod. Cal. Final Sample Ht.* (L): 4.724 in
Sample Description: Lean Clay with sand Final Sample Area (A)*: 5.300 sq. in.
Induced OCR= 1.0
Cell Load Axial Back Deviator Axial Pore Shear Normal
Pressure Deformation Pressure Stress Strain Pressure Stress Stress
Change q' p'
(S1-S3) (S1-S3)/2 (S1'+S3')/2
(psi) (lbs) (in) (psi) (ksf) (%) (ksf) (ksf) (ksf)
90.0 0 0.000 30.0 0.00 0.00 0.00 0.00 8.64
90.0 151 0.006 35.7 4.10 0.13 0.81 2.05 9.88
90.0 258 0.012 39.9 7.00 0.25 1.43 3.50 10.71
90.0 332 0.018 41.6 8.99 0.38 1.67 4.49 11.46
90.0 401 0.024 42.2 10.85 0.51 1.76 5.43 12.31
90.0 464 0.030 42.1 12.51 0.64 1.74 6.26 13.16
90.0 523 0.036 41.7 14.10 0.76 1.68 7.05 14.01
90.0 579 0.042 41.2 15.58 0.89 1.61 7.79 14.83
90.0 635 0.048 40.6 17.07 1.02 1.52 8.53 15.65
90.0 675 0.054 40.1 18.13 1.14 1.45 9.07 16.25
90.0 708 0.060 39.6 19.00 1.27 1.38 9.50 16.76
90.0 791 0.090 37.0 21.09 1.91 1.01 10.54 18.18
90.0 803 0.100 36.2 21.35 2.12 0.89 10.68 18.42
90.0 827 0.125 34.4 21.88 2.65 0.63 10.94 18.95
90.0 863 0.170 31.5 22.61 3.60 0.21 11.30 19.73
90.0 894 0.213 29.1 23.19 4.52 -0.13 11.59 20.37
90.0 922 0.259 26.6 23.67 5.49 -0.49 11.83 20.96
90.0 946 0.304 25.8 24.05 6.44 -0.60 12.02 21.27
90.0 968 0.349 24.3 24.37 7.38 -0.83 12.19 21.65
90.0 990 0.395 22.8 24.65 8.35 -1.03 12.33 22.00
90.0 1010 0.439 21.6 24.89 9.30 -1.21 12.44 22.29
90.0 1028 0.485 20.5 25.06 10.26 -1.37 12.53 22.54
90.0 1044 0.529 19.5 25.19 11.21 -1.52 12.59 22.75
90.0 1059 0.574 18.6 25.29 12.14 -1.64 12.64 22.92
90.0 1066 0.620 17.9 25.16 13.12 -1.75 12.58 22.96
90.0 1065 0.666 17.8 24.85 14.10 -1.75 12.43 22.82
90.0 1066 0.711 18.4 24.60 15.05 -1.67 12.30 22.61
90.0 1070 0.758 18.9 24.41 16.04 -1.59 12.21 22.44
90.0 1080 0.802 19.2 24.36 16.98 -1.56 12.18 22.38
90.0 1091 0.847 19.2 24.32 17.93 -1.56 12.16 22.3690.0 1102 0.893 19.0 24.27 18.91 -1.59 12.14 22.37
90.0 1113 0.938 18.8 24.25 19.85 -1.61 12.12 22.37
90.0 1123 0.983 18.7 24.17 20.80 -1.63 12.09 22.36
90.0 1133 1.027 18.7 24.09 21.75 -1.63 12.05 22.31
CONSOLIDATED UNDRAINED TRIAXIAL TEST WITH PORE PRESSURE MEASUREMENT
Figure F-2.329

LEGEND: CONFINING PRESSURES= ○ 30 psi □ 45 psi ∆ 60 psi
Project Name: Westside Subway Extension Sample Type: Mod. Cal.
Project No.: 4953-10-1561 Sample Description: Lean Clay with sand
Test Pit: G-190 Avg. Dry Unit Weight (pcf): 105.4
Sample No.: 21 Avg. Initial Moisture Content (%): 21.8
Depth (ft): 75.5 Confining Pressure: 30.0, 45.0, 60.0 psi
CU TRIAXIAL MULTI-STAGE TEST WITH PORE PRESSURE MEASUREMENTASTM D 4767
0
5
10
15
20
0 5 10 15 20 25 30 35 40
NORMAL STRESS, P' (ksf)
SH
EA
R S
TR
ES
S, q
' (ks
f)
0.0
5.0
10.0
15.0
20.0
25.0
30.0
0.0 5.0 10.0 15.0 20.0
AXIAL STRAIN (Percent)
DE
VIA
TO
R S
TR
ES
S (
ksf)
-4.0
-3.0
-2.0
-1.0
0.0
1.0
2.0
3.0
4.0
0.0 5.0 10.0 15.0 20.0
AXIAL STRAIN (Percent)C
HA
NG
E I
N P
OR
E W
AT
ER
PR
ES
SU
RE
(ks
f)
Figure F-2.330

LEGEND: CONFINING PRESSURES= ○ 30 psi □ 45 psi ∆ 60 psi
Project Name: Westside Subway Extension Sample Type: Mod. Cal.Project No.: 4953-10-1561 Sample Description: Lean Clay with sandTest Pit: G-190 Avg. Dry Unit Weight (pcf): 105.4Sample No.: 21 Avg. Initial Moisture Content (%): 21.8Depth (ft): 75.5 Confining Pressure: 30.0, 45.0, 60.0 psi
CU TRIAXIAL MULTI-STAGE TEST WITH PORE PRESSURE MEASUREMENTASTM D 4767
0
5
10
15
20
0 5 10 15 20 25 30 35 40
NORMAL STRESS (ksf)
SH
EA
R S
TR
ES
S (
ksf)
φ=34°
φ'= 30°
0
5
10
15
20
0 5 10 15 20 25 30 35 40 p' (ksf)
q' (
ksf)
C= 0.20 ksfC'= 1.50 ksf
Failure Criteria: 5% Axial Strain
Figure F-2.331
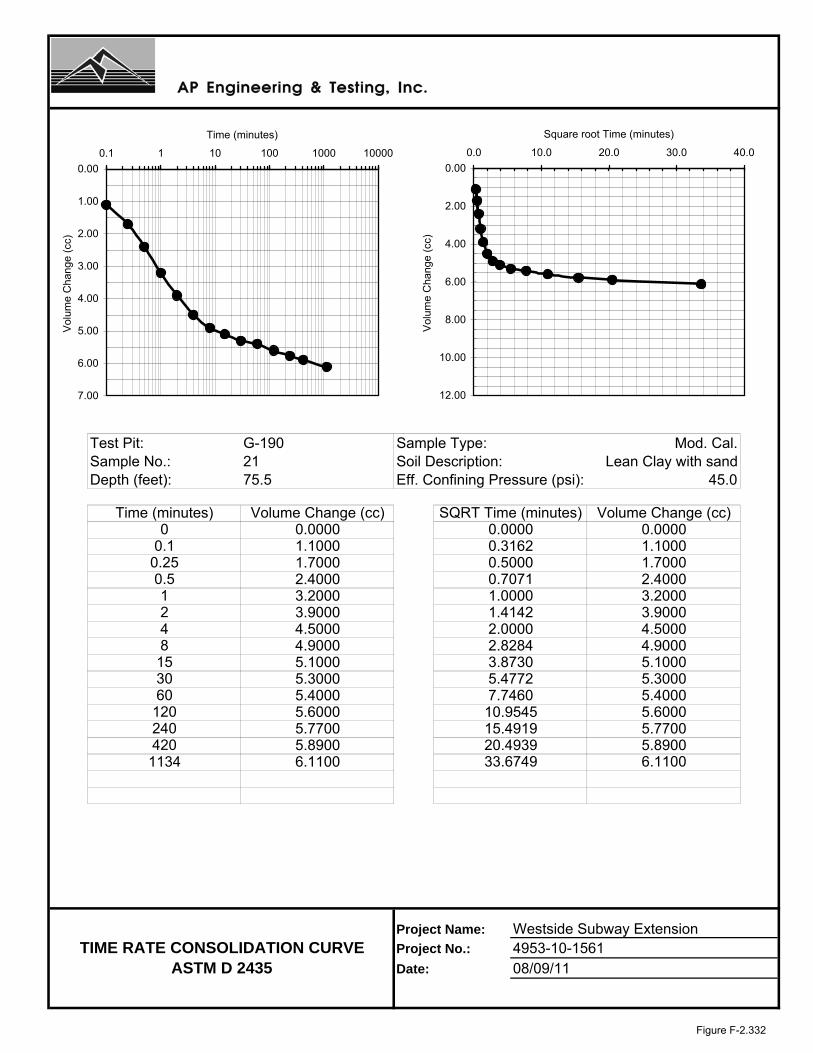
Test Pit: G-190 Sample Type: Mod. Cal.Sample No.: 21 Soil Description: Lean Clay with sandDepth (feet): 75.5 Eff. Confining Pressure (psi): 45.0
Project Name: Westside Subway ExtensionProject No.: 4953-10-1561Date: 08/09/11
1.70002.40003.20003.9000
2.40003.20003.9000
4.9000
ASTM D 2435
5.60005.77005.8900
10.954515.491920.4939
1134 6.1100
5.60007.7460
2.00004.5000
TIME RATE CONSOLIDATION CURVE
5.10005.30005.4000
5.77005.8900
4
5.4000
4.50004.90005.10005.3000
0.0000
2.82843.87305.4772
0.31620.50000.70711.00001.4142
1.70001.1000
Time (minutes) Volume Change (cc)0.00001.1000
00.1
SQRT Time (minutes) Volume Change (cc)0.0000
0.250.512
8153060
120240420
33.6749 6.1100
0.00
1.00
2.00
3.00
4.00
5.00
6.00
7.00
0.1 1 10 100 1000 10000
Time (minutes)
Vol
ume
Cha
nge
(cc)
0.00
2.00
4.00
6.00
8.00
10.00
12.00
0.0 10.0 20.0 30.0 40.0
Square root Time (minutes)
Vol
ume
Cha
nge
(cc)
Figure F-2.332
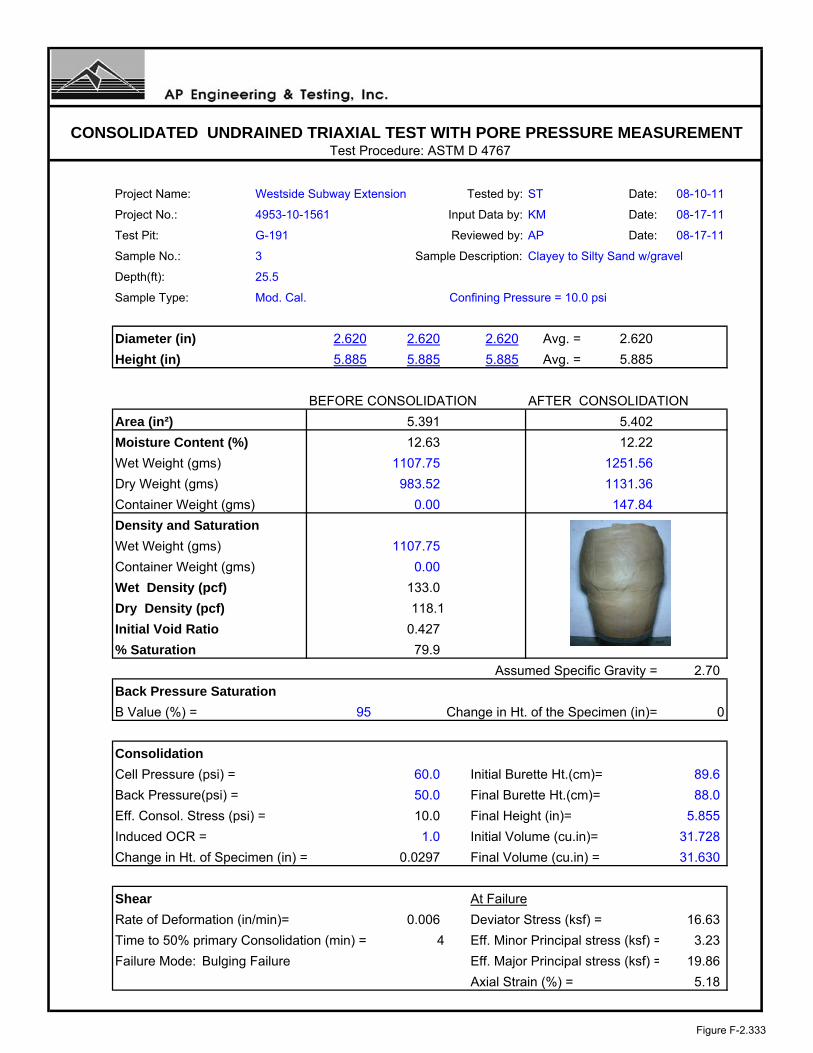
Test Procedure: ASTM D 4767
Project Name: Westside Subway Extension Tested by: ST Date: 08-10-11
Project No.: 4953-10-1561 Input Data by: KM Date: 08-17-11
Test Pit: G-191 Reviewed by: AP Date: 08-17-11
Sample No.: 3 Sample Description: Clayey to Silty Sand w/gravel
Depth(ft): 25.5
Sample Type: Mod. Cal. Confining Pressure = 10.0 psi
Diameter (in) 2.620 2.620 2.620 Avg. = 2.620
Height (in) 5.885 5.885 5.885 Avg. = 5.885
BEFORE CONSOLIDATION AFTER CONSOLIDATION
Area (in²) 5.391 5.402
Moisture Content (%) 12.63 12.22
Wet Weight (gms) 1107.75 1251.56
Dry Weight (gms) 983.52 1131.36
Container Weight (gms) 0.00 147.84
Density and Saturation
Wet Weight (gms) 1107.75
Container Weight (gms) 0.00
Wet Density (pcf) 133.0
Dry Density (pcf) 118.1
Initial Void Ratio 0.427
% Saturation 79.9
Assumed Specific Gravity = 2.70
Back Pressure Saturation
B Value (%) = 95 Change in Ht. of the Specimen (in)= 0
Consolidation
Cell Pressure (psi) = 60.0 Initial Burette Ht.(cm)= 89.6
Back Pressure(psi) = 50.0 Final Burette Ht.(cm)= 88.0
Eff. Consol. Stress (psi) = 10.0 Final Height (in)= 5.855
Induced OCR = 1.0 Initial Volume (cu.in)= 31.728
Change in Ht. of Specimen (in) = 0.0297 Final Volume (cu.in) = 31.630
Shear At Failure
Rate of Deformation (in/min)= 0.006 Deviator Stress (ksf) = 16.63
Time to 50% primary Consolidation (min) = 4 Eff. Minor Principal stress (ksf) = 3.23
Failure Mode: Bulging Failure Eff. Major Principal stress (ksf) = 19.86
Axial Strain (%) = 5.18
CONSOLIDATED UNDRAINED TRIAXIAL TEST WITH PORE PRESSURE MEASUREMENT
Figure F-2.333

Test Procedure: ASTM D 4767
Project Name: Westside Subway Extension Tested by: ST Date: 08-10-11
Project No.: 4953-10-1561 Input Data by: KM Date: 08-17-11
Test Pit: G-191 Reviewed by: AP Date: 08-17-11
Sample No.: 3 Sample Description: Clayey to Silty Sand w/gravel
Depth(ft): 25.5
Sample Type: Mod. Cal. Confining Pressure = 20.0 psi
Diameter (in) 2.620 2.620 2.620 Avg. = 2.620
Height (in) 5.885 5.885 5.885 Avg. = 5.885
BEFORE CONSOLIDATION AFTER CONSOLIDATION
Area (in²) 5.391 5.372
Moisture Content (%) 12.63 12.22
Wet Weight (gms) 1107.75 1251.56
Dry Weight (gms) 983.52 1131.36
Container Weight (gms) 0.00 147.84
Density and Saturation
Wet Weight (gms) 1107.75
Container Weight (gms) 0.00
Wet Density (pcf) 133.0
Dry Density (pcf) 118.1
Initial Void Ratio 0.427
% Saturation 79.9
Assumed Specific Gravity = 2.70
Back Pressure Saturation
B Value (%) = 95 Change in Ht. of the Specimen (in)= 0
Consolidation
Cell Pressure (psi) = 70.0 Initial Burette Ht.(cm)= 88.0
Back Pressure(psi) = 50.0 Final Burette Ht.(cm)= 86.1
Eff. Consol. Stress (psi) = 20.0 Final Height (in)= 5.885
Induced OCR= 1.0 Initial Volume (cu.in)= 31.728
Change in Ht. of Specimen (in) = 0.0000 Final Volume (cu.in) = 31.612
Shear At Failure
Rate of Deformation (in/min)= 0.006 Deviator Stress (ksf) = 26.95
Time to 50% primary Consolidation = 4 Eff. Minor Principal stress (ksf) = 5.82
Failure Mode: Bulging Failure Eff. Major Principal stress (ksf) = 32.77
Axial Strain (%) = 4.99
CONSOLIDATED UNDRAINED TRIAXIAL TEST WITH PORE PRESSURE MEASUREMENT
Figure F-2.334

Test Procedure: ASTM D 4767
Project Name: Westside Subway Extension Tested by: ST Date: 08-10-11
Project No.: Input Data by: KM Date: 08-17-11
Test Pit: G-191 Reviewed by: AP Date: 08-17-11
Sample No.: 3 Sample Description: Clayey to Silty Sand w/gravel
Depth(ft): 25.5
Sample Type: Mod. Cal. Confining Pressure = 30.0 psi
Diameter (in) 2.620 2.620 2.620 Avg. = 2.620
Height (in) 5.885 5.885 5.885 Avg. = 5.885
BEFORE CONSOLIDATION AFTER CONSOLIDATION
Area (in²) 5.391 5.422
Moisture Content (%) 12.63 12.22
Wet Weight (gms) 1107.75 1251.56
Dry Weight (gms) 983.52 1131.36
Container Weight (gms) 0.00 147.84
Density and Saturation
Wet Weight (gms) 1107.75
Container Weight (gms) 0.00
Wet Density (pcf) 133.0
Dry Density (pcf) 118.1
Initial Void Ratio 0.427
% Saturation 79.9
Assumed Specific Gravity = 2.70
Back Pressure Saturation
B Value (%) = 95 Change in Ht. of the Specimen (in)= 0
Consolidation
Cell Pressure (psi) = 80.0 Initial Burette Ht.(cm)= 86.0
Back Pressure(psi) = 50.0 Final Burette Ht.(cm)= 89.0
Eff. Consol. Stress (psi) = 30.0 Final Height (in)= 5.885
Induced OCR = 1.0 Initial Volume (cu.in)= 31.728
Change in Ht. of Specimen (in) = 0.0000 Final Volume (cu.in) = 31.911
Shear At Failure
Rate of Deformation (in/min)= 0.006 Deviator Stress (ksf) = 34.42
Time to 50% primary Consolidation = 4 Eff. Minor Principal stress (ksf) = 7.58
Failure Mode: Bulging Failure Eff. Major Principal stress (ksf) = 41.99
Axial Strain (%) = 4.85
CONSOLIDATED UNDRAINED TRIAXIAL TEST WITH PORE PRESSURE MEASUREMENT
4953-10-1561
Figure F-2.335

Project Name: Westside Subway Extension Cell Pressure: 60.0 psi
Project No: 4953-10-1561 Back Pressure : 50.0 psi
Test Pit: G-191 Consolidation Pressure : 10.0 psi
Depth(ft): 25.5 Initial Sample Height: 5.885 in
Sample No.: 3 Initial Area of Sample: 5.391 sq. in.
Sample Type: Mod. Cal. Final Sample Ht.* (L): 5.855 in
Sample Description: Clayey to Silty Sand w/gravel Final Sample Area (A)*: 5.402 sq. in.
Induced OCR= 1.0
Cell Load Axial Back Deviator Axial Pore Shear Normal
Pressure Deformation Pressure Stress Strain Pressure Stress Stress
Change q' p'
(S1-S3) (S1-S3)/2 (S1'+S3')/2
(psi) (lbs) (in) (psi) (ksf) (%) (ksf) (ksf) (ksf)
60.0 0 0.000 50.1 0.00 0.00 0.00 0.00 1.44
60.0 38 0.003 51.9 1.01 0.06 0.25 0.51 1.69
60.0 55 0.010 53.2 1.46 0.16 0.44 0.73 1.73
60.0 69 0.015 54.0 1.83 0.25 0.57 0.92 1.79
60.0 80 0.021 54.6 2.13 0.35 0.65 1.06 1.85
60.0 91 0.027 55.0 2.41 0.46 0.71 1.21 1.94
60.0 103 0.033 55.3 2.73 0.56 0.74 1.37 2.06
60.0 114 0.038 55.4 3.02 0.65 0.76 1.51 2.18
60.0 126 0.044 55.5 3.33 0.75 0.78 1.67 2.33
60.0 138 0.050 55.5 3.65 0.85 0.78 1.82 2.49
60.0 151 0.056 55.5 3.99 0.95 0.77 1.99 2.66
60.0 165 0.061 55.4 4.35 1.04 0.76 2.18 2.86
60.0 178 0.066 55.2 4.69 1.13 0.74 2.35 3.04
60.0 193 0.072 55.1 5.08 1.22 0.72 2.54 3.26
60.0 207 0.077 54.9 5.45 1.31 0.69 2.72 3.47
60.0 221 0.082 54.7 5.81 1.39 0.66 2.90 3.69
60.0 236 0.088 54.4 6.20 1.50 0.62 3.10 3.92
60.0 250 0.093 54.1 6.56 1.58 0.57 3.28 4.14
60.0 265 0.099 53.8 6.95 1.68 0.53 3.47 4.38
60.0 281 0.104 53.4 7.36 1.77 0.48 3.68 4.64
60.0 295 0.110 53.0 7.72 1.87 0.42 3.86 4.88
60.0 309 0.115 52.6 8.08 1.96 0.37 4.04 5.11
60.0 323 0.120 52.2 8.43 2.06 0.31 4.22 5.35
60.0 335 0.126 51.8 8.74 2.16 0.25 4.37 5.56
60.0 374 0.143 50.5 9.73 2.44 0.05 4.86 6.25
60.0 409 0.160 49.1 10.61 2.73 -0.15 5.30 6.89
60.0 444 0.177 47.6 11.48 3.02 -0.36 5.74 7.54
60.0 477 0.192 46.2 12.30 3.28 -0.56 6.15 8.15
60.0 506 0.207 44.8 13.01 3.54 -0.77 6.51 8.71
60.0 535 0.223 43.4 13.72 3.80 -0.96 6.86 9.26
60.0 562 0.239 42.1 14.37 4.07 -1.15 7.19 9.78
60.0 587 0.256 40.9 14.96 4.37 -1.33 7.48 10.25
60.0 613 0.272 39.8 15.58 4.64 -1.49 7.79 10.72
60.0 637 0.288 38.7 16.14 4.92 -1.64 8.07 11.15
60.0 658 0.303 37.7 16.63 5.18 -1.79 8.32 11.54
CONSOLIDATED UNDRAINED TRIAXIAL TEST WITH PORE PRESSURE MEASUREMENT
Figure F-2.336
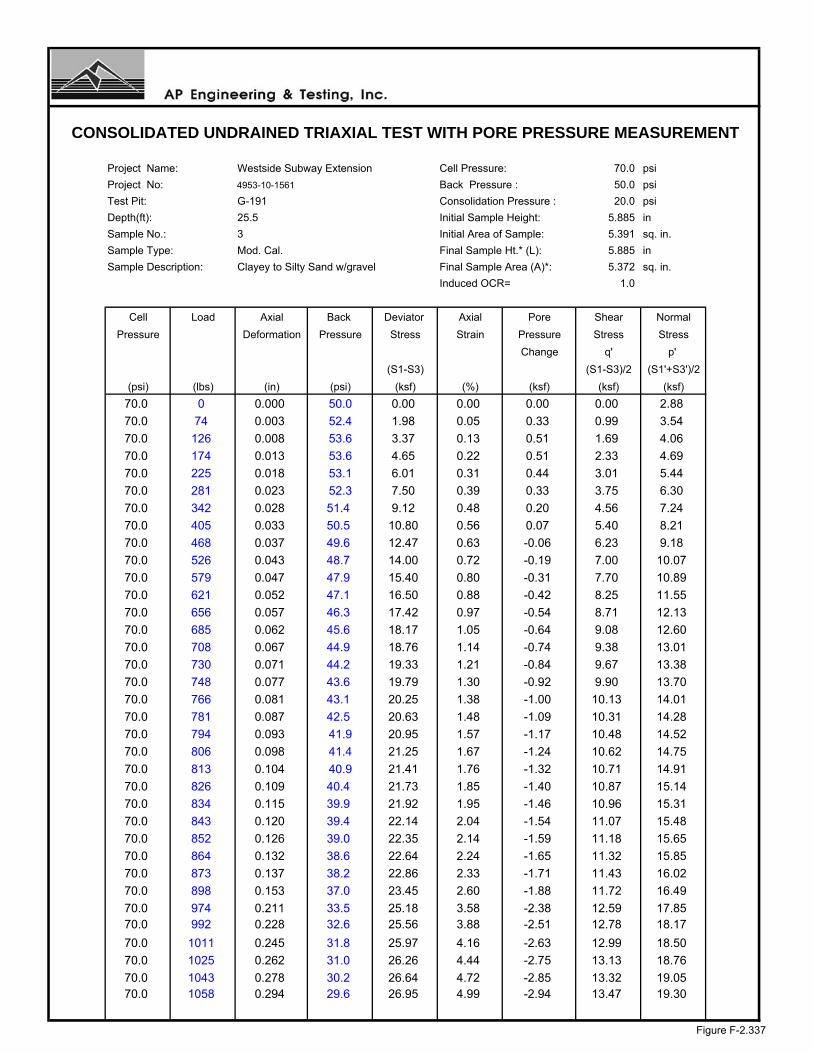
Project Name: Westside Subway Extension Cell Pressure: 70.0 psi
Project No: 4953-10-1561 Back Pressure : 50.0 psi
Test Pit: G-191 Consolidation Pressure : 20.0 psi
Depth(ft): 25.5 Initial Sample Height: 5.885 in
Sample No.: 3 Initial Area of Sample: 5.391 sq. in.
Sample Type: Mod. Cal. Final Sample Ht.* (L): 5.885 in
Sample Description: Clayey to Silty Sand w/gravel Final Sample Area (A)*: 5.372 sq. in.
Induced OCR= 1.0
Cell Load Axial Back Deviator Axial Pore Shear Normal
Pressure Deformation Pressure Stress Strain Pressure Stress Stress
Change q' p'
(S1-S3) (S1-S3)/2 (S1'+S3')/2
(psi) (lbs) (in) (psi) (ksf) (%) (ksf) (ksf) (ksf)
70.0 0 0.000 50.0 0.00 0.00 0.00 0.00 2.88
70.0 74 0.003 52.4 1.98 0.05 0.33 0.99 3.54
70.0 126 0.008 53.6 3.37 0.13 0.51 1.69 4.06
70.0 174 0.013 53.6 4.65 0.22 0.51 2.33 4.69
70.0 225 0.018 53.1 6.01 0.31 0.44 3.01 5.44
70.0 281 0.023 52.3 7.50 0.39 0.33 3.75 6.30
70.0 342 0.028 51.4 9.12 0.48 0.20 4.56 7.24
70.0 405 0.033 50.5 10.80 0.56 0.07 5.40 8.21
70.0 468 0.037 49.6 12.47 0.63 -0.06 6.23 9.18
70.0 526 0.043 48.7 14.00 0.72 -0.19 7.00 10.07
70.0 579 0.047 47.9 15.40 0.80 -0.31 7.70 10.89
70.0 621 0.052 47.1 16.50 0.88 -0.42 8.25 11.55
70.0 656 0.057 46.3 17.42 0.97 -0.54 8.71 12.13
70.0 685 0.062 45.6 18.17 1.05 -0.64 9.08 12.60
70.0 708 0.067 44.9 18.76 1.14 -0.74 9.38 13.01
70.0 730 0.071 44.2 19.33 1.21 -0.84 9.67 13.38
70.0 748 0.077 43.6 19.79 1.30 -0.92 9.90 13.70
70.0 766 0.081 43.1 20.25 1.38 -1.00 10.13 14.01
70.0 781 0.087 42.5 20.63 1.48 -1.09 10.31 14.28
70.0 794 0.093 41.9 20.95 1.57 -1.17 10.48 14.52
70.0 806 0.098 41.4 21.25 1.67 -1.24 10.62 14.75
70.0 813 0.104 40.9 21.41 1.76 -1.32 10.71 14.91
70.0 826 0.109 40.4 21.73 1.85 -1.40 10.87 15.14
70.0 834 0.115 39.9 21.92 1.95 -1.46 10.96 15.31
70.0 843 0.120 39.4 22.14 2.04 -1.54 11.07 15.48
70.0 852 0.126 39.0 22.35 2.14 -1.59 11.18 15.65
70.0 864 0.132 38.6 22.64 2.24 -1.65 11.32 15.85
70.0 873 0.137 38.2 22.86 2.33 -1.71 11.43 16.02
70.0 898 0.153 37.0 23.45 2.60 -1.88 11.72 16.49
70.0 974 0.211 33.5 25.18 3.58 -2.38 12.59 17.8570.0 992 0.228 32.6 25.56 3.88 -2.51 12.78 18.17
70.0 1011 0.245 31.8 25.97 4.16 -2.63 12.99 18.50
70.0 1025 0.262 31.0 26.26 4.44 -2.75 13.13 18.76
70.0 1043 0.278 30.2 26.64 4.72 -2.85 13.32 19.0570.0 1058 0.294 29.6 26.95 4.99 -2.94 13.47 19.30
CONSOLIDATED UNDRAINED TRIAXIAL TEST WITH PORE PRESSURE MEASUREMENT
Figure F-2.337

Project Name: Westside Subway Extension Cell Pressure: 80.0 psi
Project No: 4953-10-1561 Back Pressure : 50.0 psi
Test Pit: G-191 Consolidation Pressure : 30.0 psi
Depth(ft): 25.5 Initial Sample Height: 5.885 in
Sample No.: 3 Initial Area of Sample: 5.391 sq. in.
Sample Type: Mod. Cal. Final Sample Ht.* (L): 5.885 in
Sample Description: Clayey to Silty Sand w/gravel Final Sample Area (A)*: 5.422 sq. in.
Induced OCR= 1.0
Cell Load Axial Back Deviator Axial Pore Shear Normal
Pressure Deformation Pressure Stress Strain Pressure Stress Stress
Change q' p'
(S1-S3) (S1-S3)/2 (S1'+S3')/2
(psi) (lbs) (in) (psi) (ksf) (%) (ksf) (ksf) (ksf)
80.0 0 0.000 50.0 0.00 0.00 0.00 0.00 4.32
80.0 148 0.006 53.3 3.93 0.10 0.47 1.96 5.81
80.0 257 0.012 53.5 6.81 0.20 0.50 3.41 7.23
80.0 339 0.018 52.5 8.98 0.31 0.36 4.49 8.45
80.0 442 0.024 50.9 11.69 0.41 0.13 5.85 10.04
80.0 552 0.030 49.1 14.58 0.51 -0.13 7.29 11.74
80.0 662 0.036 47.3 17.47 0.61 -0.38 8.74 13.44
80.0 771 0.042 45.6 20.33 0.71 -0.63 10.16 15.12
80.0 872 0.048 43.9 22.97 0.82 -0.88 11.48 16.69
80.0 946 0.054 42.4 24.89 0.92 -1.09 12.45 17.86
80.0 1000 0.060 41.2 26.29 1.02 -1.27 13.14 18.74
80.0 1140 0.090 36.6 29.81 1.53 -1.94 14.91 21.16
80.0 1161 0.100 35.7 30.31 1.70 -2.05 15.15 21.53
80.0 1249 0.156 32.1 32.29 2.65 -2.57 16.14 23.04
80.0 1301 0.197 30.2 33.40 3.34 -2.86 16.70 23.88
80.0 1337 0.242 28.5 34.05 4.11 -3.10 17.02 24.44
80.0 1362 0.285 27.4 34.42 4.85 -3.26 17.21 24.79
80.0 1378 0.327 26.6 34.56 5.56 -3.37 17.28 24.97
80.0 1395 0.374 26.0 34.69 6.35 -3.46 17.35 25.13
80.0 1411 0.417 25.5 34.82 7.09 -3.53 17.41 25.25
80.0 1426 0.459 24.9 34.92 7.80 -3.61 17.46 25.39
80.0 1434 0.506 24.5 34.81 8.60 -3.68 17.40 25.40
80.0 1435 0.549 24.2 34.55 9.33 -3.71 17.28 25.31
80.0 1439 0.593 24.1 34.36 10.07 -3.74 17.18 25.24
80.0 1459 0.639 24.0 34.54 10.85 -3.75 17.27 25.34
80.0 1474 0.682 23.9 34.61 11.58 -3.76 17.31 25.38
80.0 1497 0.726 23.8 34.85 12.33 -3.77 17.43 25.52
80.0 1513 0.771 23.7 34.92 13.10 -3.78 17.46 25.56
80.0 1526 0.813 23.6 34.93 13.81 -3.80 17.46 25.59
80.0 1543 0.858 23.5 35.00 14.57 -3.82 17.50 25.6480.0 1546 0.902 23.4 34.76 15.33 -3.83 17.38 25.53
80.0 1561 0.990 23.3 34.48 16.82 -3.84 17.24 25.40
80.0 1601 1.121 23.4 34.42 19.05 -3.83 17.21 25.35
80.0 1613 1.165 23.5 34.36 19.79 -3.81 17.18 25.31
80.0 1611 1.208 24.2 34.00 20.52 -3.72 17.00 25.04
CONSOLIDATED UNDRAINED TRIAXIAL TEST WITH PORE PRESSURE MEASUREMENT
Figure F-2.338

LEGEND: CONFINING PRESSURES= ○ 10 psi □ 20 psi ∆ 30 psi
Project Name: Westside Subway Extension Sample Type: Mod. Cal.
Project No.: 4953-10-1561 Sample Description: Clayey to Silty Sand w/gravel
Test Pit: G-191 Avg. Dry Unit Weight (pcf): 118.1
Sample No.: 3 Avg. Initial Moisture Content (%): 12.6
Depth (ft): 25.5 Confining Pressure: 10.0, 20.0, 30.0 psi
CU TRIAXIAL MULTI-STAGE TEST WITH PORE PRESSURE MEASUREMENTASTM D 4767
0
5
10
15
20
25
30
0 5 10 15 20 25 30 35 40 45 50 55 60
NORMAL STRESS, P' (ksf)
SH
EA
R S
TR
ES
S, q
' (ks
f)
0.0
5.0
10.0
15.0
20.0
25.0
30.0
35.0
40.0
0.0 5.0 10.0 15.0 20.0
AXIAL STRAIN (Percent)
DE
VIA
TO
R S
TR
ES
S (
ksf)
-4.0
-3.0
-2.0
-1.0
0.0
1.0
2.0
3.0
4.0
0.0 5.0 10.0 15.0 20.0
AXIAL STRAIN (Percent)C
HA
NG
E I
N P
OR
E W
AT
ER
PR
ES
SU
RE
(ks
f)
Figure F-2.339
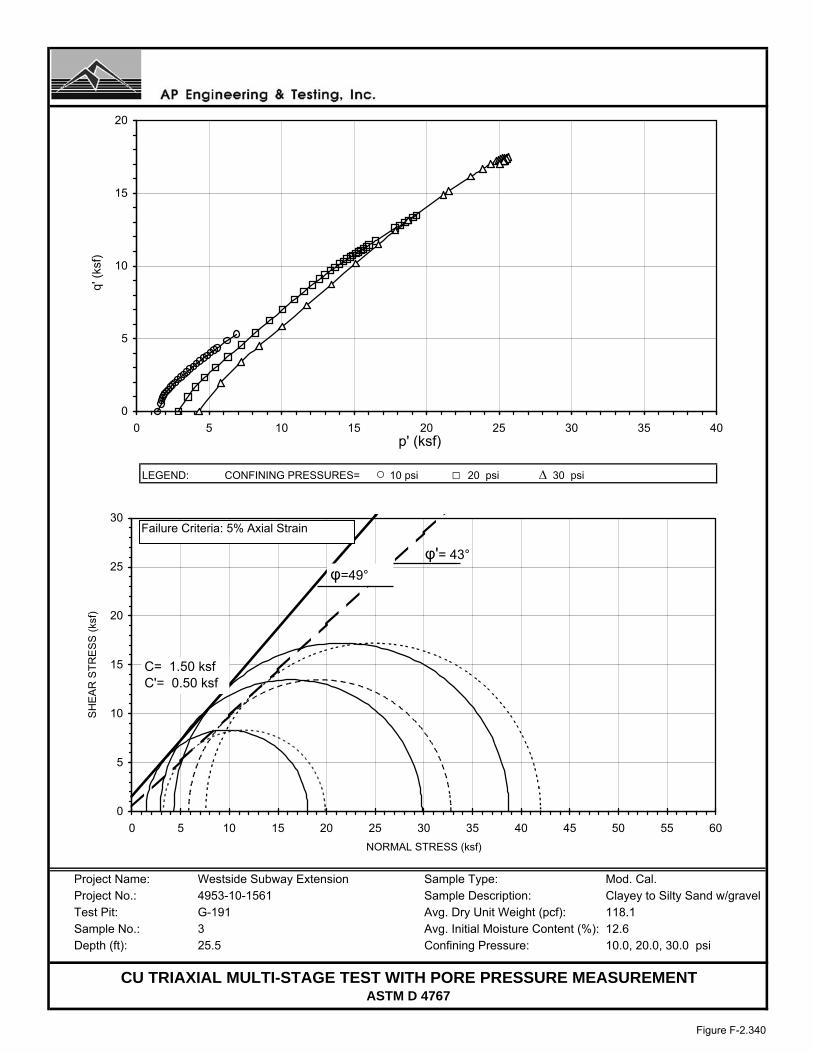
LEGEND: CONFINING PRESSURES= ○ 10 psi □ 20 psi ∆ 30 psi
Project Name: Westside Subway Extension Sample Type: Mod. Cal.Project No.: 4953-10-1561 Sample Description: Clayey to Silty Sand w/gravelTest Pit: G-191 Avg. Dry Unit Weight (pcf): 118.1Sample No.: 3 Avg. Initial Moisture Content (%): 12.6Depth (ft): 25.5 Confining Pressure: 10.0, 20.0, 30.0 psi
CU TRIAXIAL MULTI-STAGE TEST WITH PORE PRESSURE MEASUREMENTASTM D 4767
0
5
10
15
20
25
30
0 5 10 15 20 25 30 35 40 45 50 55 60
NORMAL STRESS (ksf)
SH
EA
R S
TR
ES
S (
ksf)
φ=49°
φ'= 43°
0
5
10
15
20
0 5 10 15 20 25 30 35 40 p' (ksf)
q' (
ksf)
C= 1.50 ksfC'= 0.50 ksf
Failure Criteria: 5% Axial Strain
Figure F-2.340

Test Pit: G-191 Sample Type: Mod. Cal.Sample No.: 3 Soil Description: Clayey to Silty Sand w/gravelDepth (feet): 25.5 Eff. Confining Pressure (psi): 20.0
Project Name: Westside Subway ExtensionProject No.: 4953-10-1561Date: 08/10/11
1.70001.70001.70001.8000
1.70001.70001.8000
1.9000
ASTM D 2435
1.90001.90001.9000
10.954515.491921.9089
1200 1.9000
1.90007.7460
2.00001.8000
TIME RATE CONSOLIDATION CURVE
1.90001.90001.9000
1.90001.9000
4
1.9000
1.80001.90001.90001.9000
0.0000
3.00003.87305.4772
0.31620.50000.70711.00001.4142
1.70001.6000
Time (minutes) Volume Change (cc)0.00001.6000
00.1
SQRT Time (minutes) Volume Change (cc)0.0000
0.250.512
9153060
120240480
34.6410 1.9000
0.00
1.00
2.00
3.00
4.00
5.00
0.1 1 10 100 1000 10000
Time (minutes)
Vol
ume
Cha
nge
(cc)
0.00
1.00
2.00
3.00
4.00
5.00
0.0 10.0 20.0 30.0 40.0
Square root Time (minutes)
Vol
ume
Cha
nge
(cc)
Figure F-2.341

Test Procedure: ASTM D 4767
Project Name: Westside Subway Extension Tested by: ST Date: 08-13-11
Project No.: 4953-10-1561 Input Data by: KM Date: 08-17-11
Test Pit: G-199 Reviewed by: AP Date: 08-17-11
Sample No.: 7 Sample Description: Clayey Silty Sand w/ gravel
Depth(ft): 40
Sample Type: Mod. Cal. Confining Pressure = 20.0 psi
Diameter (in) 2.604 2.604 2.604 Avg. = 2.604
Height (in) 5.809 5.809 5.809 Avg. = 5.809
BEFORE CONSOLIDATION AFTER CONSOLIDATION
Area (in²) 5.326 5.294
Moisture Content (%) 9.48 10.89
Wet Weight (gms) 1155.39 1350.83
Dry Weight (gms) 1055.35 1235.94
Container Weight (gms) 0.00 180.59
Density and Saturation
Wet Weight (gms) 1155.39
Container Weight (gms) 0.00
Wet Density (pcf) 142.3
Dry Density (pcf) 130.0
Initial Void Ratio 0.296
% Saturation 86.3
Assumed Specific Gravity = 2.70
Back Pressure Saturation
B Value (%) = 94 Change in Ht. of the Specimen (in)= 0
Consolidation
Cell Pressure (psi) = 60.0 Initial Burette Ht.(cm)= 65.3
Back Pressure(psi) = 40.0 Final Burette Ht.(cm)= 59.8
Eff. Consol. Stress (psi) = 20.0 Final Height (in)= 5.780
Induced OCR = 1.0 Initial Volume (cu.in)= 30.937
Change in Ht. of Specimen (in) = 0.0291 Final Volume (cu.in) = 30.601
Shear At Failure
Rate of Deformation (in/min)= 0.006 Deviator Stress (ksf) = 12.50
Time to 50% primary Consolidation (min) = 4 Eff. Minor Principal stress (ksf) = 3.21
Failure Mode: Bulging Failure Eff. Major Principal stress (ksf) = 15.70
Axial Strain (%) = 5.26
CONSOLIDATED UNDRAINED TRIAXIAL TEST WITH PORE PRESSURE MEASUREMENT
Figure F-2.342

Test Procedure: ASTM D 4767
Project Name: Westside Subway Extension Tested by: ST Date: 08-13-11
Project No.: 4953-10-1561 Input Data by: KM Date: 08-17-11
Test Pit: G-199 Reviewed by: AP Date: 08-17-11
Sample No.: 7 Sample Description: Clayey Silty Sand w/ gravel
Depth(ft): 40
Sample Type: Mod. Cal. Confining Pressure = 35.0 psi
Diameter (in) 2.604 2.604 2.604 Avg. = 2.604
Height (in) 5.809 5.809 5.809 Avg. = 5.809
BEFORE CONSOLIDATION AFTER CONSOLIDATION
Area (in²) 5.326 5.285
Moisture Content (%) 9.48 10.89
Wet Weight (gms) 1155.39 1350.83
Dry Weight (gms) 1055.35 1235.94
Container Weight (gms) 0.00 180.59
Density and Saturation
Wet Weight (gms) 1155.39
Container Weight (gms) 0.00
Wet Density (pcf) 142.3
Dry Density (pcf) 130.0
Initial Void Ratio 0.296
% Saturation 86.3
Assumed Specific Gravity = 2.70
Back Pressure Saturation
B Value (%) = 94 Change in Ht. of the Specimen (in)= 0
Consolidation
Cell Pressure (psi) = 75.0 Initial Burette Ht.(cm)= 59.8
Back Pressure(psi) = 40.0 Final Burette Ht.(cm)= 55.9
Eff. Consol. Stress (psi) = 35.0 Final Height (in)= 5.809
Induced OCR= 1.0 Initial Volume (cu.in)= 30.937
Change in Ht. of Specimen (in) = 0.0000 Final Volume (cu.in) = 30.699
Shear At Failure
Rate of Deformation (in/min)= 0.006 Deviator Stress (ksf) = 20.67
Time to 50% primary Consolidation = 4 Eff. Minor Principal stress (ksf) = 5.29
Failure Mode: Bulging Failure Eff. Major Principal stress (ksf) = 25.96
Axial Strain (%) = 5.19
CONSOLIDATED UNDRAINED TRIAXIAL TEST WITH PORE PRESSURE MEASUREMENT
Figure F-2.343

Test Procedure: ASTM D 4767
Project Name: Westside Subway Extension Tested by: ST Date: 08-13-11
Project No.: Input Data by: KM Date: 08-17-11
Test Pit: G-199 Reviewed by: AP Date: 08-17-11
Sample No.: 7 Sample Description: Clayey Silty Sand w/ gravel
Depth(ft): 40
Sample Type: Mod. Cal. Confining Pressure = 50.0 psi
Diameter (in) 2.604 2.604 2.604 Avg. = 2.604
Height (in) 5.809 5.809 5.809 Avg. = 5.809
BEFORE CONSOLIDATION AFTER CONSOLIDATION
Area (in²) 5.326 5.290
Moisture Content (%) 9.48 10.89
Wet Weight (gms) 1155.39 1350.83
Dry Weight (gms) 1055.35 1235.94
Container Weight (gms) 0.00 180.59
Density and Saturation
Wet Weight (gms) 1155.39
Container Weight (gms) 0.00
Wet Density (pcf) 142.3
Dry Density (pcf) 130.0
Initial Void Ratio 0.296
% Saturation 86.3
Assumed Specific Gravity = 2.70
Back Pressure Saturation
B Value (%) = 94 Change in Ht. of the Specimen (in)= 0
Consolidation
Cell Pressure (psi) = 90.0 Initial Burette Ht.(cm)= 55.9
Back Pressure(psi) = 40.0 Final Burette Ht.(cm)= 52.5
Eff. Consol. Stress (psi) = 50.0 Final Height (in)= 5.809
Induced OCR = 1.0 Initial Volume (cu.in)= 30.937
Change in Ht. of Specimen (in) = 0.0000 Final Volume (cu.in) = 30.729
Shear At Failure
Rate of Deformation (in/min)= 0.006 Deviator Stress (ksf) = 26.79
Time to 50% primary Consolidation = 4 Eff. Minor Principal stress (ksf) = 7.44
Failure Mode: Bulging Failure Eff. Major Principal stress (ksf) = 34.23
Axial Strain (%) = 5.48
CONSOLIDATED UNDRAINED TRIAXIAL TEST WITH PORE PRESSURE MEASUREMENT
4953-10-1561
Figure F-2.344

Project Name: Westside Subway Extension Cell Pressure: 60.0 psi
Project No: 4953-10-1561 Back Pressure : 40.0 psi
Test Pit: G-199 Consolidation Pressure : 20.0 psi
Depth(ft): 40 Initial Sample Height: 5.809 in
Sample No.: 7 Initial Area of Sample: 5.326 sq. in.
Sample Type: Mod. Cal. Final Sample Ht.* (L): 5.780 in
Sample Description: Clayey Silty Sand w/ gravel Final Sample Area (A)*: 5.294 sq. in.
Induced OCR= 1.0
Cell Load Axial Back Deviator Axial Pore Shear Normal
Pressure Deformation Pressure Stress Strain Pressure Stress Stress
Change q' p'
(S1-S3) (S1-S3)/2 (S1'+S3')/2
(psi) (lbs) (in) (psi) (ksf) (%) (ksf) (ksf) (ksf)
60.0 0 0.000 40.0 0.00 0.00 0.00 0.00 2.88
60.0 32 0.004 41.1 0.87 0.07 0.16 0.43 3.15
60.0 56 0.010 42.7 1.52 0.17 0.39 0.76 3.25
60.0 83 0.015 44.7 2.25 0.26 0.67 1.13 3.33
60.0 109 0.020 46.3 2.95 0.35 0.91 1.48 3.44
60.0 132 0.026 47.5 3.57 0.44 1.09 1.79 3.58
60.0 153 0.031 48.4 4.14 0.53 1.21 2.07 3.74
60.0 174 0.037 49.0 4.70 0.63 1.29 2.35 3.94
60.0 194 0.041 49.3 5.24 0.71 1.34 2.62 4.16
60.0 215 0.047 49.5 5.80 0.81 1.37 2.90 4.41
60.0 233 0.052 49.5 6.28 0.90 1.37 3.14 4.65
60.0 251 0.058 49.3 6.76 1.00 1.35 3.38 4.91
60.0 267 0.063 49.1 7.18 1.08 1.31 3.59 5.16
60.0 283 0.068 48.8 7.61 1.17 1.26 3.80 5.42
60.0 296 0.074 48.4 7.95 1.27 1.21 3.97 5.65
60.0 309 0.079 47.9 8.29 1.36 1.14 4.15 5.88
60.0 320 0.084 47.5 8.58 1.45 1.08 4.29 6.09
60.0 330 0.090 47.0 8.84 1.55 1.01 4.42 6.29
60.0 339 0.095 46.5 9.07 1.65 0.94 4.53 6.47
60.0 348 0.101 46.1 9.30 1.74 0.88 4.65 6.65
60.0 355 0.106 45.6 9.48 1.83 0.81 4.74 6.81
60.0 362 0.112 45.2 9.66 1.93 0.75 4.83 6.96
60.0 369 0.117 44.8 9.83 2.03 0.69 4.92 7.10
60.0 374 0.123 44.4 9.96 2.12 0.64 4.98 7.22
60.0 390 0.140 43.4 10.35 2.42 0.48 5.18 7.57
60.0 403 0.157 42.4 10.66 2.72 0.35 5.33 7.86
60.0 414 0.174 41.6 10.92 3.02 0.23 5.46 8.11
60.0 425 0.191 40.9 11.18 3.31 0.13 5.59 8.33
60.0 436 0.208 40.3 11.43 3.59 0.04 5.72 8.56
60.0 446 0.225 39.7 11.66 3.89 -0.04 5.83 8.75
60.0 454 0.242 39.2 11.83 4.18 -0.11 5.92 8.91
60.0 463 0.259 38.8 12.03 4.48 -0.17 6.01 9.07
60.0 472 0.276 38.4 12.23 4.77 -0.23 6.11 9.22
60.0 480 0.293 38.0 12.39 5.07 -0.29 6.20 9.36
60.0 485 0.304 37.7 12.50 5.26 -0.33 6.25 9.45
CONSOLIDATED UNDRAINED TRIAXIAL TEST WITH PORE PRESSURE MEASUREMENT
Figure F-2.345

Project Name: Westside Subway Extension Cell Pressure: 75.0 psi
Project No: 4953-10-1561 Back Pressure : 40.0 psi
Test Pit: G-199 Consolidation Pressure : 35.0 psi
Depth(ft): 40 Initial Sample Height: 5.809 in
Sample No.: 7 Initial Area of Sample: 5.326 sq. in.
Sample Type: Mod. Cal. Final Sample Ht.* (L): 5.809 in
Sample Description: Clayey Silty Sand w/ gravel Final Sample Area (A)*: 5.285 sq. in.
Induced OCR= 1.0
Cell Load Axial Back Deviator Axial Pore Shear Normal
Pressure Deformation Pressure Stress Strain Pressure Stress Stress
Change q' p'
(S1-S3) (S1-S3)/2 (S1'+S3')/2
(psi) (lbs) (in) (psi) (ksf) (%) (ksf) (ksf) (ksf)
75.0 2 0.000 40.0 0.05 0.00 0.00 0.03 5.07
75.0 92 0.002 42.7 2.51 0.03 0.38 1.25 5.92
75.0 166 0.006 45.2 4.52 0.11 0.75 2.26 6.55
75.0 226 0.011 46.9 6.15 0.19 0.98 3.07 7.13
75.0 282 0.017 47.7 7.66 0.29 1.10 3.83 7.77
75.0 335 0.022 48.0 9.09 0.37 1.14 4.55 8.45
75.0 388 0.026 48.0 10.52 0.45 1.14 5.26 9.16
75.0 438 0.031 47.8 11.87 0.53 1.11 5.94 9.86
75.0 483 0.036 47.5 13.08 0.61 1.07 6.54 10.51
75.0 523 0.040 47.2 14.15 0.70 1.03 7.08 11.09
75.0 555 0.046 46.8 15.00 0.78 0.98 7.50 11.56
75.0 581 0.050 46.4 15.69 0.87 0.92 7.85 11.97
75.0 601 0.056 46.1 16.22 0.97 0.87 8.11 12.28
75.0 616 0.062 45.7 16.61 1.07 0.82 8.30 12.52
75.0 629 0.067 45.4 16.94 1.15 0.77 8.47 12.74
75.0 640 0.073 45.0 17.22 1.25 0.72 8.61 12.93
75.0 649 0.078 44.7 17.45 1.34 0.67 8.72 13.09
75.0 657 0.084 44.4 17.64 1.44 0.63 8.82 13.24
75.0 664 0.090 44.1 17.81 1.55 0.59 8.91 13.36
75.0 676 0.101 43.5 18.10 1.73 0.51 9.05 13.59
75.0 696 0.124 42.7 18.56 2.13 0.38 9.28 13.94
75.0 721 0.156 41.5 19.12 2.69 0.21 9.56 14.39
75.0 729 0.167 41.2 19.29 2.88 0.17 9.65 14.52
75.0 738 0.178 40.9 19.49 3.06 0.12 9.75 14.66
75.0 745 0.190 40.6 19.64 3.26 0.08 9.82 14.78
75.0 750 0.201 40.3 19.73 3.45 0.04 9.87 14.86
75.0 753 0.212 40.1 19.77 3.65 0.00 9.88 14.92
75.0 759 0.223 39.8 19.89 3.84 -0.03 9.94 15.02
75.0 765 0.235 39.6 20.00 4.04 -0.07 10.00 15.11
75.0 771 0.246 39.3 20.12 4.23 -0.10 10.06 15.2075.0 775 0.257 39.1 20.18 4.43 -0.13 10.09 15.26
75.0 781 0.268 38.9 20.30 4.61 -0.16 10.15 15.35
75.0 788 0.279 38.7 20.44 4.80 -0.19 10.22 15.45
75.0 793 0.290 38.5 20.53 4.99 -0.22 10.26 15.5375.0 800 0.301 38.3 20.67 5.19 -0.25 10.33 15.62
CONSOLIDATED UNDRAINED TRIAXIAL TEST WITH PORE PRESSURE MEASUREMENT
Figure F-2.346

Project Name: Westside Subway Extension Cell Pressure: 90.0 psi
Project No: 4953-10-1561 Back Pressure : 40.0 psi
Test Pit: G-199 Consolidation Pressure : 50.0 psi
Depth(ft): 40 Initial Sample Height: 5.809 in
Sample No.: 7 Initial Area of Sample: 5.326 sq. in.
Sample Type: Mod. Cal. Final Sample Ht.* (L): 5.809 in
Sample Description: Clayey Silty Sand w/ gravel Final Sample Area (A)*: 5.290 sq. in.
Induced OCR= 1.0
Cell Load Axial Back Deviator Axial Pore Shear Normal
Pressure Deformation Pressure Stress Strain Pressure Stress Stress
Change q' p'
(S1-S3) (S1-S3)/2 (S1'+S3')/2
(psi) (lbs) (in) (psi) (ksf) (%) (ksf) (ksf) (ksf)
90.0 0 0.000 40.0 0.00 0.00 0.00 0.00 7.20
90.0 525 0.030 51.3 14.21 0.51 1.62 7.11 12.69
90.0 826 0.062 48.0 22.25 1.07 1.15 11.13 17.17
90.0 899 0.098 45.1 24.06 1.68 0.73 12.03 18.50
90.0 931 0.135 43.2 24.74 2.33 0.46 12.37 19.11
90.0 959 0.172 42.0 25.32 2.96 0.28 12.66 19.58
90.0 981 0.207 40.9 25.75 3.57 0.14 12.88 19.94
90.0 1001 0.246 40.0 26.09 4.24 0.00 13.04 20.25
90.0 1021 0.282 39.1 26.43 4.86 -0.13 13.22 20.54
90.0 1041 0.318 38.3 26.79 5.48 -0.24 13.40 20.84
90.0 1060 0.357 37.6 27.09 6.14 -0.34 13.54 21.09
90.0 1073 0.394 36.9 27.22 6.79 -0.44 13.61 21.25
90.0 1084 0.430 36.2 27.31 7.41 -0.55 13.66 21.41
90.0 1103 0.466 35.5 27.60 8.03 -0.64 13.80 21.65
90.0 1117 0.504 34.8 27.77 8.68 -0.74 13.88 21.83
90.0 1132 0.540 34.2 27.95 9.30 -0.84 13.98 22.01
90.0 1150 0.576 33.5 28.21 9.91 -0.94 14.10 22.25
90.0 1166 0.613 32.7 28.38 10.56 -1.05 14.19 22.44
90.0 1178 0.651 32.0 28.48 11.21 -1.15 14.24 22.59
90.0 1192 0.687 31.3 28.60 11.82 -1.26 14.30 22.76
90.0 1206 0.723 30.7 28.74 12.45 -1.34 14.37 22.91
90.0 1220 0.760 30.1 28.87 13.09 -1.43 14.44 23.06
90.0 1237 0.796 29.6 29.05 13.71 -1.50 14.52 23.23
90.0 1253 0.831 29.2 29.23 14.30 -1.56 14.61 23.37
90.0 1265 0.868 28.6 29.30 14.94 -1.65 14.65 23.50
90.0 1279 0.905 28.0 29.39 15.58 -1.72 14.69 23.62
90.0 1292 0.941 27.5 29.49 16.19 -1.80 14.74 23.75
90.0 1307 0.977 26.9 29.59 16.81 -1.89 14.80 23.88
90.0 1319 1.014 26.4 29.65 17.45 -1.96 14.82 23.98
90.0 1334 1.049 25.9 29.75 18.06 -2.03 14.88 24.1190.0 1351 1.084 25.5 29.91 18.66 -2.08 14.96 24.24
90.0 1361 1.121 25.0 29.89 19.30 -2.16 14.95 24.30
90.0 1377 1.158 24.5 30.01 19.93 -2.24 15.01 24.44
90.0 1391 1.192 24.0 30.08 20.52 -2.31 15.04 24.55
90.0 1408 1.229 23.7 30.21 21.15 -2.34 15.11 24.65
CONSOLIDATED UNDRAINED TRIAXIAL TEST WITH PORE PRESSURE MEASUREMENT
Figure F-2.347

LEGEND: CONFINING PRESSURES= ○ 20 psi □ 35 psi ∆ 50 psi
Project Name: Westside Subway Extension Sample Type: Mod. Cal.
Project No.: 4953-10-1561 Sample Description: Clayey Silty Sand w/ gravel
Test Pit: G-199 Avg. Dry Unit Weight (pcf): 130.0
Sample No.: 7 Avg. Initial Moisture Content (%): 9.5
Depth (ft): 40 Confining Pressure: 20.0, 35.0, 50.0 psi
CU TRIAXIAL MULTI-STAGE TEST WITH PORE PRESSURE MEASUREMENTASTM D 4767
0
5
10
15
20
0 5 10 15 20 25 30 35 40
NORMAL STRESS, P' (ksf)
SH
EA
R S
TR
ES
S, q
' (ks
f)
0.0
5.0
10.0
15.0
20.0
25.0
30.0
35.0
40.0
0.0 5.0 10.0 15.0 20.0
AXIAL STRAIN (Percent)
DE
VIA
TO
R S
TR
ES
S (
ksf)
-4.0
-3.0
-2.0
-1.0
0.0
1.0
2.0
3.0
4.0
0.0 5.0 10.0 15.0 20.0
AXIAL STRAIN (Percent)C
HA
NG
E I
N P
OR
E W
AT
ER
PR
ES
SU
RE
(ks
f)
Figure F-2.348
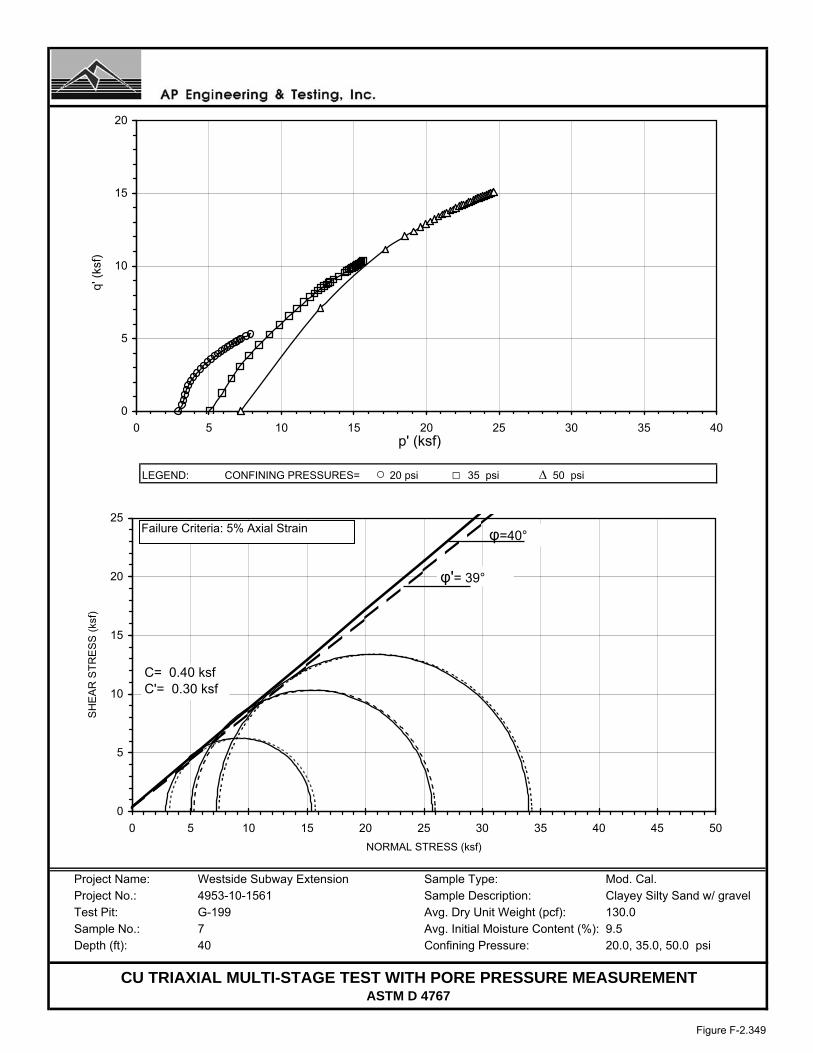
LEGEND: CONFINING PRESSURES= ○ 20 psi □ 35 psi ∆ 50 psi
Project Name: Westside Subway Extension Sample Type: Mod. Cal.Project No.: 4953-10-1561 Sample Description: Clayey Silty Sand w/ gravelTest Pit: G-199 Avg. Dry Unit Weight (pcf): 130.0Sample No.: 7 Avg. Initial Moisture Content (%): 9.5Depth (ft): 40 Confining Pressure: 20.0, 35.0, 50.0 psi
CU TRIAXIAL MULTI-STAGE TEST WITH PORE PRESSURE MEASUREMENTASTM D 4767
0
5
10
15
20
25
0 5 10 15 20 25 30 35 40 45 50
NORMAL STRESS (ksf)
SH
EA
R S
TR
ES
S (
ksf)
φ=40°
φ'= 39°
0
5
10
15
20
0 5 10 15 20 25 30 35 40 p' (ksf)
q' (
ksf)
C= 0.40 ksfC'= 0.30 ksf
Failure Criteria: 5% Axial Strain
Figure F-2.349

Test Pit: G-199 Sample Type: Mod. Cal.Sample No.: 7 Soil Description: Clayey Silty Sand w/ gravelDepth (feet): 40 Eff. Confining Pressure (psi): 35.0
Project Name: Westside Subway ExtensionProject No.: 4953-10-1561Date: 08/13/11
4.1100
120240420
37.9473
8153060
0.250.512
0.7000
Time (minutes) Volume Change (cc)0.00000.7000
00.1
SQRT Time (minutes) Volume Change (cc)0.0000 0.0000
2.82843.87305.4772
0.31620.50000.70711.00001.4142
0.9000
3.8100
3.00003.40003.62003.7000
7.7460
2.00003.0000
TIME RATE CONSOLIDATION CURVE
3.62003.70003.8100
4.00004.0700
4
ASTM D 2435
3.90004.00004.0700
10.954515.491920.4939
1440 4.1100
3.9000
1.30002.00002.5000
3.4000
0.90001.30002.00002.5000
0.00
0.50
1.00
1.50
2.00
2.50
3.00
3.50
4.00
4.50
0.1 1 10 100 1000 10000
Time (minutes)
Vol
ume
Cha
nge
(cc)
0.00
2.00
4.00
6.00
8.00
10.00
12.00
0.0 10.0 20.0 30.0 40.0
Square root Time (minutes)
Vol
ume
Cha
nge
(cc)
Figure F-2.350

Test Procedure: ASTM D 4767
Project Name: Westside Subway Extension Tested by: ST Date: 08-14-11
Project No.: 4953-10-1561 Input Data by: KM Date: 08-18-11
Test Pit: G-199 Reviewed by: AP Date: 08-18-11
Sample No.: 9 Sample Description: Silty Sand with gravel
Depth(ft): 60
Sample Type: Mod. Cal. Confining Pressure = 30.0 psi
Diameter (in) 2.615 2.615 2.615 Avg. = 2.615
Height (in) 5.675 5.675 5.675 Avg. = 5.675
BEFORE CONSOLIDATION AFTER CONSOLIDATION
Area (in²) 5.371 5.373
Moisture Content (%) 11.99 11.96
Wet Weight (gms) 1136.20 1317.25
Dry Weight (gms) 1014.55 1195.93
Container Weight (gms) 0.00 181.38
Density and Saturation
Wet Weight (gms) 1136.20
Container Weight (gms) 0.00
Wet Density (pcf) 142.0
Dry Density (pcf) 126.8
Initial Void Ratio 0.329
% Saturation 98.5
Assumed Specific Gravity = 2.70
Back Pressure Saturation
B Value (%) = 95 Change in Ht. of the Specimen (in)= 0
Consolidation
Cell Pressure (psi) = 60.0 Initial Burette Ht.(cm)= 54.0
Back Pressure(psi) = 30.0 Final Burette Ht.(cm)= 50.3
Eff. Consol. Stress (psi) = 30.0 Final Height (in)= 5.630
Induced OCR = 1.0 Initial Volume (cu.in)= 30.479
Change in Ht. of Specimen (in) = 0.0448 Final Volume (cu.in) = 30.253
Shear At Failure
Rate of Deformation (in/min)= 0.008 Deviator Stress (ksf) = 17.11
Time to 50% primary Consolidation (min) = 3 Eff. Minor Principal stress (ksf) = 3.59
Failure Mode: Bulging Failure Eff. Major Principal stress (ksf) = 20.70
Axial Strain (%) = 5.24
CONSOLIDATED UNDRAINED TRIAXIAL TEST WITH PORE PRESSURE MEASUREMENT
Figure F-2.351

Test Procedure: ASTM D 4767
Project Name: Westside Subway Extension Tested by: ST Date: 08-14-11
Project No.: 4953-10-1561 Input Data by: KM Date: 08-18-11
Test Pit: G-199 Reviewed by: AP Date: 08-18-11
Sample No.: 9 Sample Description: Silty Sand with gravel
Depth(ft): 60
Sample Type: Mod. Cal. Confining Pressure = 45.0 psi
Diameter (in) 2.615 2.615 2.615 Avg. = 2.615
Height (in) 5.675 5.675 5.675 Avg. = 5.675
BEFORE CONSOLIDATION AFTER CONSOLIDATION
Area (in²) 5.371 5.611
Moisture Content (%) 11.99 11.96
Wet Weight (gms) 1136.20 1317.25
Dry Weight (gms) 1014.55 1195.93
Container Weight (gms) 0.00 181.38
Density and Saturation
Wet Weight (gms) 1136.20
Container Weight (gms) 0.00
Wet Density (pcf) 142.0
Dry Density (pcf) 126.8
Initial Void Ratio 0.329
% Saturation 98.5
Assumed Specific Gravity = 2.70
Back Pressure Saturation
B Value (%) = 95 Change in Ht. of the Specimen (in)= 0
Consolidation
Cell Pressure (psi) = 75.0 Initial Burette Ht.(cm)= 50.3
Back Pressure(psi) = 30.0 Final Burette Ht.(cm)= 45.3
Eff. Consol. Stress (psi) = 45.0 Final Height (in)= 5.675
Induced OCR= 1.0 Initial Volume (cu.in)= 30.479
Change in Ht. of Specimen (in) = 0.0000 Final Volume (cu.in) = 30.174
Shear At Failure
Rate of Deformation (in/min)= 0.008 Deviator Stress (ksf) = 28.02
Time to 50% primary Consolidation = 3 Eff. Minor Principal stress (ksf) = 7.64
Failure Mode: Bulging Failure Eff. Major Principal stress (ksf) = 35.66
Axial Strain (%) = 5.29
CONSOLIDATED UNDRAINED TRIAXIAL TEST WITH PORE PRESSURE MEASUREMENT
Figure F-2.352

Test Procedure: ASTM D 4767
Project Name: Westside Subway Extension Tested by: ST Date: 08-14-11
Project No.: Input Data by: KM Date: 08-18-11
Test Pit: G-199 Reviewed by: AP Date: 08-18-11
Sample No.: 9 Sample Description: Silty Sand with gravel
Depth(ft): 60
Sample Type: Mod. Cal. Confining Pressure = 60.0 psi
Diameter (in) 2.615 2.615 2.615 Avg. = 2.615
Height (in) 5.675 5.675 5.675 Avg. = 5.675
BEFORE CONSOLIDATION AFTER CONSOLIDATION
Area (in²) 5.371 5.638
Moisture Content (%) 11.99 11.96
Wet Weight (gms) 1136.20 1317.25
Dry Weight (gms) 1014.55 1195.93
Container Weight (gms) 0.00 181.38
Density and Saturation
Wet Weight (gms) 1136.20
Container Weight (gms) 0.00
Wet Density (pcf) 142.0
Dry Density (pcf) 126.8
Initial Void Ratio 0.329
% Saturation 98.5
Assumed Specific Gravity = 2.70
Back Pressure Saturation
B Value (%) = 95 Change in Ht. of the Specimen (in)= 0
Consolidation
Cell Pressure (psi) = 90.0 Initial Burette Ht.(cm)= 45.3
Back Pressure(psi) = 30.0 Final Burette Ht.(cm)= 42.4
Eff. Consol. Stress (psi) = 60.0 Final Height (in)= 5.675
Induced OCR = 1.0 Initial Volume (cu.in)= 30.479
Change in Ht. of Specimen (in) = 0.0000 Final Volume (cu.in) = 30.302
Shear At Failure
Rate of Deformation (in/min)= 0.008 Deviator Stress (ksf) = 37.62
Time to 50% primary Consolidation = 3 Eff. Minor Principal stress (ksf) = 10.42
Failure Mode: Bulging Failure Eff. Major Principal stress (ksf) = 48.04
Axial Strain (%) = 4.49
CONSOLIDATED UNDRAINED TRIAXIAL TEST WITH PORE PRESSURE MEASUREMENT
4953-10-1561
Figure F-2.353

Project Name: Westside Subway Extension Cell Pressure: 60.0 psi
Project No: 4953-10-1561 Back Pressure : 30.0 psi
Test Pit: G-199 Consolidation Pressure : 30.0 psi
Depth(ft): 60 Initial Sample Height: 5.675 in
Sample No.: 9 Initial Area of Sample: 5.371 sq. in.
Sample Type: Mod. Cal. Final Sample Ht.* (L): 5.630 in
Sample Description: Silty Sand with gravel Final Sample Area (A)*: 5.373 sq. in.
Induced OCR= 1.0
Cell Load Axial Back Deviator Axial Pore Shear Normal
Pressure Deformation Pressure Stress Strain Pressure Stress Stress
Change q' p'
(S1-S3) (S1-S3)/2 (S1'+S3')/2
(psi) (lbs) (in) (psi) (ksf) (%) (ksf) (ksf) (ksf)
60.0 0 0.000 30.0 0.00 0.00 0.00 0.00 4.32
60.0 74 0.004 34.7 1.97 0.06 0.67 0.99 4.63
60.0 113 0.009 39.4 3.02 0.16 1.35 1.51 4.48
60.0 140 0.014 42.5 3.75 0.25 1.80 1.88 4.40
60.0 161 0.020 44.5 4.30 0.35 2.08 2.15 4.39
60.0 177 0.026 45.8 4.72 0.45 2.27 2.36 4.41
60.0 191 0.031 46.6 5.09 0.54 2.40 2.54 4.47
60.0 205 0.037 47.2 5.45 0.65 2.48 2.73 4.57
60.0 216 0.042 47.6 5.75 0.74 2.53 2.88 4.66
60.0 229 0.048 47.8 6.08 0.84 2.57 3.04 4.79
60.0 240 0.053 48.0 6.38 0.94 2.59 3.19 4.92
60.0 252 0.059 48.0 6.68 1.04 2.59 3.34 5.07
60.0 263 0.064 48.0 6.98 1.14 2.59 3.49 5.22
60.0 275 0.069 47.9 7.27 1.23 2.58 3.64 5.38
60.0 286 0.075 47.8 7.57 1.33 2.56 3.79 5.54
60.0 298 0.080 47.7 7.87 1.42 2.54 3.93 5.71
60.0 308 0.085 47.5 8.13 1.52 2.52 4.07 5.87
60.0 320 0.091 47.3 8.43 1.62 2.49 4.21 6.05
60.0 330 0.097 47.0 8.69 1.72 2.45 4.35 6.21
60.0 342 0.103 46.8 8.99 1.82 2.42 4.49 6.40
60.0 353 0.108 46.5 9.28 1.92 2.38 4.64 6.58
60.0 385 0.126 45.6 10.09 2.23 2.25 5.05 7.11
60.0 417 0.143 44.7 10.90 2.54 2.11 5.45 7.66
60.0 451 0.161 43.7 11.74 2.85 1.97 5.87 8.22
60.0 481 0.177 42.6 12.48 3.14 1.82 6.24 8.74
60.0 511 0.193 41.5 13.21 3.43 1.66 6.61 9.27
60.0 542 0.209 40.5 13.98 3.72 1.51 6.99 9.80
60.0 570 0.226 39.4 14.67 4.01 1.35 7.34 10.31
60.0 597 0.244 38.3 15.30 4.33 1.19 7.65 10.78
60.0 622 0.261 37.2 15.90 4.64 1.03 7.95 11.24
60.0 650 0.278 36.1 16.55 4.94 0.88 8.28 11.72
60.0 674 0.295 35.1 17.11 5.24 0.73 8.56 12.14
CONSOLIDATED UNDRAINED TRIAXIAL TEST WITH PORE PRESSURE MEASUREMENT
Figure F-2.354

Project Name: Westside Subway Extension Cell Pressure: 75.0 psi
Project No: 4953-10-1561 Back Pressure : 30.0 psi
Test Pit: G-199 Consolidation Pressure : 45.0 psi
Depth(ft): 60 Initial Sample Height: 5.675 in
Sample No.: 9 Initial Area of Sample: 5.371 sq. in.
Sample Type: Mod. Cal. Final Sample Ht.* (L): 5.675 in
Sample Description: Silty Sand with gravel Final Sample Area (A)*: 5.611 sq. in.
Induced OCR= 1.0
Cell Load Axial Back Deviator Axial Pore Shear Normal
Pressure Deformation Pressure Stress Strain Pressure Stress Stress
Change q' p'
(S1-S3) (S1-S3)/2 (S1'+S3')/2
(psi) (lbs) (in) (psi) (ksf) (%) (ksf) (ksf) (ksf)
75.0 0 0.000 30.0 0.00 0.00 0.00 0.00 6.48
75.0 228 0.013 41.9 5.84 0.23 1.70 2.92 7.69
75.0 333 0.024 43.3 8.51 0.41 1.91 4.26 8.83
75.0 438 0.033 42.8 11.17 0.59 1.84 5.59 10.23
75.0 542 0.042 41.9 13.81 0.75 1.70 6.90 11.68
75.0 638 0.052 41.0 16.22 0.91 1.58 8.11 13.01
75.0 712 0.062 40.1 18.07 1.09 1.45 9.04 14.06
75.0 767 0.072 39.2 19.43 1.26 1.32 9.72 14.88
75.0 808 0.082 38.2 20.44 1.44 1.18 10.22 15.52
75.0 841 0.093 37.2 21.23 1.64 1.04 10.61 16.06
75.0 867 0.103 36.2 21.84 1.82 0.89 10.92 16.51
75.0 891 0.115 35.2 22.40 2.02 0.74 11.20 16.94
75.0 911 0.126 34.3 22.86 2.22 0.61 11.43 17.30
75.0 927 0.137 33.7 23.22 2.41 0.52 11.61 17.57
75.0 949 0.148 32.6 23.72 2.60 0.37 11.86 17.97
75.0 967 0.159 31.7 24.12 2.81 0.23 12.06 18.31
75.0 982 0.170 30.8 24.45 3.00 0.11 12.22 18.60
75.0 998 0.181 29.9 24.80 3.18 -0.02 12.40 18.89
75.0 1016 0.191 29.1 25.19 3.37 -0.14 12.60 19.21
75.0 1033 0.201 28.3 25.57 3.55 -0.25 12.78 19.52
75.0 1047 0.212 27.5 25.86 3.74 -0.37 12.93 19.78
75.0 1061 0.223 26.7 26.16 3.93 -0.48 13.08 20.03
75.0 1078 0.235 26.0 26.52 4.14 -0.58 13.26 20.32
75.0 1091 0.246 25.3 26.78 4.34 -0.68 13.39 20.55
75.0 1103 0.257 24.6 27.02 4.53 -0.78 13.51 20.78
75.0 1116 0.268 23.9 27.29 4.72 -0.88 13.64 21.01
75.0 1126 0.279 23.2 27.47 4.92 -0.98 13.74 21.20
75.0 1141 0.290 22.6 27.79 5.10 -1.07 13.89 21.44
75.0 1153 0.300 22.0 28.02 5.29 -1.16 14.01 21.65
CONSOLIDATED UNDRAINED TRIAXIAL TEST WITH PORE PRESSURE MEASUREMENT
Figure F-2.355

Project Name: Westside Subway Extension Cell Pressure: 90.0 psi
Project No: 4953-10-1561 Back Pressure : 30.0 psi
Test Pit: G-199 Consolidation Pressure : 60.0 psi
Depth(ft): 60 Initial Sample Height: 5.675 in
Sample No.: 9 Initial Area of Sample: 5.371 sq. in.
Sample Type: Mod. Cal. Final Sample Ht.* (L): 5.675 in
Sample Description: Silty Sand with gravel Final Sample Area (A)*: 5.638 sq. in.
Induced OCR= 1.0
Cell Load Axial Back Deviator Axial Pore Shear Normal
Pressure Deformation Pressure Stress Strain Pressure Stress Stress
Change q' p'
(S1-S3) (S1-S3)/2 (S1'+S3')/2
(psi) (lbs) (in) (psi) (ksf) (%) (ksf) (ksf) (ksf)
90.0 0 0.000 30.0 0.00 0.00 0.00 0.00 8.64
90.0 229 0.006 38.8 5.84 0.11 1.27 2.92 10.29
90.0 344 0.012 41.9 8.77 0.21 1.72 4.38 11.31
90.0 469 0.018 42.7 11.94 0.32 1.83 5.97 12.78
90.0 587 0.024 42.0 14.93 0.42 1.73 7.46 14.37
90.0 709 0.030 40.7 18.01 0.53 1.54 9.01 16.10
90.0 843 0.036 39.0 21.39 0.63 1.30 10.70 18.04
90.0 961 0.042 37.5 24.36 0.74 1.07 12.18 19.75
90.0 1055 0.048 36.1 26.72 0.85 0.88 13.36 21.12
90.0 1129 0.054 34.9 28.56 0.95 0.70 14.28 22.22
90.0 1183 0.060 33.8 29.90 1.06 0.55 14.95 23.04
90.0 1327 0.090 29.2 33.36 1.59 -0.12 16.68 25.44
90.0 1349 0.100 28.1 33.85 1.76 -0.28 16.92 25.84
90.0 1385 0.119 26.3 34.63 2.10 -0.54 17.32 26.49
90.0 1500 0.207 19.9 36.91 3.65 -1.46 18.46 28.55
90.0 1542 0.255 17.6 37.62 4.49 -1.78 18.81 29.23
90.0 1610 0.343 13.8 38.64 6.04 -2.33 19.32 30.29
90.0 1647 0.389 12.4 39.18 6.85 -2.53 19.59 30.76
90.0 1675 0.432 11.2 39.53 7.61 -2.70 19.76 31.10
90.0 1704 0.476 10.3 39.87 8.39 -2.84 19.94 31.42
90.0 1724 0.522 9.4 39.99 9.19 -2.97 19.99 31.60
90.0 1751 0.564 8.7 40.28 9.94 -3.07 20.14 31.85
90.0 1776 0.609 8.1 40.49 10.73 -3.15 20.25 32.04
90.0 1784 0.655 7.8 40.31 11.53 -3.20 20.16 32.00
90.0 1811 0.742 7.1 40.21 13.07 -3.29 20.10 32.04
90.0 1838 0.786 7.0 40.45 13.84 -3.32 20.22 32.18
90.0 1854 0.828 6.8 40.44 14.59 -3.34 20.22 32.21
90.0 1867 0.874 6.7 40.34 15.40 -3.36 20.17 32.17
90.0 1875 0.916 6.5 40.16 16.14 -3.38 20.08 32.10
90.0 1901 0.958 6.4 40.36 16.88 -3.40 20.18 32.2290.0 1908 1.004 6.3 40.11 17.69 -3.42 20.06 32.11
90.0 1923 1.047 6.2 40.05 18.45 -3.42 20.03 32.09
90.0 1939 1.135 6.2 39.62 19.99 -3.43 19.81 31.88
90.0 1962 1.177 6.1 39.72 20.74 -3.44 19.86 31.93
CONSOLIDATED UNDRAINED TRIAXIAL TEST WITH PORE PRESSURE MEASUREMENT
Figure F-2.356

LEGEND: CONFINING PRESSURES= ○ 20 psi □ 40 psi ∆ 60 psi
Project Name: Westside Subway Extension Sample Type: Mod. Cal.
Project No.: 4953-10-1561 Sample Description: Silty Sand with gravel
Test Pit: G-199 Avg. Dry Unit Weight (pcf): 126.8
Sample No.: 9 Avg. Initial Moisture Content (%): 12.0
Depth (ft): 60 Confining Pressure: 30.0, 45.0, 60.0 psi
CU TRIAXIAL MULTI-STAGE TEST WITH PORE PRESSURE MEASUREMENTASTM D 4767
0
5
10
15
20
25
30
0 5 10 15 20 25 30 35 40 45 50 55 60
NORMAL STRESS, P' (ksf)
SH
EA
R S
TR
ES
S, q
' (ks
f)
0.0
5.0
10.0
15.0
20.0
25.0
30.0
35.0
40.0
45.0
50.0
0.0 5.0 10.0 15.0 20.0
AXIAL STRAIN (Percent)
DE
VIA
TO
R S
TR
ES
S (
ksf)
-4.0
-3.0
-2.0
-1.0
0.0
1.0
2.0
3.0
4.0
0.0 5.0 10.0 15.0 20.0
AXIAL STRAIN (Percent)C
HA
NG
E I
N P
OR
E W
AT
ER
PR
ES
SU
RE
(ks
f)
Figure F-2.357
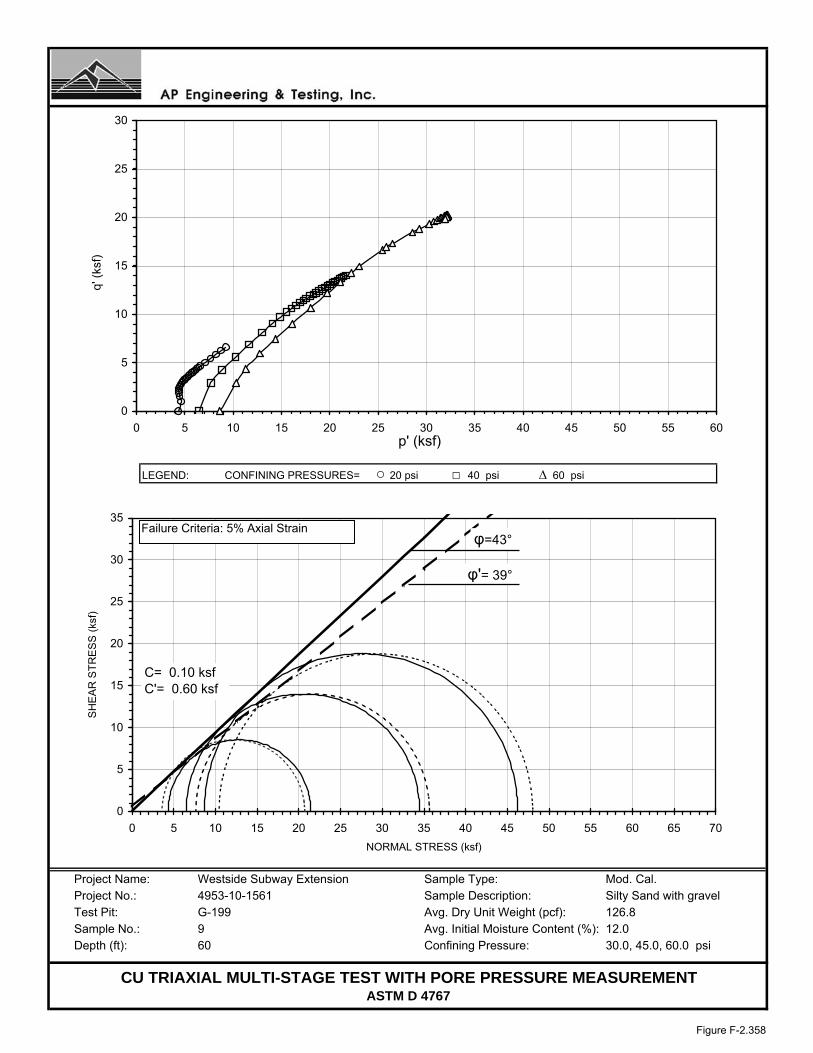
LEGEND: CONFINING PRESSURES= ○ 20 psi □ 40 psi ∆ 60 psi
Project Name: Westside Subway Extension Sample Type: Mod. Cal.Project No.: 4953-10-1561 Sample Description: Silty Sand with gravelTest Pit: G-199 Avg. Dry Unit Weight (pcf): 126.8Sample No.: 9 Avg. Initial Moisture Content (%): 12.0Depth (ft): 60 Confining Pressure: 30.0, 45.0, 60.0 psi
CU TRIAXIAL MULTI-STAGE TEST WITH PORE PRESSURE MEASUREMENTASTM D 4767
0
5
10
15
20
25
30
35
0 5 10 15 20 25 30 35 40 45 50 55 60 65 70
NORMAL STRESS (ksf)
SH
EA
R S
TR
ES
S (
ksf)
φ=43°
φ'= 39°
0
5
10
15
20
25
30
0 5 10 15 20 25 30 35 40 45 50 55 60 p' (ksf)
q' (
ksf)
C= 0.10 ksfC'= 0.60 ksf
Failure Criteria: 5% Axial Strain
Figure F-2.358

Test Pit: G-199 Sample Type: Mod. Cal.Sample No.: 9 Soil Description: Silty Sand with gravelDepth (feet): 60 Eff. Confining Pressure (psi): 45.0
Project Name: Westside Subway ExtensionProject No.: 4953-10-1561Date: 08/14/11
5.0000
120240480
38.3927
8153060
0.250.512
2.5000
Time (minutes) Volume Change (cc)0.00002.5000
00.1
SQRT Time (minutes) Volume Change (cc)0.0000 0.0000
2.82843.87305.4772
0.31620.50000.70711.00001.4142
3.5600
4.7000
4.30004.50004.50004.7000
7.7460
2.00004.3000
TIME RATE CONSOLIDATION CURVE
4.50004.70004.7000
4.90004.9000
4
ASTM D 2435
4.80004.90004.9000
10.954515.491921.9089
1474 5.0000
4.8000
3.90004.10004.3000
4.5000
3.56003.90004.10004.3000
0.00
1.00
2.00
3.00
4.00
5.00
6.00
0.1 1 10 100 1000 10000
Time (minutes)
Vol
ume
Cha
nge
(cc)
0.00
1.00
2.00
3.00
4.00
5.00
6.00
0.0 10.0 20.0 30.0 40.0 50.0
Square root Time (minutes)
Vol
ume
Cha
nge
(cc)
Figure F-2.359

Test Procedure: ASTM D 4767
Project Name: Westside Subway Extension Tested by: ST Date: 08-14-11
Project No.: 4953-10-1561 Input Data by: KM Date: 08-19-11
Test Pit: G-199 Reviewed by: AP Date: 08-19-11
Sample No.: 15 Sample Description: Fat Clay w/sand
Depth(ft): 95
Sample Type: Mod. Cal. Confining Pressure = 45.0 psi
Diameter (in) 2.615 2.615 2.615 Avg. = 2.615
Height (in) 4.720 4.720 4.720 Avg. = 4.720
BEFORE CONSOLIDATION AFTER CONSOLIDATION
Area (in²) 5.371 5.266
Moisture Content (%) 19.10 20.81
Wet Weight (gms) 118.31 1003.74
Dry Weight (gms) 107.38 856.35
Container Weight (gms) 50.16 148.06
Density and Saturation
Wet Weight (gms) 858.83
Container Weight (gms) 0.00
Wet Density (pcf) 129.1
Dry Density (pcf) 108.4
Initial Void Ratio 0.555
% Saturation 93.0
Assumed Specific Gravity = 2.70
Back Pressure Saturation
B Value (%) = 96 Change in Ht. of the Specimen (in)= 0
Consolidation
Cell Pressure (psi) = 75.0 Initial Burette Ht.(cm)= 72.1
Back Pressure(psi) = 30.0 Final Burette Ht.(cm)= 57.2
Eff. Consol. Stress (psi) = 45.0 Final Height (in)= 4.641
Induced OCR = 1.0 Initial Volume (cu.in)= 25.350
Change in Ht. of Specimen (in) = 0.0786 Final Volume (cu.in) = 24.441
Shear At Failure
Rate of Deformation (in/min)= 0.004 Deviator Stress (ksf) = 12.25
Time to 50% primary Consolidation (min) = 15 Eff. Minor Principal stress (ksf) = 2.68
Failure Mode: Bulging Failure Eff. Major Principal stress (ksf) = 14.92
Axial Strain (%) = 5.26
CONSOLIDATED UNDRAINED TRIAXIAL TEST WITH PORE PRESSURE MEASUREMENT
Figure F-2.360

Test Procedure: ASTM D 4767
Project Name: Westside Subway Extension Tested by: ST Date: 08-14-11
Project No.: 4953-10-1561 Input Data by: KM Date: 08-19-11
Test Pit: G-199 Reviewed by: AP Date: 08-19-11
Sample No.: 15 Sample Description: Fat Clay w/sand
Depth(ft): 95
Sample Type: Mod. Cal. Confining Pressure = 60.0 psi
Diameter (in) 2.615 2.615 2.615 Avg. = 2.615
Height (in) 4.720 4.720 4.720 Avg. = 4.720
BEFORE CONSOLIDATION AFTER CONSOLIDATION
Area (in²) 5.371 5.599
Moisture Content (%) 19.10 20.81
Wet Weight (gms) 118.31 1003.74
Dry Weight (gms) 107.38 856.35
Container Weight (gms) 50.16 148.06
Density and Saturation
Wet Weight (gms) 858.83
Container Weight (gms) 0.00
Wet Density (pcf) 129.1
Dry Density (pcf) 108.4
Initial Void Ratio 0.555
% Saturation 93.0
Assumed Specific Gravity = 2.70
Back Pressure Saturation
B Value (%) = 96 Change in Ht. of the Specimen (in)= 0
Consolidation
Cell Pressure (psi) = 90.0 Initial Burette Ht.(cm)= 57.2
Back Pressure(psi) = 30.0 Final Burette Ht.(cm)= 51.9
Eff. Consol. Stress (psi) = 60.0 Final Height (in)= 4.718
Induced OCR= 1.0 Initial Volume (cu.in)= 25.350
Change in Ht. of Specimen (in) = 0.0016 Final Volume (cu.in) = 25.026
Shear At Failure
Rate of Deformation (in/min)= 0.004 Deviator Stress (ksf) = 16.49
Time to 50% primary Consolidation = 15 Eff. Minor Principal stress (ksf) = 5.18
Failure Mode: Bulging Failure Eff. Major Principal stress (ksf) = 21.67
Axial Strain (%) = 5.19
CONSOLIDATED UNDRAINED TRIAXIAL TEST WITH PORE PRESSURE MEASUREMENT
Figure F-2.361

Test Procedure: ASTM D 4767
Project Name: Westside Subway Extension Tested by: ST Date: 08-14-11
Project No.: Input Data by: KM Date: 08-19-11
Test Pit: G-199 Reviewed by: AP Date: 08-19-11
Sample No.: 15 Sample Description: Fat Clay w/sand
Depth(ft): 95
Sample Type: Mod. Cal. Confining Pressure = 75.0 psi
Diameter (in) 2.615 2.615 2.615 Avg. = 2.615
Height (in) 4.720 4.720 4.720 Avg. = 4.720
BEFORE CONSOLIDATION AFTER CONSOLIDATION
Area (in²) 5.371 5.568
Moisture Content (%) 19.10 20.81
Wet Weight (gms) 118.31 1003.74
Dry Weight (gms) 107.38 856.35
Container Weight (gms) 50.16 148.06
Density and Saturation
Wet Weight (gms) 858.83
Container Weight (gms) 0.00
Wet Density (pcf) 129.1
Dry Density (pcf) 108.4
Initial Void Ratio 0.555
% Saturation 93.0
Assumed Specific Gravity = 2.70
Back Pressure Saturation
B Value (%) = 96 Change in Ht. of the Specimen (in)= 0
Consolidation
Cell Pressure (psi) = 105.0 Initial Burette Ht.(cm)= 51.9
Back Pressure(psi) = 30.0 Final Burette Ht.(cm)= 44.8
Eff. Consol. Stress (psi) = 75.0 Final Height (in)= 4.720
Induced OCR = 1.0 Initial Volume (cu.in)= 25.350
Change in Ht. of Specimen (in) = 0.0000 Final Volume (cu.in) = 24.917
Shear At Failure
Rate of Deformation (in/min)= 0.004 Deviator Stress (ksf) = 20.32
Time to 50% primary Consolidation = 15 Eff. Minor Principal stress (ksf) = 6.85
Failure Mode: Bulging Failure Eff. Major Principal stress (ksf) = 27.17
Axial Strain (%) = 4.55
CONSOLIDATED UNDRAINED TRIAXIAL TEST WITH PORE PRESSURE MEASUREMENT
4953-10-1561
Figure F-2.362

Project Name: Westside Subway Extension Cell Pressure: 75.0 psi
Project No: 4953-10-1561 Back Pressure : 30.0 psi
Test Pit: G-199 Consolidation Pressure : 45.0 psi
Depth(ft): 95 Initial Sample Height: 4.720 in
Sample No.: 15 Initial Area of Sample: 5.371 sq. in.
Sample Type: Mod. Cal. Final Sample Ht.* (L): 4.641 in
Sample Description: Fat Clay w/sand Final Sample Area (A)*: 5.266 sq. in.
Induced OCR= 1.0
Cell Load Axial Back Deviator Axial Pore Shear Normal
Pressure Deformation Pressure Stress Strain Pressure Stress Stress
Change q' p'
(S1-S3) (S1-S3)/2 (S1'+S3')/2
(psi) (lbs) (in) (psi) (ksf) (%) (ksf) (ksf) (ksf)
75.0 0 0.000 30.0 0.00 0.00 0.00 0.00 6.48
75.0 78 0.004 35.7 2.14 0.08 0.82 1.07 6.73
75.0 120 0.009 38.9 3.26 0.19 1.28 1.63 6.84
75.0 147 0.014 41.3 4.01 0.30 1.62 2.01 6.86
75.0 169 0.019 43.2 4.60 0.41 1.90 2.30 6.88
75.0 186 0.024 44.8 5.07 0.53 2.14 2.53 6.88
75.0 201 0.030 46.2 5.47 0.65 2.33 2.73 6.89
75.0 214 0.035 47.3 5.80 0.76 2.49 2.90 6.89
75.0 225 0.041 48.3 6.11 0.87 2.63 3.05 6.90
75.0 237 0.047 49.1 6.41 1.00 2.75 3.21 6.93
75.0 246 0.052 49.9 6.65 1.13 2.86 3.33 6.95
75.0 255 0.057 50.5 6.90 1.23 2.96 3.45 6.97
75.0 265 0.062 51.1 7.14 1.34 3.04 3.57 7.01
75.0 271 0.068 51.7 7.31 1.45 3.12 3.66 7.02
75.0 281 0.073 52.1 7.55 1.57 3.19 3.78 7.07
75.0 288 0.079 52.6 7.73 1.70 3.25 3.86 7.10
75.0 296 0.084 53.0 7.94 1.81 3.30 3.97 7.14
75.0 302 0.089 53.3 8.11 1.93 3.36 4.06 7.18
75.0 309 0.096 53.6 8.29 2.06 3.40 4.14 7.22
75.0 316 0.101 53.9 8.46 2.18 3.45 4.23 7.26
75.0 322 0.107 54.2 8.60 2.31 3.49 4.30 7.29
75.0 342 0.125 54.9 9.09 2.69 3.59 4.54 7.43
75.0 361 0.143 55.5 9.57 3.08 3.67 4.79 7.59
75.0 381 0.159 55.9 10.05 3.43 3.73 5.03 7.78
75.0 400 0.176 56.2 10.53 3.79 3.77 5.26 7.97
75.0 419 0.192 56.4 10.97 4.15 3.80 5.49 8.16
75.0 437 0.209 56.5 11.41 4.50 3.81 5.71 8.37
75.0 455 0.226 56.5 11.85 4.87 3.81 5.92 8.59
75.0 473 0.244 56.4 12.25 5.26 3.80 6.12 8.80
CONSOLIDATED UNDRAINED TRIAXIAL TEST WITH PORE PRESSURE MEASUREMENT
Figure F-2.363

Project Name: Westside Subway Extension Cell Pressure: 90.0 psi
Project No: 4953-10-1561 Back Pressure : 30.0 psi
Test Pit: G-199 Consolidation Pressure : 60.0 psi
Depth(ft): 95 Initial Sample Height: 4.720 in
Sample No.: 15 Initial Area of Sample: 5.371 sq. in.
Sample Type: Mod. Cal. Final Sample Ht.* (L): 4.718 in
Sample Description: Fat Clay w/sand Final Sample Area (A)*: 5.599 sq. in.
Induced OCR= 1.0
Cell Load Axial Back Deviator Axial Pore Shear Normal
Pressure Deformation Pressure Stress Strain Pressure Stress Stress
Change q' p'
(S1-S3) (S1-S3)/2 (S1'+S3')/2
(psi) (lbs) (in) (psi) (ksf) (%) (ksf) (ksf) (ksf)
90.0 0 0.000 30.0 0.00 0.00 0.00 0.00 8.64
90.0 25 0.004 32.1 0.64 0.08 0.30 0.32 8.66
90.0 81 0.009 36.4 2.08 0.19 0.91 1.04 8.77
90.0 162 0.013 42.9 4.16 0.28 1.85 2.08 8.86
90.0 220 0.018 47.4 5.64 0.38 2.50 2.82 8.96
90.0 267 0.023 50.9 6.83 0.48 3.00 3.42 9.05
90.0 310 0.027 53.6 7.93 0.58 3.40 3.96 9.20
90.0 350 0.033 55.9 8.94 0.69 3.72 4.47 9.39
90.0 388 0.038 57.7 9.90 0.81 3.99 4.95 9.60
90.0 422 0.044 59.2 10.75 0.92 4.20 5.38 9.81
90.0 455 0.049 60.4 11.58 1.04 4.37 5.79 10.06
90.0 484 0.055 61.3 12.30 1.16 4.50 6.15 10.29
90.0 508 0.059 61.8 12.90 1.26 4.58 6.45 10.51
90.0 529 0.065 62.2 13.42 1.38 4.63 6.71 10.72
90.0 546 0.070 62.3 13.84 1.48 4.65 6.92 10.91
90.0 560 0.075 62.3 14.18 1.59 4.65 7.09 11.08
90.0 572 0.081 62.2 14.46 1.71 4.64 7.23 11.23
90.0 582 0.086 62.0 14.70 1.82 4.61 7.35 11.38
90.0 590 0.092 61.8 14.88 1.94 4.58 7.44 11.50
90.0 596 0.097 61.5 15.02 2.05 4.54 7.51 11.61
90.0 602 0.103 61.2 15.15 2.18 4.50 7.57 11.72
90.0 608 0.108 60.9 15.28 2.30 4.45 7.64 11.83
90.0 613 0.114 60.6 15.39 2.42 4.41 7.69 11.92
90.0 618 0.120 60.3 15.49 2.54 4.37 7.75 12.02
90.0 626 0.131 59.7 15.65 2.78 4.28 7.83 12.19
90.0 634 0.143 59.1 15.81 3.03 4.19 7.91 12.35
90.0 640 0.154 58.5 15.92 3.26 4.11 7.96 12.49
90.0 646 0.165 57.9 16.03 3.50 4.02 8.02 12.63
90.0 652 0.177 57.4 16.14 3.74 3.94 8.07 12.77
90.0 657 0.188 56.8 16.22 3.99 3.86 8.11 12.8990.0 661 0.199 56.3 16.28 4.22 3.78 8.14 13.00
90.0 666 0.210 55.7 16.37 4.45 3.70 8.18 13.12
90.0 669 0.221 55.1 16.40 4.69 3.62 8.20 13.22
90.0 672 0.233 54.6 16.43 4.94 3.54 8.22 13.3290.0 676 0.245 54.0 16.49 5.19 3.46 8.24 13.42
CONSOLIDATED UNDRAINED TRIAXIAL TEST WITH PORE PRESSURE MEASUREMENT
Figure F-2.364
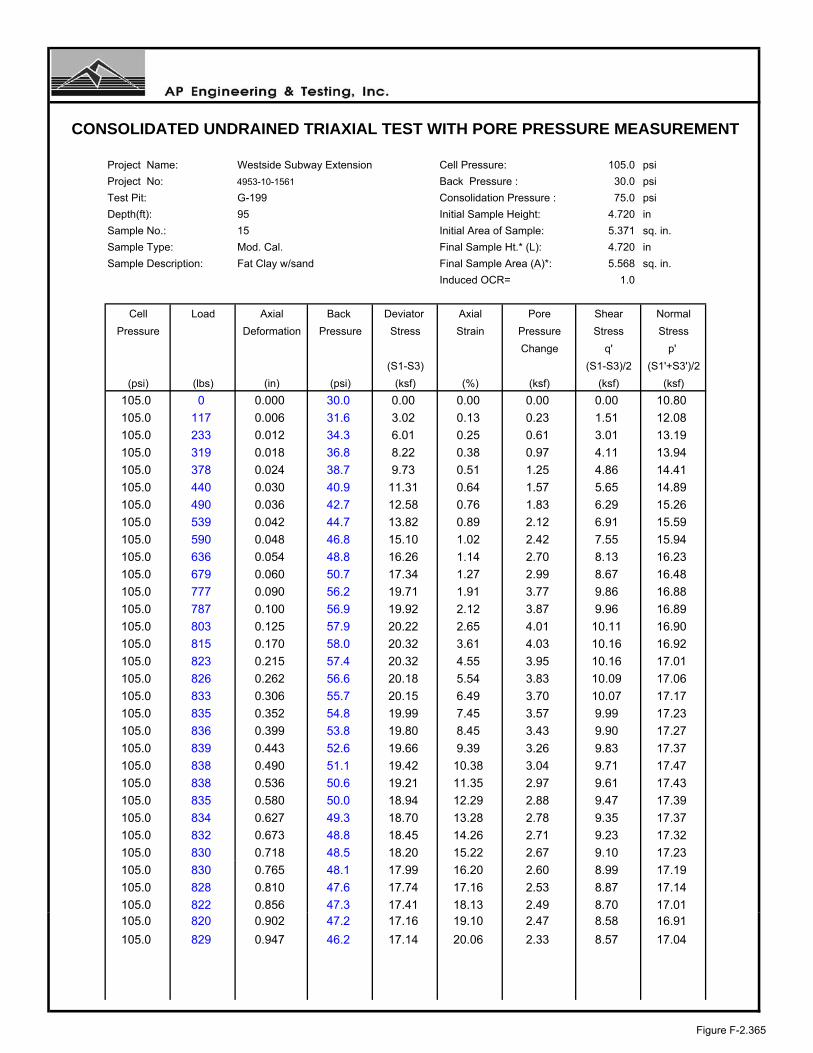
Project Name: Westside Subway Extension Cell Pressure: 105.0 psi
Project No: 4953-10-1561 Back Pressure : 30.0 psi
Test Pit: G-199 Consolidation Pressure : 75.0 psi
Depth(ft): 95 Initial Sample Height: 4.720 in
Sample No.: 15 Initial Area of Sample: 5.371 sq. in.
Sample Type: Mod. Cal. Final Sample Ht.* (L): 4.720 in
Sample Description: Fat Clay w/sand Final Sample Area (A)*: 5.568 sq. in.
Induced OCR= 1.0
Cell Load Axial Back Deviator Axial Pore Shear Normal
Pressure Deformation Pressure Stress Strain Pressure Stress Stress
Change q' p'
(S1-S3) (S1-S3)/2 (S1'+S3')/2
(psi) (lbs) (in) (psi) (ksf) (%) (ksf) (ksf) (ksf)
105.0 0 0.000 30.0 0.00 0.00 0.00 0.00 10.80
105.0 117 0.006 31.6 3.02 0.13 0.23 1.51 12.08
105.0 233 0.012 34.3 6.01 0.25 0.61 3.01 13.19
105.0 319 0.018 36.8 8.22 0.38 0.97 4.11 13.94
105.0 378 0.024 38.7 9.73 0.51 1.25 4.86 14.41
105.0 440 0.030 40.9 11.31 0.64 1.57 5.65 14.89
105.0 490 0.036 42.7 12.58 0.76 1.83 6.29 15.26
105.0 539 0.042 44.7 13.82 0.89 2.12 6.91 15.59
105.0 590 0.048 46.8 15.10 1.02 2.42 7.55 15.94
105.0 636 0.054 48.8 16.26 1.14 2.70 8.13 16.23
105.0 679 0.060 50.7 17.34 1.27 2.99 8.67 16.48
105.0 777 0.090 56.2 19.71 1.91 3.77 9.86 16.88
105.0 787 0.100 56.9 19.92 2.12 3.87 9.96 16.89
105.0 803 0.125 57.9 20.22 2.65 4.01 10.11 16.90
105.0 815 0.170 58.0 20.32 3.61 4.03 10.16 16.92
105.0 823 0.215 57.4 20.32 4.55 3.95 10.16 17.01
105.0 826 0.262 56.6 20.18 5.54 3.83 10.09 17.06
105.0 833 0.306 55.7 20.15 6.49 3.70 10.07 17.17
105.0 835 0.352 54.8 19.99 7.45 3.57 9.99 17.23
105.0 836 0.399 53.8 19.80 8.45 3.43 9.90 17.27
105.0 839 0.443 52.6 19.66 9.39 3.26 9.83 17.37
105.0 838 0.490 51.1 19.42 10.38 3.04 9.71 17.47
105.0 838 0.536 50.6 19.21 11.35 2.97 9.61 17.43
105.0 835 0.580 50.0 18.94 12.29 2.88 9.47 17.39
105.0 834 0.627 49.3 18.70 13.28 2.78 9.35 17.37
105.0 832 0.673 48.8 18.45 14.26 2.71 9.23 17.32
105.0 830 0.718 48.5 18.20 15.22 2.67 9.10 17.23
105.0 830 0.765 48.1 17.99 16.20 2.60 8.99 17.19
105.0 828 0.810 47.6 17.74 17.16 2.53 8.87 17.14
105.0 822 0.856 47.3 17.41 18.13 2.49 8.70 17.01105.0 820 0.902 47.2 17.16 19.10 2.47 8.58 16.91
105.0 829 0.947 46.2 17.14 20.06 2.33 8.57 17.04
CONSOLIDATED UNDRAINED TRIAXIAL TEST WITH PORE PRESSURE MEASUREMENT
Figure F-2.365
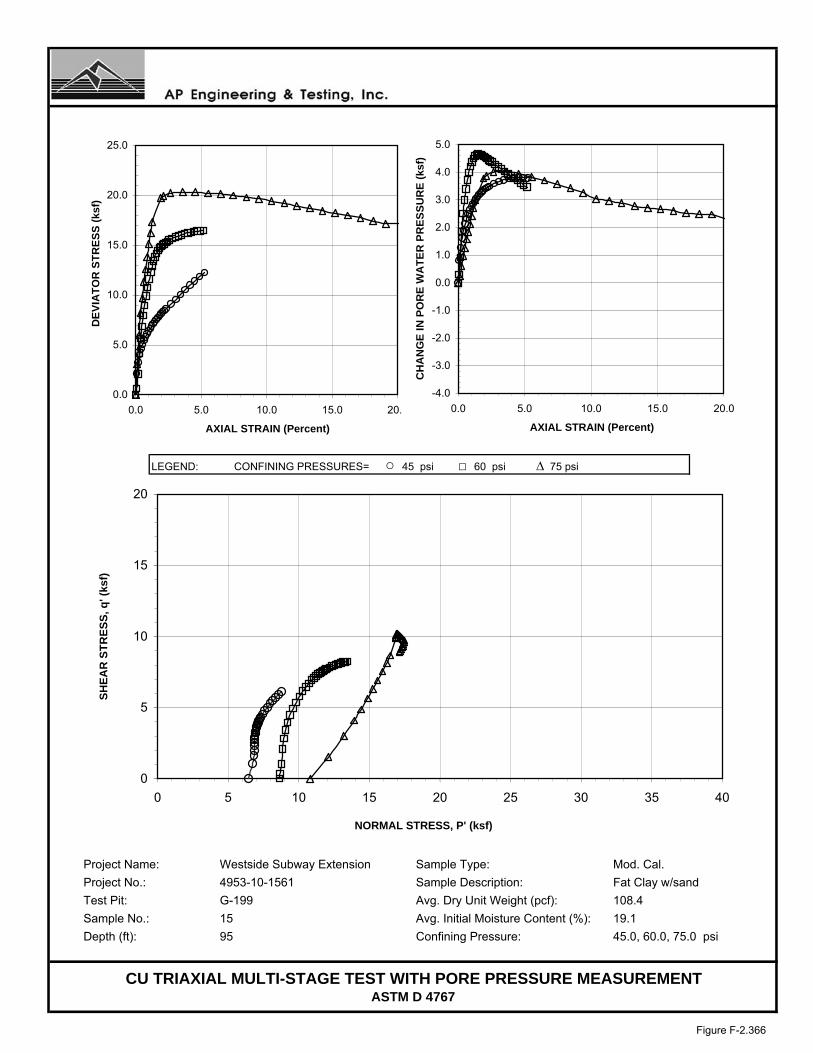
LEGEND: CONFINING PRESSURES= ○ 45 psi □ 60 psi ∆ 75 psi
Project Name: Westside Subway Extension Sample Type: Mod. Cal.
Project No.: 4953-10-1561 Sample Description: Fat Clay w/sand
Test Pit: G-199 Avg. Dry Unit Weight (pcf): 108.4
Sample No.: 15 Avg. Initial Moisture Content (%): 19.1
Depth (ft): 95 Confining Pressure: 45.0, 60.0, 75.0 psi
CU TRIAXIAL MULTI-STAGE TEST WITH PORE PRESSURE MEASUREMENTASTM D 4767
0
5
10
15
20
0 5 10 15 20 25 30 35 40
NORMAL STRESS, P' (ksf)
SH
EA
R S
TR
ES
S, q
' (ks
f)
0.0
5.0
10.0
15.0
20.0
25.0
0.0 5.0 10.0 15.0 20.0
AXIAL STRAIN (Percent)
DE
VIA
TO
R S
TR
ES
S (
ksf)
-4.0
-3.0
-2.0
-1.0
0.0
1.0
2.0
3.0
4.0
5.0
0.0 5.0 10.0 15.0 20.0
AXIAL STRAIN (Percent)C
HA
NG
E I
N P
OR
E W
AT
ER
PR
ES
SU
RE
(ks
f)
Figure F-2.366
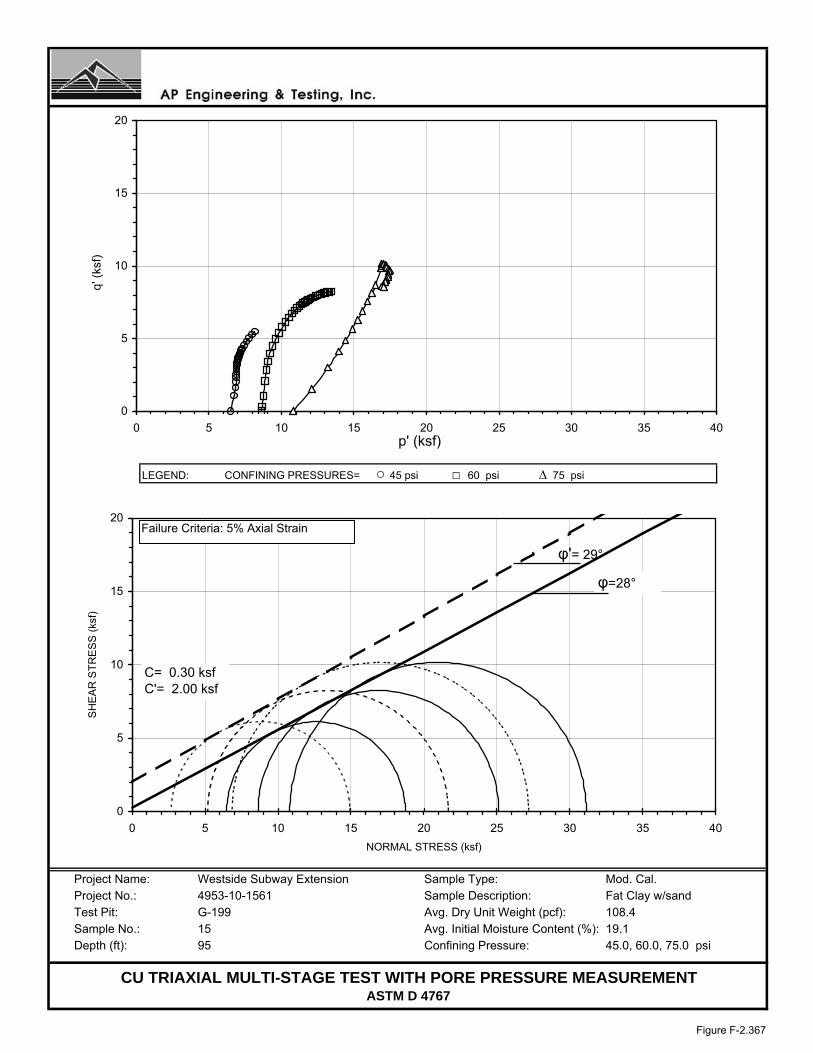
LEGEND: CONFINING PRESSURES= ○ 45 psi □ 60 psi ∆ 75 psi
Project Name: Westside Subway Extension Sample Type: Mod. Cal.Project No.: 4953-10-1561 Sample Description: Fat Clay w/sandTest Pit: G-199 Avg. Dry Unit Weight (pcf): 108.4Sample No.: 15 Avg. Initial Moisture Content (%): 19.1Depth (ft): 95 Confining Pressure: 45.0, 60.0, 75.0 psi
CU TRIAXIAL MULTI-STAGE TEST WITH PORE PRESSURE MEASUREMENTASTM D 4767
0
5
10
15
20
0 5 10 15 20 25 30 35 40
NORMAL STRESS (ksf)
SH
EA
R S
TR
ES
S (
ksf)
φ=28°
φ'= 29°
0
5
10
15
20
0 5 10 15 20 25 30 35 40 p' (ksf)
q' (
ksf)
C= 0.30 ksfC'= 2.00 ksf
Failure Criteria: 5% Axial Strain
Figure F-2.367

Test Pit: G-199 Sample Type: Mod. Cal.Sample No.: 15 Soil Description: Fat Clay w/sandDepth (feet): 95 Eff. Confining Pressure (psi): 60.0
Project Name: Westside Subway ExtensionProject No.: 4953-10-1561Date: 08/14/11
0.20000.30000.40000.6000
0.30000.40000.6000
1.2000
ASTM D 2435
3.90004.54004.9100
10.954515.491921.9089
1175 5.3000
3.90007.7460
2.00000.8000
TIME RATE CONSOLIDATION CURVE
1.60002.31003.1700
4.54004.9100
4
3.1700
0.80001.20001.60002.3100
0.0000
2.82843.87305.4772
0.31620.50000.70711.00001.4142
0.20000.2000
Time (minutes) Volume Change (cc)0.00000.2000
00.1
SQRT Time (minutes) Volume Change (cc)0.0000
0.250.512
8153060
120240480
34.2783 5.3000
0.00
1.00
2.00
3.00
4.00
5.00
6.00
0.1 1 10 100 1000 10000
Time (minutes)
Vol
ume
Cha
nge
(cc)
0.00
2.00
4.00
6.00
0.0 10.0 20.0 30.0 40.0
Square root Time (minutes)
Vol
ume
Cha
nge
(cc)
Figure F-2.368

Test Procedure: ASTM D 4767
Project Name: Westside Subway Extension Tested by: ST Date: 07-17-11
Project No.: 4953-10-1561 Input Data by: KM Date: 07-28-11
Test Pit: G-203 Reviewed by: AP Date: 07-28-11
Sample No.: - Sample Description: Dark Brown Sandy Clay
Depth(ft): 49.5
Sample Type: Mod. Cal. Confining Pressure = 20.0 psi
Diameter (in) 2.619 2.619 2.619 Avg. = 2.619
Height (in) 4.941 4.941 4.941 Avg. = 4.941
BEFORE CONSOLIDATION AFTER CONSOLIDATION
Area (in²) 5.387 5.325
Moisture Content (%) 14.15 14.71
Wet Weight (gms) 204.85 1107.00
Dry Weight (gms) 185.14 984.42
Container Weight (gms) 45.89 150.88
Density and Saturation
Wet Weight (gms) 943.64
Container Weight (gms) 0.00
Wet Density (pcf) 135.1
Dry Density (pcf) 118.3
Initial Void Ratio 0.424
% Saturation 90.1
Assumed Specific Gravity = 2.70
Back Pressure Saturation
B Value (%) = 96 Change in Ht. of the Specimen (in)= 0
Consolidation
Cell Pressure (psi) = 50.0 Initial Burette Ht.(cm)= 79.6
Back Pressure(psi) = 30.0 Final Burette Ht.(cm)= 72.4
Eff. Consol. Stress (psi) = 20.0 Final Height (in)= 4.916
Induced OCR = 1.0 Initial Volume (cu.in)= 26.618
Change in Ht. of Specimen (in) = 0.0247 Final Volume (cu.in) = 26.179
Shear At Failure
Rate of Deformation (in/min)= 0.005 Deviator Stress (ksf) = 10.52
Time to 50% primary Consolidation (min) = 5 Eff. Minor Principal stress (ksf) = 2.82
Failure Mode: Bulging Failure Eff. Major Principal stress (ksf) = 13.34
Axial Strain (%) = 5.14
CONSOLIDATED UNDRAINED TRIAXIAL TEST WITH PORE PRESSURE MEASUREMENT
Figure F-2.369

Test Procedure: ASTM D 4767
Project Name: Westside Subway Extension Tested by: ST Date: 07-17-11
Project No.: 4953-10-1561 Input Data by: KM Date: 07-28-11
Test Pit: G-203 Reviewed by: AP Date: 07-28-11
Sample No.: - Sample Description: Dark Brown Sandy Clay
Depth(ft): 49.5
Sample Type: Mod. Cal. Confining Pressure = 35.0 psi
Diameter (in) 2.619 2.619 2.619 Avg. = 2.619
Height (in) 4.941 4.941 4.941 Avg. = 4.941
BEFORE CONSOLIDATION AFTER CONSOLIDATION
Area (in²) 5.387 5.349
Moisture Content (%) 14.15 14.71
Wet Weight (gms) 204.85 1107.00
Dry Weight (gms) 185.14 984.42
Container Weight (gms) 45.89 150.88
Density and Saturation
Wet Weight (gms) 943.64
Container Weight (gms) 0.00
Wet Density (pcf) 135.1
Dry Density (pcf) 118.3
Initial Void Ratio 0.424
% Saturation 90.1
Assumed Specific Gravity = 2.70
Back Pressure Saturation
B Value (%) = 96 Change in Ht. of the Specimen (in)= 0
Consolidation
Cell Pressure (psi) = 65.0 Initial Burette Ht.(cm)= 72.4
Back Pressure(psi) = 30.0 Final Burette Ht.(cm)= 69.3
Eff. Consol. Stress (psi) = 35.0 Final Height (in)= 4.940
Induced OCR= 1.0 Initial Volume (cu.in)= 26.618
Change in Ht. of Specimen (in) = 0.0006 Final Volume (cu.in) = 26.428
Shear At Failure
Rate of Deformation (in/min)= 0.005 Deviator Stress (ksf) = 15.42
Time to 50% primary Consolidation = 5 Eff. Minor Principal stress (ksf) = 5.32
Failure Mode: Bulging Failure Eff. Major Principal stress (ksf) = 20.74
Axial Strain (%) = 6.10
CONSOLIDATED UNDRAINED TRIAXIAL TEST WITH PORE PRESSURE MEASUREMENT
Figure F-2.370

Test Procedure: ASTM D 4767
Project Name: Westside Subway Extension Tested by: ST Date: 07-17-11
Project No.: Input Data by: KM Date: 07-28-11
Test Pit: G-203 Reviewed by: AP Date: 07-28-11
Sample No.: - Sample Description: Dark Brown Sandy Clay
Depth(ft): 49.5
Sample Type: Mod. Cal. Confining Pressure = 50.0 psi
Diameter (in) 2.619 2.619 2.619 Avg. = 2.619
Height (in) 4.941 4.941 4.941 Avg. = 4.941
BEFORE CONSOLIDATION AFTER CONSOLIDATION
Area (in²) 5.387 5.359
Moisture Content (%) 14.15 14.71
Wet Weight (gms) 204.85 1107.00
Dry Weight (gms) 185.14 984.42
Container Weight (gms) 45.89 150.88
Density and Saturation
Wet Weight (gms) 943.64
Container Weight (gms) 0.00
Wet Density (pcf) 135.1
Dry Density (pcf) 118.3
Initial Void Ratio 0.424
% Saturation 90.1
Assumed Specific Gravity = 2.70
Back Pressure Saturation
B Value (%) = 96 Change in Ht. of the Specimen (in)= 0
Consolidation
Cell Pressure (psi) = 80.0 Initial Burette Ht.(cm)= 70.1
Back Pressure(psi) = 30.0 Final Burette Ht.(cm)= 67.4
Eff. Consol. Stress (psi) = 50.0 Final Height (in)= 4.937
Induced OCR = 1.0 Initial Volume (cu.in)= 26.618
Change in Ht. of Specimen (in) = 0.0045 Final Volume (cu.in) = 26.453
Shear At Failure
Rate of Deformation (in/min)= 0.005 Deviator Stress (ksf) = 19.69
Time to 50% primary Consolidation = 5 Eff. Minor Principal stress (ksf) = 6.61
Failure Mode: Bulging Failure Eff. Major Principal stress (ksf) = 26.30
Axial Strain (%) = 5.10
CONSOLIDATED UNDRAINED TRIAXIAL TEST WITH PORE PRESSURE MEASUREMENT
4953-10-1561
Figure F-2.371
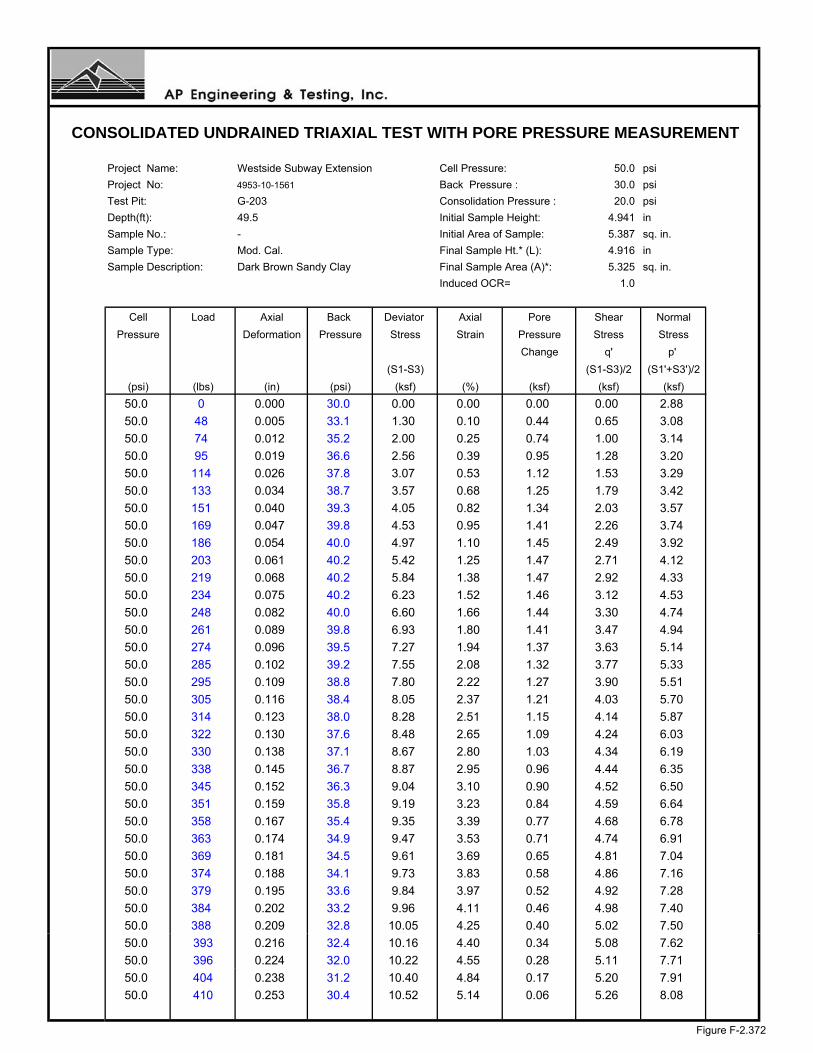
Project Name: Westside Subway Extension Cell Pressure: 50.0 psi
Project No: 4953-10-1561 Back Pressure : 30.0 psi
Test Pit: G-203 Consolidation Pressure : 20.0 psi
Depth(ft): 49.5 Initial Sample Height: 4.941 in
Sample No.: - Initial Area of Sample: 5.387 sq. in.
Sample Type: Mod. Cal. Final Sample Ht.* (L): 4.916 in
Sample Description: Dark Brown Sandy Clay Final Sample Area (A)*: 5.325 sq. in.
Induced OCR= 1.0
Cell Load Axial Back Deviator Axial Pore Shear Normal
Pressure Deformation Pressure Stress Strain Pressure Stress Stress
Change q' p'
(S1-S3) (S1-S3)/2 (S1'+S3')/2
(psi) (lbs) (in) (psi) (ksf) (%) (ksf) (ksf) (ksf)
50.0 0 0.000 30.0 0.00 0.00 0.00 0.00 2.88
50.0 48 0.005 33.1 1.30 0.10 0.44 0.65 3.08
50.0 74 0.012 35.2 2.00 0.25 0.74 1.00 3.14
50.0 95 0.019 36.6 2.56 0.39 0.95 1.28 3.20
50.0 114 0.026 37.8 3.07 0.53 1.12 1.53 3.29
50.0 133 0.034 38.7 3.57 0.68 1.25 1.79 3.42
50.0 151 0.040 39.3 4.05 0.82 1.34 2.03 3.57
50.0 169 0.047 39.8 4.53 0.95 1.41 2.26 3.74
50.0 186 0.054 40.0 4.97 1.10 1.45 2.49 3.92
50.0 203 0.061 40.2 5.42 1.25 1.47 2.71 4.12
50.0 219 0.068 40.2 5.84 1.38 1.47 2.92 4.33
50.0 234 0.075 40.2 6.23 1.52 1.46 3.12 4.53
50.0 248 0.082 40.0 6.60 1.66 1.44 3.30 4.74
50.0 261 0.089 39.8 6.93 1.80 1.41 3.47 4.94
50.0 274 0.096 39.5 7.27 1.94 1.37 3.63 5.14
50.0 285 0.102 39.2 7.55 2.08 1.32 3.77 5.33
50.0 295 0.109 38.8 7.80 2.22 1.27 3.90 5.51
50.0 305 0.116 38.4 8.05 2.37 1.21 4.03 5.70
50.0 314 0.123 38.0 8.28 2.51 1.15 4.14 5.87
50.0 322 0.130 37.6 8.48 2.65 1.09 4.24 6.03
50.0 330 0.138 37.1 8.67 2.80 1.03 4.34 6.19
50.0 338 0.145 36.7 8.87 2.95 0.96 4.44 6.35
50.0 345 0.152 36.3 9.04 3.10 0.90 4.52 6.50
50.0 351 0.159 35.8 9.19 3.23 0.84 4.59 6.64
50.0 358 0.167 35.4 9.35 3.39 0.77 4.68 6.78
50.0 363 0.174 34.9 9.47 3.53 0.71 4.74 6.91
50.0 369 0.181 34.5 9.61 3.69 0.65 4.81 7.04
50.0 374 0.188 34.1 9.73 3.83 0.58 4.86 7.16
50.0 379 0.195 33.6 9.84 3.97 0.52 4.92 7.28
50.0 384 0.202 33.2 9.96 4.11 0.46 4.98 7.40
50.0 388 0.209 32.8 10.05 4.25 0.40 5.02 7.50
50.0 393 0.216 32.4 10.16 4.40 0.34 5.08 7.62
50.0 396 0.224 32.0 10.22 4.55 0.28 5.11 7.71
50.0 404 0.238 31.2 10.40 4.84 0.17 5.20 7.91
50.0 410 0.253 30.4 10.52 5.14 0.06 5.26 8.08
CONSOLIDATED UNDRAINED TRIAXIAL TEST WITH PORE PRESSURE MEASUREMENT
Figure F-2.372
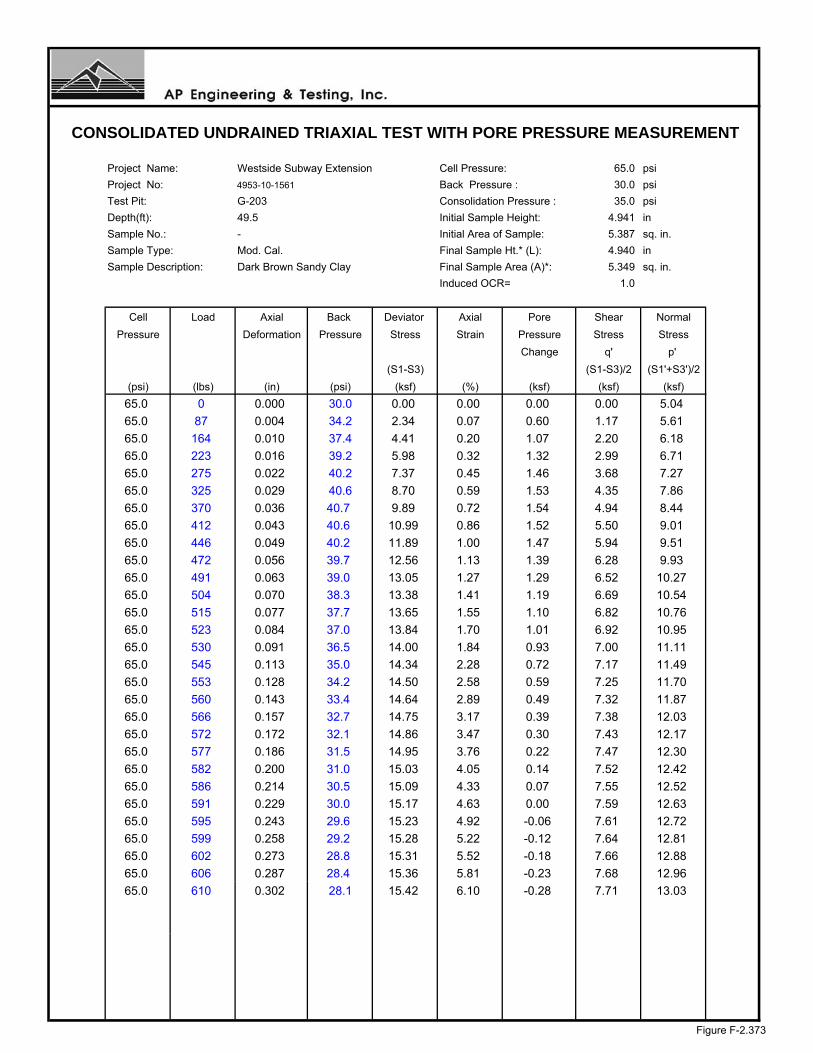
Project Name: Westside Subway Extension Cell Pressure: 65.0 psi
Project No: 4953-10-1561 Back Pressure : 30.0 psi
Test Pit: G-203 Consolidation Pressure : 35.0 psi
Depth(ft): 49.5 Initial Sample Height: 4.941 in
Sample No.: - Initial Area of Sample: 5.387 sq. in.
Sample Type: Mod. Cal. Final Sample Ht.* (L): 4.940 in
Sample Description: Dark Brown Sandy Clay Final Sample Area (A)*: 5.349 sq. in.
Induced OCR= 1.0
Cell Load Axial Back Deviator Axial Pore Shear Normal
Pressure Deformation Pressure Stress Strain Pressure Stress Stress
Change q' p'
(S1-S3) (S1-S3)/2 (S1'+S3')/2
(psi) (lbs) (in) (psi) (ksf) (%) (ksf) (ksf) (ksf)
65.0 0 0.000 30.0 0.00 0.00 0.00 0.00 5.04
65.0 87 0.004 34.2 2.34 0.07 0.60 1.17 5.61
65.0 164 0.010 37.4 4.41 0.20 1.07 2.20 6.18
65.0 223 0.016 39.2 5.98 0.32 1.32 2.99 6.71
65.0 275 0.022 40.2 7.37 0.45 1.46 3.68 7.27
65.0 325 0.029 40.6 8.70 0.59 1.53 4.35 7.86
65.0 370 0.036 40.7 9.89 0.72 1.54 4.94 8.44
65.0 412 0.043 40.6 10.99 0.86 1.52 5.50 9.01
65.0 446 0.049 40.2 11.89 1.00 1.47 5.94 9.51
65.0 472 0.056 39.7 12.56 1.13 1.39 6.28 9.93
65.0 491 0.063 39.0 13.05 1.27 1.29 6.52 10.27
65.0 504 0.070 38.3 13.38 1.41 1.19 6.69 10.54
65.0 515 0.077 37.7 13.65 1.55 1.10 6.82 10.76
65.0 523 0.084 37.0 13.84 1.70 1.01 6.92 10.95
65.0 530 0.091 36.5 14.00 1.84 0.93 7.00 11.11
65.0 545 0.113 35.0 14.34 2.28 0.72 7.17 11.49
65.0 553 0.128 34.2 14.50 2.58 0.59 7.25 11.70
65.0 560 0.143 33.4 14.64 2.89 0.49 7.32 11.87
65.0 566 0.157 32.7 14.75 3.17 0.39 7.38 12.03
65.0 572 0.172 32.1 14.86 3.47 0.30 7.43 12.17
65.0 577 0.186 31.5 14.95 3.76 0.22 7.47 12.30
65.0 582 0.200 31.0 15.03 4.05 0.14 7.52 12.42
65.0 586 0.214 30.5 15.09 4.33 0.07 7.55 12.52
65.0 591 0.229 30.0 15.17 4.63 0.00 7.59 12.63
65.0 595 0.243 29.6 15.23 4.92 -0.06 7.61 12.72
65.0 599 0.258 29.2 15.28 5.22 -0.12 7.64 12.81
65.0 602 0.273 28.8 15.31 5.52 -0.18 7.66 12.88
65.0 606 0.287 28.4 15.36 5.81 -0.23 7.68 12.96
65.0 610 0.302 28.1 15.42 6.10 -0.28 7.71 13.03
CONSOLIDATED UNDRAINED TRIAXIAL TEST WITH PORE PRESSURE MEASUREMENT
Figure F-2.373

Project Name: Westside Subway Extension Cell Pressure: 80.0 psi
Project No: 4953-10-1561 Back Pressure : 30.0 psi
Test Pit: G-203 Consolidation Pressure : 50.0 psi
Depth(ft): 49.5 Initial Sample Height: 4.941 in
Sample No.: - Initial Area of Sample: 5.387 sq. in.
Sample Type: Mod. Cal. Final Sample Ht.* (L): 4.937 in
Sample Description: Dark Brown Sandy Clay Final Sample Area (A)*: 5.359 sq. in.
Induced OCR= 1.0
Cell Load Axial Back Deviator Axial Pore Shear Normal
Pressure Deformation Pressure Stress Strain Pressure Stress Stress
Change q' p'
(S1-S3) (S1-S3)/2 (S1'+S3')/2
(psi) (lbs) (in) (psi) (ksf) (%) (ksf) (ksf) (ksf)
80.0 0 0.000 30.0 0.00 0.00 0.00 0.00 7.20
80.0 194 0.006 33.8 5.21 0.12 0.54 2.60 9.26
80.0 265 0.012 35.0 7.10 0.24 0.71 3.55 10.04
80.0 332 0.018 36.4 8.89 0.36 0.93 4.44 10.72
80.0 404 0.024 38.0 10.80 0.49 1.15 5.40 11.46
80.0 474 0.030 39.2 12.66 0.61 1.33 6.33 12.20
80.0 538 0.036 40.2 14.35 0.73 1.47 7.18 12.91
80.0 584 0.042 40.7 15.56 0.85 1.54 7.78 13.44
80.0 627 0.048 41.1 16.68 0.97 1.59 8.34 13.95
80.0 658 0.054 41.1 17.49 1.09 1.60 8.74 14.34
80.0 681 0.060 41.0 18.08 1.22 1.58 9.04 14.66
80.0 725 0.090 39.4 19.13 1.82 1.35 9.56 15.41
80.0 732 0.100 38.9 19.27 2.03 1.27 9.64 15.56
80.0 739 0.116 38.1 19.39 2.35 1.16 9.70 15.73
80.0 753 0.161 36.3 19.57 3.26 0.91 9.79 16.08
80.0 763 0.206 35.0 19.65 4.18 0.73 9.82 16.30
80.0 772 0.252 34.1 19.69 5.10 0.59 9.84 16.46
80.0 779 0.299 33.2 19.67 6.05 0.47 9.83 16.57
80.0 787 0.343 32.5 19.68 6.95 0.36 9.84 16.68
80.0 795 0.389 31.9 19.68 7.89 0.27 9.84 16.77
80.0 801 0.434 31.3 19.63 8.80 0.19 9.82 16.82
80.0 805 0.480 30.8 19.53 9.72 0.12 9.77 16.85
80.0 814 0.525 30.4 19.55 10.64 0.05 9.77 16.92
80.0 819 0.570 30.1 19.47 11.55 0.01 9.73 16.93
80.0 824 0.616 29.8 19.38 12.47 -0.04 9.69 16.93
80.0 831 0.662 29.4 19.34 13.41 -0.08 9.67 16.95
80.0 836 0.707 29.2 19.25 14.32 -0.12 9.62 16.94
80.0 843 0.752 28.9 19.20 15.23 -0.16 9.60 16.96
80.0 844 0.798 28.7 19.02 16.16 -0.18 9.51 16.89
80.0 856 0.843 28.5 19.07 17.08 -0.21 9.54 16.9580.0 863 0.889 28.4 19.02 18.00 -0.23 9.51 16.94
80.0 865 0.934 28.2 18.85 18.92 -0.26 9.42 16.89
80.0 873 0.980 28.0 18.80 19.84 -0.28 9.40 16.89
80.0 885 1.025 28.0 18.84 20.77 -0.29 9.42 16.91
80.0 888 1.070 27.9 18.69 21.68 -0.30 9.34 16.85
CONSOLIDATED UNDRAINED TRIAXIAL TEST WITH PORE PRESSURE MEASUREMENT
Figure F-2.374

LEGEND: CONFINING PRESSURES= ○ 20 psi □ 35 psi ∆ 50 psi
Project Name: Westside Subway Extension Sample Type: Mod. Cal.
Project No.: 4953-10-1561 Sample Description: Dark Brown Sandy Clay
Test Pit: G-203 Avg. Dry Unit Weight (pcf): 118.3
Sample No.: - Avg. Initial Moisture Content (%): 14.2
Depth (ft): 49.5 Confining Pressure: 20.0, 35.0, 50.0 psi
CU TRIAXIAL MULTI-STAGE TEST WITH PORE PRESSURE MEASUREMENTASTM D 4767
0
5
10
15
20
0 5 10 15 20 25 30 35 40
NORMAL STRESS, P' (ksf)
SH
EA
R S
TR
ES
S, q
' (ks
f)
0.0
2.0
4.0
6.0
8.0
10.0
12.0
14.0
16.0
18.0
20.0
0.0 5.0 10.0 15.0 20.0
AXIAL STRAIN (Percent)
DE
VIA
TO
R S
TR
ES
S (
ksf)
-4.0
-3.0
-2.0
-1.0
0.0
1.0
2.0
3.0
4.0
0.0 5.0 10.0 15.0 20.0
AXIAL STRAIN (Percent)C
HA
NG
E I
N P
OR
E W
AT
ER
PR
ES
SU
RE
(ks
f)
Figure F-2.375

LEGEND: CONFINING PRESSURES= ○ 20psi □ 35 psi ∆ 50 psi
Project Name: Westside Subway Extension Sample Type: Mod. Cal.Project No.: 4953-10-1561 Sample Description: Dark Brown Sandy ClayTest Pit: G-203 Avg. Dry Unit Weight (pcf): 118.3Sample No.: - Avg. Initial Moisture Content (%): 14.2Depth (ft): 49.5 Confining Pressure: 20.0, 35.0, 50.0 psi
CU TRIAXIAL MULTI-STAGE TEST WITH PORE PRESSURE MEASUREMENTASTM D 4767
0
5
10
15
0 5 10 15 20 25 30
NORMAL STRESS (ksf)
SH
EA
R S
TR
ES
S (
ksf)
φ=32°
φ'= 34°
0
5
10
15
20
0 5 10 15 20 25 30 35 40 p' (ksf)
q' (
ksf)
C= 1.00 ksfC'= 0.70 ksf
Failure Criteria: 5% Axial Strain
Figure F-2.376

Test Pit: G-203 Sample Type: Mod. Cal.Sample No.: - Soil Description: Dark Brown Sandy ClayDepth (feet): 49.5 Eff. Confining Pressure (psi): 35.0
Project Name: Westside Subway ExtensionProject No.: 4953-10-1561Date: 07/17/11
3.1100
120240356
37.9473
8153060
0.250.512
0.2000
Time (minutes) Volume Change (cc)0.00000.2000
00.1
SQRT Time (minutes) Volume Change (cc)0.0000 0.0000
2.82843.87305.4772
0.31620.50000.70711.00001.4142
0.2500
2.5000
0.90001.40001.70002.1000
7.7460
2.00000.9000
TIME RATE CONSOLIDATION CURVE
1.70002.10002.5000
2.90002.9500
4
ASTM D 2435
2.77002.90002.9500
10.954515.491918.8680
1440 3.1100
2.7700
0.30000.50000.7000
1.4000
0.25000.30000.50000.7000
0.00
0.50
1.00
1.50
2.00
2.50
3.00
3.50
0.1 1 10 100 1000 10000
Time (minutes)
Vol
ume
Cha
nge
(cc)
0.00
0.50
1.00
1.50
2.00
2.50
3.00
3.50
4.00
0.0 10.0 20.0 30.0 40.0
Square root Time (minutes)
Vol
ume
Cha
nge
(cc)
Figure F-2.377
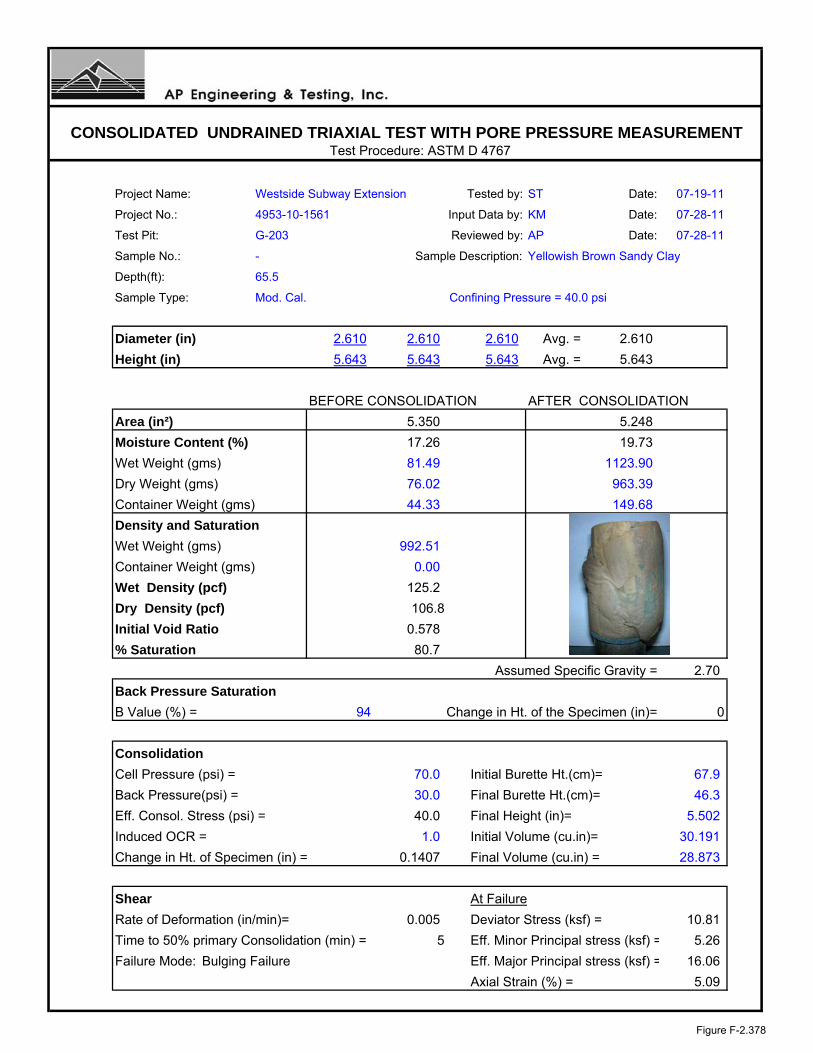
Test Procedure: ASTM D 4767
Project Name: Westside Subway Extension Tested by: ST Date: 07-19-11
Project No.: 4953-10-1561 Input Data by: KM Date: 07-28-11
Test Pit: G-203 Reviewed by: AP Date: 07-28-11
Sample No.: - Sample Description: Yellowish Brown Sandy Clay
Depth(ft): 65.5
Sample Type: Mod. Cal. Confining Pressure = 40.0 psi
Diameter (in) 2.610 2.610 2.610 Avg. = 2.610
Height (in) 5.643 5.643 5.643 Avg. = 5.643
BEFORE CONSOLIDATION AFTER CONSOLIDATION
Area (in²) 5.350 5.248
Moisture Content (%) 17.26 19.73
Wet Weight (gms) 81.49 1123.90
Dry Weight (gms) 76.02 963.39
Container Weight (gms) 44.33 149.68
Density and Saturation
Wet Weight (gms) 992.51
Container Weight (gms) 0.00
Wet Density (pcf) 125.2
Dry Density (pcf) 106.8
Initial Void Ratio 0.578
% Saturation 80.7
Assumed Specific Gravity = 2.70
Back Pressure Saturation
B Value (%) = 94 Change in Ht. of the Specimen (in)= 0
Consolidation
Cell Pressure (psi) = 70.0 Initial Burette Ht.(cm)= 67.9
Back Pressure(psi) = 30.0 Final Burette Ht.(cm)= 46.3
Eff. Consol. Stress (psi) = 40.0 Final Height (in)= 5.502
Induced OCR = 1.0 Initial Volume (cu.in)= 30.191
Change in Ht. of Specimen (in) = 0.1407 Final Volume (cu.in) = 28.873
Shear At Failure
Rate of Deformation (in/min)= 0.005 Deviator Stress (ksf) = 10.81
Time to 50% primary Consolidation (min) = 5 Eff. Minor Principal stress (ksf) = 5.26
Failure Mode: Bulging Failure Eff. Major Principal stress (ksf) = 16.06
Axial Strain (%) = 5.09
CONSOLIDATED UNDRAINED TRIAXIAL TEST WITH PORE PRESSURE MEASUREMENT
Figure F-2.378

Test Procedure: ASTM D 4767
Project Name: Westside Subway Extension Tested by: ST Date: 07-19-11
Project No.: 4953-10-1561 Input Data by: KM Date: 07-28-11
Test Pit: G-203 Reviewed by: AP Date: 07-28-11
Sample No.: - Sample Description: Yellowish Brown Sandy Clay
Depth(ft): 65.5
Sample Type: Mod. Cal. Confining Pressure = 55.0 psi
Diameter (in) 2.610 2.610 2.610 Avg. = 2.610
Height (in) 5.643 5.643 5.643 Avg. = 5.643
BEFORE CONSOLIDATION AFTER CONSOLIDATION
Area (in²) 5.350 5.261
Moisture Content (%) 17.26 19.73
Wet Weight (gms) 81.49 1123.90
Dry Weight (gms) 76.02 963.39
Container Weight (gms) 44.33 149.68
Density and Saturation
Wet Weight (gms) 992.51
Container Weight (gms) 0.00
Wet Density (pcf) 125.2
Dry Density (pcf) 106.8
Initial Void Ratio 0.578
% Saturation 80.7
Assumed Specific Gravity = 2.70
Back Pressure Saturation
B Value (%) = 94 Change in Ht. of the Specimen (in)= 0
Consolidation
Cell Pressure (psi) = 85.0 Initial Burette Ht.(cm)= 46.3
Back Pressure(psi) = 30.0 Final Burette Ht.(cm)= 38.0
Eff. Consol. Stress (psi) = 55.0 Final Height (in)= 5.642
Induced OCR= 1.0 Initial Volume (cu.in)= 30.191
Change in Ht. of Specimen (in) = 0.0011 Final Volume (cu.in) = 29.685
Shear At Failure
Rate of Deformation (in/min)= 0.005 Deviator Stress (ksf) = 11.95
Time to 50% primary Consolidation = 5 Eff. Minor Principal stress (ksf) = 5.38
Failure Mode: Bulging Failure Eff. Major Principal stress (ksf) = 17.33
Axial Strain (%) = 5.28
CONSOLIDATED UNDRAINED TRIAXIAL TEST WITH PORE PRESSURE MEASUREMENT
Figure F-2.379

Test Procedure: ASTM D 4767
Project Name: Westside Subway Extension Tested by: ST Date: 07-19-11
Project No.: Input Data by: KM Date: 07-28-11
Test Pit: G-203 Reviewed by: AP Date: 07-28-11
Sample No.: - Sample Description: Yellowish Brown Sandy Clay
Depth(ft): 65.5
Sample Type: Mod. Cal. Confining Pressure = 70.0 psi
Diameter (in) 2.610 2.610 2.610 Avg. = 2.610
Height (in) 5.643 5.643 5.643 Avg. = 5.643
BEFORE CONSOLIDATION AFTER CONSOLIDATION
Area (in²) 5.350 5.275
Moisture Content (%) 17.26 19.73
Wet Weight (gms) 81.49 1123.90
Dry Weight (gms) 76.02 963.39
Container Weight (gms) 44.33 149.68
Density and Saturation
Wet Weight (gms) 992.51
Container Weight (gms) 0.00
Wet Density (pcf) 125.2
Dry Density (pcf) 106.8
Initial Void Ratio 0.578
% Saturation 80.7
Assumed Specific Gravity = 2.70
Back Pressure Saturation
B Value (%) = 94 Change in Ht. of the Specimen (in)= 0
Consolidation
Cell Pressure (psi) = 100.0 Initial Burette Ht.(cm)= 42.7
Back Pressure(psi) = 30.0 Final Burette Ht.(cm)= 35.3
Eff. Consol. Stress (psi) = 70.0 Final Height (in)= 5.637
Induced OCR = 1.0 Initial Volume (cu.in)= 30.191
Change in Ht. of Specimen (in) = 0.0056 Final Volume (cu.in) = 29.740
Shear At Failure
Rate of Deformation (in/min)= 0.005 Deviator Stress (ksf) = 15.33
Time to 50% primary Consolidation = 5 Eff. Minor Principal stress (ksf) = 7.17
Failure Mode: Bulging Failure Eff. Major Principal stress (ksf) = 22.50
Axial Strain (%) = 3.69
CONSOLIDATED UNDRAINED TRIAXIAL TEST WITH PORE PRESSURE MEASUREMENT
4953-10-1561
Figure F-2.380

Project Name: Westside Subway Extension Cell Pressure: 70.0 psi
Project No: 4953-10-1561 Back Pressure : 30.0 psi
Test Pit: G-203 Consolidation Pressure : 40.0 psi
Depth(ft): 65.5 Initial Sample Height: 5.643 in
Sample No.: - Initial Area of Sample: 5.350 sq. in.
Sample Type: Mod. Cal. Final Sample Ht.* (L): 5.502 in
Sample Description: Yellowish Brown Sandy Clay Final Sample Area (A)*: 5.248 sq. in.
Induced OCR= 1.0
Cell Load Axial Back Deviator Axial Pore Shear Normal
Pressure Deformation Pressure Stress Strain Pressure Stress Stress
Change q' p'
(S1-S3) (S1-S3)/2 (S1'+S3')/2
(psi) (lbs) (in) (psi) (ksf) (%) (ksf) (ksf) (ksf)
70.0 0 0.000 30.0 0.00 0.00 0.00 0.00 5.76
70.0 48 0.005 33.1 1.32 0.09 0.44 0.66 5.97
70.0 74 0.012 35.2 2.03 0.22 0.74 1.01 6.03
70.0 95 0.019 36.6 2.60 0.35 0.95 1.30 6.10
70.0 114 0.026 37.8 3.11 0.47 1.12 1.56 6.20
70.0 133 0.034 38.7 3.63 0.61 1.25 1.81 6.33
70.0 151 0.040 39.3 4.11 0.73 1.34 2.06 6.48
70.0 169 0.047 39.8 4.60 0.85 1.41 2.30 6.65
70.0 186 0.054 40.0 5.05 0.99 1.45 2.53 6.84
70.0 203 0.061 40.2 5.51 1.12 1.47 2.75 7.04
70.0 219 0.068 40.2 5.94 1.24 1.47 2.97 7.25
70.0 234 0.075 40.2 6.33 1.36 1.46 3.17 7.46
70.0 248 0.082 40.3 6.70 1.48 1.48 3.35 7.63
70.0 261 0.089 40.1 7.05 1.61 1.45 3.52 7.84
70.0 274 0.096 39.8 7.39 1.74 1.41 3.69 8.04
70.0 285 0.102 39.6 7.68 1.86 1.38 3.84 8.22
70.0 295 0.109 39.3 7.93 1.98 1.34 3.97 8.39
70.0 305 0.116 39.0 8.19 2.12 1.30 4.10 8.56
70.0 314 0.123 38.9 8.42 2.24 1.28 4.21 8.69
70.0 322 0.130 38.6 8.63 2.37 1.23 4.31 8.84
70.0 330 0.138 38.2 8.83 2.50 1.18 4.41 8.99
70.0 338 0.145 37.8 9.03 2.64 1.12 4.52 9.16
70.0 345 0.152 37.3 9.21 2.77 1.05 4.60 9.32
70.0 351 0.159 36.9 9.35 2.89 1.00 4.68 9.44
70.0 358 0.167 36.5 9.53 3.03 0.94 4.76 9.58
70.0 363 0.174 36.2 9.65 3.15 0.90 4.82 9.68
70.0 369 0.181 35.9 9.79 3.29 0.85 4.90 9.81
70.0 374 0.188 35.6 9.91 3.42 0.80 4.96 9.91
70.0 379 0.195 35.2 10.03 3.55 0.75 5.02 10.02
70.0 384 0.202 34.9 10.15 3.67 0.70 5.08 10.13
70.0 388 0.209 34.7 10.24 3.80 0.67 5.12 10.21
70.0 393 0.216 34.4 10.36 3.93 0.64 5.18 10.31
70.0 396 0.224 34.3 10.43 4.06 0.62 5.21 10.36
70.0 407 0.245 33.7 10.67 4.46 0.54 5.34 10.56
70.0 410 0.253 33.6 10.73 4.59 0.52 5.37 10.6170.0 415 0.280 33.5 10.81 5.09 0.50 5.40 10.66
CONSOLIDATED UNDRAINED TRIAXIAL TEST WITH PORE PRESSURE MEASUREMENT
Figure F-2.381

Project Name: Westside Subway Extension Cell Pressure: 85.0 psi
Project No: 4953-10-1561 Back Pressure : 30.0 psi
Test Pit: G-203 Consolidation Pressure : 55.0 psi
Depth(ft): 65.5 Initial Sample Height: 5.643 in
Sample No.: - Initial Area of Sample: 5.350 sq. in.
Sample Type: Mod. Cal. Final Sample Ht.* (L): 5.642 in
Sample Description: Yellowish Brown Sandy Clay Final Sample Area (A)*: 5.261 sq. in.
Induced OCR= 1.0
Cell Load Axial Back Deviator Axial Pore Shear Normal
Pressure Deformation Pressure Stress Strain Pressure Stress Stress
Change q' p'
(S1-S3) (S1-S3)/2 (S1'+S3')/2
(psi) (lbs) (in) (psi) (ksf) (%) (ksf) (ksf) (ksf)
85.0 0 0.001 30.0 0.00 0.01 0.00 0.00 7.92
85.0 109 0.005 33.9 2.98 0.09 0.56 1.49 8.85
85.0 168 0.012 38.5 4.59 0.20 1.22 2.29 9.00
85.0 209 0.018 41.7 5.70 0.31 1.69 2.85 9.08
85.0 243 0.025 44.2 6.62 0.44 2.04 3.31 9.19
85.0 270 0.031 46.0 7.35 0.55 2.31 3.67 9.29
85.0 295 0.037 47.4 8.02 0.66 2.51 4.01 9.42
85.0 315 0.044 48.5 8.55 0.78 2.66 4.28 9.54
85.0 332 0.051 49.2 9.00 0.91 2.77 4.50 9.65
85.0 347 0.058 49.8 9.40 1.02 2.85 4.70 9.77
85.0 359 0.064 50.2 9.71 1.14 2.91 4.86 9.87
85.0 369 0.071 50.4 9.97 1.26 2.94 4.99 9.97
85.0 378 0.078 50.6 10.20 1.38 2.96 5.10 10.06
85.0 386 0.085 50.6 10.41 1.50 2.97 5.20 10.15
85.0 392 0.092 50.7 10.55 1.63 2.97 5.28 10.22
85.0 407 0.112 50.5 10.92 1.99 2.96 5.46 10.42
85.0 415 0.126 50.3 11.10 2.24 2.93 5.55 10.54
85.0 421 0.141 50.1 11.23 2.49 2.90 5.62 10.64
85.0 426 0.155 49.9 11.34 2.74 2.87 5.67 10.72
85.0 431 0.169 49.7 11.44 3.00 2.84 5.72 10.81
85.0 436 0.184 49.5 11.54 3.25 2.80 5.77 10.89
85.0 440 0.198 49.2 11.62 3.50 2.77 5.81 10.96
85.0 445 0.212 49.0 11.72 3.75 2.74 5.86 11.05
85.0 448 0.226 48.8 11.77 4.00 2.70 5.89 11.10
85.0 452 0.240 48.5 11.84 4.26 2.67 5.92 11.17
85.0 454 0.255 48.3 11.86 4.51 2.64 5.93 11.22
85.0 457 0.269 48.1 11.91 4.77 2.60 5.96 11.27
85.0 459 0.284 47.9 11.93 5.04 2.57 5.96 11.31
85.0 461 0.298 47.6 11.95 5.28 2.54 5.98 11.36
CONSOLIDATED UNDRAINED TRIAXIAL TEST WITH PORE PRESSURE MEASUREMENT
Figure F-2.382
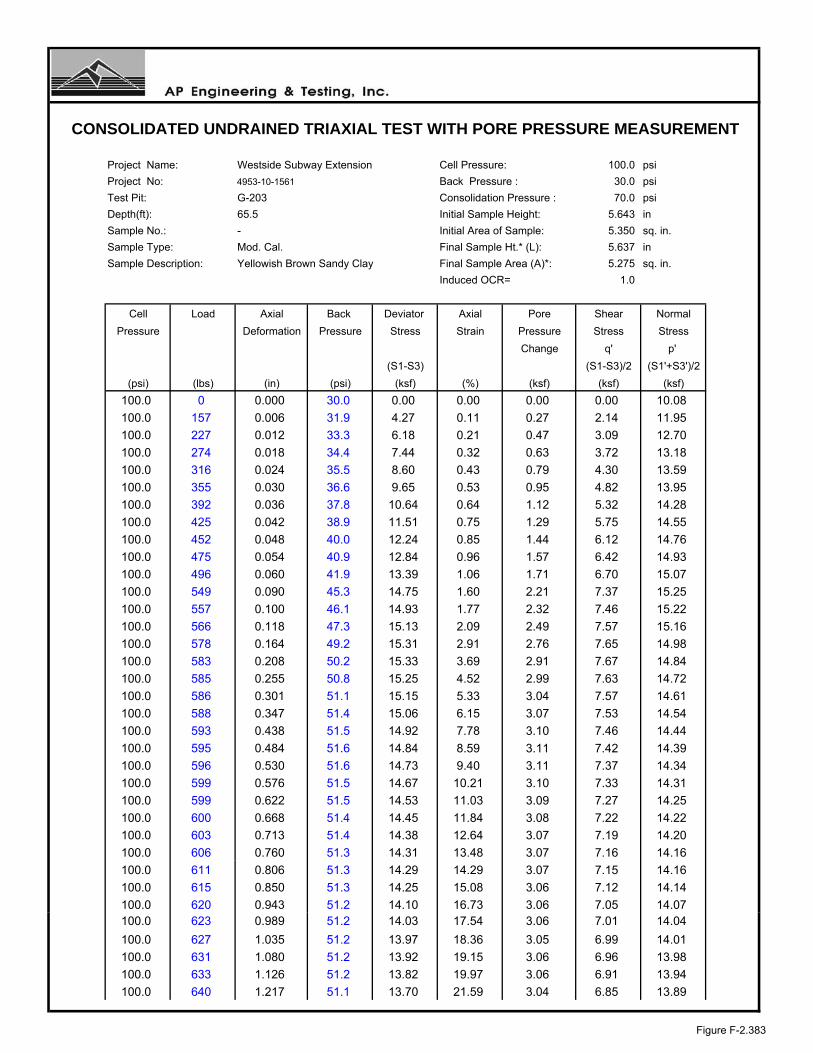
Project Name: Westside Subway Extension Cell Pressure: 100.0 psi
Project No: 4953-10-1561 Back Pressure : 30.0 psi
Test Pit: G-203 Consolidation Pressure : 70.0 psi
Depth(ft): 65.5 Initial Sample Height: 5.643 in
Sample No.: - Initial Area of Sample: 5.350 sq. in.
Sample Type: Mod. Cal. Final Sample Ht.* (L): 5.637 in
Sample Description: Yellowish Brown Sandy Clay Final Sample Area (A)*: 5.275 sq. in.
Induced OCR= 1.0
Cell Load Axial Back Deviator Axial Pore Shear Normal
Pressure Deformation Pressure Stress Strain Pressure Stress Stress
Change q' p'
(S1-S3) (S1-S3)/2 (S1'+S3')/2
(psi) (lbs) (in) (psi) (ksf) (%) (ksf) (ksf) (ksf)
100.0 0 0.000 30.0 0.00 0.00 0.00 0.00 10.08
100.0 157 0.006 31.9 4.27 0.11 0.27 2.14 11.95
100.0 227 0.012 33.3 6.18 0.21 0.47 3.09 12.70
100.0 274 0.018 34.4 7.44 0.32 0.63 3.72 13.18
100.0 316 0.024 35.5 8.60 0.43 0.79 4.30 13.59
100.0 355 0.030 36.6 9.65 0.53 0.95 4.82 13.95
100.0 392 0.036 37.8 10.64 0.64 1.12 5.32 14.28
100.0 425 0.042 38.9 11.51 0.75 1.29 5.75 14.55
100.0 452 0.048 40.0 12.24 0.85 1.44 6.12 14.76
100.0 475 0.054 40.9 12.84 0.96 1.57 6.42 14.93
100.0 496 0.060 41.9 13.39 1.06 1.71 6.70 15.07
100.0 549 0.090 45.3 14.75 1.60 2.21 7.37 15.25
100.0 557 0.100 46.1 14.93 1.77 2.32 7.46 15.22
100.0 566 0.118 47.3 15.13 2.09 2.49 7.57 15.16
100.0 578 0.164 49.2 15.31 2.91 2.76 7.65 14.98
100.0 583 0.208 50.2 15.33 3.69 2.91 7.67 14.84
100.0 585 0.255 50.8 15.25 4.52 2.99 7.63 14.72
100.0 586 0.301 51.1 15.15 5.33 3.04 7.57 14.61
100.0 588 0.347 51.4 15.06 6.15 3.07 7.53 14.54
100.0 593 0.438 51.5 14.92 7.78 3.10 7.46 14.44
100.0 595 0.484 51.6 14.84 8.59 3.11 7.42 14.39
100.0 596 0.530 51.6 14.73 9.40 3.11 7.37 14.34
100.0 599 0.576 51.5 14.67 10.21 3.10 7.33 14.31
100.0 599 0.622 51.5 14.53 11.03 3.09 7.27 14.25
100.0 600 0.668 51.4 14.45 11.84 3.08 7.22 14.22
100.0 603 0.713 51.4 14.38 12.64 3.07 7.19 14.20
100.0 606 0.760 51.3 14.31 13.48 3.07 7.16 14.16
100.0 611 0.806 51.3 14.29 14.29 3.07 7.15 14.16
100.0 615 0.850 51.3 14.25 15.08 3.06 7.12 14.14
100.0 620 0.943 51.2 14.10 16.73 3.06 7.05 14.07100.0 623 0.989 51.2 14.03 17.54 3.06 7.01 14.04
100.0 627 1.035 51.2 13.97 18.36 3.05 6.99 14.01
100.0 631 1.080 51.2 13.92 19.15 3.06 6.96 13.98
100.0 633 1.126 51.2 13.82 19.97 3.06 6.91 13.94
100.0 640 1.217 51.1 13.70 21.59 3.04 6.85 13.89
CONSOLIDATED UNDRAINED TRIAXIAL TEST WITH PORE PRESSURE MEASUREMENT
Figure F-2.383

LEGEND: CONFINING PRESSURES= ○ 40 psi □ 55 psi ∆ 70 psi
Project Name: Westside Subway Extension Sample Type: Mod. Cal.
Project No.: 4953-10-1561 Sample Description: Yellowish Brown Sandy Clay
Test Pit: G-203 Avg. Dry Unit Weight (pcf): 106.8
Sample No.: - Avg. Initial Moisture Content (%): 17.3
Depth (ft): 65.5 Confining Pressure: 40.0, 55.0, 70.0 psi
CU TRIAXIAL MULTI-STAGE TEST WITH PORE PRESSURE MEASUREMENTASTM D 4767
0
5
10
15
20
0 5 10 15 20 25 30 35 40
NORMAL STRESS, P' (ksf)
SH
EA
R S
TR
ES
S, q
' (ks
f)
0.0
2.0
4.0
6.0
8.0
10.0
12.0
14.0
16.0
18.0
20.0
0.0 5.0 10.0 15.0 20.0
AXIAL STRAIN (Percent)
DE
VIA
TO
R S
TR
ES
S (
ksf)
-1.0
0.0
1.0
2.0
3.0
4.0
5.0
0.0 1.0 2.0 3.0 4.0 5.0
AXIAL STRAIN (Percent)C
HA
NG
E I
N P
OR
E W
AT
ER
PR
ES
SU
RE
(ks
f)
Figure F-2.384

LEGEND: CONFINING PRESSURES= ○ 40 psi □ 55 psi ∆ 70 psi
Project Name: Westside Subway Extension Sample Type: Mod. Cal.Project No.: 4953-10-1561 Sample Description: Yellowish Brown Sandy ClayTest Pit: G-203 Avg. Dry Unit Weight (pcf): 106.8Sample No.: - Avg. Initial Moisture Content (%): 17.3Depth (ft): 65.5 Confining Pressure: 40.0, 55.0, 70.0 psi
CU TRIAXIAL MULTI-STAGE TEST WITH PORE PRESSURE MEASUREMENTASTM D 4767
0
5
10
15
0 5 10 15 20 25 30
NORMAL STRESS (ksf)
SH
EA
R S
TR
ES
S (
ksf)
φ=22°
φ'= 31°
0
5
10
15
20
0 5 10 15 20 25 30 35 40 p' (ksf)
q' (
ksf)
C= 1.20 ksfC'= 0.10 ksf
Failure Criteria: 5% Axial Strain
Figure F-2.385
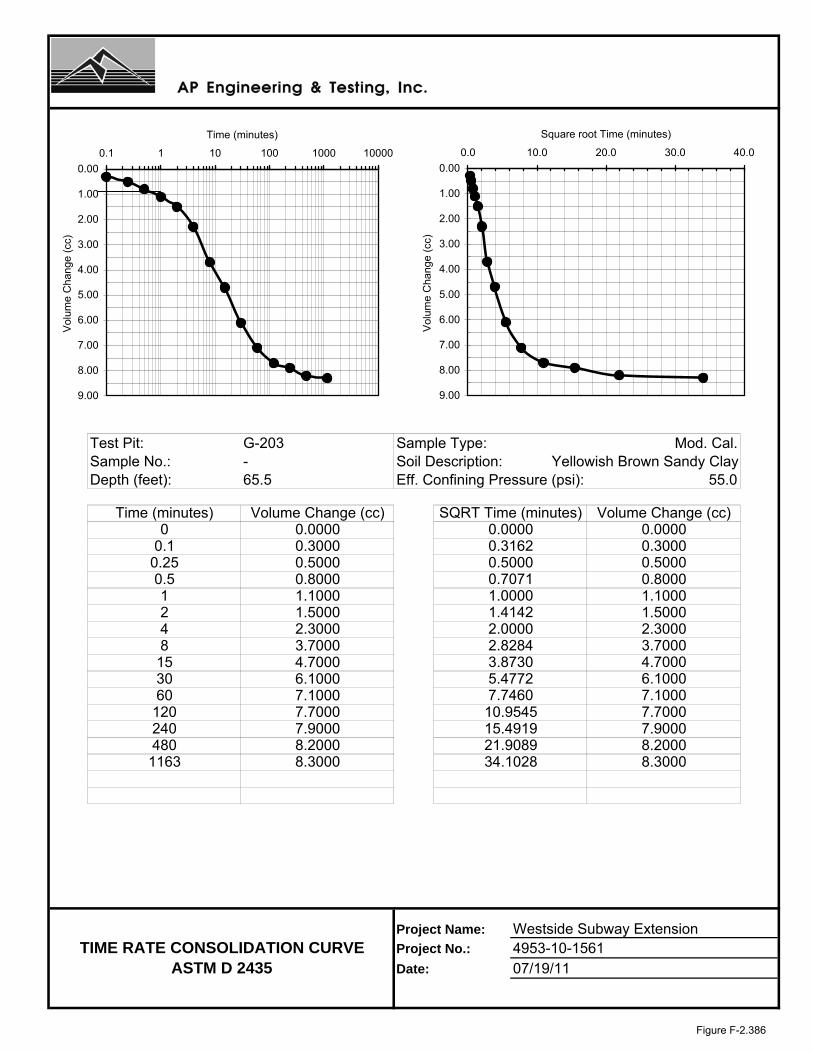
Test Pit: G-203 Sample Type: Mod. Cal.Sample No.: - Soil Description: Yellowish Brown Sandy ClayDepth (feet): 65.5 Eff. Confining Pressure (psi): 55.0
Project Name: Westside Subway ExtensionProject No.: 4953-10-1561Date: 07/19/11
8.3000
120240480
34.1028
8153060
0.250.512
0.3000
Time (minutes) Volume Change (cc)0.00000.3000
00.1
SQRT Time (minutes) Volume Change (cc)0.0000 0.0000
2.82843.87305.4772
0.31620.50000.70711.00001.4142
0.5000
7.1000
2.30003.70004.70006.1000
7.7460
2.00002.3000
TIME RATE CONSOLIDATION CURVE
4.70006.10007.1000
7.90008.2000
4
ASTM D 2435
7.70007.90008.2000
10.954515.491921.9089
1163 8.3000
7.7000
0.80001.10001.5000
3.7000
0.50000.80001.10001.5000
0.00
1.00
2.00
3.00
4.00
5.00
6.00
7.00
8.00
9.00
0.1 1 10 100 1000 10000
Time (minutes)
Vol
ume
Cha
nge
(cc)
0.00
1.00
2.00
3.00
4.00
5.00
6.00
7.00
8.00
9.00
0.0 10.0 20.0 30.0 40.0
Square root Time (minutes)
Vol
ume
Cha
nge
(cc)
Figure F-2.386

Test Procedure: ASTM D 4767
Project Name: Westside Subway Extension Tested by: ST Date: 07-19-11
Project No.: 4953-10-1561 Input Data by: KM Date: 07-28-11
Test Pit: G-204 Reviewed by: AP Date: 07-28-11
Sample No.: - Sample Description: Brown Lean Clay
Depth(ft): 5.5
Sample Type: Mod. Cal. Confining Pressure = 5.0 psi
Diameter (in) 2.610 2.610 2.610 Avg. = 2.610
Height (in) 5.622 5.622 5.622 Avg. = 5.622
BEFORE CONSOLIDATION AFTER CONSOLIDATION
Area (in²) 5.350 5.347
Moisture Content (%) 16.49 19.86
Wet Weight (gms) 96.40 1162.13
Dry Weight (gms) 89.74 994.30
Container Weight (gms) 49.34 149.23
Density and Saturation
Wet Weight (gms) 1022.99
Container Weight (gms) 0.00
Wet Density (pcf) 129.6
Dry Density (pcf) 111.2
Initial Void Ratio 0.515
% Saturation 86.5
Assumed Specific Gravity = 2.70
Back Pressure Saturation
B Value (%) = 96 Change in Ht. of the Specimen (in)= 0
Consolidation
Cell Pressure (psi) = 35.0 Initial Burette Ht.(cm)= 52.2
Back Pressure(psi) = 30.0 Final Burette Ht.(cm)= 50.5
Eff. Consol. Stress (psi) = 5.0 Final Height (in)= 5.607
Induced OCR = 1.0 Initial Volume (cu.in)= 30.079
Change in Ht. of Specimen (in) = 0.0155 Final Volume (cu.in) = 29.975
Shear At Failure
Rate of Deformation (in/min)= 0.004 Deviator Stress (ksf) = 2.74
Time to 50% primary Consolidation (min) = 6 Eff. Minor Principal stress (ksf) = 0.51
Failure Mode: Bulging Failure Eff. Major Principal stress (ksf) = 3.25
Axial Strain (%) = 5.43
CONSOLIDATED UNDRAINED TRIAXIAL TEST WITH PORE PRESSURE MEASUREMENT
Figure F-2.387

Test Procedure: ASTM D 4767
Project Name: Westside Subway Extension Tested by: ST Date: 07-19-11
Project No.: 4953-10-1561 Input Data by: KM Date: 07-28-11
Test Pit: G-204 Reviewed by: AP Date: 07-28-11
Sample No.: - Sample Description: Brown Lean Clay
Depth(ft): 5.5
Sample Type: Mod. Cal. Confining Pressure = 10.0 psi
Diameter (in) 2.610 2.610 2.610 Avg. = 2.610
Height (in) 5.622 5.622 5.622 Avg. = 5.622
BEFORE CONSOLIDATION AFTER CONSOLIDATION
Area (in²) 5.350 5.273
Moisture Content (%) 16.49 19.86
Wet Weight (gms) 96.40 1162.13
Dry Weight (gms) 89.74 994.30
Container Weight (gms) 49.34 149.23
Density and Saturation
Wet Weight (gms) 1022.99
Container Weight (gms) 0.00
Wet Density (pcf) 129.6
Dry Density (pcf) 111.2
Initial Void Ratio 0.515
% Saturation 86.5
Assumed Specific Gravity = 2.70
Back Pressure Saturation
B Value (%) = 96 Change in Ht. of the Specimen (in)= 0
Consolidation
Cell Pressure (psi) = 40.0 Initial Burette Ht.(cm)= 50.5
Back Pressure(psi) = 30.0 Final Burette Ht.(cm)= 43.3
Eff. Consol. Stress (psi) = 10.0 Final Height (in)= 5.621
Induced OCR= 1.0 Initial Volume (cu.in)= 30.079
Change in Ht. of Specimen (in) = 0.0006 Final Volume (cu.in) = 29.640
Shear At Failure
Rate of Deformation (in/min)= 0.004 Deviator Stress (ksf) = 4.47
Time to 50% primary Consolidation = 6 Eff. Minor Principal stress (ksf) = 1.01
Failure Mode: Bulging Failure Eff. Major Principal stress (ksf) = 5.48
Axial Strain (%) = 5.33
CONSOLIDATED UNDRAINED TRIAXIAL TEST WITH PORE PRESSURE MEASUREMENT
Figure F-2.388

Test Procedure: ASTM D 4767
Project Name: Westside Subway Extension Tested by: ST Date: 07-19-11
Project No.: Input Data by: KM Date: 07-28-11
Test Pit: G-204 Reviewed by: AP Date: 07-28-11
Sample No.: - Sample Description: Brown Lean Clay
Depth(ft): 5.5
Sample Type: Mod. Cal. Confining Pressure = 15.0 psi
Diameter (in) 2.610 2.610 2.610 Avg. = 2.610
Height (in) 5.622 5.622 5.622 Avg. = 5.622
BEFORE CONSOLIDATION AFTER CONSOLIDATION
Area (in²) 5.350 5.290
Moisture Content (%) 16.49 19.86
Wet Weight (gms) 96.40 1162.13
Dry Weight (gms) 89.74 994.30
Container Weight (gms) 49.34 149.23
Density and Saturation
Wet Weight (gms) 1022.99
Container Weight (gms) 0.00
Wet Density (pcf) 129.6
Dry Density (pcf) 111.2
Initial Void Ratio 0.515
% Saturation 86.5
Assumed Specific Gravity = 2.70
Back Pressure Saturation
B Value (%) = 96 Change in Ht. of the Specimen (in)= 0
Consolidation
Cell Pressure (psi) = 45.0 Initial Burette Ht.(cm)= 43.4
Back Pressure(psi) = 30.0 Final Burette Ht.(cm)= 37.8
Eff. Consol. Stress (psi) = 15.0 Final Height (in)= 5.622
Induced OCR = 1.0 Initial Volume (cu.in)= 30.079
Change in Ht. of Specimen (in) = 0.0003 Final Volume (cu.in) = 29.737
Shear At Failure
Rate of Deformation (in/min)= 0.004 Deviator Stress (ksf) = 6.57
Time to 50% primary Consolidation = 6 Eff. Minor Principal stress (ksf) = 1.82
Failure Mode: Bulging Failure Eff. Major Principal stress (ksf) = 8.40
Axial Strain (%) = 4.92
CONSOLIDATED UNDRAINED TRIAXIAL TEST WITH PORE PRESSURE MEASUREMENT
4953-10-1561
Figure F-2.389
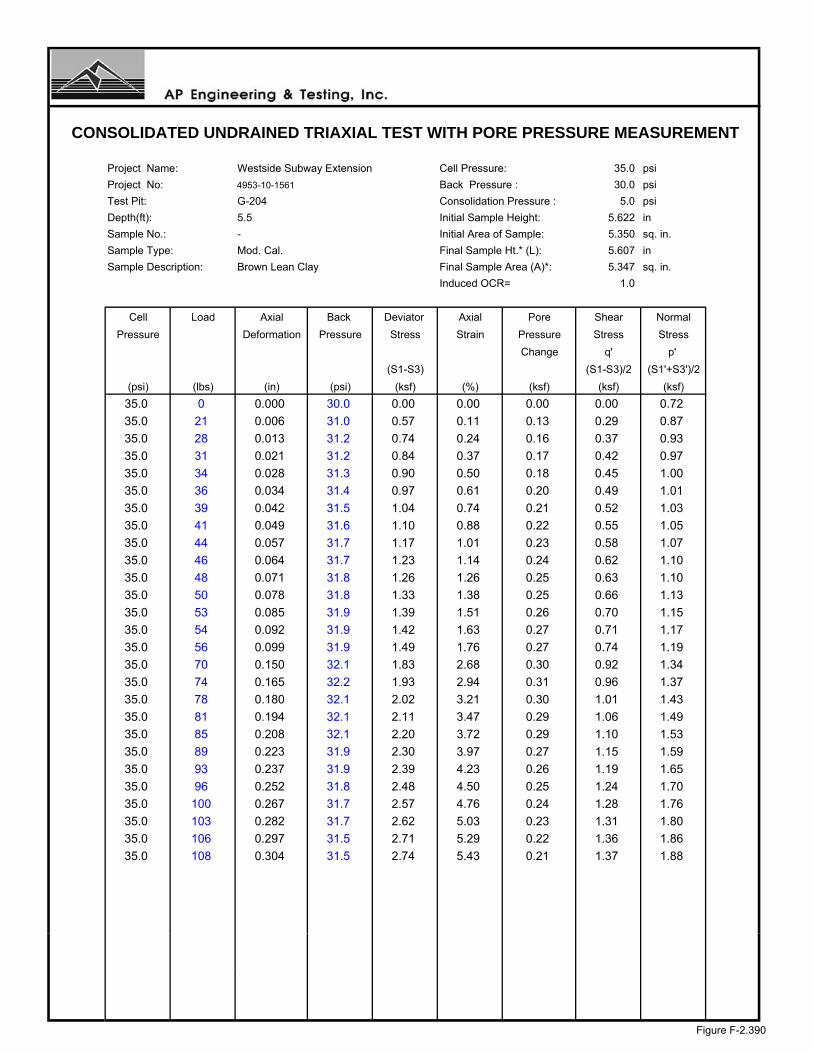
Project Name: Westside Subway Extension Cell Pressure: 35.0 psi
Project No: 4953-10-1561 Back Pressure : 30.0 psi
Test Pit: G-204 Consolidation Pressure : 5.0 psi
Depth(ft): 5.5 Initial Sample Height: 5.622 in
Sample No.: - Initial Area of Sample: 5.350 sq. in.
Sample Type: Mod. Cal. Final Sample Ht.* (L): 5.607 in
Sample Description: Brown Lean Clay Final Sample Area (A)*: 5.347 sq. in.
Induced OCR= 1.0
Cell Load Axial Back Deviator Axial Pore Shear Normal
Pressure Deformation Pressure Stress Strain Pressure Stress Stress
Change q' p'
(S1-S3) (S1-S3)/2 (S1'+S3')/2
(psi) (lbs) (in) (psi) (ksf) (%) (ksf) (ksf) (ksf)
35.0 0 0.000 30.0 0.00 0.00 0.00 0.00 0.72
35.0 21 0.006 31.0 0.57 0.11 0.13 0.29 0.87
35.0 28 0.013 31.2 0.74 0.24 0.16 0.37 0.93
35.0 31 0.021 31.2 0.84 0.37 0.17 0.42 0.97
35.0 34 0.028 31.3 0.90 0.50 0.18 0.45 1.00
35.0 36 0.034 31.4 0.97 0.61 0.20 0.49 1.01
35.0 39 0.042 31.5 1.04 0.74 0.21 0.52 1.03
35.0 41 0.049 31.6 1.10 0.88 0.22 0.55 1.05
35.0 44 0.057 31.7 1.17 1.01 0.23 0.58 1.07
35.0 46 0.064 31.7 1.23 1.14 0.24 0.62 1.10
35.0 48 0.071 31.8 1.26 1.26 0.25 0.63 1.10
35.0 50 0.078 31.8 1.33 1.38 0.25 0.66 1.13
35.0 53 0.085 31.9 1.39 1.51 0.26 0.70 1.15
35.0 54 0.092 31.9 1.42 1.63 0.27 0.71 1.17
35.0 56 0.099 31.9 1.49 1.76 0.27 0.74 1.19
35.0 70 0.150 32.1 1.83 2.68 0.30 0.92 1.34
35.0 74 0.165 32.2 1.93 2.94 0.31 0.96 1.37
35.0 78 0.180 32.1 2.02 3.21 0.30 1.01 1.43
35.0 81 0.194 32.1 2.11 3.47 0.29 1.06 1.49
35.0 85 0.208 32.1 2.20 3.72 0.29 1.10 1.53
35.0 89 0.223 31.9 2.30 3.97 0.27 1.15 1.59
35.0 93 0.237 31.9 2.39 4.23 0.26 1.19 1.65
35.0 96 0.252 31.8 2.48 4.50 0.25 1.24 1.70
35.0 100 0.267 31.7 2.57 4.76 0.24 1.28 1.76
35.0 103 0.282 31.7 2.62 5.03 0.23 1.31 1.80
35.0 106 0.297 31.5 2.71 5.29 0.22 1.36 1.86
35.0 108 0.304 31.5 2.74 5.43 0.21 1.37 1.88
CONSOLIDATED UNDRAINED TRIAXIAL TEST WITH PORE PRESSURE MEASUREMENT
Figure F-2.390

Project Name: Westside Subway Extension Cell Pressure: 40.0 psi
Project No: 4953-10-1561 Back Pressure : 30.0 psi
Test Pit: G-204 Consolidation Pressure : 10.0 psi
Depth(ft): 5.5 Initial Sample Height: 5.622 in
Sample No.: - Initial Area of Sample: 5.350 sq. in.
Sample Type: Mod. Cal. Final Sample Ht.* (L): 5.621 in
Sample Description: Brown Lean Clay Final Sample Area (A)*: 5.273 sq. in.
Induced OCR= 1.0
Cell Load Axial Back Deviator Axial Pore Shear Normal
Pressure Deformation Pressure Stress Strain Pressure Stress Stress
Change q' p'
(S1-S3) (S1-S3)/2 (S1'+S3')/2
(psi) (lbs) (in) (psi) (ksf) (%) (ksf) (ksf) (ksf)
40.0 0 0.001 30.0 0.00 0.01 0.00 0.00 1.44
40.0 30 0.006 32.4 0.82 0.10 0.34 0.41 1.51
40.0 44 0.012 33.3 1.20 0.21 0.47 0.60 1.57
40.0 55 0.019 33.9 1.50 0.33 0.56 0.75 1.63
40.0 65 0.026 34.3 1.77 0.46 0.62 0.88 1.70
40.0 74 0.033 34.6 2.01 0.59 0.67 1.00 1.78
40.0 82 0.040 34.9 2.22 0.71 0.71 1.11 1.84
40.0 90 0.047 35.1 2.44 0.83 0.74 1.22 1.92
40.0 96 0.054 35.3 2.60 0.96 0.76 1.30 1.98
40.0 102 0.061 35.4 2.76 1.09 0.77 1.38 2.05
40.0 108 0.069 35.4 2.91 1.23 0.78 1.46 2.12
40.0 112 0.076 35.4 3.02 1.35 0.78 1.51 2.17
40.0 116 0.083 35.4 3.12 1.47 0.77 1.56 2.23
40.0 120 0.089 35.3 3.23 1.59 0.77 1.61 2.28
40.0 123 0.097 35.3 3.30 1.72 0.76 1.65 2.33
40.0 131 0.119 35.1 3.50 2.11 0.73 1.75 2.46
40.0 136 0.133 35.0 3.63 2.37 0.71 1.81 2.54
40.0 139 0.148 34.8 3.70 2.63 0.69 1.85 2.60
40.0 143 0.162 34.6 3.79 2.88 0.66 1.90 2.67
40.0 146 0.176 34.4 3.86 3.13 0.64 1.93 2.73
40.0 150 0.191 34.3 3.96 3.39 0.61 1.98 2.81
40.0 153 0.205 34.1 4.03 3.65 0.59 2.01 2.87
40.0 157 0.219 33.9 4.12 3.90 0.56 2.06 2.94
40.0 160 0.234 33.8 4.19 4.16 0.54 2.09 2.99
40.0 163 0.249 33.6 4.25 4.43 0.52 2.13 3.05
40.0 166 0.263 33.4 4.32 4.68 0.49 2.16 3.11
40.0 169 0.278 33.3 4.39 4.94 0.47 2.19 3.17
40.0 171 0.292 33.1 4.43 5.20 0.44 2.21 3.21
40.0 173 0.300 33.0 4.47 5.33 0.43 2.24 3.24
CONSOLIDATED UNDRAINED TRIAXIAL TEST WITH PORE PRESSURE MEASUREMENT
Figure F-2.391

Project Name: Westside Subway Extension Cell Pressure: 45.0 psi
Project No: 4953-10-1561 Back Pressure : 30.0 psi
Test Pit: G-204 Consolidation Pressure : 15.0 psi
Depth(ft): 5.5 Initial Sample Height: 5.622 in
Sample No.: - Initial Area of Sample: 5.350 sq. in.
Sample Type: Mod. Cal. Final Sample Ht.* (L): 5.622 in
Sample Description: Brown Lean Clay Final Sample Area (A)*: 5.290 sq. in.
Induced OCR= 1.0
Cell Load Axial Back Deviator Axial Pore Shear Normal
Pressure Deformation Pressure Stress Strain Pressure Stress Stress
Change q' p'
(S1-S3) (S1-S3)/2 (S1'+S3')/2
(psi) (lbs) (in) (psi) (ksf) (%) (ksf) (ksf) (ksf)
45.0 0 0.000 30.0 0.00 0.00 0.00 0.00 2.16
45.0 45 0.006 33.3 1.22 0.11 0.48 0.61 2.30
45.0 64 0.012 34.5 1.74 0.21 0.65 0.87 2.38
45.0 77 0.018 35.2 2.09 0.32 0.75 1.04 2.46
45.0 91 0.024 35.9 2.47 0.43 0.85 1.23 2.55
45.0 101 0.030 36.3 2.73 0.53 0.91 1.37 2.62
45.0 114 0.036 36.7 3.08 0.64 0.97 1.54 2.74
45.0 126 0.042 37.0 3.40 0.75 1.01 1.70 2.85
45.0 137 0.048 37.3 3.70 0.85 1.05 1.85 2.96
45.0 148 0.054 37.5 3.99 0.96 1.08 2.00 3.08
45.0 160 0.060 37.6 4.31 1.07 1.10 2.15 3.21
45.0 197 0.090 37.5 5.28 1.60 1.07 2.64 3.72
45.0 204 0.100 37.2 5.45 1.78 1.04 2.73 3.85
45.0 221 0.137 35.4 5.87 2.44 0.78 2.93 4.32
45.0 235 0.184 34.3 6.19 3.27 0.61 3.09 4.64
45.0 245 0.229 33.2 6.40 4.08 0.46 3.20 4.90
45.0 254 0.277 32.3 6.57 4.92 0.34 3.29 5.11
45.0 261 0.322 31.5 6.70 5.73 0.22 3.35 5.29
45.0 268 0.368 31.0 6.82 6.55 0.14 3.41 5.43
45.0 274 0.416 30.2 6.91 7.40 0.03 3.45 5.58
45.0 279 0.462 29.7 6.97 8.22 -0.05 3.49 5.69
45.0 284 0.509 29.1 7.03 9.05 -0.13 3.52 5.81
45.0 289 0.556 28.6 7.09 9.88 -0.20 3.54 5.91
45.0 293 0.602 28.2 7.12 10.70 -0.26 3.56 5.99
45.0 298 0.649 27.8 7.18 11.54 -0.32 3.59 6.07
45.0 302 0.696 27.4 7.20 12.37 -0.38 3.60 6.14
45.0 305 0.742 26.9 7.21 13.20 -0.44 3.60 6.20
45.0 309 0.789 26.6 7.23 14.04 -0.50 3.62 6.27
45.0 311 0.835 26.2 7.21 14.85 -0.55 3.60 6.32
45.0 315 0.882 25.8 7.23 15.68 -0.61 3.62 6.3945.0 317 0.928 25.8 7.20 16.51 -0.61 3.60 6.37
45.0 320 0.975 25.3 7.20 17.33 -0.68 3.60 6.44
45.0 324 1.022 25.0 7.22 18.17 -0.72 3.61 6.49
45.0 330 1.161 24.6 7.13 20.65 -0.78 3.56 6.50
45.0 332 1.207 24.3 7.10 21.47 -0.82 3.55 6.53
CONSOLIDATED UNDRAINED TRIAXIAL TEST WITH PORE PRESSURE MEASUREMENT
Figure F-2.392
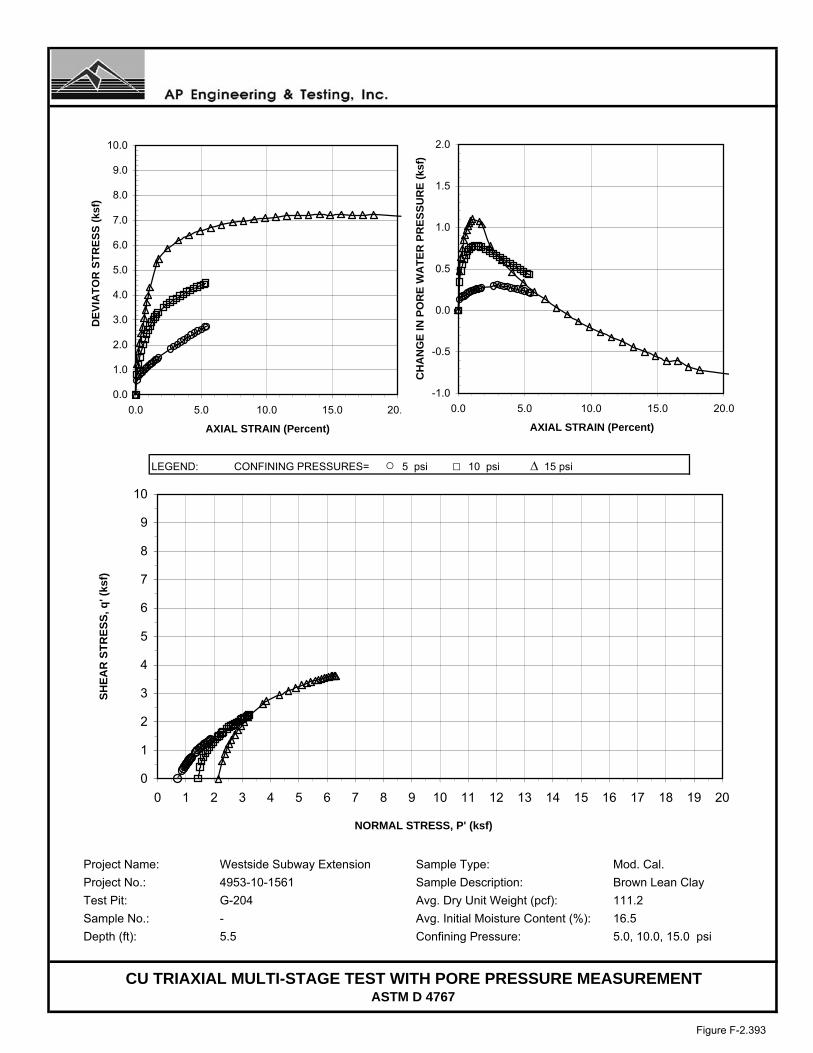
LEGEND: CONFINING PRESSURES= ○ 5 psi □ 10 psi ∆ 15 psi
Project Name: Westside Subway Extension Sample Type: Mod. Cal.
Project No.: 4953-10-1561 Sample Description: Brown Lean Clay
Test Pit: G-204 Avg. Dry Unit Weight (pcf): 111.2
Sample No.: - Avg. Initial Moisture Content (%): 16.5
Depth (ft): 5.5 Confining Pressure: 5.0, 10.0, 15.0 psi
CU TRIAXIAL MULTI-STAGE TEST WITH PORE PRESSURE MEASUREMENTASTM D 4767
0
1
2
3
4
5
6
7
8
9
10
0 1 2 3 4 5 6 7 8 9 10 11 12 13 14 15 16 17 18 19 20
NORMAL STRESS, P' (ksf)
SH
EA
R S
TR
ES
S, q
' (ks
f)
0.0
1.0
2.0
3.0
4.0
5.0
6.0
7.0
8.0
9.0
10.0
0.0 5.0 10.0 15.0 20.0
AXIAL STRAIN (Percent)
DE
VIA
TO
R S
TR
ES
S (
ksf)
-1.0
-0.5
0.0
0.5
1.0
1.5
2.0
0.0 5.0 10.0 15.0 20.0
AXIAL STRAIN (Percent)C
HA
NG
E I
N P
OR
E W
AT
ER
PR
ES
SU
RE
(ks
f)
Figure F-2.393
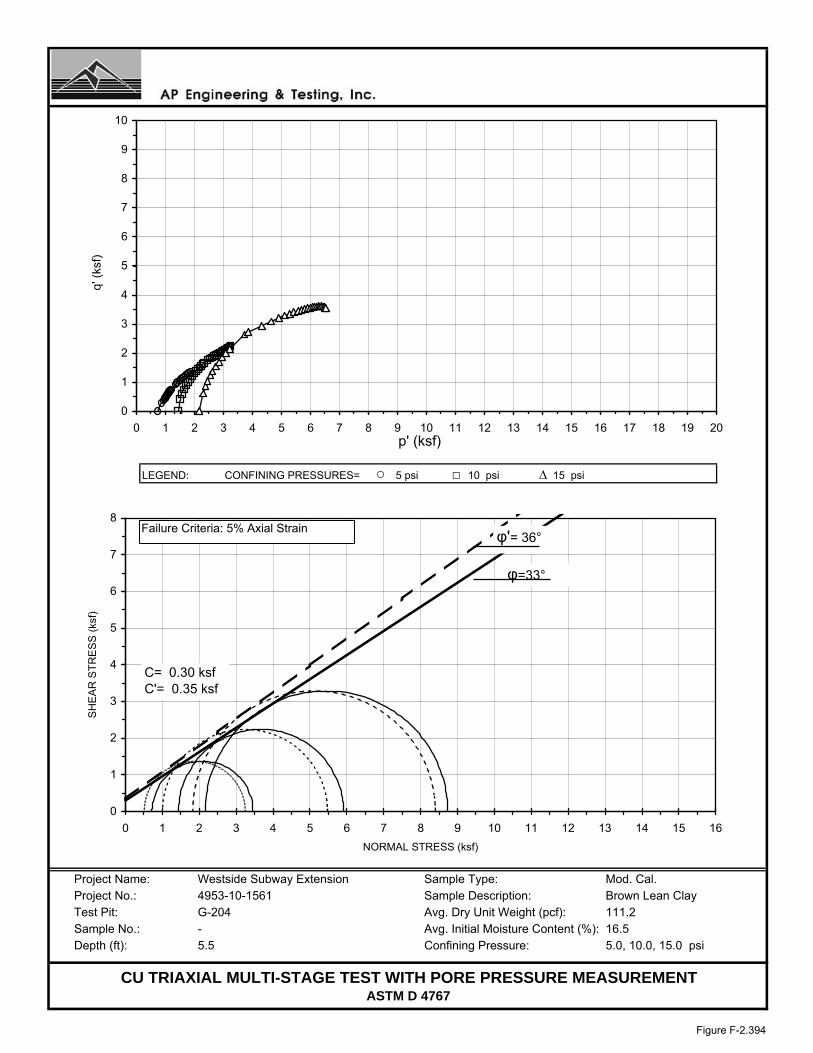
LEGEND: CONFINING PRESSURES= ○ 5 psi □ 10 psi ∆ 15 psi
Project Name: Westside Subway Extension Sample Type: Mod. Cal.Project No.: 4953-10-1561 Sample Description: Brown Lean ClayTest Pit: G-204 Avg. Dry Unit Weight (pcf): 111.2Sample No.: - Avg. Initial Moisture Content (%): 16.5Depth (ft): 5.5 Confining Pressure: 5.0, 10.0, 15.0 psi
CU TRIAXIAL MULTI-STAGE TEST WITH PORE PRESSURE MEASUREMENTASTM D 4767
0
1
2
3
4
5
6
7
8
0 1 2 3 4 5 6 7 8 9 10 11 12 13 14 15 16
NORMAL STRESS (ksf)
SH
EA
R S
TR
ES
S (
ksf)
φ=33°
φ'= 36°
0
1
2
3
4
5
6
7
8
9
10
0 1 2 3 4 5 6 7 8 9 10 11 12 13 14 15 16 17 18 19 20 p' (ksf)
q' (
ksf)
C= 0.30 ksfC'= 0.35 ksf
Failure Criteria: 5% Axial Strain
Figure F-2.394

Test Pit: G-204 Sample Type: Mod. Cal.Sample No.: - Soil Description: Brown Lean ClayDepth (feet): 5.5 Eff. Confining Pressure (psi): 10.0
Project Name: Westside Subway ExtensionProject No.: 4953-10-1561Date: 07/19/11
0.50000.70000.70001.0000
0.70000.70001.0000
1.8000
ASTM D 2435
5.30006.23006.7400
10.954515.491921.9089
1440 7.2000
5.30007.7460
2.00001.3000
TIME RATE CONSOLIDATION CURVE
2.20003.00004.1000
6.23006.7400
4
4.1000
1.30001.80002.20003.0000
0.0000
2.82843.87305.4772
0.31620.50000.70711.00001.4142
0.50000.3000
Time (minutes) Volume Change (cc)0.00000.3000
00.1
SQRT Time (minutes) Volume Change (cc)0.0000
0.250.512
8153060
120240480
37.9473 7.2000
0.00
1.00
2.00
3.00
4.00
5.00
6.00
7.00
8.00
0.1 1 10 100 1000 10000
Time (minutes)
Vol
ume
Cha
nge
(cc)
0.00
1.00
2.00
3.00
4.00
5.00
6.00
7.00
8.00
0.0 10.0 20.0 30.0 40.0
Square root Time (minutes)
Vol
ume
Cha
nge
(cc)
Figure F-2.395
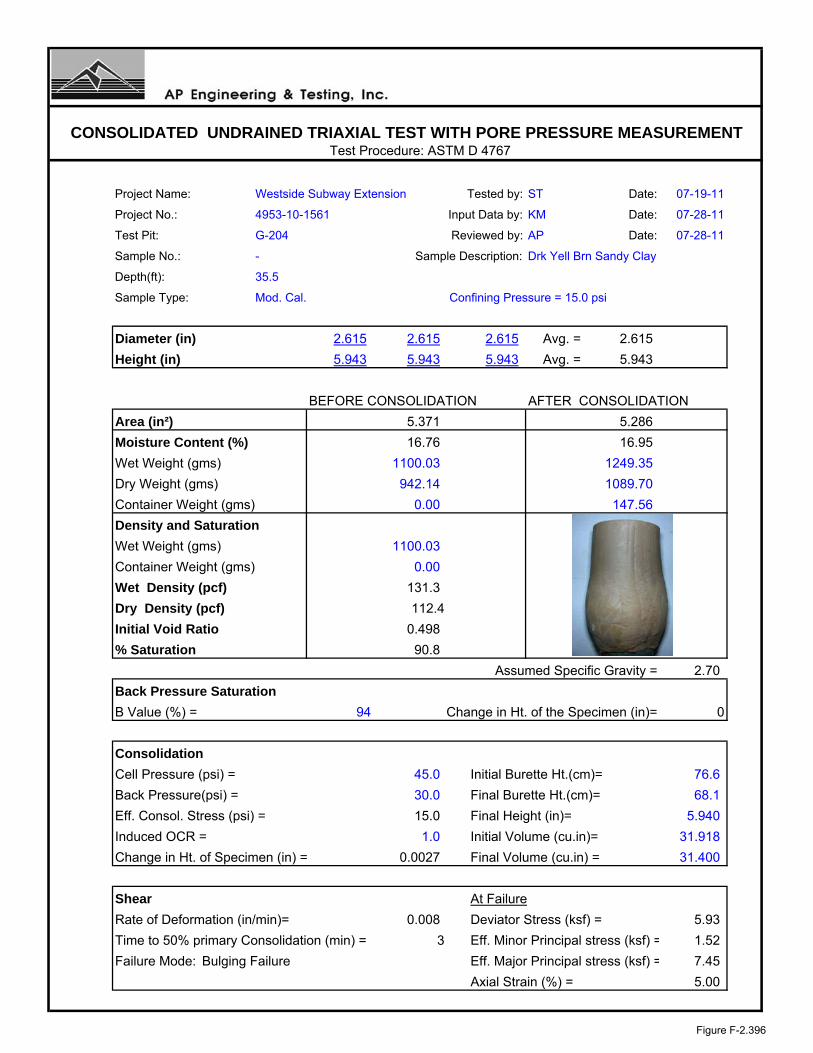
Test Procedure: ASTM D 4767
Project Name: Westside Subway Extension Tested by: ST Date: 07-19-11
Project No.: 4953-10-1561 Input Data by: KM Date: 07-28-11
Test Pit: G-204 Reviewed by: AP Date: 07-28-11
Sample No.: - Sample Description: Drk Yell Brn Sandy Clay
Depth(ft): 35.5
Sample Type: Mod. Cal. Confining Pressure = 15.0 psi
Diameter (in) 2.615 2.615 2.615 Avg. = 2.615
Height (in) 5.943 5.943 5.943 Avg. = 5.943
BEFORE CONSOLIDATION AFTER CONSOLIDATION
Area (in²) 5.371 5.286
Moisture Content (%) 16.76 16.95
Wet Weight (gms) 1100.03 1249.35
Dry Weight (gms) 942.14 1089.70
Container Weight (gms) 0.00 147.56
Density and Saturation
Wet Weight (gms) 1100.03
Container Weight (gms) 0.00
Wet Density (pcf) 131.3
Dry Density (pcf) 112.4
Initial Void Ratio 0.498
% Saturation 90.8
Assumed Specific Gravity = 2.70
Back Pressure Saturation
B Value (%) = 94 Change in Ht. of the Specimen (in)= 0
Consolidation
Cell Pressure (psi) = 45.0 Initial Burette Ht.(cm)= 76.6
Back Pressure(psi) = 30.0 Final Burette Ht.(cm)= 68.1
Eff. Consol. Stress (psi) = 15.0 Final Height (in)= 5.940
Induced OCR = 1.0 Initial Volume (cu.in)= 31.918
Change in Ht. of Specimen (in) = 0.0027 Final Volume (cu.in) = 31.400
Shear At Failure
Rate of Deformation (in/min)= 0.008 Deviator Stress (ksf) = 5.93
Time to 50% primary Consolidation (min) = 3 Eff. Minor Principal stress (ksf) = 1.52
Failure Mode: Bulging Failure Eff. Major Principal stress (ksf) = 7.45
Axial Strain (%) = 5.00
CONSOLIDATED UNDRAINED TRIAXIAL TEST WITH PORE PRESSURE MEASUREMENT
Figure F-2.396

Test Procedure: ASTM D 4767
Project Name: Westside Subway Extension Tested by: ST Date: 07-19-11
Project No.: 4953-10-1561 Input Data by: KM Date: 07-28-11
Test Pit: G-204 Reviewed by: AP Date: 07-28-11
Sample No.: - Sample Description: Drk Yell Brn Sandy Clay
Depth(ft): 35.5
Sample Type: Mod. Cal. Confining Pressure = 30.0 psi
Diameter (in) 2.615 2.615 2.615 Avg. = 2.615
Height (in) 5.943 5.943 5.943 Avg. = 5.943
BEFORE CONSOLIDATION AFTER CONSOLIDATION
Area (in²) 5.371 5.292
Moisture Content (%) 16.76 16.95
Wet Weight (gms) 1100.03 1249.35
Dry Weight (gms) 942.14 1089.70
Container Weight (gms) 0.00 147.56
Density and Saturation
Wet Weight (gms) 1100.03
Container Weight (gms) 0.00
Wet Density (pcf) 131.3
Dry Density (pcf) 112.4
Initial Void Ratio 0.498
% Saturation 90.8
Assumed Specific Gravity = 2.70
Back Pressure Saturation
B Value (%) = 94 Change in Ht. of the Specimen (in)= 0
Consolidation
Cell Pressure (psi) = 60.0 Initial Burette Ht.(cm)= 68.1
Back Pressure(psi) = 30.0 Final Burette Ht.(cm)= 60.4
Eff. Consol. Stress (psi) = 30.0 Final Height (in)= 5.943
Induced OCR= 1.0 Initial Volume (cu.in)= 31.918
Change in Ht. of Specimen (in) = 0.0000 Final Volume (cu.in) = 31.448
Shear At Failure
Rate of Deformation (in/min)= 0.008 Deviator Stress (ksf) = 10.70
Time to 50% primary Consolidation = 3 Eff. Minor Principal stress (ksf) = 3.57
Failure Mode: Bulging Failure Eff. Major Principal stress (ksf) = 14.27
Axial Strain (%) = 5.00
CONSOLIDATED UNDRAINED TRIAXIAL TEST WITH PORE PRESSURE MEASUREMENT
Figure F-2.397

Test Procedure: ASTM D 4767
Project Name: Westside Subway Extension Tested by: ST Date: 07-19-11
Project No.: Input Data by: KM Date: 07-28-11
Test Pit: G-204 Reviewed by: AP Date: 07-28-11
Sample No.: - Sample Description: Drk Yell Brn Sandy Clay
Depth(ft): 35.5
Sample Type: Mod. Cal. Confining Pressure = 45.0 psi
Diameter (in) 2.615 2.615 2.615 Avg. = 2.615
Height (in) 5.943 5.943 5.943 Avg. = 5.943
BEFORE CONSOLIDATION AFTER CONSOLIDATION
Area (in²) 5.371 5.308
Moisture Content (%) 16.76 16.95
Wet Weight (gms) 1100.03 1249.35
Dry Weight (gms) 942.14 1089.70
Container Weight (gms) 0.00 147.56
Density and Saturation
Wet Weight (gms) 1100.03
Container Weight (gms) 0.00
Wet Density (pcf) 131.3
Dry Density (pcf) 112.4
Initial Void Ratio 0.498
% Saturation 90.8
Assumed Specific Gravity = 2.70
Back Pressure Saturation
B Value (%) = 94 Change in Ht. of the Specimen (in)= 0
Consolidation
Cell Pressure (psi) = 75.0 Initial Burette Ht.(cm)= 60.4
Back Pressure(psi) = 30.0 Final Burette Ht.(cm)= 54.3
Eff. Consol. Stress (psi) = 45.0 Final Height (in)= 5.943
Induced OCR = 1.0 Initial Volume (cu.in)= 31.918
Change in Ht. of Specimen (in) = 0.0000 Final Volume (cu.in) = 31.546
Shear At Failure
Rate of Deformation (in/min)= 0.008 Deviator Stress (ksf) = 15.12
Time to 50% primary Consolidation = 3 Eff. Minor Principal stress (ksf) = 5.29
Failure Mode: Bulging Failure Eff. Major Principal stress (ksf) = 20.41
Axial Strain (%) = 5.23
CONSOLIDATED UNDRAINED TRIAXIAL TEST WITH PORE PRESSURE MEASUREMENT
4953-10-1561
Figure F-2.398

Project Name: Westside Subway Extension Cell Pressure: 45.0 psi
Project No: 4953-10-1561 Back Pressure : 30.0 psi
Test Pit: G-204 Consolidation Pressure : 15.0 psi
Depth(ft): 35.5 Initial Sample Height: 5.943 in
Sample No.: - Initial Area of Sample: 5.371 sq. in.
Sample Type: Mod. Cal. Final Sample Ht.* (L): 5.940 in
Sample Description: Drk Yell Brn Sandy Clay Final Sample Area (A)*: 5.286 sq. in.
Induced OCR= 1.0
Cell Load Axial Back Deviator Axial Pore Shear Normal
Pressure Deformation Pressure Stress Strain Pressure Stress Stress
Change q' p'
(S1-S3) (S1-S3)/2 (S1'+S3')/2
(psi) (lbs) (in) (psi) (ksf) (%) (ksf) (ksf) (ksf)
45.0 0 0.000 30.0 0.00 0.00 0.00 0.00 2.16
45.0 30 0.006 32.1 0.82 0.10 0.30 0.41 2.27
45.0 31 0.013 32.4 0.84 0.21 0.34 0.42 2.24
45.0 24 0.019 32.1 0.65 0.32 0.30 0.33 2.19
45.0 18 0.026 31.8 0.49 0.44 0.26 0.24 2.15
45.0 17 0.033 31.8 0.46 0.56 0.26 0.23 2.13
45.0 18 0.040 31.8 0.49 0.66 0.26 0.24 2.14
45.0 42 0.046 33.3 1.14 0.77 0.47 0.57 2.26
45.0 55 0.053 34.4 1.49 0.89 0.63 0.74 2.27
45.0 65 0.059 35.2 1.75 0.99 0.75 0.88 2.28
45.0 74 0.066 35.9 1.99 1.11 0.85 1.00 2.31
45.0 82 0.072 36.4 2.21 1.22 0.93 1.10 2.34
45.0 90 0.078 36.9 2.42 1.32 0.99 1.21 2.38
45.0 98 0.085 37.2 2.63 1.42 1.04 1.32 2.43
45.0 105 0.091 37.5 2.82 1.53 1.08 1.41 2.48
45.0 147 0.142 38.1 3.91 2.38 1.17 1.95 2.94
45.0 157 0.155 38.0 4.17 2.61 1.15 2.08 3.09
45.0 167 0.169 37.8 4.42 2.84 1.12 2.21 3.25
45.0 176 0.183 37.5 4.65 3.07 1.08 2.32 3.40
45.0 184 0.197 37.2 4.85 3.31 1.03 2.42 3.55
45.0 192 0.211 36.8 5.04 3.56 0.98 2.52 3.70
45.0 200 0.226 36.4 5.24 3.81 0.92 2.62 3.86
45.0 206 0.241 36.0 5.38 4.05 0.87 2.69 3.98
45.0 212 0.255 35.6 5.53 4.29 0.81 2.76 4.11
45.0 218 0.269 35.2 5.67 4.53 0.75 2.83 4.24
45.0 223 0.283 34.8 5.79 4.77 0.70 2.89 4.36
45.0 229 0.297 34.4 5.93 5.00 0.64 2.96 4.48
CONSOLIDATED UNDRAINED TRIAXIAL TEST WITH PORE PRESSURE MEASUREMENT
Figure F-2.399

Project Name: Westside Subway Extension Cell Pressure: 60.0 psi
Project No: 4953-10-1561 Back Pressure : 30.0 psi
Test Pit: G-204 Consolidation Pressure : 30.0 psi
Depth(ft): 35.5 Initial Sample Height: 5.943 in
Sample No.: - Initial Area of Sample: 5.371 sq. in.
Sample Type: Mod. Cal. Final Sample Ht.* (L): 5.943 in
Sample Description: Drk Yell Brn Sandy Clay Final Sample Area (A)*: 5.292 sq. in.
Induced OCR= 1.0
Cell Load Axial Back Deviator Axial Pore Shear Normal
Pressure Deformation Pressure Stress Strain Pressure Stress Stress
Change q' p'
(S1-S3) (S1-S3)/2 (S1'+S3')/2
(psi) (lbs) (in) (psi) (ksf) (%) (ksf) (ksf) (ksf)
60.0 0 0.000 30.0 0.00 0.00 0.00 0.00 4.32
60.0 77 0.003 33.1 2.09 0.04 0.45 1.05 4.92
60.0 125 0.008 35.5 3.40 0.14 0.79 1.70 5.22
60.0 159 0.015 37.1 4.32 0.24 1.03 2.16 5.45
60.0 188 0.021 38.3 5.10 0.35 1.19 2.55 5.68
60.0 215 0.028 39.1 5.82 0.47 1.31 2.91 5.92
60.0 238 0.034 39.7 6.44 0.57 1.39 3.22 6.15
60.0 258 0.040 40.1 6.97 0.68 1.46 3.49 6.35
60.0 276 0.047 40.4 7.45 0.80 1.50 3.73 6.54
60.0 291 0.054 40.6 7.85 0.91 1.53 3.92 6.72
60.0 303 0.061 40.7 8.16 1.03 1.53 4.08 6.87
60.0 314 0.068 40.6 8.45 1.14 1.53 4.22 7.01
60.0 322 0.074 40.5 8.65 1.25 1.52 4.33 7.13
60.0 330 0.081 40.4 8.86 1.36 1.50 4.43 7.25
60.0 336 0.089 40.2 9.01 1.49 1.47 4.50 7.35
60.0 351 0.111 39.7 9.37 1.86 1.39 4.69 7.62
60.0 359 0.125 39.3 9.56 2.10 1.33 4.78 7.77
60.0 366 0.139 38.9 9.73 2.34 1.27 4.86 7.91
60.0 372 0.154 38.5 9.86 2.59 1.22 4.93 8.03
60.0 377 0.168 38.1 9.97 2.83 1.17 4.98 8.14
60.0 382 0.182 37.7 10.08 3.06 1.11 5.04 8.25
60.0 387 0.196 37.4 10.18 3.30 1.06 5.09 8.35
60.0 392 0.210 37.1 10.29 3.53 1.02 5.15 8.45
60.0 397 0.225 36.7 10.39 3.78 0.97 5.20 8.55
60.0 401 0.240 36.4 10.47 4.03 0.92 5.24 8.63
60.0 405 0.254 36.1 10.55 4.28 0.88 5.27 8.72
60.0 408 0.269 35.8 10.60 4.52 0.84 5.30 8.79
60.0 411 0.283 35.5 10.65 4.76 0.79 5.33 8.85
60.0 414 0.297 35.2 10.70 5.00 0.75 5.35 8.92
CONSOLIDATED UNDRAINED TRIAXIAL TEST WITH PORE PRESSURE MEASUREMENT
Figure F-2.400

Project Name: Westside Subway Extension Cell Pressure: 75.0 psi
Project No: 4953-10-1561 Back Pressure : 30.0 psi
Test Pit: G-204 Consolidation Pressure : 45.0 psi
Depth(ft): 35.5 Initial Sample Height: 5.943 in
Sample No.: - Initial Area of Sample: 5.371 sq. in.
Sample Type: Mod. Cal. Final Sample Ht.* (L): 5.943 in
Sample Description: Drk Yell Brn Sandy Clay Final Sample Area (A)*: 5.308 sq. in.
Induced OCR= 1.0
Cell Load Axial Back Deviator Axial Pore Shear Normal
Pressure Deformation Pressure Stress Strain Pressure Stress Stress
Change q' p'
(S1-S3) (S1-S3)/2 (S1'+S3')/2
(psi) (lbs) (in) (psi) (ksf) (%) (ksf) (ksf) (ksf)
75.0 0 0.000 30.0 0.00 0.00 0.00 0.00 6.48
75.0 166 0.006 35.4 4.50 0.10 0.78 2.25 7.95
75.0 226 0.012 37.9 6.12 0.20 1.13 3.06 8.40
75.0 272 0.018 39.6 7.36 0.30 1.38 3.68 8.78
75.0 313 0.024 40.9 8.46 0.40 1.57 4.23 9.14
75.0 354 0.030 42.0 9.55 0.50 1.72 4.78 9.53
75.0 386 0.036 42.7 10.41 0.61 1.83 5.20 9.86
75.0 416 0.042 43.2 11.21 0.71 1.91 5.60 10.18
75.0 440 0.048 43.6 11.84 0.81 1.96 5.92 10.44
75.0 462 0.054 43.9 12.42 0.91 2.00 6.21 10.69
75.0 479 0.060 44.0 12.86 1.01 2.01 6.43 10.90
75.0 524 0.090 43.4 14.00 1.51 1.93 7.00 11.55
75.0 532 0.100 43.1 14.19 1.68 1.88 7.09 11.69
75.0 546 0.127 42.2 14.50 2.14 1.75 7.25 11.98
75.0 559 0.173 40.8 14.72 2.91 1.56 7.36 12.29
75.0 571 0.218 39.7 14.92 3.66 1.40 7.46 12.54
75.0 581 0.265 38.9 15.06 4.46 1.28 7.53 12.72
75.0 588 0.311 38.2 15.12 5.23 1.19 7.56 12.85
75.0 599 0.357 37.7 15.27 6.01 1.10 7.64 13.01
75.0 605 0.404 37.2 15.30 6.80 1.03 7.65 13.10
75.0 611 0.450 36.7 15.32 7.57 0.97 7.66 13.17
75.0 621 0.496 36.3 15.44 8.35 0.91 7.72 13.29
75.0 625 0.542 36.0 15.41 9.12 0.86 7.70 13.32
75.0 632 0.588 35.7 15.45 9.89 0.81 7.72 13.39
75.0 640 0.635 35.4 15.51 10.68 0.77 7.75 13.46
75.0 644 0.681 35.1 15.47 11.45 0.73 7.73 13.48
75.0 653 0.726 34.9 15.55 12.22 0.70 7.77 13.56
75.0 661 0.773 34.6 15.60 13.01 0.66 7.80 13.62
75.0 665 0.818 34.4 15.56 13.77 0.64 7.78 13.62
75.0 675 0.865 34.2 15.65 14.55 0.60 7.82 13.7075.0 680 0.912 34.0 15.62 15.35 0.58 7.81 13.71
75.0 686 0.958 33.8 15.61 16.11 0.55 7.81 13.74
75.0 696 1.004 33.6 15.69 16.89 0.52 7.85 13.80
75.0 720 1.188 33.1 15.63 20.00 0.44 7.81 13.85
75.0 728 1.234 33.0 15.65 20.76 0.43 7.82 13.88
CONSOLIDATED UNDRAINED TRIAXIAL TEST WITH PORE PRESSURE MEASUREMENT
Figure F-2.401
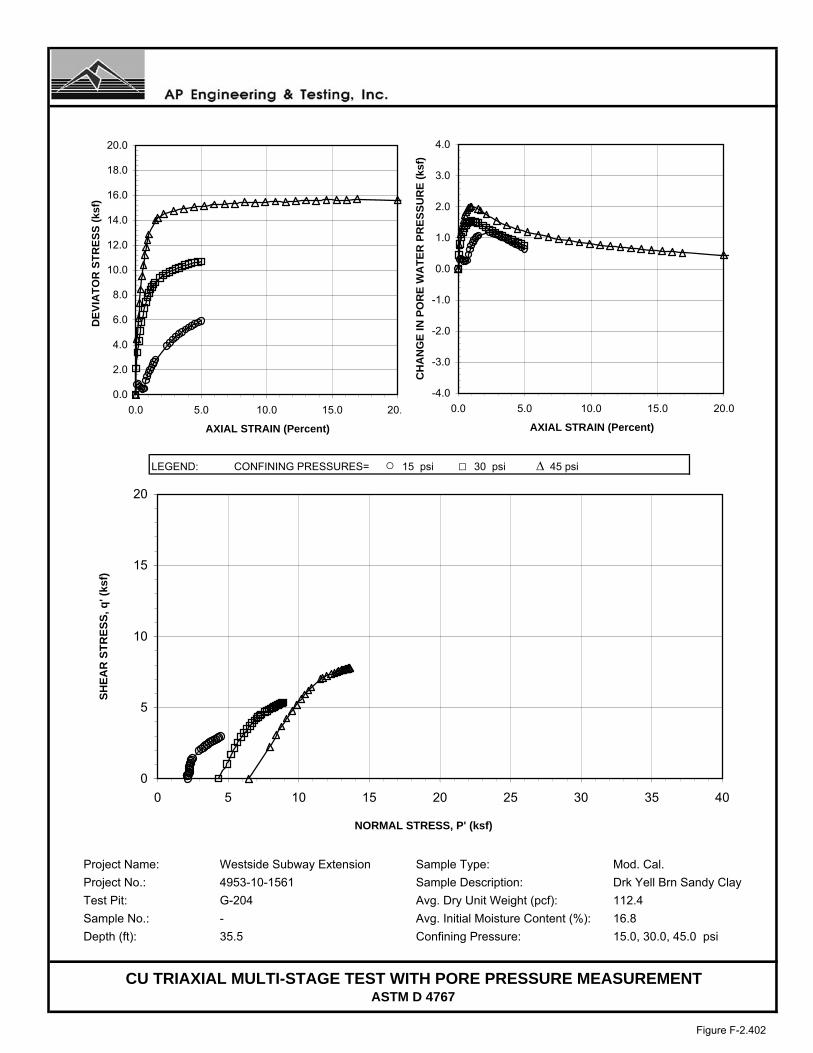
LEGEND: CONFINING PRESSURES= ○ 15 psi □ 30 psi ∆ 45 psi
Project Name: Westside Subway Extension Sample Type: Mod. Cal.
Project No.: 4953-10-1561 Sample Description: Drk Yell Brn Sandy Clay
Test Pit: G-204 Avg. Dry Unit Weight (pcf): 112.4
Sample No.: - Avg. Initial Moisture Content (%): 16.8
Depth (ft): 35.5 Confining Pressure: 15.0, 30.0, 45.0 psi
CU TRIAXIAL MULTI-STAGE TEST WITH PORE PRESSURE MEASUREMENTASTM D 4767
0
5
10
15
20
0 5 10 15 20 25 30 35 40
NORMAL STRESS, P' (ksf)
SH
EA
R S
TR
ES
S, q
' (ks
f)
0.0
2.0
4.0
6.0
8.0
10.0
12.0
14.0
16.0
18.0
20.0
0.0 5.0 10.0 15.0 20.0
AXIAL STRAIN (Percent)
DE
VIA
TO
R S
TR
ES
S (
ksf)
-4.0
-3.0
-2.0
-1.0
0.0
1.0
2.0
3.0
4.0
0.0 5.0 10.0 15.0 20.0
AXIAL STRAIN (Percent)C
HA
NG
E I
N P
OR
E W
AT
ER
PR
ES
SU
RE
(ks
f)
Figure F-2.402

LEGEND: CONFINING PRESSURES= ○ 15 psi □ 30 psi ∆ 45 psi
Project Name: Westside Subway Extension Sample Type: Mod. Cal.Project No.: 4953-10-1561 Sample Description: Drk Yell Brn Sandy ClayTest Pit: G-204 Avg. Dry Unit Weight (pcf): 112.4Sample No.: - Avg. Initial Moisture Content (%): 16.8Depth (ft): 35.5 Confining Pressure: 15.0, 30.0, 45.0 psi
CU TRIAXIAL MULTI-STAGE TEST WITH PORE PRESSURE MEASUREMENTASTM D 4767
0
5
10
15
20
0 5 10 15 20 25 30 35 40
NORMAL STRESS (ksf)
SH
EA
R S
TR
ES
S (
ksf)
φ=30°
φ'= 34°
0
5
10
15
20
0 5 10 15 20 25 30 35 40 p' (ksf)
q' (
ksf)
C= 0.50 ksfC'= 0.45 ksf
Failure Criteria: 5% Axial Strain
Figure F-2.403
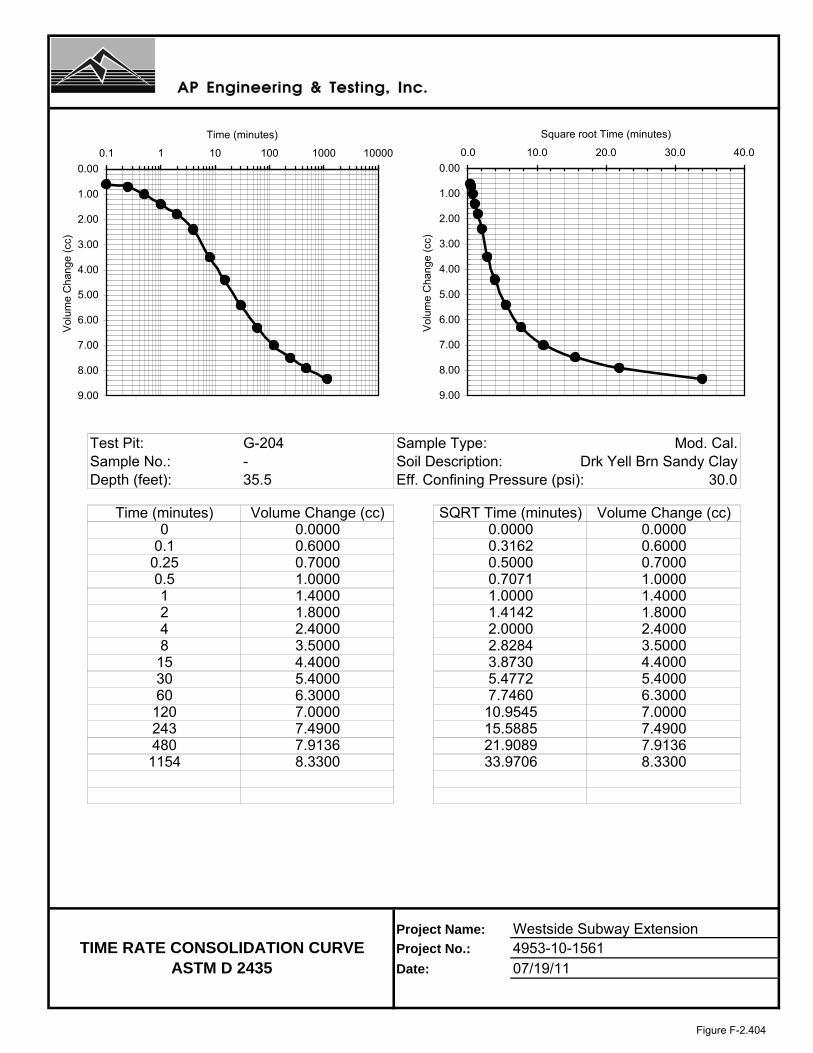
Test Pit: G-204 Sample Type: Mod. Cal.Sample No.: - Soil Description: Drk Yell Brn Sandy ClayDepth (feet): 35.5 Eff. Confining Pressure (psi): 30.0
Project Name: Westside Subway ExtensionProject No.: 4953-10-1561Date: 07/19/11
8.3300
120243480
33.9706
8153060
0.250.512
0.6000
Time (minutes) Volume Change (cc)0.00000.6000
00.1
SQRT Time (minutes) Volume Change (cc)0.0000 0.0000
2.82843.87305.4772
0.31620.50000.70711.00001.4142
0.7000
6.3000
2.40003.50004.40005.4000
7.7460
2.00002.4000
TIME RATE CONSOLIDATION CURVE
4.40005.40006.3000
7.49007.9136
4
ASTM D 2435
7.00007.49007.9136
10.954515.588521.9089
1154 8.3300
7.0000
1.00001.40001.8000
3.5000
0.70001.00001.40001.8000
0.00
1.00
2.00
3.00
4.00
5.00
6.00
7.00
8.00
9.00
0.1 1 10 100 1000 10000
Time (minutes)
Vol
ume
Cha
nge
(cc)
0.00
1.00
2.00
3.00
4.00
5.00
6.00
7.00
8.00
9.00
0.0 10.0 20.0 30.0 40.0
Square root Time (minutes)
Vol
ume
Cha
nge
(cc)
Figure F-2.404
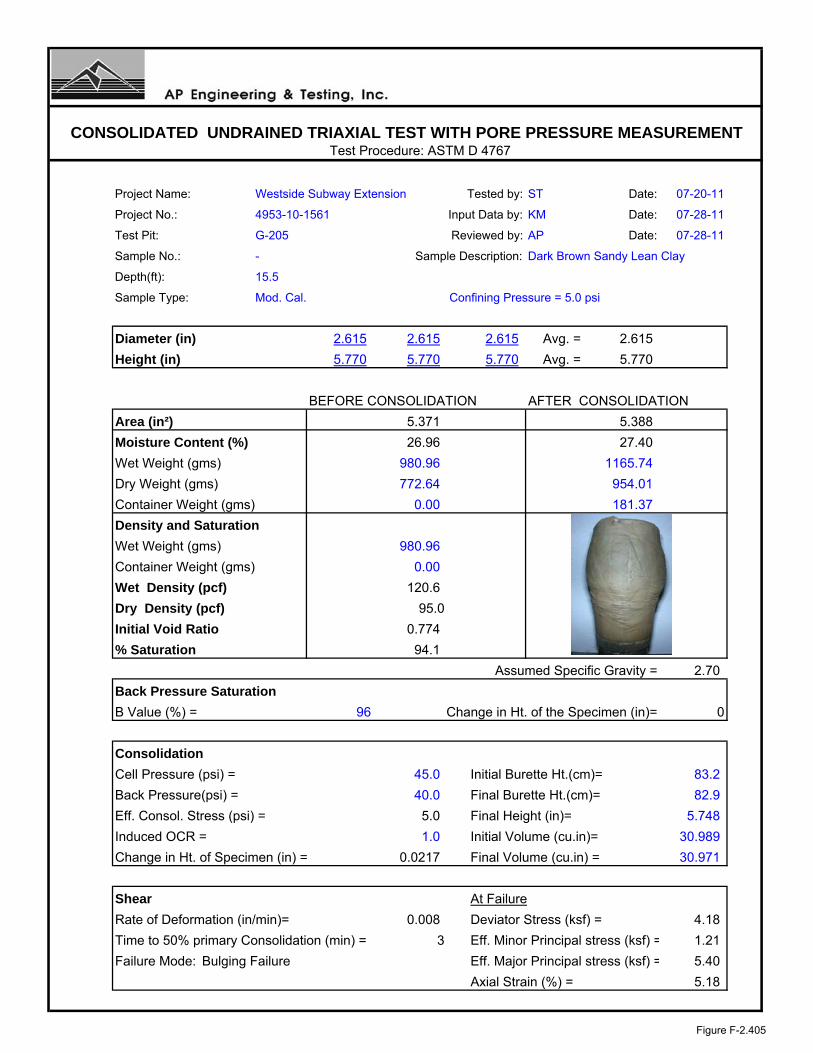
Test Procedure: ASTM D 4767
Project Name: Westside Subway Extension Tested by: ST Date: 07-20-11
Project No.: 4953-10-1561 Input Data by: KM Date: 07-28-11
Test Pit: G-205 Reviewed by: AP Date: 07-28-11
Sample No.: - Sample Description: Dark Brown Sandy Lean Clay
Depth(ft): 15.5
Sample Type: Mod. Cal. Confining Pressure = 5.0 psi
Diameter (in) 2.615 2.615 2.615 Avg. = 2.615
Height (in) 5.770 5.770 5.770 Avg. = 5.770
BEFORE CONSOLIDATION AFTER CONSOLIDATION
Area (in²) 5.371 5.388
Moisture Content (%) 26.96 27.40
Wet Weight (gms) 980.96 1165.74
Dry Weight (gms) 772.64 954.01
Container Weight (gms) 0.00 181.37
Density and Saturation
Wet Weight (gms) 980.96
Container Weight (gms) 0.00
Wet Density (pcf) 120.6
Dry Density (pcf) 95.0
Initial Void Ratio 0.774
% Saturation 94.1
Assumed Specific Gravity = 2.70
Back Pressure Saturation
B Value (%) = 96 Change in Ht. of the Specimen (in)= 0
Consolidation
Cell Pressure (psi) = 45.0 Initial Burette Ht.(cm)= 83.2
Back Pressure(psi) = 40.0 Final Burette Ht.(cm)= 82.9
Eff. Consol. Stress (psi) = 5.0 Final Height (in)= 5.748
Induced OCR = 1.0 Initial Volume (cu.in)= 30.989
Change in Ht. of Specimen (in) = 0.0217 Final Volume (cu.in) = 30.971
Shear At Failure
Rate of Deformation (in/min)= 0.008 Deviator Stress (ksf) = 4.18
Time to 50% primary Consolidation (min) = 3 Eff. Minor Principal stress (ksf) = 1.21
Failure Mode: Bulging Failure Eff. Major Principal stress (ksf) = 5.40
Axial Strain (%) = 5.18
CONSOLIDATED UNDRAINED TRIAXIAL TEST WITH PORE PRESSURE MEASUREMENT
Figure F-2.405

Test Procedure: ASTM D 4767
Project Name: Westside Subway Extension Tested by: ST Date: 07-20-11
Project No.: 4953-10-1561 Input Data by: KM Date: 07-28-11
Test Pit: G-205 Reviewed by: AP Date: 07-28-11
Sample No.: - Sample Description: Dark Brown Sandy Lean Clay
Depth(ft): 15.5
Sample Type: Mod. Cal. Confining Pressure = 15.0 psi
Diameter (in) 2.615 2.615 2.615 Avg. = 2.615
Height (in) 5.770 5.770 5.770 Avg. = 5.770
BEFORE CONSOLIDATION AFTER CONSOLIDATION
Area (in²) 5.371 5.304
Moisture Content (%) 26.96 27.40
Wet Weight (gms) 980.96 1165.74
Dry Weight (gms) 772.64 954.01
Container Weight (gms) 0.00 181.37
Density and Saturation
Wet Weight (gms) 980.96
Container Weight (gms) 0.00
Wet Density (pcf) 120.6
Dry Density (pcf) 95.0
Initial Void Ratio 0.774
% Saturation 94.1
Assumed Specific Gravity = 2.70
Back Pressure Saturation
B Value (%) = 96 Change in Ht. of the Specimen (in)= 0
Consolidation
Cell Pressure (psi) = 55.0 Initial Burette Ht.(cm)= 82.9
Back Pressure(psi) = 40.0 Final Burette Ht.(cm)= 76.6
Eff. Consol. Stress (psi) = 15.0 Final Height (in)= 5.770
Induced OCR= 1.0 Initial Volume (cu.in)= 30.989
Change in Ht. of Specimen (in) = 0.0000 Final Volume (cu.in) = 30.605
Shear At Failure
Rate of Deformation (in/min)= 0.008 Deviator Stress (ksf) = 8.08
Time to 50% primary Consolidation = 3 Eff. Minor Principal stress (ksf) = 2.68
Failure Mode: Bulging Failure Eff. Major Principal stress (ksf) = 10.76
Axial Strain (%) = 5.22
CONSOLIDATED UNDRAINED TRIAXIAL TEST WITH PORE PRESSURE MEASUREMENT
Figure F-2.406

Test Procedure: ASTM D 4767
Project Name: Westside Subway Extension Tested by: ST Date: 07-20-11
Project No.: Input Data by: KM Date: 07-28-11
Test Pit: G-205 Reviewed by: AP Date: 07-28-11
Sample No.: - Sample Description: Dark Brown Sandy Lean Clay
Depth(ft): 15.5
Sample Type: Mod. Cal. Confining Pressure = 25.0 psi
Diameter (in) 2.615 2.615 2.615 Avg. = 2.615
Height (in) 5.770 5.770 5.770 Avg. = 5.770
BEFORE CONSOLIDATION AFTER CONSOLIDATION
Area (in²) 5.371 5.318
Moisture Content (%) 26.96 27.40
Wet Weight (gms) 980.96 1165.74
Dry Weight (gms) 772.64 954.01
Container Weight (gms) 0.00 181.37
Density and Saturation
Wet Weight (gms) 980.96
Container Weight (gms) 0.00
Wet Density (pcf) 120.6
Dry Density (pcf) 95.0
Initial Void Ratio 0.774
% Saturation 94.1
Assumed Specific Gravity = 2.70
Back Pressure Saturation
B Value (%) = 96 Change in Ht. of the Specimen (in)= 0
Consolidation
Cell Pressure (psi) = 65.0 Initial Burette Ht.(cm)= 76.6
Back Pressure(psi) = 40.0 Final Burette Ht.(cm)= 71.6
Eff. Consol. Stress (psi) = 25.0 Final Height (in)= 5.770
Induced OCR = 1.0 Initial Volume (cu.in)= 30.989
Change in Ht. of Specimen (in) = 0.0000 Final Volume (cu.in) = 30.684
Shear At Failure
Rate of Deformation (in/min)= 0.008 Deviator Stress (ksf) = 11.14
Time to 50% primary Consolidation = 3 Eff. Minor Principal stress (ksf) = 3.79
Failure Mode: Bulging Failure Eff. Major Principal stress (ksf) = 14.93
Axial Strain (%) = 5.42
CONSOLIDATED UNDRAINED TRIAXIAL TEST WITH PORE PRESSURE MEASUREMENT
4953-10-1561
Figure F-2.407
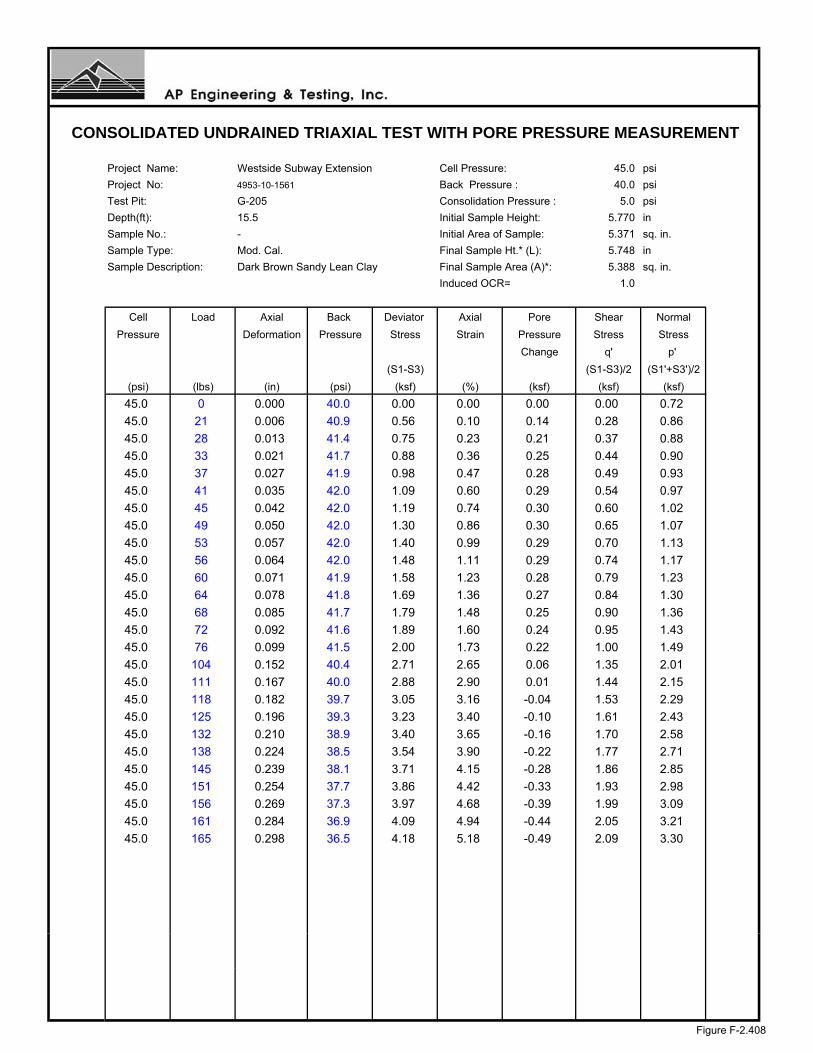
Project Name: Westside Subway Extension Cell Pressure: 45.0 psi
Project No: 4953-10-1561 Back Pressure : 40.0 psi
Test Pit: G-205 Consolidation Pressure : 5.0 psi
Depth(ft): 15.5 Initial Sample Height: 5.770 in
Sample No.: - Initial Area of Sample: 5.371 sq. in.
Sample Type: Mod. Cal. Final Sample Ht.* (L): 5.748 in
Sample Description: Dark Brown Sandy Lean Clay Final Sample Area (A)*: 5.388 sq. in.
Induced OCR= 1.0
Cell Load Axial Back Deviator Axial Pore Shear Normal
Pressure Deformation Pressure Stress Strain Pressure Stress Stress
Change q' p'
(S1-S3) (S1-S3)/2 (S1'+S3')/2
(psi) (lbs) (in) (psi) (ksf) (%) (ksf) (ksf) (ksf)
45.0 0 0.000 40.0 0.00 0.00 0.00 0.00 0.72
45.0 21 0.006 40.9 0.56 0.10 0.14 0.28 0.86
45.0 28 0.013 41.4 0.75 0.23 0.21 0.37 0.88
45.0 33 0.021 41.7 0.88 0.36 0.25 0.44 0.90
45.0 37 0.027 41.9 0.98 0.47 0.28 0.49 0.93
45.0 41 0.035 42.0 1.09 0.60 0.29 0.54 0.97
45.0 45 0.042 42.0 1.19 0.74 0.30 0.60 1.02
45.0 49 0.050 42.0 1.30 0.86 0.30 0.65 1.07
45.0 53 0.057 42.0 1.40 0.99 0.29 0.70 1.13
45.0 56 0.064 42.0 1.48 1.11 0.29 0.74 1.17
45.0 60 0.071 41.9 1.58 1.23 0.28 0.79 1.23
45.0 64 0.078 41.8 1.69 1.36 0.27 0.84 1.30
45.0 68 0.085 41.7 1.79 1.48 0.25 0.90 1.36
45.0 72 0.092 41.6 1.89 1.60 0.24 0.95 1.43
45.0 76 0.099 41.5 2.00 1.73 0.22 1.00 1.49
45.0 104 0.152 40.4 2.71 2.65 0.06 1.35 2.01
45.0 111 0.167 40.0 2.88 2.90 0.01 1.44 2.15
45.0 118 0.182 39.7 3.05 3.16 -0.04 1.53 2.29
45.0 125 0.196 39.3 3.23 3.40 -0.10 1.61 2.43
45.0 132 0.210 38.9 3.40 3.65 -0.16 1.70 2.58
45.0 138 0.224 38.5 3.54 3.90 -0.22 1.77 2.71
45.0 145 0.239 38.1 3.71 4.15 -0.28 1.86 2.85
45.0 151 0.254 37.7 3.86 4.42 -0.33 1.93 2.98
45.0 156 0.269 37.3 3.97 4.68 -0.39 1.99 3.09
45.0 161 0.284 36.9 4.09 4.94 -0.44 2.05 3.21
45.0 165 0.298 36.5 4.18 5.18 -0.49 2.09 3.30
CONSOLIDATED UNDRAINED TRIAXIAL TEST WITH PORE PRESSURE MEASUREMENT
Figure F-2.408

Project Name: Westside Subway Extension Cell Pressure: 55.0 psi
Project No: 4953-10-1561 Back Pressure : 40.0 psi
Test Pit: G-205 Consolidation Pressure : 15.0 psi
Depth(ft): 15.5 Initial Sample Height: 5.770 in
Sample No.: - Initial Area of Sample: 5.371 sq. in.
Sample Type: Mod. Cal. Final Sample Ht.* (L): 5.770 in
Sample Description: Dark Brown Sandy Lean Clay Final Sample Area (A)*: 5.304 sq. in.
Induced OCR= 1.0
Cell Load Axial Back Deviator Axial Pore Shear Normal
Pressure Deformation Pressure Stress Strain Pressure Stress Stress
Change q' p'
(S1-S3) (S1-S3)/2 (S1'+S3')/2
(psi) (lbs) (in) (psi) (ksf) (%) (ksf) (ksf) (ksf)
55.0 0 0.000 40.0 0.00 0.00 0.00 0.00 2.16
55.0 62 0.005 41.9 1.68 0.09 0.27 0.84 2.73
55.0 93 0.012 42.5 2.52 0.21 0.36 1.26 3.06
55.0 117 0.020 42.7 3.17 0.34 0.38 1.58 3.37
55.0 138 0.027 42.6 3.73 0.47 0.36 1.86 3.66
55.0 158 0.035 42.4 4.26 0.60 0.34 2.13 3.95
55.0 175 0.043 42.2 4.72 0.74 0.31 2.36 4.21
55.0 191 0.050 42.0 5.14 0.86 0.29 2.57 4.44
55.0 205 0.057 41.9 5.51 0.99 0.26 2.76 4.65
55.0 216 0.064 41.7 5.80 1.11 0.24 2.90 4.82
55.0 226 0.071 41.5 6.06 1.23 0.21 3.03 4.98
55.0 233 0.078 41.3 6.24 1.36 0.19 3.12 5.09
55.0 240 0.086 41.1 6.42 1.49 0.16 3.21 5.21
55.0 246 0.093 40.9 6.57 1.61 0.12 3.29 5.32
55.0 251 0.100 40.7 6.70 1.73 0.09 3.35 5.42
55.0 263 0.123 40.0 6.99 2.13 0.00 3.49 5.66
55.0 270 0.138 39.6 7.15 2.39 -0.06 3.58 5.80
55.0 276 0.154 39.2 7.29 2.67 -0.12 3.65 5.92
55.0 281 0.168 38.8 7.41 2.92 -0.17 3.70 6.03
55.0 286 0.183 38.5 7.52 3.17 -0.22 3.76 6.14
55.0 291 0.197 38.2 7.63 3.42 -0.27 3.82 6.24
55.0 294 0.212 37.9 7.69 3.68 -0.31 3.84 6.32
55.0 298 0.227 37.6 7.77 3.93 -0.35 3.89 6.40
55.0 301 0.242 37.3 7.83 4.19 -0.39 3.91 6.46
55.0 305 0.257 37.1 7.91 4.45 -0.42 3.96 6.54
55.0 308 0.271 36.9 7.97 4.70 -0.46 3.98 6.60
55.0 311 0.286 36.7 8.03 4.95 -0.49 4.01 6.66
55.0 314 0.301 36.5 8.08 5.22 -0.52 4.04 6.72
CONSOLIDATED UNDRAINED TRIAXIAL TEST WITH PORE PRESSURE MEASUREMENT
Figure F-2.409
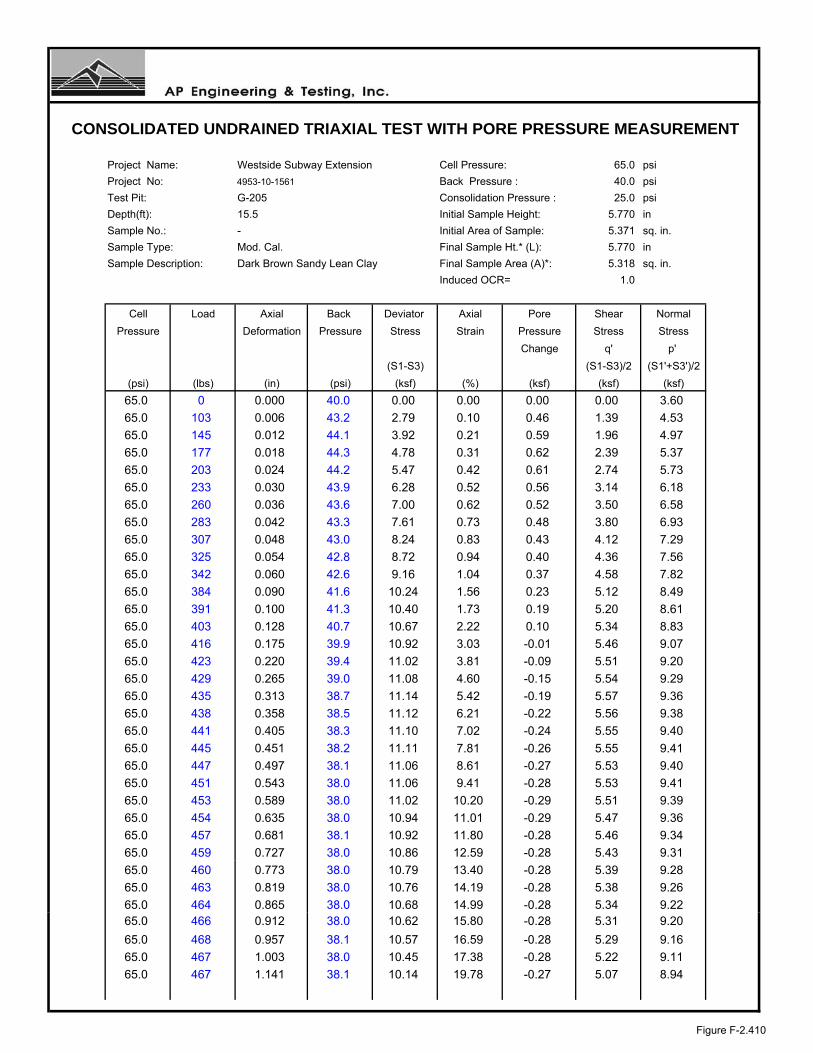
Project Name: Westside Subway Extension Cell Pressure: 65.0 psi
Project No: 4953-10-1561 Back Pressure : 40.0 psi
Test Pit: G-205 Consolidation Pressure : 25.0 psi
Depth(ft): 15.5 Initial Sample Height: 5.770 in
Sample No.: - Initial Area of Sample: 5.371 sq. in.
Sample Type: Mod. Cal. Final Sample Ht.* (L): 5.770 in
Sample Description: Dark Brown Sandy Lean Clay Final Sample Area (A)*: 5.318 sq. in.
Induced OCR= 1.0
Cell Load Axial Back Deviator Axial Pore Shear Normal
Pressure Deformation Pressure Stress Strain Pressure Stress Stress
Change q' p'
(S1-S3) (S1-S3)/2 (S1'+S3')/2
(psi) (lbs) (in) (psi) (ksf) (%) (ksf) (ksf) (ksf)
65.0 0 0.000 40.0 0.00 0.00 0.00 0.00 3.60
65.0 103 0.006 43.2 2.79 0.10 0.46 1.39 4.53
65.0 145 0.012 44.1 3.92 0.21 0.59 1.96 4.97
65.0 177 0.018 44.3 4.78 0.31 0.62 2.39 5.37
65.0 203 0.024 44.2 5.47 0.42 0.61 2.74 5.73
65.0 233 0.030 43.9 6.28 0.52 0.56 3.14 6.18
65.0 260 0.036 43.6 7.00 0.62 0.52 3.50 6.58
65.0 283 0.042 43.3 7.61 0.73 0.48 3.80 6.93
65.0 307 0.048 43.0 8.24 0.83 0.43 4.12 7.29
65.0 325 0.054 42.8 8.72 0.94 0.40 4.36 7.56
65.0 342 0.060 42.6 9.16 1.04 0.37 4.58 7.82
65.0 384 0.090 41.6 10.24 1.56 0.23 5.12 8.49
65.0 391 0.100 41.3 10.40 1.73 0.19 5.20 8.61
65.0 403 0.128 40.7 10.67 2.22 0.10 5.34 8.83
65.0 416 0.175 39.9 10.92 3.03 -0.01 5.46 9.07
65.0 423 0.220 39.4 11.02 3.81 -0.09 5.51 9.20
65.0 429 0.265 39.0 11.08 4.60 -0.15 5.54 9.29
65.0 435 0.313 38.7 11.14 5.42 -0.19 5.57 9.36
65.0 438 0.358 38.5 11.12 6.21 -0.22 5.56 9.38
65.0 441 0.405 38.3 11.10 7.02 -0.24 5.55 9.40
65.0 445 0.451 38.2 11.11 7.81 -0.26 5.55 9.41
65.0 447 0.497 38.1 11.06 8.61 -0.27 5.53 9.40
65.0 451 0.543 38.0 11.06 9.41 -0.28 5.53 9.41
65.0 453 0.589 38.0 11.02 10.20 -0.29 5.51 9.39
65.0 454 0.635 38.0 10.94 11.01 -0.29 5.47 9.36
65.0 457 0.681 38.1 10.92 11.80 -0.28 5.46 9.34
65.0 459 0.727 38.0 10.86 12.59 -0.28 5.43 9.31
65.0 460 0.773 38.0 10.79 13.40 -0.28 5.39 9.28
65.0 463 0.819 38.0 10.76 14.19 -0.28 5.38 9.26
65.0 464 0.865 38.0 10.68 14.99 -0.28 5.34 9.2265.0 466 0.912 38.0 10.62 15.80 -0.28 5.31 9.20
65.0 468 0.957 38.1 10.57 16.59 -0.28 5.29 9.16
65.0 467 1.003 38.0 10.45 17.38 -0.28 5.22 9.11
65.0 467 1.141 38.1 10.14 19.78 -0.27 5.07 8.94
CONSOLIDATED UNDRAINED TRIAXIAL TEST WITH PORE PRESSURE MEASUREMENT
Figure F-2.410

LEGEND: CONFINING PRESSURES= ○ 5 psi □ 15 psi ∆ 25 psi
Project Name: Westside Subway Extension Sample Type: Mod. Cal.
Project No.: 4953-10-1561 Sample Description: Dark Brown Sandy Lean Clay
Test Pit: G-205 Avg. Dry Unit Weight (pcf): 95.0
Sample No.: - Avg. Initial Moisture Content (%): 27.0
Depth (ft): 15.5 Confining Pressure: 5.0, 15.0, 25.0 psi
CU TRIAXIAL MULTI-STAGE TEST WITH PORE PRESSURE MEASUREMENTASTM D 4767
0
5
10
15
20
0 5 10 15 20 25 30 35 40
NORMAL STRESS, P' (ksf)
SH
EA
R S
TR
ES
S, q
' (ks
f)
0.0
2.0
4.0
6.0
8.0
10.0
12.0
14.0
16.0
18.0
20.0
0.0 5.0 10.0 15.0 20.0
AXIAL STRAIN (Percent)
DE
VIA
TO
R S
TR
ES
S (
ksf)
-2.0
-1.5
-1.0
-0.5
0.0
0.5
1.0
0.0 5.0 10.0 15.0 20.0
AXIAL STRAIN (Percent)C
HA
NG
E I
N P
OR
E W
AT
ER
PR
ES
SU
RE
(ks
f)
Figure F-2.411
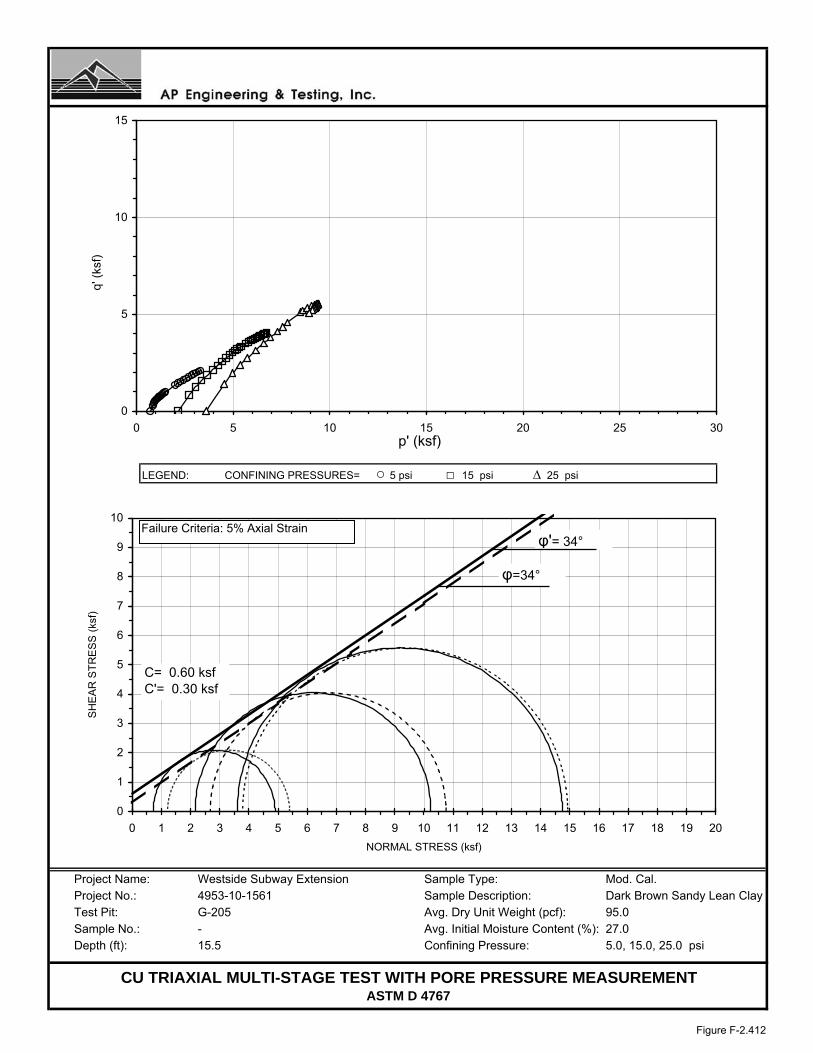
LEGEND: CONFINING PRESSURES= ○ 5 psi □ 15 psi ∆ 25 psi
Project Name: Westside Subway Extension Sample Type: Mod. Cal.Project No.: 4953-10-1561 Sample Description: Dark Brown Sandy Lean ClayTest Pit: G-205 Avg. Dry Unit Weight (pcf): 95.0Sample No.: - Avg. Initial Moisture Content (%): 27.0Depth (ft): 15.5 Confining Pressure: 5.0, 15.0, 25.0 psi
CU TRIAXIAL MULTI-STAGE TEST WITH PORE PRESSURE MEASUREMENTASTM D 4767
0
1
2
3
4
5
6
7
8
9
10
0 1 2 3 4 5 6 7 8 9 10 11 12 13 14 15 16 17 18 19 20
NORMAL STRESS (ksf)
SH
EA
R S
TR
ES
S (
ksf)
φ=34°
φ'= 34°
0
5
10
15
0 5 10 15 20 25 30 p' (ksf)
q' (
ksf)
C= 0.60 ksfC'= 0.30 ksf
Failure Criteria: 5% Axial Strain
Figure F-2.412

Test Pit: G-205 Sample Type: Mod. Cal.Sample No.: - Soil Description: Dark Brown Sandy Lean ClayDepth (feet): 15.5 Eff. Confining Pressure (psi): 15.0
Project Name: Westside Subway ExtensionProject No.: 4953-10-1561Date: 07/20/11
6.3000
120240446
35.4542
8153060
0.250.512
2.4000
Time (minutes) Volume Change (cc)0.00002.4000
00.1
SQRT Time (minutes) Volume Change (cc)0.0000 0.0000
2.82843.87305.4772
0.31620.50000.70711.00001.4142
3.6000
5.7000
5.10005.30005.40005.5000
7.7460
2.00005.1000
TIME RATE CONSOLIDATION CURVE
5.40005.50005.7000
6.10006.1000
4
ASTM D 2435
5.80006.10006.1000
10.954515.491921.1187
1257 6.3000
5.8000
4.30004.70004.9000
5.3000
3.60004.30004.70004.9000
0.00
1.00
2.00
3.00
4.00
5.00
6.00
7.00
0.1 1 10 100 1000 10000
Time (minutes)
Vol
ume
Cha
nge
(cc)
0.00
1.00
2.00
3.00
4.00
5.00
6.00
7.00
0.0 10.0 20.0 30.0 40.0
Square root Time (minutes)
Vol
ume
Cha
nge
(cc)
Figure F-2.413
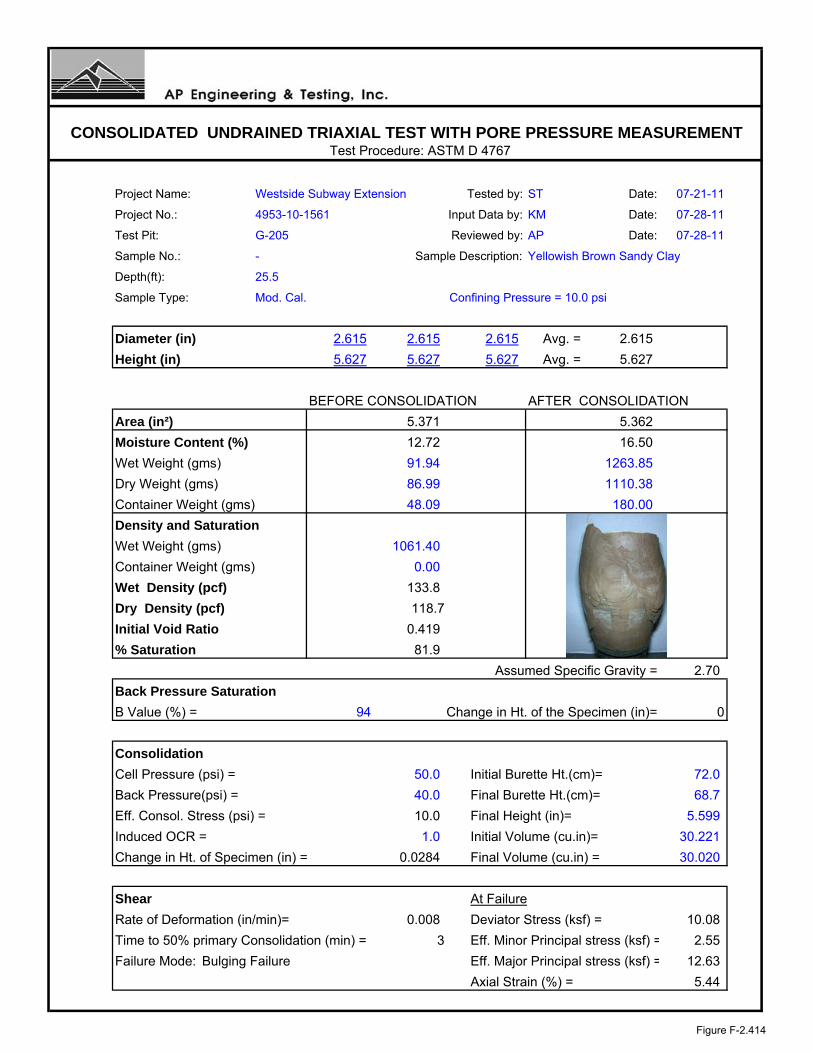
Test Procedure: ASTM D 4767
Project Name: Westside Subway Extension Tested by: ST Date: 07-21-11
Project No.: 4953-10-1561 Input Data by: KM Date: 07-28-11
Test Pit: G-205 Reviewed by: AP Date: 07-28-11
Sample No.: - Sample Description: Yellowish Brown Sandy Clay
Depth(ft): 25.5
Sample Type: Mod. Cal. Confining Pressure = 10.0 psi
Diameter (in) 2.615 2.615 2.615 Avg. = 2.615
Height (in) 5.627 5.627 5.627 Avg. = 5.627
BEFORE CONSOLIDATION AFTER CONSOLIDATION
Area (in²) 5.371 5.362
Moisture Content (%) 12.72 16.50
Wet Weight (gms) 91.94 1263.85
Dry Weight (gms) 86.99 1110.38
Container Weight (gms) 48.09 180.00
Density and Saturation
Wet Weight (gms) 1061.40
Container Weight (gms) 0.00
Wet Density (pcf) 133.8
Dry Density (pcf) 118.7
Initial Void Ratio 0.419
% Saturation 81.9
Assumed Specific Gravity = 2.70
Back Pressure Saturation
B Value (%) = 94 Change in Ht. of the Specimen (in)= 0
Consolidation
Cell Pressure (psi) = 50.0 Initial Burette Ht.(cm)= 72.0
Back Pressure(psi) = 40.0 Final Burette Ht.(cm)= 68.7
Eff. Consol. Stress (psi) = 10.0 Final Height (in)= 5.599
Induced OCR = 1.0 Initial Volume (cu.in)= 30.221
Change in Ht. of Specimen (in) = 0.0284 Final Volume (cu.in) = 30.020
Shear At Failure
Rate of Deformation (in/min)= 0.008 Deviator Stress (ksf) = 10.08
Time to 50% primary Consolidation (min) = 3 Eff. Minor Principal stress (ksf) = 2.55
Failure Mode: Bulging Failure Eff. Major Principal stress (ksf) = 12.63
Axial Strain (%) = 5.44
CONSOLIDATED UNDRAINED TRIAXIAL TEST WITH PORE PRESSURE MEASUREMENT
Figure F-2.414

Test Procedure: ASTM D 4767
Project Name: Westside Subway Extension Tested by: ST Date: 07-21-11
Project No.: 4953-10-1561 Input Data by: KM Date: 07-28-11
Test Pit: G-205 Reviewed by: AP Date: 07-28-11
Sample No.: - Sample Description: Yellowish Brown Sandy Clay
Depth(ft): 25.5
Sample Type: Mod. Cal. Confining Pressure = 20.0 psi
Diameter (in) 2.615 2.615 2.615 Avg. = 2.615
Height (in) 5.627 5.627 5.627 Avg. = 5.627
BEFORE CONSOLIDATION AFTER CONSOLIDATION
Area (in²) 5.371 5.353
Moisture Content (%) 12.72 16.50
Wet Weight (gms) 91.94 1263.85
Dry Weight (gms) 86.99 1110.38
Container Weight (gms) 48.09 180.00
Density and Saturation
Wet Weight (gms) 1061.40
Container Weight (gms) 0.00
Wet Density (pcf) 133.8
Dry Density (pcf) 118.7
Initial Void Ratio 0.419
% Saturation 81.9
Assumed Specific Gravity = 2.70
Back Pressure Saturation
B Value (%) = 94 Change in Ht. of the Specimen (in)= 0
Consolidation
Cell Pressure (psi) = 60.0 Initial Burette Ht.(cm)= 68.7
Back Pressure(psi) = 40.0 Final Burette Ht.(cm)= 67.1
Eff. Consol. Stress (psi) = 20.0 Final Height (in)= 5.627
Induced OCR= 1.0 Initial Volume (cu.in)= 30.221
Change in Ht. of Specimen (in) = 0.0000 Final Volume (cu.in) = 30.123
Shear At Failure
Rate of Deformation (in/min)= 0.008 Deviator Stress (ksf) = 13.73
Time to 50% primary Consolidation = 3 Eff. Minor Principal stress (ksf) = 4.11
Failure Mode: Bulging Failure Eff. Major Principal stress (ksf) = 17.84
Axial Strain (%) = 5.28
CONSOLIDATED UNDRAINED TRIAXIAL TEST WITH PORE PRESSURE MEASUREMENT
Figure F-2.415

Test Procedure: ASTM D 4767
Project Name: Westside Subway Extension Tested by: ST Date: 07-21-11
Project No.: Input Data by: KM Date: 07-28-11
Test Pit: G-205 Reviewed by: AP Date: 07-28-11
Sample No.: - Sample Description: Yellowish Brown Sandy Clay
Depth(ft): 25.5
Sample Type: Mod. Cal. Confining Pressure = 30.0 psi
Diameter (in) 2.615 2.615 2.615 Avg. = 2.615
Height (in) 5.627 5.627 5.627 Avg. = 5.627
BEFORE CONSOLIDATION AFTER CONSOLIDATION
Area (in²) 5.371 5.320
Moisture Content (%) 12.72 16.50
Wet Weight (gms) 91.94 1263.85
Dry Weight (gms) 86.99 1110.38
Container Weight (gms) 48.09 180.00
Density and Saturation
Wet Weight (gms) 1061.40
Container Weight (gms) 0.00
Wet Density (pcf) 133.8
Dry Density (pcf) 118.7
Initial Void Ratio 0.419
% Saturation 81.9
Assumed Specific Gravity = 2.70
Back Pressure Saturation
B Value (%) = 94 Change in Ht. of the Specimen (in)= 0
Consolidation
Cell Pressure (psi) = 70.0 Initial Burette Ht.(cm)= 67.1
Back Pressure(psi) = 40.0 Final Burette Ht.(cm)= 62.4
Eff. Consol. Stress (psi) = 30.0 Final Height (in)= 5.627
Induced OCR = 1.0 Initial Volume (cu.in)= 30.221
Change in Ht. of Specimen (in) = 0.0000 Final Volume (cu.in) = 29.934
Shear At Failure
Rate of Deformation (in/min)= 0.008 Deviator Stress (ksf) = 16.71
Time to 50% primary Consolidation = 3 Eff. Minor Principal stress (ksf) = 5.02
Failure Mode: Bulging Failure Eff. Major Principal stress (ksf) = 21.73
Axial Strain (%) = 3.85
CONSOLIDATED UNDRAINED TRIAXIAL TEST WITH PORE PRESSURE MEASUREMENT
4953-10-1561
Figure F-2.416

Project Name: Westside Subway Extension Cell Pressure: 50.0 psi
Project No: 4953-10-1561 Back Pressure : 40.0 psi
Test Pit: G-205 Consolidation Pressure : 10.0 psi
Depth(ft): 25.5 Initial Sample Height: 5.627 in
Sample No.: - Initial Area of Sample: 5.371 sq. in.
Sample Type: Mod. Cal. Final Sample Ht.* (L): 5.599 in
Sample Description: Yellowish Brown Sandy Clay Final Sample Area (A)*: 5.362 sq. in.
Induced OCR= 1.0
Cell Load Axial Back Deviator Axial Pore Shear Normal
Pressure Deformation Pressure Stress Strain Pressure Stress Stress
Change q' p'
(S1-S3) (S1-S3)/2 (S1'+S3')/2
(psi) (lbs) (in) (psi) (ksf) (%) (ksf) (ksf) (ksf)
50.0 0 0.000 40.0 0.00 0.00 0.00 0.00 1.44
50.0 35 0.008 42.2 0.94 0.14 0.31 0.47 1.60
50.0 52 0.015 43.4 1.39 0.27 0.49 0.70 1.64
50.0 66 0.023 44.2 1.77 0.41 0.61 0.88 1.71
50.0 78 0.030 44.8 2.08 0.54 0.69 1.04 1.79
50.0 90 0.038 45.1 2.40 0.68 0.74 1.20 1.90
50.0 103 0.044 45.4 2.74 0.79 0.77 1.37 2.04
50.0 115 0.052 45.5 3.06 0.93 0.79 1.53 2.18
50.0 128 0.060 45.6 3.40 1.07 0.80 1.70 2.34
50.0 142 0.067 45.5 3.77 1.20 0.80 1.88 2.53
50.0 157 0.074 45.5 4.16 1.32 0.78 2.08 2.74
50.0 171 0.081 45.3 4.53 1.44 0.76 2.26 2.94
50.0 186 0.087 45.1 4.92 1.56 0.73 2.46 3.17
50.0 201 0.094 44.8 5.31 1.68 0.69 2.65 3.40
50.0 215 0.101 44.5 5.67 1.81 0.65 2.83 3.63
50.0 291 0.151 41.2 7.60 2.70 0.18 3.80 5.06
50.0 306 0.165 40.2 7.98 2.95 0.03 3.99 5.39
50.0 318 0.180 39.3 8.27 3.21 -0.11 4.13 5.68
50.0 329 0.193 38.4 8.53 3.45 -0.24 4.27 5.94
50.0 341 0.207 37.5 8.82 3.70 -0.37 4.41 6.22
50.0 351 0.221 36.6 9.05 3.94 -0.49 4.53 6.46
50.0 361 0.233 35.8 9.29 4.17 -0.61 4.65 6.69
50.0 370 0.247 35.0 9.50 4.42 -0.72 4.75 6.91
50.0 378 0.262 34.3 9.68 4.68 -0.82 4.84 7.10
50.0 385 0.277 33.6 9.83 4.94 -0.92 4.91 7.28
50.0 391 0.291 32.9 9.96 5.19 -1.02 4.98 7.44
50.0 397 0.305 32.3 10.08 5.44 -1.11 5.04 7.59
CONSOLIDATED UNDRAINED TRIAXIAL TEST WITH PORE PRESSURE MEASUREMENT
Figure F-2.417
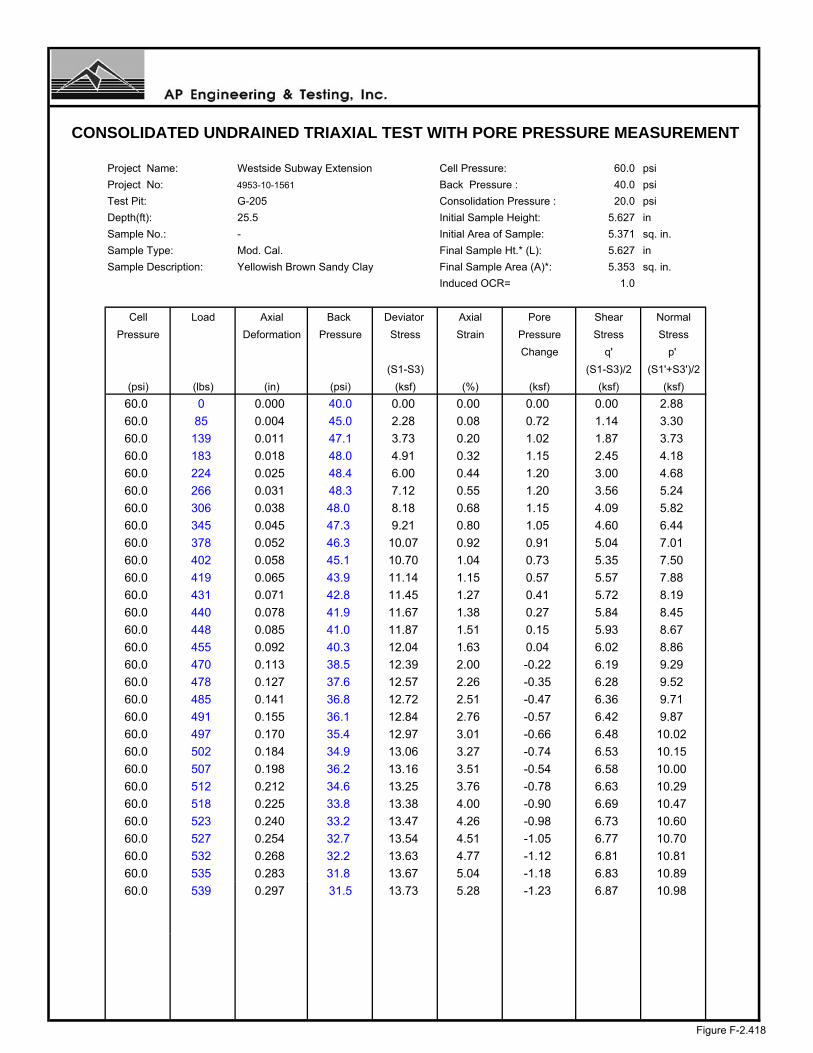
Project Name: Westside Subway Extension Cell Pressure: 60.0 psi
Project No: 4953-10-1561 Back Pressure : 40.0 psi
Test Pit: G-205 Consolidation Pressure : 20.0 psi
Depth(ft): 25.5 Initial Sample Height: 5.627 in
Sample No.: - Initial Area of Sample: 5.371 sq. in.
Sample Type: Mod. Cal. Final Sample Ht.* (L): 5.627 in
Sample Description: Yellowish Brown Sandy Clay Final Sample Area (A)*: 5.353 sq. in.
Induced OCR= 1.0
Cell Load Axial Back Deviator Axial Pore Shear Normal
Pressure Deformation Pressure Stress Strain Pressure Stress Stress
Change q' p'
(S1-S3) (S1-S3)/2 (S1'+S3')/2
(psi) (lbs) (in) (psi) (ksf) (%) (ksf) (ksf) (ksf)
60.0 0 0.000 40.0 0.00 0.00 0.00 0.00 2.88
60.0 85 0.004 45.0 2.28 0.08 0.72 1.14 3.30
60.0 139 0.011 47.1 3.73 0.20 1.02 1.87 3.73
60.0 183 0.018 48.0 4.91 0.32 1.15 2.45 4.18
60.0 224 0.025 48.4 6.00 0.44 1.20 3.00 4.68
60.0 266 0.031 48.3 7.12 0.55 1.20 3.56 5.24
60.0 306 0.038 48.0 8.18 0.68 1.15 4.09 5.82
60.0 345 0.045 47.3 9.21 0.80 1.05 4.60 6.44
60.0 378 0.052 46.3 10.07 0.92 0.91 5.04 7.01
60.0 402 0.058 45.1 10.70 1.04 0.73 5.35 7.50
60.0 419 0.065 43.9 11.14 1.15 0.57 5.57 7.88
60.0 431 0.071 42.8 11.45 1.27 0.41 5.72 8.19
60.0 440 0.078 41.9 11.67 1.38 0.27 5.84 8.45
60.0 448 0.085 41.0 11.87 1.51 0.15 5.93 8.67
60.0 455 0.092 40.3 12.04 1.63 0.04 6.02 8.86
60.0 470 0.113 38.5 12.39 2.00 -0.22 6.19 9.29
60.0 478 0.127 37.6 12.57 2.26 -0.35 6.28 9.52
60.0 485 0.141 36.8 12.72 2.51 -0.47 6.36 9.71
60.0 491 0.155 36.1 12.84 2.76 -0.57 6.42 9.87
60.0 497 0.170 35.4 12.97 3.01 -0.66 6.48 10.02
60.0 502 0.184 34.9 13.06 3.27 -0.74 6.53 10.15
60.0 507 0.198 36.2 13.16 3.51 -0.54 6.58 10.00
60.0 512 0.212 34.6 13.25 3.76 -0.78 6.63 10.29
60.0 518 0.225 33.8 13.38 4.00 -0.90 6.69 10.47
60.0 523 0.240 33.2 13.47 4.26 -0.98 6.73 10.60
60.0 527 0.254 32.7 13.54 4.51 -1.05 6.77 10.70
60.0 532 0.268 32.2 13.63 4.77 -1.12 6.81 10.81
60.0 535 0.283 31.8 13.67 5.04 -1.18 6.83 10.89
60.0 539 0.297 31.5 13.73 5.28 -1.23 6.87 10.98
CONSOLIDATED UNDRAINED TRIAXIAL TEST WITH PORE PRESSURE MEASUREMENT
Figure F-2.418

Project Name: Westside Subway Extension Cell Pressure: 70.0 psi
Project No: 4953-10-1561 Back Pressure : 40.0 psi
Test Pit: G-205 Consolidation Pressure : 30.0 psi
Depth(ft): 25.5 Initial Sample Height: 5.627 in
Sample No.: - Initial Area of Sample: 5.371 sq. in.
Sample Type: Mod. Cal. Final Sample Ht.* (L): 5.627 in
Sample Description: Yellowish Brown Sandy Clay Final Sample Area (A)*: 5.320 sq. in.
Induced OCR= 1.0
Cell Load Axial Back Deviator Axial Pore Shear Normal
Pressure Deformation Pressure Stress Strain Pressure Stress Stress
Change q' p'
(S1-S3) (S1-S3)/2 (S1'+S3')/2
(psi) (lbs) (in) (psi) (ksf) (%) (ksf) (ksf) (ksf)
70.0 0 0.000 40.0 0.00 0.00 0.00 0.00 4.32
70.0 132 0.006 46.3 3.57 0.11 0.90 1.78 5.20
70.0 205 0.012 49.2 5.54 0.21 1.32 2.77 5.77
70.0 264 0.018 50.6 7.12 0.32 1.52 3.56 6.36
70.0 313 0.024 51.1 8.44 0.43 1.60 4.22 6.94
70.0 370 0.030 51.2 9.96 0.53 1.61 4.98 7.69
70.0 421 0.036 50.8 11.32 0.64 1.55 5.66 8.43
70.0 470 0.042 50.0 12.63 0.75 1.44 6.31 9.19
70.0 506 0.048 49.1 13.58 0.85 1.30 6.79 9.81
70.0 536 0.054 47.7 14.37 0.96 1.11 7.18 10.39
70.0 558 0.060 46.2 14.94 1.07 0.89 7.47 10.90
70.0 594 0.090 41.1 15.82 1.60 0.16 7.91 12.07
70.0 600 0.100 40.1 15.95 1.78 0.01 7.98 12.29
70.0 613 0.127 38.3 16.22 2.25 -0.24 8.11 12.67
70.0 628 0.171 36.4 16.48 3.04 -0.52 8.24 13.08
70.0 642 0.217 35.1 16.71 3.85 -0.70 8.35 13.38
70.0 655 0.263 34.1 16.90 4.67 -0.85 8.45 13.62
70.0 666 0.308 33.2 17.04 5.47 -0.98 8.52 13.82
70.0 677 0.354 32.3 17.17 6.28 -1.10 8.59 14.01
70.0 686 0.400 31.5 17.25 7.11 -1.22 8.62 14.17
70.0 695 0.446 30.8 17.32 7.92 -1.33 8.66 14.31
70.0 704 0.492 30.1 17.39 8.74 -1.42 8.70 14.44
70.0 711 0.538 29.5 17.41 9.55 -1.51 8.70 14.53
70.0 719 0.583 29.0 17.45 10.36 -1.58 8.72 14.62
70.0 726 0.629 28.6 17.45 11.18 -1.64 8.73 14.69
70.0 732 0.676 28.2 17.44 12.00 -1.69 8.72 14.73
70.0 740 0.721 27.9 17.47 12.80 -1.75 8.73 14.80
70.0 747 0.767 27.5 17.46 13.64 -1.81 8.73 14.86
70.0 752 0.813 27.1 17.42 14.44 -1.86 8.71 14.88
70.0 758 0.859 26.8 17.39 15.26 -1.91 8.69 14.9270.0 763 0.905 26.4 17.33 16.08 -1.96 8.67 14.95
70.0 769 0.951 26.1 17.30 16.89 -2.01 8.65 14.98
70.0 780 1.042 25.5 17.21 18.51 -2.09 8.60 15.01
70.0 791 1.133 25.0 17.10 20.14 -2.16 8.55 15.03
70.0 803 1.224 24.3 17.01 21.75 -2.26 8.50 15.09
CONSOLIDATED UNDRAINED TRIAXIAL TEST WITH PORE PRESSURE MEASUREMENT
Figure F-2.419
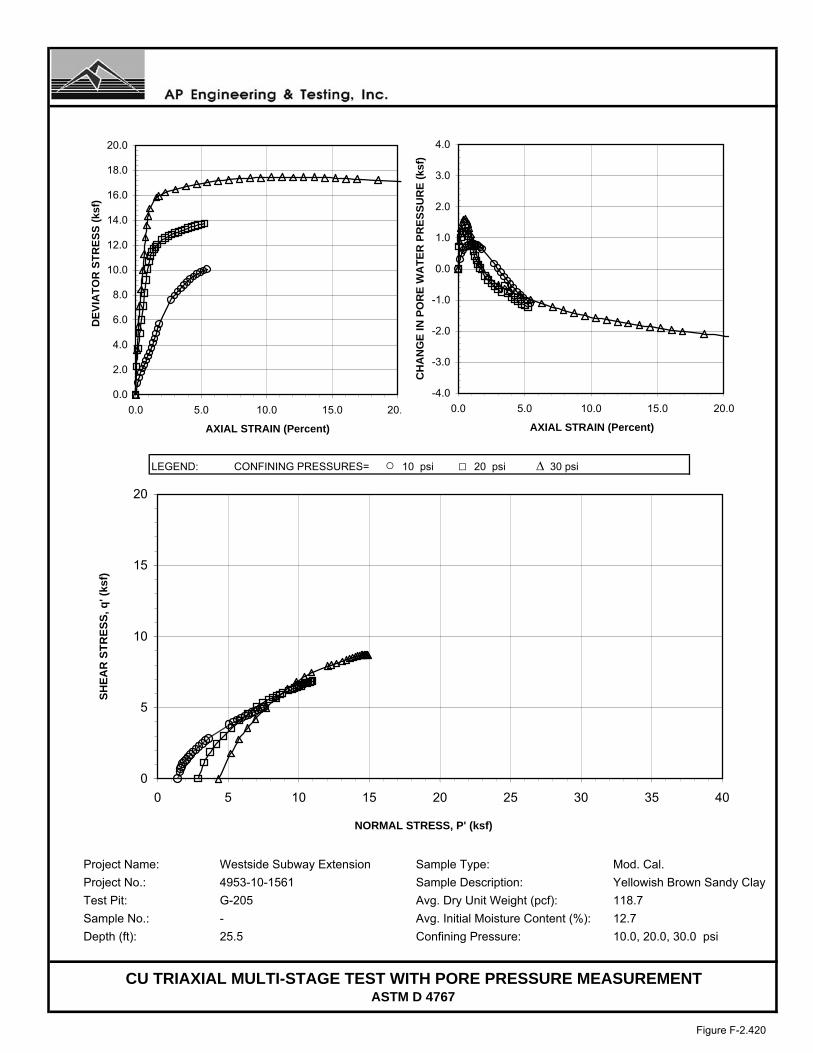
LEGEND: CONFINING PRESSURES= ○ 10 psi □ 20 psi ∆ 30 psi
Project Name: Westside Subway Extension Sample Type: Mod. Cal.
Project No.: 4953-10-1561 Sample Description: Yellowish Brown Sandy Clay
Test Pit: G-205 Avg. Dry Unit Weight (pcf): 118.7
Sample No.: - Avg. Initial Moisture Content (%): 12.7
Depth (ft): 25.5 Confining Pressure: 10.0, 20.0, 30.0 psi
CU TRIAXIAL MULTI-STAGE TEST WITH PORE PRESSURE MEASUREMENTASTM D 4767
0
5
10
15
20
0 5 10 15 20 25 30 35 40
NORMAL STRESS, P' (ksf)
SH
EA
R S
TR
ES
S, q
' (ks
f)
0.0
2.0
4.0
6.0
8.0
10.0
12.0
14.0
16.0
18.0
20.0
0.0 5.0 10.0 15.0 20.0
AXIAL STRAIN (Percent)
DE
VIA
TO
R S
TR
ES
S (
ksf)
-4.0
-3.0
-2.0
-1.0
0.0
1.0
2.0
3.0
4.0
0.0 5.0 10.0 15.0 20.0
AXIAL STRAIN (Percent)C
HA
NG
E I
N P
OR
E W
AT
ER
PR
ES
SU
RE
(ks
f)
Figure F-2.420

LEGEND: CONFINING PRESSURES= ○ 10 psi □ 20 psi ∆ 30 psi
Project Name: Westside Subway Extension Sample Type: Mod. Cal.Project No.: 4953-10-1561 Sample Description: Yellowish Brown Sandy ClayTest Pit: G-205 Avg. Dry Unit Weight (pcf): 118.7Sample No.: - Avg. Initial Moisture Content (%): 12.7Depth (ft): 25.5 Confining Pressure: 10.0, 20.0, 30.0 psi
CU TRIAXIAL MULTI-STAGE TEST WITH PORE PRESSURE MEASUREMENTASTM D 4767
0
5
10
15
0 5 10 15 20 25 30
NORMAL STRESS (ksf)
SH
EA
R S
TR
ES
S (
ksf)
φ=33°
φ'= 36°
0
5
10
15
20
0 5 10 15 20 25 30 35 40 p' (ksf)
q' (
ksf)
C= 1.75 ksfC'= 0.60 ksf
Failure Criteria: 5% Axial Strain
Figure F-2.421
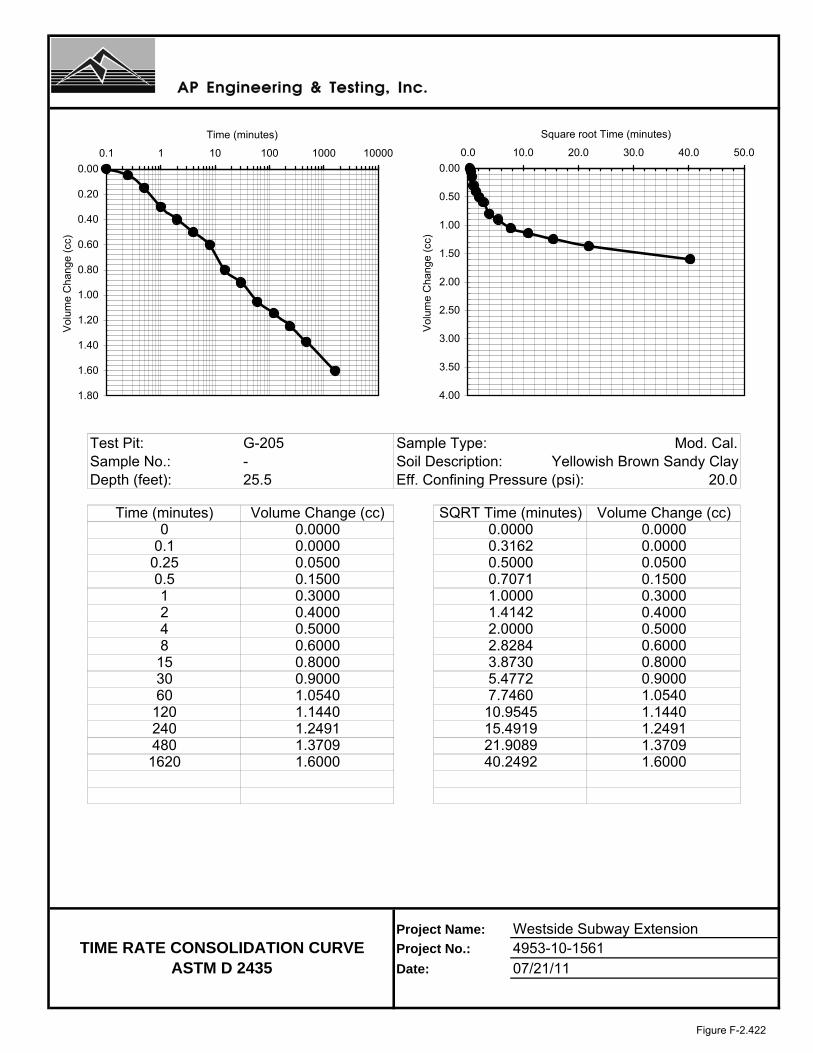
Test Pit: G-205 Sample Type: Mod. Cal.Sample No.: - Soil Description: Yellowish Brown Sandy ClayDepth (feet): 25.5 Eff. Confining Pressure (psi): 20.0
Project Name: Westside Subway ExtensionProject No.: 4953-10-1561Date: 07/21/11
1.6000
120240480
40.2492
8153060
0.250.512
0.0000
Time (minutes) Volume Change (cc)0.00000.0000
00.1
SQRT Time (minutes) Volume Change (cc)0.0000 0.0000
2.82843.87305.4772
0.31620.50000.70711.00001.4142
0.0500
1.0540
0.50000.60000.80000.9000
7.7460
2.00000.5000
TIME RATE CONSOLIDATION CURVE
0.80000.90001.0540
1.24911.3709
4
ASTM D 2435
1.14401.24911.3709
10.954515.491921.9089
1620 1.6000
1.1440
0.15000.30000.4000
0.6000
0.05000.15000.30000.4000
0.00
0.20
0.40
0.60
0.80
1.00
1.20
1.40
1.60
1.80
0.1 1 10 100 1000 10000
Time (minutes)
Vol
ume
Cha
nge
(cc)
0.00
0.50
1.00
1.50
2.00
2.50
3.00
3.50
4.00
0.0 10.0 20.0 30.0 40.0 50.0
Square root Time (minutes)
Vol
ume
Cha
nge
(cc)
Figure F-2.422
Preliminary Geotechnical and Environmental Report
Appendix F – Laboratory Testing
W E S T S I D E S U B W A Y E X T E N S I O N P R O J E C T December 21, 2011
FIGURES F-3.1 THROUGH F-3.7 CONSOLIDATION TEST DATA (ACE PHASE)

CONSOLIDATION TEST DATAProject No.: 4953-10-1561
Figure F-3.1
MTA Westside Subway ExtensionLos Angeles, California
Prepared/Date: NH 08/10/09Checked/Date: AH 10/02/09
0.12
0.10
0.08
0.06
0.04
0.02
0.00
CO
NSO
LID
AT
ION
ININ
CH
ES
PER
INC
H
1.0 10.0
LOAD IN KIPS PER SQUARE FOOT
Boring G-3 @ 55½'POORLY GRADED SAND
Boring G-2 @ 80½'SILTSTONE
Note: Water added to samples after consolidation under a load of 3.6 kips per square foot.

CONSOLIDATION TEST DATAProject No.: 4953-10-1561
Figure F-3.2
MTA Westside ExtensionLos Angeles, California
Prepared/Date: NH 08/10/09Checked/Date: AH 10/02/09
0.12
0.10
0.08
0.06
0.04
0.02
0.00
CO
NSO
LID
AT
ION
ININ
CH
ES
PER
INC
H
1.0 10.0
LOAD IN KIPS PER SQUARE FOOT
Boring G-5 @ 85½'SILTSTONE
[saturated with tar]
Boring G-5 @ 65½'POORLY GRADED SAND
[moderately infused tar]
Note: Water added to samples after consolidation under a load of 3.6 kips per square foot.

CONSOLIDATION TEST DATAProject No.: 4953-10-1561
Figure F-3.3
MTA Westside ExtensionLos Angeles, California
Prepared/Date: NH 08/10/09Checked/Date: AH 10/02/09
0.12
0.10
0.08
0.06
0.04
0.02
0.00
CO
NSO
LID
AT
ION
ININ
CH
ES
PER
INC
H
1.0 10.02.0 3.0 4.0 5.0 6.0 7.08.09.0 20.00.90.80.70.60.50.4
LOAD IN KIPS PER SQUARE FOOT
Boring G-9 @ 65½'LEAN CLAY
Boring G-7 @ 65½'POORLY GRADED SAND
[moderately infused tar]
Note: Water added to samples after consolidation under a load of 3.6 kips per square foot.

CONSOLIDATION TEST DATAProject No.: 4953-10-1561
Figure F-3.4
MTA Westside ExtensionLos Angeles, California
Prepared/Date: NH 08/10/09Checked/Date: AH 10/02/09
0.12
0.10
0.08
0.06
0.04
0.02
0.00C
ON
SOL
IDA
TIO
NIN
INC
HE
SPE
RIN
CH
1.0 10.0
LOAD IN KIPS PER SQUARE FOOT
Boring G-12 @ 75½'LEAN CLAY
Boring G-11 @ 75½'SILTY CLAY
Note: Water added to samples after consolidation under a load of 1.8 kips per square foot.
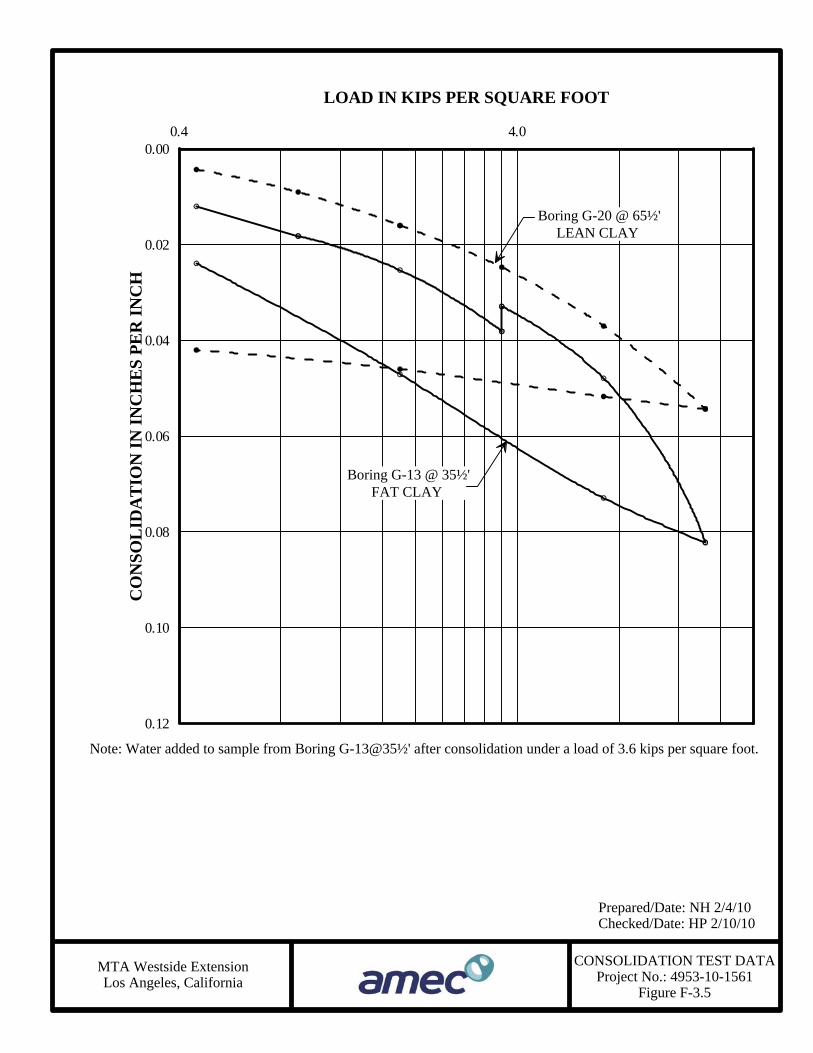
CONSOLIDATION TEST DATAProject No.: 4953-10-1561
Figure F-3.5
MTA Westside ExtensionLos Angeles, California
Prepared/Date: NH 2/4/10Checked/Date: HP 2/10/10
0.12
0.10
0.08
0.06
0.04
0.02
0.00C
ON
SOL
IDA
TIO
NIN
INC
HE
SPE
RIN
CH
0.4 4.0
LOAD IN KIPS PER SQUARE FOOT
Boring G-13 @ 35½'FAT CLAY
Boring G-20 @ 65½'LEAN CLAY
Note: Water added to sample from Boring G-13@35½' after consolidation under a load of 3.6 kips per square foot.

CONSOLIDATION TEST DATAProject No.: 4953-10-1561
Figure F-3.6
MTA Westside ExtensionLos Angeles, California
Prepared/Date: NH 2/4/10Checked/Date: HP 2/10/10
0.12
0.10
0.08
0.06
0.04
0.02
0.00C
ON
SOL
IDA
TIO
NIN
INC
HE
SPE
RIN
CH
0.4 4.0
LOAD IN KIPS PER SQUARE FOOT
Boring G-23 @ 55½'SILTY SAND
Boring G-20 @ 85½'SILTY SAND

CONSOLIDATION TEST DATAProject No.: 4953-10-1561
Figure F-3.7
MTA Westside ExtensionLos Angeles, California
Prepared/Date: NH 2/4/10Checked/Date: HP 2/10/10
0.12
0.10
0.08
0.06
0.04
0.02
0.00
CO
NSO
LID
AT
ION
ININ
CH
ES
PER
INC
H
1.0 10.0
LOAD IN KIPS PER SQUARE FOOT
Boring G-24 @ 65½'SILTY SAND
Boring G-23 @ 75½'SILTY CLAY

Preliminary Geotechnical and Environmental Report
Appendix F – Laboratory Testing
W E S T S I D E S U B W A Y E X T E N S I O N P R O J E C T December 21, 2011
FIGURES F-4.1 THROUGH F-4.97 CONSOLIDATION TEST DATA (PE PHASE)
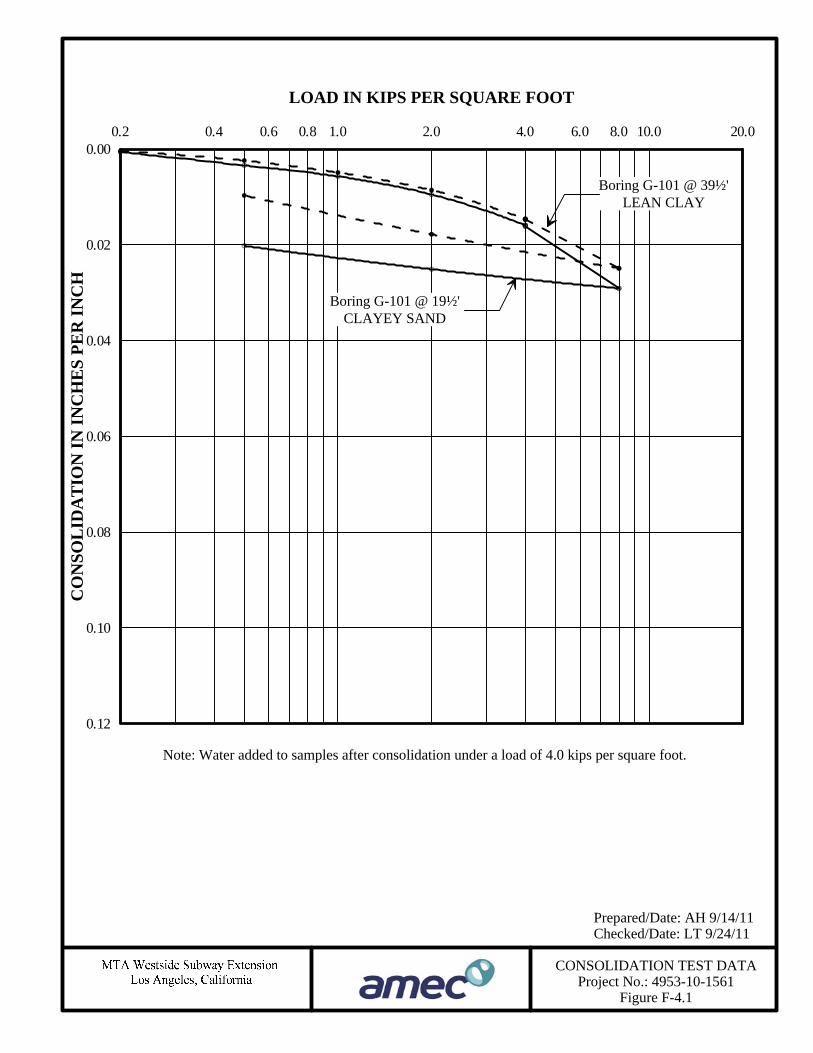
CONSOLIDATION TEST DATAProject No.: 4953-10-1561
Figure F-4.1
Prepared/Date: AH 9/14/11Checked/Date: LT 9/24/11
0.12
0.10
0.08
0.06
0.04
0.02
0.00
CO
NSO
LID
AT
ION
ININ
CH
ES
PER
INC
H
1.0 10.02.0 4.0 6.0 8.0 20.00.80.60.40.2
LOAD IN KIPS PER SQUARE FOOT
Boring G-101 @ 19½'CLAYEY SAND
Boring G-101 @ 39½'LEAN CLAY
Note: Water added to samples after consolidation under a load of 4.0 kips per square foot.

CONSOLIDATION TEST DATAProject No.: 4953-10-1561
Figure F-4.2
Prepared/Date: AH 8/25/11Checked/Date: LT 9/15/11
0.12
0.10
0.08
0.06
0.04
0.02
0.00
-0.02
CO
NSO
LID
AT
ION
ININ
CH
ES
PER
INC
H
1.0 10.02.0 4.0 6.0 8.0 20.00.80.60.4
LOAD IN KIPS PER SQUARE FOOT
Boring G-102 @ 30½'FAT CLAY with SAND
Boring G-102 @ 75½'SILTSTONE
Note: Water added to samples at 30½' and 75½' after consolidation under a load of 3.6 and 7.2 kips per square foot,respectively.

CONSOLIDATION TEST DATAProject No.: 4953-10-1561
Figure F-4.3
Prepared/Date: AH/JF 5/15/11Checked/Date: LT 8/16/11
0.12
0.10
0.08
0.06
0.04
0.02
0.00
CO
NSO
LID
AT
ION
ININ
CH
ES
PER
INC
H
1.0 10.02.0 4.0 6.0 8.0 20.00.80.60.4
LOAD IN KIPS PER SQUARE FOOT
Boring G-103 @ 46½'SILTY SAND
Note: Water added to samples after consolidation under a load of 3.6 kips per square foot.
Boring G-103 @ 40½'SANDY LEAN CLAY

CONSOLIDATION TEST DATAProject No.: 4953-10-1561
Figure F-4.4
Prepared/Date: AH 8/25/11Checked/Date: LT 9/12/11
0.12
0.10
0.08
0.06
0.04
0.02
0.00
CO
NSO
LID
AT
ION
ININ
CH
ES
PER
INC
H
1.0 10.02.0 4.0 6.0 8.0 20.00.80.60.4
LOAD IN KIPS PER SQUARE FOOT
Boring G-104 @ 35½'LEAN CLAY
Boring G-104 @ 90½'SILTSTONE
Note: Water added to samples at 35½' and 90½' after consolidation under a load of 3.6 and 7.2 kips per square foot,respectively.

CONSOLIDATION TEST DATAProject No.: 4953-10-1561
Figure F-4.5
Prepared/Date: AH 7/25/11Checked/Date: LT 8/16/11
0.12
0.10
0.08
0.06
0.04
0.02
0.00
CO
NSO
LID
AT
ION
ININ
CH
ES
PER
INC
H
1.0 10.02.0 4.0 6.0 8.0 20.00.80.60.4
LOAD IN KIPS PER SQUARE FOOT
Boring G-105 @ 45½'SILTY SAND
Note: Water added to samples at 45½' and 90½' after consolidation under a load of 3.6 and 7.2 kips per square foot,respectively..
Boring G-105 @ 75½'SILTSTONE

CONSOLIDATION TEST DATAProject No.: 4953-10-1561
Figure F-4.6
Prepared/Date: AH/JF 5/15/11Checked/Date: LT 8/16/11
0.12
0.10
0.08
0.06
0.04
0.02
0.00
CO
NSO
LID
AT
ION
ININ
CH
ES
PER
INC
H
1.0 10.02.0 4.0 6.0 8.0 20.00.80.60.4
LOAD IN KIPS PER SQUARE FOOT
Boring G-106 @ 55½'CLAYEY SAND
Note: Water added to samples after consolidation under a load of 3.6 kips per square foot.
Boring G-106 @ 37½'CLAYEY SAND
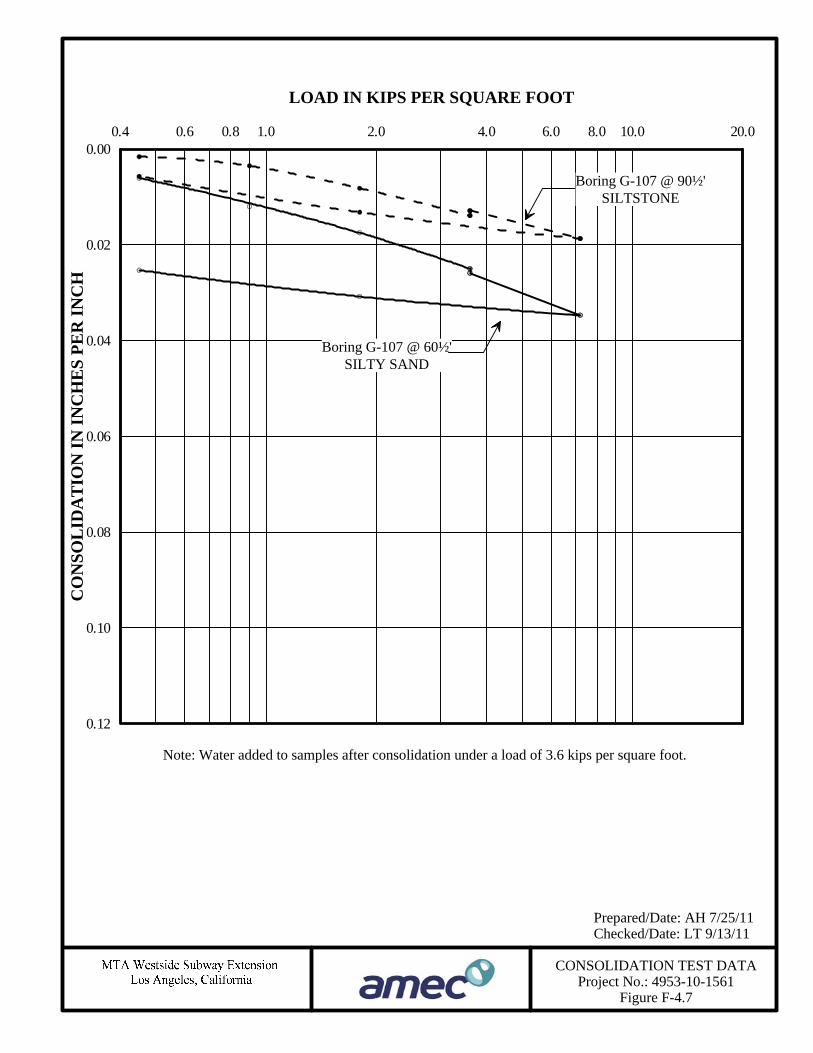
CONSOLIDATION TEST DATAProject No.: 4953-10-1561
Figure F-4.7
Prepared/Date: AH 7/25/11Checked/Date: LT 9/13/11
0.12
0.10
0.08
0.06
0.04
0.02
0.00
CO
NSO
LID
AT
ION
ININ
CH
ES
PER
INC
H
1.0 10.02.0 4.0 6.0 8.0 20.00.80.60.4
LOAD IN KIPS PER SQUARE FOOT
Boring G-107 @ 60½'SILTY SAND
Note: Water added to samples after consolidation under a load of 3.6 kips per square foot.
Boring G-107 @ 90½'SILTSTONE

CONSOLIDATION TEST DATAProject No.: 4953-10-1561
Figure F-4.8
Prepared/Date: AH 7/25/11Checked/Date: LT 9/13/11
0.12
0.10
0.08
0.06
0.04
0.02
0.00
CO
NSO
LID
AT
ION
ININ
CH
ES
PER
INC
H
1.0 10.02.0 4.0 6.0 8.0 20.00.80.60.4
LOAD IN KIPS PER SQUARE FOOT
Boring G-108 @ 90½'ELASTIC SILT
Note: Water added to samples after consolidation under a load of 3.6 kips per square foot.
Boring G-108 @ 105½'SILTSTONE
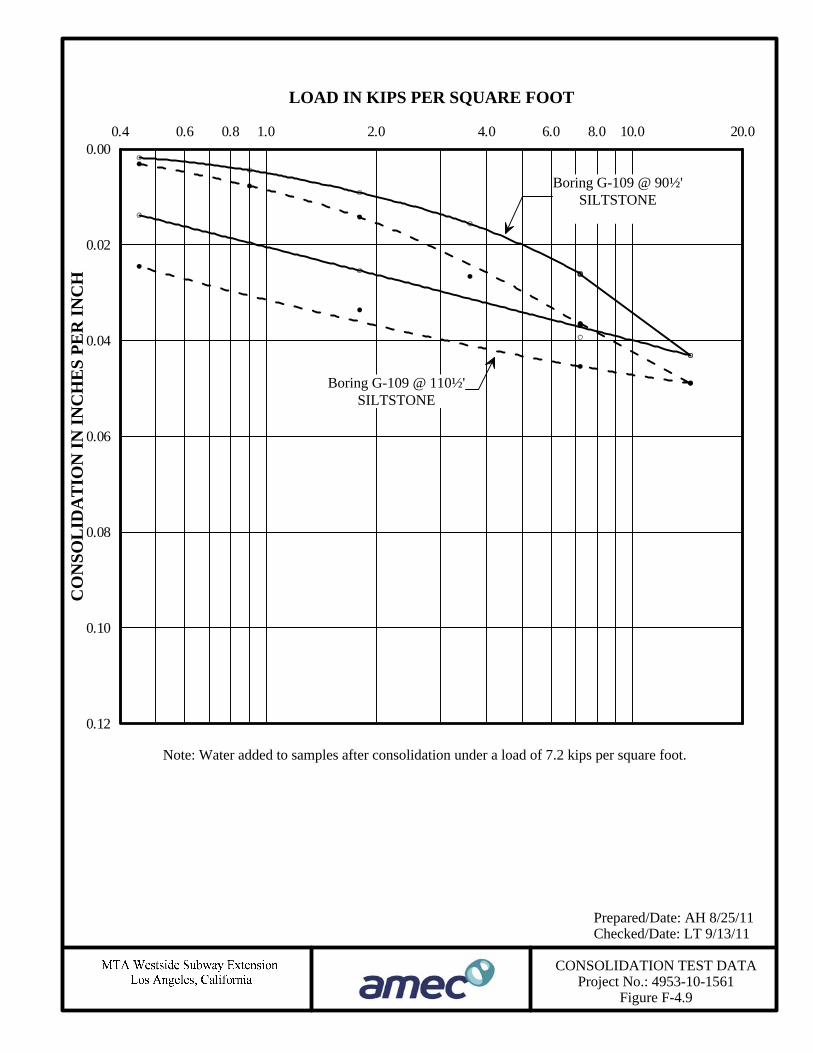
CONSOLIDATION TEST DATAProject No.: 4953-10-1561
Figure F-4.9
Prepared/Date: AH 8/25/11Checked/Date: LT 9/13/11
0.12
0.10
0.08
0.06
0.04
0.02
0.00
CO
NSO
LID
AT
ION
ININ
CH
ES
PER
INC
H
1.0 10.02.0 4.0 6.0 8.0 20.00.80.60.4
LOAD IN KIPS PER SQUARE FOOT
Boring G-109 @ 90½'SILTSTONE
Boring G-109 @ 110½'SILTSTONE
Note: Water added to samples after consolidation under a load of 7.2 kips per square foot.
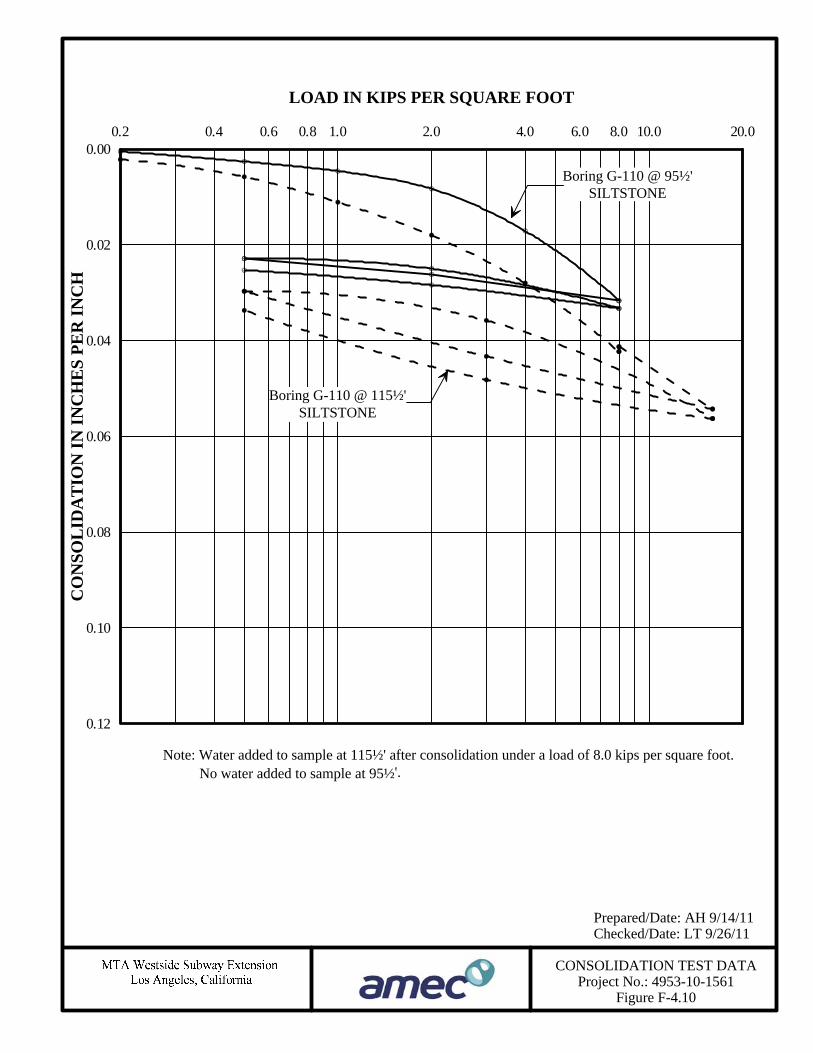
CONSOLIDATION TEST DATAProject No.: 4953-10-1561
Figure F-4.10
Prepared/Date: AH 9/14/11Checked/Date: LT 9/26/11
0.12
0.10
0.08
0.06
0.04
0.02
0.00
CO
NSO
LID
AT
ION
ININ
CH
ES
PER
INC
H
1.0 10.02.0 4.0 6.0 8.0 20.00.80.60.40.2
LOAD IN KIPS PER SQUARE FOOT
Boring G-110 @ 115½'SILTSTONE
Boring G-110 @ 95½'SILTSTONE
Note: Water added to sample at 115½' after consolidation under a load of 8.0 kips per square foot.No water added to sample at 95½'.
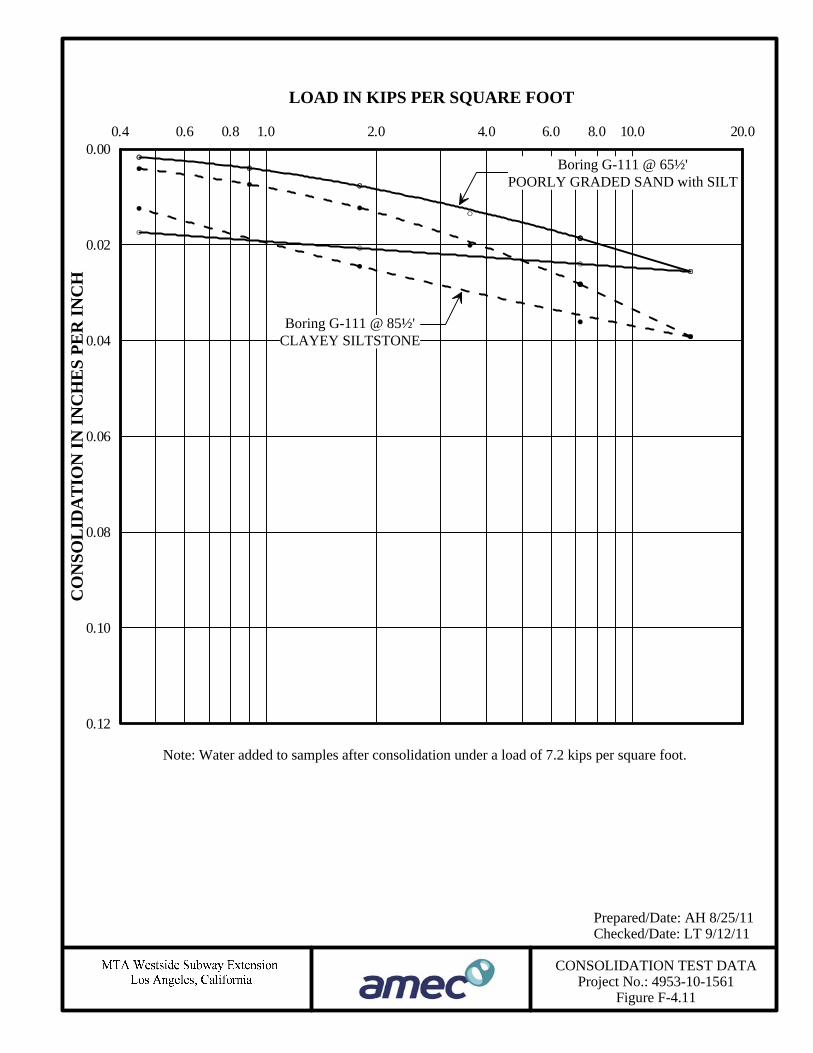
CONSOLIDATION TEST DATAProject No.: 4953-10-1561
Figure F-4.11
Prepared/Date: AH 8/25/11Checked/Date: LT 9/12/11
0.12
0.10
0.08
0.06
0.04
0.02
0.00
CO
NSO
LID
AT
ION
ININ
CH
ES
PER
INC
H
1.0 10.02.0 4.0 6.0 8.0 20.00.80.60.4
LOAD IN KIPS PER SQUARE FOOT
Boring G-111 @ 85½'CLAYEY SILTSTONE
Note: Water added to samples after consolidation under a load of 7.2 kips per square foot.
Boring G-111 @ 65½'POORLY GRADED SAND with SILT

CONSOLIDATION TEST DATAProject No.: 4953-10-1561
Figure F-4.12
Prepared/Date: AH 7/25/11Checked/Date: LT 9/12/11
0.12
0.10
0.08
0.06
0.04
0.02
0.00
CO
NSO
LID
AT
ION
ININ
CH
ES
PER
INC
H
1.0 10.02.0 4.0 6.0 8.0 20.00.80.60.4
LOAD IN KIPS PER SQUARE FOOT
Boring G-112 @ 110½'SILTSTONE
Note: Water added to samples after consolidation under a load of 3.6 kips per square foot.
Boring G-112 @ 65½'POORLY GRADED SAND with SILT
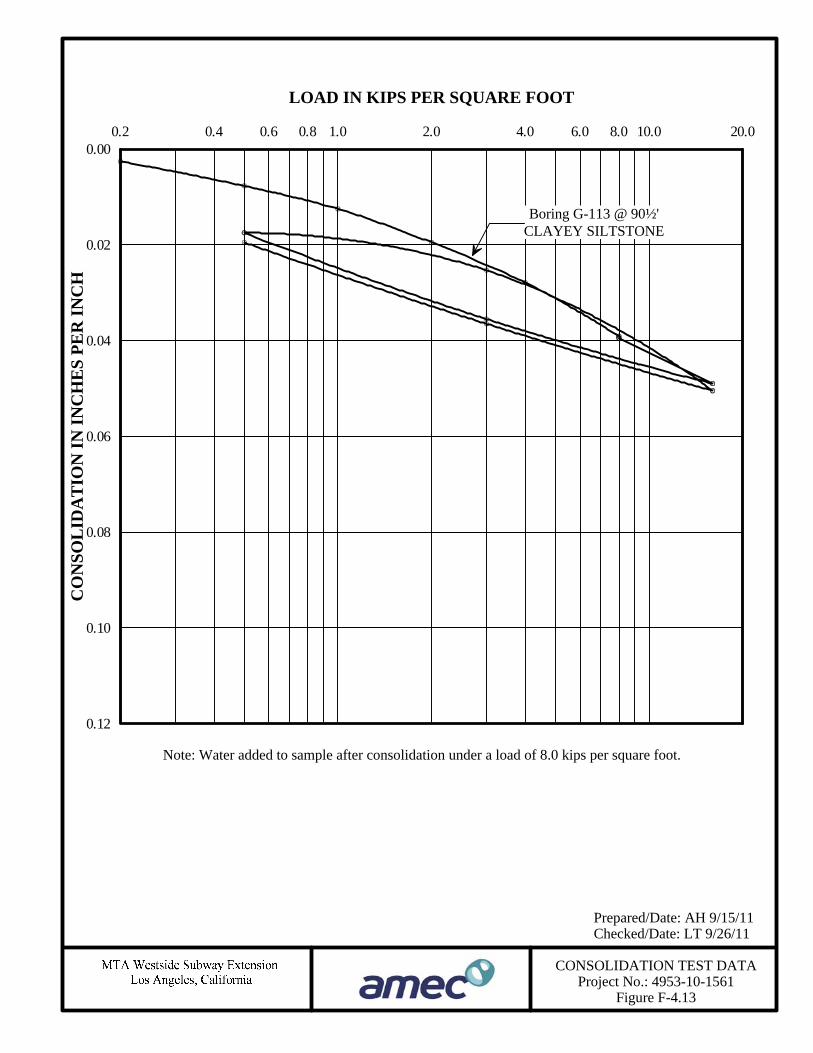
CONSOLIDATION TEST DATAProject No.: 4953-10-1561
Figure F-4.13
Prepared/Date: AH 9/15/11Checked/Date: LT 9/26/11
0.12
0.10
0.08
0.06
0.04
0.02
0.00
CO
NSO
LID
AT
ION
ININ
CH
ES
PER
INC
H
1.0 10.02.0 4.0 6.0 8.0 20.00.80.60.40.2
LOAD IN KIPS PER SQUARE FOOT
Boring G-113 @ 90½'CLAYEY SILTSTONE
Note: Water added to sample after consolidation under a load of 8.0 kips per square foot.
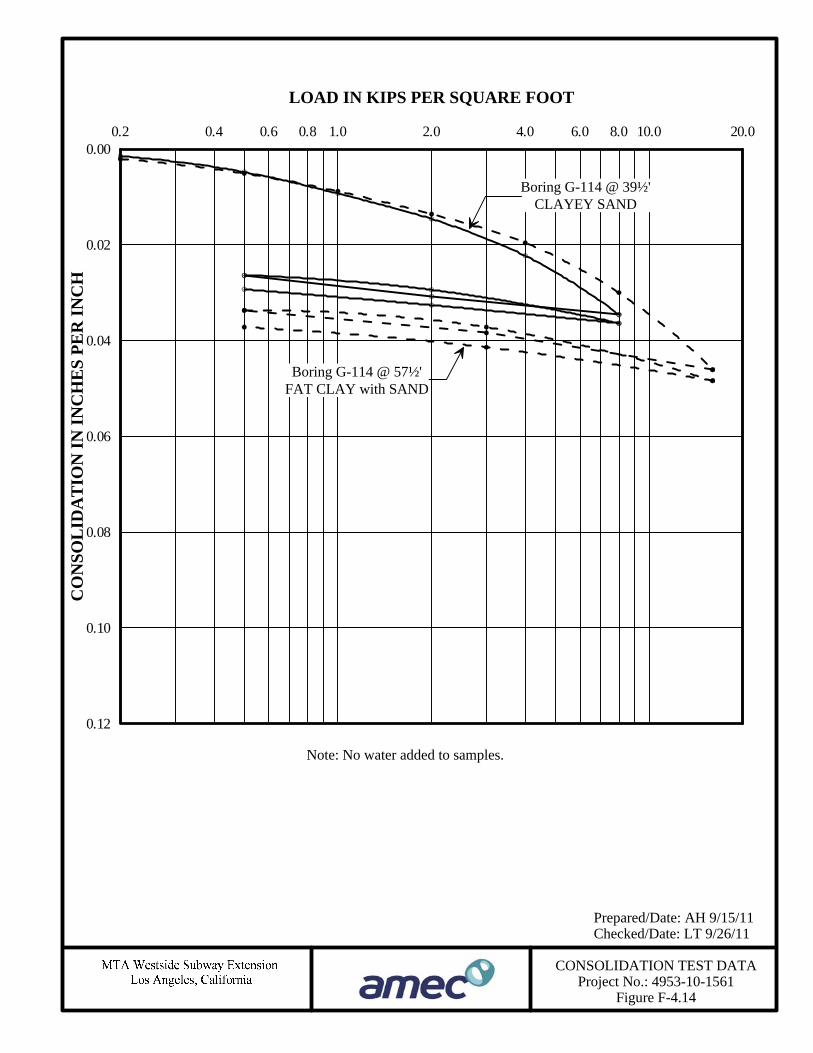
CONSOLIDATION TEST DATAProject No.: 4953-10-1561
Figure F-4.14
Prepared/Date: AH 9/15/11Checked/Date: LT 9/26/11
0.12
0.10
0.08
0.06
0.04
0.02
0.00
CO
NSO
LID
AT
ION
ININ
CH
ES
PER
INC
H
1.0 10.02.0 4.0 6.0 8.0 20.00.80.60.40.2
LOAD IN KIPS PER SQUARE FOOT
Boring G-114 @ 57½'FAT CLAY with SAND
Boring G-114 @ 39½'CLAYEY SAND
Note: No water added to samples.

CONSOLIDATION TEST DATAProject No.: 4953-10-1561
Figure F-4.15
Prepared/Date: AH 9/15/11Checked/Date: LT 9/26/11
0.12
0.10
0.08
0.06
0.04
0.02
0.00
CO
NSO
LID
AT
ION
ININ
CH
ES
PER
INC
H
1.0 10.02.0 4.0 6.0 8.0 20.00.80.60.40.2
LOAD IN KIPS PER SQUARE FOOT
Boring G-114 @ 80½'SILTY SAND
Boring G-114 @ 69½'POORLY GRADED SAND
Note: Water added to sample at 80' after consolidation under a load of 8.0 kips per square foot.No water added to sample at 69'.

CONSOLIDATION TEST DATAProject No.: 4953-10-1561
Figure F-4.16
Prepared/Date: AH 8/26/11Checked/Date: LT 9/15/11
0.12
0.10
0.08
0.06
0.04
0.02
0.00
CO
NSO
LID
AT
ION
ININ
CH
ES
PER
INC
H
1.0 10.02.0 4.0 6.0 8.0 20.00.80.60.4
LOAD IN KIPS PER SQUARE FOOT
Boring G-116 @ 50'SANDY SILT
Note: Water added to samples after consolidation under a load of 3.6 kips per square foot.
Boring G-116 @ 80'POORLY GRADED SAND with SILT

CONSOLIDATION TEST DATAProject No.: 4953-10-1561
Figure F-4.17
Prepared/Date: AH 6/28/11Checked/Date: LT 9/13/11
0.12
0.10
0.08
0.06
0.04
0.02
0.00
CO
NSO
LID
AT
ION
ININ
CH
ES
PER
INC
H
1.0 10.02.0 4.0 6.0 8.0 20.00.80.60.4
LOAD IN KIPS PER SQUARE FOOT
Boring G-118 @ 40½'SANDY SILT
[moderately infused tar]
Note: Water added to samples after consolidation under a load of 3.6 kips per square foot.
Boring G-118 @ 52½'POORLY GRADED SAND with SILT
[moderately infused tar, 14%]
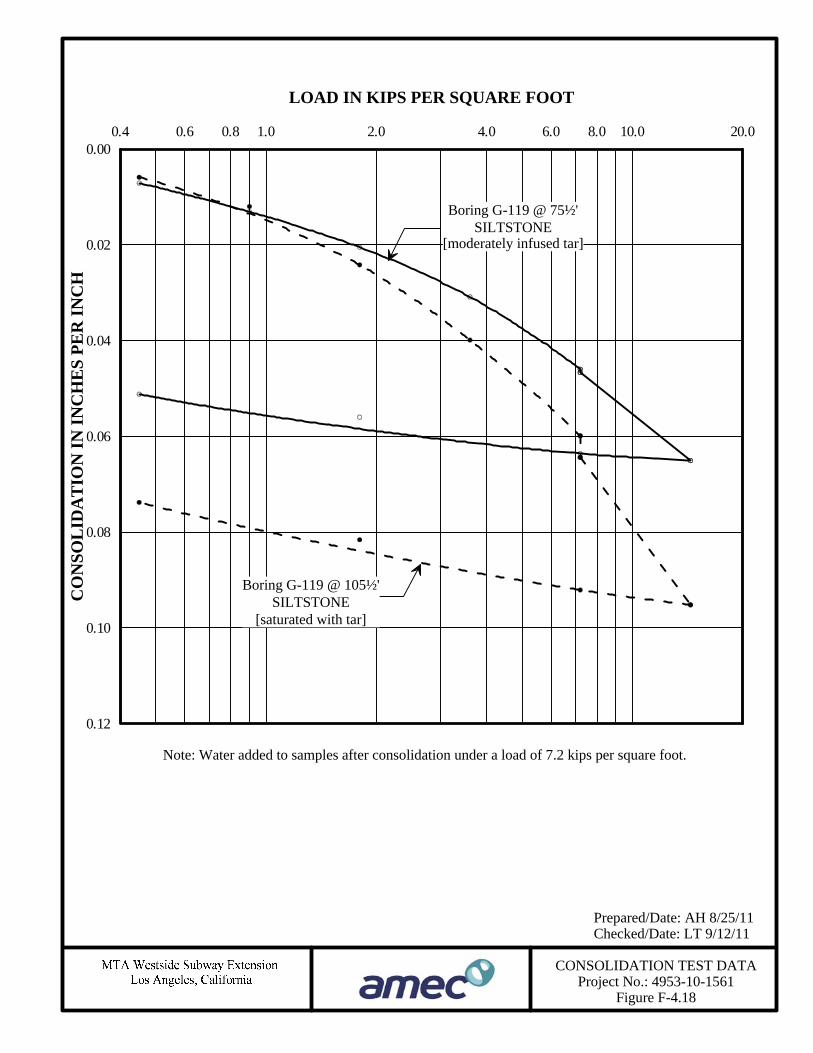
CONSOLIDATION TEST DATAProject No.: 4953-10-1561
Figure F-4.18
Prepared/Date: AH 8/25/11Checked/Date: LT 9/12/11
0.12
0.10
0.08
0.06
0.04
0.02
0.00
CO
NSO
LID
AT
ION
ININ
CH
ES
PER
INC
H
1.0 10.02.0 4.0 6.0 8.0 20.00.80.60.4
LOAD IN KIPS PER SQUARE FOOT
Boring G-119 @ 105½'SILTSTONE
[saturated with tar]
Note: Water added to samples after consolidation under a load of 7.2 kips per square foot.
Boring G-119 @ 75½'SILTSTONE
[moderately infused tar]
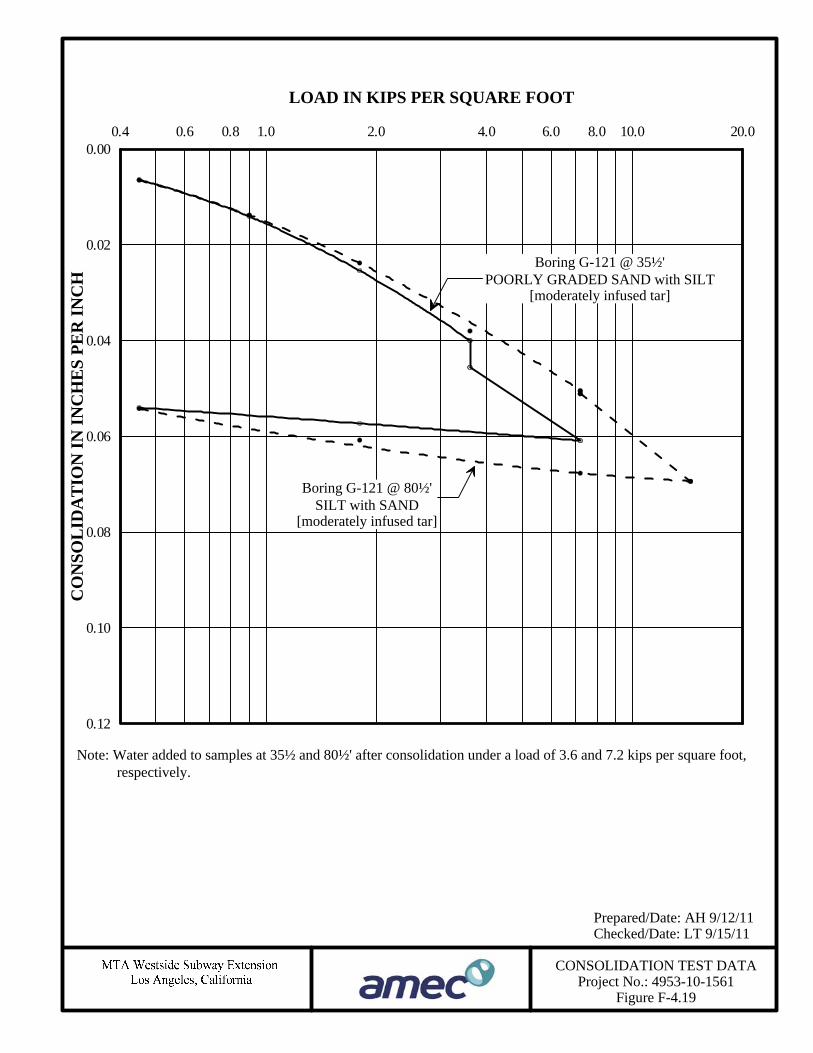
CONSOLIDATION TEST DATAProject No.: 4953-10-1561
Figure F-4.19
Prepared/Date: AH 9/12/11Checked/Date: LT 9/15/11
0.12
0.10
0.08
0.06
0.04
0.02
0.00
CO
NSO
LID
AT
ION
ININ
CH
ES
PER
INC
H
1.0 10.02.0 4.0 6.0 8.0 20.00.80.60.4
LOAD IN KIPS PER SQUARE FOOT
Boring G-121 @ 80½'SILT with SAND
[moderately infused tar]
Note: Water added to samples at 35½ and 80½' after consolidation under a load of 3.6 and 7.2 kips per square foot,respectively.
Boring G-121 @ 35½'POORLY GRADED SAND with SILT
[moderately infused tar]

CONSOLIDATION TEST DATAProject No.: 4953-10-1561
Figure F-4.20
Prepared/Date: AH 6/28/11Checked/Date: LT 9/15/11
0.12
0.10
0.08
0.06
0.04
0.02
0.00
CO
NSO
LID
AT
ION
ININ
CH
ES
PER
INC
H
1.0 10.02.0 4.0 6.0 8.0 20.00.80.60.4
LOAD IN KIPS PER SQUARE FOOT
Boring G-123 @ 52½'WELL GRADED SAND with SILT
[moderately infused tar]
Note: Water added to sample after consolidation under a load of 3.6 kips per square foot.

CONSOLIDATION TEST DATAProject No.: 4953-10-1561
Figure F-4.21
Prepared/Date: AH 6/28/11Checked/Date: LT 9/15/11
0.12
0.10
0.08
0.06
0.04
0.02
0.00
CO
NSO
LID
AT
ION
ININ
CH
ES
PER
INC
H
1.0 10.02.0 4.0 6.0 8.0 20.00.80.60.4
LOAD IN KIPS PER SQUARE FOOT
Boring G-124 @ 30½'CLAYEY SAND
[moderately infused tar, 10%]
Note: Water added to samples after consolidation under a load of 3.6 kips per square foot.
Boring G-124 @ 60½'POORLY GRADED SAND with SILT
[moderately infused tar, 13%]
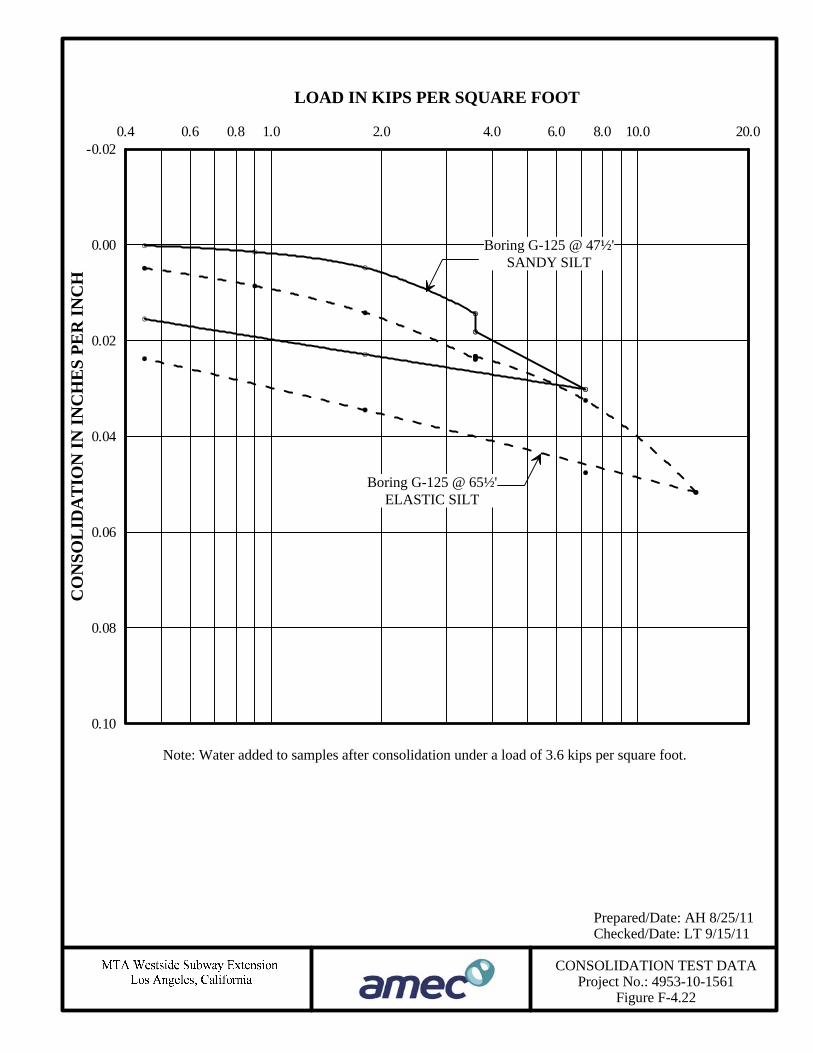
CONSOLIDATION TEST DATAProject No.: 4953-10-1561
Figure F-4.22
Prepared/Date: AH 8/25/11Checked/Date: LT 9/15/11
0.10
0.08
0.06
0.04
0.02
0.00
-0.02
CO
NSO
LID
AT
ION
ININ
CH
ES
PER
INC
H
1.0 10.02.0 4.0 6.0 8.0 20.00.80.60.4
LOAD IN KIPS PER SQUARE FOOT
Boring G-125 @ 47½'SANDY SILT
Boring G-125 @ 65½'ELASTIC SILT
Note: Water added to samples after consolidation under a load of 3.6 kips per square foot.
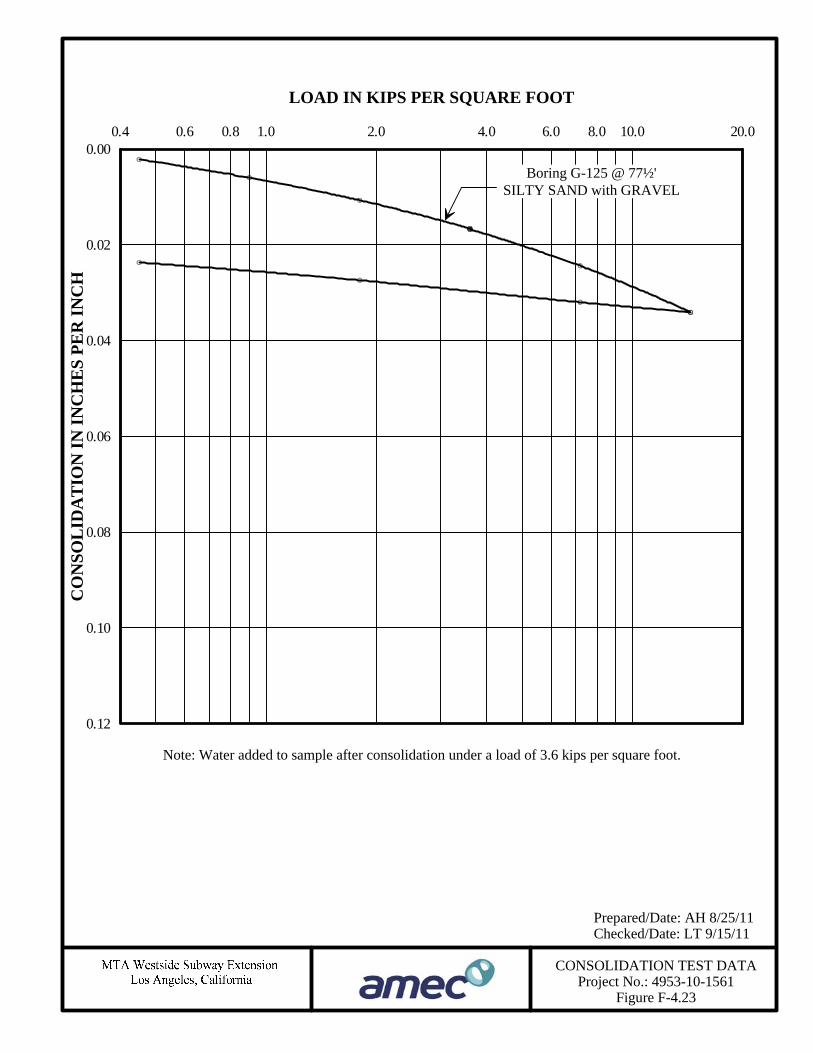
CONSOLIDATION TEST DATAProject No.: 4953-10-1561
Figure F-4.23
Prepared/Date: AH 8/25/11Checked/Date: LT 9/15/11
0.12
0.10
0.08
0.06
0.04
0.02
0.00
CO
NSO
LID
AT
ION
ININ
CH
ES
PER
INC
H
1.0 10.02.0 4.0 6.0 8.0 20.00.80.60.4
LOAD IN KIPS PER SQUARE FOOT
Boring G-125 @ 77½'SILTY SAND with GRAVEL
Note: Water added to sample after consolidation under a load of 3.6 kips per square foot.

CONSOLIDATION TEST DATAProject No.: 4953-10-1561
Figure F-4.24
Prepared/Date: AH 5/15/11Checked/Date: NH 5/20/11
0.12
0.10
0.08
0.06
0.04
0.02
0.00
CO
NSO
LID
AT
ION
ININ
CH
ES
PER
INC
H
1.0 10.02.0 4.0 6.0 8.0 20.00.80.60.4
LOAD IN KIPS PER SQUARE FOOT
Boring G-126 @ 70½'POORLY GRADED SAND
Note: Water added to samples after consolidation under a load of 3.6 kips per square foot.
Boring G-126 @ 40½'ELASTIC SILT

CONSOLIDATION TEST DATAProject No.: 4953-10-1561
Figure F-4.25
Prepared/Date: AH 7/25/11Checked/Date: LT 8/8/11
0.12
0.10
0.08
0.06
0.04
0.02
0.00
CO
NSO
LID
AT
ION
ININ
CH
ES
PER
INC
H
1.0 10.02.0 4.0 6.0 8.0 20.00.80.60.4
LOAD IN KIPS PER SQUARE FOOT
Note: Water added to sample after consolidation under a load of 3.6 kips per square foot.
Boring G-127 @ 60½'LEAN CLAY
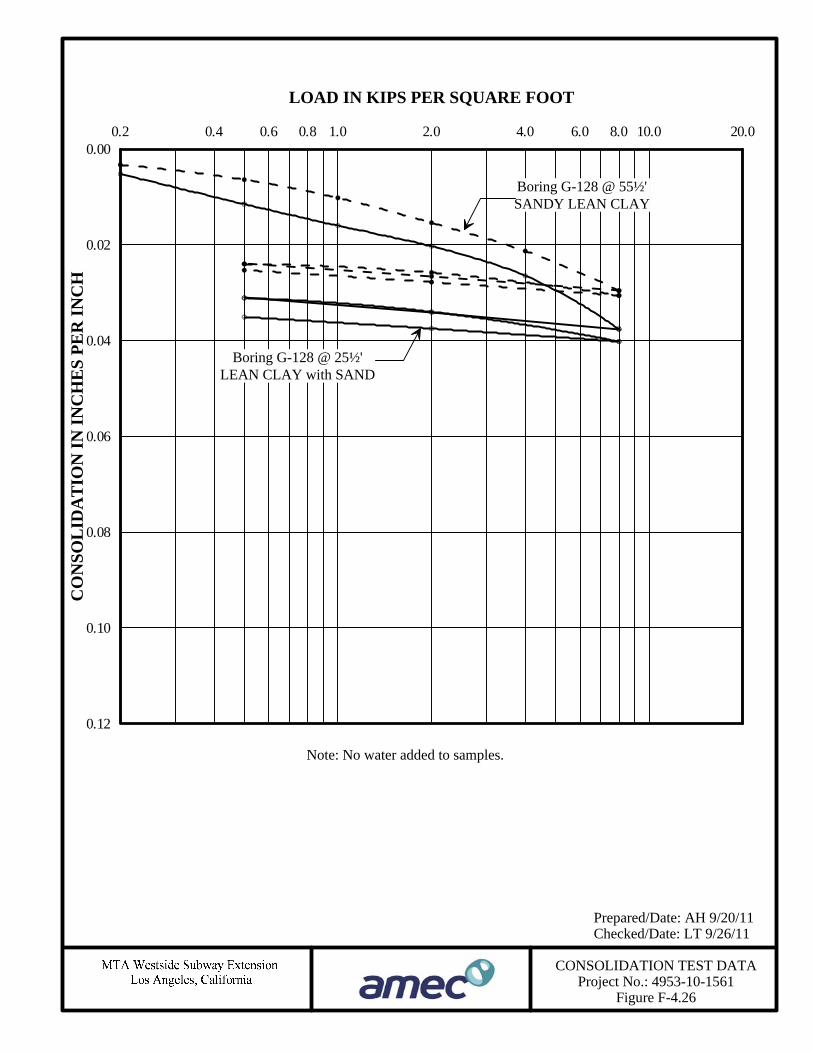
CONSOLIDATION TEST DATAProject No.: 4953-10-1561
Figure F-4.26
Prepared/Date: AH 9/20/11Checked/Date: LT 9/26/11
0.12
0.10
0.08
0.06
0.04
0.02
0.00
CO
NSO
LID
AT
ION
ININ
CH
ES
PER
INC
H
1.0 10.02.0 4.0 6.0 8.0 20.00.80.60.40.2
LOAD IN KIPS PER SQUARE FOOT
Boring G-128 @ 25½'LEAN CLAY with SAND
Boring G-128 @ 55½'SANDY LEAN CLAY
Note: No water added to samples.

CONSOLIDATION TEST DATAProject No.: 4953-10-1561
Figure F-4.27
Prepared/Date: AH 9/20/11Checked/Date: LT 9/23/11
0.12
0.10
0.08
0.06
0.04
0.02
0.00
CO
NSO
LID
AT
ION
ININ
CH
ES
PER
INC
H
1.0 10.02.0 4.0 6.0 8.0 20.00.80.60.40.2
LOAD IN KIPS PER SQUARE FOOT
Boring G-128 @ 80½'FAT CLAY with SAND
Note: Water added to sample after consolidation under a load of 8.0 kips per square foot.
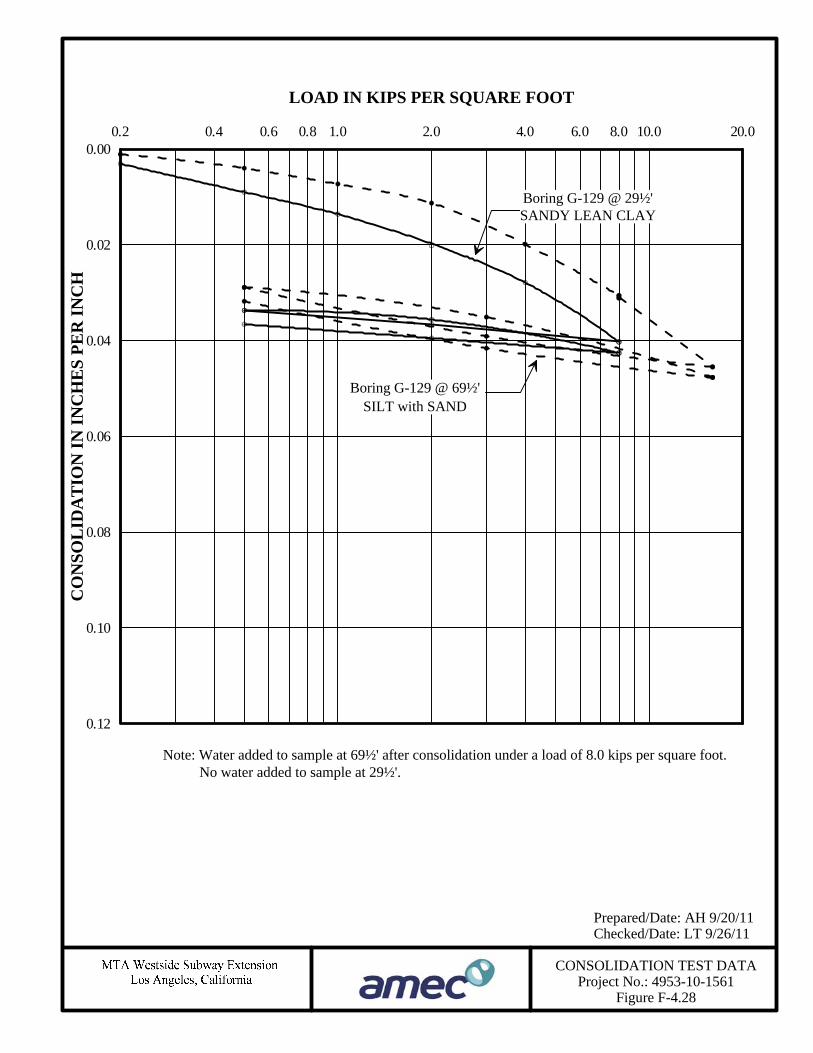
CONSOLIDATION TEST DATAProject No.: 4953-10-1561
Figure F-4.28
Prepared/Date: AH 9/20/11Checked/Date: LT 9/26/11
0.12
0.10
0.08
0.06
0.04
0.02
0.00
CO
NSO
LID
AT
ION
ININ
CH
ES
PER
INC
H
1.0 10.02.0 4.0 6.0 8.0 20.00.80.60.40.2
LOAD IN KIPS PER SQUARE FOOT
Boring G-129 @ 69½'SILT with SAND
Boring G-129 @ 29½'SANDY LEAN CLAY
Note: Water added to sample at 69½' after consolidation under a load of 8.0 kips per square foot.No water added to sample at 29½'.
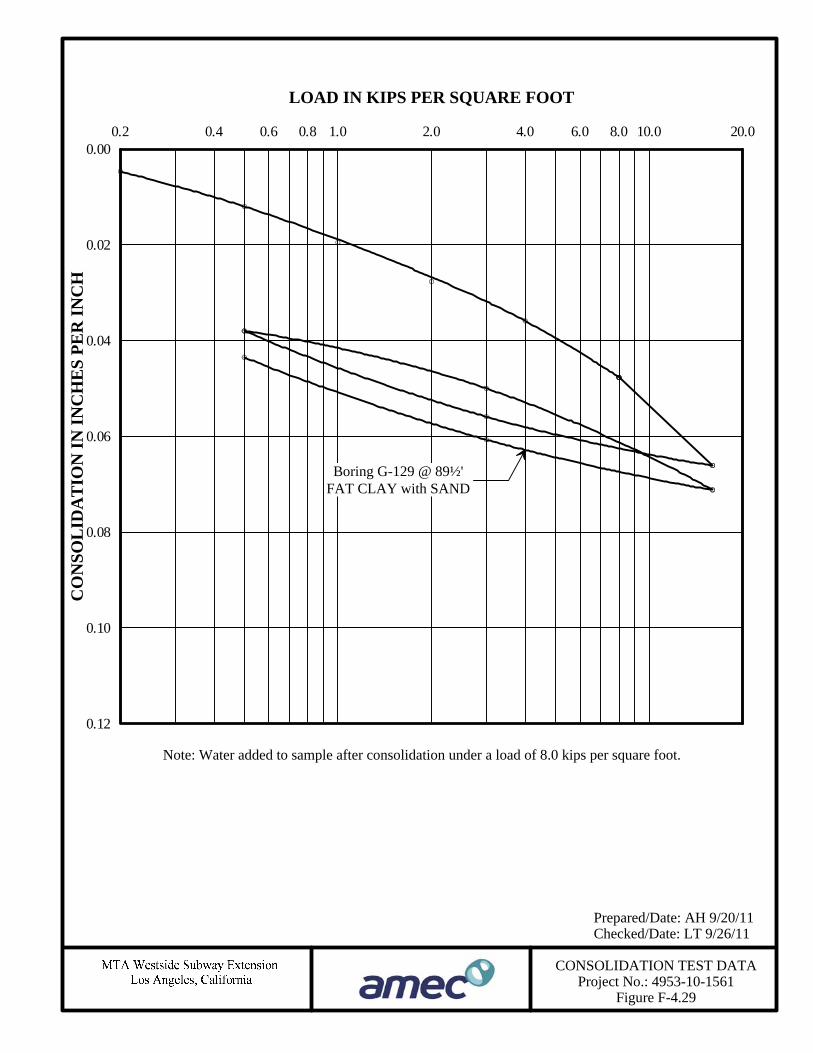
CONSOLIDATION TEST DATAProject No.: 4953-10-1561
Figure F-4.29
Prepared/Date: AH 9/20/11Checked/Date: LT 9/26/11
0.12
0.10
0.08
0.06
0.04
0.02
0.00
CO
NSO
LID
AT
ION
ININ
CH
ES
PER
INC
H
1.0 10.02.0 4.0 6.0 8.0 20.00.80.60.40.2
LOAD IN KIPS PER SQUARE FOOT
Boring G-129 @ 89½'FAT CLAY with SAND
Note: Water added to sample after consolidation under a load of 8.0 kips per square foot.
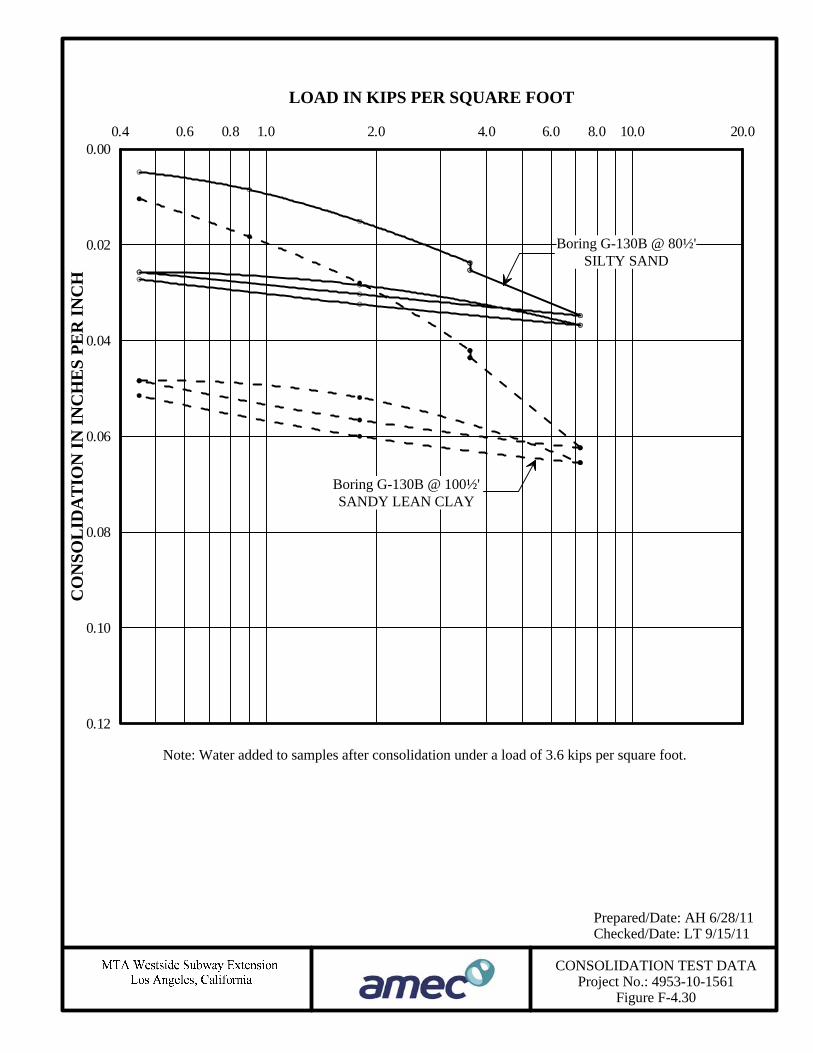
CONSOLIDATION TEST DATAProject No.: 4953-10-1561
Figure F-4.30
Prepared/Date: AH 6/28/11Checked/Date: LT 9/15/11
0.12
0.10
0.08
0.06
0.04
0.02
0.00
CO
NSO
LID
AT
ION
ININ
CH
ES
PER
INC
H
1.0 10.02.0 4.0 6.0 8.0 20.00.80.60.4
LOAD IN KIPS PER SQUARE FOOT
Boring G-130B @ 100½'SANDY LEAN CLAY
Note: Water added to samples after consolidation under a load of 3.6 kips per square foot.
Boring G-130B @ 80½'SILTY SAND
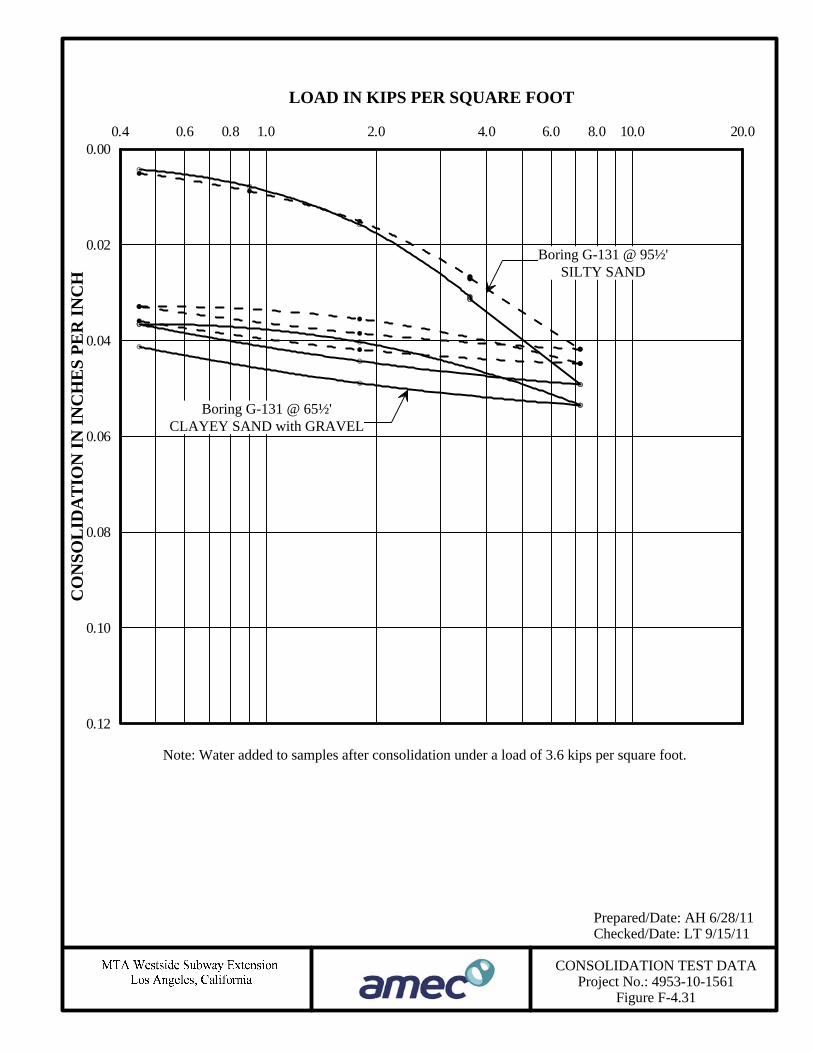
CONSOLIDATION TEST DATAProject No.: 4953-10-1561
Figure F-4.31
Prepared/Date: AH 6/28/11Checked/Date: LT 9/15/11
0.12
0.10
0.08
0.06
0.04
0.02
0.00
CO
NSO
LID
AT
ION
ININ
CH
ES
PER
INC
H
1.0 10.02.0 4.0 6.0 8.0 20.00.80.60.4
LOAD IN KIPS PER SQUARE FOOT
Boring G-131 @ 95½'SILTY SAND
Note: Water added to samples after consolidation under a load of 3.6 kips per square foot.
Boring G-131 @ 65½'CLAYEY SAND with GRAVEL

CONSOLIDATION TEST DATAProject No.: 4953-10-1561
Figure F-4.32
Prepared/Date: AH 7/26/11Checked/Date: LT 9/15/11
0.12
0.10
0.08
0.06
0.04
0.02
0.00
CO
NSO
LID
AT
ION
ININ
CH
ES
PER
INC
H
1.0 10.02.0 4.0 6.0 8.0 20.00.80.60.4
LOAD IN KIPS PER SQUARE FOOT
Boring G-132 @ 105½'LEAN CLAY with SAND
Note: Water added to samples after consolidation under a load of 3.6 kips per square foot.
Boring G-132 @ 45½'ELASTIC SILT

CONSOLIDATION TEST DATAProject No.: 4953-10-1561
Figure F-4.33
Prepared/Date: AH 6/28/11Checked/Date: LT 9/15/11
0.12
0.10
0.08
0.06
0.04
0.02
0.00
CO
NSO
LID
AT
ION
ININ
CH
ES
PER
INC
H
1.0 10.02.0 4.0 6.0 8.0 20.00.80.60.4
LOAD IN KIPS PER SQUARE FOOT
Boring G-133 @ 71½'SANDY LEAN CLAY
Note: Water added to samples after consolidation under a load of 3.6 kips per square foot.
Boring G-133 @ 59½'SILT with SAND

CONSOLIDATION TEST DATAProject No.: 4953-10-1561
Figure F-4.34
Prepared/Date: AH 5/15/11Checked/Date: NH 6/3/11
0.12
0.10
0.08
0.06
0.04
0.02
0.00
CO
NSO
LID
AT
ION
ININ
CH
ES
PER
INC
H
1.0 10.02.0 4.0 6.0 8.0 20.00.80.60.4
LOAD IN KIPS PER SQUARE FOOT
Boring G-134 @ 55'SILT with SAND
Note: Water added to samples after consolidation under a load of 3.6 kips per square foot.
Boring G-134 @ 65½'LEAN CLAY
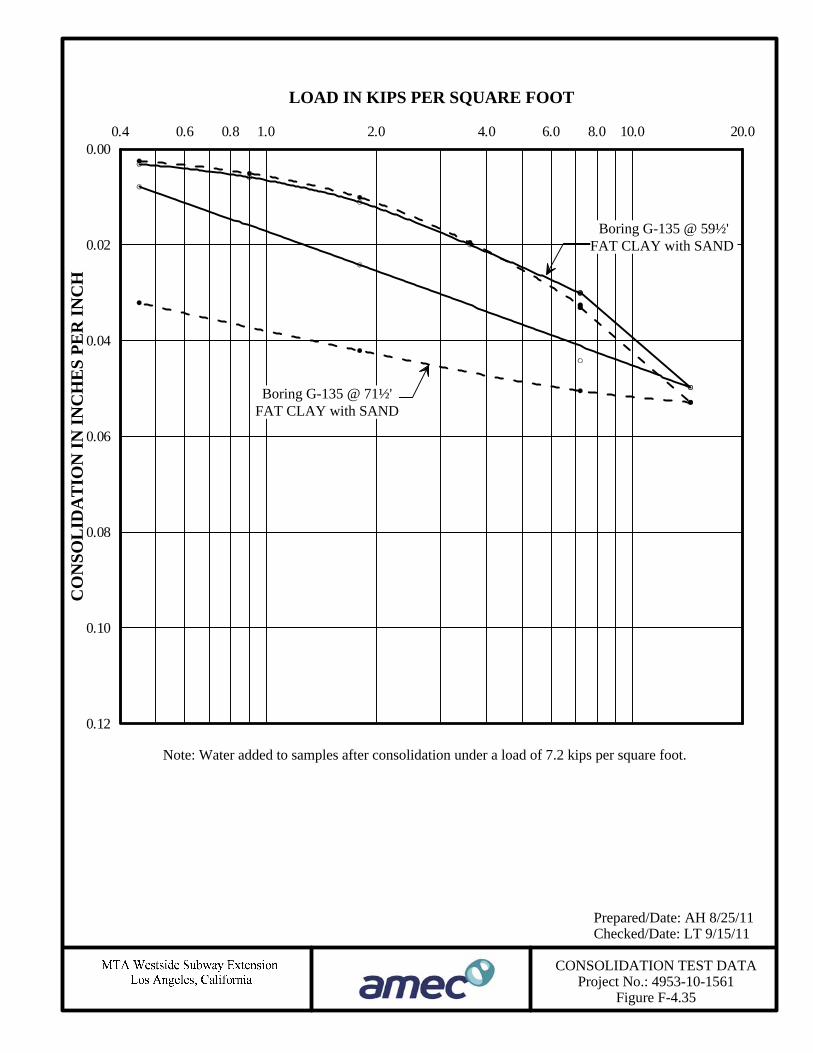
CONSOLIDATION TEST DATAProject No.: 4953-10-1561
Figure F-4.35
Prepared/Date: AH 8/25/11Checked/Date: LT 9/15/11
0.12
0.10
0.08
0.06
0.04
0.02
0.00
CO
NSO
LID
AT
ION
ININ
CH
ES
PER
INC
H
1.0 10.02.0 4.0 6.0 8.0 20.00.80.60.4
LOAD IN KIPS PER SQUARE FOOT
Boring G-135 @ 59½'FAT CLAY with SAND
Boring G-135 @ 71½'FAT CLAY with SAND
Note: Water added to samples after consolidation under a load of 7.2 kips per square foot.

CONSOLIDATION TEST DATAProject No.: 4953-10-1561
Figure F-4.36
Prepared/Date: AH 7/26/11Checked/Date: LT 9/12/11
0.12
0.10
0.08
0.06
0.04
0.02
0.00
CO
NSO
LID
AT
ION
ININ
CH
ES
PER
INC
H
1.0 10.02.0 4.0 6.0 8.0 20.00.80.60.4
LOAD IN KIPS PER SQUARE FOOT
Note: Water added to sample after consolidation under a load of 3.6 kips per square foot.
Boring G-136 @ 70½'FAT CLAY

CONSOLIDATION TEST DATAProject No.: 4953-10-1561
Figure F-4.37
Prepared/Date: AH 8/15/11Checked/Date: LT 9/12/11
0.12
0.10
0.08
0.06
0.04
0.02
0.00
CO
NSO
LID
AT
ION
ININ
CH
ES
PER
INC
H
1.0 10.02.0 4.0 6.0 8.0 20.00.80.60.4
LOAD IN KIPS PER SQUARE FOOT
Boring G-137 @ 82½'SANDY LEAN CLAY
Note: Water added to samples after consolidation under a load of 7.2 kips per square foot.
Boring G-137 @ 70½'FAT CLAY
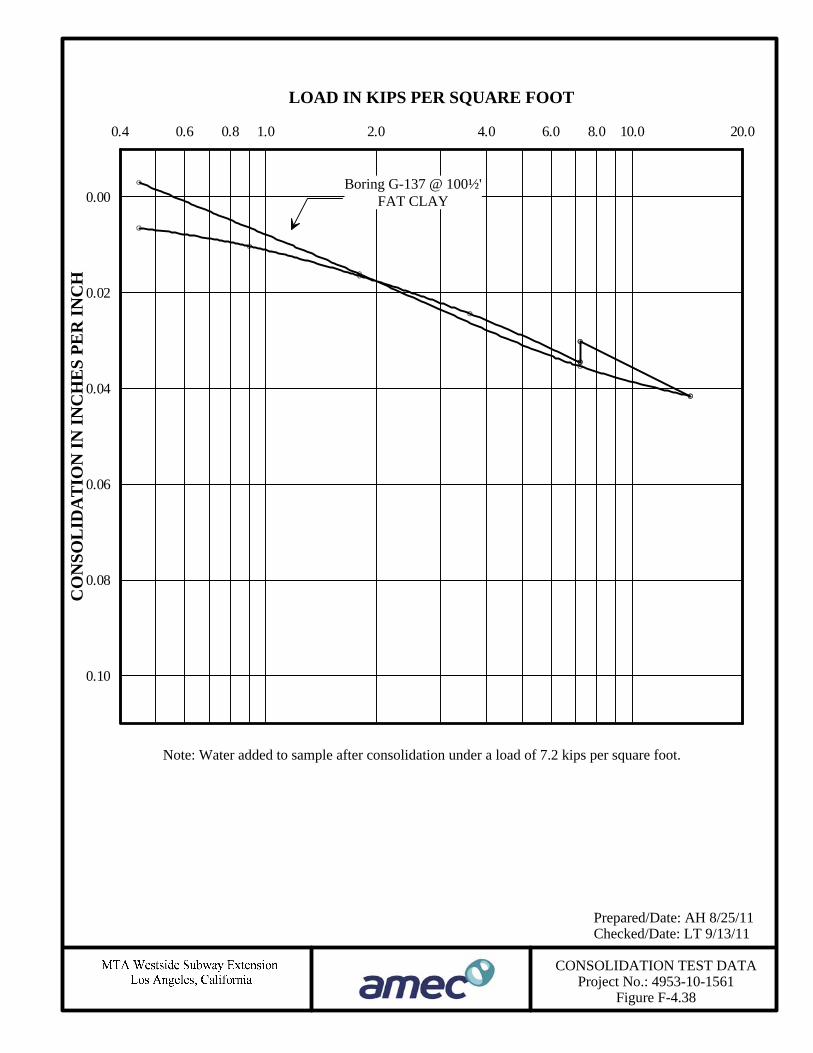
CONSOLIDATION TEST DATAProject No.: 4953-10-1561
Figure F-4.38
Prepared/Date: AH 8/25/11Checked/Date: LT 9/13/11
0.10
0.08
0.06
0.04
0.02
0.00
CO
NSO
LID
AT
ION
ININ
CH
ES
PER
INC
H
1.0 10.02.0 4.0 6.0 8.0 20.00.80.60.4
LOAD IN KIPS PER SQUARE FOOT
Note: Water added to sample after consolidation under a load of 7.2 kips per square foot.
Boring G-137 @ 100½'FAT CLAY

CONSOLIDATION TEST DATAProject No.: 4953-10-1561
Figure F-4.39
Prepared/Date: AH 8/26/11Checked/Date: LT 9/15/11
0.12
0.10
0.08
0.06
0.04
0.02
0.00
CO
NSO
LID
AT
ION
ININ
CH
ES
PER
INC
H
1.0 10.02.0 4.0 6.0 8.0 20.00.80.60.4
LOAD IN KIPS PER SQUARE FOOT
Boring G-138 @ 85½'SANDY LEAN CLAY
Note: Water added to samples after consolidation under a load of 7.2 kips per square foot.
Boring G-138 @ 55½'SANDY LEAN CLAY
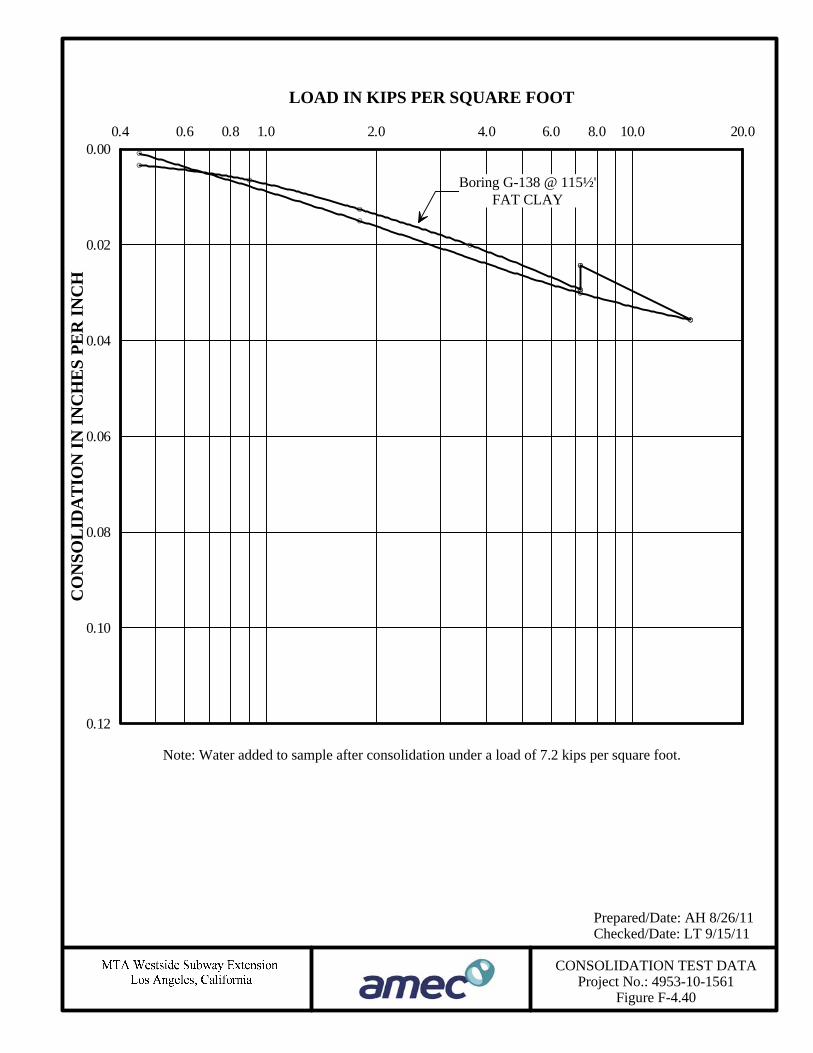
CONSOLIDATION TEST DATAProject No.: 4953-10-1561
Figure F-4.40
Prepared/Date: AH 8/26/11Checked/Date: LT 9/15/11
0.12
0.10
0.08
0.06
0.04
0.02
0.00
CO
NSO
LID
AT
ION
ININ
CH
ES
PER
INC
H
1.0 10.02.0 4.0 6.0 8.0 20.00.80.60.4
LOAD IN KIPS PER SQUARE FOOT
Boring G-138 @ 115½'FAT CLAY
Note: Water added to sample after consolidation under a load of 7.2 kips per square foot.

CONSOLIDATION TEST DATAProject No.: 4953-10-1561
Figure F-4.41
Prepared/Date: AH 9/20/11Checked/Date: LT 9/26/11
0.12
0.10
0.08
0.06
0.04
0.02
0.00
CO
NSO
LID
AT
ION
ININ
CH
ES
PER
INC
H
1.0 10.02.0 4.0 6.0 8.0 20.00.80.60.40.2
LOAD IN KIPS PER SQUARE FOOT
Boring G-139 @ 85½'CLAYEY SAND
Boring G-139 @ 55½'LEAN CLAY
Note: Water added to samples after consolidation under a load of 4.0 kips per square foot.

CONSOLIDATION TEST DATAProject No.: 4953-10-1561
Figure F-4.42
Prepared/Date: AH 5/15/11Checked/Date: NH 6/3/11
0.12
0.10
0.08
0.06
0.04
0.02
0.00
CO
NSO
LID
AT
ION
ININ
CH
ES
PER
INC
H
1.0 10.02.0 4.0 6.0 8.0 20.00.80.60.4
LOAD IN KIPS PER SQUARE FOOT
Boring G-140 @ 68½'SANDY LEAN CLAY
Note: Water added to samples after consolidation under a load of 3.6 kips per square foot.
Boring G-140 @ 62½'LEAN CLAY

CONSOLIDATION TEST DATAProject No.: 4953-10-1561
Figure F-4.43
Prepared/Date: JF 9/30/11Checked/Date: LT 9/30/11
0.12
0.10
0.08
0.06
0.04
0.02
0.00
CO
NSO
LID
AT
ION
ININ
CH
ES
PER
INC
H
1.0 10.02.0 4.0 6.0 8.0 20.00.80.60.4
LOAD IN KIPS PER SQUARE FOOT
Boring G-141 @ 60½'LEAN CLAY with SAND
Boring G-141 @ 80½'LEAN CLAY with SAND
Note: Water added to samples after consolidation under a load of 3.6 kips per square foot.

CONSOLIDATION TEST DATAProject No.: 4953-10-1561
Figure F-4.44
Prepared/Date: AH 8/25/11Checked/Date: 9/15/11
0.12
0.10
0.08
0.06
0.04
0.02
0.00
CO
NSO
LID
AT
ION
ININ
CH
ES
PER
INC
H
1.0 10.02.0 4.0 6.0 8.0 20.00.80.60.4
LOAD IN KIPS PER SQUARE FOOT
Boring G-142 @ 45½'ELASTIC SILT
Boring G-142 @ 65½'LEAN CLAY with SAND
Note: Water added to samples after consolidation under a load of 3.6 kips per square foot.

CONSOLIDATION TEST DATAProject No.: 4953-10-1561
Figure F-4.45
Prepared/Date: AH 7/26/11Checked/Date: LT 9/27/11
0.12
0.10
0.08
0.06
0.04
0.02
0.00
CO
NSO
LID
AT
ION
ININ
CH
ES
PER
INC
H
1.0 10.02.0 4.0 6.0 8.0 20.00.80.60.4
LOAD IN KIPS PER SQUARE FOOT
Note: Water added to sample after consolidation under a load of 3.6 kips per square foot.
Boring G-143 @ 35½'SILTY SAND with GRAVEL

CONSOLIDATION TEST DATAProject No.: 4953-10-1561
Figure F-4.46
Prepared/Date: AH 8/25/11Checked/Date: LT 9/27/11
0.12
0.10
0.08
0.06
0.04
0.02
0.00
CO
NSO
LID
AT
ION
ININ
CH
ES
PER
INC
H
1.0 10.02.0 4.0 6.0 8.0 20.00.80.60.4
LOAD IN KIPS PER SQUARE FOOT
Boring G-143 @ 65½'CLAYEY SAND with GRAVEL
Boring G-143 @ 75½'LEAN CLAY
Note: Water added to samples after consolidation under a load of 3.6 kips per square foot.

CONSOLIDATION TEST DATAProject No.: 4953-10-1561
Figure F-4.47
Prepared/Date: AH 9/20/11Checked/Date: LT 9/26/11
0.12
0.10
0.08
0.06
0.04
0.02
0.00
CO
NSO
LID
AT
ION
ININ
CH
ES
PER
INC
H
1.0 10.02.0 4.0 6.0 8.0 20.00.80.60.40.2
LOAD IN KIPS PER SQUARE FOOT
Boring G-144 @ 15½'FAT CLAY with SAND
Boring G-144 @ 45½'SILTY SAND
Note: Water not added to samples.

CONSOLIDATION TEST DATAProject No.: 4953-10-1561
Figure F-4.48
Prepared/Date: AH 9/20/11Checked/Date: LT 9/26/11
0.12
0.10
0.08
0.06
0.04
0.02
0.00
CO
NSO
LID
AT
ION
ININ
CH
ES
PER
INC
H
1.0 10.02.0 4.0 6.0 8.0 20.00.80.60.40.2
LOAD IN KIPS PER SQUARE FOOT
Boring G-144 @ 95½'LEAN CLAY with SAND
Boring G-144 @ 75½'LEAN CLAY with SAND
Note: Water added to samples after consolidation under a load of 8.0 kips per square foot.
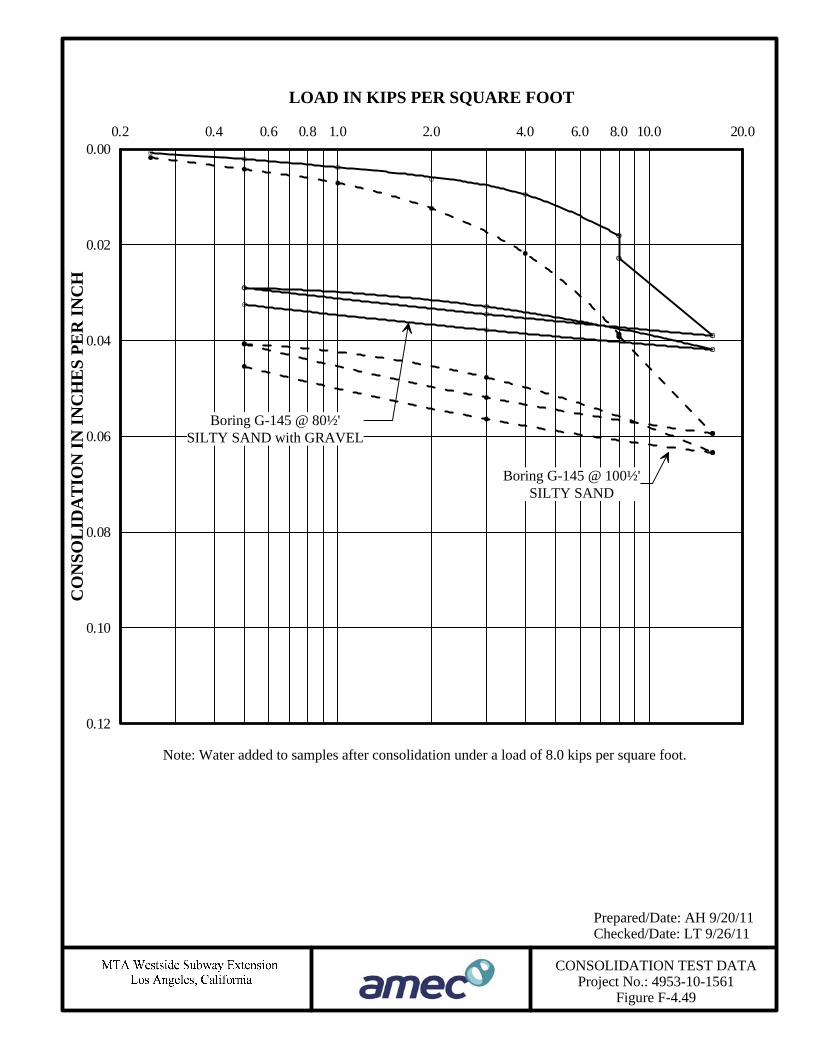
CONSOLIDATION TEST DATAProject No.: 4953-10-1561
Figure F-4.49
Prepared/Date: AH 9/20/11Checked/Date: LT 9/26/11
0.12
0.10
0.08
0.06
0.04
0.02
0.00
CO
NSO
LID
AT
ION
ININ
CH
ES
PER
INC
H
1.0 10.02.0 4.0 6.0 8.0 20.00.80.60.40.2
LOAD IN KIPS PER SQUARE FOOT
Boring G-145 @ 100½'SILTY SAND
Boring G-145 @ 80½'SILTY SAND with GRAVEL
Note: Water added to samples after consolidation under a load of 8.0 kips per square foot.

CONSOLIDATION TEST DATAProject No.: 4953-10-1561
Figure F-4.50
Prepared/Date: AH 7/26/11Checked/Date: LT 8/8/11
0.12
0.10
0.08
0.06
0.04
0.02
0.00
CO
NSO
LID
AT
ION
ININ
CH
ES
PER
INC
H
1.0 10.02.0 4.0 6.0 8.0 20.00.80.60.4
LOAD IN KIPS PER SQUARE FOOT
Boring G-146 @ 57½'SANDY LEAN CLAY
Note: Water added to samples after consolidation under a load of 3.6 kips per square foot.
Boring G-146 @ 35½'POORLY GRADED SAND

CONSOLIDATION TEST DATAProject No.: 4953-10-1561
Figure F-4.51
Prepared/Date: AH 7/26/11Checked/Date: LT 8/8/11
0.12
0.10
0.08
0.06
0.04
0.02
0.00
CO
NSO
LID
AT
ION
ININ
CH
ES
PER
INC
H
1.0 10.02.0 4.0 6.0 8.0 20.00.80.60.4
LOAD IN KIPS PER SQUARE FOOT
Boring G-146 @ 81½'LEAN CLAY with SAND
Note: Water added to samples after consolidation under a load of 3.6 kips per square foot.
Boring G-146 @ 69½'LEAN CLAY

CONSOLIDATION TEST DATAProject No.: 4953-10-1561
Figure F-4.52
Prepared/Date: JF 9/28/11Checked/Date: LT 9/28/11
0.12
0.10
0.08
0.06
0.04
0.02
0.00
CO
NSO
LID
AT
ION
ININ
CH
ES
PER
INC
H
1.0 10.02.0 4.0 6.0 8.0 20.00.80.60.4
LOAD IN KIPS PER SQUARE FOOT
Boring G-147 @ 75½'SANDY LEAN CLAY
Boring G-147 @ 95½'SILTY SAND with GRAVEL
Note: Water added to samples after consolidation under a load of 7.2 kips per square foot.

CONSOLIDATION TEST DATAProject No.: 4953-10-1561
Figure F-4.53
Prepared/Date: AH 9/20/11Checked/Date: LT 9/26/11
0.12
0.10
0.08
0.06
0.04
0.02
0.00
CO
NSO
LID
AT
ION
ININ
CH
ES
PER
INC
H
1.0 10.02.0 4.0 6.0 8.0 20.00.80.60.40.2
LOAD IN KIPS PER SQUARE FOOT
Boring G-148 @ 115½'SANDY LEAN CLAY
Boring G-148 @ 95½'SILTY SAND
Note: Water added to samples after consolidation under a load of 8.0 kips per square foot.

CONSOLIDATION TEST DATAProject No.: 4953-10-1561
Figure F-4.54
Prepared/Date: AH/JF 5/13/11Checked/Date: LT 8/16/11
0.12
0.10
0.08
0.06
0.04
0.02
0.00
CO
NSO
LID
AT
ION
ININ
CH
ES
PER
INC
H
1.0 10.02.0 4.0 6.0 8.0 20.00.80.60.4
LOAD IN KIPS PER SQUARE FOOT
Boring G-149 @ 58½'SILTY SAND with GRAVEL
Note: Water added to samples at 58½' and 78½' after consolidation under a load of 3.6 and 7.2 kips per square foot,respectively.
Boring G-149 @ 78½'LEAN CLAY
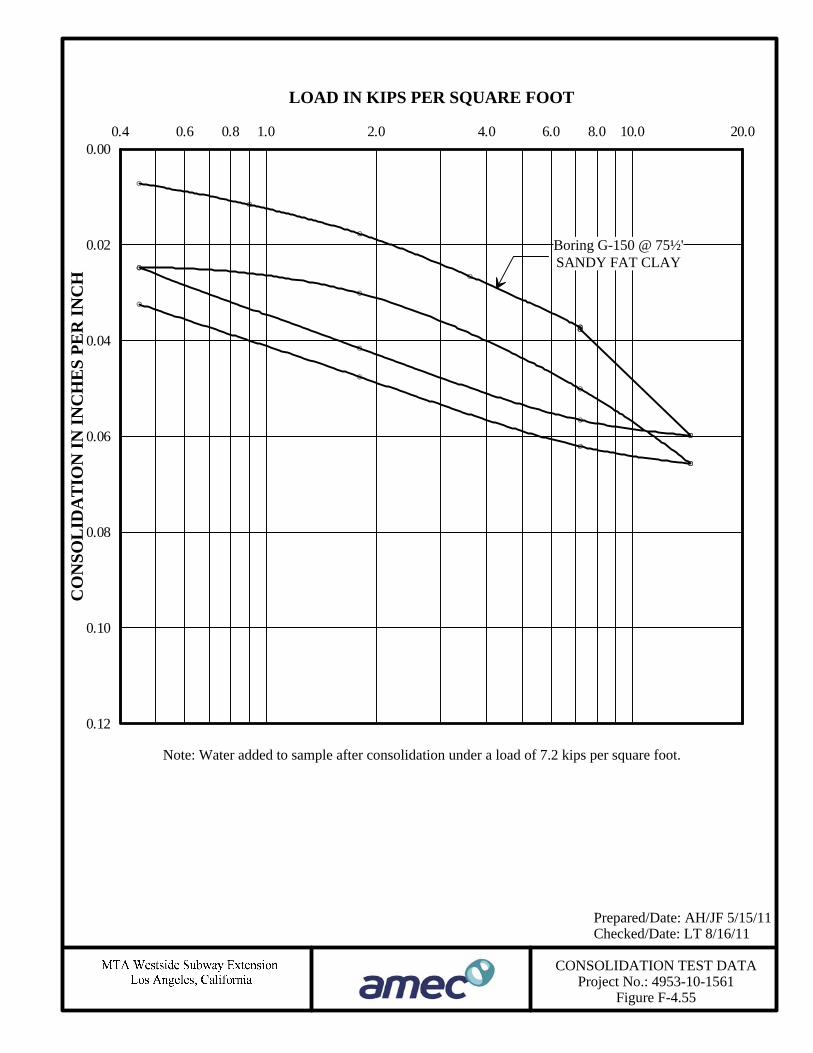
CONSOLIDATION TEST DATAProject No.: 4953-10-1561
Figure F-4.55
Prepared/Date: AH/JF 5/15/11Checked/Date: LT 8/16/11
0.12
0.10
0.08
0.06
0.04
0.02
0.00
CO
NSO
LID
AT
ION
ININ
CH
ES
PER
INC
H
1.0 10.02.0 4.0 6.0 8.0 20.00.80.60.4
LOAD IN KIPS PER SQUARE FOOT
Boring G-150 @ 75½'SANDY FAT CLAY
Note: Water added to sample after consolidation under a load of 7.2 kips per square foot.

CONSOLIDATION TEST DATAProject No.: 4953-10-1561
Figure F-4.56
Prepared/Date: AH/JF 5/13/11Checked/Date: LT 8/16/11
0.12
0.10
0.08
0.06
0.04
0.02
0.00
CO
NSO
LID
AT
ION
ININ
CH
ES
PER
INC
H
1.0 10.02.0 4.0 6.0 8.0 20.00.80.60.4
LOAD IN KIPS PER SQUARE FOOT
Boring G-152 @ 58½'SILTY SAND
Note: Water added to samples after consolidation under a load of 7.2 kips per square foot.
Boring G-152 @ 73½'FAT CLAY

CONSOLIDATION TEST DATAProject No.: 4953-10-1561
Figure F-4.57
Prepared/Date: AH/JF 5/13/11Checked/Date: LT 8/16/11
0.12
0.10
0.08
0.06
0.04
0.02
0.00
CO
NSO
LID
AT
ION
ININ
CH
ES
PER
INC
H
1.0 10.02.0 4.0 6.0 8.0 20.00.80.60.4
LOAD IN KIPS PER SQUARE FOOT
Boring G-154 @ 38½'FAT CLAY
Note: Water added to samples at 38½' and 58½' after consolidation under a load of 3.6 and 7.2 kips per square foot,respectively.
Boring G-154 @ 58½'SILTY SAND with GRAVEL

CONSOLIDATION TEST DATAProject No.: 4953-10-1561
Figure F-4.58
Prepared/Date: AH 9/23/11Checked/Date: LT 9/23/11
0.12
0.10
0.08
0.06
0.04
0.02
0.00
CO
NSO
LID
AT
ION
ININ
CH
ES
PER
INC
H
1.0 10.02.0 4.0 6.0 8.0 20.00.80.60.4
LOAD IN KIPS PER SQUARE FOOT
Boring G-156 @ 28'SILTY SAND
Note: Water added to samples after consolidation under a load of 3.6 kips per square foot.
Boring G-156 @ 48'SANDY LEAN CLAY

CONSOLIDATION TEST DATAProject No.: 4953-10-1561
Figure F-4.59
Prepared/Date: AH/JF 5/15/11Checked/Date: LT 8/16/11
0.12
0.10
0.08
0.06
0.04
0.02
0.00
CO
NSO
LID
AT
ION
ININ
CH
ES
PER
INC
H
1.0 10.02.0 4.0 6.0 8.0 20.00.80.60.4
LOAD IN KIPS PER SQUARE FOOT
Boring G-159 @ 75½'LEAN CLAY
Note: Water added to samples at 55½' and 75½' after consolidation under a load of 3.6 and 7.2 kips per square foot,respectively.
Boring G-159 @ 55½'ELASTIC SILT with SAND
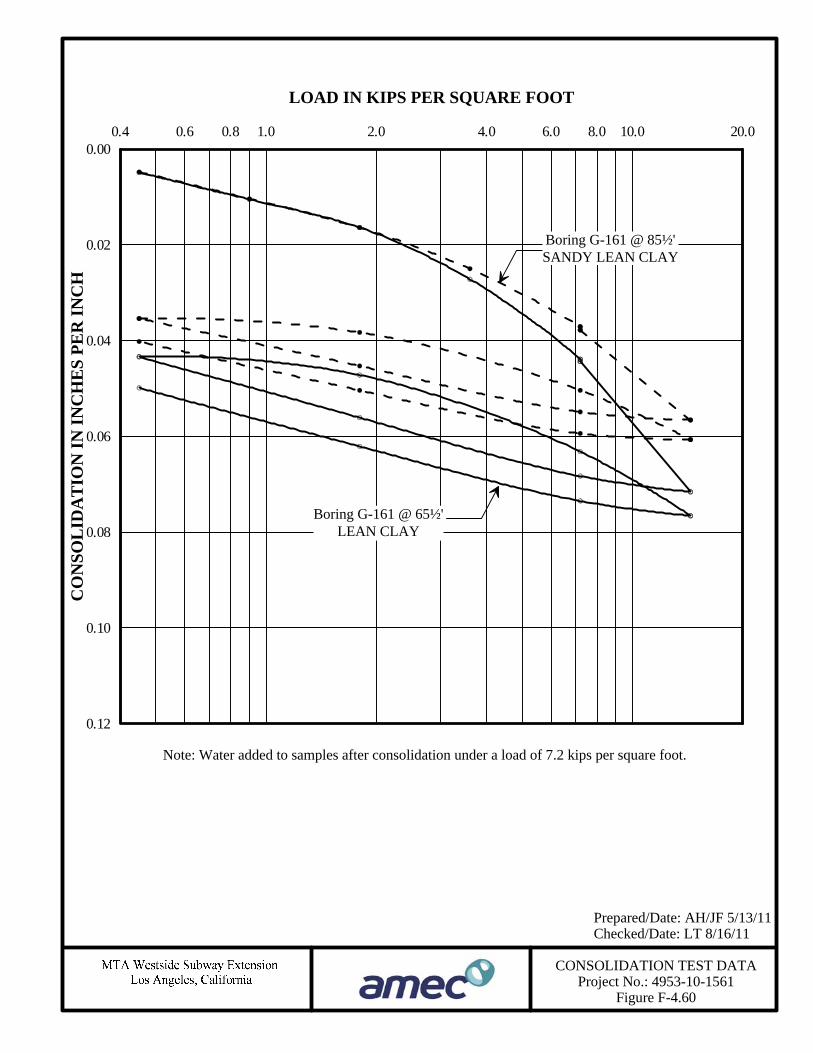
CONSOLIDATION TEST DATAProject No.: 4953-10-1561
Figure F-4.60
Prepared/Date: AH/JF 5/13/11Checked/Date: LT 8/16/11
0.12
0.10
0.08
0.06
0.04
0.02
0.00
CO
NSO
LID
AT
ION
ININ
CH
ES
PER
INC
H
1.0 10.02.0 4.0 6.0 8.0 20.00.80.60.4
LOAD IN KIPS PER SQUARE FOOT
Boring G-161 @ 65½'LEAN CLAY
Note: Water added to samples after consolidation under a load of 7.2 kips per square foot.
Boring G-161 @ 85½'SANDY LEAN CLAY

CONSOLIDATION TEST DATAProject 4953-10-1561
Figure F-4.61
Prepared/Date: AH/JF 5/15/11Checked/Date: LT 8/16/11
0.12
0.10
0.08
0.06
0.04
0.02
0.00
CO
NSO
LID
AT
ION
ININ
CH
ES
PER
INC
H
1.0 10.02.0 4.0 6.0 8.0 20.00.80.60.4
LOAD IN KIPS PER SQUARE FOOT
Boring G-162 @ 80½'LEAN CLAY with SAND
Note: Water added to sample after consolidation under a load of 7.2 kips per square foot.

CONSOLIDATION TEST DATAProject No.: 4953-10-1561
Figure F-4.62
Prepared/Date: AH/JF 5/16/11Checked/Date: LT 8/16/11
0.12
0.10
0.08
0.06
0.04
0.02
0.00
-0.02
CO
NSO
LID
AT
ION
ININ
CH
ES
PER
INC
H
1.0 10.02.0 4.0 6.0 8.0 20.00.80.60.4
LOAD IN KIPS PER SQUARE FOOT
Boring G-164 @ 54½'SANDY FAT CLAY
Note: Water added to samples at 33½' and 54½' after consolidation under a load of 3.6 and 7.2 kips per square foot,respectively.
Boring G-164 @ 33½'SILT
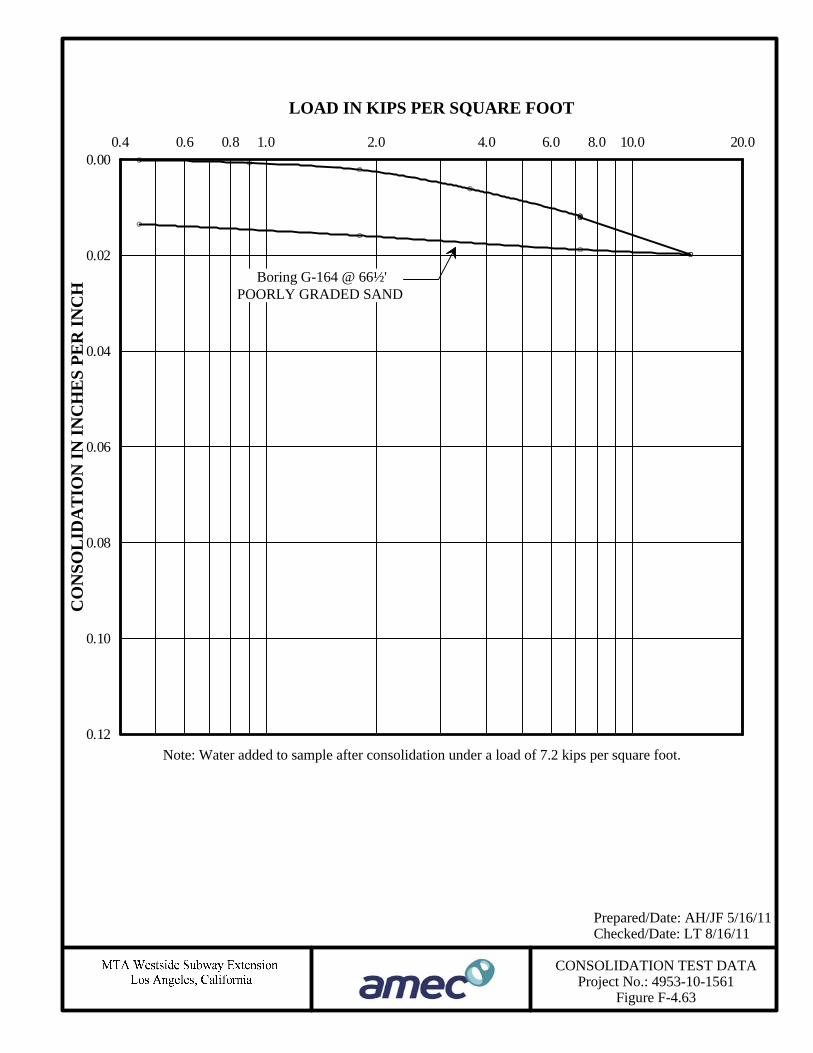
CONSOLIDATION TEST DATAProject No.: 4953-10-1561
Figure F-4.63
Prepared/Date: AH/JF 5/16/11Checked/Date: LT 8/16/11
0.12
0.10
0.08
0.06
0.04
0.02
0.00
CO
NSO
LID
AT
ION
ININ
CH
ES
PER
INC
H
1.0 10.02.0 4.0 6.0 8.0 20.00.80.60.4
LOAD IN KIPS PER SQUARE FOOT
Boring G-164 @ 66½'POORLY GRADED SAND
Note: Water added to sample after consolidation under a load of 7.2 kips per square foot.
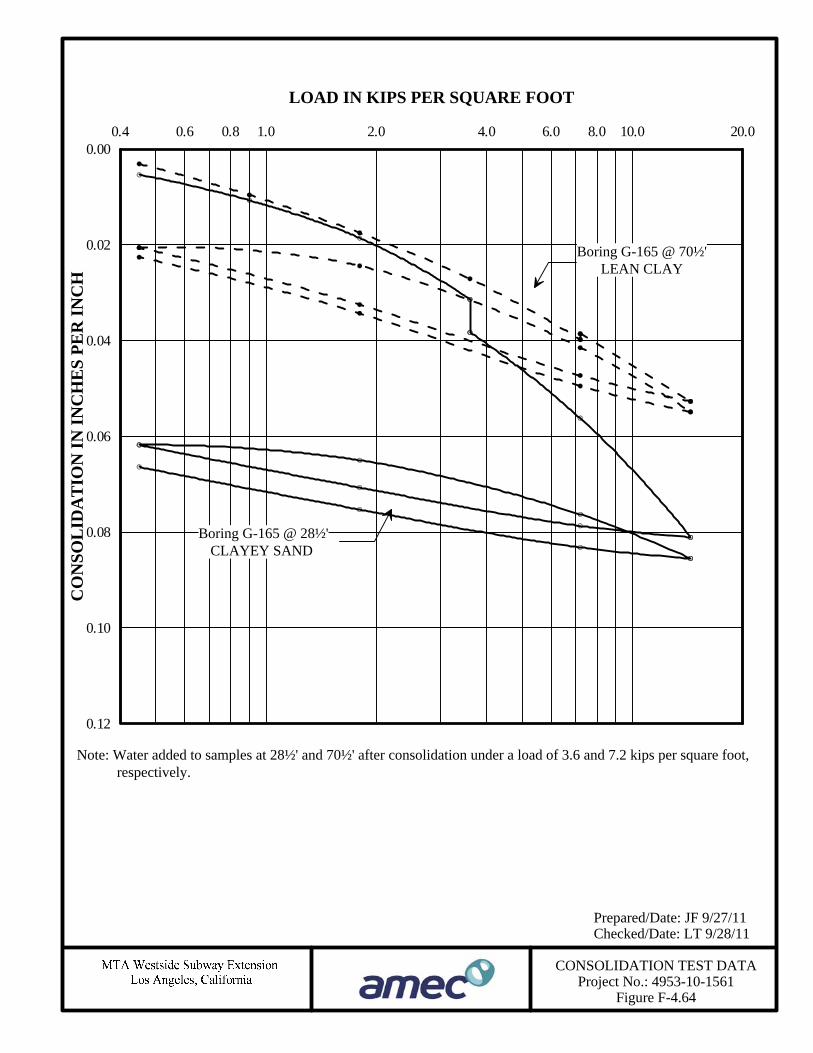
CONSOLIDATION TEST DATAProject No.: 4953-10-1561
Figure F-4.64
Prepared/Date: JF 9/27/11Checked/Date: LT 9/28/11
0.12
0.10
0.08
0.06
0.04
0.02
0.00
CO
NSO
LID
AT
ION
ININ
CH
ES
PER
INC
H
1.0 10.02.0 4.0 6.0 8.0 20.00.80.60.4
LOAD IN KIPS PER SQUARE FOOT
Boring G-165 @ 28½'CLAYEY SAND
Boring G-165 @ 70½'LEAN CLAY
Note: Water added to samples at 28½' and 70½' after consolidation under a load of 3.6 and 7.2 kips per square foot,respectively.
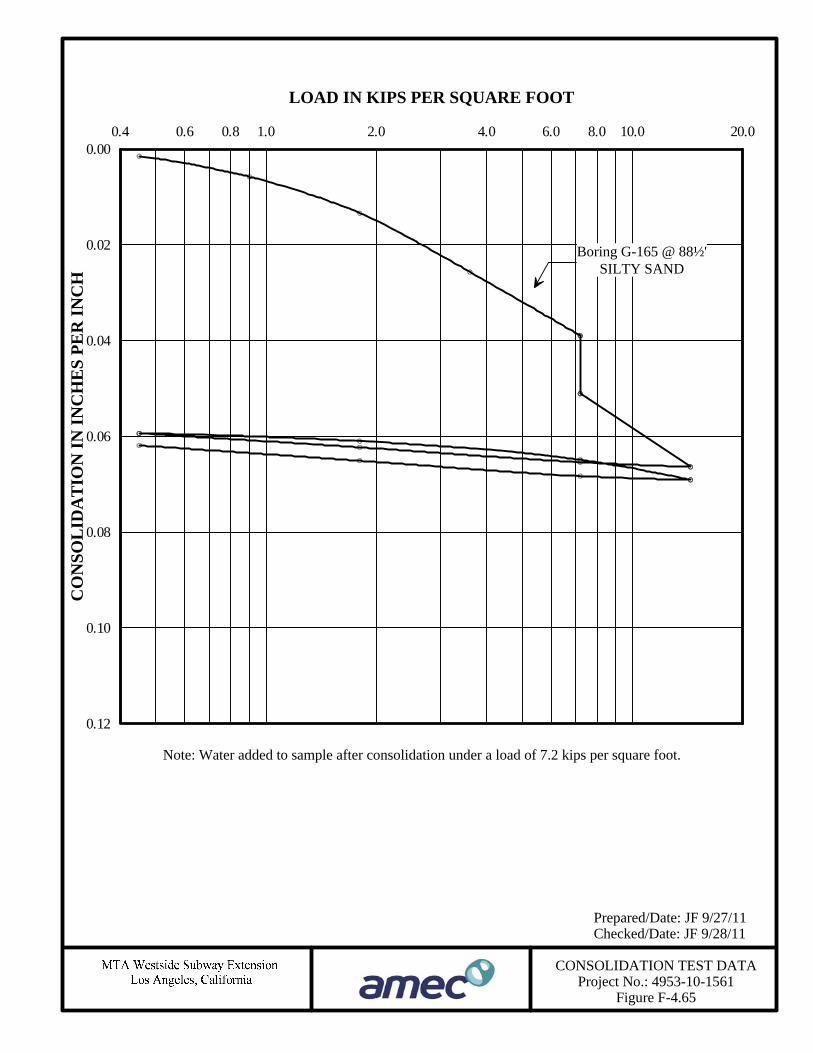
CONSOLIDATION TEST DATAProject No.: 4953-10-1561
Figure F-4.65
Prepared/Date: JF 9/27/11Checked/Date: JF 9/28/11
0.12
0.10
0.08
0.06
0.04
0.02
0.00
CO
NSO
LID
AT
ION
ININ
CH
ES
PER
INC
H
1.0 10.02.0 4.0 6.0 8.0 20.00.80.60.4
LOAD IN KIPS PER SQUARE FOOT
Boring G-165 @ 88½'SILTY SAND
Note: Water added to sample after consolidation under a load of 7.2 kips per square foot.
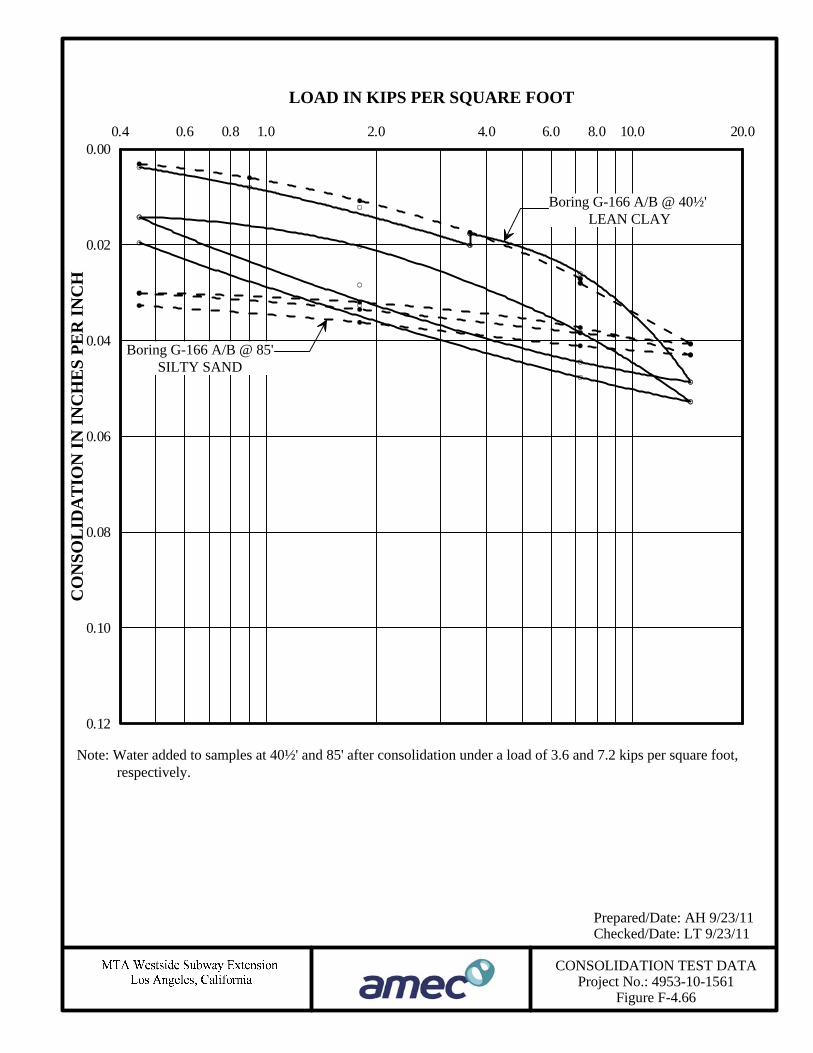
CONSOLIDATION TEST DATAProject No.: 4953-10-1561
Figure F-4.66
Prepared/Date: AH 9/23/11Checked/Date: LT 9/23/11
0.12
0.10
0.08
0.06
0.04
0.02
0.00
CO
NSO
LID
AT
ION
ININ
CH
ES
PER
INC
H
1.0 10.02.0 4.0 6.0 8.0 20.00.80.60.4
LOAD IN KIPS PER SQUARE FOOT
Boring G-166 A/B @ 85'SILTY SAND
Note: Water added to samples at 40½' and 85' after consolidation under a load of 3.6 and 7.2 kips per square foot,respectively.
Boring G-166 A/B @ 40½'LEAN CLAY

CONSOLIDATION TEST DATAProject No.: 4953-10-1561
Figure F-4.67
Prepared/Date: AH/JF 5/16/11Checked/Date: LT 8/16/11
0.12
0.10
0.08
0.06
0.04
0.02
0.00
CO
NSO
LID
AT
ION
ININ
CH
ES
PER
INC
H
1.0 10.02.0 4.0 6.0 8.0 20.00.80.60.4
LOAD IN KIPS PER SQUARE FOOT
Boring G-168 @ 67½'SILTY SAND
Note: Water added to sample after consolidation under a load of 3.6 kips per square foot.

CONSOLIDATION TEST DATAProject No.: 4953-10-1561
Figure F-4.68
Prepared/Date: AH/JF 5/25/11Checked/Date: LT 8/16/11
0.12
0.10
0.08
0.06
0.04
0.02
0.00
CO
NSO
LID
AT
ION
ININ
CH
ES
PER
INC
H
1.0 10.02.0 4.0 6.0 8.0 20.00.80.60.4
LOAD IN KIPS PER SQUARE FOOT
Boring G-169 @ 77½'SILTY SAND
Note: Water added to samples at 77½' and 95½' after consolidation under a load of 3.6 and 4.5 kips per square foot,respectively.
Boring G-169 @ 95½'SANDY LEAN CLAY
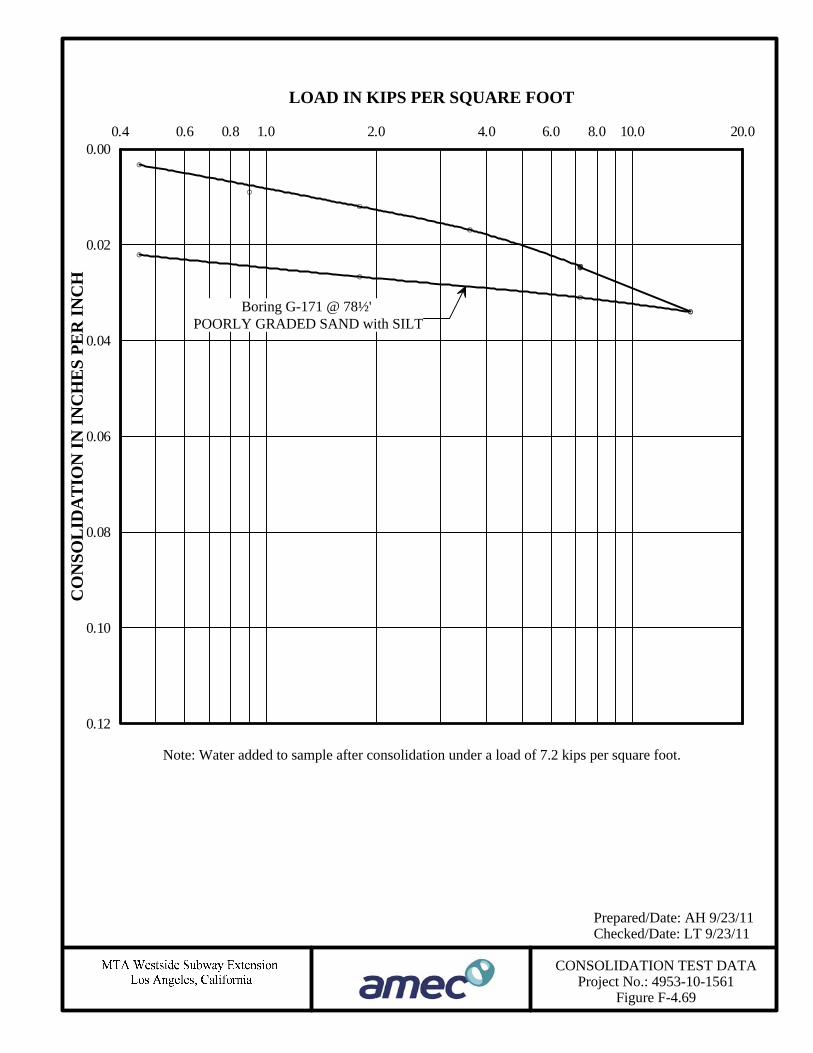
CONSOLIDATION TEST DATAProject No.: 4953-10-1561
Figure F-4.69
Prepared/Date: AH 9/23/11Checked/Date: LT 9/23/11
0.12
0.10
0.08
0.06
0.04
0.02
0.00
CO
NSO
LID
AT
ION
ININ
CH
ES
PER
INC
H
1.0 10.02.0 4.0 6.0 8.0 20.00.80.60.4
LOAD IN KIPS PER SQUARE FOOT
Note: Water added to sample after consolidation under a load of 7.2 kips per square foot.
Boring G-171 @ 78½'POORLY GRADED SAND with SILT
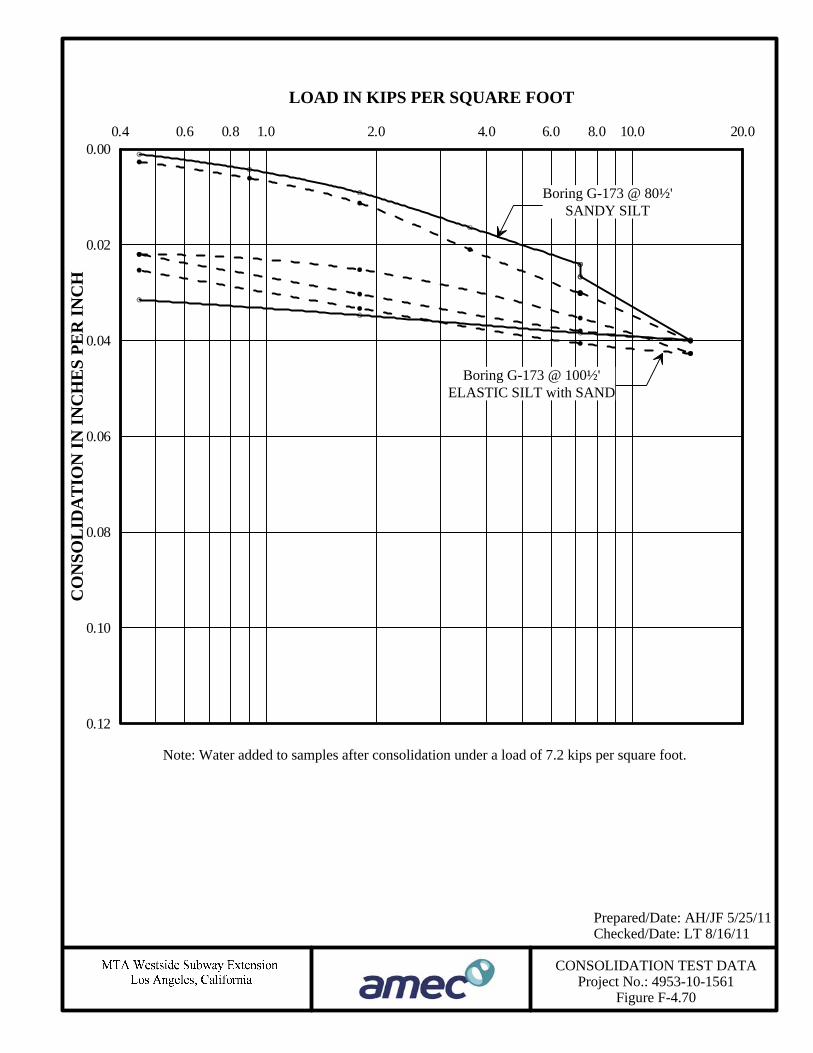
CONSOLIDATION TEST DATAProject No.: 4953-10-1561
Figure F-4.70
Prepared/Date: AH/JF 5/25/11Checked/Date: LT 8/16/11
0.12
0.10
0.08
0.06
0.04
0.02
0.00
CO
NSO
LID
AT
ION
ININ
CH
ES
PER
INC
H
1.0 10.02.0 4.0 6.0 8.0 20.00.80.60.4
LOAD IN KIPS PER SQUARE FOOT
Boring G-173 @ 80½'SANDY SILT
Note: Water added to samples after consolidation under a load of 7.2 kips per square foot.
Boring G-173 @ 100½'ELASTIC SILT with SAND
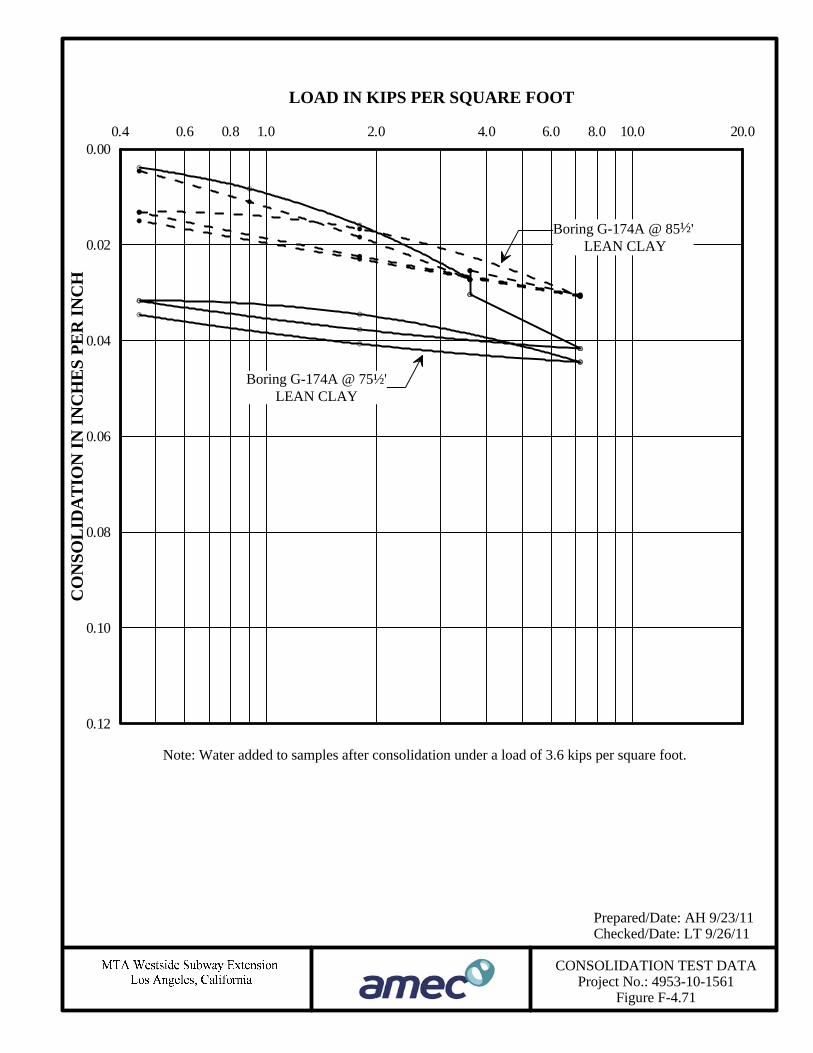
CONSOLIDATION TEST DATAProject No.: 4953-10-1561
Figure F-4.71
Prepared/Date: AH 9/23/11Checked/Date: LT 9/26/11
0.12
0.10
0.08
0.06
0.04
0.02
0.00
CO
NSO
LID
AT
ION
ININ
CH
ES
PER
INC
H
1.0 10.02.0 4.0 6.0 8.0 20.00.80.60.4
LOAD IN KIPS PER SQUARE FOOT
Boring G-174A @ 75½'LEAN CLAY
Note: Water added to samples after consolidation under a load of 3.6 kips per square foot.
Boring G-174A @ 85½'LEAN CLAY

CONSOLIDATION TEST DATAProject No.: 4953-10-1561
Figure F-4.72
Prepared/Date: AH/JF 5/25/11Checked/Date: LT 8/17/11
0.12
0.10
0.08
0.06
0.04
0.02
0.00
CO
NSO
LID
AT
ION
ININ
CH
ES
PER
INC
H
1.0 10.02.0 4.0 6.0 8.0 20.00.80.60.4
LOAD IN KIPS PER SQUARE FOOT
Boring G-175 @ 105½'FAT CLAY
Note: Water added to samples after consolidation under a load of 7.2 kips per square foot.
Boring G-175 @ 123½'SANDY SILT
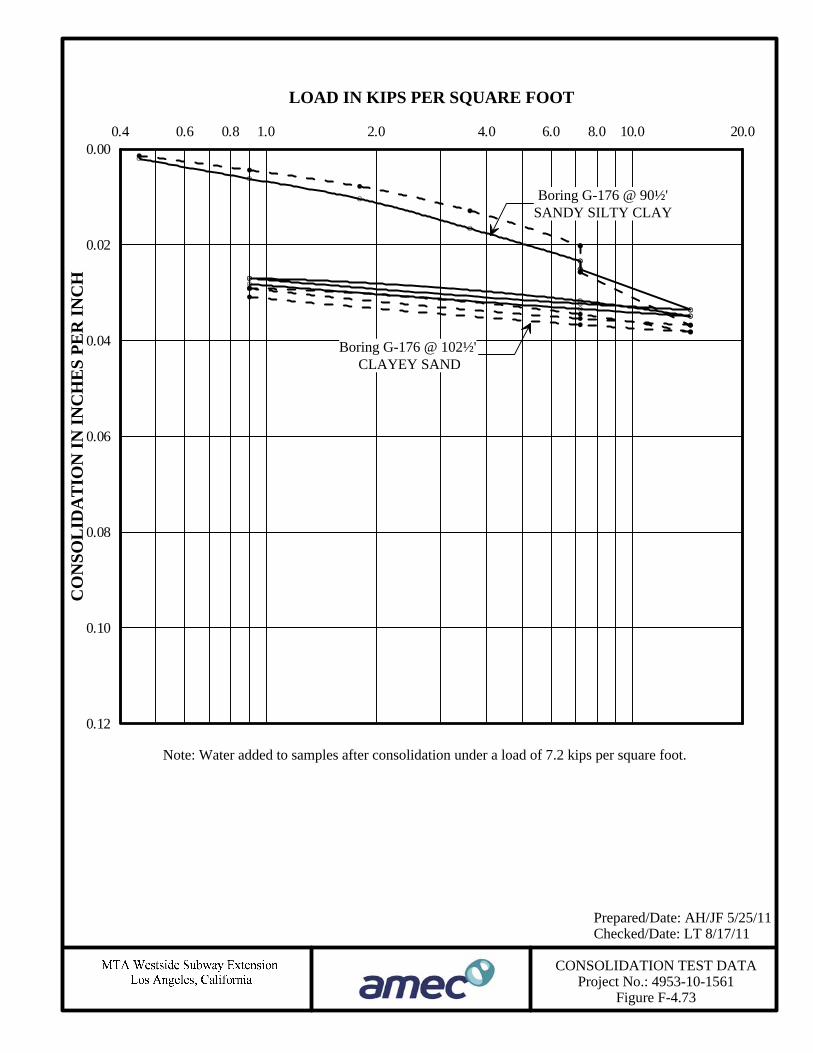
CONSOLIDATION TEST DATAProject No.: 4953-10-1561
Figure F-4.73
Prepared/Date: AH/JF 5/25/11Checked/Date: LT 8/17/11
0.12
0.10
0.08
0.06
0.04
0.02
0.00
CO
NSO
LID
AT
ION
ININ
CH
ES
PER
INC
H
1.0 10.02.0 4.0 6.0 8.0 20.00.80.60.4
LOAD IN KIPS PER SQUARE FOOT
Boring G-176 @ 90½'SANDY SILTY CLAY
Note: Water added to samples after consolidation under a load of 7.2 kips per square foot.
Boring G-176 @ 102½'CLAYEY SAND

CONSOLIDATION TEST DATAProject No.: 4953-10-1561
Figure F-4.74
Prepared/Date: AH/JF 5/25/11Checked/Date: LT 8/17/11
0.12
0.10
0.08
0.06
0.04
0.02
0.00
CO
NSO
LID
AT
ION
ININ
CH
ES
PER
INC
H
1.0 10.02.0 4.0 6.0 8.0 20.00.80.60.4
LOAD IN KIPS PER SQUARE FOOT
Boring G-177 @ 93½'CLAYEY SAND
Note: Water added to samples after consolidation under a load of 7.2 kips per square foot.
Boring G-177 @ 103½'SANDY SILT
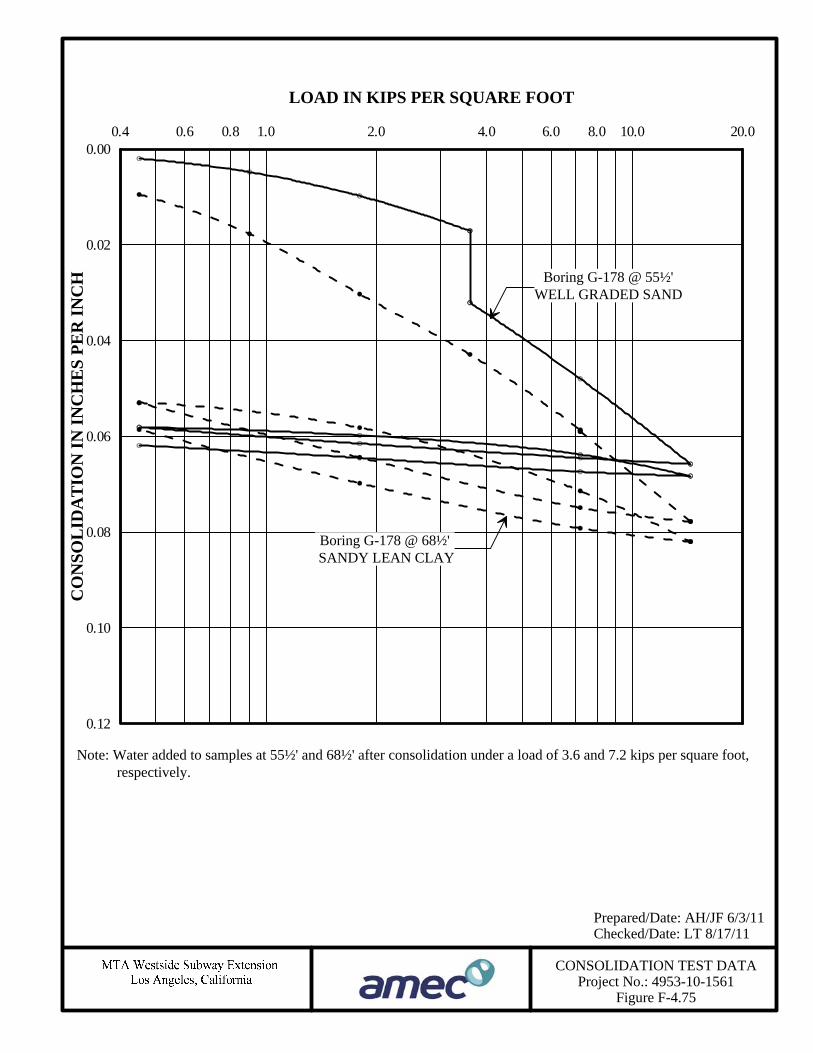
CONSOLIDATION TEST DATAProject No.: 4953-10-1561
Figure F-4.75
Prepared/Date: AH/JF 6/3/11Checked/Date: LT 8/17/11
0.12
0.10
0.08
0.06
0.04
0.02
0.00
CO
NSO
LID
AT
ION
ININ
CH
ES
PER
INC
H
1.0 10.02.0 4.0 6.0 8.0 20.00.80.60.4
LOAD IN KIPS PER SQUARE FOOT
Boring G-178 @ 55½'WELL GRADED SAND
Note: Water added to samples at 55½' and 68½' after consolidation under a load of 3.6 and 7.2 kips per square foot,respectively.
Boring G-178 @ 68½'SANDY LEAN CLAY
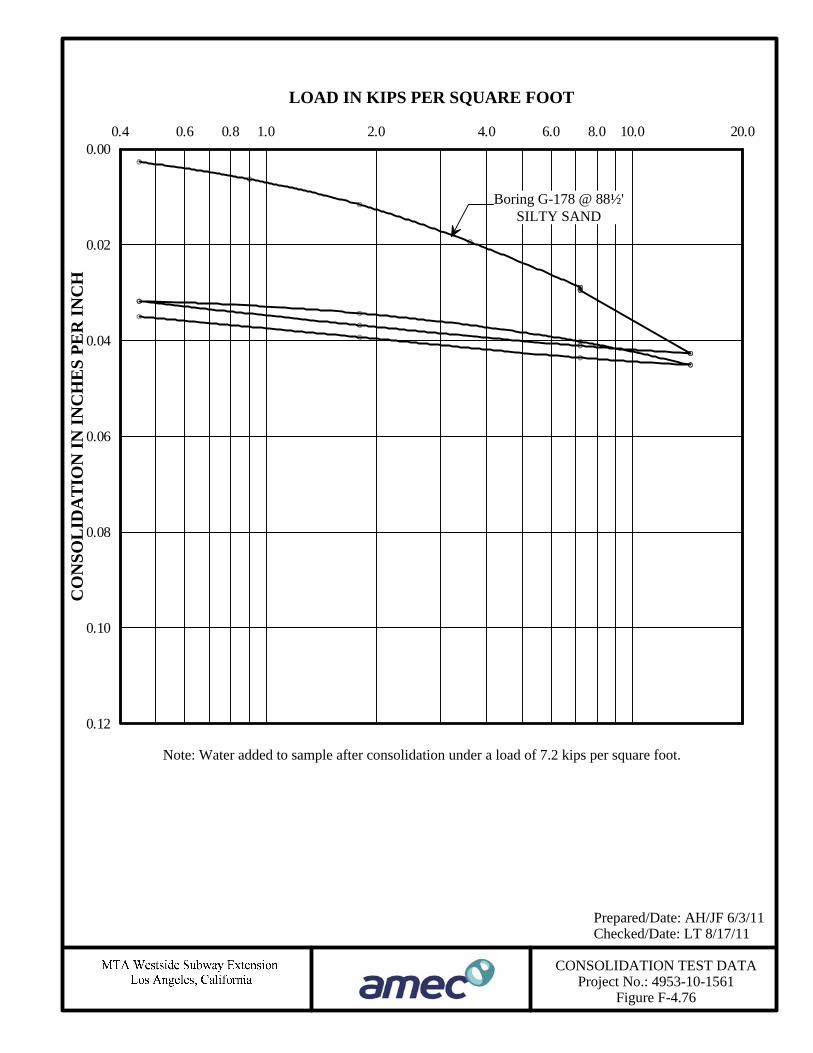
CONSOLIDATION TEST DATAProject No.: 4953-10-1561
Figure F-4.76
Prepared/Date: AH/JF 6/3/11Checked/Date: LT 8/17/11
0.12
0.10
0.08
0.06
0.04
0.02
0.00
CO
NSO
LID
AT
ION
ININ
CH
ES
PER
INC
H
1.0 10.02.0 4.0 6.0 8.0 20.00.80.60.4
LOAD IN KIPS PER SQUARE FOOT
Boring G-178 @ 88½'SILTY SAND
Note: Water added to sample after consolidation under a load of 7.2 kips per square foot.

CONSOLIDATION TEST DATAProject No.: 4953-10-1561
Figure F-4.77
Prepared/Date: AH/JF 6/3/11Checked/Date: LT 8/17/11
0.12
0.10
0.08
0.06
0.04
0.02
0.00
CO
NSO
LID
AT
ION
ININ
CH
ES
PER
INC
H
1.0 10.02.0 4.0 6.0 8.0 20.00.80.60.4
LOAD IN KIPS PER SQUARE FOOT
Boring G-179 @ 95½'SANDY LEAN CLAY
Note: Water added to samples after consolidation under a load of 7.2 kips per square foot.
Boring G-179 @ 65½'POORLY GRADED SAND
with GRAVEL
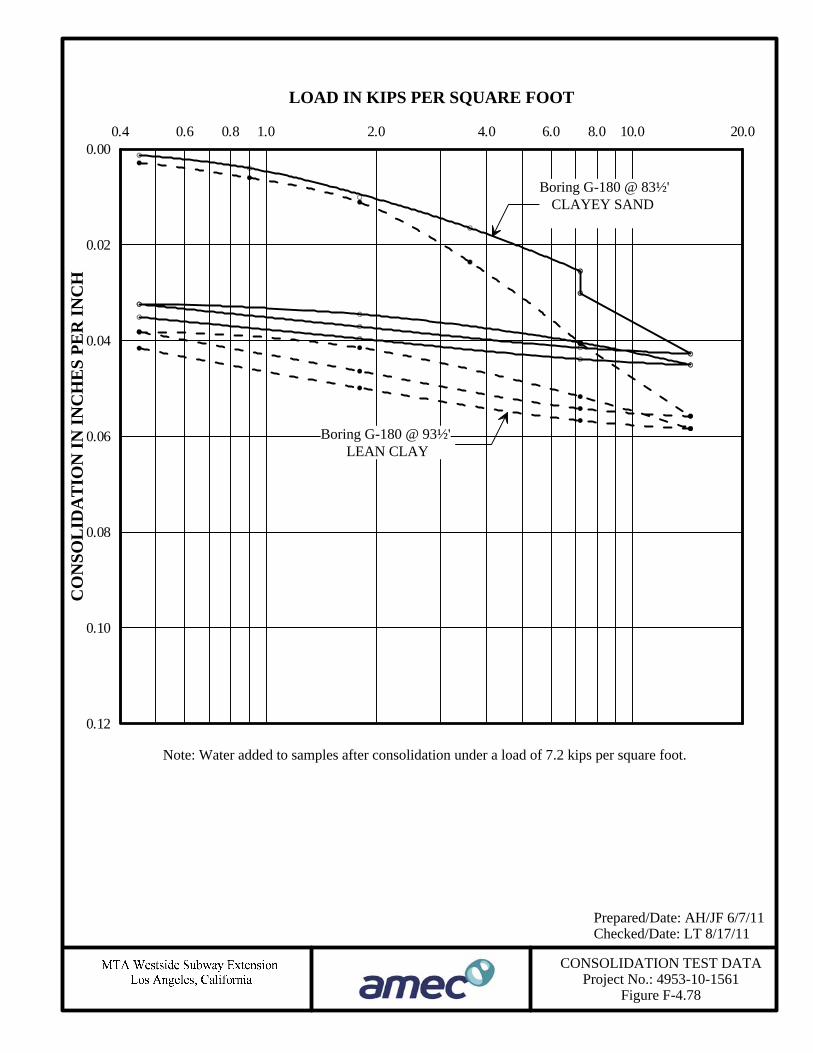
CONSOLIDATION TEST DATAProject No.: 4953-10-1561
Figure F-4.78
Prepared/Date: AH/JF 6/7/11Checked/Date: LT 8/17/11
0.12
0.10
0.08
0.06
0.04
0.02
0.00
CO
NSO
LID
AT
ION
ININ
CH
ES
PER
INC
H
1.0 10.02.0 4.0 6.0 8.0 20.00.80.60.4
LOAD IN KIPS PER SQUARE FOOT
Boring G-180 @ 93½'LEAN CLAY
Note: Water added to samples after consolidation under a load of 7.2 kips per square foot.
Boring G-180 @ 83½'CLAYEY SAND
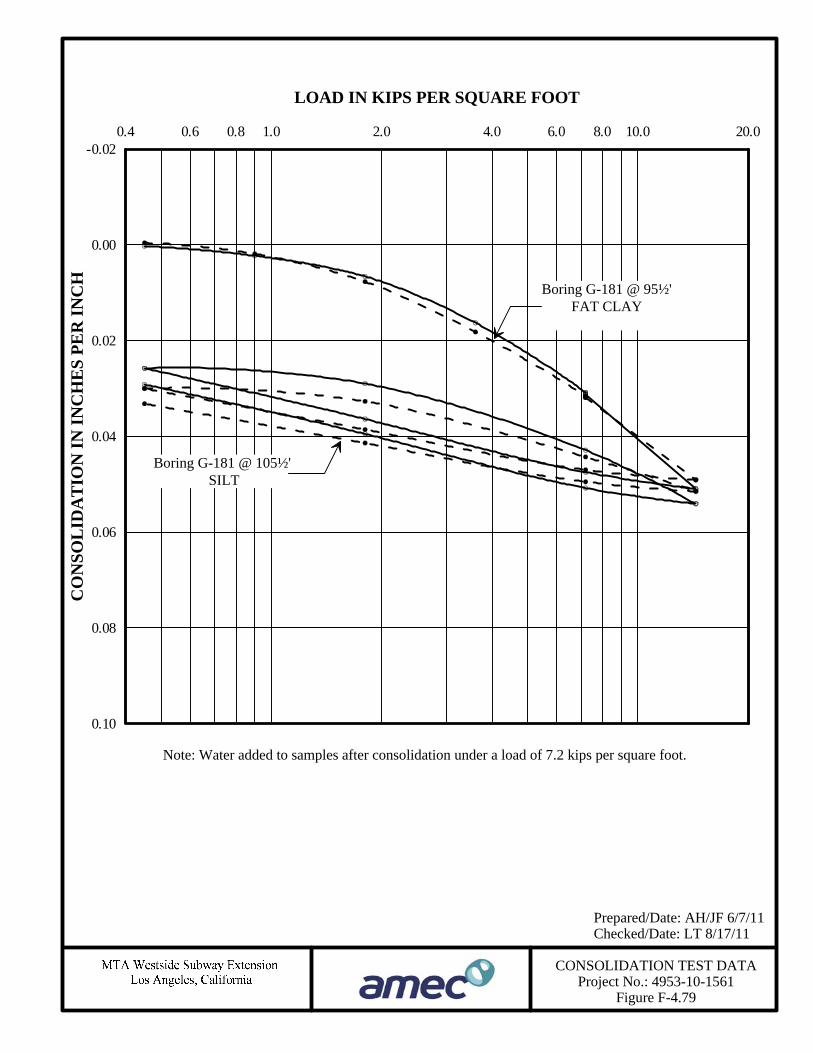
CONSOLIDATION TEST DATAProject No.: 4953-10-1561
Figure F-4.79
Prepared/Date: AH/JF 6/7/11Checked/Date: LT 8/17/11
0.10
0.08
0.06
0.04
0.02
0.00
-0.02
CO
NSO
LID
AT
ION
ININ
CH
ES
PER
INC
H
1.0 10.02.0 4.0 6.0 8.0 20.00.80.60.4
LOAD IN KIPS PER SQUARE FOOT
Boring G-181 @ 105½'SILT
Note: Water added to samples after consolidation under a load of 7.2 kips per square foot.
Boring G-181 @ 95½'FAT CLAY
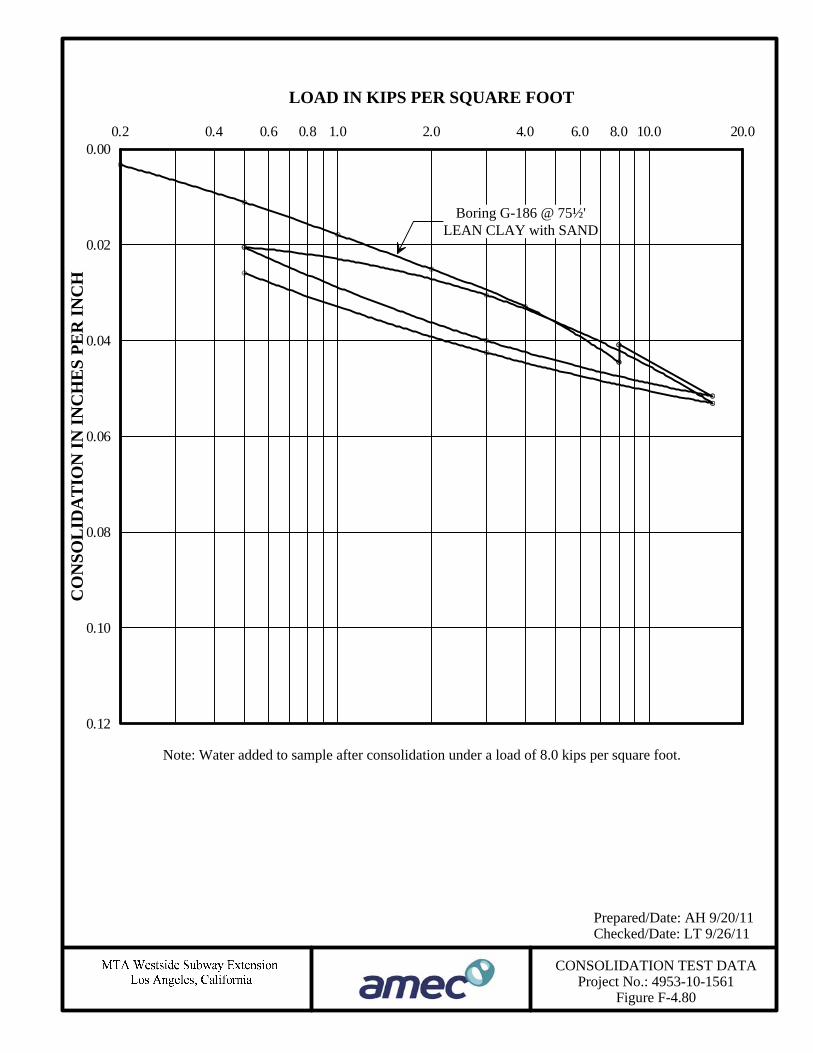
CONSOLIDATION TEST DATAProject No.: 4953-10-1561
Figure F-4.80
Prepared/Date: AH 9/20/11Checked/Date: LT 9/26/11
0.12
0.10
0.08
0.06
0.04
0.02
0.00
CO
NSO
LID
AT
ION
ININ
CH
ES
PER
INC
H
1.0 10.02.0 4.0 6.0 8.0 20.00.80.60.40.2
LOAD IN KIPS PER SQUARE FOOT
Boring G-186 @ 75½'LEAN CLAY with SAND
Note: Water added to sample after consolidation under a load of 8.0 kips per square foot.

CONSOLIDATION TEST DATAProject No.: 4953-10-1561
Figure F-4.81
Prepared/Date: AH 9/6/11Checked/Date: LT 9/13/11
0.12
0.10
0.08
0.06
0.04
0.02
0.00
CO
NSO
LID
AT
ION
ININ
CH
ES
PER
INC
H
1.0 10.02.0 4.0 6.0 8.0 20.00.80.60.4
LOAD IN KIPS PER SQUARE FOOT
Boring G-187 @ 55½'POORLY GRADED SAND with SILT
Note: Water not added to samples.
Boring G-187 @ 35½'SANDY SILT

CONSOLIDATION TEST DATAProject No.: 4953-10-1561
Figure F-4.82
Prepared/Date: AH 9/20/11Checked/Date: LT 9/27/11
0.12
0.10
0.08
0.06
0.04
0.02
0.00
CO
NSO
LID
AT
ION
ININ
CH
ES
PER
INC
H
1.0 10.02.0 4.0 6.0 8.0 20.00.80.60.40.2
LOAD IN KIPS PER SQUARE FOOT
Boring G-188 @ 50½'SILTY CLAY with SAND
Boring G-188 @ 70½'SANDY LEAN CLAY
Note: Water added to sample at 70½' after consolidation under a load of 8.0 kips per square foot.Water not added to sample at 50½'.

CONSOLIDATION TEST DATAProject No.: 4953-10-1561
Figure F-4.83
Prepared/Date: AH 9/22/11Checked/Date: LT 9/26/11
0.12
0.10
0.08
0.06
0.04
0.02
0.00
CO
NSO
LID
AT
ION
ININ
CH
ES
PER
INC
H
1.0 10.02.0 4.0 6.0 8.0 20.00.80.60.40.2
LOAD IN KIPS PER SQUARE FOOT
Boring G-189 @ 45½'SILTY SAND with GRAVEL
Boring G-189 @ 85½'FAT CLAY
Note: Water added to sample at 85½' after consolidation under a load of 8.0 kips per square foot.Water not added to sample at 45½'.

CONSOLIDATION TEST DATAProject No.: 4953-10-1561
Figure F-4.84
Prepared/Date: AH 9/22/11Checked/Date: LT 9/26/11
0.12
0.10
0.08
0.06
0.04
0.02
0.00
CO
NSO
LID
AT
ION
ININ
CH
ES
PER
INC
H
1.0 10.02.0 4.0 6.0 8.0 20.00.80.60.40.2
LOAD IN KIPS PER SQUARE FOOT
Boring G-189 @ 95½'FAT CLAY
Note: Water added to sample after consolidation under a load of 8.0 kips per square foot.
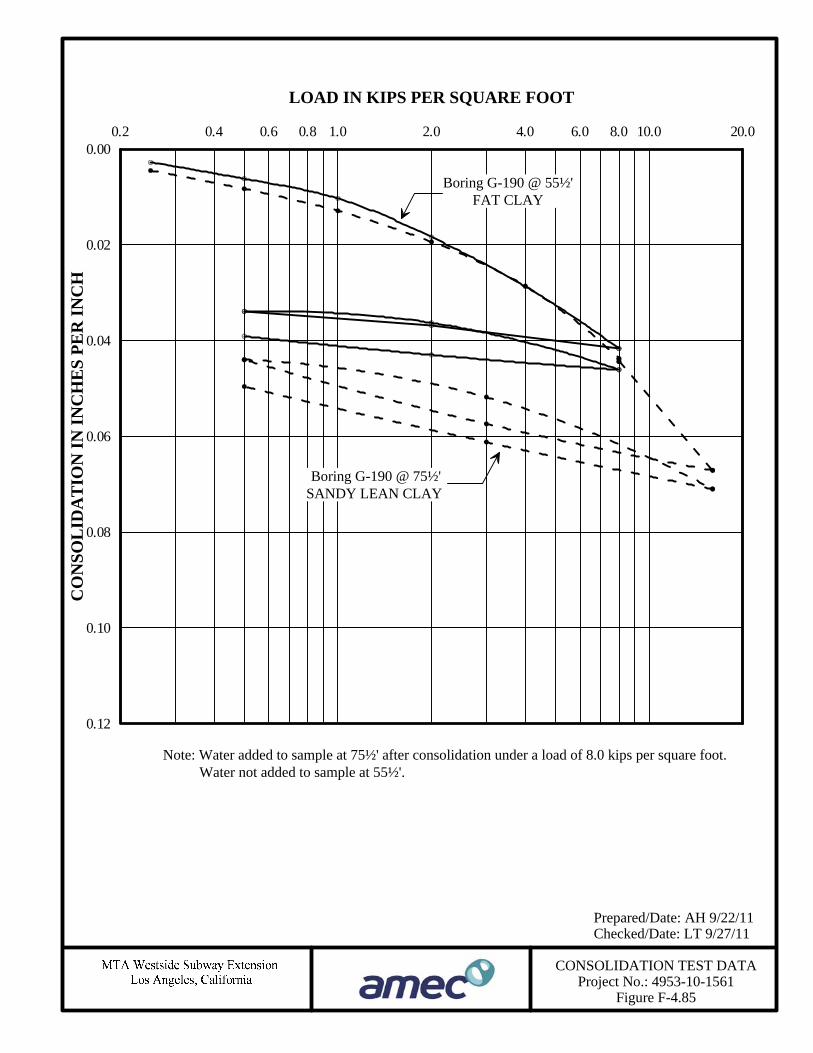
CONSOLIDATION TEST DATAProject No.: 4953-10-1561
Figure F-4.85
Prepared/Date: AH 9/22/11Checked/Date: LT 9/27/11
0.12
0.10
0.08
0.06
0.04
0.02
0.00
CO
NSO
LID
AT
ION
ININ
CH
ES
PER
INC
H
1.0 10.02.0 4.0 6.0 8.0 20.00.80.60.40.2
LOAD IN KIPS PER SQUARE FOOT
Boring G-190 @ 75½'SANDY LEAN CLAY
Boring G-190 @ 55½'FAT CLAY
Note: Water added to sample at 75½' after consolidation under a load of 8.0 kips per square foot.Water not added to sample at 55½'.
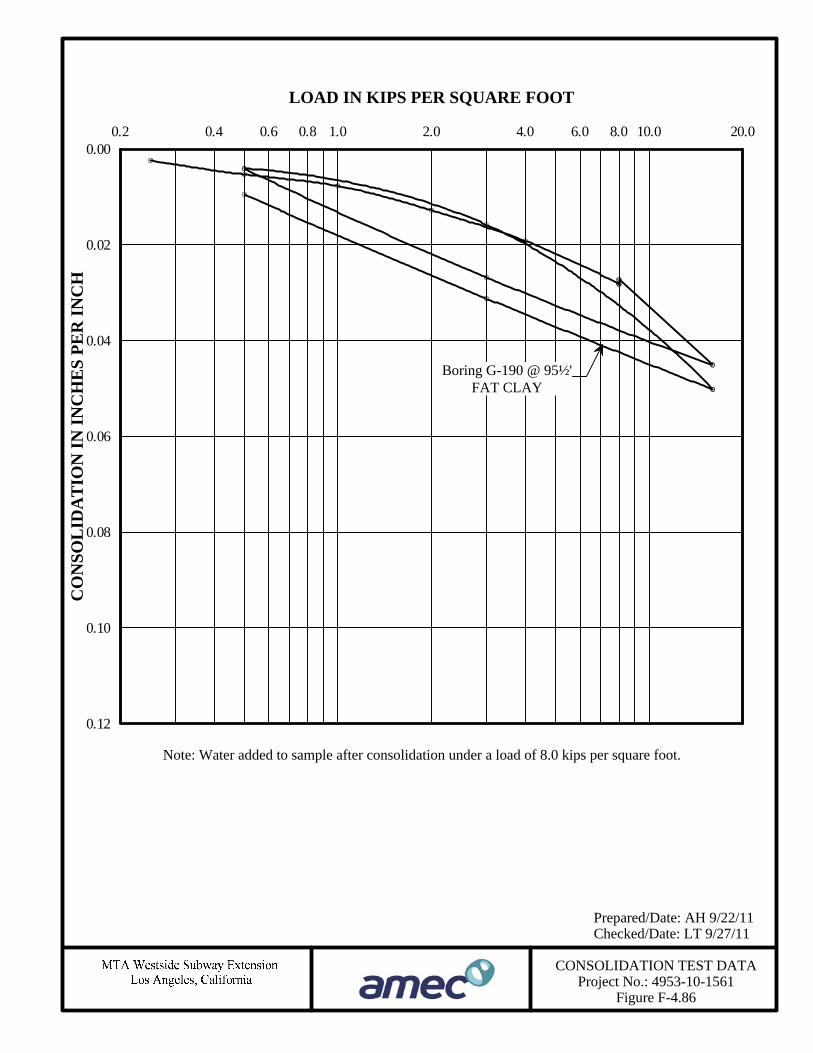
CONSOLIDATION TEST DATAProject No.: 4953-10-1561
Figure F-4.86
Prepared/Date: AH 9/22/11Checked/Date: LT 9/27/11
0.12
0.10
0.08
0.06
0.04
0.02
0.00
CO
NSO
LID
AT
ION
ININ
CH
ES
PER
INC
H
1.0 10.02.0 4.0 6.0 8.0 20.00.80.60.40.2
LOAD IN KIPS PER SQUARE FOOT
Boring G-190 @ 95½'FAT CLAY
Note: Water added to sample after consolidation under a load of 8.0 kips per square foot.
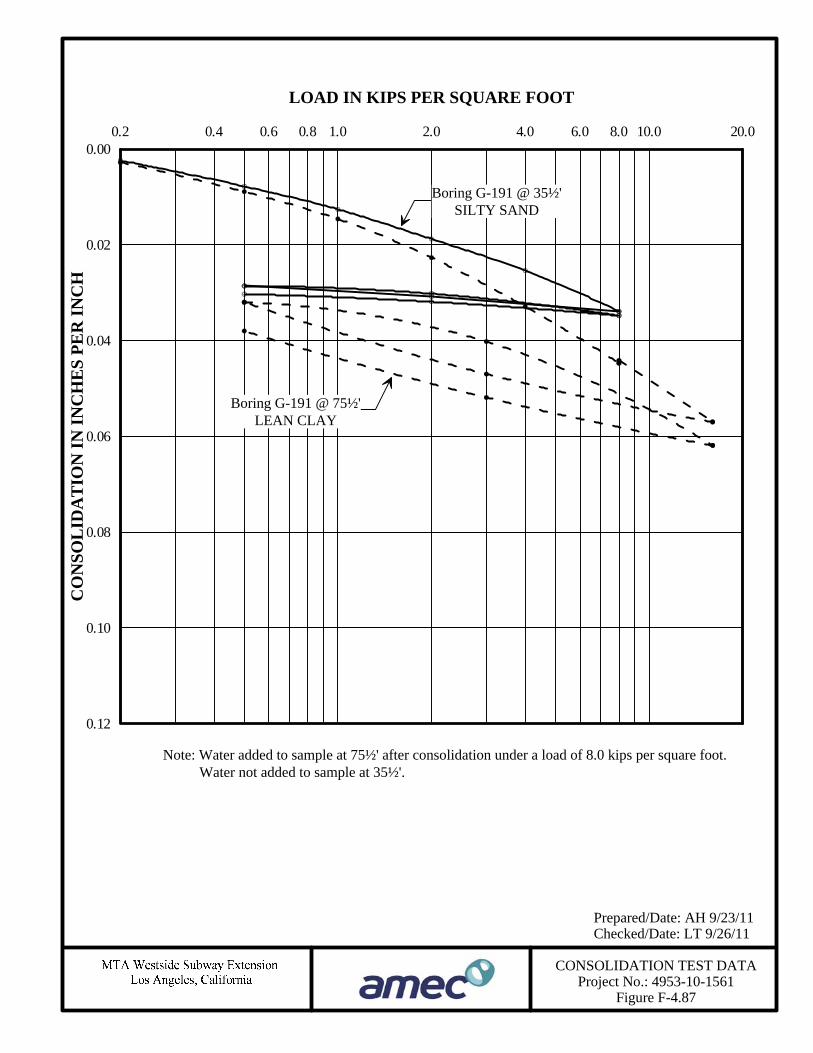
CONSOLIDATION TEST DATAProject No.: 4953-10-1561
Figure F-4.87
Prepared/Date: AH 9/23/11Checked/Date: LT 9/26/11
0.12
0.10
0.08
0.06
0.04
0.02
0.00
CO
NSO
LID
AT
ION
ININ
CH
ES
PER
INC
H
1.0 10.02.0 4.0 6.0 8.0 20.00.80.60.40.2
LOAD IN KIPS PER SQUARE FOOT
Boring G-191 @ 35½'SILTY SAND
Boring G-191 @ 75½'LEAN CLAY
Note: Water added to sample at 75½' after consolidation under a load of 8.0 kips per square foot.Water not added to sample at 35½'.
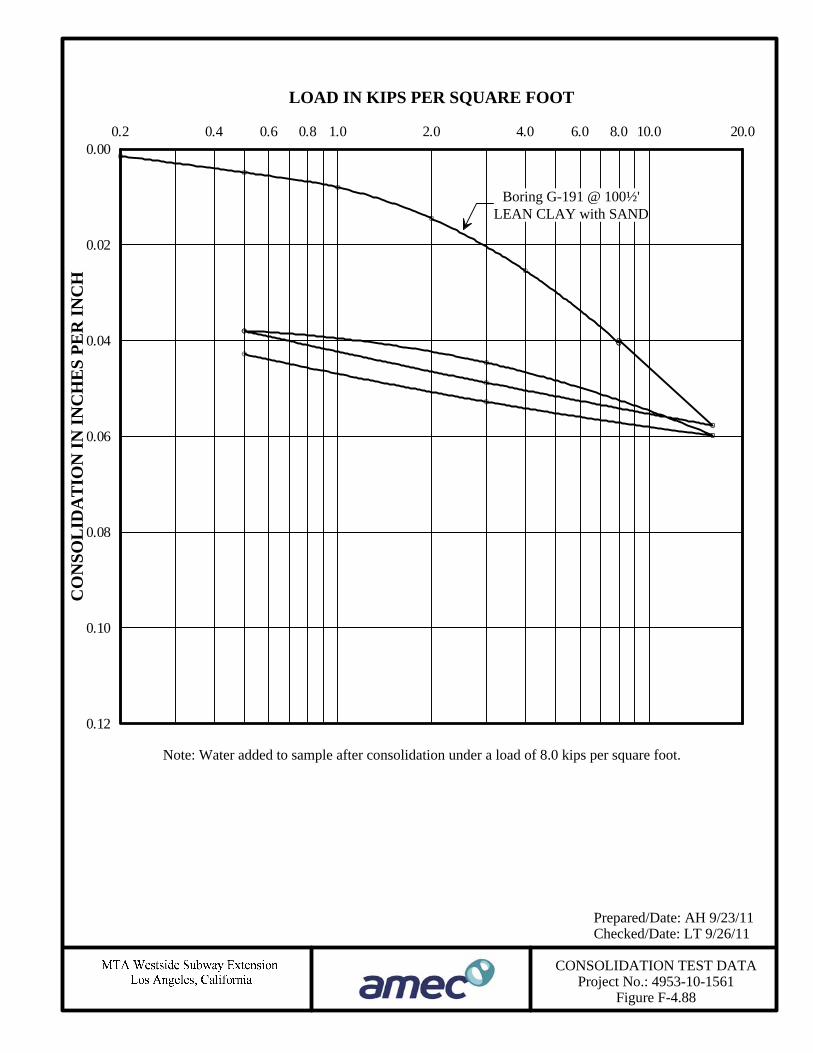
CONSOLIDATION TEST DATAProject No.: 4953-10-1561
Figure F-4.88
Prepared/Date: AH 9/23/11Checked/Date: LT 9/26/11
0.12
0.10
0.08
0.06
0.04
0.02
0.00
CO
NSO
LID
AT
ION
ININ
CH
ES
PER
INC
H
1.0 10.02.0 4.0 6.0 8.0 20.00.80.60.40.2
LOAD IN KIPS PER SQUARE FOOT
Boring G-191 @ 100½'LEAN CLAY with SAND
Note: Water added to sample after consolidation under a load of 8.0 kips per square foot.
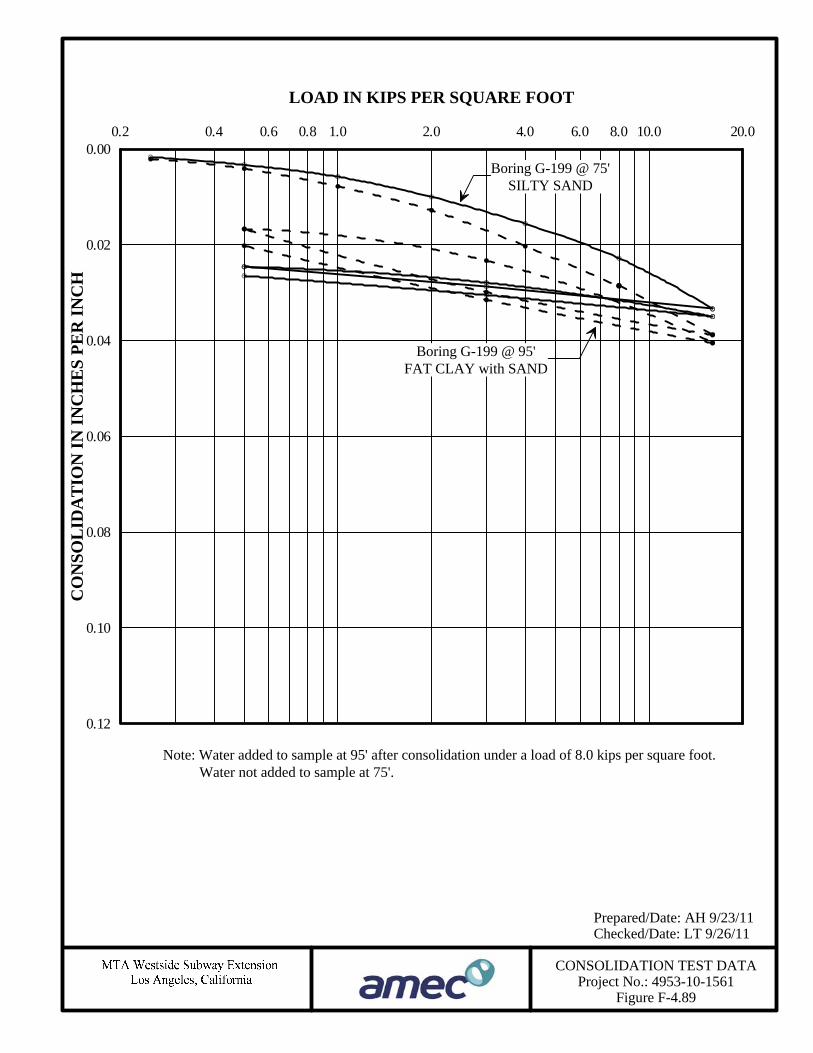
CONSOLIDATION TEST DATAProject No.: 4953-10-1561
Figure F-4.89
Prepared/Date: AH 9/23/11Checked/Date: LT 9/26/11
0.12
0.10
0.08
0.06
0.04
0.02
0.00
CO
NSO
LID
AT
ION
ININ
CH
ES
PER
INC
H
1.0 10.02.0 4.0 6.0 8.0 20.00.80.60.40.2
LOAD IN KIPS PER SQUARE FOOT
Boring G-199 @ 75'SILTY SAND
Boring G-199 @ 95'FAT CLAY with SAND
Note: Water added to sample at 95' after consolidation under a load of 8.0 kips per square foot.Water not added to sample at 75'.

CONSOLIDATION TEST DATAProject No.: 4953-10-1561
Figure F-4.90
Prepared/Date: AH 9/23/11Checked/Date: LT 9/26/11
0.12
0.10
0.08
0.06
0.04
0.02
0.00
CO
NSO
LID
AT
ION
ININ
CH
ES
PER
INC
H
1.0 10.02.0 4.0 6.0 8.0 20.00.80.60.40.2
LOAD IN KIPS PER SQUARE FOOT
Boring G-199 @ 115'SILTY CLAY with SAND
Note: Water added to sample after consolidation under a load of 8.0 kips per square foot.

CONSOLIDATION TEST DATAProject No.: 4953-10-1561
Figure F-4.91
Prepared/Date: AH 9/23/11Checked/Date: LT 9/26/11
0.12
0.10
0.08
0.06
0.04
0.02
0.00
CO
NSO
LID
AT
ION
ININ
CH
ES
PER
INC
H
1.0 10.02.0 4.0 6.0 8.0 20.00.80.60.40.2
LOAD IN KIPS PER SQUARE FOOT
Boring G-200 Alt @ 25½'SILTY SAND
Boring G-200 Alt @ 45½'SILTY SAND
Note: Water not added to samples.
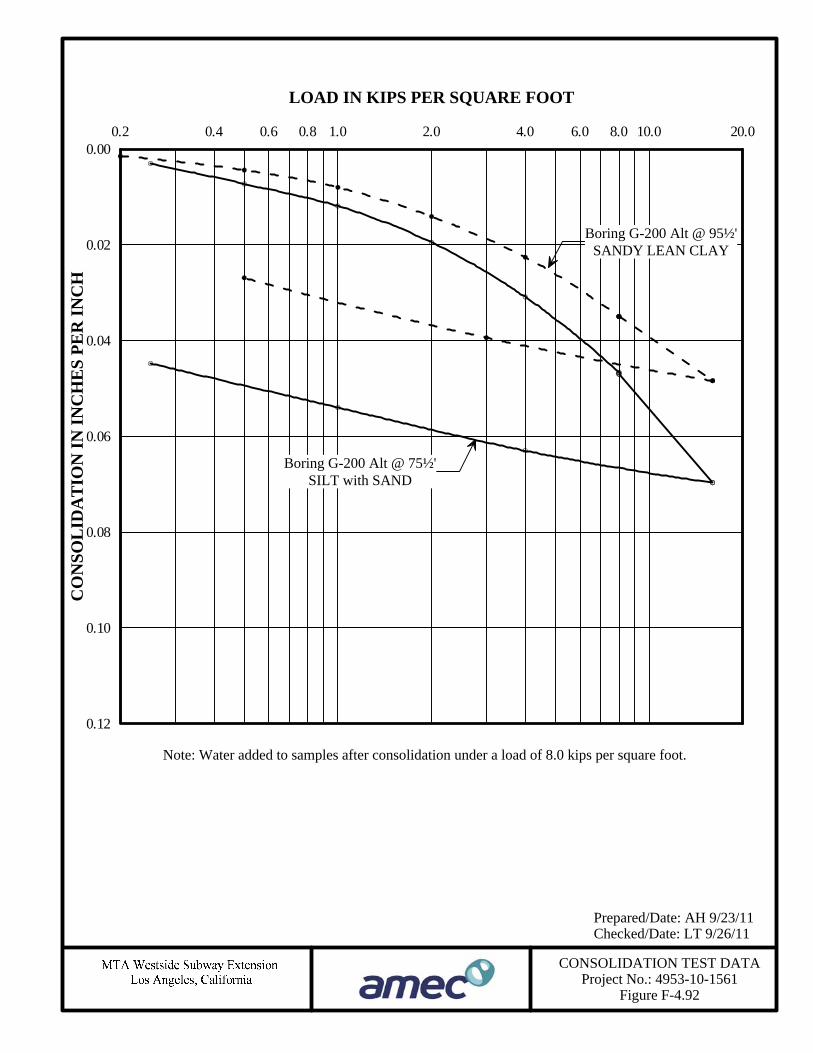
CONSOLIDATION TEST DATAProject No.: 4953-10-1561
Figure F-4.92
Prepared/Date: AH 9/23/11Checked/Date: LT 9/26/11
0.12
0.10
0.08
0.06
0.04
0.02
0.00
CO
NSO
LID
AT
ION
ININ
CH
ES
PER
INC
H
1.0 10.02.0 4.0 6.0 8.0 20.00.80.60.40.2
LOAD IN KIPS PER SQUARE FOOT
Boring G-200 Alt @ 75½'SILT with SAND
Boring G-200 Alt @ 95½'SANDY LEAN CLAY
Note: Water added to samples after consolidation under a load of 8.0 kips per square foot.

CONSOLIDATION TEST DATAProject No.: 4953-10-1561
Figure F-4.93
Prepared/Date: AH 9/23/11Checked/Date: LT 9/26/11
0.12
0.10
0.08
0.06
0.04
0.02
0.00
CO
NSO
LID
AT
ION
ININ
CH
ES
PER
INC
H
1.0 10.02.0 4.0 6.0 8.0 20.00.80.60.40.2
LOAD IN KIPS PER SQUARE FOOT
Boring G-200 Alt @ 105½'FAT CLAY
Note: Water added to sample after consolidation under a load of 8.0 kips per square foot.

CONSOLIDATION TEST DATAProject No.: 4953-10-1561
Figure F-4.94
Prepared/Date: AH 8/26/11Checked/Date: LT 9/13/11
0.12
0.10
0.08
0.06
0.04
0.02
0.00
CO
NSO
LID
AT
ION
ININ
CH
ES
PER
INC
H
1.0 10.02.0 4.0 6.0 8.0 20.00.80.60.4
LOAD IN KIPS PER SQUARE FOOT
Note: Water added to sample after consolidation under a load of 7.2 kips per square foot.
Boring G-203 @ 95½'LEAN CLAY

CONSOLIDATION TEST DATAProject No.: 4953-10-1561
Figure F-4.95
Prepared/Date: AH 8/25/11Checked/Date: LT 9/13/11
0.12
0.10
0.08
0.06
0.04
0.02
0.00
CO
NSO
LID
AT
ION
ININ
CH
ES
PER
INC
H
1.0 10.02.0 4.0 6.0 8.0 20.00.80.60.4
LOAD IN KIPS PER SQUARE FOOT
Boring G-204 @ 105½'SILTY SAND
Note: Water added to samples after consolidation under a load of 7.2 kips per square foot.
Boring G-204 @ 85½'LEAN CLAY with SAND

CONSOLIDATION TEST DATAProject No.: 4953-10-1561
Figure F-4.96
Prepared/Date: JF 9/29/11Checked/Date: LT 9/29/11
0.12
0.10
0.08
0.06
0.04
0.02
0.00
CO
NSO
LID
AT
ION
ININ
CH
ES
PER
INC
H
1.0 10.02.0 4.0 6.0 8.0 20.00.80.60.4
LOAD IN KIPS PER SQUARE FOOT
Boring G-206 @ 30'SANDY SILT
Note: Water added to samples after consolidation under a load of 3.6 kips per square foot.
Boring G-206 @ 80½'SILTSTONE

CONSOLIDATION TEST DATAProject No.: 4953-10-1561
Figure F-4.97
Prepared/Date: JF 9/29/11Checked/Date: LT 9/29/11
0.12
0.10
0.08
0.06
0.04
0.02
0.00
CO
NSO
LID
AT
ION
ININ
CH
ES
PER
INC
H
1.0 10.02.0 4.0 6.0 8.0 20.00.80.60.4
LOAD IN KIPS PER SQUARE FOOT
Boring G-207 @ 30'FAT CLAY
Note: Water added to samples after consolidation under a load of 3.6 kips per square foot.
Boring G-207 @ 60'POORLY GRADED SAND with SILT

Preliminary Geotechnical and Environmental Report
Appendix F – Laboratory Testing
W E S T S I D E S U B W A Y E X T E N S I O N P R O J E C T December 21, 2011
FIGURES F-5.1 THROUGH F-5.11 PARTICLE SIZE DISTRIBUTION (ACE PHASE)
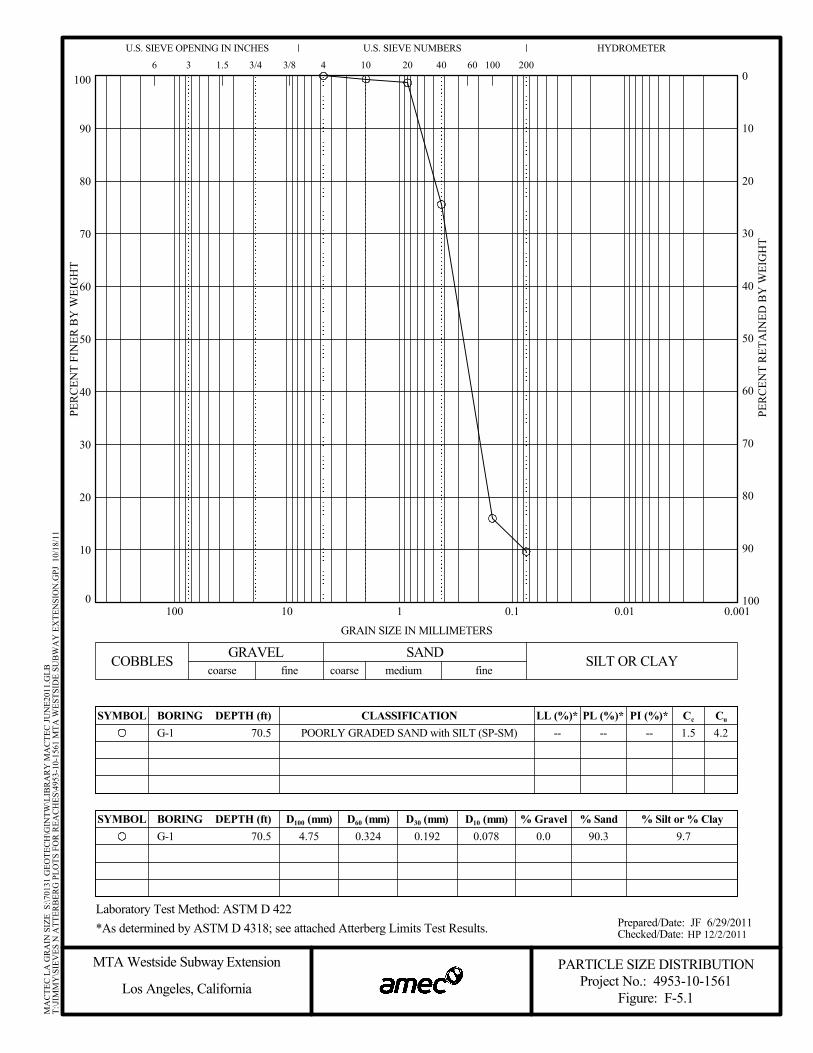
0
10
20
30
40
50
60
70
80
90
100
0.0010.010.1110100
D30 (mm)D60 (mm)D100 (mm)BORINGSYMBOL
PARTICLE SIZE DISTRIBUTION
PI (%)*PL (%)*LL (%)*
G-1 4.75 0.324 0.192 0.078 0.0 90.3% Sand
DEPTH (ft)
DEPTH (ft)
1.5 3/4
Cu
G-1BORING
PER
CEN
T R
ETA
INED
BY
WEI
GH
T
PER
CEN
T FI
NER
BY
WEI
GH
T0
10
20
30
40
50
60
70
80
90
100
coarse fine coarse medium fineGRAVEL SAND SILT OR CLAY
CLASSIFICATIONSYMBOL
60
% Silt or % Clay% GravelD10 (mm)
Cc
100
HYDROMETER
20040
COBBLES
GRAIN SIZE IN MILLIMETERS
70.5
70.5 9.7
43/8
Laboratory Test Method: ASTM D 422
U.S. SIEVE NUMBERS
-- -- -- 1.5 4.2
*As determined by ASTM D 4318; see attached Atterberg Limits Test Results.
20
U.S. SIEVE OPENING IN INCHES
6 3 10
Figure: F-5.1
Prepared/Date: JF 6/29/2011Checked/Date:
MTA Westside Subway Extension
Los Angeles, California Project No.: 4953-10-1561
MA
CTE
C L
A G
RA
IN S
IZE
S:\7
0131
GEO
TEC
H\G
INTW
\LIB
RA
RY
MA
CTE
C JU
NE2
011.
GLB
T:\J
IMM
Y\S
IEV
ES N
ATT
ERB
ERG
PLO
TS F
OR
REA
CH
ES\4
953-
10-1
561
MTA
WES
TSID
E SU
BW
AY
EX
TEN
SIO
N.G
PJ 1
0/18
/11
POORLY GRADED SAND with SILT (SP-SM)
HP 12/2/2011
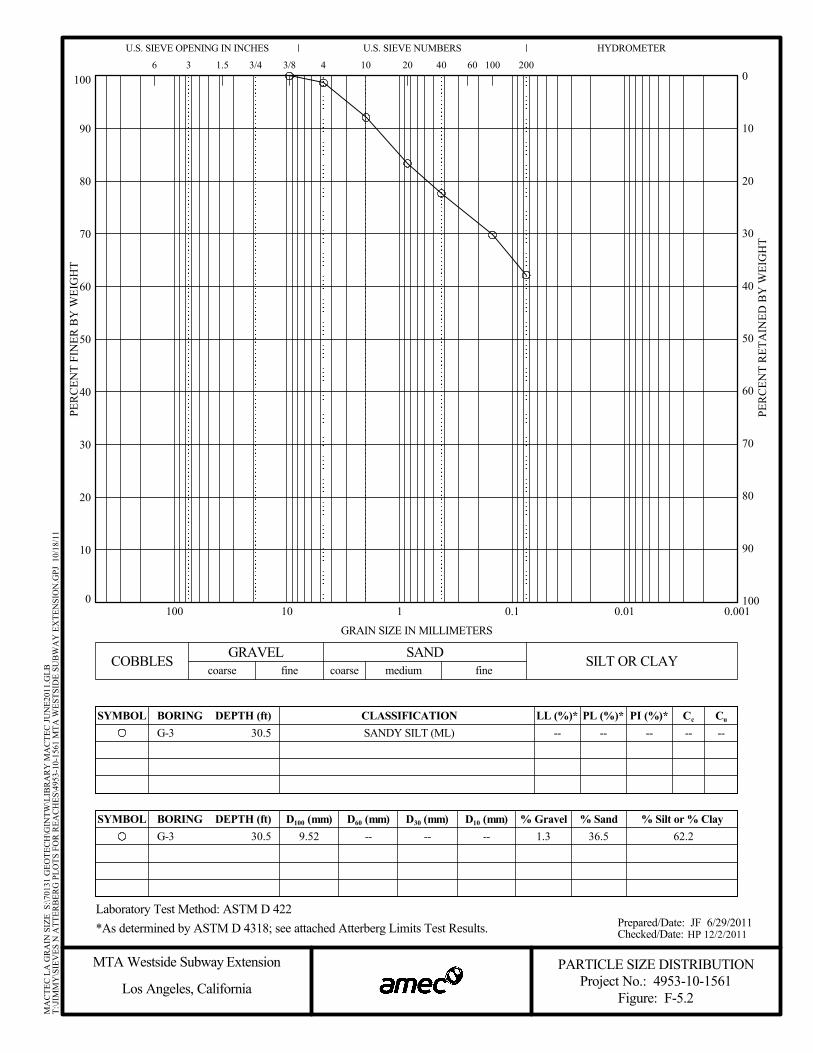
0
10
20
30
40
50
60
70
80
90
100
0.0010.010.1110100
D30 (mm)D60 (mm)D100 (mm)BORINGSYMBOL
PARTICLE SIZE DISTRIBUTION
PI (%)*PL (%)*LL (%)*
G-3 9.52 -- -- -- 1.3 36.5% Sand
DEPTH (ft)
DEPTH (ft)
1.5 3/4
Cu
G-3BORING
PER
CEN
T R
ETA
INED
BY
WEI
GH
T
PER
CEN
T FI
NER
BY
WEI
GH
T0
10
20
30
40
50
60
70
80
90
100
coarse fine coarse medium fineGRAVEL SAND SILT OR CLAY
CLASSIFICATIONSYMBOL
60
% Silt or % Clay% GravelD10 (mm)
Cc
100
HYDROMETER
20040
COBBLES
GRAIN SIZE IN MILLIMETERS
30.5
30.5 62.2
43/8
Laboratory Test Method: ASTM D 422
U.S. SIEVE NUMBERS
-- -- -- -- --
*As determined by ASTM D 4318; see attached Atterberg Limits Test Results.
20
U.S. SIEVE OPENING IN INCHES
6 3 10
Figure: F-5.2
Prepared/Date: JF 6/29/2011Checked/Date:
MTA Westside Subway Extension
Los Angeles, California Project No.: 4953-10-1561
MA
CTE
C L
A G
RA
IN S
IZE
S:\7
0131
GEO
TEC
H\G
INTW
\LIB
RA
RY
MA
CTE
C JU
NE2
011.
GLB
T:\J
IMM
Y\S
IEV
ES N
ATT
ERB
ERG
PLO
TS F
OR
REA
CH
ES\4
953-
10-1
561
MTA
WES
TSID
E SU
BW
AY
EX
TEN
SIO
N.G
PJ 1
0/18
/11
SANDY SILT (ML)
HP 12/2/2011

0
10
20
30
40
50
60
70
80
90
100
0.0010.010.1110100
D30 (mm)D60 (mm)D100 (mm)BORINGSYMBOL
PARTICLE SIZE DISTRIBUTION
PI (%)*PL (%)*LL (%)*
G-4 4.75 0.243 0.121 0.075 0.0 90.2% Sand
DEPTH (ft)
DEPTH (ft)
1.5 3/4
Cu
G-4BORING
PER
CEN
T R
ETA
INED
BY
WEI
GH
T
PER
CEN
T FI
NER
BY
WEI
GH
T0
10
20
30
40
50
60
70
80
90
100
coarse fine coarse medium fineGRAVEL SAND SILT OR CLAY
CLASSIFICATIONSYMBOL
60
% Silt or % Clay% GravelD10 (mm)
Cc
100
HYDROMETER
20040
COBBLES
GRAIN SIZE IN MILLIMETERS
70.5
70.5 9.8
43/8
Laboratory Test Method: ASTM D 422
U.S. SIEVE NUMBERS
-- -- -- 0.8 3.2
*As determined by ASTM D 4318; see attached Atterberg Limits Test Results.
20
U.S. SIEVE OPENING IN INCHES
6 3 10
Figure: F-5.3
Prepared/Date: JF 6/29/2011Checked/Date:
MTA Westside Subway Extension
Los Angeles, California Project No.: 4953-10-1561
MA
CTE
C L
A G
RA
IN S
IZE
S:\7
0131
GEO
TEC
H\G
INTW
\LIB
RA
RY
MA
CTE
C JU
NE2
011.
GLB
T:\J
IMM
Y\S
IEV
ES N
ATT
ERB
ERG
PLO
TS F
OR
REA
CH
ES\4
953-
10-1
561
MTA
WES
TSID
E SU
BW
AY
EX
TEN
SIO
N.G
PJ 1
0/18
/11
POORLY GRADED SAND with SILT (SP-SM)
HP 12/2/2011

0
10
20
30
40
50
60
70
80
90
100
0.0010.010.1110100
D30 (mm)D60 (mm)D100 (mm)BORINGSYMBOL
PARTICLE SIZE DISTRIBUTION
PI (%)*PL (%)*LL (%)*
G-10G-10G-10
12.7012.7012.70
1.4740.1820.160
0.2130.061
--
--0.008
--
18.32.35.2
62.455.744.9
% Sand
DEPTH (ft)
DEPTH (ft)
1.5 3/4
Cu
G-10G-10G-10
BORING
PER
CEN
T R
ETA
INED
BY
WEI
GH
T
PER
CEN
T FI
NER
BY
WEI
GH
T0
10
20
30
40
50
60
70
80
90
100
coarse fine coarse medium fineGRAVEL SAND SILT OR CLAY
CLASSIFICATIONSYMBOL
60
% Silt or % Clay% GravelD10 (mm)
Cc
100
HYDROMETER
20040
COBBLES
GRAIN SIZE IN MILLIMETERS
35.550.555.5
35.550.555.5
19.342.049.9
43/8
Laboratory Test Method: ASTM D 422
U.S. SIEVE NUMBERS
--28--
--19--
--9--
--2.4--
--21.5
--
*As determined by ASTM D 4318; see attached Atterberg Limits Test Results.
20
U.S. SIEVE OPENING IN INCHES
6 3 10
Figure: F-5.4
Prepared/Date: JF 6/29/2011Checked/Date:Prepared/Date: JF 6/29/2011Checked/Date:Prepared/Date: JF 6/29/2011Checked/Date:
MTA Westside Subway Extension
Los Angeles, California Project No.: 4953-10-1561
MA
CTE
C L
A G
RA
IN S
IZE
S:\7
0131
GEO
TEC
H\G
INTW
\LIB
RA
RY
MA
CTE
C JU
NE2
011.
GLB
T:\J
IMM
Y\S
IEV
ES N
ATT
ERB
ERG
PLO
TS F
OR
REA
CH
ES\4
953-
10-1
561
MTA
WES
TSID
E SU
BW
AY
EX
TEN
SIO
N.G
PJ 1
0/18
/11
CLAYEY SAND (SC)CLAYEY SAND (SC)SILTY SAND (SM)
HP 12/2/2011

0
10
20
30
40
50
60
70
80
90
100
0.0010.010.1110100
D30 (mm)D60 (mm)D100 (mm)BORINGSYMBOL
PARTICLE SIZE DISTRIBUTION
PI (%)*PL (%)*LL (%)*
G-11G-11
9.5219.10
--1.294
--0.142
----
0.217.7
23.058.5
% Sand
DEPTH (ft)
DEPTH (ft)
1.5 3/4
Cu
G-11G-11
BORING
PER
CEN
T R
ETA
INED
BY
WEI
GH
T
PER
CEN
T FI
NER
BY
WEI
GH
T0
10
20
30
40
50
60
70
80
90
100
coarse fine coarse medium fineGRAVEL SAND SILT OR CLAY
CLASSIFICATIONSYMBOL
60
% Silt or % Clay% GravelD10 (mm)
Cc
100
HYDROMETER
20040
COBBLES
GRAIN SIZE IN MILLIMETERS
30.540.5
30.540.5
76.823.8
43/8
Laboratory Test Method: ASTM D 422
U.S. SIEVE NUMBERS
----
----
----
----
----
*As determined by ASTM D 4318; see attached Atterberg Limits Test Results.
20
U.S. SIEVE OPENING IN INCHES
6 3 10
Figure: F-5.5
Prepared/Date: JF 6/29/2011Checked/Date:Prepared/Date: JF 6/29/2011Checked/Date:
MTA Westside Subway Extension
Los Angeles, California Project No.: 4953-10-1561
MA
CTE
C L
A G
RA
IN S
IZE
S:\7
0131
GEO
TEC
H\G
INTW
\LIB
RA
RY
MA
CTE
C JU
NE2
011.
GLB
T:\J
IMM
Y\S
IEV
ES N
ATT
ERB
ERG
PLO
TS F
OR
REA
CH
ES\4
953-
10-1
561
MTA
WES
TSID
E SU
BW
AY
EX
TEN
SIO
N.G
PJ 1
0/18
/11
SILT (ML)SILTY SAND (SM)
HP 12/2/2011
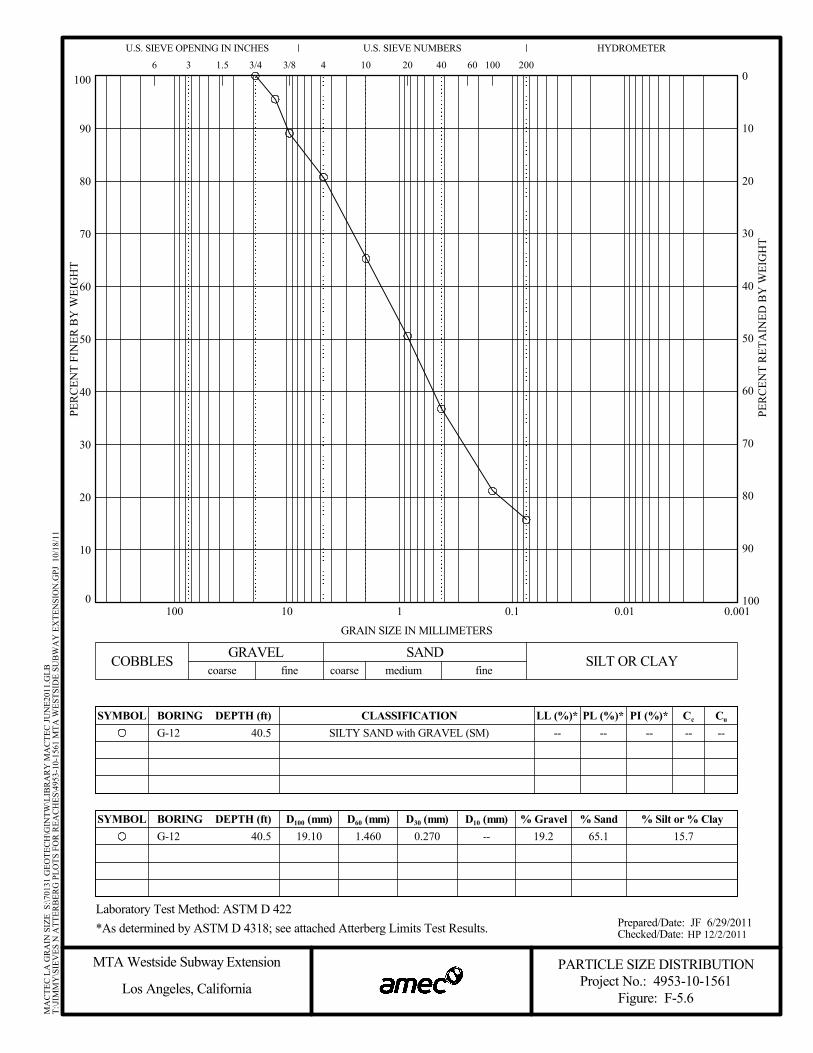
0
10
20
30
40
50
60
70
80
90
100
0.0010.010.1110100
D30 (mm)D60 (mm)D100 (mm)BORINGSYMBOL
PARTICLE SIZE DISTRIBUTION
PI (%)*PL (%)*LL (%)*
G-12 19.10 1.460 0.270 -- 19.2 65.1% Sand
DEPTH (ft)
DEPTH (ft)
1.5 3/4
Cu
G-12BORING
PER
CEN
T R
ETA
INED
BY
WEI
GH
T
PER
CEN
T FI
NER
BY
WEI
GH
T0
10
20
30
40
50
60
70
80
90
100
coarse fine coarse medium fineGRAVEL SAND SILT OR CLAY
CLASSIFICATIONSYMBOL
60
% Silt or % Clay% GravelD10 (mm)
Cc
100
HYDROMETER
20040
COBBLES
GRAIN SIZE IN MILLIMETERS
40.5
40.5 15.7
43/8
Laboratory Test Method: ASTM D 422
U.S. SIEVE NUMBERS
-- -- -- -- --
*As determined by ASTM D 4318; see attached Atterberg Limits Test Results.
20
U.S. SIEVE OPENING IN INCHES
6 3 10
Figure: F-5.6
Prepared/Date: JF 6/29/2011Checked/Date:
MTA Westside Subway Extension
Los Angeles, California Project No.: 4953-10-1561
MA
CTE
C L
A G
RA
IN S
IZE
S:\7
0131
GEO
TEC
H\G
INTW
\LIB
RA
RY
MA
CTE
C JU
NE2
011.
GLB
T:\J
IMM
Y\S
IEV
ES N
ATT
ERB
ERG
PLO
TS F
OR
REA
CH
ES\4
953-
10-1
561
MTA
WES
TSID
E SU
BW
AY
EX
TEN
SIO
N.G
PJ 1
0/18
/11
SILTY SAND with GRAVEL (SM)
HP 12/2/2011
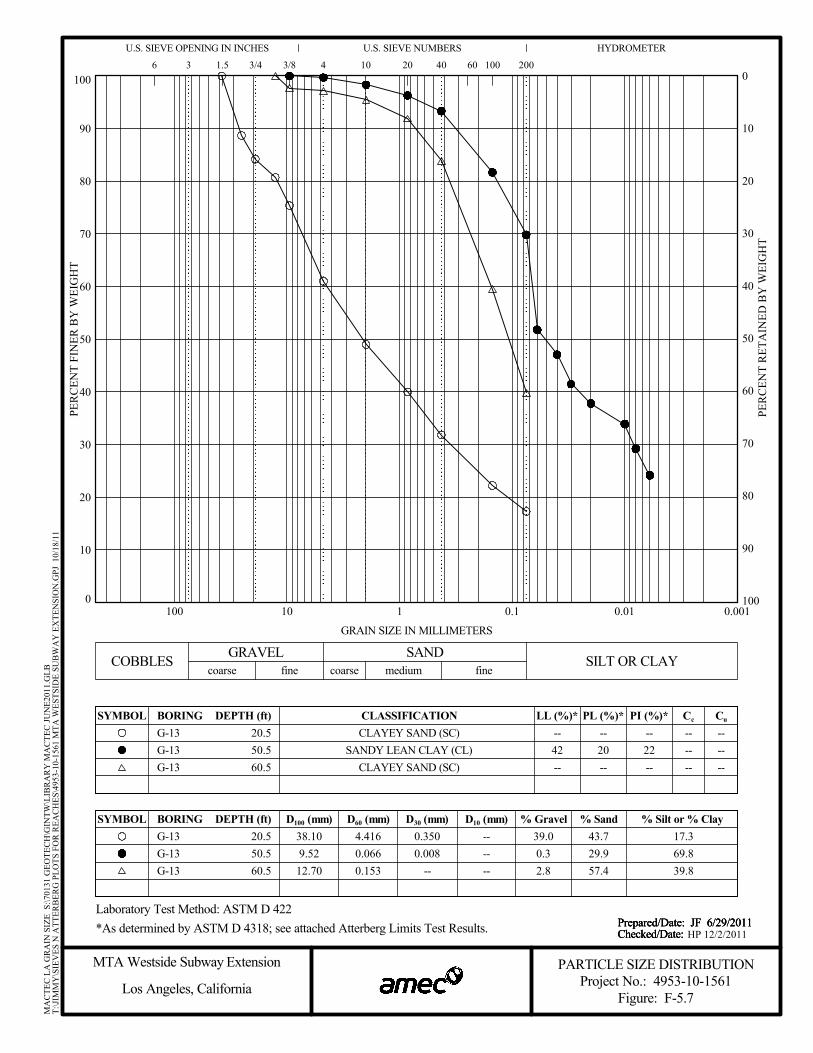
0
10
20
30
40
50
60
70
80
90
100
0.0010.010.1110100
D30 (mm)D60 (mm)D100 (mm)BORINGSYMBOL
PARTICLE SIZE DISTRIBUTION
PI (%)*PL (%)*LL (%)*
G-13G-13G-13
38.109.5212.70
4.4160.0660.153
0.3500.008
--
------
39.00.32.8
43.729.957.4
% Sand
DEPTH (ft)
DEPTH (ft)
1.5 3/4
Cu
G-13G-13G-13
BORING
PER
CEN
T R
ETA
INED
BY
WEI
GH
T
PER
CEN
T FI
NER
BY
WEI
GH
T0
10
20
30
40
50
60
70
80
90
100
coarse fine coarse medium fineGRAVEL SAND SILT OR CLAY
CLASSIFICATIONSYMBOL
60
% Silt or % Clay% GravelD10 (mm)
Cc
100
HYDROMETER
20040
COBBLES
GRAIN SIZE IN MILLIMETERS
20.550.560.5
20.550.560.5
17.369.839.8
43/8
Laboratory Test Method: ASTM D 422
U.S. SIEVE NUMBERS
--42--
--20--
--22--
------
------
*As determined by ASTM D 4318; see attached Atterberg Limits Test Results.
20
U.S. SIEVE OPENING IN INCHES
6 3 10
Figure: F-5.7
Prepared/Date: JF 6/29/2011Checked/Date:Prepared/Date: JF 6/29/2011Checked/Date:Prepared/Date: JF 6/29/2011Checked/Date:
MTA Westside Subway Extension
Los Angeles, California Project No.: 4953-10-1561
MA
CTE
C L
A G
RA
IN S
IZE
S:\7
0131
GEO
TEC
H\G
INTW
\LIB
RA
RY
MA
CTE
C JU
NE2
011.
GLB
T:\J
IMM
Y\S
IEV
ES N
ATT
ERB
ERG
PLO
TS F
OR
REA
CH
ES\4
953-
10-1
561
MTA
WES
TSID
E SU
BW
AY
EX
TEN
SIO
N.G
PJ 1
0/18
/11
CLAYEY SAND (SC)SANDY LEAN CLAY (CL)
CLAYEY SAND (SC)
HP 12/2/2011
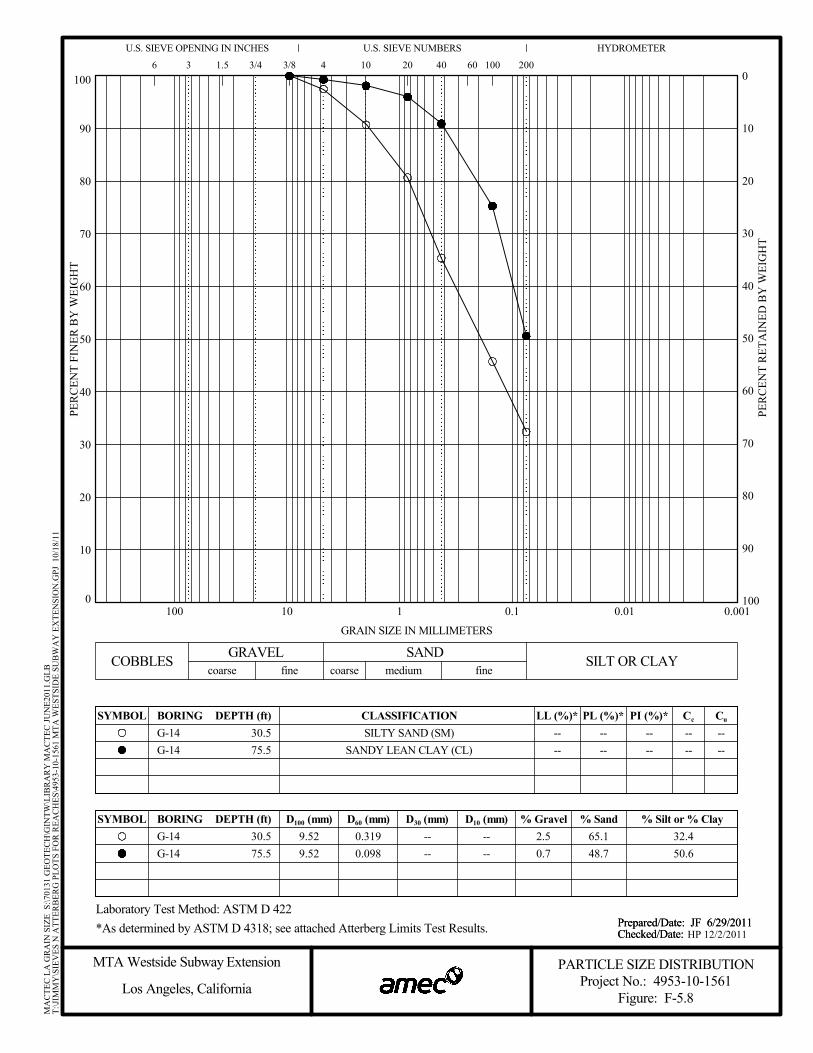
0
10
20
30
40
50
60
70
80
90
100
0.0010.010.1110100
D30 (mm)D60 (mm)D100 (mm)BORINGSYMBOL
PARTICLE SIZE DISTRIBUTION
PI (%)*PL (%)*LL (%)*
G-14G-14
9.529.52
0.3190.098
----
----
2.50.7
65.148.7
% Sand
DEPTH (ft)
DEPTH (ft)
1.5 3/4
Cu
G-14G-14
BORING
PER
CEN
T R
ETA
INED
BY
WEI
GH
T
PER
CEN
T FI
NER
BY
WEI
GH
T0
10
20
30
40
50
60
70
80
90
100
coarse fine coarse medium fineGRAVEL SAND SILT OR CLAY
CLASSIFICATIONSYMBOL
60
% Silt or % Clay% GravelD10 (mm)
Cc
100
HYDROMETER
20040
COBBLES
GRAIN SIZE IN MILLIMETERS
30.575.5
30.575.5
32.450.6
43/8
Laboratory Test Method: ASTM D 422
U.S. SIEVE NUMBERS
----
----
----
----
----
*As determined by ASTM D 4318; see attached Atterberg Limits Test Results.
20
U.S. SIEVE OPENING IN INCHES
6 3 10
Figure: F-5.8
Prepared/Date: JF 6/29/2011Checked/Date:Prepared/Date: JF 6/29/2011Checked/Date:
MTA Westside Subway Extension
Los Angeles, California Project No.: 4953-10-1561
MA
CTE
C L
A G
RA
IN S
IZE
S:\7
0131
GEO
TEC
H\G
INTW
\LIB
RA
RY
MA
CTE
C JU
NE2
011.
GLB
T:\J
IMM
Y\S
IEV
ES N
ATT
ERB
ERG
PLO
TS F
OR
REA
CH
ES\4
953-
10-1
561
MTA
WES
TSID
E SU
BW
AY
EX
TEN
SIO
N.G
PJ 1
0/18
/11
SILTY SAND (SM)SANDY LEAN CLAY (CL)
HP 12/2/2011
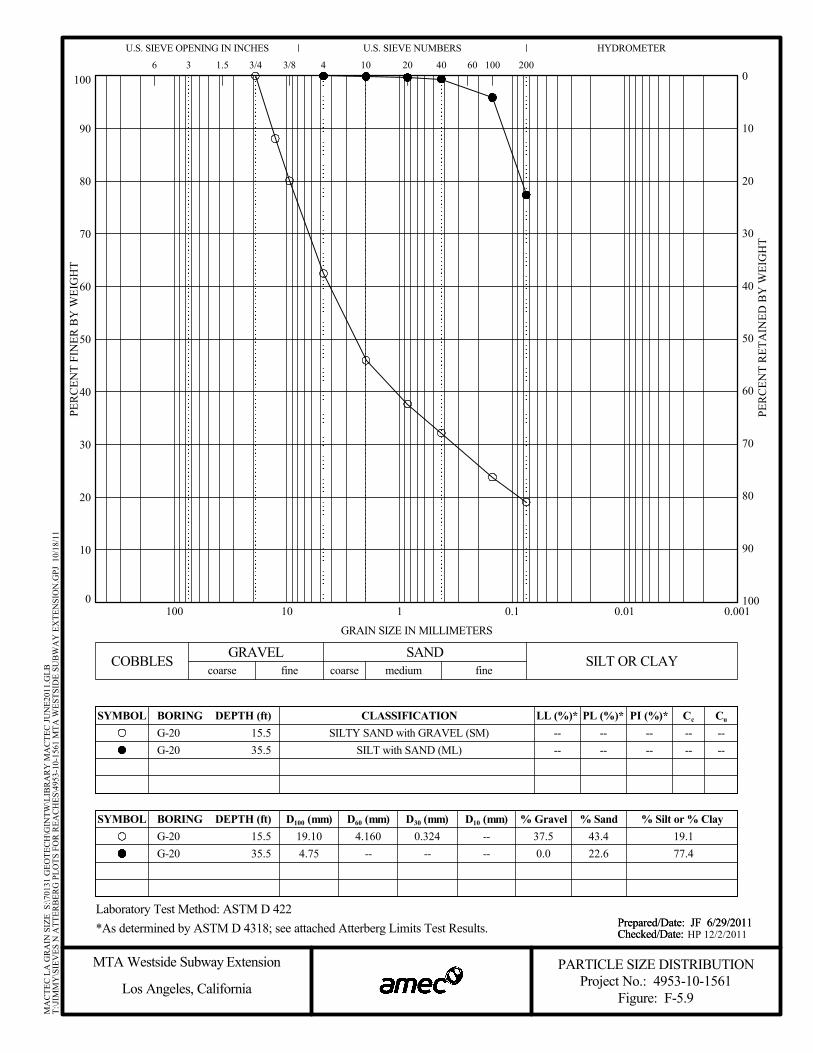
0
10
20
30
40
50
60
70
80
90
100
0.0010.010.1110100
D30 (mm)D60 (mm)D100 (mm)BORINGSYMBOL
PARTICLE SIZE DISTRIBUTION
PI (%)*PL (%)*LL (%)*
G-20G-20
19.104.75
4.160--
0.324--
----
37.50.0
43.422.6
% Sand
DEPTH (ft)
DEPTH (ft)
1.5 3/4
Cu
G-20G-20
BORING
PER
CEN
T R
ETA
INED
BY
WEI
GH
T
PER
CEN
T FI
NER
BY
WEI
GH
T0
10
20
30
40
50
60
70
80
90
100
coarse fine coarse medium fineGRAVEL SAND SILT OR CLAY
CLASSIFICATIONSYMBOL
60
% Silt or % Clay% GravelD10 (mm)
Cc
100
HYDROMETER
20040
COBBLES
GRAIN SIZE IN MILLIMETERS
15.535.5
15.535.5
19.177.4
43/8
Laboratory Test Method: ASTM D 422
U.S. SIEVE NUMBERS
----
----
----
----
----
*As determined by ASTM D 4318; see attached Atterberg Limits Test Results.
20
U.S. SIEVE OPENING IN INCHES
6 3 10
Figure: F-5.9
Prepared/Date: JF 6/29/2011Checked/Date:Prepared/Date: JF 6/29/2011Checked/Date:
MTA Westside Subway Extension
Los Angeles, California Project No.: 4953-10-1561
MA
CTE
C L
A G
RA
IN S
IZE
S:\7
0131
GEO
TEC
H\G
INTW
\LIB
RA
RY
MA
CTE
C JU
NE2
011.
GLB
T:\J
IMM
Y\S
IEV
ES N
ATT
ERB
ERG
PLO
TS F
OR
REA
CH
ES\4
953-
10-1
561
MTA
WES
TSID
E SU
BW
AY
EX
TEN
SIO
N.G
PJ 1
0/18
/11
SILTY SAND with GRAVEL (SM)SILT with SAND (ML)
HP 12/2/2011
Related Documents