Page 1 Martin et al. Hypertension Research (In press). DOI: DOI: 10.1038/hr.2015.36 Text Word Count: 4064 1 Abstract Word Count: 250 2 Reference Word Count: 46 3 Table Count: 4 4 Figure Count: 3 5 Supplemental Figures: 2 6 7 Considerations for SphygmoCor Radial Artery Pulse Wave Analysis: Side Selection and 8 Peripheral Arterial Blood Pressure Calibration 9 10 Martin: Considerations for Pulse Wave Analysis 11 12 Jeffrey S. Martin 1,2 13 Alexandra R. Borges 1 14 John B. Christy IV 3 15 Darren T. Beck 3 16 17 1 Department of Biomedical Sciences, Quinnipiac University, Hamden, CT USA 06518. 18 2 Department of Cell Biology and Physiology, Edward Via College of Osteopathic Medicine- 19 Auburn Campus, Auburn, AL USA 36832 20 2 Department of Kinesiology, University of Rhode Island, Kingston, RI USA 02881 21 22 23 Corresponding Author: 24 Jeffrey S. Martin, Ph.D. 25 Department of Cell Biology and Physiology 26 Edward Via College of Osteopathic Medicine – Auburn Campus 27 910 S. Donahue Dr. 28 Auburn, AL USA 36832 29 Tel: (203) 980-1322 30 Email: [email protected] 31 32 This is a pre-copyedited, author-produced PDF of an article accepted for publication in 33 Hypertension Research, the official journal of the Japanese Society of Hypertension. The 34 version of record (Martin JS, Borges AR, Christy IV and Beck DT. 2015. In press. DOI: 35 10.1038/hr.2015.36) is available online at: 36 http://www.nature.com/hr/journal/vaop/ncurrent/pdf/hr201536a.pdf 37 38 39 40 41 Disclosures/Conflicts of Interest: None 42 Keywords: applanation tonometry, augmentation index, bilateral blood pressure, pulse wave 43 analysis 44

Welcome message from author
This document is posted to help you gain knowledge. Please leave a comment to let me know what you think about it! Share it to your friends and learn new things together.
Transcript

Page 1 Martin et al. Hypertension Research (In press). DOI: DOI: 10.1038/hr.2015.36
Text Word Count: 4064 1
Abstract Word Count: 250 2 Reference Word Count: 46 3
Table Count: 4 4
Figure Count: 3 5 Supplemental Figures: 2 6
7 Considerations for SphygmoCor Radial Artery Pulse Wave Analysis: Side Selection and 8
Peripheral Arterial Blood Pressure Calibration 9 10
Martin: Considerations for Pulse Wave Analysis 11 12
Jeffrey S. Martin1,2 13
Alexandra R. Borges1 14
John B. Christy IV3 15
Darren T. Beck3 16
17 1Department of Biomedical Sciences, Quinnipiac University, Hamden, CT USA 06518. 18
2Department of Cell Biology and Physiology, Edward Via College of Osteopathic Medicine- 19
Auburn Campus, Auburn, AL USA 36832 20 2Department of Kinesiology, University of Rhode Island, Kingston, RI USA 02881 21
22 23
Corresponding Author: 24
Jeffrey S. Martin, Ph.D. 25 Department of Cell Biology and Physiology 26
Edward Via College of Osteopathic Medicine – Auburn Campus 27 910 S. Donahue Dr. 28
Auburn, AL USA 36832 29 Tel: (203) 980-1322 30
Email: [email protected] 31
32
This is a pre-copyedited, author-produced PDF of an article accepted for publication in 33
Hypertension Research, the official journal of the Japanese Society of Hypertension. The 34
version of record (Martin JS, Borges AR, Christy IV and Beck DT. 2015. In press. DOI: 35
10.1038/hr.2015.36) is available online at: 36
http://www.nature.com/hr/journal/vaop/ncurrent/pdf/hr201536a.pdf 37
38
39
40
41
Disclosures/Conflicts of Interest: None 42
Keywords: applanation tonometry, augmentation index, bilateral blood pressure, pulse wave 43
analysis 44

Page 2 Martin et al. Hypertension Research (In press). DOI: DOI: 10.1038/hr.2015.36
ABSTRACT 45
BACKGROUND: Methods employed for pulse wave analysis (PWA) and peripheral blood 46
pressure (PBP) calibration vary. The purpose of this study was to evaluate the agreement of 47
SphygmoCor PWA parameters derived from radial artery tonometry when considering 1) timing 48
(before vs. after tonometry) and side selection (ipsilateral vs. contralateral limb) for PBP 49
calibration and 2) side selection for tonometry (left vs. right arm). METHODS: In 34 subjects 50
(aged 21.9±2.3 years), bilateral radial artery tonometry was performed simultaneously at three 51
instances. PBP assessment via oscillometric sphygmomanometry in the left arm only and both 52
arms simultaneously occurred following the first and second instances of tonometry, 53
respectively. RESULTS: Significant within-arm differences in PWA parameters derived before 54
and after PBP measurement were observed in the right arm only (e.g. aortic systolic blood 55
pressure, Δ = 0.38±0.64 mmHg). Simultaneously captured bilateral PWA variables 56
demonstrated significant between-arm differences in 88% (14/16) and 56% (9/16) of outcome 57
variables when calibrated to within-arm and equivalent PBP, respectively. Moreover, the right 58
arm consistently demonstrated lower values for clinical PWA variables (e.g. Augmentation 59
Index, Bias = -2.79%). However, 26% (n=9) of participants presented with clinically significant 60
differences (>10 mmHg) in bilateral PBP and their exclusion from analysis abolished most 61
between-arm differences observed. CONCLUSIONS: SphygmoCor PWA in the right radial 62
artery results in greater variability independent of the timing of PBP measurement and 63
magnitude of calibration pressures in young subjects. Moreover, bilateral PBP measurement is 64
imperative to identify subjects in whom a significant difference in bilateral PWA outcomes may 65
exist. 66
67

Page 3 Martin et al. Hypertension Research (In press). DOI: DOI: 10.1038/hr.2015.36
INTRODUCTION 68
Several parameters of central arterial blood pressure and wave reflection characteristics 69
have demonstrated value as independent predictors of future cardiovascular morbidity and 70
mortality.1–5 Central blood pressures have also been shown to more strongly relate to vascular 71
disease than peripheral blood pressures.4 However, direct measurement of central aortic 72
pressures is invasive and expensive.6 As a result, methods for non-invasive assessment of central 73
hemodynamic indices have been increasingly employed in clinical and research settings for 74
evaluation and titration of treatments and/or interventions. 75
There are a number of methods currently available for the non-invasive assessment of 76
aortic wave reflection characteristics.7,8 At present, applanation tonometry in which high-fidelity 77
radial artery pressure waveforms are recorded using a ‘pencil’ type micromanometer are most 78
commonly performed,9 likely due in part to the strong validity and reliability of resultant 79
measures reported in the literature.10–12 Notably, the central hemodynamic indices derived from 80
radial artery pulse wave analysis (PWA) are dependent upon calibration to peripheral artery 81
blood pressure (PBP) measured at the brachial artery and based on the assumption that mean 82
blood pressure is constant throughout the arterial tree.13,14 Further, the importance of PBP in 83
PWA measures is emphasized by Shih et al who demonstrated that errors in PWA measurements 84
are equivalent to those associated with brachial cuff sphygmomanometry.15 85
Methods for PBP determination and calibration vary between PWA devices and are not 86
always standardized. In the case of the SphygmoCor system, the operations manual recommends 87
a rest period after brachial artery sphygmomanometry before radial pressure waveform 88
measurement due to supra-systolic pressures followed by a period of cuff deflation which 89
disrupts local and distal blood flow and brachial wave transmission. This would seem to suggest 90

Page 4 Martin et al. Hypertension Research (In press). DOI: DOI: 10.1038/hr.2015.36
that PBP measurement should be performed in the same arm at which PWA will occur. 91
However, to our knowledge, there is no data available that examines the variability in PWA at 92
the radial artery prior to and following PBP assessment at the brachial artery via cuff 93
sphygmomanometry. 94
To circumvent the disruption in arterial blood flow that may occur downstream of cuff 95
sphygmomanometry, calibration could be performed using measurement of PBP in the 96
contralateral limb. However, PBP measurements made at the brachial artery have been shown to 97
vary significantly between arms.16,17 Given the reliance of PWA on PBP calibration, disparities 98
in bilateral PBP could further increase variability in clinical measures derived from PWA 99
depending on the arm selected for calibration. Indeed, calibration is based on the assumption 100
that mean blood pressure is constant throughout the large arteries.14 Moreover, it is unknown if 101
characteristics of the radial pulse pressure wave derived from PWA are also variable between 102
arms of measure, independent of arm selection for calibration. Importantly, validation studies 103
frequently use a single arm and/or exclude persons with unequal brachial pressures.11,12,18,19 As 104
PWA protocols are increasingly employed in clinical and research settings, it is imperative to 105
explore potential differences in bilateral PWA and to standardize evaluation methods for 106
continuity of patient monitoring and comparative value of PWA outcomes. 107
Therefore, the purpose of this study was to 1) evaluate the effect of PBP measurement on 108
subsequent PWA, 2) evaluate the difference in PWA between arms when calibrated to the same 109
PBP (i.e. left brachial artery), and 3) evaluate the difference in PWA between arms when 110
calibrated to within arm PBP in young, apparently healthy people using the SphygmoCor system. 111
METHODS 112
Study participants. 113

Page 5 Martin et al. Hypertension Research (In press). DOI: DOI: 10.1038/hr.2015.36
The study population was recruited via word of mouth from the greater Hamden, CT and 114
Kingston, RI areas with thirty-four subjects (17 male, 17 female; 21.9±2.3 years) enrolled. 115
Apparently healthy, young (aged <30 yrs), non-smokers without previously diagnosed 116
cardiovascular disease were included in this study and all participants maintained normal sinus 117
rhythm throughout the testing procedures. Subjects were asked to report to the laboratory in a 118
post-absorptive state and were instructed to abstain from exercise and the consumption of 119
alcohol and caffeine for at least 12 hours prior to testing. A random number generator was used 120
to create a list of 40, 4 digit codes that were assigned consecutively to each subject. All 121
measurements were made in the Cardiovascular Laboratories at Quinnipiac University and the 122
University of Rhode Island. This study was approved by the Institutional Review Boards at 123
Quinnipiac University and the University of Rhode Island and written informed consent was 124
obtained from all participants. 125
Subject Characteristics. 126
Height and weight were measured using standard techniques. Body fat was assessed via 127
bioelectrical impedance analysis (Omron HBF306C, Omron Corporation, Kyoto, Japan). Heart 128
rate (HR) brachial systolic (PSBP), diastolic (PDBP), and pulse blood pressure (PPP) 129
measurements were made in triplicate at the brachial artery of the right and left arms by 130
oscillometric blood pressure sphygmomanometry using an automated, non-invasive device 131
(Omron BP785, Omron Corporation, Kyoto, Japan). The Omron BP785 (HEM-7222) has been 132
declared as equivalent to the Omron M6 (HEM-7000) which has been previously validated 133
according to the international protocol20 and is required by manufacturing standards to be 134
accurate within 3 mmHg for pressure readings. In our hands, for triplicate measurements at the 135
same site, the overall intra-class correlation coefficient was 0.96 and 0.88 and the typical error 136
Page 6 Martin et al. Hypertension Research (In press). DOI: DOI: 10.1038/hr.2015.36
was 3.27 and 2.54 for PSBP and PDBP, respectively. HR and PBP measurements were made on 137
two occasions in the left arm, and on one occasion in the right arm with the second set of 138
measures in the left arm and thebsingular set of measures in the right arm occurring 139
simultaneously. Two automated oscillometric blood pressure sphygmomanometry devices 140
(Omron BP785) were used throughout the study with the arm measured by each device randomly 141
selected for each subject (i.e. odd/even first digit of subject code). The average of three HR and 142
BP measurements at each timepoint was used for resting values and hypertensive status was 143
determined by the mean of all left arm PBP measurements, unless right arm PBP was found to be 144
significantly higher (> 10 mmHg) than the left in which case the higher, right arm was used.21 145
Pulse wave analysis (PWA). 146
The assessment of arterial wave reflection characteristics was performed non-invasively 147
using identical SphygmoCor CPVH Pulse Wave Velocity systems and Research Version 9.0 148
software (AtCor Medical, Sydney, Australia). The SphygmoCor systems utilize a Medical 149
Electronics Module Model EM3, an AtCor Medical/Millar tipped pressure tonometer (Millar 150
Instruments, Houston, TX, USA) and a validated generalized mathematical transfer function to 151
synthesize a central aortic pressure waveform.13,14 The generalized transfer function has been 152
validated using both intra-arterially and noninvasively obtained radial pressure waves.12 153
Participants rested quietly in a supine position in a temperature controlled room for 15 154
minutes prior to initial radial artery pulse pressure waveform analysis. Consecutive pulse 155
pressure waveform measurements were then performed by two highly trained and experienced 156
technicians (JSM and DTB) simultaneously at the right and left radial artery on 3 occasions 157
interspersed by PBP assessment in the left arm only and in both arms simultaneously 158
(Supplemental Figure 1). Briefly, an initial set of pulse pressure waveform measurements was 159

Page 7 Martin et al. Hypertension Research (In press). DOI: DOI: 10.1038/hr.2015.36
performed (PWA 1), PBP was assessed in the left arm only, a second set of pulse pressure 160
waveform measurements commenced (PWA 2), PBP was assessed simultaneously in the right 161
and left arms, and, finally, a third set of pulse pressure waveform measurements was performed 162
(PWA 3). The arm evaluated for PWA by each of the two investigators was randomly selected 163
for each subject (i.e. odd/even last digit of subject code) and the average of the first three high 164
quality pulse pressure waveform recordings per subject and per tonometer were captured for 165
analysis. Pulse pressure waveforms were calibrated to the ipsilateral and/or contralateral limb 166
PSBP and PDBP as appropriate for the comparisons described below (see statistical analysis). 167
The use of PSBP and PDBP to calibrate radial pressure waveforms omits a possible brachial-to-168
radial pressure amplification and may lead to underestimation of the central pressure.22–25 169
Despite this, PSBP and PDBP were used for radial artery waveform calibration, as recommended 170
by the manufacturer, as automated oscillometric blood pressure monitors are not required to 171
verify and validate mean arterial pressure (MAP),26 available estimation equations will produce 172
calibration errors,27 and the range of error in calibration was found to be less by Shih et al. when 173
utilizing PSBP and PDBP rather than MAP and PDBP.15 174
Optimal recording of the pressure wave was obtained when the hold-down force of the 175
transducer on the artery was such that the resulting waveform had a stable baseline for at least 10 176
cardiac cycles and resulted in a quality index QI of >90% (derived from an algorithm including 177
average pulse height variation, diastolic variation, and maximum rate of rise of the peripheral 178
waveform). This technique has been shown to be highly reproducible28 and, in our hands, 179
reproducibility in young, healthy men has previously been reported with a mean coefficient of 180
variation of 6.5%, 2.1%, 2.4% and 2.4% for aortic augmentation index (AIx), time to reflection 181
of the reflected pressure wave (T1r), central systolic and diastolic blood pressure, respectively.29 182
Page 8 Martin et al. Hypertension Research (In press). DOI: DOI: 10.1038/hr.2015.36
A typical aortic pressure waveform synthesized from radial pulse pressure using 183
applanation tonometry and the generalized transfer function is shown in Supplemental Figure 2. 184
Detailed description of PWA parameters have been described previously.30 185
Statistical Analysis. 186
Analyses included the following: 1) To evaluate the effect of PBP measurement on 187
subsequent PWA, comparisons of dependent variables within arm and calibrated to within arm 188
PBP (left arm: PWA 1 vs. PWA 2; right arm: PWA 2 vs. PWA 3) were performed; 2) To 189
evaluate the difference between arms in PWA, comparisons of dependent variables between 190
arms, calibrated to left arm PBP (PWA1 and PWA2) were performed; 3) To evaluate the effect 191
of calibrating to within arm PBP on between arm differences in PWA, comparisons of dependent 192
variables between arms, calibrated to within arm PBP (PWA3) were performed; 4) To explore 193
the impact of clinically significant differences in bilateral PBP (defined as a difference >10 194
mmHg) on the observed PWA differences between arms, comparisons of dependent variables at 195
PWA2 when calibrated to the same (left arm) PBP were made when subjects were clustered as 196
overall (overall group; n=34), those with (Clinical Difference, n=9) and those without (Normal, 197
n=25) a clinically significant difference in PBP; and 5) To determine the effect of not detecting a 198
clinically significant difference in PBP between arms with PWA, comparisons of left arm PWA2 199
dependent variables in the clinically different group when calibrated to the lower (left arm) and 200
higher (right arm) PBP observed were performed. 201
Nine subjects presented with a clinically significant difference in bilateral PBP with eight 202
demonstrating the higher pressure in the right arm. The subject with clinically significant higher 203
PBP in the left arm was excluded from analyses 4 and 5, described above, to more clearly define 204
the directional error associated with the traditional method of assessing PBP and PWA in only 205

Page 9 Martin et al. Hypertension Research (In press). DOI: DOI: 10.1038/hr.2015.36
the left arm. Inclusion/exclusion of this subject in the analysis did not affect any of the 206
significant outcomes. 207
All values are presented as mean ± SD. Kolmogorov-Smirnov tests were used to confirm 208
normality of the distributions of the variable differences. Comparisons of PWA primary and 209
secondary variables measured in the left and right arms via pencil-type tonometer were analyzed 210
using Student's paired t-tests for within and between arms differences. In the sub-analysis of 211
subjects with and without clinically significant difference in bilateral PBP, Satterwaite corrected 212
two sample t-tests were performed. Linear regression by the method of ordinary least squares 213
was used to define the correlation between tonometer values, with goodness of fit expressed by 214
Pearson's correlation coefficient (r). Further, agreement between the left and right arm 215
measurements were analyzed using Bland-Altman tests for agreement of clinical measurements 216
and defined as being within 10% of the overall mean for the studied variable as the maximal 217
tolerated difference.31 An alpha level of P < 0.05 was required for statistical significance. Based 218
on the reproducibility of augmentation index measured by PWA by Wilkinson et al28, we 219
determined that approximately 30 subjects would be required to give at least an 80% chance of 220
detecting a difference in AIx of 10% at an alpha level of 0.05. All statistical analyses were 221
performed using SPSS version 22.0 for Windows (SPSS, Chicago, IL, USA). 222
RESULTS 223
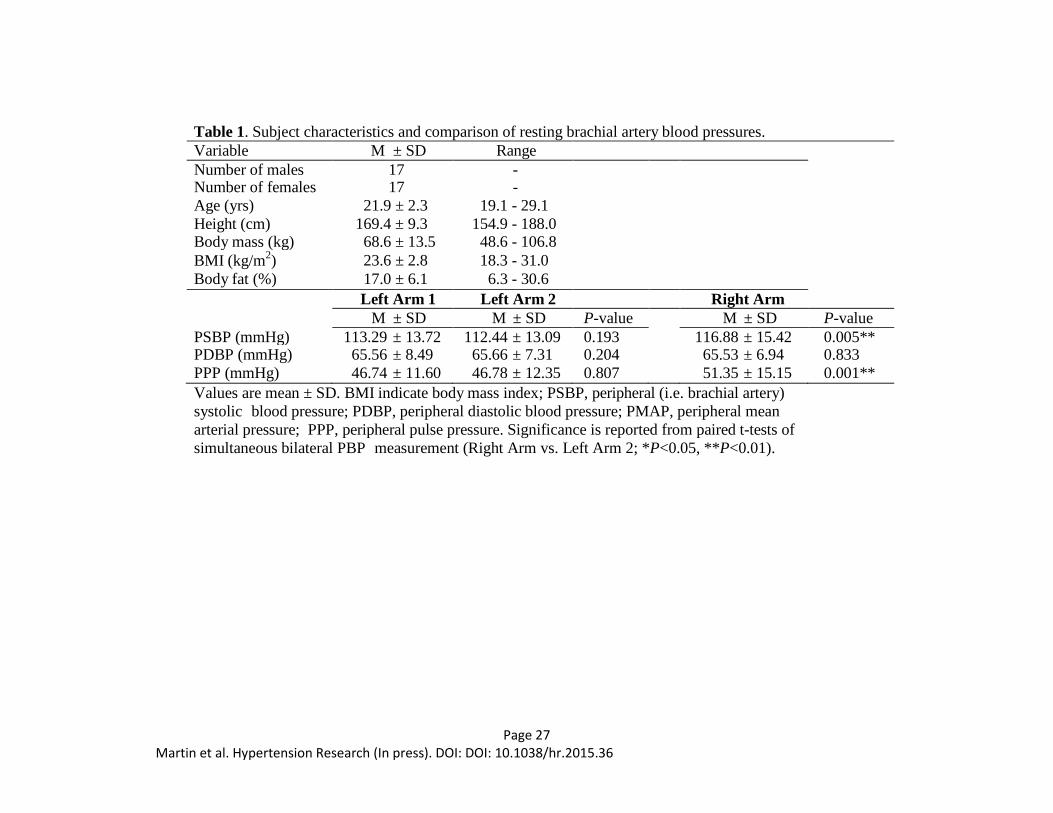
Subject characteristics are presented in Table 1. Study participants (n=34) included 22 224
normotensive, 11 prehypertensive, and 1 stage 1 hypertensive participants. Overall means of 225
PSBP, PDBP, and PMAP were calculated as the average of simultaneous bilateral measurements 226
resulting in PSBP, PDBP and PMAP means of 114.7 ± 13.7 mmHg, 65.6 ± 7.0 mmHg and 81.9 227
± 7.4, respectively. PSBP and PPP were significantly different in the right and left arms when 228

Page 10 Martin et al. Hypertension Research (In press). DOI: DOI: 10.1038/hr.2015.36
simultaneously measured (P<0.01). No significant differences in PBP were found between time 229
points in the left arm. 230
Effect of peripheral blood pressure measurement on subsequent pulse wave analysis 231
variables. 232
Comparisons of the within-arm difference before and after calibration to PBP via cuff 233
sphygmomanometry in PWA parameters are presented in Table 2. There were no significant 234
differences identified within the left arm. However, HR, ASBP, APP, PPA, TTI and AIx@75 235
were significantly different following PBP measurement in the right arm (P<0.05 for HR, PPA 236
and AIx@75; P<0.01 for ASBP, APP and TTI). 237
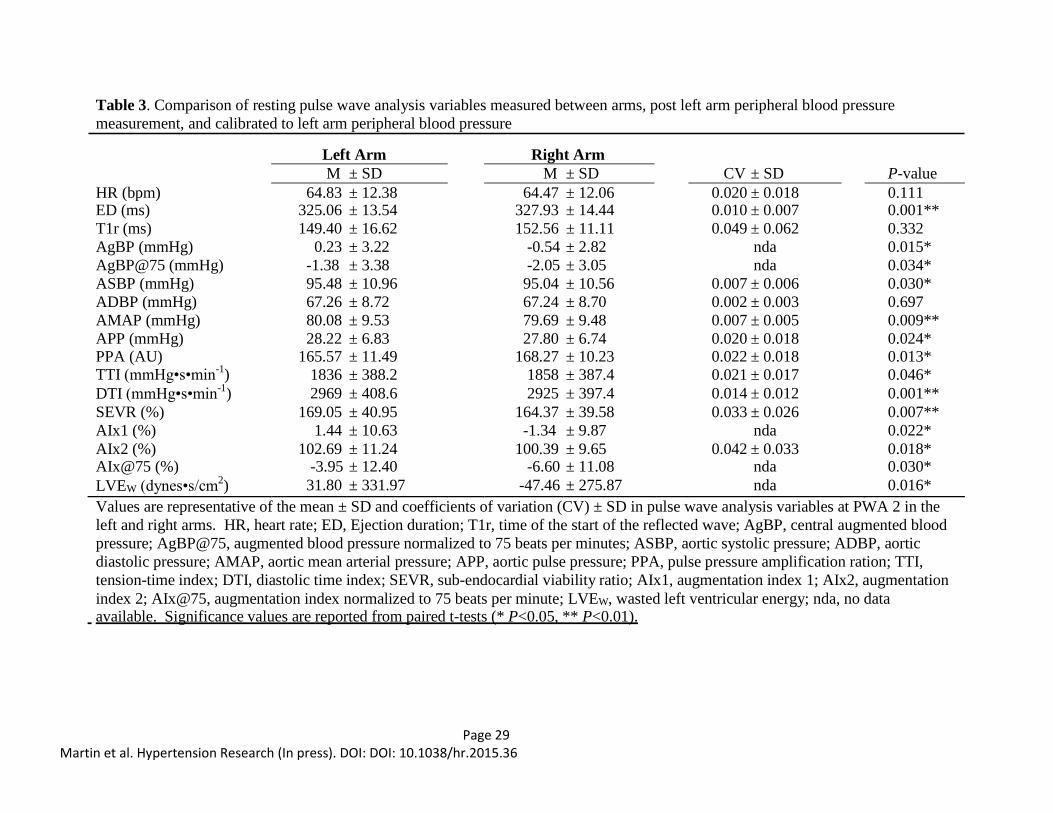
Evaluation of the difference in pulse wave analysis variables between arms. 238
Comparisons of between arms measures derived simultaneously from PWA at the 239
respective radial artery after calibration to the same PBP (i.e. left arm) demonstrated significant 240
differences in ED, AgBP, AgBP@75, ASBP, AMAP, APP, PPA, TTI, DTI, SEVR, AIx1, AIx2, 241
AIx@75 and LVEW (Table 3). The most striking differences between arms were observed in 242
AgBP, AIx1, AIx@75 and LVEW at 0.8 mmHg, 2.8%, 2.7% and 79.26 dynes•s/cm-1, 243
respectively. When comparing simultaneous measurements between arms before calibration to 244
the same PBP, the same parameters were significantly different, with the exceptions of AMP, 245
TTI and SEVR (P=0.298, 0.570 and 0.973, respectively; data not shown). 246
Figures 1 and 2 show Pearson correlations and Bland-Altman tests for agreement of 247
clinical measurements. PWA measurements in the right arm produced a negative bias in SEVR, 248
AgBP, AIx1, AIx2, AIx@75 and LVEW whereas DTI demonstrated a positive bias which was 249
expected given its reciprocal relationship with TTI. In persons that presented with clinically 250
different bilateral PBP, the difference between arms was significantly higher when compared to 251
Page 11 Martin et al. Hypertension Research (In press). DOI: DOI: 10.1038/hr.2015.36
‘normal’ subjects for AgBP, AgBP@75, TTI, DTI, SVI, AIx1, AIx2, AIx@75 and LVEW despite 252
being calibrated to the same PBP. Moreover, in all cases except for DTI, the significant 253
difference between arms in simultaneous PWA measurements was abolished when considering 254
only the ‘normal’ subjects (Figure 3). 255
Effect of calibration to within arm peripheral blood pressure on differences in between 256
arm pulse wave analysis variables. 257
Between arms measures derived simultaneously from PWA at the respective radial artery 258
after calibration to within arm PBP are shown in Table 4. Simultaneous measurements 259
calibrated to within arm PBP no longer demonstrated statistical differences in ASBP, AMAP, 260
TTI, DTI, and SEVR. Although the difference in ASBP increased (-0.4 vs. +1.96; PWA2 vs. 261
PWA3) when calibrated to within arm PBP, it only approached statistical significance (P=0.065). 262
Differences in ASBP, ED, AgBP, AgBP@75, APP, PPA, AIx1, AIx2, AIx@75 and LVEW 263
between arms were still found to vary significantly between sides. 264
Effect of not detecting a clinically significant difference in bilateral peripheral blood 265
pressure measurement on pulse wave analysis variables. 266
Correcting for the higher PBP (re-calibration) with the same radial artery pulse pressure 267
waveform measurements in the clinically different group resulted in significant increases in TTI 268
(182.5 ± 73.4, P<0.01), DTI (246.0 ± 149.5, P<0.01), CSP (10.8 ± 3.5, P<0.01), CDP (4.1 ± 4.3, 269
P<0.05), CPP (6.7 ± 4.6, P<0.01) and CMP (7.1 ± 3.3, P<0.01). 270
DISCUSSION 271
The present study sought to evaluate the agreement in variables derived from bilateral 272
radial artery PWA and the effects of timing and side selection for PBP measurement using the 273
SphygmoCor system. The principle findings are that, in young subjects 1) there was no 274

Page 12 Martin et al. Hypertension Research (In press). DOI: DOI: 10.1038/hr.2015.36
significant effect of PBP measurement on repeated PWA in the left arm; 2) there is a significant 275
difference in simultaneously captured bilateral PWA in which the right arm variables associated 276
with wave reflection characteristics are lower; and 3) a significant portion of the negative bias in 277
the right arm was associated with subjects who presented with clinically significant differences 278
in PBP. 279
It has been suggested that peripheral vasodilation caused by arterial obstruction alters 280
brachial wave transmission,32 and this may need to be considered in the assessment of PBP prior 281
to PWA. Indeed, the SphygmoCor operator’s manual suggests that a period of at least two 282
minutes elapse following cuff sphygmomanometry before radial pressure waveform recordings. 283
However, to our knowledge, no data are available that documents the magnitude or time course 284
of the effect(s) of PBP assessment via cuff sphygmomanometer on indices derived from PWA. 285
Here we employed radial artery PWA before and two minutes after PBP measurement in the left 286
arm and found no significant effect of standard brachial artery sphygmomanometry on any 287
variables (P>0.10 for all dependent variables). Interestingly, significant differences were 288
observed in ASBP, APP, PPA, TTI and AIx@75 measurements prior to and following PBP 289
assessment in the right arm (Table 2). Although the absolute difference between measurements 290
is modest, it does suggest greater variability in the right arm with consecutive PWA 291
measurements surrounding PBP assessment may exist. Indeed, greater variability in right arm 292
PBP has been reported previously33 and may extend to differences in radial pressure waveforms. 293
Several investigations have reported differences in PBP between arms with 294
approximately 20% exhibiting clinically significant bilateral differences (defined as a >10 295
mmHg difference).17,34 In the present study, we observed a significant difference in PSBP and 296
PPP between arms (Table 1) and nine subjects (26.5%) presented with clinically significant 297

Page 13 Martin et al. Hypertension Research (In press). DOI: DOI: 10.1038/hr.2015.36
differences between arms. Current recommendations for the assessment of PBP include 298
measurement in both arms at first examination,21,35,36 and when a consistent inter-arm difference 299
is observed that the higher pressure should be used to determine hypertensive status.21 Strict 300
adherence to these guidelines is not routinely reported in PWA studies and clinical adherence is 301
sub-optimal.37 Frequently, PWA and PBP are measured in the same arm (e.g. left arm), and may 302
not detect a difference in bilateral PBP. Of the 9 subjects in our study that presented with 303
clinically significant differences in PBP, comparative analysis of the effect of calibration to each 304
limb for the same radial artery PWA measurements demonstrated markedly lower values for 305
clinically relevant variables, TTI (10%), DTI (8%), ASBP (11%), ADBP (6%), APP (24%), and 306
AMAP (9%), when calibrated to the lower pressure. Given the clinical implications of these 307
markers, this discrepancy cannot be ignored. For example, it has been reported that there is a 7 308
and 15% increase in cardiovascular risk for every 10 mmHg increase in ASBP and APP, 309
respectively.38 Importantly, 8 of 9 participants exhibited significantly higher PBP in the right 310
arm. 311
Comparisons of simultaneous bilateral PWA parameters revealed significant differences 312
between sides whether calibrated to the ipsilateral or contralateral limb. Nearly all (HR, T1r and 313
ADBP being the exceptions) PWA variables were significantly different between arms when 314
measured simultaneously and calibrated to the same (left arm) PBP with the right arm 315
consistently indicating lesser results of wave reflection and central pressure augmentation (Table 316
3). Moreover, independent of PBP calibration, ED and PPA were consistently higher in the right 317
arm while AgBP, AgBP@75, AIx1, AIx2, AIx@75 and LVEW were consistently lower in the 318
right arm at all timepoints (Table 4). To further explore these differences, Pearson correlations 319
and Bland-Altman agreement analyses were evaluated to demonstrate the bias between arms. 320

Page 14 Martin et al. Hypertension Research (In press). DOI: DOI: 10.1038/hr.2015.36
Selected variables presented in Figures 1 and 2 illustrate the negative bias in parameters of wave 321
reflection and central pressure augmentation. Despite modest bias in measures known to have a 322
considerable variability (TTI, DTI and SEVR; Figure 2),39 underestimation in clinical 323
populations (e.g. coronary artery disease) is less than desirable. The present study included 324
young, apparently healthy male and female participants representing a relatively homogenous 325
population. Therefore, further studies should be conducted to evaluate the bilateral PWA 326
relationship in aged and clinical populations as age associated increases in vascular resistance 327
and/or asymmetrical vascular disease may contribute to disparities in PWA characteristics.17,40 328
Nevertheless, as can be appreciated from Figure 1, there was a moderate negative bias associated 329
with central pressure augmentation (i.e. AgBP, AIx1) and resultant LVEW, an index of 330
myocardial oxygen demand and LV work.41 In our study, six (18%) of the participants 331
demonstrated absolute differences of greater than 10% for AIx and, on average, the bias for AIx 332
was 3% lower in the right arm. The clinical significance of the observed difference is 333
demonstrated by reports that the relative risk of LV hypertrophy, and independent predictor of 334
cardiovascular events,42 has been reported as 1.99 for each 10% increase in AIx.43 335
Upon review of our data, we hypothesized that the bias in bilateral PWA assessment may 336
be driven by those that presented with clinically significant differences in bilateral PBP. 337
Identification of those subjects on the Pearson correlation and Bland-Altman agreement analyses 338
plots (represented by closed circles, Figures 1 and 2) demonstrated a clear pattern of greater 339
variability in those subjects. When grouped separately, the difference in bilateral PWA measures 340
is amplified in those with a clinically significant difference in bilateral PBP and abolished in 341
those without for all variables except DTI (Figure 3). 342
Limitations 343

Page 15 Martin et al. Hypertension Research (In press). DOI: DOI: 10.1038/hr.2015.36
The prevalence of clinically significant differences in bilateral blood pressure among 344
young, apparently healthy, non-obese subjects in the present study was unexpected. Although 345
inter-arm differences in PBP can suggest underlying pathophysiology (e.g. vascular disease), 346
Grossman et al. recently reported a prevalence of 13% and 9% for inter-arm systolic and 347
diastolic blood pressures, respectively, in a large cohort of young, healthy subjects.44 348
Importantly, the prevalence was not related to age, body mass index or heart rate. In addition, 349
the automated oscillometric blood pressure devices employed in the present study feature a 350
calibration check system which runs immediately prior to each measurement, were used within 3 351
months of initial manufacturer calibration, and are similar to those commonly used in clinical 352
and research settings. Ideally, aortic pressure waveforms should be measured directly via arterial 353
angiography as a gold standard for reference. However, the purpose of the present study was to 354
evaluate bilateral differences in variables derived from unilateral radial artery PWA methods that 355
have previously been validated invasively. Regardless, further studies should be conducted to 356
further explore the differences in bilateral PWA in a larger, more heterogeneous population (e.g. 357
disease, aging, etc.) as considerable variability in wave reflection characteristics can be attributed 358
to age and gender.45,46 In the present study, we did not observe significant gender differences in 359
the bilateral PWA discrepancies, but our study was not sufficiently powered to appropriately 360
evaluate this point and should be further characterized. Finally, we used the SphygmoCor 361
system and the findings may not be applicable to different devices and transfer functions. 362
Although methods should be optimized for each PWA system, consideration of the findings 363
herein and inter-system variability should be given for evaluation and titration of treatments 364
and/or interventions. 365
Conclusions 366

Page 16 Martin et al. Hypertension Research (In press). DOI: DOI: 10.1038/hr.2015.36
With respect to the aforementioned variability in bilateral radial artery PWA measures 367
using the SphygmoCor system and the prevalence of clinically different PBP, standard 368
recommendations for PWA are needed for longitudinal clinical monitoring and research 369
comparisons. Here we present novel evidence that SphygmoCor PWA in the right radial artery 370
results in significantly more variability than the left radial artery independent of the order of 371
PWA and PBP measurement and calibration pressures. Moreover, our data suggest that bilateral 372
PBP should be evaluated prior to tonometry measurements and PWA in order to identify subjects 373
in whom 1) there may be a significant difference in bilateral PWA outcomes and 2) markedly 374
different reports of aortic blood pressure estimates would be generated depending on the limb 375
selected for PBP calibration if a clinically significant difference in PBP exists. Therefore, when 376
possible, we suggest simultaneous assessment of PBP prior to radial artery tonometry and that 377
the left arm be utilized for SphygmoCor tonometry measurements. Moreover, when a clinically 378
significant difference in bilateral PBP is observed several things should be considered, including, 379
but not limited to, exclusion from research studies or bilateral assessment of PWA with careful 380
analytical consideration of treatment effects. As our findings highlight, future studies should 381
invasively determine the most accurate method for assessing radial artery PWA in these persons. 382
In the interim, when non-invasive estimates of central pressure are primary outcomes of interest 383
in persons with a clinically significant difference in bilateral PBP, the higher PBP observed 384
should be used for calibration as this is more consistent with guidelines for determination of 385
hypertensive status using brachial artery PBP.21 386
387
388
389

Page 17 Martin et al. Hypertension Research (In press). DOI: DOI: 10.1038/hr.2015.36
REFERENCES 390
1 Agabiti-Rosei E, Mancia G, O’Rourke MF, Roman MJ, Safar ME, Smulyan H, Wang J-G, 391
Wilkinson IB, Williams B, Vlachopoulos C. Central blood pressure measurements and 392
antihypertensive therapy: a consensus document. Hypertension 2007; 50: 154–160. 393
doi:10.1161/HYPERTENSIONAHA.107.090068 394
2 Nichols WW, Singh BM. Augmentation index as a measure of peripheral vascular disease 395
state. Curr Opin Cardiol 2002; 17: 543–551. 396
3 Sabovic M, Safar ME, Blacher J. Is there any additional prognostic value of central blood 397
pressure wave forms beyond peripheral blood pressure? Curr Pharm Des 2009; 15: 254–266. 398
4 Vlachopoulos C, Aznaouridis K, O’Rourke MF, Safar ME, Baou K, Stefanadis C. Prediction 399
of cardiovascular events and all-cause mortality with central haemodynamics: a systematic 400
review and meta-analysis. Eur Heart J 2010; 31: 1865–1871. doi:10.1093/eurheartj/ehq024 401
5 Otsuka T, Munakata R, Kato K, Kodani E, Ibuki C, Kusama Y, Seino Y, Kawada T. 402
Oscillometric measurement of brachial artery cross-sectional area and its relationship with 403
cardiovascular risk factors and arterial stiffness in a middle-aged male population. Hypertens 404
Res 2013; 36: 910–915. doi:10.1038/hr.2013.56 405
6 Beck DT, Martin JS, Nichols WW, Gurovich AN, Braith RW. Validity of a Novel Wristband 406
Tonometer for Measuring Central Hemodynamics and Augmentation Index. Am J Hypertens 407
(e-pub ahead of print 21 February 2014; doi:10.1093/ajh/hpt300). 408
7 Jatoi NA, Mahmud A, Bennett K, Feely J. Assessment of arterial stiffness in hypertension: 409
comparison of oscillometric (Arteriograph), piezoelectronic (Complior) and tonometric 410
(SphygmoCor) techniques. J Hypertens 2009; 27: 2186–2191. 411
doi:10.1097/HJH.0b013e32833057e8 412

Page 18 Martin et al. Hypertension Research (In press). DOI: DOI: 10.1038/hr.2015.36
8 Wassertheurer S, Kropf J, Weber T, van der Giet M, Baulmann J, Ammer M, Hametner B, 413
Mayer CC, Eber B, Magometschnigg D. A new oscillometric method for pulse wave 414
analysis: comparison with a common tonometric method. J Hum Hypertens 2010; 24: 498–415
504. doi:10.1038/jhh.2010.27 416
9 Narayan O, Casan J, Szarski M, Dart AM, Meredith IT, Cameron JD. Estimation of central 417
aortic blood pressure: a systematic meta-analysis of available techniques. J Hypertens 2014; 418
32: 1727–1740. doi:10.1097/HJH.0000000000000249 419
10 O’Rourke MF, Pauca A, Jiang XJ. Pulse wave analysis. Br J Clin Pharmacol 2001; 51: 507–420
522. 421
11 Chen CH, Nevo E, Fetics B, Pak PH, Yin FC, Maughan WL, Kass DA. Estimation of central 422
aortic pressure waveform by mathematical transformation of radial tonometry pressure. 423
Validation of generalized transfer function. Circulation 1997; 95: 1827–1836. 424
12 Pauca AL, O’Rourke MF, Kon ND. Prospective Evaluation of a Method for Estimating 425
Ascending Aortic Pressure From the Radial Artery Pressure Waveform. Hypertension 2001; 426
38: 932–937. doi:10.1161/hy1001.096106 427
13 Sharman JE, Lim R, Qasem AM, Coombes JS, Burgess MI, Franco J, Garrahy P, Wilkinson 428
IB, Marwick TH. Validation of a generalized transfer function to noninvasively derive 429
central blood pressure during exercise. Hypertension 2006; 47: 1203–1208. 430
doi:10.1161/01.HYP.0000223013.60612.72 431
14 Nichols W, O’Rourke M, Vlachopoulos C. McDonald’s Blood Flow in Arteries, Sixth 432
Edition: Theoretical, Experimental and Clinical Principles. CRC Press 433
Page 19 Martin et al. Hypertension Research (In press). DOI: DOI: 10.1038/hr.2015.36
15 Shih Y-T, Cheng H-M, Sung S-H, Hu W-C, Chen C-H. Quantification of the calibration 434
error in the transfer function-derived central aortic blood pressures. Am J Hypertens 2011; 435
24: 1312–1317. doi:10.1038/ajh.2011.146 436
16 Singer AJ, Hollander JE. Blood pressure. Assessment of interarm differences. Arch Intern 437
Med 1996; 156: 2005–2008. 438
17 Lane D, Beevers M, Barnes N, Bourne J, John A, Malins S, Beevers DG. Inter-arm 439
differences in blood pressure: when are they clinically significant? J Hypertens 2002; 20: 440
1089–1095. 441
18 Pauca AL, Wallenhaupt SL, Kon ND, Tucker WY. DOes radial artery pressure accurately 442
reflect aortic pressure? CHEST J 1992; 102: 1193–1198. doi:10.1378/chest.102.4.1193 443
19 Sato T, Nishinaga M, Kawamoto A, Ozawa T, Takatsuji H. Accuracy of a continuous blood 444
pressure monitor based on arterial tonometry. Hypertension 1993; 21: 866–874. 445
doi:10.1161/01.HYP.21.6.866 446
20 Belghazi J, El Feghali RN, Moussalem T, Rejdych M, Asmar RG. Validation of four 447
automatic devices for self-measurement of blood pressure according to the International 448
Protocol of the European Society of Hypertension. Vasc Health Risk Manag 2007; 3: 389–449
400. 450
21 Pickering TG, Hall JE, Appel LJ, Falkner BE, Graves J, Hill MN, Jones DW, Kurtz T, Sheps 451
SG, Roccella EJ. Recommendations for Blood Pressure Measurement in Humans and 452
Experimental Animals Part 1: Blood Pressure Measurement in Humans: A Statement for 453
Professionals From the Subcommittee of Professional and Public Education of the American 454
Heart Association Council on High Blood Pressure Research. Circulation 2005; 111: 697–455
716. doi:10.1161/01.CIR.0000154900.76284.F6 456
Page 20 Martin et al. Hypertension Research (In press). DOI: DOI: 10.1038/hr.2015.36
22 Verbeke F, Segers P, Heireman S, Vanholder R, Verdonck P, Bortel LMV. Noninvasive 457
Assessment of Local Pulse Pressure Importance of Brachial-to-Radial Pressure 458
Amplification. Hypertension 2005; 46: 244–248. doi:10.1161/01.HYP.0000166723.07809.7e 459
23 Bazaral MG, Welch M, Golding LA, Badhwar K. Comparison of brachial and radial arterial 460
pressure monitoring in patients undergoing coronary artery bypass surgery. Anesthesiology 461
1990; 73: 38–45. 462
24 Mahieu D, Kips J, Rietzschel ER, De Buyzere ML, Verbeke F, Gillebert TC, De Backer GG, 463
De Bacquer D, Verdonck P, Van Bortel LM, Segers P. Noninvasive assessment of central 464
and peripheral arterial pressure (waveforms): implications of calibration methods: J 465
Hypertens 2010; 28: 300–305. doi:10.1097/HJH.0b013e3283340a1a 466
25 Picone D, Climie R, Keske M, Sharman J. Non-invasive estimation of exercise central blood 467
pressure by radial tonometry may be underestimated due to brachial-to-radial-systolic-blood-468
pressure-amplification and is related to upper limb blood flow velocity. Artery Res 2014; 8: 469
124–125. doi:10.1016/j.artres.2014.09.062 470
26 White WB, Berson AS, Robbins C, Jamieson MJ, Prisant LM, Roccella E, Sheps SG. 471
National standard for measurement of resting and ambulatory blood pressures with 472
automated sphygmomanometers. Hypertension 1993; 21: 504–509. 473
doi:10.1161/01.HYP.21.4.504 474
27 Smulyan H, Safar ME. Blood Pressure Measurement: Retrospective and Prospective Views. 475
Am J Hypertens 2011; 24: 628–634. doi:10.1038/ajh.2011.22 476
28 Wilkinson IB, Fuchs SA, Jansen IM, Spratt JC, Murray GD, Cockcroft JR, Webb DJ. 477
Reproducibility of pulse wave velocity and augmentation index measured by pulse wave 478
analysis. J Hypertens 1998; 16: 2079–2084. 479

Page 21 Martin et al. Hypertension Research (In press). DOI: DOI: 10.1038/hr.2015.36
29 Martin JS, Casey DP, Gurovich AN, Beck DT, Braith RW. Association of age with timing 480
and amplitude of reflected pressure waves during exercise in men. Am J Hypertens 2011; 24: 481
415–420. doi:10.1038/ajh.2010.261 482
30 Martin JS, Beck DT, Gurovich AN, Braith RW. The acute effects of smokeless tobacco on 483
central aortic blood pressure and wave reflection characteristics. Exp Biol Med Maywood NJ 484
2010; 235: 1263–1268. doi:10.1258/ebm.2010.009376 485
31 Martin Bland J, Altman D. Statisical Methods for Assessing Agreement between Two 486
Methods of Clinical Measurement. The Lancet 1986; 327: 307–310. doi:10.1016/S0140-487
6736(86)90837-8 488
32 Shimizu M. Blood Flow in a Brachial Artery Compressed Externally by a Pneumatic Cuff. J 489
Biomech Eng 1992; 114: 78–83. doi:10.1115/1.2895453 490
33 Pesola GR, Pesola HR, Lin M, Nelson MJ, Westfal RE. The Normal Difference in Bilateral 491
Indirect Blood Pressure Recordings in Hypertensive Individuals. Acad Emerg Med 2002; 9: 492
342–345. doi:10.1197/aemj.9.4.342 493
34 Clark CE, Campbell JL, Evans PH, Millward A. Prevalence and clinical implications of the 494
inter-arm blood pressure difference: A systematic review. J Hum Hypertens 2006; 20: 923–495
931. doi:10.1038/sj.jhh.1002093 496
35 Williams B, Poulter NR, Brown MJ, Davis M, McInnes GT, Potter JF, Sever PS, McG Thom 497
S, British Hypertension Society. Guidelines for management of hypertension: report of the 498
fourth working party of the British Hypertension Society, 2004-BHS IV. J Hum Hypertens 499
2004; 18: 139–185. doi:10.1038/sj.jhh.1001683 500
36 Chobanian AV, Bakris GL, Black HR, Cushman WC, Green LA, Izzo JL Jr, Jones DW, 501
Materson BJ, Oparil S, Wright JT Jr, Roccella EJ, National Heart, Lung, and Blood Institute 502

Page 22 Martin et al. Hypertension Research (In press). DOI: DOI: 10.1038/hr.2015.36
Joint National Committee on Prevention, Detection, Evaluation, and Treatment of High 503
Blood Pressure, National High Blood Pressure Education Program Coordinating Committee. 504
The Seventh Report of the Joint National Committee on Prevention, Detection, Evaluation, 505
and Treatment of High Blood Pressure: the JNC 7 report. JAMA J Am Med Assoc 2003; 289: 506
2560–2572. doi:10.1001/jama.289.19.2560 507
37 Wingfield D, Pierce M, Feher M. Blood pressure measurement in the community: do 508
guidelines help? J Hum Hypertens 1996; 10: 805–809. 509
38 Roman MJ, Devereux RB, Kizer JR, Lee ET, Galloway JM, Ali T, Umans JG, Howard BV. 510
Central pressure more strongly relates to vascular disease and outcome than does brachial 511
pressure: the Strong Heart Study. Hypertension 2007; 50: 197–203. 512
doi:10.1161/HYPERTENSIONAHA.107.089078 513
39 Baller DD, Bretschneider HJ, Hellige G. A critical look at currently used indirect indices of 514
myocardial oxygen consumption. Basic Res Cardiol 1981; 76: 163–181. 515
doi:10.1007/BF01907955 516
40 HARRISON EG Jr, ROTH GM, HINES EA Jr. Bilateral indirect and direct arterial 517
pressures. Circulation 1960; 22: 419–436. 518
41 Hashimoto J, Nichols WW, O’Rourke MF, Imai Y. Association between wasted pressure 519
effort and left ventricular hypertrophy in hypertension: influence of arterial wave reflection. 520
Am J Hypertens 2008; 21: 329–333. doi:10.1038/ajh.2007.49 521
42 Brown DW, Giles WH, Croft JB. Left ventricular hypertrophy as a predictor of coronary 522
heart disease mortality and the effect of hypertension. Am Heart J 2000; 140: 848–856. 523
doi:10.1067/mhj.2000.111112 524

Page 23 Martin et al. Hypertension Research (In press). DOI: DOI: 10.1038/hr.2015.36
43 Hashimoto J, Watabe D, Hatanaka R, Hanasawa T, Metoki H, Asayama K, Ohkubo T, 525
Totsune K, Imai Y. Enhanced radial late systolic pressure augmentation in hypertensive 526
patients with left ventricular hypertrophy. Am J Hypertens 2006; 19: 27–32. 527
doi:10.1016/j.amjhyper.2005.06.017 528
44 Grossman A, Prokupetz A, Gordon B, Morag-Koren N, Grossman E. Inter-Arm Blood 529
Pressure Differences in Young, Healthy Patients. J Clin Hypertens 2013; 15: 575–578. 530
doi:10.1111/jch.12125 531
45 Ring M, Eriksson MJ, Zierath JR, Caidahl K. Arterial stiffness estimation in healthy 532
subjects: a validation of oscillometric (Arteriograph) and tonometric (SphygmoCor) 533
techniques. Hypertens Res 2014; 37: 999–1007. doi:10.1038/hr.2014.115 534
46 Doonan RJ, Mutter A, Egiziano G, Gomez Y-H, Daskalopoulou SS. Differences in arterial 535
stiffness at rest and after acute exercise between young men and women. Hypertens Res 536
2013; 36: 226–231. doi:10.1038/hr.2012.158 537
538
539
540
541
542
543
544
545
546
547
Page 24 Martin et al. Hypertension Research (In press). DOI: DOI: 10.1038/hr.2015.36
FIGURE LEGENDS 548
549
Figure 1. Correlation coefficients and Bland-Altman plots for right and left arm measurement 550
agreement in PWA derived measures of central augmented blood pressure (AgBP), the central 551
augmentation index (AIx1), and wasted left ventricular energy (LVEw) at PWA 2. Closed circles 552
represent subjects who presented with a clinically significant difference in bilateral peripheral 553
blood pressure (n=9), whereas open circles represent those without a clinically significant 554
difference in peripheral blood pressure (n=25). 555
556
Figure 2. Correlation coefficients and Bland-Altman plots for right and left arm measurement 557
agreement in PWA derived measures of the tension-time index (TTI), diastolic-time index (DTI) 558
and sub-endocardial viability ration (SEVR) at PWA 2. Closed circles represent subjects who 559
presented with a clinically significant difference in bilateral peripheral blood pressure (n=9), 560
whereas open circles represent those without a clinically significant difference in peripheral 561
blood pressure (n=25). 562
563
Figure 3. Between arm differences (right arm - left arm) in PWA derived characteristics of 564
central arterial blood pressure and wave reflection characteristics at PWA2. TTI, tension-time 565
index; DTI, diastolic time index; SEVR, sub-endocardial viability ratio; AgBP, central 566
augmented blood pressure AIx1, augmentation index 1, LVEW, wasted left ventricular energy. 567
Data are mean ± SD. Paired t-tests were performed to determine significant differences between 568
arms and Satterthwaite corrected two sample t-tests were performed to determine differences 569
between groups. Clinically different bilateral blood pressure was defined as > 10mmHg. 570

Page 25 Martin et al. Hypertension Research (In press). DOI: DOI: 10.1038/hr.2015.36
*Significantly different between arms (P<0.05), †significantly different between groups 571
(P<0.05). 572

Page 27 Martin et al. Hypertension Research (In press). DOI: DOI: 10.1038/hr.2015.36
SUPPLEMENTAL FIGURE LEGENDS
Supplemental Figure 1. Timeline for measurement of radial artery pulse pressure waveforms
(PWA) and brachial artery blood pressure (PBP)
Supplemental Figure 2. A typical central aortic pressure waveform synthesized from the radial
artery pressure waveform using applanation tonometry. The dotted line is representative of the
theoretical aortic pressure waveform independent of wave reflection. Augmentation index (AIX),
expressed as a percentage, is the ratio of augmented pressure (ASBP – Pi) and central aortic
pulse pressure (ASBP – ADBP). Wasted left ventricular pressure energy (LVEW) is defined as
the portion of area under the pulse pressure curve attributed to amplitude and duration of wave
reflection where, even though there is an increased systolic pressure, blood flow through the
aorta decreases. LVEW, expressed in dynes·sec/cm2, is directly related to augmented pressure
(AP; calculated as ASBP – Pi) and to the time duration of the reflected aortic pressure wave, ∆tr.
ASBP = central aortic systolic blood pressure; Pi = pressure at the first inflection point marking
the onset of reflected aortic pressure wave return from the periphery; ADBP = central aortic
diastolic blood pressure; ∆tp = time to arrival of the reflected pressure wave; ∆tr = systolic
duration of the reflected aortic pressure wave; ED = ejection duration; ESP = end systolic
pressure.
Page 27 Martin et al. Hypertension Research (In press). DOI: DOI: 10.1038/hr.2015.36
Table 1. Subject characteristics and comparison of resting brachial artery blood pressures.
Variable M ± SD Range
Number of males 17 - Number of females 17 -
Age (yrs) 21.9 ± 2.3 19.1 - 29.1
Height (cm) 169.4 ± 9.3 154.9 - 188.0 Body mass (kg) 68.6 ± 13.5 48.6 - 106.8
BMI (kg/m2) 23.6 ± 2.8 18.3 - 31.0
Body fat (%) 17.0 ± 6.1 6.3 - 30.6
Left Arm 1 Left Arm 2 Right Arm
M ± SD M ± SD P-value M ± SD P-value
PSBP (mmHg) 113.29 ± 13.72 112.44 ± 13.09 0.193 116.88 ± 15.42 0.005** PDBP (mmHg) 65.56 ± 8.49 65.66 ± 7.31 0.204 65.53 ± 6.94 0.833
PPP (mmHg) 46.74 ± 11.60 46.78 ± 12.35 0.807 51.35 ± 15.15 0.001**
Values are mean ± SD. BMI indicate body mass index; PSBP, peripheral (i.e. brachial artery)
systolic blood pressure; PDBP, peripheral diastolic blood pressure; PMAP, peripheral mean
arterial pressure; PPP, peripheral pulse pressure. Significance is reported from paired t-tests of
simultaneous bilateral PBP measurement (Right Arm vs. Left Arm 2; *P<0.05, **P<0.01).

Page 28 Martin et al. Hypertension Research (In press). DOI: DOI: 10.1038/hr.2015.36
Table 2. Within arm differences in resting pulse wave analysis variables measured pre and post peripheral blood pressure
measurement and calibrated to within arm blood pressure.
Left Arm (PWA 2 – PWA 1) Right Arm (PWA 3 – PWA 2)
M ± SD CV ± SD P-value M ± SD CV ± SD P-value
HR (bpm) 0.74 ± 2.72 0.023 ± 0.022 0.121 1.39 ± 3.18 0.030 ± 0.022 0.016* ED (ms) -1.45 ± 7.27 0.010 ± 0.012 0.255 -0.15 ± 8.30 0.012 ± 0.014 0.918
T1r (ms) 2.63 ± 8.89 0.030 ± 0.030 0.094 0.42 ± 7.96 0.026 ± 0.026 0.759
AgBP (mmHg) 0.14 ± 1.46 nda 0.585 0.24 ± 1.29 nda 0.286
AgBP@75 (mmHg) 0.26 ± 1.57 nda 0.339 0.40 ± 1.31 nda 0.082
ASBP (mmHg) 0.20 ± 0.86 0.005 ± 0.004 0.192 0.38 ± 0.64 0.004 ± 0.004 0.002**
ADBP (mmHg) -0.02 ± 0.42 0.003 ± 0.003 0.838 0.03 ± 0.48 0.004 ± 0.004 0.720
AMAP (mmHg) 0.15 ± 0.97 0.006 ± 0.006 0.364 0.41 ± 1.13 0.008 ± 0.008 0.043
APP (mmHg) 0.21 ± 0.79 0.017 ± 0.013 0.126 0.35 ± 0.64 0.014 ± 0.013 0.003**
PPA (AU) -0.47 ± 4.30 0.015 ± 0.011 0.529 -1.20 ± 3.31 0.011 ± 0.010 0.042* TTI (mmHg•s•min
-1) 15.63 ± 79.17 0.024 ± 0.019 0.258 45.94 ± 95.26 0.030 ± 0.025 0.008**
DTI (mmHg•s•min-1
) -5.88 ± 69.73 0.012 ± 0.010 0.626 -26.14 ± 96.05 0.019 ± 0.017 0.122
SEVR (%) -0.93 ± 12.71 0.035 ± 0.029 0.674 -4.53 ± 14.69 0.050 ± 0.042 0.081
AIx1 (%) 0.46 ± 5.05 nda 0.597 0.98 ± 4.32 nda 0.195
AIx2 (%) 0.56 ± 5.52 0.028 ± 0.027 0.559 0.95 ± 4.24 0.024 ± 0.020 0.202 AIx@75 (%) 0.98 ± 5.34 nda 0.292 1.57 ± 4.46 nda 0.049*
LVEW (dynes•s/cm2) 13.11 ± 148.32 nda 0.126 28.78 ± 138.46 nda 0.234
Data are presented as difference in pulse wave analysis variables pre and post peripheral blood pressure measurement for the left
and right arm (PWA 2 – PWA 1 and PWA 3 – PWA 2, respectively). Values are mean difference ± SD and coefficients of
variation (CV) ± SD. HR, heart rate; ED, Ejection duration; T1r, time of the start of the reflected wave; AgBP, central
augmented blood pressure; AgBP@75, augmented blood pressure normalized to 75 beats per minutes; ASBP, aortic systolic
pressure; ADBP, aortic diastolic pressure; AMAP, aortic mean arterial pressure; APP, aortic pulse pressure; PPA, pulse pressure
amplification ratio; TTI, tension-time index; DTI, diastolic time index; SEVR, sub-endocardial viability ratio; AIx1,
augmentation index 1; AIx2, augmentation index 2; AIx@75, augmentation index normalized to 75 beats per minute; LVEW, wasted left ventricular energy; nda, no data available. Significance values are reported from paired t-tests (* P<0.05, ** P<0.01).
Page 29 Martin et al. Hypertension Research (In press). DOI: DOI: 10.1038/hr.2015.36
Table 3. Comparison of resting pulse wave analysis variables measured between arms, post left arm peripheral blood pressure
measurement, and calibrated to left arm peripheral blood pressure
Left Arm Right Arm
M ± SD M ± SD CV ± SD P-value
HR (bpm) 64.83 ± 12.38 64.47 ± 12.06 0.020 ± 0.018 0.111 ED (ms) 325.06 ± 13.54 327.93 ± 14.44 0.010 ± 0.007 0.001**
T1r (ms) 149.40 ± 16.62 152.56 ± 11.11 0.049 ± 0.062 0.332
AgBP (mmHg) 0.23 ± 3.22 -0.54 ± 2.82 nda 0.015*
AgBP@75 (mmHg) -1.38 ± 3.38 -2.05 ± 3.05 nda 0.034*
ASBP (mmHg) 95.48 ± 10.96 95.04 ± 10.56 0.007 ± 0.006 0.030*
ADBP (mmHg) 67.26 ± 8.72 67.24 ± 8.70 0.002 ± 0.003 0.697
AMAP (mmHg) 80.08 ± 9.53 79.69 ± 9.48 0.007 ± 0.005 0.009**
APP (mmHg) 28.22 ± 6.83 27.80 ± 6.74 0.020 ± 0.018 0.024* PPA (AU) 165.57 ± 11.49 168.27 ± 10.23 0.022 ± 0.018 0.013* TTI (mmHg•s•min
-1) 1836 ± 388.2 1858 ± 387.4 0.021 ± 0.017 0.046*
DTI (mmHg•s•min-1
) 2969 ± 408.6 2925 ± 397.4 0.014 ± 0.012 0.001**
SEVR (%) 169.05 ± 40.95 164.37 ± 39.58 0.033 ± 0.026 0.007**
AIx1 (%) 1.44 ± 10.63 -1.34 ± 9.87 nda 0.022*
AIx2 (%) 102.69 ± 11.24 100.39 ± 9.65 0.042 ± 0.033 0.018* AIx@75 (%) -3.95 ± 12.40 -6.60 ± 11.08 nda 0.030*
LVEW (dynes•s/cm2) 31.80 ± 331.97 -47.46 ± 275.87 nda 0.016*
Values are representative of the mean ± SD and coefficients of variation (CV) ± SD in pulse wave analysis variables at PWA 2 in the
left and right arms. HR, heart rate; ED, Ejection duration; T1r, time of the start of the reflected wave; AgBP, central augmented blood
pressure; AgBP@75, augmented blood pressure normalized to 75 beats per minutes; ASBP, aortic systolic pressure; ADBP, aortic
diastolic pressure; AMAP, aortic mean arterial pressure; APP, aortic pulse pressure; PPA, pulse pressure amplification ration; TTI,
tension-time index; DTI, diastolic time index; SEVR, sub-endocardial viability ratio; AIx1, augmentation index 1; AIx2, augmentation
index 2; AIx@75, augmentation index normalized to 75 beats per minute; LVEW, wasted left ventricular energy; nda, no data available. Significance values are reported from paired t-tests (* P<0.05, ** P<0.01).

Page 30 Martin et al. Hypertension Research (In press). DOI: DOI: 10.1038/hr.2015.36
Table 4. Comparison of resting pulse wave analysis variables measured between arms, post simultaneous bilateral peripheral blood
pressure measurement, and calibrated to within arm peripheral blood pressure
Left Arm Right Arm
M ± SD M ± SD CV ± SD P-value
HR (bpm) 63.86 ± 11.56 63.06 ± 11.89 0.021 ± 0.021 0.111 ED (ms) 324.26 ± 12.65 327.12 ± 14.10 0.011 ± 0.009 0.006**
T1r (ms) 150.87 ± 9.62 152.25 ± 11.40 0.037 ± 0.032 0.457
AgBP (mmHg) 0.10 ± 3.30 -0.95 ± 3.08 nda 0.002**
AgBP@75 (mmHg) -1.65 ± 3.28 -2.81 ± 3.17 nda 0.000**
ASBP (mmHg) 94.43 ± 9.69 96.39 ± 10.09 0.033 ± 0.031 0.065
ADBP (mmHg) 66.32 ± 7.54 66.19 ± 7.13 0.029 ± 0.025 0.832
AMAP (mmHg) 79.19 ± 8.14 79.56 ± 7.94 0.029 ± 0.025 0.625
APP (mmHg) 28.10 ± 7.29 30.20 ± 8.54 0.095 ± 0.054 0.010**
PPA (AU) 166.74 ± 12.31 169.50 ± 10.60 0.020 ± 0.017 0.004**
TTI (mmHg•s•min-1
) 1812 ± 352.4 1829 ± 372.0 0.034 ± 0.031 0.423
DTI (mmHg•s•min-1
) 2935 ± 337.9 2945 ± 321.9 0.029 ± 0.028 0.735
SEVR (%) 168.11 ± 36.79 167.78 ± 38.08 0.028 ± 0.025 0.832
AIx1 (%) 0.60 ± 10.88 -2.16 ± 9.81 nda 0.012*
AIx2 (%) 101.51 ± 12.18 98.27 ± 10.33 0.039 ± 0.032 0.007** AIx@75 (%)
LVEW (dynes•s/cm2)
-4.74 ± 11.79 12.22 ± 320.71
-8.03 ± 10.07 -89.58 ± 301.57
nda
nda
0.005** 0.002**
Values are representative of the mean ± SD and coefficients of variation (CV) ± SD in pulse wave analysis variables at PWA 3 in the left and right arms. HR, heart rate; ED, Ejection duration; T1r, time of the start of the reflected wave; AgBP, central augmented blood
pressure; AgBP@75, augmented blood pressure normalized to 75 beats per minutes; ASBP, aortic systolic pressure; ADBP, aortic
diastolic pressure; AMAP, aortic mean arterial pressure; APP, aortic pulse pressure; PPA, pulse pressure amplification ration; TTI,
tension-time index; DTI, diastolic time index; SEVR, sub-endocardial viability ratio; AIx1, augmentation index 1; AIx2, augmentation
index 2; AIx@75, augmentation index normalized to 75 beats per minute; LVEW, wasted left ventricular energy; nda, no data available. Significance values are reported from paired t-tests (* P<0.05, ** P<0.01).

Page 31 Martin et al. Hypertension Research (In press). DOI: DOI: 10.1038/hr.2015.36
Figure 1. Correlation coefficients and Bland-Altman plots for right and left arm measurement
agreement in PWA derived measures of central augmented blood pressure (AgBP), the central
augmentation index (AIx1), and wasted left ventricular energy (LVEw) at PWA 2. Closed circles
represent subjects who presented with a clinically significant difference in bilateral peripheral
blood pressure (n=9), whereas open circles represent those without a clinically significant
difference in peripheral blood pressure (n=25).

Page 32 Martin et al. Hypertension Research (In press). DOI: DOI: 10.1038/hr.2015.36
Figure 2. Correlation coefficients and Bland-Altman plots for right and left arm
measurement agreement in PWA derived measures of the tension-time index (TTI),
diastolic-time index (DTI) and sub-endocardial viability ration (SEVR) at PWA 2.
Closed circles represent subjects who presented with a clinically significant difference
in bilateral peripheral blood pressure (n=9), whereas open circles represent those
without a clinically significant difference in peripheral blood pressure (n=25).

Page 33 Martin et al. Hypertension Research (In press). DOI: DOI: 10.1038/hr.2015.36
Figure 3. Between arm differences (right arm - left arm) in PWA derived characteristics of central
arterial blood pressure and wave reflection characteristics at PWA2. TTI, tension-time index; DTI,
diastolic time index; SEVR, sub-endocardial viability ratio; AgBP, central augmented blood pressure
AIx1, augmentation index 1, LVEW, wasted left ventricular energy. Data are mean ± SD. Paired t-
tests were performed to determine significant differences between arms and Satterthwaite corrected
two sample t-tests were performed to determine differences between groups. Clinically different
bilateral blood pressure was defined as > 10mmHg. *Significantly different between arms (P<0.05),
†significantly different between groups (P<0.05).

Page 34 Martin et al. Hypertension Research (In press). DOI: DOI: 10.1038/hr.2015.36
1
2
3
4
5
6
Supplemental Figure 1. Timeline for measurement of radial 7
artery pulse pressure waveforms (PWA) and brachial artery 8
blood pressure (PBP) 9

Page 35 Martin et al. Hypertension Research (In press). DOI: DOI: 10.1038/hr.2015.36
10
Supplemental Figure 2. A typical central aortic pressure waveform synthesized from the radial 11
artery pressure waveform using applanation tonometry. The dotted line is representative of the 12
theoretical aortic pressure waveform independent of wave reflection. Augmentation index 13
(AIX), expressed as a percentage, is the ratio of augmented pressure (ASBP – Pi) and central 14
aortic pulse pressure (ASBP – ADBP). Wasted left ventricular pressure energy (LVEW) is 15
defined as the portion of area under the pulse pressure curve attributed to amplitude and 16
duration of wave reflection where, even though there is an increased systolic pressure, blood 17
flow through the aorta decreases. LVEW, expressed in dynes•sec/cm2, is directly related to 18
augmented pressure (AP; calculated as ASBP – Pi) and to the time duration of the reflected 19
aortic pressure wave, ∆tr. ASBP = central aortic systolic blood pressure; Pi = pressure at the 20
first inflection point marking the onset of reflected aortic pressure wave return from the 21
periphery; ADBP = central aortic diastolic blood pressure; ∆tp = time to arrival of the reflected 22
pressure wave; ∆tr = systolic duration of the reflected aorticpressure wave; ED = ejection 23
duration; ESP = end systolic pressure. 24
25
Related Documents


![Clinics in Surgery Clinical Image - Open Access Journalof the radial artery are uncommon [1]. Reports appear in literature about certain variations, such as high origin of radial artery,](https://static.cupdf.com/doc/110x72/5ff8834eb1a33c688345bcd5/clinics-in-surgery-clinical-image-open-access-of-the-radial-artery-are-uncommon.jpg)
