Connecting “the D’s” to Vehicle Miles Traveled in the Sacramento Region Presentation to SB375 Regional Targets Advisory Committee February 3, 2009

Welcome message from author
This document is posted to help you gain knowledge. Please leave a comment to let me know what you think about it! Share it to your friends and learn new things together.
Transcript

Connecting “the D’s” to Vehicle Miles Traveled in the Sacramento Region
Presentation toSB375 Regional Targets Advisory Committee
February 3, 2009

Purpose
• Show one practical, regional planning application of the D’s
• Provide examples of MANY ways to reduce VMT going forward
• Demonstrate that system-wide improvements happen over time
• Stimulate focused RTAC discussion and debate

Outline
• Vehicle miles traveled as primary indicator– Defining area types by average VMT per
household• Land use characteristics of VMT-defined
areas• Drilling down to specifics in prototype areas• Forecasting results

2005 VMT Per Household

2005 VMT Per Household
• 2005 reg. average VMT/HH = +/-50 miles– Dark green = Group 1--Very Low VMT (< 25
miles)
– Light green = Group 2--Low VMT (25 – 45 miles)
– Yellow = Group 3--Average(45-55 miles)
– Orange = Group 4--High (55-75 miles)
– Red = Group 5--Very High (75+ miles)

2005 VMT Per Household
• Next slides:
– What are land use characteristics of each of these 5 areas?
– Are there common features?

VMT Prototype Areas
• 18 Prototype areas
• 2 to 4 prototypes areas per VMT group
• Areas spread across region
• Variety
• Used the prototype areas to compare land uses and travel behavior

B
A
Very Low VMT Prototypes (Group 1)
• A = Midtown Sacramento• B = Downtown Marysville

A
CD
B
Low VMT Prototypes (Group 2)
• A=Cent. Yuba City• B=Cent. Auburn• C=Arden Arcade• D=Cent. Davis

DC
AB
Average VMT Prototypes (Group 3)
• A = Citrus Heights• B = Cent. Folsom• C = Pocket• D = South Sacramento
B
D
C
A
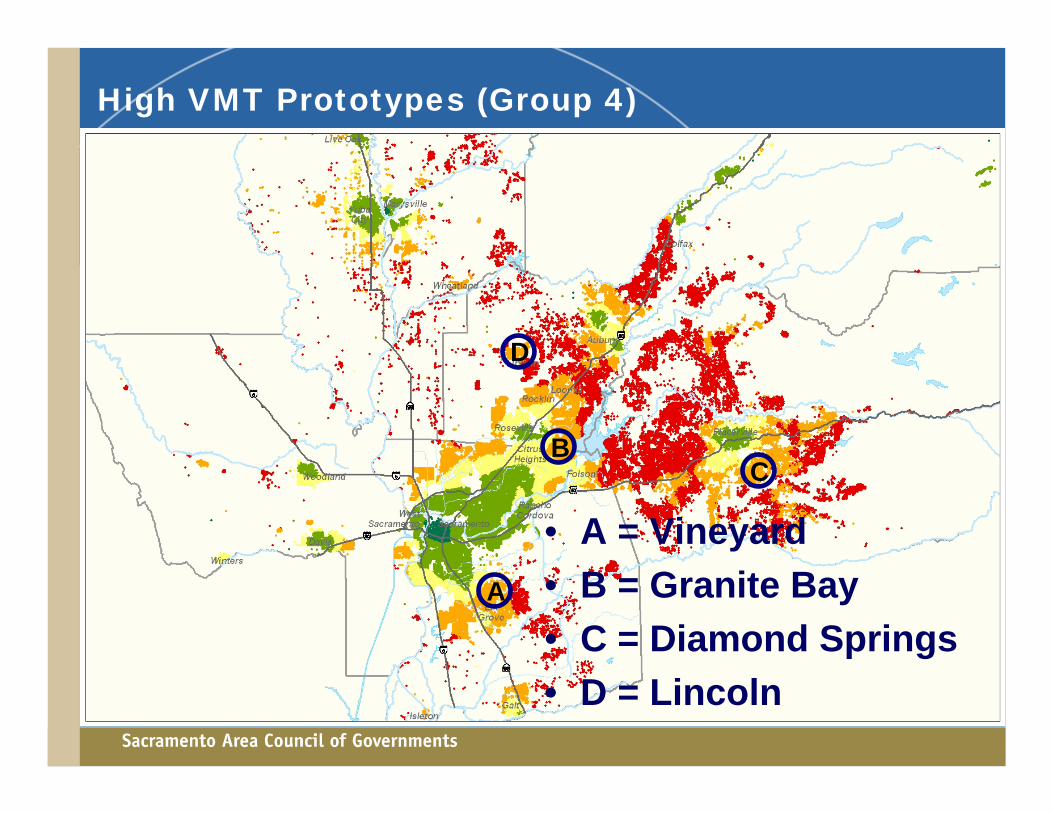
High VMT Prototypes (Group 4)
• A = Vineyard• B = Granite Bay• C = Diamond Springs• D = Lincoln

D
AC
B
Very High VMT Prototypes (Group 5)
• A = El Dorado Foothills• B = Wilton• C = Knight’s Landing• D = Linda

Density in Prototype Areas• Density = Jobs + housing per acre at place
of residence• Higher density = lower VMT
28
13
64 3
0
5
10
15
20
25
30
1 Very Low 2 Low 3 Average 4 High 5 Very High
VMT Grouping

Street Pattern in Prototype Areas• Street pattern = density of good
intersections at place of residence• Better street pattern = lower VMT
60
23
30
18
10
0
10
20
30
40
50
60
70
1 Very Low 2 Low 3 Average 4 High 5 Very High
VMT Grouping

Transit Proximity in Prototype Areas• Proximity = % of households within ¼ mile
of nearest transit• Higher proximity = lower VMT
100%91%
74%
22%
13%
0%
10%
20%
30%
40%
50%
60%
70%
80%
90%
100%
1 Very Low 2 Low 3 Average 4 High 5 Very High
VMT Grouping

Mix of Use in Prototype Areas• Mix Index = 0 (homogeneous development)
to 100 (balanced mix)• More balanced mix = lower VMT
66
56
44
23
7
0
10
20
30
40
50
60
70
80
90
100
1 Very Low 2 Low 3 Average 4 High 5 Very High
VMT Grouping

Bike/Walk Mode Share in Prototype Areas• Regional Average = 7.5 %• Higher share in lower VMT areas
37.4%
19.4%
7.7%5.5%
2.3%
0%
5%
10%
15%
20%
25%
30%
35%
40%
1 Very Low 2 Low 3 Average 4 High 5 Very High
VMT Groupings

Transit Mode Share in Prototype Areas• Regional Average = 1.2 %• Higher share in lower VMT areas
7.4%
2.8%
1.3%
0.3% 0.1%0%
1%
2%
3%
4%
5%
6%
7%
8%
1 Very Low 2 Low 3 Average 4 High 5 Very High
VMT Groupings

Drill Down into Lower VMT Prototype Areas (Groups 1 and 2)
• Very Low VMT area (Group 1)– Midtown Sacramento

Drill Down into Lower VMT Prototype Areas (Groups 1 and 2)
• Very Low VMT area (Group 1)– Midtown Sacramento
• Low VMT areas (Group 2)– Arden Arcade– Yuba City

Midtown Sacramento (Group 1—Very Low VMT)

Midtown Sacramento—Land Use
• Adjacent to CBD
• Mixed office, retail, residential
• Small-lot single family + apartments
• Small blocks, grid pattern
• High frequency transit

Midtown Sacramento—Development Types
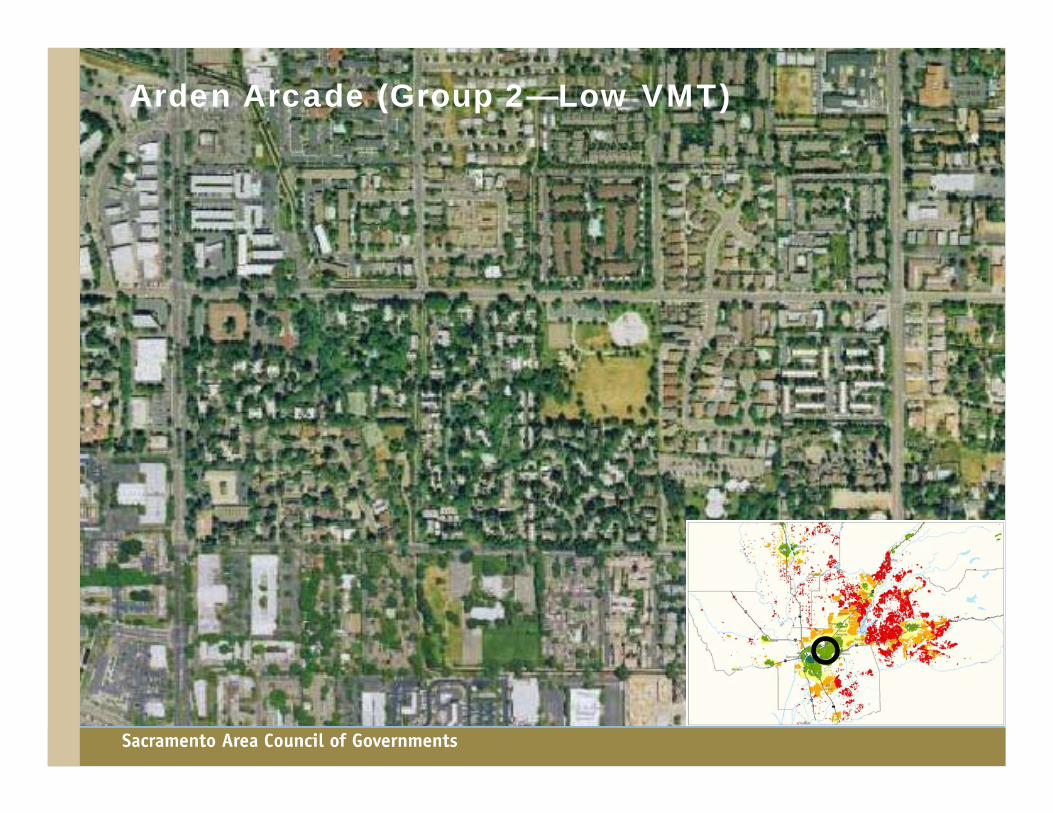
Arden Arcade (Group 2—Low VMT)

Arden Arcade—Land Use
• Inner suburban, 5 miles from CBD
• Low/medium density retail and commercial strip
• Large-lot single family + some large scale multi-family
• Large blocks, fragmented street pattern
• High frequency transit

Arden Arcade—Development Types

Central Yuba City (Group 2—Low VMT)

Central Yuba City—Land Use
• Historic farm-market town
• Strip commercial and large lot single family residential
• Medium street grid in residential, large blocks in commercial and retail areas
• Low frequency transit

Central Yuba City—Development Types

2005 VMT Per Household

Areas of Improvement: 2005 VMT / HH
Roseville/Rocklin/Lincoln:

Areas of Improvement: 2035 MTP VMT / HH
Roseville/Rocklin/Lincoln:
Red > Orange
Orange > Yellow
Yellow > Green

Areas of Improvement: 2005 VMT / HH
Folsom/El Dorado Hills

Areas of Improvement: 2035 MTP VMT / HH
Folsom/El Dorado Hills
Red > Orange
Orange > Yellow

Areas of Improvement: 2005 VMT / HH
Railyards and West Sacramento:

Areas of Improvement: 2035 MTP VMT / HH
Railyards and West Sacramento:
Dark Green area expands

Regional Baseball Analogy • From Christopher Leinberger• Unique roles for cities within a region• Not “one size fits all”
D ow n tow n
Indu stria l A rea
D ow n tow n A d jac en t
S uburban To w n C enter
L ifes tyle C en ter
E dgeless C ity
E dge C ity Indu stria l/D is tribu tio n /A irport
M anager: M etrop o litanU m bre lla O rg an iz a tio n
C om pe tition : Th e R e stO f th e W orld ’s M etro A re as
O utfie ld :D rivab le S u b-urban
In fie ld :W alka b le U rban
E ach positio n h as u n iq ue sk ills , ra re ly com petes d irectly w ith one an oth er and eac h w ins w he n a ll w in s
Related Documents