JANUARY – SEPTEMBER 2013 CONDENSED CONSOLIDATED INTERIM FINANCIAL STATEMENTS 2013 (UNAUDITED)

Welcome message from author
This document is posted to help you gain knowledge. Please leave a comment to let me know what you think about it! Share it to your friends and learn new things together.
Transcript
January – september 2013
condensed consolidated interim
financial statements 2013
(unaudited)

contents
1. Income Statement 1
2. Statement of Comprehensive Income 2
3. Balance Sheet 3
4. Statement of Changes in Equity 4
5. Cash Flow Statement 5
6. Notes to the Condensed Consolidated Interim Financial Statements 6
7. Financial Calendar 14
Schindellegi, October 14, 2013

1 condensed consolidated interim financial statements 2013 Income Statement
1. Income Statement
January – September July – September
cHf million 2013 2012 Varianceper cent
2013 2012 Varianceper cent
turnover 15,705 15,471 1.5 5,311 5,409 –1.8
Customs duties and taxes –2,832 –2,750 –988 –960
net turnover 12,873 12,721 1.2 4,323 4,449 –2.8
Net expenses for services from third parties –8,188 –8,164 –2,750 –2,924
Gross profit 4,685 4,557 2.8 1,573 1,525 3.1
Personnel expenses 1 –2,806 –2,696 –940 –914
Selling, general and administrative expenses –1,172 –1,191 –390 –382
Other operating income/expenses, net 3 16 1 3
Expense for EU antitrust fines – –65 – –
ebitda 710 621 14.3 244 232 5.2
Depreciation of property, plant and equipment –106 –108 –35 –36
Amortisation of other intangibles –43 –51 –14 –16
ebit 561 462 21.4 195 180 8.3
Financial income 4 9 1 3
Financial expenses –4 –5 –1 –2
Result from joint ventures and associates 6 4 1 1
earnings before tax (ebt) 567 470 20.6 196 182 7.7
Income tax –125 –113 –43 –39
earnings for the period 442 357 23.8 153 143 7.0
attributable to:
equity holders of the parent company 435 352 23.6 150 141 6.4
Non-controlling interests 7 5 3 2
earnings for the period 442 357 23.8 153 143 7.0
basic earnings per share in cHf 2 3.63 2.95 1.25 1.19
diluted earnings per share in cHf 2 3.63 2.95 1.25 1.19
1 Since January 1, 2013, the Group applies IAS 19 (revised). This change in accounting policy was recognised retrospectively and comparatives have been restated.
The impact for the first nine months of 2012 amounts to CHF 1 million.
2 Since January 1, 2013, the Group applies IAS 19 (revised). This change in accounting policy was recognised retrospectively and comparatives have been restated. The impact for the first nine months of 2012 amounts to CHF 0.01 on basic and diluted earnings per share respectively.
condensed consolidated interim financial statements 2013 Statement of Comprehensive Income 2
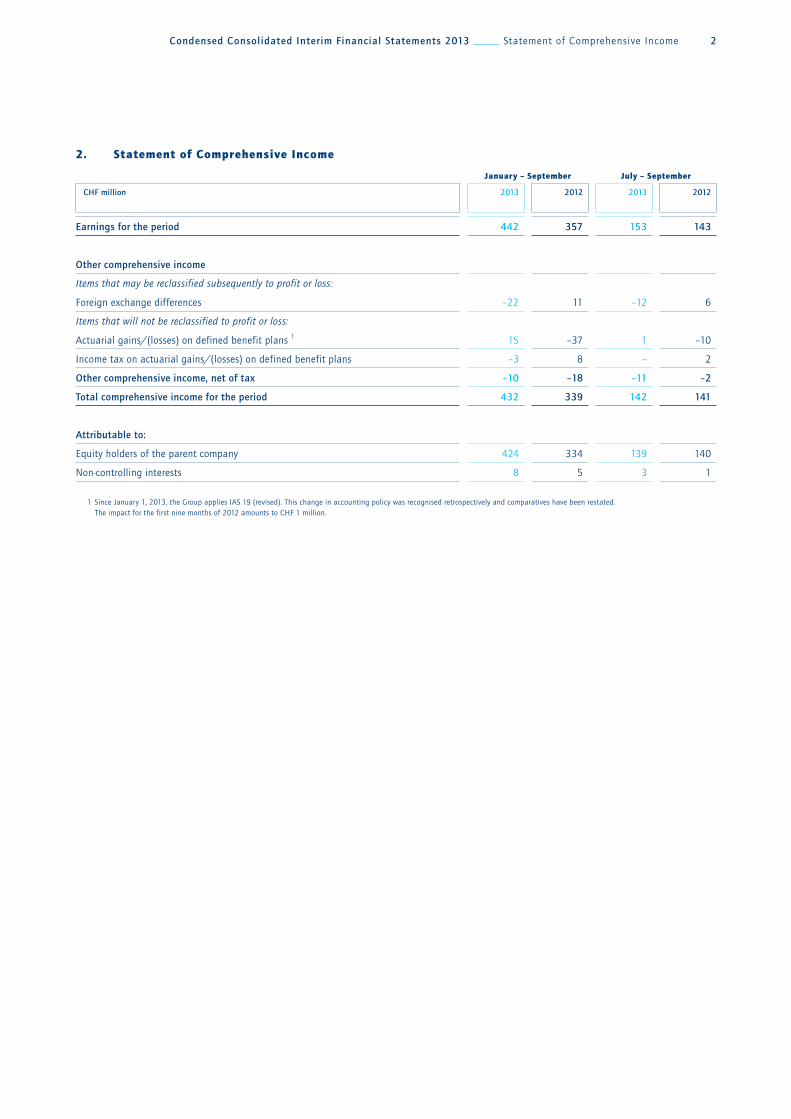
2. Statement of Comprehensive Income
January – September July – September
cHf million 2013 2012 2013 2012
earnings for the period 442 357 153 143
other comprehensive income
Items that may be reclassified subsequently to profit or loss:
Foreign exchange differences –22 11 –12 6
Items that will not be reclassified to profit or loss:
Actuarial gains/(losses) on defined benefit plans 1 15 –37 1 –10
Income tax on actuarial gains/(losses) on defined benefit plans –3 8 – 2
other comprehensive income, net of tax –10 –18 –11 –2
total comprehensive income for the period 432 339 142 141
attributable to:
Equity holders of the parent company 424 334 139 140
Non-controlling interests 8 5 3 1
1 Since January 1, 2013, the Group applies IAS 19 (revised). This change in accounting policy was recognised retrospectively and comparatives have been restated. The impact for the first nine months of 2012 amounts to CHF 1 million.
3 condensed consolidated interim financial statements 2013 Balance Sheet
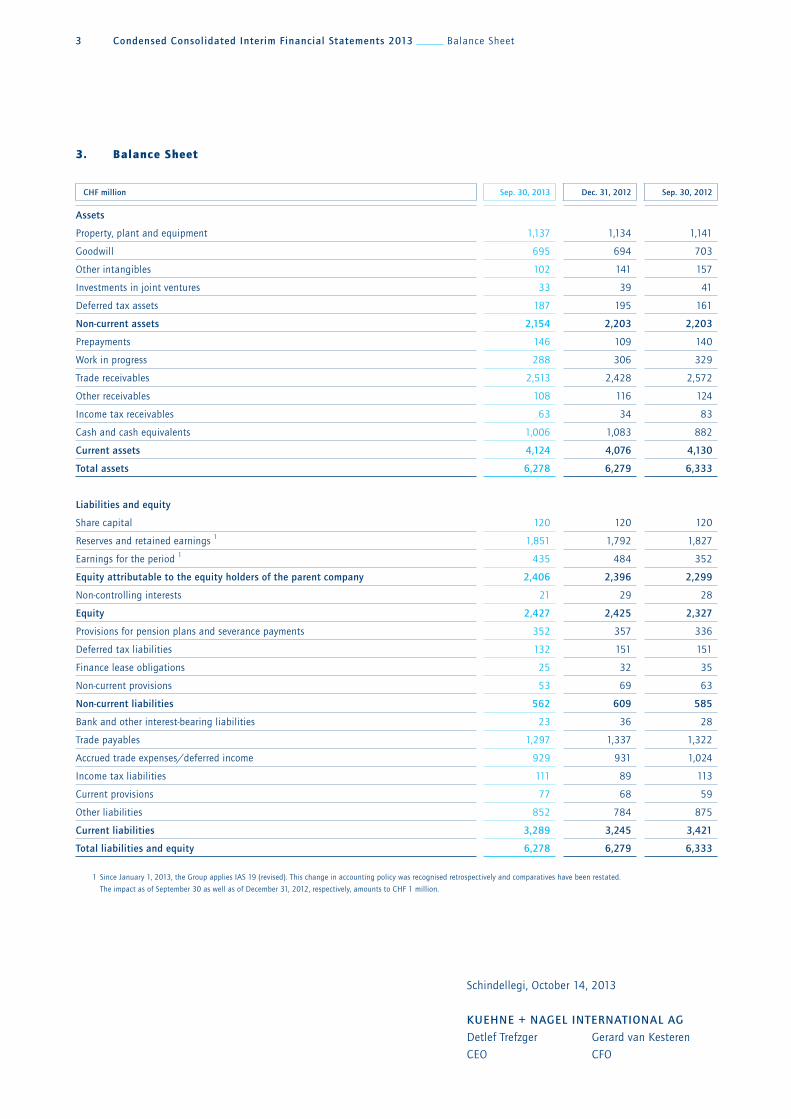
Schindellegi, October 14, 2013
KueHne + naGel international aG
Detlef Trefzger Gerard van Kesteren
CEO CFO
3. Balance Sheet
cHf million sep. 30, 2013 dec. 31, 2012 sep. 30, 2012
assets
Property, plant and equipment 1,137 1,134 1,141
Goodwill 695 694 703
Other intangibles 102 141 157
Investments in joint ventures 33 39 41
Deferred tax assets 187 195 161
non-current assets 2,154 2,203 2,203
Prepayments 146 109 140
Work in progress 288 306 329
Trade receivables 2,513 2,428 2,572
Other receivables 108 116 124
Income tax receivables 63 34 83
Cash and cash equivalents 1,006 1,083 882
current assets 4,124 4,076 4,130
total assets 6,278 6,279 6,333
liabilities and equity
Share capital 120 120 120
Reserves and retained earnings 1 1,851 1,792 1,827
Earnings for the period 1 435 484 352
equity attributable to the equity holders of the parent company 2,406 2,396 2,299
Non-controlling interests 21 29 28
equity 2,427 2,425 2,327
Provisions for pension plans and severance payments 352 357 336
Deferred tax liabilities 132 151 151
Finance lease obligations 25 32 35
Non-current provisions 53 69 63
non-current liabilities 562 609 585
Bank and other interest-bearing liabilities 23 36 28
Trade payables 1,297 1,337 1,322
Accrued trade expenses/deferred income 929 931 1,024
Income tax liabilities 111 89 113
Current provisions 77 68 59
Other liabilities 852 784 875
current liabilities 3,289 3,245 3,421
total liabilities and equity 6,278 6,279 6,333
1 Since January 1, 2013, the Group applies IAS 19 (revised). This change in accounting policy was recognised retrospectively and comparatives have been restated.
The impact as of September 30 as well as of December 31, 2012, respectively, amounts to CHF 1 million.

condensed consolidated interim financial statements 2013 Statement of Changes in Equity 4
4. Statement of Changes in Equity
cHf million sharecapital
sharepremium
treasuryshares
cumu-lative
translation adjust-
ment
actuarial gains &
losses
retained earnings
total equity
attribu-table to
the equity holders
of parent company
non-controlling
interests
total equity
Balance as of January 1, 2012 120 535 –45 –715 –44 2,531 2,382 23 2,405
Change in accounting policy 1 – – – – 1 –1 – – –
restated balance as
of January 1, 2012 120 535 –45 –715 –43 2,530 2,382 23 2,405
Earnings for the period 1 – – – – – 352 352 5 357
other comprehensive income
Foreign exchange differences – – – 11 – – 11 – 11
Actuarial gains/(losses) on
defined benefit plans, net of tax 1
–
–
–
–
–29
–
–29
–
–29
total other comprehensive income,
net of tax
–
–
–
11
–29
–
–18
–
–18
total comprehensive income
for the period
–
–
–
11
–29 352 334 5 339
Purchase of treasury shares – – –20 – – – –20 – –20
Disposal of treasury shares – 13 42 – – – 55 – 55
Dividend paid 2 – – – – – –460 –460 – –460
Expenses for share-based
compensation plans
–
–
–
–
– 8 8
– 8
total transactions with owners – 13 22 – – –452 –417 – –417
balance as of september 30, 2012 120 548 –23 –704 –72 2,430 2,299 28 2,327
Balance as of January 1, 2013 120 549 –20 –736 –82 2,565 2,396 29 2,425
Earnings for the period – – – – – 435 435 7 442
other comprehensive income
Foreign exchange differences – – – –23 – – –23 1 –22
Actuarial gains/(losses) on
defined benefit plans, net of tax – – – – 12 – 12 – 12
total other comprehensive income,
net of tax – – – –23 12 – –11 1
–10
total comprehensive income
for the period – – – –23 12 435 424 8 432
Purchase of treasury shares – – –17 – – – –17 – –17
Disposal of treasury shares – 2 11 – – – 13 – 13
Dividend paid 2 – – – – – –419 –419 –16 –435
Expenses for share-based
compensation plans – – – – – 9 9 –
9
total transactions with owners – 2 –6 – – –410 –414 –16 –430
balance as of september 30, 2013 120 551 –26 –759 –70 2,590 2,406 21 2,427
1 Since January 1, 2013, the Group applies IAS 19 (revised). This change in accounting policy was recognised retrospectively and comparatives have been restated.
The impact as of September 30, 2012 amounts to CHF 1 million.
2 CHF 3.50 per share (2012: CHF 3.85 per share).

5 condensed consolidated interim financial statements 2013 Cash Flow Statement
5. Cash Flow Statement
January – September July – September
cHf million 2013 2012 Variance 2013 2012 Variance
cash flow from operating activities Earnings for the period 1 442 357 153 143
Reversal of non-cash items: Income tax 125
113 43
39
Financial income –4 –9 –1 –3
Financial expenses 4 5 1 2
Result from joint ventures and associates –6 –4 –1 –1
Depreciation of property, plant and equipment 106 108 35 36
Amortisation of other intangibles 43 51 14 16
Expenses for share-based compensation plans 9 8 3 3
Gain on disposal of property, plant and equipment and associate –7 –15 –2 –3
Loss on disposal of property, plant and equipment 4 1 1 –
Net addition to provisions for pension plans and severance payments 1 6 6 2 2
subtotal operational cash flow 722 621 101 248 234 14
(Increase)/decrease work in progress 10 –55 –12 –20
(Increase)/decrease trade and other receivables, prepayments –141 –346 –19 –16
Increase/(decrease) other liabilities 68 106 84 –25
Increase/(decrease) provisions –5 –39 4 –32
Increase/(decrease) trade payables, accrued trade expenses/deferred income –28
170 –38
2
Income taxes paid –147 –138 –42 –41
total cash flow from operating activities 479 319 160 225 102 123
cash flow from investing activities
Capital expenditure
– Property, plant and equipment –115 –115 –39 –47
– Other intangibles –4 –7 –1 –1
Disposal of property, plant and equipment 19 21 11 6
Acquisition of subsidiaries, net of cash acquired – –5 – –1
Disposal of financial investments – 252 – –
Interest received 3 4 1 1
(Increase)/decrease of share capital in joint ventures 6 – 3 –
Sale of associate 1 5 1 –
Dividend received from joint ventures and associates 6 4 1 1
total cash flow from investing activities –84 159 –243 –23 –41 18
cash flow from financing activities
Proceeds from interest-bearing liabilities – 2 – –
Repayment of interest-bearing liabilities –10 –23 –4 –5
Interest paid –3 –4 –1 –1
Purchase of treasury shares –17 –20 –17 –3
Disposal of treasury shares 13 55 9 33
Dividend paid to equity holders of parent company –419 –460 – –
Dividend paid to non-controlling interests –16 – –4 –
total cash flow from financing activities –452 –450 –2 –17 24 –41
Exchange difference on cash and cash equivalents –9 6 –8 –1
increase/(decrease) in cash and cash equivalents –66 34 –100 177 84 93
cash and cash equivalents at the beginning of the period, net 1,058 835 223 815 785 30
cash and cash equivalents at the end of the period, net 992 869 123 992 869 123
1 Since January 1, 2013, the Group applies IAS 19 (revised). This change in accounting policy was recognised retrospectively and comparatives have been restated.
The impact for the first nine months of 2012 amounts to CHF 1 million.

condensed consolidated interim financial statements 2013 Notes 6
notes to tHe condensed consolidated interim financial statements
6.1 OrganisationKuehne + Nagel International AG (the Company) is incorporated
in Schindellegi (Feusisberg), Switzerland. The Company is one
of the world’s leading logistics providers. Its strong market posi-
tion lies in the seafreight, airfreight, the overland and contract
logistics businesses.
The Condensed Consolidated Interim Financial Statements of
the Company for the nine months ended September 30, 2013,
comprise the Company, its subsidiaries (the Group) and its inter-
ests in joint ventures.
The Group voluntarily also presents a balance sheet as of
September 30, 2012, and a cash flow statement for the three
months ended September 30, including comparatives.
6.2 Statement of complianceThe unaudited Condensed Consolidated Interim Financial State-
ments have been prepared in accordance with IAS 34 Interim
Financial Reporting. They do not include all of the information
required for full annual financial statements, and should be read
in conjunction with the Consolidated Financial Statements of
the Group for the year ended December 31, 2012.
6.3 Basis of preparationThe Condensed Consolidated Interim Financial Statements are
presented in Swiss francs (CHF) million. They are prepared on a
historical cost basis except for certain financial instruments
which are stated at fair value. Non-current assets and disposal
groups held for sale are stated at the lower of the carrying
amount and fair value less costs to sell.
The preparation of the Condensed Consolidated Interim Finan-
cial Statements in conformity with IFRS requires the manage-
ment to make judgments, estimates and assumptions that affect
the application of policies and reported amounts of assets and
liabilities, income and expenses. The actual result may differ
from these estimates. Judgements made by the management
in the application of IFRS that have a significant effect on
the Condensed Consolidated Interim Financial Statements and
estimates with a significant risk of material adjustment in the
next period were the same as those applied to the Consolidated
Financial Statements for the year ended December 31, 2012.
accounting policies
The accounting policies are the same as those applied in the
Consolidated Financial Statements for the year ended December 31,
2012. The only exception is the adoption of IAS 19 (revised) as of
January 1, 2013. The interest costs and expected return on plan
assets used in the previous version of IAS 19 have been replaced
with a net interest amount which is calculated by multiplying the
discount rate with the net defined benefit obligation. This change
has a negative impact on the expenses for defined benefit plans
of CHF 1 million for the year 2012.
The other new, revised and amended standards that are effec-
tive for the 2013 reporting year are either not relevant for the
Group, or do not have a material impact on the Condensed
Consolidated Interim Financial Statements.
6.4 Foreign exchange ratesThe major foreign currency exchange rates applied are as
follows:
income statement and cash f low statement
(average rates for the period)
balance sheet
(period end rates)
6.5 SeasonalityThe Group is not exposed to significant seasonal or cyclical
variations in its operations.
currency 2013cHf
Varianceper cent
2012cHf
EUR 1.– 1.2295 2.0 1.2059
USD 1.– 0.9314 –0.4 0.9347
GBP 1.– 1.4454 –2.4 1.4805
currency sep. 2013cHf
Varianceper cent
sep. 2012cHf
EUR 1.– 1.2300 1.7 1.2100
USD 1.– 0.9116 –2.6 0.9357
GBP 1.– 1.4609 –3.8 1.5186
7 condensed consolidated interim financial statements 2013 Notes
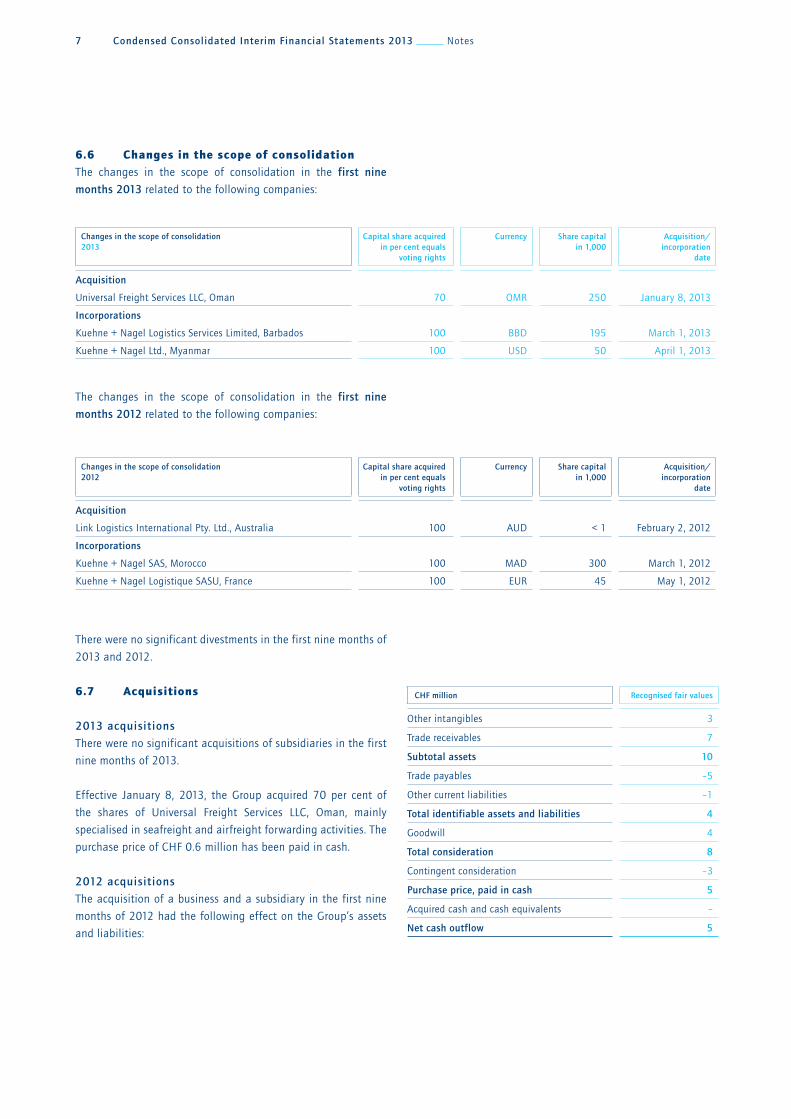
6.6 Changes in the scope of consolidation The changes in the scope of consolidation in the first nine
months 2013 related to the following companies:
The changes in the scope of consolidation in the first nine
months 2012 related to the following companies:
There were no significant divestments in the first nine months of
2013 and 2012.
6.7 Acquisitions
2013 acquisitions
There were no significant acquisitions of subsidiaries in the first
nine months of 2013.
Effective January 8, 2013, the Group acquired 70 per cent of
the shares of Universal Freight Services LLC, Oman, mainly
specialised in seafreight and airfreight forwarding activities. The
purchase price of CHF 0.6 million has been paid in cash.
2012 acquisitions
The acquisition of a business and a subsidiary in the first nine
months of 2012 had the following effect on the Group’s assets
and liabilities:
cHf million recognised fair values
Other intangibles 3
Trade receivables 7
subtotal assets 10
Trade payables –5
Other current liabilities –1
total identifiable assets and liabilities 4
Goodwill 4
total consideration 8
Contingent consideration –3
purchase price, paid in cash 5
Acquired cash and cash equivalents –
net cash outflow 5
changes in the scope of consolidation2013
capital share acquiredin per cent equals
voting rights
currency share capital in 1,000
acquisition/incorporation
date
acquisition
Universal Freight Services LLC, Oman 70 OMR 250 January 8, 2013
incorporations
Kuehne + Nagel Logistics Services Limited, Barbados 100 BBD 195 March 1, 2013
Kuehne + Nagel Ltd., Myanmar 100 USD 50 April 1, 2013
changes in the scope of consolidation2012
capital share acquiredin per cent equals
voting rights
currency share capital in 1,000
acquisition/incorporation
date
acquisition
Link Logistics International Pty. Ltd., Australia 100 AUD < 1 February 2, 2012
incorporations
Kuehne + Nagel SAS, Morocco 100 MAD 300 March 1, 2012
Kuehne + Nagel Logistique SASU, France 100 EUR 45 May 1, 2012

condensed consolidated interim financial statements 2013 Notes 8
Effective February 2, 2012, the Group acquired Link Logistics
International Pty. Ltd., an Australian freight forwarder specialised
in perishables logistics. The purchase price of CHF 5.4 million
includes a contingent consideration of CHF 1.8 million depend-
ing on the financial performance of the acquired business until
December 2013. CHF 3.6 million has been paid in cash.
Effective July 3, 2012, the Group acquired the perishable logis-
tics business (mainly a customer list) of Perishables International
Transportation Inc., a Canadian independent freight forwarder,
specialising in handling and transportation of fresh and frozen
perishable goods. The purchase price of CHF 2.2 million includes
a contingent consideration of CHF 0.7 million depending on the
financial performance of the acquired business until June 2014.
CHF 1.5 million has been paid in cash.
The acquisitions (including the part of 2011 acquisitions that
completes a twelve months period since the date of acquisition)
contributed CHF 258 million of turnover and CHF 5 million of
loss to the consolidated turnover and earnings respectively for
the first nine months of 2012. If the acquisitions had occurred
on January 1, 2012, the Group’s turnover would have been
CHF 15,490 million and consolidated earnings for the period
would have been CHF 358 million.
The trade receivables comprise gross contractual amounts due
of CHF 7 million, and all amounts are expected to be collectible.
Goodwill of CHF 4 million arose on these acquisitions because
certain intangible assets did not meet the IFRS 3 criteria for the
recognition as intangible assets at the date of acquisition. These
assets mainly consist of management expertise and workforce.
Other intangibles of CHF 3 million recognised on these acquisi-
tions represent non-contractual customer lists having a useful
life of one year.
The initial accounting for the acquisitions made in the first nine
months of 2012 was only determined provisionally. No mate-
rial adjustments to the values previously reported were deemed
necessary after having finalised the acquisition accounting.
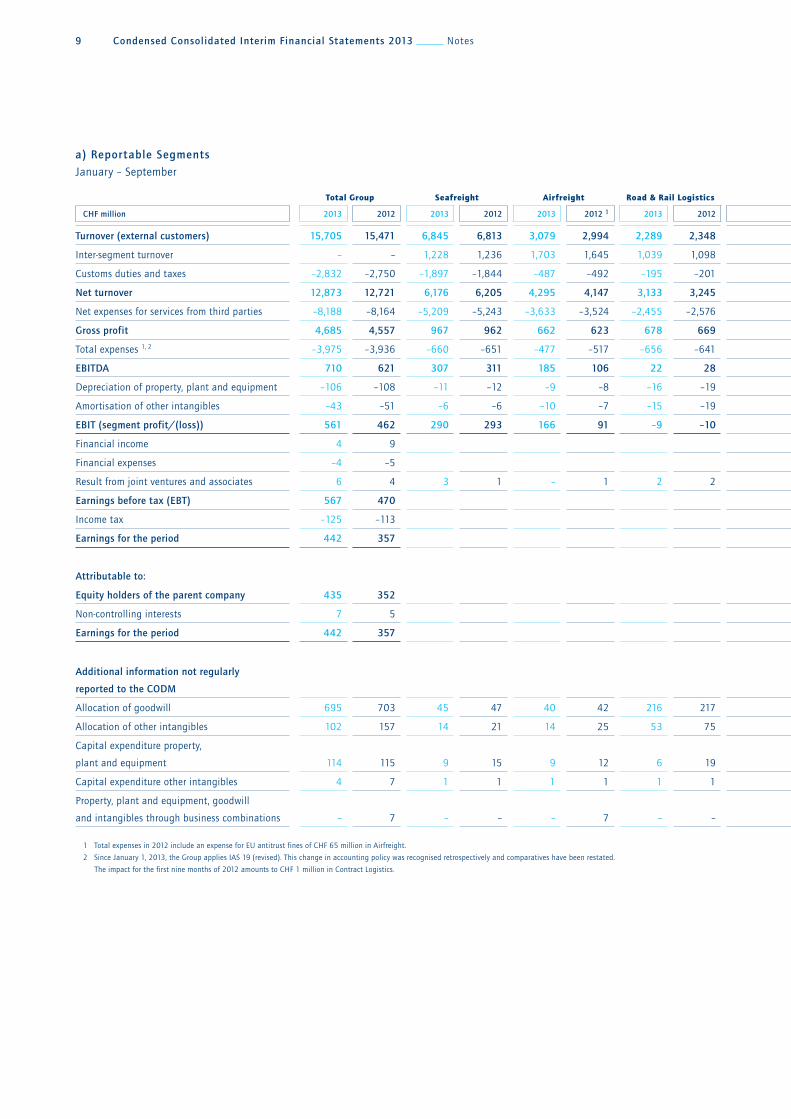
6.8 Segment Reporting
a) reportable segments
The Group provides integrated logistics solutions across custo-
mer’s supply chains using its global logistics network. The busi-
ness is divided into six operating segments namely seafreight,
airfreight, road & rail logistics, contract logistics, real
estate and insurance brokers. These six reportable segments
reflect the internal management and reporting structure to
the Management Board (the chief operating decision maker,
CODM) and are managed through specific organisational struc-
tures. The CODM reviews internal management reports on a
monthly basis. Each segment is a distinguishable business unit
and is engaged in providing and selling discrete products and
services.
The discrete distinction between Seafreight, Airfreight and Road
& Rail Logistics is the usage of the same transportation mode
within a reportable segment. In addition to common business
processes and management routines, a single main transporta-
tion mode is used within a reportable segment. For the reportable
segment Contract Logistics the services performed are related
to customer contracts for warehouse and distribution activities,
whereby services performed are storage, handling and distribu-
tion. In the reportable segment Real Estate, activities mainly
related to internal rent of facilities are reported. Under Insurance
Brokers, activities exclusively related to brokerage of insurance
coverage, mainly marine liability, are reported.
Pricing between segments is determined on an arm’s length basis.
The accounting policies of the reportable segments are the same
as applied in the Consolidated Financial Statements.
Information about the reportable segments is presented on the
next pages. Segment performance is based on EBIT as reviewed
by the CODM. The column “elimination” is eliminations of turn-
over and expenses between segments. All operating expenses are
allocated to the segments and included in the EBIT.
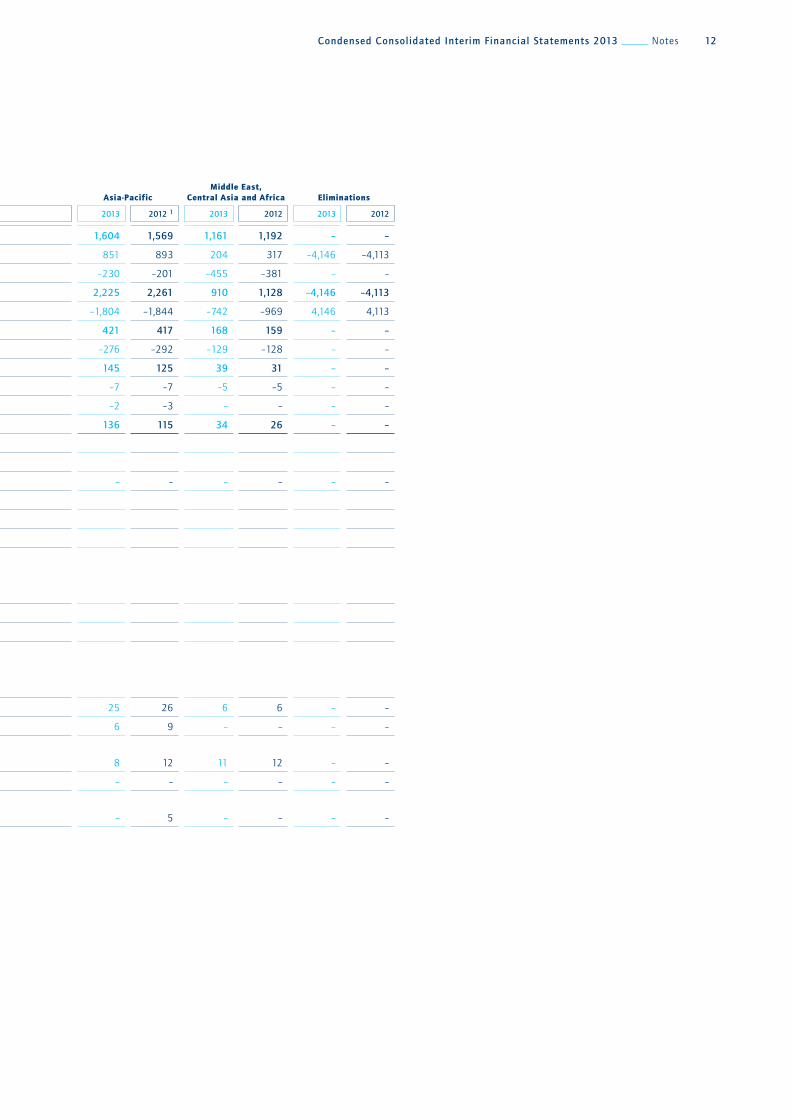
b) Geographical information
The Group is operating on a worldwide basis in the following
geographical areas: europe, americas, asia-pacific and middle
east, central asia and africa. All products and services are pro-
vided in each of these geographical regions. The segment revenue
is based on the geographical location of the customers invoiced,
and segment assets are based on the geographical location of
assets.
c) major customers
There is no single customer who represents more than 10 per cent
of the Group’s total revenue.
9 condensed consolidated interim financial statements 2013 Notes
a) reportable segments
January – September
Total Group Seafreight Airfreight Road & Rail Logistics Contract Logistics Real Estate Insurance BrokersTotal
Reportable Segments Eliminations
cHf million 2013 2012 2013 2012 2013 2012 1 2013 2012 2013 2012 2 2013 2012 2013 2012 2013 2012 2013 2012
turnover (external customers) 15,705 15,471 6,845 6,813 3,079 2,994 2,289 2,348 3,402 3,231 1 1 89 84 15,705 15,471 – –
Inter-segment turnover – – 1,228 1,236 1,703 1,645 1,039 1,098 125 90 54 56 51 44 4,200 4,169 –4,200 –4,169
Customs duties and taxes –2,832 –2,750 –1,897 –1,844 –487 –492 –195 –201 –253 –213 – – – – –2,832 –2,750 – –
net turnover 12,873 12,721 6,176 6,205 4,295 4,147 3,133 3,245 3,274 3,108 55 57 140 128 17,073 16,890 –4,200 –4,169
Net expenses for services from third parties –8,188 –8,164 –5,209 –5,243 –3,633 –3,524 –2,455 –2,576 –927 –833 – – –110 –101 –12,334 –12,277 4,146 4,113
Gross profit 4,685 4,557 967 962 662 623 678 669 2,347 2,275 55 57 30 27 4,739 4,613 –54 –56
Total expenses 1, 2 –3,975 –3,936 –660 –651 –477 –517 –656 –641 –2,213 –2,161 –8 –8 –15 –14 –4,029 –3,992 54 56
ebitda 710 621 307 311 185 106 22 28 134 114 47 49 15 13 710 621 – –
Depreciation of property, plant and equipment –106 –108 –11 –12 –9 –8 –16 –19 –52 –51 –18 –18 – – –106 –108 – –
Amortisation of other intangibles –43 –51 –6 –6 –10 –7 –15 –19 –12 –19 – – – – –43 –51 – –
ebit (segment profit/(loss)) 561 462 290 293 166 91 –9 –10 70 44 29 31 15 13 561 462 – –
Financial income 4 9
Financial expenses –4 –5
Result from joint ventures and associates 6 4 3 1 – 1 2 2 1 – – – – – 6 4 – –
earnings before tax (ebt) 567 470
Income tax –125 –113
earnings for the period 442 357
attributable to:
equity holders of the parent company 435 352
Non-controlling interests 7 5
earnings for the period 442 357
additional information not regularly
reported to the codm
Allocation of goodwill 695 703 45 47 40 42 216 217 394 397 – – – – 695 703 – –
Allocation of other intangibles 102 157 14 21 14 25 53 75 21 36 – – – – 102 157 – –
Capital expenditure property,
plant and equipment 114
115 9 15 9 12 6
19
60 54
30 15 – – 114 115 – –
Capital expenditure other intangibles 4 7 1 1 1 1 1 1 1 4 – – – – 4 7 – –
Property, plant and equipment, goodwill
and intangibles through business combinations – 7 – – –
7 – – – – – – – – – 7 – –
1 Total expenses in 2012 include an expense for EU antitrust fines of CHF 65 million in Airfreight.
2 Since January 1, 2013, the Group applies IAS 19 (revised). This change in accounting policy was recognised retrospectively and comparatives have been restated.
The impact for the first nine months of 2012 amounts to CHF 1 million in Contract Logistics.

condensed consolidated interim financial statements 2013 Notes 10
Total Group Seafreight Airfreight Road & Rail Logistics Contract Logistics Real Estate Insurance Brokers
Total Reportable Segments Eliminations
cHf million 2013 2012 2013 2012 2013 2012 1 2013 2012 2013 2012 2 2013 2012 2013 2012 2013 2012 2013 2012
turnover (external customers) 15,705 15,471 6,845 6,813 3,079 2,994 2,289 2,348 3,402 3,231 1 1 89 84 15,705 15,471 – –
Inter-segment turnover – – 1,228 1,236 1,703 1,645 1,039 1,098 125 90 54 56 51 44 4,200 4,169 –4,200 –4,169
Customs duties and taxes –2,832 –2,750 –1,897 –1,844 –487 –492 –195 –201 –253 –213 – – – – –2,832 –2,750 – –
net turnover 12,873 12,721 6,176 6,205 4,295 4,147 3,133 3,245 3,274 3,108 55 57 140 128 17,073 16,890 –4,200 –4,169
Net expenses for services from third parties –8,188 –8,164 –5,209 –5,243 –3,633 –3,524 –2,455 –2,576 –927 –833 – – –110 –101 –12,334 –12,277 4,146 4,113
Gross profit 4,685 4,557 967 962 662 623 678 669 2,347 2,275 55 57 30 27 4,739 4,613 –54 –56
Total expenses 1, 2 –3,975 –3,936 –660 –651 –477 –517 –656 –641 –2,213 –2,161 –8 –8 –15 –14 –4,029 –3,992 54 56
ebitda 710 621 307 311 185 106 22 28 134 114 47 49 15 13 710 621 – –
Depreciation of property, plant and equipment –106 –108 –11 –12 –9 –8 –16 –19 –52 –51 –18 –18 – – –106 –108 – –
Amortisation of other intangibles –43 –51 –6 –6 –10 –7 –15 –19 –12 –19 – – – – –43 –51 – –
ebit (segment profit/(loss)) 561 462 290 293 166 91 –9 –10 70 44 29 31 15 13 561 462 – –
Financial income 4 9
Financial expenses –4 –5
Result from joint ventures and associates 6 4 3 1 – 1 2 2 1 – – – – – 6 4 – –
earnings before tax (ebt) 567 470
Income tax –125 –113
earnings for the period 442 357
attributable to:
equity holders of the parent company 435 352
Non-controlling interests 7 5
earnings for the period 442 357
additional information not regularly
reported to the codm
Allocation of goodwill 695 703 45 47 40 42 216 217 394 397 – – – – 695 703 – –
Allocation of other intangibles 102 157 14 21 14 25 53 75 21 36 – – – – 102 157 – –
Capital expenditure property,
plant and equipment 114
115 9 15 9 12 6
19
60 54
30 15 – – 114 115 – –
Capital expenditure other intangibles 4 7 1 1 1 1 1 1 1 4 – – – – 4 7 – –
Property, plant and equipment, goodwill
and intangibles through business combinations – 7 – – –
7 – – – – – – – – – 7 – –
1 Total expenses in 2012 include an expense for EU antitrust fines of CHF 65 million in Airfreight.
2 Since January 1, 2013, the Group applies IAS 19 (revised). This change in accounting policy was recognised retrospectively and comparatives have been restated.
The impact for the first nine months of 2012 amounts to CHF 1 million in Contract Logistics.

11 condensed consolidated interim financial statements 2013 Notes
b) Geographical information
January – September
Total Group Europe Americas Asia-PacificMiddle East,
Central Asia and Africa Eliminations
cHf million 2013 2012 2013 2012 1 2013 2012 2 2013 2012 1 2013 2012 2013 2012
turnover (external customers) 15,705 15,471 9,411 9,311 3,529 3,399 1,604 1,569 1,161 1,192 – –
Inter-regional turnover – – 2,532 2,356 559 547 851 893 204 317 –4,146 –4,113
Customs duties and taxes –2,832 –2,750 –1,500 –1,498 –647 –670 –230 –201 –455 –381 – –
net turnover 12,873 12,721 10,443 10,169 3,441 3,276 2,225 2,261 910 1,128 –4,146 –4,113
Net expenses for services from third parties –8,188 –8,164 –7,121 –6,908 –2,667 –2,556 –1,804 –1,844 –742 –969 4,146 4,113
Gross profit 4,685 4,557 3,322 3,261 774 720 421 417 168 159 – –
Total expenses 1, 2 –3,975 –3,936 –2,940 –2,914 –630 –602 –276 –292 –129 –128 – –
ebitda 710 621 382 347 144 118 145 125 39 31 – –
Depreciation of property, plant and equipment –106 –108 –79 –80 –15 –16 –7 –7 –5 –5 – –
Amortisation of other intangibles –43 –51 –37 –44 –4 –4 –2 –3 – – – –
ebit 561 462 266 223 125 98 136 115 34 26 – –
Financial income 4 9
Financial expenses –4 –5
Result from joint ventures and associates 6 4 6 4 – – – – – – – –
earnings before tax (ebt) 567 470
Income tax –125 –113
earnings for the period 442 357
attributable to:
equity holders of the parent company 435 352
Non-controlling interests 7 5
earnings for the period 442 357
additional information not regularly
reported to the codm
Allocation of goodwill 695 703 557 559 107 112 25 26 6 6 – –
Allocation of other intangibles 102 157 85 129 11 19 6 9 – – – –
Capital expenditure property,
plant and equipment 114 115 81 76
14 15 8 12 11 12 – –
Capital expenditure other intangibles 4 7 4 7 – – – – – – – –
Property, plant and equipment, goodwill
and intangibles through business combinations –
7 – – – 2 – 5 – – – –
1 Total expenses in 2012 include an expense for EU antitrust fines of CHF 48 million in Europe and CHF 17 million in Asia-Pacific.
2 Since January 1, 2013, the Group applies IAS 19 (revised). This change in accounting policy was recognised retrospectively and comparatives have been restated.
The impact for the first nine months of 2012 amounts to CHF 1 million in the Americas.
condensed consolidated interim financial statements 2013 Notes 12
Total Group Europe Americas Asia-Pacific
Middle East, Central Asia and Africa Eliminations
cHf million 2013 2012 2013 2012 1 2013 2012 2 2013 2012 1 2013 2012 2013 2012
turnover (external customers) 15,705 15,471 9,411 9,311 3,529 3,399 1,604 1,569 1,161 1,192 – –
Inter-regional turnover – – 2,532 2,356 559 547 851 893 204 317 –4,146 –4,113
Customs duties and taxes –2,832 –2,750 –1,500 –1,498 –647 –670 –230 –201 –455 –381 – –
net turnover 12,873 12,721 10,443 10,169 3,441 3,276 2,225 2,261 910 1,128 –4,146 –4,113
Net expenses for services from third parties –8,188 –8,164 –7,121 –6,908 –2,667 –2,556 –1,804 –1,844 –742 –969 4,146 4,113
Gross profit 4,685 4,557 3,322 3,261 774 720 421 417 168 159 – –
Total expenses 1, 2 –3,975 –3,936 –2,940 –2,914 –630 –602 –276 –292 –129 –128 – –
ebitda 710 621 382 347 144 118 145 125 39 31 – –
Depreciation of property, plant and equipment –106 –108 –79 –80 –15 –16 –7 –7 –5 –5 – –
Amortisation of other intangibles –43 –51 –37 –44 –4 –4 –2 –3 – – – –
ebit 561 462 266 223 125 98 136 115 34 26 – –
Financial income 4 9
Financial expenses –4 –5
Result from joint ventures and associates 6 4 6 4 – – – – – – – –
earnings before tax (ebt) 567 470
Income tax –125 –113
earnings for the period 442 357
attributable to:
equity holders of the parent company 435 352
Non-controlling interests 7 5
earnings for the period 442 357
additional information not regularly
reported to the codm
Allocation of goodwill 695 703 557 559 107 112 25 26 6 6 – –
Allocation of other intangibles 102 157 85 129 11 19 6 9 – – – –
Capital expenditure property,
plant and equipment 114 115 81 76
14 15 8 12 11 12 – –
Capital expenditure other intangibles 4 7 4 7 – – – – – – – –
Property, plant and equipment, goodwill
and intangibles through business combinations –
7 – – – 2 – 5 – – – –
1 Total expenses in 2012 include an expense for EU antitrust fines of CHF 48 million in Europe and CHF 17 million in Asia-Pacific.
2 Since January 1, 2013, the Group applies IAS 19 (revised). This change in accounting policy was recognised retrospectively and comparatives have been restated.
The impact for the first nine months of 2012 amounts to CHF 1 million in the Americas.

13 condensed consolidated interim financial statements 2013 Notes
6.9 EquityIn the first nine months of 2013, the Company sold 131,220
treasury shares (2012: 582,047 treasury shares) for CHF 13
million (2012: CHF 55 million) under the share-based com-
pensation plans. The Company also purchased 140,000 trea-
sury shares for CHF 17 million during the reporting period
6.10 Employees
6.11 Capital expenditureThe capital expenditure (excluding other intangible assets and
property, plant and equipment from acquisitions) from January
to September 2013 was CHF 118 million (2012: CHF 122 million).
6.12 Legal claimsThe status of proceedings, disclosed in notes 41 and 45 to
the Consolidated Financial Statements for the year ended
December 31, 2012, has not changed materially.
(2012: 202,017 treasury shares for CHF 20 million).
The dividend payment for the year 2012 paid in 2013 amounted
to CHF 3.50 per share or CHF 419 million (2012: CHF 3.85 per
share or CHF 460 million).
6.13 Post balance sheet eventsThese unaudited Condensed Consolidated Interim Financial
Statements of Kuehne + Nagel International AG were authorised
for issue by the Audit Committee of the Group on October 14,
2013.
There have been no material events between September 30,
2013, and the date of authorisation that would require adjust-
ments of the Condensed Consolidated Interim Financial State-
ments or disclosure.
cHf million sep. 30, 2013 sep. 30, 2012
Europe 44,218 44,270
Americas 9,038 9,131
Asia-Pacific 6,761 6,932
Middle East, Central Asia and Africa 2,765 2,851
total employees 62,782 63,184
full-time equivalent 72,626 71,405

condensed consolidated interim financial statements 2013 Financial Calendar 14
March 3, 2014 Full year 2013 results
April 14, 2014 First quarter 2014 results
May 6, 2014 Annual General Meeting
May 13, 2014 Dividend Payment for 2013
July 14, 2014 Half-year 2014 results
October 13, 2014 Nine-months 2014 results
7. Financial Calendar

Kuehne + nagel international aG
Kuehne + Nagel House
P.O. Box 67
CH-8834 Schindellegi
Telephone +41 (0) 44 786 95 11
Fax +41 (0) 44 786 95 95
www.kuehne-nagel.com
Related Documents