Ezdan Holding Group Q.P.S.C. CONDENSED CONSOLIDATED INTERIM FINANCIAL STATEMENTS 30 June 2020

Welcome message from author
This document is posted to help you gain knowledge. Please leave a comment to let me know what you think about it! Share it to your friends and learn new things together.
Transcript
Ezdan Holding Group Q.P.S.C.
CONDENSED CONSOLIDATED INTERIM FINANCIAL STATEMENTS
30 June 2020
Ezdan Holding Group Q.P.S.C.
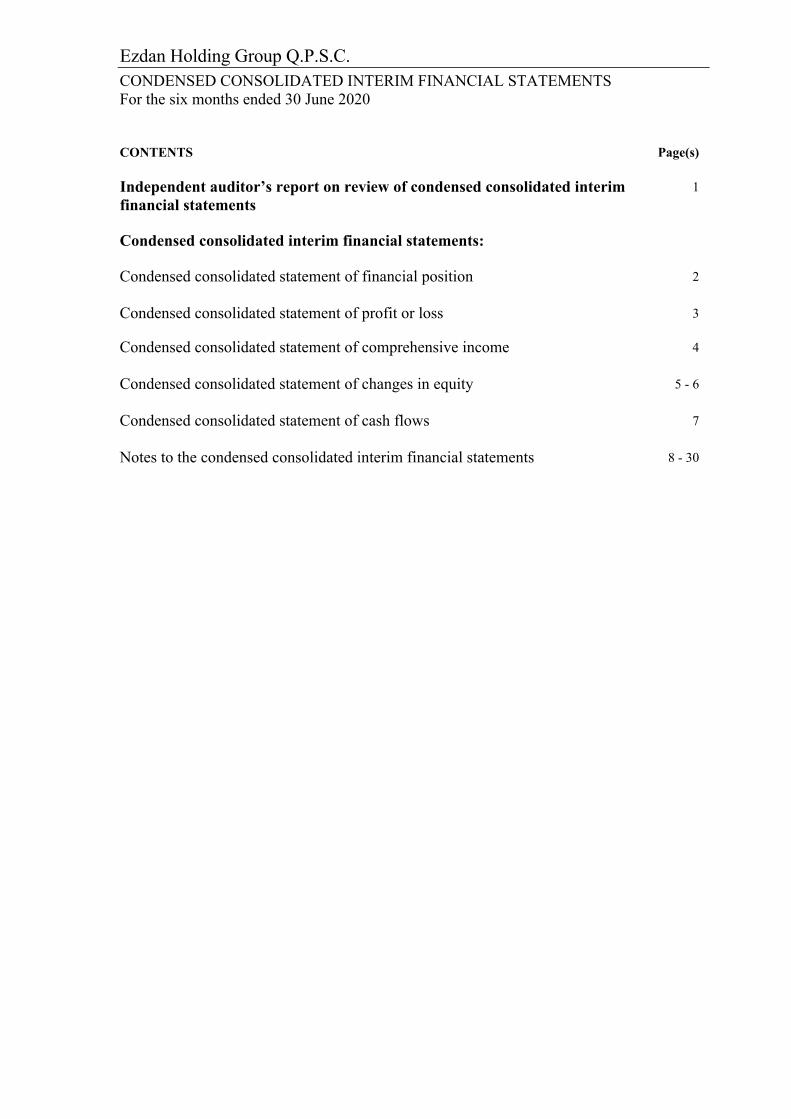
CONDENSED CONSOLIDATED INTERIM FINANCIAL STATEMENTS For the six months ended 30 June 2020 CONTENTS Page(s) Independent auditor’s report on review of condensed consolidated interim financial statements
1
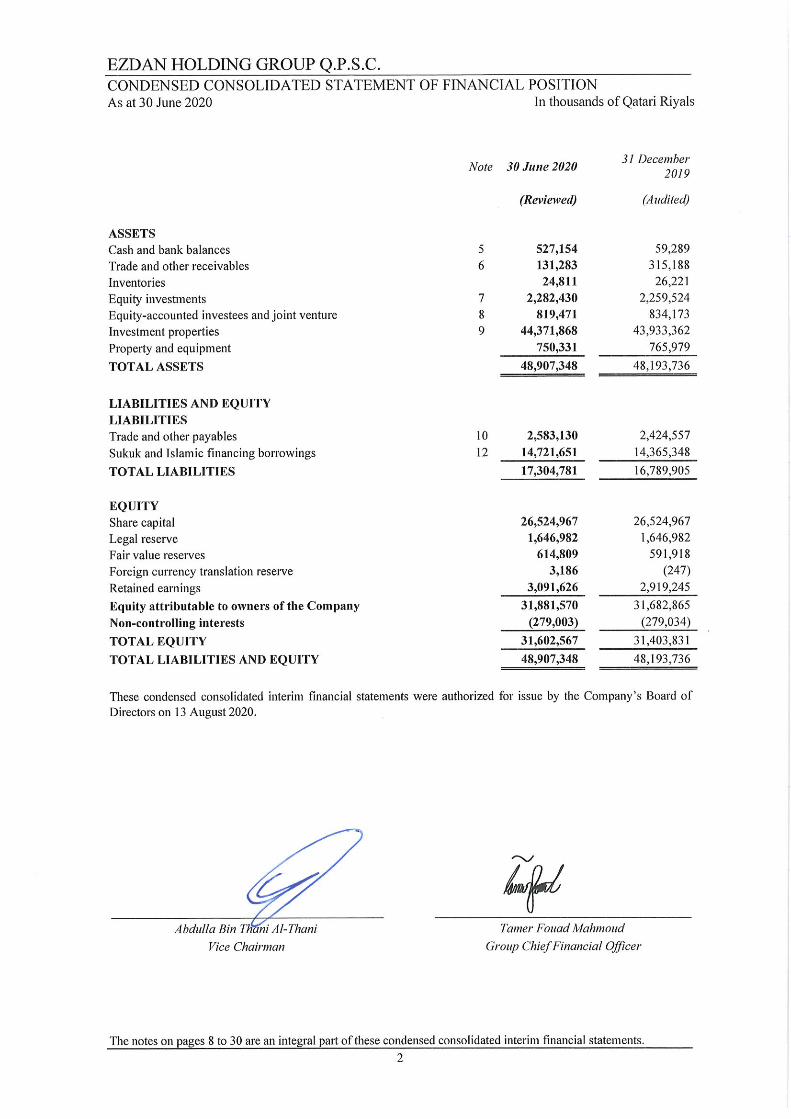
Condensed consolidated interim financial statements: Condensed consolidated statement of financial position
2
Condensed consolidated statement of profit or loss 3
Condensed consolidated statement of comprehensive income
4
Condensed consolidated statement of changes in equity
5 - 6
Condensed consolidated statement of cash flows
7
Notes to the condensed consolidated interim financial statements
8 - 30
EZDAN HOLDING GROUP Q.P.S.C.
The notes on pages 8 to 30 are an integral part of these condensed consolidated interim financial statements. 3
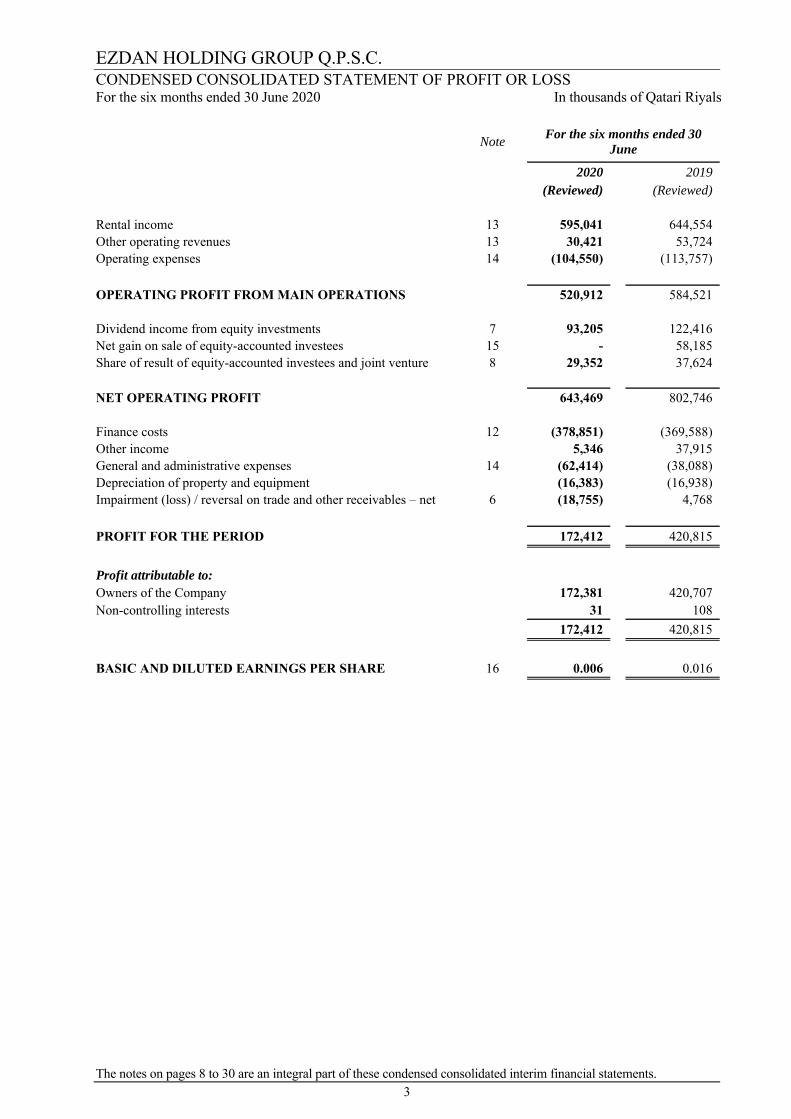
CONDENSED CONSOLIDATED STATEMENT OF PROFIT OR LOSS For the six months ended 30 June 2020 In thousands of Qatari Riyals
Note For the six months ended 30 June
2020 2019 (Reviewed) (Reviewed)
Rental income 13 595,041 644,554 Other operating revenues 13 30,421 53,724 Operating expenses 14 (104,550) (113,757)
OPERATING PROFIT FROM MAIN OPERATIONS 520,912 584,521
Dividend income from equity investments 7 93,205 122,416 Net gain on sale of equity-accounted investees 15 - 58,185 Share of result of equity-accounted investees and joint venture 8 29,352 37,624
NET OPERATING PROFIT 643,469 802,746
Finance costs 12 (378,851) (369,588) Other income 5,346 37,915 General and administrative expenses 14 (62,414) (38,088) Depreciation of property and equipment (16,383) (16,938) Impairment (loss) / reversal on trade and other receivables – net 6 (18,755) 4,768
PROFIT FOR THE PERIOD 172,412 420,815
Profit attributable to:
Owners of the Company 172,381 420,707 Non-controlling interests 31 108
172,412 420,815
BASIC AND DILUTED EARNINGS PER SHARE 16 0.006 0.016
EZDAN HOLDING GROUP Q.P.S.C.
The notes on pages 8 to 30 are an integral part of these condensed consolidated interim financial statements. 4
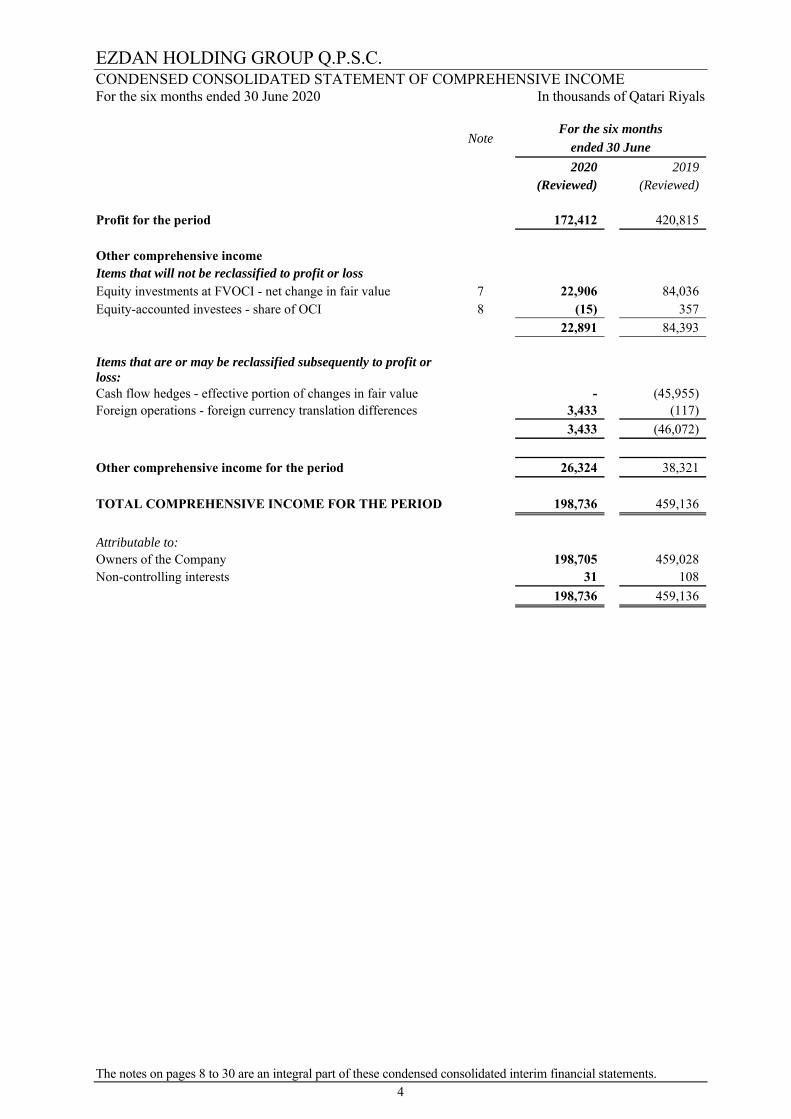
CONDENSED CONSOLIDATED STATEMENT OF COMPREHENSIVE INCOME For the six months ended 30 June 2020 In thousands of Qatari Riyals
Note For the six months
ended 30 June 2020 2019
(Reviewed) (Reviewed)
Profit for the period 172,412 420,815
Other comprehensive income
Items that will not be reclassified to profit or loss
Equity investments at FVOCI - net change in fair value 7 22,906 84,036 Equity-accounted investees - share of OCI 8 (15) 357
22,891 84,393
Items that are or may be reclassified subsequently to profit or loss:
Cash flow hedges - effective portion of changes in fair value - (45,955) Foreign operations - foreign currency translation differences 3,433 (117)
3,433 (46,072)
Other comprehensive income for the period 26,324 38,321
TOTAL COMPREHENSIVE INCOME FOR THE PERIOD 198,736 459,136
Attributable to:
Owners of the Company 198,705 459,028 Non-controlling interests 31 108
198,736 459,136
EZDAN HOLDING GROUP Q.P.S.C.
The notes on pages 8 to 30 are an integral part of these condensed consolidated interim financial statements. 5
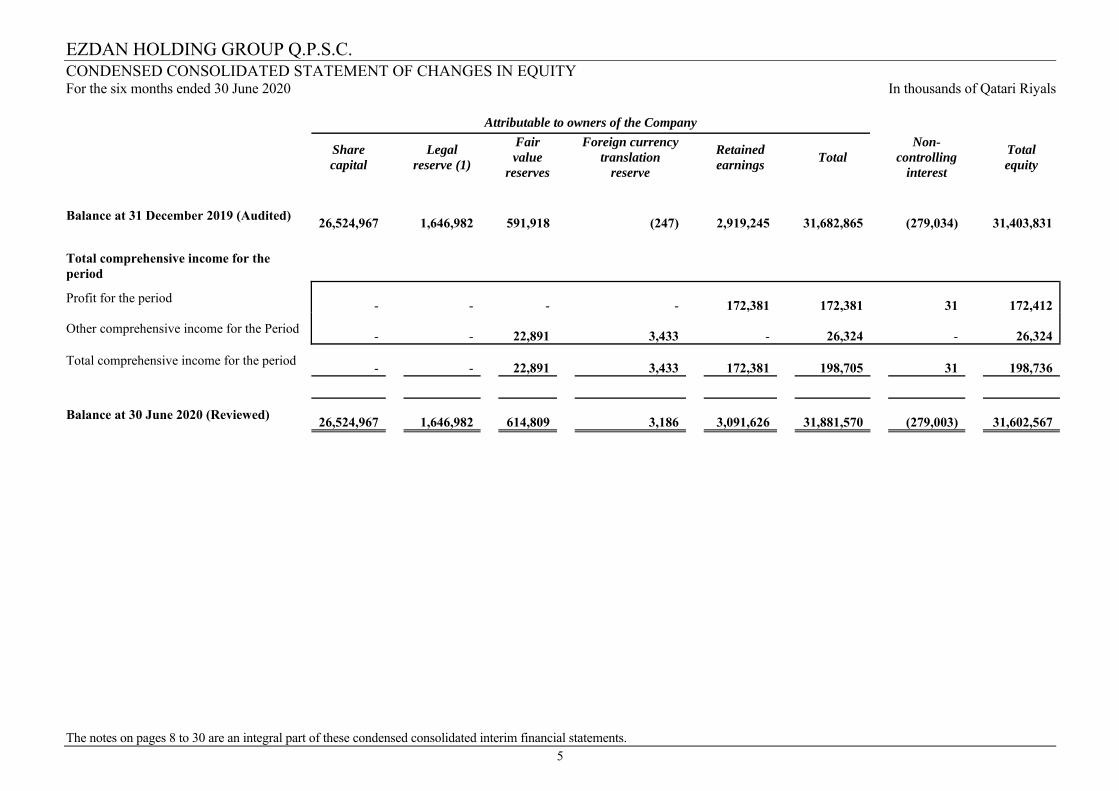
CONDENSED CONSOLIDATED STATEMENT OF CHANGES IN EQUITY For the six months ended 30 June 2020 In thousands of Qatari Riyals
Attributable to owners of the Company
Share capital
Legal
reserve (1)
Fair value
reserves
Foreign currency translation
reserve
Retained earnings
Total Non-
controlling interest
Total equity
Balance at 31 December 2019 (Audited)
26,524,967
1,646,982
591,918
(247)
2,919,245
31,682,865
(279,034)
31,403,831
Total comprehensive income for the period
Profit for the period
-
-
-
-
172,381
172,381
31
172,412
Other comprehensive income for the Period
-
-
22,891
3,433
- 26,324
- 26,324
Total comprehensive income for the period
-
-
22,891
3,433 172,381 198,705
31 198,736
Balance at 30 June 2020 (Reviewed)
26,524,967
1,646,982 614,809
3,186
3,091,626 31,881,570
(279,003) 31,602,567
EZDAN HOLDING GROUP Q.P.S.C.
The notes on pages 8 to 30 are an integral part of these condensed consolidated interim financial statements. 6
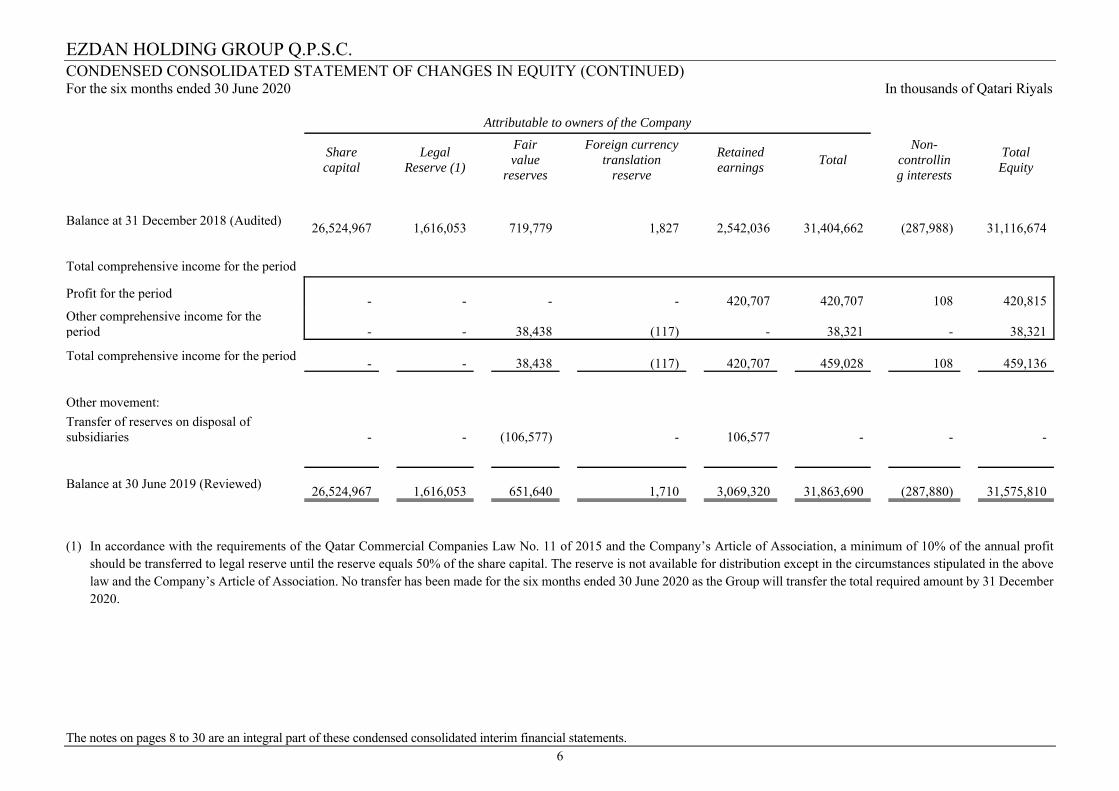
CONDENSED CONSOLIDATED STATEMENT OF CHANGES IN EQUITY (CONTINUED) For the six months ended 30 June 2020 In thousands of Qatari Riyals Attributable to owners of the Company
Share capital
Legal
Reserve (1)
Fair value
reserves
Foreign currency translation
reserve
Retained earnings
Total Non-
controlling interests
Total Equity
Balance at 31 December 2018 (Audited)
26,524,967
1,616,053
719,779
1,827
2,542,036
31,404,662
(287,988)
31,116,674
Total comprehensive income for the period
Profit for the period
-
-
-
-
420,707
420,707
108
420,815 Other comprehensive income for the period
-
-
38,438
(117)
-
38,321
-
38,321
Total comprehensive income for the period
-
-
38,438
(117)
420,707
459,028
108
459,136
Other movement:
Transfer of reserves on disposal of subsidiaries
-
-
(106,577)
-
106,577
-
-
-
Balance at 30 June 2019 (Reviewed)
26,524,967
1,616,053
651,640
1,710
3,069,320
31,863,690
(287,880)
31,575,810
(1) In accordance with the requirements of the Qatar Commercial Companies Law No. 11 of 2015 and the Company’s Article of Association, a minimum of 10% of the annual profit
should be transferred to legal reserve until the reserve equals 50% of the share capital. The reserve is not available for distribution except in the circumstances stipulated in the above law and the Company’s Article of Association. No transfer has been made for the six months ended 30 June 2020 as the Group will transfer the total required amount by 31 December 2020.
EZDAN HOLDING GROUP Q.P.S.C.
The notes on pages 8 to 30 are an integral part of these condensed consolidated interim financial statements. 7
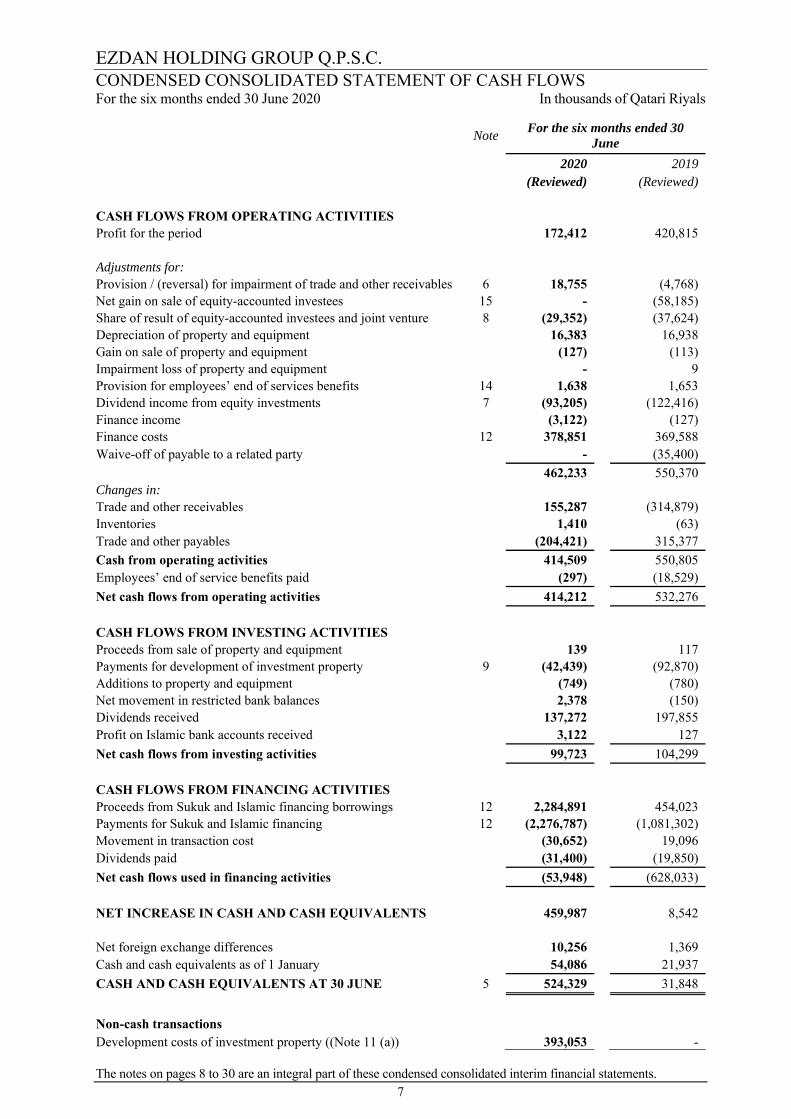
CONDENSED CONSOLIDATED STATEMENT OF CASH FLOWS For the six months ended 30 June 2020 In thousands of Qatari Riyals
Note For the six months ended 30
June 2020 2019
(Reviewed) (Reviewed)
CASH FLOWS FROM OPERATING ACTIVITIES
Profit for the period 172,412 420,815
Adjustments for:
Provision / (reversal) for impairment of trade and other receivables 6 18,755 (4,768) Net gain on sale of equity-accounted investees 15 - (58,185) Share of result of equity-accounted investees and joint venture 8 (29,352) (37,624) Depreciation of property and equipment 16,383 16,938 Gain on sale of property and equipment (127) (113) Impairment loss of property and equipment - 9 Provision for employees’ end of services benefits 14 1,638 1,653 Dividend income from equity investments 7 (93,205) (122,416) Finance income (3,122) (127) Finance costs 12 378,851 369,588 Waive-off of payable to a related party - (35,400)
462,233 550,370 Changes in:
Trade and other receivables 155,287 (314,879) Inventories 1,410 (63) Trade and other payables (204,421) 315,377
Cash from operating activities 414,509 550,805 Employees’ end of service benefits paid (297) (18,529)
Net cash flows from operating activities 414,212 532,276
CASH FLOWS FROM INVESTING ACTIVITIES
Proceeds from sale of property and equipment 139 117 Payments for development of investment property 9 (42,439) (92,870) Additions to property and equipment (749) (780) Net movement in restricted bank balances 2,378 (150) Dividends received 137,272 197,855 Profit on Islamic bank accounts received 3,122 127
Net cash flows from investing activities 99,723 104,299
CASH FLOWS FROM FINANCING ACTIVITIES
Proceeds from Sukuk and Islamic financing borrowings 12 2,284,891 454,023 Payments for Sukuk and Islamic financing 12 (2,276,787) (1,081,302) Movement in transaction cost (30,652) 19,096 Dividends paid (31,400) (19,850)
Net cash flows used in financing activities (53,948) (628,033)
NET INCREASE IN CASH AND CASH EQUIVALENTS 459,987 8,542
Net foreign exchange differences 10,256 1,369 Cash and cash equivalents as of 1 January 54,086 21,937
CASH AND CASH EQUIVALENTS AT 30 JUNE 5 524,329 31,848
Non-cash transactions Development costs of investment property ((Note 11 (a)) 393,053 -
EZDAN HOLDING GROUP Q.P.S.C. NOTES TO THE CONDENSED CONSOLIDATED INTERIM FINANCIAL STATEMENTS For the six months ended 30 June 2020
8
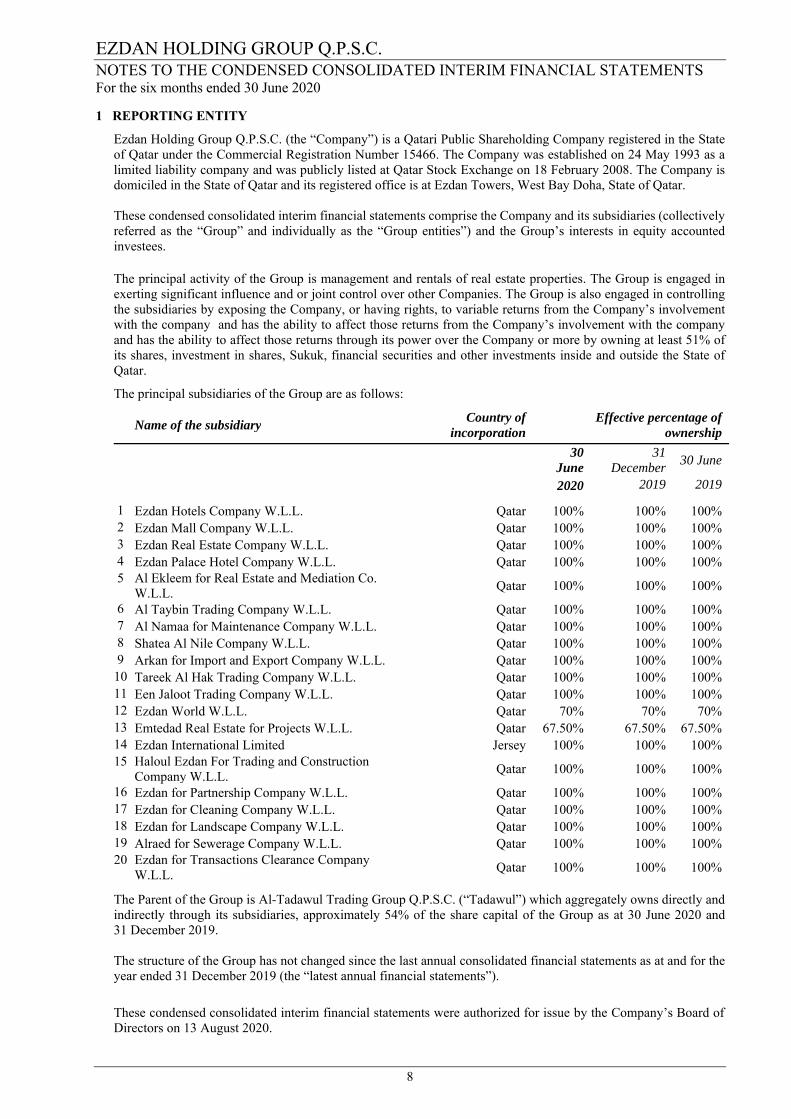
1 REPORTING ENTITY
Ezdan Holding Group Q.P.S.C. (the “Company”) is a Qatari Public Shareholding Company registered in the State of Qatar under the Commercial Registration Number 15466. The Company was established on 24 May 1993 as a limited liability company and was publicly listed at Qatar Stock Exchange on 18 February 2008. The Company is domiciled in the State of Qatar and its registered office is at Ezdan Towers, West Bay Doha, State of Qatar.
These condensed consolidated interim financial statements comprise the Company and its subsidiaries (collectively referred as the “Group” and individually as the “Group entities”) and the Group’s interests in equity accounted investees.
The principal activity of the Group is management and rentals of real estate properties. The Group is engaged in exerting significant influence and or joint control over other Companies. The Group is also engaged in controlling the subsidiaries by exposing the Company, or having rights, to variable returns from the Company’s involvement with the company and has the ability to affect those returns from the Company’s involvement with the company and has the ability to affect those returns through its power over the Company or more by owning at least 51% of its shares, investment in shares, Sukuk, financial securities and other investments inside and outside the State of Qatar.
The principal subsidiaries of the Group are as follows:
Name of the subsidiary
Country of incorporation
Effective percentage of ownership
30 June
31 December
30 June
2020 2019 2019
1 Ezdan Hotels Company W.L.L. Qatar 100% 100% 100% 2 Ezdan Mall Company W.L.L. Qatar 100% 100% 100% 3 Ezdan Real Estate Company W.L.L. Qatar 100% 100% 100% 4 Ezdan Palace Hotel Company W.L.L. Qatar 100% 100% 100% 5 Al Ekleem for Real Estate and Mediation Co.
W.L.L. Qatar 100% 100% 100%
6 Al Taybin Trading Company W.L.L. Qatar 100% 100% 100% 7 Al Namaa for Maintenance Company W.L.L. Qatar 100% 100% 100% 8 Shatea Al Nile Company W.L.L. Qatar 100% 100% 100% 9 Arkan for Import and Export Company W.L.L. Qatar 100% 100% 100%
10 Tareek Al Hak Trading Company W.L.L. Qatar 100% 100% 100% 11 Een Jaloot Trading Company W.L.L. Qatar 100% 100% 100% 12 Ezdan World W.L.L. Qatar 70% 70% 70% 13 Emtedad Real Estate for Projects W.L.L. Qatar 67.50% 67.50% 67.50% 14 Ezdan International Limited Jersey 100% 100% 100% 15 Haloul Ezdan For Trading and Construction
Company W.L.L. Qatar 100% 100% 100%
16 Ezdan for Partnership Company W.L.L. Qatar 100% 100% 100% 17 Ezdan for Cleaning Company W.L.L. Qatar 100% 100% 100% 18 Ezdan for Landscape Company W.L.L. Qatar 100% 100% 100% 19 Alraed for Sewerage Company W.L.L. Qatar 100% 100% 100% 20 Ezdan for Transactions Clearance Company
W.L.L. Qatar 100% 100% 100%
The Parent of the Group is Al-Tadawul Trading Group Q.P.S.C. (“Tadawul”) which aggregately owns directly and indirectly through its subsidiaries, approximately 54% of the share capital of the Group as at 30 June 2020 and 31 December 2019. The structure of the Group has not changed since the last annual consolidated financial statements as at and for the year ended 31 December 2019 (the “latest annual financial statements”).
These condensed consolidated interim financial statements were authorized for issue by the Company’s Board of Directors on 13 August 2020.
EZDAN HOLDING GROUP Q.P.S.C. NOTES TO THE CONDENSED CONSOLIDATED INTERIM FINANCIAL STATEMENTS For the six months ended 30 June 2020
9
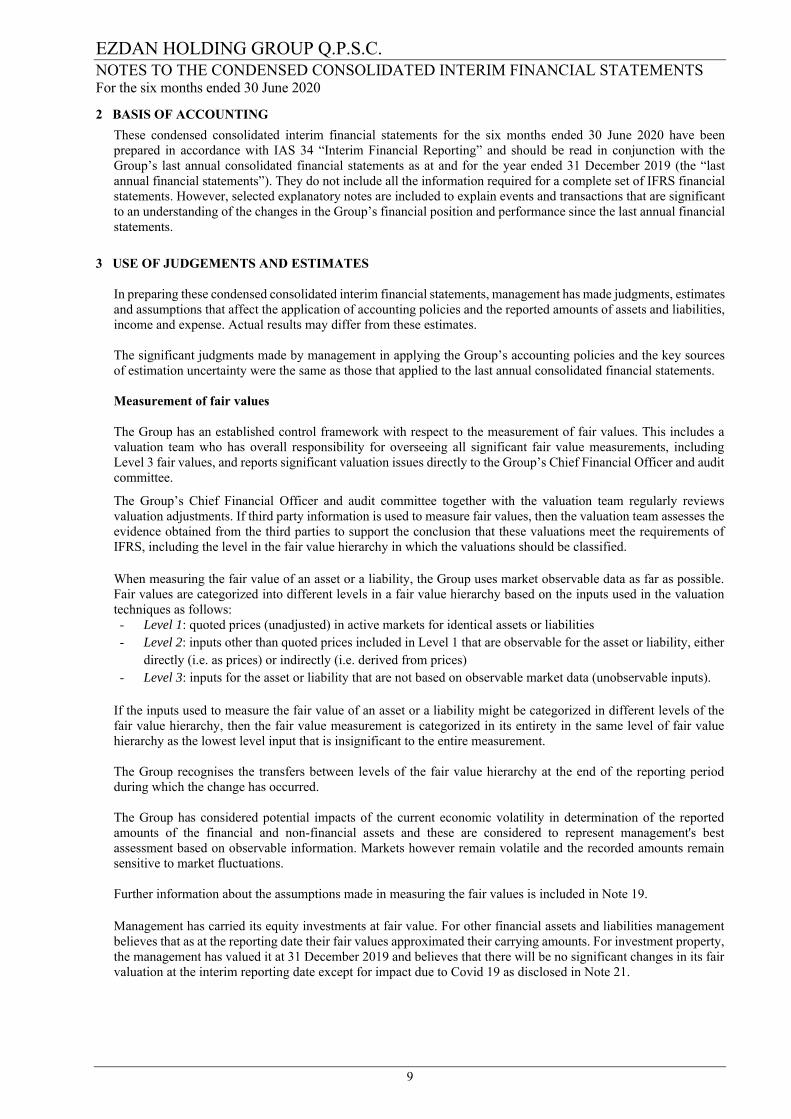
2 BASIS OF ACCOUNTING
These condensed consolidated interim financial statements for the six months ended 30 June 2020 have been prepared in accordance with IAS 34 “Interim Financial Reporting” and should be read in conjunction with the Group’s last annual consolidated financial statements as at and for the year ended 31 December 2019 (the “last annual financial statements”). They do not include all the information required for a complete set of IFRS financial statements. However, selected explanatory notes are included to explain events and transactions that are significant to an understanding of the changes in the Group’s financial position and performance since the last annual financial statements.
3 USE OF JUDGEMENTS AND ESTIMATES
In preparing these condensed consolidated interim financial statements, management has made judgments, estimates and assumptions that affect the application of accounting policies and the reported amounts of assets and liabilities, income and expense. Actual results may differ from these estimates.
The significant judgments made by management in applying the Group’s accounting policies and the key sources of estimation uncertainty were the same as those that applied to the last annual consolidated financial statements.
Measurement of fair values
The Group has an established control framework with respect to the measurement of fair values. This includes a valuation team who has overall responsibility for overseeing all significant fair value measurements, including Level 3 fair values, and reports significant valuation issues directly to the Group’s Chief Financial Officer and audit committee.
The Group’s Chief Financial Officer and audit committee together with the valuation team regularly reviews valuation adjustments. If third party information is used to measure fair values, then the valuation team assesses the evidence obtained from the third parties to support the conclusion that these valuations meet the requirements of IFRS, including the level in the fair value hierarchy in which the valuations should be classified. When measuring the fair value of an asset or a liability, the Group uses market observable data as far as possible. Fair values are categorized into different levels in a fair value hierarchy based on the inputs used in the valuation techniques as follows: - Level 1: quoted prices (unadjusted) in active markets for identical assets or liabilities - Level 2: inputs other than quoted prices included in Level 1 that are observable for the asset or liability, either
directly (i.e. as prices) or indirectly (i.e. derived from prices) - Level 3: inputs for the asset or liability that are not based on observable market data (unobservable inputs).
If the inputs used to measure the fair value of an asset or a liability might be categorized in different levels of the fair value hierarchy, then the fair value measurement is categorized in its entirety in the same level of fair value hierarchy as the lowest level input that is insignificant to the entire measurement.
The Group recognises the transfers between levels of the fair value hierarchy at the end of the reporting period during which the change has occurred. The Group has considered potential impacts of the current economic volatility in determination of the reported amounts of the financial and non-financial assets and these are considered to represent management's best assessment based on observable information. Markets however remain volatile and the recorded amounts remain sensitive to market fluctuations.
Further information about the assumptions made in measuring the fair values is included in Note 19. Management has carried its equity investments at fair value. For other financial assets and liabilities management believes that as at the reporting date their fair values approximated their carrying amounts. For investment property, the management has valued it at 31 December 2019 and believes that there will be no significant changes in its fair valuation at the interim reporting date except for impact due to Covid 19 as disclosed in Note 21.
EZDAN HOLDING GROUP Q.P.S.C. NOTES TO THE CONDENSED CONSOLIDATED INTERIM FINANCIAL STATEMENTS For the six months ended 30 June 2020 In thousands of Qatari Riyals
9
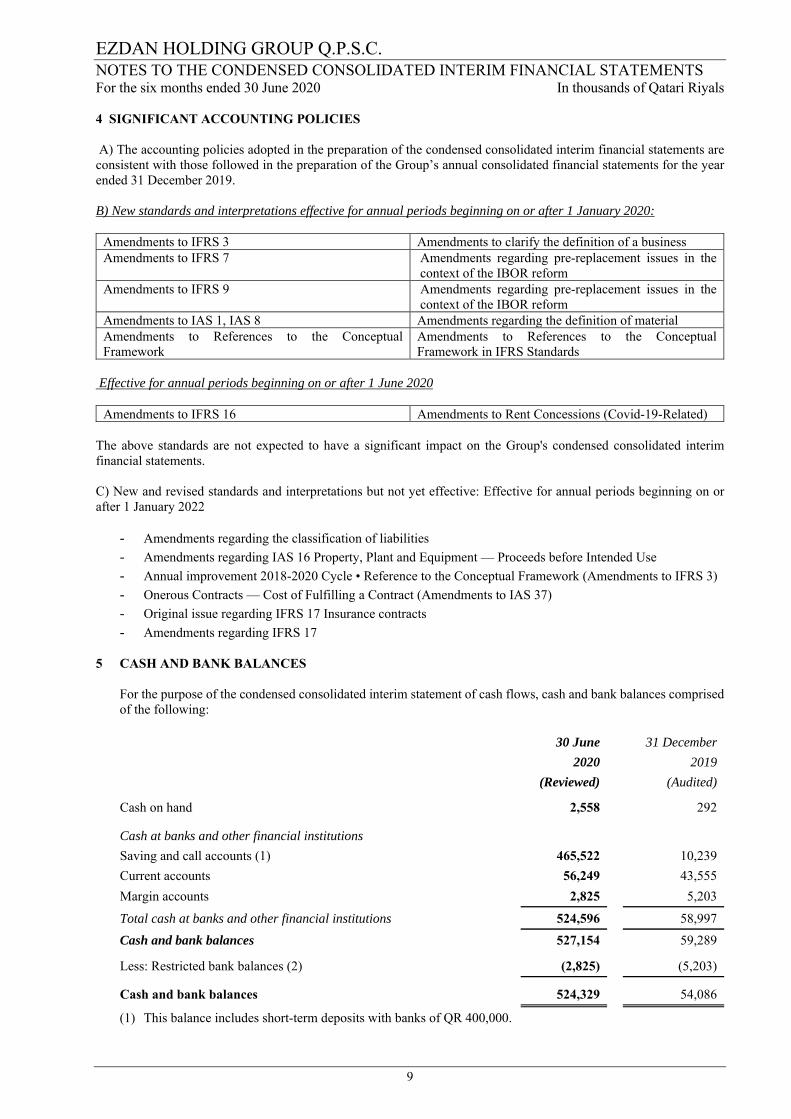
4 SIGNIFICANT ACCOUNTING POLICIES A) The accounting policies adopted in the preparation of the condensed consolidated interim financial statements are consistent with those followed in the preparation of the Group’s annual consolidated financial statements for the year ended 31 December 2019. B) New standards and interpretations effective for annual periods beginning on or after 1 January 2020:
Amendments to IFRS 3 Amendments to clarify the definition of a businessAmendments to IFRS 7 Amendments regarding pre-replacement issues in the
context of the IBOR reform Amendments to IFRS 9 Amendments regarding pre-replacement issues in the
context of the IBOR reform Amendments to IAS 1, IAS 8 Amendments regarding the definition of material Amendments to References to the Conceptual Framework
Amendments to References to the Conceptual Framework in IFRS Standards
Effective for annual periods beginning on or after 1 June 2020
Amendments to IFRS 16 Amendments to Rent Concessions (Covid-19-Related) The above standards are not expected to have a significant impact on the Group's condensed consolidated interim financial statements. C) New and revised standards and interpretations but not yet effective: Effective for annual periods beginning on or after 1 January 2022
- Amendments regarding the classification of liabilities - Amendments regarding IAS 16 Property, Plant and Equipment — Proceeds before Intended Use - Annual improvement 2018-2020 Cycle • Reference to the Conceptual Framework (Amendments to IFRS 3) - Onerous Contracts — Cost of Fulfilling a Contract (Amendments to IAS 37) - Original issue regarding IFRS 17 Insurance contracts - Amendments regarding IFRS 17
5 CASH AND BANK BALANCES
For the purpose of the condensed consolidated interim statement of cash flows, cash and bank balances comprised of the following:
30 June 31 December
2020 2019
(Reviewed) (Audited)
Cash on hand 2,558 292
Cash at banks and other financial institutions
Saving and call accounts (1) 465,522 10,239
Current accounts 56,249 43,555
Margin accounts 2,825 5,203
Total cash at banks and other financial institutions 524,596 58,997
Cash and bank balances 527,154 59,289
Less: Restricted bank balances (2) (2,825) (5,203)
Cash and bank balances 524,329 54,086
(1) This balance includes short-term deposits with banks of QR 400,000.
EZDAN HOLDING GROUP Q.P.S.C. NOTES TO THE CONDENSED CONSOLIDATED INTERIM FINANCIAL STATEMENTS For the six months ended 30 June 2020 In thousands of Qatari Riyals
9
5 CASH AND BANK BALANCES (CONTINUED)
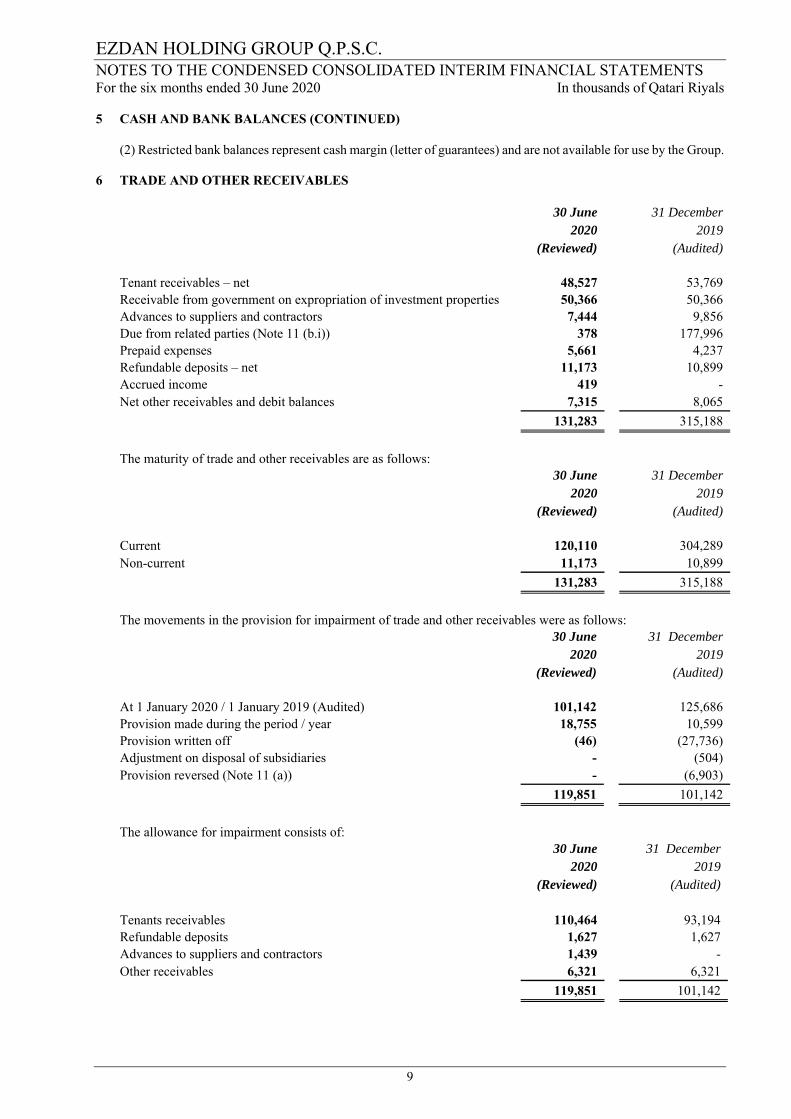
(2) Restricted bank balances represent cash margin (letter of guarantees) and are not available for use by the Group.
6 TRADE AND OTHER RECEIVABLES 30 June 31 December
2020 2019 (Reviewed) (Audited)
Tenant receivables – net 48,527 53,769 Receivable from government on expropriation of investment properties 50,366 50,366 Advances to suppliers and contractors 7,444 9,856 Due from related parties (Note 11 (b.i)) 378 177,996 Prepaid expenses 5,661 4,237 Refundable deposits – net 11,173 10,899 Accrued income 419 - Net other receivables and debit balances 7,315 8,065
131,283 315,188
The maturity of trade and other receivables are as follows:
30 June 31 December 2020 2019
(Reviewed) (Audited)
Current 120,110 304,289 Non-current 11,173 10,899
131,283 315,188
The movements in the provision for impairment of trade and other receivables were as follows:
30 June 31 December 2020 2019
(Reviewed) (Audited)
At 1 January 2020 / 1 January 2019 (Audited) 101,142 125,686 Provision made during the period / year 18,755 10,599 Provision written off (46) (27,736) Adjustment on disposal of subsidiaries - (504) Provision reversed (Note 11 (a)) - (6,903)
119,851 101,142
The allowance for impairment consists of: 30 June 31 December
2020 2019 (Reviewed) (Audited)
Tenants receivables 110,464 93,194 Refundable deposits 1,627 1,627 Advances to suppliers and contractors 1,439 - Other receivables 6,321 6,321
119,851 101,142
EZDAN HOLDING GROUP Q.P.S.C. NOTES TO THE CONDENSED CONSOLIDATED INTERIM FINANCIAL STATEMENTS For the six months ended 30 June 2020 In thousands of Qatari Riyals
12
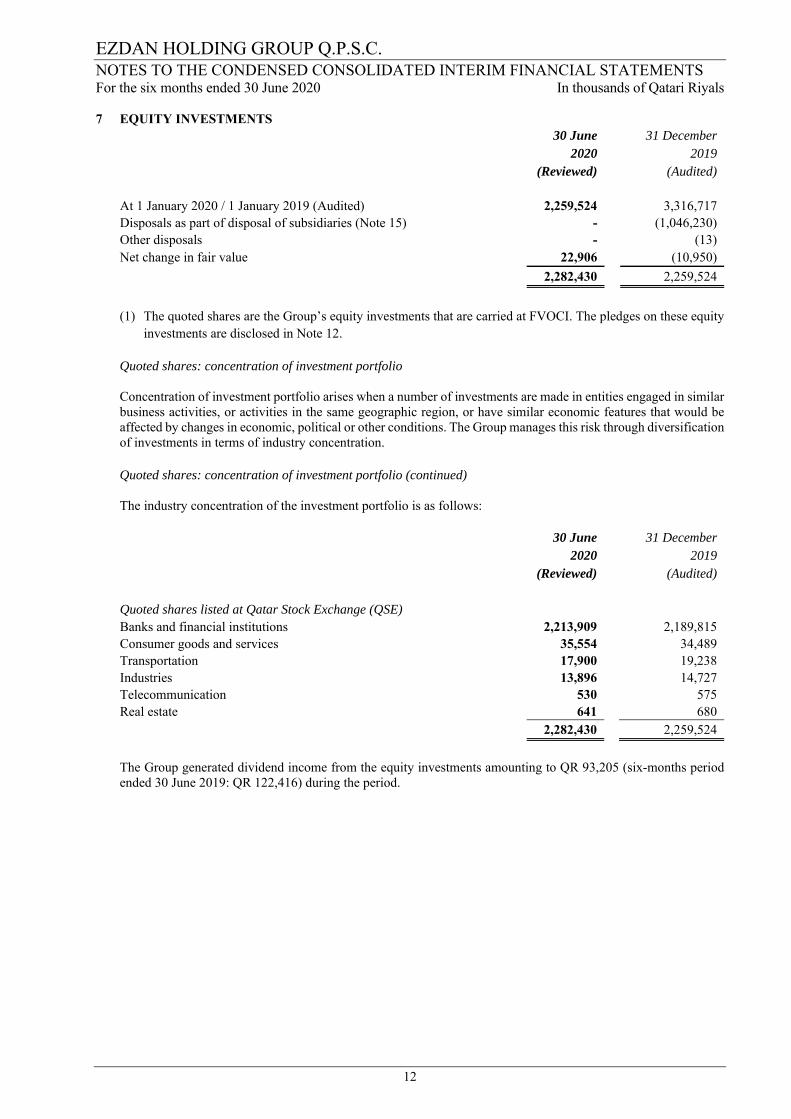
7 EQUITY INVESTMENTS
30 June 31 December 2020 2019
(Reviewed) (Audited)
At 1 January 2020 / 1 January 2019 (Audited) 2,259,524 3,316,717 Disposals as part of disposal of subsidiaries (Note 15) - (1,046,230) Other disposals - (13) Net change in fair value 22,906 (10,950) 2,282,430 2,259,524
(1) The quoted shares are the Group’s equity investments that are carried at FVOCI. The pledges on these equity
investments are disclosed in Note 12.
Quoted shares: concentration of investment portfolio Concentration of investment portfolio arises when a number of investments are made in entities engaged in similar business activities, or activities in the same geographic region, or have similar economic features that would be affected by changes in economic, political or other conditions. The Group manages this risk through diversification of investments in terms of industry concentration.
Quoted shares: concentration of investment portfolio (continued)
The industry concentration of the investment portfolio is as follows: 30 June 31 December
2020 2019 (Reviewed) (Audited)
Quoted shares listed at Qatar Stock Exchange (QSE)
Banks and financial institutions 2,213,909 2,189,815 Consumer goods and services 35,554 34,489 Transportation 17,900 19,238 Industries 13,896 14,727 Telecommunication 530 575 Real estate 641 680
2,282,430 2,259,524
The Group generated dividend income from the equity investments amounting to QR 93,205 (six-months period ended 30 June 2019: QR 122,416) during the period.
EZDAN HOLDING GROUP Q.P.S.C. NOTES TO THE CONDENSED CONSOLIDATED INTERIM FINANCIAL STATEMENTS For the six months ended 30 June 2020 In thousands of Qatari Riyals
13
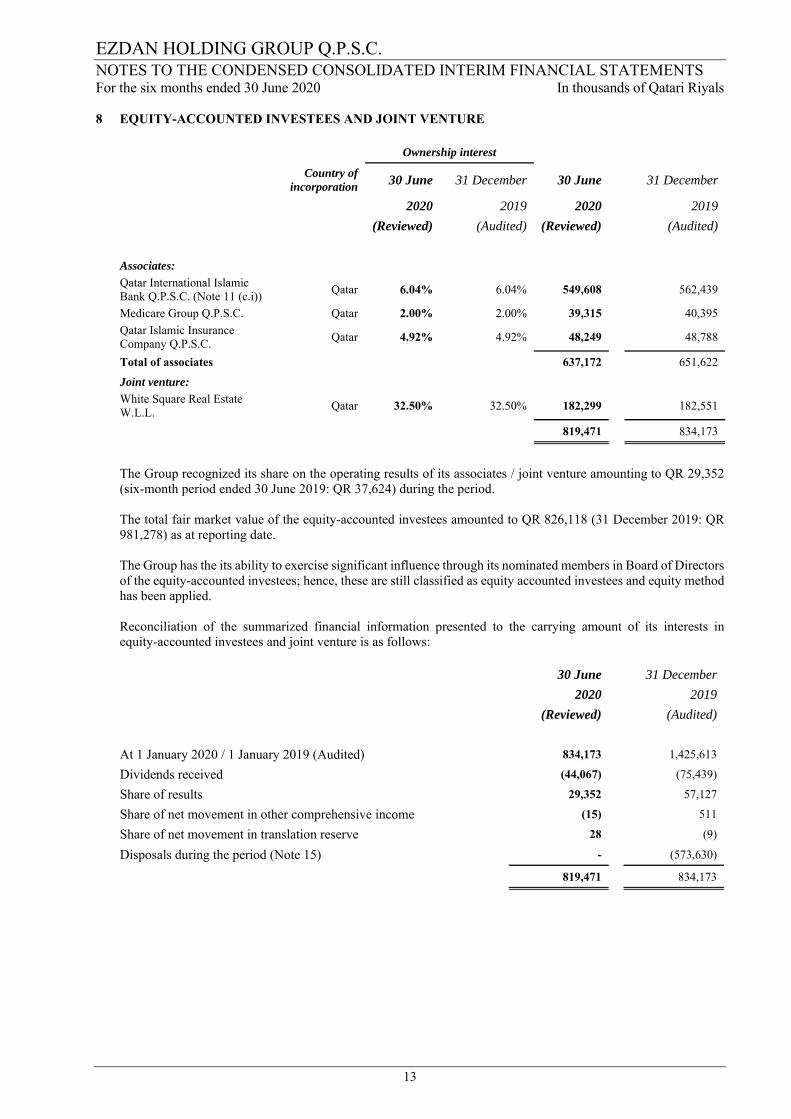
8 EQUITY-ACCOUNTED INVESTEES AND JOINT VENTURE
Ownership interest
Country of incorporation 30 June 31 December 30 June
31 December
2020 2019 2020 2019 (Reviewed) (Audited) (Reviewed) (Audited)
Associates:
Qatar International Islamic Bank Q.P.S.C. (Note 11 (c.i))
Qatar 6.04% 6.04% 549,608 562,439
Medicare Group Q.P.S.C. Qatar 2.00% 2.00% 39,315 40,395
Qatar Islamic Insurance Company Q.P.S.C.
Qatar 4.92% 4.92% 48,249 48,788
Total of associates 637,172 651,622
Joint venture:
White Square Real Estate W.L.L.
Qatar 32.50% 32.50% 182,299 182,551
819,471 834,173
The Group recognized its share on the operating results of its associates / joint venture amounting to QR 29,352 (six-month period ended 30 June 2019: QR 37,624) during the period.
The total fair market value of the equity-accounted investees amounted to QR 826,118 (31 December 2019: QR 981,278) as at reporting date.
The Group has the its ability to exercise significant influence through its nominated members in Board of Directors of the equity-accounted investees; hence, these are still classified as equity accounted investees and equity method has been applied. Reconciliation of the summarized financial information presented to the carrying amount of its interests in equity-accounted investees and joint venture is as follows: 30 June 31 December
2020 2019
(Reviewed) (Audited)
At 1 January 2020 / 1 January 2019 (Audited) 834,173 1,425,613
Dividends received (44,067) (75,439)
Share of results 29,352 57,127
Share of net movement in other comprehensive income (15) 511
Share of net movement in translation reserve 28 (9)
Disposals during the period (Note 15) - (573,630)
819,471 834,173
EZDAN HOLDING GROUP Q.P.S.C. NOTES TO THE CONDENSED CONSOLIDATED INTERIM FINANCIAL STATEMENTS For the six months ended 30 June 2020 In thousands of Qatari Riyals
14
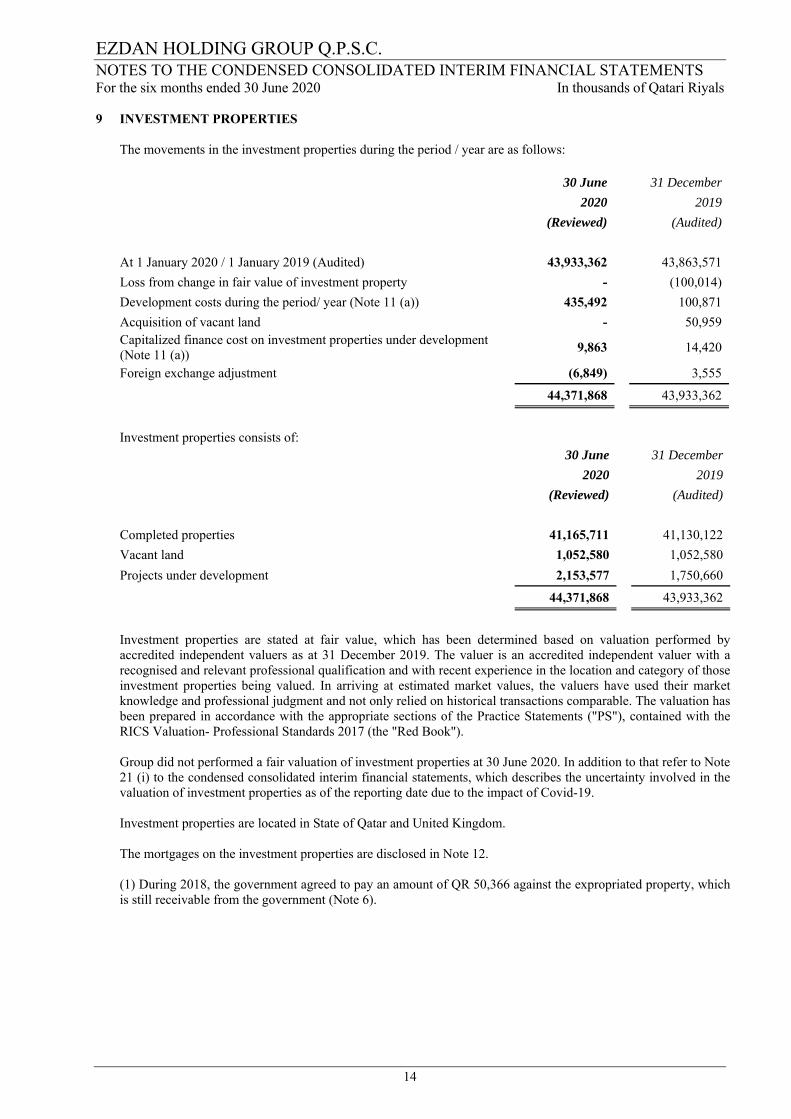
9 INVESTMENT PROPERTIES The movements in the investment properties during the period / year are as follows:
30 June 31 December
2020 2019
(Reviewed) (Audited)
At 1 January 2020 / 1 January 2019 (Audited) 43,933,362 43,863,571
Loss from change in fair value of investment property - (100,014)
Development costs during the period/ year (Note 11 (a)) 435,492 100,871
Acquisition of vacant land - 50,959 Capitalized finance cost on investment properties under development (Note 11 (a))
9,863 14,420
Foreign exchange adjustment (6,849) 3,555
44,371,868 43,933,362
Investment properties consists of: 30 June 31 December
2020 2019
(Reviewed) (Audited)
Completed properties 41,165,711 41,130,122
Vacant land 1,052,580 1,052,580
Projects under development 2,153,577 1,750,660
44,371,868 43,933,362
Investment properties are stated at fair value, which has been determined based on valuation performed by accredited independent valuers as at 31 December 2019. The valuer is an accredited independent valuer with a recognised and relevant professional qualification and with recent experience in the location and category of those investment properties being valued. In arriving at estimated market values, the valuers have used their market knowledge and professional judgment and not only relied on historical transactions comparable. The valuation has been prepared in accordance with the appropriate sections of the Practice Statements ("PS"), contained with the RICS Valuation- Professional Standards 2017 (the "Red Book"). Group did not performed a fair valuation of investment properties at 30 June 2020. In addition to that refer to Note 21 (i) to the condensed consolidated interim financial statements, which describes the uncertainty involved in the valuation of investment properties as of the reporting date due to the impact of Covid-19.
Investment properties are located in State of Qatar and United Kingdom.
The mortgages on the investment properties are disclosed in Note 12. (1) During 2018, the government agreed to pay an amount of QR 50,366 against the expropriated property, which is still receivable from the government (Note 6).
EZDAN HOLDING GROUP Q.P.S.C. NOTES TO THE CONDENSED CONSOLIDATED INTERIM FINANCIAL STATEMENTS For the six months ended 30 June 2020 In thousands of Qatari Riyals
15
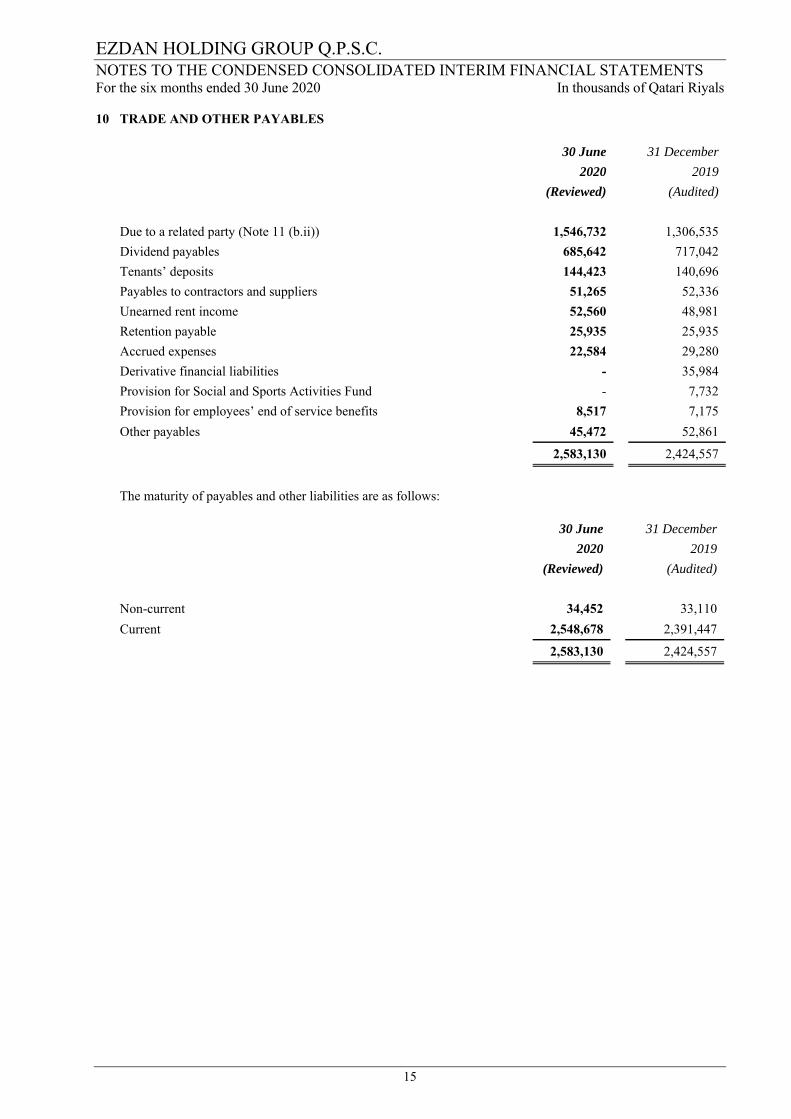
10 TRADE AND OTHER PAYABLES
30 June
31 December
2020
2019
(Reviewed)
(Audited)
Due to a related party (Note 11 (b.ii)) 1,546,732 1,306,535
Dividend payables 685,642 717,042
Tenants’ deposits 144,423 140,696
Payables to contractors and suppliers 51,265 52,336
Unearned rent income 52,560 48,981
Retention payable 25,935 25,935
Accrued expenses 22,584 29,280
Derivative financial liabilities - 35,984
Provision for Social and Sports Activities Fund - 7,732
Provision for employees’ end of service benefits 8,517 7,175
Other payables 45,472 52,861
2,583,130 2,424,557
The maturity of payables and other liabilities are as follows:
30 June 31 December
2020 2019
(Reviewed) (Audited)
Non-current 34,452 33,110
Current 2,548,678 2,391,447
2,583,130 2,424,557
EZDAN HOLDING GROUP Q.P.S.C. NOTES TO THE CONDENSED CONSOLIDATED INTERIM FINANCIAL STATEMENTS For the six months ended 30 June 2020 In thousands of Qatari Riyals
16
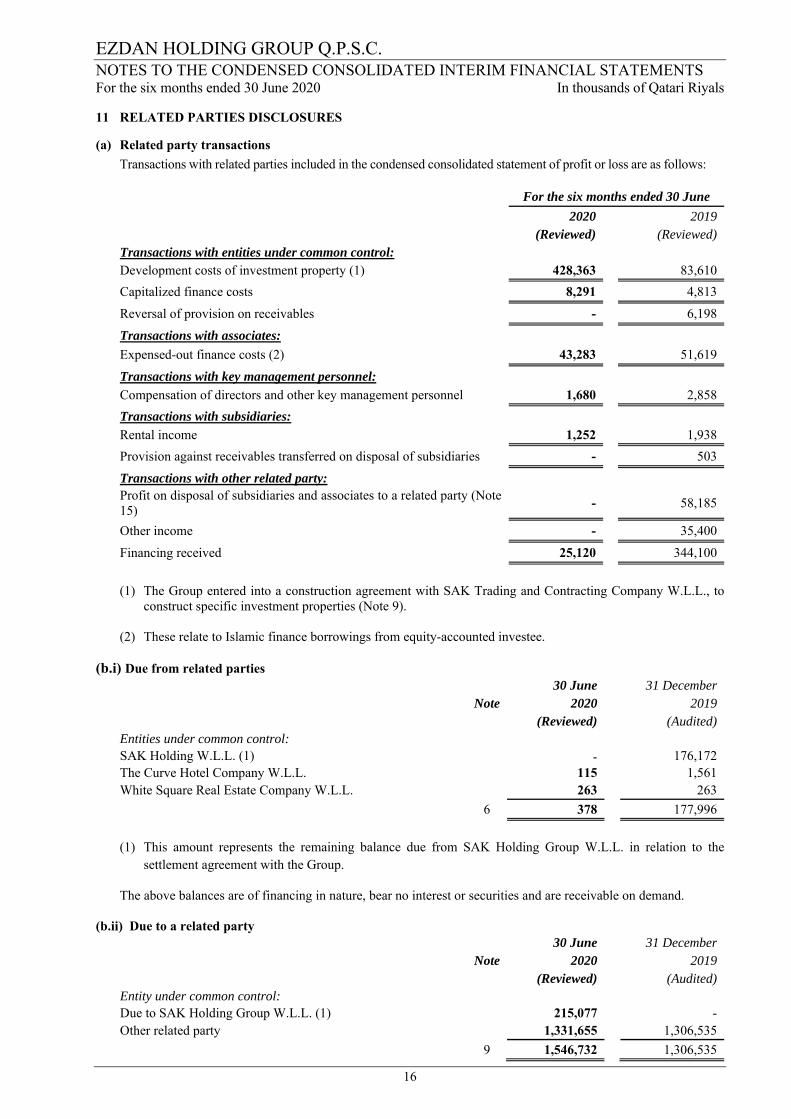
11 RELATED PARTIES DISCLOSURES
(a) Related party transactions
Transactions with related parties included in the condensed consolidated statement of profit or loss are as follows:
For the six months ended 30 June 2020 2019
(Reviewed) (Reviewed) Transactions with entities under common control:
Development costs of investment property (1) 428,363 83,610
Capitalized finance costs 8,291 4,813
Reversal of provision on receivables - 6,198
Transactions with associates:
Expensed-out finance costs (2) 43,283 51,619
Transactions with key management personnel:
Compensation of directors and other key management personnel 1,680 2,858
Transactions with subsidiaries:
Rental income 1,252 1,938
Provision against receivables transferred on disposal of subsidiaries - 503
Transactions with other related party:
Profit on disposal of subsidiaries and associates to a related party (Note 15)
- 58,185
Other income - 35,400
Financing received 25,120 344,100
(1) The Group entered into a construction agreement with SAK Trading and Contracting Company W.L.L., to
construct specific investment properties (Note 9).
(2) These relate to Islamic finance borrowings from equity-accounted investee. (b.i) Due from related parties
30 June 31 December Note 2020 2019
(Reviewed) (Audited) Entities under common control:
SAK Holding W.L.L. (1) - 176,172 The Curve Hotel Company W.L.L. 115 1,561 White Square Real Estate Company W.L.L. 263 263 6 378 177,996
(1) This amount represents the remaining balance due from SAK Holding Group W.L.L. in relation to the
settlement agreement with the Group.
The above balances are of financing in nature, bear no interest or securities and are receivable on demand.
(b.ii) Due to a related party 30 June 31 December
Note 2020 2019 (Reviewed) (Audited)
Entity under common control:
Due to SAK Holding Group W.L.L. (1) 215,077 - Other related party 1,331,655 1,306,535 9 1,546,732 1,306,535
EZDAN HOLDING GROUP Q.P.S.C. NOTES TO THE CONDENSED CONSOLIDATED INTERIM FINANCIAL STATEMENTS For the six months ended 30 June 2020 In thousands of Qatari Riyals
17
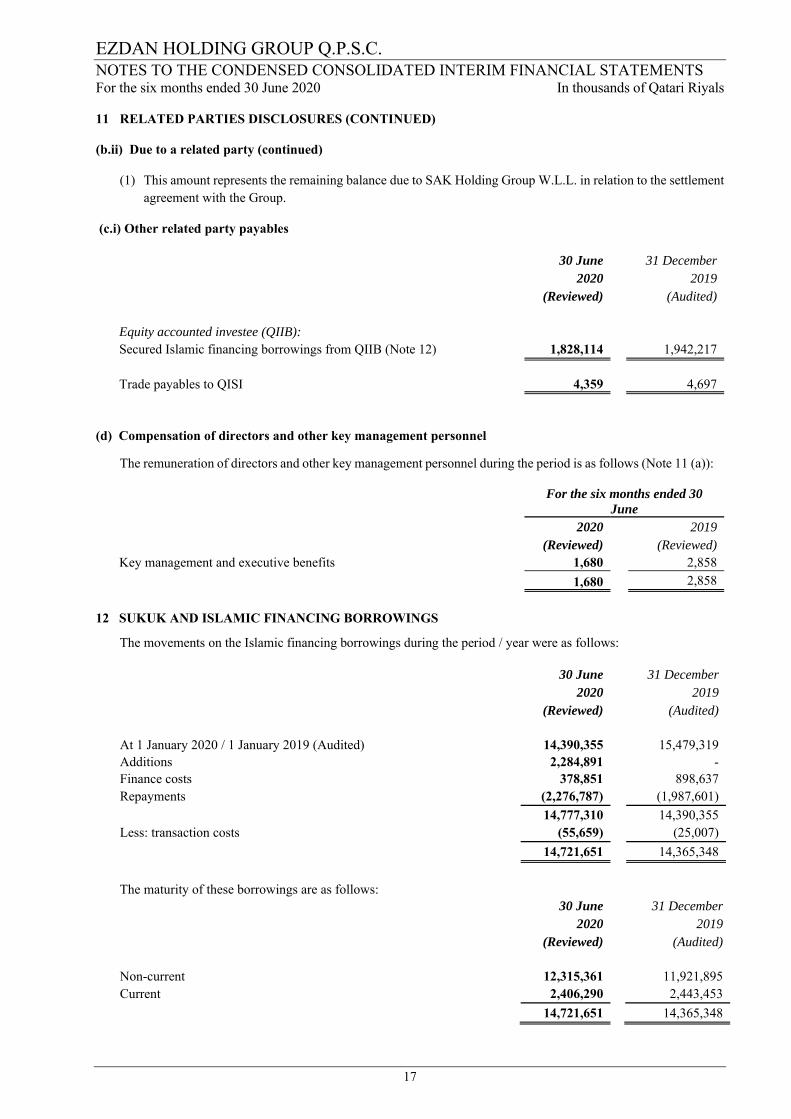
11 RELATED PARTIES DISCLOSURES (CONTINUED)
(b.ii) Due to a related party (continued)
(1) This amount represents the remaining balance due to SAK Holding Group W.L.L. in relation to the settlement agreement with the Group.
(c.i) Other related party payables
30 June 31 December 2020 2019
(Reviewed) (Audited)
Equity accounted investee (QIIB):
Secured Islamic financing borrowings from QIIB (Note 12) 1,828,114 1,942,217
Trade payables to QISI 4,359
4,697
(d) Compensation of directors and other key management personnel
The remuneration of directors and other key management personnel during the period is as follows (Note 11 (a)):
For the six months ended 30 June
2020 2019 (Reviewed) (Reviewed)
Key management and executive benefits 1,680 2,858
1,680 2,858
12 SUKUK AND ISLAMIC FINANCING BORROWINGS
The movements on the Islamic financing borrowings during the period / year were as follows: 30 June 31 December
2020 2019 (Reviewed) (Audited)
At 1 January 2020 / 1 January 2019 (Audited) 14,390,355 15,479,319 Additions 2,284,891 - Finance costs 378,851 898,637 Repayments (2,276,787) (1,987,601)
14,777,310 14,390,355 Less: transaction costs (55,659) (25,007)
14,721,651 14,365,348
The maturity of these borrowings are as follows:
30 June 31 December 2020 2019
(Reviewed) (Audited)
Non-current 12,315,361 11,921,895 Current 2,406,290 2,443,453
14,721,651 14,365,348
EZDAN HOLDING GROUP Q.P.S.C. NOTES TO THE CONDENSED CONSOLIDATED INTERIM FINANCIAL STATEMENTS For the six months ended 30 June 2020 In thousands of Qatari Riyals
18
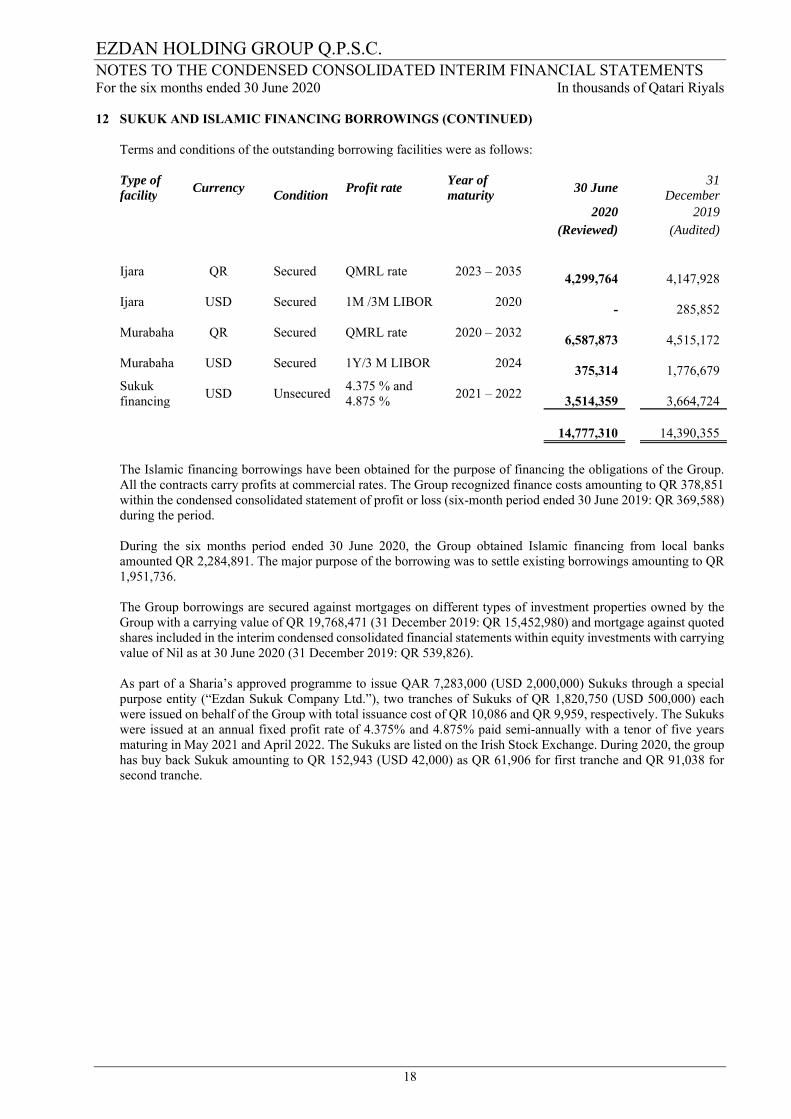
12 SUKUK AND ISLAMIC FINANCING BORROWINGS (CONTINUED) Terms and conditions of the outstanding borrowing facilities were as follows:
Type of facility
Currency
Condition
Profit rate Year of maturity
30 June 31 December
2020 2019
(Reviewed) (Audited)
Ijara QR
Secured QMRL rate 2023 – 2035 4,299,764
4,147,928
Ijara USD
Secured 1M /3M LIBOR 2020 -
285,852
Murabaha QR
Secured QMRL rate 2020 – 2032 6,587,873
4,515,172
Murabaha USD
Secured 1Y/3 M LIBOR 2024 375,314
1,776,679
Sukuk financing
USD
Unsecured 4.375 % and 4.875 %
2021 – 2022 3,514,359
3,664,724
14,777,310
14,390,355
The Islamic financing borrowings have been obtained for the purpose of financing the obligations of the Group. All the contracts carry profits at commercial rates. The Group recognized finance costs amounting to QR 378,851 within the condensed consolidated statement of profit or loss (six-month period ended 30 June 2019: QR 369,588) during the period. During the six months period ended 30 June 2020, the Group obtained Islamic financing from local banks amounted QR 2,284,891. The major purpose of the borrowing was to settle existing borrowings amounting to QR 1,951,736.
The Group borrowings are secured against mortgages on different types of investment properties owned by the Group with a carrying value of QR 19,768,471 (31 December 2019: QR 15,452,980) and mortgage against quoted shares included in the interim condensed consolidated financial statements within equity investments with carrying value of Nil as at 30 June 2020 (31 December 2019: QR 539,826).
As part of a Sharia’s approved programme to issue QAR 7,283,000 (USD 2,000,000) Sukuks through a special purpose entity (“Ezdan Sukuk Company Ltd.”), two tranches of Sukuks of QR 1,820,750 (USD 500,000) each were issued on behalf of the Group with total issuance cost of QR 10,086 and QR 9,959, respectively. The Sukuks were issued at an annual fixed profit rate of 4.375% and 4.875% paid semi-annually with a tenor of five years maturing in May 2021 and April 2022. The Sukuks are listed on the Irish Stock Exchange. During 2020, the group has buy back Sukuk amounting to QR 152,943 (USD 42,000) as QR 61,906 for first tranche and QR 91,038 for second tranche.
EZDAN HOLDING GROUP Q.P.S.C. NOTES TO THE CONDENSED CONSOLIDATED INTERIM FINANCIAL STATEMENTS For the six months ended 30 June 2020 In thousands of Qatari Riyals
19
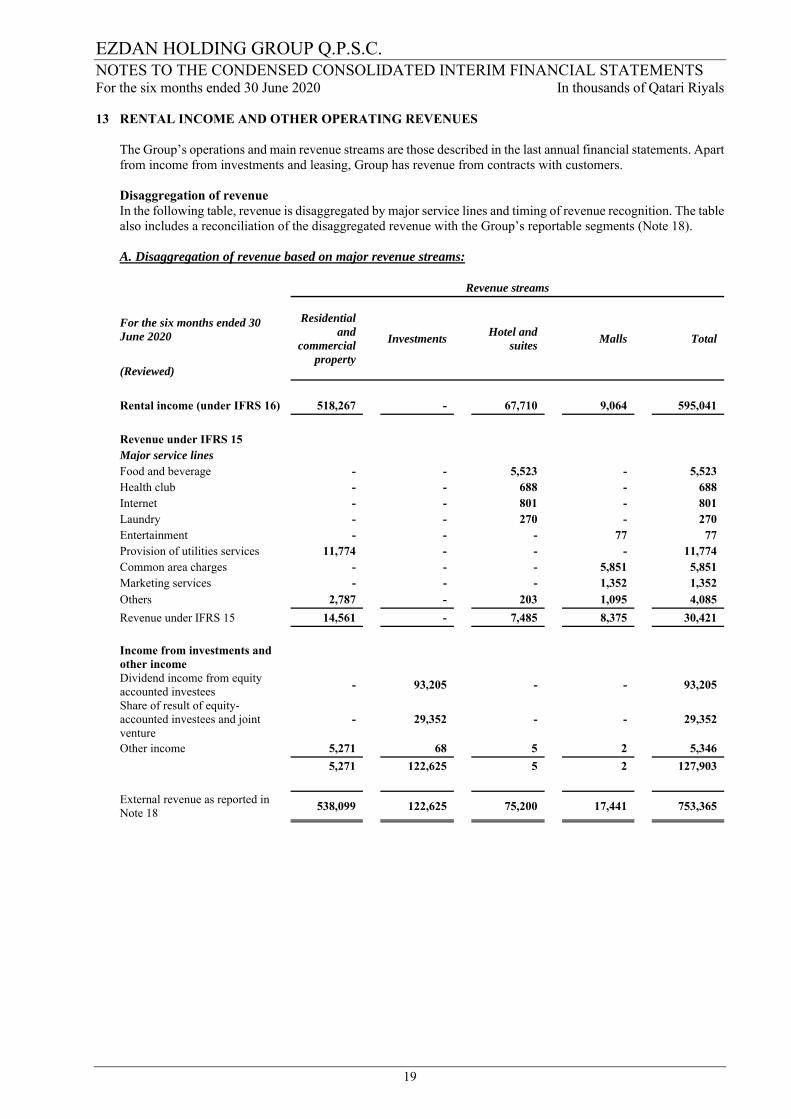
13 RENTAL INCOME AND OTHER OPERATING REVENUES
The Group’s operations and main revenue streams are those described in the last annual financial statements. Apart from income from investments and leasing, Group has revenue from contracts with customers.
Disaggregation of revenue In the following table, revenue is disaggregated by major service lines and timing of revenue recognition. The table also includes a reconciliation of the disaggregated revenue with the Group’s reportable segments (Note 18).
A. Disaggregation of revenue based on major revenue streams:
Revenue streams
For the six months ended 30 June 2020
Residential and
commercial property
Investments
Hotel and suites
Malls
Total
(Reviewed)
Rental income (under IFRS 16) 518,267 - 67,710 9,064 595,041
Revenue under IFRS 15
Major service lines
Food and beverage - - 5,523 - 5,523 Health club - - 688 - 688 Internet - - 801 - 801 Laundry - - 270 - 270 Entertainment - - - 77 77 Provision of utilities services 11,774 - - - 11,774 Common area charges - - - 5,851 5,851 Marketing services - - - 1,352 1,352 Others 2,787 - 203 1,095 4,085
Revenue under IFRS 15 14,561 - 7,485 8,375 30,421
Income from investments and other income
Dividend income from equity accounted investees
- 93,205 - - 93,205
Share of result of equity-accounted investees and joint venture
- 29,352 - - 29,352
Other income 5,271 68 5 2 5,346 5,271 122,625 5 2 127,903
External revenue as reported in Note 18
538,099 122,625 75,200 17,441 753,365
EZDAN HOLDING GROUP Q.P.S.C. NOTES TO THE CONDENSED CONSOLIDATED INTERIM FINANCIAL STATEMENTS For the six months ended 30 June 2020 In thousands of Qatari Riyals
20
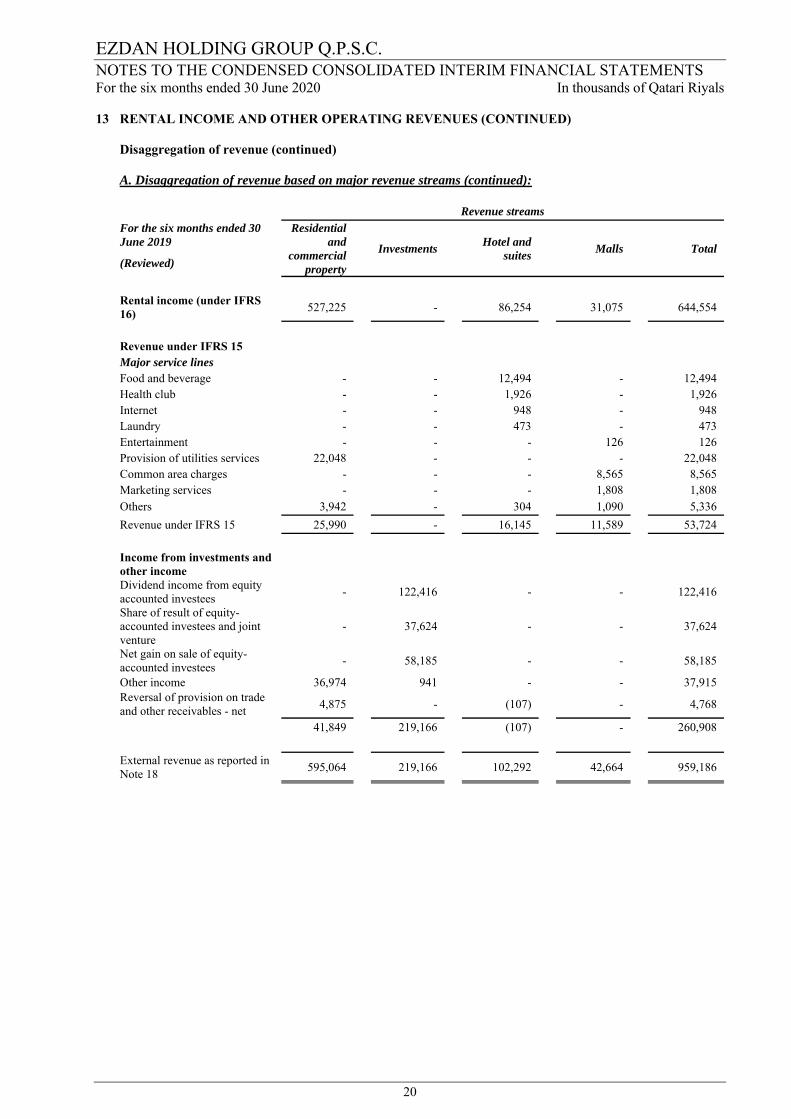
13 RENTAL INCOME AND OTHER OPERATING REVENUES (CONTINUED) Disaggregation of revenue (continued)
A. Disaggregation of revenue based on major revenue streams (continued):
Revenue streams
For the six months ended 30 June 2019
Residential and
commercial property
Investments
Hotel and
suites
Malls
Total
(Reviewed)
Rental income (under IFRS 16)
527,225 - 86,254 31,075 644,554
Revenue under IFRS 15
Major service lines
Food and beverage - - 12,494 - 12,494 Health club - - 1,926 - 1,926 Internet - - 948 - 948 Laundry - - 473 - 473 Entertainment - - - 126 126 Provision of utilities services 22,048 - - - 22,048 Common area charges - - - 8,565 8,565 Marketing services - - - 1,808 1,808 Others 3,942 - 304 1,090 5,336
Revenue under IFRS 15 25,990 - 16,145 11,589 53,724
Income from investments and other income
Dividend income from equity accounted investees
- 122,416 - - 122,416
Share of result of equity-accounted investees and joint venture
- 37,624 - - 37,624
Net gain on sale of equity-accounted investees
- 58,185 - - 58,185
Other income 36,974 941 - - 37,915 Reversal of provision on trade and other receivables - net
4,875 - (107) - 4,768
41,849 219,166 (107) - 260,908
External revenue as reported in Note 18
595,064 219,166 102,292 42,664 959,186
EZDAN HOLDING GROUP Q.P.S.C. NOTES TO THE CONDENSED CONSOLIDATED INTERIM FINANCIAL STATEMENTS For the six months ended 30 June 2020 In thousands of Qatari Riyals
21
13 RENTAL INCOME AND OTHER OPERATING REVENUES (CONTINUED) Disaggregation of revenue (continued)
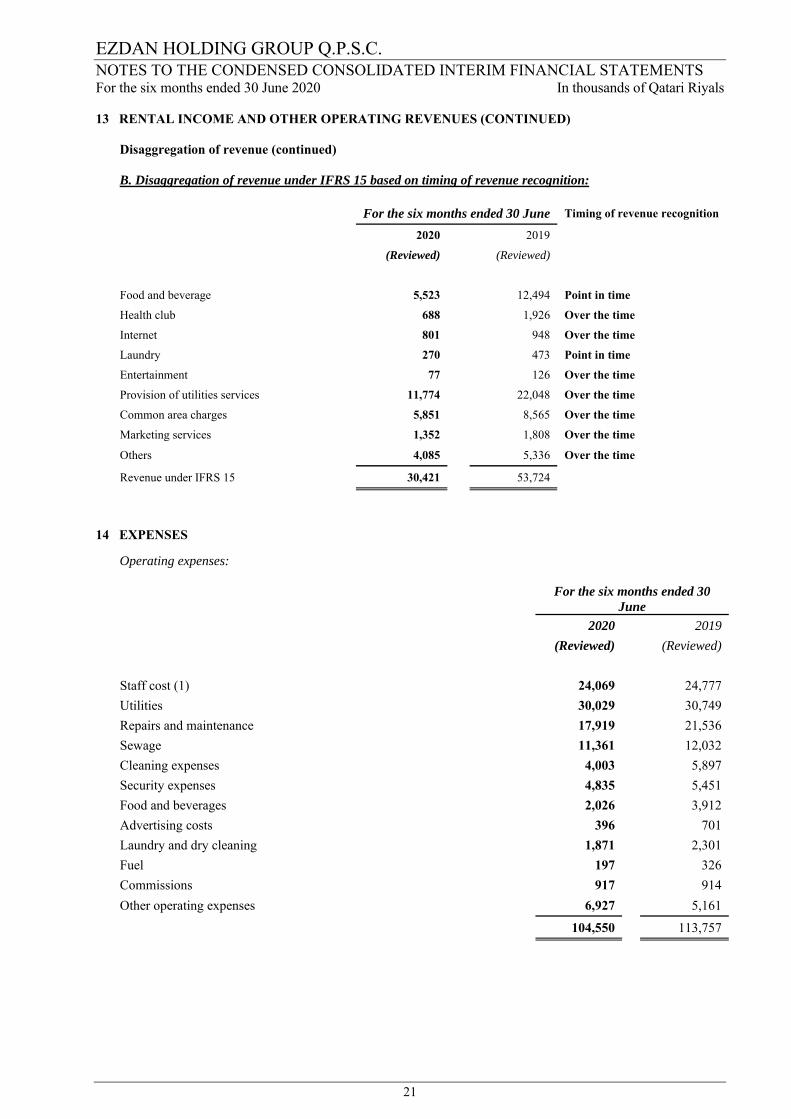
B. Disaggregation of revenue under IFRS 15 based on timing of revenue recognition:
For the six months ended 30 June Timing of revenue recognition
2020 2019
(Reviewed) (Reviewed)
Food and beverage 5,523 12,494 Point in time
Health club 688 1,926 Over the time
Internet 801 948 Over the time
Laundry 270 473 Point in time
Entertainment 77 126 Over the time
Provision of utilities services 11,774 22,048 Over the time
Common area charges 5,851 8,565 Over the time
Marketing services 1,352 1,808 Over the time
Others 4,085 5,336 Over the time
Revenue under IFRS 15 30,421 53,724
14 EXPENSES
Operating expenses: For the six months ended 30
June 2020 2019
(Reviewed) (Reviewed)
Staff cost (1) 24,069 24,777
Utilities 30,029 30,749
Repairs and maintenance 17,919 21,536
Sewage 11,361 12,032
Cleaning expenses 4,003 5,897
Security expenses 4,835 5,451
Food and beverages 2,026 3,912
Advertising costs 396 701
Laundry and dry cleaning 1,871 2,301
Fuel 197 326
Commissions 917 914
Other operating expenses 6,927 5,161
104,550 113,757
EZDAN HOLDING GROUP Q.P.S.C. NOTES TO THE CONDENSED CONSOLIDATED INTERIM FINANCIAL STATEMENTS For the six months ended 30 June 2020 In thousands of Qatari Riyals
22
14 EXPENSES (CONTINUED)
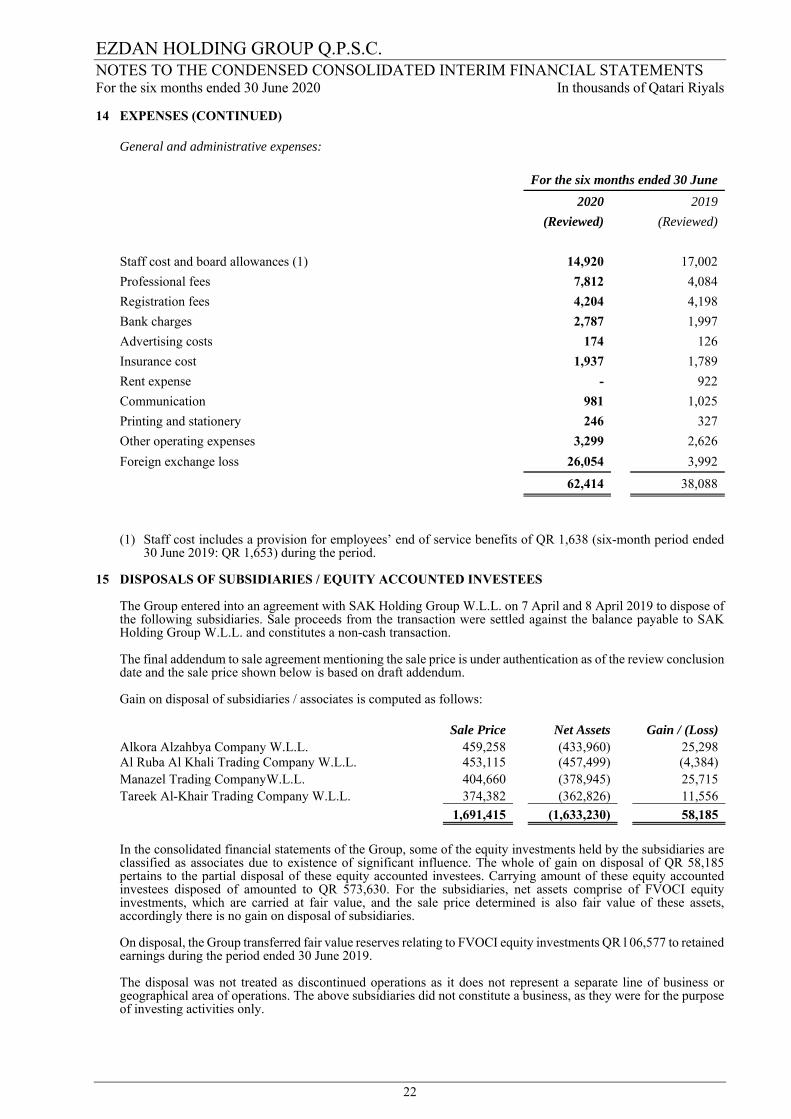
General and administrative expenses: For the six months ended 30 June
2020 2019
(Reviewed) (Reviewed)
Staff cost and board allowances (1) 14,920 17,002
Professional fees 7,812 4,084
Registration fees 4,204 4,198
Bank charges 2,787 1,997
Advertising costs 174 126
Insurance cost 1,937 1,789
Rent expense - 922
Communication 981 1,025
Printing and stationery 246 327
Other operating expenses 3,299 2,626
Foreign exchange loss 26,054 3,992
62,414 38,088
(1) Staff cost includes a provision for employees’ end of service benefits of QR 1,638 (six-month period ended 30 June 2019: QR 1,653) during the period.
15 DISPOSALS OF SUBSIDIARIES / EQUITY ACCOUNTED INVESTEES
The Group entered into an agreement with SAK Holding Group W.L.L. on 7 April and 8 April 2019 to dispose of the following subsidiaries. Sale proceeds from the transaction were settled against the balance payable to SAK Holding Group W.L.L. and constitutes a non-cash transaction. The final addendum to sale agreement mentioning the sale price is under authentication as of the review conclusion date and the sale price shown below is based on draft addendum. Gain on disposal of subsidiaries / associates is computed as follows:
Sale Price Net Assets Gain / (Loss) Alkora Alzahbya Company W.L.L. 459,258 (433,960) 25,298 Al Ruba Al Khali Trading Company W.L.L. 453,115 (457,499) (4,384)Manazel Trading CompanyW.L.L. 404,660 (378,945) 25,715 Tareek Al-Khair Trading Company W.L.L. 374,382 (362,826) 11,556
1,691,415 (1,633,230) 58,185
In the consolidated financial statements of the Group, some of the equity investments held by the subsidiaries are classified as associates due to existence of significant influence. The whole of gain on disposal of QR 58,185 pertains to the partial disposal of these equity accounted investees. Carrying amount of these equity accounted investees disposed of amounted to QR 573,630. For the subsidiaries, net assets comprise of FVOCI equity investments, which are carried at fair value, and the sale price determined is also fair value of these assets, accordingly there is no gain on disposal of subsidiaries. On disposal, the Group transferred fair value reserves relating to FVOCI equity investments QR l 06,577 to retained earnings during the period ended 30 June 2019. The disposal was not treated as discontinued operations as it does not represent a separate line of business or geographical area of operations. The above subsidiaries did not constitute a business, as they were for the purpose of investing activities only.
EZDAN HOLDING GROUP Q.P.S.C. NOTES TO THE CONDENSED CONSOLIDATED INTERIM FINANCIAL STATEMENTS For the six months ended 30 June 2020 In thousands of Qatari Riyals
23
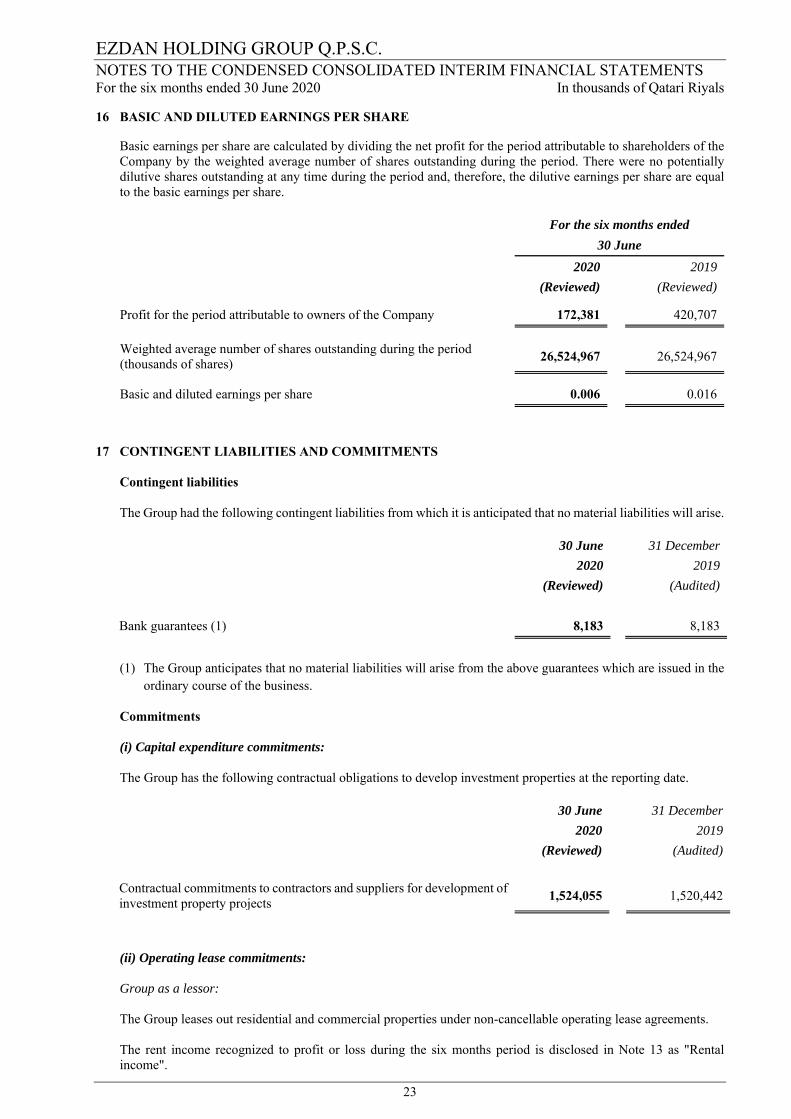
16 BASIC AND DILUTED EARNINGS PER SHARE
Basic earnings per share are calculated by dividing the net profit for the period attributable to shareholders of the Company by the weighted average number of shares outstanding during the period. There were no potentially dilutive shares outstanding at any time during the period and, therefore, the dilutive earnings per share are equal to the basic earnings per share. For the six months ended
30 June 2020 2019
(Reviewed) (Reviewed)
Profit for the period attributable to owners of the Company 172,381 420,707
Weighted average number of shares outstanding during the period (thousands of shares)
26,524,967 26,524,967
Basic and diluted earnings per share 0.006 0.016
17 CONTINGENT LIABILITIES AND COMMITMENTS
Contingent liabilities
The Group had the following contingent liabilities from which it is anticipated that no material liabilities will arise.
30 June 31 December
2020 2019
(Reviewed) (Audited)
Bank guarantees (1) 8,183 8,183
(1) The Group anticipates that no material liabilities will arise from the above guarantees which are issued in the
ordinary course of the business.
Commitments (i) Capital expenditure commitments:
The Group has the following contractual obligations to develop investment properties at the reporting date.
30 June 31 December
2020 2019
(Reviewed) (Audited)
Contractual commitments to contractors and suppliers for development of investment property projects
1,524,055 1,520,442
(ii) Operating lease commitments:
Group as a lessor: The Group leases out residential and commercial properties under non-cancellable operating lease agreements. The rent income recognized to profit or loss during the six months period is disclosed in Note 13 as "Rental income".
EZDAN HOLDING GROUP Q.P.S.C. NOTES TO THE CONDENSED CONSOLIDATED INTERIM FINANCIAL STATEMENTS For the six months ended 30 June 2020 In thousands of Qatari Riyals
24
17 CONTINGENT LIABILITIES AND COMMITMENTS (CONTINUED)
Commitments (continued) (ii) Operating lease commitments (continued)
Group as a lessor (continued)
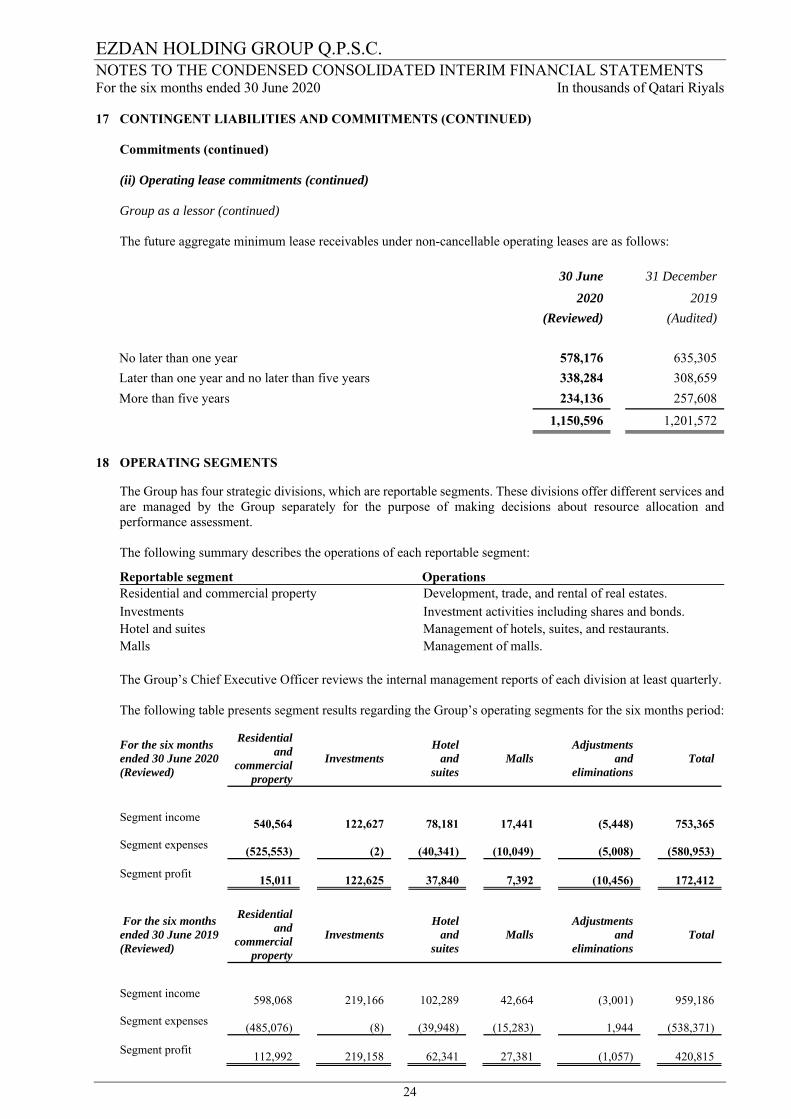
The future aggregate minimum lease receivables under non-cancellable operating leases are as follows:
30 June 31 December
2020 2019
(Reviewed) (Audited)
No later than one year 578,176 635,305
Later than one year and no later than five years 338,284 308,659
More than five years 234,136 257,608
1,150,596 1,201,572
18 OPERATING SEGMENTS
The Group has four strategic divisions, which are reportable segments. These divisions offer different services and are managed by the Group separately for the purpose of making decisions about resource allocation and performance assessment.
The following summary describes the operations of each reportable segment:
Reportable segment Operations Residential and commercial property Development, trade, and rental of real estates. Investments Investment activities including shares and bonds. Hotel and suites Management of hotels, suites, and restaurants. Malls Management of malls.
The Group’s Chief Executive Officer reviews the internal management reports of each division at least quarterly.
The following table presents segment results regarding the Group’s operating segments for the six months period:
For the six months ended 30 June 2020 (Reviewed)
Residential and
commercial property
Investments Hotel
and suites
Malls Adjustments
and eliminations
Total
Segment income
540,564 122,627
78,181
17,441
(5,448) 753,365
Segment expenses
(525,553)
(2)
(40,341)
(10,049)
(5,008)
(580,953)
Segment profit
15,011 122,625
37,840
7,392
(10,456) 172,412
For the six months ended 30 June 2019 (Reviewed)
Residential and
commercial property
Investments Hotel
and suites
Malls Adjustments
and eliminations
Total
Segment income
598,068
219,166
102,289
42,664
(3,001)
959,186
Segment expenses
(485,076)
(8)
(39,948)
(15,283) 1,944
(538,371)
Segment profit
112,992
219,158
62,341
27,381
(1,057)
420,815
EZDAN HOLDING GROUP Q.P.S.C. NOTES TO THE CONDENSED CONSOLIDATED INTERIM FINANCIAL STATEMENTS For the six months ended 30 June 2020 In thousands of Qatari Riyals
25
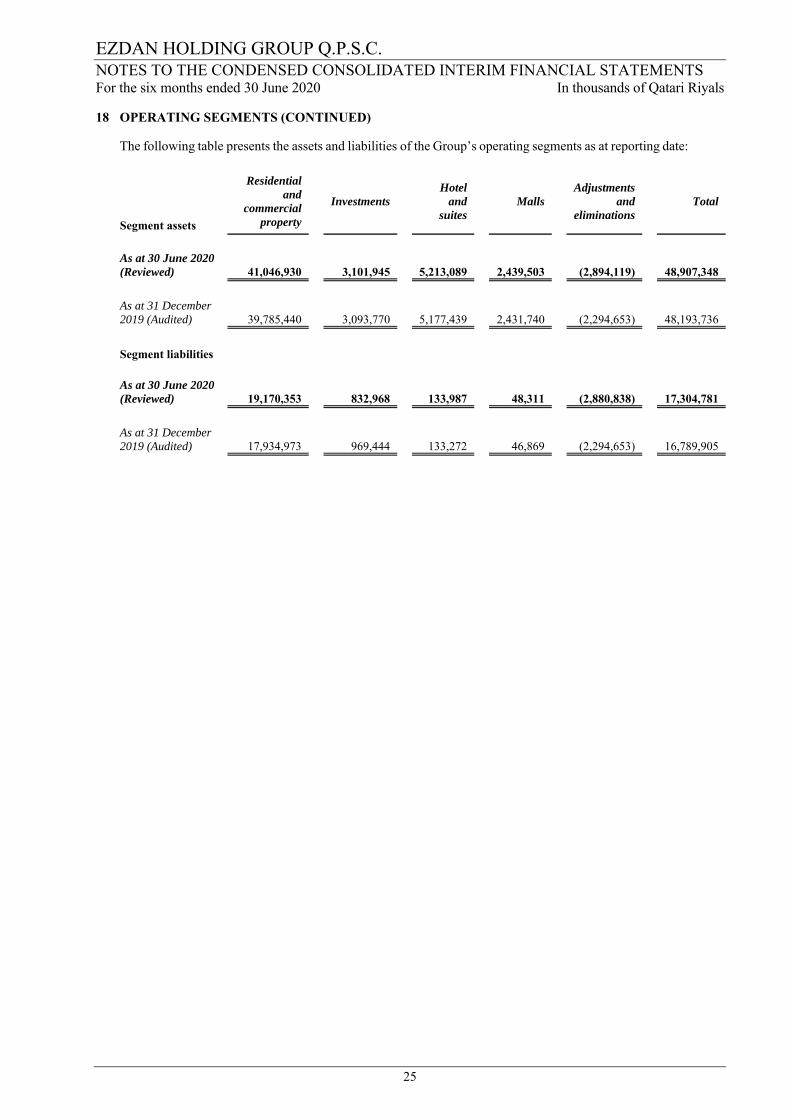
18 OPERATING SEGMENTS (CONTINUED)
The following table presents the assets and liabilities of the Group’s operating segments as at reporting date:
Residential and
commercial property
Investments
Hotel and
suites
Malls
Adjustments and
eliminations
Total
Segment assets
As at 30 June 2020 (Reviewed)
41,046,930 3,101,945
5,213,089
2,439,503
(2,894,119) 48,907,348
As at 31 December 2019 (Audited)
39,785,440
3,093,770
5,177,439
2,431,740
(2,294,653)
48,193,736
Segment liabilities
As at 30 June 2020 (Reviewed)
19,170,353
832,968
133,987
48,311
(2,880,838)
17,304,781
As at 31 December 2019 (Audited)
17,934,973
969,444
133,272
46,869
(2,294,653)
16,789,905
EZDAN HOLDING GROUP Q.P.S.C. NOTES TO THE CONDENSED CONSOLIDATED INTERIM FINANCIAL STATEMENTS For the six months ended 30 June 2020 In thousands of Qatari Riyals
26
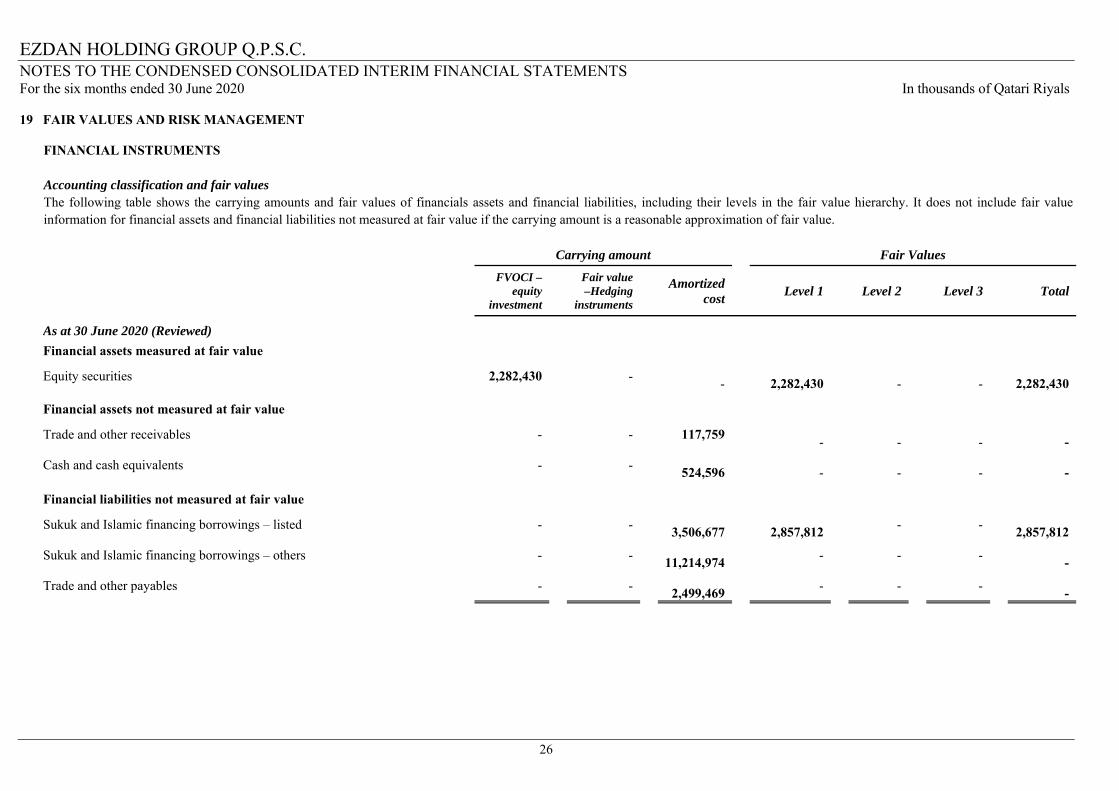
19 FAIR VALUES AND RISK MANAGEMENT
FINANCIAL INSTRUMENTS
Accounting classification and fair values The following table shows the carrying amounts and fair values of financials assets and financial liabilities, including their levels in the fair value hierarchy. It does not include fair value information for financial assets and financial liabilities not measured at fair value if the carrying amount is a reasonable approximation of fair value.
Carrying amount Fair Values
FVOCI –
equity investment
Fair value –Hedging
instruments
Amortized cost
Level 1 Level 2 Level 3 Total
As at 30 June 2020 (Reviewed)
Financial assets measured at fair value
Equity securities 2,282,430 - -
2,282,430
-
-
2,282,430
Financial assets not measured at fair value
Trade and other receivables - - 117,759 -
-
-
-
Cash and cash equivalents - - 524,596
-
-
-
-
Financial liabilities not measured at fair value
Sukuk and Islamic financing borrowings – listed - - 3,506,677
2,857,812
- - 2,857,812
Sukuk and Islamic financing borrowings – others - - 11,214,974
- - - -
Trade and other payables - - 2,499,469
- - - -
EZDAN HOLDING GROUP Q.P.S.C. NOTES TO THE CONDENSED CONSOLIDATED INTERIM FINANCIAL STATEMENTS For the six months ended 30 June 2020 In thousands of Qatari Riyals
27
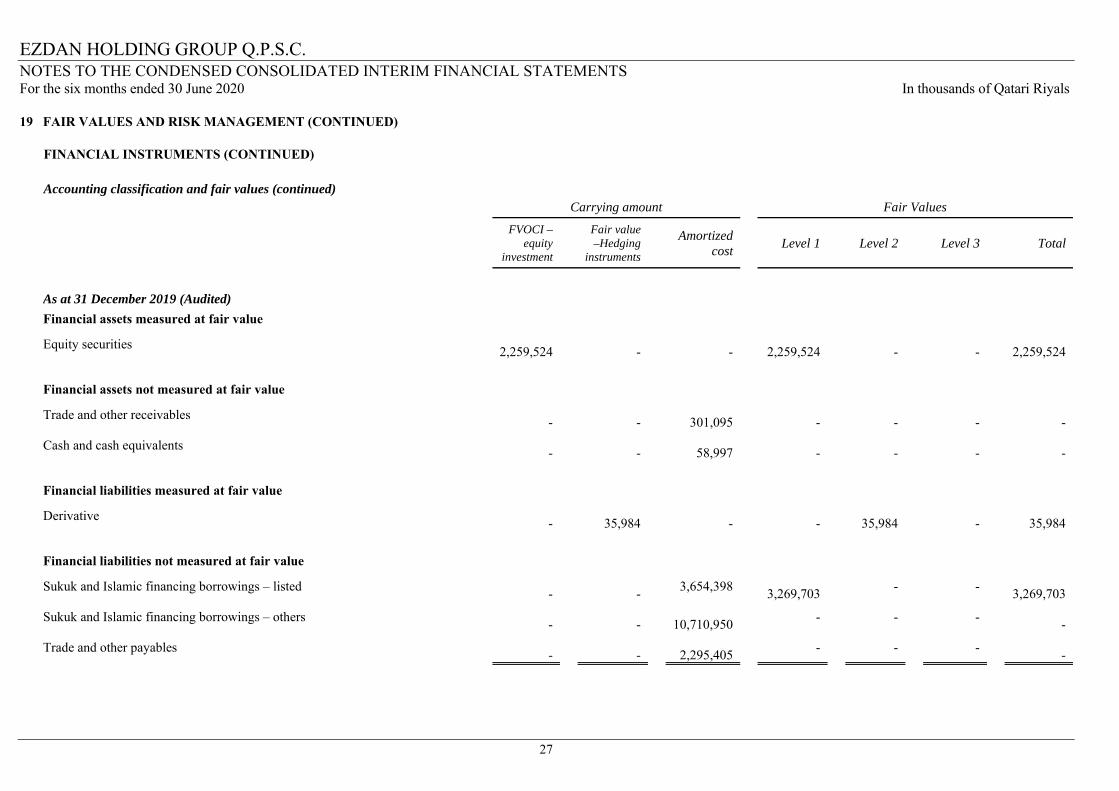
19 FAIR VALUES AND RISK MANAGEMENT (CONTINUED)
FINANCIAL INSTRUMENTS (CONTINUED)
Accounting classification and fair values (continued) Carrying amount Fair Values
FVOCI –
equity investment
Fair value –Hedging
instruments
Amortized cost
Level 1 Level 2 Level 3 Total
As at 31 December 2019 (Audited)
Financial assets measured at fair value
Equity securities
2,259,524
-
-
2,259,524
-
-
2,259,524
Financial assets not measured at fair value
Trade and other receivables
-
-
301,095
-
-
-
-
Cash and cash equivalents
-
-
58,997
-
-
-
-
Financial liabilities measured at fair value
Derivative
-
35,984
-
-
35,984
-
35,984
Financial liabilities not measured at fair value
Sukuk and Islamic financing borrowings – listed
-
- 3,654,398
3,269,703 - -
3,269,703
Sukuk and Islamic financing borrowings – others
-
-
10,710,950 - - -
-
Trade and other payables
-
-
2,295,405 - - -
-
EZDAN HOLDING GROUP Q.P.S.C. NOTES TO THE CONDENSED CONSOLIDATED INTERIM FINANCIAL STATEMENTS For the six months ended 30 June 2020 In thousands of Qatari Riyals
28
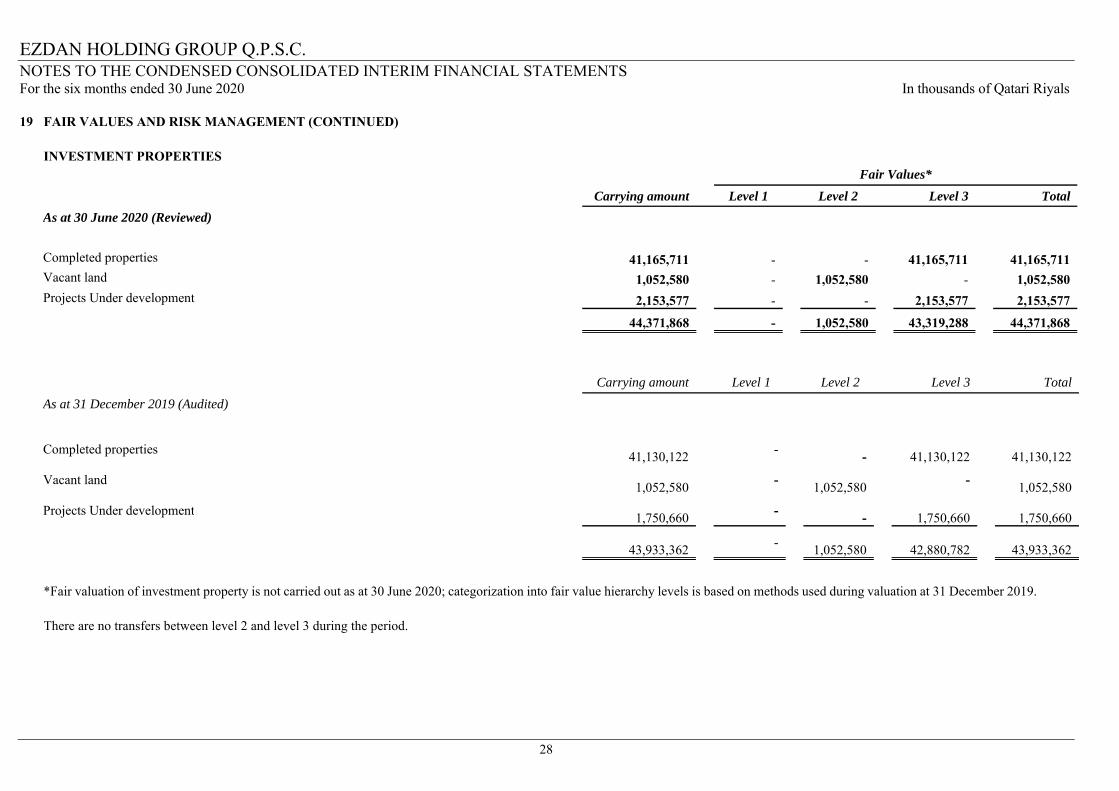
19 FAIR VALUES AND RISK MANAGEMENT (CONTINUED)
INVESTMENT PROPERTIES Fair Values*
Carrying amount Level 1 Level 2 Level 3 Total
As at 30 June 2020 (Reviewed)
Completed properties 41,165,711 - - 41,165,711 41,165,711 Vacant land 1,052,580 - 1,052,580 - 1,052,580 Projects Under development 2,153,577 - - 2,153,577 2,153,577
44,371,868 - 1,052,580 43,319,288 44,371,868
Carrying amount Level 1 Level 2 Level 3 Total
As at 31 December 2019 (Audited)
Completed properties
41,130,122 -
-
41,130,122
41,130,122
Vacant land
1,052,580 -
1,052,580 -
1,052,580
Projects Under development
1,750,660 -
-
1,750,660
1,750,660
43,933,362
- 1,052,580
42,880,782
43,933,362
*Fair valuation of investment property is not carried out as at 30 June 2020; categorization into fair value hierarchy levels is based on methods used during valuation at 31 December 2019.
There are no transfers between level 2 and level 3 during the period.
EZDAN HOLDING GROUP Q.P.S.C. NOTES TO THE CONDENSED CONSOLIDATED INTERIM FINANCIAL STATEMENTS For the six months ended 30 June 2020
29
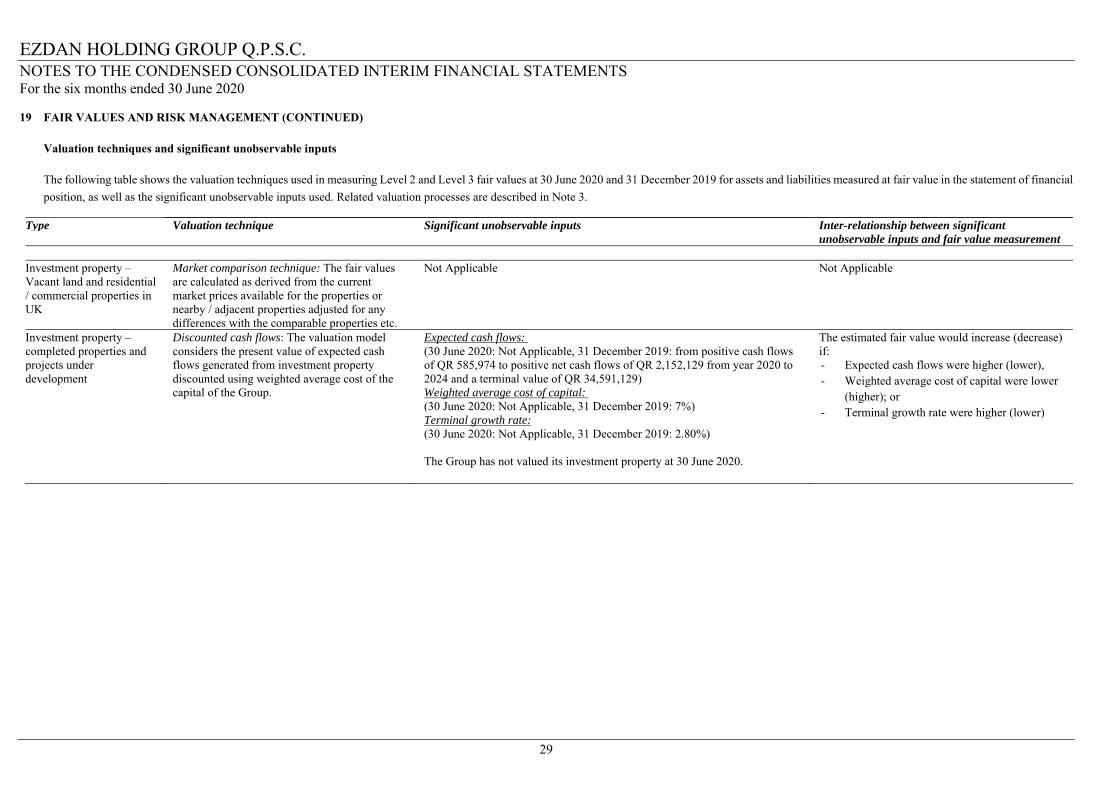
19 FAIR VALUES AND RISK MANAGEMENT (CONTINUED)
Valuation techniques and significant unobservable inputs
The following table shows the valuation techniques used in measuring Level 2 and Level 3 fair values at 30 June 2020 and 31 December 2019 for assets and liabilities measured at fair value in the statement of financial
position, as well as the significant unobservable inputs used. Related valuation processes are described in Note 3. Type Valuation technique Significant unobservable inputs Inter-relationship between significant
unobservable inputs and fair value measurement
Investment property – Vacant land and residential / commercial properties in UK
Market comparison technique: The fair values are calculated as derived from the current market prices available for the properties or nearby / adjacent properties adjusted for any differences with the comparable properties etc.
Not Applicable Not Applicable
Investment property –completed properties and projects under development
Discounted cash flows: The valuation model considers the present value of expected cash flows generated from investment property discounted using weighted average cost of the capital of the Group.
Expected cash flows: (30 June 2020: Not Applicable, 31 December 2019: from positive cash flows of QR 585,974 to positive net cash flows of QR 2,152,129 from year 2020 to 2024 and a terminal value of QR 34,591,129) Weighted average cost of capital: (30 June 2020: Not Applicable, 31 December 2019: 7%) Terminal growth rate: (30 June 2020: Not Applicable, 31 December 2019: 2.80%) The Group has not valued its investment property at 30 June 2020.
The estimated fair value would increase (decrease) if: - Expected cash flows were higher (lower), - Weighted average cost of capital were lower
(higher); or - Terminal growth rate were higher (lower)
EZDAN HOLDING GROUP Q.P.S.C. NOTES TO THE CONDENSED CONSOLIDATED INTERIM FINANCIAL STATEMENTS For the six months ended 30 June 2020
30
20 COMPARATIVE FIGURES
Certain comparative figures have been reclassified where necessary in order to conform to the current period presentation in the condensed consolidated interim financial statements. Such reclassification do not affect previously reported net profit or net assets of the Group.
21 COVID 19 Impact:
The coronavirus outbreak (“Covid 19”) at the beginning of 2020 has brought about a deceleration of the economic activity in the State of Qatar and globally. Fiscal and monetary authorities, both domestic and international, have announced various support measures across the globe to counter possible adverse implications. During the six-month period ended 30 June 2020, the Group has provided rent concession to its directly affected tenants mainly in Ezdan Malls considering the impact on their operations. In addition to that lender plans as well. The Group will continue to closely monitor as the situation progresses and has activated its business continuity planning and other risk management practices to manage any associate risk that may arise impacting business operations and financial performance in 2020. In light of the rapidly escalating situation, the Group has considered whether any adjustments and changes in judgments, estimates, and risk management are required to be considered and reported in the condensed interim consolidated financial statements. The Group’s business operations remain largely unaffected by the current situation. Below are the key assumptions about the future and other sources of estimation uncertainties:
(i) Fair value of investment properties
The general risk environment in which the Group operates has heightened during the period, which is largely due to the continued level of overall uncertainty of the future impact Covid 19 worldwide. This environment could have a significant impact upon property valuations. The Group’s investment properties were valued by professionally qualified individuals employed by the Group (Internal valuer) as at the reporting date.
The outbreak of Covid 19 has resulted in the real estate market experiencing significantly lower levels of transactional activities and liquidity in the State of Qatar and globally. As at the reporting date, there was a shortage of market evidence for comparison purpose therefore, less weight has been given to recent market evidence while carrying out the valuations. The current response to Covid 19 means that the valuer is faced with an unprecedented set of circumstances on which to base a judgment. The valuation across all investment properties are therefore, reported on the basis of “material valuation uncertainty”. Consequently, less certainty – and a higher degree of caution – should be attached to the valuations than would normally be the case. Moreover, valuation methodology used for investment properties at the reporting date remains the same as used at 31 December 2019.
(ii) Expected credit losses
The uncertainties caused by Covid 19 has required the Group to update the inputs and assumptions used for the determination of expected credit losses (“ECLs”) as at 30 June 2020. ECLs were estimated based on a range of forecast economic conditions as at that date and considering that the situation is fast evolving, the Group has considered the impact of higher volatility in the forward-looking macro-economic factors, when determining the severity and likelihood of economic scenarios for ECL determination. (iii) Going concern The Group has performed an assessment of whether it is a going concern in the light of current economic conditions and all available information about future risks and uncertainties. The projections have been prepared covering the Group’s future performance, capital and liquidity. The impact of Covid 19 may continue to evolve, but at the present time the projections show that the Group has sufficient resources to continue in operational existence and its going concern position remains largely unaffected and unchanged from 31 December 2019. As a result, these interim condensed consolidated financial statements have been appropriately prepared on a going concern basis. Further, the Group has assessed the impact of any operational disruptions, including any contractual challenges and changes in business or commercial relationships among the Group entities, customers and suppliers, to determine if there is any potential increase in contingent liabilities and commitments (Notes 17).
Independent auditor’s report on review of condensed consolidated interim financial statements on page 1.
Related Documents