1 TABLE OF CONTENTS CONCEPT 3 2018 UPDATE The regional transit vision for a connected Atlanta.

Welcome message from author
This document is posted to help you gain knowledge. Please leave a comment to let me know what you think about it! Share it to your friends and learn new things together.
Transcript
1
TABL
E OF
CON
TENT
S
CONCEPT 32018 UPDATEThe regional transit vision for a connected Atlanta.
CONC
EPT 3
2
TABLE OF CONTENTSEXECUTIVE SUMMARY
10
40 APPENDIX A: DETAILED PROJECT INFORMATION SHEETS102 APPENDIX B: DATA MANAGEMENT PLAN
APPENDICES
8CHAPTER 1: OVERVIEW OF CONCEPT 3
CHAPTER 2: WHAT HAS CHANGED?
16CHAPTER 3: THE UPDATE PROCESS - A NEW EVALUATION FRAMEWORK
28CHAPTER 4: A NEW REGIONAL TRANSIT VISION
36CHAPTER 5: NEXT STEPS
3
TABL
E OF
CON
TENT
S
Prepared For
Prepared By
4
CONC
EPT 3
EXECUTIVE SUMMARY
CONCEPT 32018 UPDATE
5
EXEC
UTIVE
SUM
MAR
Y
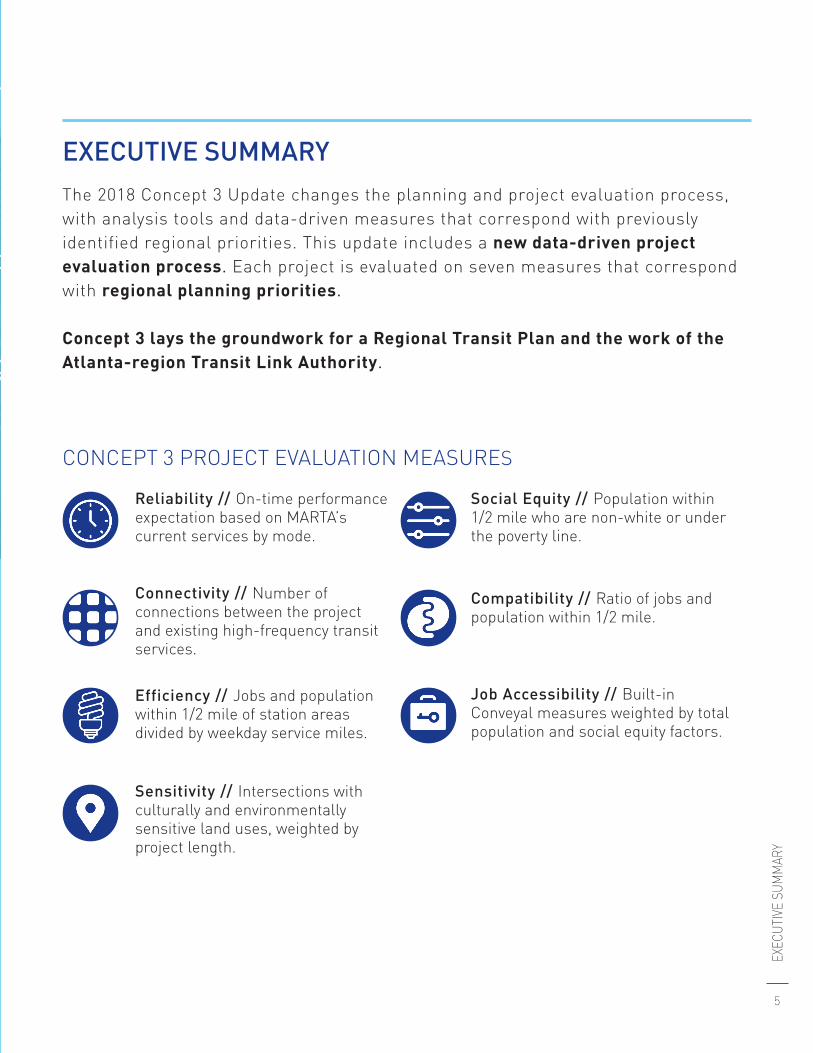
Reliability // On-time performance expectation based on MARTA’s current services by mode.
Connectivity // Number of connections between the project and existing high-frequency transit services.
Efficiency // Jobs and population within 1/2 mile of station areas divided by weekday service miles.
Sensitivity // Intersections with culturally and environmentally sensitive land uses, weighted by project length.
Social Equity // Population within 1/2 mile who are non-white or under the poverty line.
Compatibility // Ratio of jobs and population within 1/2 mile.
Job Accessibility // Built-in Conveyal measures weighted by total population and social equity factors.
EXECUTIVE SUMMARYThe 2018 Concept 3 Update changes the planning and project evaluation process, with analysis tools and data-driven measures that correspond with previously identified regional priorities. This update includes a new data-driven project evaluation process. Each project is evaluated on seven measures that correspond with regional planning priorities.
Concept 3 lays the groundwork for a Regional Transit Plan and the work of the Atlanta-region Transit Link Authority.
CONCEPT 3 PROJECT EVALUATION MEASURES
6
CONC
EPT 3
Concept 3 includes 50 projects from across Atlanta, and the counties of Fulton, Cobb, Gwinnett, and DeKalb. The projects listed in Chapter 5 are grouped by regional area. Complete evaluation results for each project can be found in Appendix A: Detailed Project Information Sheets.
The 2018 Concept 3 Update also includes a supplemental Data Management Plan (Appendix B), which describes the needs, challenges, and opportunities for improved data management in the regional transit planning process, and details the current and potential data flow for different data sets and sources relevant to Concept 3 and related transit plans.
This plan recommends six next steps for the Atlanta region following the 2018 Concept 3 Update (see adjacent page).
7
EXEC
UTIVE
SUM
MAR
Y
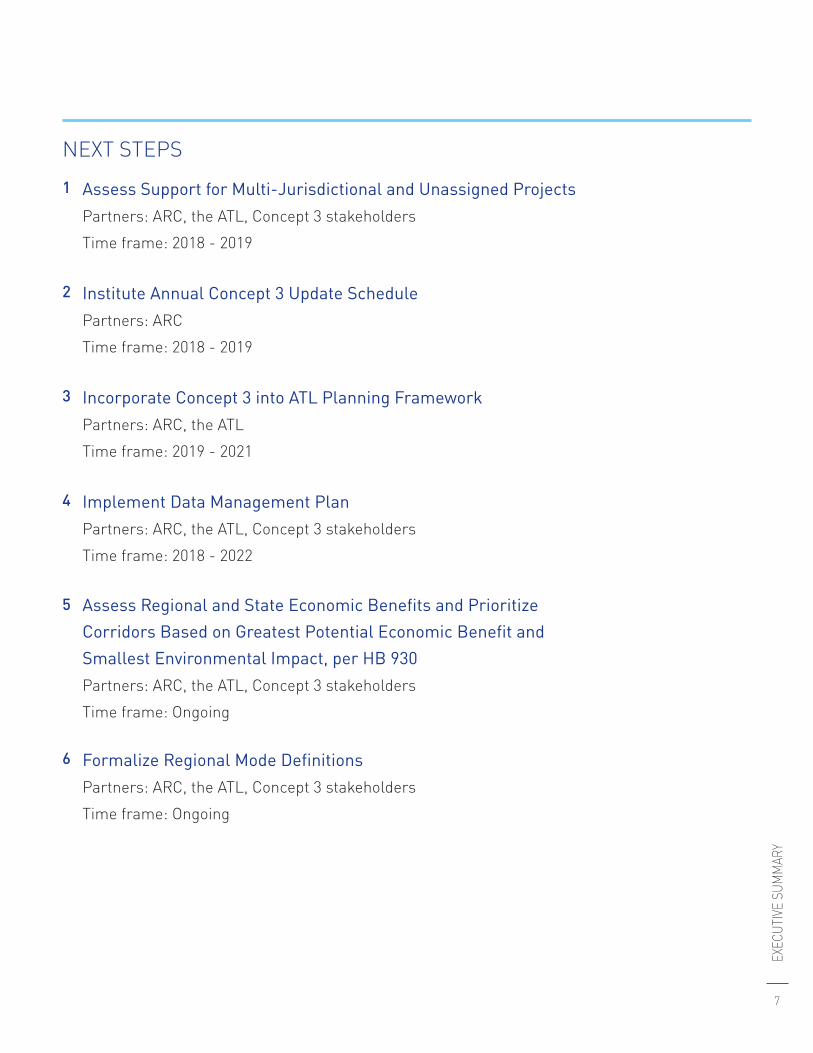
Assess Support for Multi-Jurisdictional and Unassigned ProjectsPartners: ARC, the ATL, Concept 3 stakeholdersTime frame: 2018 - 2019
Institute Annual Concept 3 Update SchedulePartners: ARCTime frame: 2018 - 2019
1
2
NEXT STEPS
Incorporate Concept 3 into ATL Planning FrameworkPartners: ARC, the ATLTime frame: 2019 - 2021
3
Implement Data Management PlanPartners: ARC, the ATL, Concept 3 stakeholdersTime frame: 2018 - 2022
4
Assess Regional and State Economic Benefits and Prioritize Corridors Based on Greatest Potential Economic Benefit and Smallest Environmental Impact, per HB 930Partners: ARC, the ATL, Concept 3 stakeholdersTime frame: Ongoing
5
Formalize Regional Mode DefinitionsPartners: ARC, the ATL, Concept 3 stakeholdersTime frame: Ongoing
6

8
CONC
EPT 3
CHAPTER 1
9
CHAP
TER
1
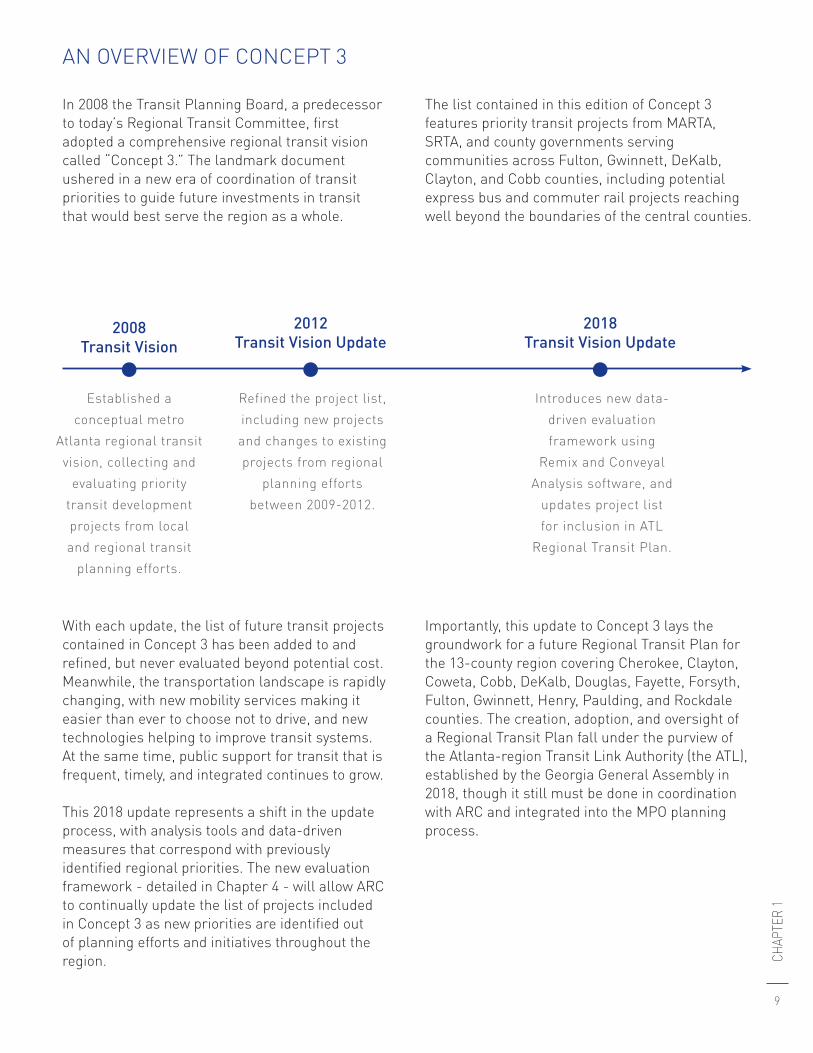
In 2008 the Transit Planning Board, a predecessor to today’s Regional Transit Committee, first adopted a comprehensive regional transit vision called “Concept 3.” The landmark document ushered in a new era of coordination of transit priorities to guide future investments in transit that would best serve the region as a whole.
With each update, the list of future transit projects contained in Concept 3 has been added to and refined, but never evaluated beyond potential cost. Meanwhile, the transportation landscape is rapidly changing, with new mobility services making it easier than ever to choose not to drive, and new technologies helping to improve transit systems. At the same time, public support for transit that is frequent, timely, and integrated continues to grow.
This 2018 update represents a shift in the update process, with analysis tools and data-driven measures that correspond with previously identified regional priorities. The new evaluation framework - detailed in Chapter 4 - will allow ARC to continually update the list of projects included in Concept 3 as new priorities are identified out of planning efforts and initiatives throughout the region.
The list contained in this edition of Concept 3 features priority transit projects from MARTA, SRTA, and county governments serving communities across Fulton, Gwinnett, DeKalb, Clayton, and Cobb counties, including potential express bus and commuter rail projects reaching well beyond the boundaries of the central counties.
Importantly, this update to Concept 3 lays the groundwork for a future Regional Transit Plan for the 13-county region covering Cherokee, Clayton, Coweta, Cobb, DeKalb, Douglas, Fayette, Forsyth, Fulton, Gwinnett, Henry, Paulding, and Rockdale counties. The creation, adoption, and oversight of a Regional Transit Plan fall under the purview of the Atlanta-region Transit Link Authority (the ATL), established by the Georgia General Assembly in 2018, though it still must be done in coordination with ARC and integrated into the MPO planning process.
AN OVERVIEW OF CONCEPT 3
2008 Transit Vision
Established a conceptual metro
Atlanta regional transit vision, collecting and
evaluating priority transit development projects from local and regional transit
planning efforts.
Refined the project list, including new projects and changes to existing projects from regional
planning efforts between 2009-2012.
Introduces new data-driven evaluation framework using
Remix and Conveyal Analysis software, and
updates project list for inclusion in ATL
Regional Transit Plan.
2012 Transit Vision Update
2018 Transit Vision Update

10
CONC
EPT 3
CHAPTER 2
11
CHAP
TER
2
WHAT HAS CHANGED?
In this chapter, we review the myriad changes that have taken place in the Atlanta region in the 10 years since the Concept 3 process was adopted, including changing economic and cultural conditions, population and demographic shifts, policy changes, and the introduction of new mobility services.
A CHANGING ECONOMY AND CULTURE
It has been 10 years since Atlanta first adopted Concept 3, a comprehensive transit vision for the region. Since the first plan, the Atlanta region has seen drastic economic, geographic, and demographic changes.
The Great Recession and subsequent recovery reshaped large swaths of the regional economy and urban geography. Fortune 500 employers like The Home Depot, Delta Airlines, UPS, and Coca-Cola now compete for talent with new arrivals like Porsche North America and Athenahealth, as well as a thriving ecosystem of technology and design startups.
New development, particularly in and around the urban core, are changing age-old travel patterns by reshuffling the landscape of where people work, live, and play. Mixed-use landmarks like Ponce City Market and Atlantic Station have turned once quiet pockets into bustling 24-hour districts, which are augmented by an ongoing development boom in Midtown, West Midtown, and around the BeltLine. And the brand-new venues of Mercedes-Benz Stadium in Atlanta and SunTrust Park in Cobb County draw tens of thousands of visitors for concerts and sporting events.
As our cities and communities continue to change, so too do our preferred options for how we move around and between them. Transportation Network Companies like Uber and Lyft have exploded in popularity; microtransit services like Chariot and Via are causing cities to rethink dial-a-ride and underperforming fixed-route services; and a new crop of privately funded mobility startups are bringing dockless bicycles, e-bikes, and scooters to cities where bikeshare systems were once thought inviable.
This rise in new mobility services has been enabled largely by rapid adoption of new technologies by consumers and service providers alike. Nationwide, nearly 80% of adults are estimated to have access to a smartphone . Meanwhile, GPS-enabled vehicles and tablet-equipped operators allow for real-time location data for quicker scheduling and automatic route optimization. Finally, many cities and mobility service providers are already looking ahead to autonomous vehicles that could further transform our travel patterns.
The people of the Atlanta region are changing too. A 2017 report released by the Housing Justice League and the Research|Action Cooperative found that ongoing development around the BeltLine is rapidly gentrifying central neighborhoods, displacing many low-income residents and African-American communities. On a macro level, rising property values are a sign of a growing economy, but they can lead to dire consequences for low-income populations and communities of color without strong affordable-housing protections in place.
A 2016 report by the Partnership for Southern Equity highlights the powerful symbiotic relationship between transportation investments and land-use planning. Yet the tendency to pursue each independently often produces negative outcomes such as induced traffic and congestion, or displacement of low-income and marginalized communities. The report also presents examples of initiatives that are leading to more equitable outcomes in the San Francisco Bay area, Seattle, and Minneapolis-Saint Paul.
12
CONC
EPT 3
Attitudes and preferences about transportation are changing as well, both within the city and in the regional counties. In 2014 Clayton County overwhelmingly passed a referendum to join MARTA, with new bus services starting in 2015. In the 2017 Metro Atlanta Speaks public opinion survey, nearly half of all respondents, including a majority in each of the 13 Counties plus the city of Atlanta indicated that expanding public transit was the best solution to traffic problems in the region.
The region’s changing attitude towards transit is beginning to be reflected in the policy environment as well. The past year brought one of the most significant changes to public transit policy-making in the region’s history, with House Bill 930 establishing the Atlanta-region Transit Link Authority (ATL). Moving forward, the ATL brings a legislation-backed structure to coordinate transit planning and funding across the region. This major shift follows a series of regional and local investments and actions in transit, including expansion and improvements to the Breeze smart card system, deployment of mobile ticketing, and MARTA and City of Atlanta sales tax referendums.
Federal guidelines have also seen significant changes in recent years, first with the MAP-21 transportation authorization bill in 2012, then by the FAST Act in 2015, which realigned several transit programs, increased funding for bus and bus facilities, and created several new discretionary programs. These myriad changes on the federal and state level have created new urgency for county and local governments to redefine their transit priorities, to identify service models and partnerships that can meet the changing needs of their constituencies.
THE POLICY LANDSCAPE
13
CHAP
TER
2
THE POLICY LANDSCAPE THE PUBLIC TRANSPORTATION ECOSYSTEM
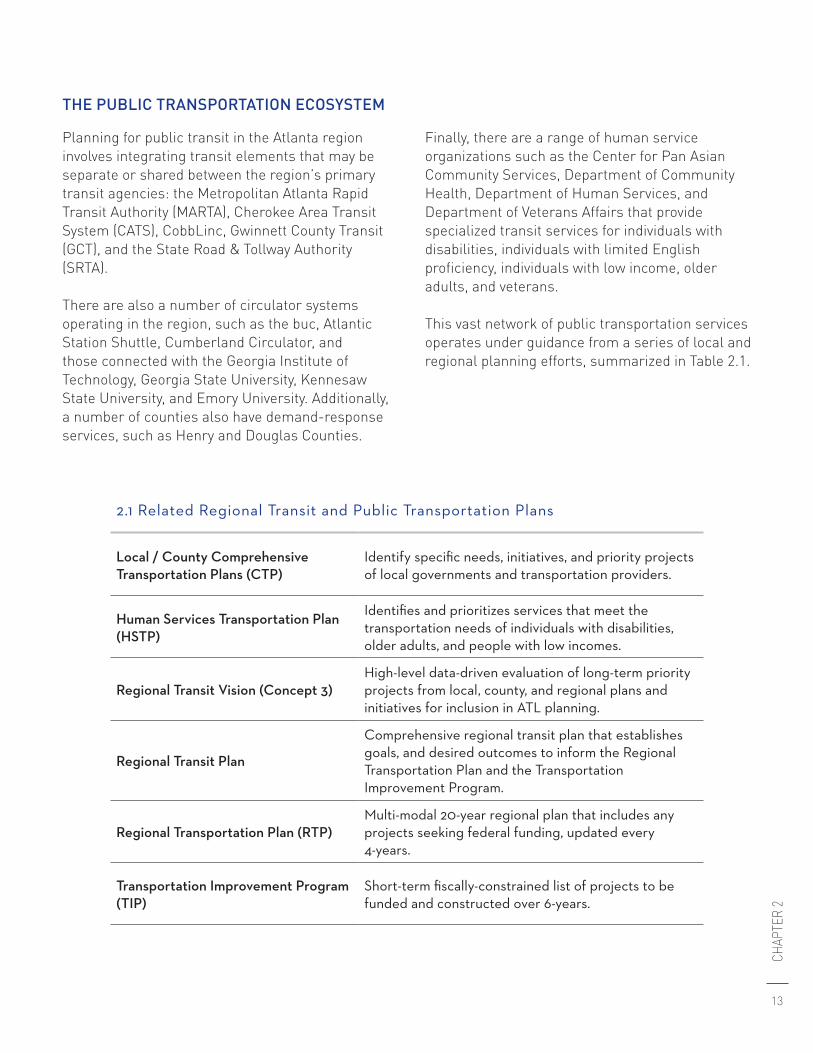
2.1 Related Regional Transit and Public Transportation Plans
Local / County Comprehensive Transportation Plans (CTP)
Identify specific needs, initiatives, and priority projects of local governments and transportation providers.
Human Services Transportation Plan (HSTP)
Identifies and prioritizes services that meet the transportation needs of individuals with disabilities, older adults, and people with low incomes.
Regional Transit Vision (Concept 3)High-level data-driven evaluation of long-term priority projects from local, county, and regional plans and initiatives for inclusion in ATL planning.
Regional Transit Plan
Comprehensive regional transit plan that establishes goals, and desired outcomes to inform the Regional Transportation Plan and the Transportation Improvement Program.
Regional Transportation Plan (RTP)Multi-modal 20-year regional plan that includes any projects seeking federal funding, updated every 4-years.
Transportation Improvement Program (TIP)
Short-term fiscally-constrained list of projects to be funded and constructed over 6-years.
Planning for public transit in the Atlanta region involves integrating transit elements that may be separate or shared between the region’s primary transit agencies: the Metropolitan Atlanta Rapid Transit Authority (MARTA), Cherokee Area Transit System (CATS), CobbLinc, Gwinnett County Transit (GCT), and the State Road & Tollway Authority (SRTA).
There are also a number of circulator systems operating in the region, such as the buc, Atlantic Station Shuttle, Cumberland Circulator, and those connected with the Georgia Institute of Technology, Georgia State University, Kennesaw State University, and Emory University. Additionally, a number of counties also have demand-response services, such as Henry and Douglas Counties.
Finally, there are a range of human service organizations such as the Center for Pan Asian Community Services, Department of Community Health, Department of Human Services, and Department of Veterans Affairs that provide specialized transit services for individuals with disabilities, individuals with limited English proficiency, individuals with low income, older adults, and veterans.
This vast network of public transportation services operates under guidance from a series of local and regional planning efforts, summarized in Table 2.1.
14
CONC
EPT 3
AVAILABLE TOOLS AND TECHNIQUES
New and increasingly affordable technology is changing the definition of what is possible for the many organizations that provide public transportation services. Increasing smartphone ubiquity along with GPS-enabled vehicles make “flexible” or deviated fixed route services more viable. Some transit agencies around the country are exploring partnerships with transportation network companies like Uber and Lyft, or microtransit providers like Via and Chariot to operate first-mile/last-mile services, ADA paratransit, or non-emergency medical transportation. Meanwhile, in cities around the country, private-sector dockless bikeshare and roaming carshare services are redefining the urban mobility landscape.
The speed of change now happening across the transportation industry demonstrates that quickly responding to new information must become the norm. Infrastructure - both physical and technological - must become more flexible than fixed as the region moves into the future. Regional collaborations, consortia, and public-private partnerships can expose untapped efficiencies and entirely new service delivery models, such as Mobility as a Service (MaaS) and Integrated Transportation Systems (ITS). This new landscape raises several questions for public transit providers, including:
• How can transit operators act as “integrators of mobility,” facilitating connectivity between high-capacity fixed route services and non-single occupancy vehicle options?
• How can we improve the transit offering through a focus on the “total journey experience” (real-time information, wayfinding, seamless payment, transfers between providers)?
• How can transit agencies balance their role in the changing mobility landscape with broader societal needs for social equity, environmental protection, and economic development?
• How can transit operators invest funding most effectively, partner with others, and adopt technology in such a way that the region’s overall mobility will be enhanced?
• How can transit agencies be active participants in shaping the mobility landscape in 5, 10, or 20 years?
Grappling with such questions and dealing with this degree of uncertainty will require ongoing coordination between transportation planning organizations like ARC and the newly created ATL as well as community organizations and advocacy groups. To better prepare the region, this update to Concept 3 introduces an entirely new evaluation framework, allowing ARC and regional stakeholders to more frequently adjust and improve long-term plans based on new information from partners and stakeholders and continuing analysis.

page intentionally blank

16
CONC
EPT 3
CHAPTER 3
17
CHAP
TER
3
The first goal of this Concept 3 update is to develop a methodology for evaluating transit projects using web-based tools that provide insight into the impact that projects will have on the region. The second goal is to provide a consolidated list of priority transportation projects from all regional partners. Using the newly developed evaluation process, this project list provides insights into projects’ potential regional impacts according to the priorities set forth in the Transportation Improvement Program (TIP). With a data-driven evaluation process this update lays the foundation for regional transit planning and implementation by ARC, regional partners, and the Atlanta-region Transit Link Authority (ATL), established by the Georgia General Assembly in 2018.
This Chapter documents the development of the evaluation framework that was used to evaluate the project list for the 2018 Concept 3 Update. It describes how Concept 3 relates to other documents in the transportation planning process, including the TIP evaluation framework.
ARC’S PLANNING PROCESS
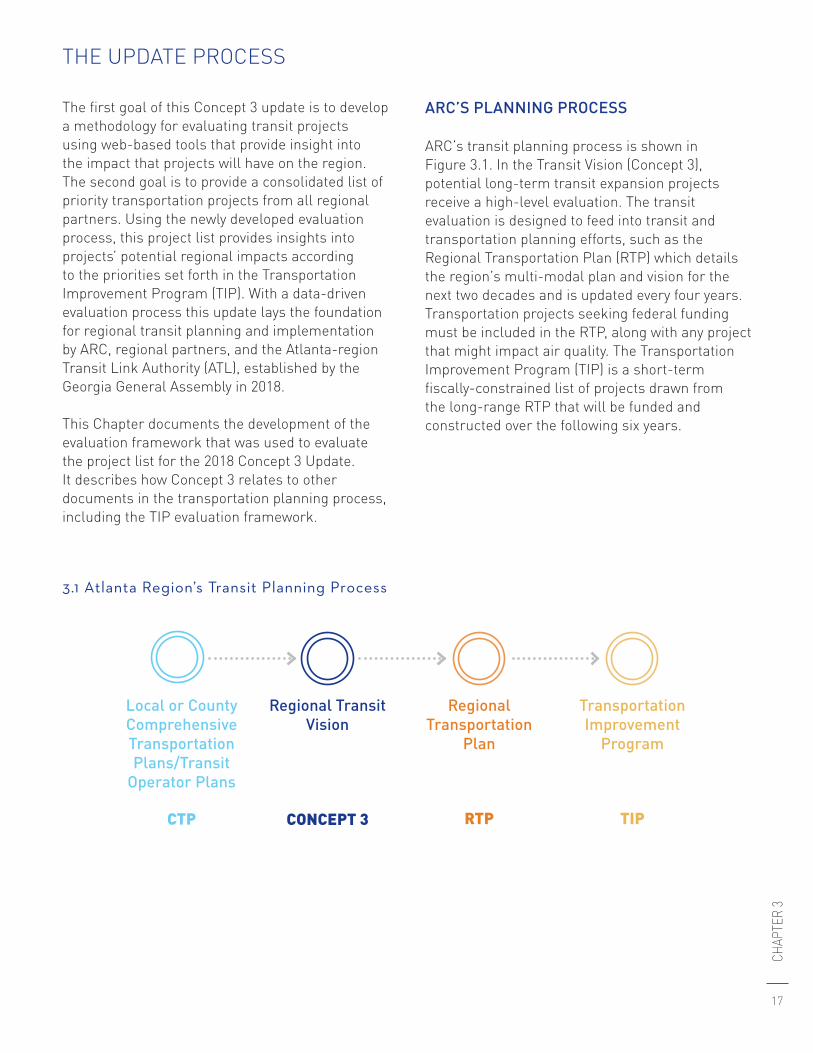
ARC’s transit planning process is shown in Figure 3.1. In the Transit Vision (Concept 3), potential long-term transit expansion projects receive a high-level evaluation. The transit evaluation is designed to feed into transit and transportation planning efforts, such as the Regional Transportation Plan (RTP) which details the region’s multi-modal plan and vision for the next two decades and is updated every four years. Transportation projects seeking federal funding must be included in the RTP, along with any project that might impact air quality. The Transportation Improvement Program (TIP) is a short-term fiscally-constrained list of projects drawn from the long-range RTP that will be funded and constructed over the following six years.
THE UPDATE PROCESS
Local or County Comprehensive Transportation Plans/Transit
Operator Plans
CTP
Regional Transit Vision
CONCEPT 3
Regional Transportation
Plan
RTP
Transportation Improvement
Program
TIP
3.1 Atlanta Region’s Transit Planning Process
18
CONC
EPT 3
TIP PROJECT EVALUATION FRAMEWORK
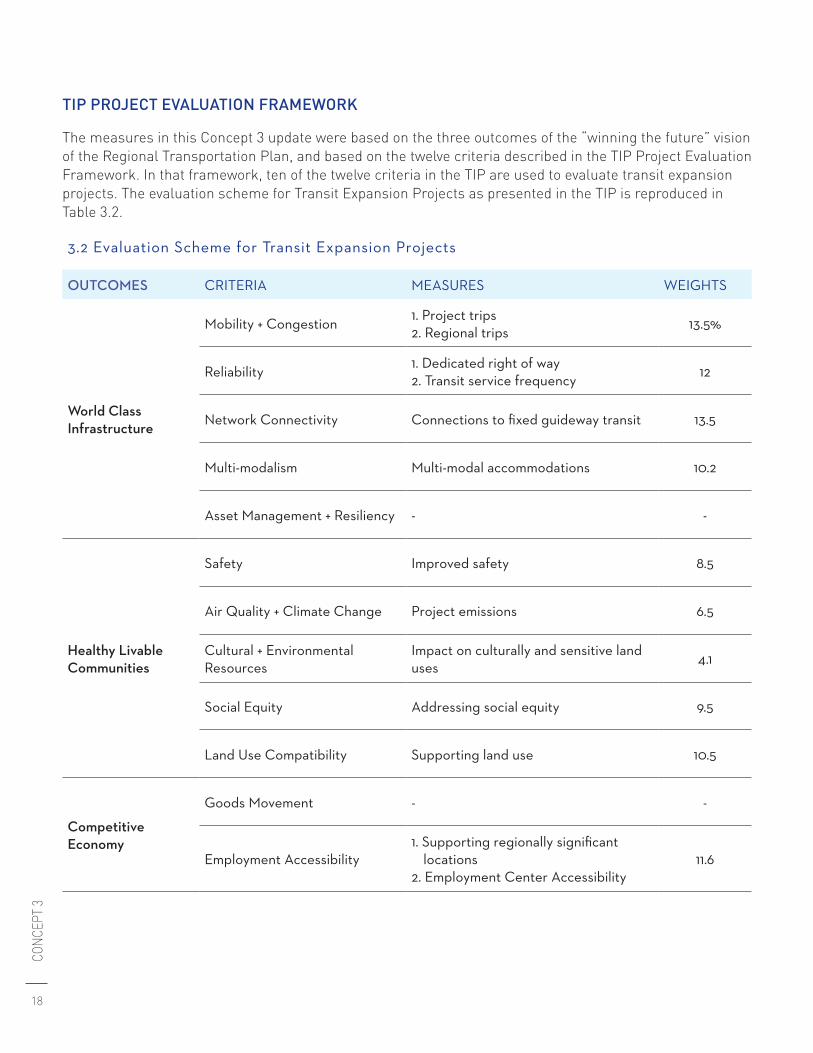
The measures in this Concept 3 update were based on the three outcomes of the “winning the future” vision of the Regional Transportation Plan, and based on the twelve criteria described in the TIP Project Evaluation Framework. In that framework, ten of the twelve criteria in the TIP are used to evaluate transit expansion projects. The evaluation scheme for Transit Expansion Projects as presented in the TIP is reproduced in Table 3.2.
3.2 Evaluation Scheme for Transit Expansion Projects
OUTCOMES CRITERIA MEASURES WEIGHTS
World Class Infrastructure
Mobility + Congestion 1. Project trips2. Regional trips 13.5%
Reliability 1. Dedicated right of way2. Transit service frequency 12
Network Connectivity Connections to fixed guideway transit 13.5
Multi-modalism Multi-modal accommodations 10.2
Asset Management + Resiliency - -
Healthy Livable Communities
Safety Improved safety 8.5
Air Quality + Climate Change Project emissions 6.5
Cultural + Environmental Resources
Impact on culturally and sensitive land uses 4.1
Social Equity Addressing social equity 9.5
Land Use Compatibility Supporting land use 10.5
Competitive Economy
Goods Movement - -
Employment Accessibility1. Supporting regionally significant
locations2. Employment Center Accessibility
11.6
19
CHAP
TER
3
CONCEPT 3 PROJECT EVALUATION FRAMEWORK
The new Concept 3 process, as aforementioned, integrates previously established outcomes and criteria but adapts the measures to a long-range transit planning context.
When projects are evaluated for the TIP, the project parameters are more definitively known than is typical for a long-range planning effort like Concept 3. Elements such as station design, alignment, right-of-way, and specific vehicle technologies are important components of TIP criteria but may not yet be defined at this early stage. The high number of projects in the vision also requires a different approach for measuring projects than the RTP or TIP do, which primarily use metrics coming from the activity-based travel demand model (ABM). This necessitates some adaptation and modification of the criteria and corresponding measures supporting these three outcomes. The following sections walk through each of the criteria, describing both the criteria themselves and how their measures were adapted for Concept 3.
An important component of each project is its mode. The mode informs many of the assumptions made during the evaluation process. While there are no regionally agreed upon modes definitions, some basic definitions have been developed through the course of this update process. Modal characteristics and attributes are described on pages 26 and 27.
Mobility + CongestionUnder the TIP project evaluation framework, transit projects should improve mobility and decrease congestion principally by removing trips from highway facilities. Transit projects that attract high numbers of riders should receive priority.
The TIP uses ridership forecasts of the project and system from the ABM to establish the effect transit projects will have on mobility and congestion in the region. Rather than estimating ridership for long term projects, the Concept 3 evaluation framework instead focuses on accessibility measures, with the understanding that detailed alternatives analyses may be required in the future.
ReliabilityThe TIP proposes that transit service reliability is improved by dedicating right-of-way and increasing service frequency. Separated modes with high frequency, such as BRT and light rail, should receive priority over other modes.
The TIP measures reliability by valuing projects with more dedicated right-of-way and higher service frequency. Measures of service frequency are included in some accessibility statistics, so this measure is not considered under the Reliability criteria for Concept 3. And specific information on project alignments is not available for most projects beyond certain modal assumptions (heavy rail, commuter rail, bus rapid transit, streetcar). As a simple measure appropriate for a big-picture assessment like Concept 3, we assign the following expected on-time performance by mode, based on MARTA’s self-reported on-time-performance for local buses and the MARTA rail system, interpolated for BRT and light rail.
20
CONC
EPT 3
Network ConnectivityThe TIP suggests that new transit projects should improve the overall connectivity of the transit system in two ways: first, all projects should connect to an existing transit service; second, projects with more connections to existing services should be favored. In Concept 3 we use the number of connections between a project and MARTA Rail or other high-frequency transit as a measure of overall connectivity.
Asset Management + ResiliencyThe TIP proposed no measures for Asset Management + Resiliency with regards to transit expansion projects, though we believe that there are potential measures in these two areas that could inform transit prioritization. We do recommend that Asset Management and Resiliency be separate criteria.
Asset Management. Riders per service mile is a common measure of organizational sustainability for transit operators in that it balances a measure of the capital and operating costs of a project against the project’s effectiveness in delivering service. Because ridership statistics are not available for Concept 3 evaluation, we use a project’s ½ mile catchment area jobs and household totals divided by weekday service miles.Resiliency. ARC previously identified key issues related to infrastructure resiliency in the Atlanta region including autonomous vehicles, ride hailing/carsharing, and intelligent infrastructure and technology. These factors are all critically important for land use and transportation planning in the region, but their relationship to long-range transit planning varies. We recognize the relevance of these issues but do not use a resiliency measure in Concept 3.
SafetyThe TIP understands that specific safety improvements of transit expansion projects come from thoughtful station design and careful consideration of safe and effective access management strategies. Similar to the multimodal criterion, this measure is heavily dependent on specific design elements that are not known in a long-range plan context, and is therefore not included in the Concept 3 evaluation.
Air Quality + Climate ChangeThe TIP considers both the CO2 and pollutant emissions added from operating a transit project as well as the avoided emissions from people switching to transit from automobile modes. All else equal, the TIP prioritizes projects with lower emissions impacts or greater emissions reductions. At the project level, the Air Quality + Climate Change measure in the TIP is based on quantitative CMAQ calculations that use short-term data sets. On the regional scale, long-term emissions analyses are conducted through the transportation conformity process. Emissions analyses are not conducted in Concept 3 as it is a long-term, project level plan. Ultimately, when projects outlined in Concept 3 enter the RTP or the TIP, emissions impacts will be evaluated
Cultural + Environmental ResourcesThe TIP counts the length of a project’s alignment that lies near sensitive features including historical resources, wetlands, and existing greenspace. Projects that interfere with many of these layers, or that lie almost entirely within them, should not be prioritized. A full environmental impact study would be needed to determine the precise impact of a project on such resources. For Concept 3 we use a preliminary potential impact measure by calculating the share of a project’s alignment that conflicts with cultural and environmental resource layers, such as neighborhoods and wetlands, or within 100 feet of point or line resources.
21
CHAP
TER
3
EquityThe TIP evaluates equity by considering how the project improves mobility or accessibility for Equitable Target Area (ETA) communities. ARC defines ETA communities as those that are non-white or low-income. For Concept 3 the evaluation tools use an accessibility calculator method to define the number of ETA residents that live within a given distance of the transit line.
Land Use CompatibilityTransit projects work best when they operate within supportive land uses; the TIP prioritizes projects with higher surrounding residential densities. Compatibility related to destinations, such as jobs, are addressed with the Employment Accessibility criteria. For Concept 3 the evaluation methods look at the number of residents and jobs within ½ mile of the project’s stop facilities. The jobs and housing totals per service mile are already considered in the Asset Management criterion. To avoid double-counting the land use density around stops, this criterion instead considers the balance between jobs and population.
Employment AccessibilityThe TIP prioritizes projects that connect to a regional activity center, or that improve the accessibility of these centers via transit for workers in the region. But Employment Accessibility can be measured different ways, depending on which job centers and populations are prioritized. For Concept 3 the evaluation methods use an accessibility calculator to identify the number of jobs that individuals can access via the transit system from different points in the region, then weight the results both by overall population and by ETA population. The method and tools are detailed in Chapter 4.
Goods MovementThe TIP does not use the Goods Movement criterion to evaluate transit expansion projects, and we do not feel that it is necessary to add any measures for the Transit Vision.
22
CONC
EPT 3
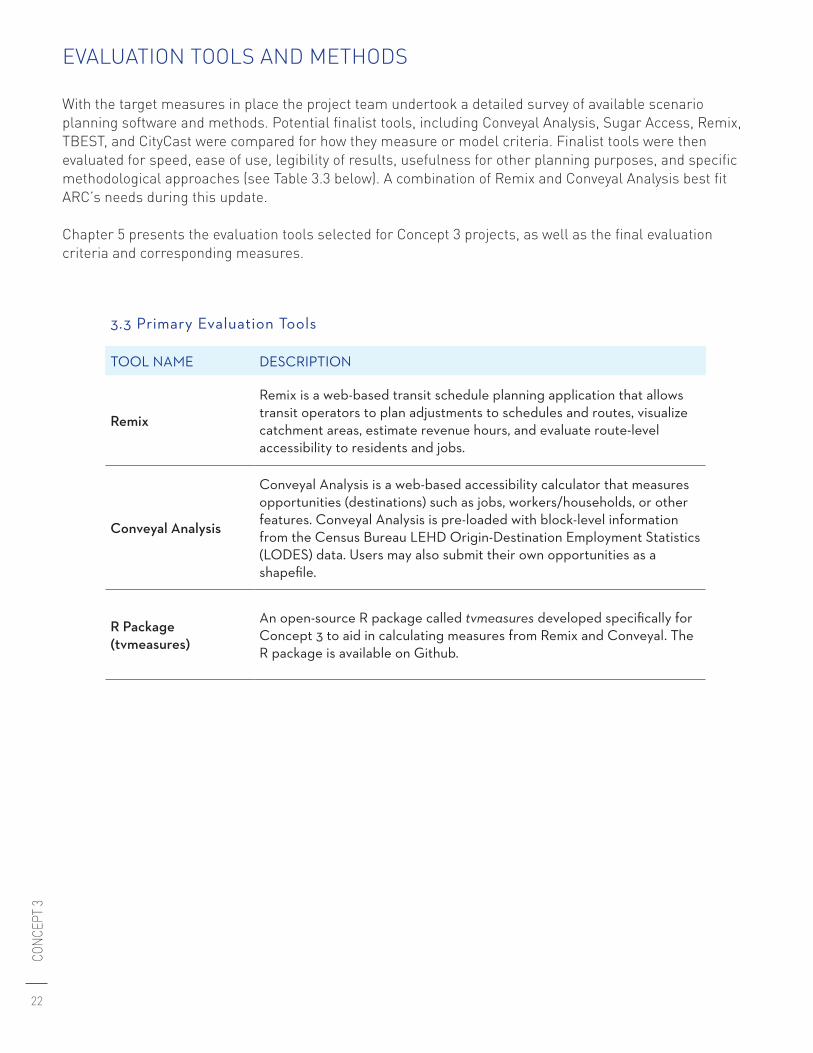
With the target measures in place the project team undertook a detailed survey of available scenario planning software and methods. Potential finalist tools, including Conveyal Analysis, Sugar Access, Remix, TBEST, and CityCast were compared for how they measure or model criteria. Finalist tools were then evaluated for speed, ease of use, legibility of results, usefulness for other planning purposes, and specific methodological approaches (see Table 3.3 below). A combination of Remix and Conveyal Analysis best fit ARC’s needs during this update.
Chapter 5 presents the evaluation tools selected for Concept 3 projects, as well as the final evaluation criteria and corresponding measures.
EVALUATION TOOLS AND METHODS
3.3 Primary Evaluation Tools
TOOL NAME DESCRIPTION
Remix
Remix is a web-based transit schedule planning application that allows transit operators to plan adjustments to schedules and routes, visualize catchment areas, estimate revenue hours, and evaluate route-level accessibility to residents and jobs.
Conveyal Analysis
Conveyal Analysis is a web-based accessibility calculator that measures opportunities (destinations) such as jobs, workers/households, or other features. Conveyal Analysis is pre-loaded with block-level information from the Census Bureau LEHD Origin-Destination Employment Statistics (LODES) data. Users may also submit their own opportunities as a shapefile.
R Package(tvmeasures)
An open-source R package called tvmeasures developed specifically for Concept 3 to aid in calculating measures from Remix and Conveyal. The R package is available on Github.
23
CHAP
TER
3
3.4 Concept 3’s Seven Evaluation Criteria
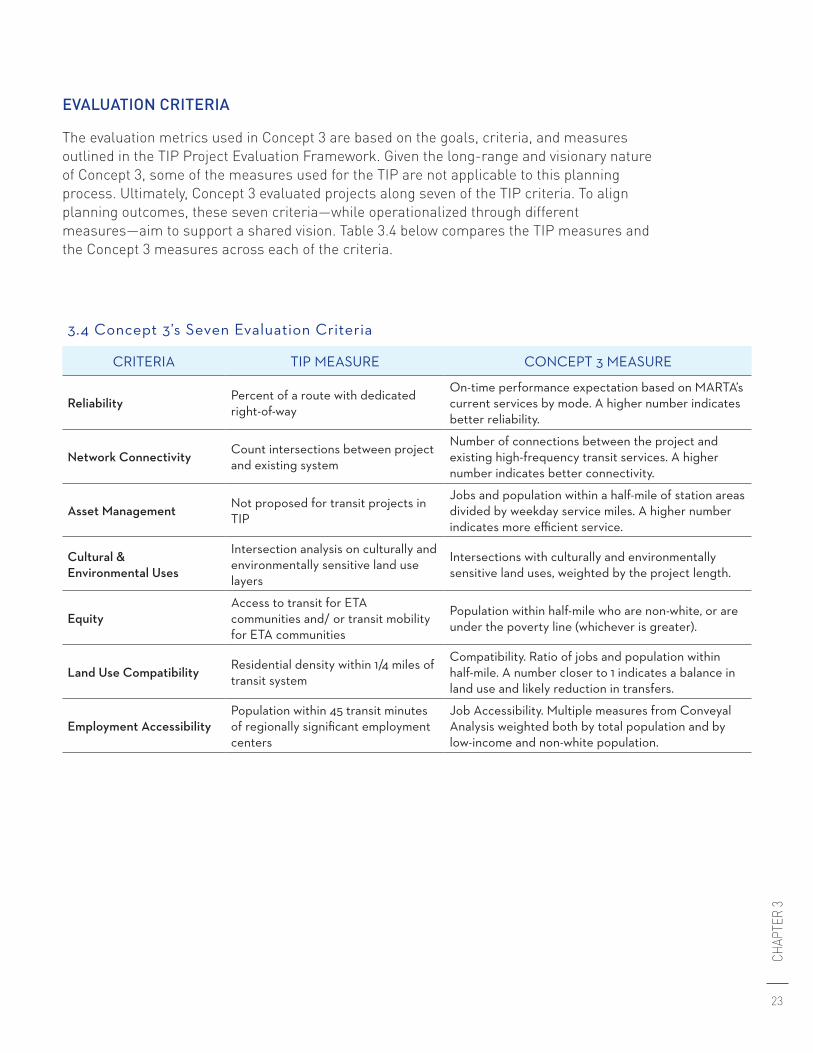
CRITERIA TIP MEASURE CONCEPT 3 MEASURE
Reliability Percent of a route with dedicated right-of-way
On-time performance expectation based on MARTA’s current services by mode. A higher number indicates better reliability.
Network Connectivity Count intersections between project and existing system
Number of connections between the project and existing high-frequency transit services. A higher number indicates better connectivity.
Asset Management Not proposed for transit projects in TIP
Jobs and population within a half-mile of station areas divided by weekday service miles. A higher number indicates more efficient service.
Cultural & Environmental Uses
Intersection analysis on culturally and environmentally sensitive land use layers
Intersections with culturally and environmentally sensitive land uses, weighted by the project length.
EquityAccess to transit for ETA communities and/ or transit mobility for ETA communities
Population within half-mile who are non-white, or are under the poverty line (whichever is greater).
Land Use Compatibility Residential density within 1/4 miles of transit system
Compatibility. Ratio of jobs and population within half-mile. A number closer to 1 indicates a balance in land use and likely reduction in transfers.
Employment AccessibilityPopulation within 45 transit minutes of regionally significant employment centers
Job Accessibility. Multiple measures from Conveyal Analysis weighted both by total population and by low-income and non-white population.
EVALUATION CRITERIA
The evaluation metrics used in Concept 3 are based on the goals, criteria, and measuresoutlined in the TIP Project Evaluation Framework. Given the long-range and visionary natureof Concept 3, some of the measures used for the TIP are not applicable to this planningprocess. Ultimately, Concept 3 evaluated projects along seven of the TIP criteria. To alignplanning outcomes, these seven criteria—while operationalized through differentmeasures—aim to support a shared vision. Table 3.4 below compares the TIP measures andthe Concept 3 measures across each of the criteria.
24
CONC
EPT 3
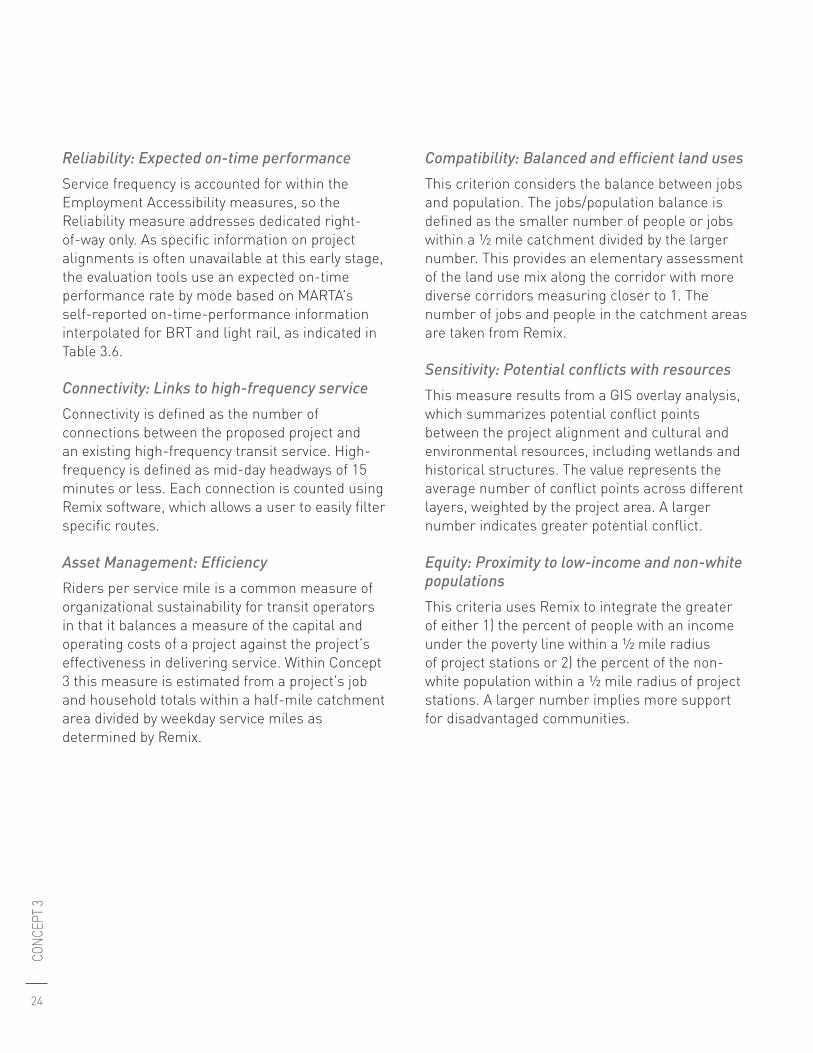
Reliability: Expected on-time performanceService frequency is accounted for within the Employment Accessibility measures, so the Reliability measure addresses dedicated right-of-way only. As specific information on project alignments is often unavailable at this early stage, the evaluation tools use an expected on-time performance rate by mode based on MARTA’s self-reported on-time-performance information interpolated for BRT and light rail, as indicated in Table 3.6.
Connectivity: Links to high-frequency serviceConnectivity is defined as the number of connections between the proposed project and an existing high-frequency transit service. High-frequency is defined as mid-day headways of 15 minutes or less. Each connection is counted using Remix software, which allows a user to easily filter specific routes.
Asset Management: EfficiencyRiders per service mile is a common measure of organizational sustainability for transit operators in that it balances a measure of the capital and operating costs of a project against the project’s effectiveness in delivering service. Within Concept 3 this measure is estimated from a project’s job and household totals within a half-mile catchment area divided by weekday service miles as determined by Remix.
Compatibility: Balanced and efficient land usesThis criterion considers the balance between jobs and population. The jobs/population balance is defined as the smaller number of people or jobs within a ½ mile catchment divided by the larger number. This provides an elementary assessment of the land use mix along the corridor with more diverse corridors measuring closer to 1. The number of jobs and people in the catchment areas are taken from Remix.
Sensitivity: Potential conflicts with resourcesThis measure results from a GIS overlay analysis, which summarizes potential conflict points between the project alignment and cultural and environmental resources, including wetlands and historical structures. The value represents the average number of conflict points across different layers, weighted by the project area. A larger number indicates greater potential conflict.
Equity: Proximity to low-income and non-white populationsThis criteria uses Remix to integrate the greater of either 1) the percent of people with an income under the poverty line within a ½ mile radius of project stations or 2) the percent of the non-white population within a ½ mile radius of project stations. A larger number implies more support for disadvantaged communities.
25
CHAP
TER
3
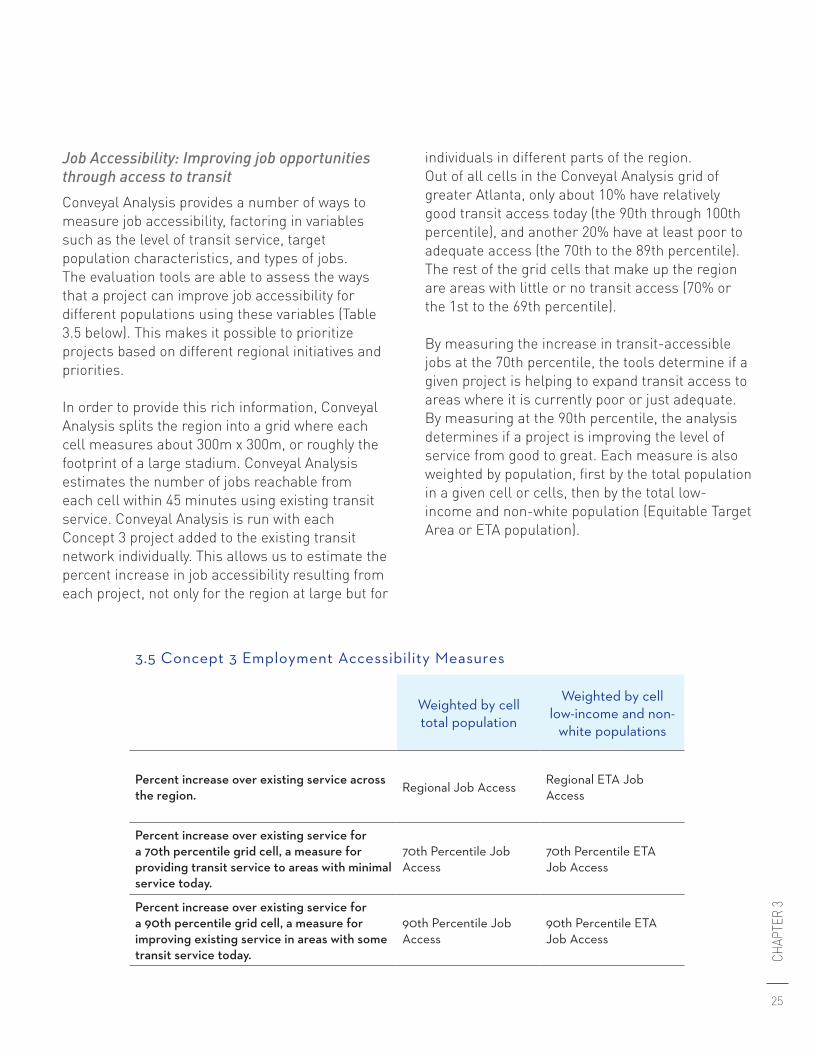
Job Accessibility: Improving job opportunities through access to transitConveyal Analysis provides a number of ways to measure job accessibility, factoring in variables such as the level of transit service, target population characteristics, and types of jobs. The evaluation tools are able to assess the ways that a project can improve job accessibility for different populations using these variables (Table 3.5 below). This makes it possible to prioritize projects based on different regional initiatives and priorities.
In order to provide this rich information, Conveyal Analysis splits the region into a grid where each cell measures about 300m x 300m, or roughly the footprint of a large stadium. Conveyal Analysis estimates the number of jobs reachable from each cell within 45 minutes using existing transit service. Conveyal Analysis is run with each Concept 3 project added to the existing transit network individually. This allows us to estimate the percent increase in job accessibility resulting from each project, not only for the region at large but for
individuals in different parts of the region.Out of all cells in the Conveyal Analysis grid of greater Atlanta, only about 10% have relatively good transit access today (the 90th through 100th percentile), and another 20% have at least poor to adequate access (the 70th to the 89th percentile). The rest of the grid cells that make up the region are areas with little or no transit access (70% or the 1st to the 69th percentile).
By measuring the increase in transit-accessible jobs at the 70th percentile, the tools determine if a given project is helping to expand transit access to areas where it is currently poor or just adequate. By measuring at the 90th percentile, the analysis determines if a project is improving the level of service from good to great. Each measure is also weighted by population, first by the total population in a given cell or cells, then by the total low-income and non-white population (Equitable Target Area or ETA population).
3.5 Concept 3 Employment Accessibility Measures
Weighted by cell total population
Weighted by cell low-income and non-
white populations
Percent increase over existing service across the region. Regional Job Access Regional ETA Job
Access
Percent increase over existing service for a 70th percentile grid cell, a measure for providing transit service to areas with minimal service today.
70th Percentile Job Access
70th Percentile ETA Job Access
Percent increase over existing service for a 90th percentile grid cell, a measure for improving existing service in areas with some transit service today.
90th Percentile Job Access
90th Percentile ETA Job Access
26
CONC
EPT 3
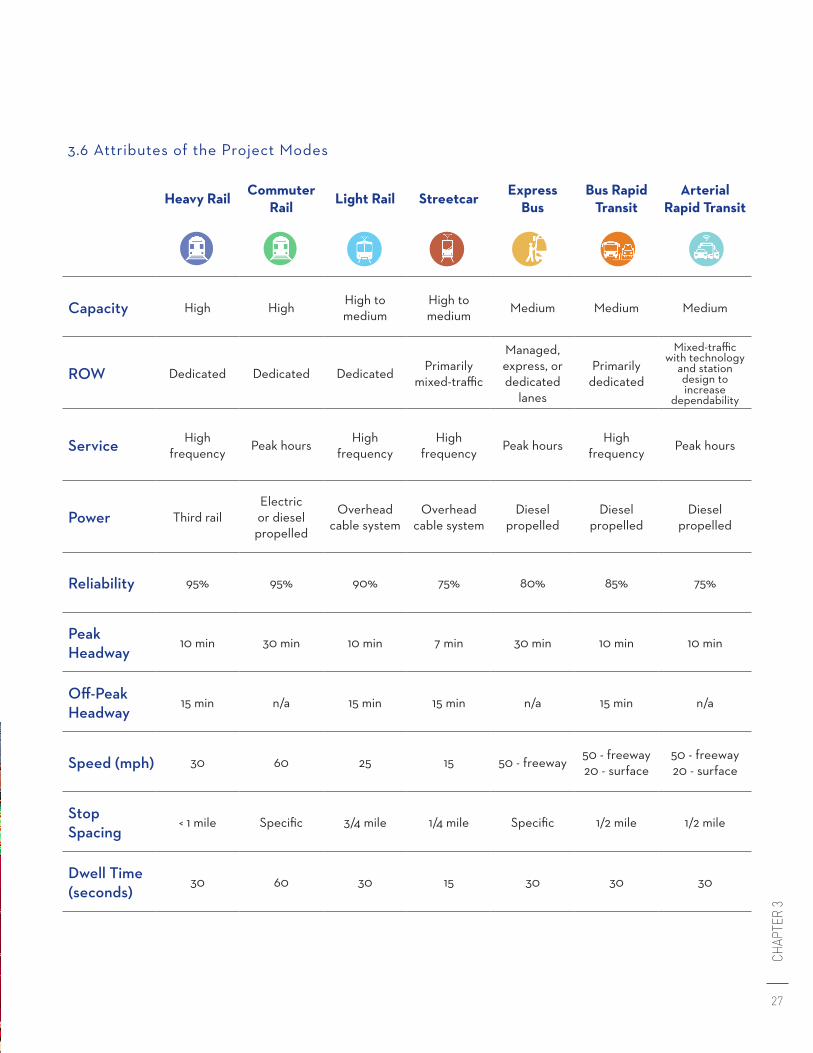
MODAL CHARACTERISTICS
Each project in Concept 3 is categorized as one of seven different modes. Each mode has a number of service characteristics that are used in the analysis in Remix and Conveyal, as outlined in Table 3.6 on the following page. As an aside, all heavy rail transit pojects in Concept 3 are extensions of existing MARTA services, and associated values are based on the performance of each service.
These values are based on the judgment of the project team with participation from ARC and considering comparable systems in other cities. They may not represent actual values used in planning or designing the specific projects. Many projects include specific information on stop location, which will override the stop spacing defaults. Streetcar and bus projects will follow existing highway facilities unless specifically indicated in the project definition. Light rail and commuter rail projects will use non-highway alignments.
While power sources are assumed for the purposes of Remix and Conveyal analyses, air quality and emissions are not evaluated in detail in Concept 3. However, air quality is addressed conceptually in Concept 3, and more detailed air quality and emissions evaluations are conducted through near-term project prioritization processes.
27
CHAP
TER
3
3.6 Attributes of the Project Modes
Heavy Rail Commuter Rail Light Rail Streetcar Express
BusBus Rapid
TransitArterial
Rapid Transit
Capacity High High High to medium
High to medium Medium Medium Medium
ROW Dedicated Dedicated Dedicated Primarily mixed-traffic
Managed, express, or dedicated
lanes
Primarily dedicated
Mixed-traffic with technology
and station design to increase
dependability
Service High frequency Peak hours High
frequencyHigh
frequency Peak hours High frequency Peak hours
Power Third railElectric or diesel propelled
Overhead cable system
Overhead cable system
Diesel propelled
Diesel propelled
Diesel propelled
Reliability 95% 95% 90% 75% 80% 85% 75%
Peak Headway
10 min 30 min 10 min 7 min 30 min 10 min 10 min
Off-Peak Headway
15 min n/a 15 min 15 min n/a 15 min n/a
Speed (mph) 30 60 25 15 50 - freeway 50 - freeway 20 - surface
50 - freeway 20 - surface
Stop Spacing
< 1 mile Specific 3/4 mile 1/4 mile Specific 1/2 mile 1/2 mile
Dwell Time (seconds)
30 60 30 15 30 30 30

28
CONC
EPT 3
CHAPTER 4
29
CHAP
TER
4
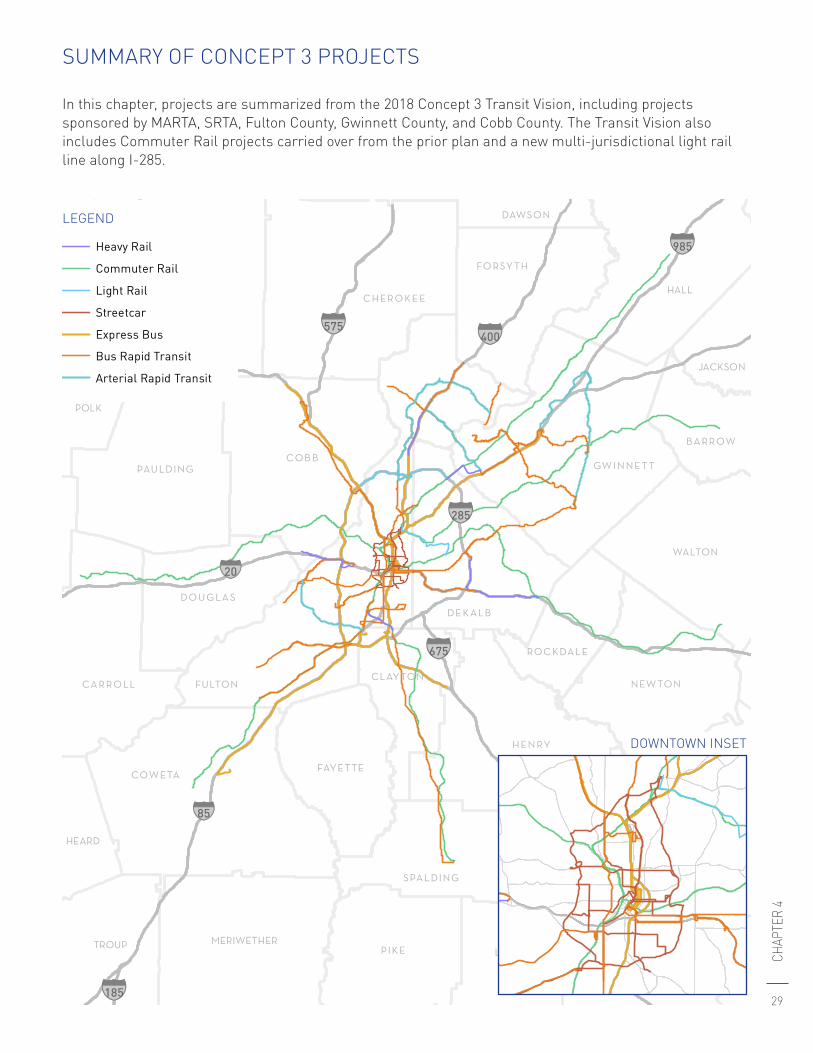
In this chapter, projects are summarized from the 2018 Concept 3 Transit Vision, including projects sponsored by MARTA, SRTA, Fulton County, Gwinnett County, and Cobb County. The Transit Vision also includes Commuter Rail projects carried over from the prior plan and a new multi-jurisdictional light rail line along I-285.
SUMMARY OF CONCEPT 3 PROJECTS
FAYETTE
ROCKDAL E
COB B
FO RSY TH
CLAY TON
HEN RY
NEW TON
GW IN NE T T
FULTON
DO U G LA S
COWETA
DE KA LB
CHER O KE E
PAU LDING
CA R R O LL
DAWSON
SPAL DING
WALTON
PIKE
BA RR OW
POLK
JONESMONROELAMAR
MERIWETHERTROUP
HEARD BUTTSJASPER
JACKSON
BARTOW HALL
§̈¦675
§̈¦285
§̈¦185
§̈¦575
§̈¦985
§̈¦400
§̈¦75
§̈¦20
§̈¦85
LEGEND
Heavy Rail
Commuter Rail
Light Rail
Streetcar
Express Bus
Bus Rapid Transit
Arterial Rapid Transit
DOWNTOWN INSET
LEGEND
30
CONC
EPT 3
REGIONAL PRIORITY TRANSIT PROJECTS
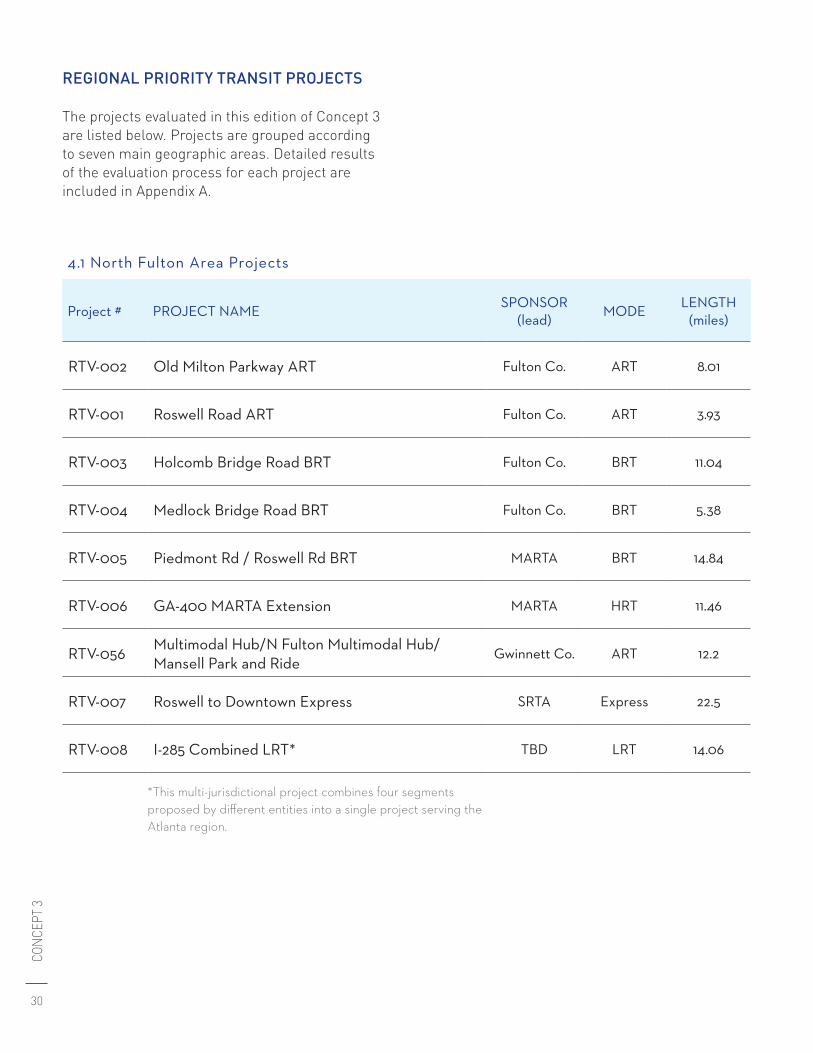
The projects evaluated in this edition of Concept 3 are listed below. Projects are grouped according to seven main geographic areas. Detailed results of the evaluation process for each project are included in Appendix A.
4.1 North Fulton Area Projects
Project # PROJECT NAME SPONSOR (lead) MODE LENGTH
(miles)
RTV-002 Old Milton Parkway ART Fulton Co. ART 8.01
RTV-001 Roswell Road ART Fulton Co. ART 3.93
RTV-003 Holcomb Bridge Road BRT Fulton Co. BRT 11.04
RTV-004 Medlock Bridge Road BRT Fulton Co. BRT 5.38
RTV-005 Piedmont Rd / Roswell Rd BRT MARTA BRT 14.84
RTV-006 GA-400 MARTA Extension MARTA HRT 11.46
RTV-056 Multimodal Hub/N Fulton Multimodal Hub/Mansell Park and Ride
Gwinnett Co. ART 12.2
RTV-007 Roswell to Downtown Express SRTA Express 22.5
RTV-008 I-285 Combined LRT* TBD LRT 14.06
*This multi-jurisdictional project combines four segments proposed by different entities into a single project serving the Atlanta region.
31
CHAP
TER
4
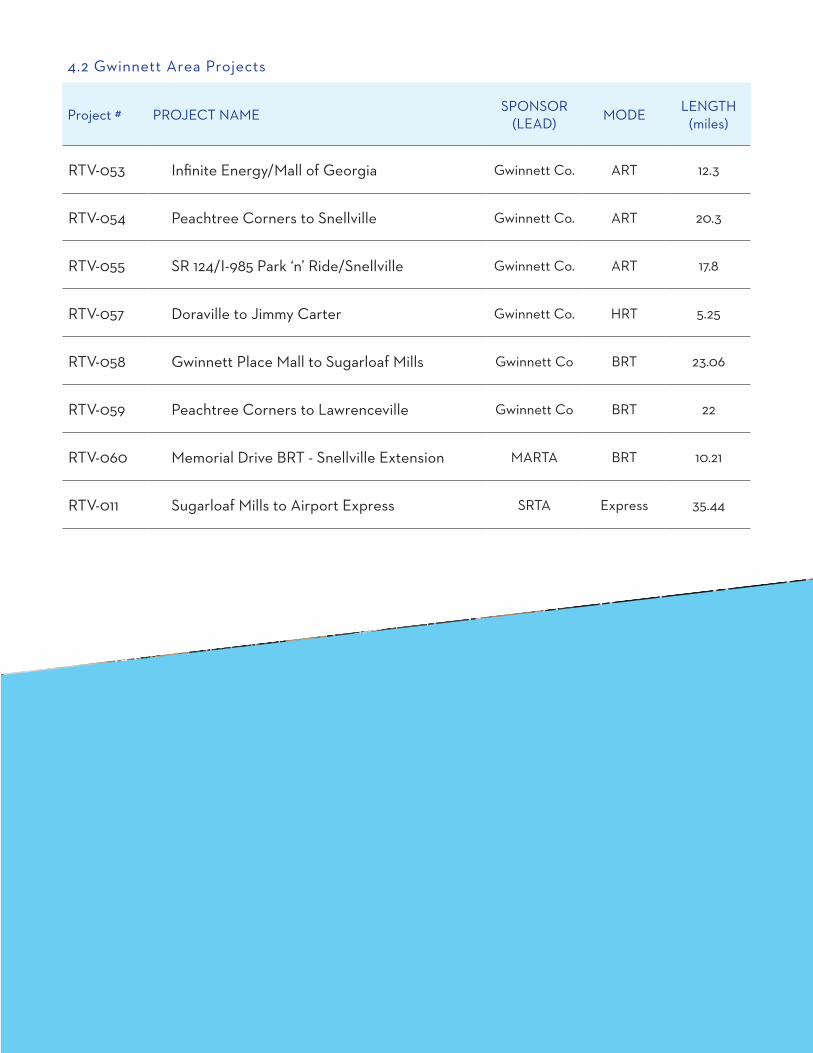
4.2 Gwinnett Area Projects
Project # PROJECT NAME SPONSOR (LEAD) MODE LENGTH
(miles)
RTV-053 Infinite Energy/Mall of Georgia Gwinnett Co. ART 12.3
RTV-054 Peachtree Corners to Snellville Gwinnett Co. ART 20.3
RTV-055 SR 124/I-985 Park ‘n’ Ride/Snellville Gwinnett Co. ART 17.8
RTV-057 Doraville to Jimmy Carter Gwinnett Co. HRT 5.25
RTV-058 Gwinnett Place Mall to Sugarloaf Mills Gwinnett Co BRT 23.06
RTV-059 Peachtree Corners to Lawrenceville Gwinnett Co BRT 22
RTV-060 Memorial Drive BRT - Snellville Extension MARTA BRT 10.21
RTV-011 Sugarloaf Mills to Airport Express SRTA Express 35.44
32
CONC
EPT 3
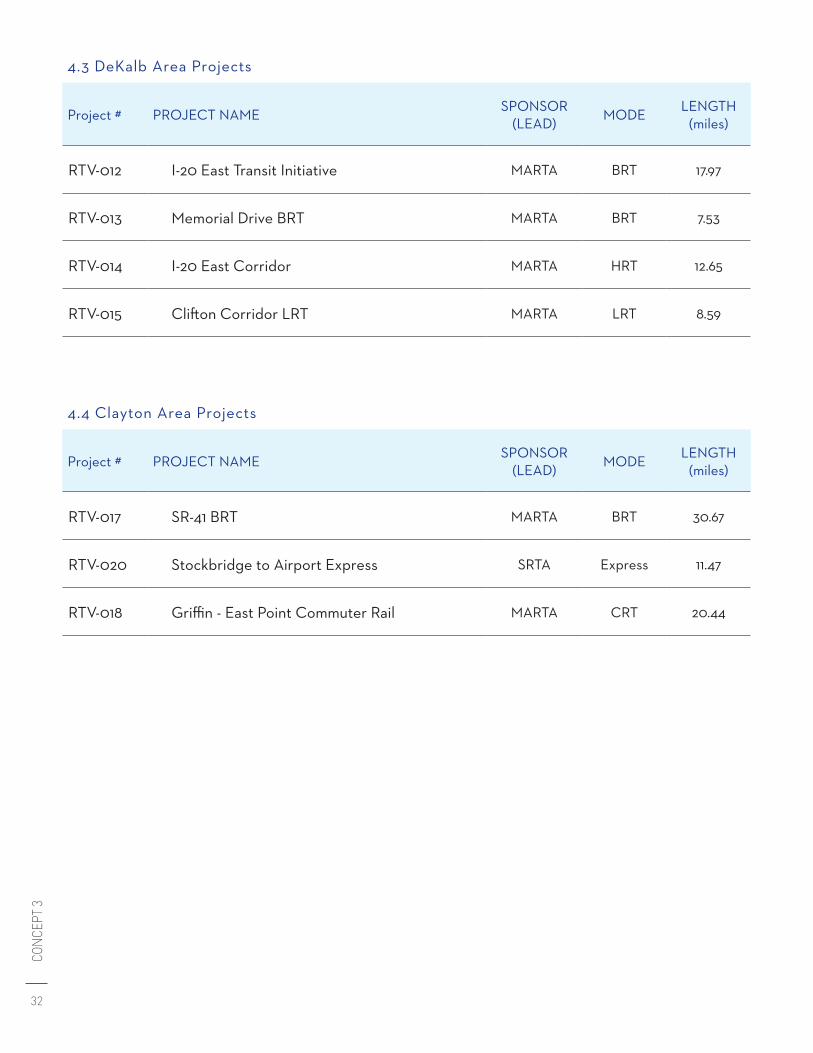
4.3 DeKalb Area Projects
Project # PROJECT NAME SPONSOR (LEAD) MODE LENGTH
(miles)
RTV-012 I-20 East Transit Initiative MARTA BRT 17.97
RTV-013 Memorial Drive BRT MARTA BRT 7.53
RTV-014 I-20 East Corridor MARTA HRT 12.65
RTV-015 Clifton Corridor LRT MARTA LRT 8.59
4.4 Clayton Area Projects
Project # PROJECT NAME SPONSOR (LEAD) MODE LENGTH
(miles)
RTV-017 SR-41 BRT MARTA BRT 30.67
RTV-020 Stockbridge to Airport Express SRTA Express 11.47
RTV-018 Griffin - East Point Commuter Rail MARTA CRT 20.44
33
CHAP
TER
4
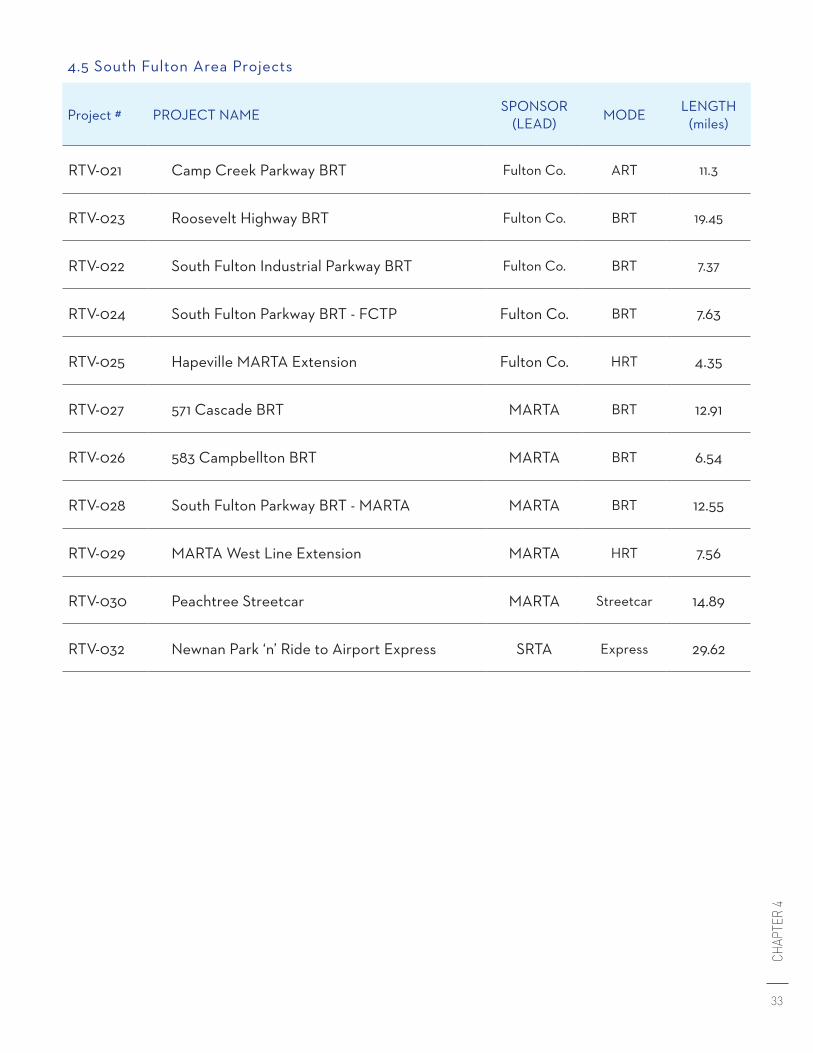
4.5 South Fulton Area Projects
Project # PROJECT NAME SPONSOR (LEAD) MODE LENGTH
(miles)
RTV-021 Camp Creek Parkway BRT Fulton Co. ART 11.3
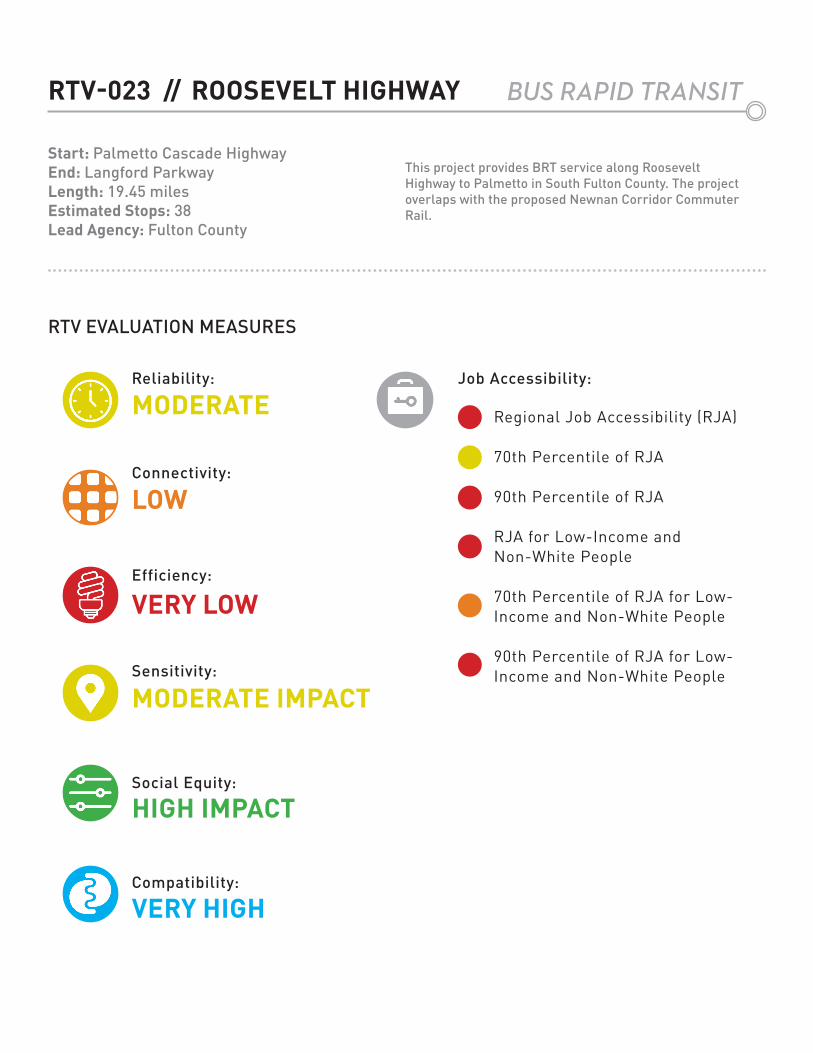
RTV-023 Roosevelt Highway BRT Fulton Co. BRT 19.45
RTV-022 South Fulton Industrial Parkway BRT Fulton Co. BRT 7.37
RTV-024 South Fulton Parkway BRT - FCTP Fulton Co. BRT 7.63
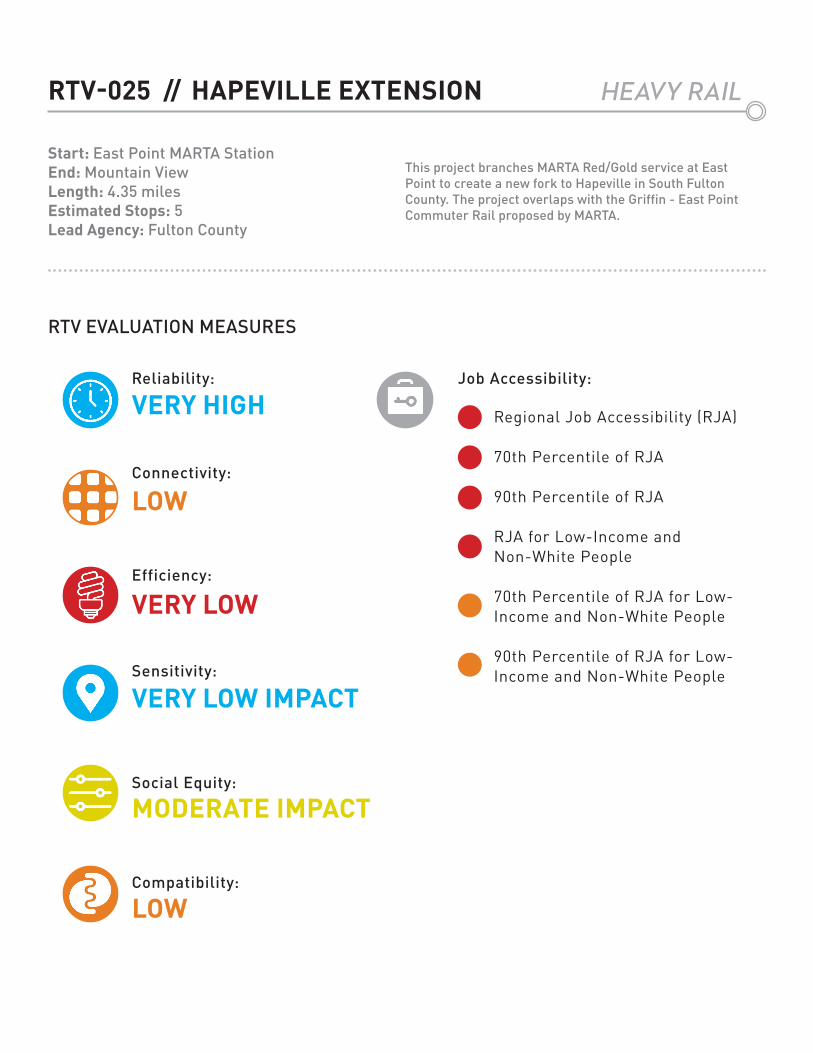
RTV-025 Hapeville MARTA Extension Fulton Co. HRT 4.35
RTV-027 571 Cascade BRT MARTA BRT 12.91
RTV-026 583 Campbellton BRT MARTA BRT 6.54
RTV-028 South Fulton Parkway BRT - MARTA MARTA BRT 12.55
RTV-029 MARTA West Line Extension MARTA HRT 7.56
RTV-030 Peachtree Streetcar MARTA Streetcar 14.89
RTV-032 Newnan Park ‘n’ Ride to Airport Express SRTA Express 29.62
34
CONC
EPT 3
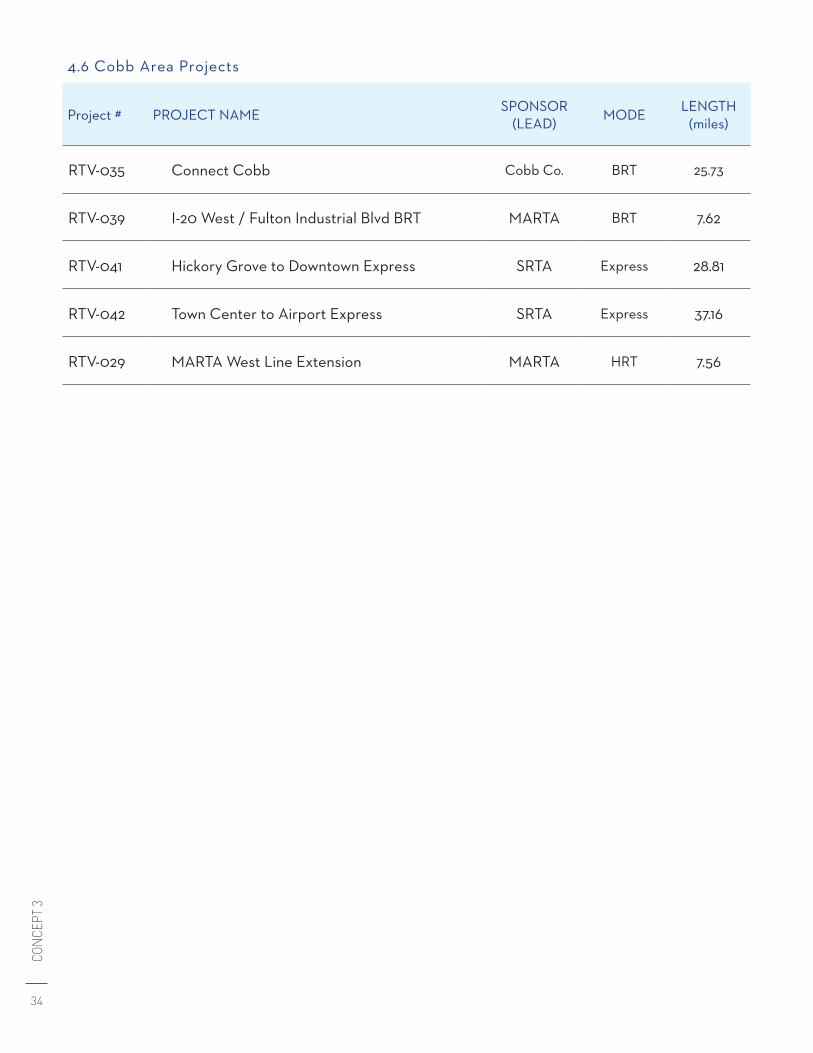
4.6 Cobb Area Projects
Project # PROJECT NAME SPONSOR (LEAD) MODE LENGTH
(miles)
RTV-035 Connect Cobb Cobb Co. BRT 25.73
RTV-039 I-20 West / Fulton Industrial Blvd BRT MARTA BRT 7.62
RTV-041 Hickory Grove to Downtown Express SRTA Express 28.81
RTV-042 Town Center to Airport Express SRTA Express 37.16
RTV-029 MARTA West Line Extension MARTA HRT 7.56
35
CHAP
TER
4
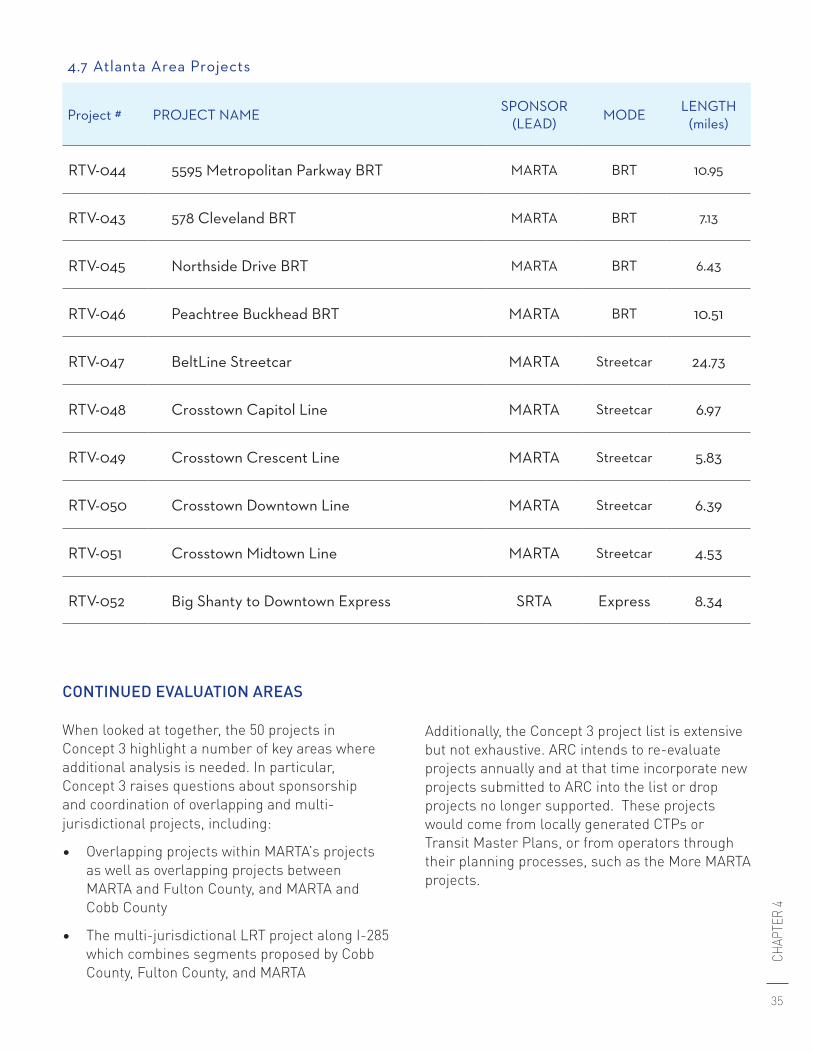
4.7 Atlanta Area Projects
Project # PROJECT NAME SPONSOR (LEAD) MODE LENGTH
(miles)
RTV-044 5595 Metropolitan Parkway BRT MARTA BRT 10.95
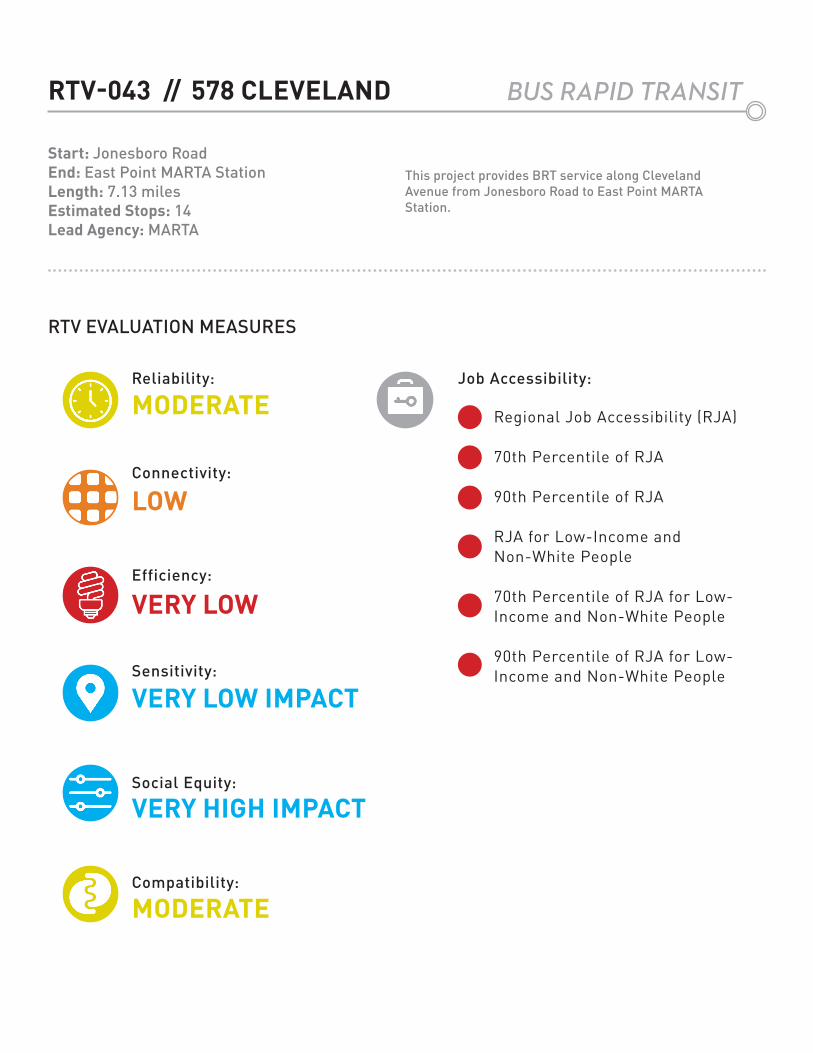
RTV-043 578 Cleveland BRT MARTA BRT 7.13
RTV-045 Northside Drive BRT MARTA BRT 6.43
RTV-046 Peachtree Buckhead BRT MARTA BRT 10.51
RTV-047 BeltLine Streetcar MARTA Streetcar 24.73
RTV-048 Crosstown Capitol Line MARTA Streetcar 6.97
RTV-049 Crosstown Crescent Line MARTA Streetcar 5.83
RTV-050 Crosstown Downtown Line MARTA Streetcar 6.39
RTV-051 Crosstown Midtown Line MARTA Streetcar 4.53
RTV-052 Big Shanty to Downtown Express SRTA Express 8.34
CONTINUED EVALUATION AREAS
When looked at together, the 50 projects in Concept 3 highlight a number of key areas where additional analysis is needed. In particular, Concept 3 raises questions about sponsorship and coordination of overlapping and multi-jurisdictional projects, including:
• Overlapping projects within MARTA’s projects as well as overlapping projects between MARTA and Fulton County, and MARTA and Cobb County
• The multi-jurisdictional LRT project along I-285 which combines segments proposed by Cobb County, Fulton County, and MARTA
Additionally, the Concept 3 project list is extensive but not exhaustive. ARC intends to re-evaluate projects annually and at that time incorporate new projects submitted to ARC into the list or drop projects no longer supported. These projects would come from locally generated CTPs or Transit Master Plans, or from operators through their planning processes, such as the More MARTA projects.

36
CONC
EPT 3
CHAPTER 5
37
CHAP
TER
5
NEXT STEPS
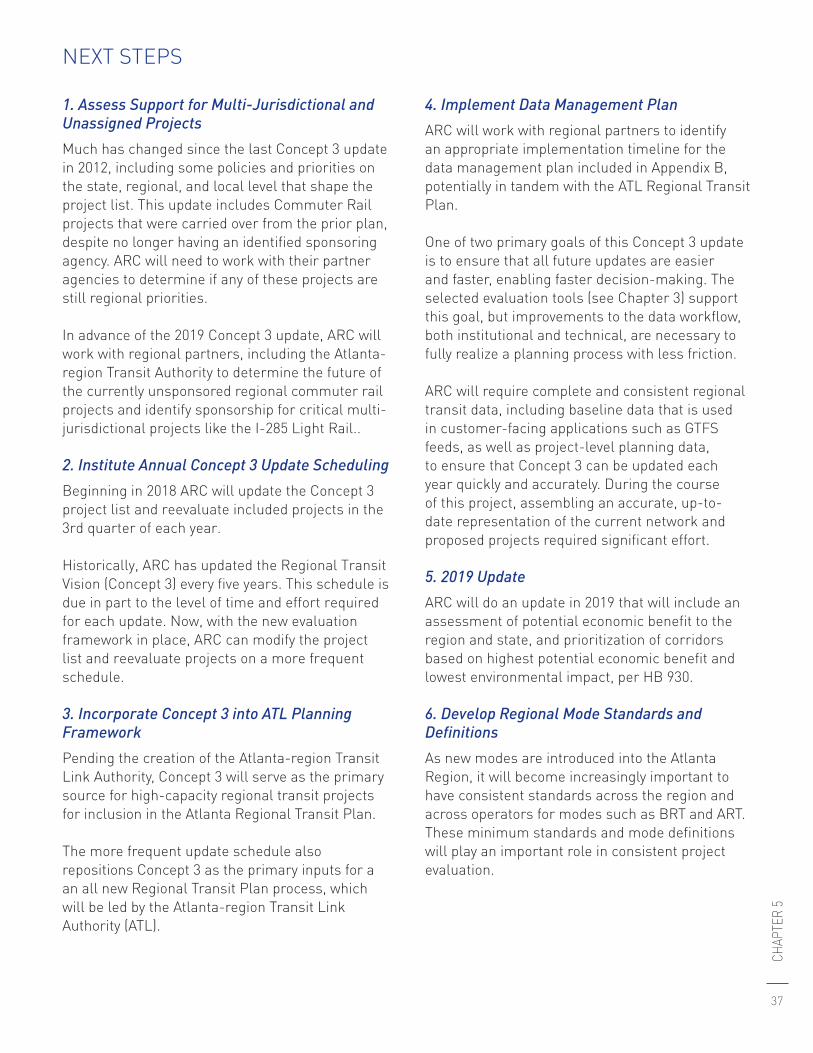
1. Assess Support for Multi-Jurisdictional and Unassigned ProjectsMuch has changed since the last Concept 3 update in 2012, including some policies and priorities on the state, regional, and local level that shape the project list. This update includes Commuter Rail projects that were carried over from the prior plan, despite no longer having an identified sponsoring agency. ARC will need to work with their partner agencies to determine if any of these projects are still regional priorities.
In advance of the 2019 Concept 3 update, ARC will work with regional partners, including the Atlanta-region Transit Authority to determine the future of the currently unsponsored regional commuter rail projects and identify sponsorship for critical multi-jurisdictional projects like the I-285 Light Rail..
2. Institute Annual Concept 3 Update SchedulingBeginning in 2018 ARC will update the Concept 3 project list and reevaluate included projects in the 3rd quarter of each year.
Historically, ARC has updated the Regional Transit Vision (Concept 3) every five years. This schedule is due in part to the level of time and effort required for each update. Now, with the new evaluation framework in place, ARC can modify the project list and reevaluate projects on a more frequent schedule.
3. Incorporate Concept 3 into ATL Planning FrameworkPending the creation of the Atlanta-region Transit Link Authority, Concept 3 will serve as the primary source for high-capacity regional transit projects for inclusion in the Atlanta Regional Transit Plan.
The more frequent update schedule also repositions Concept 3 as the primary inputs for a an all new Regional Transit Plan process, which will be led by the Atlanta-region Transit Link Authority (ATL).
4. Implement Data Management PlanARC will work with regional partners to identify an appropriate implementation timeline for the data management plan included in Appendix B, potentially in tandem with the ATL Regional Transit Plan.
One of two primary goals of this Concept 3 update is to ensure that all future updates are easier and faster, enabling faster decision-making. The selected evaluation tools (see Chapter 3) support this goal, but improvements to the data workflow, both institutional and technical, are necessary to fully realize a planning process with less friction.
ARC will require complete and consistent regional transit data, including baseline data that is used in customer-facing applications such as GTFS feeds, as well as project-level planning data, to ensure that Concept 3 can be updated each year quickly and accurately. During the course of this project, assembling an accurate, up-to-date representation of the current network and proposed projects required significant effort.
5. 2019 UpdateARC will do an update in 2019 that will include an assessment of potential economic benefit to the region and state, and prioritization of corridors based on highest potential economic benefit and lowest environmental impact, per HB 930.
6. Develop Regional Mode Standards and DefinitionsAs new modes are introduced into the Atlanta Region, it will become increasingly important to have consistent standards across the region and across operators for modes such as BRT and ART. These minimum standards and mode definitions will play an important role in consistent project evaluation.
38
CONC
EPT 3
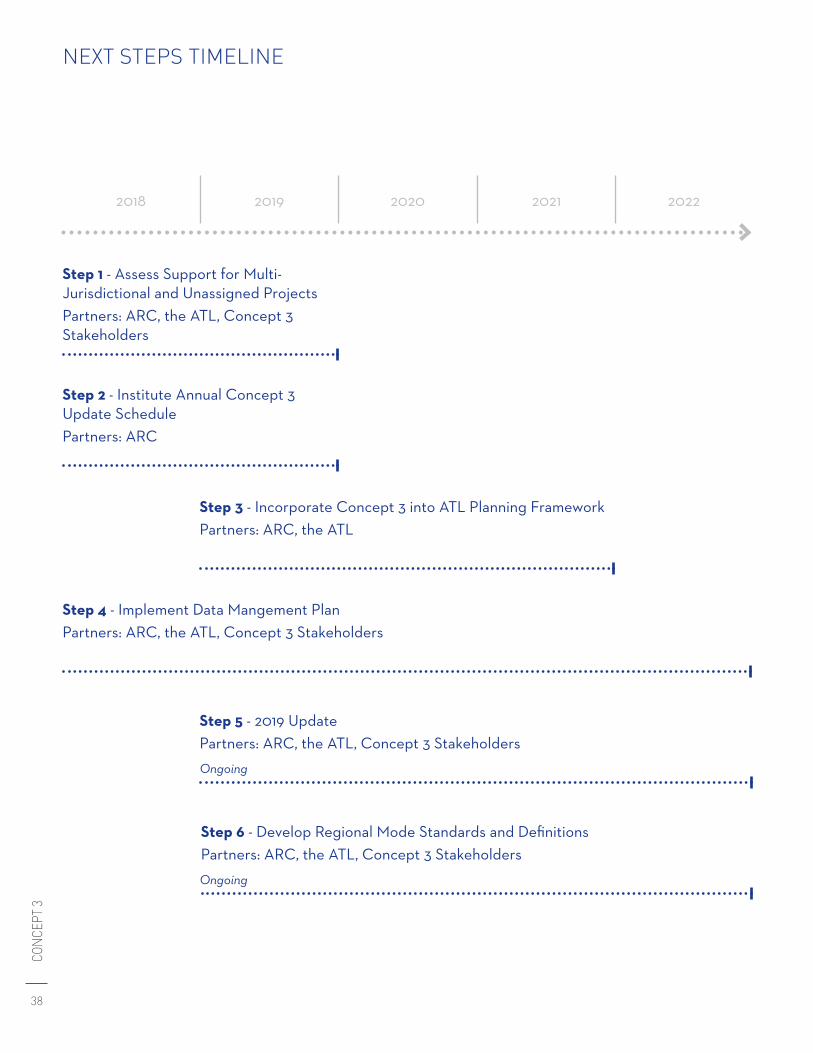
NEXT STEPS TIMELINE
2018 2019 2020 2021 2022
Step 1 - Assess Support for Multi-Jurisdictional and Unassigned ProjectsPartners: ARC, the ATL, Concept 3 Stakeholders
Step 2 - Institute Annual Concept 3 Update SchedulePartners: ARC
Step 3 - Incorporate Concept 3 into ATL Planning FrameworkPartners: ARC, the ATL
Step 4 - Implement Data Mangement PlanPartners: ARC, the ATL, Concept 3 Stakeholders
Step 5 - 2019 UpdatePartners: ARC, the ATL, Concept 3 Stakeholders
Step 6 - Develop Regional Mode Standards and DefinitionsPartners: ARC, the ATL, Concept 3 Stakeholders
Ongoing
Ongoing

39
CHAP
TER
5
page intentionally blank
APPENDIX ADETAILED PROJECT INFORMATION SHEET
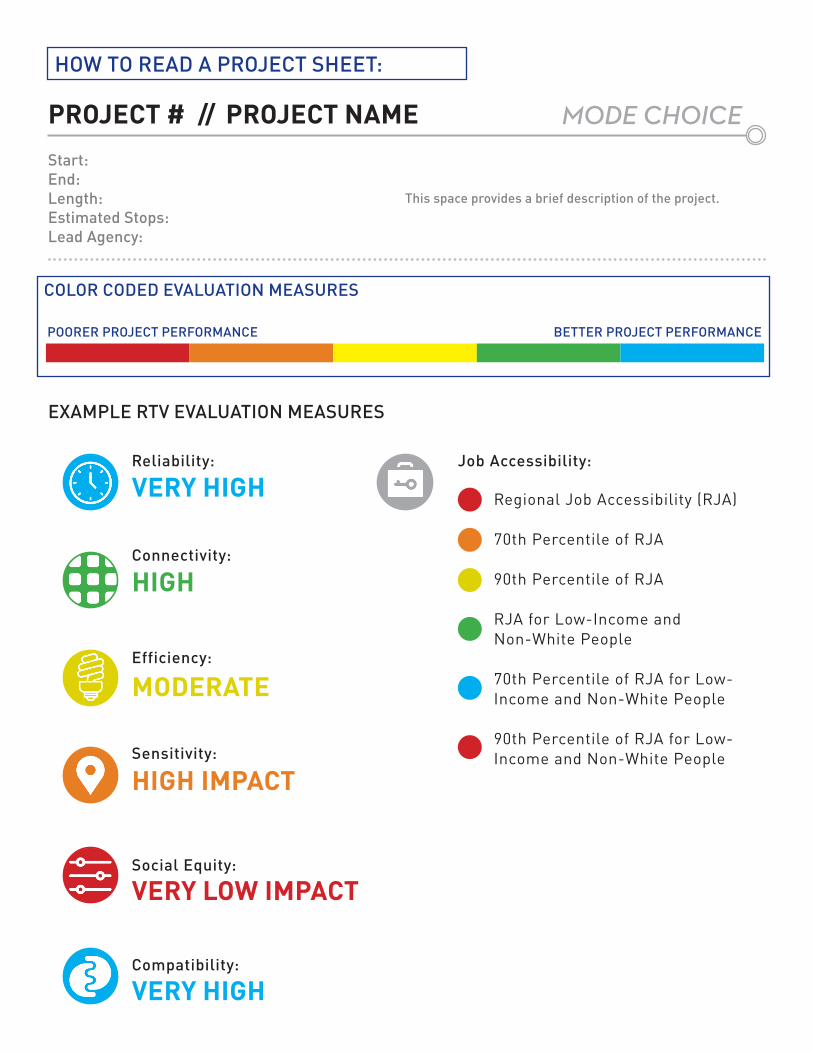
Start: End: Length: Estimated Stops:Lead Agency:
This space provides a brief description of the project.
HOW TO READ A PROJECT SHEET:
PROJECT # // PROJECT NAME MODE CHOICE
EXAMPLE RTV EVALUATION MEASURES
Reliability:
Connectivity:
Efficiency:
Sensitivity:
Social Equity:
Compatibility:
Job Accessibility:
Regional Job Accessibility (RJA)
70th Percentile of RJA
90th Percentile of RJA
RJA for Low-Income and Non-White People
70th Percentile of RJA for Low-Income and Non-White People
90th Percentile of RJA for Low-Income and Non-White People
VERY HIGH
HIGH
MODERATE
HIGH IMPACT
VERY LOW IMPACT
VERY HIGH
COLOR CODED EVALUATION MEASURES
POORER PROJECT PERFORMANCE BETTER PROJECT PERFORMANCE
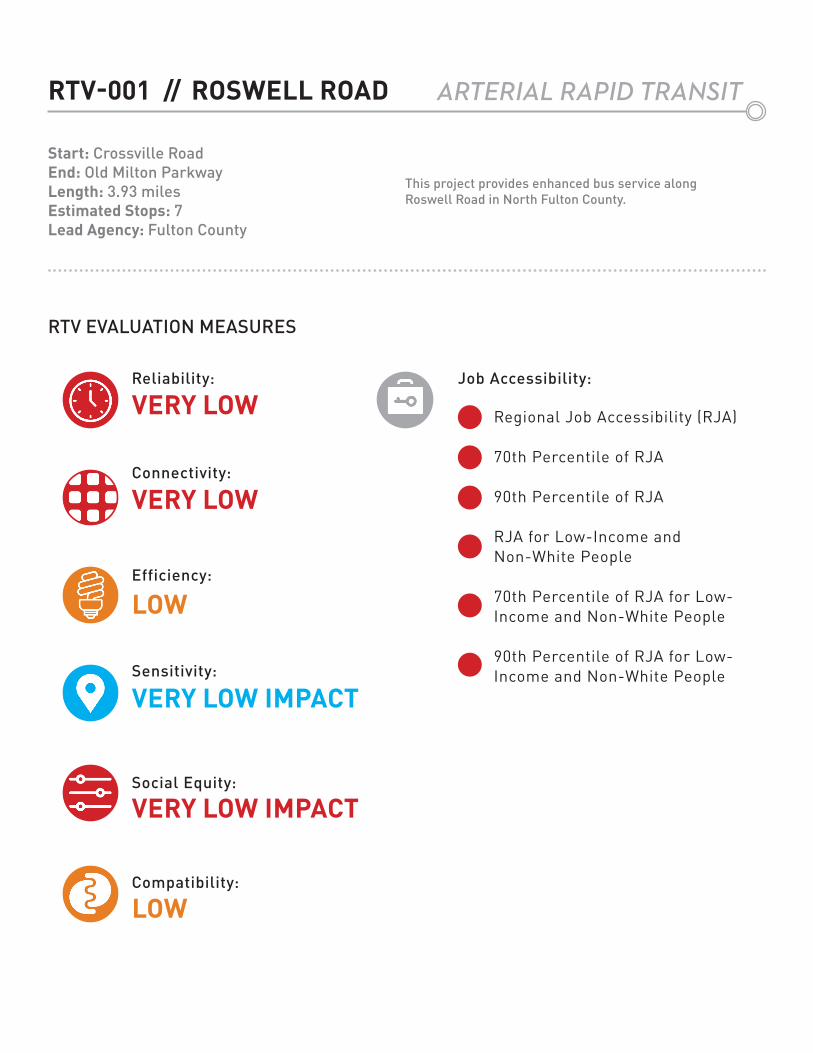
RTV-001 // ROSWELL ROAD
Start: Crossville RoadEnd: Old Milton ParkwayLength: 3.93 milesEstimated Stops: 7Lead Agency: Fulton County
This project provides enhanced bus service along Roswell Road in North Fulton County.
ARTERIAL RAPID TRANSIT
Reliability:
Connectivity:
Efficiency:
Sensitivity:
Social Equity:
Compatibility:
Job Accessibility:
Regional Job Accessibility (RJA)
70th Percentile of RJA
90th Percentile of RJA
RJA for Low-Income and Non-White People
70th Percentile of RJA for Low-Income and Non-White People
90th Percentile of RJA for Low-Income and Non-White People
RTV EVALUATION MEASURES
VERY LOW
VERY LOW
LOW
VERY LOW IMPACT
VERY LOW IMPACT
LOW
Reliability:
Connectivity:
Efficiency:
Sensitivity:
Social Equity:
Compatibility:
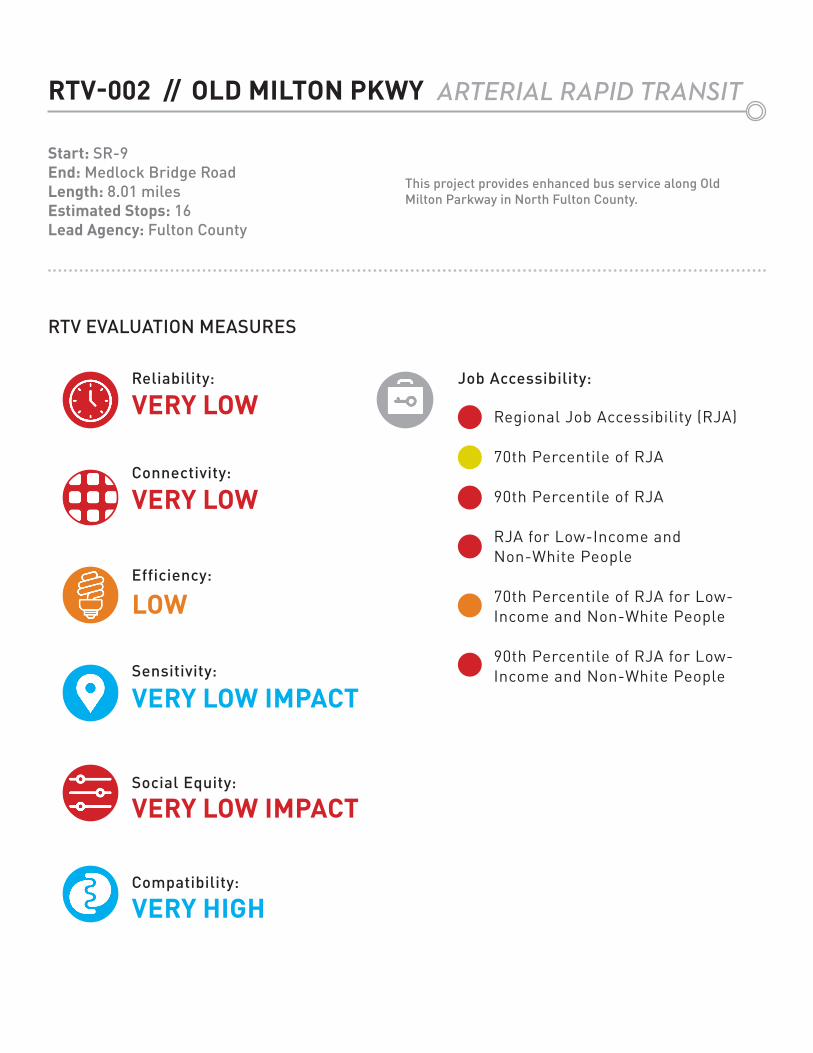
Job Accessibility:
Regional Job Accessibility (RJA)
70th Percentile of RJA
90th Percentile of RJA
RJA for Low-Income and Non-White People
70th Percentile of RJA for Low-Income and Non-White People
90th Percentile of RJA for Low-Income and Non-White People
RTV-002 // OLD MILTON PKWY
Start: SR-9End: Medlock Bridge RoadLength: 8.01 milesEstimated Stops: 16Lead Agency: Fulton County
This project provides enhanced bus service along Old Milton Parkway in North Fulton County.
ARTERIAL RAPID TRANSIT
RTV EVALUATION MEASURES
VERY LOW
VERY LOW
LOW
VERY LOW IMPACT
VERY LOW IMPACT
VERY HIGH
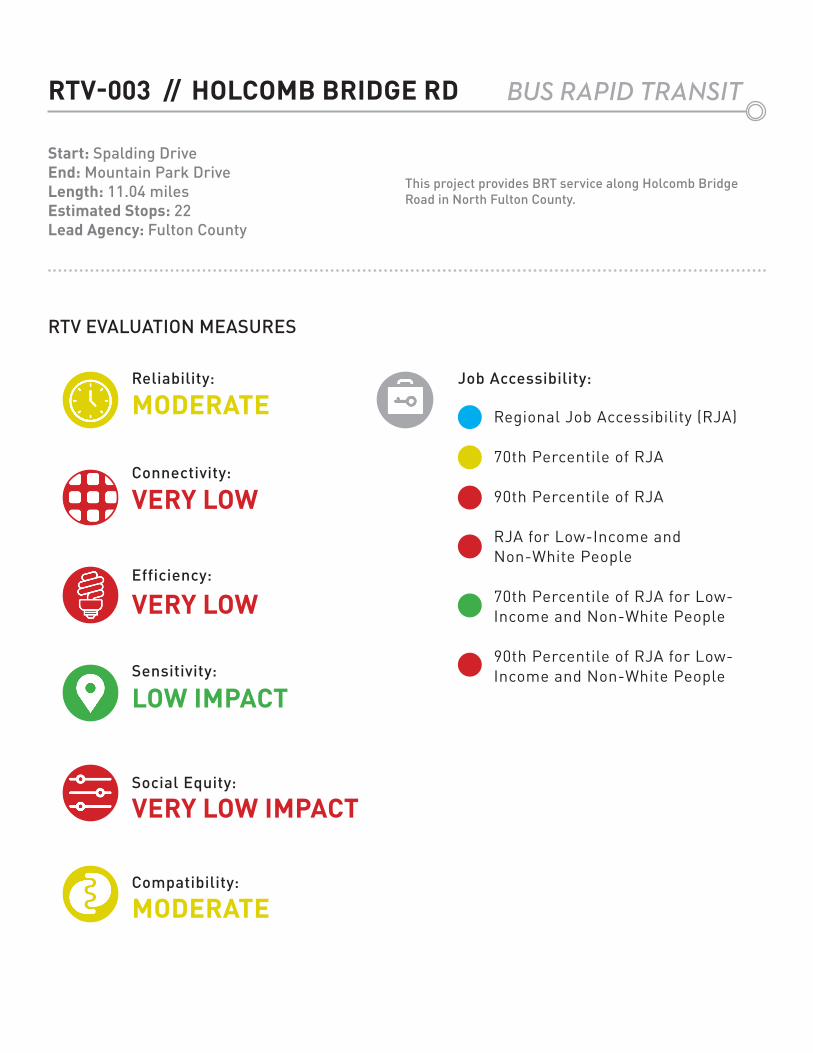
RTV-003 // HOLCOMB BRIDGE RD
Start: Spalding DriveEnd: Mountain Park DriveLength: 11.04 milesEstimated Stops: 22Lead Agency: Fulton County
This project provides BRT service along Holcomb Bridge Road in North Fulton County.
BUS RAPID TRANSIT
Reliability:
Connectivity:
Efficiency:
Sensitivity:
Social Equity:
Compatibility:
Job Accessibility:
Regional Job Accessibility (RJA)
70th Percentile of RJA
90th Percentile of RJA
RJA for Low-Income and Non-White People
70th Percentile of RJA for Low-Income and Non-White People
90th Percentile of RJA for Low-Income and Non-White People
RTV EVALUATION MEASURES
MODERATE
VERY LOW
VERY LOW
LOW IMPACT
VERY LOW IMPACT
MODERATE
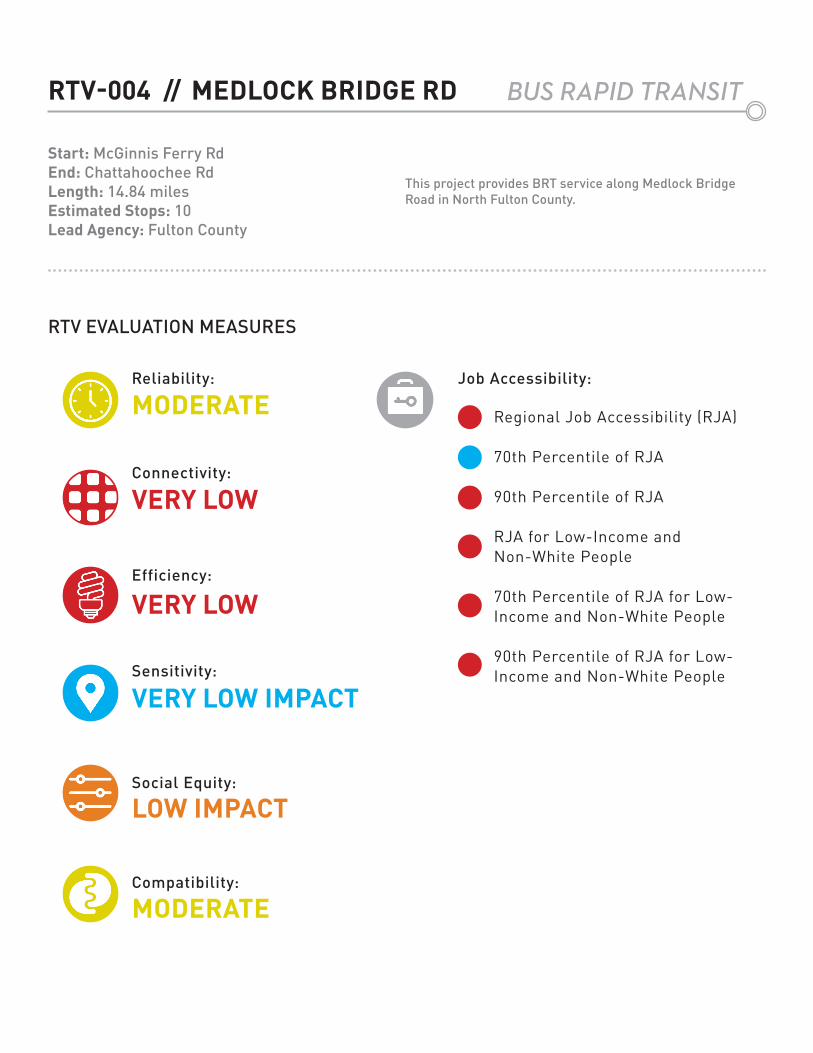
Reliability:
Connectivity:
Efficiency:
Sensitivity:
Social Equity:
Compatibility:
Job Accessibility:
Regional Job Accessibility (RJA)
70th Percentile of RJA
90th Percentile of RJA
RJA for Low-Income and Non-White People
70th Percentile of RJA for Low-Income and Non-White People
90th Percentile of RJA for Low-Income and Non-White People
RTV-004 // MEDLOCK BRIDGE RD
Start: McGinnis Ferry RdEnd: Chattahoochee RdLength: 14.84 milesEstimated Stops: 10Lead Agency: Fulton County
This project provides BRT service along Medlock Bridge Road in North Fulton County.
BUS RAPID TRANSIT
RTV EVALUATION MEASURES
MODERATE
VERY LOW
VERY LOW
VERY LOW IMPACT
LOW IMPACT
MODERATE
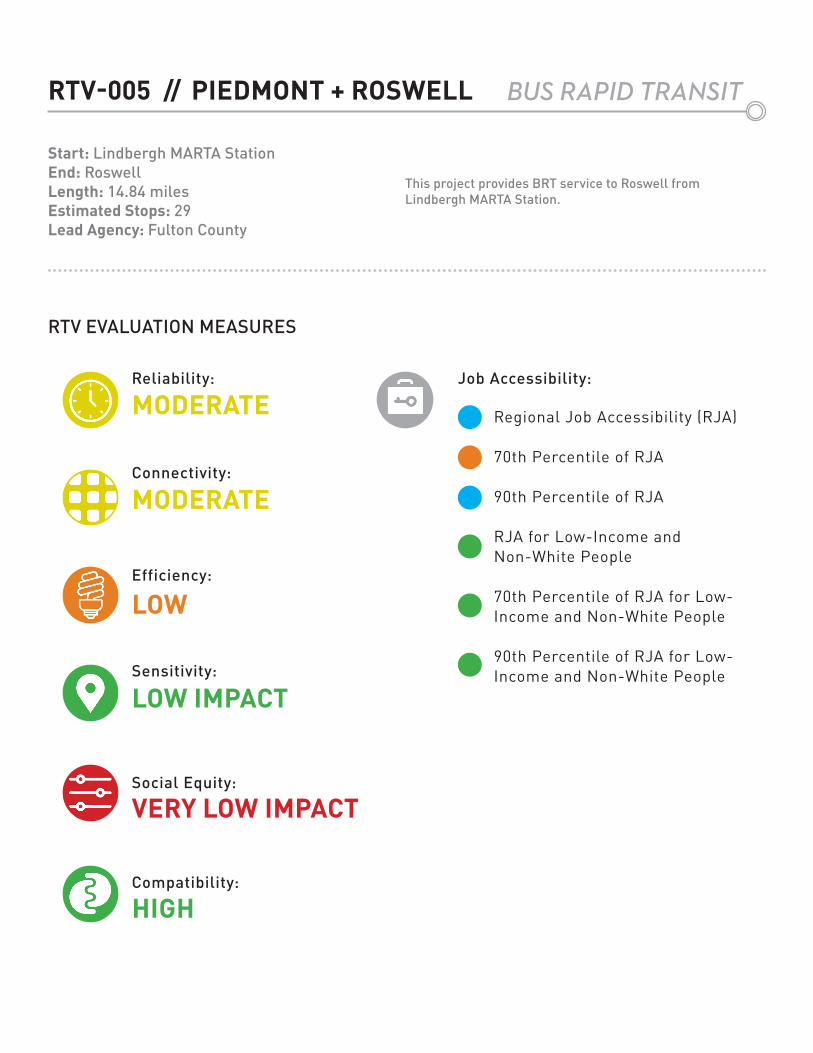
RTV-005 // PIEDMONT + ROSWELL
Start: Lindbergh MARTA StationEnd: RoswellLength: 14.84 milesEstimated Stops: 29Lead Agency: Fulton County
This project provides BRT service to Roswell from Lindbergh MARTA Station.
BUS RAPID TRANSIT
Reliability:
Connectivity:
Efficiency:
Sensitivity:
Social Equity:
Compatibility:
Job Accessibility:
Regional Job Accessibility (RJA)
70th Percentile of RJA
90th Percentile of RJA
RJA for Low-Income and Non-White People
70th Percentile of RJA for Low-Income and Non-White People
90th Percentile of RJA for Low-Income and Non-White People
RTV EVALUATION MEASURES
MODERATE
MODERATE
LOW
LOW IMPACT
VERY LOW IMPACT
HIGH
Reliability:
Connectivity:
Efficiency:
Sensitivity:
Social Equity:
Compatibility:
Job Accessibility:
Regional Job Accessibility (RJA)
70th Percentile of RJA
90th Percentile of RJA
RJA for Low-Income and Non-White People
70th Percentile of RJA for Low-Income and Non-White People
90th Percentile of RJA for Low-Income and Non-White People
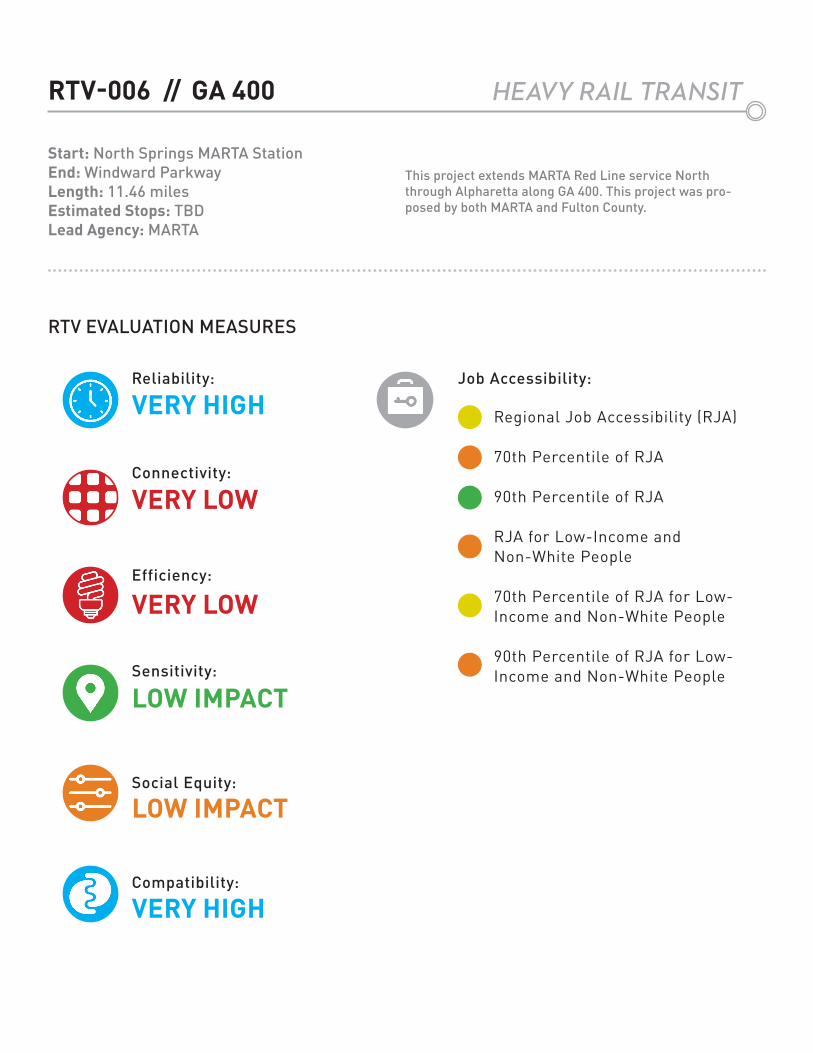
RTV-006 // GA 400
Start: North Springs MARTA StationEnd: Windward ParkwayLength: 11.46 milesEstimated Stops: TBDLead Agency: MARTA
This project extends MARTA Red Line service North through Alpharetta along GA 400. This project was pro-posed by both MARTA and Fulton County.
HEAVY RAIL TRANSIT
RTV EVALUATION MEASURES
VERY HIGH
VERY LOW
VERY LOW
LOW IMPACT
LOW IMPACT
VERY HIGH
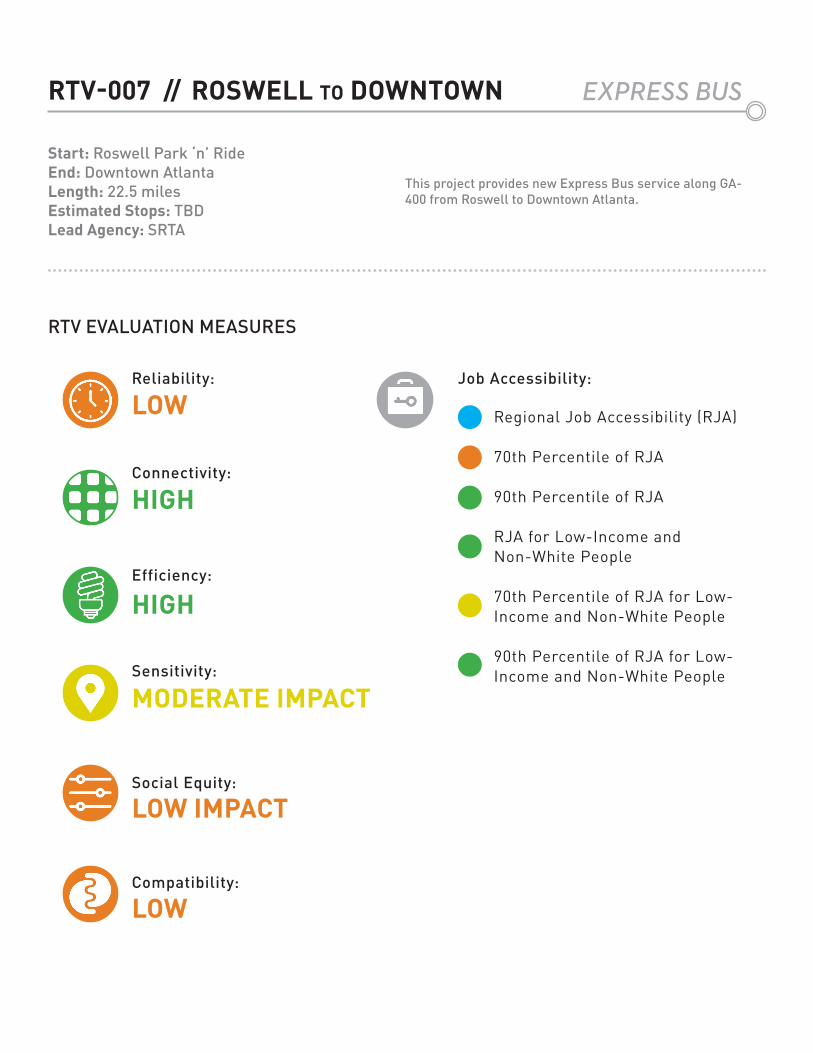
RTV-007 // ROSWELL TO DOWNTOWN
Start: Roswell Park ‘n’ RideEnd: Downtown AtlantaLength: 22.5 milesEstimated Stops: TBDLead Agency: SRTA
This project provides new Express Bus service along GA-400 from Roswell to Downtown Atlanta.
EXPRESS BUS
Reliability:
Connectivity:
Efficiency:
Sensitivity:
Social Equity:
Compatibility:
Job Accessibility:
Regional Job Accessibility (RJA)
70th Percentile of RJA
90th Percentile of RJA
RJA for Low-Income and Non-White People
70th Percentile of RJA for Low-Income and Non-White People
90th Percentile of RJA for Low-Income and Non-White People
RTV EVALUATION MEASURES
LOW
HIGH
HIGH
MODERATE IMPACT
LOW IMPACT
LOW
Reliability:
Connectivity:
Efficiency:
Sensitivity:
Social Equity:
Compatibility:
Job Accessibility:
Regional Job Accessibility (RJA)
70th Percentile of RJA
90th Percentile of RJA
RJA for Low-Income and Non-White People
70th Percentile of RJA for Low-Income and Non-White People
90th Percentile of RJA for Low-Income and Non-White People
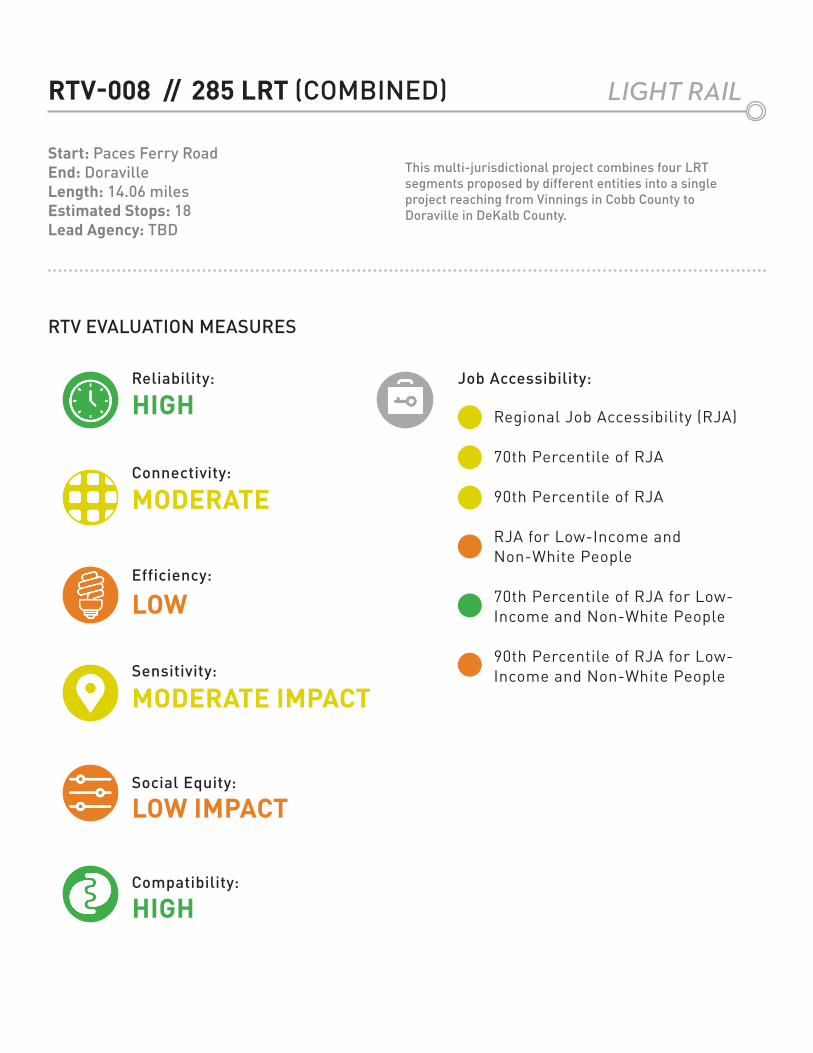
RTV-008 // 285 LRT (COMBINED)
Start: Paces Ferry RoadEnd: DoravilleLength: 14.06 milesEstimated Stops: 18Lead Agency: TBD
This multi-jurisdictional project combines four LRT segments proposed by different entities into a single project reaching from Vinnings in Cobb County to Doraville in DeKalb County.
LIGHT RAIL
RTV EVALUATION MEASURES
HIGH
MODERATE
LOW
MODERATE IMPACT
LOW IMPACT
HIGH
Reliability:
Connectivity:
Efficiency:
Sensitivity:
Social Equity:
Compatibility:
Job Accessibility:
Regional Job Accessibility (RJA)
70th Percentile of RJA
90th Percentile of RJA
RJA for Low-Income and Non-White People
70th Percentile of RJA for Low-Income and Non-White People
90th Percentile of RJA for Low-Income and Non-White People
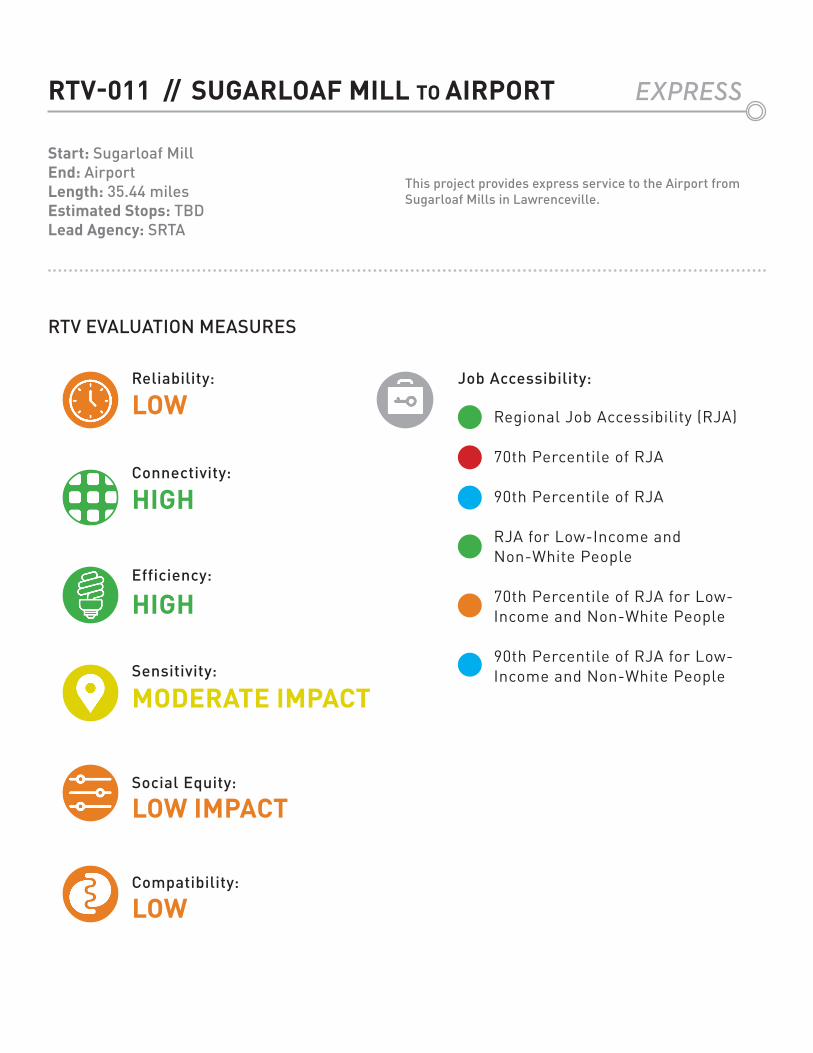
RTV-011 // SUGARLOAF MILL TO AIRPORT
Start: Sugarloaf MillEnd: AirportLength: 35.44 milesEstimated Stops: TBDLead Agency: SRTA
This project provides express service to the Airport from Sugarloaf Mills in Lawrenceville.
EXPRESS
RTV EVALUATION MEASURES
LOW
HIGH
HIGH
MODERATE IMPACT
LOW IMPACT
LOW
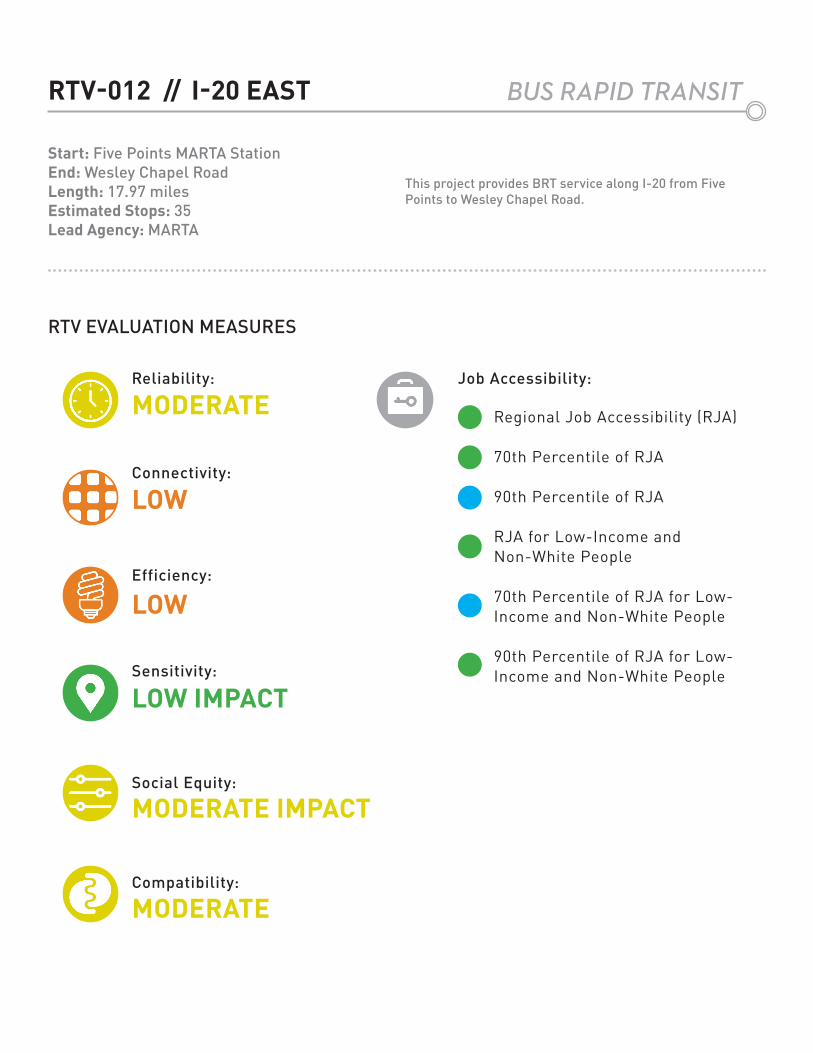
RTV-012 // I-20 EAST
Start: Five Points MARTA StationEnd: Wesley Chapel RoadLength: 17.97 milesEstimated Stops: 35Lead Agency: MARTA
This project provides BRT service along I-20 from Five Points to Wesley Chapel Road.
BUS RAPID TRANSIT
Reliability:
Connectivity:
Efficiency:
Sensitivity:
Social Equity:
Compatibility:
Job Accessibility:
Regional Job Accessibility (RJA)
70th Percentile of RJA
90th Percentile of RJA
RJA for Low-Income and Non-White People
70th Percentile of RJA for Low-Income and Non-White People
90th Percentile of RJA for Low-Income and Non-White People
RTV EVALUATION MEASURES
MODERATE
LOW
LOW
LOW IMPACT
MODERATE IMPACT
MODERATE
Reliability:
Connectivity:
Efficiency:
Sensitivity:
Social Equity:
Compatibility:
Job Accessibility:
Regional Job Accessibility (RJA)
70th Percentile of RJA
90th Percentile of RJA
RJA for Low-Income and Non-White People
70th Percentile of RJA for Low-Income and Non-White People
90th Percentile of RJA for Low-Income and Non-White People
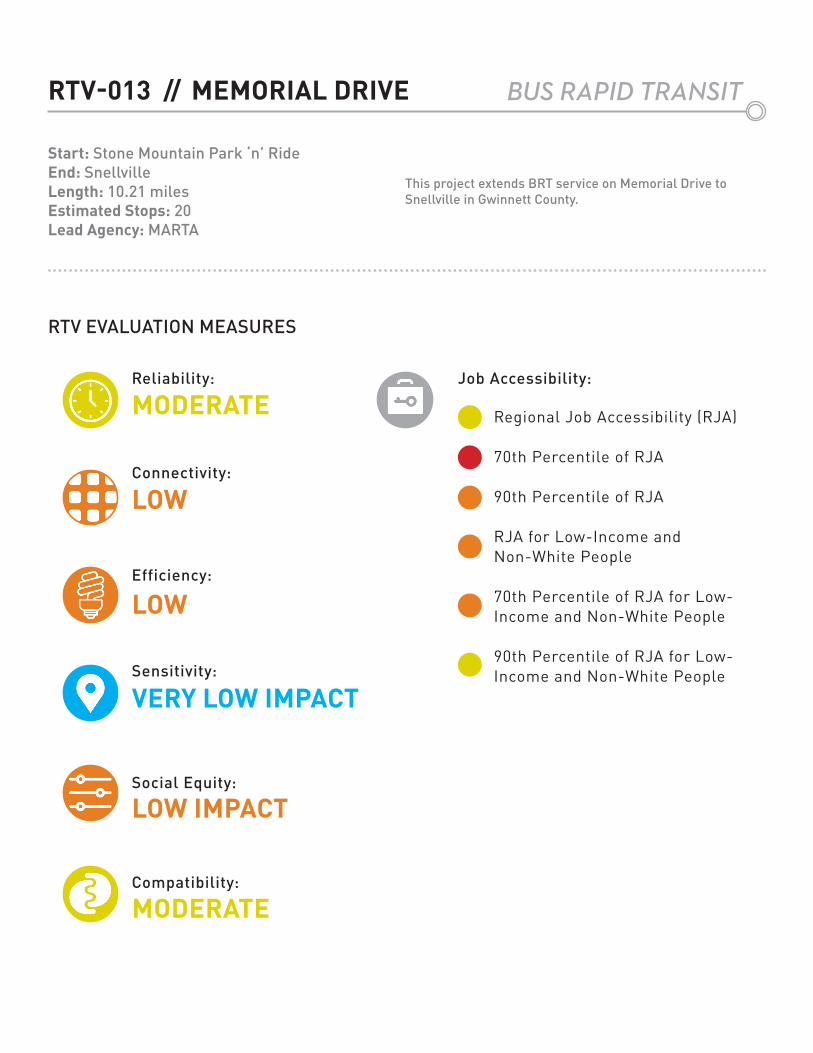
RTV-013 // MEMORIAL DRIVE
Start: Stone Mountain Park ‘n’ RideEnd: SnellvilleLength: 10.21 milesEstimated Stops: 20Lead Agency: MARTA
This project extends BRT service on Memorial Drive to Snellville in Gwinnett County.
BUS RAPID TRANSIT
RTV EVALUATION MEASURES
MODERATE
LOW
LOW
VERY LOW IMPACT
LOW IMPACT
MODERATE
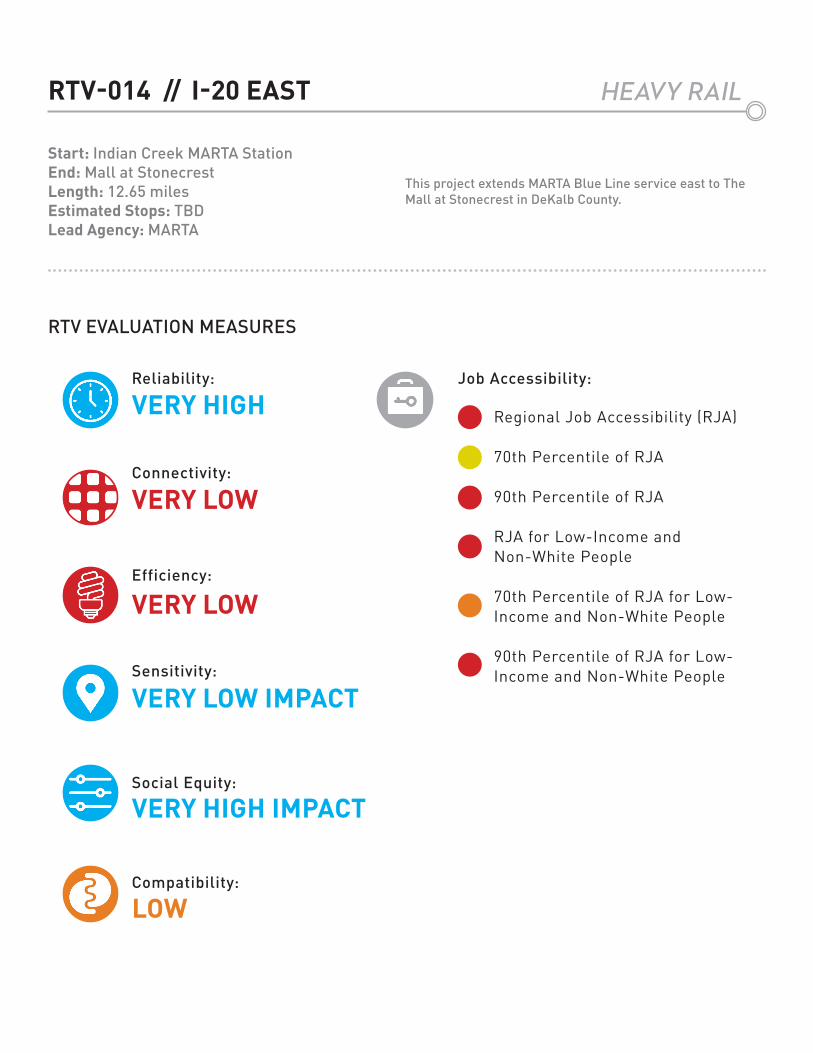
RTV-014 // I-20 EAST
Start: Indian Creek MARTA StationEnd: Mall at StonecrestLength: 12.65 milesEstimated Stops: TBDLead Agency: MARTA
This project extends MARTA Blue Line service east to The Mall at Stonecrest in DeKalb County.
HEAVY RAIL
Reliability:
Connectivity:
Efficiency:
Sensitivity:
Social Equity:
Compatibility:
Job Accessibility:
Regional Job Accessibility (RJA)
70th Percentile of RJA
90th Percentile of RJA
RJA for Low-Income and Non-White People
70th Percentile of RJA for Low-Income and Non-White People
90th Percentile of RJA for Low-Income and Non-White People
RTV EVALUATION MEASURES
VERY HIGH
VERY LOW
VERY LOW
VERY LOW IMPACT
VERY HIGH IMPACT
LOW
Reliability:
Connectivity:
Efficiency:
Sensitivity:
Social Equity:
Compatibility:
Job Accessibility:
Regional Job Accessibility (RJA)
70th Percentile of RJA
90th Percentile of RJA
RJA for Low-Income and Non-White People
70th Percentile of RJA for Low-Income and Non-White People
90th Percentile of RJA for Low-Income and Non-White People
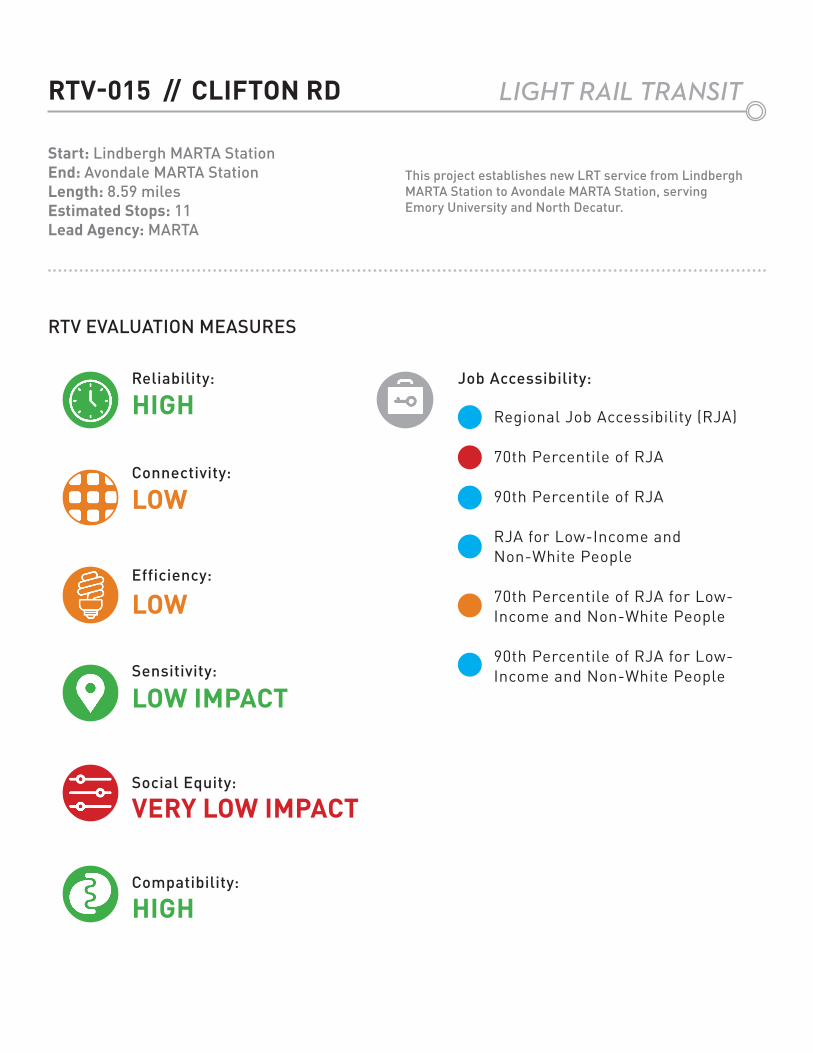
RTV-015 // CLIFTON RD
Start: Lindbergh MARTA StationEnd: Avondale MARTA StationLength: 8.59 milesEstimated Stops: 11Lead Agency: MARTA
This project establishes new LRT service from Lindbergh MARTA Station to Avondale MARTA Station, serving Emory University and North Decatur.
LIGHT RAIL TRANSIT
RTV EVALUATION MEASURES
HIGH
LOW
LOW
LOW IMPACT
VERY LOW IMPACT
HIGH
Reliability:
Connectivity:
Efficiency:
Sensitivity:
Social Equity:
Compatibility:
Job Accessibility:
Regional Job Accessibility (RJA)
70th Percentile of RJA
90th Percentile of RJA
RJA for Low-Income and Non-White People
70th Percentile of RJA for Low-Income and Non-White People
90th Percentile of RJA for Low-Income and Non-White People
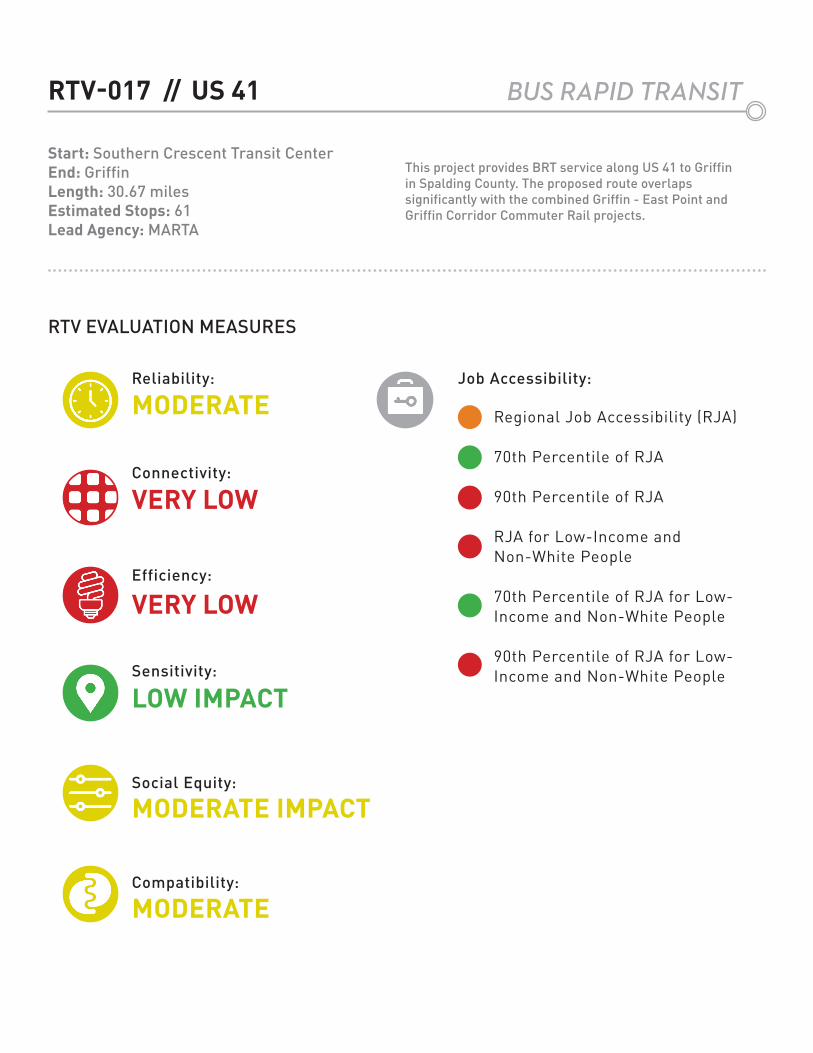
RTV-017 // US 41
Start: Southern Crescent Transit CenterEnd: GriffinLength: 30.67 milesEstimated Stops: 61Lead Agency: MARTA
This project provides BRT service along US 41 to Griffin in Spalding County. The proposed route overlaps significantly with the combined Griffin - East Point and Griffin Corridor Commuter Rail projects.
BUS RAPID TRANSIT
RTV EVALUATION MEASURES
MODERATE
VERY LOW
VERY LOW
LOW IMPACT
MODERATE IMPACT
MODERATE
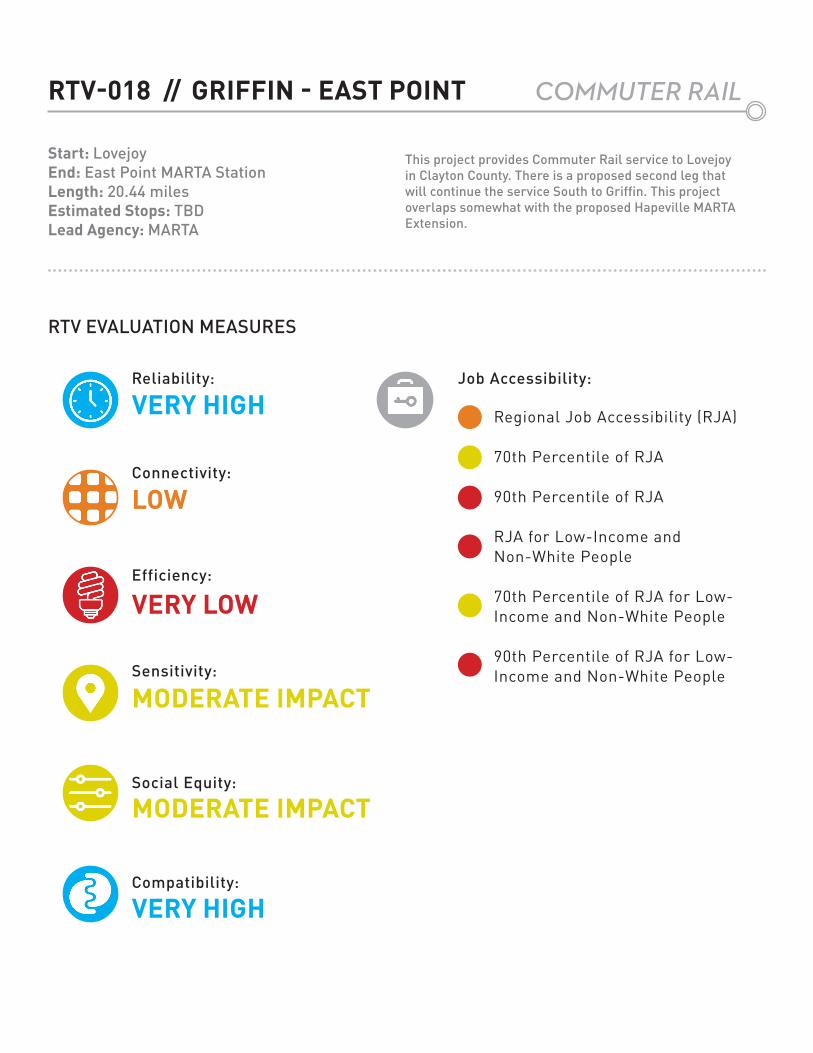
RTV-018 // GRIFFIN - EAST POINT
Start: LovejoyEnd: East Point MARTA StationLength: 20.44 milesEstimated Stops: TBDLead Agency: MARTA
This project provides Commuter Rail service to Lovejoy in Clayton County. There is a proposed second leg that will continue the service South to Griffin. This project overlaps somewhat with the proposed Hapeville MARTA Extension.
COMMUTER RAIL
Reliability:
Connectivity:
Efficiency:
Sensitivity:
Social Equity:
Compatibility:
Job Accessibility:
Regional Job Accessibility (RJA)
70th Percentile of RJA
90th Percentile of RJA
RJA for Low-Income and Non-White People
70th Percentile of RJA for Low-Income and Non-White People
90th Percentile of RJA for Low-Income and Non-White People
RTV EVALUATION MEASURES
VERY HIGH
LOW
VERY LOW
MODERATE IMPACT
MODERATE IMPACT
VERY HIGH
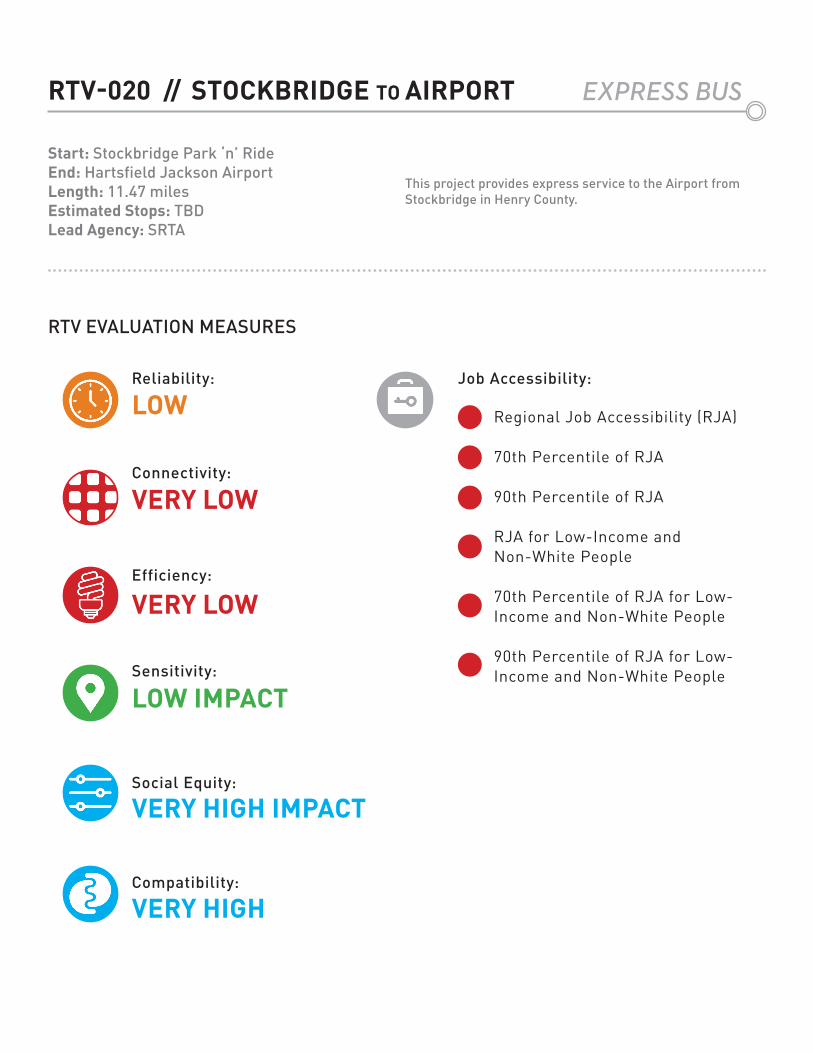
RTV-020 // STOCKBRIDGE TO AIRPORT
Start: Stockbridge Park ‘n’ RideEnd: Hartsfield Jackson AirportLength: 11.47 milesEstimated Stops: TBDLead Agency: SRTA
This project provides express service to the Airport from Stockbridge in Henry County.
EXPRESS BUS
Reliability:
Connectivity:
Efficiency:
Sensitivity:
Social Equity:
Compatibility:
Job Accessibility:
Regional Job Accessibility (RJA)
70th Percentile of RJA
90th Percentile of RJA
RJA for Low-Income and Non-White People
70th Percentile of RJA for Low-Income and Non-White People
90th Percentile of RJA for Low-Income and Non-White People
RTV EVALUATION MEASURES
LOW
VERY LOW
VERY LOW
LOW IMPACT
VERY HIGH IMPACT
VERY HIGH
Reliability:
Connectivity:
Efficiency:
Sensitivity:
Social Equity:
Compatibility:
Job Accessibility:
Regional Job Accessibility (RJA)
70th Percentile of RJA
90th Percentile of RJA
RJA for Low-Income and Non-White People
70th Percentile of RJA for Low-Income and Non-White People
90th Percentile of RJA for Low-Income and Non-White People
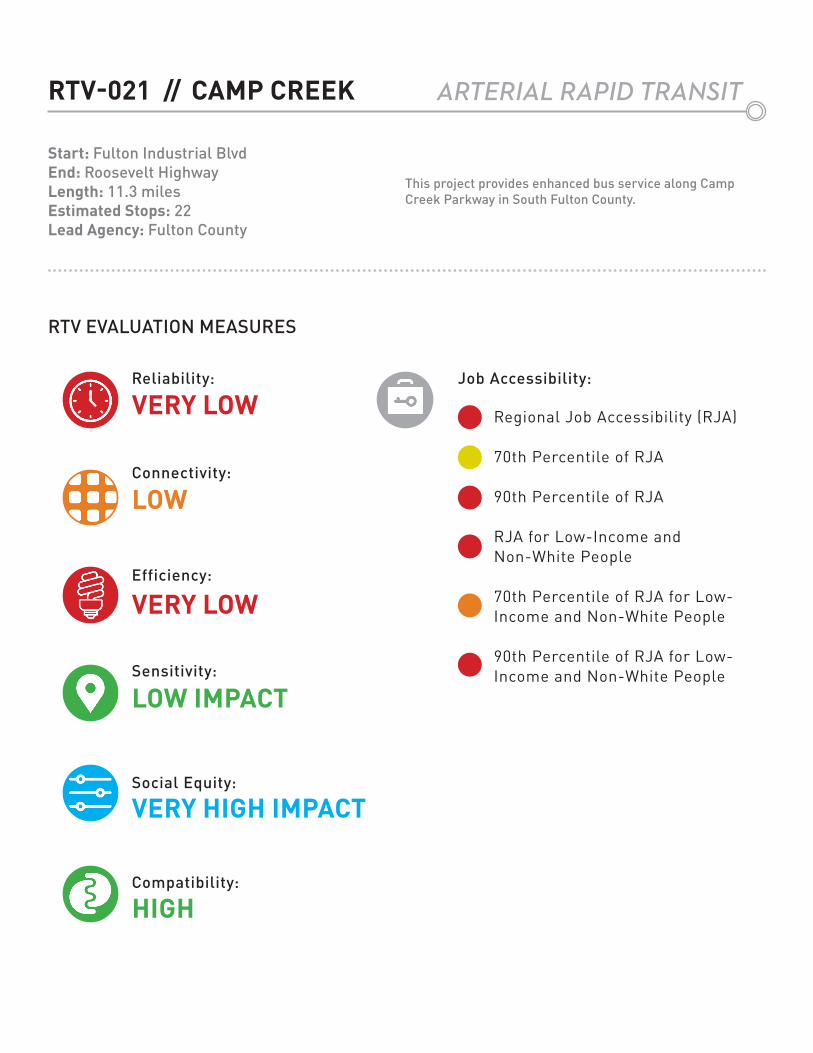
RTV-021 // CAMP CREEK
Start: Fulton Industrial BlvdEnd: Roosevelt HighwayLength: 11.3 milesEstimated Stops: 22Lead Agency: Fulton County
This project provides enhanced bus service along Camp Creek Parkway in South Fulton County.
ARTERIAL RAPID TRANSIT
RTV EVALUATION MEASURES
VERY LOW
LOW
VERY LOW
LOW IMPACT
VERY HIGH IMPACT
HIGH
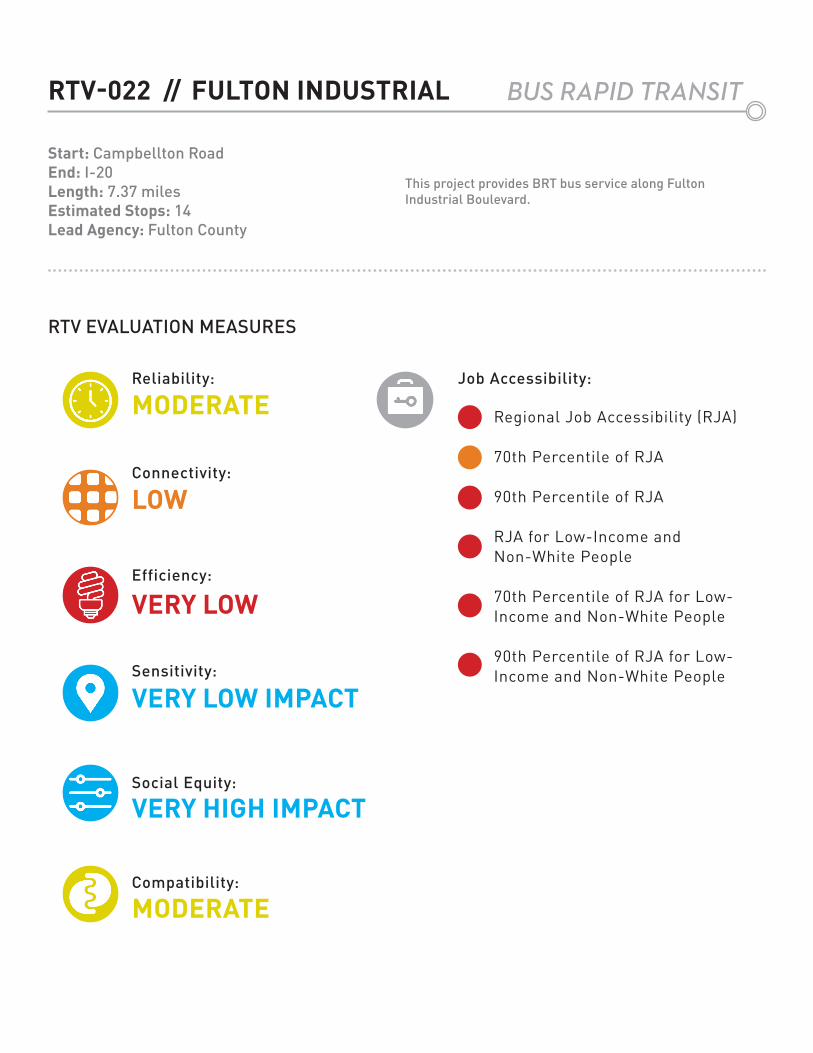
RTV-022 // FULTON INDUSTRIAL
Start: Campbellton RoadEnd: I-20Length: 7.37 milesEstimated Stops: 14Lead Agency: Fulton County
This project provides BRT bus service along Fulton Industrial Boulevard.
BUS RAPID TRANSIT
Reliability:
Connectivity:
Efficiency:
Sensitivity:
Social Equity:
Compatibility:
Job Accessibility:
Regional Job Accessibility (RJA)
70th Percentile of RJA
90th Percentile of RJA
RJA for Low-Income and Non-White People
70th Percentile of RJA for Low-Income and Non-White People
90th Percentile of RJA for Low-Income and Non-White People
RTV EVALUATION MEASURES
MODERATE
LOW
VERY LOW
VERY LOW IMPACT
VERY HIGH IMPACT
MODERATE
Reliability:
Connectivity:
Efficiency:
Sensitivity:
Social Equity:
Compatibility:
Job Accessibility:
Regional Job Accessibility (RJA)
70th Percentile of RJA
90th Percentile of RJA
RJA for Low-Income and Non-White People
70th Percentile of RJA for Low-Income and Non-White People
90th Percentile of RJA for Low-Income and Non-White People
RTV-023 // ROOSEVELT HIGHWAY
Start: Palmetto Cascade HighwayEnd: Langford ParkwayLength: 19.45 milesEstimated Stops: 38Lead Agency: Fulton County
This project provides BRT service along Roosevelt Highway to Palmetto in South Fulton County. The project overlaps with the proposed Newnan Corridor Commuter Rail.
BUS RAPID TRANSIT
RTV EVALUATION MEASURES
MODERATE
LOW
VERY LOW
MODERATE IMPACT
HIGH IMPACT
VERY HIGH
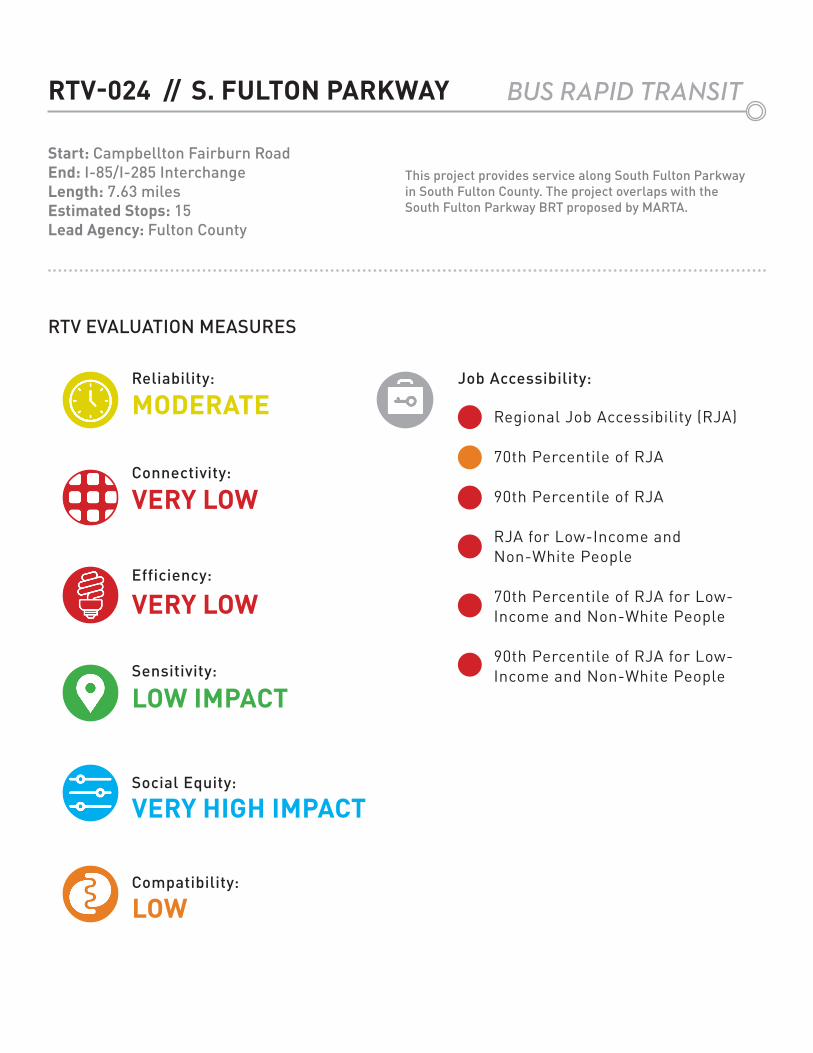
RTV-024 // S. FULTON PARKWAY
Start: Campbellton Fairburn RoadEnd: I-85/I-285 InterchangeLength: 7.63 milesEstimated Stops: 15Lead Agency: Fulton County
This project provides service along South Fulton Parkway in South Fulton County. The project overlaps with the South Fulton Parkway BRT proposed by MARTA.
BUS RAPID TRANSIT
Reliability:
Connectivity:
Efficiency:
Sensitivity:
Social Equity:
Compatibility:
Job Accessibility:
Regional Job Accessibility (RJA)
70th Percentile of RJA
90th Percentile of RJA
RJA for Low-Income and Non-White People
70th Percentile of RJA for Low-Income and Non-White People
90th Percentile of RJA for Low-Income and Non-White People
RTV EVALUATION MEASURES
MODERATE
VERY LOW
VERY LOW
LOW IMPACT
VERY HIGH IMPACT
LOW
Reliability:
Connectivity:
Efficiency:
Sensitivity:
Social Equity:
Compatibility:
Job Accessibility:
Regional Job Accessibility (RJA)
70th Percentile of RJA
90th Percentile of RJA
RJA for Low-Income and Non-White People
70th Percentile of RJA for Low-Income and Non-White People
90th Percentile of RJA for Low-Income and Non-White People
RTV-025 // HAPEVILLE EXTENSION
Start: East Point MARTA StationEnd: Mountain ViewLength: 4.35 milesEstimated Stops: 5Lead Agency: Fulton County
This project branches MARTA Red/Gold service at East Point to create a new fork to Hapeville in South Fulton County. The project overlaps with the Griffin - East Point Commuter Rail proposed by MARTA.
HEAVY RAIL
RTV EVALUATION MEASURES
VERY HIGH
LOW
VERY LOW
VERY LOW IMPACT
MODERATE IMPACT
LOW
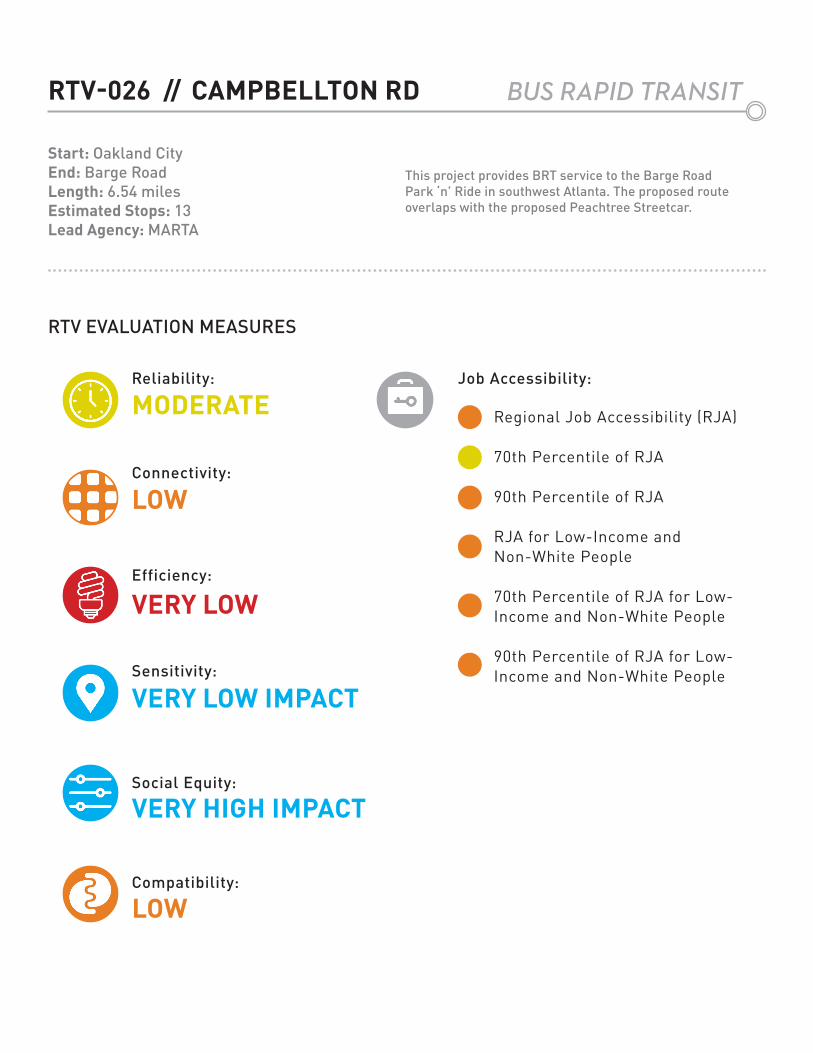
RTV-026 // CAMPBELLTON RD
Start: Oakland CityEnd: Barge RoadLength: 6.54 milesEstimated Stops: 13Lead Agency: MARTA
This project provides BRT service to the Barge Road Park ‘n’ Ride in southwest Atlanta. The proposed route overlaps with the proposed Peachtree Streetcar.
BUS RAPID TRANSIT
Reliability:
Connectivity:
Efficiency:
Sensitivity:
Social Equity:
Compatibility:
Job Accessibility:
Regional Job Accessibility (RJA)
70th Percentile of RJA
90th Percentile of RJA
RJA for Low-Income and Non-White People
70th Percentile of RJA for Low-Income and Non-White People
90th Percentile of RJA for Low-Income and Non-White People
RTV EVALUATION MEASURES
MODERATE
LOW
VERY LOW
VERY LOW IMPACT
VERY HIGH IMPACT
LOW
Reliability:
Connectivity:
Efficiency:
Sensitivity:
Social Equity:
Compatibility:
Job Accessibility:
Regional Job Accessibility (RJA)
70th Percentile of RJA
90th Percentile of RJA
RJA for Low-Income and Non-White People
70th Percentile of RJA for Low-Income and Non-White People
90th Percentile of RJA for Low-Income and Non-White People
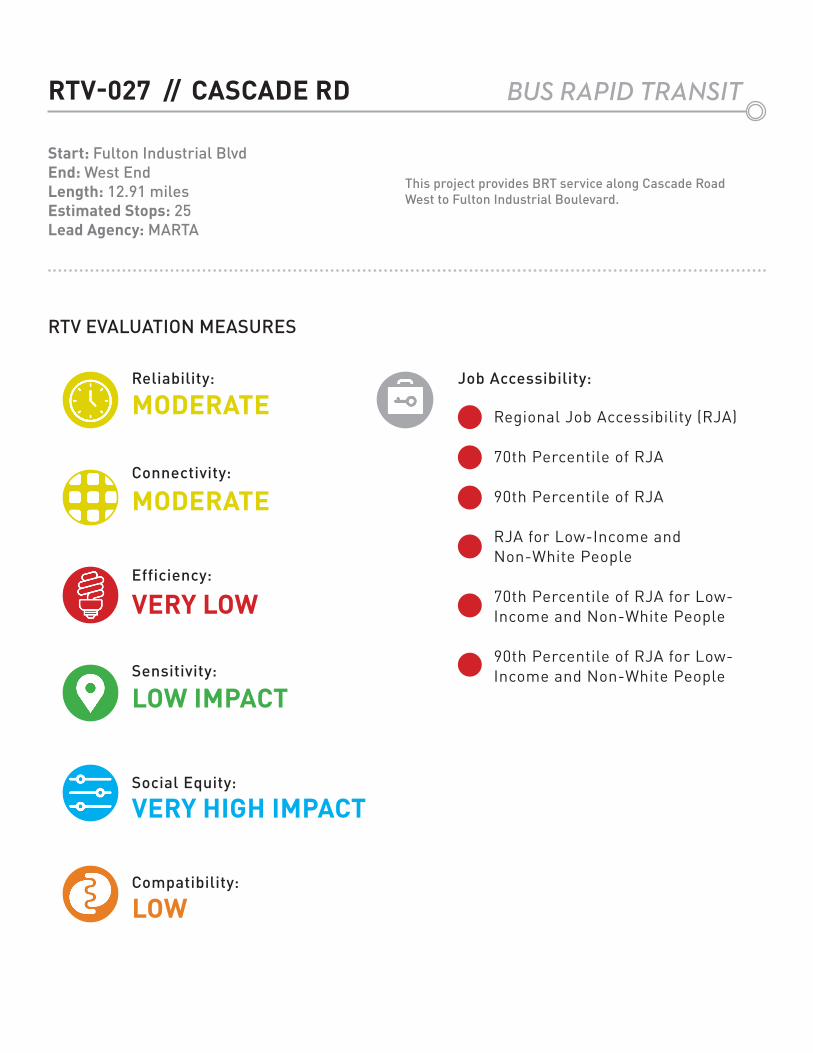
RTV-027 // CASCADE RD
Start: Fulton Industrial BlvdEnd: West EndLength: 12.91 milesEstimated Stops: 25Lead Agency: MARTA
This project provides BRT service along Cascade Road West to Fulton Industrial Boulevard.
BUS RAPID TRANSIT
RTV EVALUATION MEASURES
MODERATE
MODERATE
VERY LOW
LOW IMPACT
VERY HIGH IMPACT
LOW
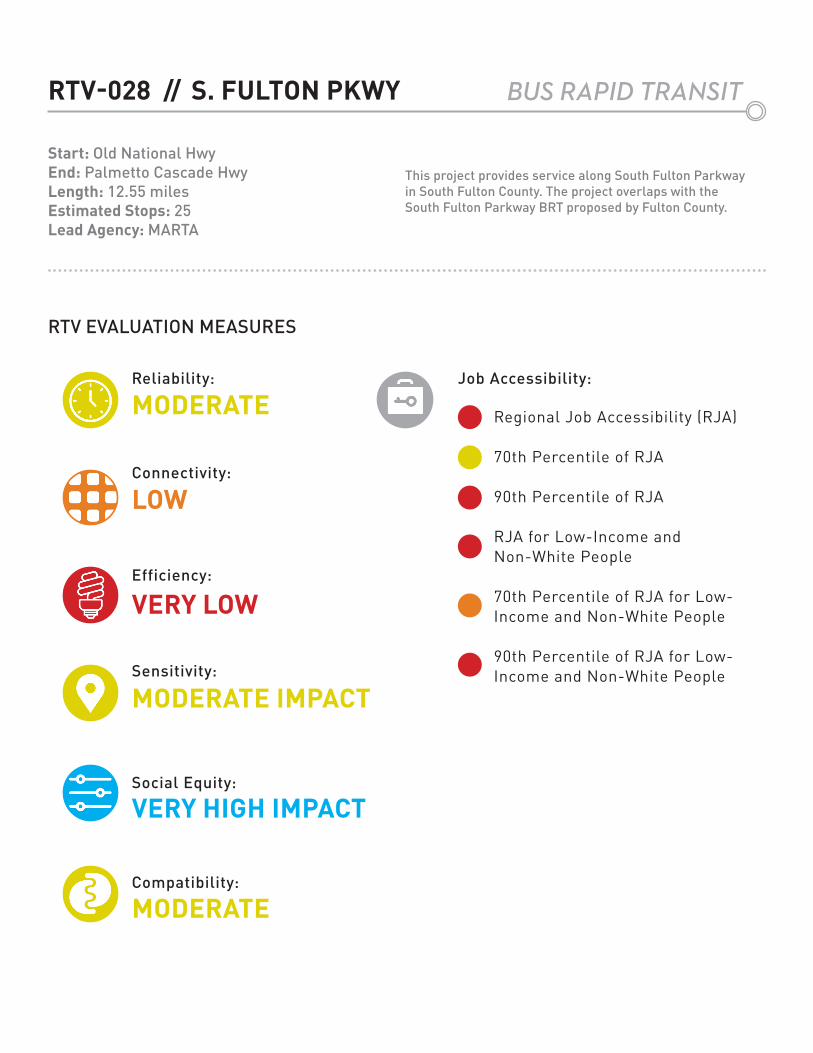
RTV-028 // S. FULTON PKWY
Start: Old National HwyEnd: Palmetto Cascade HwyLength: 12.55 milesEstimated Stops: 25Lead Agency: MARTA
This project provides service along South Fulton Parkway in South Fulton County. The project overlaps with the South Fulton Parkway BRT proposed by Fulton County.
BUS RAPID TRANSIT
Reliability:
Connectivity:
Efficiency:
Sensitivity:
Social Equity:
Compatibility:
Job Accessibility:
Regional Job Accessibility (RJA)
70th Percentile of RJA
90th Percentile of RJA
RJA for Low-Income and Non-White People
70th Percentile of RJA for Low-Income and Non-White People
90th Percentile of RJA for Low-Income and Non-White People
RTV EVALUATION MEASURES
MODERATE
LOW
VERY LOW
MODERATE IMPACT
VERY HIGH IMPACT
MODERATE
Reliability:
Connectivity:
Efficiency:
Sensitivity:
Social Equity:
Compatibility:
Job Accessibility:
Regional Job Accessibility (RJA)
70th Percentile of RJA
90th Percentile of RJA
RJA for Low-Income and Non-White People
70th Percentile of RJA for Low-Income and Non-White People
90th Percentile of RJA for Low-Income and Non-White People
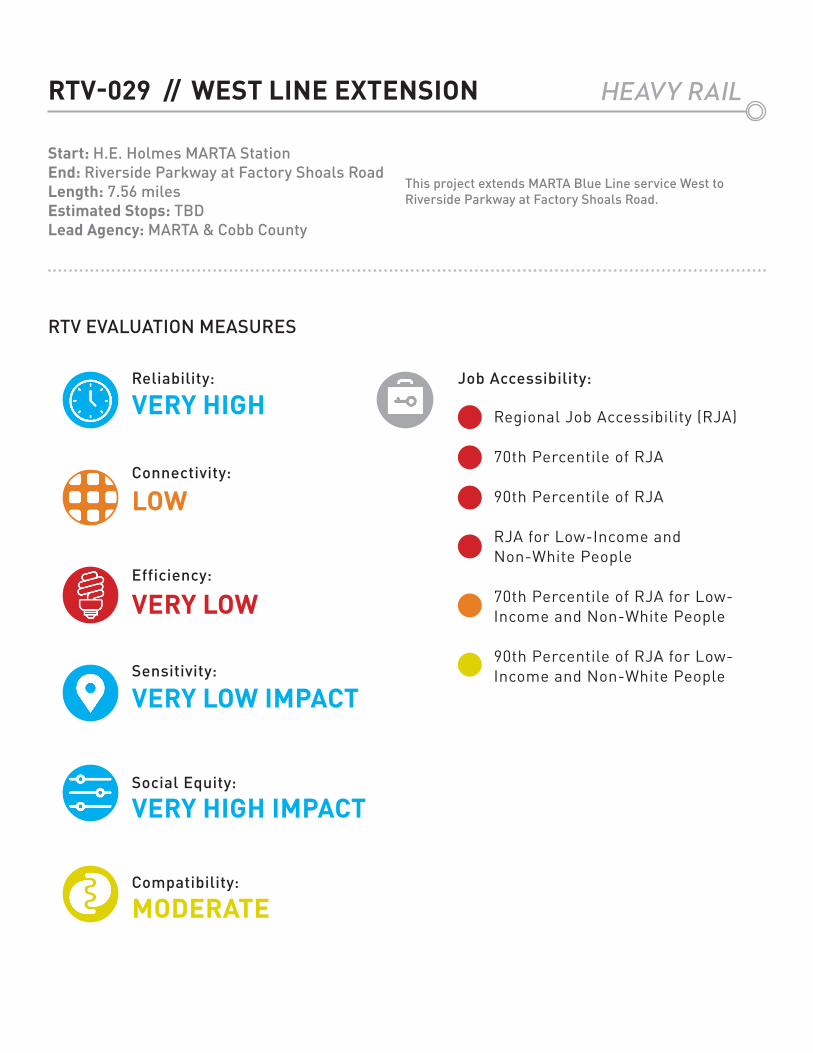
RTV-029 // WEST LINE EXTENSION
Start: H.E. Holmes MARTA StationEnd: Riverside Parkway at Factory Shoals RoadLength: 7.56 milesEstimated Stops: TBDLead Agency: MARTA & Cobb County
This project extends MARTA Blue Line service West to Riverside Parkway at Factory Shoals Road.
HEAVY RAIL
RTV EVALUATION MEASURES
VERY HIGH
LOW
VERY LOW
VERY LOW IMPACT
VERY HIGH IMPACT
MODERATE
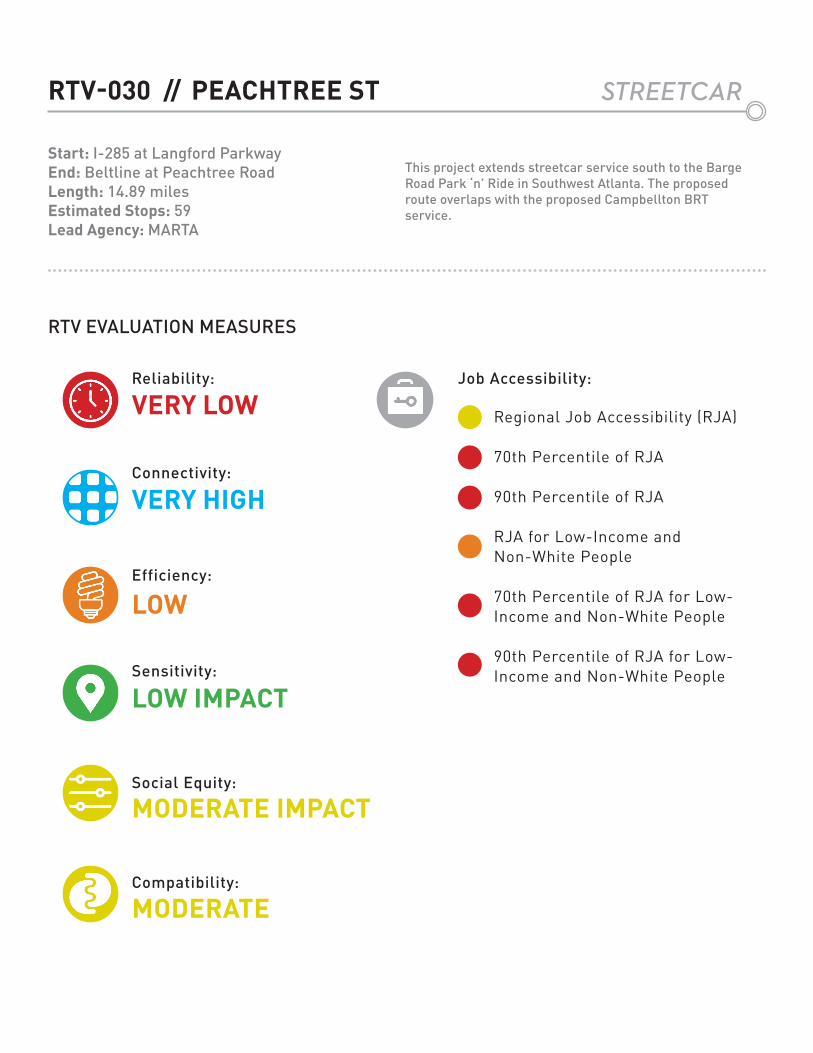
RTV-030 // PEACHTREE ST
Start: I-285 at Langford ParkwayEnd: Beltline at Peachtree RoadLength: 14.89 milesEstimated Stops: 59Lead Agency: MARTA
This project extends streetcar service south to the Barge Road Park ‘n’ Ride in Southwest Atlanta. The proposed route overlaps with the proposed Campbellton BRT service.
STREETCAR
Reliability:
Connectivity:
Efficiency:
Sensitivity:
Social Equity:
Compatibility:
Job Accessibility:
Regional Job Accessibility (RJA)
70th Percentile of RJA
90th Percentile of RJA
RJA for Low-Income and Non-White People
70th Percentile of RJA for Low-Income and Non-White People
90th Percentile of RJA for Low-Income and Non-White People
RTV EVALUATION MEASURES
VERY LOW
VERY HIGH
LOW
LOW IMPACT
MODERATE IMPACT
MODERATE
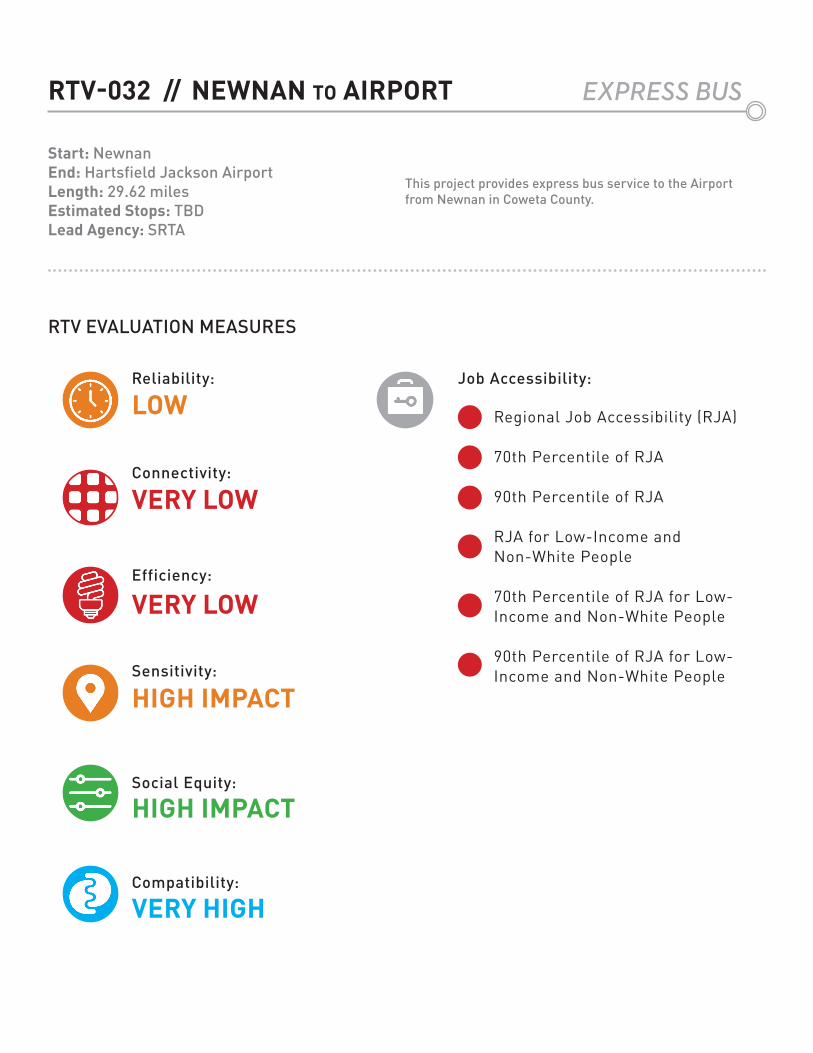
RTV-032 // NEWNAN TO AIRPORT
Start: NewnanEnd: Hartsfield Jackson AirportLength: 29.62 milesEstimated Stops: TBDLead Agency: SRTA
This project provides express bus service to the Airport from Newnan in Coweta County.
EXPRESS BUS
Reliability:
Connectivity:
Efficiency:
Sensitivity:
Social Equity:
Compatibility:
Job Accessibility:
Regional Job Accessibility (RJA)
70th Percentile of RJA
90th Percentile of RJA
RJA for Low-Income and Non-White People
70th Percentile of RJA for Low-Income and Non-White People
90th Percentile of RJA for Low-Income and Non-White People
RTV EVALUATION MEASURES
LOW
VERY LOW
VERY LOW
HIGH IMPACT
HIGH IMPACT
VERY HIGH
Reliability:
Connectivity:
Efficiency:
Sensitivity:
Social Equity:
Compatibility:
Job Accessibility:
Regional Job Accessibility (RJA)
70th Percentile of RJA
90th Percentile of RJA
RJA for Low-Income and Non-White People
70th Percentile of RJA for Low-Income and Non-White People
90th Percentile of RJA for Low-Income and Non-White People
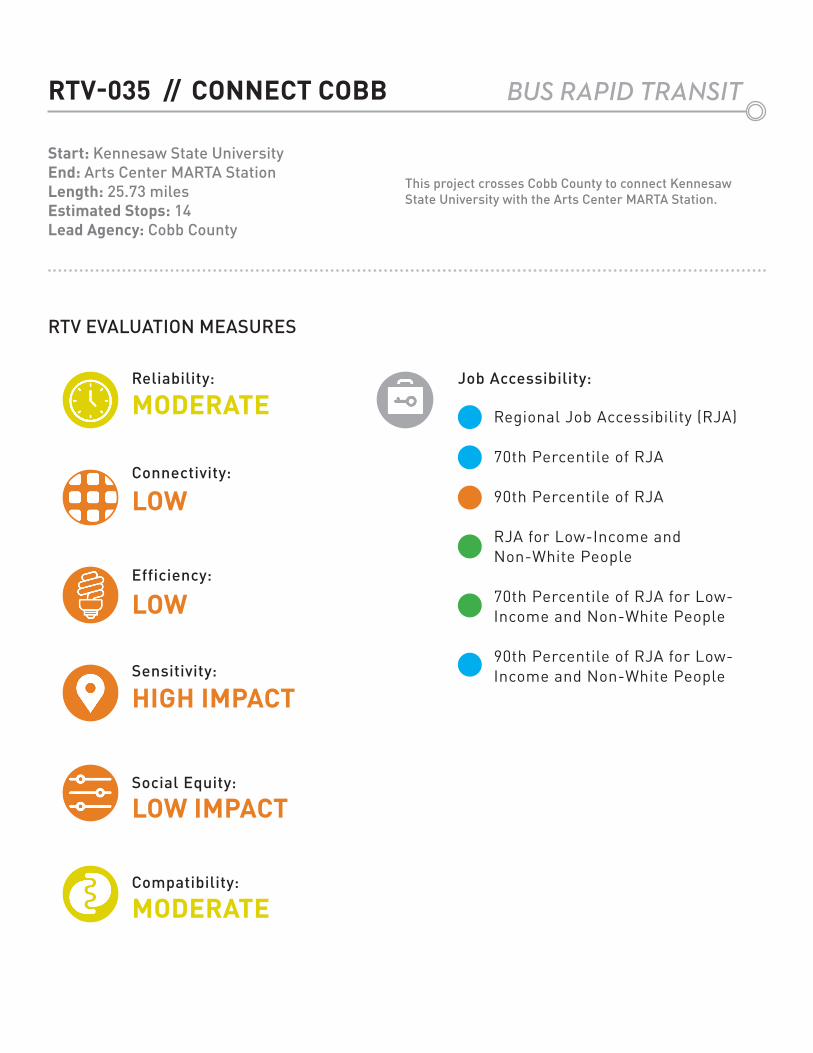
RTV-035 // CONNECT COBB
Start: Kennesaw State UniversityEnd: Arts Center MARTA StationLength: 25.73 milesEstimated Stops: 14Lead Agency: Cobb County
This project crosses Cobb County to connect Kennesaw State University with the Arts Center MARTA Station.
BUS RAPID TRANSIT
RTV EVALUATION MEASURES
MODERATE
LOW
LOW
HIGH IMPACT
LOW IMPACT
MODERATE
Reliability:
Connectivity:
Efficiency:
Sensitivity:
Social Equity:
Compatibility:
Job Accessibility:
Regional Job Accessibility (RJA)
70th Percentile of RJA
90th Percentile of RJA
RJA for Low-Income and Non-White People
70th Percentile of RJA for Low-Income and Non-White People
90th Percentile of RJA for Low-Income and Non-White People
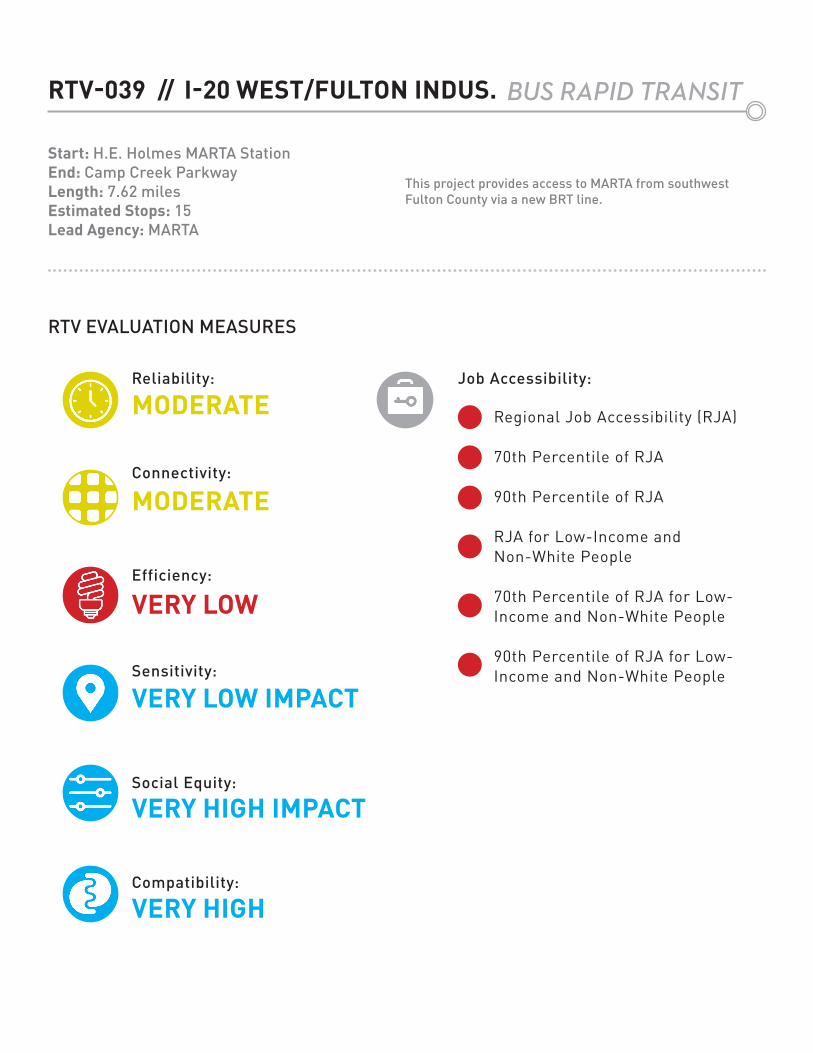
RTV-039 // I-20 WEST/FULTON INDUS.
Start: H.E. Holmes MARTA StationEnd: Camp Creek ParkwayLength: 7.62 milesEstimated Stops: 15Lead Agency: MARTA
This project provides access to MARTA from southwest Fulton County via a new BRT line.
BUS RAPID TRANSIT
RTV EVALUATION MEASURES
MODERATE
MODERATE
VERY LOW
VERY LOW IMPACT
VERY HIGH IMPACT
VERY HIGH
Reliability:
Connectivity:
Efficiency:
Sensitivity:
Social Equity:
Compatibility:
Job Accessibility:
Regional Job Accessibility (RJA)
70th Percentile of RJA
90th Percentile of RJA
RJA for Low-Income and Non-White People
70th Percentile of RJA for Low-Income and Non-White People
90th Percentile of RJA for Low-Income and Non-White People
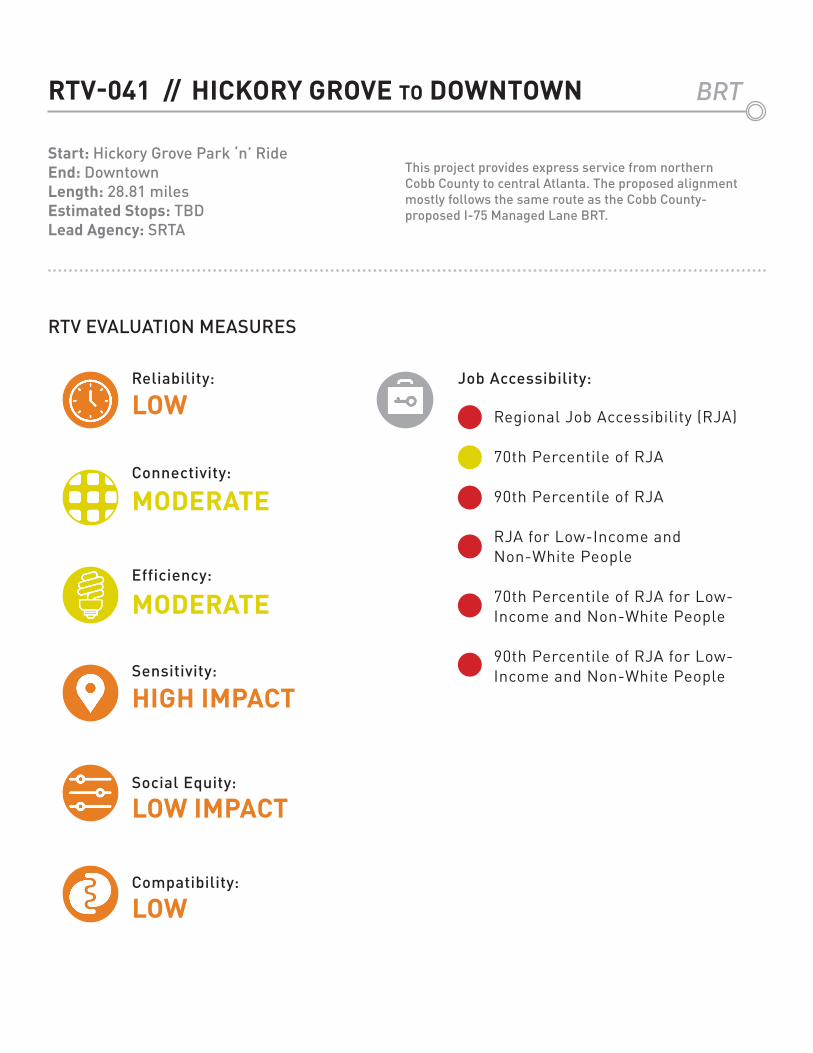
RTV-041 // HICKORY GROVE TO DOWNTOWN
Start: Hickory Grove Park ‘n’ RideEnd: DowntownLength: 28.81 milesEstimated Stops: TBDLead Agency: SRTA
This project provides express service from northern Cobb County to central Atlanta. The proposed alignment mostly follows the same route as the Cobb County-proposed I-75 Managed Lane BRT.
BRT
RTV EVALUATION MEASURES
LOW
MODERATE
MODERATE
HIGH IMPACT
LOW IMPACT
LOW
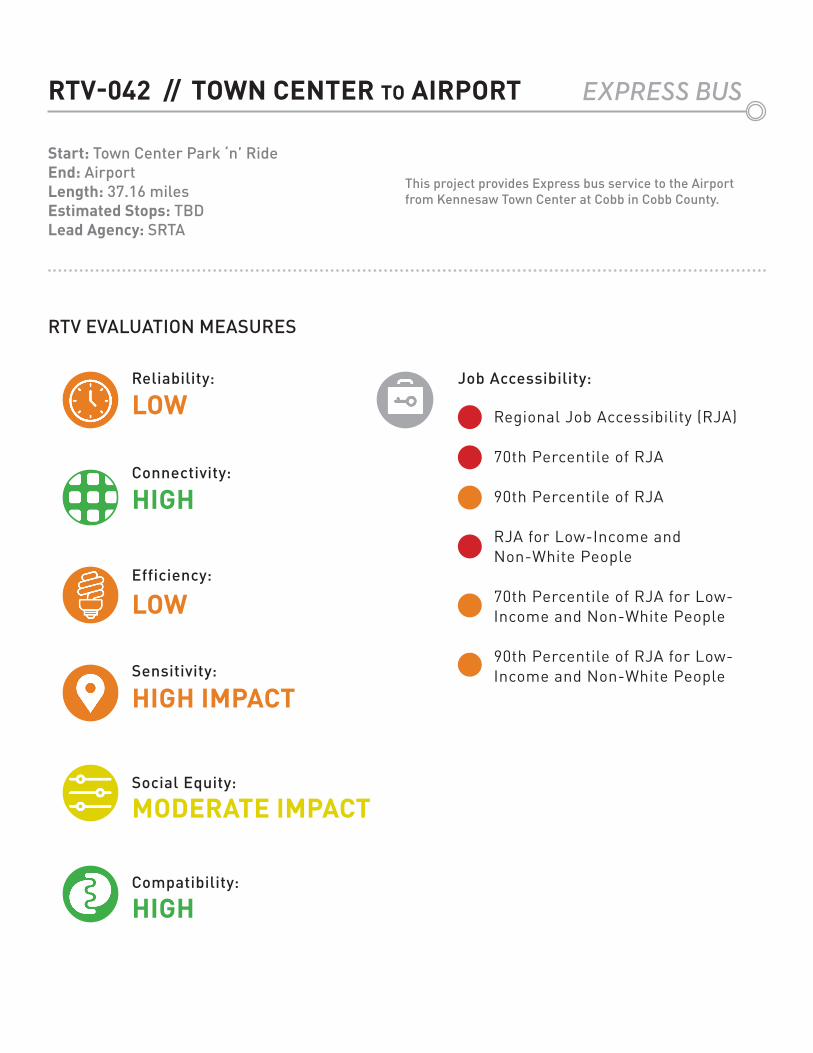
RTV-042 // TOWN CENTER TO AIRPORT
Start: Town Center Park ‘n’ RideEnd: AirportLength: 37.16 milesEstimated Stops: TBDLead Agency: SRTA
This project provides Express bus service to the Airport from Kennesaw Town Center at Cobb in Cobb County.
EXPRESS BUS
Reliability:
Connectivity:
Efficiency:
Sensitivity:
Social Equity:
Compatibility:
Job Accessibility:
Regional Job Accessibility (RJA)
70th Percentile of RJA
90th Percentile of RJA
RJA for Low-Income and Non-White People
70th Percentile of RJA for Low-Income and Non-White People
90th Percentile of RJA for Low-Income and Non-White People
RTV EVALUATION MEASURES
LOW
HIGH
LOW
HIGH IMPACT
MODERATE IMPACT
HIGH
Reliability:
Connectivity:
Efficiency:
Sensitivity:
Social Equity:
Compatibility:
Job Accessibility:
Regional Job Accessibility (RJA)
70th Percentile of RJA
90th Percentile of RJA
RJA for Low-Income and Non-White People
70th Percentile of RJA for Low-Income and Non-White People
90th Percentile of RJA for Low-Income and Non-White People
RTV-043 // 578 CLEVELAND
Start: Jonesboro RoadEnd: East Point MARTA StationLength: 7.13 milesEstimated Stops: 14Lead Agency: MARTA
This project provides BRT service along Cleveland Avenue from Jonesboro Road to East Point MARTA Station.
BUS RAPID TRANSIT
RTV EVALUATION MEASURES
MODERATE
LOW
VERY LOW
VERY LOW IMPACT
VERY HIGH IMPACT
MODERATE
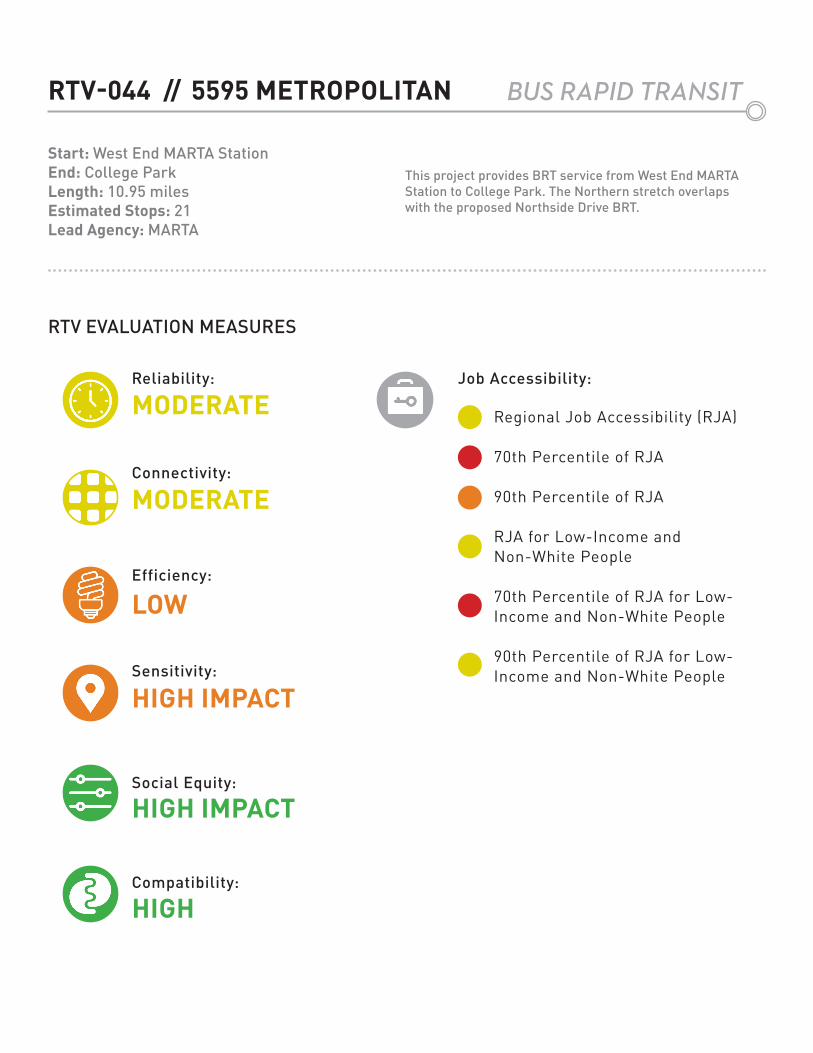
RTV-044 // 5595 METROPOLITAN
Start: West End MARTA StationEnd: College ParkLength: 10.95 milesEstimated Stops: 21Lead Agency: MARTA
This project provides BRT service from West End MARTA Station to College Park. The Northern stretch overlaps with the proposed Northside Drive BRT.
BUS RAPID TRANSIT
Reliability:
Connectivity:
Efficiency:
Sensitivity:
Social Equity:
Compatibility:
Job Accessibility:
Regional Job Accessibility (RJA)
70th Percentile of RJA
90th Percentile of RJA
RJA for Low-Income and Non-White People
70th Percentile of RJA for Low-Income and Non-White People
90th Percentile of RJA for Low-Income and Non-White People
RTV EVALUATION MEASURES
MODERATE
MODERATE
LOW
HIGH IMPACT
HIGH IMPACT
HIGH
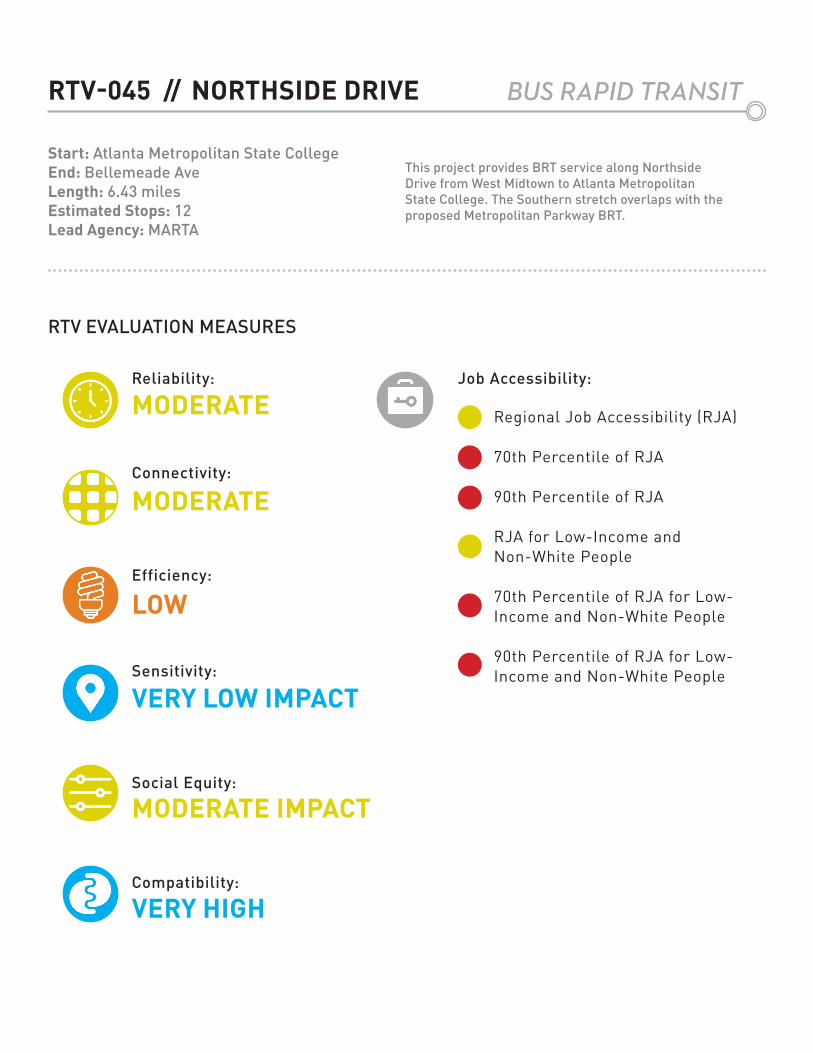
Reliability:
Connectivity:
Efficiency:
Sensitivity:
Social Equity:
Compatibility:
Job Accessibility:
Regional Job Accessibility (RJA)
70th Percentile of RJA
90th Percentile of RJA
RJA for Low-Income and Non-White People
70th Percentile of RJA for Low-Income and Non-White People
90th Percentile of RJA for Low-Income and Non-White People
RTV-045 // NORTHSIDE DRIVE
Start: Atlanta Metropolitan State CollegeEnd: Bellemeade AveLength: 6.43 milesEstimated Stops: 12Lead Agency: MARTA
This project provides BRT service along Northside Drive from West Midtown to Atlanta Metropolitan State College. The Southern stretch overlaps with the proposed Metropolitan Parkway BRT.
BUS RAPID TRANSIT
RTV EVALUATION MEASURES
MODERATE
MODERATE
LOW
VERY LOW IMPACT
MODERATE IMPACT
VERY HIGH
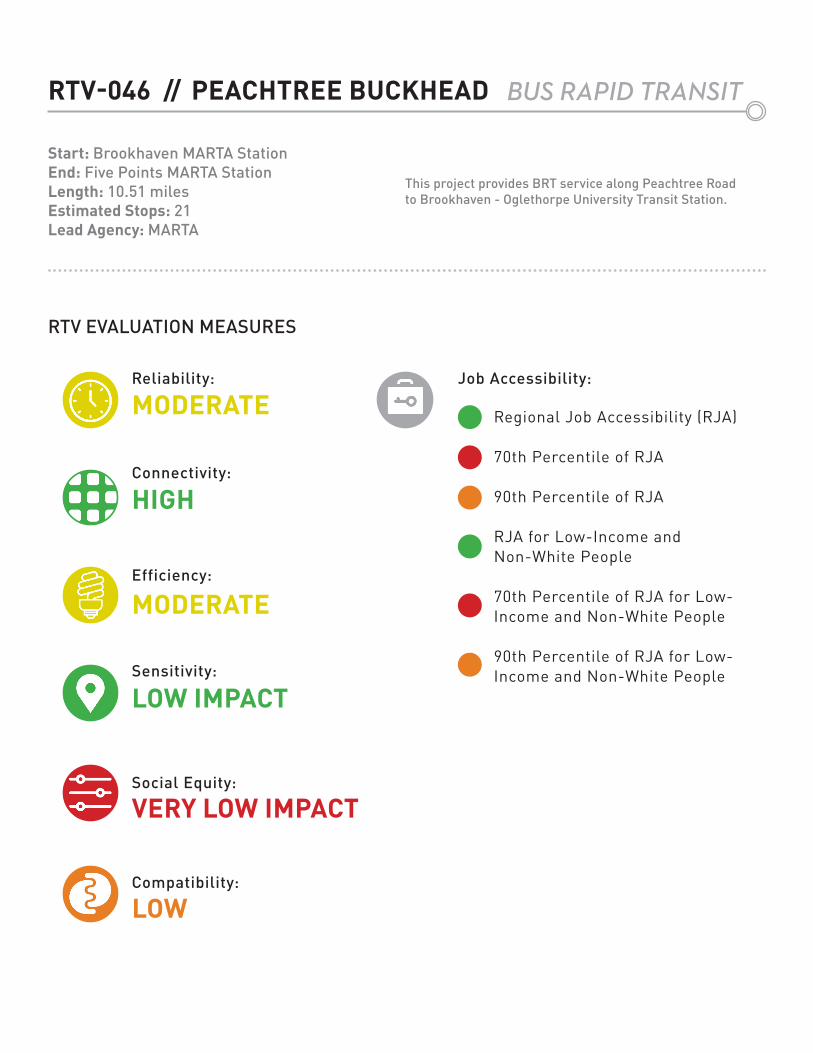
RTV-046 // PEACHTREE BUCKHEAD
Start: Brookhaven MARTA StationEnd: Five Points MARTA StationLength: 10.51 milesEstimated Stops: 21Lead Agency: MARTA
This project provides BRT service along Peachtree Road to Brookhaven - Oglethorpe University Transit Station.
BUS RAPID TRANSIT
Reliability:
Connectivity:
Efficiency:
Sensitivity:
Social Equity:
Compatibility:
Job Accessibility:
Regional Job Accessibility (RJA)
70th Percentile of RJA
90th Percentile of RJA
RJA for Low-Income and Non-White People
70th Percentile of RJA for Low-Income and Non-White People
90th Percentile of RJA for Low-Income and Non-White People
RTV EVALUATION MEASURES
MODERATE
HIGH
MODERATE
LOW IMPACT
VERY LOW IMPACT
LOW
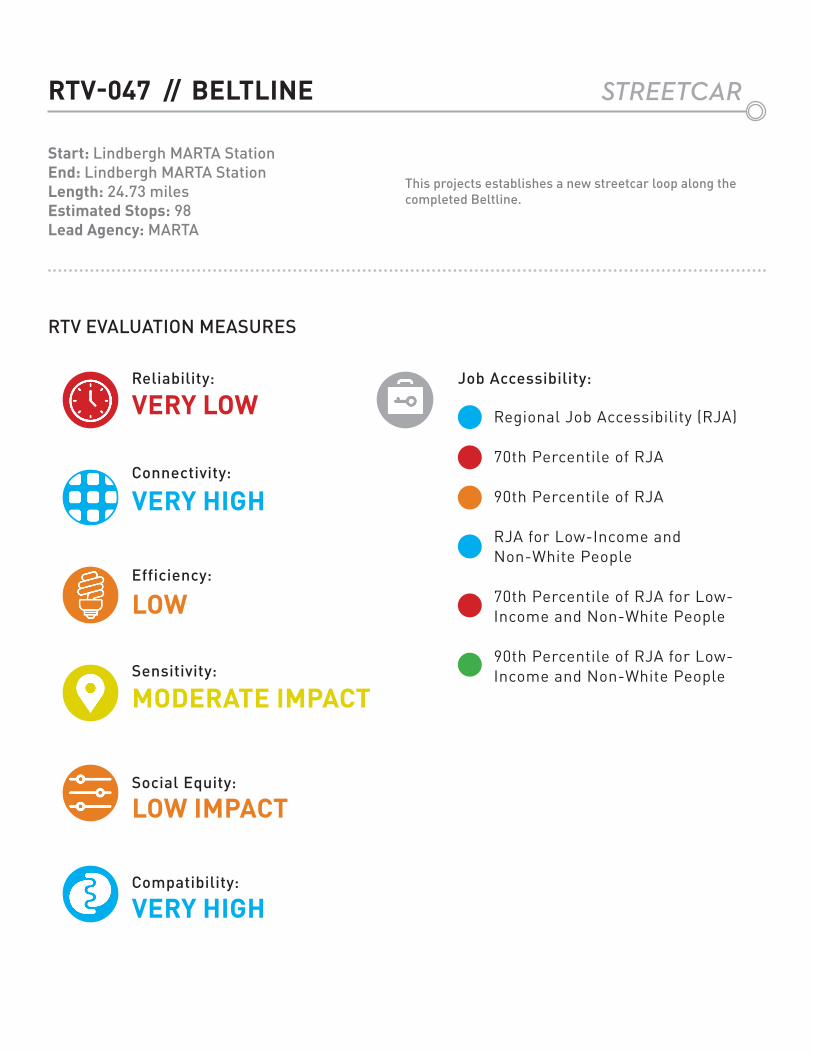
Reliability:
Connectivity:
Efficiency:
Sensitivity:
Social Equity:
Compatibility:
Job Accessibility:
Regional Job Accessibility (RJA)
70th Percentile of RJA
90th Percentile of RJA
RJA for Low-Income and Non-White People
70th Percentile of RJA for Low-Income and Non-White People
90th Percentile of RJA for Low-Income and Non-White People
RTV-047 // BELTLINE
Start: Lindbergh MARTA StationEnd: Lindbergh MARTA StationLength: 24.73 milesEstimated Stops: 98Lead Agency: MARTA
This projects establishes a new streetcar loop along the completed Beltline.
STREETCAR
RTV EVALUATION MEASURES
VERY LOW
VERY HIGH
LOW
MODERATE IMPACT
LOW IMPACT
VERY HIGH
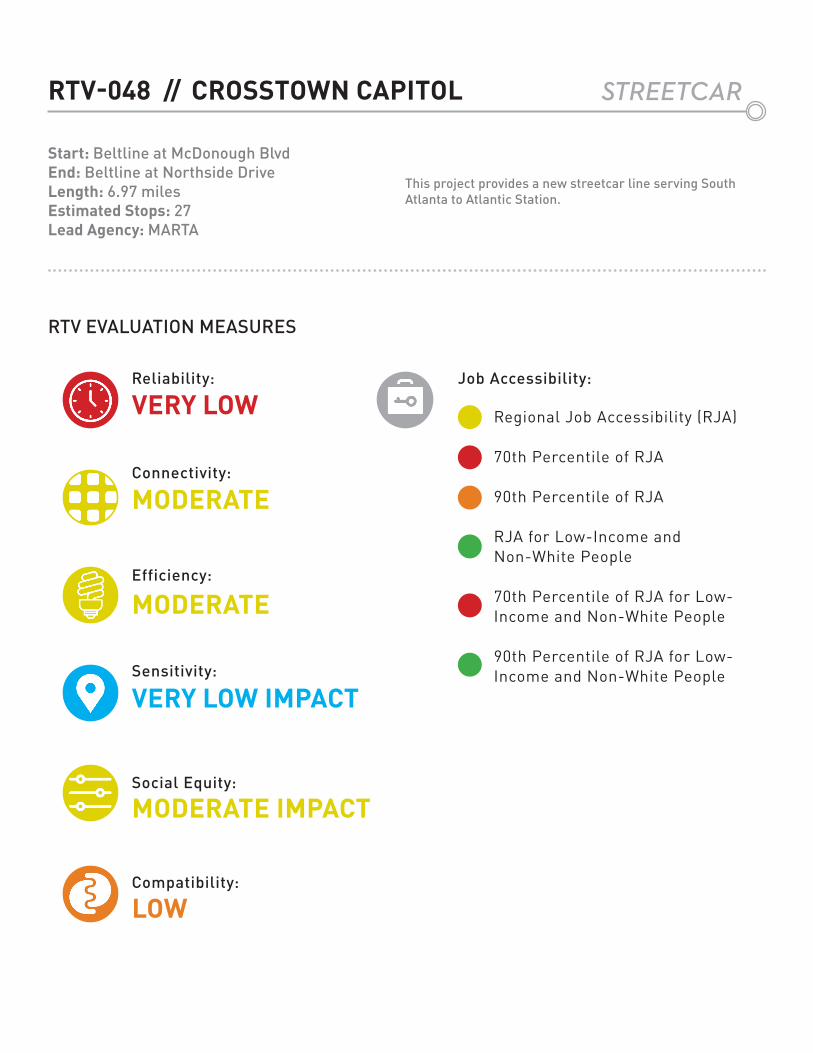
RTV-048 // CROSSTOWN CAPITOL
Start: Beltline at McDonough BlvdEnd: Beltline at Northside DriveLength: 6.97 milesEstimated Stops: 27Lead Agency: MARTA
This project provides a new streetcar line serving South Atlanta to Atlantic Station.
STREETCAR
Reliability:
Connectivity:
Efficiency:
Sensitivity:
Social Equity:
Compatibility:
Job Accessibility:
Regional Job Accessibility (RJA)
70th Percentile of RJA
90th Percentile of RJA
RJA for Low-Income and Non-White People
70th Percentile of RJA for Low-Income and Non-White People
90th Percentile of RJA for Low-Income and Non-White People
RTV EVALUATION MEASURES
VERY LOW
MODERATE
MODERATE
VERY LOW IMPACT
MODERATE IMPACT
LOW
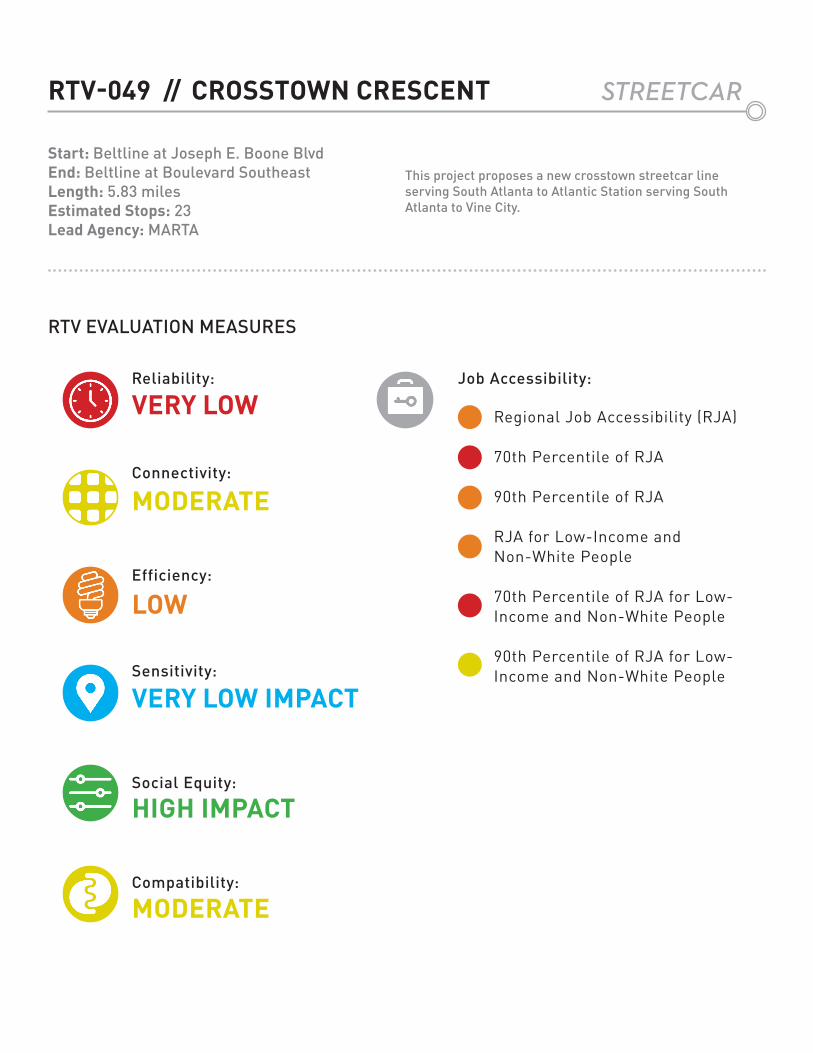
Reliability:
Connectivity:
Efficiency:
Sensitivity:
Social Equity:
Compatibility:
Job Accessibility:
Regional Job Accessibility (RJA)
70th Percentile of RJA
90th Percentile of RJA
RJA for Low-Income and Non-White People
70th Percentile of RJA for Low-Income and Non-White People
90th Percentile of RJA for Low-Income and Non-White People
RTV-049 // CROSSTOWN CRESCENT
Start: Beltline at Joseph E. Boone BlvdEnd: Beltline at Boulevard SoutheastLength: 5.83 milesEstimated Stops: 23Lead Agency: MARTA
This project proposes a new crosstown streetcar line serving South Atlanta to Atlantic Station serving South Atlanta to Vine City.
STREETCAR
RTV EVALUATION MEASURES
VERY LOW
MODERATE
LOW
VERY LOW IMPACT
HIGH IMPACT
MODERATE
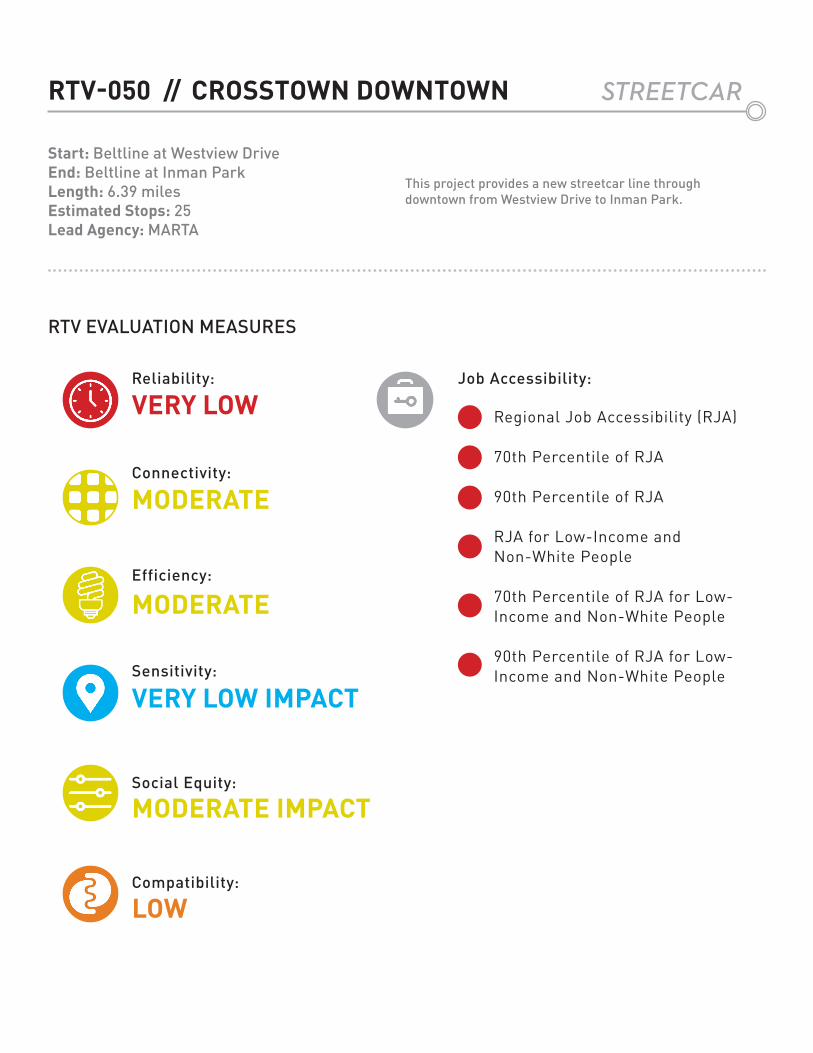
RTV-050 // CROSSTOWN DOWNTOWN
Start: Beltline at Westview DriveEnd: Beltline at Inman ParkLength: 6.39 milesEstimated Stops: 25Lead Agency: MARTA
This project provides a new streetcar line through downtown from Westview Drive to Inman Park.
STREETCAR
Reliability:
Connectivity:
Efficiency:
Sensitivity:
Social Equity:
Compatibility:
Job Accessibility:
Regional Job Accessibility (RJA)
70th Percentile of RJA
90th Percentile of RJA
RJA for Low-Income and Non-White People
70th Percentile of RJA for Low-Income and Non-White People
90th Percentile of RJA for Low-Income and Non-White People
RTV EVALUATION MEASURES
VERY LOW
MODERATE
MODERATE
VERY LOW IMPACT
MODERATE IMPACT
LOW
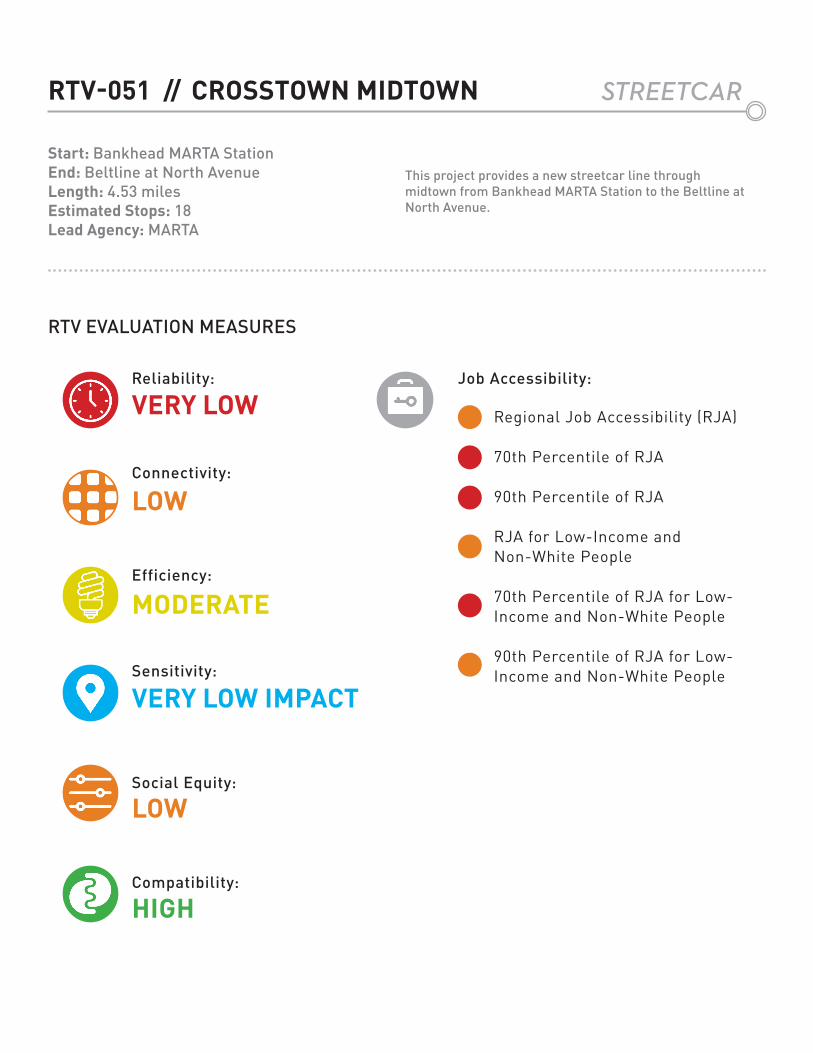
Reliability:
Connectivity:
Efficiency:
Sensitivity:
Social Equity:
Compatibility:
Job Accessibility:
Regional Job Accessibility (RJA)
70th Percentile of RJA
90th Percentile of RJA
RJA for Low-Income and Non-White People
70th Percentile of RJA for Low-Income and Non-White People
90th Percentile of RJA for Low-Income and Non-White People
RTV-051 // CROSSTOWN MIDTOWN
Start: Bankhead MARTA StationEnd: Beltline at North AvenueLength: 4.53 milesEstimated Stops: 18Lead Agency: MARTA
This project provides a new streetcar line through midtown from Bankhead MARTA Station to the Beltline at North Avenue.
STREETCAR
RTV EVALUATION MEASURES
VERY LOW
LOW
MODERATE
VERY LOW IMPACT
LOW
HIGH
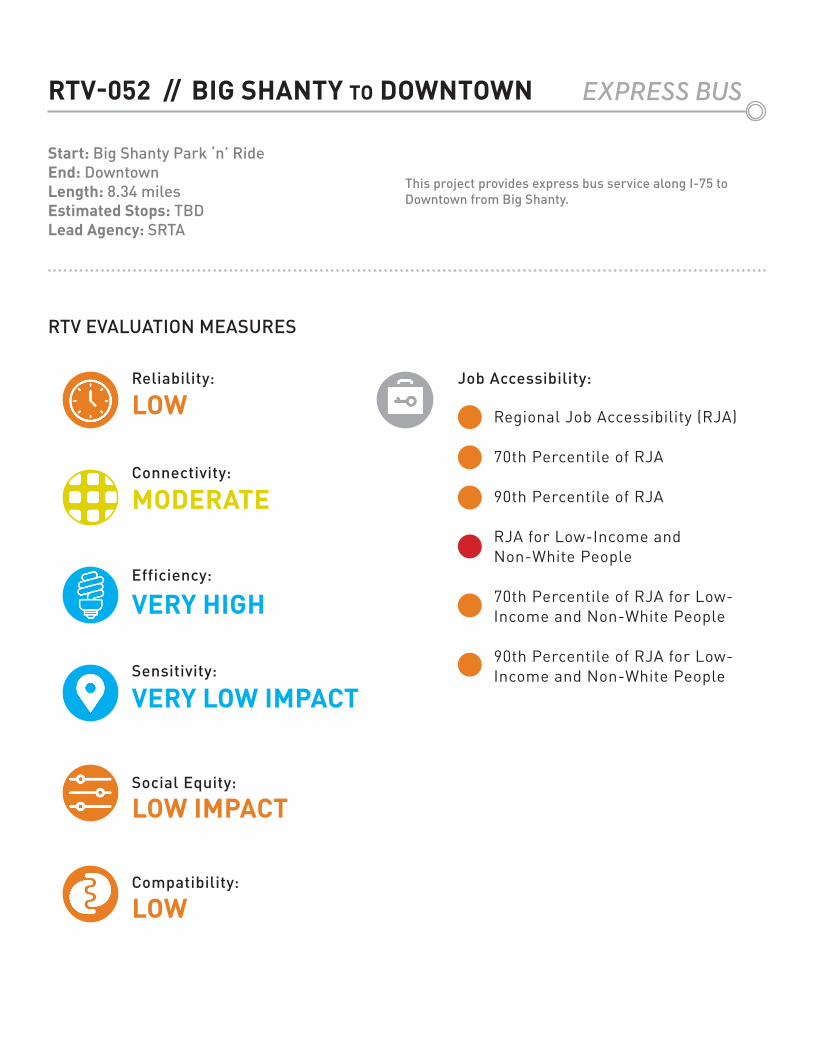
RTV-052 // BIG SHANTY TO DOWNTOWN
Start: Big Shanty Park ‘n’ RideEnd: DowntownLength: 8.34 milesEstimated Stops: TBDLead Agency: SRTA
This project provides express bus service along I-75 to Downtown from Big Shanty.
EXPRESS BUS
Reliability:
Connectivity:
Efficiency:
Sensitivity:
Social Equity:
Compatibility:
Job Accessibility:
Regional Job Accessibility (RJA)
70th Percentile of RJA
90th Percentile of RJA
RJA for Low-Income and Non-White People
70th Percentile of RJA for Low-Income and Non-White People
90th Percentile of RJA for Low-Income and Non-White People
RTV EVALUATION MEASURES
LOW
MODERATE
VERY HIGH
VERY LOW IMPACT
LOW IMPACT
LOW
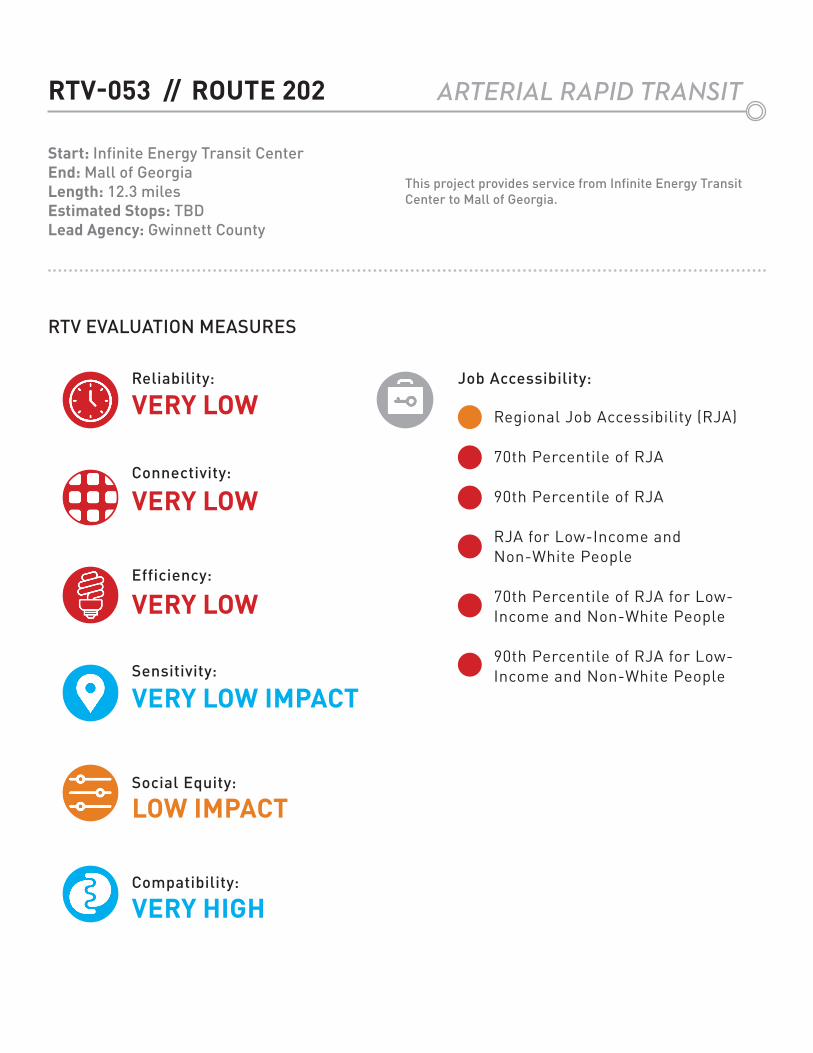
Reliability:
Connectivity:
Efficiency:
Sensitivity:
Social Equity:
Compatibility:
Job Accessibility:
Regional Job Accessibility (RJA)
70th Percentile of RJA
90th Percentile of RJA
RJA for Low-Income and Non-White People
70th Percentile of RJA for Low-Income and Non-White People
90th Percentile of RJA for Low-Income and Non-White People
RTV-053 // ROUTE 202
Start: Infinite Energy Transit CenterEnd: Mall of GeorgiaLength: 12.3 milesEstimated Stops: TBDLead Agency: Gwinnett County
This project provides service from Infinite Energy Transit Center to Mall of Georgia.
ARTERIAL RAPID TRANSIT
RTV EVALUATION MEASURES
VERY LOW
VERY LOW
VERY LOW
VERY LOW IMPACT
LOW IMPACT
VERY HIGH
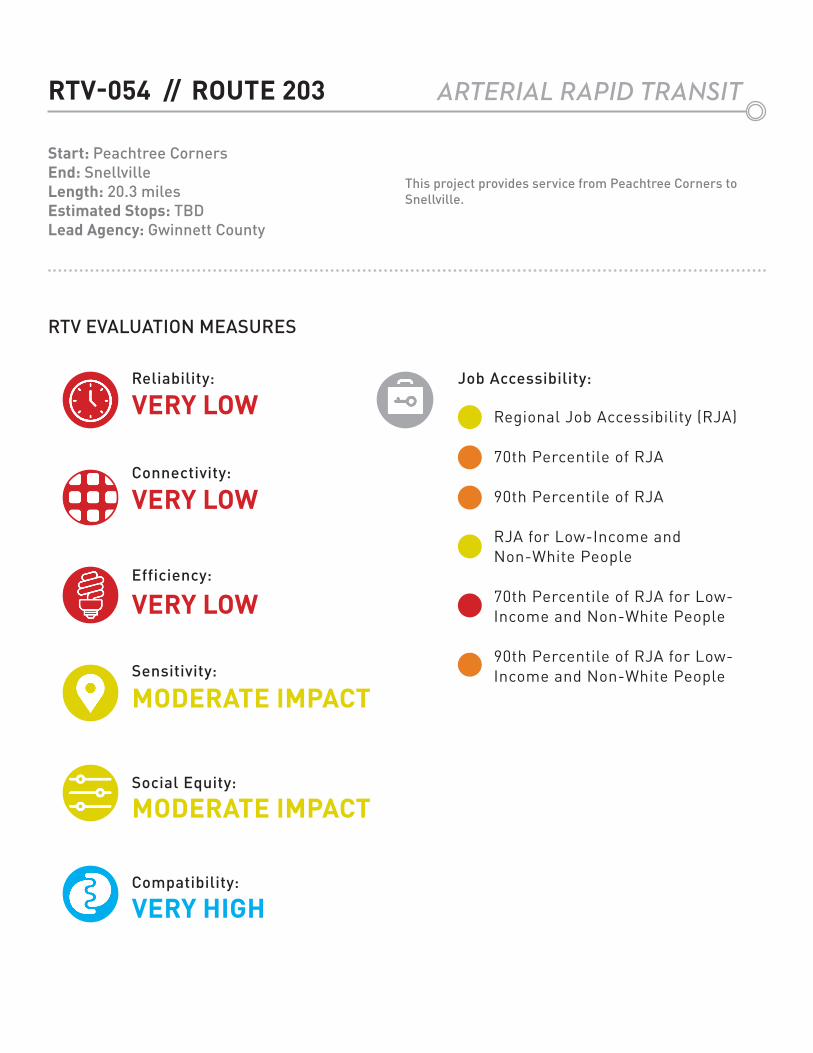
RTV-054 // ROUTE 203
Start: Peachtree CornersEnd: SnellvilleLength: 20.3 milesEstimated Stops: TBDLead Agency: Gwinnett County
This project provides service from Peachtree Corners to Snellville.
ARTERIAL RAPID TRANSIT
Reliability:
Connectivity:
Efficiency:
Sensitivity:
Social Equity:
Compatibility:
Job Accessibility:
Regional Job Accessibility (RJA)
70th Percentile of RJA
90th Percentile of RJA
RJA for Low-Income and Non-White People
70th Percentile of RJA for Low-Income and Non-White People
90th Percentile of RJA for Low-Income and Non-White People
RTV EVALUATION MEASURES
VERY LOW
VERY LOW
VERY LOW
MODERATE IMPACT
MODERATE IMPACT
VERY HIGH
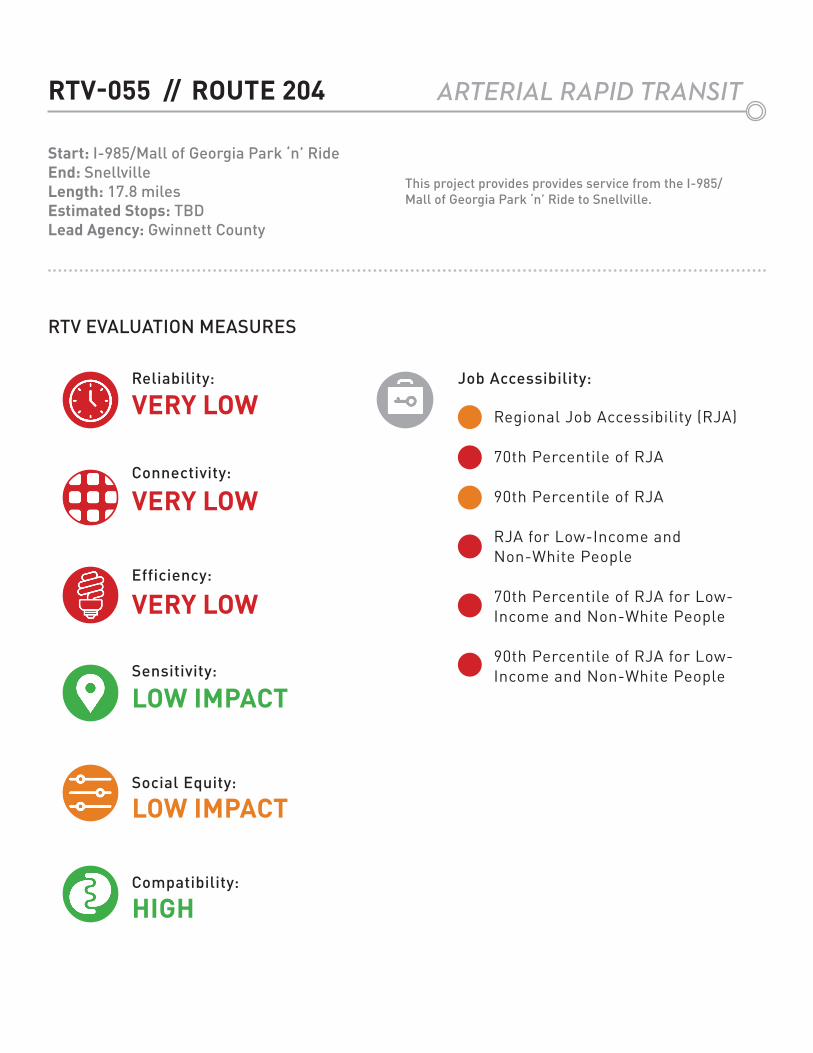
Reliability:
Connectivity:
Efficiency:
Sensitivity:
Social Equity:
Compatibility:
Job Accessibility:
Regional Job Accessibility (RJA)
70th Percentile of RJA
90th Percentile of RJA
RJA for Low-Income and Non-White People
70th Percentile of RJA for Low-Income and Non-White People
90th Percentile of RJA for Low-Income and Non-White People
RTV-055 // ROUTE 204
Start: I-985/Mall of Georgia Park ‘n’ RideEnd: SnellvilleLength: 17.8 milesEstimated Stops: TBDLead Agency: Gwinnett County
This project provides provides service from the I-985/Mall of Georgia Park ‘n’ Ride to Snellville.
ARTERIAL RAPID TRANSIT
RTV EVALUATION MEASURES
VERY LOW
VERY LOW
VERY LOW
LOW IMPACT
LOW IMPACT
HIGH
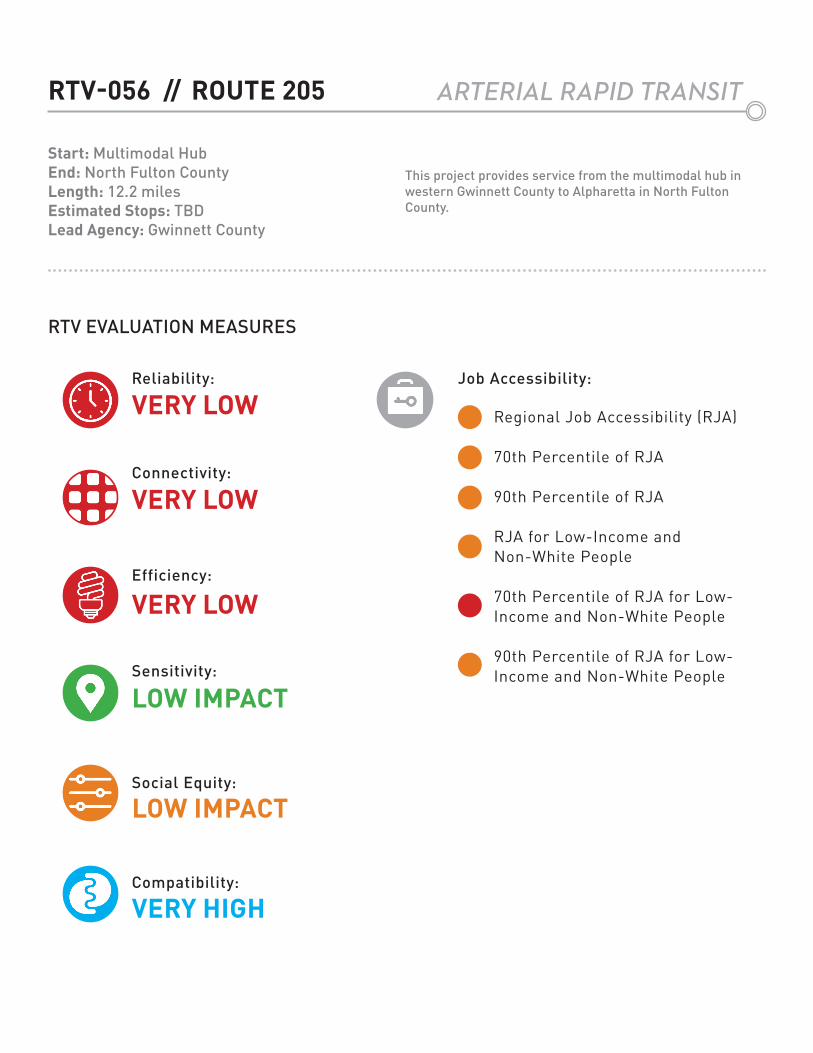
RTV-056 // ROUTE 205
Start: Multimodal HubEnd: North Fulton CountyLength: 12.2 milesEstimated Stops: TBDLead Agency: Gwinnett County
This project provides service from the multimodal hub in western Gwinnett County to Alpharetta in North Fulton County.
ARTERIAL RAPID TRANSIT
Reliability:
Connectivity:
Efficiency:
Sensitivity:
Social Equity:
Compatibility:
Job Accessibility:
Regional Job Accessibility (RJA)
70th Percentile of RJA
90th Percentile of RJA
RJA for Low-Income and Non-White People
70th Percentile of RJA for Low-Income and Non-White People
90th Percentile of RJA for Low-Income and Non-White People
RTV EVALUATION MEASURES
VERY LOW
VERY LOW
VERY LOW
LOW IMPACT
LOW IMPACT
VERY HIGH
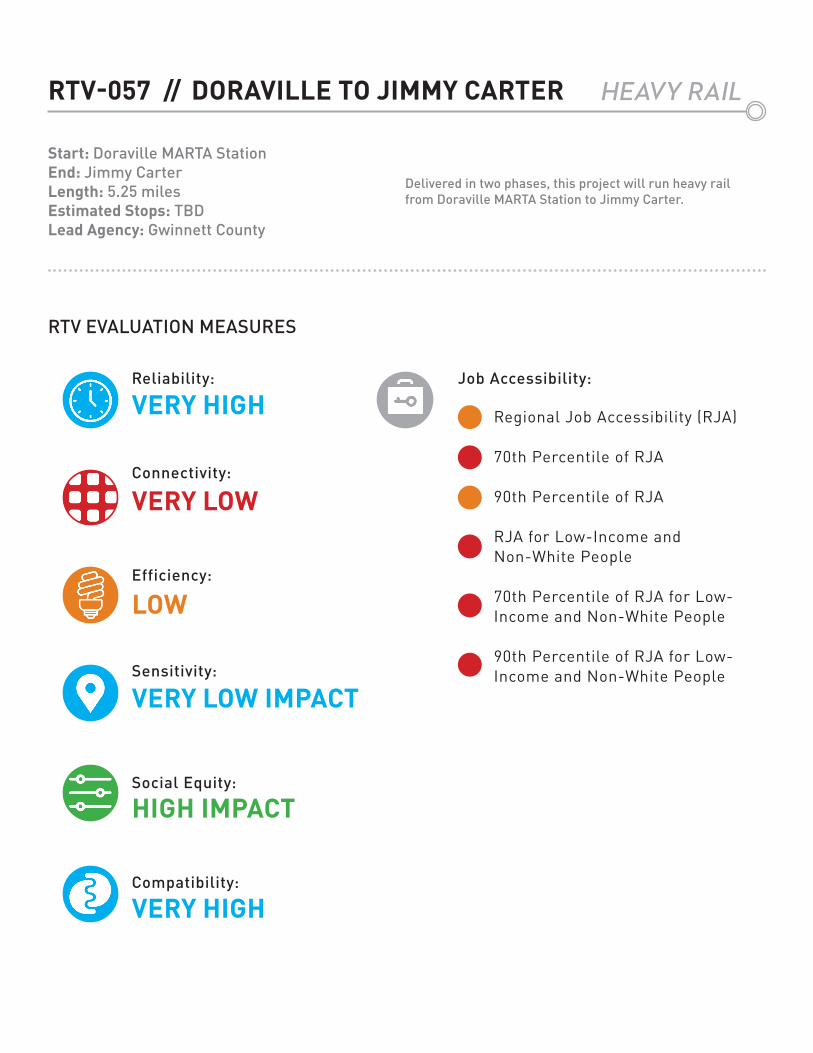
Reliability:
Connectivity:
Efficiency:
Sensitivity:
Social Equity:
Compatibility:
Job Accessibility:
Regional Job Accessibility (RJA)
70th Percentile of RJA
90th Percentile of RJA
RJA for Low-Income and Non-White People
70th Percentile of RJA for Low-Income and Non-White People
90th Percentile of RJA for Low-Income and Non-White People
RTV-057 // DORAVILLE TO JIMMY CARTER
Start: Doraville MARTA StationEnd: Jimmy CarterLength: 5.25 milesEstimated Stops: TBDLead Agency: Gwinnett County
Delivered in two phases, this project will run heavy rail from Doraville MARTA Station to Jimmy Carter.
HEAVY RAIL
RTV EVALUATION MEASURES
VERY HIGH
VERY LOW
LOW
VERY LOW IMPACT
HIGH IMPACT
VERY HIGH
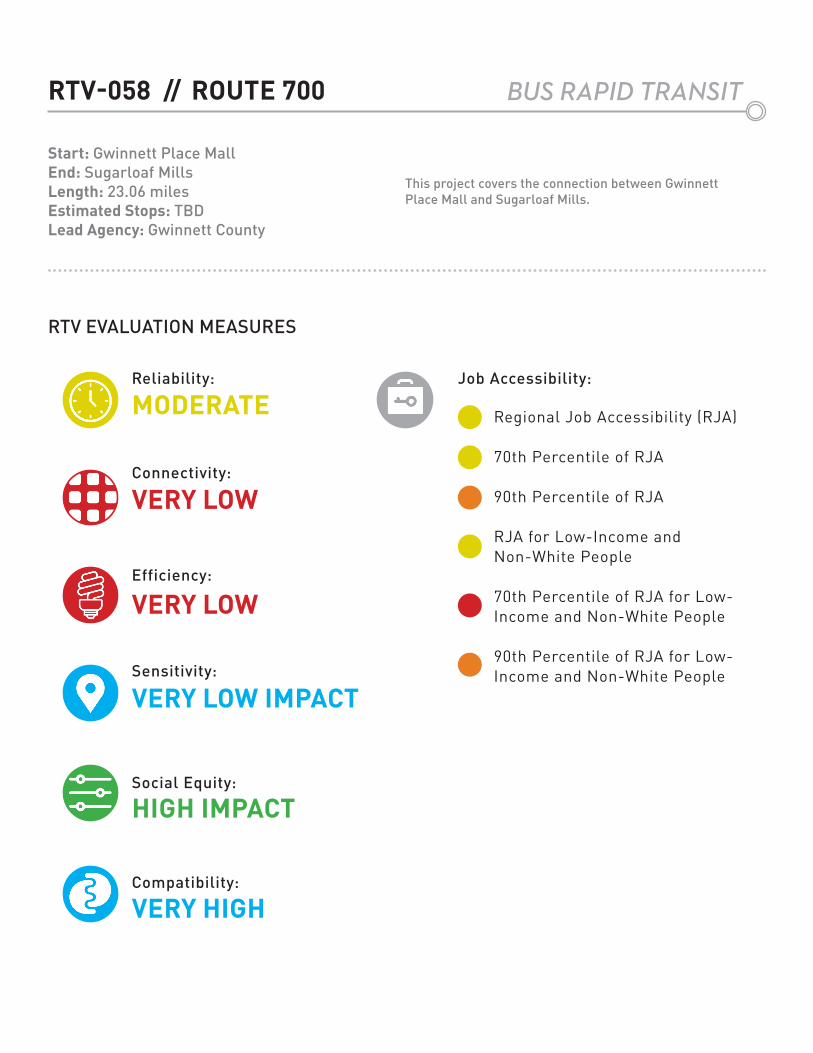
RTV-058 // ROUTE 700
Start: Gwinnett Place MallEnd: Sugarloaf MillsLength: 23.06 milesEstimated Stops: TBDLead Agency: Gwinnett County
This project covers the connection between Gwinnett Place Mall and Sugarloaf Mills.
BUS RAPID TRANSIT
Reliability:
Connectivity:
Efficiency:
Sensitivity:
Social Equity:
Compatibility:
Job Accessibility:
Regional Job Accessibility (RJA)
70th Percentile of RJA
90th Percentile of RJA
RJA for Low-Income and Non-White People
70th Percentile of RJA for Low-Income and Non-White People
90th Percentile of RJA for Low-Income and Non-White People
RTV EVALUATION MEASURES
MODERATE
VERY LOW
VERY LOW
VERY LOW IMPACT
HIGH IMPACT
VERY HIGH
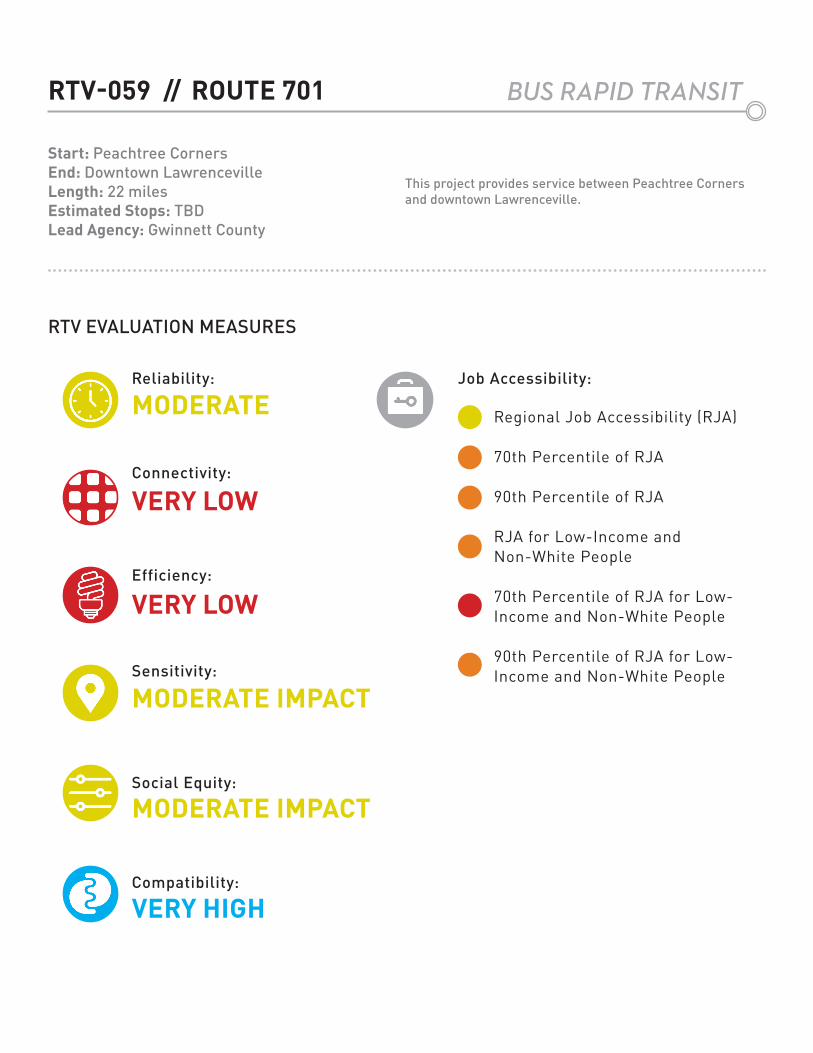
Reliability:
Connectivity:
Efficiency:
Sensitivity:
Social Equity:
Compatibility:
Job Accessibility:
Regional Job Accessibility (RJA)
70th Percentile of RJA
90th Percentile of RJA
RJA for Low-Income and Non-White People
70th Percentile of RJA for Low-Income and Non-White People
90th Percentile of RJA for Low-Income and Non-White People
RTV-059 // ROUTE 701
Start: Peachtree CornersEnd: Downtown LawrencevilleLength: 22 milesEstimated Stops: TBDLead Agency: Gwinnett County
This project provides service between Peachtree Corners and downtown Lawrenceville.
BUS RAPID TRANSIT
RTV EVALUATION MEASURES
MODERATE
VERY LOW
VERY LOW
MODERATE IMPACT
MODERATE IMPACT
VERY HIGH
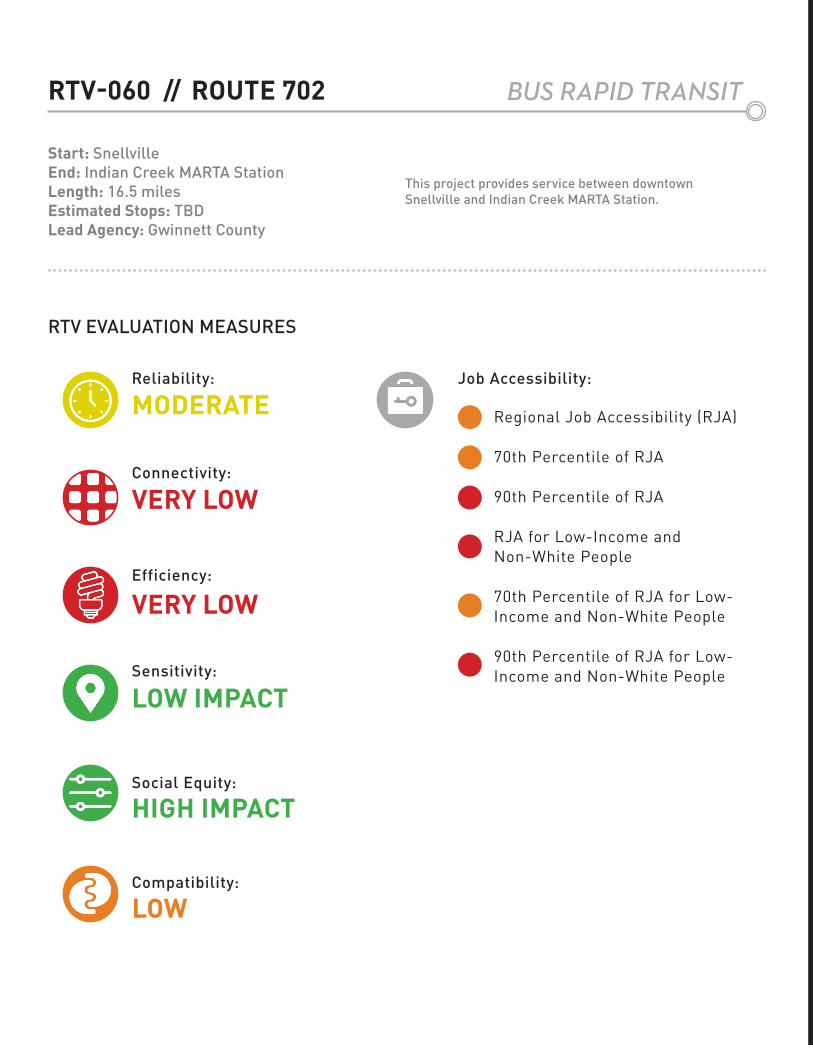
RTV-060 // ROUTE 702
Start: SnellvilleEnd: Indian Creek MARTA StationLength: 16.5 milesEstimated Stops: TBDLead Agency: Gwinnett County
This project provides service between downtown Snellville and Indian Creek MARTA Station.
BUS RAPID TRANSIT
Reliability:
Connectivity:
Efficiency:
Sensitivity:
Social Equity:
Compatibility:
Job Accessibility:
Regional Job Accessibility (RJA)
70th Percentile of RJA
90th Percentile of RJA
RJA for Low-Income and Non-White People
70th Percentile of RJA for Low-Income and Non-White People
90th Percentile of RJA for Low-Income and Non-White People
RTV EVALUATION MEASURES
MODERATE
VERY LOW
VERY LOW
LOW IMPACT
HIGH IMPACT
LOW
APPENDIX BDATA MANAGEMENT PLAN
THE NEED FOR BETTER DATA MANAGEMENT
Transit and transportation needs in the Atlanta region are continually evolving as populations shift and new priorities emerge. With this Concept 3 update, ARC has adjusted the planning process to allow for more frequent analysis and iterations of transportation plans. These iterations come in the form of advancing projects from one planning phase to the next (see Chapter 3), as well as updating existing plans and reevaluating projects.
Moving forward, the projects outlined and evaluated in Concept 3 will be added to a new Regional Transit Plan from the Atlanta-region Transit Link Authority (ATL). ARC also plans to re-run project evaluations every year in the third quarter to ensure that values are representative of the quickly changing surroundings.
The updated project evaluation schedule as well as the overall smooth transfer between planning efforts each fundamentally depend on good data management. Managing and evaluating transit project involves hundreds of data attributes of various types and which are stored and maintained by differing agencies. Streamlining the evaluation process therefore must include solutions for more direct and consistent data storage, transfer, and access.
HOW DATA IS USED
Planning for transit projects involves many datasets spanning different time scales, plans, departments, and agencies. A transit project may take decades from when it was first conceived until it is finally implemented. It may go through many changes during that time because of demographic shifts, land use, technology upgrades, safety standards, etc. Other projects may be implemented only a few years after their conception. Projects may first appear as part of Concept 3, and then make their way into the RTP and TIP, or they may be introduced at the RTP stage directly.
Project data can be useful for several purposes. As a project migrates between regional plans, both the initial data used to evaluate the project and, at times, some output data from the evaluation processes can be reused. This type of data portability can support efficient workflows for transit agencies and for ARC.
Transit agencies, planners, and advocates could also use the data for many other purposes. With project scores and details available, transit planners could draw lessons from projects that score well on performance metrics of interest, and avoid the pitfalls of projects that do not meet expectations. The data may offer some examples to think through the best way to approach potential trade-offs between priorities like mobility, social equity, preservation, etc. Transit agencies may even use the data to alter a specific project to improve its anticipated performance. These opportunities are all promising since projects that score better also better align with the criteria of the regional vision.
APPENDIX B: DATA MANAGEMENT PLAN
This Data Management Plan is a supplemental document to the 2018 Concept 3 Update for ARC. This document inventories the data required for various transit planning processes in Atlanta, and outlines opportunities to improve the data warehousing and pipelines that feed analysis.
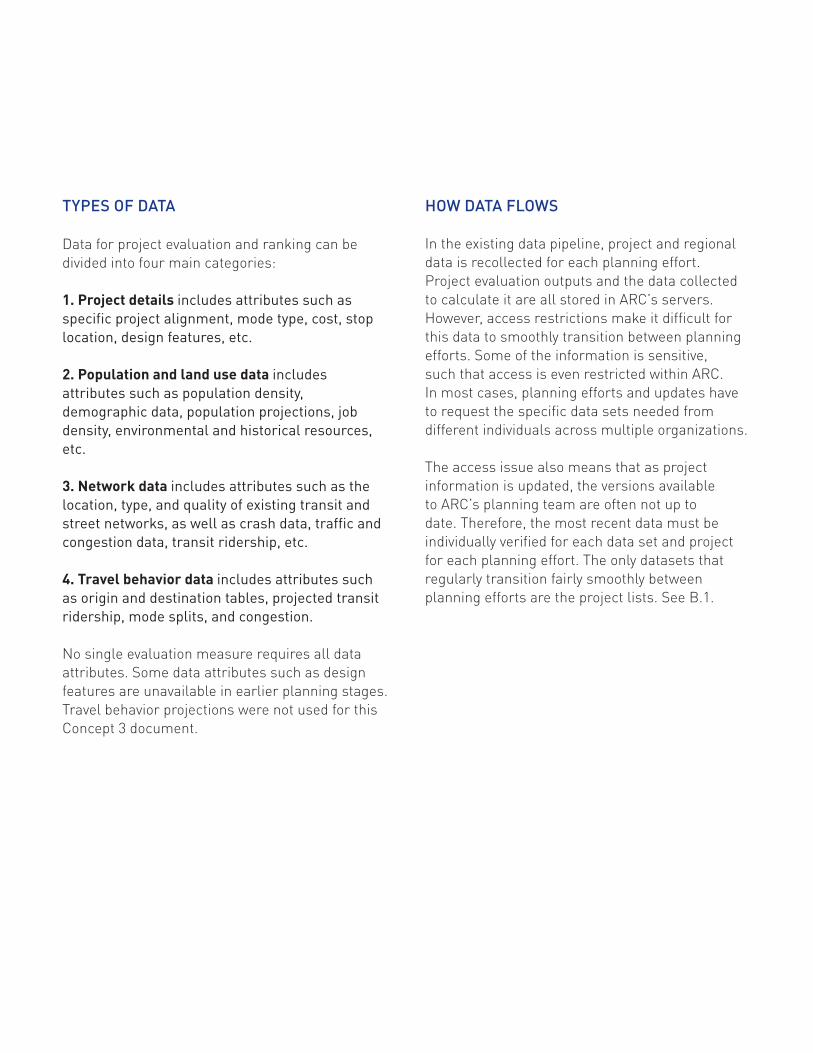
TYPES OF DATA
Data for project evaluation and ranking can be divided into four main categories:
1. Project details includes attributes such as specific project alignment, mode type, cost, stop location, design features, etc.
2. Population and land use data includes attributes such as population density, demographic data, population projections, job density, environmental and historical resources, etc.
3. Network data includes attributes such as the location, type, and quality of existing transit and street networks, as well as crash data, traffic and congestion data, transit ridership, etc.
4. Travel behavior data includes attributes such as origin and destination tables, projected transit ridership, mode splits, and congestion.
No single evaluation measure requires all data attributes. Some data attributes such as design features are unavailable in earlier planning stages. Travel behavior projections were not used for this Concept 3 document.
HOW DATA FLOWS
In the existing data pipeline, project and regional data is recollected for each planning effort. Project evaluation outputs and the data collected to calculate it are all stored in ARC’s servers. However, access restrictions make it difficult for this data to smoothly transition between planning efforts. Some of the information is sensitive, such that access is even restricted within ARC. In most cases, planning efforts and updates have to request the specific data sets needed from different individuals across multiple organizations.
The access issue also means that as project information is updated, the versions available to ARC’s planning team are often not up to date. Therefore, the most recent data must be individually verified for each data set and project for each planning effort. The only datasets that regularly transition fairly smoothly between planning efforts are the project lists. See B.1.
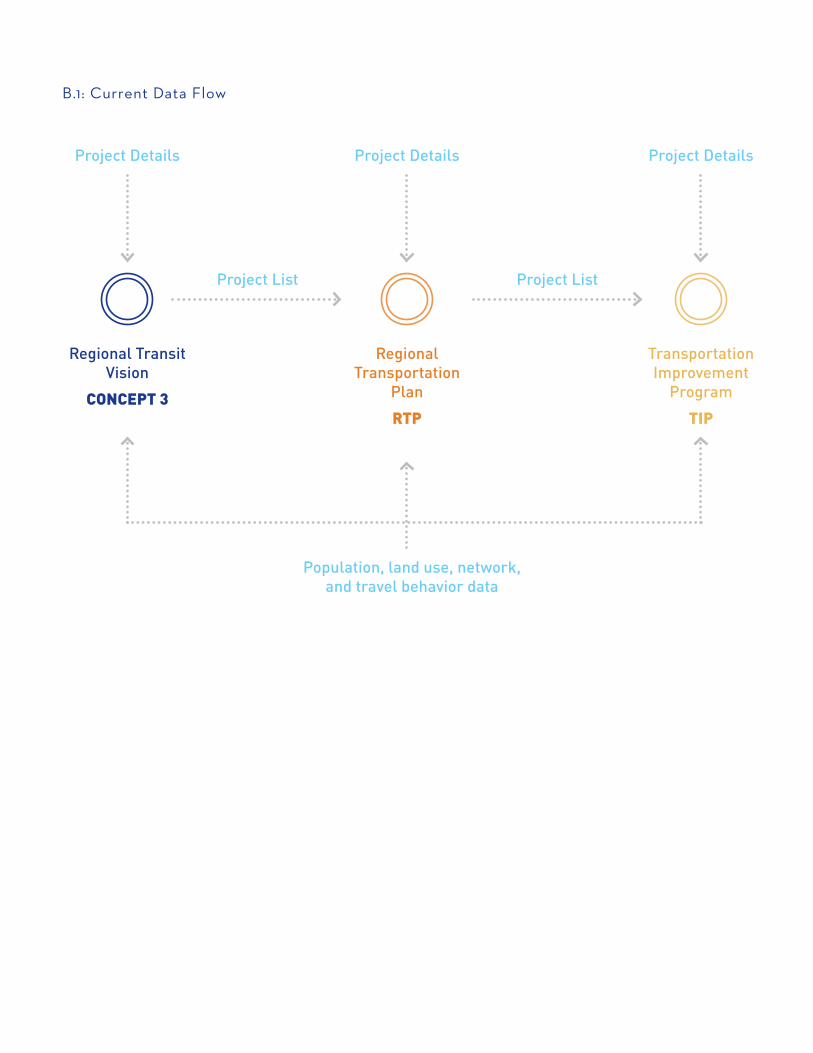
B.1: Current Data Flow
Project Details
Regional Transit Vision
CONCEPT 3
Project Details Project Details
Regional Transportation
PlanRTP
Transportation Improvement
ProgramTIP
Project List Project List
Population, land use, network, and travel behavior data
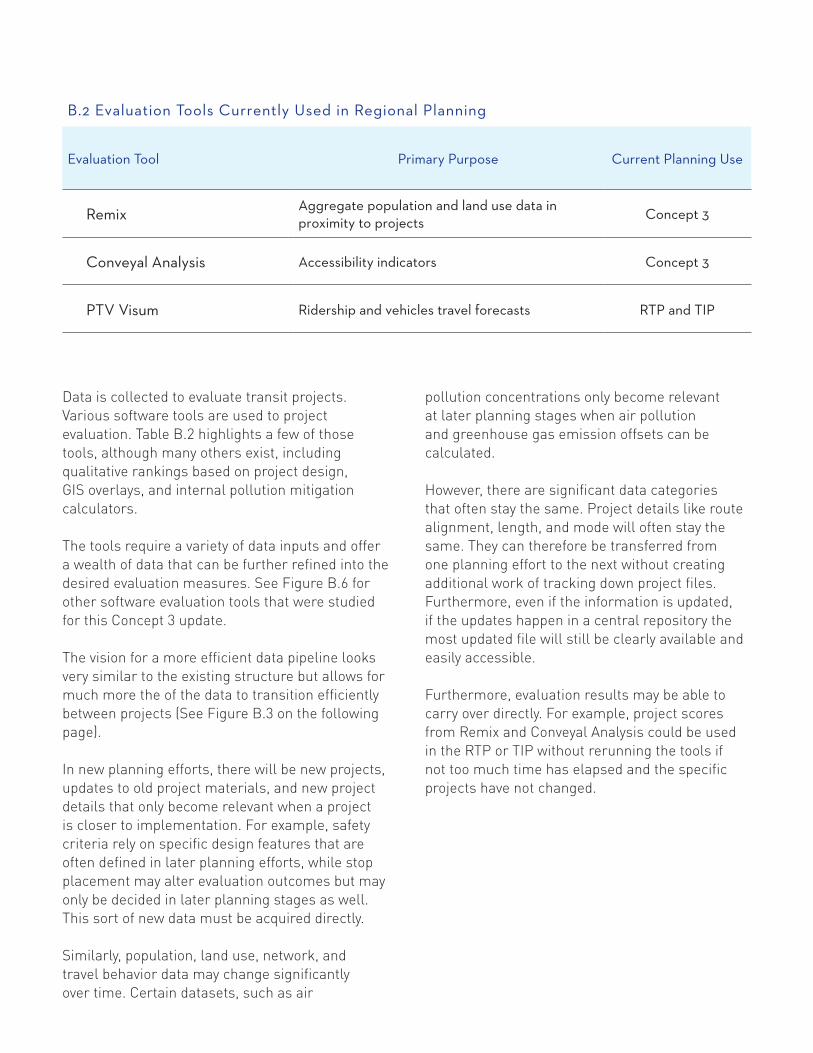
Data is collected to evaluate transit projects. Various software tools are used to project evaluation. Table B.2 highlights a few of those tools, although many others exist, including qualitative rankings based on project design, GIS overlays, and internal pollution mitigation calculators.
The tools require a variety of data inputs and offer a wealth of data that can be further refined into the desired evaluation measures. See Figure B.6 for other software evaluation tools that were studied for this Concept 3 update.
The vision for a more efficient data pipeline looks very similar to the existing structure but allows for much more the of the data to transition efficiently between projects (See Figure B.3 on the following page).
In new planning efforts, there will be new projects, updates to old project materials, and new project details that only become relevant when a project is closer to implementation. For example, safety criteria rely on specific design features that are often defined in later planning efforts, while stop placement may alter evaluation outcomes but may only be decided in later planning stages as well. This sort of new data must be acquired directly.
Similarly, population, land use, network, and travel behavior data may change significantly over time. Certain datasets, such as air
pollution concentrations only become relevant at later planning stages when air pollution and greenhouse gas emission offsets can be calculated.
However, there are significant data categories that often stay the same. Project details like route alignment, length, and mode will often stay the same. They can therefore be transferred from one planning effort to the next without creating additional work of tracking down project files. Furthermore, even if the information is updated, if the updates happen in a central repository the most updated file will still be clearly available and easily accessible.
Furthermore, evaluation results may be able to carry over directly. For example, project scores from Remix and Conveyal Analysis could be used in the RTP or TIP without rerunning the tools if not too much time has elapsed and the specific projects have not changed.
B.2 Evaluation Tools Currently Used in Regional Planning
Evaluation Tool Primary Purpose Current Planning Use
Remix Aggregate population and land use data in proximity to projects Concept 3
Conveyal Analysis Accessibility indicators Concept 3
PTV Visum Ridership and vehicles travel forecasts RTP and TIP
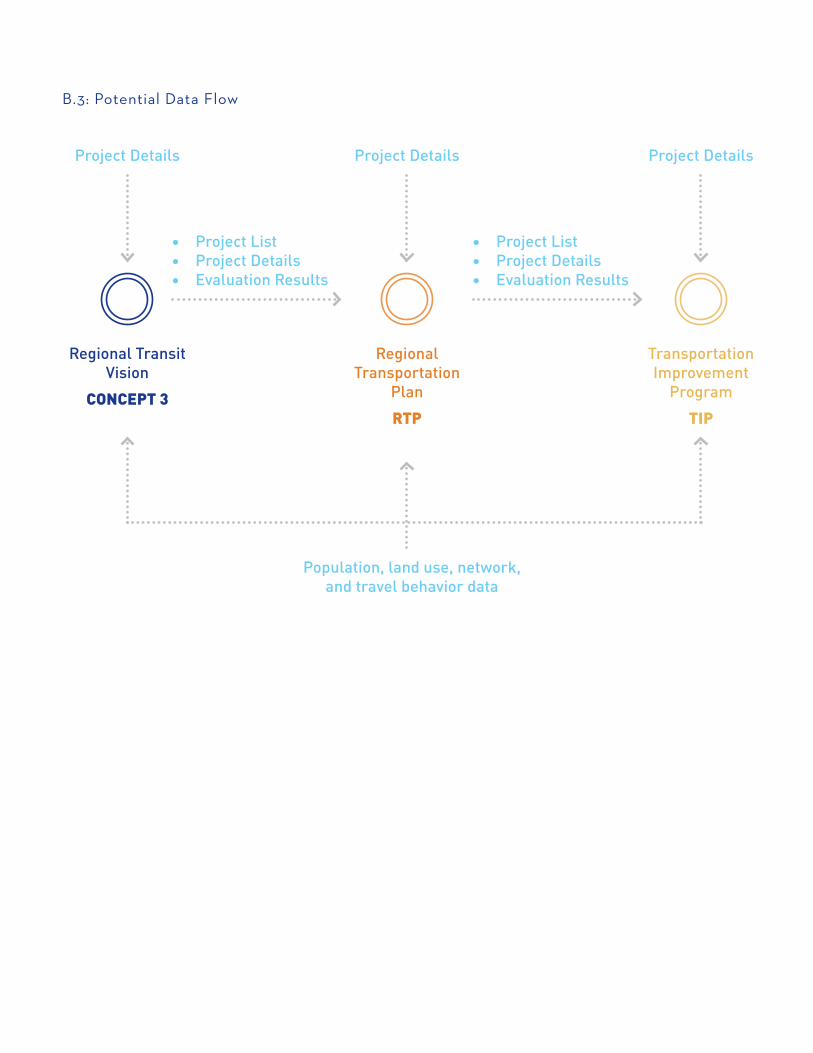
B.3: Potential Data Flow
Project Details
Regional Transit Vision
CONCEPT 3
Project Details Project Details
Regional Transportation
PlanRTP
Transportation Improvement
ProgramTIP
• Project List• Project Details• Evaluation Results
Population, land use, network, and travel behavior data
• Project List• Project Details• Evaluation Results
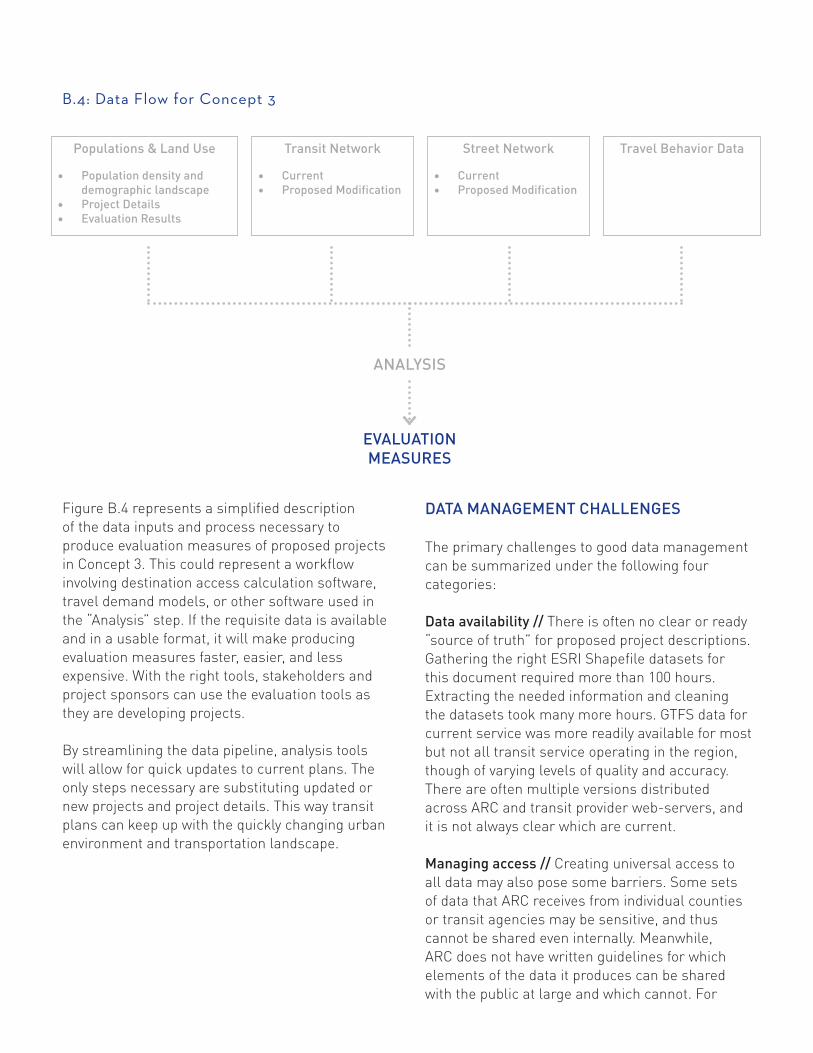
B.4: Data Flow for Concept 3
EVALUATION MEASURES
Populations & Land Use
• Population density and demographic landscape
• Project Details• Evaluation Results
Transit Network
• Current• Proposed Modification
Street Network
• Current• Proposed Modification
Travel Behavior Data
ANALYSIS
Figure B.4 represents a simplified description of the data inputs and process necessary to produce evaluation measures of proposed projects in Concept 3. This could represent a workflow involving destination access calculation software, travel demand models, or other software used in the “Analysis” step. If the requisite data is available and in a usable format, it will make producing evaluation measures faster, easier, and less expensive. With the right tools, stakeholders and project sponsors can use the evaluation tools as they are developing projects.
By streamlining the data pipeline, analysis tools will allow for quick updates to current plans. The only steps necessary are substituting updated or new projects and project details. This way transit plans can keep up with the quickly changing urban environment and transportation landscape.
DATA MANAGEMENT CHALLENGES
The primary challenges to good data management can be summarized under the following four categories:
Data availability // There is often no clear or ready “source of truth” for proposed project descriptions. Gathering the right ESRI Shapefile datasets for this document required more than 100 hours. Extracting the needed information and cleaning the datasets took many more hours. GTFS data for current service was more readily available for most but not all transit service operating in the region, though of varying levels of quality and accuracy. There are often multiple versions distributed across ARC and transit provider web-servers, and it is not always clear which are current.
Managing access // Creating universal access to all data may also pose some barriers. Some sets of data that ARC receives from individual counties or transit agencies may be sensitive, and thus cannot be shared even internally. Meanwhile, ARC does not have written guidelines for which elements of the data it produces can be shared with the public at large and which cannot. For
example, sharing individual project scores may create confusion if low scoring projects are funded before high scoring projects, something that may happen for a number of reasons that are not reflected in the evaluation criteria.
Data maintenance // Because circumstances may inspire projects to change mode or technology, adopt a different alignment, or something else entirely, the project version published in Concept 3, in the RTP, and maintained by the transit agency that is planning it, could all be different. The many departments and agencies complicate adoption of any single standard or method that everyone will approve of and follow. To ensure the main data warehouse is always updated with the most recent version will also require person hours and quality control.
Data formats and network coding // Various software require different formats for project descriptions. Both evaluation tools used in this project, Conveyal Analysis and Remix, acquire the current transit network via GTFS and use OpenStreetMap for the road network. However, the software has different requirements for importing proposed projects, and, further, because many proposed projects will use existing infrastructure, the connections between existing infrastructure and service and proposed infrastructure and service need to be manually inputted. Interoperable data formats (which can be utilized by many software packages) will enable a streamlined workflow.
DATA MANAGEMENT OPPORTUNITIES
There are a number of opportunities for ARC and their regional partners to overcome the challenges listed above, thereby enabling the ideal data management flow detailed in Figure B.4.
Improving data availability // The ARC server creates a number of barriers to access that can result in file dispersion. The ESRI Geodatabase maintained by ARC has emerged as a possible solution to advance on some of these issues. The geodatabase provides a broader base of access, and project data that should be shared can be added as attribute columns for project shapes inside of layers. The ESRI Geodatabase in its current form cannot house all project data because it does not allow for differentiated levels of access.
Managing access // Some project data is highly sensitive and can only be shared with certain people at ARC, while other project elements can be accessible to everyone at ARC, to partner counties and transit agencies, or to the public at large. Increasing access provides greater opportunities for optimizing workflows and forging collaborations. It is important to establish clear guidelines for access for various project elements, and to strive for the greatest level of access possible within those guidelines. The central warehouse for project data would have to be adapted to allow for differentiated access so that all project data can be stored in the same place but data elements would only be accessible to the appropriate parties.
Data maintenance // Ensuring a single source of truth requires clear protocols and practices that will be used to ensure that the data warehouse always has the most up-to-date project information and that whenever two different project files exist, it can be clear which one is the
most recent. This can include naming conventions, granting editing access to partner transit agencies so that they can directly upload new project data into the warehouse, using version control systems (i.e. GitHub), and assigning person hours to review, manage, and maintain data.
Data formats and network coding // To account for various data input and output formats of different tools, ARC can require that tools used in the workflow utilize standard data formats if they are available. In cases where there are not standards, ARC can require documentation for tool-specific data formats, which may later become a basis for standardized interoperable data. For example, most tools support GTFS. However, this data format is designed around use cases involving operating services where parameters such as the precise location of stops is known. This attribute is not available in earlier planning processes (see Chapter 4). Conveyal Analysis exports GeoJSON files that describe transit network scenarios where fewer parameters may be known. Data format standardization can also be supported by tracking and engaging with existing efforts, such as Zephyr Foundation’s (currently notional) General Travel Network Specification.
Some proposed transit projects are modifications to existing lines (e.g. extensions) while others are new lines. Modifications to existing lines need to be applied to an existing baseline scenario. During the 2018 Concept 3 update process, transit network modifications were separately and manually applied in the selected evaluation software. In the future, there is opportunity to streamline this process by developing, purchasing, or commissioning software to re-apply proposed projects (e.g. modifications such as added trips or route changes) to updated baseline samples.
Sampling the baseline network // During this update process, baseline street and transit network datasets were combined with proposed projects to create and evaluate hypothetical network scenarios. This requires baseline data that accurately describes the current transportation network. A sample of General Transit Feed Specification (GTFS) data used in traveler-facing applications established the baseline transit scenario for the plan update. In future updates, a new transit baseline sample will need to be established (Figure B.5).
The plan update’s baseline street network sample came from OpenStreetMap, which is the default source of street network information for the selected evaluation tools and is also used by many traveler-facing applications. By contributing to OpenStreetMap, regional organizations can maintain a shared, public street network that is used in planning processes and in journey planners and other traveler-facing tools.
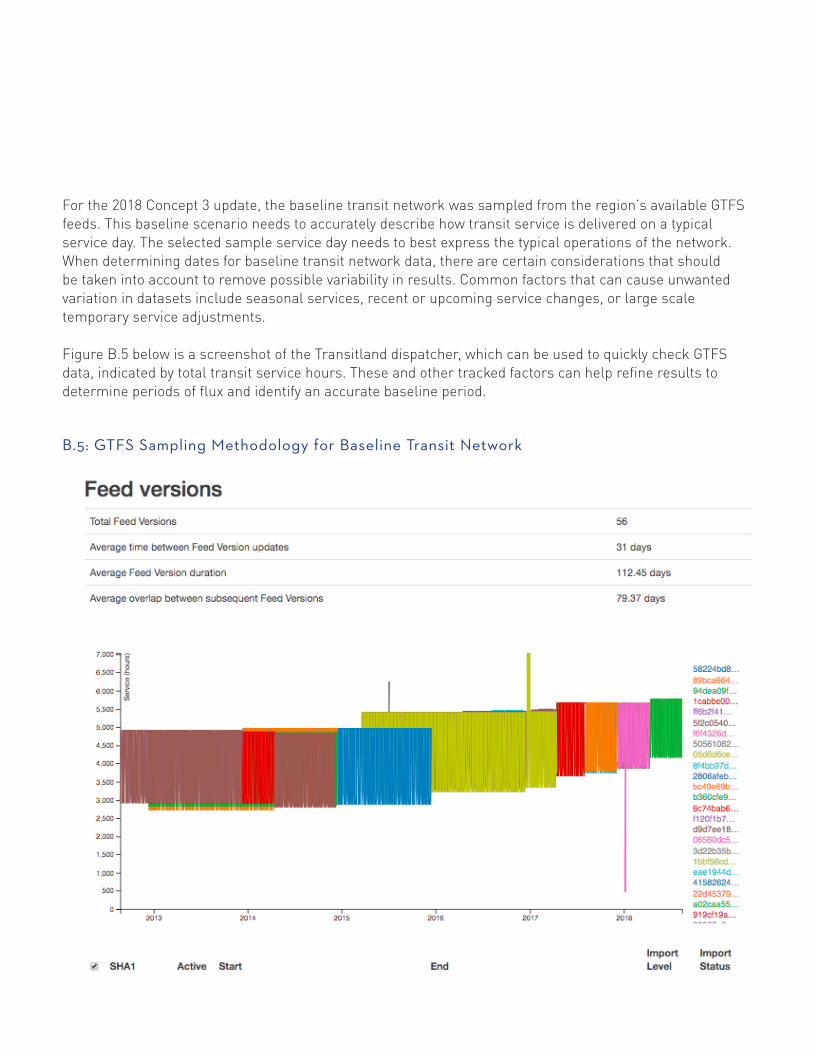
B.5: GTFS Sampling Methodology for Baseline Transit Network
For the 2018 Concept 3 update, the baseline transit network was sampled from the region’s available GTFS feeds. This baseline scenario needs to accurately describe how transit service is delivered on a typical service day. The selected sample service day needs to best express the typical operations of the network. When determining dates for baseline transit network data, there are certain considerations that should be taken into account to remove possible variability in results. Common factors that can cause unwanted variation in datasets include seasonal services, recent or upcoming service changes, or large scale temporary service adjustments.
Figure B.5 below is a screenshot of the Transitland dispatcher, which can be used to quickly check GTFS data, indicated by total transit service hours. These and other tracked factors can help refine results to determine periods of flux and identify an accurate baseline period.
SOFTWARE
Various Evaluation Tool candidate software were studied and assessed for the Concept 3 Update. Tools were selected based on their present features, but as new software emerges, existing software evolves, and process are reassessed, different tools may be better suited for the needs of future. Utilizing and insisting on standardized data will make it possible to more flexibly add new analysis tools to the workflow. Below is a description of two primary categories of tools for destination access analysis and travel modeling and a list of some example tools researched during the 2018 Concept 3 update process.
Destination access analysis // A new generation of tools richly quantifies access to jobs, services, and amenities provided by transit. One commonly used measure of access, for example, is the number of destinations (e.g. jobs) accessible by transit from a single point in 45 minutes. Aggregate measures can be formed by many of these single-point measurements across a transit service area. In an access analysis, travel time can be computed for:
• Trips people could make for all households, to all jobs, and/or other selected destination categories.
• Trips that people want to make, indicated by queries entered into a trip planner.
• Trips that people actually do make, gathered from survey or farecard-derived origin-destination data or other datasets such as LEHD Origin-Destination Employment Statistics (LODES).
Aggregate access to destinations using the above listed approaches can be calculated for the current transit network (baseline scenario) and for network changes under consideration to understand the implications for trips people can, want to, and/or actually do make.
Fast-adapting, data-driven travel demand and behavior models // A new category of fast-adapting travel demand models make it easier to consider demand for all modes in the transit planning process and uncover latent demand. Data-driven models are updated more frequently (e.g. quarterly) than traditional regional travel demand models. This is accomplished by using datasets such as consumer marketing datasets and passive datasets such as cell phone data.
Table B.6 on the following page lists various Evaluation Tools that were studied for this Concept 3 update. The tools vary along multiple dimensions, including the amount of input required, the types of evaluation measures they offer, the modes of transit they can evaluate, runtime and processing intensity, ease of use and technical support, methodology, and more. For Concept 3, Conveyal Analysis and Remix were deemed to best serve the evaluation needs while meeting the time, budget, and data availability restrictions.
Planning processes should periodically study tool options. On the one hand, there is value in continuing to use the same tools for a longer interval. This way project evaluation measures can be compared over time as well. However, new tools may emerge that better meet the constraints and aims of the planning process, or existing tools that are relatively new and appear promising but require further development may mature and and become top contenders. The tools in Figure B.6 can serve as a starting list for future studies.
In order to be available, useful, and transparent to all stakeholders, the outputs of analysis processes need to be clearly presented. This is one of the functions of documents such as Concept 3. There is also opportunity to develop report templates and data dashboards that automate presentation of analysis outputs. For example, during this Concept 3 update process, R was used to post-process some of the outputs of evaluation tools. Various tools could be employed to post-process, consolidate, and present such outputs in a reproducible methodology.
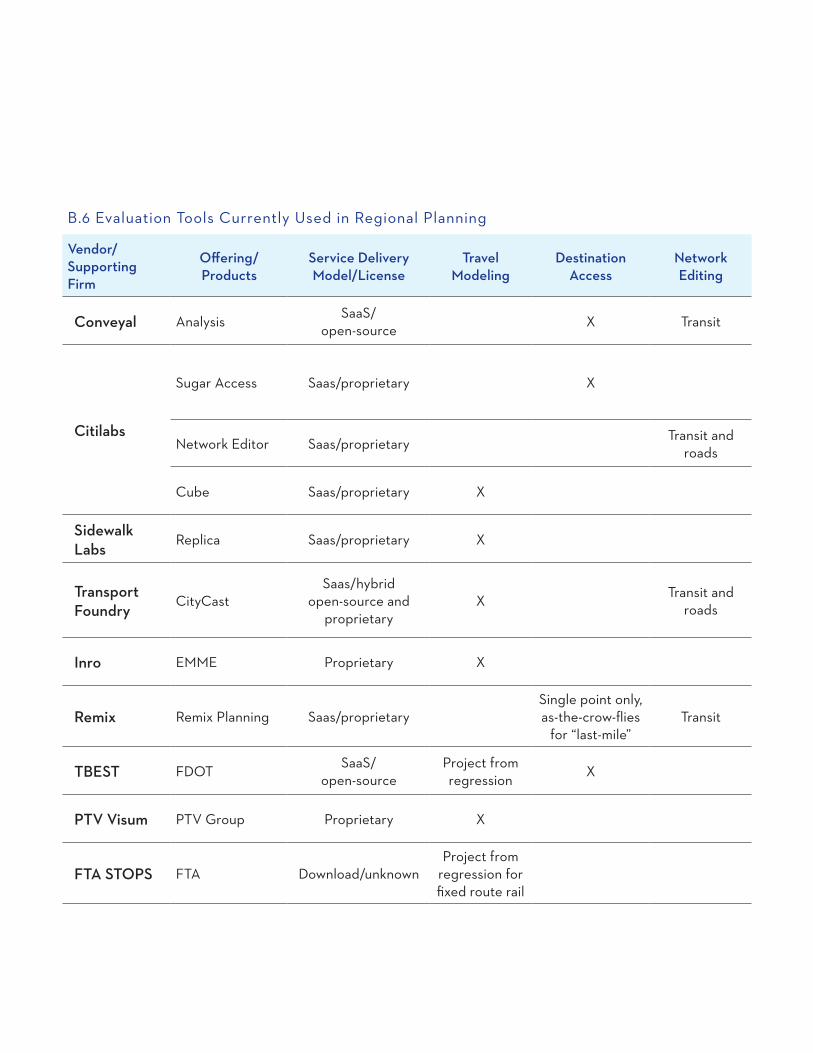
B.6 Evaluation Tools Currently Used in Regional Planning
Vendor/Supporting Firm
Offering/ Products
Service Delivery Model/License
Travel Modeling
Destination Access
Network Editing
Conveyal Analysis SaaS/ open-source X Transit
Citilabs
Sugar Access Saas/proprietary X
Network Editor Saas/proprietary Transit and roads
Cube Saas/proprietary X
Sidewalk Labs
Replica Saas/proprietary X
Transport Foundry
CityCastSaas/hybrid
open-source and proprietary
X Transit and roads
Inro EMME Proprietary X
Remix Remix Planning Saas/proprietarySingle point only, as-the-crow-flies
for “last-mile”Transit
TBEST FDOT SaaS/ open-source
Project from regression X
PTV Visum PTV Group Proprietary X
FTA STOPS FTA Download/unknownProject from
regression for fixed route rail

Graphic Design Attributions:
Thanks to the following folks for their Noun Project artwork:
Train by Ryan DellBus by SANTRI ICONTram by jon trillanagrid by Hea Poh Linclock by LunglaiEconomic Bulb by Ben DavisLocation by WeltenraserSliders by joeartconcompatibility by Antonbusiness bag by Vectors MarketRail by Dinosoft LabsTrain by RediffusionTram by Jamison WieserWifi Bus by Luis Pradotraffic jam by Bence Bezeredy

Related Documents