Z. Phys. B 104, 513–521 (1997) ZEITSCHRIFT F ¨ UR PHYSIK B c Springer-Verlag 1997 Computer simulation of nanoindentation into polymer films G. P¨ atzold 1,2 , A. Linke 1,2 , T. Hapke 1,2 , D.W. Heermann 1,2 1 Institut f¨ ur Theoretische Physik, Universit¨ at Heidelberg, Philosophenweg 19, D-69120 Heidelberg, Germany (e-mail: [email protected], http://wwwcp.tphys.uni-heidelberg.de/) 2 Interdisziplin¨ ares Zentrum f¨ ur wissenschaftliches Rechnen der Universit¨ at Heidelberg, Heidelberg, Germany Received: 2 April 1997 Abstract. We present computer simulations of nanoinden- tation into amorphous polymer films. The bulk polymer is treated through a united atom model in connection with molecular dynamics methods. The dynamics of the inden- ter is modeled as overdamped, such that the indentation ve- locity is proportional to the difference between the external force acting onto the tool and the resistance force built up in the polymer film. We concentrate on the initial, kinetic stage of the indentation process and give results for the mo- tion of the indenter, the deformation field of the polymer film, the stress field, and the field of total monomer energy. We propose an effective coefficient as a new measure for the resistivity of a surface against indentation. Its value can be determined in an experiment with constant indentation velocity. In addition, we investigate the free drift behavior when the external driving force has been set to zero and the tool is expelled from the polymer film. For different polymer chain lengths, the tool’s motion is exponential in time and we determine the relaxation scale. PACS: 68.60.Bs; 81.40.Lm; 81.40.Pq 1. Introduction The penetration of a sharp body into a surface is one of the most basic damage and probing mechanisms one can think of. We study this situation for the case of a rigid tool which indents a thin amorphous polymer film. This film can be thought of as some representative component for micro- or even nanotechnological design, where the film thickness varies from micrometers to tens of nanometers. Important applications include resists and interlayer dielectrics in mi- croelectronics fabrication, alignment layers in liquid crystal displays, lubricants in magnetic information storage devices, and coatings for wear protection and corrosion [1]. In most cases, the material of the film is chosen for its functional property (electronic, magnetic, or optical). For other minia- turized components, Young’s modulus is the most impor- tant material property, because the operational principle of many micromechanical components is based on the elastic behavior of the material. Examples for such components are pressure sensors in which a membrane is bent by an applied pressure, or acceleration sensors, in which a seismic mass is deflected by an applied acceleration. In many applications, the microscopic components are expected to withstand harsh mechanical influences. Several factors can cause mechanical stresses, which results in vari- ous deformation and fracture phenomena. Thus, besides the functional properties, also mechanical properties are of im- portance for the desired function of thin films. Many me- chanical testing methods applied to macroscopic bulk mate- rials can obviously not be used for films less than a micron thick. Special care has to be taken to measure the prop- erties of the film and not of the substrate. Much work has been spent on the development of reliable and accurate tech- niques to measure the elastic properties (Young’s modulus), stresses, adhesion, hardness, and fracture resistance of thin films. One feasible testing technique is nanoindentation. It is similar to conventional hardness testing, but is performed on a much smaller scale. In the basic experimental setup, the force required to press a sharp diamond indenter into a ma- terial is measured as a function of the indentation depth [2]. The experimental depth resolution on the scale of nanome- ters allows nowadays to conduct indentation experiments even on very thin films. Two quantities which can be read- ily extracted from nanoindentation experiments are Young’s modulus, i.e. the material’s stiffness, and the hardness, which can be correlated to yield strength [3]. Nanoindentation ex- periments have also been used to study creep, plastic flow, and fracture of materials. Experimental nanoindentation de- pends on a number of parameters, like the shape of the in- denter tip and the strain history of the sample. The latter affects the material’s structure and can lead to strain hard- ening and a change in the measured results. Luedtke and Landman [4] performed computer simula- tions to study the formation of solid junctions between metal surfaces and metal tips, and of liquid junctions between metal tips and hexadecane molecules. Part of their moti- vation was to contrast continuum based contact mechanics with atomistic simulations. These authors stress that nanoin-

Welcome message from author
This document is posted to help you gain knowledge. Please leave a comment to let me know what you think about it! Share it to your friends and learn new things together.
Transcript
Z. Phys. B 104, 513–521 (1997) ZEITSCHRIFTFUR PHYSIK Bc© Springer-Verlag 1997
Computer simulation of nanoindentation into polymer films
G. Patzold1,2, A. Linke 1,2, T. Hapke1,2, D.W. Heermann1,2
1 Institut fur Theoretische Physik, Universitat Heidelberg, Philosophenweg 19, D-69120 Heidelberg, Germany(e-mail: [email protected], http://wwwcp.tphys.uni-heidelberg.de/)2 Interdisziplinares Zentrum fur wissenschaftliches Rechnen der Universitat Heidelberg, Heidelberg, Germany
Received: 2 April 1997
Abstract. We present computer simulations of nanoinden-tation into amorphous polymer films. The bulk polymer istreated through a united atom model in connection withmolecular dynamics methods. The dynamics of the inden-ter is modeled as overdamped, such that the indentation ve-locity is proportional to the difference between the externalforce acting onto the tool and the resistance force built upin the polymer film. We concentrate on the initial, kineticstage of the indentation process and give results for the mo-tion of the indenter, the deformation field of the polymerfilm, the stress field, and the field of total monomer energy.We propose an effective coefficient as a new measure forthe resistivity of a surface against indentation. Its value canbe determined in an experiment with constant indentationvelocity. In addition, we investigate the free drift behaviorwhen the external driving force has been set to zero and thetool is expelled from the polymer film. For different polymerchain lengths, the tool’s motion is exponential in time andwe determine the relaxation scale.
PACS: 68.60.Bs; 81.40.Lm; 81.40.Pq
1. Introduction
The penetration of a sharp body into a surface is one ofthe most basic damage and probing mechanisms one canthink of. We study this situation for the case of a rigid toolwhich indents a thin amorphous polymer film. This film canbe thought of as some representative component for micro-or even nanotechnological design, where the film thicknessvaries from micrometers to tens of nanometers. Importantapplications include resists and interlayer dielectrics in mi-croelectronics fabrication, alignment layers in liquid crystaldisplays, lubricants in magnetic information storage devices,and coatings for wear protection and corrosion [1]. In mostcases, the material of the film is chosen for its functionalproperty (electronic, magnetic, or optical). For other minia-turized components, Young’s modulus is the most impor-tant material property, because the operational principle of
many micromechanical components is based on the elasticbehavior of the material. Examples for such components arepressure sensors in which a membrane is bent by an appliedpressure, or acceleration sensors, in which a seismic mass isdeflected by an applied acceleration.
In many applications, the microscopic components areexpected to withstand harsh mechanical influences. Severalfactors can cause mechanical stresses, which results in vari-ous deformation and fracture phenomena. Thus, besides thefunctional properties, also mechanical properties are of im-portance for the desired function of thin films. Many me-chanical testing methods applied to macroscopic bulk mate-rials can obviously not be used for films less than a micronthick. Special care has to be taken to measure the prop-erties of the film and not of the substrate. Much work hasbeen spent on the development of reliable and accurate tech-niques to measure the elastic properties (Young’s modulus),stresses, adhesion, hardness, and fracture resistance of thinfilms.
One feasible testing technique is nanoindentation. It issimilar to conventional hardness testing, but is performed ona much smaller scale. In the basic experimental setup, theforce required to press a sharp diamond indenter into a ma-terial is measured as a function of the indentation depth [2].The experimental depth resolution on the scale of nanome-ters allows nowadays to conduct indentation experimentseven on very thin films. Two quantities which can be read-ily extracted from nanoindentation experiments are Young’smodulus, i.e. the material’s stiffness, and the hardness, whichcan be correlated to yield strength [3]. Nanoindentation ex-periments have also been used to study creep, plastic flow,and fracture of materials. Experimental nanoindentation de-pends on a number of parameters, like the shape of the in-denter tip and the strain history of the sample. The latteraffects the material’s structure and can lead to strain hard-ening and a change in the measured results.
Luedtke and Landman [4] performed computer simula-tions to study the formation of solid junctions between metalsurfaces and metal tips, and of liquid junctions betweenmetal tips and hexadecane molecules. Part of their moti-vation was to contrast continuum based contact mechanicswith atomistic simulations. These authors stress that nanoin-
514
dentation can not only be used to probe materials but also toinduce atomic-scale structural modifications via tip substrateinteractions. Whereas our approach and methodology is sim-ilar to that of Luedtke and Landman, there are certain dif-ferences. They included the attractive part of the tip/surfaceinteraction potential; therefore they observed adhesion andthe jump-to-contact instability. This is not the case in ourstudy. Our interest goes into the displacement of matter dur-ing indentation and we avoid the peculiarities of detailedmetal/polymer interaction potentials. The generic repellingpotential we use allows us to study the kinematics of thedeformation field and the stress response.
Recently, nanoindentation into polymer surfaces has beenstudied experimentally [5]. An atomic force microscope wasused in force mode to investigate the mechanical behavior ofpolyurethane and epoxy samples under mechanical load. TheAFM probe tip was first lowered into contact with the sam-ple, then indented into the surface, and finally lifted off ofthe sample surface. For polyurethane samples, large amountsof elastic deformation, as measured from the unloading re-sponse, were observed, and the amount of inelastic defor-mation, as measured by the hysteresis between the load andunload curves, depended on the magnitude of the maximumload. The total amount of indentation, as well as the amountsof elastic deformation and load-unload hysteresis, is largerfor the lower modulus material. This observation indicatesthat for these materials, as the penetration depth increases,the deformation zone increases such that both elastic andinelastic deformations increase.
In the next section, we include a short review aboutthe simulation model we use. We give some details specificto the computer simulation of nanoindentation experiments.Thereafter, the possibilities to extract a concise characteriza-tion of the indentation process from the atomistic raw dataare discussed. We then present our results on forced indenta-tion and free drift dynamics, thereby proposing a dynamicalmeasure for surface hardness and a characteristic time scalefor restoration processes. In the last part, we look at the localfields of total deformation, von Mises equivalent stress, andtotal energy caused by the indenting tool. Previous resultswith an emphasis on the overall deformation characteristicsrather than on the more local effects considered here havealready been published [6].
2. Polymer model, simulation method,and postprocessing
2.1. United atom model for polyethylene
For the polymer chains, we use a united atom model in con-junction with Newtonian dynamics. In addition to harmonicchain forces which keep the bond lengths next to the equilib-rium value, we model the fluctuation of bond angles, againby a quadratic potential. Between monomers which do notparticipate in mutual bond length or bond angle interactions,Lennard-Jones forces are acting, both to model an excludedvolume effect and to hold the polymer system together. Notethat, for the sake of simplicity, we neglect any torsion po-tential in the present study. Future work will address moredetailed potentials and elaborate polymer models. Here we
60Å
Polymer FilmTool
120Å
Lower Plate
Upper Plate
40Å
x
yz
Column ColumnRight SupportLeft Support
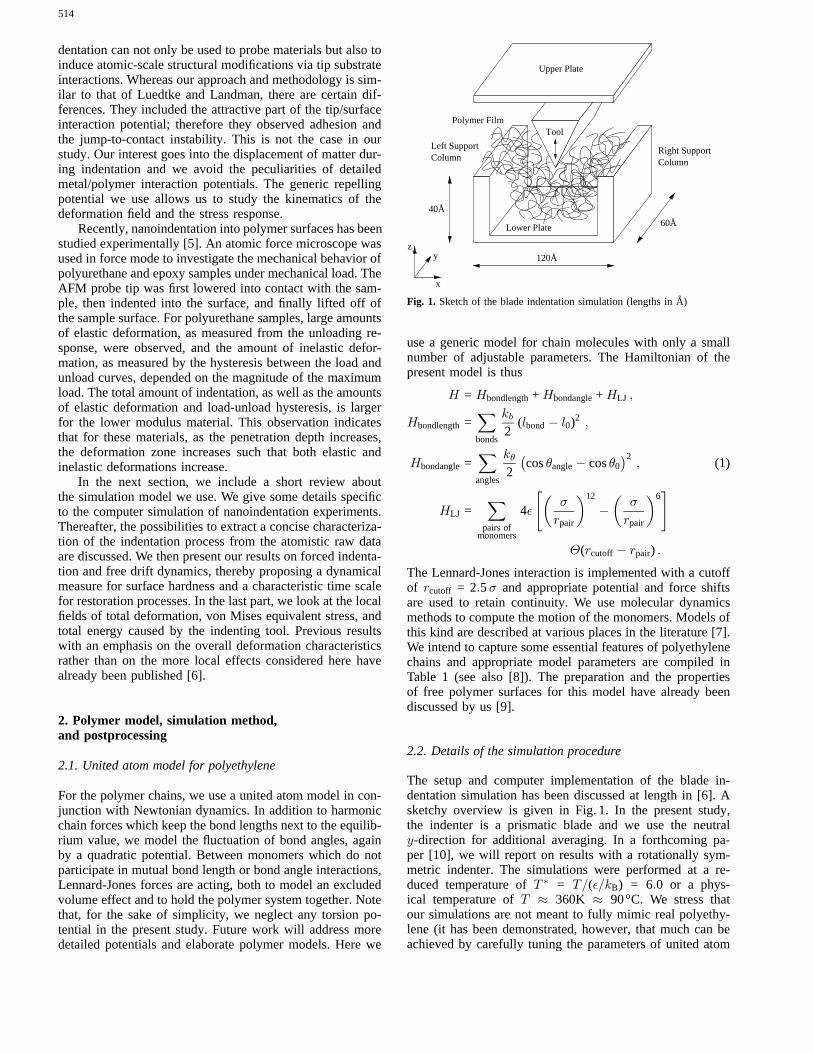
Fig. 1. Sketch of the blade indentation simulation (lengths inA)
use a generic model for chain molecules with only a smallnumber of adjustable parameters. The Hamiltonian of thepresent model is thus
H = Hbondlength+ Hbondangle+ HLJ ,
Hbondlength=∑bonds
kb2
(lbond− l0)2 ,
Hbondangle=∑angles
kθ2
(cosθangle− cosθ0
)2, (1)
HLJ =∑
pairs ofmonomers
4ε
[(σ
rpair
)12
−(
σ
rpair
)6]
Θ(rcutoff − rpair) .
The Lennard-Jones interaction is implemented with a cutoffof rcutoff = 2.5σ and appropriate potential and force shiftsare used to retain continuity. We use molecular dynamicsmethods to compute the motion of the monomers. Models ofthis kind are described at various places in the literature [7].We intend to capture some essential features of polyethylenechains and appropriate model parameters are compiled inTable 1 (see also [8]). The preparation and the propertiesof free polymer surfaces for this model have already beendiscussed by us [9].
2.2. Details of the simulation procedure
The setup and computer implementation of the blade in-dentation simulation has been discussed at length in [6]. Asketchy overview is given in Fig. 1. In the present study,the indenter is a prismatic blade and we use the neutraly-direction for additional averaging. In a forthcoming pa-per [10], we will report on results with a rotationally sym-metric indenter. The simulations were performed at a re-duced temperature ofT ∗ = T/(ε/kB) = 6.0 or a phys-ical temperature ofT ≈ 360K ≈ 90oC. We stress thatour simulations are not meant to fully mimic real polyethy-lene (it has been demonstrated, however, that much can beachieved by carefully tuning the parameters of united atom

515
Table 1. Parameters of the polyethylene model
Lennard-Jones energy,ε 8.3027· 10−22 J 500 J/molLennard-Jones length,σ 380 pm 3.8Amonomer mass (CH2 group),m 2.3248· 10−26 kg 14 atomic units
temperature,T 361 Kbond length,l0 152 pm 1.52Abond angle,θ0 109.47o cosθ0 = −1/3spring constant (bond length),kb 5.7498· 101 N/m 3.46 · 107 J/(nm2mol)bending constant (bond angle),kθ 8.3027· 10−19 J 5· 105 J/molsimulation time step,∆t 2.0108 fs
models [8]). The chain lengths are too short and we treatchain-end monomers like mid-chain monomers. We also ne-glect the torsional potential (the rotation about C-C axes isnot restricted). The high temperature helps to ensure that infeasible simulation times, the chains travel several radii ofgyration. We have simulated chains of length N=20, 40, and60. The film thickness is on average 75A. The boundaryconditions are periodic in the lateral (x and y) directions,but there is naturally no periodicity along the film thickness(z) direction. For the time integration, we use the velocityvariant of the Verlet algorithm. To keep the temperature con-stant (indenting the tool adds energy to the system and wouldincrease the temperature), a Hoover thermostat is employed.We report on relatively short molecular dynamics runs with aduration of about 20 picoseconds. The reason is that we wantto achieve high temporal resolution for the indentation pro-cess. To use our resources adequately, we sample polymerconfigurations every 0.2 picoseconds over five independentruns for each computer simulation. The interaction betweenpolymer and tool is purely repulsive and modeled by theeffective potential
HT/M =∑
monomers
4ε
(σ
r T/M
)12
Θ(rcutoff − r T/M) , (2)
wherer T/M is the shortest distance between a monomer andthe surface of the tool. For the motion of the tool, we useoverdamped dynamics,
vtool =1ζ
(Fexternal− Fpolymer
), (3)
wherevtool is the z component of the indentation velocity(motion into the x and y directions is suppressed),ζ is anadjustable friction coefficient,Fexternal is the external driv-ing force, andFpolymer is the reaction force of the polymerfilm. The reason to use this artificial first order dynamics in-stead of the physical second order Newtonian dynamics forthe indenter is to avoid transient phenomena. Earlier studieswith Newtonian dynamics have shown that the tool under-goes damped oscillations after impact on the film. From thepresent study, we excluded this effect since it depends onthe arbitrary tool mass. This would add an additional freeparameter, whereas the friction constantζ in the overdampeddynamics merely sets the time scale of the indentation pro-cess. We claim that there is a regime in nanoindentationwhich is not governed by the inertia of the tool and forwhich the equilibrium condition, i.e. zero net force, is thesame for first and second order dynamics.
2.3. Interpreting the results
Under the action of the indenting tool, the polymer film un-dergoes considerable deformations, at least in some activeregion next to the impact zone. In continuum mechanics, thedeformation state is encoded into a three-dimensional vectorfield which describes the motion of so-called material points.In the context of particle based simulations, a first questionto address is how to define such points. Possible candidatesare monomer or chain center of mass coordinates. However,on the nano-scale, diffusive motion takes place. From thesimulations, we know that the average free diffusive motionof monomers is 5 to 6A during the chosen indentation in-terval of 10 picoseconds. On the other hand, we observe atrend for the indenting blade to displace entire chains. But inthe simulations to be presented here, there is an overlap be-tween the linear dimensions of the tool and the chain radiusof gyration. We accordingly have no seperation of scales andobservations based solely on center of mass coordinates ofchains turn out to be too coarse.We therefore interpret theaverage motion of monomers as the displacement of materialpoints in a corresponding field description.
In particular, we divide the volume of the polymer filminto a number of subvolumes. A first average deformationis then computed from all monomers in each subvolume.The information gained is associated with the geometricalcenter of the subvolume. In addition, statistics over severalindependent simulation runs is performed. Again, the keyassumption is that the average particle motion (computed asthe arithmetic mean) is amenable to a continuous field de-scription. When contour lines, e.g. of the total displacementfield, have to be computed, one better smears out steep gra-dients by use of a low pass filter (weighted average overnine neighbour points). In future work, it may be necessaryto use additional interpolation or approximation algorithmswhen it comes to the computation of derived quantities likethe deformation gradient field. Finally, in addition to the mo-tion of points, it may be of advantage to follow the motionof other geometric primitives (lines, surfaces, or subvolumesspanned by certain monomers) in order to characterize thedeformation process.
An analogous approach is used to compute stress fields.The expression for the particle interaction based stress ten-sor [11],
σαβ = − 1V
∑m
〈FmαRmβ〉 , (4)
is evaluated in subvolumesV , whereFmα is the force ontomonomerm into coordinate directionα, and Rmβ is the

516
0 2 4 6 8 10 12 14 16 18 20Time [ps]
−30
−25
−20
−15
−10
−5
0
5
10B
lade
Pos
ition
[Å]
=1.0nNexternal
Polymer chain length N=40Indentation force F
externalF
Fpolymer
Fig. 2. Indentation and free drift curves with chain length N=40 and inden-tation forceFexternal= 1.0 nN. During the indentation process, bothFexternalandFpolymer are different from zero. For the free drift simulations,Fexternalhas been set to zero
2 4 6 8 10Time [ps]
−20
−10
0
Bla
de P
ositi
on [Å
]
N=20, F=1.0 nNN=20, F=1.5 nNN=40, F=1.0 nNN=40, F=1.5 nNN=60, F=1.0 nNN=60, F=1.5 nNN=20, F=2.0 nNN=40, F=2.0 nNN=60, F=2.0 nN
Fig. 3. Tool indentation curves for chain lengthN = 20, 40, and 60, andindentation forcesFexternal of 1.0, 1.5, and 2.0 nN
β-component of the position vector of that monomer. Inpractice, we compute the contributions to the foregoing for-mula arising from interactions between pairs and triples ofmonomers. We then determine the common center of mass ofthe participating monomers and use this position to sort thecontribution into the subvolume bins. In the present study,we do not consider the question whether stresses are me-diated mainly by Lennard-Jones (or, in general, interchain)interactions or if the polymer backbone (intrachain interac-tions) plays the essential role.
According to the geometry of the blade indentation sim-ulation, one might first be tempted to describe the film de-formation asbending. We have suggested the term “poly-mer film bending” before [6]. However, “bending” is quitea technical term [12] in the classical theory of elasticity.The simplest theory deals with an idealized model of a can-tilever beam, the “Bernoulli beam”, which is characterizedby two assumptions, (1) that plane cross sections remainplane during the bending process, and (2) that cross sectionsremain perpendicular to the neutral axis of the beam. The
20 40 60Chain Length
650
700
750
800
850
900
950
1000
Effe
ctiv
e R
esis
tanc
e C
oeffi
cien
t [pN
/(Å
/ps)
] Fext = 1.0 nNFext = 1.5 nNFext = 2.0 nN
Fig. 4. Chain length dependence of the effective resistance coefficient. Theresult forN = 20 andFexternal = 1.0 nN is spoiled by finite chain lengtheffects and omitted from the plot
1.0 1.5 2.0External Indentation Force [nN]
650
750
850
950
Effe
ctiv
e R
esis
tanc
e C
oeffi
cien
t [pN
/(Å
/ps)
] Chain Length N = 20Chain Length N = 40Chain Length N = 60
Fig. 5. Force dependence of the effective resistance coefficient. The resultfor N = 20 andFexternal = 1.0 nN is spoiled by finite chain length effectsand omitted from the plot
neutral axis connects all the centers of cross section. Wedo of course not assume that our polymer film deforms likea purely elastic Bernoulli beam. But there are two generalsignatures of bending deformation which can be looked forin the simulation results, (1) some neutral axis or plane canbe identified which is characterized by zero strain, (2) theneutral axis separates regions of pressure and tension, i.e. toboth sides of the neutral plane in the polymer film we findstresses of opposite sign. In the simulations to be discussedhere, however, we could not identify these signatures. Thusthe film behaviour is not characterized by elastic bendingeffects.
Under the action of the load applied to the film,sheardeformation has to be expected, too. This is especially thecase since the polymer melt we simulate is quite liquid innature and can hardly withstand any shearing forces. How-ever, it will turn out that on the time scale accessible to oursimulations, the deformations are quite local and restrictedto the impact zone. This can be seen by computing charac-teristic invariants from deformation and stress fields which

517
20 40 60Chain Length
0.0
0.5
1.0
1.5
2.0
2.5
3.0
3.5
4.0
4.5
5.0
Rel
axat
ion
Tim
e [p
s]
6 8 10 12 14 16 18 20Time [ps]
−15
−10
−5
Bla
de P
ositi
on [Å
]
Blade Position
0
1
2
3
4
5
Interaction Energy [10
−21J]
Blade/Polymer Energy
Fig. 6. Relaxation times for different chain lengths. The data for the figureare: for N=20:τ = 3.52± 0.65 ps, for N=40:τ = 3.65± 0.74 ps, and forN=60: τ = 3.84± 0.69 ps
Fig. 7. Free drift dynamics of a single polymer configuration. Shown arethe blade position (left axis) and the tool/polymer interaction energy (rightaxis)
also allow to distinguish between the different types of de-formation. Doing so, we cannot identify extended shearingplanes.
3. Forced indentation and effective resistance coefficient
For each polymer chain length (N=20, 40, and 60), the rawdata for the tip movement during forced indentation and freedrift have been obtained as an average over five independentruns. Figure 2 shows the curves for blade position vs. timefor N=40 (“0” on the blade position axis indicates the po-sition of the film’s upper surface). At the very beginning,there is no appreciable interaction between the blade andthe film. According to the overdamped dynamics, the blademoves downward very quickly. These first 100 femtosec-onds are not properly resolved in the figure. The comparisonbetween theabsolute indentation depthsresulting from thisinitial phase for different chain lengths is problematic. Wefound an increase in depth going from N=20 to N=40, butfor N=60, the indentation is smaller again. We feel that toclarify this issue, more simulations with better time resolu-tion of the startup phase must be performed. It may wellbe that the missing unique trend in the present result is anartifact of some overshoot effect. The maximum indentationdepth after 10 picoseconds is of order 25A and should becompared to the film thickness of 75A.
However, with the exception of the very short startupphase, the indenter moves downwards with nearly constantvelocity. Referring to (3), this means that the reaction forceemerging from the polymer film,Fpolymer, is constant in time.This is a remarkable result, since the reaction force is thesum of all polymer/tool interactions, and due to indentation,an ever increasing area of the tool dips into the film. Wetherefore concentrated on the measurement of theindenta-tion velocityduring forced indentation.
Sample polymer configurations resulting from the inden-tation simulations were stored after 2, 4, 6, 8, and 10 pi-coseconds. These configurations were then used to start thesimulation program again, but with the external force ontothe tool set to zero. The tool is then pushed out of the film.
Table 3. Reaction forcesFpolymer in the polymer film (in pico Newton) forchanging indentation forceFexternal
Chain length 1.0 nN 1.5 nN 2.0 nN
20 984.49 1476.07 1970.2740 984.02 1478.64 1973.4260 985.41 1480.10 1975.85
Table 4. Effective resistance coefficients (in pN/(A/ps)) for changing in-dentation forceFexternal
Chain length 1.0 nN 1.5 nN 2.0 nN
20 729.93 707.55 766.2840 740.74 802.14 865.8060 819.67 857.14 966.18
Thesefree drift curves show the signature of a relaxationprocess and are further analyzed below.
The indentation curve in Fig. 2 corresponds to an ex-ternal force of 1.0 nano Newton. In Fig. 3 then, curves fordifferent chain length as well as for different external forcesare plotted. In order to compare their slope (i.e. the indenta-tion velocities) the curves have been shifted such that theyall pass through blade positionztool = 0 att = 2 picoseconds.In Table 2, the net forces onto the tool,
Fnet = Fexternal− Fpolymer, (5)
are compiled for different chain length and external drivingforcesFexternal. These quantities have been sampled duringthe simulation runs and can in turn be used to compute thereaction forceFpolymer in the polymer film as summarizedin Table 3. In Table 2 also the tool velocities calculatedaccording to (cf. (3)),
vtool = Fnet/ζ , (6)
and the tool velocities as determined from linear fits for thethe curves in Fig. 3 are given. The deviations of a few per-cent are attributed to numerical inaccuracies and cumulativeerrors during the data sampling.

518
0 50 100 1200
50
100
150
Hei
ght [
Å]
2 2 2
2
2
24 4
4
4
4
4
4
4
4
44
6
Indentation time 4 psIndentation force 2 nN
0 50 100 1200
50
100
150
2 2 2
2
2
2
4 4 4
4 4
4
4
4
4
4
4
4
4
4
4
4
6
6
6
6
8
Indentation time 6 psIndentation force 2 nN
0 50 100 1200
50
100
150
Width [Å]
Hei
ght [
Å]
2
2 2
2
2
2
4 4 4
4
4
4
44
4
6
6
6
66 6
6
6
6
6
6
6
6
6
8
8
8
8
10
10
Indentation time 8 psIndentation force 2 nN
0 50 100 1200
50
100
150
Width [Å]
2 2 2
2
2
2
4 4 4
4
4 4
4
6
6
6
6 6 6
6
6
66
6
6
688
8
8
8
8 8
8
8
8
10
10
10
10
12
12 14
Indentation time 10 psIndentation force 2 nN
Fig. 8. Isocontour lines (curve labels inA) of the total displacement field. The time sequence (snapshots after 4, 6, 8, and 10 ps) shows how the disturbancecaused by the indenter spreads out (indentation forceFexternal= 2.0 nN, chain length N=40)
Table 2. Tool net forcesFnet = Fexternal− Fpolymer and indentation velocitiesvtool. For each external force,the first column gives the mean net force onto the tool (in pico Newton) as measured in the simulation. Thesecond column is the estimated tool velocity, calculated with a friction coefficient ofζ = 11.56 pN/(A/ps)(which was used in our simulations). The third column is the actual indentation velocity as given by theslope of the linear fit to the indentation curves (both velocities inA/ps, where 1A/ps = 360 km/h)
Chain length Fexternal= 1.0 nN Fexternal= 1.5 nN Fexternal= 2.0 nN
20 -15.5086 -1.34 -1.30 -23.9275 -2.07 -2.12 -29.7333 -2.57 -2.6140 -15.9768 -1.38 -1.35 -21.3637 -1.85 -1.87 -26.5775 -2.30 -2.3160 -14.5866 -1.26 -1.22 -19.8963 -1.72 -1.75 -24.1507 -2.09 -2.07
In Table 4, theeffective resistance coefficients, definedas the external force necessary to reach a certain indentationvelocity,
ζeff = Fexternal/vtool , (7)
are given.We claim that this effective coefficient is an ap-propriate measure for a material’s resistivity against indenta-
tion. The effective resistance coefficient provides a dynamicalcharacteristic for the surface hardness.Figure 4 shows thedata from Table 4 plotted vs. the chain length. The effectiveresistance coefficient is a materials property, but not a mate-rials constant. This non-linear behavior can clearly be seenin Fig. 5, where the coefficient is plotted against the driv-

519
0 50 100 1200
50
100
150
Hei
ght [
Å]
0
150
300
450
600
750
Indentation time 0.8 psIndentation force 20 nN
0 50 100 1200
50
100
150
0
150
300
450
600
750
Indentation time 1.2 psIndentation force 20 nN
0 50 100 1200
50
100
150
Width [Å]
Hei
ght [
Å]
0
150
300
450
600
750
Indentation time 2.0 psIndentation force 20 nNIndentation time 1.6 psIndentation force 20 nN
0 50 100 1200
50
100
150
Width [Å]
0
150
300
450
600
750
Indentation time 2.0 psIndentation force 20 nN
Fig. 9. Local values of the von Mises equivalent stress during an indentation simulation. The external force onto the tool was 20 nano Newton. Thus theindentation process is faster than in the previous figure, and snapshots are shown after 0.8, 1.2, 1.6, and 2.0 picoseconds. The active zone of high elasticshear energy is confined to a “hot spot” just below the tip of the blade. The stress values are given in N/mm2
ing force,Fexternal. For higher external driving (and higherindentation velocity, cf. Tab. 2), the coefficient increases.
4. Free drift and characteristic relaxation times
For each chain length, five free drift curves (like the ones inFig. 2) were shifted in such a way that first data points aremapped to the origin of the coordinate system. It then turnsout that the shifted curves can be fitted to single functionsof the form
f (t) = A(1− exp(t/τ )) , (8)
since the relaxation timeτ shows no obvious dependence onthe indentation depth where the tool was released (i.e. after2, 4, 6, 8, or 10 picoseconds indentation time). For eachchain length, an average relaxation time has been computedwhich is plotted in Fig. 6.The time scaleτ is character-istic for the recovery phenomena in the amorphous polymer
film. The determination ofτ gives information about how fastnano-scale surface damages disappear.We observe a slightincrease of the relaxation time with the chain length.
Up to this point, the mean properties of free drift pro-cesses, as determined from averaging over a number of in-dependent simulation runs, have been discussed. A moredetailled picture can be obtained if one looks at the freedrift dynamics of asingle run. This is shown in Fig. 7 forchains with N=40. The external tool indentation force of ini-tially 1.0 nano Newton was set to zero after 6 picoseconds.The displacement of the tool from the polymer film is not acontinuous process but happens to be a sequence of discreteevents which show up as steps in the position curve andas sharp maxima in the tool/polymer interaction energy. Toidentify these elementary events and the underlying mecha-nism on the scale of monomers will be a demanding exercisein the three dimensional visualization of polymer configura-tions which we hope to accomplish in the near future.

520
0 50 100 1200
50
100
150
Hei
ght [
Å]
−150
0
150
300
450
600
Indentation time 0.4 psChain length N=20
0 50 100 1200
50
100
150
−150
0
150
300
450
600
Indentation time 1.2 psChain length N=20
0 50 100 1200
50
100
150
Width [Å]
Hei
ght [
Å]
−150
0
150
300
450
600
Indentation time 1.2 psChain length N=20
0 50 100 1200
50
100
150
Width [Å]
−150
0
150
300
450
600
Indentation time 2.0 psChain length N=20
Fig. 10. The field of total energy for the same indentation simulation as in the previous figure after 0.4, 1.2, 1.6, and 2.0 picoseconds. The energy scaleis J/cm3. The “hot spot” is again just below the tip of the indenter. The highest local energy values are reached in the initial phase of the indentationsimulation (upper left picture)
5. Local deformation, stress and energy fields
The foregoing analysis of the blade indentation simulationswas restricted toglobal properties. By this we mean thebehavior due to cumulative effects stemmig from all poly-mer chains in the film. The motion of the indenter certainlyreflects the interaction of large numbers of monomers. Inwhat follows, we want to take a closer look and presentlo-cal deformation, stress, and energy fields. These fields havebeen computed as subvolume averages from stored polymerconfiguration files.
5.1. Total displacement fields
We first turn to an invariant of the deformation field. Thedisplacement vector field is based on the motion of singlemonomers. Thescalar field of total displacementis definedas the length of the displacement vectors,
d(x, t) = |x(ξ, t) − ξ| . (9)
Hereξ is the reference position of each control volume at thebeginnig of the simulation andx(ξ, t) is the average positionat timet of all monomers initially in that volume. The fieldvalues have been plotted at the positionsx after deformation,not at the initial reference positionsξ. Figure 8 shows a timesequence of isocontour lines for the total displacement field.One clearly observes a spreading impact zone. On the otherhand, after 10 picoseconds, a certain part of the film is stillnot affected by the indentation process (enclosed by the 6Aline). Also note the region of enhanced displacement at thebottom of the film opposite to the indentation notch.
5.2. Equivalent stress according to von Mises
In the theory of plasticity, theequivalent stress accordingto von Misesis a criterion to identify regions where plasticflow will set in. From the cartesian components of the stress

521
tensor, the equivalent stress is computed as
σ2VM =
12
[(σxx − σyy)2 + (σyy − σzz)2 + (σzz − σxx)2
+6(σ2xy + σ2
yz + σ2zx)].
It is a measure for the elastic shear energy stored in the ma-terial. In regions where the von Mises stress exceeds somethreshold value, plastic deformation is predicted to occur.Figure 9 shows a grey scale plot of the von Mises stressduring an indentation simulation with quite a high externalforce,Fexternal = 20nN. Each picture in the figures has beenobtained as an average over five independent runs, but thestress signal is still quite noisy. However, the “hot spot” oflarge stress just below the tip of the indenter can clearly beidentified. We do not claim that classical plasticity theoryapplies to nano-scale polymer films. The von Mises stresshowever, is a usefull invariant of the microscopic stress ten-sor which allows to find active regions in a material evenon this small scale.
5.3. Total energy field
A third plot worth to look at is thetotal energy field. To com-pute it, all contributions to the Hamiltonian (1) are summedup in small subvolumes. The result for a fast indentationsimulation is shown in Fig. 10. Note the concentration ofhigh energy just after contact between indenter and polymerfilm. Later on, the region of raised energy is just a narrowstripe next to the indentation notch. For slow indentationsimulations, no appreciable local energy enhancements wereobserved at all.
The energy field also gives information about the extentof the surface region in the film. In the bulk, the total energymust be negative (bound state) due to the Lennard-Jonesinteractions which hold the film together, whereas at thesurfaces, the energy must be zero. As can be seen in thefigure, the region where the presence of a free surface is feltin the energy has a thickness of about 10A.
6. Conclusion and outlook
We have looked in some detail onto nanoindentation sim-ulations into amorphous polymer films. An effective resis-tance coefficient as a new dynamical measure for surfacehardness has been proposed. A characteristic time scale forthe dynamics of surface disturbances and damages has beenidentified by use of free drift simulations. Further studyis necessary to clarify the connection between indentationdepth and indentation force. An interesting perspective isalso to look at the free drift dynamics in detail (step dy-namics characterized by the built up of energy barriers).We furthermore presented first visualization of the local de-formation, stress, and energy fields. Animations of thesefields allow to observe the spreading of damages in thematerial (http://wwwcp.tphys.uni-heidelberg.de/). The two-dimensional results presented here can be generalized tothree dimensions, a first step being the use of a rotationalsymmetric indenter (in preparation [10]). An open questionis whether a closed formulation for the time evolution of
these fields (as in classical continuum mechanics) withoutrecourse to the underlying atomistic dynamics can be foundon the nano-scale.
This work is supported by the Bundesministerium fur Bildung und For-schung (BMBF) in the framework of the project “Computersimulation kom-plexer Materialien” under grant no. 03N8008D.
References
1. Frank, C.W. et al.: Science273, 912 (1996)2. Pethica, J.B., Oliver, W.C.: Phys. Scri.T19, 61 (1987); Oliver, W.C.,
Pharr, G.M., J. Mater. Res.7, 1564 (1992); Jarvis, S.P., Weihs, T.P.,Oral, A., Pethica, J.B. in P.H. Townsend (ed) Thin Films: Stresses andMechanical Properties IV, (Mater. Res. Soc. Proc.308, Pittsburgh, PA,1993), pp. 127–132
3. Doerner, M.F., Nix, W.D.: J. Mater. Res.1, 601 (1986); Weihs,T.P., Hong, S., Bravman, J.C., Nix, W.D., J. Mater. Res.5, 931(1988); Mater. Res. Symp. Proc.130, 87 (1989); Nix, W.D.: Met-all. Trans.20A, 2217 (1989); Vlassak, J.J., Nix, W.D., Phil. Mag.A67,1045 (1993); J. Mech. Phys. Solids42, 1223 (1994); Vinci, R.P., Vlas-sak, J.J.: Annu. Rev. Mater. Sci.26, 431 (1996)
4. Luedtke, W.D., Landman, U.: Comp. Mat. Sci.1, 1 (1992)5. Vanlandingham, M.R. et al.: Relating polymer indentation behavior to
elastic modulus using atomic force microscopy, contribution Ca9.13to the MRS 1996 fall meeting, December 2-6, Boston, Massachusetts(symposium Ca: structure and evolution of surfaces)
6. Patzold, G., Hapke, T., Linke, A., Heermann, D.W.: Thin SolidFilms 295, 199 (1997); Heermann, D.W., Linke, A., Patzold, G.,Hapke, T.: Deformation of polymer films by bending force, contri-bution Ca9.14 to the MRS 1996 fall meeting, December 2-6, Boston,Massachusetts (symposium Ca: structure and evolution of surfaces)(http://wwwcp.tphys.uni-heidelberg.de/~paetzold/)
7. Allen, M.P., Tildesley, D.J.: Computer Simulation of Liquids. Oxford:Clarendon Press 1987; Rigby, D., Roe, R.J.: J. Chem. Phys.87, 7285(1987); Th. Hapke: Simulation mikromechanischer Eigenschaften vonamorphen makromolekularen Glasern am Beispiel von Polyethylen,Diplomarbeit am Institut fur Theoretische Physik der Universitat Hei-delberg, 1995
8. Paul, W., Yoon, D.Y., Smith, G.D.: J. Chem. Phys.103, 1702 (1995)9. Hapke, T., Linke, A., Patzold, G., Heermann, D.W.: Surface Science
373, 109 (1997); Patzold, G., Heermann, D.W., Linke, A., Hapke, T.:Computer studies on free and confined amorphous polymer films, con-tribution FF1.4 to the MRS 1996 fall meeting, December 2-6, Boston,Massachusetts (symposium FF: dynamics in small confining systemsIV) (http://wwwcp.tphys.uni-heidelberg.de/~paetzold/)
10. Linke, A., Patzold, G., Hapke, T., Heermann, D.W. (unpublished)11. Bird, R.B., Armstrong, R.C., Hassager, O., Curtiss, C.F.: Dynamics of
Polymeric Liquids. New York: Wiley 1977; Doi, M., Edwards, S.F.:The Theory of Polymer Dynamics. Oxford: Clarendon Press 1986
12. Becker, E., Burger, W.: Kontinuumsmechanik. Stuttgart: Teubner-Verlag 1975
This article was processed by the author using the LaTEX style file pljour2from Springer-Verlag.
Related Documents


