Computational Advertising in Yelp Local Ads Soups Ranjan, PhD @soupsranjan [email protected] May 7 th , 2015

Welcome message from author
This document is posted to help you gain knowledge. Please leave a comment to let me know what you think about it! Share it to your friends and learn new things together.
Transcript

Computational Advertising in Yelp
Local Ads
Soups Ranjan, PhD @soupsranjan [email protected]
May 7th, 2015

Where do our local ads show?
m.yelp.com iOS, Android apps www

Yelp Advertisers
“89% of users who research a business on Yelp make a purchase at that business within a week” – Yelp Q4 2014 Investor Deck
• National as well as local businesses• Restaurants, Professional services (movers, gardeners, plumbers)
• Purchase many different ways: • Impression package on a CPM (Cost Per Impression) basis• Clicks on a CPC (Cost Per Click) basis• Leads on a PPC (Pay Per Call) basis

Uniqueness of Local Advertising - Location
• Users interest in a business reduces with distance
• Also varies by Category
CT
R
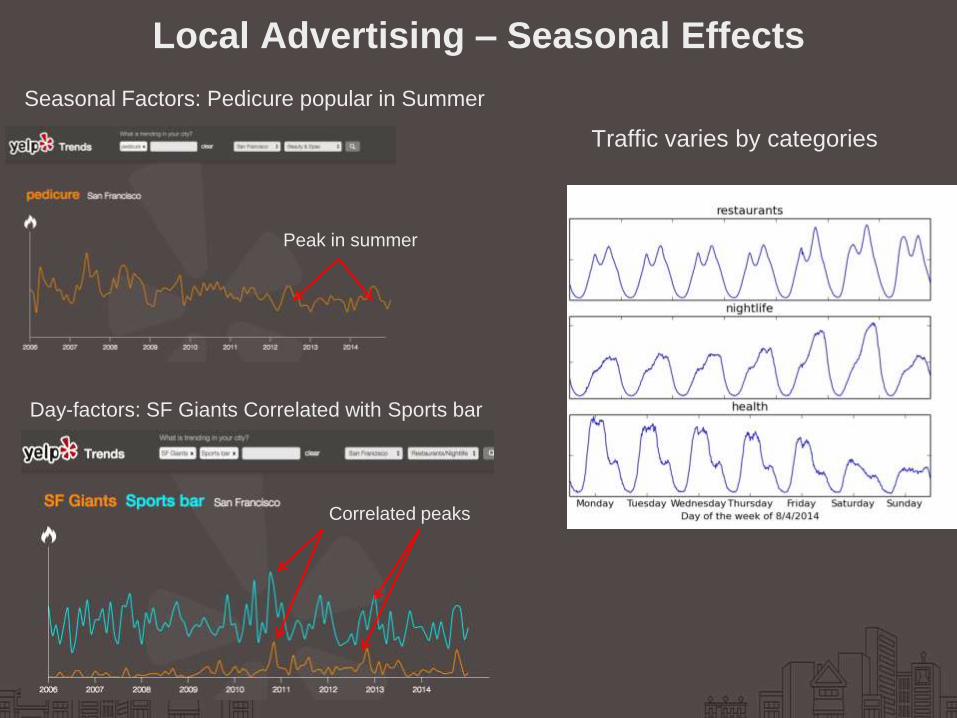
Local Advertising – Seasonal Effects
Seasonal Factors: Pedicure popular in Summer
Day-factors: SF Giants Correlated with Sports bar
Peak in summer
Correlated peaks
Traffic varies by categories

Uniqueness of Local Advertising - CategoriesKaraoke ads do well on Sushi & Japanese searches
CTR
Cate
gory
Sim
ilarity
- Sushi has low “category similarity” to Karaoke
- But Karaoke ads do well on Sushi searches!
Queries where we show karaoke ads

Uniqueness of Local Advertising - Budgets
- If budget for Chinese
advertisers “nearby” is
exhausted
- We may still show an ad
for a closely-related
category, e.g., Szechuan
CTR
Cate
gory
Sim
ilarity

Within the fraction of a second that we return you “search results” for bars, we also return an ad that optimizes:
I. Relevance for userII. Revenue for YelpIII. Advertiser Goal (budget, clicks and leads)
``Balancing all of the Stakeholders”

userPage-view Ad
user
user
Page-view
Page-view
Ad
Ad
Time
Advertising is a “Matching Problem”
Constraints: 1. Finite Users (Traffic)2. Finite Ad Budgets3. Don’t know future traffic
Optimize:1. Maximize Yelp Revenue2. Show user “most relevant” ad3. Fulfill Ad Budgets
Greedy strategy works well: - Via 2nd price auction, Select ad with highest expected revenue

Ad Lifecycle
1) Candidate Ad Selection
Blue Light, $100 budget
City Brewery, $200 budget
3) CTR Prediction
Click Probability for each ad
4) 2nd Price Auction
2) Auto BidderFind best Bid price
for each ad
If there’s a click, Blue Light pays: 8/0.10 = 80 cents
Ad Cost-per-
Click
(cent)
Expected
CTR:
P(click)
Expected
Revenue
= CPC *
CTR
Blue Light 100 cents 0.10 10 cents
City
Brewery
200 cents 0.04 8 cents

2nd Price Auction
• Winner pays the runner-up’s price.• Dominant Strategy: bid your true value
Ad Cost-per-
Click
(cents)
Expected
CTR: P(click)
Expected Revenue for
Impression = CPC *
CTR
Blue Light 100 cents 0.10 10 cents
City
Brewery
200 cents 0.04 8 cents
If there’s a click, Blue Light pays: cents 8/0.10 = 80 cents

1) Candidate Ad Selection
3) CTR Prediction
4) 2nd Price Auction
2) Auto Bidder

1) Candidate Ad Selection & FilteringElastic Search – Index Ads and Search over them quickly
Elastic
Search
Index
ES query All
Ads
Location &
Category
Filters
• All ads indexed by their geo-quad in Elastic Search
Elastic
Search
Index

1) Candidate Ad Selection
3) CTR Prediction
4) 2nd Price Auction
2) Auto Bidder

2) Auto-Bidding
• Sushi chef just wants to optimize: Sushi, Sashimi & Nori
• Doesn’t necessarily know how to optimize:• Cost Per Acquisition• Cost Per Click• Customer Lifetime Value (LTV)
• Solution: They just set their monthly budget, we maximize clicks for their budget

Can we bid for them?
for a given budget,
how many clicks fit
in that budget?

Can we bid for them?
given competition,
how many
auctions/clicks can
be won?

Yes, we can bid for them!
most possible clicks
given budget and
competition - that’s
the bid!
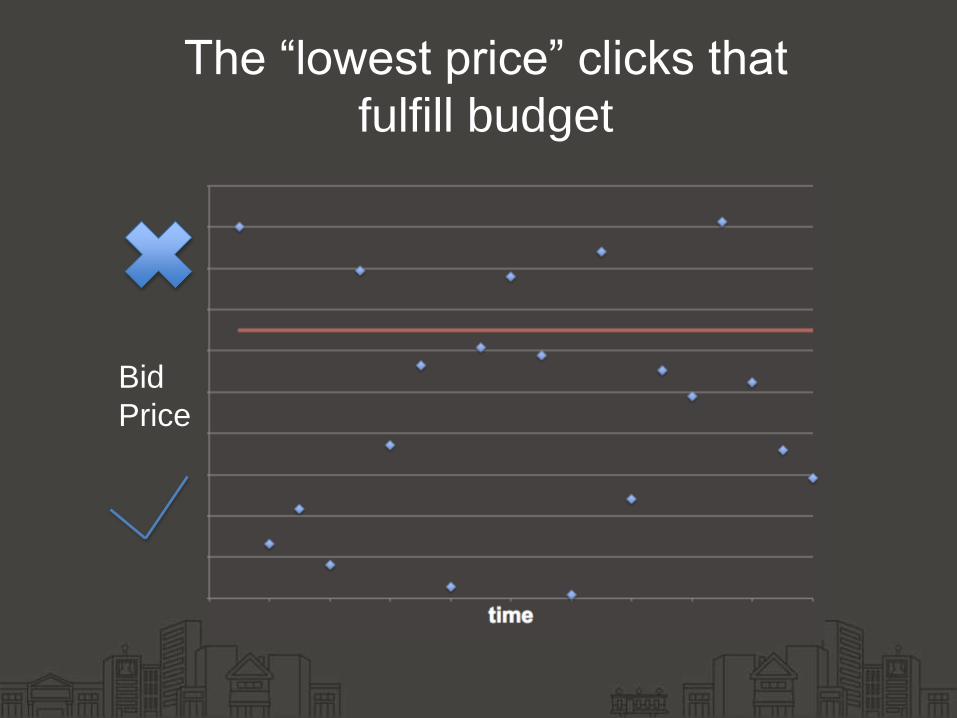
The “lowest price” clicks that
fulfill budget
Bid
Price

How do you find the intersection?
It’s easy to draw
this line…
y = budget / bid

How do you find the intersection?
It’s easy to draw
this line…
y = budget / bid
We can sample
this line based on
past auctions.

How do you find the intersection?
It’s easy to draw
this line…
y = budget / bid
We can sample
this line based on
past auctions.
Repeat for each advertiser,
assuming independence.

1) Candidate Ad Selection
3) CTR Prediction
4) 2nd Price Auction
2) Auto Bidder
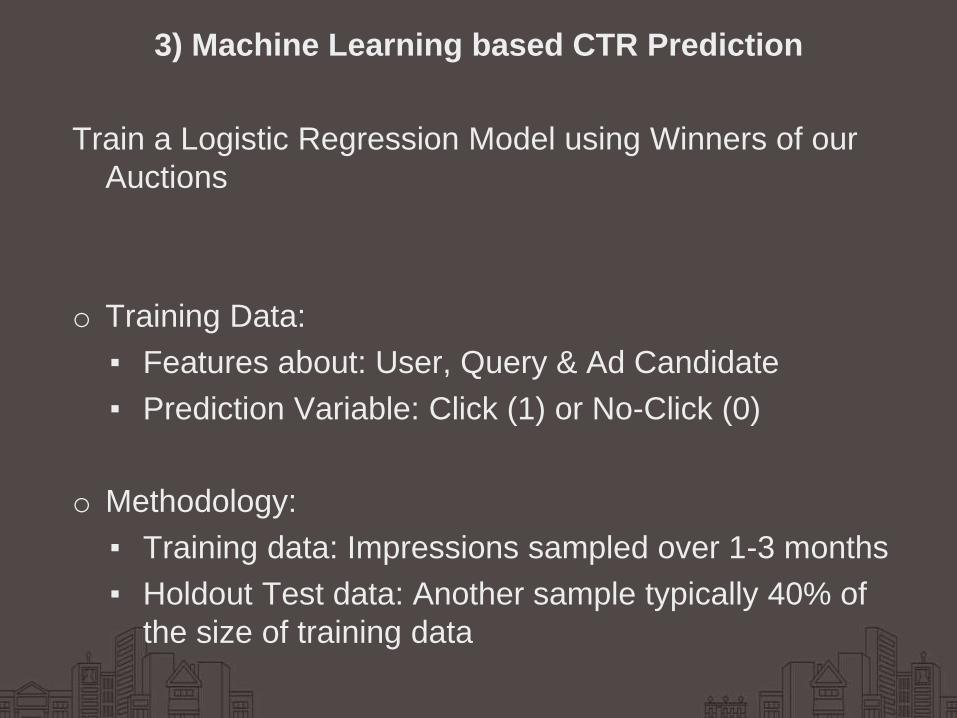
3) Machine Learning based CTR Prediction
Train a Logistic Regression Model using Winners of our
Auctions
o Training Data:
▪ Features about: User, Query & Ad Candidate
▪ Prediction Variable: Click (1) or No-Click (0)
o Methodology:
▪ Training data: Impressions sampled over 1-3 months
▪ Holdout Test data: Another sample typically 40% of
the size of training data
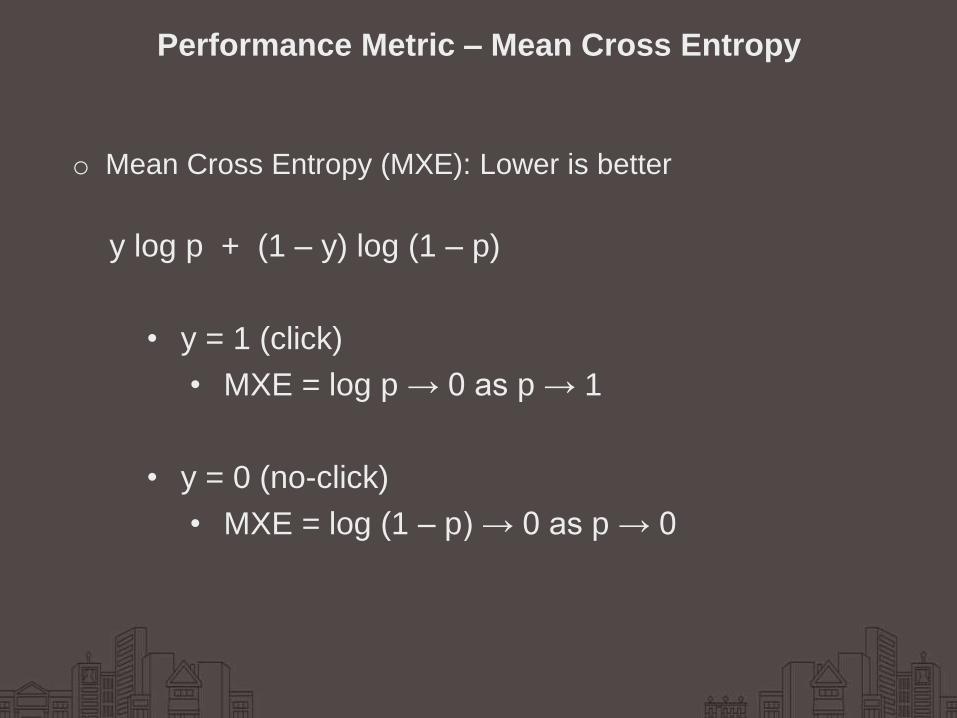
Performance Metric – Mean Cross Entropy
o Mean Cross Entropy (MXE): Lower is better
y log p + (1 – y) log (1 – p)
• y = 1 (click)
• MXE = log p → 0 as p → 1
• y = 0 (no-click)
• MXE = log (1 – p) → 0 as p → 0

query &ad
Feature 1
Feature 2
Feature n
Feature Extraction & Transformation
sparse vector
Data:- Historical CTR Table
Transforms
Transforms
- Standardization- Distance, Distance^2
Model
algorithm
pCTR
Feature Framework
Transforms

Feature Example
from ad_ctr_prediction.features.feature import Feature
from ad_ctr_prediction.features.feature import FeatureData
class BrandCampaignFeature(Feature):
name = ’brand_name_campaign'
def get_raw_feature(self, opportunity, candidate):
"""1.0 if brand advertiser, 0.0 otherwise""”
is_brand_name_campaign = 0.0
if candidate.is_brand_name_campaign:
is_brand_name_campaign = 1.0
return [FeatureData(value=is_brand_name_campaign)]
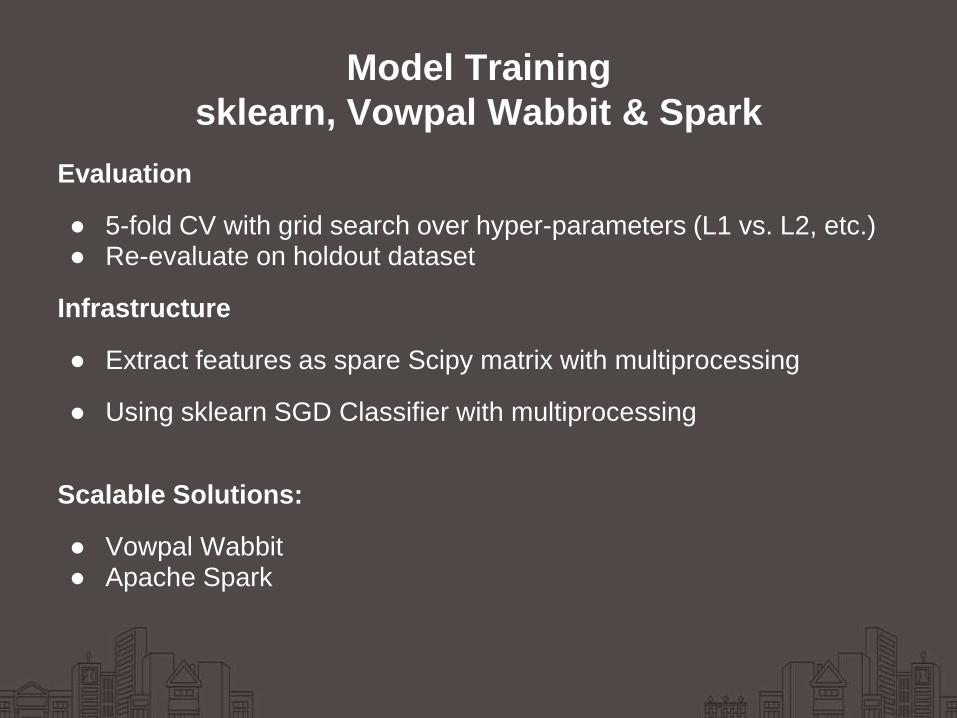
Evaluation
● 5-fold CV with grid search over hyper-parameters (L1 vs. L2, etc.)● Re-evaluate on holdout dataset
Infrastructure
● Extract features as spare Scipy matrix with multiprocessing
● Using sklearn SGD Classifier with multiprocessing
Scalable Solutions:
● Vowpal Wabbit● Apache Spark
Model Training
sklearn, Vowpal Wabbit & Spark

Scaling Grid Search
Feature Extraction
Grid
Search
Point
Grid
Search
Point
Grid
Search
Point
Grid
Search
Point
Grid
Search
Point
S3
Extraction
Batch
Training
Batch
Scalable
mrJob
VW or
Spark
mrJob
VW or
Spark

Past Shown Ads Click or
No-Click
(y)
pCTR MXE
Click (1) 0.99 Log(0.99)
No-Click
(0)
0.01 Log(1-0.01)
CTR Prediction Performance – Offline (or Training)
Offline MXE =
y log pCTR + (1 – y) log (1 – pCTR)
We train on only the
winners of each auction
Offline metric only measures how accurate our
pCTR values are for the winners

Ad Candidate for 1
Auction
pCTR Bid
0.99 10 cents
0.01 8 cents
CTR Prediction Performance – Online
Online MXE =
y log pCTR + (1 – y) log (1 – pCTR)
During Online scoring: model actually
evaluates every “candidate” for an auction
Need Online metric that can measure performance of all auction participants!
Online MXE will also only measure
performance for auction winners

Online Performance:
You can’t measure what you don’t see!
pCTR Threshold pCTR
Model 2
Model 1
Online MXE =
y log pCTR + (1 – y)
log (1 – pCTR)
- What about a model which moves all non-clicks to below the threshold?
- Online MXE doesn’t measure it!
What we measure:

Online Performance:
MXE vs. Calibration Metrics
Challenger Model: Worst by MXE but best by Calibration Metric
Status Quo: Best by MXE but worst by Calibration Metric
pCTR bins
pCTR bins
Imp
ress
ion
s
oC
TR-
pC
TRo
CTR
-p
CTR
Over-Prediction Errors:
oCTR < pCTR

• Accuracy Metrics:
• Mean Cross Entropy (MXE)
• Calibration Metrics
• Business Metrics:
• Revenue Per Opportunity (RPO)
Performance Metrics

• What’s a feature and what’s a model?
– Page Type: Model
– Advertiser Category: Feature
• We want to use same model to evaluate all ad
candidates
• As this performs better in terms of ad-pick latencies
• Training Frequency
– High seasonality in our data
CTR Prediction Challenges
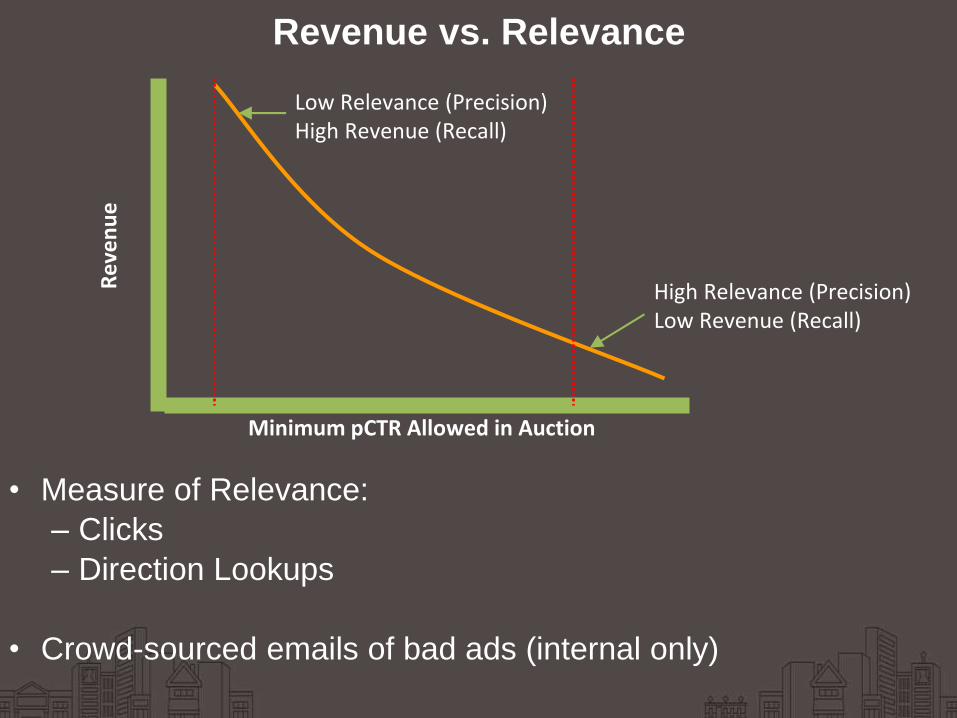
• Measure of Relevance:
– Clicks
– Direction Lookups
• Crowd-sourced emails of bad ads (internal only)
Revenue vs. Relevance
Re
ven
ue
Minimum pCTR Allowed in Auction
Low Relevance (Precision)High Revenue (Recall)
High Relevance (Precision)Low Revenue (Recall)

• Cost of a Feature:
– Training cost: Time to train
– Scoring cost: Time, CPU & Memory needed in Ad-Servers
– Cost increases with larger number of features
• Object creation, Garbage Collection, etc.
• Cost vs. Accuracy
– Convert every category in our Category Tree in to a Binary Feature
• Category:Japanese = 1
• Category:Korean = 0
– Convert: category feature to numerical via CTR translation
• CategoryCTR = <float>
Cost vs. Accuracy

• Exploit/Explore:
– Learn about “category pairs” we can expand into via
exploit/explore strategies
• Model Automation:
– How to measure whether model traffic changed?
Model Training

• Local Advertising has lot of unique challenges
• Yelp has several USPs for Local Business Advertisers:
– Yelp users have a strong “intent to buy”
– Yelp can “close the loop” for Local Business
Advertisers
Conclusions

All of Yelp data for 10 cities:● 61K businesses● 61K checkin-sets● 481K business
attributes
Your academic project, research or visualizations. Submitted by June 30, 2015.
● 1.6M reviews● 366K users● 2.8M edge social-graph● 495K tips
yelp.com/dataset_challenge

Yelp Dataset Challenge:● Round 4: 60+ submissions
Good Food Bad Service - Stanford
(Stanford)
UCSD Data Science Club

Infer Home Prices from Yelp Reviews - Montreal
Yackathons!

“Keeping it Fresh” (drivendata.org)

Related Documents


![Discovering Yelp Elites: Reifying Yelp Elite Selection Criterion · 2018-02-05 · A. Yelp Challenge Dataset We obtain the dataset from the Yelp Dataset Challenge [4] which includes](https://static.cupdf.com/doc/110x72/5f23397707fa8e71780e4974/discovering-yelp-elites-reifying-yelp-elite-selection-criterion-2018-02-05-a.jpg)