NASA Contractor Report 198285 / Compression Testing of Textile Composite Materials John E. Masters Lockheed Martin Engineering and Sciences Company, Hampton, Virginia Contract NAS1-19000 February 1996 National Aeronautics and Space Administration Langley Research Center Hampton, Virginia 23681-0001 https://ntrs.nasa.gov/search.jsp?R=19960015568 2018-05-10T11:57:47+00:00Z

Welcome message from author
This document is posted to help you gain knowledge. Please leave a comment to let me know what you think about it! Share it to your friends and learn new things together.
Transcript

NASA Contractor Report 198285
/
Compression Testing of TextileComposite Materials
John E. Masters
Lockheed Martin Engineering and Sciences Company, Hampton, Virginia
Contract NAS1-19000
February 1996
National Aeronautics and
Space AdministrationLangley Research CenterHampton, Virginia 23681-0001
https://ntrs.nasa.gov/search.jsp?R=19960015568 2018-05-10T11:57:47+00:00Z


Abstract:
The utilization of textile processes such as braiding, weaving,and knitting in the manufacture of composite materials has long been
proposed as a means of improving mechanical performance and ofreducing cost. However, along with the potential advantages of
improved impact and delamination resistance, these new materialforms also bring with them new challenges in design and
manufacturing.
The applicability of existing test methods, which weredeveloped primarily for laminates made of unidirectional prepregtape, to textile composites is one area of concern. The issue iswhether the values measured for the 2-D and 3-D braided, woven,stitched, and knit materials are accurate representations of the true
material response.
This report provides a review of efforts to establish acompression test method for textile reinforced composite materials.Experimental data have been gathered from several sources andevaluated to assess the effectiveness of a variety of test methods.The effectiveness of the individual test methods to measure the
material's modulus and strength is determined. Data are presentedfor 2-D triaxial braided, 3-D woven, and stitched graphite/epoxymaterial. However, the determination of a recommended test
method and specimen dimensions is based, primarily, onexperimental results obtained by the Boeing Defense and SpaceGroup for 2-D triaxially braided materials.


Introduction
Textile composite materials have been extensively evaluated in
NASA's Advanced Composite Technology (ACT) Program, which was
initiated in 1990 to develop less-costly composite aircraft structures.
Composite laminates reinforced with continuous networks of braided,
woven, knit, or stitched fibers have all been tested as a part of the
program. These test results established the viability of textile
composite materials as potential alternatives to unidirectional
prepreg tape.
These new composite material forms bring with them potential
testing problems. The test methods currently used to evaluate
composite materials were developed for composite materials made of
unidirectional prepreg tape or simple 2-D woven fabrics. The
microstructure of these laminated composite materials differs
significantly from the architectures of the braided, woven, knit, m_d
stitched materials under investigation. Consequently, the
applicability of the current test methods to the wide range of
emerging materials bears investigation. The overriding concern is
that the values measured are accurate representations of the true
material response.
Fiber architecture plays a prime role in determining the
mechanical response of textile composite materials. Inhomogeneous
local displacement fields develop within the textile specimens, even
under uniform axial extension (Ref. 1), as a result of the
interweaving and interlacing of the yarn bundles. This is not seen in
laminates formed of unidirectional tape materials. Specimen
dimensions and loading methods developed for tape type composites
may, therefore, not be applicable to textile composites.
A program to establish a set of test methods to evaluate textile
composites was developed to address these issues. This report
provides a review of a portion of that work, the effort to establish a
compression test method for unnotched textile reinforced compositematerials.
Information was gathered from a variety of sources and
analyzed to establish the recommended test method. The current
practices established by ASTM and the MIL-HDBK-17 Committee for
laminated composite materials were considered. Test data developed
3

by Boeing Defense and Space (Ref. 2) under contract to NASA was theprimary source of information on compression test methoddevelopment for textile composites. In addition, LockheedAeronautical Systems Company conducted an extensive materialsevaluation program on braided and woven textile systems. The testpractice employed there and the data developed on that programwere also evaluated.
The following sections include descriptions of the materialsinvestigated and the test methods considered. This is followed by adiscussion of the experimental results and, finally, by a summarysection that identifies a recommended test method.
4

Materials Investigated
Boeing evaluated three textile forms in their test program: 2-D
triaxial braids, through-the-thickness weaves, and stitched uniwoven
laminates. All the specimens tested in their program featured
Hercules' AS-4 graphite fibers and Shell's RSL-1895 epoxy resin.
The Lockheed test program included both 2-D and 3-D braided
textiles and 3-D woven systems. The material tested in this program
were made of Hercules' AS-4 graphite fibers impregnated with PR-
500 epoxy resin.
Braided Material
2-D Triaxial Braids
Specimens featuring 2-D triaxially braided fibrous preforms
were evaluated by both Boeing and Lockheed. Figure 1
schematically illustrates a triaxial braid architecture and establishes
the nomenclature used in the paper. As the figure indicates, three
yarns are intertwined to form a single layer of 0°/ _+ O ° material in
this braiding scheme. In the example shown here, the braided yarns
are intertwined in a 2 by 2 pattern. Each + O yarn crosses
alternatively over and under two - O yarns and vice verse. The 0 °
yarns were inserted between the braided yarns. This yields a two-
dimensional material; there is no through-the-thickness
reinforcement.
The figure shows a repeatable unit of the braid architecturethat is sometimes referred to as the braid's natural unit cell. A unit
cell is a repeatable unit of fabric geometry. It represents the
complete yarn or tow intertwinement pattern. It is desirable, for
analysis purposes, to define the smallest unit cell possible.
Rectangular unit cells are also preferable. The box outlined withinthe rhombic unit cell defines the smallest unit cell for a triaxial braid.
5

Braidangle
loading
direltion
mmm
Unit Cell
Axial
yarns Transverse_loading
direction
Braider
yarns
Figure 1. 2-D Triaxial Braid.
A shorthand notation, similar to the practice used to define the
stacking sequence of laminates formed of unidirectional prepreg
tape, has been developed to define the braid architecture. The
proposed notation is
6

[0 ° xk / + 0 ° yk] N% Axial
where: 0 indicates the braid angle,
x indicates the number of fibers in the axial yarn bundles,
y indicates the number of fibers in the braided yarn
bundles,
k indicates thousands, and
N indicates the percentage by volume of axial yarns in the
preform
This notation will be employed throughout the report when referring
to the test results obtained for braided materials.
Boeing evaluated four 2-D triaxial braid architectures in their
test program. The nominal braid configurations are summarized in
Table I. Two specimen thicknesses, 0,125 inches and 0.250 inches,
were evaluated in the program. The number of layers in each panel
is listed in the table along with the unit cell dimensions,
Table I. 2 - D Triaxial Braid Configurations Investigated by Boeing.
Braid Configuration Number of Layers Unit Cell Size(inch)
(0.125 in.) (0.250 in.) height x width
[0 30k / +70 6k] 46% Axial
[0 75k 1+70 15k] 46% Axial
[0 36k /+45 15k] 46% Axial
[0 6k/+45 15k] 12% Axial
4 8 .083 x.458
3 6 .150 x.829
3 6 .207x.414
5 10 .207 x.414
Note: [0 75k/+ 7015k] 46% Axial materials were braided with 72 braider and36 axial yarns. The others had 144 braider and 72 axial yams.
Lockheed evaluated two 2-D triaxial braid architectures in
their test program. These specimens had the following braid
configurations: [012k/_+606k] 33% Axial and [024k/+606k] 50%
Axial. All 2-D braid compression specimens tested at Lockheed had a
nominal thickness of 0.12 inch. The unit cell dimensions of these
architectures were not available.
7

3-D Braids
Lockheed also tested two 3-D braided materials in compression.Their nominal braid configurations were: [024k/_+606k] 50% Axial
and [018k/+606k] 5696 Axial.
The 3-D braid systems, like their 2-D counterparts, featurethree yarn systems that are intertwined to form a fibrous preform.However, unlike the braids discussed earlier, the yarns move alongthe z axis to provide through-the-thickness reinforcement.
Woven Material
Weaving, unlike braiding, forms a preform by introducingyarns in two orthogonal directions, the warp (0 °) and the fill (90 °)directions. A fabric is formed in this process by interlacing orselectively inserting fill yarns into the warp yarn system. Theindividual layers of the woven material tested in this program wereformed in this manner. However, unlike traditional woven materials,
these specimens also featured graphite yarns woven through thethickness of the panel. These interlocking yarns ran parallel to the0 ° warp yarns and wrapped around the 90 ° weft yarns thus forminga true three-dimensional material.
Three interlocking configurations, through-the-thickness
orthogonal interlock, through-the-thickness angle interlock, and alayer-to-layer interlock, were investigated by both Boeing and
Lockheed. These three configurations are shown schematically inFigure 2.
Through-the-Thickness Through-the-Thickness Layer-to-Layer InterlockOrtho@onal Interlock Angle Interlock
Figure 2. General Schematic of the Three 3-D Weave Types.
8

The woven systems tested at Boeing are defined in Table II.
The table lists the sizes of the yarns used in the warp, fill, and the
through-the-thickness directions plus the number of layers in each
laminate. As the data indicate, two yarn sizes were investigated for
each of the three weave patterns studied.
Table III defines the 3-D woven systems evaluated at
Lockheed. The sizes of the yarns used in the warp, fill, and the
through-the-thickness directions are listed in the table. A
comparison of Tables II and III indicates that two weaves were
common to each test program. Boeing's TS-2 angle interlock weave is
identical to the TTT-1 system tested at Lockheed. The LS-2 and the
LTL-2 layer-to-layer angle interlock systems are also quite similar.
The former has a slightly higher warp yarn content (56%) than r_he
latter (46%).
Table II. Weave Configurations Investigated by Boeing.
Weave
Type
OrthogonalInterlock
OrthogonalInterlock
AngleInterlock
AngleInterlock
Layer-to-LayerAngle Interlock
Layer-to-LayerAngle Interlock
Weave Warp No. of Fill Yarn No. of InterlockCode Yarn Warp Size Fill Yarn Size
Size Layers Layers
OS - 1 24k 4 12k (34%) 5 6k (7%)(59%)
OS - 2 12k 6 6k (31%) 7 3k (11%)(58%)
TS - 1 24k 4 12k (33%) 5 6k (10%)(57%)
TS - 2 12k 6 6k (38%) 7 3k (6%)
(56%)
LS - 1 24k 4 12k (35%) 5 6k (7%)
(59%)
LS - 2 12k 6 6k (39%) 7 3k (5%)(56%)
Note: Numbers in parenthesis indicate yarn content as a percentage of total yarn content.
lk T300 yams were used to interlock the fill yarns on the surface of the Layer-to-Layer Angle Interlock material.
9

Table III. Weave Configurations Investigated by Lockheed.
Weave
Type
AngleInterlock
Layer-to-LayerAngle Interlock
Layer-to-LayerAngle Interlock
Weave Warp No. of Fill No. of InterlockCode Yarn Warp Yarn Fill Yarn Size
Size La_,ers Size Layers
TIT- 1 12k n/a 6k (38%) n/a 3k (6%)(56%)
LTL - 1 6k (46%) n/a 6k (46%) n/a 3k (8%)
LTL - 2 12k n/a 6k (46%) n/a 3k (8%)(46%)
Note: Numbers in parenthesis indicate yarn content as a percentage of total yarn content.
lk T300 yarns were used to interlock the f'fll yarns on the surface of the Layer-to-Layer Angle Interlock material.
Stitched Material
Figure 3 schematically illustrates a stitched fibrous preformand defines the stitching nomenclature. Boeing tested five stitchedmaterial systems; they are listed in Table IV. Four stitch parameters,stitching yarn, yarn size, stitch spacing, and stitch pitch, were variedin the study.
All the stitched laminates tested were 48-ply thick. Theyfeatured a quasi-isotropic [+45/0/-45/90] 6s stacking sequence.
They were fabricated of an AS4 tmiweave fabric that featured a lightE-Glass fill yarn (8 fill yarns per inch).
10

0° Direction
IIIIIIIIIIII
IIIIIIIIIIIII
IIIIIIIIIIIII
IIIIIIIIIIIII
fllllllllllll
fllllllllllll
fllllllllllll
IIIIIIII
Stitch Pitch
_ _ Row Spacing
Figure 3.
Stitch Fibers
Stitched Laminate Geometry and Nomenclature.
Table IV.
MaterialDesignation
SU- 1
SU- 2
SU- 3
SU- 4
SU- 5
Stitched Laminate Configurations Investigated by Boeing.
Stitch Material Stitch Pitch Stitch Spacing Stitch Tow Size(stitch/in.) (in)
$2 Glass 8 0.125 3k
$2 Glass 8 0.125 6k
Kevlar 29 8 0.125 6k
Kevlar 29 4 0.250 6k
Kevlar 29 8 0.125 12k
11

Test Methods
As Whitney et. al. noted (Ref. 3), compression strength isperhaps the most difficult of the intrinsic composite materialproperties to measure. This difficulty is due to the material's strongtendency for premature failure under compression loading. Evenslight geometric variations can result in eccentricity of the appliedload, thereby, enhancing the opportunity for failure due to geometricinstability. Local crushing of the specimen ends, or end brooming, isa second potential source of premature failure. A variety of rathercomplex loading fixtures and specimen configurations have beendeveloped to address these two premature failure modes.
Compression test methods have been classified into three broadcategories by Daniel and Ishai (Ref. 4). The first category (Type I)features specimens with short unsupported gage lengths. Relativelylong, fully supported specimens are used in the second (Type II)category of test methods. Test fixtures provide contact support overthe specimen's entire gage length to prevent bucking in these tests.The composite laminate is bonded to a honeycomb core to provide therequired lateral support in the third (Type III) category ofcompression test methods. Sandwich specimens can be tested in directedgewise compression or in pure bending. Examples of all threecategories of methods can be found in the literature. Representativesof each were considered for use on textile composites.
American Society for Testing and Materials Test Methods
The American Society for Testing and Materials (ASTM) liststwo test methods to determine the compressive properties of
composite materials: D5467, Standard Test Method for CompressiveProperties of Polymer Matrix Composite Materials Using a SandwichBeam and D3410/D3410M-94, Standard Test Method for
Compressive Properties of Polymer Matrix Composite Materials withUnsupported Gage Section by Shear Loading. A third test method,D695, originally developed for rigid, un-reinforced plastics, has beenextensively modified and is often used on composite materials. Ithas become known as the Modified D695 Method (Ref. 5). These test
methods were developed for composites fabricated of unidirectional
prepreg tape and simple woven fabrics. They are the only methodsthat have gained broad national acceptance; they have beenendorsed by the MIL-HDBK-17 Committee.
12

The three ASTM test methods differ primarily in the manner inwhich load is introduced into the specimen. In method D 5467 ahoneycomb core sandwich beam with a thin composite skin is loadedin four point bending at its two quarter-span points. This subjectsthe top skin to nearly uniform compression loading. Load istransferred into the unsupported composite specimen through shearloading in method D 3410. Two test procedures, each with its owntest specimen geometry and loading fixture, are identified in themethod. Although load is transmitted to the specimen throughtapered wedge grips in both procedures, the wedges are conical inone case and rectangular in the other. Compressive load istransmitted to the composite specimen by end-loading in the D 695test method.
The specimen geometries also differ markedly from method tomethod. The sandwich flexure specimen used in D 5467 consists of ahoneycomb core with a composite skin or facing sheet bonded on thetop (compressive) side and a metal sheet bonded on the bottom(tensile) side. The overall beam is 22 inches long and 1 inch wide.The honeycomb core is 1.5 inch deep; and the thickness of thecomposite and metal faces are adjusted to ensure compressive failurein the top face.
Both test procedures defined in Method D 3410 feature a flat
strip of composite material having a constant rectangular cross-section. The specimens' dimensions differ, however. Procedure A
requires a 0.25 inch wide, 5.5 inch long specimen with a 0.5 inch testsection. In contrast to Procedure A, D 3410 permits a degree of
flexibility in the choice of Procedure B specimen dimensions.Specimen widths and gage lengths may vary from 0.5 to 1.0 inch inthis case. A table of required minimum specimen thickness isprovided for both procedures to ensure that column buckling doesnot occur in the specimen's unsupported test section. The valueslisted are determined by applying the Euler buckling equation
assuming pinned-end conditions. Minimum specimen thicknessesare expressed in tabular form as a function of the expected modulusand compression strength in the direction of load application.Although recommended tab dimensions are provided in the testmethod, they are not required. The test method states that there isno reason to change a given gripping method if acceptable failuremodes occur with reasonable frequency.
13

The specimen used in the Modified D 695 test is also sn-aight-sided. It incorporates end tabs that are adhesively bonded to thespecimen to increase the bearing area. The specimen is constrainedfrom buckling by sandwiching it between lateral supports that arelightly bolted together. These test specimens are 0.5 inch wide andhave an unsupported test section of 0.188 inch. Specimen thicknessis set at a nominal 0.040 inch for tape laminates and 0.120 inch forwoven fabric laminates.
Test Methods Investigated at Boeing
Boeing evaluated seven compression test configurations. Allthree of the general test method categories discussed above wererepresented in the test methods investigated.
Two of the methods investigated featured test specimens withthe short unsupported test sections typical of the Type I category oftest methods. The first specimen, which is commonly referred to asthe NASA Short Block Specimen (Ref. 6), is shown in Figure 4. Thesecond specimen, which bears a close resemblance to the specimenused in Procedure B of ASTM D 3410, is illustrated in Figure 5.Boeing referred to this specimen as a Modified IITRI specimen indeference to the work performed at the Illinois Institute ofTechnology Research Institute (Ref. 7) that served as the commonbasis for both this specimen and the one defined in D3410. As thefigures illustrate, Boeing chose to use identical test sectiondimensions for the NASA Short Block and Modified IITRI specimens.
All Short Block specimens tested at Boeing were 0.250 inch thick.With the exception of one set of 2-D triaxiaUy braided coupons, aUModified IITRI specimens tested were also 0.250 inch thick.
ln th!ilq]iE 0fiiiii!iiliiii!
Figure 4. NASA Short Block Specimen and Test Fixture.14

- 0.075" Fiberglass Tab
Figure 5. Modified I1TRI Test Specimen.
Although both specimens featured short unsupported test
sections, the methods of load transfer to the specimens differed. The
Short Block specimen is end-loaded; load is transferred to the tabbed
Modified IITRI specimen through shear. However, unlike the ASTM
method, which uses mechanical wedge grips to transfer load to the
specimen, Boeing's Modified IITRI specimen was tested in hydraulic
grips.
The method of load introduction and the clamping conditions
are the only differences in these two test methods since the two
specimens' test section dimensions are identical. As the figures
indicate, the loaded edges of the NASA Short Block specimen are
clamped over 0.30 inch; the Modified IITRI coupon is clamped over a
much larger area. In addition, the Modified IITRI specimen is
clamped more rigidly than the NASA Short Block specimen.
The majority of test methods evaluated at Boeing fell into the
Type II category since they featured specimens with relatively long
test sections that were full or partially supported over their entire
gage length to prevent bucking. Two of the test methods evaluated
used the 1.5 inch wide, 12.0 inch long specimens shown in Figure 6.
In both cases the specimens were sandwiched between lightly bolted
lateral supports. The first of these methods is referred to as the
Boeing OHC Test in Ref. 2 because it used a test fixture developed for
open hole compression (OHC) testing. The fLxture, which is shown in
Figure 7, is used in the Suppliers of Advanced Composite MaterialAssociation's (SACMA) Recommended Test Method SRM 3R-94 (Ref.
8) and is being evaluated by ASTM. It provides contact support over
the entire surface of the specimen except for a 1.0 inch long, 0.65
inch wide cut-out section. Load is transferred to the specimen by
end-loading in this test.
15

Figure 6. Specimen Used in the Boeing OHC and Zabora Tests.
I
V
1
=rot
¢-
E ......
¢D
L_
i
iiiii
iii
Figure 7. Boeing OHC Test Fixture.
12. w
r
The second method featured a similar test fixture but it
supported the specimen in a different manner. In this case thespecimen was given contact support along its entire length but onlyat the edges. As the drawing in Figure 8 indicates, a shallow step ismachined into the two halves of the test fixture to leave the central
0.80 inch wide section unsupported. In addition, a 3.0 inch long 0.80inch wide section of the fixture is cut out of the fixture altogether.
The test fixture is referred to as the Zabora Fixture in Boeing's reportsince it was designed by Ron Zabora of Boeing Commercial AirplanesCo. The load is transferred into the composite specimen throughshear loading in the Zabora Fixture.
16

The Boeing OHC and the Zabora Fixtures permit the evaluationof relatively thin specimens since they support the specimens alongtheir entire length. Boeing tested only 0.125 inch thick specimens inthese test fixtures.
TI::I
, ,:°1I I I 1
I I I I! I I I
7.s-o i I,,O
I I I
I I II I I
O i tiO
'@
.0T'
3.0"
Figure 8. Zabora Test Fixture.
Boeing evaluated two additional test methods that also fit into
the Type II compression test category. These test methods werereferred to as the Boeing CAI Test and the NASA ST-4 Test in Ref. 2.The first method, which was developed by Boeing CommercialAirplanes Co., featured a test specimen and test fixture that have
been used previously in compression after impact (CAI) tests. Likethe Boeing OHC Test, it has been adopted by SACMA (Ref. 9) and is
under evaluation by ASTM (as a CAI test, not as a compression test).The NASA ST-4 Test was initially developed for open hole
compression testing (Ref. 10).
These two test methods differed only in the sizes of thespecimens tested. The Boeing CAI test used a 4.0 inch wide, 6.0 inch
long specimen; the NASA ST-4 specimen measured 5.0 inch by 10.0
17

inch. All Boeing CAI and NASA ST-4 specimens tested had a nominalthickness of 0.250 inch.
The specimens are end loaded in both cases. Their loadingedges are clamped; their sides are simply supported between railsthat are snug but not tight (Figure 9).
5" NASA ST-4, I4" Boeing CAI I
Clamped
10" NASA ST-4,6" Boeing CAI
Figure 9. Boeing CA/and NASA ST-4 Test Fixtures.
The seventh test method evaluated at Boeing featured theSandwich Column Test specimen shown in Figure 10. These tabbedcoupons were clamped into a test fixture and end loaded. A shallow10 ° bevel was machined into the specimen ends to match the
specimen ends to the test fixture that is also shown in the figure.
18

Nomex Honeycomb Core
Composite Facesheet
1/16" Fiberglass Tabs
Aluminum Honeycomb Core
Figure 10. Sandwich Column Test Specimen and Fixture.
Test Method Used by Lockheed Aeronautical Systems Co.
The test method Lockheed employed in its textile materials
evaluation program featured relatively long test specimens that were
supported along their entire gage length (a Type II test). A test
fixture identical to the Zabora Fixture was used to prevent buckling.
Two specimen geometries were used in these tests. Lockheed
distinguished between hard materials, which contained greater than
25% axial yarns, and soft materials, which have an axial yarn content
of 25% or less. The large, 1.5 inch wide, 12.0 inch long, specimens
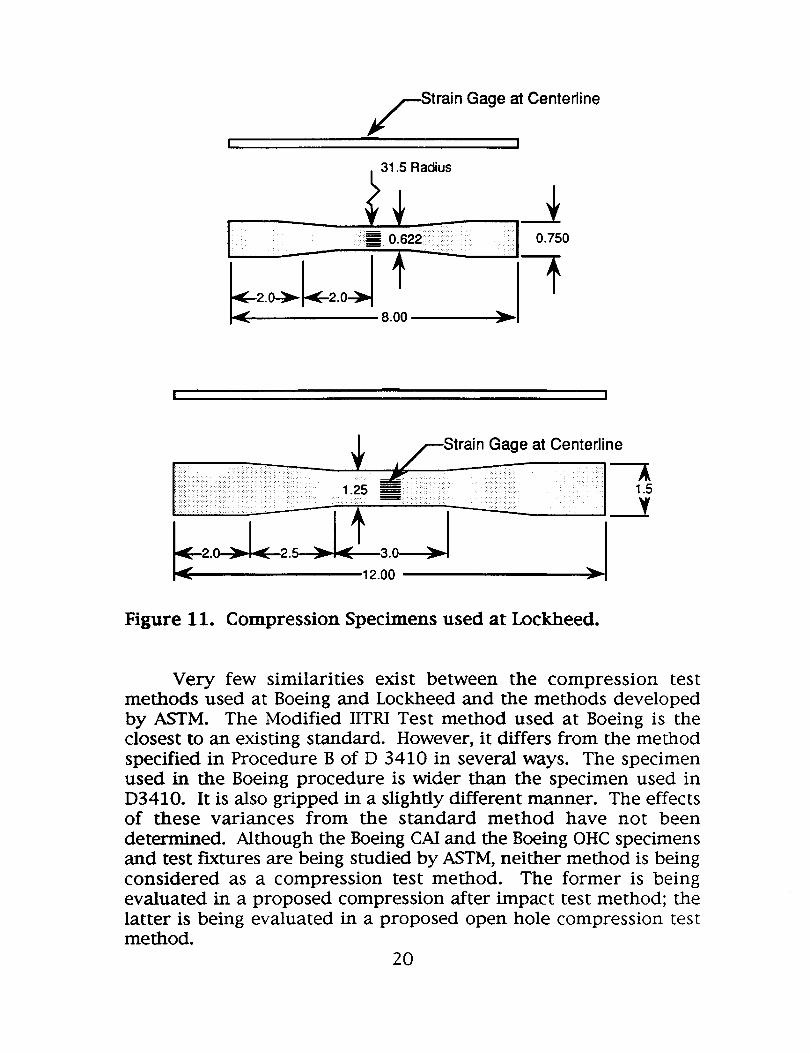
shown in Figure 11 were used for the soft materials. The smaller,
0.75 inch x 8.0 inch. specimens shown in the figure were used for the
hard materials. All the results listed in this report were obtained
from specimens with a 0.120 inch nominal thickness. As the figure
indicates, Lockheed, unlike Boeing, used tapered specimens in their
compression tests.
19
train
Gage at Centerline
8.00
_31 i Radius
0.622:
r
0.750
I !
_---Strain Gage at Center.line
1,251.5
'_._ 12.00 ..-_'_
Figure 11. Compression Specimens used at Lockheed.
Very few similarities exist between the compression testmethods used at Boeing and Lockheed and the methods developed
by ASTM. The Modified IITRI Test method used at Boeing is theclosest to an existing standard. However, it differs from the method
specified in Procedure B of D 3410 in several ways. The specimenused in the Boeing procedure is wider than the specimen used inD3410. It is also gripped in a slightly different manner. The effectsof these variances from the standard method have not been
determined. Although the Boeing CAI and the Boeing OHC specimensand test fixtures are being studied by ASTM, neither method is being
considered as a compression test method. The former is beingevaluated in a proposed compression after impact test method; the
latter is being evaluated in a proposed open hole compression testmethod.
20
Instrumentation and Data Reduction
Plate-to-plate variations in the fiber volume fractionnecessitated the use of a normalization practice to facilitate datacomparison. When dealing with tape or fabric laminates, Boeingtypically determines a normalized thickness corresponding to a givenfiber volume. This thickness is kept constant for all calculations.They used a similar approach in this investigation.
They first experimentally measured each panel's fiber volumefraction and thickness. The mean thickness and fiber volume werethen determined across all panels of a given material. The thicknesscorresponding to a 60% volume fraction was then calculated for eachmaterial. These values were used to calculate all stresses and modulifor that material form. The resulting nominal thicknesses are listedin Ref. 2.
Although the values used in the calculations are somewhatdifferent, the nominal thicknesses of "1/8" and "1/4" inch will beused in the following sections of this report for simplicity.
Boeing calculated the specimen modulus by performing a linearregression of load versus axial strain. The axial strain range used inthe calculation was 1000 to 3000 microstrain, Boeing employed0.500 inch square strain gages (Measurements Group Inc. EA-06-500AE-350) in these measurements. The specimen's actual widthand nominal thickness were used in the calculation.
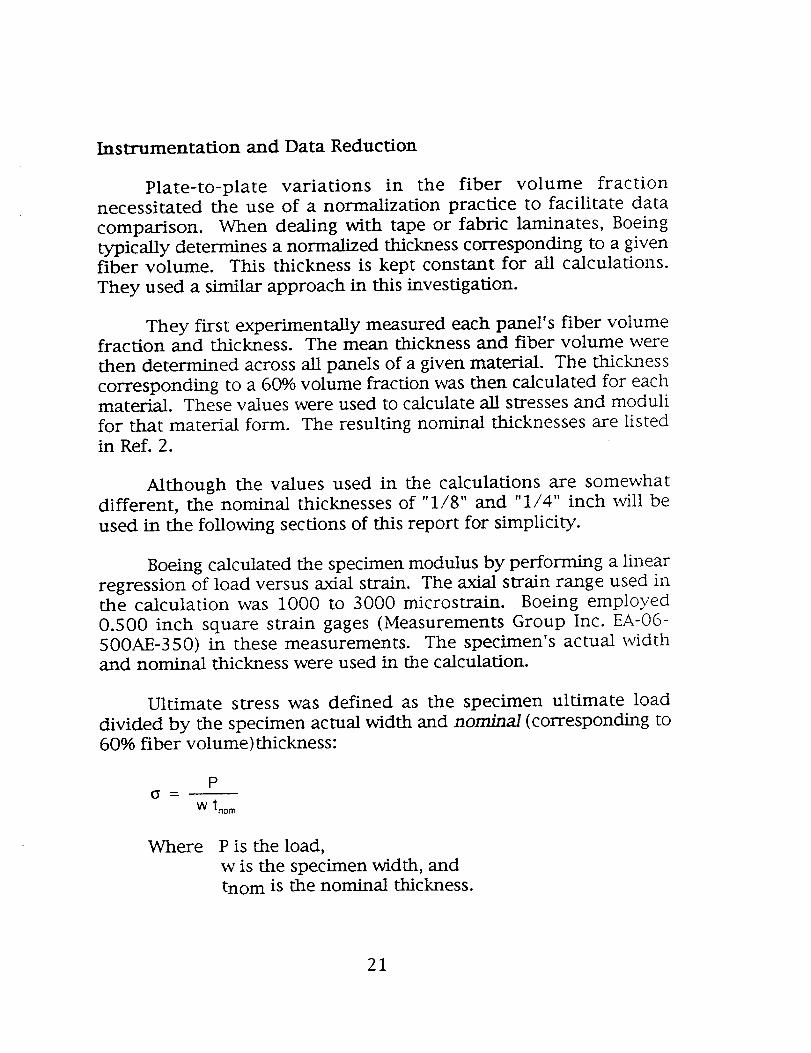
Ultimate stress was defined as the specimen ultimate loaddivided by the specimen actual width and nominal (corresponding to60% fiber volume) thickness:
PG --
W triom
Where P is the load,w is the specimen width, andtnom is the nominal thickness.
21

Test Results
The results of the experimental programs conducted at Boeingand at Lockheed will be reviewed in this section. The Boeing study
was designed to develop data to support textile composite materialtest method development. Their results, therefore, address specifictest issues. Lockheed, on the other hand, conducted a materials
evaluation program to support their ACT related activities. Theyemployed a single test method in this effort. Their results areincluded here for completeness. They supplement the results of the
Boeing study, which will serve as the primary source of information.
Boeing Test Results - 2-D Triaxial Braids
Although data were generated for 3-D woven and stitcheduniweave material systems, Boeing used the 2-D triaxial braidedmaterial systems listed in Table I to evaluate the test methods.These material systems were used to establish the viability of thevarious candidate methods and to measure their sensitivity to
specimen dimensions.
Modtt_ecl IITRI and NASA Short Block Tests
The test matrices used to evaluate the Modified IITRI and
NASA Short Block test methods are given in Tables V and VI. The
matrices indicate that gage section length was varied from 1.0 to 2.0inches to determine the specimens' sensitivity to Euler buckling. Allthe specimens listed in the tables had a nominal thickness of 0.250inch. In addition to these specimens, one set of 0.125 inch thick, 1.5inch wide, Modified IITRI specimens were tested for each 2-D braidarchitecture. These specimens had a 1.0 inch gage length.
Boeing conducted gage length sensitivity studies on Short Blockand Modified IITRI specimens only. The studies were necessary forthese methods since they use the only specimens in the study with
unsupported test sections. Edge or face supports are provided in theother methods to prevent buckling.
22

Table V. Test Matrix for NASA Short Block Tests.
Dimensions
Width Length
1.50 1.0
1.50 1.50
1.50 2.0
[0 30k/+70 6k]46% Axial
Material Systems
[0 75k/+70 15k] [0 36k/+45 15k]46% Axial 46% Axial
3 - 3
3 3 3
3 - 3
Note: All specimens were 0.250 inch thick.
[0 6k/+45 15k]12% Axial
3
Table VI. Test Matrix for Modified IITRI Tests.
Dimensions Material Systems
Width Length
1.50 1.0
1.50 1.50
1.50 2.0
[0 30k/+70 6k] [0 75k/+70 15k] [0 36k/+45 15k]46% Axial 46% Axial 46% Axial
3 3
3 3 3
3 3
[0 6k/+45 15k]12% Axial
Note: All specimens listed were 0.250 inch thick.
An additional set of 1.50 inch x 1.0 inch x 0.125 inch specimens were
tested for each material system.
Tables VII and VIII list the compression moduli measured
during these tests. They indicate that the Modified IITRI specimenshad higher moduli, by an average of 9%, in five of the six cases inwhich their data could be compared with the results obtained withthe Short Block specimen. This is illustrated graphically in Figure 12,
which plots the moduli of all four braid architectures. These resultswere obtained using 1.5 inch wide, 0.25 inch thick specimens with a
1.5 inch gage section. The one exception in which the Short BlockSpecimen had a higher modulus (by 7.5%) is shown in the figure.
23

The tables also indicate that there was very little scatter in the
data. The average coefficient of variation (CoV) of all the NASA Short
Block data was 3.8%; the Modified HTRI specimens had an average
CoV of 2.6%. The scatter in these data is comparable to the CoVs that
were measured for these 0.500 inch gages in the strain gage size
sensitivity study (Ref. 11) that was conducted as a part of this effort
to develop test methods for textile composites.
Table VII. NASA Short Block Test Results: Modulus.
Dimensions Compression Modulus (MSI)
Width Length [0 30k/+70 6k] [0 75k/+_70 15k] [0 36k/+45 15k]46% Axial 46% Axial 46% Axial
1.50 1.0
1.50 1.50
1.50 2.0
Note:
No Data - No Data
[0 6k/+45 15k]12% Axial
8.42+0.14 7.91+0.21 8.90+0.19 4.05+0.33
( 1.7%) (2.6%) (2.0%) (8.0%)
7.67 + 0.57 - 8.31 + 0.08
(7.4%) (1.0%)
Coefficients of Variation are shown in ().
Table VIII.
Dimensions
Width
1.50 1.0
1.50 1.50
1.50 2.0
1.50 1.0
Length [0 30k/+70 6k]46% Axial
Modified HTRI Test Results: Modulus.
Compression Modulus (MSI)
[0 75k/+70 15k] [0 36k/+45 15k]46% Axial 46% Axial
0.250 inch Thick Specimens
8.67 + 0.13 8.50
(1.5%)
[0 6k/+45 15k]12% Axial
8.64+0.2 8.31+0.14 8.28+0.3 4.59+0.11
(2.3%) (1.7%) (3.6%) (2.4%)
8.94 + 0.10 - 9.04 + 0.5
(1.1%) (5.5%)
Thick Specimens0.125 inch
8.79 + 0.17 8.44 + 0.9 9.32 + 1.0 4.43 + 0.2
(1.9%) (10.7%) (10.7%) (4.5%)
24

09
v
o}
O
10.0
8.0
6.0
4.0
2.0
0.0
[] NASA Short Block Specimen
[] Modified IITRI Specimen
[0 _ /+70 _] [0 m,/'1-45 ,.] [0 _ /±70 ,s, ] [0 r_/±45 ,_]
46% Axial 46% Axial 46% Axial 12% Axial
Figure 12. A Comparison of Modulus Measurements MadeUsing the Short Block and Modified IITRI Tests.
The compression strengths measured during these tests aresummarized in Tables IX and X. In contrast to the modulimeasurements listed in Tables VII and VIII, the Short Block
specimen yielded higher strengths than the Modified IITRI specimenin all but one case. The Short Block specimens' strengths were on
average 19% higher than the Modified IITRI specimens' strengths.These differences were quite pronounced in some cases. This isevident in Figure 13, which plots the results obtained for 1.5 inchwide, 0.25 inch thick specimens with a 1.5 inch gage section. The
figure illustrates the large differences, 41%, in the compressionstrengths of the [075k/_+7015k] 46% specimens. The error bars seen
in the figure provide a measure of the scatter in the individual datasets. The two test methods were comparable by this measure. TheModified IITRI test results had an average CoV of 8.4%; the ShortBlock tests' was 6.8%.
25

Table IX. NASA Short Block Test Results: Strength.
Dimensions Compression Strength (KSI)
Width Length
1.50 1.0
1.50 1.50
1.50 2.0
[0 30k/+70 6k]46% Axial
[0 75k/+70 15k]46% Axial
[0 36k/+45 15k]46% Axial
79.2 + 1.7 - 78.1 + 4.0(2.1%) (5.1%)
76.9 + 3.4 61.9 + 4.5 64.1 + 4.8
Note:
(4.4%) (7.3%) (7.5%)
71.5 + 7.6 - 57.4 + 9.1
(10.6%) (15.9%)
Coefficients of Variation are shown in ().
[0 6k/+45 15k]12% Axial
46.1 +0.6
(1.3%)
Table X. Modified IITRI Test Results: Strength.
Dimensions
Width Length
1.50 1.0
1.50 1.50
1.50 2.0
1.50 1.0
[0 30k/+70 6k]46% Axial
67.6+ 6.8
(10.1%)
71.2 + 0.06
(0.1%)
62.9 + 16.1
(25.6%)
Compression Strength (KSI)
[0 75k/---70 15k]46% Axial
0.250 inch
[0 36k/+45 15k]46% Axial
67.1 + 1.6
(2.4%)
Thick Specimens
58.6
[0 6k/+45 15k]12% Axial
44.0 + 4.7 54.8 + 1.9 44.1 + 0.06
(10.7%) (3.5%) (0.1%)
62.8 + 5.5
(8.8%)
0.125 inch Thick Specimens
51.7 + 10.0 62.8 + 3.1 49.1 + 2.2
(19.3%) (5.0%) (4.5%)
Note: Coefficients of Variation are shown in ().
26

v
e"
e-
80.0
60.0
40.0
20.0
0.0
[]
[]
NASA Short Block Specimen
Modified IITRI Specimen
//1
/ ./ ./A
.. l+4s,_] [0 /+70,_] [0 /+4s,i][0 /±70 e] [0 _ ,l _-
46% Axial 46% Axial 46% Axial 12% Axial
Figure 13. A Comparison of Strength Measurements Made
Using the Short Block and Modified IITRI Tests.
As the test matrix indicated, a series of tests was alsoconducted to measure the sensitivity of these two test specimen
geometries to changes in gage length. A series of [030k/_+706k] 46%and [036k/+4515k] 46% specimens with 1.0 inch, 1.5 inch, and 2.0
inch gage lengths were tested (See Tables IX and X). It is difficult toaccurately define trends in the data given the limited number ofreplicate tests and the observation that the scatter in all the dataincreased as the gage length increased. The data indicate, however,that the Modified IITRI specimen seems less sensitive to changes ingage length than the Short Block specimen. The former's moduli
actually showed a slight, 5%, increase with increasing gage length.The Short Block specimens registered slightly larger, 8%, decreases inmodulus. The strengths of the Short Block specimens also showed
greater sensitivity to changes in gage length. The [030k/+706k] 46%specimens' strengths decreased by 10% and the [036k/+4515k] 46%
27

specimens' strengths decreased by 27% in the Short Block tests asgage length increased to 2.0 inch. The Modified IITRI test results, bycomparison, showed a 7% decrease and a 7% increase, respectively, asthe [030k/+706k] 46% and the [036k/_+4515k] 46% specimens' gagelengths increased over the same ranges.
A comparison of the Short Block and the Modified IITRI dataalso gives an indication of the effects of end constraint and loadingmode. The Short Block method lightly clamps the specimen over0.30 inch length and features end loading. The Modified IITRIclamps a much larger section of its specimen (2.50 inches). Load istransferred to this specimen through shear loading. The dataindicate that the Modified IITRI specimens averaged 9% highermoduli than their Short Block counterparts. On the other hand, theShort Block specimens' strengths were 20% higher. Comparablescatter was seen in both methods' moduli and strength results.
One set of Modified IITRI tests was conducted using 0.125 inchthick specimens to measure the sensitivity of this method tospecimen thickness. A 1.0 inch gage length was selected for thesetests. The results of these tests are also included in Tables VIII and
X. The tabulated results indicate that the 0.125 inch thick specimenshad moduli and strengths that were comparable to the 0.250 inchthick specimens for all four braids. Minguet (Ref. 2) noted, however,that an examination of the strain data obtained using back-to-back
gages indicated that the 0.125 inch thick specimens exhibited non-lineari W indicative of a stability problem. His observations indicatethat, despite the short gage length, this method may not be viablewhen thin specimens are tested.
Boelmg Open ltole Compression and Zabota Tests
Boeing Open Hole Compression and Zabora test methods havebeen grouped together for discussion since both feature long, thinspecimens that are supported along their entire length to preventbuckling. In fact, Boeing used identical, 1.5 inch wide, 12.0 inch long,specimens in their evaluations of each method. Although they arequiet similar, the two test fixtures used in these tests support the
specimens in different manners. Both fixtures feature cut-outsections. However, the cut-out in the Zabora fixture is three times
longer than the cut-out in the Boeing OHC fixture. The test fixturesalso differ in the manner in which they support the specimens in
28

sections away from the cut-outs. The Boeing OHC test fixture
provides contact support over the entire specimen face. The Zabora
fixture contacts the specimen edges only; a shallow step machined
into the fixture leaves the 0.800 inch wide center section
unsupported.
Table XI lists the test matrix used to evaluate these test
methods. Samples of all four braids were tested. However, unlike
the Short Block and Modified IITRI tests, the sensitivity of the test
methods to changes in specimen geometry was not addressed. Only
one specimen configuration was evaluated.
Table XI. Test Matrix for Boeing OHC and Zabora Tests.
Dimensions
Width Length
Boeing OHC1.5 12.0Zabora1.5 12.0
[0 30k/+70 6k]46% Axial
Material Systems
[0 75k/+70 15k] [0 36k/+45 15k]46% Axial 46% Axial
[0 6k/+45 15k]12% Axial
3 3 3 3
3 3 3 3
Note: All specimens listed were 0.125 inch thick.
The results of these evaluations are contained in Tables XII and
XIII. They are also graphically illustrated in Figures 14 and 15.
Table XII. Boeing OHC and Zabora Test Results: Modulus.
Test Method
Boeing OHC
Zabora
[0 30k/+70 6k]46% Axial
Compression Modulus (MSI)
[0 75k/+70 15k] [0 36k/+45 15k]46% Axial 46% Axial
[0 6k/+45 15k]12% Axial
9.21+0.09 11.7+5.8 10.2+0.24 4.57+0.06
(1.0%) (50%) (2.4%) (1.3%)
9.20+0.41 8.63+0.26 10.56+0.4 4.92+0.10
(4.4%) (3.0%) (3.8%) (2.0%)
29

Table XIII. Boeing OHC and Zabora Test Results: Strength.
Test Method
Boeing OHC
Zabora
I Compression Strength (KSI)[0 30k/+70 6k] [0 75k/+70 15k] [0 36k/+45 15k] [0 6k/+45 15k]46% Axial 46% Axial 46% Axial 12% Axial
102.9 + 26.0 77.0 + 35.3 59.2 + 3.4 41.7 + 0.6
(25.3%) (45.8%) (5.7%) (1.3%)
85.9 + 11.3 64.3 + 3.8 67.7 + 4.2 46.9 + 2.0
(13.2%) (5.9%) (6.2%) (4.3%)
The data indicate that, with the exception of one set of results,the scatter in the modulus measurements was, again, quite low. TheZabora specimens had an average CoV of 3%. The moduli measuredfor the [030k/+706k] 46% Axial, [036k/+4515k] 46% Axial, and
[06k/_+4515k] 12% Axial specimens using the Boeing OHC test
method had an average CoV of 1.5%. The exception was the resultsobtained for the [075k/+7015k] 46% Axial material; they had a CoV
of 50%. The large scatter in these measurements can be traced to asingle test in which a modulus of 18 MSI was recorded. This wasmore than twice the modulus measured in the other two tests in the
series; they averaged 8.4 MSI.
The two methods recorded comparable average moduli for eachof the braids tested if the suspect [075k/+7015k] 46% Axial data are
not considered. The moduli measured by the two methods differed
by an average of only 3.5%, which is comparable to the scatter in thatdata.
30

t/)
o
12.0
10.0
8.0
6.0
4.0
2.0
0.0
[] Boeing OHC Specimen
[] Zabora Specimen
Figure 14. A Comparison of Modulus Measurements Made
Using the Boeing OHC and Zabora Test Methods.
The results of the compression strength measurements areshown in Figure 15. An analysis of the data indicates that the Zabora
tests yielded higher strengths (by an average of 15%) for both the[036k/_+4515k] 46% Axial and [06k/+4515k] 12% Axial material.
The two methods recorded comparable strengths for the[075k/+7015k] 46% Axial braids if the suspect Boeing OHC data are,
again, not considered. The Boeing OHC fixture yielded a higherstrength for the [030k/+706k] 46% Axial specimens, 102.9 versus85.9 KSI. However, the scatter in the Boeing OHC measurements forthis architecture was nearly twice as great as the scatter in theZabora measurements, 25% versus 13%.
It is difficult to establish a clear pattern from these results.
However, it may be stated that, although the strengths obtainedusing the Zabora fixture were only slightly higher than those
31

obtained using the Boeing OHC fixture, the reproducibility of the datawas greater with the former than the latter. The Boeing OHC testshad an average CoV of 11% if the [075k/+70151d 46% Axial data is
not considered, the average CoV is 19.5% if it is considered. TheZabora test results had an average CoV of 7.4%.
120.0 1
100.0
[] Boeing OHC Specimen
[] Zabora Specimen
(n 8o.o
r.
" 60.0
411.0
20.0
0.0
[o,/+70 ..1 [o ,/±_ ,._] [o,../±7o ,,_] [o./±_ ,,_]46% Axial 46% Axial 46% Axial 12% Axial
Figure 15. A Comparison of Strength Measurements Made
Using the Boeing OHC and Zabora Test Methods.
Booing Compression after Impact and NASA ST-4 Tests
Although the Boeing Compression after Impact (CAI) test wasoriginally designed to measure damage tolerance and the NASA ST-4test was originally used to measure the open hole compression
strength, they employ identical test fixtures. As in the Boeing OHCand the Zabora fixtures, the test specimens are fully supported along
32

their lengths to prevent buckling. However, unlike the two previoustest methods, the specimens are only supported along their edges inthese tests. Both tests employ knife edge fixtures that clamp ontothe specimens about 0.50 inch in from their edges. The two methodsdiffer only in the sizes of the specimens used. The Boeing CAIspecimen is 4.0 inch wide and 6.0 inch long; ST-4 specimen is 5.0inch wide and 10.0 inch long.
The test matrix used to evaluate these methods is given inTable XIV. It indicates that, like the Boeing OHC and Zabora tests,data were gathered for all four 2-D braids. It also indicates that,
again like the Boeing OHC and Zabora tests, the sensitivity of the testmethods to changes in specimen geometry was not addressed. Onlyone specimen configuration was evaluated for each method and all
specimens were 0.250 inches thick.
Table XIV. Test Matrix for Boeing CAI and NASA ST-4 Tests.
Dimensions
Width Length
Boeing CAI4.0 6.0
NASA ST-45.0 10.0
[0 30k/+70 6k]46% Axial
Material Systems
[0 75k/+70 15k] [0 36k/+45 15k]46 % Axial 46 % Axial
[0 6k/+45 15k]12% Axial
3 3 3 3
3 3 3 3
The results of the elastic measurements are listed in Table XV;
Table XVI lists the strength measurement results.
Table XV. Boeing CAI and NASA ST-4 Test Results: Modulus.
Test Method
Boeing CAI
NASA ST-4
[0 30k/+70 6k]46% Axial
Compression Modulus (MSI)
[0 75k/+70 15k] [0 36k/+45 15k]46% Axial 46% Axial
[0 6k/+45 15k]12% Axial
9.11+0.09 8.66+0.28 9.48+0.4 4.35+0.13
(1.0%) (3.2%) (4.0%) (3.0%)
9.46 + 0.32 8.37 + 0.27 9.18 + 0.6 4.74 + 0.05
(3.4%) (3.2%) (6.5%) (1.0%)
33

Table XVI. Boeing CAI and NASA ST-4 Test Results: Strength.
Test Method Compression Strength (KSI)
[0 30k/+70 6k] [0 75k/+70 15k] [0 36k/+45 15k] [0 6k/+45 15k]46% Axial 46% Axial 46% Axial 12% Axial
Boeing CAI
NASA ST-4
63.2 + 4.4 56.0 +- 1.7 56.8 + 2.9 43.0 + 0.6
(7.0%) (3.0%) (5.1%) (1.4%)
44.6 + 1.6 43.4 + 1.8 47.0 + 1.0 43.2 + 3.1
(3.6%) (4.1%) (2.1%) (7.2%)
There was little difference in the moduli measured by the twomethods. As Figure 16 demonstrates, the Boeing CAI method yieldedhigher values for the [036k/_+4515k] 46% Axial and the
[075k/+7015k] 46% Axial material; the ST-4 method recorded
higher moduli for the [030k/+706k] 46% Axial and the[06k/-4515k] 12% Axial specimens. The average difference in thesemeasurements was 5%. The scatter in all these measurements was
also quite low. The Boeing CAI measurements had an average CoV of3%; the ST-4 tests averaged 3.5%.
Although the two methods yielded comparable results in themodulus measurements, there was a decided difference in their
strength results. As the data in Figure 17 demonstrates, the BoeingCAI test method yielded substantially higher strengths (by anaverage of 23 %) for three of the four braids tested. The twomethods yielded comparable results for the [06k/+4515k] 12% Axial
material only. This decrease in strength is assumed to be indicativeof buckling instability in the 10.0 inch long ST-4 specimens despitethe edge supports.
34

10.0
[] Boeing CAI Specimen
[] NASA ST-4 Specimen
8.0
A
U)_; 6.0
-i
o:E 4.0
2.0
0.0
Figure 16.
[0 3QLJ'I'70 .] [0 }_'45 1Ski [0 _70 ,Ski [Osk/i_L_ 1_ ]
46% Axial 46% Axial 46% Axial 12% Axial
Boeing CAI and NASA ST-4 Moduli Measurements.
7O
60
50
AmU)
"_ 40
r-
r"
P 3o
20
10
Figure 17.
[] Boeing CAI Specimen
171 NASA ST-4 Specimen
/// 7_
//////
//////I// i/// _/'//fi//// ////// / / /
SLL LLS ILL I.SS
[0 l/±70 ,146% [0 /'_15 1_;k]46% [O;,,,k_70 1S.]46% [Olik/'¢45 IS] 12%
Boeing CAI and NASA ST-4 Strength Measurements.
35

Sandwich Column Tests
The final test method investigated by Boeing was the SandwichColumn Test illustrated in Figure 10. The test matrix employed in
this investigation is given in Table XVII. It demonstrates that theinvestigators conducted an extensive evaluation of the effects of the
specimen width and length on modulus and strength.
Table XVII. Test Matrix for Sandwich Column Tests.
Dimensions
Width Length
1.50 6.0
2.25 6.0
3.0 6.0
3.0 2.0
3.0 8.0
Material Systems
[0 30k/+70 6k] [0 75k/+70 15k] [0 36k/+45 15k]46% Axial 46% Axial 46% Axial
3 - 3
3 - 3
3 3 3
3 - 3
3 - 3
[0 6k/+45 15k]12% Axial
3
Note: All composite face sheets had a nominal thickness of 0.0625 inch.
The results of the modulus measurements are summarized in
Table XVIII; the strength results are listed in Table XIX. Minguet
(Ref. 2) noted two difficulties in evaluating these specimens. Boeingwas unable to determine the textile composite face sheet's fibervolume fraction because the specimens were delivered as a
completed sandwich. This made comparison of the data with theresults attained from previous tests difficult. The second problemwas far more serious. AU the specimens failed by separation of theface sheet from the core due to either core failure or to failure of the
core-laminate bond. The latter problem negates the compression
strength test results. A review of the results listed in Table XIXaffirm this observation. The strengths recorded using this technique
were significantly lower than those measured using any of the othermethods previously reviewed. A review of the moduli listed in Table
XVIII also raises questions about the specimen performance in theelastic range. These values were lower than the results obtained
36

using the other methods for three of the four materials tested. In
the fourth case, the modulus measured for the [036k/_+4515k] 46%
Axial material was significantly larger than the moduli measured
using the other six test techniques.
Table XVIII.
Dimensions
Width
Sandwich Column Test Results: Modulus.
Compression Modulus (MSI)
Length [0 30k/+70 6k] [0 75k/+70 15k] [0 36k/+45 15k]46% Axial 46% Axial 46% Axial
1.50 6.0
2.25 6.0
3.0 6.0
3.0 2.0
3.0 8.0
7.56 + O. 11 - 11.2 + 0.24
(1.5%) (2.1%)
7.49+0.21 - 11.4+0.18
(2.8%) (1.6%)
[0 6k/+45 15k]12% Axial
7.48 + 0.09 5.5 + 0.17 11.0 + 0.3 3.43 + 0.04
(1.2%) (3.1%) (2.7%) (1.2%)
7.87 + 0.26 - 11.0 _ 0.14
(3.3%) (1.3%)
7.97 + 0.21 - 11.4 + 0.2
(2.6%) (1.8%)
Table XIX. Sandwich Column Test Results: Strength.
Dimensions Compression Strength (KSI)
Width Length [0 30k/+70 6k] [0 75k/+70 15k] [0 36k/+45 15k]46% Axial 46% Axial 46% Axial
1.50 6.0
2.25 6.0
3.0 6.0
3.0 2.0
3.0 8.0
28.1 + 0.7 34.7 + 1.9(2.5%) (5.5%)
28.5 + 2.1 35.7 + 1.0
(7.4%) (2.8%)
27.2±3.0 16.3±1.1 33.5±1.0
(11.0%) (6.7%) (3.0%)
30.4 ± 2.5 36.5 + 0.8
(8.2%) (2.2%)
26.2 ± 2.7 34.4 ± 2.7
(10.3%) (7.8%)
37
[0 6k/±45 15k]12% Axial
16.7 ± 0.2
(1.2%)
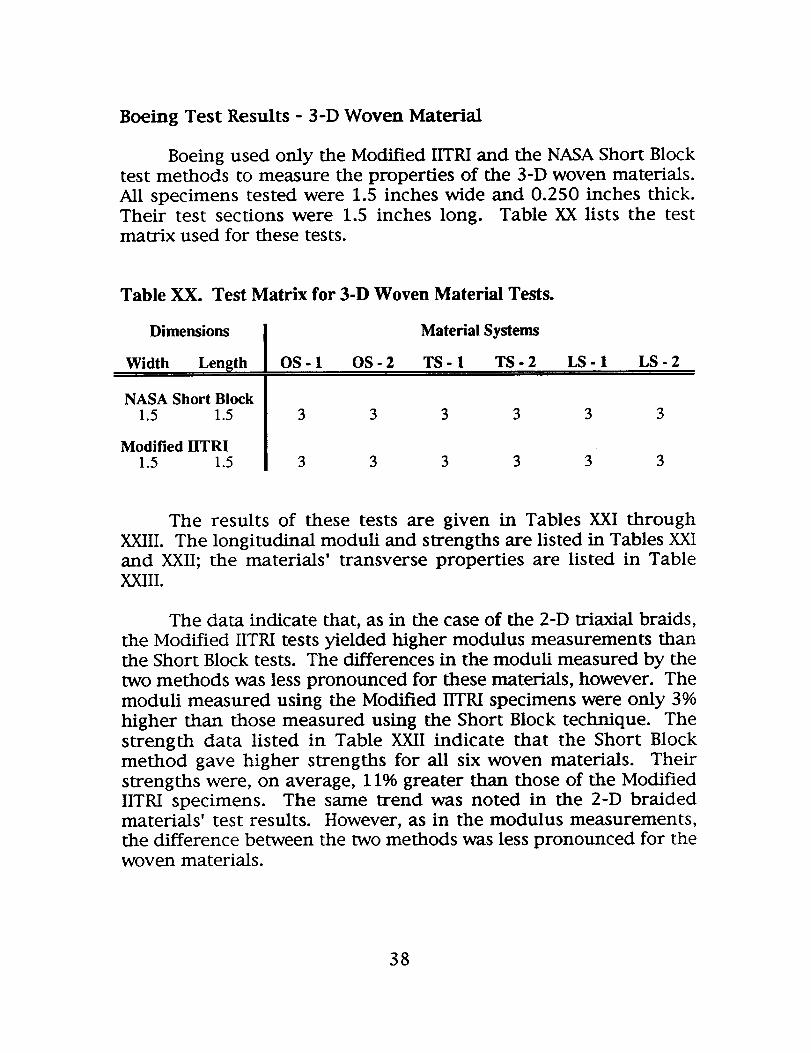
Boeing Test Results - 3-D Woven Material
Boeing used only the Modified IITRI and the NASA Short Blocktest methods to measure the properties of the 3-D woven materials.
All specimens tested were 1.5 inches wide and 0.250 inches thick.Their test sections were 1.5 inches long. Table XX lists the testmatrix used for these tests.
Table XX. Test Matrix for 3-D Woven Material Tests.
Dimensions
Width Length OS - 1 OS - 2
NASA Short Block1.5 1.5
Modified HTRI1.5 1.5
Material Systems
TS - 1 TS - 2 LS - 1 LS - 2
3 3 3 3 3 3
3 3 3 3 3 3
The results of these tests are given in Tables XXI throughXXIII. The longitudinal moduli and strengths are listed in Tables XXIand XXII; the materials' transverse properties are listed in TableXXIII.
The data indicate that, as in the case of the 2-D triaxial braids,the Modified IITRI tests yielded higher modulus measurements thanthe Short Block tests. The differences in the moduli measured by the
two methods was less pronounced for these materials, however. Themoduli measured using the Modified IITRI specimens were only 3%
higher than those measured using the Short Block technique. Thestrength data listed in Table XXII indicate that the Short Blockmethod gave higher strengths for all six woven materials. Theirstrengths were, on average, 11% greater than those of the ModifiedIITRI specimens. The same trend was noted in the 2-D braidedmaterials' test results. However, as in the modulus measurements,the difference between the two methods was less pronounced for thewoven materials.
38

Table XXI.
TestMethod
NASAShortBlock
ModifiedIITRI
3-D Woven Material Test Results: Longitudinal Modulus.
Compression Modulus (MSI)
OS- 1 OS- 2 TS- 1 TS- 2 LS- 1 LS- 2
10.58 _+ 10.61 _+ 10.62 -+ 10.28 _+ 11.09 _+ 10.67 _0.18 0.69 0.30 0.04 0.22 0.33
(1.7%) (6.5%) (2.8%) (0.4%) (2.0%) (3.1%)
10.61_+ 10.31_+ 10.62_+ 10.64_+ 11.39_+ ll.O0_+0.16 0.09 0.22 0.16 0.11 0.20
(1.5%) (1.0%) (2.1%) (1.5%) (1.0%) (1.8%)
Table XXII. 3-D Woven Material Test Results: Longitudinal Strength.
TestMethod
NASAShortBlock
ModifiedIITRI
Compression Strength (KSI)
OS - 1 OS - 2 TS - 1 TS - 2 LS - 1 LS - 2
83.7_+2.9 92.2_+5.3 76.1_+1.1 71.5_+2.9 80.5-+4.6 78.1-+6.0
(3.4%) (5.7%) (1.4%) (4.1%) (5.7%) (7.7%)
81.5_+4.4 78.4_+6.1 74.1-+4.9 65.5_+1.0 76.3_+2.8 62.2_+0.5
(5.4%) (7.8%) (6.6%) (1.5%) (3.7%) (1.0%)
Table XXIII. 3-D Woven Material Test Results: Transverse Modulus
and Strength.
Property I os. 1
Material Systems
OS- 2 TS- 1 TS- 2 LS- 1 LS- 2
Modulus
(MSI)
Strength(KSI)
6.07_+0.14 5.96_+0.04 5.82+0.10 6.98+0.14 6.12_+0.09 6.26+
(2.3%) (0.7%) (1.7%) (2.0%) (1.5%) 0.003(0.1%)
41.0-+1.1 52.8-+0.6 37.4-+2.0 50.8_+2.0 32.3_+4.7 27.3_+5.6
(2.8%) (1.2%) (5.4%) (3.9%) (14.4%) (20.5%)
39

Boeing Test Results - Stitched Uniwoven Material
Table XXIV lists the test matrix used to evaluate the stitched
materials. As in the case of the 3-D woven materials, Boeing
employed only the Modified IITRI and the Short Block methods in
this study. The specimen gage length was again f'Lxed at 1.5 inch. All
the specimens were 1.5 inch wide and 0.25 inch thick.
Table XXIV. Test Matrix for Stitched Laminate Tests.
Dimensions IWidth Length SU - 1
Material Systems
SU - 2 SU - 3 SU - 4 SU - 5
NASA Short Block1.5 1.5
NASA Short Block1,5 1.5
3 3 3 3 3
3 3 3 3 3
The moduli and strengths measured in these tests are listed inTables XXV and XXVI, respectively. The performances of the twotest methods on the stitched materials were comparable to theirperformances on the braided and woven materials. The Modified
IITRI method registered the higher moduli in all five stitchedsystems evaluated. The average difference in this case was 5%. Thiswas comparable to the difference measured for the woven systemsbut slightly less than the improvements seen in the braided systems.The Short Block method again yielded the higher strengths. Theaverage difference in strength was 12% in this case. This was, again,comparable to the increase seen in the woven materials but less thanthe difference measured for the braided materials.
4O

Table XXV. Stitched Laminate Test Results: Longitudinal Modulus.
Test Method
NASA Short Block
Modified IITRI
Compression Modulus (MSI)
SU- 1 SU- 2 SU- 3 SU- 4 SU- 5
5.79+0.24 5.88+0.05 6.10+0.14
(4.1%) (1.0%) (2.3%)
6.22+0.09 5.81+0.10
(1.4%) (1.7%)
6.33+0.07 6.11+0.06 6.37+0.10 6.44+0.04 6.04+0.02
(1.1%) (1.0%) (1.6%) (0.6%) (0.3%)
Table XXVI.
Test Method
NASA Short Block
Modified IITRI
Stitched Laminate Test Results: Longitudinal Strength.
Compression Strength (KSI)
SU- 1 SU- 2 SU- 3 SU-4 SU- 5
56.3+2.1 51.5+1.9 53.9+0.9 53.1+1.1 52.6+2.3
(3.7%) (3.7%) (1.7%) (2.0%) (4.4%)
52.1-!-0.9 45.3+0.5 47.6+2.0 48.1_0.9 45.6+0.5
(1.7%) (1.2%) (4.1%) (1.9%) (1.2%)
A series of Modified IITRI tests was also conducted on each
architecture to determine its transverse compression properties. The
specimen dimensions listed in Table XXIV were used in these tests.The results of these tests are listed in Table XXVII.
Table XXVH. Stitched Laminate Results: Transverse Modulus and Strength.
Property
Modulus
(MSI)
Strength(KSI)
Material Systems
SU- 1 SU- 2 SU-3 SU- 4 SU- 5
6.35+0.15 6.21+0.05 6.49+0.11 6.61+0.05 6.64+0.05
(2.4%) (1.0%) (1.7%) (1.0%) (1.0%)
55.1+2.3 51.6+0.5 54.2+2.2 52.2+1.4 55.7+1.1
(4.2%) (1.0%) (4.0%) (2.7%) (1.9%)
41

Lockheed Test Results
Tables XXVIII to XXX summarize the results of Lockheed's
evaluations of the 2-D Braided, 3-D Braided, and 3-D Wovenmaterials, respectively.
Table XXVIII. 2-D Braided Material Test Results: Lockheed
Property 2-D Braided Systems
[0 12k/+60 6k] 33% Axial
Longitudinal Modulus(MSI)
Longitudinal Strength(KSI)
Transverse Modulus
(MSI)
Transverse Strength(KSI)
[0 24k/_+60 6k] 50% Axial
7.13_+0.16 9.87_+0.31
(2.3%) (3.1%)
65.4 _+5.3 77.7 + 2.0
(8.1%) (2.6%)
6.30 _+0.09 5.07 _+0.13
(1.4%) (2.5%)
49.0 _+ 3.6 40.4 _+0.9
(7.4%) (2.2%)
Table XXIX. 3-D Braided Material Test Results: Lockheed
Property
3-D Braided Systems[0 6k/-+60 6k] 30 % Axial [0 18k/+60 6k] 56% Axial
Longitudinal Modulus(MSI)
Longitudinal Strength(KSI)
Transverse Modulus
(MSI)
Transverse Strength(KSI)
5.92 _+0.36 9.58 _+0.21
(6.2%) (2.2%)
71.1 + 4.8 71.8 _+ 1.5
(6.7%) (2.1%)
5.22 _+0.20 3.66 _+0.27
(3.9%) (7.4%)
54.3 _+2.3 32.8 _+0.2
(4.2%) (0.6%)
42

Table XXX. 3-D Woven Material Test Results: Lockheed
Property
Longitudinal Modulus(MSI)
Longitudinal Strength(KSI)
Transverse Modulus(MSI)
Transverse Strength(KSI)
3-D Woven Systems
TTT- 1 LTL - 1 LTL- 2
7.95 + 0.2 8.91 + 0.18 7.64 + 0.16
(2.5%) (2.0%) (2.1%)
75.1 + 3.2 81.6 + 8.0 71.9 + 4.2(4.2%) (9.8%) (5.9%)
7.94 + 0.04 8.13 + 0.15 8.67 + 0.28(0.5%) (1.8%) (3.2%)
57.9 + 1.3 53.7 + 0.5 55.3 + 1.4(2.2 %) (1.0%) (2.6%)
A comparison of the 2-D and 3-D braid architectures indicates
that all four systems were braided at +60 ° and that their axial yarn
contents were comparable. The former featured 33% and 50% axial
yarns; the latter contained 30% and 56% axial yarns. Although they
are not exactly equal, a comparison of their properties is reasonable.
The data indicate that the 2-D materials had higher
longitudinal and transverse moduli than their 3-D counterparts. The
data also show, however, that these 2-D and 3-D braids had
comparable strengths.
Scatter in both sets of data was quite low. The average CoVs
for the 2-D and 3-D materials' moduli measurements were 2.3% and
4.9%, respectively. Their strength measurements averaged 5.1% and
3.4%. The reproducibility of these results is comparable to those
attained by Boeing using the Zabora Method, which featured a
comparable test fixture. Unlike the method employed at Lockheed,
however, the Zabora Method uses straight-sided specimens. By
comparison, the moduli measured for the four 2-D braids using the
Zabora test (Table XII) had an average CoV of 3.3%; the strength
measurements (Table XIII) averaged 7.4%.
The results obtained for the three 3-D woven systems also
showed little scatter. The moduli measurements had an average CoV
of 2.0%; the strength results averaged 4.3%. A comparison of these
results with those obtained using the Zabora fixture is not possible,
however, since Boeing evaluated only 2-D braids with that method.
43

Summary and Conclusions
Compression test data developed by Boeing and Lockheedunder ACT Program funding were reviewed in this report. Boeing
was specifically funded to develop data on test methods for textilecomposites. They investigated seven separate test techniques. Theseresults were the prime source of data used to identify arecommended test practice. The Lockheed investigation focused on
developing material property data bases for a variety of textilecomposite materials. They used a single method to measure thematerials' compression properties. Their results were used tosupplement the Boeing test data. Although woven, braided, andstitched laminates were tested in both programs, Boeing primarilyused braided specimens to assess the viability of the various
methods and to establish specimen dimensions.
Compression test specimens have been divided into threecategories: short, unsupported coupons, long coupons supported alongtheir entire length, and laminates that feature sandwich constructionto prevent buckling. All three types of specimen configurations wereevaluated by Boeing. Lockheed used a long, tapered coupon and atest fixture that provided edge support along the length of the
specimen in its evaluation.
A number of issues must be considered in choosing a
compression test method. The effectiveness of the method in
measuring the true material response is certainly the primeconsideration. The test methods' ability to measure both the
modulus and the strength will be used to select a test method. It is
highly desirable that the same test method and specimen be used toestablish both properties. The test methods will, therefore, be
judged on their combined performance in making bothmeasurements.
Two metrics, the magnitude of the modulus or strengthmeasurement and the reproducibility of those measurements, will be
used to judge the methods' effectiveness.
44

Investigators faced with a similar choice for tape materials
have often chosen the method that yields the highest strength. This
is based on the assumption that compression strength is a material
property and not a structural property. If you assume that the
material has an inherent, baseline strength then logic indicates that
the method that yields the highest value is the best since it either
measures the true material response or comes the closest of all the
candidates. Stated another way, even an ideal test cannot yield a
result greater than the material's inherent strength; a faulty test can,
however, record a lower "strength."
The premise discussed above will also be applicable to the
modulus measurements but to a lesser degree. These measures are
performed in the linear elastic range. Buckling, a failure mode that
would lower apparent strength, should not be a factor in these tests.
The approach taken in this report will be to choose the test
method that consistently yields the highest modulus and strength
provided it has acceptable reproducibility. Test methods with a CoV
of 5% or lower will be judged acceptable.
The relative performances of the candidate test methods are
illustrated in Figures 18 and 19. The moduli measured for each of
the four 2-D triaxial braids are summarized in Figure 18; their
strengths are plotted in Figures 19. Data from six of the seven
methods evaluated are contained in the figures. As was noted
earlier, the seventh method, the Sandwich Column Test Method, was
ineffective and was not considered. The inch 1.50 by 1.50 inch by
0.250 inch NASA Short Block and Modified IITRI test results are
plotted in the figures.
45

[0 /_+70 _ ] 46% Axial Braid Data10.0 3Ok 12.0
8.0 _/ 10.0
|,o
+,.o ,+X _/ i 4.0
2.0 _// 2.0
///0.0 •
Short Mod. Boeing Zabora Bc_ng NASA 0.0Block IITRI OHC ST-4
[0 nk/-I-70 +Sk] 46% Axial Braid Data
f •
/-j
F/
fJ
fJ
fJ
rJ
,,/ • ii
s,o. NASABlock UTRI ST-4
Test Methods Test Methods
10.0
8.0
:Ev 6.0m
_=:1
"_ 4.0X
2.O
o.0
[0 _k/_5 +S_] 46% Axial Braid Data [0 ak/_+45 +s_] 12% Axial Braid Data
-_ _ 5.0
A 4.0 _
3.0
1.0
0.0
Block liTRI
Test Methods Test Methods
Figure 18. Comparison of Methods: Modulus Measurements.
A method-to-method comparison of the data in Figure 18indicates that a range of moduli was recorded for each material. Thedifferences between the low and the high moduli measured(expressed as a percentage of the low value) ranged from 9.5% forthe [075k/+7015k] 46% Axial material to 27.5% for the
[036k/+4515k] 46% Axial material. The average difference between
the low and the high values measured was 18% for the four braidstested. The Zabora Method recorded the highest modulus for two ofthe four 2-D braids tested; it was the second highest in the two
remaining cases. The test methods that featured short, unsupportedtest sections, the NASA Short Block and the Modified IITRI Test
46

Methods, consistently yielded the lowest values. The Short Blockmethod recorded the lowest modulus in three of the four casesconsidered. The moduli measured using the Short Block Test were15% (expressed as a percentage of the Short Block modulus) lower,on average, than the highest values measured.
An examination of the scatter in the data indicates that all themethods performed comparably well. The reproducibility of themeasurements, i.e., the scatter in the moduli, made using eachmethod was quite good. The CoV exceeded 5% in only two cases: theShort Block measurement of the [06k/+4515k] 12% Axial material
(8%), and the NASA ST-4 measurement on the [036k/+4515k] 46%
Axial material (6.5%).
The results of the strength measurements provide a morediscernible basis with which to select a test method. The data in
Figure 19 indicate that the overall range of the measurementsincreased significantly when compared method-to-method. Theaverage difference between the low and the high values recorded foreach material was almost 60% in the strength measurements
compared to only 18% in the modulus measurements. A review ofthe data also indicates that there was more scatter in the individual
strength measurements than in the modulus measurements. TheCoVs exceeded 5% in almost half of the strength measurements.
An examination of the figure indicates that the Zabora Method
again led the other methods. It was followed by the Boeing OHC andthe Short Block Tests. The Zabora Method recorded the highest
strength for three of the four braids tested. It was the secondhighest in the remaining case. The NASA ST-4 Method, by contrast,yielded the lowest strength in three of the four cases evaluated.
The Short Block Method, with an average CoY 5.1%,demonstrated the best reproducibility of the top three methods. It
was followed by the Zabora and the Boeing OHC Methods. Their CoVswere 7.4% and 10.8%, respectively.
47

120.0
100.0
A
50.ob¢
J:
50.o¢:
4o.o
20.0
0.0
[0 3o_I+70
ShodBlock
] 46% Axial Braid Data6k 120.0
i 100.0
20.0
_.o_
20.0 "1
0.0 '
Mod. Boeing Zabora Boeing NASAIITRI OHC CAI ST..4
Test Methods
[0 /:1:70 lSk] 46% Axial Braid Data
Sho¢l iMORi. (_(cng Zabora I_ng NASABlock ST-4
Test Methods
70.0
60.0
A 50.0i(n,_,"" 40.0J:
_" 30.0e4.)
¢_ 20.O
10.0
[0 _,/±45 1Sk] 46% Axial Braid Data50.0
////////////////////////
Test Methods
\\\\
\\\X
NASAST4
50.0
_400. •
J:
20.0 •
20.0,
10.0 '
0.0 0.0Short Mod. ShortBlock UTRI Block
[0 m/+45 lSk] 12% Axial Braid Data
NASAST-4
Figure 19. Comparison of Methods: Strength Measurements.
The Zabora Method demonstrated the best overall performance
in both the modulus and the strength measurements. In most cases
the highest modulus or strength was recorded using this method. Itdemonstrated low scatter in the modulus measurements and,
although greater than 596, reasonable scatter in the strengthmeasurements. It is, therefore, recommended as the method to beused to characterize the compression strength of textile composites.
Along with its performance advantages, the Zabora Method hasseveral other attractive features. The specimen used in the test is
quite versatile; it can be used for both tension and open hole tension
testing (Ref. 12, 13). In contrast to several of the other test methods,the Zabora Method can also be used effectively to measure properties
48

of thin materials. The specimens tested in this evaluation were
0.125 inch thick. The Short Block Method, by comparison, is limited
to 0.250 inch specimens to avoid buckling.
The Zabora Method is similar to the test method employed at
Lockheed. A comparison of the data developed by Boeing with the
result obtained at Lockheed indicates that the tapered cross-section
used in the latter's method may not be necessary. The average CoVs
reported at Lockheed for 2-D braided materials were 2.3% for the
modulus measurements and 5.1% for the strength measurements.
The Short Block and the Boeing OHC Methods also deserve
strong consideration. However, the data reveal disadvantages toboth methods.
The Short Block Method recorded the second highest strengths
in three of the four cases tested. The strengths measured using this
method were on average 5.7% lower than strength measured using
the Zabora Method. The moduli recorded using this method were
consistently much lower than those measured using the other
methods, however. The Short Block specimen does offer one
important advantage. Although it requires the use of a thicker
specimen than the Zabora Method, the Short Block specimens require
far less material overall since they are much shorter than the Zabora
specimens. The Short Block Method may be used effectively in a
materials development program when quantities of material arelimited and relative moduli measurements are sufficient to assess
trends in the data. The superior performance of the Zabora Method
and the versatiliW of its test specimen, by comparison, make it more
desirable for use in a program to determine design data.
In contrast to the Short Block Method, the Boeing OHC Method
recorded consistently high moduli and strength values. Like the
Zabora Method, it features a versatile specimen that can be used in
both tension and compression tests. In addition, the test fixture used
in this test is specified in a SACMA Recommended Test Method SRM
3R-94 and is being evaluated by ASTM for open hole compression
testing. This is an advantage since the fixture is already in use in
many test labs and is marketed commercially. The scatter in its
strength data was, however, quite high. Boeing noted that
abnormally high strength results were obtained in several cases.
They attributed these results to friction or interference between the
fixture and the specimen.
49

References
. Naik, R. A., Ifju, P. G., and Masters, J. E., "Effect of FiberArchitecture Parameters on Deformation Fields and Elastic
Moduli of 2-D Braided Composites," Journal of CompositeMaterials, Vol. 28, No. 7/1994, pp. 656 - 681.
2. Minguet, P. J., Fedro, M. J., and Gunther, C. K., "Test Methods forTextile Composites," NASA Contractor Report 4609, July, 1994.
o Whitney, J. M., Daniel, I. M., and Pipes, R. B., Exp_erimCnl_dMechanics of Fiber Reinforced Composite Materials, The Societyfor Experimental Stress Analysis, Brookfield Center, CT, 1982, pp.175 - 185.
. Daniel, I. M. and Ishai, O., Engineering Mechanics of CompositeMaterials, Oxford University Press, New York, NY, 1994, pp. 316- 321.
. Adams, D. F., "Current Status of Compression Testing ofComposite Materials," Proceedings 40th International SAMPESymposium. May 1995, pp. 1831 - 1845
. Shuart, M.J.: Failure of Compression-Loaded MultidirectionalComposite Laminates. AIAA Journal, vol. 27, no. 9, September1989, pp. 1274-1279.
. Hofer, K. E., Rao, N., and Larsen, D., "Development of EngineeringData on Mechanical Properties of Advanced Composite
Materials," Air Force Technical Report AFML-TR-72-205, Part I,Sept. 1972.
o SACMA Recommended Test Method for Open-Hole CompressionProperties of Oriented Fiber-Resin Composites, SRM 3R-94,Suppliers of Advanced Composites Materials Association,Arlington, VA, 1994.
o SACMA Recommended Test Method for Compression AfterImpact Properties of Oriented Fiber-Resin Composites, SRM 2R-94, Suppliers of Advanced Composites Materials Association,Arlington, VA, 1994.
50

10. Standard Tests for Toughened Resin Composites, NASA ReferencePublication 1092, NASA Langley Research Center, Hampton, VA,1983.
11. Masters, J. E., Strain Gage Selection Criteria for TextileComposite Materials, NASA CR-198286, February 1996.
12. Portanova, M. A., Standard Methods for Unnotched TensionTesting of Textile Composites, NASA CR-198264, December 1995.
13. Portanova, M. A., Standard Methods for Open Hole Tension
Testing of Textile Composites, NASA CR-198262, December 1995.
51

REPORT DOCUMENTATION PAGE FormApprovedOMB NO. 0704-0188
I_c w_m_g t_xOoo_ th_ _loak_ d S_ionna_ Ioemk_med_o wem4W l l_mx_ _ _ me _m _ _ _. _ _i_ _ _,g_ apd n_ tbodau nemeC m_doo_ _ _m_ me _k_m ol _ _ _mmwnm _Oa_ u_ _ _ ot a_l omof _ d _aa_=loe _' _eleemme. inck'ding _mion= lotreducingate burden,to Washlngme_ Scrim=. Dimc_oramIw intam/ee _ N _. 1215 _ _Hlg_my, Sul 1204,Adington.VA 22202_ acKIto meOflim _ Managemm andBudge. papenmdt_ i_ (0704.01m. Wa_etitlart.OC 2050_
1. AGENCY USE ONLY (Leave b/ank) 2. REPORT DATE
February 19964. TITLE AND SUBTITLE
Compression Testing of Textile Composite Materials
6. AUTHOR(S)
John E. Masters
7. PERFORMINGORGANIZATIONNAME(S)ANDADDRESS(ES)
Lockheed Martin Engineering & Sciences144 Research DriveHampton, VA 23666
'9. SPONSORING/MONITORINGAGENCYNAME(S)ANDADDRESS(ES)
National Aeronautics and Space AdministrationLangley Research CenterHampma, VA 23681-0001
11. SUPPLEMENTARYNOTES
NASA Technical Monitor: I.S. Raju
3. REPORT TYPE AND DATES COVEREDContractor Retx)rt
5. FUNDING NUMBERS
Contract NAS 1 -19000
WU 505-63-50-04
i8. PERFORMING ORGANIZATIONREPORT NUMBER
10. SPONSORING/MONITORINGAGENCY REPORT NUMBER
NASA CR-198285
12a.DISTRIBUTION/AVAILABILITYSTATEMENT
Unclassified - Unlimited
Subject Category 24
12b. DISTRIBUTION CODE
Modulus, S_rength, Compression, Braids, Short Block, Zabora, nTRI
17. SECURITY CLASSIFICATIONOF REPORT
Unclassified
NSN 754GO1-280-5500
14. SUBJECT TERMS
18. SECURITY CLASSlRCATION 19. SECURITY CLASSIFICATIONOF THIS PAGE OF ABSTRACT
Unclassified
15. NUMBER OF PAGES
52
16. PRICE CODE
A0420. LIMITATION OF ABSTRACT
StamardForm29e (Flev.2-89)Pr_cdmd by ANSI Std. Z39-t 8296-102
13. ABSTRACT (Maximum 200 words)
The applicability of existing testmethods, which were developed primarily for laminates made ofunidirectional prepreg tape, to textile composites is an area of concern. The issue is whether the values measured for the 2-
D and 3-D braided, woven, stitched, and knit materials are accurate representations of the true material response.
This report provides a review of efforts to establish a compression test method for textile reinforced compositematerials. Experimental data have been gathered from several sources and evaluated to assess the effectiveness of a varietyof test methods. The effectiveness of the individual test methods to measure the material's modulus and su'ength isdetermined. Data are presented for 2-D triaxial braided, 3-D wovon, and stitched graphite/epoxy material. However, thedetermination of a recommended test method and specimen dimcmsions is based, primarily, on experimental resultsobtained by the Boeing Defense and Space Group for 2-D triaxially I_aided materials. They evaluated seven test methods:NASA Short Block, Modified IITRI, Boeing Open Hole Compression, Zabora Compression, Boeing Compression afterImpact, NASA ST-4, and a Sandwich Column Test.


Related Documents