Comprehensive Transformation Strategy Towards a greaT UniversiTy

Welcome message from author
This document is posted to help you gain knowledge. Please leave a comment to let me know what you think about it! Share it to your friends and learn new things together.
Transcript
Comprehensive Transformation Strategy
Towards agreaT UniversiTy
Comprehensive Transformation Strategy
Towards a greaT UniversiTy
Table of contents
1 Introduction
2 Comprehensive Institutional Transformation Strategy
3 Our Approach
4 CPUT’s Current Reality4.1 goal 1: equity and redress 4.2 goal 2: access, retention and success4.3 goal 3:diversity4.4 goal 4:social Cohesion4.5 goal 5:governance4.6 goal 6: Composition of srC over 2009 - 2011
5 Transformation Goals and ObjectivesContainedinthetransformationstrategyare18transformationobjectivesthatrelatetothesixtransformationgoalswithsettimelines.
6 Conclusion and Acknowledgements Thiscomprehensivetransformationstrategyisadynamicdocumentwhoseimpactandeffectivenessshouldbedeterminedthrough
propermonitoringofprogressmadethroughthetransformationimplementationplan.TheleadershipoftheViceChancellor,Prof.LVTanga,theTransformationForum,SenateandInstitutionalForumaswellastheTaskTeamwhichdevelopedthisstrategyviz;GeorgeMvalo,LuclaireAireyandProf.HarryBallardisherebyacknowledged.
CounCil approved: 22 June 2013
Comprehensive Transformation Strategy
Towards a greaT UniversiTy
1
Introduction
During the phase of the 2006 to 2010 Strategic Plan, the Cape Peninsula University of Technology (CPUT) changed from
pursuing a diffused model to transformation to a dual one. Under the former approach, transformation was to cut across all
activities and divisions within CPUT. In this model ownership and evaluation of the transformation agenda was a continuous
challenge as there was no direct ownership of the process.
The shift came through the centralization of transformation in the Vice Chancellor’s Office while at the same time giving
space to Units/Departments and individuals to construct and implement transformation initiatives in their specific contexts. An
institutional Transformation Forum created a platform where the community could assemble, account, share and evaluate the
different activities on the transformation agenda.
CPUT is the only university of technology in the Western Cape Province amongst three traditional universities, six FET Colleges
and several private colleges. CPUT has had a rapid enrolment growth reaching a student population of just over 32 000 by 2012
of which postgraduate students constitute 4.54 per cent of the sum total. This is still below the Department of Higher Education
and Training benchmark set for Universities of Technology and far below the proportion of postgraduate students (enrolment and
graduation rates) in the three regional sister universities.
1

Comprehensive Transformation Strategy
Towards a greaT UniversiTy
2
Comprehensive Institutional Transformation Strategy
CPUT is in the midst of a transformation process, which is wide ranging in its reach and impact on organizational practices, processes and institutional culture.
The CPUT transformation strategy is informed by, inter alia, the Institutional Transformation, Social Cohesion and Diversity Charter, 2010, Vision
2020, and the Institutional Quality Improvement Plan (IQIP), 2012. The ultimate goal is to align all faculty and departmental transformation plans to the
institutional transformation strategy. Ultimately, the objectives set out in the institutional transformation strategy, should be measurable and realistic
within set timeframes. The Comprehensive Transformation strategy is a framework that is to guide our transformation journey as the Cape Peninsula
University of Technology until 2020.
For our purposes, transformation refers to a dynamic continuous process of change and adjustment that impact on all facets of university life
as encapsulated in the three missions of a university and all attendant policies, systems and practices that constitute the day-to-day life of a Higher
Education Institution.
In line with Vision 2020, the university is committed to the principle of social transformation and will pursue strategies to enhance this within the
institution and society (p4 Vision 2020). Transformation is understood to represent a move from the current state to a new state that results in change at a
practical and systemic level in terms of our practices and policies. It affects all aspects such as equity, organizational culture, organizational effectiveness,
managerial practices and transforming the curriculum.
This will then be underpinned by the value stated in Vision 2020 (p7) to support the principle of “equity and excellence”.
Social cohesion, a critical component of an institutional culture, is viewed in a broad context and includes issues such as stigmatization associated
with HIV/AIDS, xenophobia, LGBTI rights and so on.
2
Comprehensive Transformation Strategy
Towards a greaT UniversiTy
3
Our approach
During 2010 the following goals were formulated:
Equity and Redress Access, Retention and Success Diversity Social Cohesion Governance Networking and Partnerships
3
The rationale for the formulation of these goals was informed by, inter alia, the CPUT Transformation, Social Cohesion and Diversity Charter,
chapter two of the Constitution of the Republic of South Africa, 1996, and the white paper on higher education and the National Plan on Higher Education.
To formulate working strategies for this comprehensive transformation strategy, it was necessary to sketch the prevailing, current reality. A data
collection exercise was undertaken to obtain the baseline data and trends, and used to set realistic targets. The data was provided by the MIS
department, the Disability Office, Fundani’s Student Learning Unit, CTS, QMD, CPUT’s Self-Evaluation Audit Report for the HEQC, and the IQIP.
Comprehensive Transformation Strategy
Towards a greaT UniversiTy
4
The following principles were adopted to ensure uniformity:
Indicators should be measurable
Targets should be SMART and as far as possible quantitative
The current CPUT reality was established to form a baseline on which to set realistic targets and to
facilitate the measurement for progress.
This is a high-level strategy document where responsibility for more detailed implementation plans lies
with the Executive Management. The lower level implementation plans should be aligned with the
relevant strategies of the respective faculties, departments and units.
The underpinning policies supporting transformation are:
Employment Equity Policy
Recruitment and Selection Policy
Policy for People with Disabilities
Policy for the Employment of Foreign nationals
Ad Hominem Promotion Policy for Academic Staff
Performance Management Policy
Student Initiation Policy
Quality Assurance Policy
Student Admissions Policy
Academic Planning Framework
Sexual Harassment Policy
Language Policy
Khula Policy
Recognition of Prior Learning Policy
This high-level strategy document does not include an
implementation plan required to give effect to the goals and
objectives.
The implementation plan has been developed separately.
Priority, timelines, resourcing and accountability will be detailed
in the implementation plan.
Comprehensive Transformation Strategy
Towards a greaT UniversiTy
5
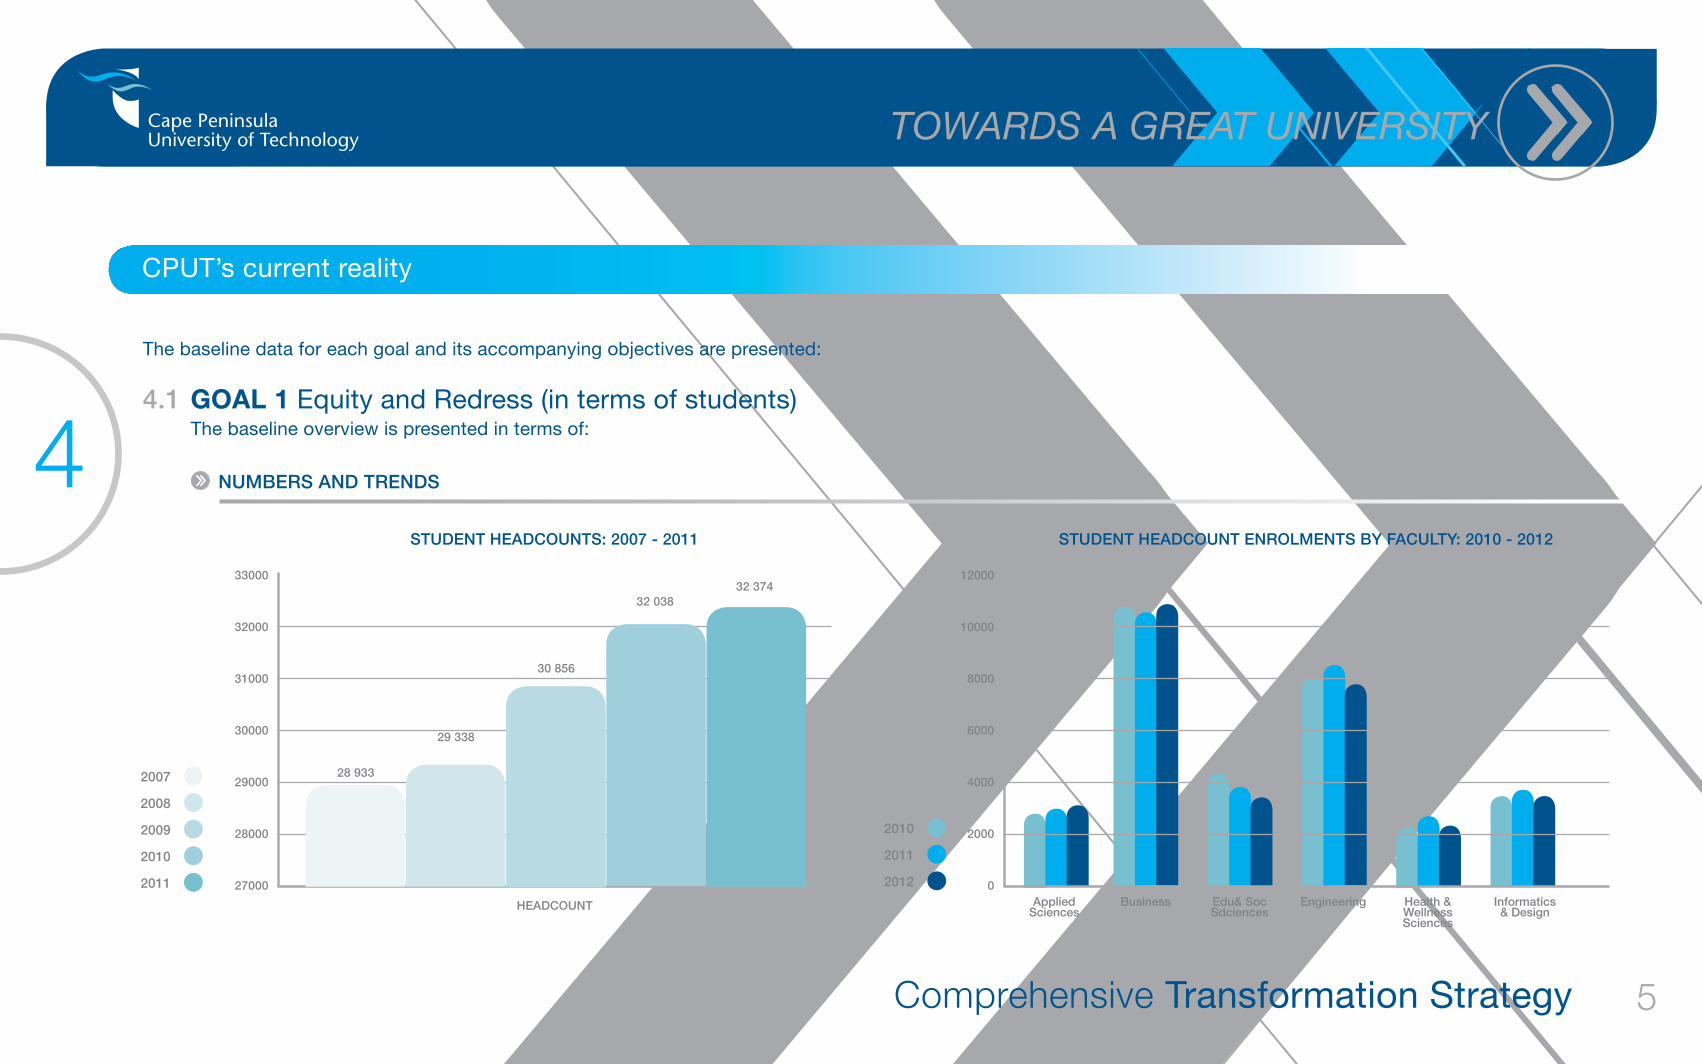
CPUT’s current reality
The baseline data for each goal and its accompanying objectives are presented:
4.1 Goal 1 Equity and Redress (in terms of students)The baseline overview is presented in terms of:
NUmbeRS ANd TReNdS
2007
2008
2009
2010
2011
2010
2011
2012
4STUdeNT HeAdCOUNTS: 2007 - 2011
HeAdCOUNT
33000
32000
31000
30000
29000
28000
27000
28 933
29 338
30 856
32 03832 374
STUdeNT HeAdCOUNT eNROlmeNTS by fACUlTy: 2010 - 2012
Applied Sciences
Informatics & design
Health & Wellness Sciences
engineeringedu& SocSdciences
business
12000
10000
8000
6000
4000
2000
0
Comprehensive Transformation Strategy
Towards a greaT UniversiTy
6
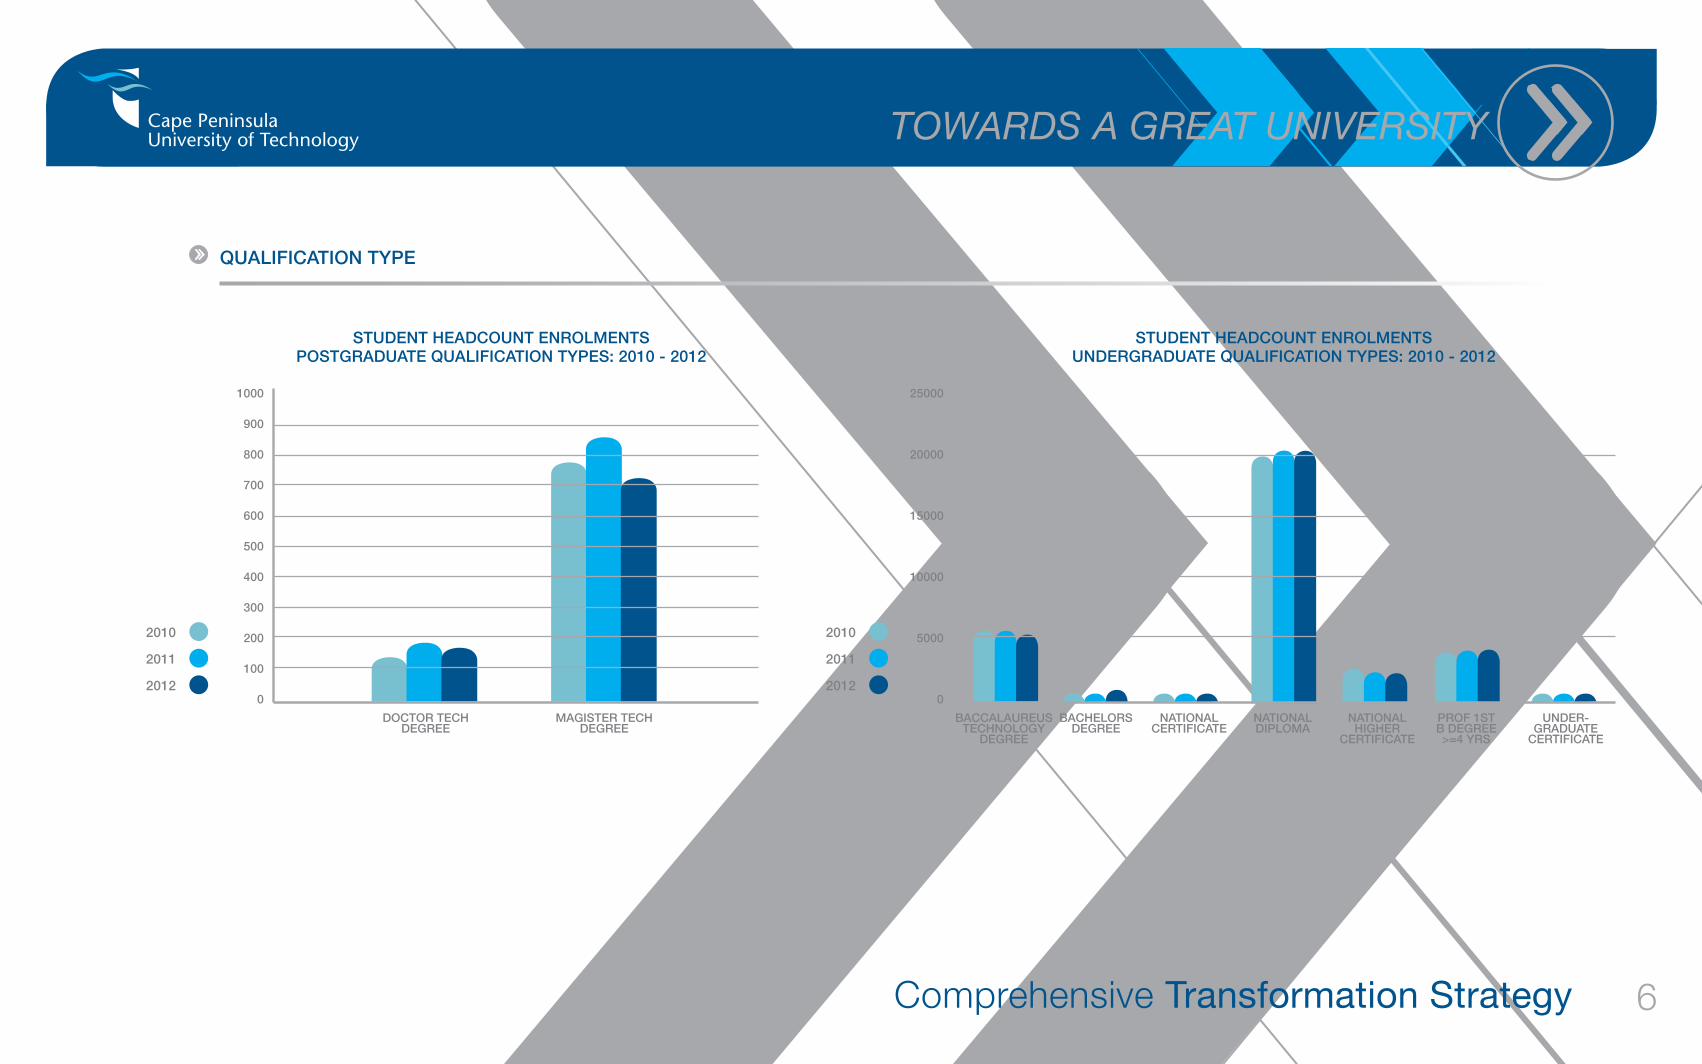
QUAlIfICATION TyPe
2010
2011
2012
STUdeNT HeAdCOUNT eNROlmeNTSPOSTGRAdUATe QUAlIfICATION TyPeS: 2010 - 2012
dOCTOR TeCH deGRee
mAGISTeR TeCH deGRee
1000
900
800
700
600
500
400
300
200
100
0
2010
2011
2012
STUdeNT HeAdCOUNT eNROlmeNTSUNdeRGRAdUATe QUAlIfICATION TyPeS: 2010 - 2012
bACCAlAUReUSTeCHNOlOGy
deGRee
NATIONAl HIGHeR
CeRTIfICATe
NATIONAl dIPlOmA
PROf 1STb deGRee>=4 yRS
UNdeR-GRAdUATe
CeRTIfICATe
NATIONAl CeRTIfICATe
bACHelORS deGRee
25000
20000
15000
10000
5000
0
Comprehensive Transformation Strategy
Towards a greaT UniversiTy
7
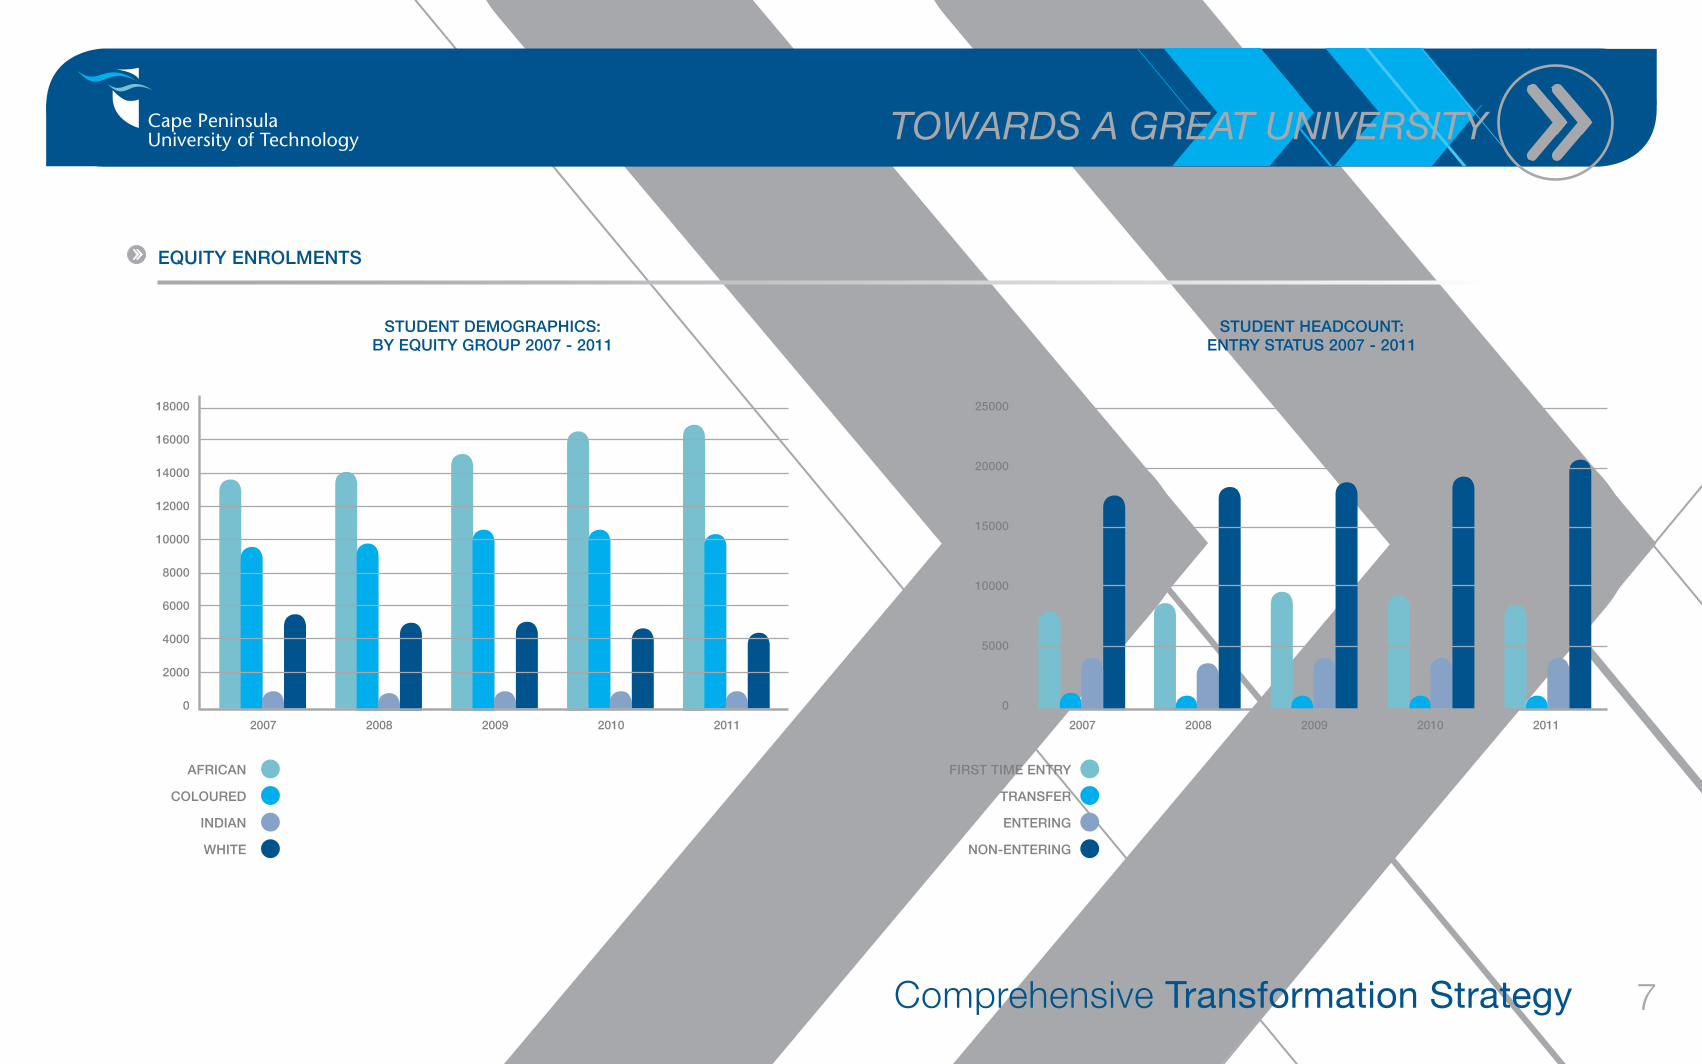
eQUITy eNROlmeNTS
AfRICAN
COlOURed
INdIAN
WHITe
fIRST TIme eNTRy
TRANSfeR
eNTeRING
NON-eNTeRING
STUdeNT demOGRAPHICS:by eQUITy GROUP 2007 - 2011
18000
16000
14000
12000
10000
8000
6000
4000
2000
0
2007 2008 2009 2010 2011
STUdeNT HeAdCOUNT:eNTRy STATUS 2007 - 2011
25000
20000
15000
10000
5000
0
2007 2008 2009 2010 2011
Comprehensive Transformation Strategy
Towards a greaT UniversiTy
8
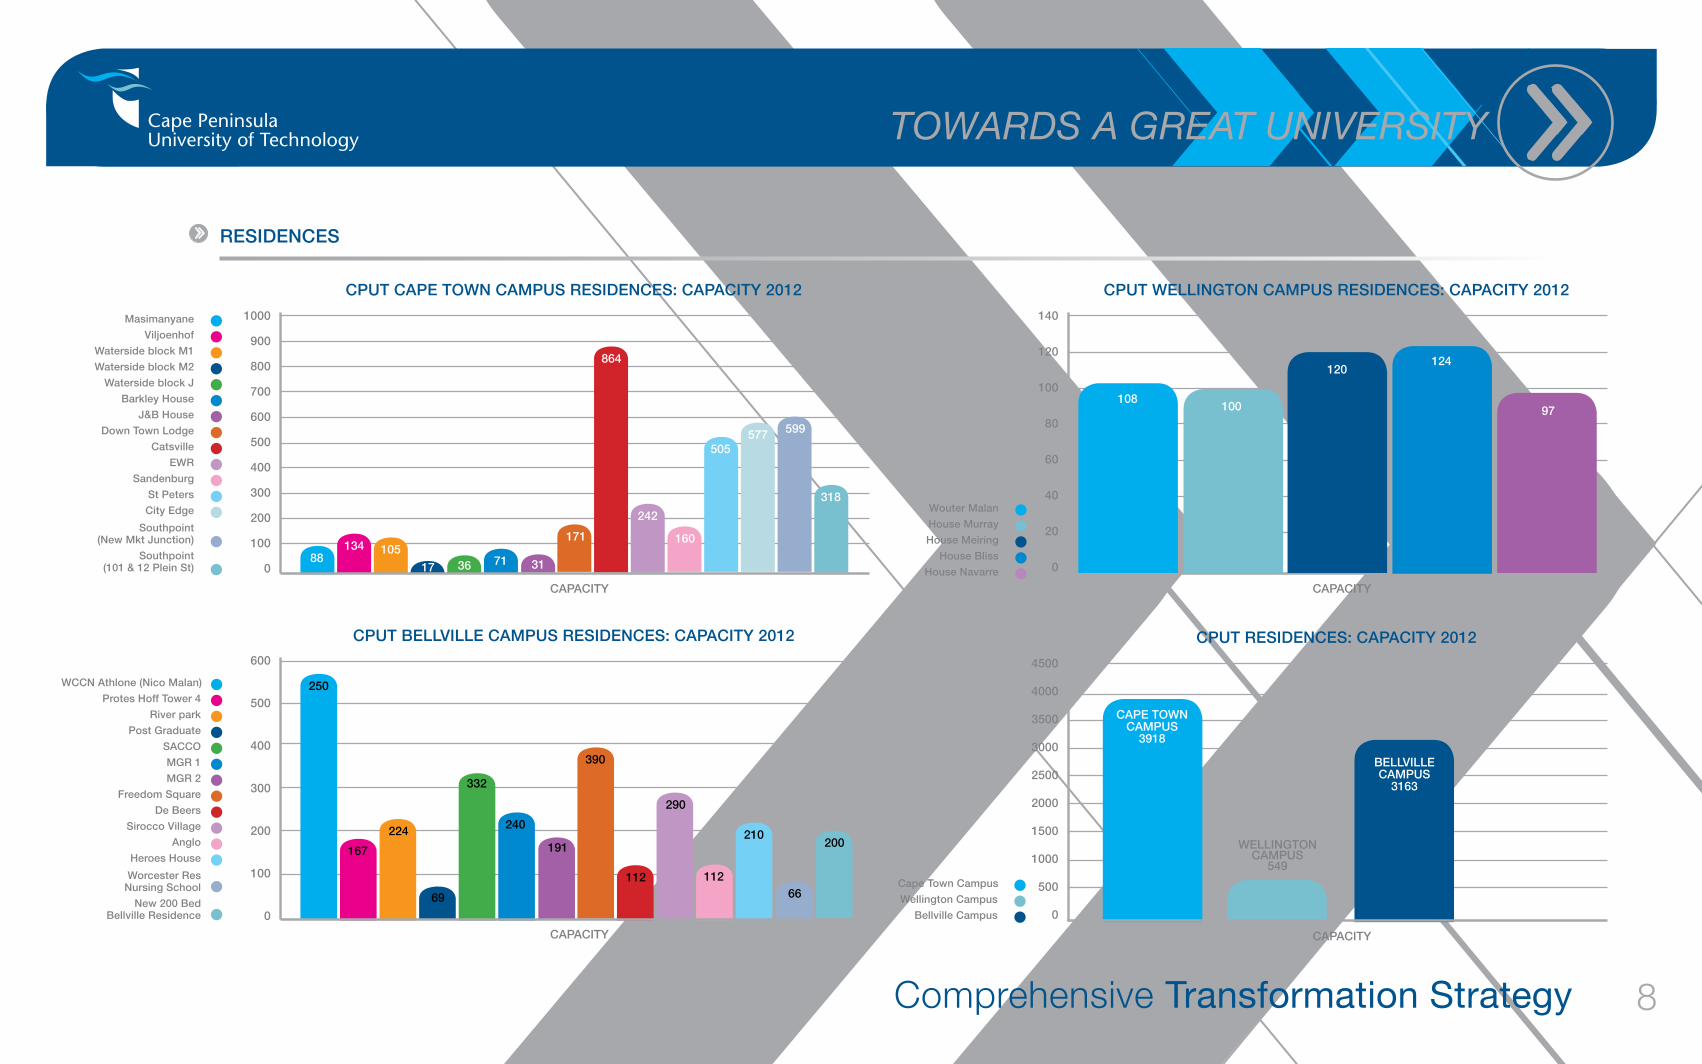
ReSIdeNCeS
masimanyane
Viljoenhof Waterside block m1 Waterside block m2 Waterside block J barkley House J&b House down Town lodge Catsville eWR Sandenburg St Peters City edge
Southpoint (New mkt Junction)
Southpoint (101 & 12 Plein St)
Wouter malan
House murray House meiring House bliss House Navarre
CPUT CAPe TOWN CAmPUS ReSIdeNCeS: CAPACITy 2012 CPUT WellINGTON CAmPUS ReSIdeNCeS: CAPACITy 2012
1000
900
800
700
600
500
400
300
200
100
0
140
120
100
80
60
40
20
0
CAPACITy CAPACITy
88134 105
17 36 3171
171
864
242
160
505577 599
318
108
Cape Town Campus
Wellington Campus bellville Campus
CPUT ReSIdeNCeS: CAPACITy 2012
4500
4000
3500
3000
2500
2000
1500
1000
500
0
CAPACITy
CAPe TOWN CAmPUS
3918
WellINGTONCAmPUS
549
bellVIlleCAmPUS
3163
100
120124
97
WCCN Athlone (Nico malan)
Protes Hoff Tower 4 River park Post Graduate SACCO mGR 1 mGR 2 freedom Square de beers Sirocco Village Anglo Heroes House
Worcester Res Nursing School
New 200 bed bellville Residence
CPUT bellVIlle CAmPUS ReSIdeNCeS: CAPACITy 2012600
500
400
300
200
100
0
CAPACITy
250
167
224
69
332
191
240
390
112
290
112
210
66
200
Comprehensive Transformation Strategy
Towards a greaT UniversiTy
9
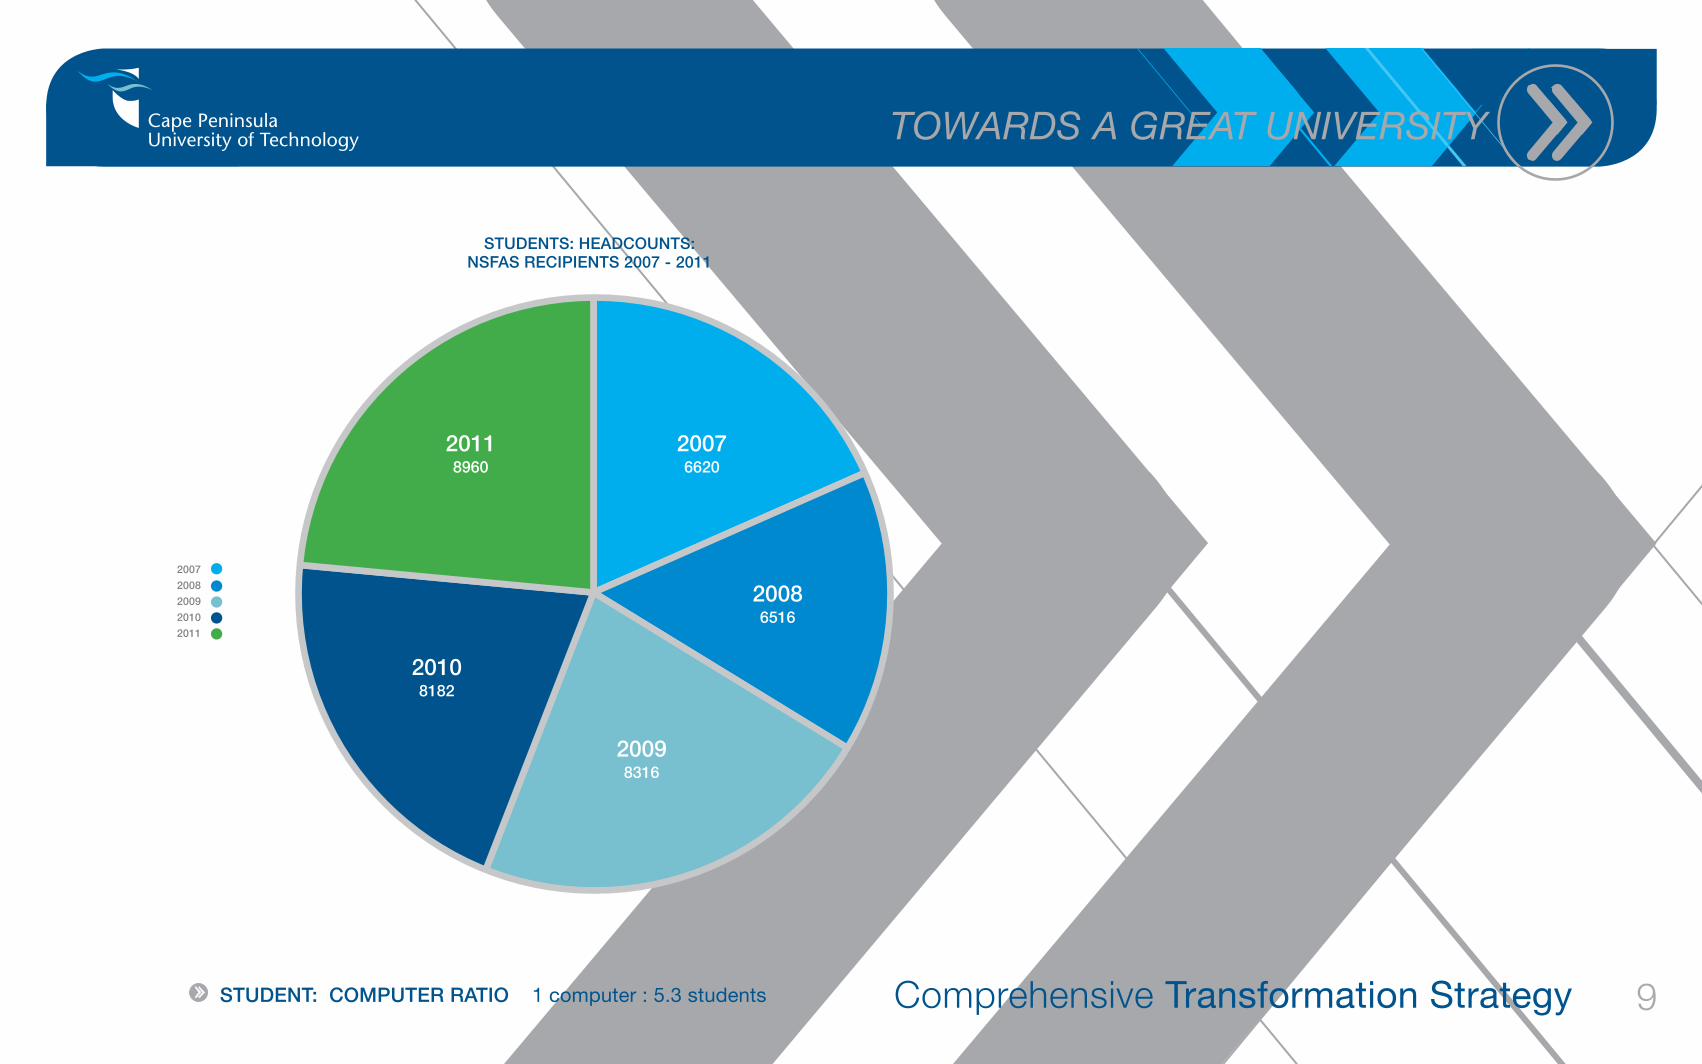
2007
2008 2009 2010 2011
STUdeNTS: HeAdCOUNTS:NSfAS ReCIPIeNTS 2007 - 2011
20118960
20076620
20098316
20108182
20086516
STUdeNT: COmPUTeR RATIO 1 computer : 5.3 students
Comprehensive Transformation Strategy
Towards a greaT UniversiTy
10
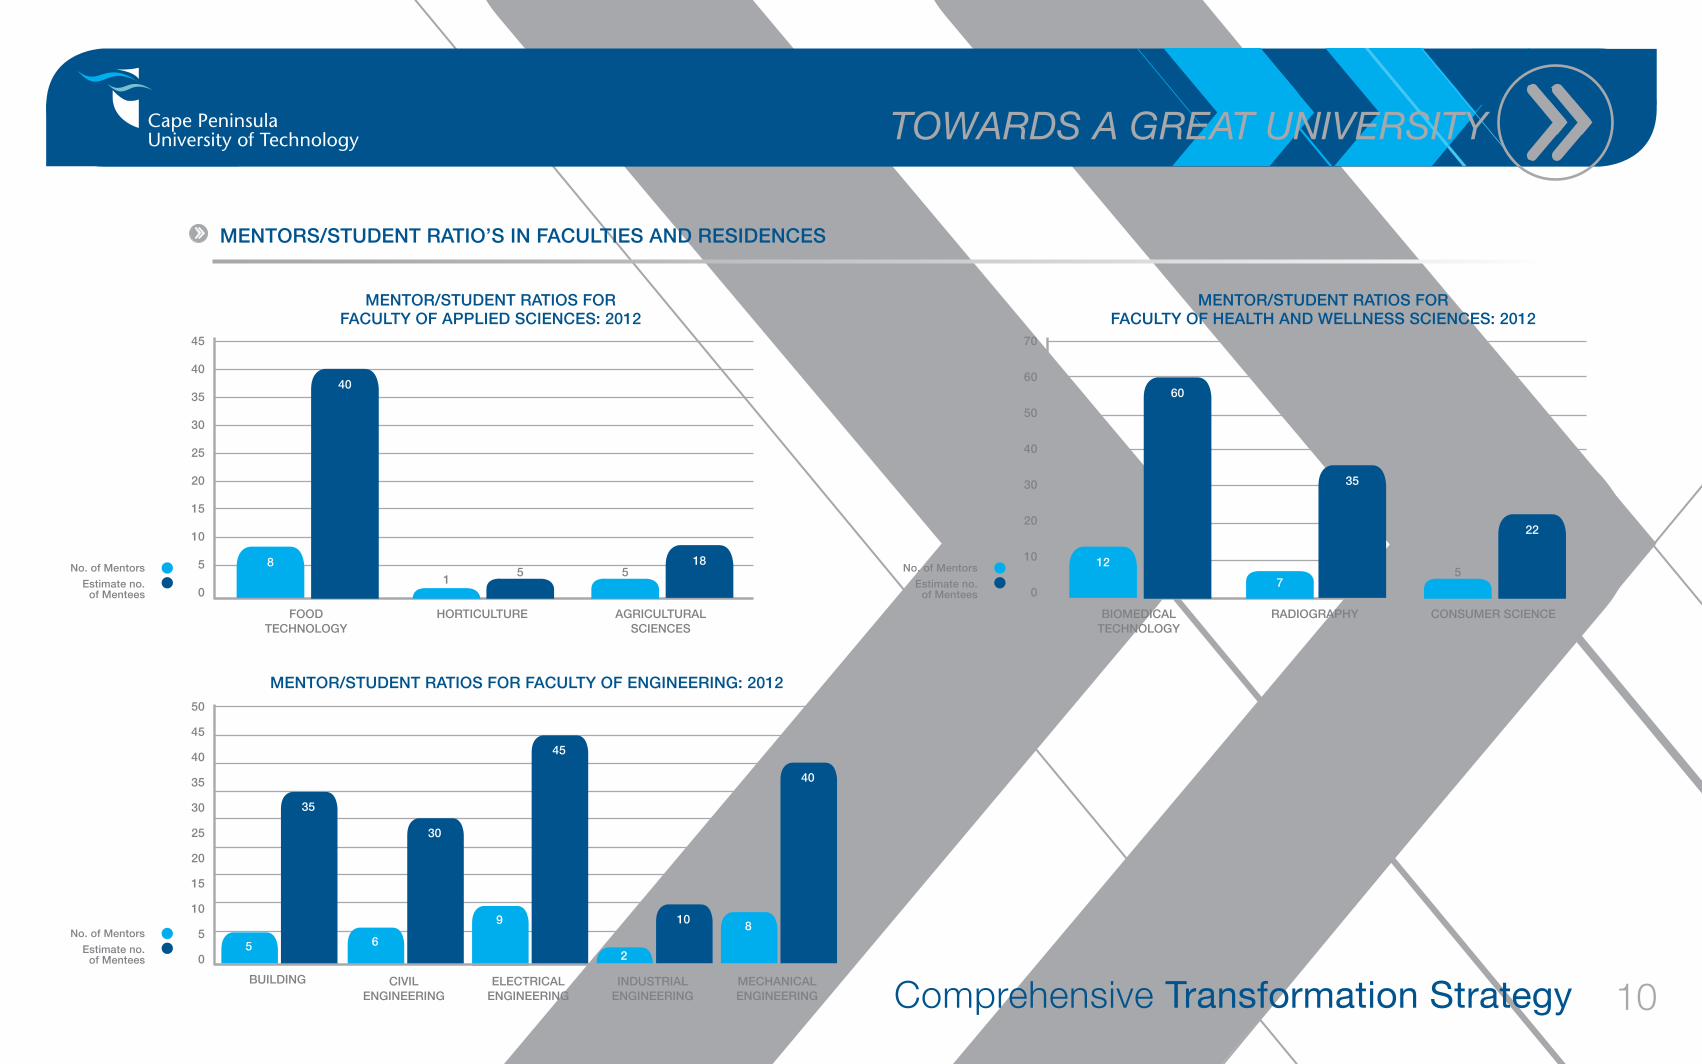
No. of mentors
estimate no. of mentees
meNTOR/STUdeNT RATIOS fORfACUlTy Of APPlIed SCIeNCeS: 2012
45
40
35
30
25
20
15
10
5
0
fOOdTeCHNOlOGy
HORTICUlTURe AGRICUlTURAl SCIeNCeS
81
5 5
40
18 No. of mentors
estimate no. of mentees
meNTOR/STUdeNT RATIOS fORfACUlTy Of HeAlTH ANd WellNeSS SCIeNCeS: 2012
70
60
50
40
30
20
10
0
bIOmedICAlTeCHNOlOGy
RAdIOGRAPHy CONSUmeR SCIeNCe
125
7
60
35
22
No. of mentors
estimate no. of mentees
meNTOR/STUdeNT RATIOS fOR fACUlTy Of eNGINeeRING: 201250
45
40
35
30
25
20
15
10
5
0
bUIldING
5
35
CIVIleNGINeeRING
6
30
eleCTRICAleNGINeeRING
9
45
INdUSTRIAleNGINeeRING
2
10
meCHANICAleNGINeeRING
8
40
meNTORS/STUdeNT RATIO’S IN fACUlTIeS ANd ReSIdeNCeS

Comprehensive Transformation Strategy
Towards a greaT UniversiTy
11
No. of mentors
estimate no. of mentees
meNTOR/STUdeNT RATIOS fORfACUlTy Of bUSINeSS: 2012
16
14
12
10
8
6
4
2
0
mANAGemeNT HUmAN ReSOURCemANAGemeNT
ACCOUNTING
2 23
10 10
15
No. of mentors
estimate no. of mentees
meNTOR/STUdeNT RATIOS fORfACUlTy Of INfORmATICS ANd deSIGN: 2012
120
100
80
60
40
20
0
GRAPHICS ANd INdUSTRIAl deSIGN
22
110
Comprehensive Transformation Strategy
Towards a greaT UniversiTy
12
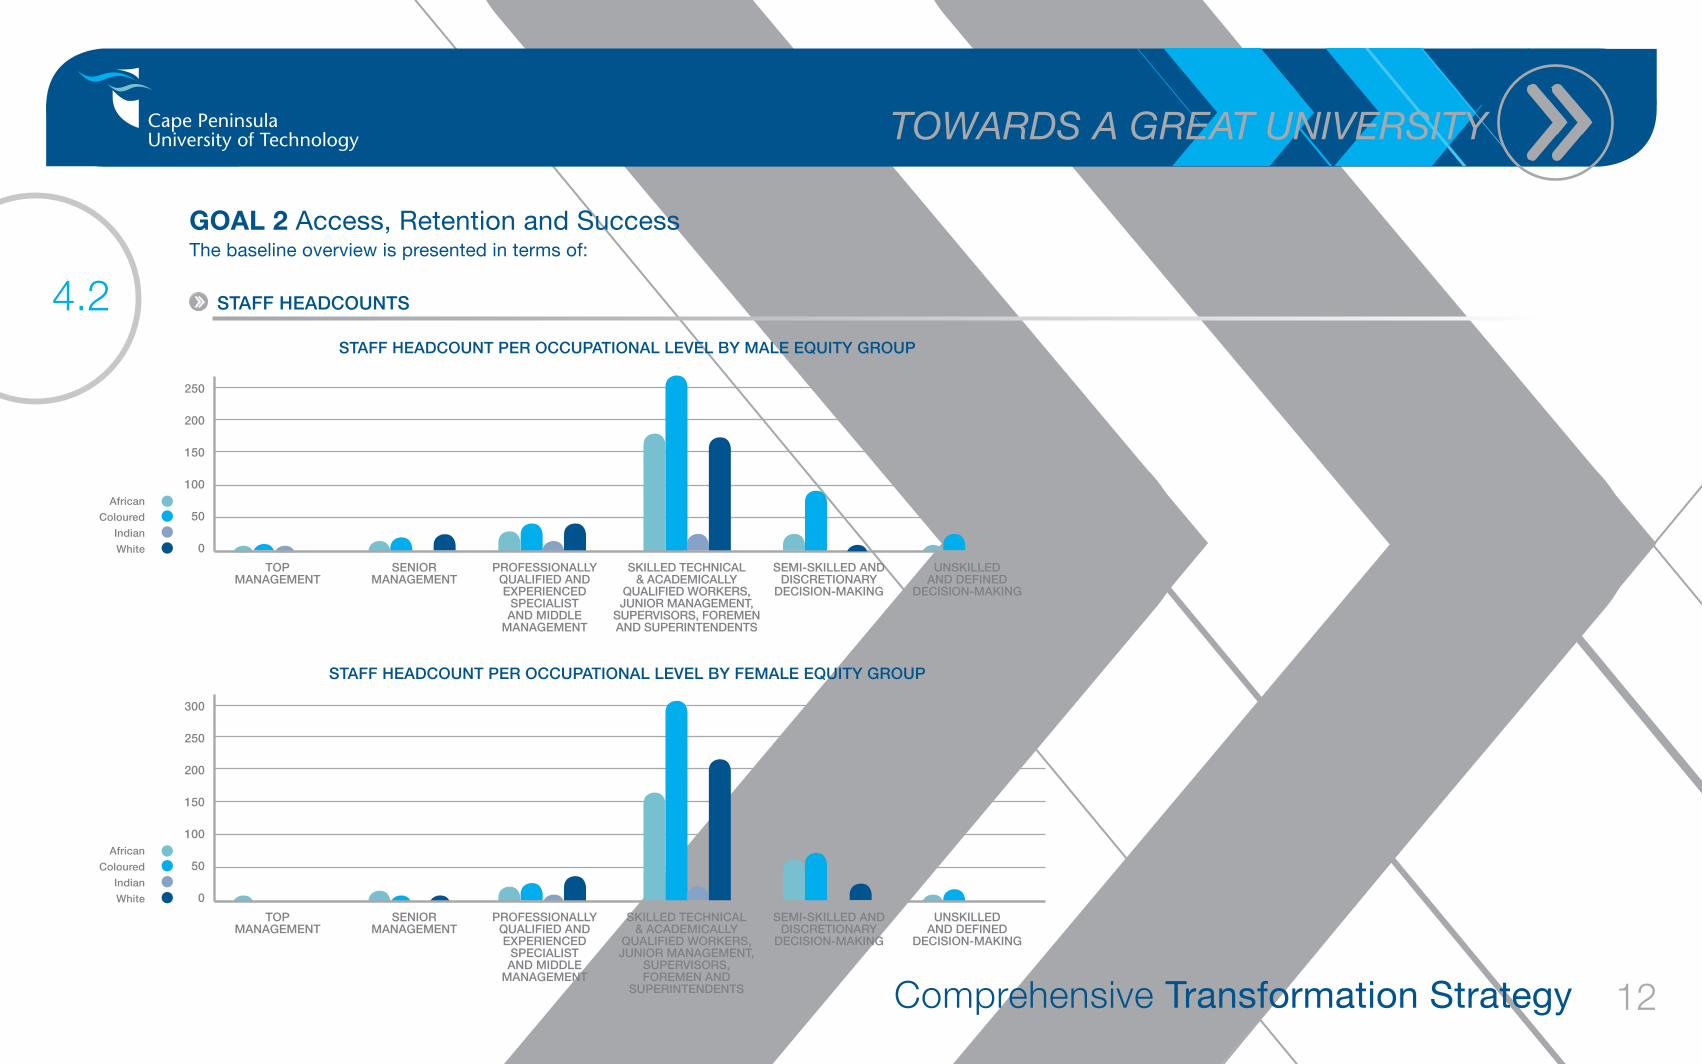
Goal 2 Access, Retention and Success The baseline overview is presented in terms of:
STAff HeAdCOUNTS
STAff HeAdCOUNT PeR OCCUPATIONAl leVel by mAle eQUITy GROUP
African
Coloured
Indian
White
250
200
150
100
50
0
TOPmANAGemeNT
SeNIORmANAGemeNT
PROfeSSIONAllyQUAlIfIed ANd eXPeRIeNCed
SPeCIAlIST ANd mIddle
mANAGemeNT
SKIlled TeCHNICAl & ACAdemICAlly
QUAlIfIed WORKeRS, JUNIOR mANAGemeNT,
SUPeRVISORS, fORemeN ANd SUPeRINTeNdeNTS
SemI-SKIlled ANd dISCReTIONARy
deCISION-mAKING
UNSKIlled ANd defINed
deCISION-mAKING
African
Coloured
Indian
White
STAff HeAdCOUNT PeR OCCUPATIONAl leVel by femAle eQUITy GROUP
300
250
200
150
100
50
0
TOPmANAGemeNT
SeNIORmANAGemeNT
PROfeSSIONAllyQUAlIfIed ANd eXPeRIeNCed
SPeCIAlIST ANd mIddle
mANAGemeNT
SKIlled TeCHNICAl & ACAdemICAlly
QUAlIfIed WORKeRS, JUNIOR mANAGemeNT,
SUPeRVISORS, fORemeN ANd
SUPeRINTeNdeNTS
SemI-SKIlled ANd dISCReTIONARy
deCISION-mAKING
UNSKIlled ANd defINed
deCISION-mAKING
4.2
Comprehensive Transformation Strategy
Towards a greaT UniversiTy
13
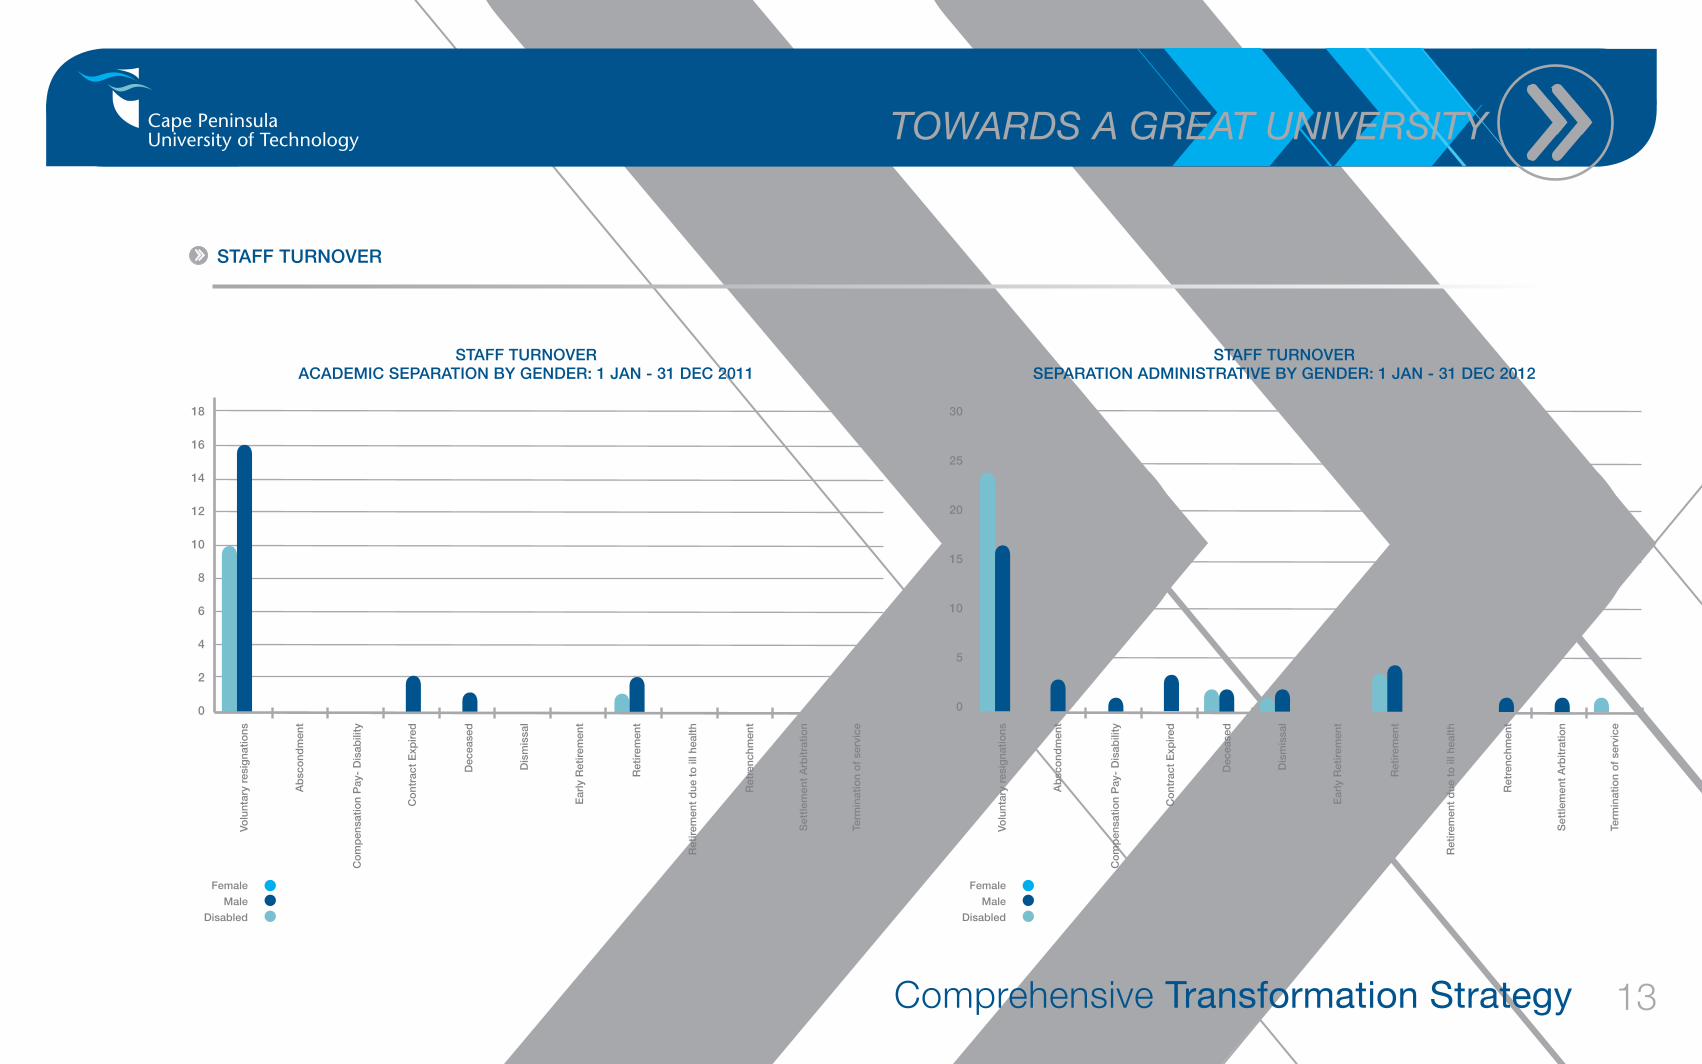
STAff TURNOVeR
female
male
disabled
STAff TURNOVeRACAdemIC SePARATION by GeNdeR: 1 JAN - 31 deC 2011
18
16
14
12
10
8
6
4
2
0
Volu
ntar
y re
sig
natio
ns
Ab
sco
ndm
ent
Co
mp
ensa
tion
Pay
- d
isab
ility
Co
ntra
ct e
xpire
d
dec
ease
d
dis
mis
sal
ear
ly R
etire
men
t
Ret
irem
ent
Ret
irem
ent
due
to
ill h
ealth
Ret
renc
hmen
t
Set
tlem
ent
Arb
itrat
ion
Term
inat
ion
of
serv
ice
female
male
disabled
STAff TURNOVeRSePARATION AdmINISTRATIVe by GeNdeR: 1 JAN - 31 deC 2012
30
25
20
15
10
5
0
Volu
ntar
y re
sig
natio
ns
Ab
sco
ndm
ent
Co
mp
ensa
tion
Pay
- d
isab
ility
Co
ntra
ct e
xpire
d
dec
ease
d
dis
mis
sal
ear
ly R
etire
men
t
Ret
irem
ent
Ret
irem
ent
due
to
ill h
ealth
Ret
renc
hmen
t
Set
tlem
ent
Arb
itrat
ion
Term
inat
ion
of
serv
ice
Comprehensive Transformation Strategy
Towards a greaT UniversiTy
14
African
Coloured
Indian
White
African
Coloured
Indian
White
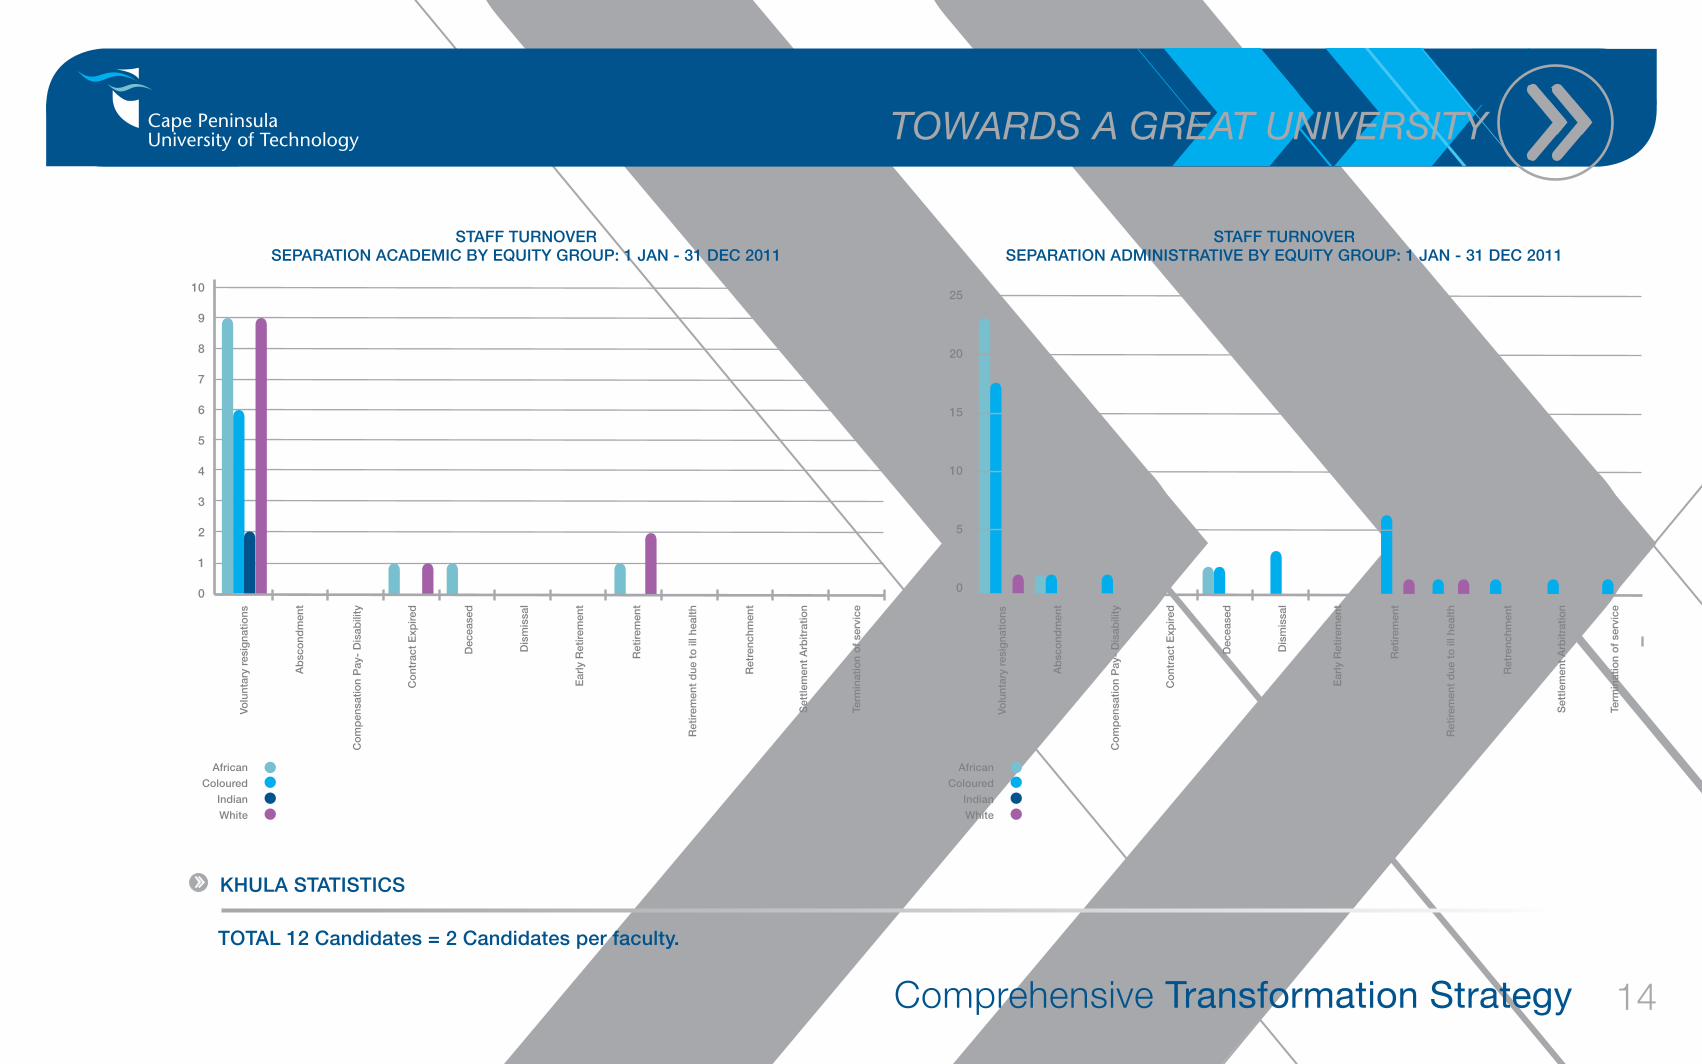
STAff TURNOVeRSePARATION ACAdemIC by eQUITy GROUP: 1 JAN - 31 deC 2011
10
9
8
7
6
5
4
3
2
1
0
Volu
ntar
y re
sig
natio
ns
Ab
sco
ndm
ent
Co
mp
ensa
tion
Pay
- d
isab
ility
Co
ntra
ct e
xpire
d
dec
ease
d
dis
mis
sal
ear
ly R
etire
men
t
Ret
irem
ent
Ret
irem
ent
due
to
ill h
ealth
Ret
renc
hmen
t
Set
tlem
ent
Arb
itrat
ion
Term
inat
ion
of
serv
ice
STAff TURNOVeRSePARATION AdmINISTRATIVe by eQUITy GROUP: 1 JAN - 31 deC 2011
25
20
15
10
5
0
Volu
ntar
y re
sig
natio
ns
Ab
sco
ndm
ent
Co
mp
ensa
tion
Pay
- d
isab
ility
Co
ntra
ct e
xpire
d
dec
ease
d
dis
mis
sal
ear
ly R
etire
men
t
Ret
irem
ent
Ret
irem
ent
due
to
ill h
ealth
Ret
renc
hmen
t
Set
tlem
ent
Arb
itrat
ion
Term
inat
ion
of
serv
ice
KHUlA STATISTICS
TOTAl 12 Candidates = 2 Candidates per faculty.

Comprehensive Transformation Strategy
Towards a greaT UniversiTy
15
Goal 3 Diversity The baseline overview is presented in terms of:
STAff HeAdCOUNTS IN TeRmS Of AGe, eQUITy ANd lANGUAGe
2009
2010
2011
350
300
250
200
150
100
50
0
21-22 23-24 25-29 30-34 35-39 40-44 45-49 50-54 55-59 60-65 65-
STAff HeAdCOUNTS by AGe GROUP: 2009 - 2011
4.3
Comprehensive Transformation Strategy
Towards a greaT UniversiTy
16
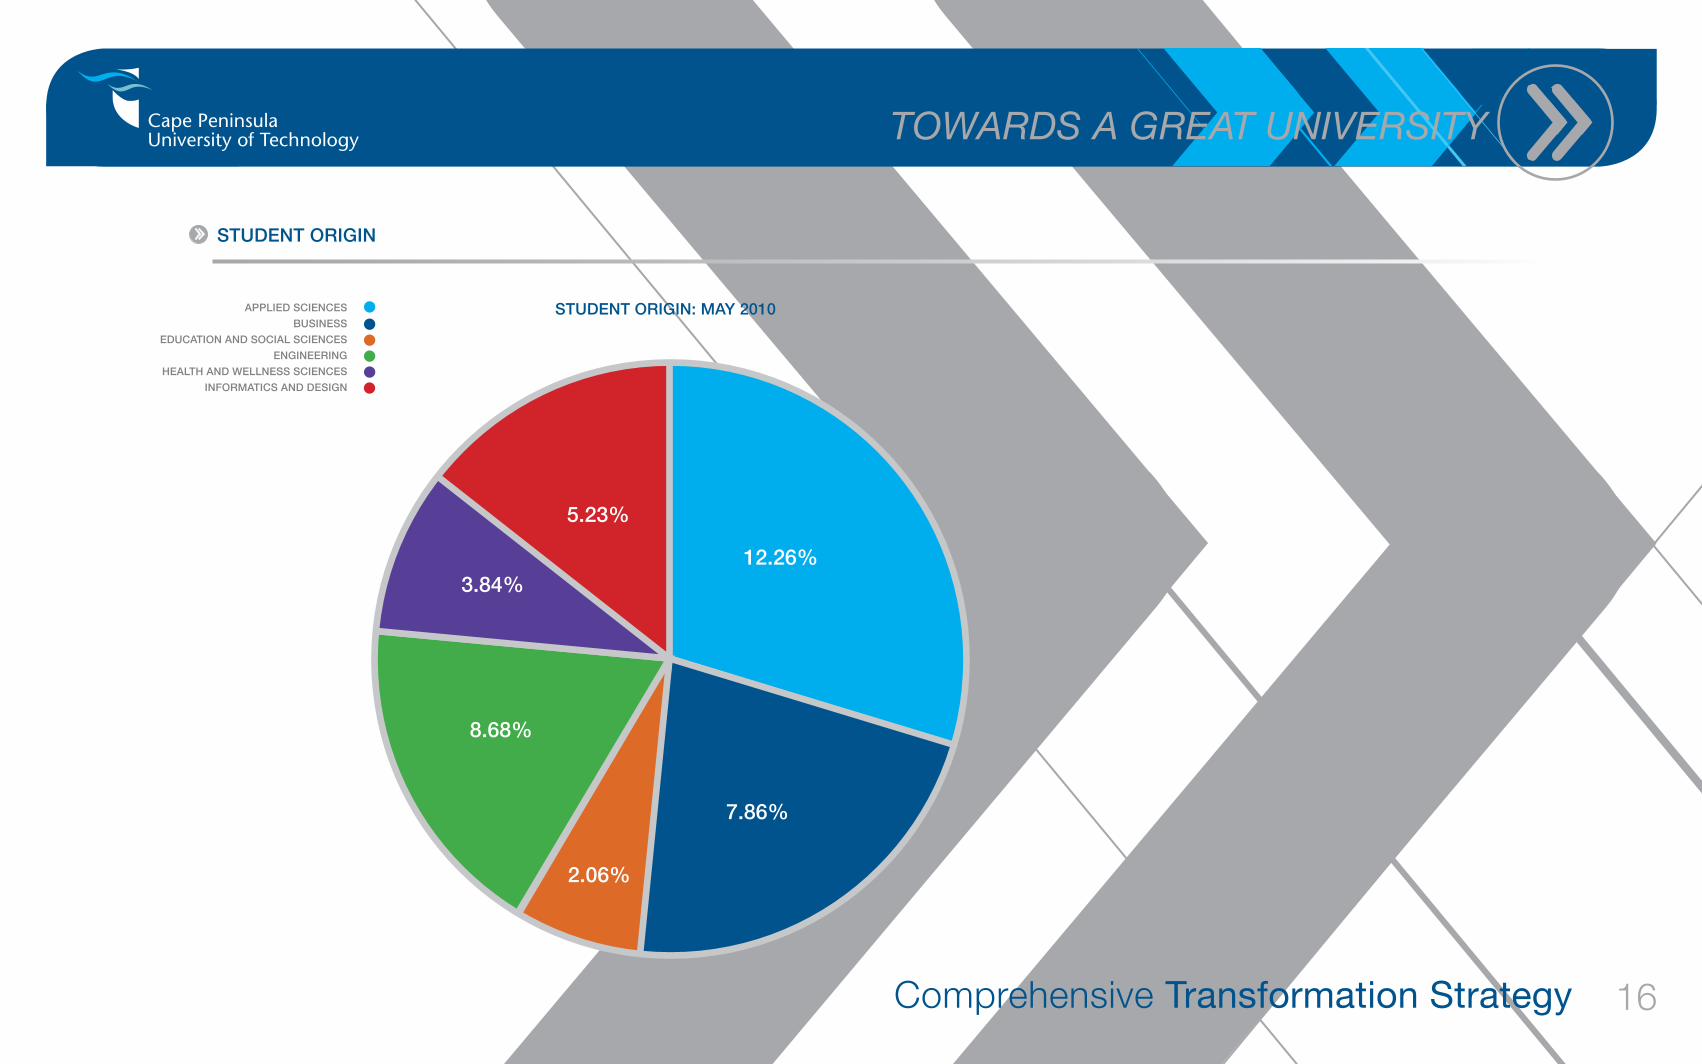
APPlIed SCIeNCeS
bUSINeSS edUCATION ANd SOCIAl SCIeNCeS eNGINeeRING HeAlTH ANd WellNeSS SCIeNCeS INfORmATICS ANd deSIGN
STUdeNT ORIGIN: mAy 2010
12.26%
7.86%
2.06%
8.68%
3.84%
5.23%
STUdeNT ORIGIN
Comprehensive Transformation Strategy
Towards a greaT UniversiTy
17
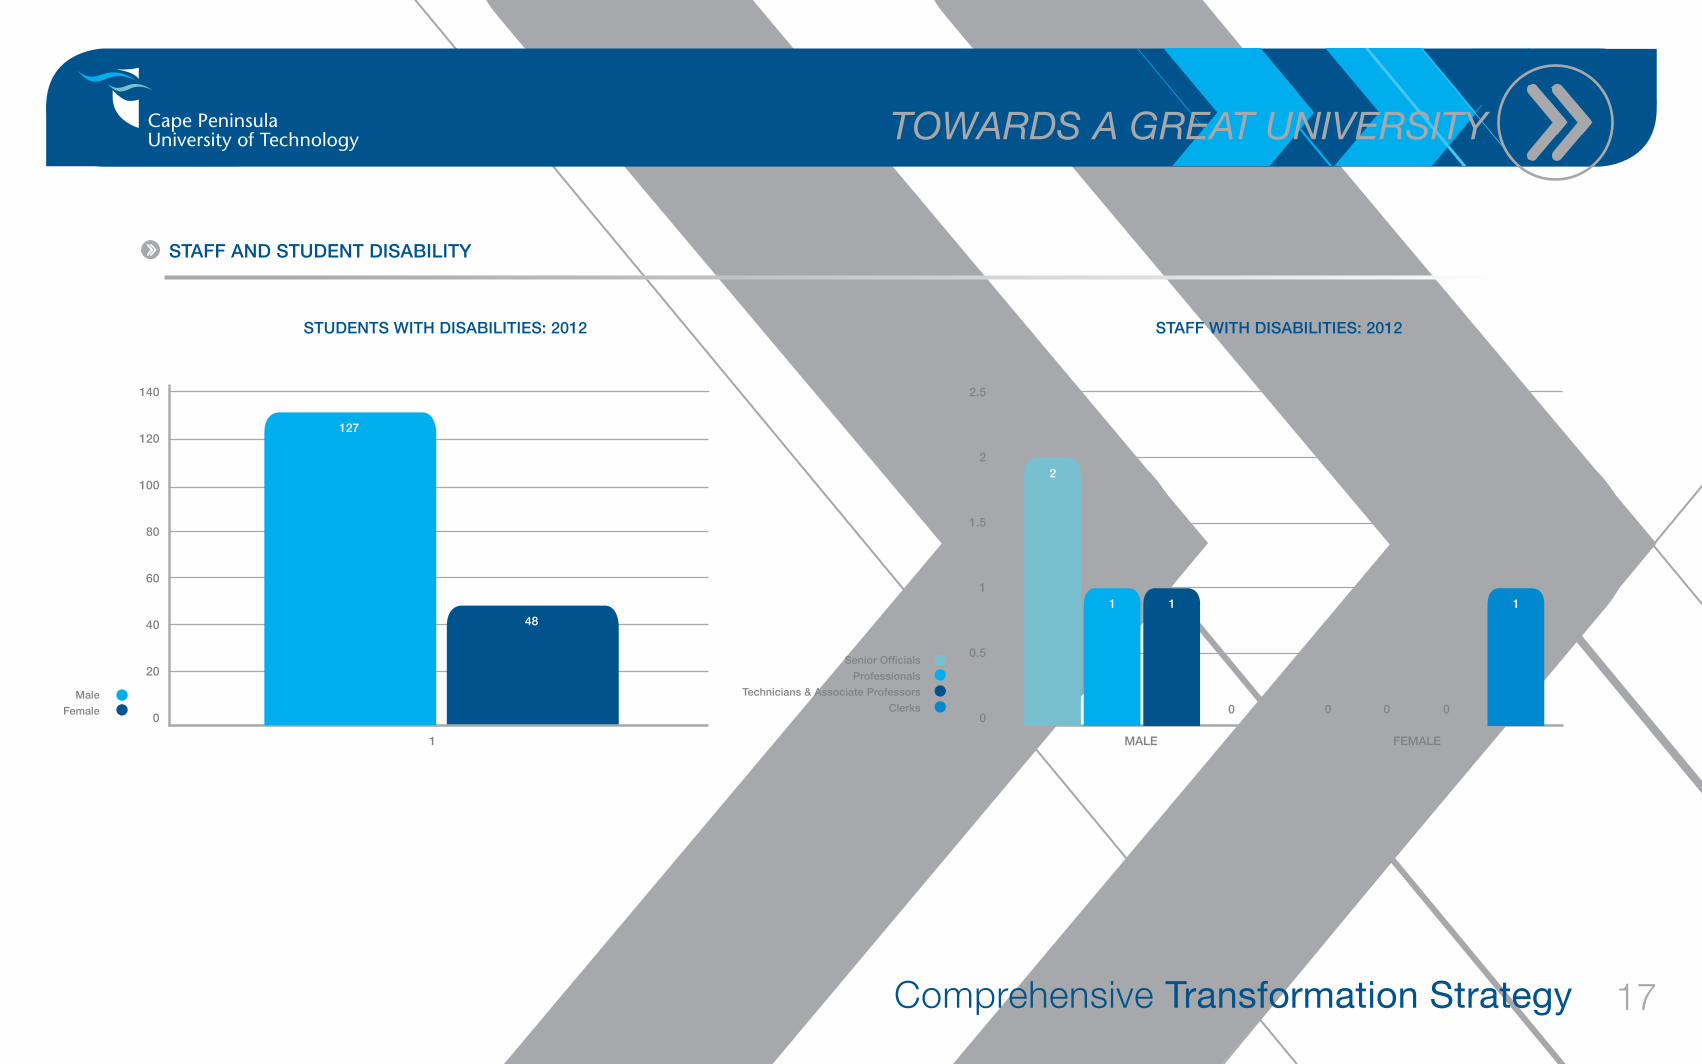
STAff ANd STUdeNT dISAbIlITy
male
female
Senior Officials
Professionals
Technicians & Associate Professors
Clerks
STUdeNTS WITH dISAbIlITIeS: 2012 STAff WITH dISAbIlITIeS: 2012
140
120
100
80
60
40
20
0
2.5
2
1.5
1
0.5
0
1 mAle femAle
127
2
1 1 1
0 0 0 0
48
Comprehensive Transformation Strategy
Towards a greaT UniversiTy
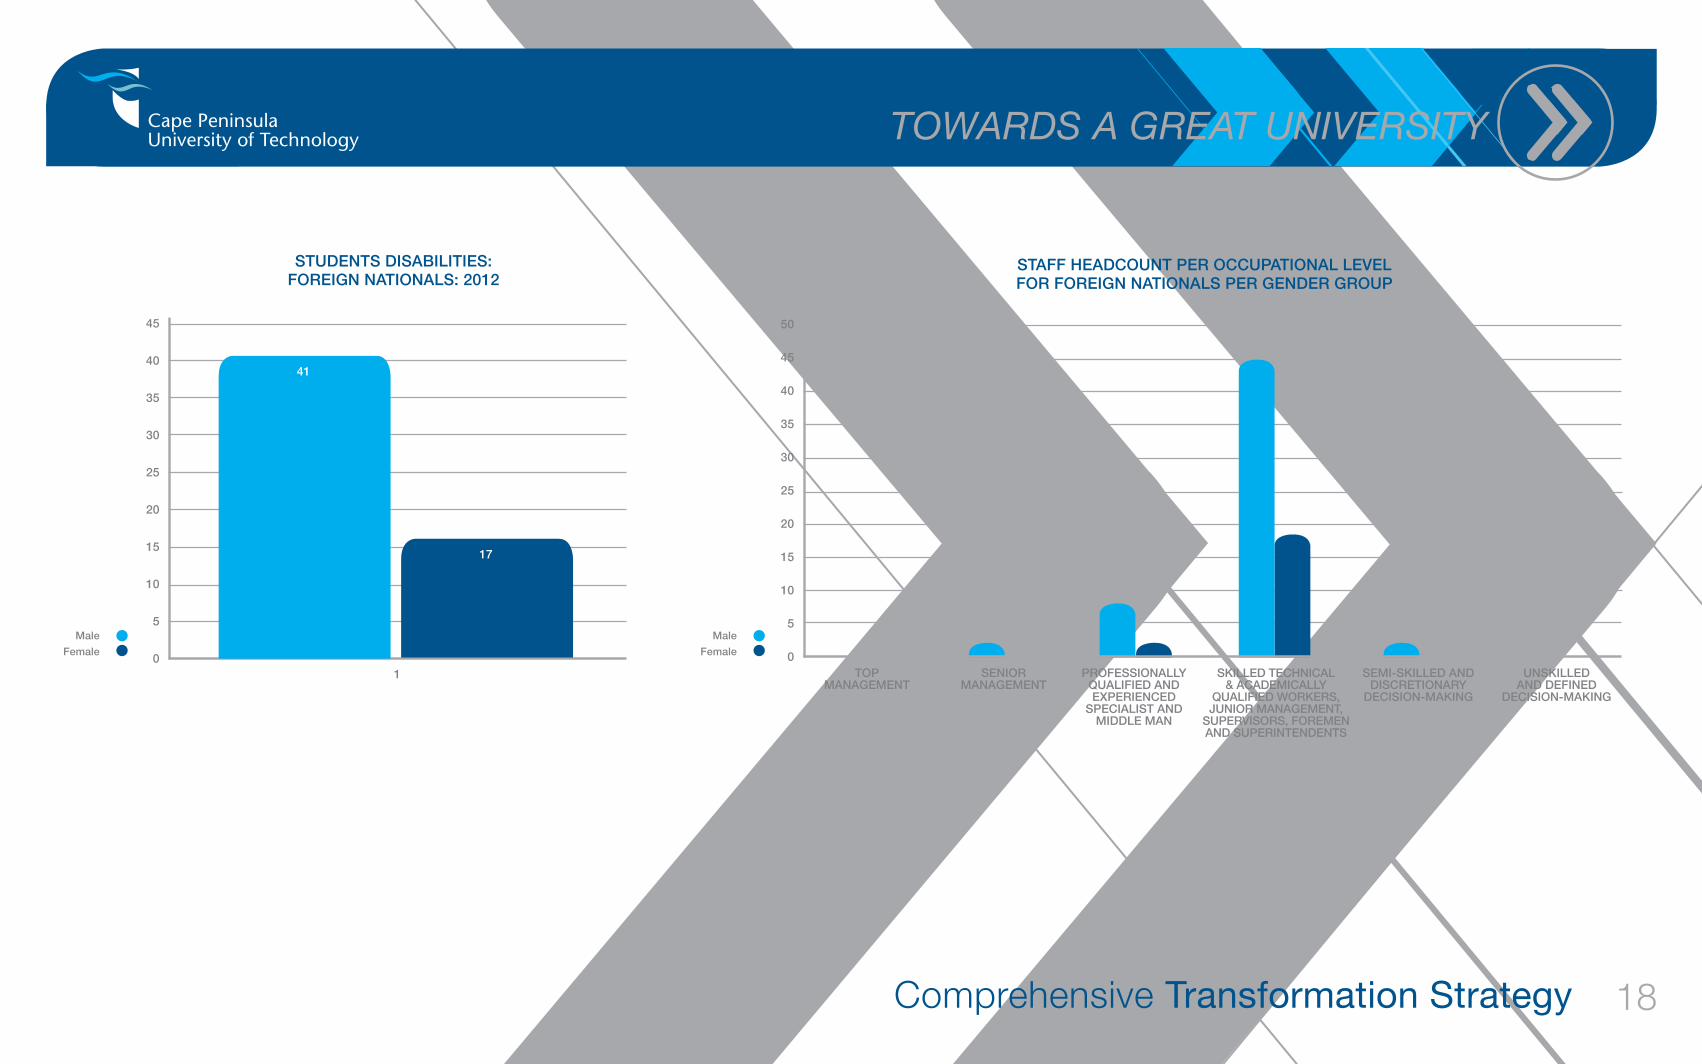
18
male
female
STUdeNTS dISAbIlITIeS:fOReIGN NATIONAlS: 2012
45
40
35
30
25
20
15
10
5
01
41
17
male
female
STAff HeAdCOUNT PeR OCCUPATIONAl leVelfOR fOReIGN NATIONAlS PeR GeNdeR GROUP
50
45
40
35
30
25
20
15
10
5
0TOP
mANAGemeNTSeNIOR
mANAGemeNTPROfeSSIONAlly
QUAlIfIed ANd eXPeRIeNCed
SPeCIAlIST ANd mIddle mAN
SKIlled TeCHNICAl & ACAdemICAlly
QUAlIfIed WORKeRS, JUNIOR mANAGemeNT,
SUPeRVISORS, fORemeN ANd SUPeRINTeNdeNTS
SemI-SKIlled ANd dISCReTIONARy
deCISION-mAKING
UNSKIlled ANd defINed
deCISION-mAKING
Comprehensive Transformation Strategy
Towards a greaT UniversiTy
19
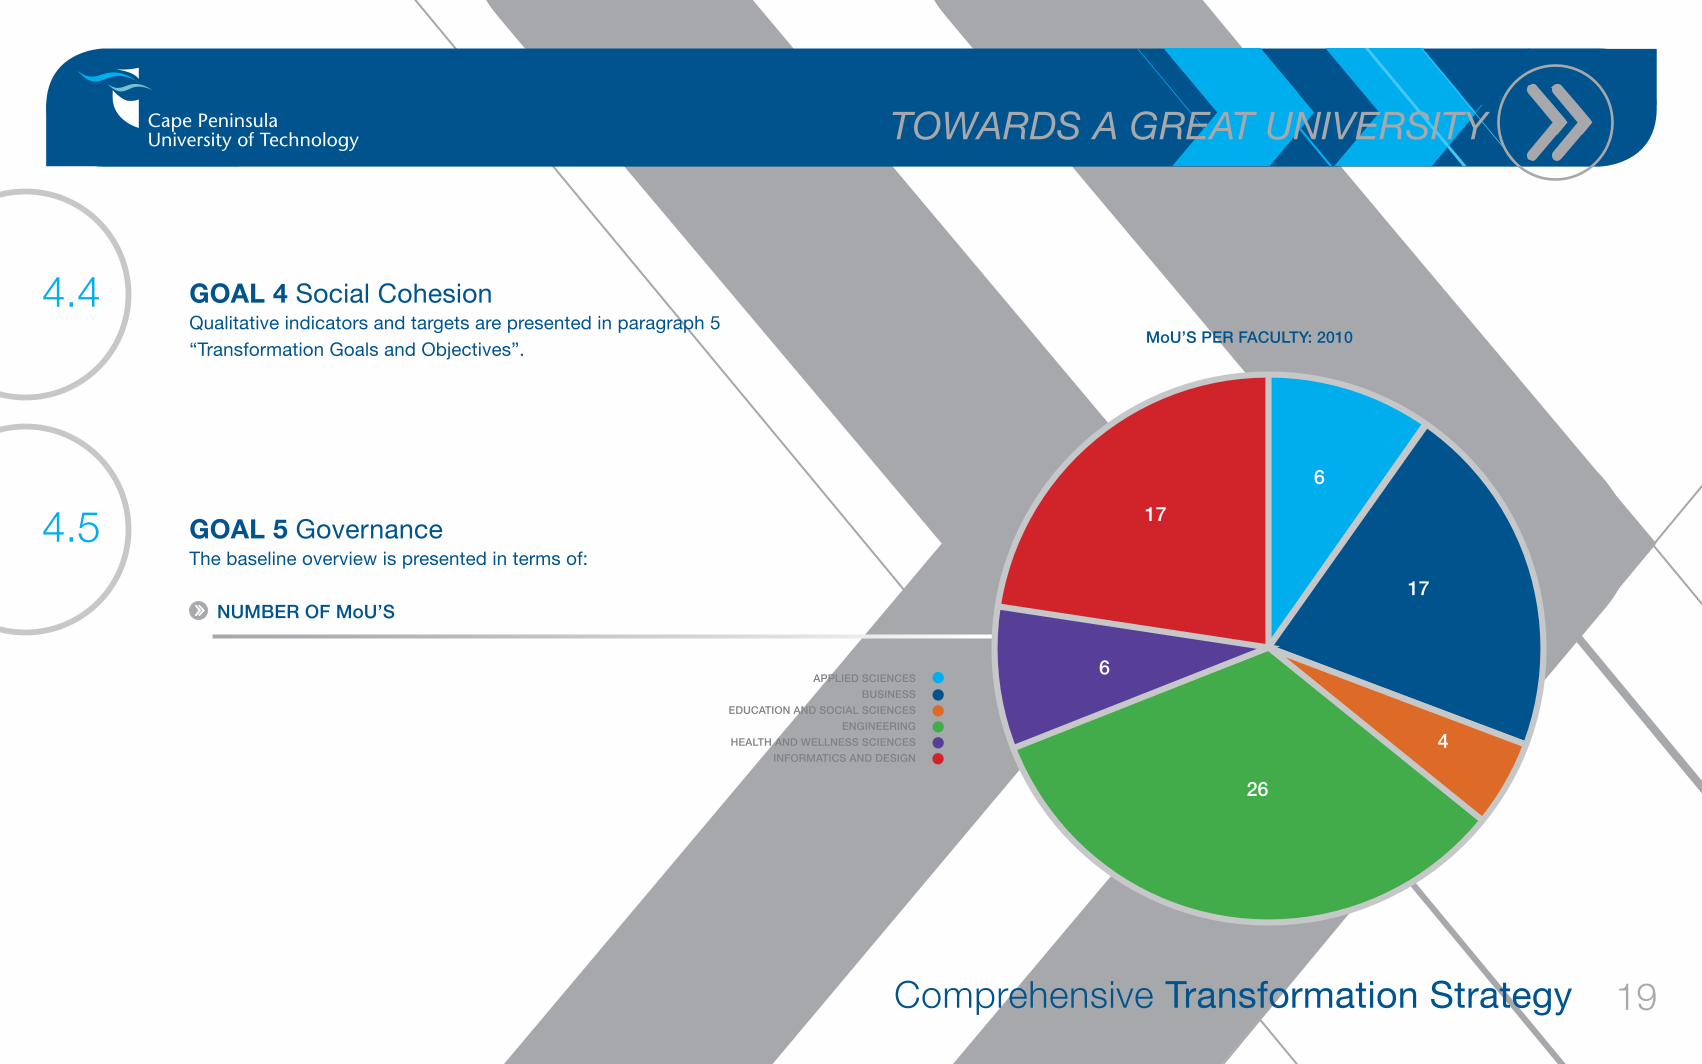
Goal 4 Social Cohesion Qualitative indicators and targets are presented in paragraph 5 “Transformation Goals and Objectives”.
4.4
4.5 Goal 5 Governance The baseline overview is presented in terms of:
NUmbeR Of moU’S
APPlIed SCIeNCeS
bUSINeSS edUCATION ANd SOCIAl SCIeNCeS eNGINeeRING HeAlTH ANd WellNeSS SCIeNCeS INfORmATICS ANd deSIGN
moU’S PeR fACUlTy: 2010
6
17
4
26
6
17
Comprehensive Transformation Strategy
Towards a greaT UniversiTy
20
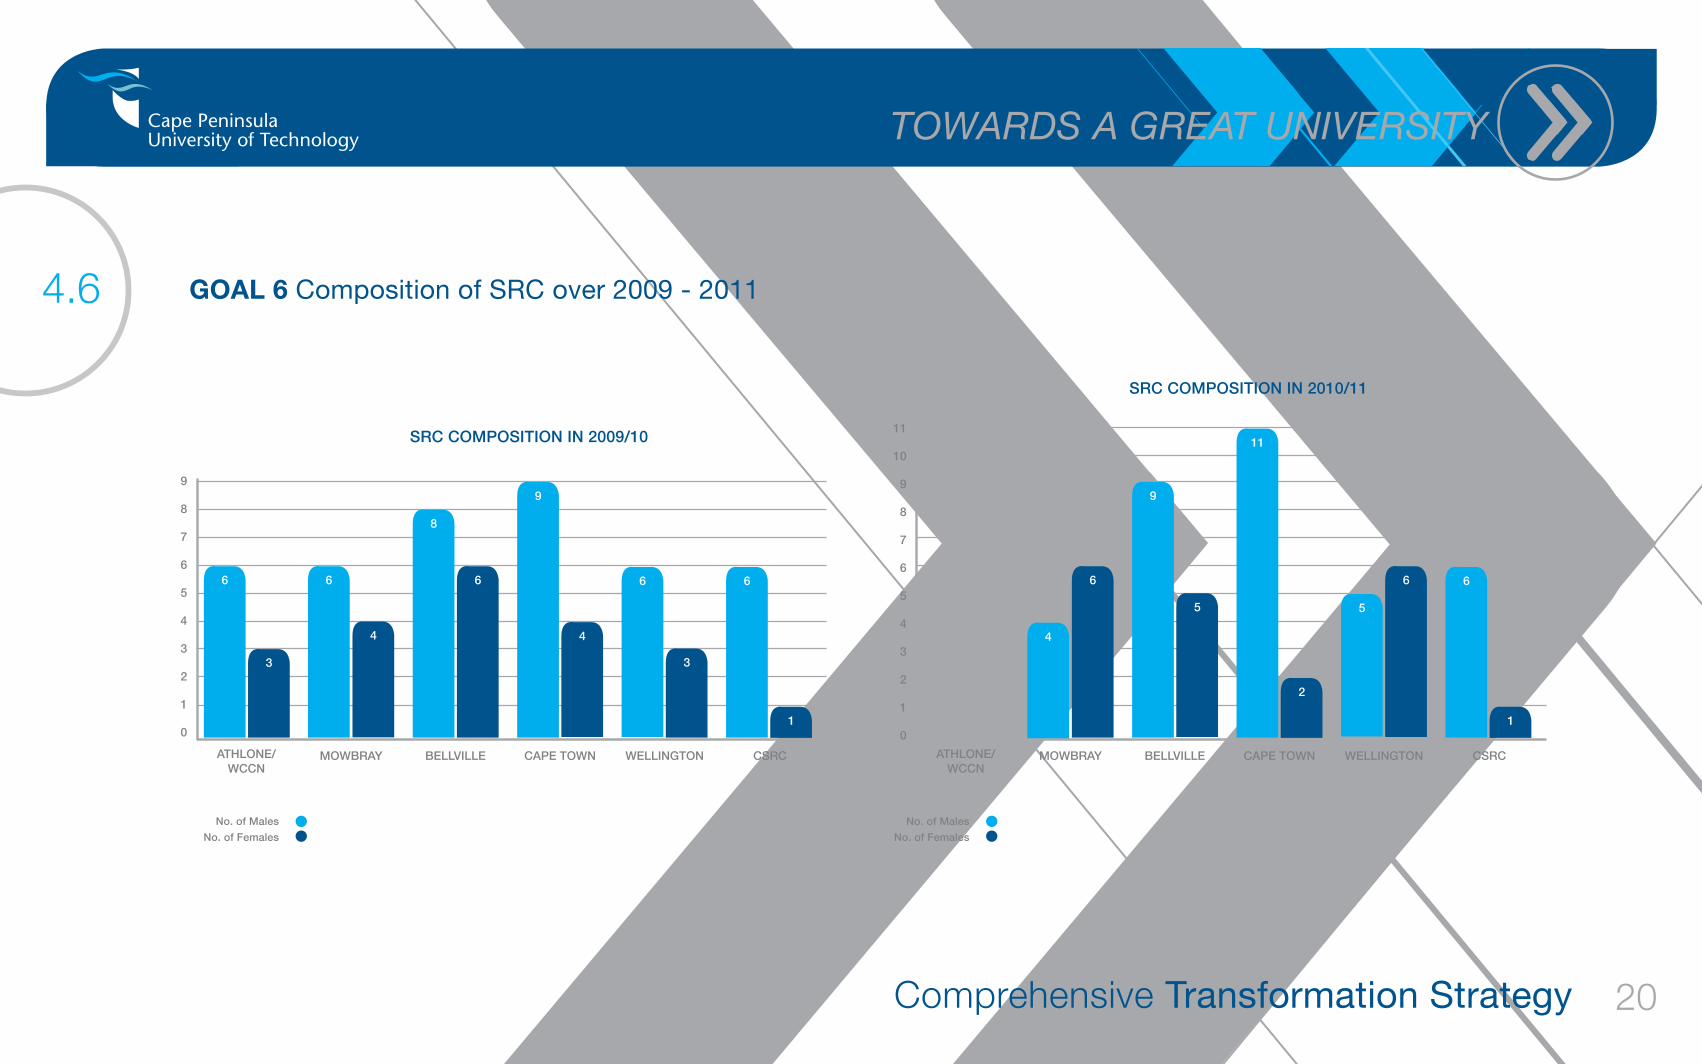
Goal 6 Composition of SRC over 2009 - 20114.6
SRC COmPOSITION IN 2009/10
SRC COmPOSITION IN 2010/11
No. of males
No. of females
No. of males
No. of females
9
8
7
6
5
4
3
2
1
0
11
10
9
8
7
6
5
4
3
2
1
0
ATHlONe/WCCN
ATHlONe/WCCN
6 6
4
8
99
11
6
5
6 6
3
4
66
5
4
2
3
6
1 1
mOWbRAy mOWbRAybellVIlle bellVIlleCAPe TOWN CAPe TOWNWellINGTON WellINGTONCSRC CSRC
Comprehensive Transformation Strategy
Towards a greaT UniversiTy
21
Transformation Goals and Objectives
5
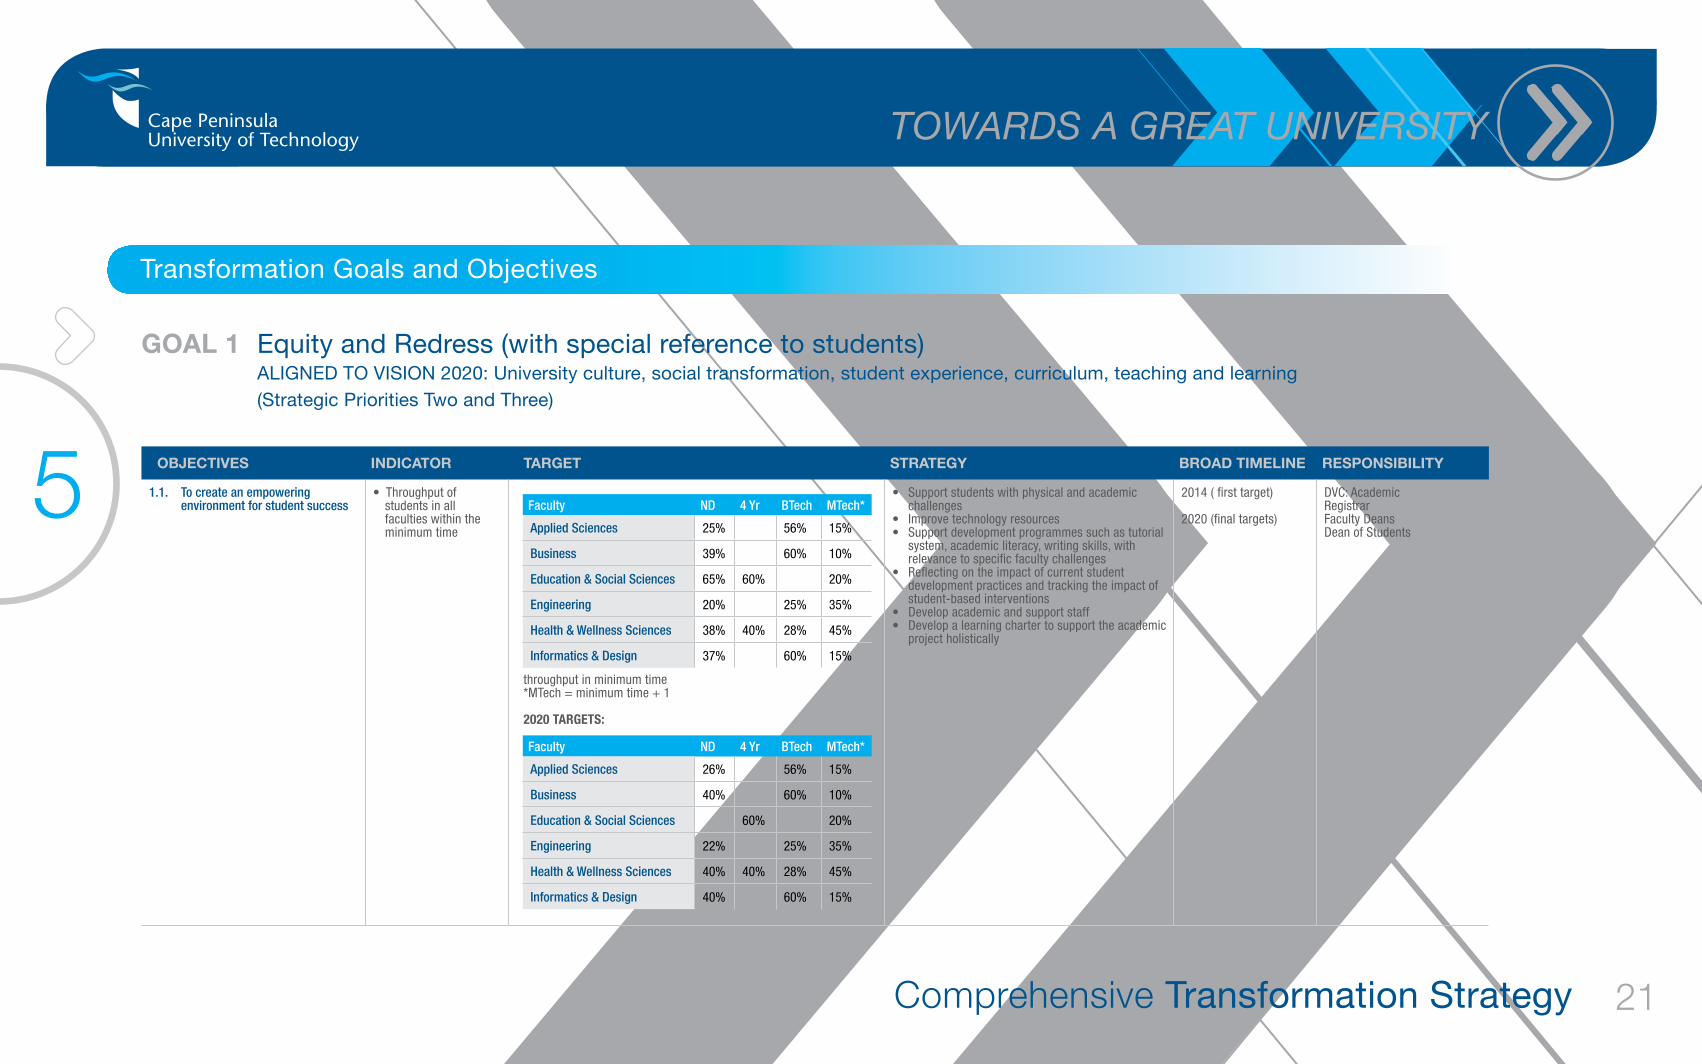
Goal 1 Equity and Redress (with special reference to students) ALIGNED TO VISION 2020: University culture, social transformation, student experience, curriculum, teaching and learning (Strategic Priorities Two and Three)
oBJeCTiveS indiCaTor TarGeT STraTeGY Broad TiMeline reSponSiBiliTY
1.1. Tocreateanempoweringenvironmentforstudentsuccess
• Throughput of students in all faculties within the minimum time
throughput in minimum time*MTech = minimum time + 1
2020 targets:
• Support students with physical and academic challenges
• Improve technology resources • Support development programmes such as tutorial
system, academic literacy, writing skills, with relevance to specific faculty challenges
• Reflecting on the impact of current student development practices and tracking the impact of student-based interventions
• Develop academic and support staff• Develop a learning charter to support the academic
project holistically
2014 ( first target)
2020 (final targets)
DVC: AcademicRegistrarFaculty DeansDean of Students
Faculty ND 4Yr BTech MTech*
AppliedSciences 25% 56% 15%
Business 39% 60% 10%
Education&SocialSciences 65% 60% 20%
Engineering 20% 25% 35%
Health&WellnessSciences 38% 40% 28% 45%
Informatics&Design 37% 60% 15%
Faculty ND 4Yr BTech MTech*
AppliedSciences 26% 56% 15%
Business 40% 60% 10%
Education&SocialSciences 60% 20%
Engineering 22% 25% 35%
Health&WellnessSciences 40% 40% 28% 45%
Informatics&Design 40% 60% 15%
Comprehensive Transformation Strategy
Towards a greaT UniversiTy
22
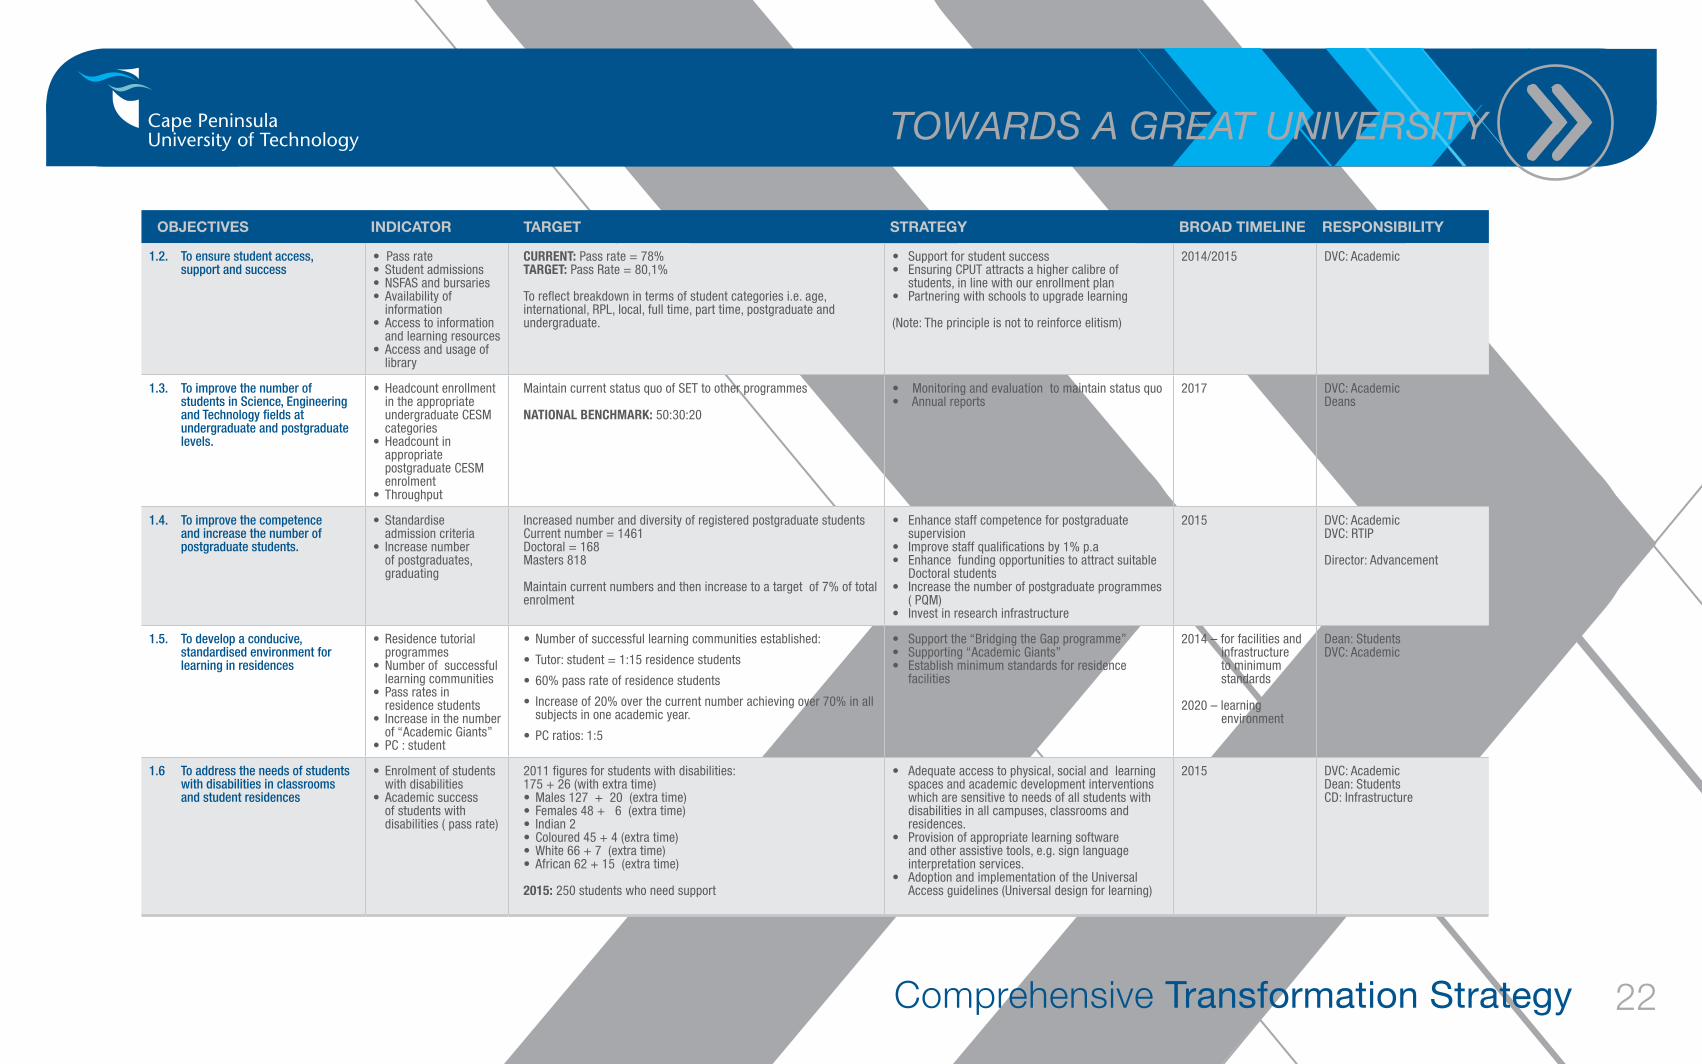
oBJeCTiveS indiCaTor TarGeT STraTeGY Broad TiMeline reSponSiBiliTY
1.2. Toensurestudentaccess,supportandsuccess
• Pass rate• Student admissions• NSFAS and bursaries• Availability of
information• Access to information
and learning resources• Access and usage of
library
Current: Pass rate = 78%target: Pass Rate = 80,1%
To reflect breakdown in terms of student categories i.e. age, international, RPL, local, full time, part time, postgraduate and undergraduate.
• Support for student success• Ensuring CPUT attracts a higher calibre of
students, in line with our enrollment plan• Partnering with schools to upgrade learning
(Note: The principle is not to reinforce elitism)
2014/2015 DVC: Academic
1.3. ToimprovethenumberofstudentsinScience,EngineeringandTechnologyfieldsatundergraduateandpostgraduatelevels.
• Headcount enrollment in the appropriate undergraduate CESM categories
• Headcount in appropriate postgraduate CESM enrolment
• Throughput
Maintain current status quo of SET to other programmes
national benChmark: 50:30:20
• Monitoring and evaluation to maintain status quo• Annual reports
2017 DVC: AcademicDeans
1.4. Toimprovethecompetenceandincreasethenumberofpostgraduatestudents.
• Standardise admission criteria
• Increase number of postgraduates, graduating
Increased number and diversity of registered postgraduate studentsCurrent number = 1461Doctoral = 168Masters 818
Maintain current numbers and then increase to a target of 7% of total enrolment
• Enhance staff competence for postgraduate supervision
• Improve staff qualifications by 1% p.a• Enhance funding opportunities to attract suitable
Doctoral students• Increase the number of postgraduate programmes
( PQM)• Invest in research infrastructure
2015 DVC: AcademicDVC: RTIP
Director: Advancement
1.5. Todevelopaconducive,standardisedenvironmentforlearninginresidences
• Residence tutorial programmes
• Number of successful learning communities
• Pass rates in residence students
• Increase in the number of “Academic Giants”
• PC : student
• Number of successful learning communities established:
• Tutor: student = 1:15 residence students
• 60% pass rate of residence students
• Increase of 20% over the current number achieving over 70% in all subjects in one academic year.
• PC ratios: 1:5
• Support the “Bridging the Gap programme”• Supporting “Academic Giants”• Establish minimum standards for residence
facilities
2014 – for facilities and infrastructure to minimum standards
2020 – learning environment
Dean: StudentsDVC: Academic
1.6 Toaddresstheneedsofstudentswithdisabilitiesinclassroomsandstudentresidences
• Enrolment of students with disabilities
• Academic success of students with disabilities ( pass rate)
2011 figures for students with disabilities:175 + 26 (with extra time) • Males 127 + 20 (extra time)• Females 48 + 6 (extra time)• Indian 2• Coloured 45 + 4 (extra time)• White 66 + 7 (extra time)• African 62 + 15 (extra time)
2015: 250 students who need support
• Adequate access to physical, social and learning spaces and academic development interventions which are sensitive to needs of all students with disabilities in all campuses, classrooms and residences.
• Provision of appropriate learning software and other assistive tools, e.g. sign language interpretation services.
• Adoption and implementation of the Universal Access guidelines (Universal design for learning)
2015 DVC: AcademicDean: StudentsCD: Infrastructure
Comprehensive Transformation Strategy
Towards a greaT UniversiTy
23
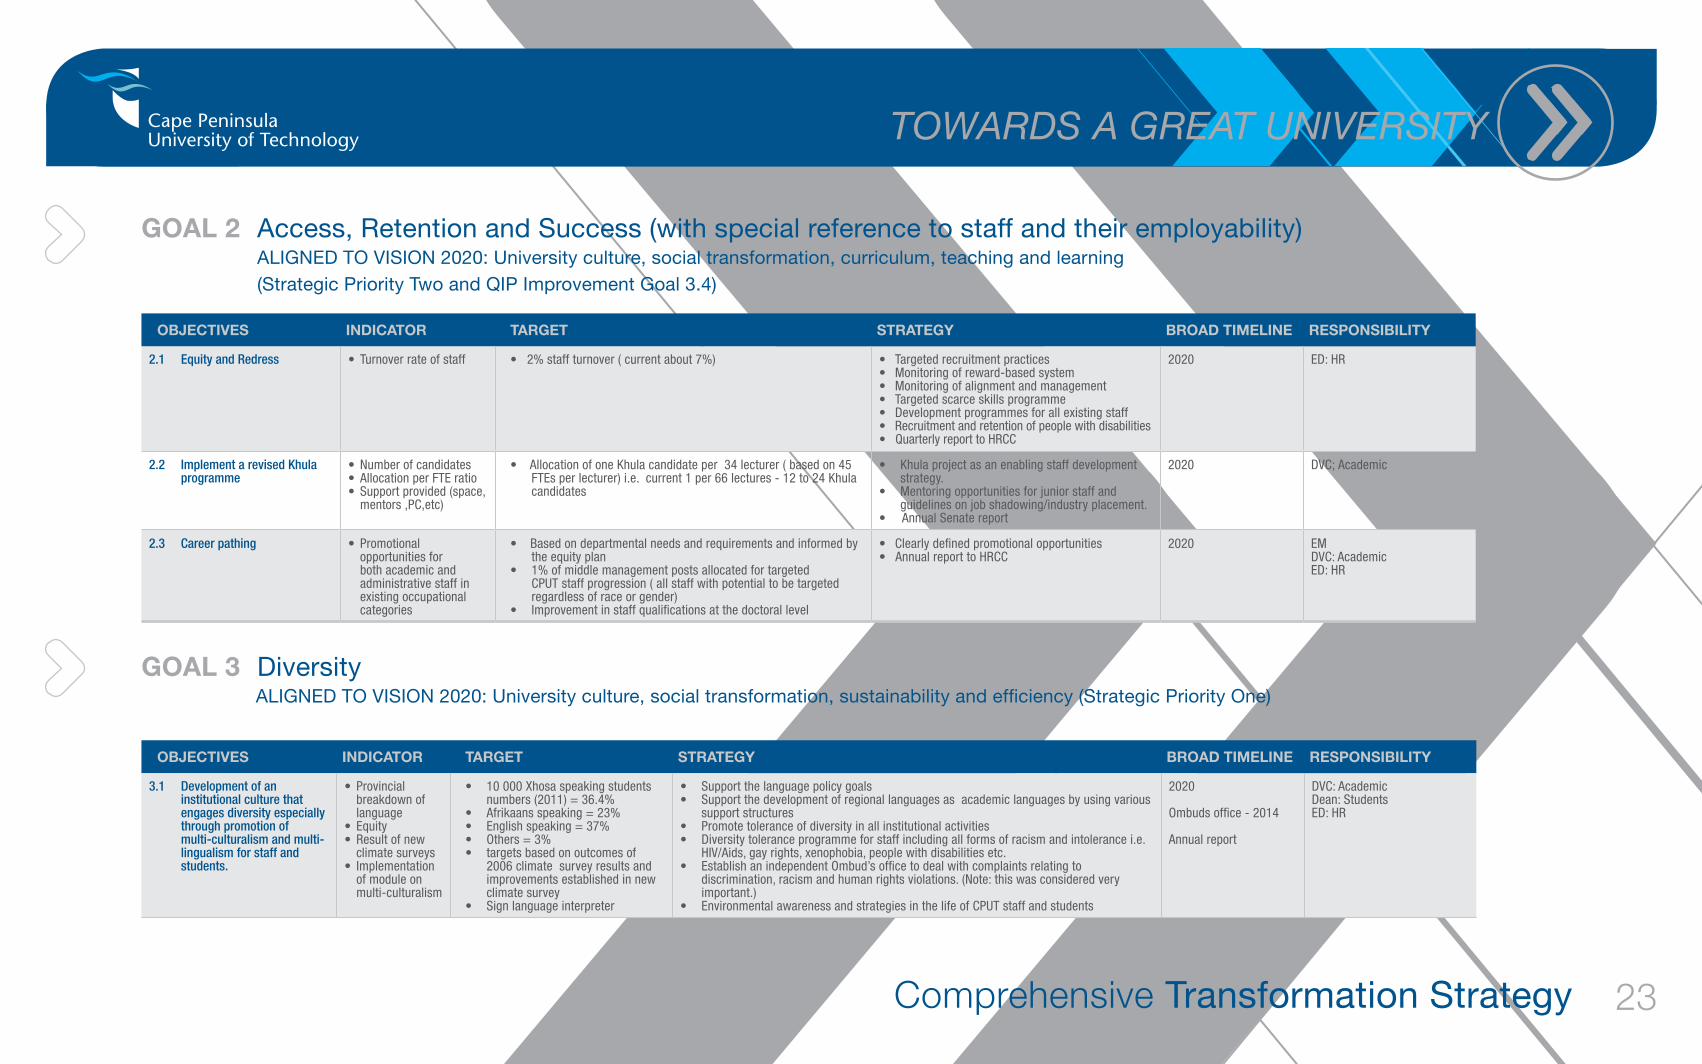
Goal 2 Access, Retention and Success (with special reference to staff and their employability) ALIGNED TO VISION 2020: University culture, social transformation, curriculum, teaching and learning (Strategic Priority Two and QIP Improvement Goal 3.4)
Goal 3 Diversity ALIGNED TO VISION 2020: University culture, social transformation, sustainability and efficiency (Strategic Priority One)
oBJeCTiveS indiCaTor TarGeT STraTeGY Broad TiMeline reSponSiBiliTY
2.1 EquityandRedress • Turnover rate of staff • 2% staff turnover ( current about 7%) • Targeted recruitment practices• Monitoring of reward-based system• Monitoring of alignment and management• Targeted scarce skills programme• Development programmes for all existing staff• Recruitment and retention of people with disabilities• Quarterly report to HRCC
2020 ED: HR
2.2 ImplementarevisedKhulaprogramme
• Number of candidates• Allocation per FTE ratio• Support provided (space,
mentors ,PC,etc)
• Allocation of one Khula candidate per 34 lecturer ( based on 45 FTEs per lecturer) i.e. current 1 per 66 lectures - 12 to 24 Khula candidates
• Khula project as an enabling staff development strategy.
• Mentoring opportunities for junior staff and guidelines on job shadowing/industry placement.
• Annual Senate report
2020 DVC; Academic
2.3 Careerpathing • Promotional opportunities for both academic and administrative staff in existing occupational categories
• Based on departmental needs and requirements and informed by the equity plan
• 1% of middle management posts allocated for targeted CPUT staff progression ( all staff with potential to be targeted regardless of race or gender)
• Improvement in staff qualifications at the doctoral level
• Clearly defined promotional opportunities• Annual report to HRCC
2020 EMDVC: AcademicED: HR
oBJeCTiveS indiCaTor TarGeT STraTeGY Broad TiMeline reSponSiBiliTY
3.1 Developmentofaninstitutionalculturethatengagesdiversityespeciallythroughpromotionofmulti-culturalismandmulti-lingualismforstaffandstudents.
• Provincial breakdown of language
• Equity• Result of new
climate surveys• Implementation
of module on multi-culturalism
• 10 000 Xhosa speaking students numbers (2011) = 36.4%
• Afrikaans speaking = 23%• English speaking = 37%• Others = 3%• targets based on outcomes of
2006 climate survey results and improvements established in new climate survey
• Sign language interpreter
• Support the language policy goals• Support the development of regional languages as academic languages by using various
support structures• Promote tolerance of diversity in all institutional activities• Diversity tolerance programme for staff including all forms of racism and intolerance i.e.
HIV/Aids, gay rights, xenophobia, people with disabilities etc.• Establish an independent Ombud’s office to deal with complaints relating to
discrimination, racism and human rights violations. (Note: this was considered very important.)
• Environmental awareness and strategies in the life of CPUT staff and students
2020
Ombuds office - 2014
Annual report
DVC: AcademicDean: StudentsED: HR
Comprehensive Transformation Strategy
Towards a greaT UniversiTy
24
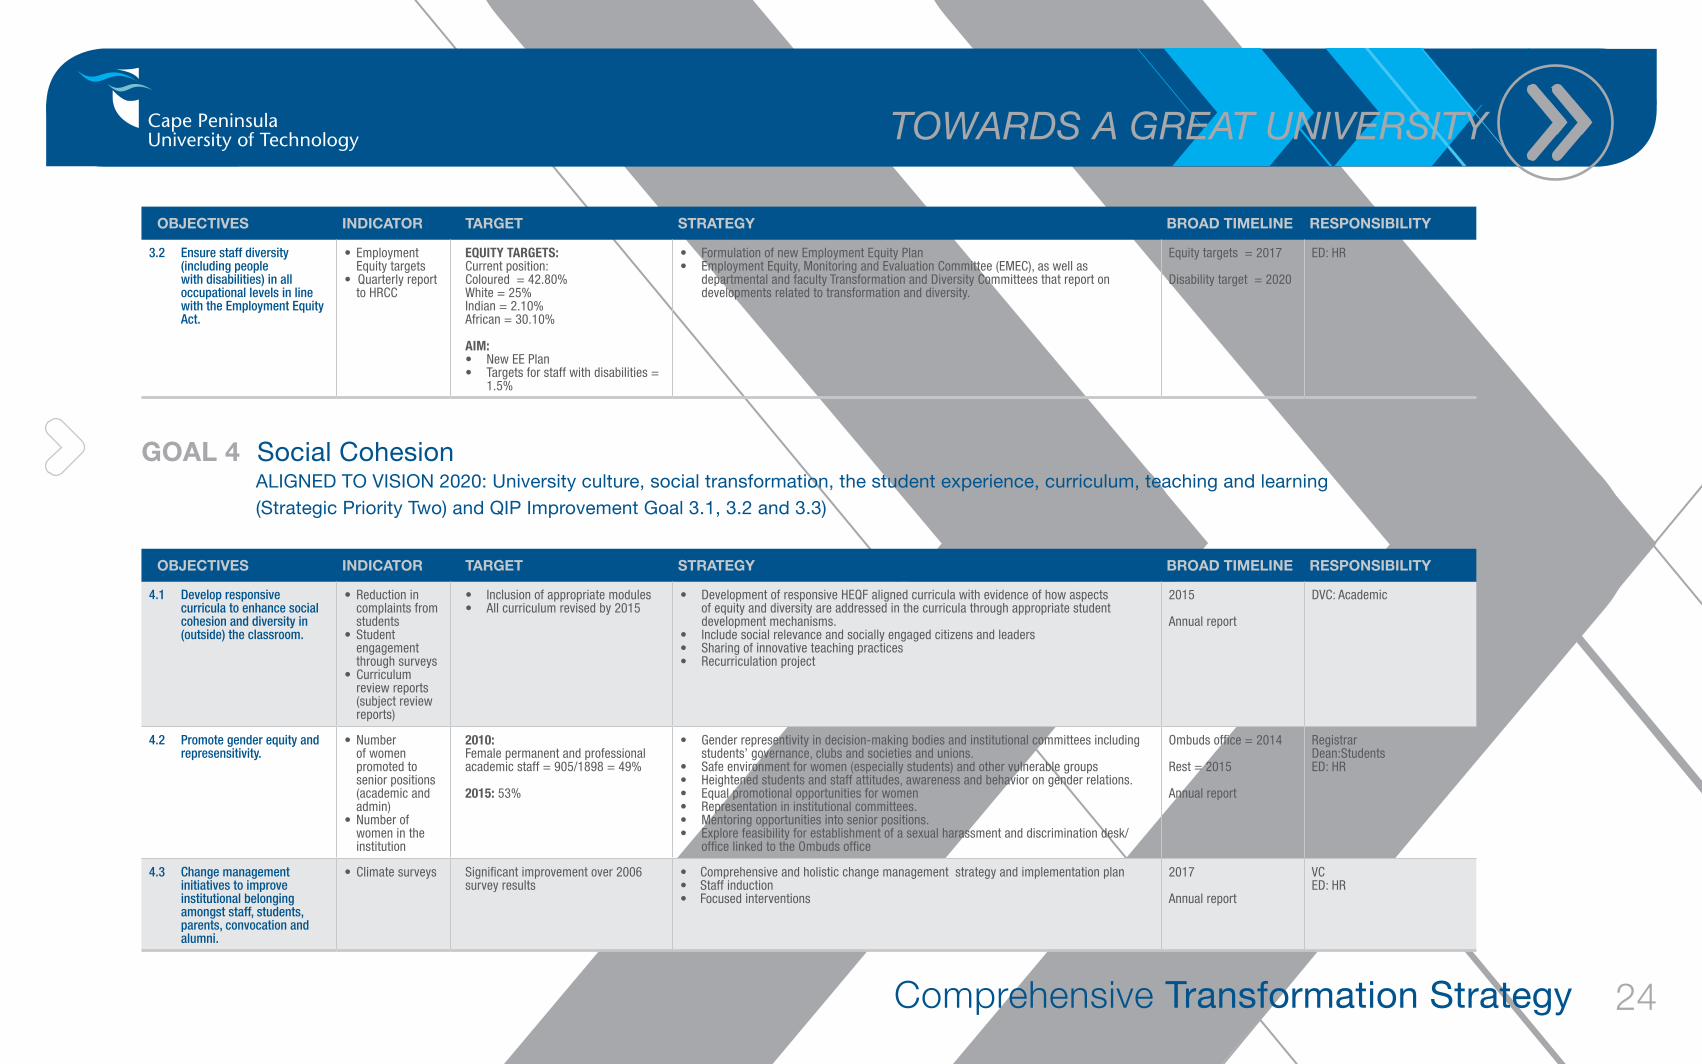
oBJeCTiveS indiCaTor TarGeT STraTeGY Broad TiMeline reSponSiBiliTY
3.2 Ensurestaffdiversity(includingpeoplewithdisabilities)inalloccupationallevelsinlinewiththeEmploymentEquityAct.
• Employment Equity targets
• Quarterly report to HRCC
equity targets:Current position:Coloured = 42.80%White = 25%Indian = 2.10%African = 30.10%
aim: • New EE Plan• Targets for staff with disabilities =
1.5%
• Formulation of new Employment Equity Plan• Employment Equity, Monitoring and Evaluation Committee (EMEC), as well as
departmental and faculty Transformation and Diversity Committees that report on developments related to transformation and diversity.
Equity targets = 2017
Disability target = 2020
ED: HR
Goal 4 Social Cohesion ALIGNED TO VISION 2020: University culture, social transformation, the student experience, curriculum, teaching and learning (Strategic Priority Two) and QIP Improvement Goal 3.1, 3.2 and 3.3)
oBJeCTiveS indiCaTor TarGeT STraTeGY Broad TiMeline reSponSiBiliTY
4.1 Developresponsivecurriculatoenhancesocialcohesionanddiversityin(outside)theclassroom.
• Reduction in complaints from students
• Student engagement through surveys
• Curriculum review reports (subject review reports)
• Inclusion of appropriate modules • All curriculum revised by 2015
• Development of responsive HEQF aligned curricula with evidence of how aspects of equity and diversity are addressed in the curricula through appropriate student development mechanisms.
• Include social relevance and socially engaged citizens and leaders • Sharing of innovative teaching practices• Recurriculation project
2015
Annual report
DVC: Academic
4.2 Promotegenderequityandrepresensitivity.
• Number of women promoted to senior positions (academic and admin)
• Number of women in the institution
2010:Female permanent and professionalacademic staff = 905/1898 = 49%
2015: 53%
• Gender representivity in decision-making bodies and institutional committees including students’ governance, clubs and societies and unions.
• Safe environment for women (especially students) and other vulnerable groups • Heightened students and staff attitudes, awareness and behavior on gender relations. • Equal promotional opportunities for women • Representation in institutional committees.• Mentoring opportunities into senior positions.• Explore feasibility for establishment of a sexual harassment and discrimination desk/
office linked to the Ombuds office
Ombuds office = 2014
Rest = 2015
Annual report
RegistrarDean:StudentsED: HR
4.3 Changemanagementinitiativestoimproveinstitutionalbelongingamongststaff,students,parents,convocationandalumni.
• Climate surveys Significant improvement over 2006survey results
• Comprehensive and holistic change management strategy and implementation plan• Staff induction• Focused interventions
2017
Annual report
VCED: HR
Comprehensive Transformation Strategy
Towards a greaT UniversiTy
25
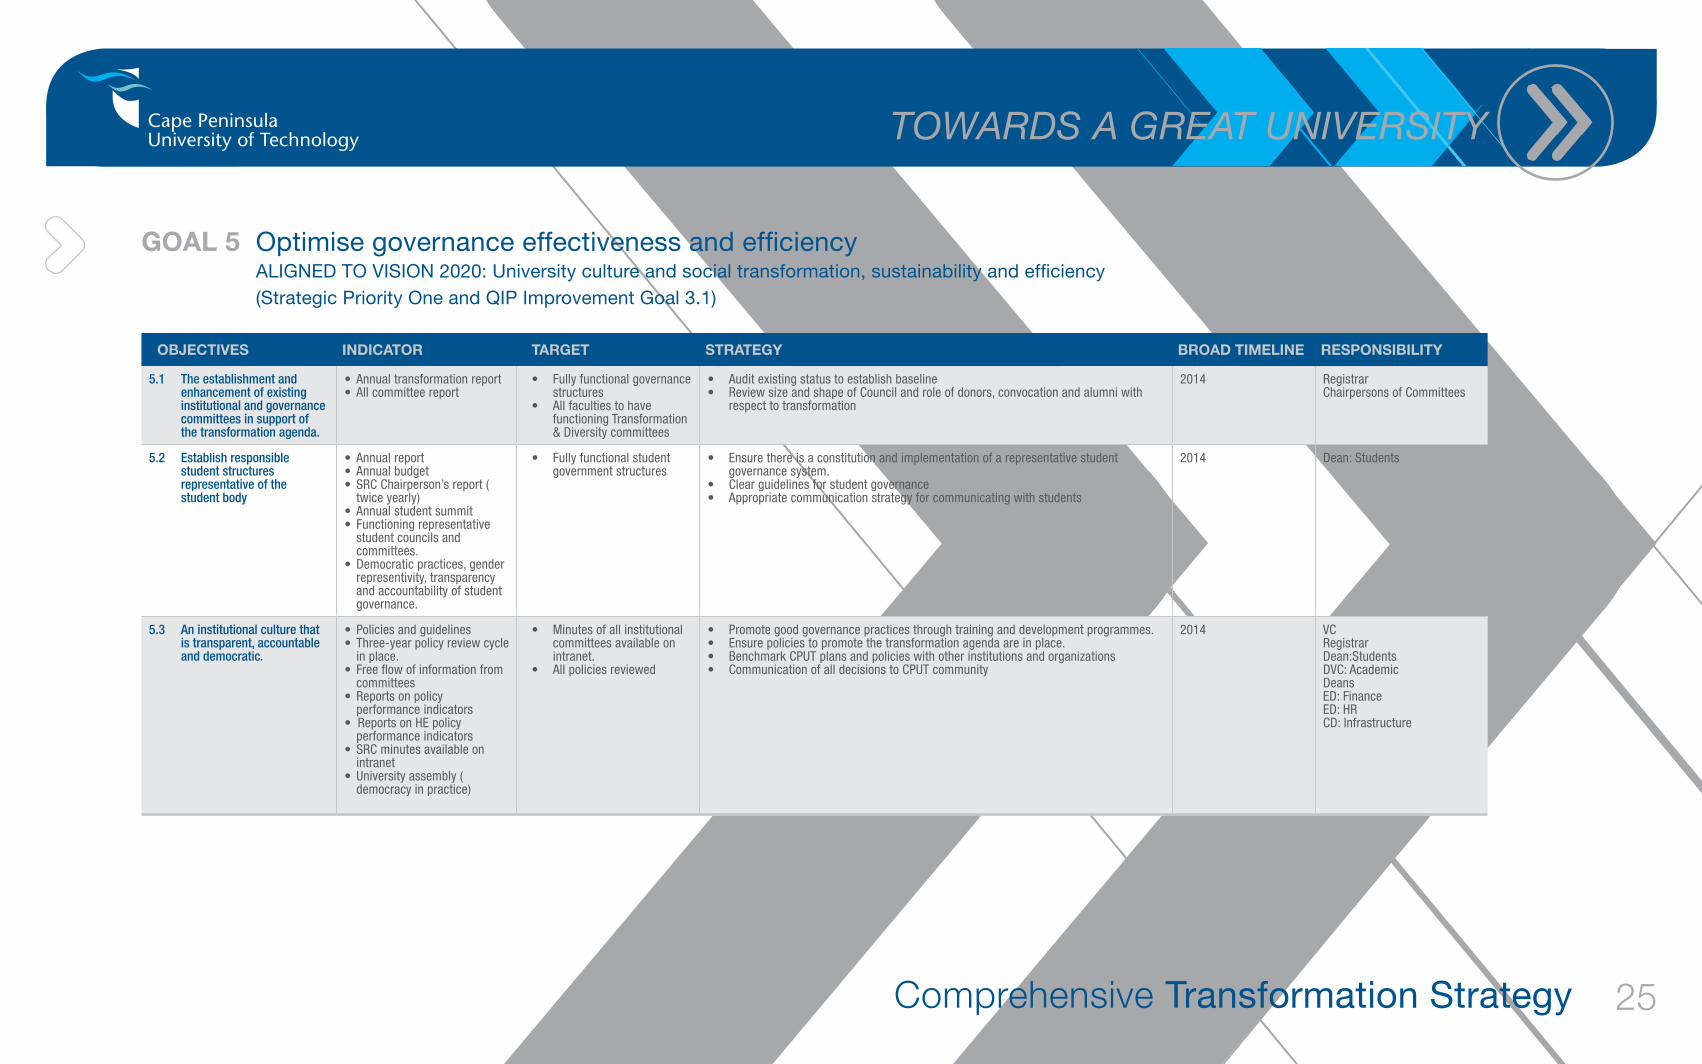
Goal 5 Optimise governance effectiveness and efficiency ALIGNED TO VISION 2020: University culture and social transformation, sustainability and efficiency (Strategic Priority One and QIP Improvement Goal 3.1)
oBJeCTiveS indiCaTor TarGeT STraTeGY Broad TiMeline reSponSiBiliTY
5.1 Theestablishmentandenhancementofexistinginstitutionalandgovernancecommitteesinsupportofthetransformationagenda.
• Annual transformation report• All committee report
• Fully functional governance structures
• All faculties to have functioning Transformation & Diversity committees
• Audit existing status to establish baseline• Review size and shape of Council and role of donors, convocation and alumni with
respect to transformation
2014 RegistrarChairpersons of Committees
5.2 Establishresponsiblestudentstructuresrepresentativeofthestudentbody
• Annual report• Annual budget• SRC Chairperson’s report (
twice yearly)• Annual student summit• Functioning representative
student councils and committees.
• Democratic practices, gender representivity, transparency and accountability of student governance.
• Fully functional student government structures
• Ensure there is a constitution and implementation of a representative student governance system.
• Clear guidelines for student governance• Appropriate communication strategy for communicating with students
2014 Dean: Students
5.3 Aninstitutionalculturethatistransparent,accountableanddemocratic.
• Policies and guidelines • Three-year policy review cycle
in place.• Free flow of information from
committees• Reports on policy
performance indicators• Reports on HE policy
performance indicators• SRC minutes available on
intranet• University assembly (
democracy in practice)
• Minutes of all institutional committees available on intranet.
• All policies reviewed
• Promote good governance practices through training and development programmes.• Ensure policies to promote the transformation agenda are in place.• Benchmark CPUT plans and policies with other institutions and organizations• Communication of all decisions to CPUT community
2014 VCRegistrarDean:StudentsDVC: AcademicDeansED: FinanceED: HRCD: Infrastructure
Comprehensive Transformation Strategy
Towards a greaT UniversiTy
26
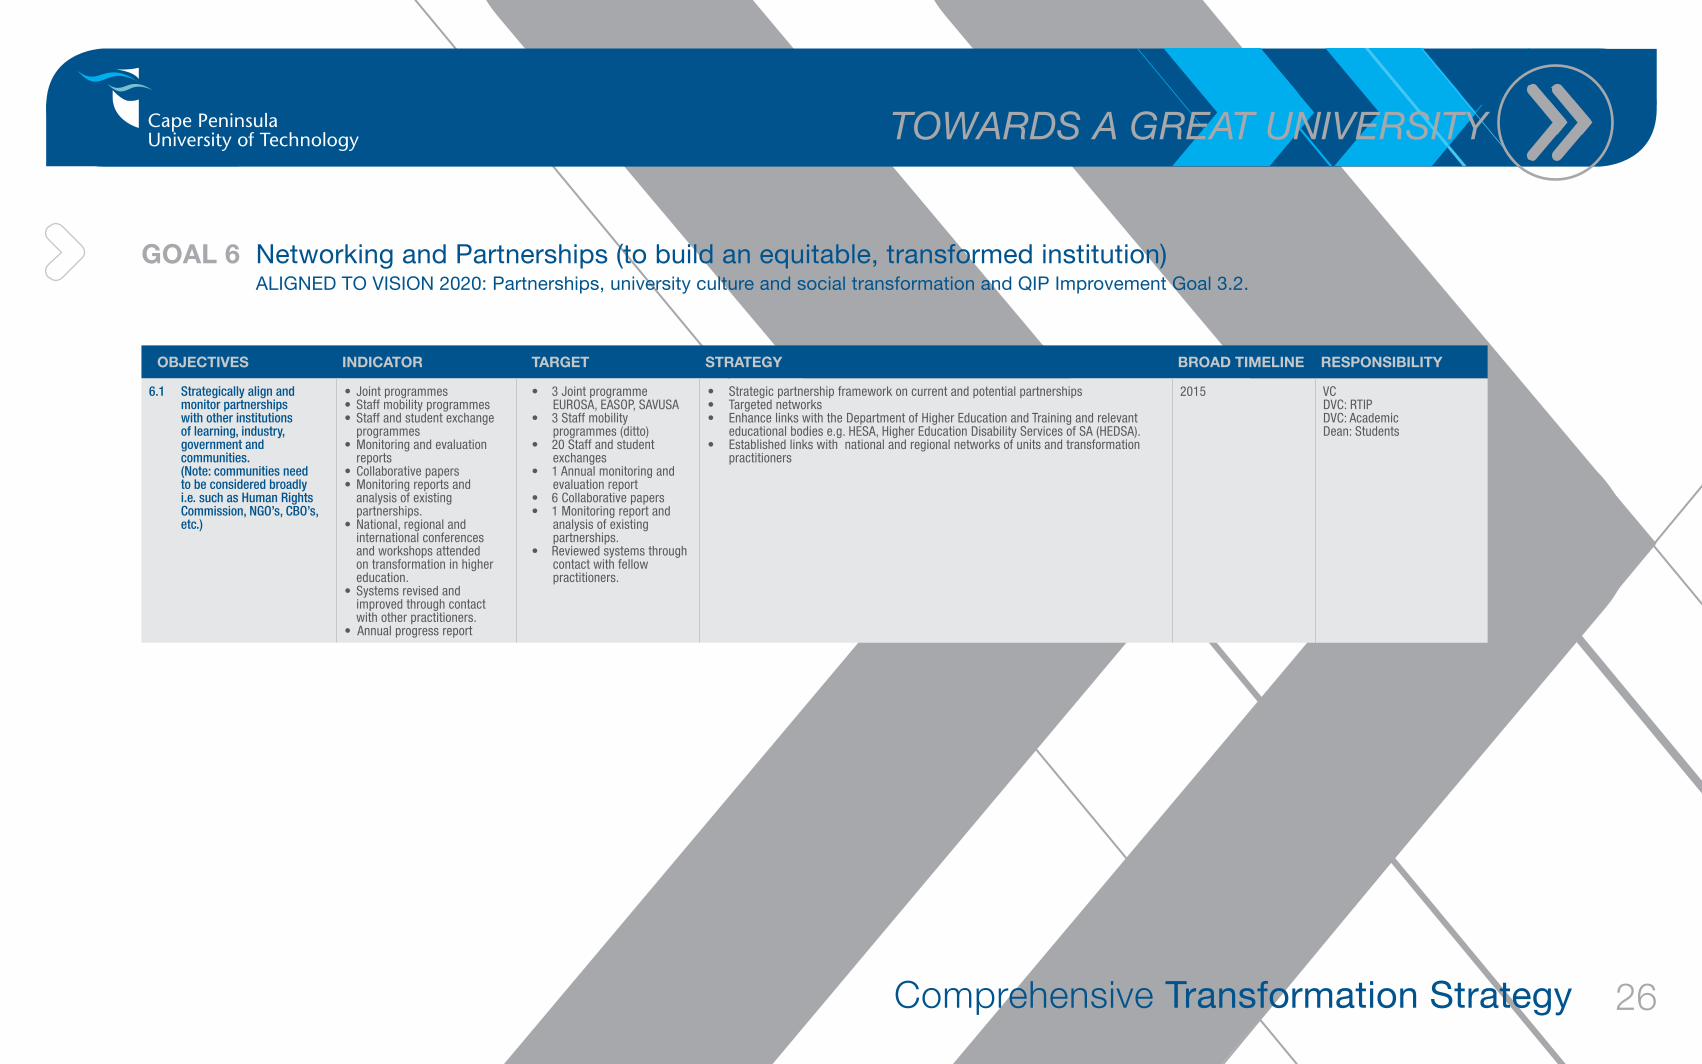
Goal 6 Networking and Partnerships (to build an equitable, transformed institution) ALIGNED TO VISION 2020: Partnerships, university culture and social transformation and QIP Improvement Goal 3.2.
oBJeCTiveS indiCaTor TarGeT STraTeGY Broad TiMeline reSponSiBiliTY
6.1 Strategicallyalignandmonitorpartnershipswithotherinstitutionsoflearning,industry,governmentandcommunities.(Note:communitiesneedtobeconsideredbroadlyi.e.suchasHumanRightsCommission,NGO’s,CBO’s,etc.)
• Joint programmes• Staff mobility programmes• Staff and student exchange
programmes• Monitoring and evaluation
reports• Collaborative papers • Monitoring reports and
analysis of existing partnerships.
• National, regional and international conferences and workshops attended on transformation in higher education.
• Systems revised and improved through contact with other practitioners.
• Annual progress report
• 3 Joint programme EUROSA, EASOP, SAVUSA
• 3 Staff mobility programmes (ditto)
• 20 Staff and student exchanges
• 1 Annual monitoring and evaluation report
• 6 Collaborative papers• 1 Monitoring report and
analysis of existing partnerships.
• Reviewed systems through contact with fellow practitioners.
• Strategic partnership framework on current and potential partnerships• Targeted networks• Enhance links with the Department of Higher Education and Training and relevant
educational bodies e.g. HESA, Higher Education Disability Services of SA (HEDSA). • Established links with national and regional networks of units and transformation
practitioners
2015 VCDVC: RTIPDVC: AcademicDean: Students
Related Documents