RESEARCH Open Access Composite effects of gene determinants on the translation speed and density of ribosomes Tamir Tuller 1*† , Isana Veksler-Lublinsky 2† , Nir Gazit 3 , Martin Kupiec 4 , Eytan Ruppin 3,5 and Michal Ziv-Ukelson 2 Abstract Background: Translation is a central process of life, and its regulation is crucial for cell growth. In this article, focusing on two model organisms, Escherichia coli and Saccharomyces cerevisiae, we study how three major local features of a gene’s coding sequence (its adaptation to the tRNA pool, its amino acid charge, and its mRNA folding energy) affect its translation elongation. Results: We find that each of these three different features has a non-negligible distinct correlation with the speed of translation elongation. In addition, each of these features might contribute independently to slowing down ribosomal speed at the beginning of genes, which was suggested in previous studies to improve ribosomal allocation and the cost of translation, and to decrease ribosomal jamming. Remarkably, a model of ribosomal translation based on these three basic features highly correlated with the genomic profile of ribosomal density. The robustness to transcription errors in terms of the values of these features is higher at the beginnings of genes, suggesting that this region is important for translation. Conclusions: The reported results support the conjecture that translation elongation speed is affected by the three coding sequence determinants mentioned above, and not only by adaptation to the tRNA pool; thus, evolution shapes all these determinants along the coding sequences and across genes to improve the organism’s translation efficiency. Background Gene translation is a central biological process in all liv- ing organisms by which an mRNA sequence is decoded by the ribosome to synthesize a specific protein. During the elongation stage of this process, each codon is itera- tively translated by the ribosome to an amino acid. Translation elongation is known to be conserved in all living organisms (Bacteria, Archaea, and eukaryotes [1]); thus, understanding this process and the determinants related to it have important ramifications for human health [2-4], biotechnology [5-10], and evolution [4,8,11]. Indeed, gene translation has been the topic of an increasing number of studies in recent years (see, for example, [5,7,8,12-20]). Specifically, it was recently dis- covered that the efficiency of translation can be controlled by the codon order in the coding sequence [8,17]. This is partially achieved by a ‘ramp’ at the begin- ning of the coding sequences composed of less efficient codons. This ramp slows down ribosomal speed, and thus improves their allocation and minimizes the number of collisions between them. In addition, it was shown that there is global selection for weak mRNA folding at the beginning of the coding sequence to improve the binding of ribosomes [7,8,14,16,17,21,22]. Furthermore, recent, small-scale studies also suggested that positively charged amino acids slow down ribosomes as the electrostatic potential inside the exit tunnel is negative [23,24]. Finally, based on large scale measurements of ribosome densities [13,15] it has been demonstrated that the density (and thus the speed [8]) of ribosomes varies within a gene and across genes. We have previously shown that the speed and alloca- tion of ribosomes in genes is affected by the distribution of the adaptation of codons along them to the tRNA pool of the organism [8]. The goal of this paper is to study how the different features of coding sequences * Correspondence: [email protected] † Contributed equally 1 Department of Biomedical Engineering, Faculty of Engineering, Tel Aviv University, Ramat Aviv 69978, Israel Full list of author information is available at the end of the article Tuller et al. Genome Biology 2011, 12:R110 http://genomebiology.com/2011/12/11/R110 © 2011 Tuller et al.; licensee BioMed Central Ltd. This is an open access article distributed under the terms of the Creative Commons Attribution License (http://creativecommons.org/licenses/by/2.0), which permits unrestricted use, distribution, and reproduction in any medium, provided the original work is properly cited.

Welcome message from author
This document is posted to help you gain knowledge. Please leave a comment to let me know what you think about it! Share it to your friends and learn new things together.
Transcript
RESEARCH Open Access
Composite effects of gene determinants on thetranslation speed and density of ribosomesTamir Tuller1*†, Isana Veksler-Lublinsky2†, Nir Gazit3, Martin Kupiec4, Eytan Ruppin3,5 and Michal Ziv-Ukelson2
Abstract
Background: Translation is a central process of life, and its regulation is crucial for cell growth. In this article,focusing on two model organisms, Escherichia coli and Saccharomyces cerevisiae, we study how three major localfeatures of a gene’s coding sequence (its adaptation to the tRNA pool, its amino acid charge, and its mRNA foldingenergy) affect its translation elongation.
Results: We find that each of these three different features has a non-negligible distinct correlation with the speedof translation elongation. In addition, each of these features might contribute independently to slowing downribosomal speed at the beginning of genes, which was suggested in previous studies to improve ribosomalallocation and the cost of translation, and to decrease ribosomal jamming. Remarkably, a model of ribosomaltranslation based on these three basic features highly correlated with the genomic profile of ribosomal density.The robustness to transcription errors in terms of the values of these features is higher at the beginnings of genes,suggesting that this region is important for translation.
Conclusions: The reported results support the conjecture that translation elongation speed is affected by the threecoding sequence determinants mentioned above, and not only by adaptation to the tRNA pool; thus, evolutionshapes all these determinants along the coding sequences and across genes to improve the organism’s translationefficiency.
BackgroundGene translation is a central biological process in all liv-ing organisms by which an mRNA sequence is decodedby the ribosome to synthesize a specific protein. Duringthe elongation stage of this process, each codon is itera-tively translated by the ribosome to an amino acid.Translation elongation is known to be conserved in allliving organisms (Bacteria, Archaea, and eukaryotes [1]);thus, understanding this process and the determinantsrelated to it have important ramifications for humanhealth [2-4], biotechnology [5-10], and evolution[4,8,11].Indeed, gene translation has been the topic of an
increasing number of studies in recent years (see, forexample, [5,7,8,12-20]). Specifically, it was recently dis-covered that the efficiency of translation can be
controlled by the codon order in the coding sequence[8,17]. This is partially achieved by a ‘ramp’ at the begin-ning of the coding sequences composed of less efficientcodons. This ramp slows down ribosomal speed, andthus improves their allocation and minimizes the numberof collisions between them. In addition, it was shown thatthere is global selection for weak mRNA folding at thebeginning of the coding sequence to improve the bindingof ribosomes [7,8,14,16,17,21,22]. Furthermore, recent,small-scale studies also suggested that positively chargedamino acids slow down ribosomes as the electrostaticpotential inside the exit tunnel is negative [23,24]. Finally,based on large scale measurements of ribosome densities[13,15] it has been demonstrated that the density (andthus the speed [8]) of ribosomes varies within a gene andacross genes.We have previously shown that the speed and alloca-
tion of ribosomes in genes is affected by the distributionof the adaptation of codons along them to the tRNApool of the organism [8]. The goal of this paper is tostudy how the different features of coding sequences
* Correspondence: [email protected]† Contributed equally1Department of Biomedical Engineering, Faculty of Engineering, Tel AvivUniversity, Ramat Aviv 69978, IsraelFull list of author information is available at the end of the article
Tuller et al. Genome Biology 2011, 12:R110http://genomebiology.com/2011/12/11/R110
© 2011 Tuller et al.; licensee BioMed Central Ltd. This is an open access article distributed under the terms of the Creative CommonsAttribution License (http://creativecommons.org/licenses/by/2.0), which permits unrestricted use, distribution, and reproduction inany medium, provided the original work is properly cited.
interact to affect the speed of ribosomal movement andallocation. Our results may suggest that selection forcesact to slow down the speed of ribosomes at the begin-ning of genes. This is likely to improve allocation ofribosomes and prevent traffic jams and collisionsbetween ribosomes [8]. This is achieved not only viaselection for slower codons in these regions but also byincreasing mRNA folding strength and the frequency ofamino acids with a positive charge in these regions.Furthermore, we show that there is selection to
increase the robustness to transcriptional errors at thebeginnings of ORFs, which might change these threefeatures, pointing to the specific importance of thisregion in translation regulation.
ResultsComputing the genomic profiles of codon bias, chargeand folding energyWe defined three genomic profiles of coding sequencedeterminants: (1) a profile of codon bias co-adaptationto the tRNA pool; (2) the amino acid charge pattern;and (3) the profile of local mRNA folding energy.The profile of co-adaptation of the codon bias to the
tRNA pool is based on the tRNA adaptation index (tAI)measure [25] and represents the co-adaptation betweenthe coding sequences and the tRNA pool of the organ-ism. The tAI is superior to other measures of codonbias as it yields higher correlations with protein abun-dance than the alternative measures and is a more directmeasure of adaptation to the tRNA pool. It is based onthe coding sequences and the genomic copy numbers oftRNA molecules (which were shown to be highly corre-lated with their cellular tRNA levels; more details areprovided in Materials and methods and Note S1 inAdditional file 1).The tAI of a codon is higher if it is recognized by
more abundant tRNA molecules; thus, on average, therecognition time of the codon by the right tRNA isshorter [8]. The i-th entry in the genomic codon biasprofile is computed as the mean tAI of the i-th codonsacross genes (of substantial length [8]; Materials andmethods).The charge profile represents the position-specific
average charge of the amino acid chains across genes.The i-th entry in the charge profile is the mean chargeof the i-th amino acid across genes where 1 represents apositive charge (amino acids Arg, His and Lys), -1 anegative charge (amino acids Asp and Glu), and 0 nocharge (all other amino acids) (Materials and methods).The exit channel follows the peptidyl transferase center,where the catalytic reaction of the ribosome takes place;the polyleptide thus must traverse two negativelycharged regions to exit [24,26]. Thus, charged aminoacids that are encoded in the codons preceding
(upstream) the translated codon should have electrosta-tical interactions with the ribosome.The folding energy profile was computed as follows.
First, we computed for each gene a profile of local fold-ing energies (Materials and methods); the folding energycorresponding to the i-th codon is the folding energy ofa 40-nucleotide window that begins with this codon.Folding energies corresponding to nucleotides beforethe start codon (that is, at the 5’ UTRs) were defined ina similar way. In the next stage, we computed the meanfolding energy for each entry (position) in a similar wayto the tAI and charge profiles described above (Materi-als and methods). Stronger folding corresponds to lower(more negative) folding energy. It was shown before[14,27] that the correlation between the folding energyand protein abundance is very weak in endogenousgenes. However, in this study we focus on the effect offolding energy on the density of ribosomes and theirallocation.In addition, due to a novel approach for measuring
ribosomal density at single nucleotide resolution, whichwas performed for numerous Saccharomyces cerevisiaegenes [15], it is possible to plot, in a similar manner, agenomic ribosomal density profile. The i-th entry in thisprofile is the mean ribosomal density of the i-th codonacross genes (of substantial length).The three genomic profiles of S. cerevisiae and Escher-
ichia coli, and the genomic profile of ribosomal densityin S. cerevisiae are shown in Figure 1. As we mentionedearlier, it was reported in previous studies that the co-adaptation profile of codons to the tRNA pool correlateswith the ribosomal density profile, and that this profilehas a ‘ramp’ of slower translation speed at the beginningof coding sequences [8]. Figure 1 demonstrates that theactual ramp has three dimensions.However, there are two additional dimensions:First, the genomic profile of folding energy contains a
region of stronger folding (after an initial weak foldingregion that promotes ribosomal binding; see Figure S1in Additional file 2 for the median profile). Similarresults were obtained when analyzing measurements ofmRNA folding [28]: at the beginning of the codingsequence there are usually nucleotides that are notinvolved in base-pairing (that is, weak mRNA folding; P= 8.9 × 10-69) as opposed to downstream nucleotideswhere the frequency of nucleotides involved in base-pairing increases (that is, strong folding; P = 5 × 10-74;Materials and methods; Figure S2 in Additional file 2).Second, genes tend to have more positively chargedamino acids at their 5’ end, which should also contri-bute to the deceleration of ribosomes. The length of theslower region in each of the three dimensions of theramp is between 30 and 50 codons, similar to the lengthof the ribosome’s exit channel [17] (the lengths of the
Tuller et al. Genome Biology 2011, 12:R110http://genomebiology.com/2011/12/11/R110
Page 2 of 18
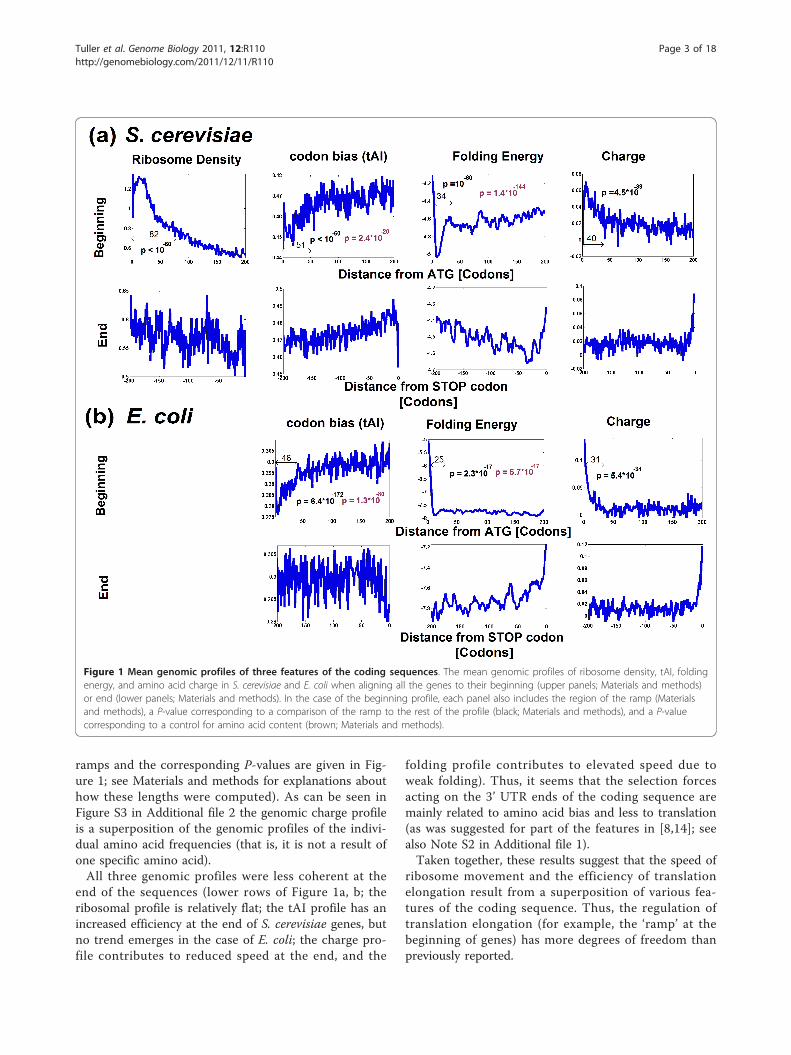
ramps and the corresponding P-values are given in Fig-ure 1; see Materials and methods for explanations abouthow these lengths were computed). As can be seen inFigure S3 in Additional file 2 the genomic charge profileis a superposition of the genomic profiles of the indivi-dual amino acid frequencies (that is, it is not a result ofone specific amino acid).All three genomic profiles were less coherent at the
end of the sequences (lower rows of Figure 1a, b; theribosomal profile is relatively flat; the tAI profile has anincreased efficiency at the end of S. cerevisiae genes, butno trend emerges in the case of E. coli; the charge pro-file contributes to reduced speed at the end, and the
folding profile contributes to elevated speed due toweak folding). Thus, it seems that the selection forcesacting on the 3’ UTR ends of the coding sequence aremainly related to amino acid bias and less to translation(as was suggested for part of the features in [8,14]; seealso Note S2 in Additional file 1).Taken together, these results suggest that the speed of
ribosome movement and the efficiency of translationelongation result from a superposition of various fea-tures of the coding sequence. Thus, the regulation oftranslation elongation (for example, the ‘ramp’ at thebeginning of genes) has more degrees of freedom thanpreviously reported.
Figure 1 Mean genomic profiles of three features of the coding sequences. The mean genomic profiles of ribosome density, tAI, foldingenergy, and amino acid charge in S. cerevisiae and E. coli when aligning all the genes to their beginning (upper panels; Materials and methods)or end (lower panels; Materials and methods). In the case of the beginning profile, each panel also includes the region of the ramp (Materialsand methods), a P-value corresponding to a comparison of the ramp to the rest of the profile (black; Materials and methods), and a P-valuecorresponding to a control for amino acid content (brown; Materials and methods).
Tuller et al. Genome Biology 2011, 12:R110http://genomebiology.com/2011/12/11/R110
Page 3 of 18
In the next sections we further examine this idea,demonstrating that these ramps are more striking forhighly expressed genes, that they are more robust totranscription errors, and that each of the ramps makes adistinct contribution to the ribosomal density.
The three dimensions of the ‘ramp’ are accentuated forhighly expressed genes and for genes with higherribosomal densityIf the ‘ramp’s three dimensions are selected for in such amanner as to improve the allocation of ribosomes andprevent ribosome collisions, we expect a more promi-nent ramp for genes with higher mRNA levels and ribo-somal densities, as such genes potentially consume moreribosomes (as was suggested in [8]). The ramp has addi-tional potential advantages (Note S3 in Additional file1). Thus, we expect to see it also in genes with lowerribosomal density [8].The ramp’s length is the slower region at the begin-
ning of the genomic profile and it is measured relativelyto the entire profile (Materials and methods); thus, theramp region of highly expressed genes can in actualitybe more efficient than that of lowly expressed genes,despite the fact that absolute translation rates for lowlyexpressed genes are lower.Figure 2a-c depicts the mean genomic profiles of
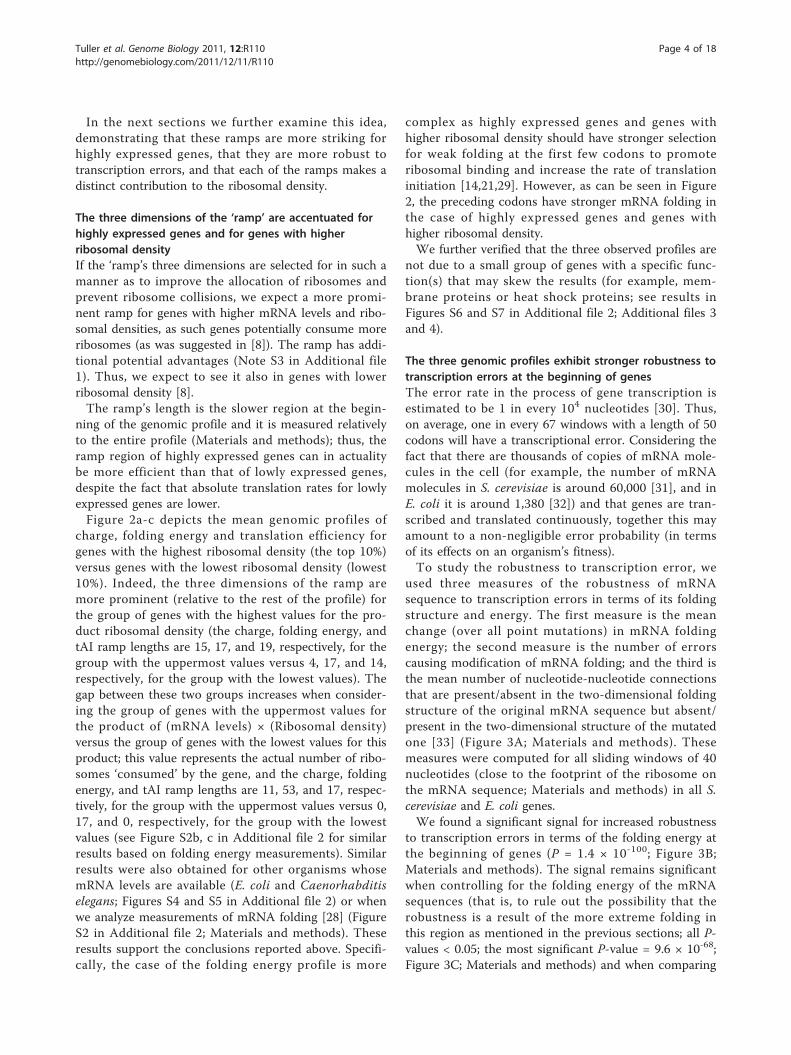
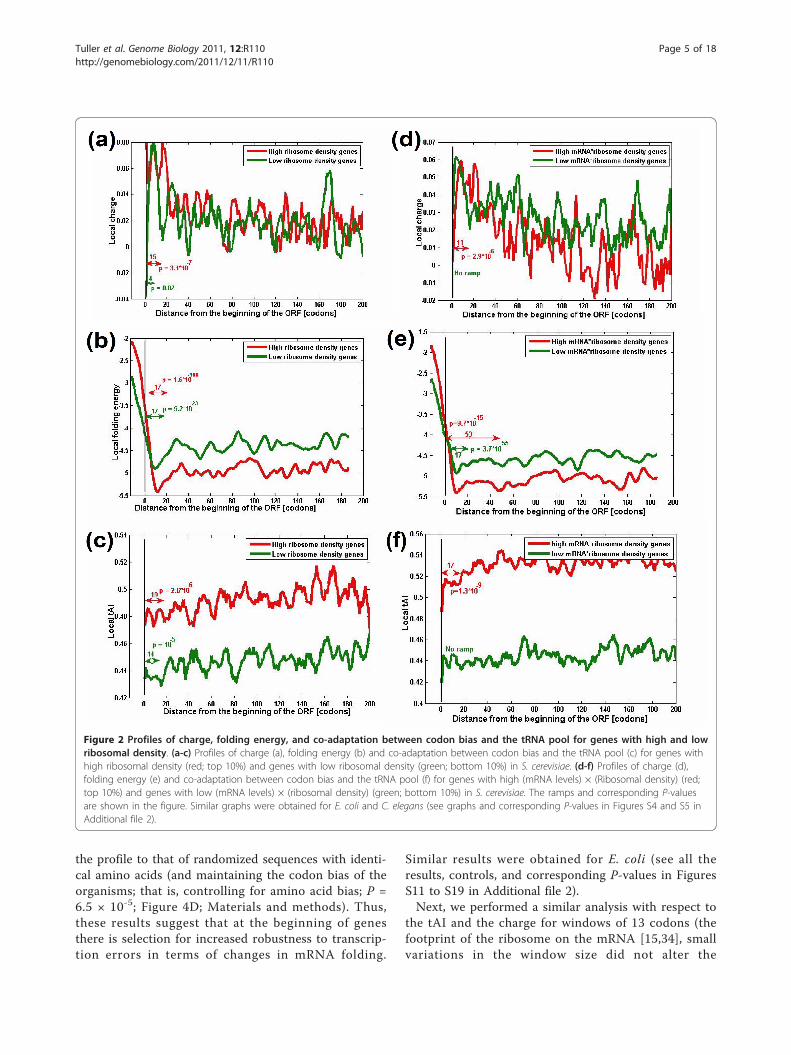
charge, folding energy and translation efficiency forgenes with the highest ribosomal density (the top 10%)versus genes with the lowest ribosomal density (lowest10%). Indeed, the three dimensions of the ramp aremore prominent (relative to the rest of the profile) forthe group of genes with the highest values for the pro-duct ribosomal density (the charge, folding energy, andtAI ramp lengths are 15, 17, and 19, respectively, for thegroup with the uppermost values versus 4, 17, and 14,respectively, for the group with the lowest values). Thegap between these two groups increases when consider-ing the group of genes with the uppermost values forthe product of (mRNA levels) × (Ribosomal density)versus the group of genes with the lowest values for thisproduct; this value represents the actual number of ribo-somes ‘consumed’ by the gene, and the charge, foldingenergy, and tAI ramp lengths are 11, 53, and 17, respec-tively, for the group with the uppermost values versus 0,17, and 0, respectively, for the group with the lowestvalues (see Figure S2b, c in Additional file 2 for similarresults based on folding energy measurements). Similarresults were also obtained for other organisms whosemRNA levels are available (E. coli and Caenorhabditiselegans; Figures S4 and S5 in Additional file 2) or whenwe analyze measurements of mRNA folding [28] (FigureS2 in Additional file 2; Materials and methods). Theseresults support the conclusions reported above. Specifi-cally, the case of the folding energy profile is more
complex as highly expressed genes and genes withhigher ribosomal density should have stronger selectionfor weak folding at the first few codons to promoteribosomal binding and increase the rate of translationinitiation [14,21,29]. However, as can be seen in Figure2, the preceding codons have stronger mRNA folding inthe case of highly expressed genes and genes withhigher ribosomal density.We further verified that the three observed profiles are
not due to a small group of genes with a specific func-tion(s) that may skew the results (for example, mem-brane proteins or heat shock proteins; see results inFigures S6 and S7 in Additional file 2; Additional files 3and 4).
The three genomic profiles exhibit stronger robustness totranscription errors at the beginning of genesThe error rate in the process of gene transcription isestimated to be 1 in every 104 nucleotides [30]. Thus,on average, one in every 67 windows with a length of 50codons will have a transcriptional error. Considering thefact that there are thousands of copies of mRNA mole-cules in the cell (for example, the number of mRNAmolecules in S. cerevisiae is around 60,000 [31], and inE. coli it is around 1,380 [32]) and that genes are tran-scribed and translated continuously, together this mayamount to a non-negligible error probability (in termsof its effects on an organism’s fitness).To study the robustness to transcription error, we
used three measures of the robustness of mRNAsequence to transcription errors in terms of its foldingstructure and energy. The first measure is the meanchange (over all point mutations) in mRNA foldingenergy; the second measure is the number of errorscausing modification of mRNA folding; and the third isthe mean number of nucleotide-nucleotide connectionsthat are present/absent in the two-dimensional foldingstructure of the original mRNA sequence but absent/present in the two-dimensional structure of the mutatedone [33] (Figure 3A; Materials and methods). Thesemeasures were computed for all sliding windows of 40nucleotides (close to the footprint of the ribosome onthe mRNA sequence; Materials and methods) in all S.cerevisiae and E. coli genes.We found a significant signal for increased robustness
to transcription errors in terms of the folding energy atthe beginning of genes (P = 1.4 × 10-100; Figure 3B;Materials and methods). The signal remains significantwhen controlling for the folding energy of the mRNAsequences (that is, to rule out the possibility that therobustness is a result of the more extreme folding inthis region as mentioned in the previous sections; all P-values < 0.05; the most significant P-value = 9.6 × 10-68;Figure 3C; Materials and methods) and when comparing
Tuller et al. Genome Biology 2011, 12:R110http://genomebiology.com/2011/12/11/R110
Page 4 of 18
the profile to that of randomized sequences with identi-cal amino acids (and maintaining the codon bias of theorganisms; that is, controlling for amino acid bias; P =6.5 × 10⁻⁵; Figure 4D; Materials and methods). Thus,these results suggest that at the beginning of genesthere is selection for increased robustness to transcrip-tion errors in terms of changes in mRNA folding.
Similar results were obtained for E. coli (see all theresults, controls, and corresponding P-values in FiguresS11 to S19 in Additional file 2).Next, we performed a similar analysis with respect to
the tAI and the charge for windows of 13 codons (thefootprint of the ribosome on the mRNA [15,34], smallvariations in the window size did not alter the
Figure 2 Profiles of charge, folding energy, and co-adaptation between codon bias and the tRNA pool for genes with high and lowribosomal density. (a-c) Profiles of charge (a), folding energy (b) and co-adaptation between codon bias and the tRNA pool (c) for genes withhigh ribosomal density (red; top 10%) and genes with low ribosomal density (green; bottom 10%) in S. cerevisiae. (d-f) Profiles of charge (d),folding energy (e) and co-adaptation between codon bias and the tRNA pool (f) for genes with high (mRNA levels) × (Ribosomal density) (red;top 10%) and genes with low (mRNA levels) × (ribosomal density) (green; bottom 10%) in S. cerevisiae. The ramps and corresponding P-valuesare shown in the figure. Similar graphs were obtained for E. coli and C. elegans (see graphs and corresponding P-values in Figures S4 and S5 inAdditional file 2).
Tuller et al. Genome Biology 2011, 12:R110http://genomebiology.com/2011/12/11/R110
Page 5 of 18
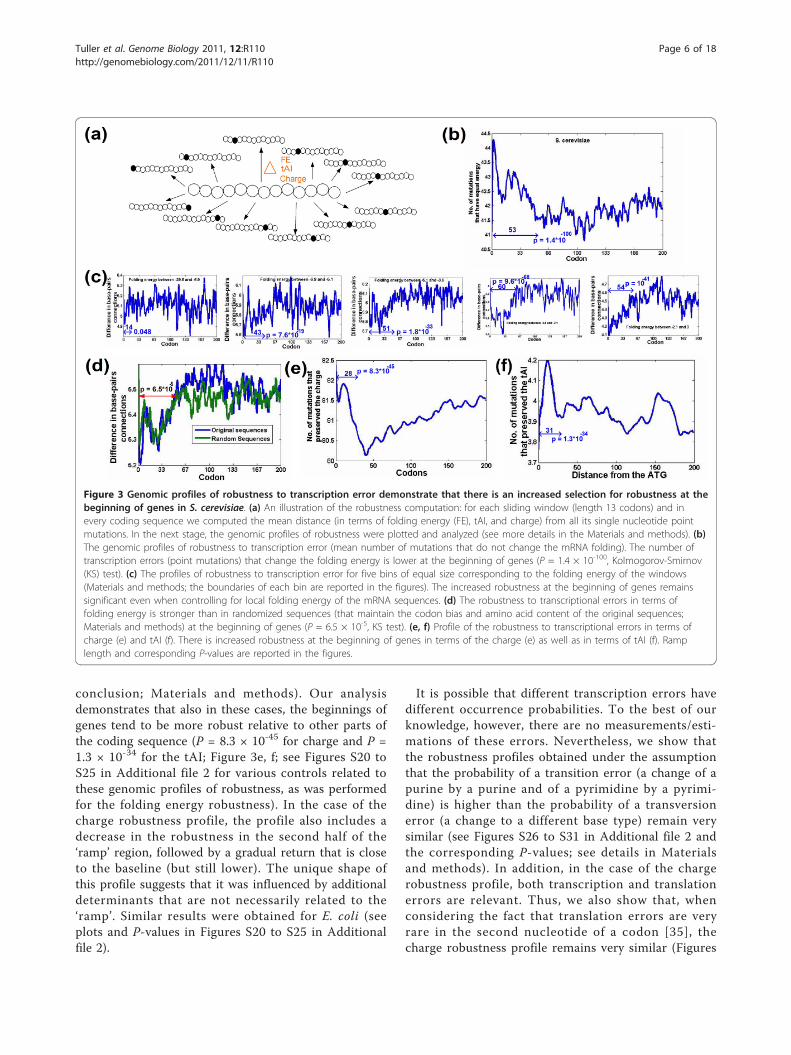
conclusion; Materials and methods). Our analysisdemonstrates that also in these cases, the beginnings ofgenes tend to be more robust relative to other parts ofthe coding sequence (P = 8.3 × 10-45 for charge and P =1.3 × 10⁻³⁴ for the tAI; Figure 3e, f; see Figures S20 toS25 in Additional file 2 for various controls related tothese genomic profiles of robustness, as was performedfor the folding energy robustness). In the case of thecharge robustness profile, the profile also includes adecrease in the robustness in the second half of the‘ramp’ region, followed by a gradual return that is closeto the baseline (but still lower). The unique shape ofthis profile suggests that it was influenced by additionaldeterminants that are not necessarily related to the‘ramp’. Similar results were obtained for E. coli (seeplots and P-values in Figures S20 to S25 in Additionalfile 2).
It is possible that different transcription errors havedifferent occurrence probabilities. To the best of ourknowledge, however, there are no measurements/esti-mations of these errors. Nevertheless, we show thatthe robustness profiles obtained under the assumptionthat the probability of a transition error (a change of apurine by a purine and of a pyrimidine by a pyrimi-dine) is higher than the probability of a transversionerror (a change to a different base type) remain verysimilar (see Figures S26 to S31 in Additional file 2 andthe corresponding P-values; see details in Materialsand methods). In addition, in the case of the chargerobustness profile, both transcription and translationerrors are relevant. Thus, we also show that, whenconsidering the fact that translation errors are veryrare in the second nucleotide of a codon [35], thecharge robustness profile remains very similar (Figures
Figure 3 Genomic profiles of robustness to transcription error demonstrate that there is an increased selection for robustness at thebeginning of genes in S. cerevisiae. (a) An illustration of the robustness computation: for each sliding window (length 13 codons) and inevery coding sequence we computed the mean distance (in terms of folding energy (FE), tAI, and charge) from all its single nucleotide pointmutations. In the next stage, the genomic profiles of robustness were plotted and analyzed (see more details in the Materials and methods). (b)The genomic profiles of robustness to transcription error (mean number of mutations that do not change the mRNA folding). The number oftranscription errors (point mutations) that change the folding energy is lower at the beginning of genes (P = 1.4 × 10-100, Kolmogorov-Smirnov(KS) test). (c) The profiles of robustness to transcription error for five bins of equal size corresponding to the folding energy of the windows(Materials and methods; the boundaries of each bin are reported in the figures). The increased robustness at the beginning of genes remainssignificant even when controlling for local folding energy of the mRNA sequences. (d) The robustness to transcriptional errors in terms offolding energy is stronger than in randomized sequences (that maintain the codon bias and amino acid content of the original sequences;Materials and methods) at the beginning of genes (P = 6.5 × 10⁻⁵, KS test). (e, f) Profile of the robustness to transcriptional errors in terms ofcharge (e) and tAI (f). There is increased robustness at the beginning of genes in terms of the charge (e) as well as in terms of tAI (f). Ramplength and corresponding P-values are reported in the figures.
Tuller et al. Genome Biology 2011, 12:R110http://genomebiology.com/2011/12/11/R110
Page 6 of 18
S30 and S31 in Additional file 2; see details in Materi-als and methods).
The three genomic profiles explain the ribosomal densityprofileEach of the three coding sequence profiles has significantpartial correlation with the ribosomal density profileUnder the assumption of a constant flux of ribosomes,the density of ribosomes is higher for lower ribosomalvelocity and it is proportional to 1/(Ribosomal velocity)[8]. In this section, we aim to verify that the three pro-files of coding sequence features (previously reported)contribute to the genomic ribosomal density profile[8,15] and thus to the ribosomal speed profile. If thereis correlation between the ribosomal speed or densityand features of the coding sequence, it should appear
along the entire sequence and not only at the beginning.As longer sequences should have larger statistical power(but the length should be shorter than most of thegenes), we decided to check the three profiles along 200codons.First, we found that the three genomic profiles of the
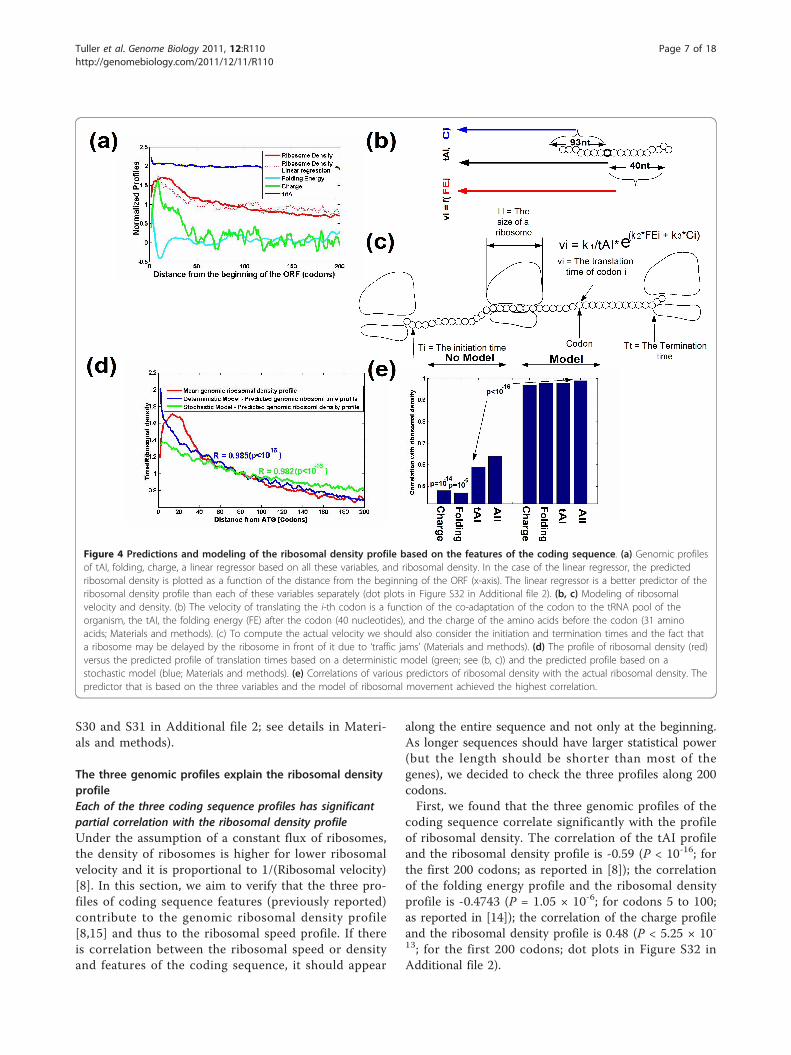
coding sequence correlate significantly with the profileof ribosomal density. The correlation of the tAI profileand the ribosomal density profile is -0.59 (P < 10-16; forthe first 200 codons; as reported in [8]); the correlationof the folding energy profile and the ribosomal densityprofile is -0.4743 (P = 1.05 × 10⁻⁶; for codons 5 to 100;as reported in [14]); the correlation of the charge profileand the ribosomal density profile is 0.48 (P < 5.25 × 10⁻¹³; for the first 200 codons; dot plots in Figure S32 inAdditional file 2).
Figure 4 Predictions and modeling of the ribosomal density profile based on the features of the coding sequence. (a) Genomic profilesof tAI, folding, charge, a linear regressor based on all these variables, and ribosomal density. In the case of the linear regressor, the predictedribosomal density is plotted as a function of the distance from the beginning of the ORF (x-axis). The linear regressor is a better predictor of theribosomal density profile than each of these variables separately (dot plots in Figure S32 in Additional file 2). (b, c) Modeling of ribosomalvelocity and density. (b) The velocity of translating the i-th codon is a function of the co-adaptation of the codon to the tRNA pool of theorganism, the tAI, the folding energy (FE) after the codon (40 nucleotides), and the charge of the amino acids before the codon (31 aminoacids; Materials and methods). (c) To compute the actual velocity we should also consider the initiation and termination times and the fact thata ribosome may be delayed by the ribosome in front of it due to ‘traffic jams’ (Materials and methods). (d) The profile of ribosomal density (red)versus the predicted profile of translation times based on a deterministic model (green; see (b, c)) and the predicted profile based on astochastic model (blue; Materials and methods). (e) Correlations of various predictors of ribosomal density with the actual ribosomal density. Thepredictor that is based on the three variables and the model of ribosomal movement achieved the highest correlation.
Tuller et al. Genome Biology 2011, 12:R110http://genomebiology.com/2011/12/11/R110
Page 7 of 18
Second, we verified that these correlations are main-tained even if we control for the other two variables(Materials and methods; Note S4 in Additional file 1).Indeed, all partial correlations were significant: the par-tial correlation of the charge and the ribosomal densityprofile given the other two variables, R(Charge, Riboso-mal density | tAI, Folding), is 0.314 (P = 6.5 × 10⁻⁶;empirical P < 0.01); the partial correlation of the tAIand the ribosomal density profile given the other twovariables, R(tAI, Ribosomal density | Charge, Folding), is-0.47 (P = 3.35 × 10⁻¹²; empirical P < 0.01); the partialcorrelation of the local folding and the ribosomal den-sity profile given the other two variables, R(Folding,Ribosomal density | Charge, tAI), is -0.224 (P = 0.0015;empirical P < 0.01).In addition, when we inferred a linear regressor
(Materials and methods) based on the three features ofthe coding sequence we obtained an improved correla-tion with ribosomal density compared to the correlationwith each of the features separately, resulting in a plotthat significantly resembles the ribosomal density graph(Spearman correlation 0.87, P < 10-16; Figure 4a; FigureS32d in Additional file 2; when we did not consider thefirst 50 codons (the region of the ramp) the correlationwas only 0.33, P = 4 × 10⁻⁵). The formula of the regres-sor was: (1/tAI) × 3.18 + Folding energy × (-0.177) +Charge × 5 - 3.034. In addition the P-values (confidenceintervals) of the three features were significant (foldingP = 0.01; charge and tAI P-values < 0.005), suggestingthat all three have a significant contribution to theregressor.The results remained robust when we performed
leave-one-out iterations, where in each iteration theregressor was inferred based on 50% of the sequencesand was applied on the remaining sequences (P < 0.01;Materials and methods).As a whole, the results reported in this section
demonstrate that each of the features of the codingsequence makes a distinct contribution to the transla-tion rate and density of ribosomes. In addition, theresults reported in this section suggest that the tAImakes the most substantial contribution, whilst the fold-ing energy makes the smallest, to the ribosomal densityprofile.An integrated model of ribosomal density and translationrateWe investigated the possibility of improving the correla-tion with the genomic profile of ribosomal density byemploying a model based on: 1) the three features ofthe coding sequence; and 2) ribosomal size and theinteractions between them [8,34].A depiction of the model is shown in Figure 4b, c: the
nominal velocity of each codon is a superposition of itstAI, the charge of the amino acid before the codon and
the folding energy before and after the codon (see theexact details in Materials and methods). In addition, aribosome translating slower codons may block theadvancement of ribosomes moving behind it (Materialsand methods). Assuming constant ribosomal flux andno ribosomal abortion, the length of time a ribosometranslates each codon should be proportional to theribosomal density of the codon [8]. Indeed, when wecorrelated the predictions of this model (the mean geno-mic translation time of codons) with the genomic profileof ribosomal density, the correlation was near maximal(r = 0.982; P < 10-16; Figure 4d, e) and was significantlybetter when we considered all three genomic featuresrather than a subset of them (P < 0.05; Materials andmethods); a similar correlation (r = 0.98; P < 10-16) wasobtained when we performed a cross-validation (Materi-als and methods). We found that small changes in themodel (regarding the subsequences near the codon thataffect its translation; Materials and methods) haveminor effect on the results of the model (all correlationsbetween 0.984 and 0.985) but the slope of the currentmodel (Figure 4b, c) better resembles the slope of themeasured ribosomal density profile.In addition, when we used a stochastic model of gene
translation [36] (Materials and methods) we were ableto get a slope of the predicted genomic profile of riboso-mal density that better resembles the slope measuredfrom the ribosomal density profile (Figure 4d). However,the correlation remained as in the deterministic case (r= 0.985; P < 10-16).
Ribosomal densities versus the three coding sequencefeatures: a site-by-site comparisonIn this section, we establish the existence of a relation-ship between coding sequence features and ribosomaldensity in each individual gene. However, we expectthat such correlations will be much lower than thosewith the genomic profiles, due to the noisiness of ribo-somal density measurements (Materials and methods).In addition, the measures used for estimating the adap-tation to the tRNA pool and the effect of charge/foldingare only approximations of the real measures.First, we computed the ‘bottleneck’ for each gene, that
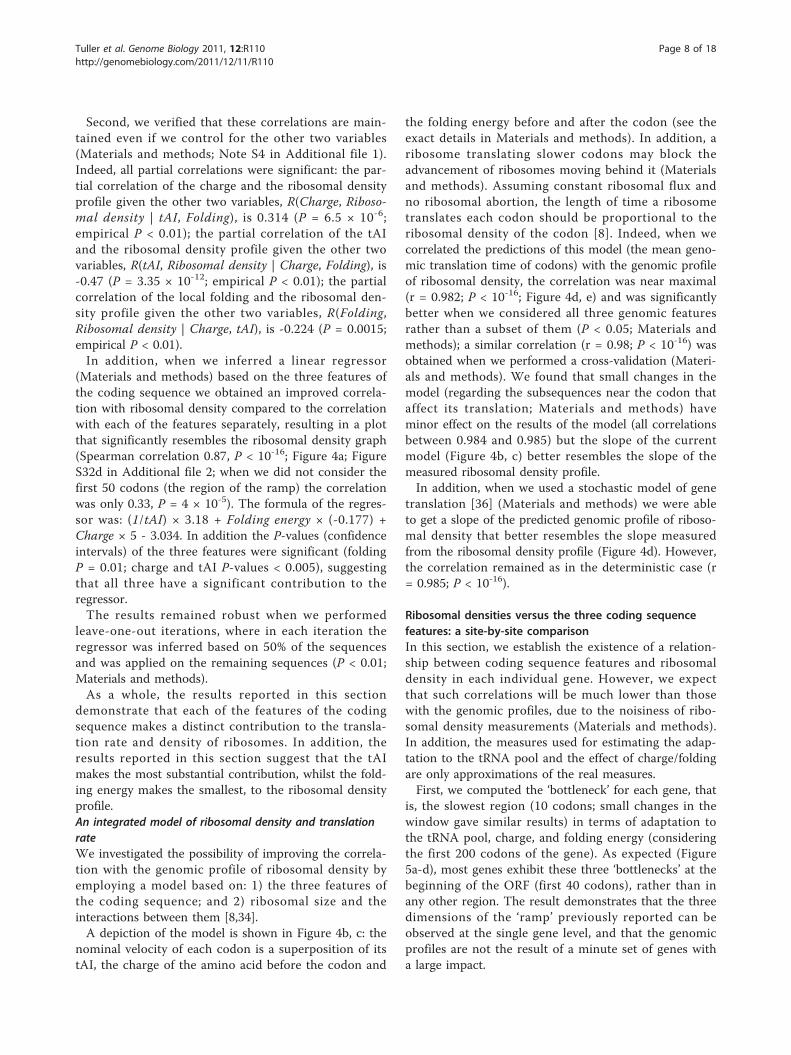
is, the slowest region (10 codons; small changes in thewindow gave similar results) in terms of adaptation tothe tRNA pool, charge, and folding energy (consideringthe first 200 codons of the gene). As expected (Figure5a-d), most genes exhibit these three ‘bottlenecks’ at thebeginning of the ORF (first 40 codons), rather than inany other region. The result demonstrates that the threedimensions of the ‘ramp’ previously reported can beobserved at the single gene level, and that the genomicprofiles are not the result of a minute set of genes witha large impact.
Tuller et al. Genome Biology 2011, 12:R110http://genomebiology.com/2011/12/11/R110
Page 8 of 18
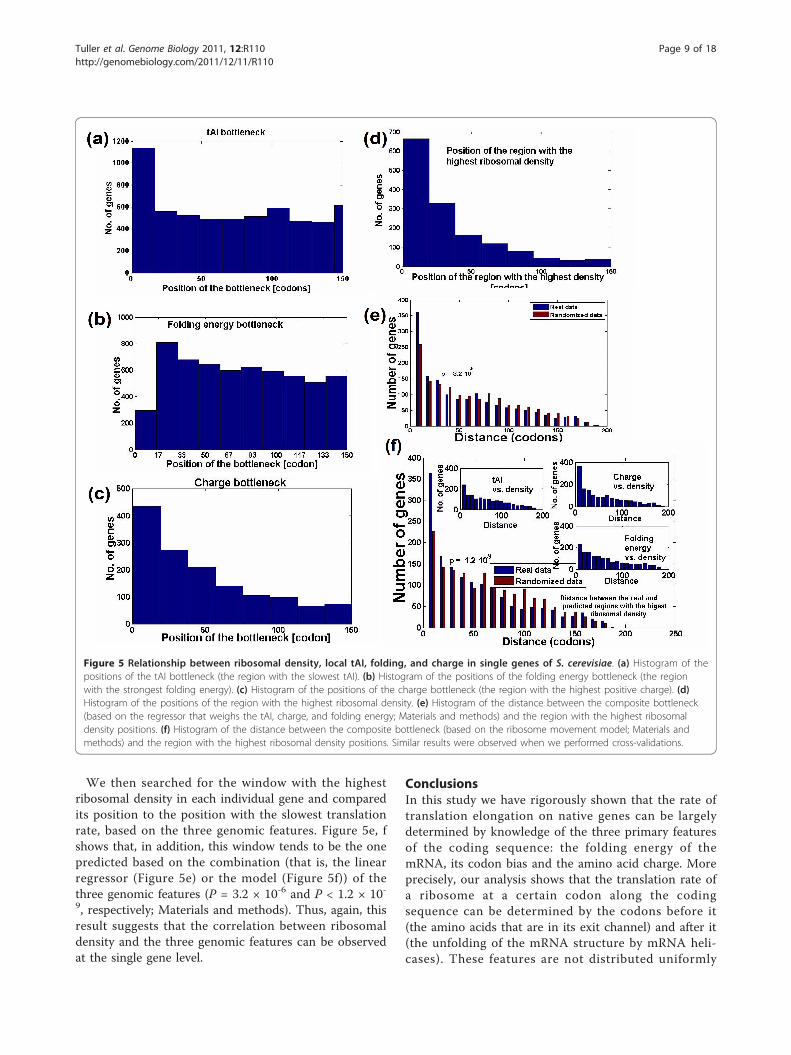
We then searched for the window with the highestribosomal density in each individual gene and comparedits position to the position with the slowest translationrate, based on the three genomic features. Figure 5e, fshows that, in addition, this window tends to be the onepredicted based on the combination (that is, the linearregressor (Figure 5e) or the model (Figure 5f)) of thethree genomic features (P = 3.2 × 10⁻⁶ and P < 1.2 × 10⁻⁹, respectively; Materials and methods). Thus, again, thisresult suggests that the correlation between ribosomaldensity and the three genomic features can be observedat the single gene level.
ConclusionsIn this study we have rigorously shown that the rate oftranslation elongation on native genes can be largelydetermined by knowledge of the three primary featuresof the coding sequence: the folding energy of themRNA, its codon bias and the amino acid charge. Moreprecisely, our analysis shows that the translation rate ofa ribosome at a certain codon along the codingsequence can be determined by the codons before it(the amino acids that are in its exit channel) and after it(the unfolding of the mRNA structure by mRNA heli-cases). These features are not distributed uniformly
Figure 5 Relationship between ribosomal density, local tAI, folding, and charge in single genes of S. cerevisiae. (a) Histogram of thepositions of the tAI bottleneck (the region with the slowest tAI). (b) Histogram of the positions of the folding energy bottleneck (the regionwith the strongest folding energy). (c) Histogram of the positions of the charge bottleneck (the region with the highest positive charge). (d)Histogram of the positions of the region with the highest ribosomal density. (e) Histogram of the distance between the composite bottleneck(based on the regressor that weighs the tAI, charge, and folding energy; Materials and methods) and the region with the highest ribosomaldensity positions. (f) Histogram of the distance between the composite bottleneck (based on the ribosome movement model; Materials andmethods) and the region with the highest ribosomal density positions. Similar results were observed when we performed cross-validations.
Tuller et al. Genome Biology 2011, 12:R110http://genomebiology.com/2011/12/11/R110
Page 9 of 18
along the coding sequence, probably due to selection forslower ribosomal translation rates (higher ribosomaldensity) at the beginning of the coding sequences inorder to improve ribosomal allocation and decreaseribosomal jamming [8]. Furthermore, we have ascer-tained that these results remain significant under variouscontrols, in various organisms, and for different sets ofgenes (Note S5 in Additional file 1 covers additionalgenomic profiles that relate to translation).It is important to note that although the predicted
genomic ribosomal density profile highly correlated withthe measured profile, there is still a gap between theshapes of both profiles (for example, the slope of themeasured profile is higher; Figures 4 and 5). This gapmay be the result of additional factors that are relatedto ribosomal translation speed that were not taken intoaccount in this paper; among these factors are the initia-tion rate, ribosomal abortion, and condition-specifictRNA abundance and mRNA folding. Furthermore, thisgap might also be partially related to noise and bias inthe ribosomal density measurements (Materials andmethods).One important aspect of gene translation that clearly
can be improved in the model presented in this study isthe initiation step. In the future we plan to improve ourmodel by taking into account different features of the5’UTR (for example, mRNA folding energy, lengths ofthe 5’UTR, the Kozak context of the first ATG of theORF [37], and the number of times the sequence ATGappears in the 5’UTR) and by modeling ribosomal abor-tions; we believe that these changes in the model willimprove the ribosomal density predictions.It is important to remember that in this paper we ana-
lyze native genes; thus, it is possible that part of thereported effect of the coding features on the ribosomaldensity profile is not causal. To verify this point, furtherexperimental studies of ribosomal profiles based on var-iants of the same non-native protein(s) should be per-formed (as was done in [7,38] for studying determinantsof protein abundance).In addition, we demonstrate that coding sequences
have increased robustness to transcription errors attheir beginning, in terms of these three features. Whilerobustness to mutations related to DNA mutation interms of their effect on the properties of the amino acidthey encode have been demonstrated before [35], herewe suggest a new type of robustness - increased robust-ness to transcription error in terms of the effect of suchmutations on translation at the beginning of the codingsequences. The results reported in this paper and in[35] may suggest that the robustness of the genetic codeis partially related to the resilience of the ribosome pro-cessing speed.
The results reported in this paper may suggest thatmutations/errors at the beginning of the codingsequence that alter the tAI/folding energy/charge usuallyhave a higher influence on the fitness of the organismthan mutations/errors occurring in other regions of thecoding sequence. As we can not prove causality by ana-lyzing endogenous genes, further experimental analysisis needed to verify if this is indeed the case.This increased robustness can be related directly to
ribosomal allocation, which is more affected by muta-tions in the ramp, but may also be indirectly related, forexample, to an increased effect on misfolding of proteinsand the production of toxic proteins (see, for example,[39]). Thus, it is not clear how to evaluate the contribu-tion of ramp robustness to the fitness of an organism.Thus, the increased robustness to transcription errors
in the first 30 to 50 codons may suggest that this is themost critical region of the coding sequence for the regu-lation of gene translation and ribosomal allocation. Apossible explanation of this result is the fact that thisregion is occupied by relatively more ribosomes (see, forexample, Figure 1), that is, it is subject to heavier ribo-somal traffic. Thus, it is possible that changes in elonga-tion rates due to transcription errors in coding regionsthat are occupied by more ribosomes have a larger effecton an organism’s fitness.The results reported in this paper suggest practical
ways to optimize heterologous coding sequences inorder to express them in a new host, a common bio-technological task (see, for example, [6,7,38]). Since therate of translation elongation is affected by not justcodon bias, one should also consider the effect of thechosen codons on the folding energy (and/or thecharge) of the sequences. Specifically, a ‘ramp’ thatslows down ribosomes is helpful to increase the fitnessof the host and thus the protein production rate [8].This ramp should be shaped according to the combinedeffect of the folding energy, charge and codon bias ofthe coding sequences.
Materials and methodsVarious sources of informationtRNA copy numbersThe tRNA copy numbers of S. cerevisiae were down-loaded from [40]; other tRNA copy numbers weredownloaded from [41].Coding sequencesThe coding sequences of the analyzed organisms weredownloaded from the FTP site of the National Centerfor Biotechnology Information (NCBI).Protein abundanceProtein abundance measurements were downloadedfrom [42].
Tuller et al. Genome Biology 2011, 12:R110http://genomebiology.com/2011/12/11/R110
Page 10 of 18
Gene Ontology associationsThe Gene Ontology (GO) associations of S. cerevisiaegenes are from [43].Gene expressionmRNA levels of E. coli were downloaded from [18];mRNA levels of S. cerevisiae were downloaded from[15]; mRNA levels of C. elegans come from the GeneExpression Omnibus (GEO) [44] (GDS1786).Lists of ribosomal proteinsThe lists of ribosomal proteins were downloaded from[43].Measurements of mRNA foldingMeasurements of mRNA folding in S. cerevisiae genesare from [28].Ribosomal densitiesWe used two data sources of ribosomal density in S. cer-evisiae. The first dataset comes from Arava et al. [13]and includes measurements of ribosome number oneach mRNA molecule (without information about theper-codon density); they were used to generate Figure 2.To obtain ribosomal densities, we normalized thesevalues by the length of the ORFs.The second dataset [15] includes measurements of
ribosomal density at a single nucleotide resolution. Thisdataset is noisy at the single gene level (for example, theribosomal density along a gene may change from a posi-tive number to zero and, again, to a positive number)but when considering large enough sets of genes, itenables a good estimation of the spatial ribosomal den-sity trend.Data generated in this paperThe data that were generated in this study can be down-loaded from [45].
Computing foldingFolding energy was calculated using the Vienna package[46].
Computing the tRNA adaptation indexWe computed the tAI similarly to the way it was com-puted in the work of dos Reis et al. [25]. This measuregauges the availability of tRNAs for each codon alongan mRNA. As codon-anti-codon coupling is not uniquedue to wobble interactions, several anti-codons canrecognize the same codon, with different efficiencyweights (see dos Reis et al. for all the inter-codon-anti-codon relations).Let ni be the number of tRNA isoacceptors recogniz-
ing codon i. Let tCGNij be the copy number of the j-thtRNA that recognizes the i-th codon, and let Sij be theselective constraint on the efficiency of the codon-anti-codon coupling. We define the absolute adaptiveness,Wi , for each codon i as:
Wi =ni∑j=1
(1 − Sij)tCGNij
From Wi we obtain wi, which is the relative adaptive-ness value of codon i, by normalizing the Wi values(dividing them by the maximum of all 61 Wi values).The final tAI of a gene g, is the following geometric
mean:
tAIg =
⎛⎝
lg∏k=1
wikg
⎞⎠
1/lg
where ikg is the codon defined by the k-th triplet ongene g; and lg is the length of the gene (excluding stopcodons).We implemented one alteration compared to the com-
putations of dos Reis et al.; we re-inferred the Sij values(appearing in the equation above) by performing a hill-climbing optimization of the Spearman correlationbetween protein abundance and translation efficiency inS. cerevisiae.To this end we used the protein abundance measure-
ments mentioned above.The Sij values can be organized in a vector (S vector)
as described in [25]; each component of this vector isrelated to one wobble nucleoside-nucleoside pairing: I:U,G:U, G:C, I:C, U:A, I:A, and so on.
Computing profiles of tRNA adaptation index, folding andchargeThe local folding profile of a gene was defined as thevector of the folding values assigned to the sliding win-dows of length 40 nucleotides, that is:
Local FEGenei = (FE1, FE2, ..., FEn)
where FE is the folding energy.All the genes in the genome were lined up once
according to their start codon, and once according totheir stop codon. The two profiles of mean foldingenergy were calculated as:
Local FEstart = (FE2, FE3, FE4, ...)
Local FEend = (FEn, FEn−1, FEn−2, ...)
where:
FEi =∑
Genesi
FEi/ |Genesi|
and Genesi is the number of genes with at least i + 140-nucleotide windows.Local profiles of amino acid charge were computed in
a similar way. First, we computed for each gene a vector
Tuller et al. Genome Biology 2011, 12:R110http://genomebiology.com/2011/12/11/R110
Page 11 of 18
of the charge assigned to the amino acids of the gene(+1 for a positive charge, -1 for a negative charge, 0 fora neutral amino acid). Next, we lined up the genes onceaccording to their start codon, and once according totheir stop codon, and computed the mean charge ateach position.The local profiles of tAI were computed in a similar
way [8]. First, we computed for each gene a vector ofthe tAI assigned to the codons of the gene. Next, welined up the genes once according to their start codon,and once according to their stop codon, and computedthe mean tAI at each position (codon).When we computed the reported profiles we consid-
ered all the genes (that is, we did not filter short genes)as we believe that the important feature in our contextis the distance from the ATG in codons and not in per-centage of the coding sequences (see also [8]). Most ofthe analyzed genes are longer than 200 codons; in S. cer-evisiae, for example, less than 20% of the genes areshorter than 200 codons (1,119 out of 5,861; a histo-gram of the S. cerevisiae gene lengths is shown in FigureS46 in Additional file 2).
Computing the profile of ribosomal densityThe data for the ribosomal density profile were kindlysupplied to us by Dr Ingolia. He sent us the data thatwere used for generating Figure 2d in their paper [15].The data included read density at single nucleotide reso-lution as a function of position along the gene for well-expressed genes. The read density of each gene was nor-malized compared to itself (see details in [15]). We aver-aged the ribosomal density values of the nucleotides ofeach codon (as the data of Ingolia et al. was at the atsingle nucleotide resolution) in each gene to obtain aper-codon measurement of ribosomal density. Thegenomic ribosomal density profile was computed in away similar to the tAI, folding energy and charge pro-files (the values of each codon were averaged over allthe relevant genes).
Profiles of tRNA adaptation index, folding and charge forgroups of genesProfiles of coding sequence determinants for specificgene groups (for example, ribosomal proteins and GOslim groups) were computed as reported above. In thesecases, however, we only considered the genes in thegroup.
The tRNA adaptation index as a predictor of proteinabundanceHighly expressed genes have more efficient codons toimprove their translation rate, the allocation of ribo-somes, and the fitness of the organism [7,14]. Thus, it isnot surprising that in many organisms measures of
codon bias such as the tAI exhibit significant correlationwith protein abundance [5,14,40,47]. In S. cerevisiae, forexample, the correlation between tAI and protein abun-dance is higher than 0.6 [5,40].
Linear regression and partial correlationsLet X and Y denote two variables and Z = [Z1, Z2, Z3,..]denote a set of variables. The non-parametric multivari-ate analysis that is reported in this paper includes partialSpearman correlations of the from R(X,Y|Z). Roughly, ifsuch a correlation is significant, it means that there is arelationship between X and Y that can not be explainedby the variables in Z. Specifically, we computed the cor-relation between ribosomal density (X) and one of thethree coding sequence determinants (Y; tAI, charge, orfolding energy) given the rest of the coding sequence’sdeterminants. This analysis was performed by the com-mercial MATLAB software (see more details inMATLAB help. Founded in 1984, MathWorks employs2200 people in 15 countries, with headquarters inNatick, Massachusetts, USA).Let rxy denote the matrix of the correlation coefficient
corresponding to the vectors x and y. The partial corre-lation for two variables (x and y) when controlling for athird variable (z), rxy_z, is computed according to thefollowing formula (see, for example, [48]):
rxy z =rxy − rxz ∗ ryz√(
1 − (rxz)2) ∗(1 − (
ryz)2
) (1)
When we want to control for more than one variablewe can use the formula above in a recursive way. Forexample, the correlation between x, y when controllingfor z and w (the case that was reported in the paper) is:
rxy zw =rxy z − rxw z ∗ ryw z√(
1 − (rxw z)2) ∗(1 − (
ryw z)2
) (2)
In Equation 2, rxy_z, rwy_z, ryw_z, rxw_z, and ryw_zare computed using Equation 1.The P-values are computed for linear and rank partial
correlations using a Student’s t distribution for a trans-formation of the correlation. This is exact for linear par-tial correlations when the variables are normal, but ifthis is not the case it is a large-sample approximation.We also computed an empirical P-value that was basedon 100 permutations of x and y (the variables that arenot controlled for). The empirical P-value is the fre-quency of the times that the partial correlation of thepermutated vector was larger than the original one (itwas significant for all variables).The regressor mentioned in the main text is a linear
regressor, where the explained variable is the ribosomal
Tuller et al. Genome Biology 2011, 12:R110http://genomebiology.com/2011/12/11/R110
Page 12 of 18
density and it is explained by the three coding sequencedeterminants (tAI, charge, and folding energy). As wementioned above, the ribosomal density data are noisy;thus, we utilized the smoothed version of all the profiles(five-point moving average; the default parameter inMATLAB), but obtained very similar results withoutsmoothing.
Simulation of ribosomal movementThe ribosomal movement model was based on the workof [34] (Figure 4c). According to this model, the nom-inal translation time of a codon is determined by thecharge of the amino acid encoded by the codon (andthe charge of the amino acids encoded by the neighbor-ing codons upstream), the co-adaptation of the codon tothe tRNA pool, and the strength of mRNA folding near(upstream of) the codon (see more details in the nextsection).The actual translation time of a codon is also related
to the potential presence of a ribosome downstream ofit. If there is a proximal ribosome in front of it, theribosome translating the codon is delayed until the ribo-some downstream of it proceeds.Other parameters of the simulations are: the mini-
mum distance between two consecutive ribosomes (thatis, the size of the ribosome); the ribosome binding time(initiation time); and the termination time (the timerequired for the ribosome to release the mRNA). Theproperties (for example, translation time) of the ribo-some movement regime were computed at steady state(that is, when there was a negligible change in the trans-lation time between consecutive ribosomes and after atleast one ribosome completed the translation).
Stochastic model of translation elongationThis model is based on [36]. We model an mRNA withN codons as a chain of sites, each of which is labeled byi. The first and last codons, i = 1, i = N, are associatedwith the start and stop codons, respectively. At anytime, t, attached to the mRNA are M(t) ribosomes. Eachribosome will cover l codons. Any codon may be cov-ered by a single ribosome or none. To locate a ribo-some, we arbitrarily assume that the codon beingtranslated is the one in the middle of the ribosome. Forexample, if the first (l + 1)/2 codons are not covered, aribosome can bind to the first codon on the mRNAstrand, and then it is said to be ‘on codon i = 1’. A com-plete specification of the configuration of the mRNAstrand is given by the codon occupation number: ni = 1if codon i is being translated and ni = 0 otherwise. Notethat when ni = 1 the (l - 1)/2 codons before and aftercodon i are covered by the ribosome that is on site i butsince they are not the ones being translated the codonoccupation number for them is equal to zero.
We will now specify the dynamics of this model. Afree ribosome will attach to codon i = 1 with rate l,provided that the first (l + 1)/2 codons on the mRNAare empty. An attached ribosome located at codon i willmove to the next codon i + 1 with rate li, providedcodon i + (l + 1)/2 is not covered by another ribosome.In case i + (l + 1)/2 >N (the ribosome is bulging out ofthe mRNA strand) an attached ribosome will move tothe next codon with rate li. The translation rates li areinversely proportional to the mean translation times ti.In order to simulate these dynamics, we assume that
the time between initiation attempts is distributed expo-nentially with rate l. Similarly, the time between jumpattempts from site i to i + 1 is assumed to be exponen-tially distributed with rate li. Note that in the case of i= N the jump attempt is in fact a termination step. Wedefine an ‘event’ as an initiation, jump attempt, or ter-mination step. From our definition it follows that thetime between events is exponentially distributed (mini-mum of exponentially distributed random variables)with rate:
μ({ni}) = λ +N∑
i=1niλi
Note that a jump attempt from codon i can only bemade if there is a ribosome translating this codon andhence the rate μ({ni}) depends on the set of site occupa-tion numbers.The probability that a specific event was an initiation
attempt is given by l/μ({ni}). Similarly, the probabilitythat a specific event was a jump attempt (or termina-tion event) from site i to site i + 1 is given by nili/μ({ni}).At each step of the simulation, we determine the nat-
ure of the event and the time passed till its occurrenceby these rules. The set of site occupation numbers isthen updated accordingly and the simulation proceedsto the next event. For example, if an initiation attemptwas made, we check if the first (l + 1)/2 codons on themRNA are not covered. If so, we set ni = 1, otherwisethe attempt fails and ni remains as is. If a jump attemptfrom codon i to codon i + 1 was made, we check if sitei + (l + 1)/2 is not covered. If so, we set ni = 0 and ni+1= 1, otherwise the attempt fails and ni, ni+1 remain as is.Starting with an empty mRNA strand we simulated
the system for 250,000 steps. The system was thensimulated for an additional 1,000,000 steps where wekept track of the total number of terminations and thetotal time that have passed from the point this phasestarted. The steady state rate of protein production wasdetermined by dividing the number of terminationevents by the total time that has passed. The number ofsteps in the second stage was taken after observing that
Tuller et al. Genome Biology 2011, 12:R110http://genomebiology.com/2011/12/11/R110
Page 13 of 18
increasing the number of steps fourfold had a negligibleeffect on the predicted protein production rate.
Simulation of ribosomal movement: translation time of acodonThe translation time (or rate) of a codon (or the nom-inal speed of its translation) is based on three featuresof the coding sequence. First is the co-adaptation of thecodon to the tRNA pool; this value was based on thetAI. Second is the charge of the amino acids corre-sponding to the 31 neighboring upstream codons. Theexit tunnel of a ribosome has negative charge and itslength is around 31 amino acids [24]; thus, amino acidswith positive charge should slow the translation time ofa ribosome [24]. At the beginning of the gene we con-sidered the l < 32 amino acids before the codon. Thirdis the folding energy of the neighboring downstreammRNA (40 nucleotides from the start of the codon).Stronger folding should slow the ribosome [49,50].When the ribosome translates a codon the A site of theribosome lies in the middle of a stretch of mRNA thatis physically occupied and unwound by the ribosome;however, we are interested in modeling the delay/speedof the ribosome when it is translating this codon. Atthis stage, the mRNA folding before the ribosome is notrelevant (the ribosome already translated these codons);the mRNA folding after the ribosome is relevant as thispart of the mRNA should be unfolded by the helicasebefore the ribosome continues and moves forward.The non-normalized time corresponding to the adap-
tation to the tRNA pool of the organism (tAIi) of codoni is: 1/tAIi.The non-normalized time corresponding to the charge
upstream of codon i is the sum of ‘amino acid charges’among the 32 amino acids before the codon (where aneutral amino acid adds 0 to the sum, a positivelycharged amino acid adds 1 to the sum, and a negativelycharged amino acid adds -1 to the sum; the amino acidswith positive charge are Arg and His, and Lys, while theamino acids with negative charge are Asp and Glu).The non-normalized time corresponding to the fold-
ing energy downstream of codon i is the folding energyof the 40-nucleotides starting from the beginning of thecodon (at the end of the sequence consider the 3’ UTR).The three normalized times were computed as follows:
for each of the three features we divide their non-nor-malized value by their mean value along all the codingsequences and all windows, such that the mean of eachof the normalized features will be 1.Let Ntai(i) denote the ‘normalized tRNA pool adapta-
tion time’ of codon i; let Nch(i) denote the ‘normalizedcharge time’ of codon i; let Nfe(i) denote the ‘normal-ized folding energy time’ of codon i.
The total time corresponding to the the i-th codon isa1
Ntai(i)· ea2·Nch(i)+a3·Nfe(i) .
We checked a1, a2, a3 in the range 0[1] and chosethe values that optimized the correlation between theprediction of the ribosomal movement model (with thetimes above) and the actual ribosomal density. The cor-relation was based on the smoothed version of the realand predicted profiles (five-point moving average).We obtained similar correlations when we used charge
and folding before or after the codon, probably since thecharge and folding in close windows in a gene tend tobe similar and thus correspond to relatively similarspeeds.
The size of the ribosomeBased on previous studies [8,15,30,34,51], the footprintof the ribosome on the transcript is 10 to 20 codons. Aswas mentioned before, the exit channel, which is in adifferent compartment of the ribosome, is longer (31codons).
Profiles of mRNA secondary structure robustnessAn mRNA sequence is robust to errors (point muta-tions) if point mutations tend to maintain its twodimensional structure (compared to random sequenceswith similar features).We computed profiles of secondary structure robust-
ness by performing the following steps for each windowof length 40 nucleotides in each mRNA sequence. First,compute the folding structure and folding energy foreach of the 40 × 3 one-nucleotide point mutations ofthe sub-sequence. Second, compute the distance of eachmutated sequence from the original one in terms ofabsolute change in folding energy and the number ofchanges in the base-pair connections required for trans-ferring one structure to the other (see, for example,[33]); we also plotted the mean number of point muta-tions (errors) that do not change the mRNA structure.Third, average the distances for each window.As a control, we generated a randomized genome
maintaining the codon bias and the amino acidsequences in the original genome. We compared thedistribution of robustness obtained in the original gen-ome and the randomized one.To control for folding energy we divided the windows
into five groups of equal size; each group includes win-dows (over all genes) with similar folding energy. Weplotted the profiles of folding energy robustness foreach group separately.To manage the extensive amount of computations
needed for performing so many predictions of secondarystructure, we employed a cluster of eight computers
Tuller et al. Genome Biology 2011, 12:R110http://genomebiology.com/2011/12/11/R110
Page 14 of 18
(each of which had an AMD Opteron(tm) 252 2. GHzprocessor, two cores, and 6 GB RAM) and a six-corecomputer (AMD Phenom(tm) II X6 1090T 3.2 GHzprocessor, six cores, 16 GB RAM) for several weeks.
Profiles of tRNA adaptation index and charge robustnesstRNA adaptation index and charge robustness profileswere computed in a similar manner. In the case of thecharge, we computed for each window of 13 codons thenumber of point mutations that change the charge ofthe corresponding amino acids, and the mean change inthe charge due to point mutations. In the case of thetAI, we computed for each window of 13 codons theaverage (over all point mutations) change in the tAIscore of the codon, and the number of mutations thatdo not change the tAI of the codon. At the next step,we plotted the corresponding genomic profiles ofrobustness as was described for the folding energyrobustness.
Robustness profiles: control for folding, tRNA adaptationindex, and chargeTo make sure that the robustness profiles are not trivi-ally a result of the fact that the folding, tAI, and chargevalues are more extreme at the beginning of the codingsequences, we also analyzed the robustness profileswhen considering only windows in certain ranges offolding, tAI, and charge, respectively (five bins of equalsize).It is also important to note that the codons (and simi-
larly the folding or the charge) at the beginning of thecoding sequence are less optimal than those at the endof it; that is, relative to the immediate context, thesecodons are not necessarily the universally least efficientones. For example, in highly expressed genes, thesecodons can be more efficient than all the codons oflowly expressed genes (Figure 2c).
Robustness profiles: assuming different probabilities oftransition and transversion errors; assuming thattranslation errors are relatively rare in the secondposition of the codonsTo consider the fact that transcription errors that resultin transition may have higher probability than transcrip-tion errors that result in transversion, we gave higherweights to the first type of errors when we computedthe robustness scores. For example, if we assume thatthe probability of a transition error is twice the prob-ability of a transversion error, the weight of such anerror/mutation in the folding/charge/tAI robustnessscore of an mRNA window is two times the weight oftransversion.Similarly, in the case of charge robustness, to consider
the fact that translation errors are very rare in the
second position of codons [35], the weight of such anerror/mutation in the charge robustness score of amRNA window is lower (for example, 0.1) than theweight of an error in the first/third positions of thecodons.
The length of the rampsThe length of the ramp (for a profile of tAI, charge,folding energy, or robustness) was computed similarly to[8] by comparing the mean (KS test) of sliding windowsof length 13 codons to the mean of the rest of the cor-responding profile (we considered the first 200 codons).The region at the beginning corresponding to a set ofconsecutive windows with a mean value significantlylower (P ≤ 0.05) than the mean of the entire profile wasdefined as the length of the ramp (the length of theramp is the number of significant consecutive windowsplus 12). We allowed this region to begin in the firstfive codons (if there was no significant window in thisregion, we declared that there is no ramp).
P-values for the folding, charge, and tAI profiles and thecorresponding robustness profilesWe performed two statistical tests to check if the codingsequence determinants of a certain position weresignificant.In the first test we checked if the value is more extreme
than in other positions. This test does not take intoaccount constraints on amino acid sequences. Firstly,however, we believe that selection for translation effi-ciency can also occur at the amino acid level - that is,there are many pairs of amino acids that, when substi-tuted, do not change the function of the protein but canimprove translation (see, for example, [52-54] about var-ious distances between amino acids). The effect on trans-lation and the coding sequence function is determined bythe position of the codon along the coding sequence. Sec-ondly, the effect of the various features of a codon on thetranslation rate of the ribosome can be significant, eventhough these profiles are not selected for.The first test was performed by comparing (KS test)
all the values in the positions within the ramp (see theprevious section) to the rest of the positions. A similartest was performed also while testing subgroups ofgenes (for example, ribosomal proteins and GO groups).In the second test we checked if the value is more
extreme than the randomized version of the position.The randomized version of the genome was generatedby maintaining the amino acid composition of each cod-ing sequence and the codon bias of the genome, andsampling for each gene, a randomized version underthese constraints. In this case, we compared the valuesof the positions within the ramp of the real genome andthe randomized one by a KS test.
Tuller et al. Genome Biology 2011, 12:R110http://genomebiology.com/2011/12/11/R110
Page 15 of 18
Predicted ribosomal density versus real ribosomal densityin single genesWe used the linear regressor and the model that gavethe best genomic ribosomal density to predict the ribo-somal density at a resolution of single codons in each ofthe S. cerevisiae genes. Next, we plotted the graph (his-tograms) of distances between the window with thehighest ribosomal density, and the window with highestpredicted ribosomal density. We show that the distancestend to be small. We compared the distribution of dis-tances corresponding to the real genome to a rando-mized genome, where the vectors of ribosomal densitieswere randomly permutated and show (by KS test) thatthe original mean is significantly smaller than the rando-mized mean.
Cross-validation tests and evaluation of the ribosomalmovement model and the regressorWe compared the model and regressor with all threefeatures to models that include only some of the fea-tures (for example, only charge and tAI without folding)by performing 20 cross-validation tests. In each test themodel was trained based on 50% of the data (trainingsets) and was implemented on the second 50% of thedata (test sets). We performed correlations between theribosomal density and the predicted ribosomal density(by the model or the regressor) for the test sets in thefull model and compared them to the correlationsobtained for the partial models. The empirical P-valuewas computed as percentage of cases where the partialmodel was better then the full one on the same test set.Differences (between pairs of correlations) larger than0.4% were assumed to be significant. We also compared,in a similar manner, the absolute sum of distancesbetween the predicted and real genomic profile of ribo-somal density.In the case of the predicted profile of ribosomal den-
sity in single genes, we divided the genes into twogroups as before, inferred the parameters of the modelbased on one of the groups and applied it to the secondgroup (as reported above).
Site-by-site comparisons of predicted versus realribosomal densityWe wanted to test whether there is a direct relationshipbetween the coding sequence determinants and theribosomal translation rate (speed). Thus, we aimed atshowing a significant relationship between local densityof ribosomes [15] and charge, tAI, and folding profilesin single genes. Such a task comes with several caveats:1) as mentioned, the measurements of ribosomal densityare very noisy; 2) ribosomes may interact with eachother (jam); 3) often, the rate-limiting step may beinitiation, which varies across genes.
To overcome these problems, we searched for thewindow with the highest ribosomal density in each indi-vidual gene and compared its position to the positionwith the slowest translation rate based on the threegenomic features. This relationship should hold alsowhen initiation is rate limiting and varies among genes,or when there are interactions between ribosomes.
Randomized profilesTo show that the genomic profiles reported in this study(the three ramps at the beginning of genes and theincreased robustness to transcription errors at the begin-ning of genes) are not due to amino acid bias, we com-pared the genomic profile of folding energy with a profileof folding energy observed for a randomization of thegenome. The genome was randomized in the followingmanner. Each codon was replaced by a random codon,according to the distribution (frequency) of codons cod-ing the same amino acid in the genome of the organism.Thus, the randomized genomes maintained both theamino acid content of each coding sequence and thecodon frequencies of the original genome.
Genomic profiles based on measurements of mRNAfoldingWe downloaded the mRNA measurement data from[28]. These data include for each nucleotide, in thou-sands of S. cerevisiae transcripts, the log ratio betweenthe probability that it is in a double-stranded conforma-tion and the probability that it is in a single-strandedconformation (parallel analysis of RNA structure (PARS)score [28]). If this value is higher, the position isinvolved in a double-stranded conformation and this isrelated to a higher folding energy. At the first stage (Fig-ure S2 in Additional file 2), we computed for each posi-tion the mean PARS score (over all the genes) andplotted two profiles: 1) a simple average; and 2) aweighted average (in which the weight of G or C, whichare involved in pairings with three hydrogen bonds, is 3,while the weight of A or T, which are involved in pair-ings with two hydrogen bonds, is 2). We performed aKS test and compared each position to the remaining600 ‘first’ positions along the genes. We found that thefirst three positions have a significantly low PARS score(weak mRNA folding) while the next two positions havea significantly high PARS score (strong mRNA folding).At the second stage we plotted this profile for highly
expressed genes (top 10% of the genes in terms ofmRNA-levels × ribosomal density) and lowly expressedgenes (bottom 10% of the genes in terms of mRNA-levels × ribosomal density) and demonstrated that thehigh/low PARS score reported above is stronger forhighly expressed genes (Figure S2 in Additional file 2;similar results were obtained for the weighted profile).
Tuller et al. Genome Biology 2011, 12:R110http://genomebiology.com/2011/12/11/R110
Page 16 of 18
One problem of the PARS score is that it is global andnot local (like the predicted local folding energy mea-sure reported in this study) - a nucleotide has a higherPARS score even if it is connected to another nucleotideinside or outside the 40-nucleotide window. Thus, weused the inferred folding of complete mRNA sequencesof yeast based on the PARS scores that are reported inthe study of Kertesz et al. [28]. We computed for eachsliding window in each gene how many pairs of nucleo-tides where both nucleotides are within the window areconnected. We plotted the mean genomic graph ofthese values (as we did with the predicted foldingenergy). The new graphs indeed look similar to thegraph obtained based on predictions of mRNA folding(Figure S2 in Additional file 2).
Genomic profiles of pairs of identical slow codonsTo study the distribution of pairs of identical slowcodons along the coding sequences, we divided thecodons into slow (the lowest 10% in terms of the tAI)and fast ones (the remaining codons). We computed theprofile of the mean number of pairs of identical slowcodons in each position in E. coli and S. cerevisiae. Wecompared this profile to those obtained under two ran-domization regimes: 1) when controlling for amino acidcontent and codon bias as mentioned above; and 2)when permutating only the slow codons in each gene(that is, a control that considers the fact that there arepositions, such as the ramp, with more slow codons).We also computed this profile separately for highly andlowly expressed genes in these organisms.
Additional material
Additional file 1: Supplementary Notes S1 to S5: [55-61]
Additional file 2: Supplementary Figures S1 to S7 and S9 to S46.
Additional file 3: Supplementary Table S1 - properties of ramps forGO groups.
Additional file 4: Supplementary Figure S8.
AbbreviationsGO: Gene Ontology; KS: Kolmogorov-Smirnov; ORF: open reading frame;PARS: parallel analysis of RNA structure; tAI: tRNA adaptation index; UTR:untranslated region.
AcknowledgementsWe would like to thank Ms Hadas Zur, Dr Yoav Arava, Prof. Elchanan Mossel,and Prof. Yitzhak Pilpel for very helpful discussions. In addition, we wouldlike to thank the anonymous referees for their thoughtful comments. TT waspartially supported by a Koshland fellowship at the Weizmann Institute ofScience and his travel was supported by EU grant PIRG04-GA-2008-239317.The work of IVL and MZU was partially supported by ISF grant 478/10. Workby MK was supported by grants from the Israeli Ministry of Science andTechnology.
Author details1Department of Biomedical Engineering, Faculty of Engineering, Tel AvivUniversity, Ramat Aviv 69978, Israel. 2Department of Computer Science, BenGurion University of the Negev, Beer-Sheva 84105, Israel. 3Blavatnik School ofComputer Science, Tel Aviv University, Ramat Aviv 69978, Israel. 4Departmentof Molecular Microbiology and Biotechnology Tel Aviv University, Ramat Aviv69978, Israel. 5School of Medicine, Tel Aviv University, Ramat Aviv 69978,Israel.
Authors’ contributionsTT designed the experiments, conducted the data analysis and wrote themanuscript. IV conducted the data analysis and helped to write themanuscript. NG conducted the data analysis. MK helped to write themanuscript. ER helped to write the manuscript. MZ helped to write themanuscript. ER and MZ contributed equally to this work. All authors haveread and approved the manuscript for publication.
Received: 14 March 2011 Revised: 10 September 2011Accepted: 3 November 2011 Published: 3 November 2011
References1. Kapp LD, Lorsch JR: The molecular mechanics of eukaryotic translation.
Annu Rev Biochem 2004, 73:657-704.2. Kimchi-Sarfaty C, Oh JM, Kim I-W, Sauna ZE, Calcagno AM, Ambudkar SV,
Gottesman MM: A “silent” polymorphism in the MDR1 gene changessubstrate specificity. Science 2007, 315:525-528.
3. Bahir I, Fromer M, Prat Y, Linial M: Viral adaptation to host: a proteome-based analysis of codon usage and amino acid preferences. Mol Syst Biol2009, 5:1-14.
4. Drummond DA, Wilke CO: Mistranslation-induced protein misfolding as adominant constraint on coding-sequence evolution. Cell 2008,134:341-352.
5. Tuller T, Kupiec M, Ruppin E: Determinants of protein abundance andtranslation efficiency in S. cerevisiae. PLoS Comput Biol 2007, 3:2510-2519.
6. Gustafsson C, Govindarajan S, Minshull J: Codon bias and heterologousprotein expression. Trends Biotechnol 2004, 22:346-353.
7. Kudla G, Murray AW, Tollervey D, Plotkin JB: Coding-sequencedeterminants of gene expression in Escherichia coli. Science 2009,324:255-258.
8. Tuller T, Carmi A, Vestsigian K, Navon S, Dorfan Y, Zaborske J, Pan T,Dahan O, Furman I, Pilpel Y: An evolutionarily conserved mechanism forcontrolling the efficiency of protein translation. Cell 2010, 141:344-354.
9. Wenzel SC, Muller R: Recent developments towards the heterologousexpression of complex bacterial natural product biosynthetic pathways.Curr Opin Biotechnol 2005, 16:594-606.
10. Scholten KB, Kramer D, Kueter EW, Graf M, Schoedl T, Meijer CJ,Schreurs MW, Hooijberg E: Codon modification of T cell receptors allowsenhanced functional expression in transgenic human T cells. ClinImmunol 2006, 119:135-145.
11. Warnecke T, Hurst LD: GroEL dependency affects codon usage–supportfor a critical role of misfolding in gene evolution. Mol Syst Biol 2010,6:340.
12. Zhang F, Saha S, Shabalina SA, Kashina A: Differential arginylation of actinisoforms is regulated by coding sequence-dependent degradation.Science 2010, 329:1534-1537.
13. Arava Y, Wang Y, Storey JD, Liu CL, Brown PO, Herschlag D: Genome-wideanalysis of mRNA translation profiles in Saccharomyces cerevisiae. ProcNatl Acad Sci USA 2003, 100:3889-3894.
14. Tuller T, Waldman YY, Kupiec M, Ruppin E: Translation efficiency isdetermined by both codon bias and folding energy. Proc Natl Acad SciUSA 2010, 107:3645-3650.
15. Ingolia NT, Ghaemmaghami S, Newman JR, Weissman JS: Genome-wideanalysis in vivo of translation with nucleotide resolution using ribosomeprofiling. Science 2009, 324:218-223.
16. Cannarozzi G, Schraudolph NN, Faty M, von Rohr P, Friberg MT, Roth AC,Gonnet P, Gonnet G, Barral Y: A role for codon order in translationdynamics. Cell 141:355-367.
17. Fredrick K, Ibba M: How the sequence of a gene can tune its translation.Cell 2010, 141:227-229.
Tuller et al. Genome Biology 2011, 12:R110http://genomebiology.com/2011/12/11/R110
Page 17 of 18
18. Lu P, Vogel C, Wang R, Yao X, Marcotte EM: Absolute protein expressionprofiling estimates the relative contributions of transcriptional andtranslational regulation. Nat Biotechnol 2007, 25:117-124.
19. Vogel C, Abreu Rde S, Ko D, Le SY, Shapiro BA, Burns SC, Sandhu D,Boutz DR, Marcotte EM, Penalva LO: Sequence signatures and mRNAconcentration can explain two-thirds of protein abundance variation ina human cell line. Mol Syst Biol 2010, 6:400.
20. Zhang Z, Zhou L, Hu L, Zhu Y, Xu H, Liu Y, Chen X, Yi X, Kong X, Hurst LD:Nonsense-mediated decay targets have multiple sequence-relatedfeatures that can inhibit translation. Mol Syst Biol 2010, 6:442.
21. Gu W, Zhou T, Wilke CO: A universal trend of reduced mRNA stabilitynear the translation-initiation site in prokaryotes and eukaryotes. PLoSComput Biol 2010, 6:e1000664.
22. Wen JD, Lancaster L, Hodges C, Zeri AC, Yoshimura SH, Noller HF,Bustamante C, Tinoco I: Following translation by single ribosomes onecodon at a time. Nature 2008, 452:598-603.
23. Voss NR, Gerstein M, Steitz TA, Moore PB: The geometry of the ribosomalpolypeptide exit tunnel. J Mol Biol 2006, 360:893-906.
24. Lu J, Deutsch C: Electrostatics in the ribosomal tunnel modulate chainelongation rates. J Mol Biol 2008, 384:73-86.
25. dos Reis M, Savva R, Wernisch L: Solving the riddle of codon usagepreferences: a test for translational selection. Nucleic Acids Res 2004,32:5036-5044.
26. Trylska J, Konecny R, Tama F, Brooks CL, McCammon JA: Ribosomemotions modulate electrostatic properties. Biopolymers 2004, 74:423-431.
27. Supek F, Smuc T: On relevance of codon usage to expression ofsynthetic and natural genes in Escherichia coli. Genetics 2010,185:1129-1134.
28. Kertesz M, Wan Y, Mazor E, Rinn JL, Nutter RC, Chang HY, Segal E: Genome-wide measurement of RNA secondary structure in yeast. Nature 2010,467:103-107.
29. Supek F, Muc T: On relevance of codon usage to expression of syntheticand natural genes in Escherichia coli. Genetics 2010, 185:1129-1134.
30. Alberts B, Johnson A, Lewis J, Raff M, Roberts K, Walter P: Molecular Biologyof the Cell New York: Garland Publishing; 2002.
31. Zenklusen D, Larson DR, Singer RH: Single-RNA counting revealsalternative modes of gene expression in yeast. Nat Struct Mol Biol 2008,15:1263-1271.
32. Ingraham JL, Neidhardt FC: Escherichia coli and Salmonella. In Cellular andMolecular Biology. Volume 1. ASM Press; 1996.
33. Wuchty S, Fontana W, Hofacker IL, Schuster P: Complete suboptimalfolding of RNA and the stability of secondary structures. Biopolymers1999, 49:145-165.
34. Zhang S, Goldman E, Zubay G: Clustering of low usage codons andribosome movement. J Theor Biol 1994, 170:339-354.
35. Freeland SJ, Hurst LD: The genetic code is one in a million. J Mol Evol1998, 47:238-248.
36. Reuveni S, Meilijson I, Kupiec M, Ruppin E, Tuller T: Genome-scale analysisof translation elongation with a ribosome flow model. PLoS Comput Biol2011, 7:e1002127.
37. Kozak M: Point mutations define a sequence flanking the AUG initiatorcodon that modulates translation by eukaryotic ribosomes. Cell 1986,44:283-292.
38. Welch M, Govindarajan S, Ness JE, Villalobos A, Gurney A, Minshull J,Gustafsson C: Design parameters to control synthetic gene expression inEscherichia coli. PLoS One 2009, 4:1-10.
39. Drummond DA, Wilke CO: The evolutionary consequences of erroneousprotein synthesis. Nat Rev Genet 2009, 10:715-724.
40. Man O, Pilpel Y: Differential translation efficiency of orthologous genes isinvolved in phenotypic divergence of yeast species. Nat Genet 2007,39:415-421.
41. Chan PP, Lowe TM: GtRNAdb: a database of transfer RNA genes detectedin genomic sequence. Nucleic Acids Res 2009, 37:D93-97.
42. Newman JR, Ghaemmaghami S, Ihmels J, Breslow DK, Noble M, DeRisi JL,Weissman JS: Single-cell proteomic analysis of S. cerevisiae reveals thearchitecture of biological noise. Nature 2006, 441:840-846.
43. Hirschman JE, Balakrishnan R, Christie KR, Costanzo MC, Dwight SS,Engel SR, Fisk DG, Hong EL, Livstone MS, Nash R, Park J, Oughtred R,Skrzypek M, Starr B, Theesfeld CL, Williams J, Andrada R, Binkley G, Dong Q,Lane C, Miyasato S, Sethuraman A, Schroeder M, Thanawala MK, Weng S,Dolinski K, Botstein D, Cherry JM: Genome Snapshot: a new resource at
the Saccharomyces Genome Database (SGD) presenting an overview ofthe Saccharomyces cerevisiae genome. Nucleic Acids Res 2006, 34:D442-445.
44. Barrett T, Troup DB, Wilhite SE, Ledoux P, Rudnev D, Evangelista C, Kim IF,Soboleva A, Tomashevsky M, Edgar R: NCBI GEO: mining tens of millionsof expression profiles–database and tools update. Nucleic Acids Res 2007,35:D760-765.
45. Data generated in this study. [http://www.cs.bgu.ac.il/~vaksler/freespace/Files/Files.htm].
46. Hofacker IL: Vienna RNA secondary structure server. Nucleic Acids Res2003, 31:3429-3431.
47. Waldman YY, Tuller T, Shlomi T, Sharan R, Ruppin E: Translation efficiencyin humans: tissue specificity, global optimization and differencesbetween developmental stages. Nucleic Acids Res 2010, 38:2964-2974.
48. Dorota K, Kurowicka D, Joe H: Dependence Modeling: Vine Copula HandbookWorld Scientific Publishing; 2010.
49. Cebe R, Geiser M: Rapid and easy thermodynamic optimization of the 5’-end of mRNA dramatically increases the level of wild type proteinexpression in Escherichia coli. Protein Expr Purif 2006, 45:374-380.
50. Qing G, Xia B, Inouye M: Enhancement of translation initiation by A/T-richsequences downstream of the initiation codon in Escherichia coli. J MolMicrobiol Biotechnol 2003, 6:133-144.
51. Kaczanowska M, Ryden-Aulin M: Ribosome biogenesis and the translationprocess in Escherichia coli. Microbiol Mol Biol Rev 2007, 71:477-494.
52. Grantham R: Amino acid difference formula to help explain proteinevolution. Science 1974, 185:862-864.
53. Dayhoff M, Schwartz R, Orcutt B: A model of evolutionary change inproteins. Matrices for detecting distant relationships. In Atlas of ProteinSequence and Structure. Edited by: Dayhoff M. Washington: NationalBiomedical Research Foundation; 1978:345-358.
54. Henikoff S, Henikoff JG: Amino acid substitution matrices from proteinblocks. Proc Natl Acad Sci USA 1992, 89:10915-10919.
55. Percudani R, Pavesi A, Ottonello S: Transfer RNA gene redundancy andtranslational selection in Saccharomyces cerevisiae. J Mol Biol 1997,268:322-330.
56. Kanaya S, Yamada Y, Kudo Y, Ikemura T: Studies of codon usage and tRNAgenes of 18 unicellular organisms and quantification of Bacillus subtilistRNAs: gene expression level and species-specific diversity of codonusage based on multivariate analysis. Gene 1999, 238:143-155.
57. Ikemura T: Correlation between the abundance of Escherichia colitransfer RNAs and the occurrence of the respective codons in its proteingenes: a proposal for a synonymous codon choice that is optimal forthe E. coli translational system. J Mol Biol 1981, 151:389-409.
58. Dong H, Nilsson L, Kurland CG: Co-variation of tRNA abundance andcodon usage in Escherichia coli at different growth rates. J Mol Biol 1996,260:649-663.
59. Sorensen MA, Pedersen S: Absolute in vivo translation rates of individualcodons in Escherichia coli. The two glutamic acid codons GAA and GAGare translated with a threefold difference in rate. J Mol Biol 1991,222:265-280.
60. Segal E, Fondufe-Mittendorf Y, Chen L, Thastrom A, Field Y, Moore IK,Wang JP, Widom J: A genomic code for nucleosome positioning. Nature2006, 442:772-778.
61. Gurvich OL, Baranov PV, Gesteland RF, Atkins JF: Expression levelsinfluence ribosomal frameshifting at the tandem rare arginine codonsAGG_AGG and AGA_AGA in Escherichia coli. J Bacteriol 2005,187:4023-4032.
doi:10.1186/gb-2011-12-11-r110Cite this article as: Tuller et al.: Composite effects of gene determinantson the translation speed and density of ribosomes. Genome Biology 201112:R110.
Tuller et al. Genome Biology 2011, 12:R110http://genomebiology.com/2011/12/11/R110
Page 18 of 18
Related Documents