PNNL-22152 Prepared for the U.S. Army Corps of Engineers, Portland District, under an Interagency Agreement with the U.S. Department of Energy Contract DE-AC05-76RL01830 Compliance Monitoring of Yearling and Subyearling Chinook Salmon and Juvenile Steelhead Survival and Passage at John Day Dam, 2012 FINAL COMPLIANCE REPORT JR Skalski JS Hughes RL Townsend GR Ploskey AG Seaburg Z Deng MA Weiland TJ Carlson CM Woodley May 2013

Welcome message from author
This document is posted to help you gain knowledge. Please leave a comment to let me know what you think about it! Share it to your friends and learn new things together.
Transcript

PNNL-22152
Prepared for the U.S. Army Corps of Engineers, Portland District, under an Interagency Agreement with the U.S. Department of Energy Contract DE-AC05-76RL01830
Compliance Monitoring of Yearling and Subyearling Chinook Salmon and Juvenile Steelhead Survival and Passage at John Day Dam, 2012
FINAL COMPLIANCE REPORT JR Skalski JS Hughes RL Townsend GR Ploskey AG Seaburg Z Deng MA Weiland TJ Carlson CM Woodley May 2013


PNNL-22152
Compliance Monitoring of Yearling and Subyearling Chinook Salmon and Juvenile Steelhead Survival and Passage at John Day Dam, 2012 FINAL COMPLIANCE REPORT JR Skalski1 JS Hughes RL Townsend1 GR Ploskey AG Seaburg1 Z Deng MA Weiland TJ Carlson CM Woodley May 2013 Prepared for U.S. Army Corps of Engineers, Portland District under an Interagency Agreement with the U.S. Department of Energy Contract DE-AC05-76RL01830 Pacific Northwest National Laboratory Richland, Washington 99352
1 University of Washington, Seattle, Washington.

iii
Preface
This study was conducted by the Pacific Northwest National Laboratory (PNNL) and the University of Washington (UW) for the U.S. Army Corps of Engineers, Portland District (USACE). The PNNL and UW project managers were Drs. Thomas J. Carlson and John R. Skalski, respectively. The USACE technical lead was Mr. Brad Eppard. The study was designed to estimate dam passage survival at John Day Dam as stipulated by the 2008 Federal Columbia River Power System (FCRPS) Biological Opinion (BiOp) and provide additional performance measures as specified in the Columbia Basin Fish Accords.
This report summarizes the results of the compliance studies of yearling and subyearling Chinook salmon and steelhead at John Day Dam in 2012.
Suggested citation for this report:
Skalski JR, RL Townsend, AG Seaburg, MA Weiland, CM Woodley, JS Hughes, GR Ploskey, Z Deng, and TJ Carlson. 2012. Compliance Monitoring of Yearling and Subyearling Chinook Salmon and Juvenile Steelhead Survival and Passage at John Day Dam, 2012. PNNL-22152, Pacific Northwest National Laboratory, Richland, Washington.

v
Executive Summary
The purpose of this compliance study was to estimate dam passage survival of yearling and subyearling Chinook salmon and juvenile steelhead at John Day Dam during the spring and summer outmigrations in 2012. Under the 2008 Federal Columbia River Power System (FCRPS) Biological Opinion (BiOp), dam passage survival should be greater than or equal to 0.96 for spring migrants and greater than or equal to 0.93 for summer migrants, estimated with a standard error (SE) less than or equal to 0.015. The study also estimated survival from the forebay 2 km upstream of the dam to the tailrace 3 km downstream of the dam,1 as well as the forebay residence time, tailrace egress time, spill passage efficiency (SPE), and fish passage efficiency (FPE), as required in the Columbia Basin Fish Accords (Fish Accords).
A virtual/paired-release design was used to estimate dam passage survival at John Day Dam. The approach included yearling and subyearling Chinook salmon and juvenile steelhead, tagged with acoustic micro-transmitters, released above John Day Dam that contributed to the formation of a virtual release at the face of John Day Dam. A survival estimate from this release was adjusted by a paired release below John Day Dam. A total of 3376 yearling Chinook salmon, 5726 subyearling Chinook salmon, and 3239 juvenile steelhead were used in the virtual releases. Sample sizes for the below-dam paired releases (R2 and R3, respectively) were 997 and 995 for yearling Chinook salmon, 986 and 983 for subyearling Chinook salmon, and 1000 and 1000 for juvenile steelhead. The Juvenile Salmon Acoustic Telemetry System (JSATS) tags were manufactured by Advanced Telemetry Systems. Model SS300 tags, weighing 0.304 g in air, were surgically implanted in yearling and subyearling Chinook salmon, and Model SS130 tags, weighing 0.438 g in air, were surgically implanted in juvenile steelhead for this investigation.
The intent of the spring study was to estimate dam passage survival during both 30% and 40% spill conditions. The two spill conditions were to be systematically performed in alternating 2-d test intervals over the course of the spring outmigration. High flow conditions in 2012 interrupted the spill study. Dam passage survival was therefore estimated season-wide regardless of spill conditions.
The study results are summarized in the following tables.
Table ES.1. Estimates of dam passage survival(a) at John Day Dam in 2012.
Spill Operations Yearling Chinook
Salmon Steelhead Subyearling Chinook
Salmon
Season-wide spring 0.9673 (0.0065) 0.9744 (0.0028)(b) NA
Season-wide summer NA NA 0.9414 (0.0031)(b)
(a) Dam passage survival is defined as survival from the upstream face of the dam to a standardized reference point in the tailrace.
(b) Based on V1 single release only.
1 The forebay-to-tailrace survival estimate satisfies the “BRZ-to-BRZ” (boat-restricted zone) survival estimate called for in the Fish Accords.

vi
Table ES.2. Fish Accords performance measures at John Day Dam in 2012. Standard errors are in parentheses.
Performance Measures Yearling Chinook
Salmon Steelhead Subyearling
Chinook Salmon
Forebay-to-tailrace survival (season-wide) 0.9660 (0.0065) 0.9687 (0.0030)(a) 0.9390 (0.0032)(a)
Forebay residence time (mean/median) 2.50 (0.14)/1.15 5.79 (0.33)/2.39 2.91 (0.26)/1.02
Tailrace egress rate (mean/median) 2.80 (0.28)/0.50 6.22 (0.48)/0.46 2.95 (0.16)/0.48
Spill passage efficiency(b) 0.7456 (0.0075) 0.7452 (0.0076) 0.6962 (0.0061)
Fish passage efficiency 0.9272 (0.0045) 0.9695 (0.0030) 0.8585 (0.0046)
(a) Based on V1 single release only. (b) The estimate of SPE includes temporary spill weir (TSW) and non-TSW spill bays.
vii
Table ES.3. Survival study summary.
Year: 2012 Study Site(s): John Day Dam Objective(s) of study: Estimate dam passage survival and other performance measures for yearling Chinook salmon, steelhead, and subyearling Chinook salmon. Hypothesis (if applicable): Not applicable; this is a compliance study. Fish: Implant Procedure: Species-race: yearling Chinook salmon (CH1), steelhead
(STH), subyearling Chinook salmon (CH0) Surgical: Yes Injected: No
Source: John Day Dam Smolt Monitoring Facility Size (median): CH1 STH CH0 Sample Size(a): CH1 STH CH0 Weight (g): 26.4 72.6 13.9 # release sites: 5 5 5 Length (mm): 144 208 113 Total # released: 5368 5239 7695 Tag Type: Advanced Telemetry Systems (ATS)
Analytical Model: Characteristics of Estimate:
Model Weight (air) CH1/CH0: SS300 0.304 g STH: SS130 0.438 g
Virtual/paired-release model
Effects Reflected (direct, total, etc.): Direct Absolute or Relative: Absolute
Environmental/Operating Conditions (daily from 30 April 2012 through 2 June 2012): Statistic Mean Min Max
River Discharge (kcfs): 347.9 275.7 410.9 Spill Discharge (kcfs): 129.9 83.9 176.8 Percent Spill (24 h/d): 37.1 29.9 43.7 Temperature (°C): 12.3 10.6 13.8 Total Dissolved Gas % (tailrace): 118..8 115.2 122.4 Treatment(s): None, because high discharge prevented operators from achieving 30% and 40% spill levels. Unique Study Characteristics: None
Environmental/Operating Conditions (daily from 17 June 2012 through 19 July 2012): Statistic Mean Min Max
River Discharge (kcfs): 354.9 295.3 432.2 Spill Discharge (kcfs): 134.5 89.7 181.9 Percent Spill (24 h/d): 37.8 29.9 45.5 Temperature (°C): 16.6 14.9 18.6 Total Dissolved Gas % (tailrace): 119.2 116.4 123.4 Treatment(s): None, because high discharge prevented operators from achieving 30% and 40% spill levels. Unique Study Characteristics: None
Survival and Passage Estimates (value & SE): CH1 STH CH0 Dam survival
• Season-wide spring 0.9673 (0.0065) 0.9744 (0.0028)(b) NA
• Season-wide summer NA NA 0.9414 (0.0031)(b) Forebay-to-tailrace survival (season-wide) 0.9660 (0.0065) 0.9687 (0.0030)2 0.9390 (0.0032)(b) Forebay residence time (mean/median) 2.50 (0.14)/1.15 5.79 (0.33)/2.39 2.91 (0.26)/1.02 Tailrace egress rate (mean/median) 2.80 (0.28)/0.50 6.22 (0.48)/0.46 2.95 (0.16)/0.48 Spill passage efficiency 0.7456 (0.0075) 0.7452 (0.0076) 0.6962 (0.0061) Fish passage efficiency 0.9272 (0.0045) 0.9695 (0.0030) 0.8585 (0.0046) Compliance Results: Estimates of dam passage survival met compliance requirements for CH1, STH, and CH0 for both point estimates and standard errors. (a) Release sites include all release locations that contributed fish to the virtual-release group. Release numbers include
only the fish used in the estimation of dam passage survival. (b) Based on V1 single release only.
ix
Acknowledgments
This study was the result of hard work by dedicated scientists from Cascade Aquatics, Pacific Northwest National Laboratory (PNNL), Pacific States Marine Fisheries Commission (PSMFC), the U.S. Army Corps of Engineers, Portland District (USACE), and the University of Washington (UW). Their teamwork and attention to detail, schedule, and budget were essential for the study to succeed in providing high-quality, timely results to decision-makers.
• Cascade Aquatics: B James, P James, E Anderson, C Green, E Green, J Herdman, K Martin, and H Watson
• PNNL: T Abel, C Brandt, A Bryson, E Choi, D Deng, G Dirkes, J Duncan, E Fischer, A Flory, T Fu, D Geist, M Greiner, K Hall, K Ham, R Herrington, J Horner, M Ingraham, G Johnson, R Karls, R Kaufman, F Khan, J Kim, B Lamarche, K Lavender, X Li, J Martinez, A Miracle, A Phillips, N Phillips, B Rayamajhi, G Roesijadi, D Saunders, S Southard, G Squeochs, A Thronas, N Trimble, J Varvinec, C Vernon, K Wagner, Y Yuan, and S Zimmerman
• PSMFC: R Martinson, G Kolvachuk, and D Ballenger, along with the helpful staff at John Day and Bonneville Dam Juvenile Smolt Facilities. Also we would like to thank PTAGIS and N Tancreto for her help with BON Sort-By-Code. In addition, A Ajmani, M Bahnick, A Barnes, G Batten, C Beyer, R Blanchard, S Carpenter, A Collins, A Cook, J Cox, A Cushing, L Cushing, R Davis, T Elder, D Etherington, G George, D Grugett, B Harkleroad, M Hennen, T Levandowsky, S Marvin, T Mitchell, M Neumann, G Ottoway, K Paine, K Prather, J Robertson, T Royal, G Schilperoort, G Seybert, D Spiteri, P Tramel, D Trott, R Wall, and L Wood
• USACE: B Eppard, D Schwartz, M Langeslay, and electricians, mechanics, riggers, operators, and biologists at John Day (M Zyndol, T Hurd), The Dalles (P Keller, B Cordie), and Bonneville (J Rerecich, B Hausmann, A Traylor, I Royer) dams
• UW: J Lady and P Westhagen.

xi
Acronyms and Abbreviations
°C degree(s) Celsius
3D three dimensional
ATS Advanced Telemetry Systems
BiOp biological opinion
BRZ boat-restricted zone
CH0 subyearling Chinook salmon
CH1 yearling Chinook salmon
FCRPS Federal Columbia River Power System
FPE fish passage efficiency
g gram(s)
h hours(s)
JBS juvenile bypass system
JSATS Juvenile Salmon Acoustic Telemetry System
kcfs thousand cubic feet per second
km kilometer(s)
L liter(s)
m meter(s)
mg milligram(s)
mm millimeter(s)
PIT passive integrated transponder
PNNL Pacific Northwest National Laboratory
PRI pulse repetition interval
PSMFC Pacific States Marine Fisheries Commission
rkm river kilometer(s)
RME research, monitoring, and evaluation
ROR run-of-river
RPA reasonable and prudent alternative
s second(s)
SE standard error
SPE spill passage efficiency
STH steelhead
USACE U.S. Army Corps of Engineers
UW University of Washington

xiii
Contents
Preface .................................................................................................................................................. iii
Executive Summary .............................................................................................................................. v
Acknowledgments ................................................................................................................................. ix
Acronyms and Abbreviations ............................................................................................................... xi
1.0 Introduction .................................................................................................................................. 1.1
1.1 Background .......................................................................................................................... 1.1
1.2 Study Objectives .................................................................................................................. 1.2
1.3 Report Contents and Organization ....................................................................................... 1.2
2.0 Methods ........................................................................................................................................ 2.1
2.1 Release-Recapture Design .................................................................................................... 2.1
2.2 Handling, Tagging, and Release Procedures ........................................................................ 2.3
2.2.1 Acoustic Tags ............................................................................................................ 2.3
2.2.2 Fish Source ................................................................................................................ 2.3
2.2.3 Tagging Procedure .................................................................................................... 2.4
2.2.4 Release Procedures .................................................................................................... 2.4
2.3 Acoustic Signal Processing .................................................................................................. 2.5
2.4 Statistical Methods ............................................................................................................... 2.6
2.4.1 Estimation of Dam Passage Survival ........................................................................ 2.6
2.4.2 Tag-Life Analysis ...................................................................................................... 2.7
2.4.3 Tests of Assumptions ................................................................................................ 2.8
2.4.4 Forebay-to-Tailrace Survival .................................................................................... 2.10
2.4.5 Estimation of Travel Times ....................................................................................... 2.10
2.4.6 Estimation of Spill Passage Efficiency ..................................................................... 2.10
2.4.7 Estimation of Fish Passage Efficiency ...................................................................... 2.11
3.0 Results .......................................................................................................................................... 3.1
3.1 Fish Collection, Rejection, and Tagging .............................................................................. 3.1
3.2 Discharge and Spill Conditions ............................................................................................ 3.2
3.3 Run Timing .......................................................................................................................... 3.3
3.4 Assessment of Assumptions ................................................................................................. 3.4
3.4.1 Examination of Tagger Effects.................................................................................. 3.4
3.4.2 Examination of Tag-Lot Effects ................................................................................ 3.4
3.4.3 Handling Mortality and Tag Shedding ...................................................................... 3.4
3.4.4 Effects of Tailrace and Tailwater Release Locations on Survival............................. 3.4
3.4.5 Examination of Time In-River on Survivals of Different Release Groups ............... 3.8
3.4.6 Fish Size Distributions .............................................................................................. 3.8
3.4.7 Tag-Life Corrections ................................................................................................. 3.8
xiv
3.4.8 Arrival Distributions ................................................................................................. 3.8
3.4.9 Downstream Mixing .................................................................................................. 3.15
3.5 Survival and Passage Performance....................................................................................... 3.17
3.5.1 Dam Passage Survival ............................................................................................... 3.17
3.5.2 Forebay-to-Tailrace Passage Survival ....................................................................... 3.20
3.5.3 Forebay Residence Time ........................................................................................... 3.21
3.5.4 Tailrace Egress Time ................................................................................................. 3.21
3.5.5 Spill Passage Efficiency ............................................................................................ 3.21
3.5.6 Fish Passage Efficiency ............................................................................................. 3.21
4.0 Discussion ..................................................................................................................................... 4.1
4.1 Study Conduct ...................................................................................................................... 4.1
4.2 Study Performance ............................................................................................................... 4.1
4.3 Summary of Compliance Study Results ............................................................................... 4.1
5.0 References .................................................................................................................................... 5.1
Appendix A – Tests of Assumptions .................................................................................................... A.1
Appendix B – Capture Histories Used in Estimating Dam Passage Survival ....................................... B.1

xv
Figures
2.1 Schematic of the virtual/paired-release design used to estimate dam passage survival at John Day Dam ............................................................................................................................ 2.2
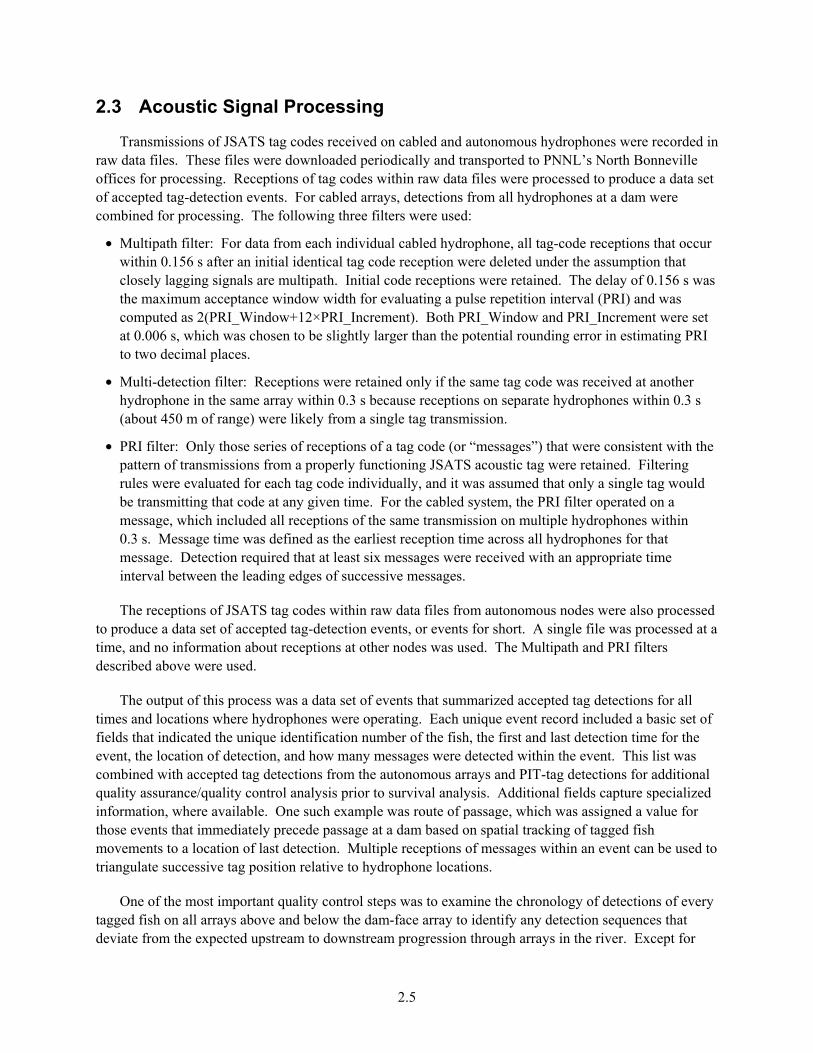
2.2 Front view schematic of hydrophone deployments at three turbines showing the double-detection arrays ........................................................................................................................... 2.3
3.1 Daily average total discharge and percent spill at John Day Dam during the spring yearling Chinook salmon and steelhead study, 30 April to 2 June 2012, and the summer subyearling Chinook salmon study, 17 June to 19 July 2012 ....................................... 3.2
3.2 Plots of the cumulative percentage of yearling Chinook salmon and steelhead that had passed John Day Dam during the spring study and subyearling Chinook salmon during the summer study of 2012 .......................................................................................................... 3.3
3.3 Single-release estimates of survival probabilities for yearling Chinook salmon released across the Columbia River at four or five locations from the Washington to the Oregon side of the channel ...................................................................................................................... 3.5
3.4 Single-release estimates of survival probabilities for juvenile steelhead released across the Columbia River at four or five locations from the Washington to the Oregon side of the channel ............................................................................................................................. 3.6
3.5 Single-release estimates of survival probabilities for subyearling Chinook salmon released across the Columbia River at four or five locations from the Washington to the Oregon side of the channel ............................................................................................... 3.7
3.6 Relative frequency distributions for fish lengths of yearling Chinook salmon used in release V1, release R2, release R3, and ROR fish sampled at John Day Dam by the Fish Passage Center in 2012 ............................................................................................................... 3.9
3.7 Relative frequency distributions for fish lengths of juvenile steelhead used in release V1, release R2, release R3, and ROR fish sampled at John Day Dam by the Fish Passage Center in 2012 ............................................................................................................................ 3.10
3.8 Relative frequency distributions for fish lengths of subyearling Chinook salmon used in release V1, release R2, release R3, and ROR fish sampled at John Day Dam by the Fish Passage Center in 2012 during the period of the study .............................................................. 3.11
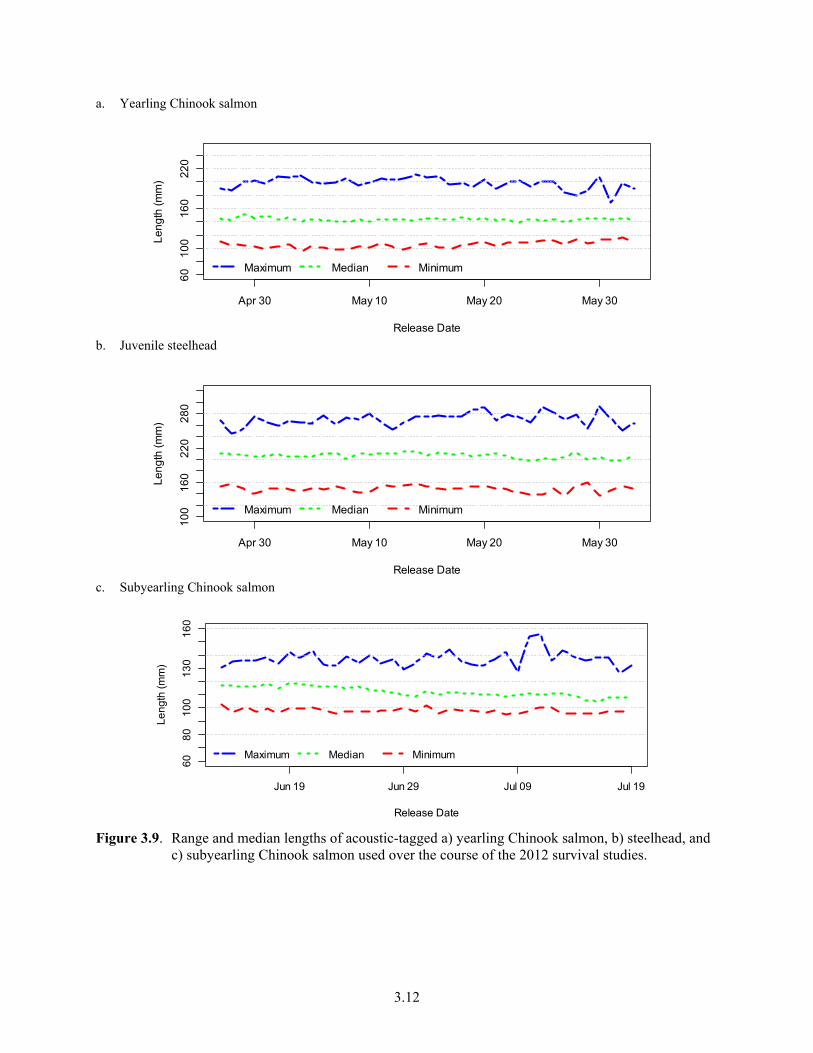
3.9 Range and median lengths of acoustic-tagged yearling Chinook salmon, steelhead, and subyearling Chinook salmon used over the course of the 2012 survival studies ....................... 3.12
3.10 Observed time of tag failure and fitted survivorship curves using the vitality model of Li and Anderson (2009) for yearling Chinook salmon and subyearling Chinook salmon tag lots and a three-parameter Weibull model for steelhead .......................................... 3.13
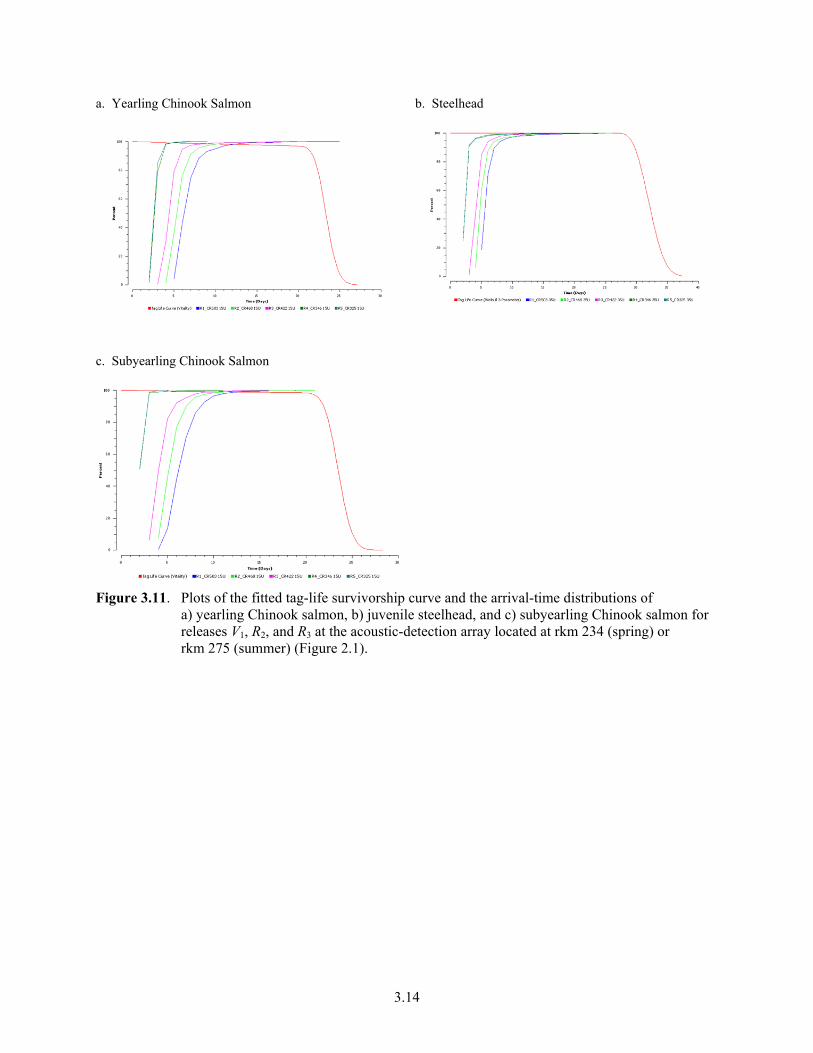
3.11 Plots of the fitted tag-life survivorship curve and the arrival-time distributions of yearling Chinook salmon, juvenile steelhead, and subyearling Chinook salmon for releases V1, R2, and R3 at the acoustic-detection array located at rkm 234 or rkm 275 .............. 3.14
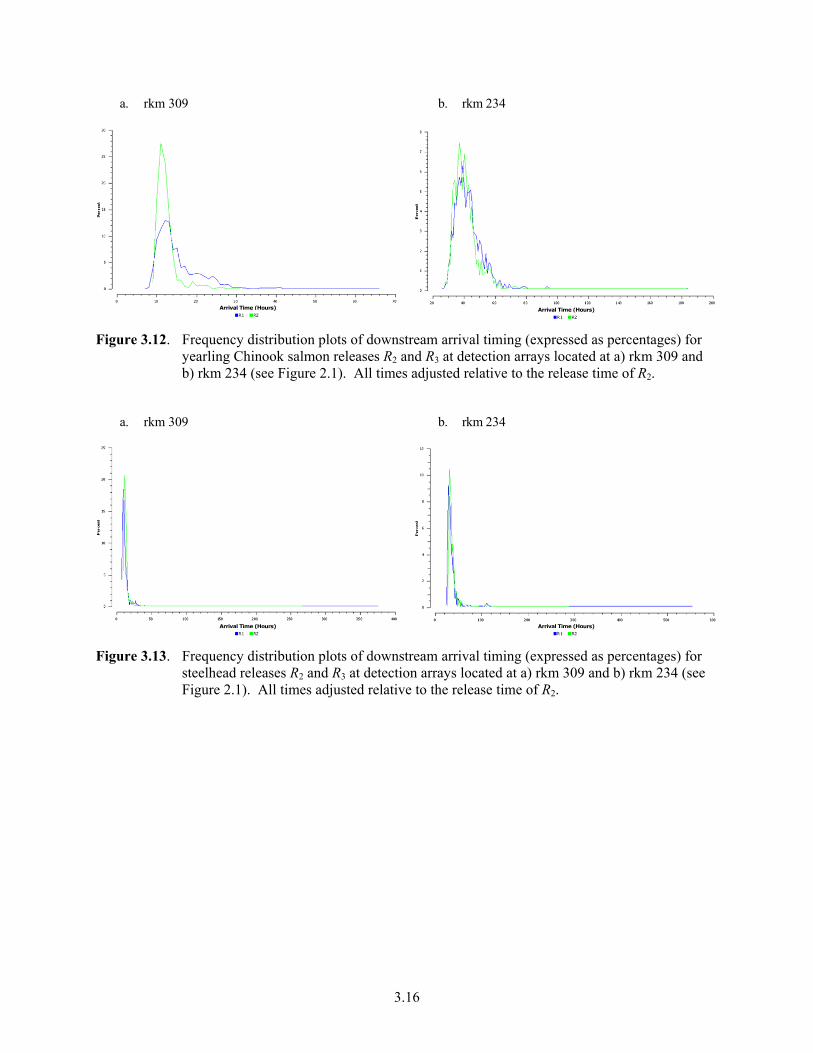
3.12 Frequency distribution plots of downstream arrival timing for yearling Chinook salmon releases R2 and R3 at detection arrays located at rkm 309 and rkm 234 ..................................... 3.16
3.13 Frequency distribution plots of downstream arrival timing for steelhead releases R2 and R3 at detection arrays located at rkm 309 and rkm 234 .............................................................. 3.16
3.14 Frequency distribution plots of downstream arrival timing for subyearling Chinook salmon releases R2 and R3 at detection arrays located at rkm 309 and rkm 275 ......................... 3.17

xvi
3.15 Distribution of forebay residence times for yearling Chinook salmon, steelhead, and subyearling Chinook salmon at John Day Dam, 2012 ............................................................... 3.22
3.16 Distribution of tailrace egress times for yearling Chinook salmon, steelhead, and subyearling Chinook salmon at John Day Dam, 2012 ............................................................... 3.24
Tables
ES.1 Estimates of dam passage survival at John Day Dam in 2011 ................................................... v
ES.2 Fish Accords performance measures at John Day Dam in 2011 ................................................ vi
ES.3 Survival study summary ............................................................................................................. vii
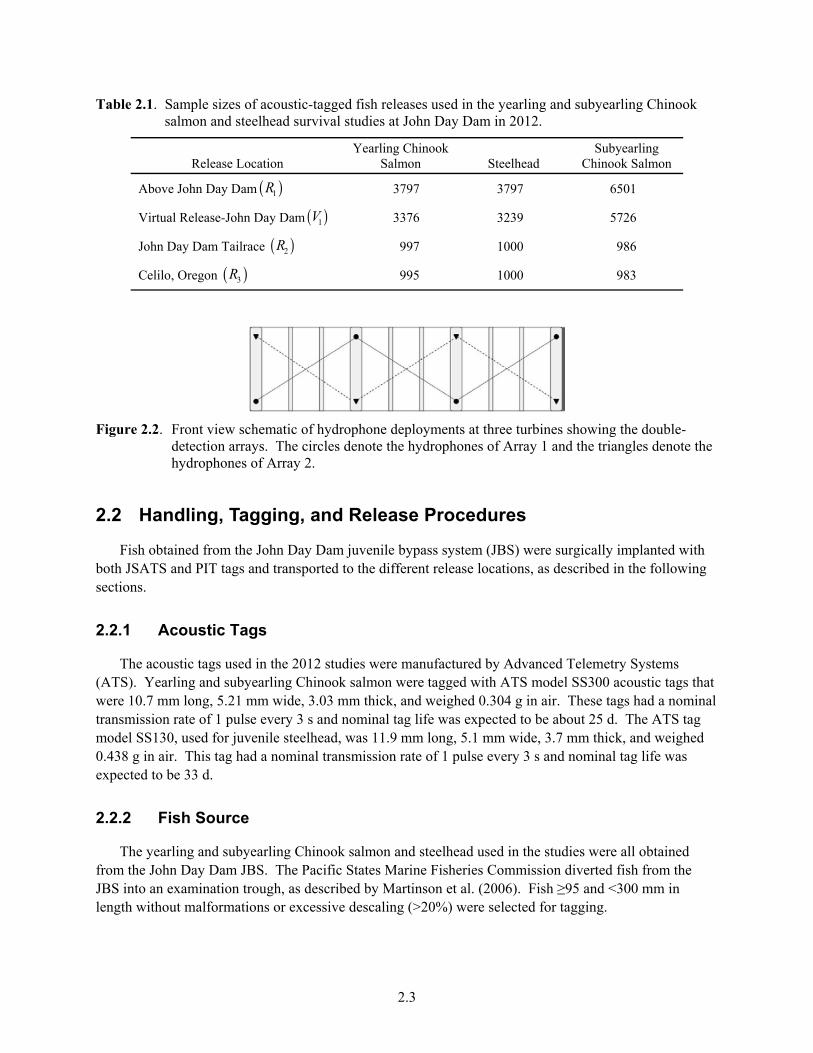
2.1 Sample sizes of acoustic-tagged fish releases used in the yearling and subyearling Chinook salmon and steelhead survival studies at John Day Dam in 2012 ............................... 2.3
2.2 Relative release times for acoustic-tagged fish to accommodate downstream mixing .............. 2.4
3.1 Total number of fish handled by PNNL during the spring and summer of 2012 and counts of fish in several handling categories .............................................................................. 3.1
3.2 Number of observed malady types that warranted rejection of yearling and subyearling Chinook salmon and juvenile steelhead handled by PNNL during spring and summer of 2012 ........................................................................................................................................ 3.1
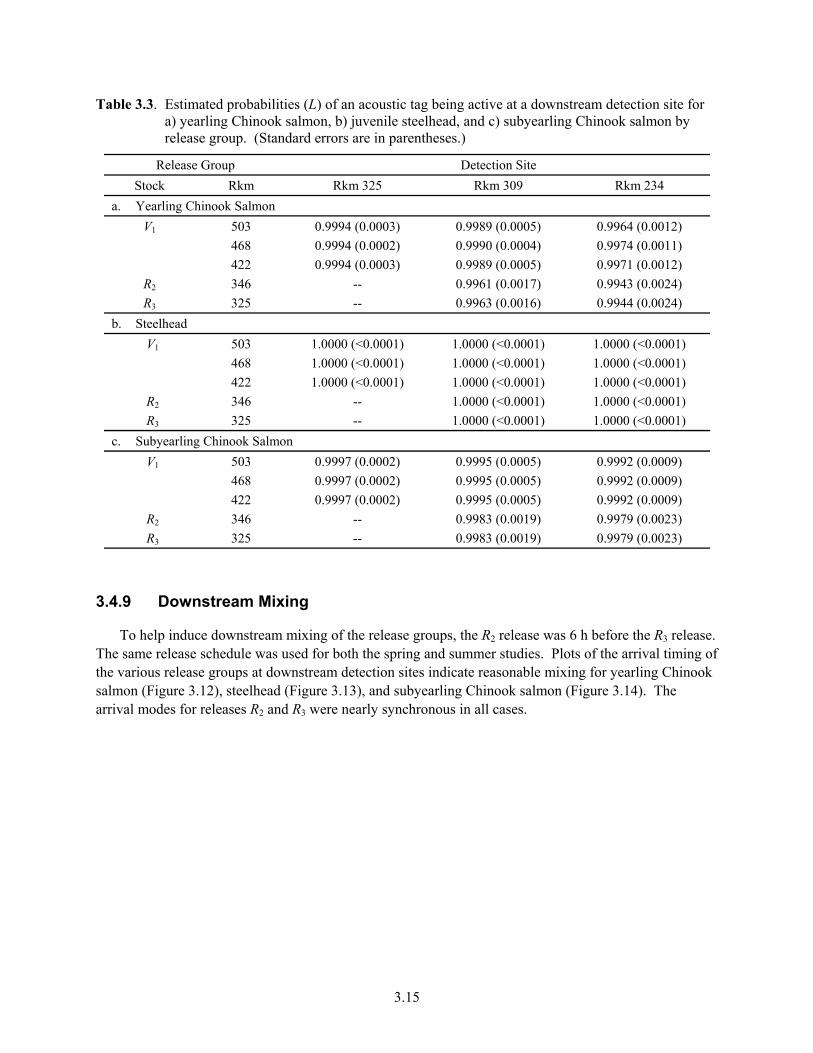
3.3 Estimated probabilities of an acoustic tag being active at a downstream detection site for yearling Chinook salmon, juvenile steelhead, and subyearling Chinook salmon by release group ............................................................................................................................... 3.15
3.4 Survival, detection, and λ parameters for final model used to estimate dam passage survival for yearling Chinook salmon during the season-wide spring study .............................. 3.18
3.5 Survival, detection, and λ parameters for final model used to estimate dam passage survival for steelhead during the season-wide spring study ....................................................... 3.19
3.6 Survival, detection, and λ parameters for final model used to estimate dam passage survival for subyearling Chinook during the season-wide spring study ..................................... 3.20
3.7 Estimated mean and median forebay residence times and mean and median tailrace egress times for yearling Chinook salmon, steelhead, and subyearling Chinook salmon at John Day Dam in 2012 ........................................................................................................... 3.23
4.1 Summary of estimates of dam passage survival at John Day Dam from the 2011 and 2012 JSATS compliance studies ................................................................................................ 4.2
1.1
1.0 Introduction
The compliance monitoring studies reported herein were conducted by researchers at the Pacific Northwest National Laboratory (PNNL) and the University of Washington for the U.S. Army Corps of Engineers, Portland District (USACE) in spring and summer 2012. The purpose of these studies was to estimate dam passage survival at John Day Dam as stipulated by the 2008 Federal Columbia River Power System (FCRPS) Biological Opinion (BiOp; NMFS 2008) and provide additional performance measures at the dam as stipulated in the Columbia Basin Fish Accords for yearling and subyearling Chinook salmon and steelhead (3 Treaty Tribes-Action Agencies 2008).
1.1 Background
The FCRPS 2008 BiOp contains a reasonable and prudent alternative (RPA) that includes actions calling for measurements of juvenile salmonid survival (RPAs 52.1 and 58.1). These RPAs are being addressed as part of the federal research, monitoring, and evaluation (RME) effort for the FCRPS BiOp. Most importantly, the FCRPS BiOp includes performance standards for juvenile salmonid survival in the FCRPS against which the Action Agencies (Bonneville Power Administration, Bureau of Reclamation, and USACE) must compare their estimates, as follows (after the RME Strategy 2 of the RPA):
Juvenile Dam Passage Performance Standards – The Action Agencies juvenile performance standards are an average across Snake River and lower Columbia River dams of 96% average dam passage survival for spring Chinook and steelhead and 93% average across all dams for Snake River subyearling Chinook. Dam passage survival is defined as survival from the upstream face of the dam to a standardized reference point in the tailrace.
The Memorandum of Agreement between the three lower river tribes and the Action Agencies (known informally as the Fish Accords), contains three additional requirements relevant to the 2012 survival studies (after Attachment A to the Memorandum of Agreement):
Dam Survival Performance Standard – Meet the 96% dam passage survival standard for yearling Chinook and steelhead and the 93% standard for subyearling Chinook. Achievement of the standard is based on 2 years of empirical survival data . . . .
Spill Passage Efficiency and Delay Metrics − Spill passage efficiency (SPE) and delay metrics under current spill conditions . . . are not expected to be degraded (“no backsliding”) with installation of new fish passage facilities at the dams . . . .
Future RME − The Action Agencies’ dam survival studies for purposes of determining juvenile dam passage performance will also collect information about SPE, BRZ-to-BRZ (boat-restricted zone) survival and delay, as well as other distribution and survival information. Spill passage efficiency and delay metrics will be considered in the performance check-ins or with Configuration and Operations Plan updates, but not as principal or priority metrics over dam survival performance standards. Once a dam meets the survival performance standard, SPE and delay metrics may be monitored coincidentally with dam survival testing.
1.2
This report summarizes the results of the 2012 spring acoustic-telemetry studies of yearling and subyearling Chinook salmon and steelhead at John Day Dam to assess the Action Agencies’ compliance with the performance criteria of the BiOp and Fish Accords.
1.2 Study Objectives
The purpose of the 2012 compliance monitoring at John Day Dam was to estimate performance measures for yearling and subyearling Chinook salmon and juvenile steelhead as outlined in the FCRPS BiOp and Fish Accords. For each fish stock, the following metrics were estimated using the Juvenile Salmon Acoustic Telemetry System (JSATS) technology:
• Dam passage survival, defined as survival from the upstream face of the dam to a standardized reference point in the tailrace. Performance1 should be ≥96% survival for spring stocks (i.e., yearling Chinook salmon and steelhead) and ≥93% survival for summer stocks (i.e., subyearling Chinook salmon). Survival should be estimated with a standard error (SE) ≤1.5% (i.e., 95% confidence interval with half-width of ±3%; 3% = 1.96 SE ≈ 2 SE or SE = 1.5%).
• Forebay-to-tailrace survival, defined as survival from a forebay array 2 km upstream of the dam to a tailrace array 3 km downstream of the dam. The forebay-to-tailrace survival estimate satisfies the “BRZ-to-BRZ” survival estimated called for in the Fish Accords.
• Forebay residence time, defined as the time from first detection on the forebay entrance array, 2 km upstream of the dam, to the time of last detection on the dam-face array.
• Tailrace egress time, defined as the average travel time from last detection on the dam-face array to the last detection on the tailrace array 3 km downstream of the dam.
• Spill passage efficiency, defined as the fraction of fish going through the dam via the spillway.
• Fish passage efficiency (FPE), defined as the fraction of fish going through the dam via non-turbine routes.
The intent of the 2012 study was to assess compliance with the dam passage survival standard under alternative 30% and 40% spill conditions. The high river flow conditions during 2012 disrupted the intended spill studies. Consequently, only season-wide estimates of dam passage survival were performed.
Results are reported for the three fish stocks by performance measure. This report is designed to provide a succinct and timely summary of BiOp/Fish Accords performance measures.
1.3 Report Contents and Organization
The ensuing sections of this report present the study methods, results, and related discussion. The final section of the report lists references cited in the main text. The appendixes contain supplemental information about the tests of assumptions and capture-history data used in estimating dam passage survival rates.
1 Performance as defined in the 2008 FCRPS BiOp, Section 6.0.

2.1
2.0 Methods
Study methods involved fish release and recapture; the associated fish handling, tagging, and release procedures; acoustic signal processing; and statistical and analytical approaches.
2.1 Release-Recapture Design
The release-recapture design used to estimate dam passage survival at John Day Dam consisted of a novel combination of a virtual release (V1) of fish at the face of the dam and a paired release below the dam (Figure 2.1) (Skalski et al. 2010a, 2010b). Tagged fish were released above John Day Dam at three locations to supply a source of fish known to have arrived alive at the face of the dam. By releasing the fish far enough upstream, the fish should have arrived at the dam in a spatial pattern typical of run-of-river (ROR) fish. This virtual-release group was then used to estimate survival through the dam and part of the way through the next reservoir (i.e., river kilometer [rkm] 325) (Figure 2.1). To account and adjust for this extra reach mortality, a paired release below John Day Dam (i.e., R2 and R3) (Figure 2.1) was used to estimate survival in that segment of the reservoir below the dam. Dam passage survival was then estimated as the quotient of the survival estimates for the virtual release to that of the paired release. The sizes of the releases of the fish tagged with acoustic micro-transmitters used in the dam passage survival estimates are summarized in Table 2.1.
The same release-recapture design was also used to estimate forebay-to-tailrace survival, except that the virtual-release group was constructed of fish known to have arrived at the forebay array (rkm 351). The same below-dam paired release was used to adjust for the extra release mortality below the dam as was used to estimate dam passage survival. The double-detection arrays at the face of the dam (Figure 2.2) were analyzed as two independent arrays to allow estimation of detection probabilities by route of passage and assign the location of the last detection (i.e., the passage route). These passage-route data were used to calculate SPE and FPE at John Day Dam. The fish used in the virtual release at the face of the dam were also used to estimate tailrace egress time.
One manufacturing lot of tags was used for yearling Chinook salmon, another for steelhead, and yet another tag lot for the subyearling Chinook salmon study. A total of 98 tags for yearling Chinook salmon, 100 for steelhead, and 99 for subyearling Chinook salmon were randomly sampled for the tag-life assessments. The tags were activated, held in river water, and monitored continuously until they failed. The information from the tag-life study was used to adjust the perceived survival estimates from the Cormack-Jolly-Seber release-recapture model according to the methods of Townsend et al. (2006).

2.2
1 3Dam
2
ˆ ˆˆ
ˆS S
SS
⋅=
Figure 2.1. Schematic of the virtual/paired-release design used to estimate dam passage survival at John Day Dam. The virtual release (V1) was composed of fish that arrived at the dam face from releases at rkm 503, 468, and 422. The below-dam release pair was composed of releases R2 and R3 with detection arrays used in the survival analysis denoted by dashed lines. During the spring study, the detection array at rkm 275 was unavailable. Instead, the last detection array used in the spring survival analyses was at rkm 234.
2.3
Table 2.1. Sample sizes of acoustic-tagged fish releases used in the yearling and subyearling Chinook salmon and steelhead survival studies at John Day Dam in 2012.
Release Location Yearling Chinook
Salmon Steelhead Subyearling
Chinook Salmon
Above John Day Dam ( )1R 3797 3797 6501
Virtual Release-John Day Dam ( )1V 3376 3239 5726
John Day Dam Tailrace ( )2R 997 1000 986
Celilo, Oregon ( )3R 995 1000 983
Figure 2.2. Front view schematic of hydrophone deployments at three turbines showing the double-detection arrays. The circles denote the hydrophones of Array 1 and the triangles denote the hydrophones of Array 2.
2.2 Handling, Tagging, and Release Procedures
Fish obtained from the John Day Dam juvenile bypass system (JBS) were surgically implanted with both JSATS and PIT tags and transported to the different release locations, as described in the following sections.
2.2.1 Acoustic Tags
The acoustic tags used in the 2012 studies were manufactured by Advanced Telemetry Systems (ATS). Yearling and subyearling Chinook salmon were tagged with ATS model SS300 acoustic tags that were 10.7 mm long, 5.21 mm wide, 3.03 mm thick, and weighed 0.304 g in air. These tags had a nominal transmission rate of 1 pulse every 3 s and nominal tag life was expected to be about 25 d. The ATS tag model SS130, used for juvenile steelhead, was 11.9 mm long, 5.1 mm wide, 3.7 mm thick, and weighed 0.438 g in air. This tag had a nominal transmission rate of 1 pulse every 3 s and nominal tag life was expected to be 33 d.
2.2.2 Fish Source
The yearling and subyearling Chinook salmon and steelhead used in the studies were all obtained from the John Day Dam JBS. The Pacific States Marine Fisheries Commission diverted fish from the JBS into an examination trough, as described by Martinson et al. (2006). Fish ≥95 and <300 mm in length without malformations or excessive descaling (>20%) were selected for tagging.

2.4
2.2.3 Tagging Procedure
The fish to be tagged were anesthetized in an 18.9-L “knockdown” bucket that contained fresh river water and MS-222 (tricaine methanesulfonate; 80 to 100 mg/L). Anesthesia buckets were refreshed repeatedly to maintain the temperature within ±2°C of current river temperatures. Each fish was weighed and measured before tagging.
During surgery, each fish was placed ventral side up and a gravity-fed anesthesia supply line was placed into its mouth. The dilution of the “maintenance” anesthesia was 40 mg/L. Using a micro-sharp, a 5- to 7-mm incision was made in the body cavity between the pelvic girdle and pectoral fin. A passive integrated transponder (PIT) tag was inserted followed by an acoustic tag. Both tags were inserted toward the anterior end of the fish. The incision was closed using a 5-0 Monocryl suture.
After closing the incision, the fish were placed in a dark 18.9-L transport bucket filled with aerated river water. Fish were held in these buckets for 12 to 36 h before being transported for release into the river. The loading rate was five fish per bucket.
2.2.4 Release Procedures
All fish were tagged at John Day Dam and transported by truck to the release locations (Figure 2.1). Transportation routes were adjusted to provide equal travel times to each release location from John Day Dam. Upon arriving at a release site, fish buckets were transferred to a boat for transport to the in-river release location. There were five release locations at each release site across the river (Figure 2.1), and equal numbers of buckets of fish were released at each of the five locations.
Releases in the tailrace occurred for 32 consecutive days in spring (from 2 May to 2 June 2012) and another 32 consecutive days in summer (from 18 June to 19 July 2012). Upstream releases began above McNary Dam on 27 April in spring and 13 June in summer 2012, and fish were first detected on 30 April (spring) and 17 June (summer) at the V1 array. Releases alternated between daytime and nighttime, every other day, over the course of the study. The timing of the releases at the release sites was staggered to help facilitate downstream mixing (Table 2.2).
Table 2.2. Relative release times for acoustic-tagged fish to accommodate downstream mixing. The virtual release occurred continuously from upstream release sites. Releases were timed to accommodate the approximately 6-h travel time between R2 and R3.
Release Location
Relative Release Times
Daytime Start Nighttime Start
V1 (rkm 349) Continuous Continuous
R2 (rkm 346) Day 1: 0400 Day 2: 1600
R3 (rkm 325) Day 1: 1000 Day 2: 2200
2.5
2.3 Acoustic Signal Processing
Transmissions of JSATS tag codes received on cabled and autonomous hydrophones were recorded in raw data files. These files were downloaded periodically and transported to PNNL’s North Bonneville offices for processing. Receptions of tag codes within raw data files were processed to produce a data set of accepted tag-detection events. For cabled arrays, detections from all hydrophones at a dam were combined for processing. The following three filters were used:
• Multipath filter: For data from each individual cabled hydrophone, all tag-code receptions that occur within 0.156 s after an initial identical tag code reception were deleted under the assumption that closely lagging signals are multipath. Initial code receptions were retained. The delay of 0.156 s was the maximum acceptance window width for evaluating a pulse repetition interval (PRI) and was computed as 2(PRI_Window+12×PRI_Increment). Both PRI_Window and PRI_Increment were set at 0.006 s, which was chosen to be slightly larger than the potential rounding error in estimating PRI to two decimal places.
• Multi-detection filter: Receptions were retained only if the same tag code was received at another hydrophone in the same array within 0.3 s because receptions on separate hydrophones within 0.3 s (about 450 m of range) were likely from a single tag transmission.
• PRI filter: Only those series of receptions of a tag code (or “messages”) that were consistent with the pattern of transmissions from a properly functioning JSATS acoustic tag were retained. Filtering rules were evaluated for each tag code individually, and it was assumed that only a single tag would be transmitting that code at any given time. For the cabled system, the PRI filter operated on a message, which included all receptions of the same transmission on multiple hydrophones within 0.3 s. Message time was defined as the earliest reception time across all hydrophones for that message. Detection required that at least six messages were received with an appropriate time interval between the leading edges of successive messages.
The receptions of JSATS tag codes within raw data files from autonomous nodes were also processed to produce a data set of accepted tag-detection events, or events for short. A single file was processed at a time, and no information about receptions at other nodes was used. The Multipath and PRI filters described above were used.
The output of this process was a data set of events that summarized accepted tag detections for all times and locations where hydrophones were operating. Each unique event record included a basic set of fields that indicated the unique identification number of the fish, the first and last detection time for the event, the location of detection, and how many messages were detected within the event. This list was combined with accepted tag detections from the autonomous arrays and PIT-tag detections for additional quality assurance/quality control analysis prior to survival analysis. Additional fields capture specialized information, where available. One such example was route of passage, which was assigned a value for those events that immediately precede passage at a dam based on spatial tracking of tagged fish movements to a location of last detection. Multiple receptions of messages within an event can be used to triangulate successive tag position relative to hydrophone locations.
One of the most important quality control steps was to examine the chronology of detections of every tagged fish on all arrays above and below the dam-face array to identify any detection sequences that deviate from the expected upstream to downstream progression through arrays in the river. Except for

2.6
possible detections on forebay entrance arrays after detection on a nearby dam-face array 1 to 3 km downstream, apparent upstream movements of tagged fish between arrays that were greater than 5 km apart or separated by one or more dams were very rare (<0.015%) and probably represented false positive detections on the upstream array. False positive detections usually will have close to the minimum number of messages and were deleted from the event data set before survival analysis.
Three-dimensional (3D) tracking of JSATS-tagged fish in the immediate forebay of John Day Dam was used to determine routes of passage to estimate SPE and FPE. Acoustic tracking is a common technique in bioacoustics based on time-of-arrival differences among different hydrophones. Usually, the process requires a three-hydrophone array for two-dimensional tracking and a four-hydrophone array for 3D tracking. For this study, only 3D tracking was performed. The methods were similar to those described by Weiland et al. (2009, 2011, 2013).
2.4 Statistical Methods
Statistical methods were used to test assumptions and estimate passage survival, tag life, forebay-to-tailrace survival, travel times, SPE, and FPE, as described below.
2.4.1 Estimation of Dam Passage Survival
Maximum likelihood estimation was used to estimate dam passage survival at John Day Dam based on the virtual/paired-release design. The capture histories from all the replicate releases, both daytime and nighttime, were pooled to produce the estimate of dam passage survival. A joint likelihood model was constructed of a product multinomial with separate multinomial distributions describing the capture histories of the separate release groups (i.e., V1, R2, and R3) and differentiated by tag lot. Different tag-life adjustments were made for the different upstream releases contributing to V1.
The joint likelihood used to model the three release groups was initially fully parameterized. Each of the three releases was allowed to have unique survival and detection parameters. If precision was adequate (i.e., 0.015SE ≤ ) with the fully parameterized model, no further modeling was performed. If initial precision was inadequate, then likelihood ratio tests were used to assess the homogeneity of parameters across release groups to identify the best parsimonious model to describe the capture-history data. This approach was used to help preserve both precision and robustness of the survival results. All calculations were performed using Program ATLAS (http://www.cbr.washington.edu/paramest/atlas/).
Dam passage survival was estimated by the function
1 31Dam
22
3
ˆ ˆˆˆ
ˆˆ
ˆ
S SSS
SS
S
⋅= = (2.1)
where ˆiS is the tag-life-corrected survival estimate for the ith release group ( )1, ,3i = . The variance of
DamS was estimated in a two-step process that incorporated both the uncertainty in the tag-life corrections
and the release-recapture processes.
2.7
In 2012, compliance tests at John Day Dam were planned for dam operation conditions that included alternating 2-d test intervals of either 30% or 40% spill during both spring and summer studies. However, because of high river discharge in 2012, the spill conditions of 30% or 40% spill could not be achieved. Therefore, dam passage survival was estimated season-wide, including all days regardless of spill conditions.
2.4.2 Tag-Life Analysis
For each tag lot of JSATS tags, 98, 100, and 99 acoustic tags were systematically sampled over the course of the yearling Chinook salmon, juvenile steelhead, and subyearling Chinook salmon tagging studies, respectively. The tags were continuously monitored from activation to failure in ambient river water. For each tag lot, the failure times were fit to either the four-parameter vitality model of Li and Anderson (2009) or a three-parameter Weibull distribution. The vitality model tends to fit acoustic-tag failure times well, as it allows for both early onset of random failure due to manufacturing as well as systematic battery failure later on. In the case of the steelhead, no early onset failures occurred. Consequently, the three-parameter Weibull distribution was used to model tag life for the steelhead study.
The survivorship function for the vitality model can be rewritten as
( )2 2
4 2
2 2 2
2 2 2 2
1 2 11
kteu r r
s srt u r rtS t e
u s t u s t
−
+
− + + = − Φ − Φ + + (2.2)
where Φ = cumulative normal distribution r = average wear rate of components
s = standard deviation in wear rate
k = rate of accidental failure
u = standard deviation in quality of original components.
The random failure component, in addition to battery discharge, gives the vitality model additional latitude to fit tag-life data not found in other failure-time distributions such as the Weibull or Gompertz. Parameter estimation was based on maximum likelihood estimation.
The three-parameter Weibull distribution (Elandt-Johnson and Johnson 1980:62) with scale ( )λ , shape ( )β , and shift ( )γ parameters has the following probability density function
( )
1
,tt
f t e
ββ γλβ γ
λ λ
− − − − =
with survivorship function
( ) ,t
S t e
βγλ− −
=

2.8
cumulative density function (CDF)
( ) 1 ,t
F t e
βγλ− −
= −
and hazard function
( )
1
.t
h tββ γ
λ λ
−− =
The three-parameter Weibull reduces to the two-parameter Weibull when γ =0; it reduces to the
exponential distribution when β =1 and γ =0.
For the virtual-release group (V1) based on fish known to have arrived at the dam and with active tags, the conditional probability of tag activation, given the tag was active at the detection array at rkm 349, was used in the tag-life adjustment for that release group. The conditional probability of tag activation at time t1, given it was active at time t0, was computed by the quotient:
( ) ( )
( )1
1 00
S tP t t
S t=
(2.3)
where ( )0S t is the average unconditional probability that the tag is active when detected at the V1
detection array (rkm 349), and ( )1S t is the average unconditional probability that the tag is active when
detected at the first downstream survival detection array (rkm 325).
2.4.3 Tests of Assumptions
Approaches to assumption testing are described below.
2.4.3.1 Burnham et al. (1987) Tests
Tests 2 and 3 of Burnham et al. (1987) have been used to assess whether upstream detection history has an effect on downstream survival. Such tests are most appropriate when fish are physically recaptured or segregated during capture as in the case with PIT-tagged fish going through the JBS. However, acoustic-tag studies do not use physical recaptures to detect fish. Consequently, there is little or no relevance of these tests in acoustic-tag studies. Furthermore, the very high detection probabilities present in acoustic-tag studies frequently preclude calculation of these tests. For these reasons, these tests were not performed.

2.9
2.4.3.2 Tests of Mixing
Evaluation of homogeneous arrival of release groups at downriver detection sites was based on graphs of arrival distributions. The graphs were used to identify any systematic and meaningful departures from mixing. Ideally, the arrival distributions should overlap one another with similarly timed modes.
2.4.3.3 Tagger Effects
Subtle differences in handling and tagging techniques can have an effect on the survival of juvenile salmonids used in the estimation of dam passage survival. For this reason, tagger effects were evaluated. The single release-recapture model was used to estimate reach survivals for fish tagged by different individuals. The analysis evaluated whether any consistent pattern of reduced reach survivals existed for fish tagged by any of the tagging staff.
For k independent reach survival estimates, a test of equal survival was performed using the F-test
( )2ˆ
1,
1
ˆVar
Sk k
i ii
sF
S S
k
− ∞
=
=
(2.4)
where
( )2
2 1ˆ
ˆˆ
1
k
ii
S
S Ss
k=
−=
−
(2.5)
and
1
ˆˆ
k
ii
SS
k==
(2.6)
The F-test was used in evaluating tagger effects as well as delayed tag effects.
2.4.3.4 Delayed Tag Effects
The fish forming the virtual-release group (i.e., V1) came from multiple upstream release locations. If delayed effects of handling or tagging occurred, this could affect the performance of the virtual-release group. Consequently, downstream reach survivals and cumulative release survivals are compared among fish released at different upstream locations. The F-test (2.4) evaluates whether reach survivals are homogeneous regardless of release location. Should heterogeneity be detected, uppermost release groups might be eliminated from subsequent survival and other analyses.

2.10
2.4.3.5 Tag-Lot Effects
Because only one tag lot was used per survival analysis, examination of tag-lot effects was unnecessary.
2.4.4 Forebay-to-Tailrace Survival
The same virtual/paired-release methods used to estimate dam passage were also used to estimate forebay-to-tailrace survival. The only distinction was the virtual-release group (V1) was composed of fish known to have arrived alive at the forebay array (rkm 351) of John Day Dam instead of at the dam face (Figure 2.1).
2.4.5 Estimation of Travel Times
Travel times associated with forebay residence time and tailrace egress were estimated using arithmetic averages as specified in the Fish Accords, i.e.,
1
n
ii
tt
n==
, (2.7)
with the variance of t estimated by
( )( )( )
2
1Var1
n
ii
t tt
n n=
−=
−
, (2.8)
and where it was the travel time of the ith fish ( )1, ,i n= . Median travel times were also computed and
reported.
The estimated tailrace egress time was based on the time from last detection of a fish at the double array at the dam face at John Day Dam to the last detection at the tailrace array 3 km downstream of the dam (rkm 346). The estimated forebay residence times were based on the time from the first detection at the forebay BRZ array 2 km above the dam to the last detection at the double array on the upstream face of John Day Dam.
2.4.6 Estimation of Spill Passage Efficiency
Spill passage efficiency was estimated by the fraction
ˆ ˆSPE
ˆ ˆ ˆ ˆNTSW TSW
NTSW TSW TUR JBS
N N
N N N N
+=
+ + + , (2.9)
where ˆiN is the estimated abundance of acoustic-tagged fish through the ith route ( i = non-TSW
[NTSW], temporary spill weir [TSW], turbines [TUR], and juvenile bypass system [JBS]). The

2.11
double-detection array was used to estimate absolute abundance (N) through a route using the single mark-recapture model (Seber 1982:60) independently at each route. Calculating the variance in stages, the variance of SPE was estimated as
( ) ( ) ( )
( ) ( )( )
( ) ( )( )
22
4
1
2 2
SPE 1 SPEVar SPE SPE 1 SPE
ˆ
ˆ ˆˆ ˆ Var VarVar Var.
ˆ ˆ ˆ ˆ
ii
TUR JBSNTSW TSW
NTSW TSW TUR JBS
N
N NN N
N N N N
=
−= + −
++ ⋅ + + +
(2.10)
2.4.7 Estimation of Fish Passage Efficiency
Fish passage efficiency was estimated by the fraction
ˆ ˆ ˆFPE
ˆ ˆ ˆ ˆNTSW TSW JBS
NTSW TSW JBS TUR
N N N
N N N N
+ +=
+ + + , (2.11)
Calculating the variance in stages, the variance of FPE was estimated as
( ) ( ) ( )
( ) ( ) ( )( )
( )
22
4
1
2 2
FPE 1 FPEVar FPE FPE 1 FPE
ˆ
ˆ ˆ ˆ ˆVar Var Var Var.
ˆˆ ˆ ˆ
ii
NTSW TSW JBS TUR
TURNTSW TSW JBS
N
N N N N
NN N N
=
−= + −
+ + ⋅ + + +
(2.12)
3.1
3.0 Results
The results cover four topics: 1) fish collection, rejection, and tagging; 2) discharge and spill conditions; 3) tests of assumptions; and 4) survival and passage estimates.
3.1 Fish Collection, Rejection, and Tagging
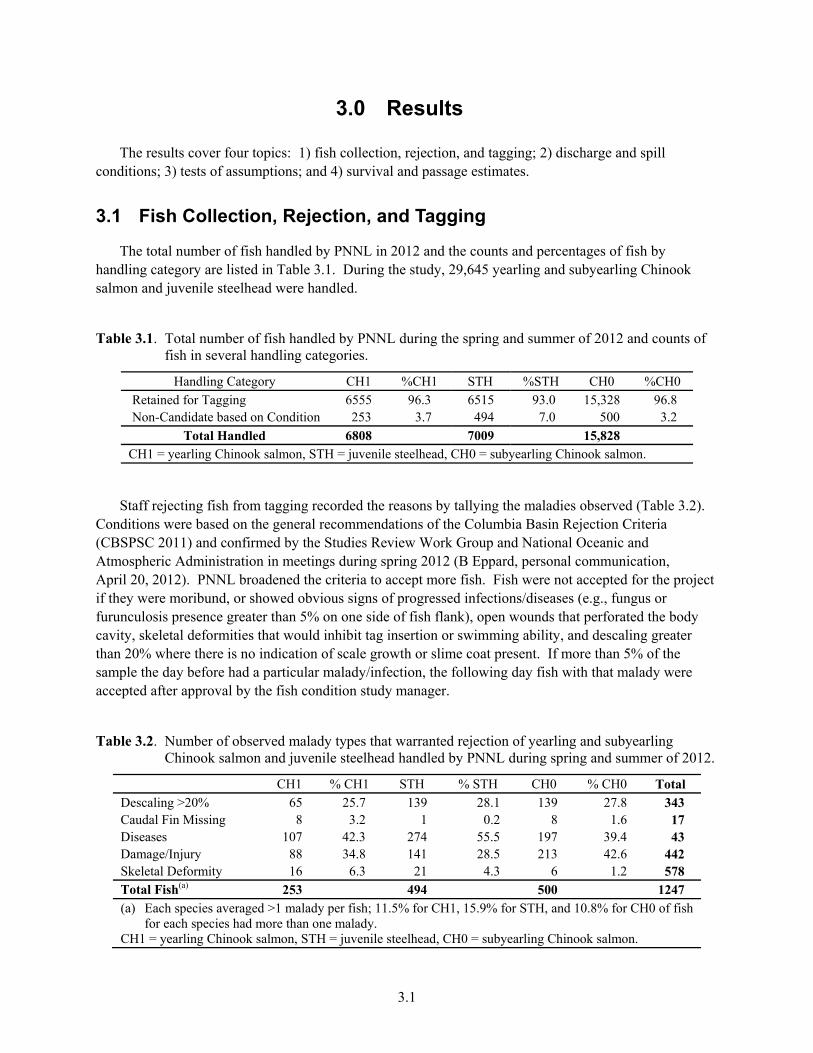
The total number of fish handled by PNNL in 2012 and the counts and percentages of fish by handling category are listed in Table 3.1. During the study, 29,645 yearling and subyearling Chinook salmon and juvenile steelhead were handled.
Table 3.1. Total number of fish handled by PNNL during the spring and summer of 2012 and counts of fish in several handling categories.
Handling Category CH1 %CH1 STH %STH CH0 %CH0
Retained for Tagging 6555 96.3 6515 93.0 15,328 96.8 Non-Candidate based on Condition 253 3.7 494 7.0 500 3.2
Total Handled 6808 7009 15,828 CH1 = yearling Chinook salmon, STH = juvenile steelhead, CH0 = subyearling Chinook salmon.
Staff rejecting fish from tagging recorded the reasons by tallying the maladies observed (Table 3.2). Conditions were based on the general recommendations of the Columbia Basin Rejection Criteria (CBSPSC 2011) and confirmed by the Studies Review Work Group and National Oceanic and Atmospheric Administration in meetings during spring 2012 (B Eppard, personal communication, April 20, 2012). PNNL broadened the criteria to accept more fish. Fish were not accepted for the project if they were moribund, or showed obvious signs of progressed infections/diseases (e.g., fungus or furunculosis presence greater than 5% on one side of fish flank), open wounds that perforated the body cavity, skeletal deformities that would inhibit tag insertion or swimming ability, and descaling greater than 20% where there is no indication of scale growth or slime coat present. If more than 5% of the sample the day before had a particular malady/infection, the following day fish with that malady were accepted after approval by the fish condition study manager.
Table 3.2. Number of observed malady types that warranted rejection of yearling and subyearling Chinook salmon and juvenile steelhead handled by PNNL during spring and summer of 2012.
CH1 % CH1 STH % STH CH0 % CH0 Total Descaling >20% 65 25.7 139 28.1 139 27.8 343 Caudal Fin Missing 8 3.2 1 0.2 8 1.6 17 Diseases 107 42.3 274 55.5 197 39.4 43 Damage/Injury 88 34.8 141 28.5 213 42.6 442 Skeletal Deformity 16 6.3 21 4.3 6 1.2 578 Total Fish(a) 253 494 500 1247 (a) Each species averaged >1 malady per fish; 11.5% for CH1, 15.9% for STH, and 10.8% for CH0 of fish
for each species had more than one malady. CH1 = yearling Chinook salmon, STH = juvenile steelhead, CH0 = subyearling Chinook salmon.

3.2
3.2 Discharge and Spill Conditions
High river discharge during spring and summer 2012 prevented formation of the intended 2-d 30% or 40% spill test intervals (Figure 3.1). Dam passage survival was therefore calculated season-wide during the prevailing conditions of spill (i.e., ≥30%) over the entire period.
a. Spring
b. Summer
Figure 3.1. Daily average total discharge and percent spill at John Day Dam during a) the spring yearling Chinook salmon and steelhead study, 30 April to 2 June 2012, and b) the summer subyearling Chinook salmon study, 17 June to 19 July 2012.
0
50
100
150
200
250
300
350
400
450
Date
Flo
w (
Kcf
s)
04/30 05/10 05/20 05/30
152025303540
% S
pill
Flow Spill
0
50
100
150
200
250
300
350
400
450
Date
Flo
w (
Kcf
s)
06/19 06/24 06/29 07/04 07/09 07/14 07/19
15202530354045
% S
pill
Flow Spill
3.3
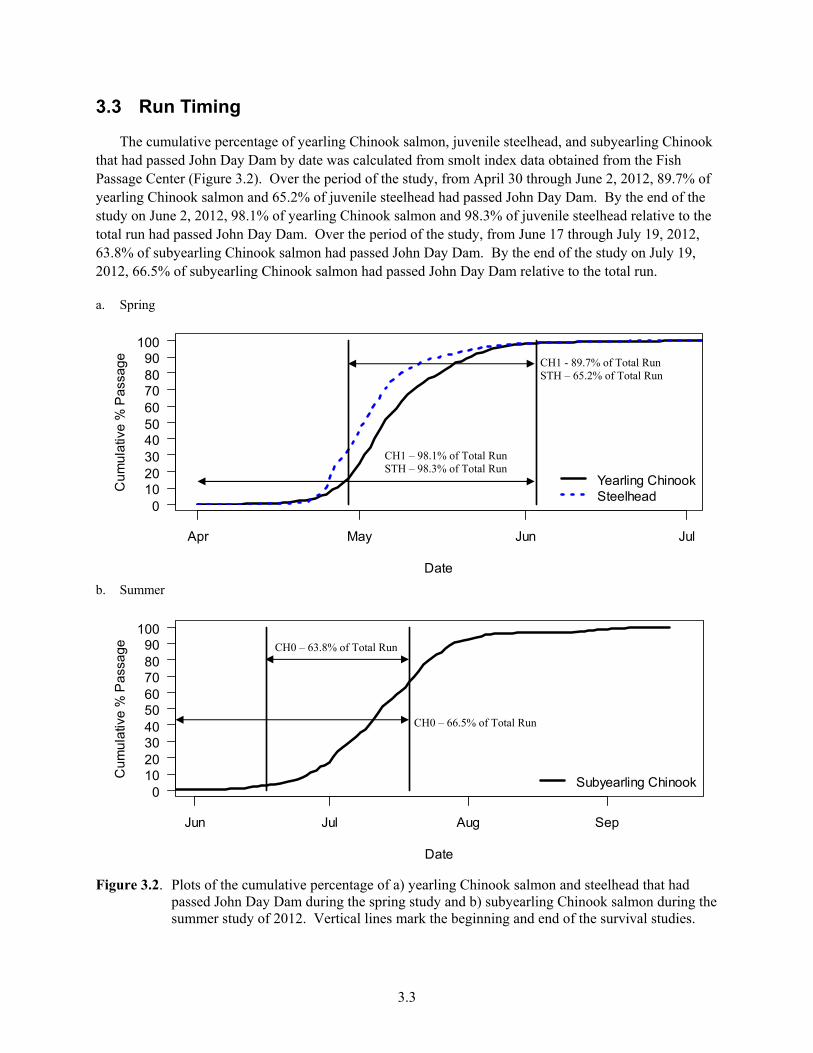
3.3 Run Timing
The cumulative percentage of yearling Chinook salmon, juvenile steelhead, and subyearling Chinook that had passed John Day Dam by date was calculated from smolt index data obtained from the Fish Passage Center (Figure 3.2). Over the period of the study, from April 30 through June 2, 2012, 89.7% of yearling Chinook salmon and 65.2% of juvenile steelhead had passed John Day Dam. By the end of the study on June 2, 2012, 98.1% of yearling Chinook salmon and 98.3% of juvenile steelhead relative to the total run had passed John Day Dam. Over the period of the study, from June 17 through July 19, 2012, 63.8% of subyearling Chinook salmon had passed John Day Dam. By the end of the study on July 19, 2012, 66.5% of subyearling Chinook salmon had passed John Day Dam relative to the total run.
a. Spring
b. Summer
Figure 3.2. Plots of the cumulative percentage of a) yearling Chinook salmon and steelhead that had passed John Day Dam during the spring study and b) subyearling Chinook salmon during the summer study of 2012. Vertical lines mark the beginning and end of the survival studies.
Apr May Jun Jul
Date
Cu
mu
lativ
e %
Pa
ssa
ge
0102030405060708090
100
Yearling ChinookSteelhead
Jun Jul Aug Sep
Date
Cu
mu
lativ
e %
Pa
ssa
ge
0102030405060708090
100
Subyearling Chinook
CH1 - 89.7% of Total Run STH – 65.2% of Total Run
CH1 – 98.1% of Total Run STH – 98.3% of Total Run
CH0 – 63.8% of Total Run
CH0 – 66.5% of Total Run
3.4
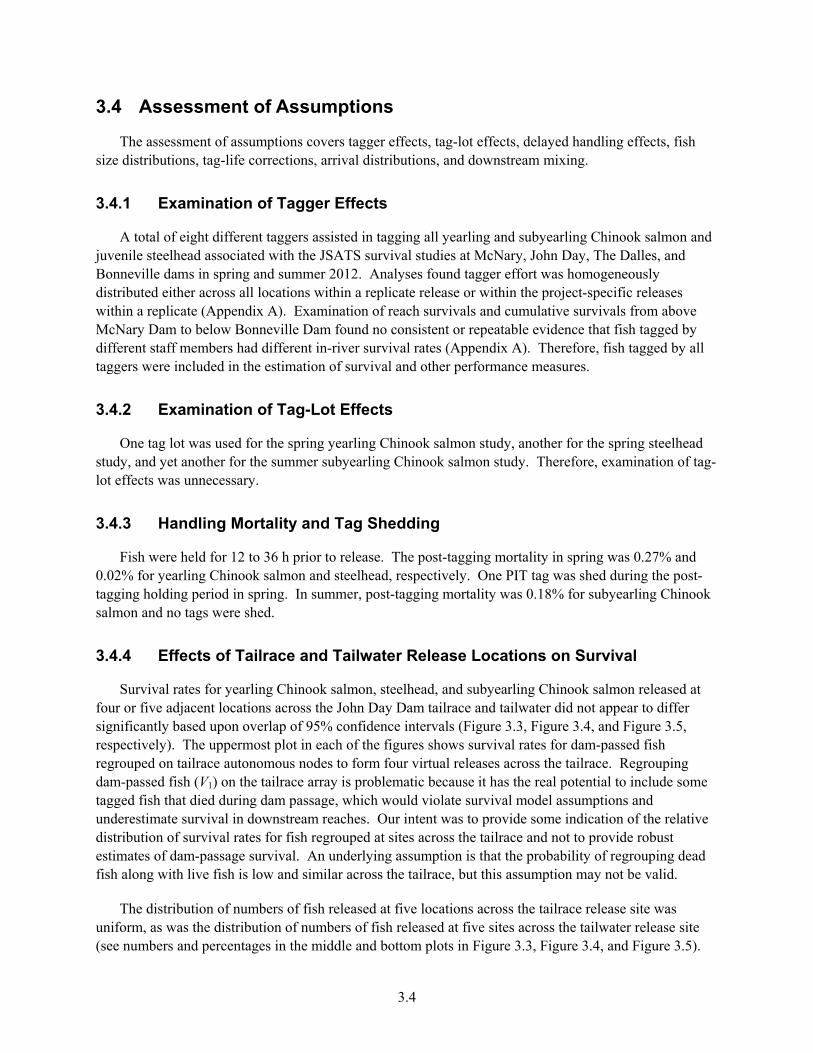
3.4 Assessment of Assumptions
The assessment of assumptions covers tagger effects, tag-lot effects, delayed handling effects, fish size distributions, tag-life corrections, arrival distributions, and downstream mixing.
3.4.1 Examination of Tagger Effects
A total of eight different taggers assisted in tagging all yearling and subyearling Chinook salmon and juvenile steelhead associated with the JSATS survival studies at McNary, John Day, The Dalles, and Bonneville dams in spring and summer 2012. Analyses found tagger effort was homogeneously distributed either across all locations within a replicate release or within the project-specific releases within a replicate (Appendix A). Examination of reach survivals and cumulative survivals from above McNary Dam to below Bonneville Dam found no consistent or repeatable evidence that fish tagged by different staff members had different in-river survival rates (Appendix A). Therefore, fish tagged by all taggers were included in the estimation of survival and other performance measures.
3.4.2 Examination of Tag-Lot Effects
One tag lot was used for the spring yearling Chinook salmon study, another for the spring steelhead study, and yet another for the summer subyearling Chinook salmon study. Therefore, examination of tag-lot effects was unnecessary.
3.4.3 Handling Mortality and Tag Shedding
Fish were held for 12 to 36 h prior to release. The post-tagging mortality in spring was 0.27% and 0.02% for yearling Chinook salmon and steelhead, respectively. One PIT tag was shed during the post-tagging holding period in spring. In summer, post-tagging mortality was 0.18% for subyearling Chinook salmon and no tags were shed.
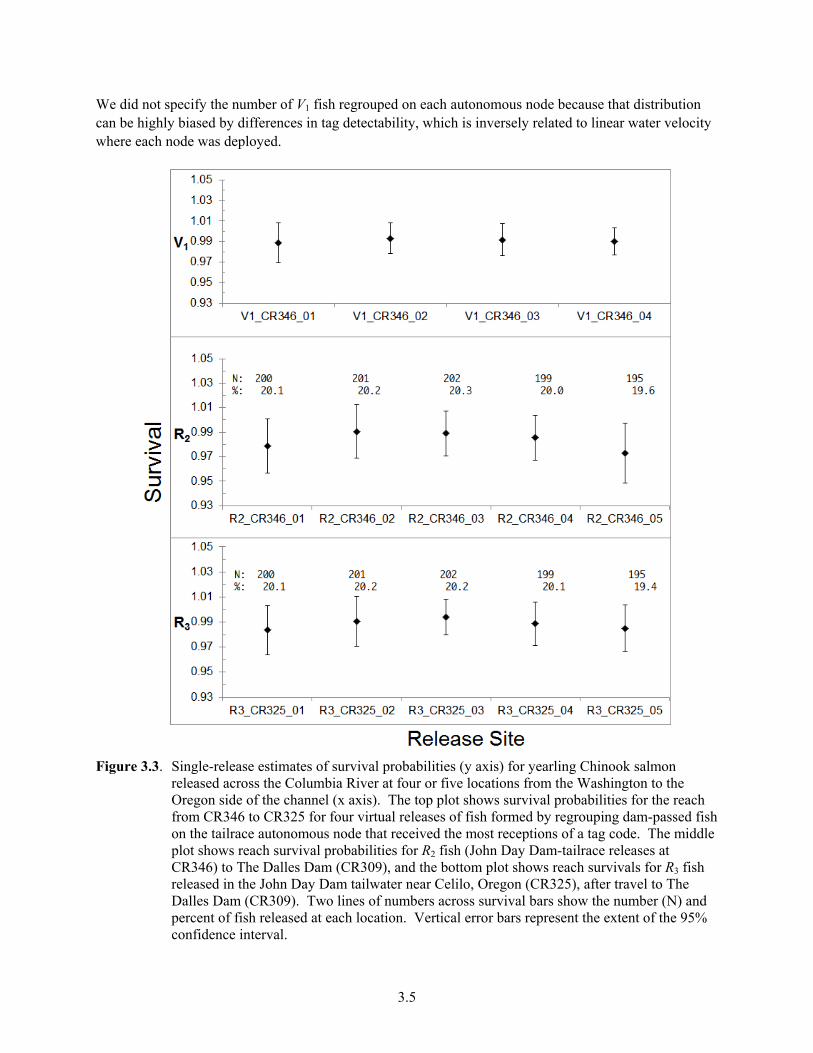
3.4.4 Effects of Tailrace and Tailwater Release Locations on Survival
Survival rates for yearling Chinook salmon, steelhead, and subyearling Chinook salmon released at four or five adjacent locations across the John Day Dam tailrace and tailwater did not appear to differ significantly based upon overlap of 95% confidence intervals (Figure 3.3, Figure 3.4, and Figure 3.5, respectively). The uppermost plot in each of the figures shows survival rates for dam-passed fish regrouped on tailrace autonomous nodes to form four virtual releases across the tailrace. Regrouping dam-passed fish (V1) on the tailrace array is problematic because it has the real potential to include some tagged fish that died during dam passage, which would violate survival model assumptions and underestimate survival in downstream reaches. Our intent was to provide some indication of the relative distribution of survival rates for fish regrouped at sites across the tailrace and not to provide robust estimates of dam-passage survival. An underlying assumption is that the probability of regrouping dead fish along with live fish is low and similar across the tailrace, but this assumption may not be valid.
The distribution of numbers of fish released at five locations across the tailrace release site was uniform, as was the distribution of numbers of fish released at five sites across the tailwater release site (see numbers and percentages in the middle and bottom plots in Figure 3.3, Figure 3.4, and Figure 3.5).
3.5
We did not specify the number of V1 fish regrouped on each autonomous node because that distribution can be highly biased by differences in tag detectability, which is inversely related to linear water velocity where each node was deployed.
Figure 3.3. Single-release estimates of survival probabilities (y axis) for yearling Chinook salmon released across the Columbia River at four or five locations from the Washington to the Oregon side of the channel (x axis). The top plot shows survival probabilities for the reach from CR346 to CR325 for four virtual releases of fish formed by regrouping dam-passed fish on the tailrace autonomous node that received the most receptions of a tag code. The middle plot shows reach survival probabilities for R2 fish (John Day Dam-tailrace releases at CR346) to The Dalles Dam (CR309), and the bottom plot shows reach survivals for R3 fish released in the John Day Dam tailwater near Celilo, Oregon (CR325), after travel to The Dalles Dam (CR309). Two lines of numbers across survival bars show the number (N) and percent of fish released at each location. Vertical error bars represent the extent of the 95% confidence interval.
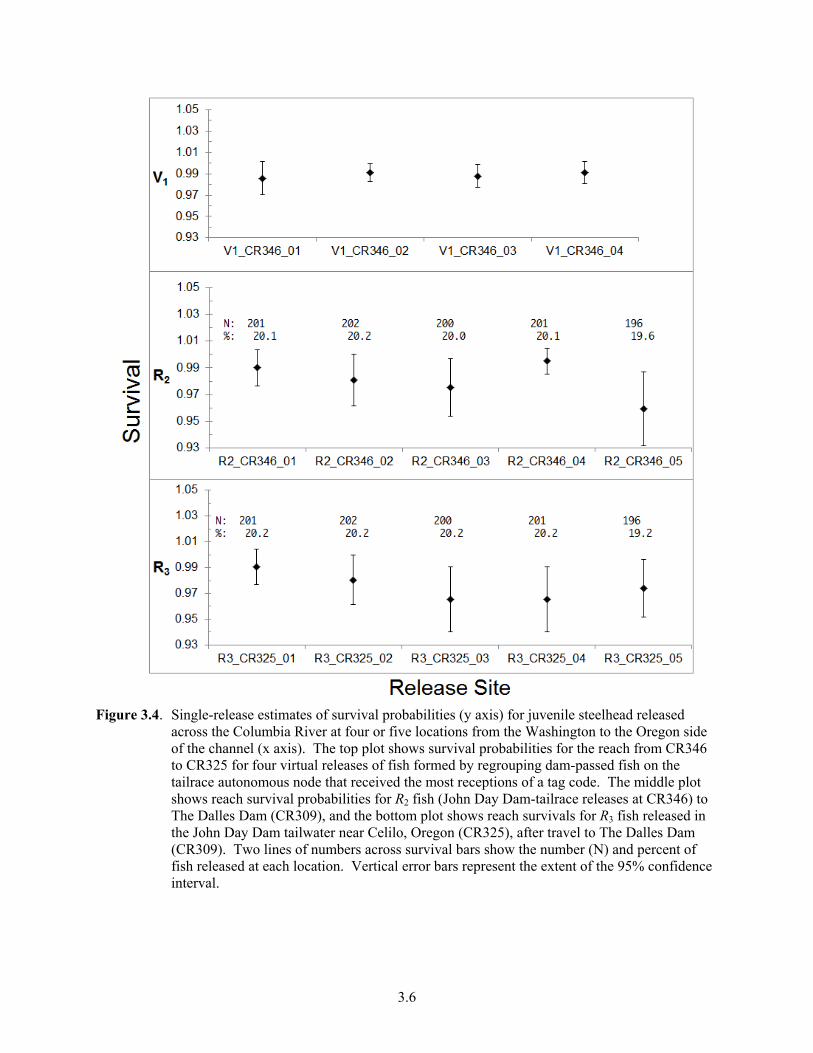
3.6
Figure 3.4. Single-release estimates of survival probabilities (y axis) for juvenile steelhead released across the Columbia River at four or five locations from the Washington to the Oregon side of the channel (x axis). The top plot shows survival probabilities for the reach from CR346 to CR325 for four virtual releases of fish formed by regrouping dam-passed fish on the tailrace autonomous node that received the most receptions of a tag code. The middle plot shows reach survival probabilities for R2 fish (John Day Dam-tailrace releases at CR346) to The Dalles Dam (CR309), and the bottom plot shows reach survivals for R3 fish released in the John Day Dam tailwater near Celilo, Oregon (CR325), after travel to The Dalles Dam (CR309). Two lines of numbers across survival bars show the number (N) and percent of fish released at each location. Vertical error bars represent the extent of the 95% confidence interval.
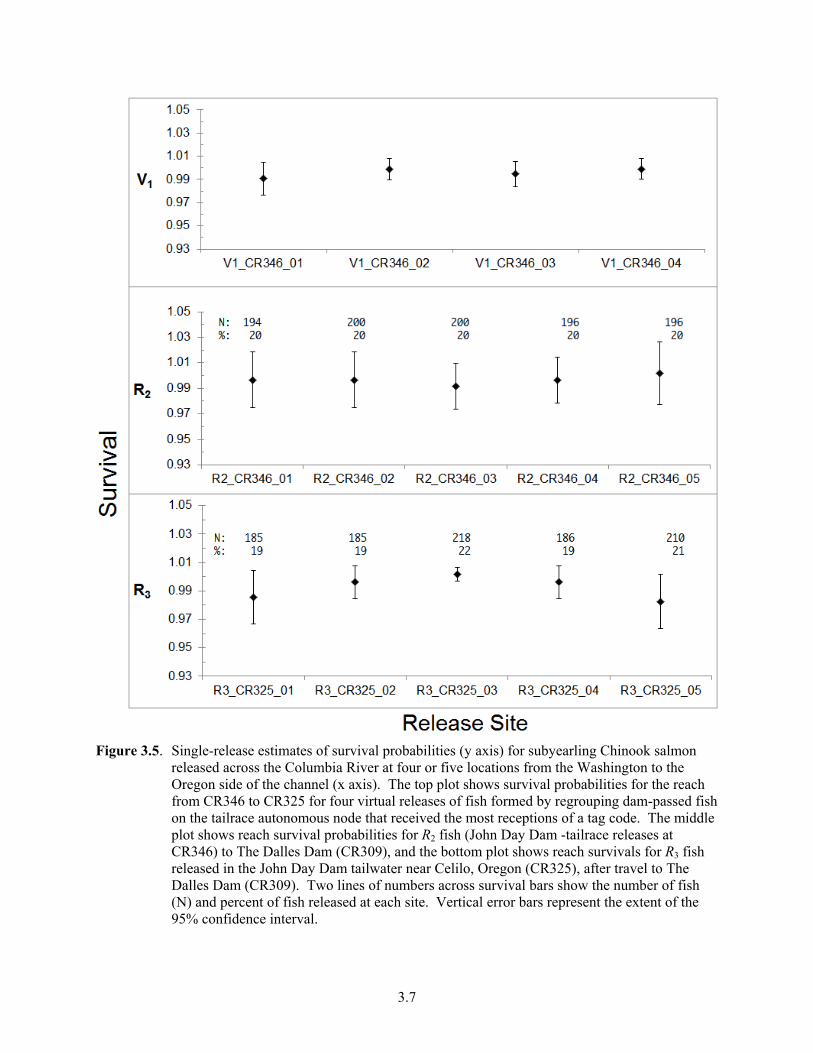
3.7
Figure 3.5. Single-release estimates of survival probabilities (y axis) for subyearling Chinook salmon released across the Columbia River at four or five locations from the Washington to the Oregon side of the channel (x axis). The top plot shows survival probabilities for the reach from CR346 to CR325 for four virtual releases of fish formed by regrouping dam-passed fish on the tailrace autonomous node that received the most receptions of a tag code. The middle plot shows reach survival probabilities for R2 fish (John Day Dam -tailrace releases at CR346) to The Dalles Dam (CR309), and the bottom plot shows reach survivals for R3 fish released in the John Day Dam tailwater near Celilo, Oregon (CR325), after travel to The Dalles Dam (CR309). Two lines of numbers across survival bars show the number of fish (N) and percent of fish released at each site. Vertical error bars represent the extent of the 95% confidence interval.

3.8
3.4.5 Examination of Time In-River on Survivals of Different Release Groups
The virtual release formed from the detections of upriver releases at the face of the dam could result in biased survival estimates if fish from varying upriver release locations had differential downriver survival rates (Figure 2.1). For this reason, reach survivals and cumulative survivals were compared across fish from different upriver release locations. There was no consistent or reproducible evidence to suggest that the amount of time (i.e., distance) in-river had a subsequent effect on downriver survival for either yearling Chinook salmon or juvenile steelhead (Appendix A). There was evidence for subyearling Chinook salmon that the uppermost releases could not be used at Bonneville Dam. However, in constructing the virtual releases at the face of John Day Dam, fish from all available upriver release locations were used in subsequent survival and other parameter estimation.
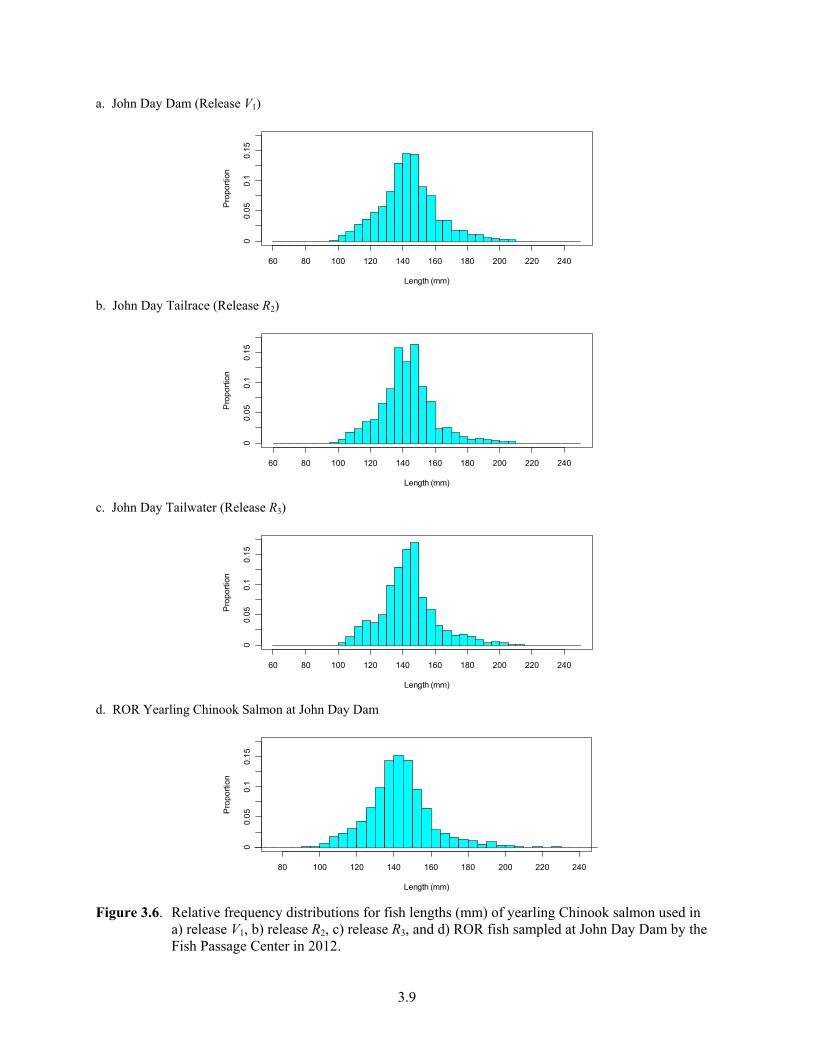
3.4.6 Fish Size Distributions
Comparison of JSATS-tagged fish with ROR fish sampled at John Day Dam through the Smolt Monitoring Program shows that the length frequency distributions were generally well matched for yearling Chinook salmon (Figure 3.6), steelhead (Figure 3.7), and subyearling Chinook salmon (Figure 3.8). The length distributions for the three yearling Chinook salmon releases (Figure 3.6), the three steelhead releases (Figure 3.7), and the three subyearling Chinook salmon releases (Figure 3.8) also were quite similar. Mean lengths for the acoustic-tagged yearling Chinook salmon were 143.9 mm; for the steelhead, 206.7 mm; and for the subyearling Chinook salmon, 112.9 mm. Mean lengths for yearling Chinook salmon, steelhead, and subyearling Chinook salmon sampled by the Fish Passage Center at the John Day Dam juvenile sampling facility were 143.3 mm, 201.2 mm, and 109.4 mm, respectively. Fish size did not change over the course of the study for yearling Chinook salmon or steelhead (Figure 3.9). For subyearling Chinook salmon, size shifted ever so slightly smaller as the season progressed.
3.4.7 Tag-Life Corrections
During 2012, separate tag lots were used for each fish stock in the spring and summer studies. From each of these tag lots, 98 to 100 tags were systematically sampled to conduct independent tag-life studies. A 3-parameter Weibull curve was used to fit the tags used in the steelhead study, and the vitality curve of Li and Anderson (2009) was used to fit the yearling Chinook salmon spring study and the subyearling Chinook salmon summer study Figure 3.10). Average tag lives were 32.2 d, 23.0 d, and 23.3 d for the steelhead, yearling Chinook salmon, and summer subyearling Chinook salmon tag lots, respectively.
3.4.8 Arrival Distributions
The estimated probability an acoustic tag was active when fish arrived at a downstream detection array depends on the tag-life curve and the distribution of observed travel times for yearling Chinook salmon, steelhead, and subyearling Chinook salmon (Figure 3.11). Examination of the fish arrival distributions to the last detection array used in the survival analyses indicated all fish that arrived had passed through the study area before tag failure became important. These probabilities were calculated by integrating the tag survivorship curve (Figure 3.11) over the observed distribution of fish arrival times (i.e., time from tag activation to arrival). The probabilities of a JSATS tag being active at a downstream detection site were specific to release location and season (Table 3.3). In all cases, the probability a tag was active at a downstream detection site as far as rkm 234 for yearling Chinook salmon was 0.9943 and 1.0000 for juvenile steelhead (Table 3.3). For subyearling Chinook salmon, the probability of an acoustic tag being active at rkm 275 was 0.9979.
3.9
a. John Day Dam (Release V1)
b. John Day Tailrace (Release R2)
c. John Day Tailwater (Release R3)
d. ROR Yearling Chinook Salmon at John Day Dam
Figure 3.6. Relative frequency distributions for fish lengths (mm) of yearling Chinook salmon used in a) release V1, b) release R2, c) release R3, and d) ROR fish sampled at John Day Dam by the Fish Passage Center in 2012.
Length (mm)
Pro
porti
on
60 80 100 120 140 160 180 200 220 240
00.
05
0.1
0.1
5
Length (mm)
Pro
por
tion
60 80 100 120 140 160 180 200 220 240
00
.05
0.1
0.1
5
Length (mm)
Pro
porti
on
60 80 100 120 140 160 180 200 220 240
00.
05
0.1
0.1
5
Length (mm)
Pro
porti
on
80 100 120 140 160 180 200 220 240
00.
05
0.1
0.1
5

3.10
a. John Day Dam (Release V1)
b. John Day Tailrace (Release R2)
c. John Day Tailwater (Release R3)
d. ROR Juvenile Steelhead at John Day Dam
Figure 3.7. Relative frequency distributions for fish lengths (mm) of juvenile steelhead used in a) release V1, b) release R2, c) release R3, and d) ROR fish sampled at John Day Dam by the Fish Passage Center in 2012.
Length (mm)
Pro
porti
on
120 140 160 180 200 220 240 260 280 300 320 340
00.
02
50.
05
0.0
75
0.1
Length (mm)
Pro
porti
on
120 140 160 180 200 220 240 260 280 300 320 340
00.
02
50.
05
0.0
75
0.1
Length (mm)
Pro
porti
on
120 140 160 180 200 220 240 260 280 300 320 340
00.
02
50.
05
0.0
75
0.1
Length (mm)
Pro
porti
on
100 120 140 160 180 200 220 240 260 280 300 320
00.
02
50.
05
0.0
75
0.1

3.11
a. John Day Dam (Release V1)
b. John Day Tailrace (Release R2)
c. John Day Tailwater (Release R3)
d. ROR Subyearling Chinook Salmon at John Day Dam
Figure 3.8. Relative frequency distributions for fish lengths (mm) of subyearling Chinook salmon used in a) release V1, b) release R2, c) release R3, and d) ROR fish sampled at John Day Dam by the Fish Passage Center in 2012 during the period of the study.
Length (mm)
Pro
po
rtio
n
70 80 90 100 110 120 130 140 150 1600
0.0
50
.12
50
.20
.27
5
Length (mm)
Pro
po
rtio
n
70 80 90 100 110 120 130 140 150 160
00
.05
0.1
25
0.2
0.2
75
Length (mm)
Pro
po
rtio
n
70 80 90 100 110 120 130 140 150 160
00
.05
0.1
25
0.2
0.2
75
Length (mm)
Pro
po
rtio
n
70 80 90 100 110 120 130 140 150 160
00
.05
0.1
25
0.2
0.2
75
3.12
a. Yearling Chinook salmon
b. Juvenile steelhead
c. Subyearling Chinook salmon
Figure 3.9. Range and median lengths of acoustic-tagged a) yearling Chinook salmon, b) steelhead, and c) subyearling Chinook salmon used over the course of the 2012 survival studies.
Apr 30 May 10 May 20 May 30
60
10
01
60
220
Release Date
Le
ng
th (
mm
)
Maximum Median Minimum
Apr 30 May 10 May 20 May 30
10
01
60
22
02
80
Release Date
Le
ng
th (
mm
)
Maximum Median Minimum
Jun 19 Jun 29 Jul 09 Jul 19
60
80
10
01
30
16
0
Release Date
Le
ng
th (
mm
)
Maximum Median Minimum

3.13
a. Spring – Yearling Chinook Salmon b. Spring – Steelhead
c. Summer – Subyearling Chinook Salmon
Figure 3.10. Observed time of tag failure and fitted survivorship curves using the vitality model of Li and Anderson (2009) for a) yearling Chinook salmon and c) subyearling Chinook salmon tag lots and a three-parameter Weibull model for b) steelhead.
3.14
a. Yearling Chinook Salmon b. Steelhead
c. Subyearling Chinook Salmon
Figure 3.11. Plots of the fitted tag-life survivorship curve and the arrival-time distributions of a) yearling Chinook salmon, b) juvenile steelhead, and c) subyearling Chinook salmon for releases V1, R2, and R3 at the acoustic-detection array located at rkm 234 (spring) or rkm 275 (summer) (Figure 2.1).
3.15
Table 3.3. Estimated probabilities (L) of an acoustic tag being active at a downstream detection site for a) yearling Chinook salmon, b) juvenile steelhead, and c) subyearling Chinook salmon by release group. (Standard errors are in parentheses.)
Release Group Detection Site
Stock Rkm Rkm 325 Rkm 309 Rkm 234
a. Yearling Chinook Salmon
V1 503 0.9994 (0.0003) 0.9989 (0.0005) 0.9964 (0.0012)
468 0.9994 (0.0002) 0.9990 (0.0004) 0.9974 (0.0011)
422 0.9994 (0.0003) 0.9989 (0.0005) 0.9971 (0.0012)
R2 346 -- 0.9961 (0.0017) 0.9943 (0.0024)
R3 325 -- 0.9963 (0.0016) 0.9944 (0.0024)
b. Steelhead
V1 503 1.0000 (<0.0001) 1.0000 (<0.0001) 1.0000 (<0.0001)
468 1.0000 (<0.0001) 1.0000 (<0.0001) 1.0000 (<0.0001)
422 1.0000 (<0.0001) 1.0000 (<0.0001) 1.0000 (<0.0001)
R2 346 -- 1.0000 (<0.0001) 1.0000 (<0.0001)
R3 325 -- 1.0000 (<0.0001) 1.0000 (<0.0001)
c. Subyearling Chinook Salmon
V1 503 0.9997 (0.0002) 0.9995 (0.0005) 0.9992 (0.0009)
468 0.9997 (0.0002) 0.9995 (0.0005) 0.9992 (0.0009)
422 0.9997 (0.0002) 0.9995 (0.0005) 0.9992 (0.0009)
R2 346 -- 0.9983 (0.0019) 0.9979 (0.0023)
R3 325 -- 0.9983 (0.0019) 0.9979 (0.0023)
3.4.9 Downstream Mixing
To help induce downstream mixing of the release groups, the R2 release was 6 h before the R3 release. The same release schedule was used for both the spring and summer studies. Plots of the arrival timing of the various release groups at downstream detection sites indicate reasonable mixing for yearling Chinook salmon (Figure 3.12), steelhead (Figure 3.13), and subyearling Chinook salmon (Figure 3.14). The arrival modes for releases R2 and R3 were nearly synchronous in all cases.
3.16
a. rkm 309
Arrival Time (Hours)
b. rkm 234
Arrival Time (Hours)
Figure 3.12. Frequency distribution plots of downstream arrival timing (expressed as percentages) for yearling Chinook salmon releases R2 and R3 at detection arrays located at a) rkm 309 and b) rkm 234 (see Figure 2.1). All times adjusted relative to the release time of R2.
a. rkm 309
Arrival Time (Hours)
b. rkm 234
Arrival Time (Hours)
Figure 3.13. Frequency distribution plots of downstream arrival timing (expressed as percentages) for steelhead releases R2 and R3 at detection arrays located at a) rkm 309 and b) rkm 234 (see Figure 2.1). All times adjusted relative to the release time of R2.
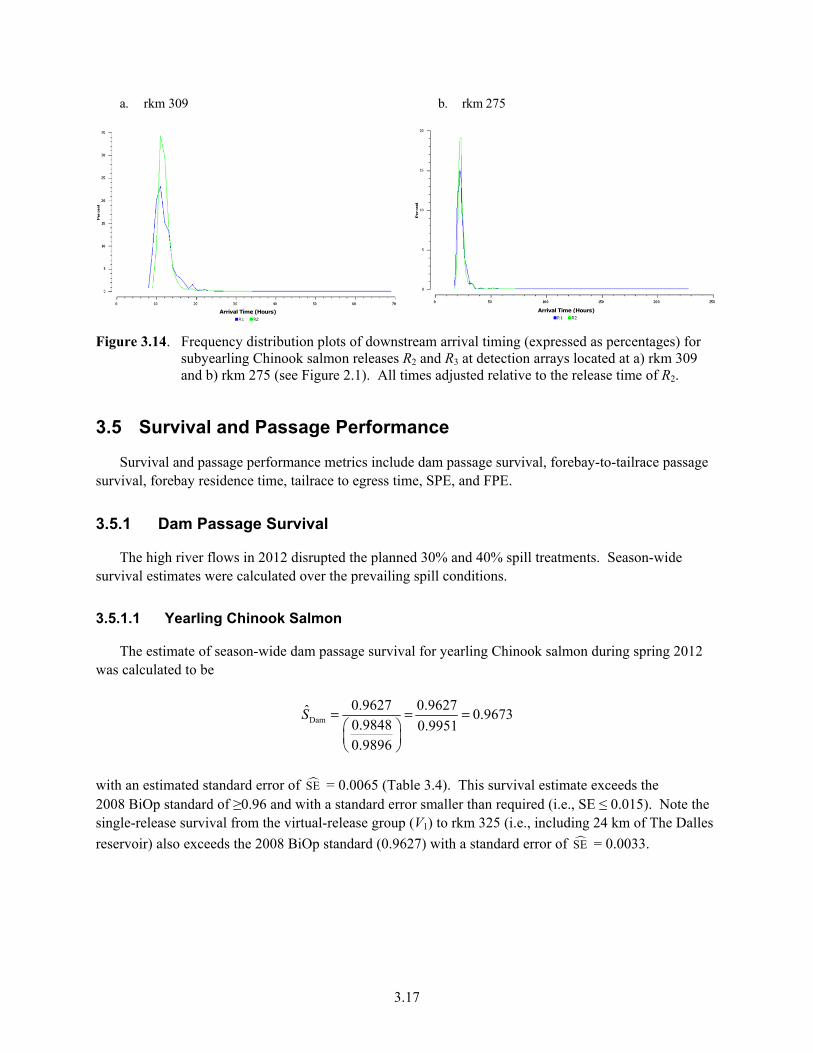
3.17
a. rkm 309
Arrival Time (Hours)
b. rkm 275
Arrival Time (Hours)
Figure 3.14. Frequency distribution plots of downstream arrival timing (expressed as percentages) for subyearling Chinook salmon releases R2 and R3 at detection arrays located at a) rkm 309 and b) rkm 275 (see Figure 2.1). All times adjusted relative to the release time of R2.
3.5 Survival and Passage Performance
Survival and passage performance metrics include dam passage survival, forebay-to-tailrace passage survival, forebay residence time, tailrace to egress time, SPE, and FPE.
3.5.1 Dam Passage Survival
The high river flows in 2012 disrupted the planned 30% and 40% spill treatments. Season-wide survival estimates were calculated over the prevailing spill conditions.
3.5.1.1 Yearling Chinook Salmon
The estimate of season-wide dam passage survival for yearling Chinook salmon during spring 2012 was calculated to be
Dam
0.9627 0.9627ˆ 0.96730.9848 0.99510.9896
S = = =
with an estimated standard error of SE = 0.0065 (Table 3.4). This survival estimate exceeds the 2008 BiOp standard of ≥0.96 and with a standard error smaller than required (i.e., SE ≤ 0.015). Note the single-release survival from the virtual-release group (V1) to rkm 325 (i.e., including 24 km of The Dalles
reservoir) also exceeds the 2008 BiOp standard (0.9627) with a standard error of SE = 0.0033.
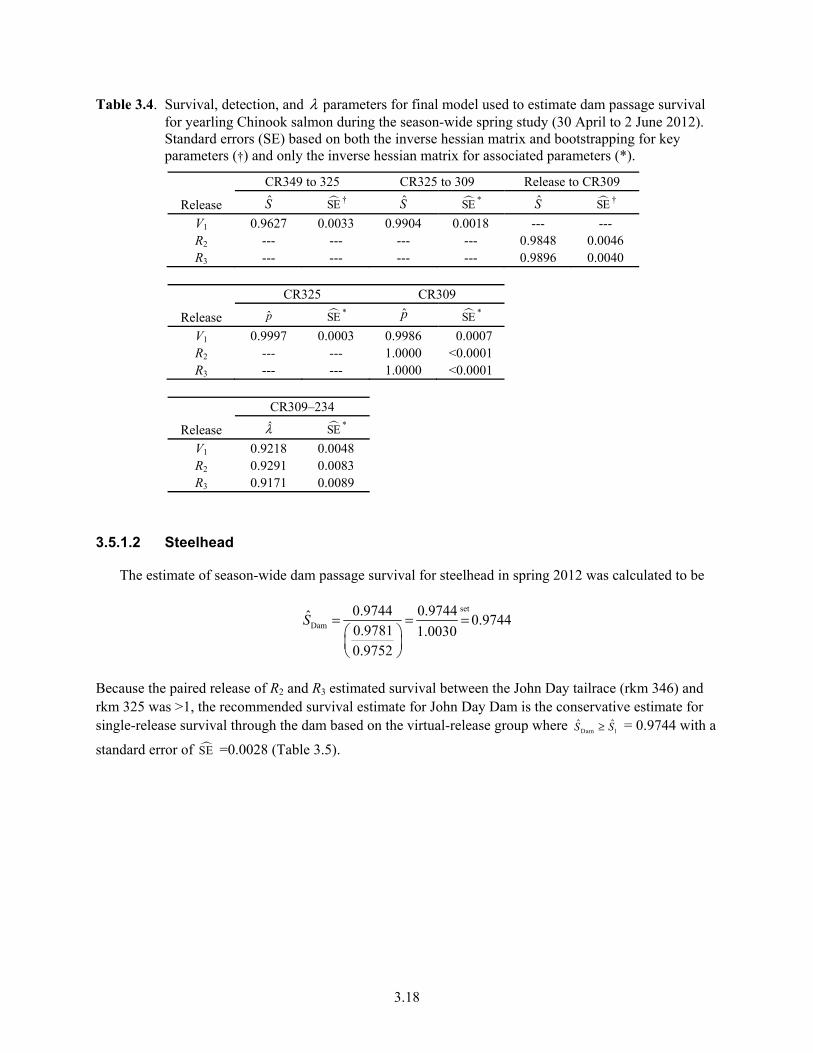
3.18
Table 3.4. Survival, detection, and λ parameters for final model used to estimate dam passage survival for yearling Chinook salmon during the season-wide spring study (30 April to 2 June 2012). Standard errors (SE) based on both the inverse hessian matrix and bootstrapping for key parameters (†) and only the inverse hessian matrix for associated parameters (*).
Release
CR349 to 325 CR325 to 309 Release to CR309
S SE † S SE * S SE †
V1 0.9627 0.0033 0.9904 0.0018 --- --- R2 --- --- --- --- 0.9848 0.0046 R3 --- --- --- --- 0.9896 0.0040
Release
CR325 CR309
p SE * p SE *
V1 0.9997 0.0003 0.9986 0.0007 R2 --- --- 1.0000 <0.0001 R3 --- --- 1.0000 <0.0001
Release
CR309–234
λ SE *
V1 0.9218 0.0048 R2 0.9291 0.0083 R3 0.9171 0.0089
3.5.1.2 Steelhead
The estimate of season-wide dam passage survival for steelhead in spring 2012 was calculated to be
set
Dam
0.9744 0.9744ˆ 0.97440.9781 1.00300.9752
S = = =
Because the paired release of R2 and R3 estimated survival between the John Day tailrace (rkm 346) and rkm 325 was >1, the recommended survival estimate for John Day Dam is the conservative estimate for single-release survival through the dam based on the virtual-release group where Dam 1
ˆ ˆS S≥ = 0.9744 with a
standard error of SE =0.0028 (Table 3.5).
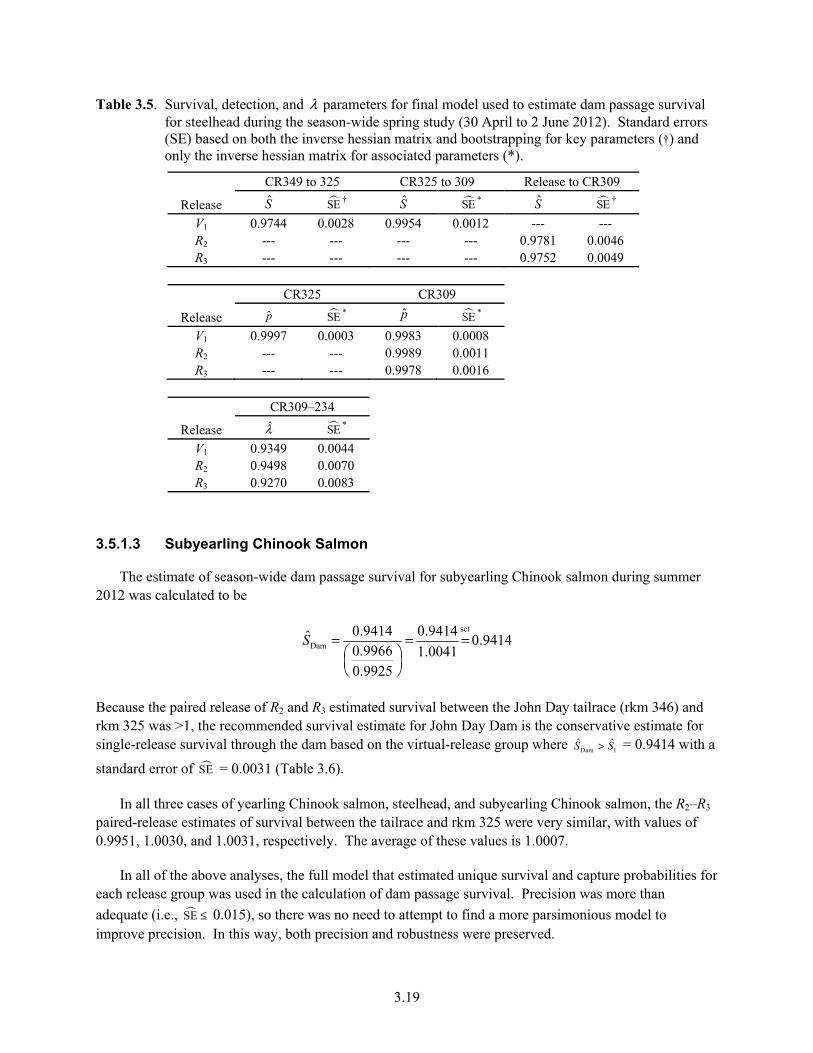
3.19
Table 3.5. Survival, detection, and λ parameters for final model used to estimate dam passage survival for steelhead during the season-wide spring study (30 April to 2 June 2012). Standard errors (SE) based on both the inverse hessian matrix and bootstrapping for key parameters (†) and only the inverse hessian matrix for associated parameters (*).
Release
CR349 to 325 CR325 to 309 Release to CR309
S SE † S SE * S SE †
V1 0.9744 0.0028 0.9954 0.0012 --- --- R2 --- --- --- --- 0.9781 0.0046 R3 --- --- --- --- 0.9752 0.0049
Release
CR325 CR309
p SE * p SE *
V1 0.9997 0.0003 0.9983 0.0008 R2 --- --- 0.9989 0.0011 R3 --- --- 0.9978 0.0016
Release
CR309–234
λ SE *
V1 0.9349 0.0044 R2 0.9498 0.0070 R3 0.9270 0.0083
3.5.1.3 Subyearling Chinook Salmon
The estimate of season-wide dam passage survival for subyearling Chinook salmon during summer 2012 was calculated to be
set
Dam
0.9414 0.9414ˆ 0.94140.9966 1.00410.9925
S = = =
Because the paired release of R2 and R3 estimated survival between the John Day tailrace (rkm 346) and rkm 325 was >1, the recommended survival estimate for John Day Dam is the conservative estimate for single-release survival through the dam based on the virtual-release group where Dam 1
ˆ ˆS S> = 0.9414 with a
standard error of SE = 0.0031 (Table 3.6).
In all three cases of yearling Chinook salmon, steelhead, and subyearling Chinook salmon, the R2–R3 paired-release estimates of survival between the tailrace and rkm 325 were very similar, with values of 0.9951, 1.0030, and 1.0031, respectively. The average of these values is 1.0007.
In all of the above analyses, the full model that estimated unique survival and capture probabilities for each release group was used in the calculation of dam passage survival. Precision was more than
adequate (i.e., SE ≤ 0.015), so there was no need to attempt to find a more parsimonious model to improve precision. In this way, both precision and robustness were preserved.
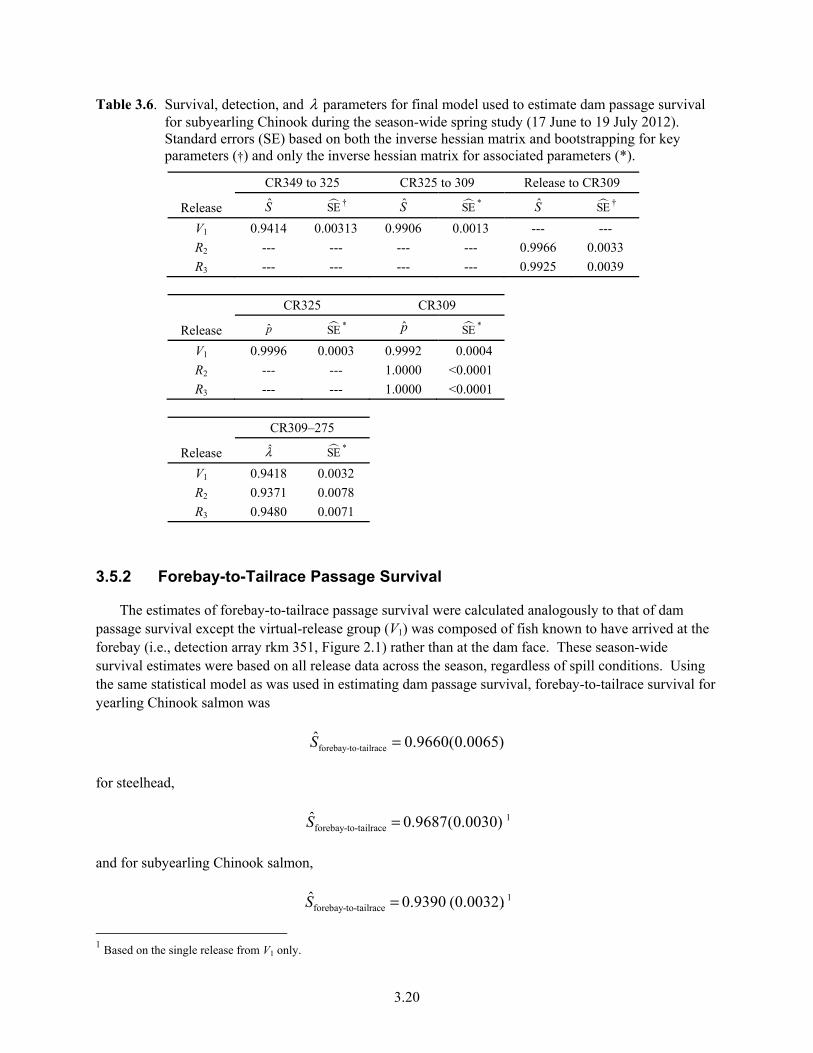
3.20
Table 3.6. Survival, detection, and λ parameters for final model used to estimate dam passage survival for subyearling Chinook during the season-wide spring study (17 June to 19 July 2012). Standard errors (SE) based on both the inverse hessian matrix and bootstrapping for key parameters (†) and only the inverse hessian matrix for associated parameters (*).
Release
CR349 to 325 CR325 to 309 Release to CR309
S SE † S SE * S SE †
V1 0.9414 0.00313 0.9906 0.0013 --- ---
R2 --- --- --- --- 0.9966 0.0033
R3 --- --- --- --- 0.9925 0.0039
Release
CR325 CR309
p SE * p SE *
V1 0.9996 0.0003 0.9992 0.0004
R2 --- --- 1.0000 <0.0001
R3 --- --- 1.0000 <0.0001
Release
CR309–275
λ SE *
V1 0.9418 0.0032
R2 0.9371 0.0078
R3 0.9480 0.0071
3.5.2 Forebay-to-Tailrace Passage Survival
The estimates of forebay-to-tailrace passage survival were calculated analogously to that of dam passage survival except the virtual-release group (V1) was composed of fish known to have arrived at the forebay (i.e., detection array rkm 351, Figure 2.1) rather than at the dam face. These season-wide survival estimates were based on all release data across the season, regardless of spill conditions. Using the same statistical model as was used in estimating dam passage survival, forebay-to-tailrace survival for yearling Chinook salmon was
forebay-to-tailraceˆ 0.9660(0.0065)S =
for steelhead,
forebay-to-tailraceˆ 0.9687(0.0030)S = 1
and for subyearling Chinook salmon,
forebay-to-tailraceˆ 0.9390 (0.0032).S = 1
1 Based on the single release from V1 only.

3.21
3.5.3 Forebay Residence Time
The forebay residence time was calculated from the first detection at the forebay BRZ array to the last detection at the dam (2 rkm). For yearling Chinook salmon, the mean forebay residence time was
estimated to be 2.50 h ( SE = 0.14), for steelhead it was estimated to be 5.79 h ( SE = 0.33), and for
subyearling Chinook salmon it was estimated to be 2.91 h ( SE = 0.26) (Figure 3.15, Table 3.7). The distribution of forebay residence times indicates the modes were 1.0 h for yearling Chinook salmon, 1.5 h for steelhead, and 1.0 h for subyearling Chinook salmon. Median residence times were 1.15 h, 2.39 h, and 1.02 h for yearling Chinook salmon, steelhead, and subyearling Chinook salmon, respectively (Table 3.7).
3.5.4 Tailrace Egress Time
The tailrace egress time was calculated based on the time from the last detection of fish at the double array at the face of John Day Dam to the last detection at the BRZ tailrace array (Figure 3.16). Mean
tailrace egress time for yearling Chinook salmon was estimated to be t = 2.80 h ( SE = 0.28). For
juvenile steelhead, mean tailrace egress time was estimated to be t = 6.22 h ( SE = 0.48). Mean tailrace
egress time for subyearling Chinook salmon was estimated to be t = 2.95 h ( SE = 0.16). Median egress times were 0.50, 0.46, and 0.48 h for yearling Chinook salmon, steelhead, and subyearling Chinook salmon, respectively (Table 3.7). The distribution of tailrace egress times indicates the modes were 0.5 h for yearling Chinook salmon, steelhead, and subyearling Chinook salmon (Figure 3.16).
3.5.5 Spill Passage Efficiency
Spill passage efficiency is defined as the fraction of the fish that passed through a hydroproject by the spillway, including the temporary spill weirs. The double-detection array at the face of John Day Dam was used to identify and track fish as they entered the forebay. Given that the combined detection efficiency of double array was 100% for each run of fish passing each route, we were able to use observed counts of fish entering the various routes at John Day Dam to estimate SPE based on a binomial sampling model. For yearling Chinook salmon, SPE = 0.7456 (0.0075); for juvenile steelhead, SPE = 0.7452 (0.0076); and for subyearling Chinook salmon, SPE = 0.6962 (0.0061).
3.5.6 Fish Passage Efficiency
Fish passage efficiency, called SPE in the Fish Accords, is the fraction of the fish that passed through non-turbine routes at the dam. As with SPE, the double-detection array at the face of John Day Dam was used to identify and track fish as they entered the dam. Given 100% combined detection efficiency by the double array for each route and run of fish, we were able to use observed counts of fish entering the various routes at John Day Dam were used to estimate FPE based on a binomial sampling model. For yearling Chinook salmon at John Day Dam in 2012, FPE is estimated to be FPE = 0.9272 (0.0045); for juvenile steelhead, FPE = 0.9695 (0.0030); and for subyearling Chinook salmon, FPE = 0.8585 (0.0046).
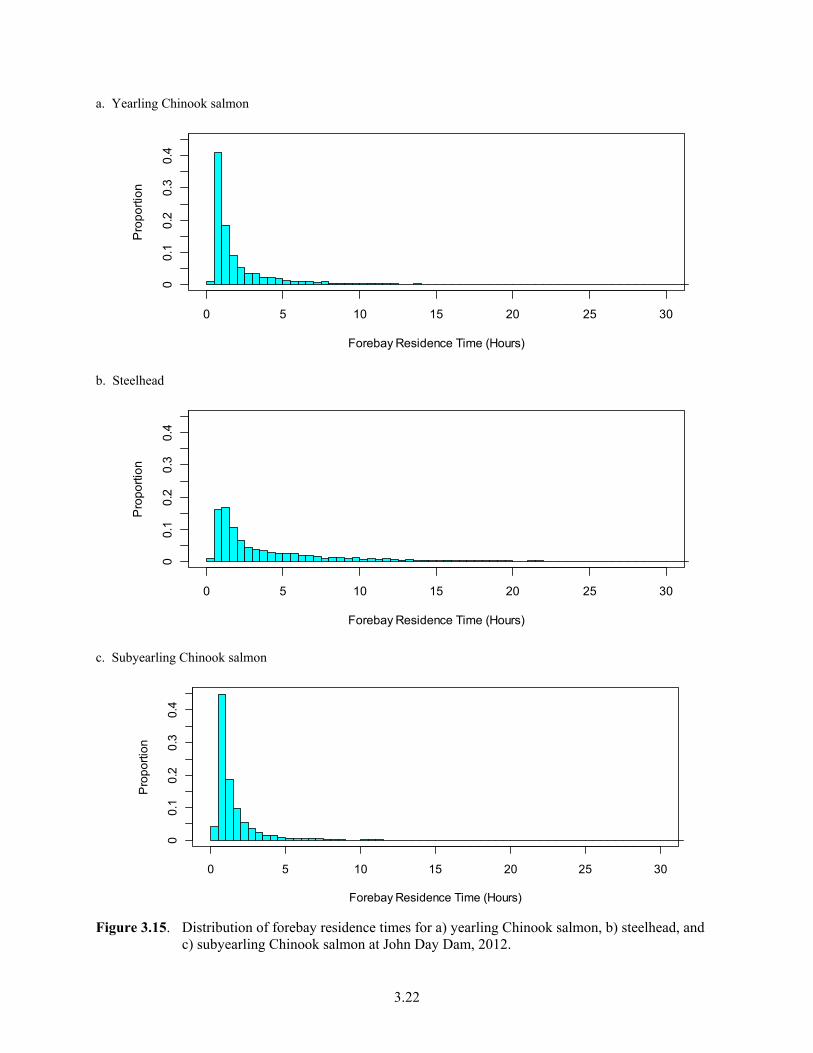
3.22
a. Yearling Chinook salmon
b. Steelhead
c. Subyearling Chinook salmon
Figure 3.15. Distribution of forebay residence times for a) yearling Chinook salmon, b) steelhead, and c) subyearling Chinook salmon at John Day Dam, 2012.
Forebay Residence Time (Hours)
Pro
po
rtio
n
0 5 10 15 20 25 30
00
.10
.20
.30
.4
Forebay Residence Time (Hours)
Pro
po
rtio
n
0 5 10 15 20 25 30
00
.10
.20
.30
.4
Forebay Residence Time (Hours)
Pro
po
rtio
n
0 5 10 15 20 25 30
00
.10
.20
.30
.4
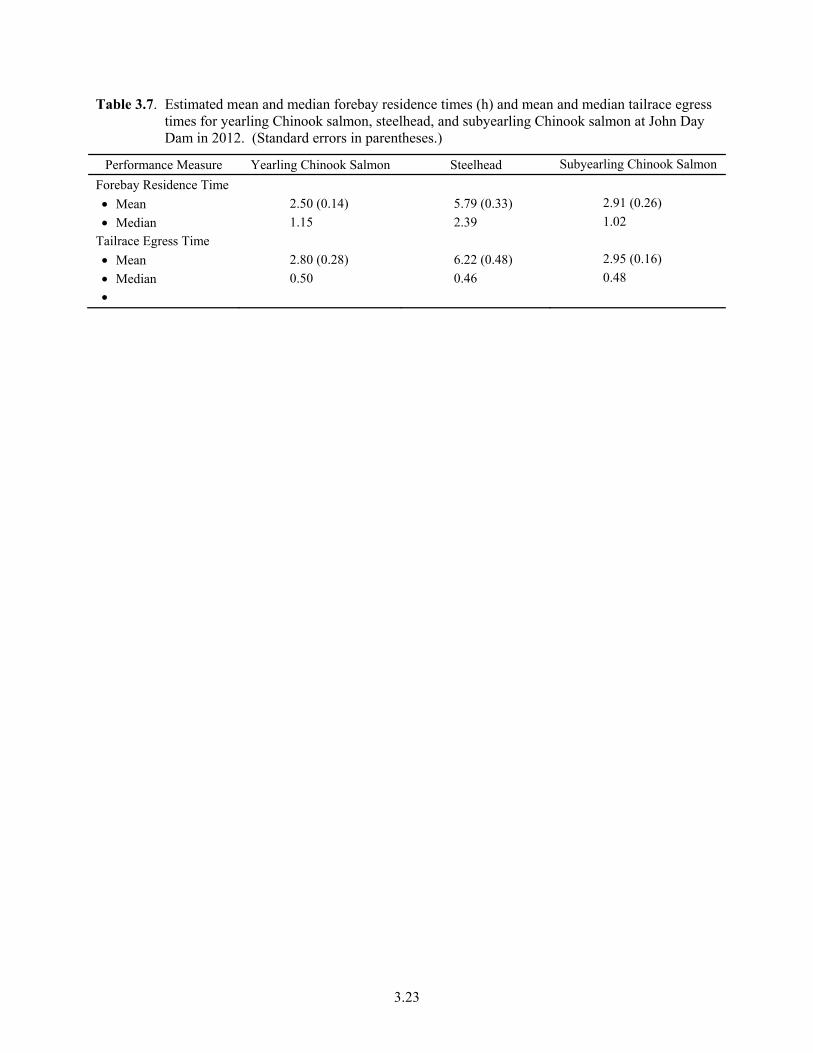
3.23
Table 3.7. Estimated mean and median forebay residence times (h) and mean and median tailrace egress times for yearling Chinook salmon, steelhead, and subyearling Chinook salmon at John Day Dam in 2012. (Standard errors in parentheses.)
Performance Measure Yearling Chinook Salmon Steelhead Subyearling Chinook Salmon
Forebay Residence Time
• Mean 2.50 (0.14) 5.79 (0.33) 2.91 (0.26)
• Median 1.15 2.39 1.02
Tailrace Egress Time
• Mean 2.80 (0.28) 6.22 (0.48) 2.95 (0.16)
• Median 0.50 0.46 0.48
•
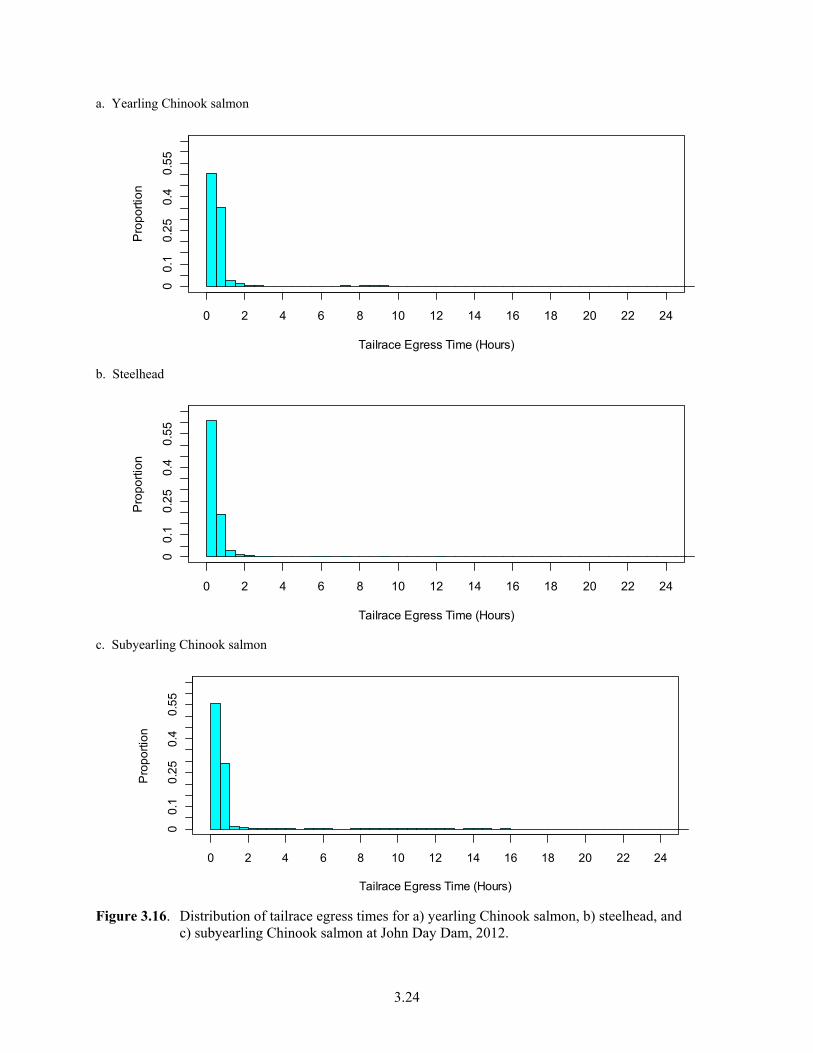
3.24
a. Yearling Chinook salmon
b. Steelhead
c. Subyearling Chinook salmon
Figure 3.16. Distribution of tailrace egress times for a) yearling Chinook salmon, b) steelhead, and c) subyearling Chinook salmon at John Day Dam, 2012.
Tailrace Egress Time (Hours)
Pro
po
rtio
n
0 2 4 6 8 10 12 14 16 18 20 22 24
00
.10
.25
0.4
0.5
5
Tailrace Egress Time (Hours)
Pro
po
rtio
n
0 2 4 6 8 10 12 14 16 18 20 22 24
00
.10
.25
0.4
0.5
5
Tailrace Egress Time (Hours)
Pro
po
rtio
n
0 2 4 6 8 10 12 14 16 18 20 22 24
00
.10
.25
0.4
0.5
5
4.1
4.0 Discussion
The discussion describes the conduct of the 2012 study, study performance, and compares the 2012 estimates with compliance results in 2011 at John Day Dam.
4.1 Study Conduct
The many tests of assumptions (Appendix A) found the acoustic-tag study achieved good downstream mixing, with adequate tag life and no evidence of adverse tagger effects. There was no evidence that delayed tagging/handling effects were present that might affect the performance of the V1 release at the face of the dam. These results suggest the assumptions of the virtual/paired-release model were fulfilled, permitting valid estimation of dam passage survival and related parameters.
Despite not being able to compare compliance under 30% and 40% spill conditions, the season-wide estimates of dam passage survival in 2012 for yearling and subyearling Chinook salmon and steelhead met the 2008 BiOp standards for point estimates and adequate precision.
4.2 Study Performance
The 2012 spring and summer compliance studies at John Day Dam were interrupted by high flow conditions that precluded conducting the 30% and 40% spill blocks. Early parts of the season were slightly above 40%, while the remainder of the spring and summer studies fluctuated between 30–40% (Figure 3.1). No attempt was made to tease out days near the 30% and 40% spill targets. Instead, a single season-wide estimate of dam passage survival was calculated for each fish stock.
Results of the compliance studies suggest that BiOp survival standards at John Day Dam can be met under prevailing conditions with spills in the range of 30–40%. Ultimate acceptance of the 2012 study results at John Day Dam will depend on whether the fisheries community considers the 2012 flow and spill conditions to be nominal.
4.3 Summary of Compliance Study Results
The compliance studies in 2012 were the second year of investigations at John Day Dam. During 2011, the first year of investigations, compliance studies were conducted in spring on yearling Chinook salmon and steelhead. To date, five compliance studies have been performed at John Day Dam (Table 4.1). There have now been two compliance studies of yearling Chinook salmon and steelhead and one study of subyearling Chinook salmon. All five studies met the 2008 BiOp standards for dam passage survival and associated standard errors.

4.2
Table 4.1. Summary of estimates of dam passage survival at John Day Dam from the 2011 and 2012 JSATS compliance studies. (Standard errors in parentheses.)
Fish Stock
Year of Study
2011 2012
Yearling Chinook Salmon 0.9678 (0.0071) 0.9673 (0.0065)
Steelhead 0.9867 (0.0061) 0.9744 (0.0028)
Subyearling Chinook Salmon 0.9414 (0.0031)

5.1
5.0 References
3 Treaty Tribes-Action Agencies. 2008. Memorandum of Agreement Among the Umatilla, Warm Springs and Yakama Tribes, Bonneville Power Administration, U.S. Army Corps of Engineers, and U.S. Bureau of Reclamation, Portland, Oregon, April 4, 2008. Available at http://www.salmonrecovery.gov/Files/BiologicalOpinions/3-tribe-AA-MOA-Final.pdf.
Burnham KP, DR Anderson, GC White, C Brownie, and KH Pollock. 1987. “Design and analysis methods for fish survival experiments based on release-recapture.” American Fisheries Society Monograph 5.
CBSPSC (Columbia Basin Surgical Protocol Steering Committee). 2011. Surgical Protocols for Implanting JSATS Transmitters into Juvenile Salmonids for Studies Conducted for the U.S. Army Corps of Engineers. V1, 21 pp. U.S. Army Corps of Engineers, Portland District, Portland, Oregon.
Elandt-Johnson RC, and NL Johnson. 1980. Survival Models and Data Analysis. Wiley, New York.
Li T and JJ Anderson. 2009. “The vitality model: A way to understand population survival and demographic heterogeneity.” Theoretical Population Biology 76:118–131.
Martinson R, G Kovalchuk, and D Ballinger. 2006. Monitoring of Downstream Salmon and Steelhead at Federal Hydroelectric Facilities. 2005–2006 Annual Report, Project No. 198712700, BPA Report DOE/BP-00022085-2, Portland, Oregon.
NMFS (National Marine Fisheries Service). 2008. Biological Opinion – Consultation on Remand for Operation of the Federal Columbia River Power System, 11 Bureau of Reclamation Projects in the Columbia Basin and ESA Section 10(a)(1)(A) Permit for Juvenile Fish Transportation Program. National Marine Fisheries Service (NOAA Fisheries) – Northwest Region, Seattle, Washington. Available at: http://www.salmonrecovery.gov/.
Seber GAF. 1982. The Estimation of Animal Abundance. MacMillan, New York.
Skalski JR, GE Johnson, and TJ Carlson. 2010a. Compliance Monitoring of Juvenile Yearling Chinook Salmon and Steelhead Survival and Passage at The Dalles Dam, Spring 2010. PNNL-19819, summary report submitted to the U.S. Army Corps of Engineers, Portland District, Portland, Oregon, by Pacific Northwest National Laboratory, Richland, Washington.
Skalski JR, RL Townsend, TW Steig, and S Hemstrom. 2010b. “Comparison of two alternative approaches for estimating dam passage survival using acoustic-tagged sockeye salmon smolts.” North American Journal of Fisheries Management 30:831–839.
Townsend RL, JR Skalski, P Dillingham, and TW Steig. 2006. “Correcting bias in survival estimation resulting from tag failure in acoustic and radiotelemetry studies.” Journal of Agricultural Biology and Environmental Statistics 11(2):183–196.

5.2
Weiland MA, GR Ploskey, JS Hughes, and fifteen co-authors. 2009. Acoustic Telemetry Evaluation of Juvenile Salmonid Passage and Survival at John Day Dam with Emphasis on the Prototype Surface Flow Outlet, 2008. PNNL-18890, final report submitted to the U.S. Army Corps of Engineers, Portland District, Portland, Oregon, by Pacific Northwest National Laboratory, Richland, Washington.
Weiland MA, GR Ploskey, JS Hughes, and sixteen coauthors. 2011. Acoustic Telemetry Evaluation of Juvenile Salmonid Passage and Survival Proportions at John Day Dam, 2009. PNNL-20766, final report submitted to the U.S. Army Corps of Engineers, Portland District, Portland, Oregon, by Pacific Northwest National Laboratory, Richland, Washington.
Weiland MA, GR Ploskey, CM Woodley, and twenty-three coauthors. 2013. Acoustic Telemetry Evaluation of Juvenile Salmonid Passage and Survival at John Day Dam, 2010. Draft Technical Report submitted to the U.S. Army Corps of Engineers, Portland District, Portland, Oregon, by Pacific Northwest National Laboratory, Richland, Washington.

Appendix A –
Tests of Assumptions

A.1
Appendix A
Test of Assumptions
A.1 Tagger Effects
A.1.1 Spring Study
Data from all five release locations in the two-dam study were examined for tagger effects. This was done to maximize the statistical power to detect tagger effects that might have influenced either or both of the McNary and John Day dam studies.
To minimize any tagger effects that might go undetected, tagger effort should be balanced across release locations and within replicates. A total of eight taggers participated in tagging the yearling Chinook salmon and steelhead during the spring study. Tagger effort was found to be balanced across the
five release locations regardless of whether the data were pooled across species ( )( )228 7.8016 0.9999 ,P χ ≥ =
or analyzed separately for yearling Chinook salmon ( )( )228 4.3024 1P χ ≥ ≈ or steelhead ( )( )2
28 5.1934 1P χ ≥ ≈
(Table A.1).
Tagger effort was examined within each of the 32 replicate releases conducted over the course of the spring study (Table A.2, Table A.3). Tagger effort was found to be balanced within replicates 1, 5, 9, 13, 17, 21, 25, and 29 ( )1P ≈ . To accommodate staff time off during the month-long study, tagger effort was conditionally balanced within the individual project releases (i.e., R1–R3, R4–R5) (Table A.2, Table A.3) for the remainder of the replicate release groups. This conditional and unconditional balance within replicates is the reason for the overall balance observed in Table A.1.
To test for tagger effects, reach survivals and cumulative survivals were calculated for fish tagged by different staff members based on release location (i.e., R1, …, R5) and species (Table A.4). Of the 38 tests of homogeneous reach survivals, 6 were found to be significant at α = 0.10 (i.e., 15.8%). By chance alone, one might expect 10% of the 38 tests (i.e., 4) to be significant at α = 0.10 when no effect exists. Similarly, we found 11 of 38 tests of homogeneous cumulative survival to be significant at α = 0.10 (i.e., 28.9%). The percentages of rejections are higher than one might expect to see, but detailed examination of the data indicates no particular pattern to the results. No particular tagger had fish with consistently lower survivals. All taggers had fish releases with the highest and lowest reach survivals. For some unknown reason, there is more heterogeneity among the survival estimates across taggers than expected by binomial change alone, but no identifiable below average taggers were observed. For this reason, all fish tagged by all taggers were included in the subsequent survival analyses.

A.2
Table A.1. Numbers of yearling Chinook salmon and steelhead tagged by each staff member by release location (i.e., R1, R2, ...). Chi-square tests of homogeneity were not significant for a) yearling Chinook salmon or b) steelhead.
a. Combined yearling Chinook salmon and steelhead
Release A B C D E F G H P-value R1_CR503 457 297 348 358 288 286 293 472 R2_CR468 361 257 309 309 248 258 249 406 R3_CR422 357 258 311 310 235 262 253 412 R4_CR346 310 222 247 258 190 227 209 334 R5_CR325 306 223 238 259 199 231 207 332 Chi-square = 7.8016 df = 28 0.9999
b. Yearling Chinook salmon
Release A B C D E F G H P-value R1_CR503 225 152 172 179 141 145 145 240 R2_CR468 182 129 155 155 122 127 121 207 R3_CR422 180 131 157 154 116 131 126 205 R4_CR346 153 112 124 129 94 113 102 170 R5_CR325 146 115 115 131 101 115 102 170 Chi-square = 4.3024 df = 28 1
c. Steelhead
Release A B C D E F G H P-value R1_CR503 232 145 176 179 147 141 148 232 R2_CR468 179 128 154 154 126 131 128 199 R3_CR422 177 127 154 156 119 131 127 207 R4_CR346 157 110 123 129 96 114 107 164 R5_CR325 160 108 123 128 98 116 105 162 Chi-square = 5.1934 df = 28 1
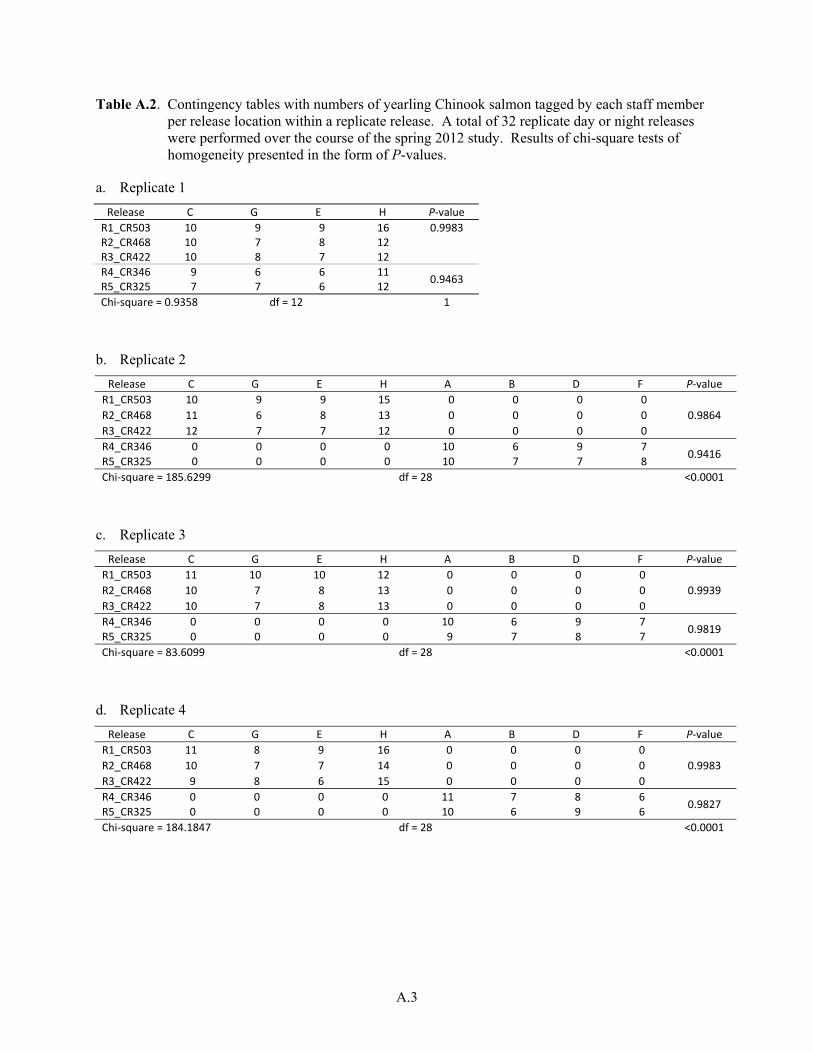
A.3
Table A.2. Contingency tables with numbers of yearling Chinook salmon tagged by each staff member per release location within a replicate release. A total of 32 replicate day or night releases were performed over the course of the spring 2012 study. Results of chi-square tests of homogeneity presented in the form of P-values.
a. Replicate 1
Release C G E H P-value R1_CR503 10 9 9 16 0.9983 R2_CR468 10 7 8 12 R3_CR422 10 8 7 12 R4_CR346 9 6 6 11 0.9463 R5_CR325 7 7 6 12 Chi-square = 0.9358 df = 12 1
b. Replicate 2
Release C G E H A B D F P-value R1_CR503 10 9 9 15 0 0 0 0
0.9864 R2_CR468 11 6 8 13 0 0 0 0 R3_CR422 12 7 7 12 0 0 0 0 R4_CR346 0 0 0 0 10 6 9 7 0.9416 R5_CR325 0 0 0 0 10 7 7 8 Chi-square = 185.6299 df = 28 <0.0001
c. Replicate 3
Release C G E H A B D F P-value R1_CR503 11 10 10 12 0 0 0 0
0.9939 R2_CR468 10 7 8 13 0 0 0 0 R3_CR422 10 7 8 13 0 0 0 0 R4_CR346 0 0 0 0 10 6 9 7 0.9819 R5_CR325 0 0 0 0 9 7 8 7 Chi-square = 83.6099 df = 28 <0.0001
d. Replicate 4
Release C G E H A B D F P-value R1_CR503 11 8 9 16 0 0 0 0
0.9983 R2_CR468 10 7 7 14 0 0 0 0 R3_CR422 9 8 6 15 0 0 0 0 R4_CR346 0 0 0 0 11 7 8 6 0.9827 R5_CR325 0 0 0 0 10 6 9 6 Chi-square = 184.1847 df = 28 <0.0001
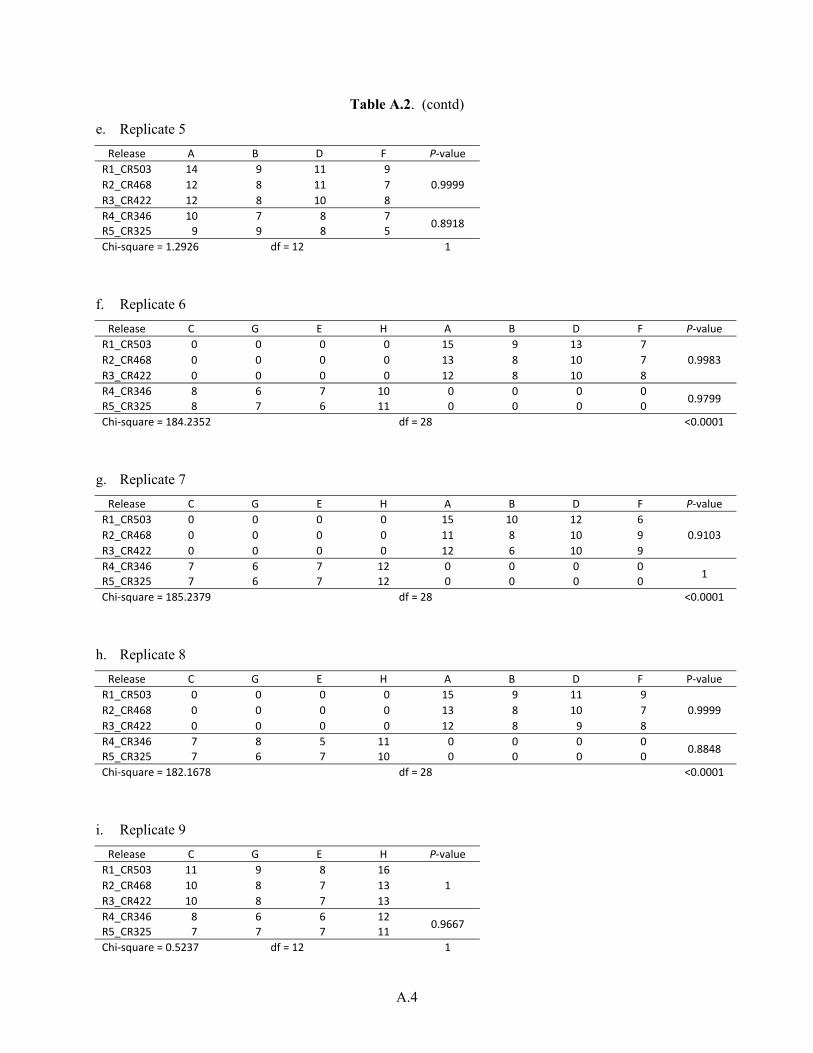
A.4
Table A.2. (contd)
e. Replicate 5
Release A B D F P-value R1_CR503 14 9 11 9
0.9999 R2_CR468 12 8 11 7 R3_CR422 12 8 10 8 R4_CR346 10 7 8 7 0.8918 R5_CR325 9 9 8 5 Chi-square = 1.2926 df = 12 1
f. Replicate 6
Release C G E H A B D F P-value R1_CR503 0 0 0 0 15 9 13 7
0.9983 R2_CR468 0 0 0 0 13 8 10 7 R3_CR422 0 0 0 0 12 8 10 8 R4_CR346 8 6 7 10 0 0 0 0 0.9799 R5_CR325 8 7 6 11 0 0 0 0 Chi-square = 184.2352 df = 28 <0.0001
g. Replicate 7
Release C G E H A B D F P-value R1_CR503 0 0 0 0 15 10 12 6
0.9103 R2_CR468 0 0 0 0 11 8 10 9 R3_CR422 0 0 0 0 12 6 10 9 R4_CR346 7 6 7 12 0 0 0 0 1 R5_CR325 7 6 7 12 0 0 0 0 Chi-square = 185.2379 df = 28 <0.0001
h. Replicate 8
Release C G E H A B D F P-value R1_CR503 0 0 0 0 15 9 11 9
0.9999 R2_CR468 0 0 0 0 13 8 10 7 R3_CR422 0 0 0 0 12 8 9 8 R4_CR346 7 8 5 11 0 0 0 0 0.8848 R5_CR325 7 6 7 10 0 0 0 0 Chi-square = 182.1678 df = 28 <0.0001
i. Replicate 9
Release C G E H P-value R1_CR503 11 9 8 16
1 R2_CR468 10 8 7 13 R3_CR422 10 8 7 13 R4_CR346 8 6 6 12 0.9667 R5_CR325 7 7 7 11 Chi-square = 0.5237 df = 12 1

A.5
Table A.2. (contd)
j. Replicate 10
Release C G E H A B D F P-value R1_CR503 11 9 9 14 0 0 0 0
0.9986 R2_CR468 10 6 8 14 0 0 0 0 R3_CR422 9 7 8 13 0 0 0 0 R4_CR346 0 0 0 0 11 6 8 7 0.9532 R5_CR325 0 0 0 0 9 7 9 7 Chi-square = 183.6209 df = 28 <0.0001
k. Replicate 11
Release C G E H A B D F P-value R1_CR503 10 8 10 16 0 0 0 0
0.9633 R2_CR468 11 9 6 12 0 0 0 0 R3_CR422 9 7 8 14 0 0 0 0 R4_CR346 0 0 0 0 9 7 9 7 0.9861 R5_CR325 0 0 0 0 9 6 9 8 Chi-square = 186.6222 df = 28 <0.0001
l. Replicate 12
Release C G E H A B D F P-value R1_CR503 10 9 7 17 0 0 0 0
0.9903 R2_CR468 9 9 8 12 0 0 0 0 R3_CR422 8 9 8 13 0 0 0 0 R4_CR346 0 0 0 0 10 7 7 8
0.8837 R5_CR325 0 0 0 0 9 8 9 6
Chi-square = 186.2008 df = 28 <0.0001
m. Replicate 13
Release A B D F P-value R1_CR503 15 9 10 9
0.9966 R2_CR468 13 7 10 8 R3_CR422 11 8 11 8 R4_CR346 9 8 8 7 0.9970 R5_CR325 9 8 7 7
Chi-square = 1.5055 df = 12 0.9999
n. Replicate 14
Release C G E H A B D F P-value R1_CR503 0 0 0 0 14 9 11 9
1 R2_CR468 0 0 0 0 12 8 10 8 R3_CR422 0 0 0 0 12 8 10 8 R4_CR346 8 7 6 11 0 0 0 0 0.9861 R5_CR325 7 7 7 11 0 0 0 0 Chi-square = 183.4326 df = 28 <0.0001

A.6
Table A.2. (contd)
o. Replicate 15
Release C G E H A B D F P-value R1_CR503 0 0 0 0 15 9 10 9
0.9918 R2_CR468 0 0 0 0 11 8 10 9 R3_CR422 0 0 0 0 11 10 9 8 R4_CR346 9 7 7 9 0 0 0 0 0.9532 R5_CR325 8 7 6 11 0 0 0 0 Chi-square = 185.2049 df = 28 <0.0001
p. Replicate 16
Release C G E H A B D F P-value R1_CR503 0 0 0 0 16 9 11 8
0.9881 R2_CR468 0 0 0 0 10 9 10 8 R3_CR422 0 0 0 0 12 9 9 8 R4_CR346 8 6 6 12 0 0 0 0 0.9532 R5_CR325 8 7 7 10 0 0 0 0 Chi-square = 185.3927 df = 28 <0.0001
q. Replicate 17
Release C G E H P-value R1_CR503 11 9 9 15
0.9957 R2_CR468 9 8 9 11 R3_CR422 10 9 7 11 R4_CR346 9 6 6 11 0.9872 R5_CR325 8 6 7 11 Chi-square = 1.1469 df = 12 1
r. Replicate 18
Release C G E H A B D F P-value R1_CR503 11 10 7 15 0 0 0 0
0.9945 R2_CR468 10 8 8 12 0 0 0 0 R3_CR422 11 8 8 11 0 0 0 0 R4_CR346 0 0 0 0 10 7 8 7 0.9493 R5_CR325 0 0 0 0 8 8 8 8 Chi-square = 185.0954 df = 28 <0.0001
s. Replicate 19
Release C G E H A B D F P-value R1_CR503 11 9 9 14 0 0 0 0
0.9985 R2_CR468 10 6 8 13 0 0 0 0 R3_CR422 9 7 8 14 0 0 0 0 R4_CR346 0 0 0 0 8 9 7 7 0.8110 R5_CR325 0 0 0 0 9 6 9 8 Chi-square = 184.4256 df = 28 <0.0001
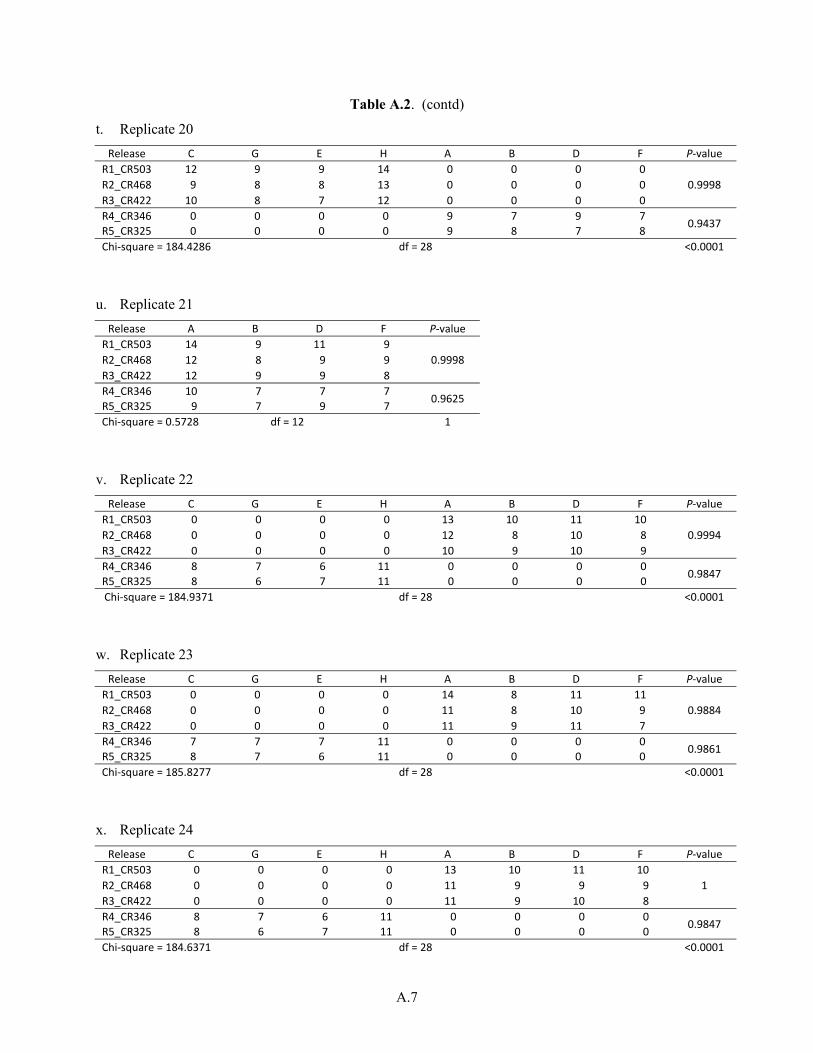
A.7
Table A.2. (contd)
t. Replicate 20
Release C G E H A B D F P-value R1_CR503 12 9 9 14 0 0 0 0
0.9998 R2_CR468 9 8 8 13 0 0 0 0 R3_CR422 10 8 7 12 0 0 0 0 R4_CR346 0 0 0 0 9 7 9 7 0.9437 R5_CR325 0 0 0 0 9 8 7 8 Chi-square = 184.4286 df = 28 <0.0001
u. Replicate 21
Release A B D F P-value R1_CR503 14 9 11 9
0.9998 R2_CR468 12 8 9 9 R3_CR422 12 9 9 8 R4_CR346 10 7 7 7 0.9625 R5_CR325 9 7 9 7 Chi-square = 0.5728 df = 12 1
v. Replicate 22
Release C G E H A B D F P-value R1_CR503 0 0 0 0 13 10 11 10
0.9994 R2_CR468 0 0 0 0 12 8 10 8 R3_CR422 0 0 0 0 10 9 10 9 R4_CR346 8 7 6 11 0 0 0 0 0.9847 R5_CR325 8 6 7 11 0 0 0 0 Chi-square = 184.9371 df = 28 <0.0001
w. Replicate 23
Release C G E H A B D F P-value R1_CR503 0 0 0 0 14 8 11 11
0.9884 R2_CR468 0 0 0 0 11 8 10 9 R3_CR422 0 0 0 0 11 9 11 7 R4_CR346 7 7 7 11 0 0 0 0 0.9861 R5_CR325 8 7 6 11 0 0 0 0 Chi-square = 185.8277 df = 28 <0.0001
x. Replicate 24
Release C G E H A B D F P-value R1_CR503 0 0 0 0 13 10 11 10
1 R2_CR468 0 0 0 0 11 9 9 9 R3_CR422 0 0 0 0 11 9 10 8 R4_CR346 8 7 6 11 0 0 0 0 0.9847 R5_CR325 8 6 7 11 0 0 0 0 Chi-square = 184.6371 df = 28 <0.0001
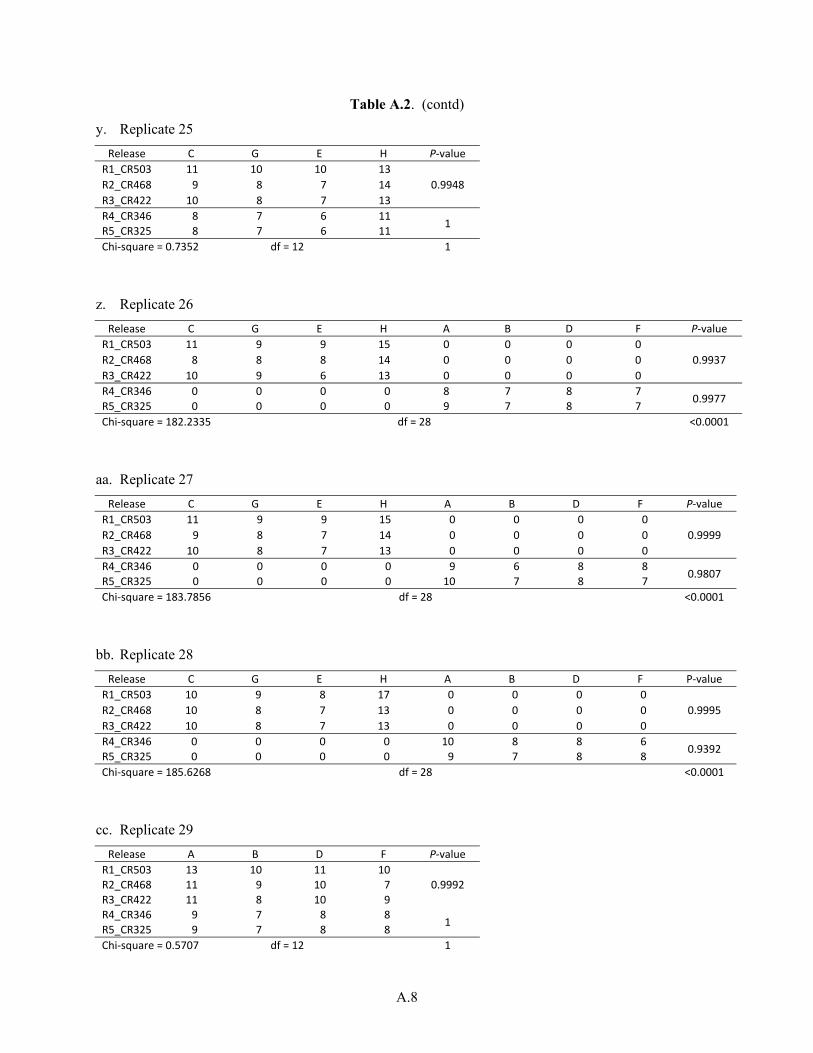
A.8
Table A.2. (contd)
y. Replicate 25
Release C G E H P-value R1_CR503 11 10 10 13
0.9948 R2_CR468 9 8 7 14 R3_CR422 10 8 7 13 R4_CR346 8 7 6 11 1 R5_CR325 8 7 6 11 Chi-square = 0.7352 df = 12 1
z. Replicate 26
Release C G E H A B D F P-value R1_CR503 11 9 9 15 0 0 0 0
0.9937 R2_CR468 8 8 8 14 0 0 0 0 R3_CR422 10 9 6 13 0 0 0 0 R4_CR346 0 0 0 0 8 7 8 7 0.9977 R5_CR325 0 0 0 0 9 7 8 7 Chi-square = 182.2335 df = 28 <0.0001
aa. Replicate 27
Release C G E H A B D F P-value R1_CR503 11 9 9 15 0 0 0 0
0.9999 R2_CR468 9 8 7 14 0 0 0 0 R3_CR422 10 8 7 13 0 0 0 0 R4_CR346 0 0 0 0 9 6 8 8 0.9807 R5_CR325 0 0 0 0 10 7 8 7 Chi-square = 183.7856 df = 28 <0.0001
bb. Replicate 28
Release C G E H A B D F P-value R1_CR503 10 9 8 17 0 0 0 0
0.9995 R2_CR468 10 8 7 13 0 0 0 0 R3_CR422 10 8 7 13 0 0 0 0 R4_CR346 0 0 0 0 10 8 8 6 0.9392 R5_CR325 0 0 0 0 9 7 8 8 Chi-square = 185.6268 df = 28 <0.0001
cc. Replicate 29
Release A B D F P-value R1_CR503 13 10 11 10
0.9992 R2_CR468 11 9 10 7 R3_CR422 11 8 10 9 R4_CR346 9 7 8 8 1 R5_CR325 9 7 8 8 Chi-square = 0.5707 df = 12 1
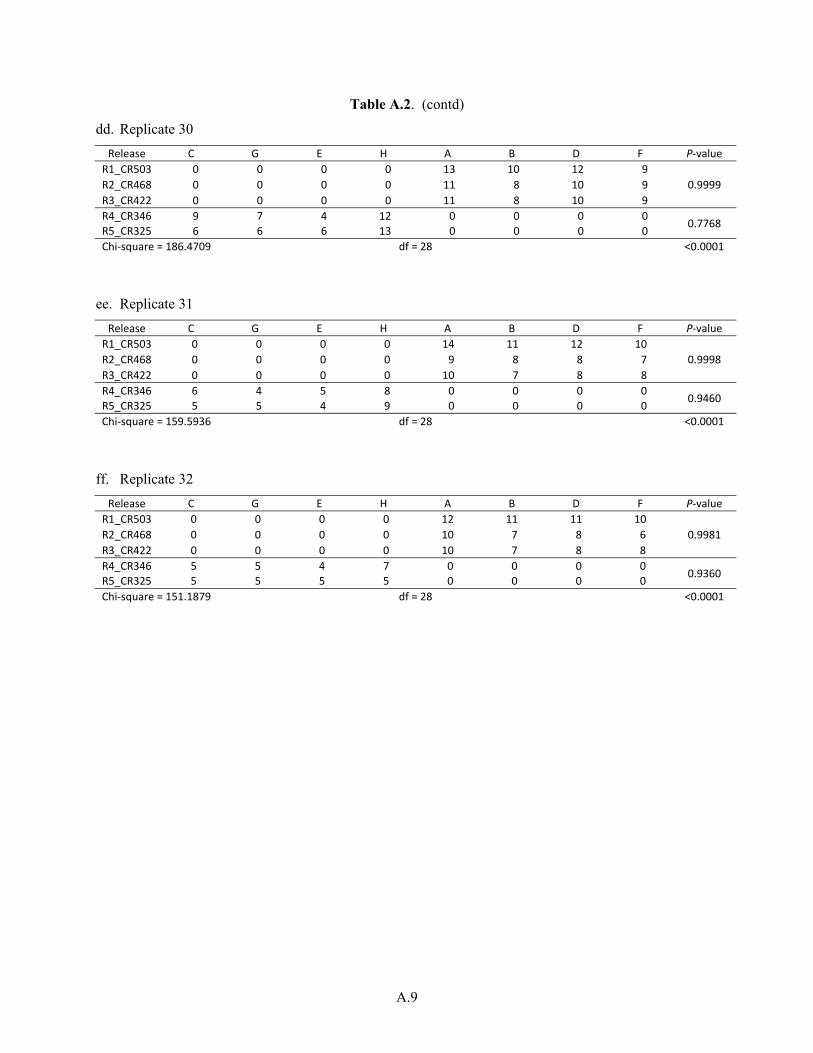
A.9
Table A.2. (contd)
dd. Replicate 30
Release C G E H A B D F P-value R1_CR503 0 0 0 0 13 10 12 9
0.9999 R2_CR468 0 0 0 0 11 8 10 9 R3_CR422 0 0 0 0 11 8 10 9 R4_CR346 9 7 4 12 0 0 0 0 0.7768 R5_CR325 6 6 6 13 0 0 0 0 Chi-square = 186.4709 df = 28 <0.0001
ee. Replicate 31
Release C G E H A B D F P-value R1_CR503 0 0 0 0 14 11 12 10
0.9998 R2_CR468 0 0 0 0 9 8 8 7 R3_CR422 0 0 0 0 10 7 8 8 R4_CR346 6 4 5 8 0 0 0 0 0.9460 R5_CR325 5 5 4 9 0 0 0 0 Chi-square = 159.5936 df = 28 <0.0001
ff. Replicate 32
Release C G E H A B D F P-value R1_CR503 0 0 0 0 12 11 11 10
0.9981 R2_CR468 0 0 0 0 10 7 8 6 R3_CR422 0 0 0 0 10 7 8 8 R4_CR346 5 5 4 7 0 0 0 0 0.9360 R5_CR325 5 5 5 5 0 0 0 0 Chi-square = 151.1879 df = 28 <0.0001

A.10
Table A.3. Contingency tables with numbers of steelhead tagged by each staff member per release location within a replicate release. A total of 32 replicate day or nighttime releases were performed over the course of the spring 2012 study. Results of chi-square tests of homogeneity are presented in the form of P-values.
a. Replicate 1
Release C G E H P-value R1_CR503 11 8 10 15
0.9993 R2_CR468 10 7 8 12 R3_CR422 10 8 7 13 R4_CR346 8 6 7 11
1 R5_CR325 8 6 7 11 Chi-square = 0.3823 df = 12 1
b. Replicate 2
Release C G E H A B D F P-value R1_CR503 10 8 10 16 0 0 0 0
1 R2_CR468 9 7 8 14 0 0 0 0 R3_CR422 9 7 8 14 0 0 0 0 R4_CR346 0 0 0 0 11 7 8 6
0.9872 R5_CR325 0 0 0 0 11 6 9 6 Chi-square = 184.4663 df = 28 <0.0001
c. Replicate 3
Release C G E H A B D F P-value R1_CR503 12 9 11 12 0 0 0 0
0.9600 R2_CR468 9 8 7 14 0 0 0 0 R3_CR422 9 8 7 14 0 0 0 0 R4_CR346 0 0 0 0 11 7 8 6
0.9667 R5_CR325 0 0 0 0 12 6 7 7 Chi-square = 187.048 df = 28 <0.0001
d. Replicate 4
Release C G E H A B D F P-value R1_CR503 11 9 10 14 0 0 0 0
1 R2_CR468 9 8 8 13 0 0 0 0 R3_CR422 9 8 8 13 0 0 0 0 R4_CR346 0 0 0 0 11 6 7 7
0.9970 R5_CR325 0 0 0 0 11 6 8 7 Chi-square = 183.3133 df = 28 <0.0001

A.11
Table A.3. (contd)
e. Replicate 5
Release A B D F P-value R1_CR503 15 8 12 9
0.9985 R2_CR468 12 9 10 7 R3_CR422 12 8 10 8 R4_CR346 11 6 8 6
0.9768 R5_CR325 11 7 7 7 Chi-square = 0.8446 df = 12 1
f. Replicate 6
Release C G E H A B D F P-value R1_CR503 0 0 0 0 15 8 11 9
0.9998 R2_CR468 0 0 0 0 13 8 9 8 R3_CR422 0 0 0 0 13 7 10 7 R4_CR346 9 6 6 11 0 0 0 0
0.9419 R5_CR325 8 6 8 10 0 0 0 0 Chi-square = 183.4433 df = 28 <0.0001
g. Replicate 7
Release C G E H A B D F P-value R1_CR503 0 0 0 0 14 10 11 9
0.9980 R2_CR468 0 0 0 0 12 7 10 9 R3_CR422 0 0 0 0 12 7 11 8 R4_CR346 7 7 6 12 0 0 0 0
0.9906 R5_CR325 8 7 6 11 0 0 0 0 Chi-square = 185.0656 df = 28 <0.0001
h. Replicate 8
Release C G E H A B D F P-value R1_CR503 0 0 0 0 14 9 12 9
0.9999 R2_CR468 0 0 0 0 12 7 11 8 R3_CR422 0 0 0 0 13 7 10 8 R4_CR346 8 7 6 11 0 0 0 0
0.9847 R5_CR325 8 6 7 11 0 0 0 0 Chi-square = 184.6945 df = 28 <0.0001

A.12
Table A.3. (contd)
i. Replicate 9
Release C G E H P-value R1_CR503 11 9 9 15
0.9974 R2_CR468 9 9 8 12 R3_CR422 10 7 7 14 R4_CR346 7 7 6 11
0.9970 R5_CR325 8 7 6 11 Chi-square = 0.6691 df = 12 1
j. Replicate 10
Release C G E H A B D F P-value R1_CR503 11 10 9 14 0 0 0 0
0.9986 R2_CR468 11 8 8 11 0 0 0 0 R3_CR422 9 8 8 13 0 0 0 0 R4_CR346 0 0 0 0 10 7 8 7
1 R5_CR325 0 0 0 0 10 7 8 7 Chi-square = 184.6593 df = 28 <0.0001
k. Replicate 11
Release C G E H A B D F P-value R1_CR503 11 9 9 15 0 0 0 0
0.9974 R2_CR468 10 8 8 12 0 0 0 0 R3_CR422 9 9 6 13 0 0 0 0 R4_CR346 0 0 0 0 11 6 8 7
0.9516 R5_CR325 0 0 0 0 9 7 8 8 Chi-square = 184.8016 df = 28 <0.0001
l. Replicate 12
Release C G E H A B D F P-value R1_CR503 10 10 9 14 0 0 0 0
0.9976 R2_CR468 10 7 8 13 0 0 0 0 R3_CR422 9 7 8 14 0 0 0 0 R4_CR346 0 0 0 0 11 6 8 7
0.9887 R5_CR325 0 0 0 0 10 7 8 7 Chi-square = 184.1484 df = 28 <0.0001
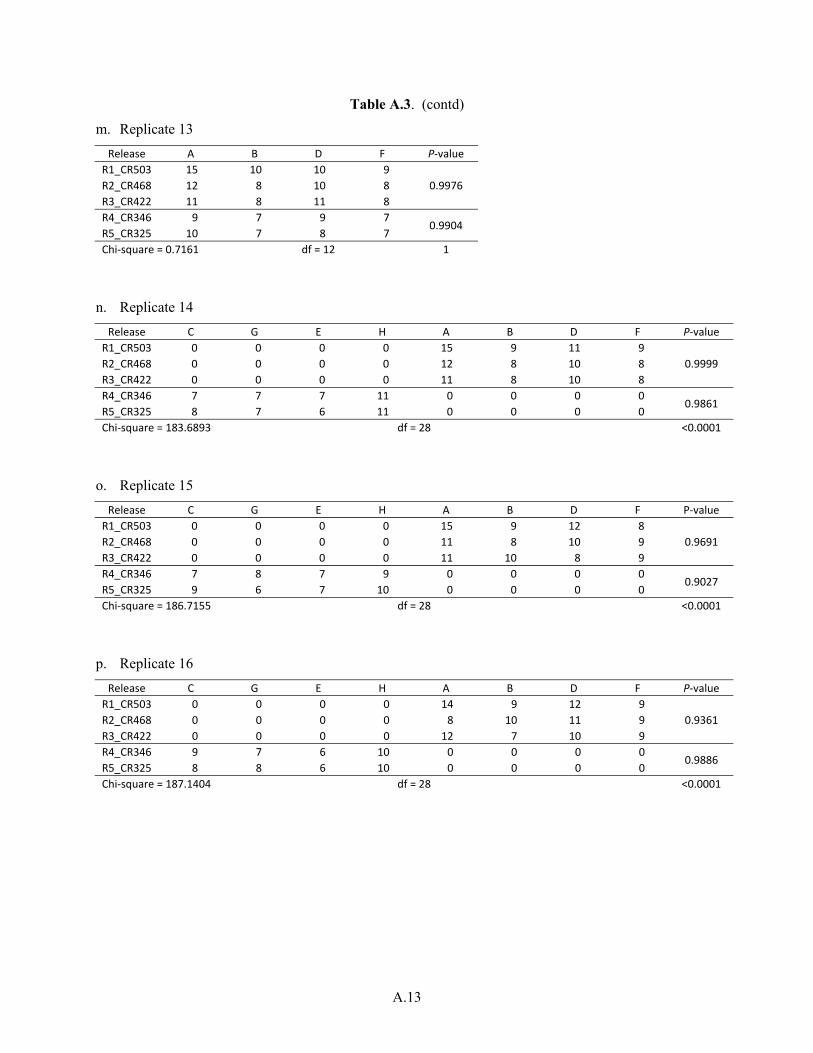
A.13
Table A.3. (contd)
m. Replicate 13
Release A B D F P-value R1_CR503 15 10 10 9
0.9976 R2_CR468 12 8 10 8 R3_CR422 11 8 11 8 R4_CR346 9 7 9 7
0.9904 R5_CR325 10 7 8 7 Chi-square = 0.7161 df = 12 1
n. Replicate 14
Release C G E H A B D F P-value R1_CR503 0 0 0 0 15 9 11 9
0.9999 R2_CR468 0 0 0 0 12 8 10 8 R3_CR422 0 0 0 0 11 8 10 8 R4_CR346 7 7 7 11 0 0 0 0
0.9861 R5_CR325 8 7 6 11 0 0 0 0 Chi-square = 183.6893 df = 28 <0.0001
o. Replicate 15
Release C G E H A B D F P-value R1_CR503 0 0 0 0 15 9 12 8
0.9691 R2_CR468 0 0 0 0 11 8 10 9 R3_CR422 0 0 0 0 11 10 8 9 R4_CR346 7 8 7 9 0 0 0 0
0.9027 R5_CR325 9 6 7 10 0 0 0 0 Chi-square = 186.7155 df = 28 <0.0001
p. Replicate 16
Release C G E H A B D F P-value R1_CR503 0 0 0 0 14 9 12 9
0.9361 R2_CR468 0 0 0 0 8 10 11 9 R3_CR422 0 0 0 0 12 7 10 9 R4_CR346 9 7 6 10 0 0 0 0
0.9886 R5_CR325 8 8 6 10 0 0 0 0 Chi-square = 187.1404 df = 28 <0.0001
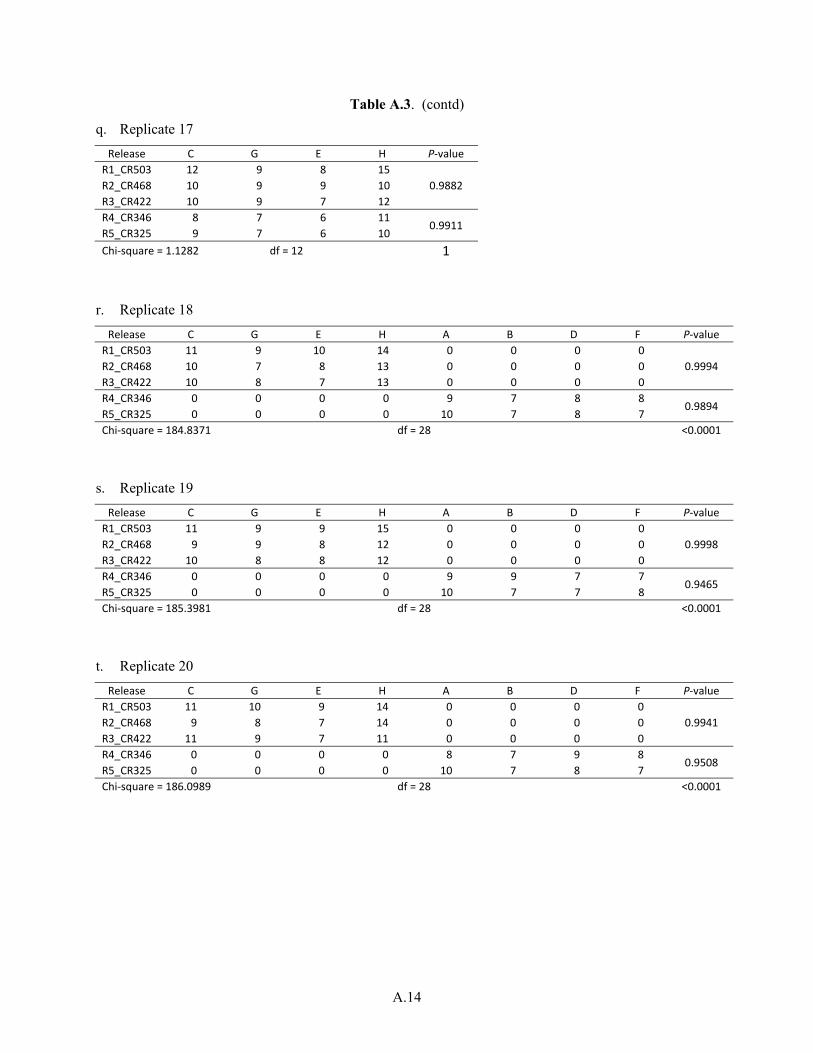
A.14
Table A.3. (contd)
q. Replicate 17
Release C G E H P-value R1_CR503 12 9 8 15
0.9882 R2_CR468 10 9 9 10 R3_CR422 10 9 7 12 R4_CR346 8 7 6 11
0.9911 R5_CR325 9 7 6 10 Chi-square = 1.1282 df = 12 1
r. Replicate 18
Release C G E H A B D F P-value R1_CR503 11 9 10 14 0 0 0 0
0.9994 R2_CR468 10 7 8 13 0 0 0 0 R3_CR422 10 8 7 13 0 0 0 0 R4_CR346 0 0 0 0 9 7 8 8
0.9894 R5_CR325 0 0 0 0 10 7 8 7 Chi-square = 184.8371 df = 28 <0.0001
s. Replicate 19
Release C G E H A B D F P-value R1_CR503 11 9 9 15 0 0 0 0
0.9998 R2_CR468 9 9 8 12 0 0 0 0 R3_CR422 10 8 8 12 0 0 0 0 R4_CR346 0 0 0 0 9 9 7 7
0.9465 R5_CR325 0 0 0 0 10 7 7 8 Chi-square = 185.3981 df = 28 <0.0001
t. Replicate 20
Release C G E H A B D F P-value R1_CR503 11 10 9 14 0 0 0 0
0.9941 R2_CR468 9 8 7 14 0 0 0 0 R3_CR422 11 9 7 11 0 0 0 0 R4_CR346 0 0 0 0 8 7 9 8
0.9508 R5_CR325 0 0 0 0 10 7 8 7 Chi-square = 186.0989 df = 28 <0.0001

A.15
Table A.3. (contd)
u. Replicate 21
Release A B D F P-value R1_CR503 16 9 11 8
0.9925 R2_CR468 11 8 10 8 R3_CR422 11 8 10 9 R4_CR346 10 7 8 7
1 R5_CR325 10 7 8 7 Chi-square = 0.8351 df = 12 1
v. Replicate 22
Release C G E H A B D F P-value R1_CR503 0 0 0 0 15 10 10 9
0.9972 R2_CR468 0 0 0 0 11 8 10 9 R3_CR422 0 0 0 0 11 8 10 9 R4_CR346 9 7 6 10 0 0 0 0
0.9872 R5_CR325 8 7 7 10 0 0 0 0 Chi-square = 185.2304 df = 28 <0.0001
w. Replicate 23
Release C G E H A B D F P-value R1_CR503 0 0 0 0 15 9 11 9
0.9804 R2_CR468 0 0 0 0 11 8 9 10 R3_CR422 0 0 0 0 10 9 11 8 R4_CR346 8 7 6 11 0 0 0 0
0.9901 R5_CR325 8 8 6 10 0 0 0 0 Chi-square = 186.0532 df = 28 <0.0001
x. Replicate 24
Release C G E H A B D F P-value R1_CR503 0 0 0 0 15 9 11 9
0.9948 R2_CR468 0 0 0 0 11 9 10 8 R3_CR422 0 0 0 0 10 9 10 9 R4_CR346 8 7 7 10 0 0 0 0
0.9887 R5_CR325 8 7 6 11 0 0 0 0 Chi-square = 185.4116 df = 28 <0.0001
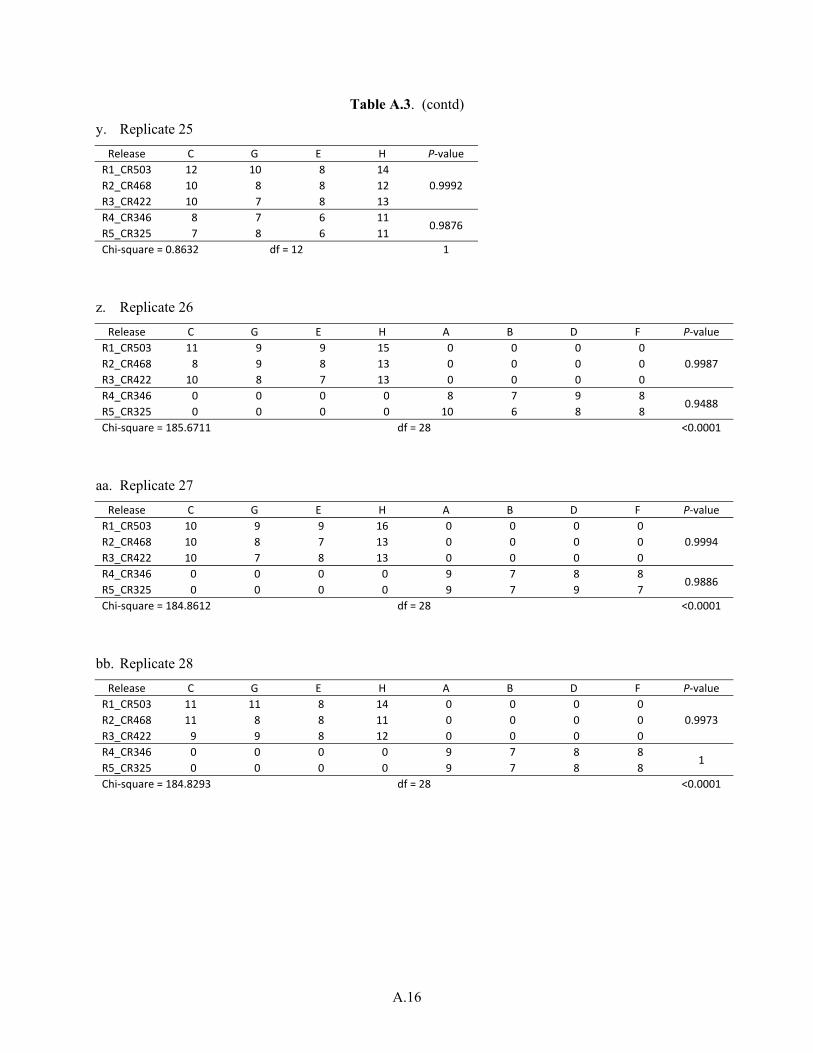
A.16
Table A.3. (contd)
y. Replicate 25
Release C G E H P-value R1_CR503 12 10 8 14
0.9992 R2_CR468 10 8 8 12 R3_CR422 10 7 8 13 R4_CR346 8 7 6 11
0.9876 R5_CR325 7 8 6 11 Chi-square = 0.8632 df = 12 1
z. Replicate 26
Release C G E H A B D F P-value R1_CR503 11 9 9 15 0 0 0 0
0.9987 R2_CR468 8 9 8 13 0 0 0 0 R3_CR422 10 8 7 13 0 0 0 0 R4_CR346 0 0 0 0 8 7 9 8
0.9488 R5_CR325 0 0 0 0 10 6 8 8 Chi-square = 185.6711 df = 28 <0.0001
aa. Replicate 27
Release C G E H A B D F P-value R1_CR503 10 9 9 16 0 0 0 0
0.9994 R2_CR468 10 8 7 13 0 0 0 0 R3_CR422 10 7 8 13 0 0 0 0 R4_CR346 0 0 0 0 9 7 8 8
0.9886 R5_CR325 0 0 0 0 9 7 9 7 Chi-square = 184.8612 df = 28 <0.0001
bb. Replicate 28
Release C G E H A B D F P-value R1_CR503 11 11 8 14 0 0 0 0
0.9973 R2_CR468 11 8 8 11 0 0 0 0 R3_CR422 9 9 8 12 0 0 0 0 R4_CR346 0 0 0 0 9 7 8 8
1 R5_CR325 0 0 0 0 9 7 8 8 Chi-square = 184.8293 df = 28 <0.0001
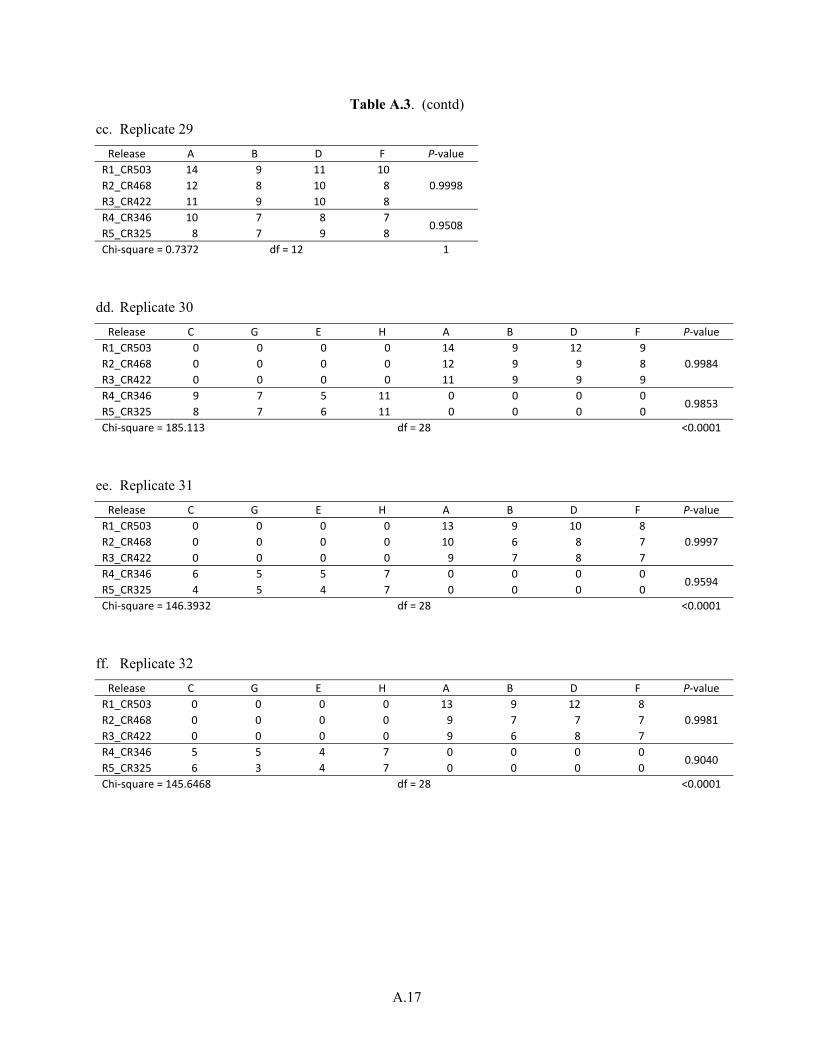
A.17
Table A.3. (contd)
cc. Replicate 29
Release A B D F P-value R1_CR503 14 9 11 10
0.9998 R2_CR468 12 8 10 8 R3_CR422 11 9 10 8 R4_CR346 10 7 8 7
0.9508 R5_CR325 8 7 9 8 Chi-square = 0.7372 df = 12 1
dd. Replicate 30
Release C G E H A B D F P-value R1_CR503 0 0 0 0 14 9 12 9
0.9984 R2_CR468 0 0 0 0 12 9 9 8 R3_CR422 0 0 0 0 11 9 9 9 R4_CR346 9 7 5 11 0 0 0 0
0.9853 R5_CR325 8 7 6 11 0 0 0 0 Chi-square = 185.113 df = 28 <0.0001
ee. Replicate 31
Release C G E H A B D F P-value R1_CR503 0 0 0 0 13 9 10 8
0.9997 R2_CR468 0 0 0 0 10 6 8 7 R3_CR422 0 0 0 0 9 7 8 7 R4_CR346 6 5 5 7 0 0 0 0
0.9594 R5_CR325 4 5 4 7 0 0 0 0 Chi-square = 146.3932 df = 28 <0.0001
ff. Replicate 32
Release C G E H A B D F P-value R1_CR503 0 0 0 0 13 9 12 8
0.9981 R2_CR468 0 0 0 0 9 7 7 7 R3_CR422 0 0 0 0 9 6 8 7 R4_CR346 5 5 4 7 0 0 0 0
0.9040 R5_CR325 6 3 4 7 0 0 0 0 Chi-square = 145.6468 df = 28 <0.0001
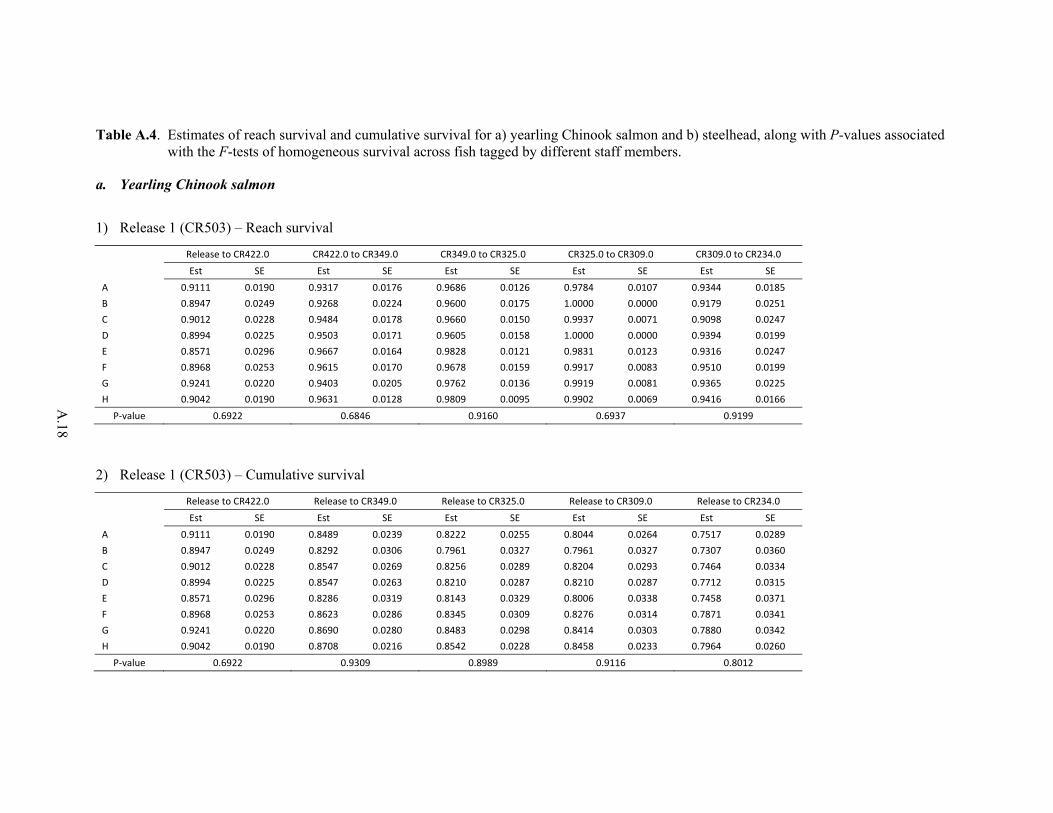
A.18
Table A.4. Estimates of reach survival and cumulative survival for a) yearling Chinook salmon and b) steelhead, along with P-values associated with the F-tests of homogeneous survival across fish tagged by different staff members.
a. Yearling Chinook salmon
1) Release 1 (CR503) – Reach survival
Release to CR422.0 CR422.0 to CR349.0 CR349.0 to CR325.0 CR325.0 to CR309.0 CR309.0 to CR234.0 Est SE Est SE Est SE Est SE Est SE
A 0.9111 0.0190 0.9317 0.0176 0.9686 0.0126 0.9784 0.0107 0.9344 0.0185 B 0.8947 0.0249 0.9268 0.0224 0.9600 0.0175 1.0000 0.0000 0.9179 0.0251 C 0.9012 0.0228 0.9484 0.0178 0.9660 0.0150 0.9937 0.0071 0.9098 0.0247 D 0.8994 0.0225 0.9503 0.0171 0.9605 0.0158 1.0000 0.0000 0.9394 0.0199 E 0.8571 0.0296 0.9667 0.0164 0.9828 0.0121 0.9831 0.0123 0.9316 0.0247 F 0.8968 0.0253 0.9615 0.0170 0.9678 0.0159 0.9917 0.0083 0.9510 0.0199 G 0.9241 0.0220 0.9403 0.0205 0.9762 0.0136 0.9919 0.0081 0.9365 0.0225 H 0.9042 0.0190 0.9631 0.0128 0.9809 0.0095 0.9902 0.0069 0.9416 0.0166
P-value 0.6922 0.6846 0.9160 0.6937 0.9199
2) Release 1 (CR503) – Cumulative survival
Release to CR422.0 Release to CR349.0 Release to CR325.0 Release to CR309.0 Release to CR234.0 Est SE Est SE Est SE Est SE Est SE
A 0.9111 0.0190 0.8489 0.0239 0.8222 0.0255 0.8044 0.0264 0.7517 0.0289 B 0.8947 0.0249 0.8292 0.0306 0.7961 0.0327 0.7961 0.0327 0.7307 0.0360 C 0.9012 0.0228 0.8547 0.0269 0.8256 0.0289 0.8204 0.0293 0.7464 0.0334 D 0.8994 0.0225 0.8547 0.0263 0.8210 0.0287 0.8210 0.0287 0.7712 0.0315 E 0.8571 0.0296 0.8286 0.0319 0.8143 0.0329 0.8006 0.0338 0.7458 0.0371 F 0.8968 0.0253 0.8623 0.0286 0.8345 0.0309 0.8276 0.0314 0.7871 0.0341 G 0.9241 0.0220 0.8690 0.0280 0.8483 0.0298 0.8414 0.0303 0.7880 0.0342 H 0.9042 0.0190 0.8708 0.0216 0.8542 0.0228 0.8458 0.0233 0.7964 0.0260
P-value 0.6922 0.9309 0.8989 0.9116 0.8012

A.19
Table A.4. (contd)
3) Release 2 (CR468) – Reach survival
Release to CR422.0 CR422.0 to CR349.0 CR349.0 to CR325.0 CR325.0 to CR309.0 CR309.0 to CR234.0 Est SE Est SE Est SE Est SE Est SE
A 0.9066 0.0216 0.9879 0.0085 0.9691 0.0136 0.9809 0.0109 0.9420 0.0189 B 0.9147 0.0246 0.9407 0.0217 0.9369 0.0231 0.9904 0.0096 0.9728 0.0167 C 0.9161 0.0223 0.9718 0.0139 0.9639 0.0159 0.9848 0.0106 0.9425 0.0211 D 0.9484 0.0178 0.9456 0.0187 0.9565 0.0174 0.9924 0.0075 0.9084 0.0252 E 0.9262 0.0237 0.9912 0.0088 0.9821 0.0125 1.0000 0.0000 0.9733 0.0155 F 0.9055 0.0260 0.9478 0.0207 0.9266 0.0250 0.9901 0.0099 0.9504 0.0218 G 0.9587 0.0181 0.9914 0.0086 0.9826 0.0122 1.0000 0.0000 0.9395 0.0227 H 0.9227 0.0186 0.9895 0.0074 0.9365 0.0177 0.9892 0.0080 0.9257 0.0199
P-value 0.6034 0.0208 0.1745 0.8435 0.3297
4) Release 2 (CR468) –Cumulative survival
Release to CR422.0 Release to CR349.0 Release to CR325.0 Release to CR309.0 Release to CR234.0 Est SE Est SE Est SE Est SE Est SE
A 0.9066 0.0216 0.8956 0.0227 0.8680 0.0251 0.8514 0.0264 0.8020 0.0296 B 0.9147 0.0246 0.8605 0.0305 0.8062 0.0348 0.7985 0.0353 0.7768 0.0369 C 0.9161 0.0223 0.8903 0.0251 0.8582 0.0280 0.8452 0.0291 0.7965 0.0327 D 0.9484 0.0178 0.8968 0.0244 0.8578 0.0281 0.8513 0.0286 0.7733 0.0337 E 0.9262 0.0237 0.9180 0.0248 0.9016 0.0270 0.9016 0.0270 0.8775 0.0298 F 0.9055 0.0260 0.8583 0.0309 0.7953 0.0358 0.7874 0.0363 0.7484 0.0385 G 0.9587 0.0181 0.9504 0.0197 0.9339 0.0226 0.9339 0.0226 0.8774 0.0300 H 0.9227 0.0186 0.9130 0.0196 0.8551 0.0245 0.8458 0.0251 0.7830 0.0287
P-value 0.6034 0.1751 0.0140 0.0077 0.0353

A.20
Table A.4. (contd)
5) Release 3 (CR422) – Reach survival
Release to CR349.0 CR349.0 to CR325.0 CR325.0 to CR309.0 CR309.0 to CR234.0 Est SE Est SE Est SE Est SE
A 0.9389 0.0179 0.9527 0.0163 1.0000 0.0000 0.9516 0.0172 B 0.9389 0.0209 0.9098 0.0259 0.9910 0.0090 0.9455 0.0217 C 0.9745 0.0126 0.9542 0.0169 1.0000 0.0000 0.9272 0.0220 D 0.9482 0.0179 0.9723 0.0137 0.9929 0.0071 0.9357 0.0207 E 0.9397 0.0221 0.9817 0.0129 1.0006 0.0006 0.9443 0.0225 F 0.9313 0.0221 0.9672 0.0161 0.9746 0.0145 0.9056 0.0275 G 0.9524 0.0190 0.9667 0.0164 0.9569 0.0189 0.9662 0.0178 H 0.9317 0.0176 0.9581 0.0145 0.9891 0.0077 0.9415 0.0178
P-value 0.7931 0.1229 0.0752 0.6593
6) Release 3 (CR422) – Cumulative survival
Release to CR349.0 Release to CR325.0 Release to CR309.0 Release to CR234.0 Est SE Est SE Est SE Est SE
A 0.9389 0.0179 0.8944 0.0229 0.8944 0.0229 0.8512 0.0267 B 0.9389 0.0209 0.8543 0.0309 0.8466 0.0316 0.8004 0.0350 C 0.9745 0.0126 0.9299 0.0204 0.9299 0.0204 0.8622 0.0278 D 0.9482 0.0179 0.9219 0.0217 0.9154 0.0225 0.8565 0.0283 E 0.9397 0.0221 0.9224 0.0248 0.9229 0.0249 0.8715 0.0312 F 0.9313 0.0221 0.9008 0.0261 0.8779 0.0286 0.7950 0.0354 G 0.9524 0.0190 0.9206 0.0241 0.8810 0.0289 0.8512 0.0320 H 0.9317 0.0176 0.8927 0.0216 0.8829 0.0225 0.8313 0.0264
P-value 0.7931 0.3975 0.3121 0.5294

A.21
Table A.4. (contd)
7) Release 4 (CR346) – Reach survival
Release to CR325.0 CR325.0 to CR309.0 CR309.0 to CR234.0 Est SE Est SE Est SE
A 0.9935 0.0065 0.9737 0.0130 0.9126 0.0233 B 1.0002 0.0002 0.9820 0.0126 0.9560 0.0199 C 0.9919 0.0080 0.9919 0.0081 0.9705 0.0163 D 1.0000 0.0000 0.9767 0.0133 0.9534 0.0190 E 1.0000 0.0000 0.9574 0.0208 0.9558 0.0217 F 0.9912 0.0088 1.0000 0.0000 0.9291 0.0244 G 1.0000 0.0000 0.9902 0.0098 0.9406 0.0235 H 1.0000 0.0000 0.9941 0.0059 0.9529 0.0163
P-value 0.9217 0.3168 0.6115
8) Release 4 (CR346) – Cumulative survival
Release to CR325.0 Release to CR309.0 Release to CR234.0 Est SE Est SE Est SE
A 0.9935 0.0065 0.9673 0.0144 0.8828 0.0261 B 1.0002 0.0002 0.9821 0.0125 0.9390 0.0229 C 0.9919 0.0080 0.9839 0.0113 0.9548 0.0194 D 1.0000 0.0000 0.9767 0.0133 0.9312 0.0225 E 1.0000 0.0000 0.9574 0.0208 0.9152 0.0288 F 0.9912 0.0088 0.9912 0.0088 0.9209 0.0255 G 1.0000 0.0000 0.9902 0.0098 0.9314 0.0250 H 1.0000 0.0000 0.9941 0.0059 0.9473 0.0172
P-value 0.9217 0.4389 0.5142
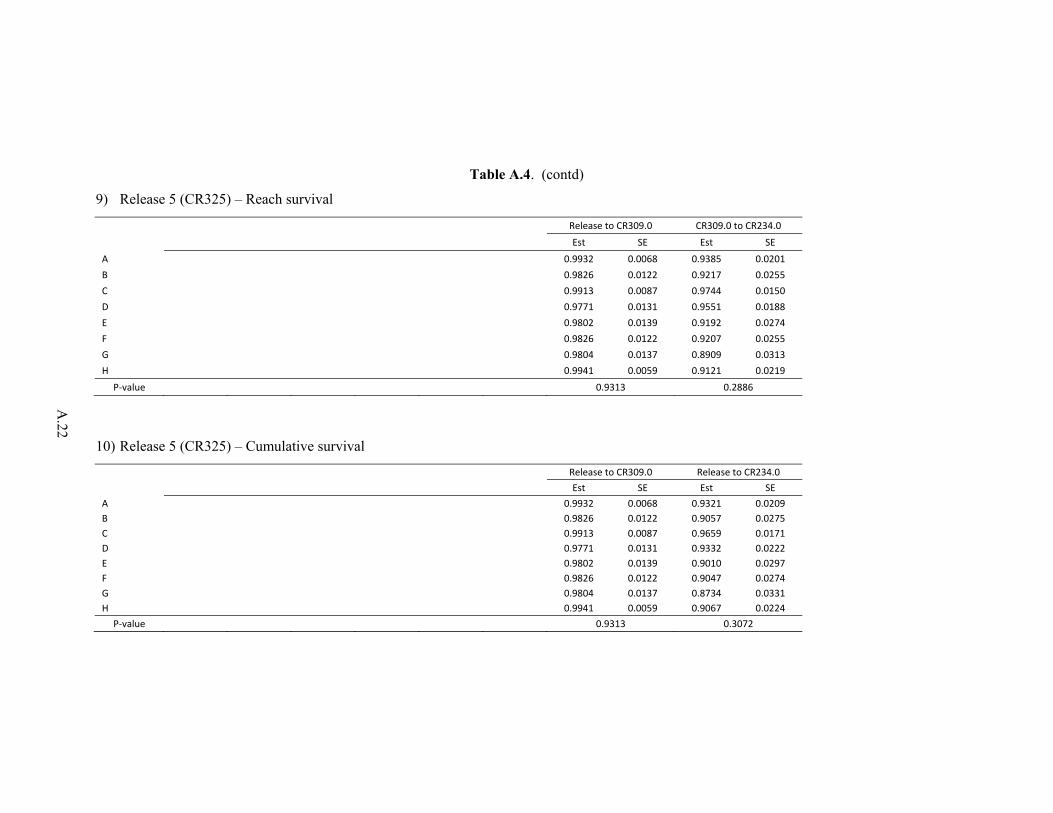
A.22
Table A.4. (contd)
9) Release 5 (CR325) – Reach survival
Release to CR309.0 CR309.0 to CR234.0 Est SE Est SE
A 0.9932 0.0068 0.9385 0.0201 B 0.9826 0.0122 0.9217 0.0255 C 0.9913 0.0087 0.9744 0.0150 D 0.9771 0.0131 0.9551 0.0188 E 0.9802 0.0139 0.9192 0.0274 F 0.9826 0.0122 0.9207 0.0255 G 0.9804 0.0137 0.8909 0.0313 H 0.9941 0.0059 0.9121 0.0219
P-value 0.9313 0.2886
10) Release 5 (CR325) – Cumulative survival
Release to CR309.0 Release to CR234.0 Est SE Est SE
A 0.9932 0.0068 0.9321 0.0209 B 0.9826 0.0122 0.9057 0.0275 C 0.9913 0.0087 0.9659 0.0171 D 0.9771 0.0131 0.9332 0.0222 E 0.9802 0.0139 0.9010 0.0297 F 0.9826 0.0122 0.9047 0.0274 G 0.9804 0.0137 0.8734 0.0331 H 0.9941 0.0059 0.9067 0.0224
P-value 0.9313 0.3072
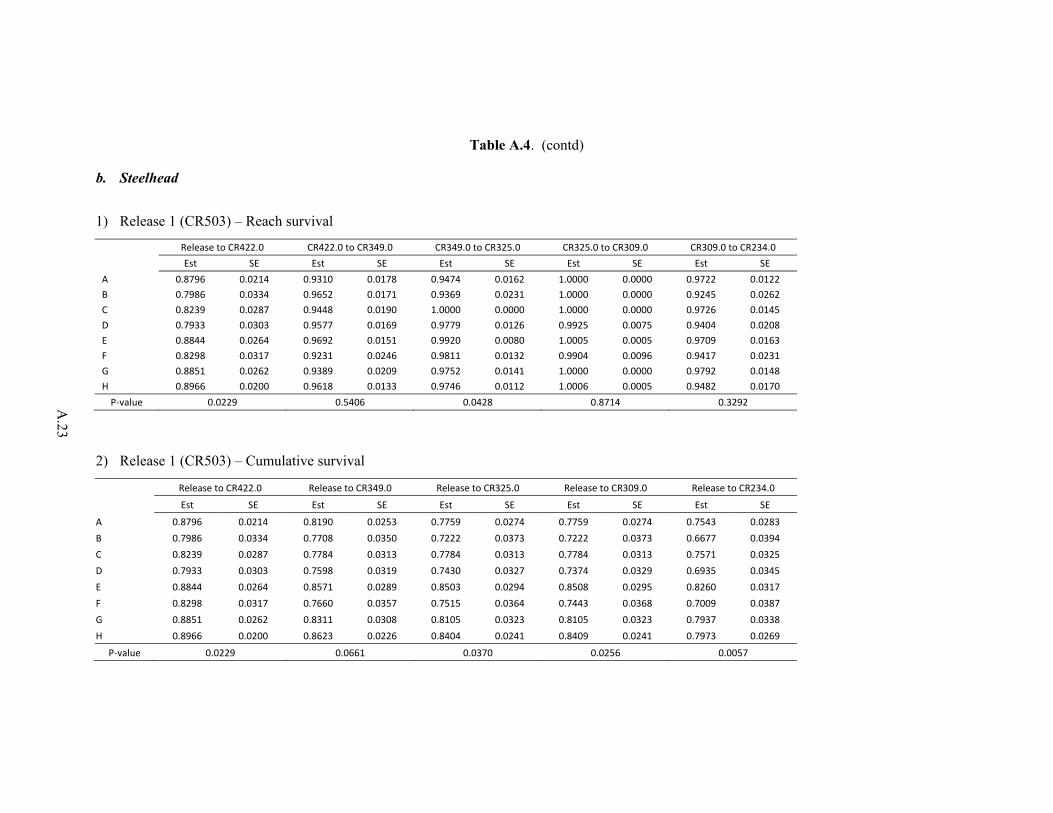
A.23
Table A.4. (contd)
b. Steelhead
1) Release 1 (CR503) – Reach survival
Release to CR422.0 CR422.0 to CR349.0 CR349.0 to CR325.0 CR325.0 to CR309.0 CR309.0 to CR234.0 Est SE Est SE Est SE Est SE Est SE
A 0.8796 0.0214 0.9310 0.0178 0.9474 0.0162 1.0000 0.0000 0.9722 0.0122 B 0.7986 0.0334 0.9652 0.0171 0.9369 0.0231 1.0000 0.0000 0.9245 0.0262 C 0.8239 0.0287 0.9448 0.0190 1.0000 0.0000 1.0000 0.0000 0.9726 0.0145 D 0.7933 0.0303 0.9577 0.0169 0.9779 0.0126 0.9925 0.0075 0.9404 0.0208 E 0.8844 0.0264 0.9692 0.0151 0.9920 0.0080 1.0005 0.0005 0.9709 0.0163 F 0.8298 0.0317 0.9231 0.0246 0.9811 0.0132 0.9904 0.0096 0.9417 0.0231 G 0.8851 0.0262 0.9389 0.0209 0.9752 0.0141 1.0000 0.0000 0.9792 0.0148 H 0.8966 0.0200 0.9618 0.0133 0.9746 0.0112 1.0006 0.0005 0.9482 0.0170
P-value 0.0229 0.5406 0.0428 0.8714 0.3292
2) Release 1 (CR503) – Cumulative survival
Release to CR422.0 Release to CR349.0 Release to CR325.0 Release to CR309.0 Release to CR234.0
Est SE Est SE Est SE Est SE Est SE
A 0.8796 0.0214 0.8190 0.0253 0.7759 0.0274 0.7759 0.0274 0.7543 0.0283 B 0.7986 0.0334 0.7708 0.0350 0.7222 0.0373 0.7222 0.0373 0.6677 0.0394 C 0.8239 0.0287 0.7784 0.0313 0.7784 0.0313 0.7784 0.0313 0.7571 0.0325 D 0.7933 0.0303 0.7598 0.0319 0.7430 0.0327 0.7374 0.0329 0.6935 0.0345 E 0.8844 0.0264 0.8571 0.0289 0.8503 0.0294 0.8508 0.0295 0.8260 0.0317 F 0.8298 0.0317 0.7660 0.0357 0.7515 0.0364 0.7443 0.0368 0.7009 0.0387 G 0.8851 0.0262 0.8311 0.0308 0.8105 0.0323 0.8105 0.0323 0.7937 0.0338 H 0.8966 0.0200 0.8623 0.0226 0.8404 0.0241 0.8409 0.0241 0.7973 0.0269
P-value 0.0229 0.0661 0.0370 0.0256 0.0057

A.24
Table A.4. (contd)
3) Release 2 (CR468) – Reach survival
Release to CR422.0 CR422.0 to CR349.0 CR349.0 to CR325.0 CR325.0 to CR309.0 CR309.0 to CR234.0 Est SE Est SE Est SE Est SE Est SE
A 0.9162 0.0207 0.9451 0.0178 0.9739 0.0129 0.9933 0.0067 0.9688 0.0150 B 0.8828 0.0284 0.9115 0.0267 0.9902 0.0098 1.0000 0.0000 0.9219 0.0269 C 0.9351 0.0199 0.9375 0.0202 0.9704 0.0146 1.0000 0.0000 0.9589 0.0185 D 0.9286 0.0208 0.9231 0.0223 0.9847 0.0107 1.0000 0.0000 0.9690 0.0153 E 0.8810 0.0289 0.9640 0.0177 0.9810 0.0133 0.9908 0.0097 0.9536 0.0218 F 0.9160 0.0242 0.9417 0.0214 0.9643 0.0175 1.0000 0.0000 0.9820 0.0130 G 0.9297 0.0226 0.9160 0.0254 1.0002 0.0002 0.9811 0.0132 0.9161 0.0274 H 0.9196 0.0193 0.9290 0.0190 0.9706 0.0130 0.9939 0.0060 0.9417 0.0188
P-value 0.5984 0.7263 0.4919 0.8238 0.2294
4) Release 2 (CR468) – Cumulative survival
Release to CR422.0 Release to CR349.0 Release to CR325.0 Release to CR309.0 Release to CR234.0 Est SE Est SE Est SE Est SE Est SE
A 0.9162 0.0207 0.8659 0.0255 0.8433 0.0272 0.8376 0.0276 0.8115 0.0295 B 0.8828 0.0284 0.8047 0.0350 0.7968 0.0356 0.7968 0.0356 0.7345 0.0392 C 0.9351 0.0199 0.8766 0.0265 0.8506 0.0287 0.8506 0.0287 0.8156 0.0317 D 0.9286 0.0208 0.8571 0.0282 0.8441 0.0292 0.8441 0.0292 0.8179 0.0311 E 0.8810 0.0289 0.8492 0.0319 0.8330 0.0333 0.8254 0.0339 0.7871 0.0369 F 0.9160 0.0242 0.8626 0.0301 0.8318 0.0327 0.8318 0.0327 0.8169 0.0339 G 0.9297 0.0226 0.8516 0.0314 0.8517 0.0314 0.8356 0.0328 0.7655 0.0378 H 0.9196 0.0193 0.8543 0.0250 0.8291 0.0267 0.8241 0.0270 0.7761 0.0298
P-value 0.5984 0.8151 0.9408 0.9634 0.5815

A.25
Table A.4. (contd)
5) Release 3 (CR422) – Reach survival
Release to CR349.0 CR349.0 to CR325.0 CR325.0 to CR309.0 CR309.0 to CR234.0 Est SE Est SE Est SE Est SE
A 0.9266 0.0196 0.9695 0.0134 0.9937 0.0063 0.9624 0.0152 B 0.9291 0.0228 0.9487 0.0204 1.0000 0.0000 0.9647 0.0177 C 0.9805 0.0111 0.9868 0.0093 0.9866 0.0094 0.9497 0.0189 D 0.9359 0.0196 0.9583 0.0167 0.9928 0.0072 0.9799 0.0126 E 0.9496 0.0201 0.9732 0.0153 0.9908 0.0091 0.9630 0.0182 F 0.9313 0.0221 0.9664 0.0165 1.0000 0.0000 0.9489 0.0208 G 0.9055 0.0260 0.9561 0.0192 1.0000 0.0000 0.9770 0.0159 H 0.9324 0.0175 0.9789 0.0104 0.9839 0.0092 0.9704 0.0133
P-value 0.3370 0.7138 0.7856 0.8674
6) Release 3 (CR422) – Reach survival
Release to CR349.0 Release to CR325.0 Release to CR309.0 Release to CR234.0 Est SE Est SE Est SE Est SE
A 0.9266 0.0196 0.8983 0.0227 0.8927 0.0233 0.8591 0.0262 B 0.9291 0.0228 0.8815 0.0287 0.8815 0.0287 0.8504 0.0318 C 0.9805 0.0111 0.9675 0.0143 0.9545 0.0168 0.9065 0.0241 D 0.9359 0.0196 0.8969 0.0244 0.8904 0.0251 0.8725 0.0270 E 0.9496 0.0201 0.9241 0.0243 0.9157 0.0255 0.8818 0.0297 F 0.9313 0.0221 0.9000 0.0263 0.9000 0.0263 0.8540 0.0312 G 0.9055 0.0260 0.8658 0.0303 0.8658 0.0303 0.8459 0.0327 H 0.9324 0.0175 0.9127 0.0197 0.8980 0.0211 0.8715 0.0237
P-value 0.3370 0.1350 0.3479 0.8434

A.26
Table A.4. (contd)
7) Release 4 (CR346) – Reach survival
Release to CR325.0 CR325.0 to CR309.0 CR309.0 to CR234.0 Est SE Est SE Est SE
A 0.9936 0.0063 0.9936 0.0064 0.9742 0.0127 B 1.0000 0.0000 1.0000 0.0000 0.9639 0.0179 C 0.9919 0.0081 1.0005 0.0005 0.9446 0.0213 D 0.9535 0.0185 0.9919 0.0081 0.9597 0.0180 E 1.0000 0.0000 1.0009 0.0008 0.9589 0.0209 F 0.9825 0.0123 0.9911 0.0089 0.9657 0.0178 G 0.9720 0.0160 1.0000 0.0000 0.9327 0.0246 H 0.9939 0.0061 0.9816 0.0105 0.9693 0.0138
P-value 0.0947 0.4834 0.8119
8) Release 4 (CR346) – Cumulative survival
Release to CR325.0 Release to CR309.0 Release to CR234.0 Est SE Est SE Est SE
A 0.9936 0.0063 0.9873 0.0090 0.9618 0.0153 B 1.0000 0.0000 1.0000 0.0000 0.9639 0.0179 C 0.9919 0.0081 0.9924 0.0081 0.9374 0.0223 D 0.9535 0.0185 0.9457 0.0199 0.9076 0.0256 E 1.0000 0.0000 1.0009 0.0008 0.9598 0.0205 F 0.9825 0.0123 0.9737 0.0150 0.9402 0.0226 G 0.9720 0.0160 0.9720 0.0160 0.9065 0.0281 H 0.9939 0.0061 0.9756 0.0120 0.9456 0.0178
P-value 0.0947 0.0512 0.3512
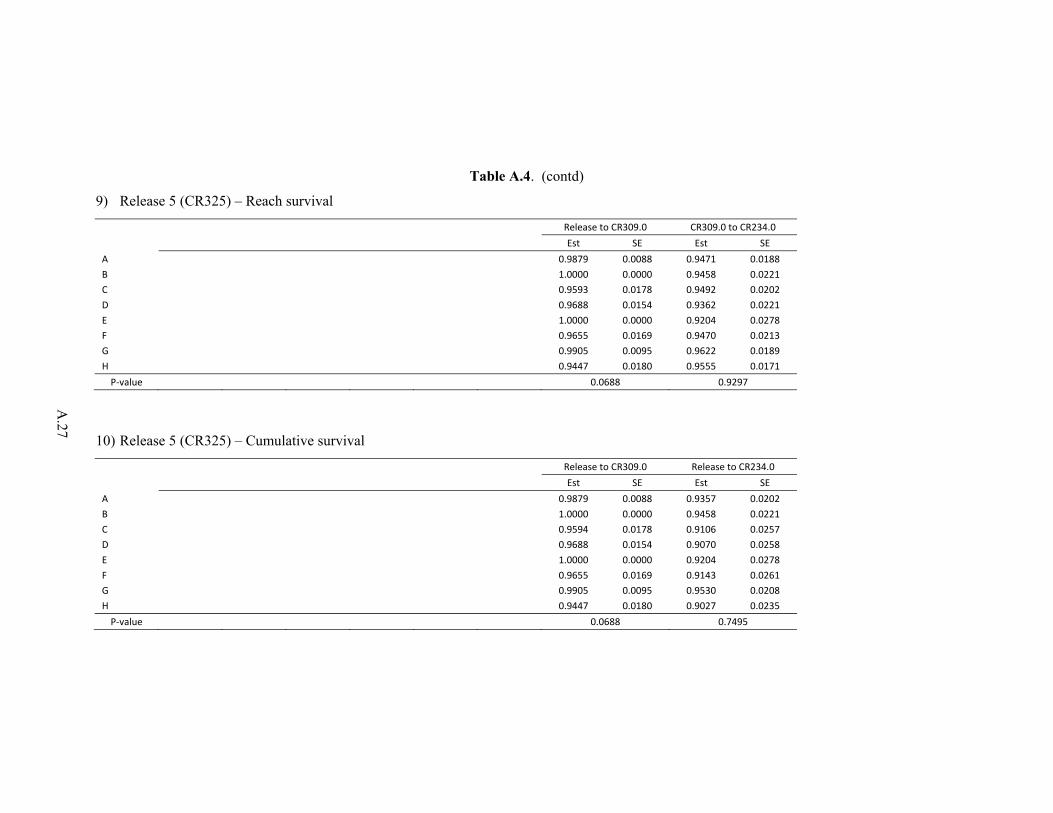
A.27
Table A.4. (contd)
9) Release 5 (CR325) – Reach survival
Release to CR309.0 CR309.0 to CR234.0 Est SE Est SE
A 0.9879 0.0088 0.9471 0.0188 B 1.0000 0.0000 0.9458 0.0221 C 0.9593 0.0178 0.9492 0.0202 D 0.9688 0.0154 0.9362 0.0221 E 1.0000 0.0000 0.9204 0.0278 F 0.9655 0.0169 0.9470 0.0213 G 0.9905 0.0095 0.9622 0.0189 H 0.9447 0.0180 0.9555 0.0171
P-value 0.0688 0.9297
10) Release 5 (CR325) – Cumulative survival
Release to CR309.0 Release to CR234.0 Est SE Est SE
A 0.9879 0.0088 0.9357 0.0202 B 1.0000 0.0000 0.9458 0.0221 C 0.9594 0.0178 0.9106 0.0257 D 0.9688 0.0154 0.9070 0.0258 E 1.0000 0.0000 0.9204 0.0278 F 0.9655 0.0169 0.9143 0.0261 G 0.9905 0.0095 0.9530 0.0208 H 0.9447 0.0180 0.9027 0.0235
P-value 0.0688 0.7495

A.28
A.1.2 Summer Study
Data from all nine release locations in the four-dam study were examined for tagger effects. This was again done to maximize the statistical power to detect tagger effects that might have influenced any of the Lower Columbia River survival studies in summer 2012.
Tagger effort was balanced across the nine release locations and eight taggers (Table A.5)
( )( )256 4.8194 1P χ ≥ = . Tagger effort was also examined within each of the 32 replicate releases (Table A.6).
Tagger effort was found to be balanced within the individual project releases (i.e., R1–R3, R4–R5, R6–R7, and R8–R9) within each of the replicate releases (Table A.7). These conditionally balanced designs within the individual replicates and the balance of taggers across projects resulted in the overall balanced design.
Tests of tagger effects were examined across the nine release locations based on both reach survivals and cumulative reach survivals (Table A.7). Five of the 45 tests of homogeneous reach survival across taggers were significant at α = 0.10 (i.e., 11.11%). Two of the 44 tests of homogeneous cumulative reach survival across taggers were significant at α = 0.10 (i.e., 4.55%). The rate of rejection in both cases is below that expected by chance alone, suggesting no evidence of tagger effects.
Based on the balanced release design (Table A.5 and Table A.6) and tests of homogeneity (Table A.7), all fish tagged by all staff members were used in the subsequent survival analyses for summer 2012.
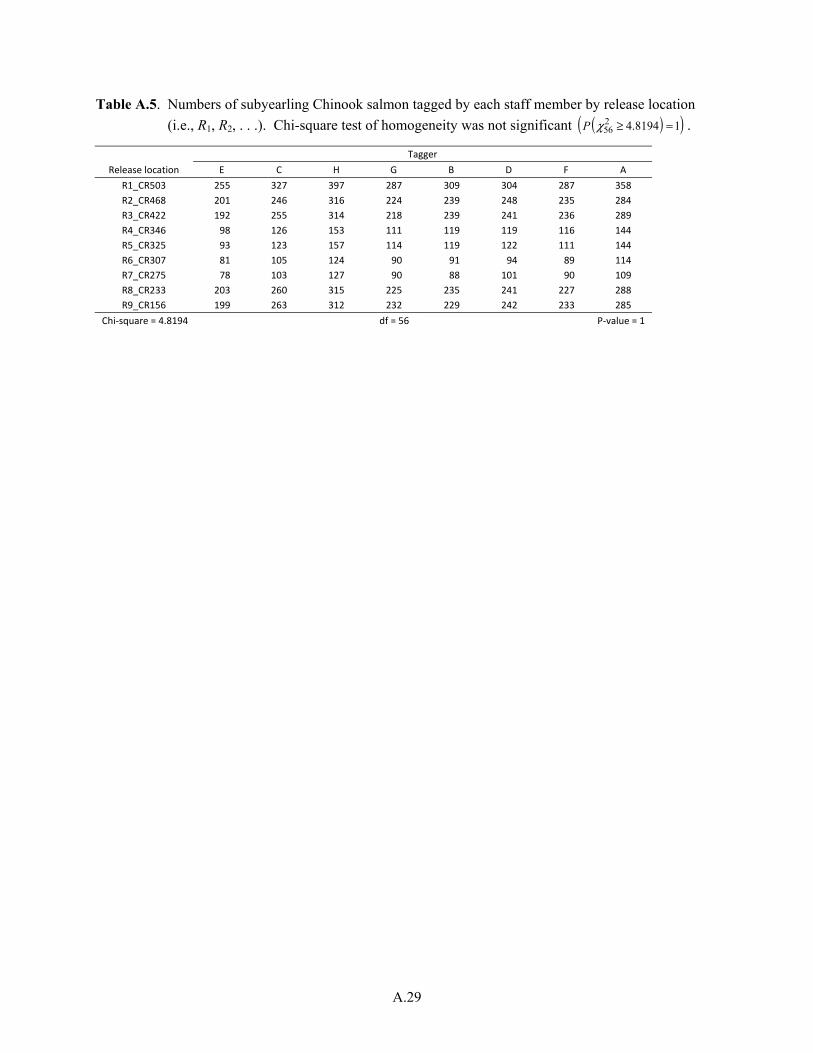
A.29
Table A.5. Numbers of subyearling Chinook salmon tagged by each staff member by release location
(i.e., R1, R2, . . .). Chi-square test of homogeneity was not significant ( )( )256 4.8194 1P χ ≥ = .
Tagger Release location E C H G B D F A
R1_CR503 255 327 397 287 309 304 287 358 R2_CR468 201 246 316 224 239 248 235 284 R3_CR422 192 255 314 218 239 241 236 289 R4_CR346 98 126 153 111 119 119 116 144 R5_CR325 93 123 157 114 119 122 111 144 R6_CR307 81 105 124 90 91 94 89 114 R7_CR275 78 103 127 90 88 101 90 109 R8_CR233 203 260 315 225 235 241 227 288 R9_CR156 199 263 312 232 229 242 233 285
Chi-square = 4.8194 df = 56 P-value = 1
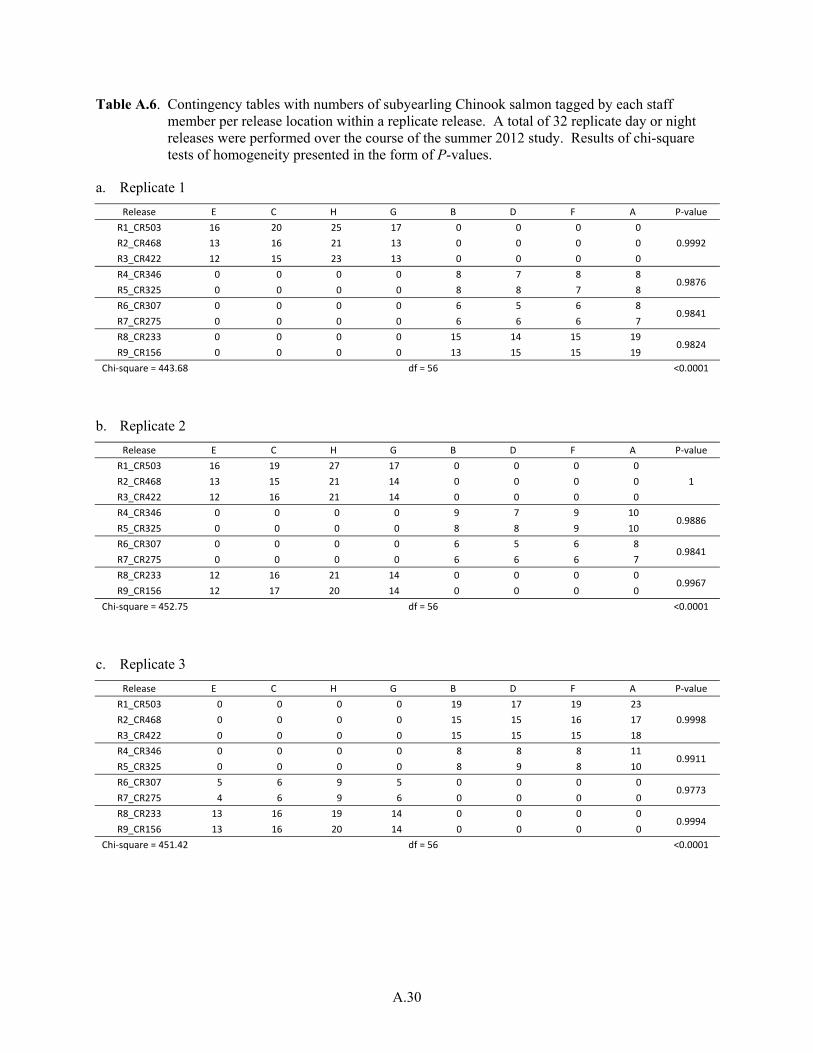
A.30
Table A.6. Contingency tables with numbers of subyearling Chinook salmon tagged by each staff member per release location within a replicate release. A total of 32 replicate day or night releases were performed over the course of the summer 2012 study. Results of chi-square tests of homogeneity presented in the form of P-values.
a. Replicate 1
Release E C H G B D F A P-value R1_CR503 16 20 25 17 0 0 0 0
0.9992 R2_CR468 13 16 21 13 0 0 0 0 R3_CR422 12 15 23 13 0 0 0 0 R4_CR346 0 0 0 0 8 7 8 8
0.9876 R5_CR325 0 0 0 0 8 8 7 8 R6_CR307 0 0 0 0 6 5 6 8
0.9841 R7_CR275 0 0 0 0 6 6 6 7 R8_CR233 0 0 0 0 15 14 15 19
0.9824 R9_CR156 0 0 0 0 13 15 15 19
Chi-square = 443.68 df = 56 <0.0001
b. Replicate 2
Release E C H G B D F A P-value R1_CR503 16 19 27 17 0 0 0 0
1 R2_CR468 13 15 21 14 0 0 0 0 R3_CR422 12 16 21 14 0 0 0 0 R4_CR346 0 0 0 0 9 7 9 10
0.9886 R5_CR325 0 0 0 0 8 8 9 10 R6_CR307 0 0 0 0 6 5 6 8
0.9841 R7_CR275 0 0 0 0 6 6 6 7 R8_CR233 12 16 21 14 0 0 0 0
0.9967 R9_CR156 12 17 20 14 0 0 0 0
Chi-square = 452.75 df = 56 <0.0001
c. Replicate 3
Release E C H G B D F A P-value R1_CR503 0 0 0 0 19 17 19 23
0.9998 R2_CR468 0 0 0 0 15 15 16 17 R3_CR422 0 0 0 0 15 15 15 18 R4_CR346 0 0 0 0 8 8 8 11
0.9911 R5_CR325 0 0 0 0 8 9 8 10 R6_CR307 5 6 9 5 0 0 0 0
0.9773 R7_CR275 4 6 9 6 0 0 0 0 R8_CR233 13 16 19 14 0 0 0 0
0.9994 R9_CR156 13 16 20 14 0 0 0 0
Chi-square = 451.42 df = 56 <0.0001
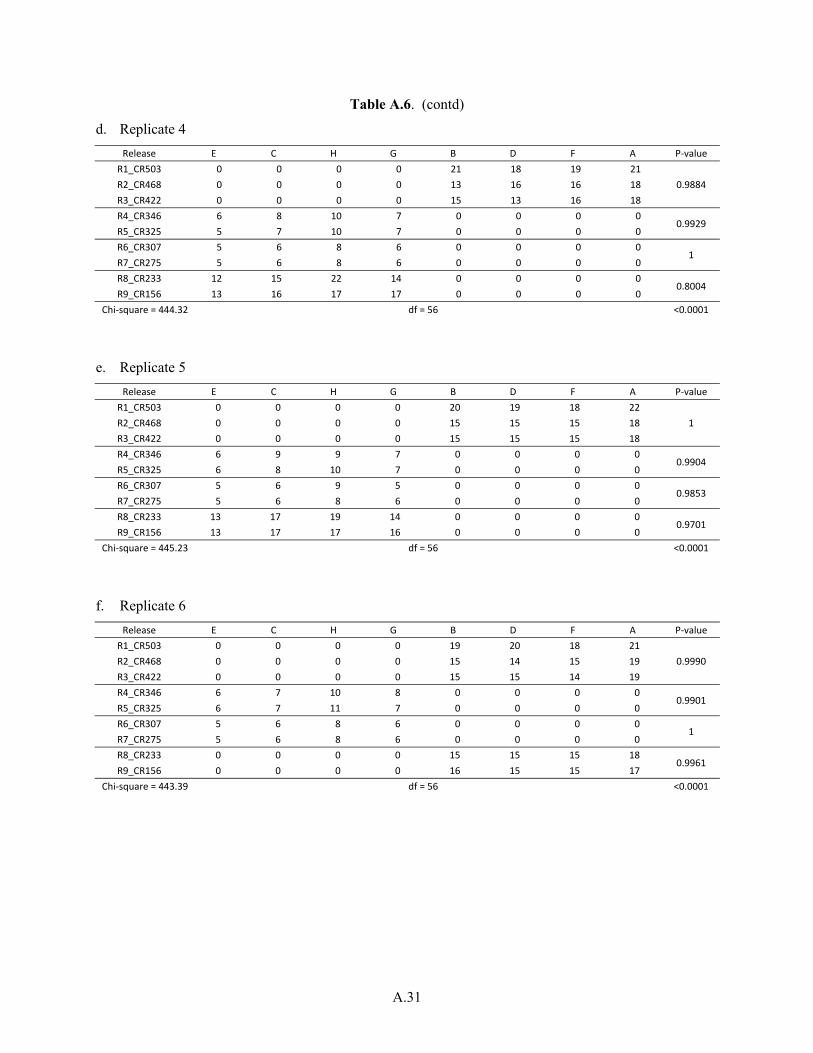
A.31
Table A.6. (contd)
d. Replicate 4
Release E C H G B D F A P-value R1_CR503 0 0 0 0 21 18 19 21
0.9884 R2_CR468 0 0 0 0 13 16 16 18 R3_CR422 0 0 0 0 15 13 16 18 R4_CR346 6 8 10 7 0 0 0 0
0.9929 R5_CR325 5 7 10 7 0 0 0 0 R6_CR307 5 6 8 6 0 0 0 0
1 R7_CR275 5 6 8 6 0 0 0 0 R8_CR233 12 15 22 14 0 0 0 0
0.8004 R9_CR156 13 16 17 17 0 0 0 0
Chi-square = 444.32 df = 56 <0.0001
e. Replicate 5
Release E C H G B D F A P-value R1_CR503 0 0 0 0 20 19 18 22
1 R2_CR468 0 0 0 0 15 15 15 18 R3_CR422 0 0 0 0 15 15 15 18 R4_CR346 6 9 9 7 0 0 0 0
0.9904 R5_CR325 6 8 10 7 0 0 0 0 R6_CR307 5 6 9 5 0 0 0 0
0.9853 R7_CR275 5 6 8 6 0 0 0 0 R8_CR233 13 17 19 14 0 0 0 0
0.9701 R9_CR156 13 17 17 16 0 0 0 0
Chi-square = 445.23 df = 56 <0.0001
f. Replicate 6
Release E C H G B D F A P-value R1_CR503 0 0 0 0 19 20 18 21
0.9990 R2_CR468 0 0 0 0 15 14 15 19 R3_CR422 0 0 0 0 15 15 14 19 R4_CR346 6 7 10 8 0 0 0 0
0.9901 R5_CR325 6 7 11 7 0 0 0 0 R6_CR307 5 6 8 6 0 0 0 0
1 R7_CR275 5 6 8 6 0 0 0 0 R8_CR233 0 0 0 0 15 15 15 18
0.9961 R9_CR156 0 0 0 0 16 15 15 17
Chi-square = 443.39 df = 56 <0.0001
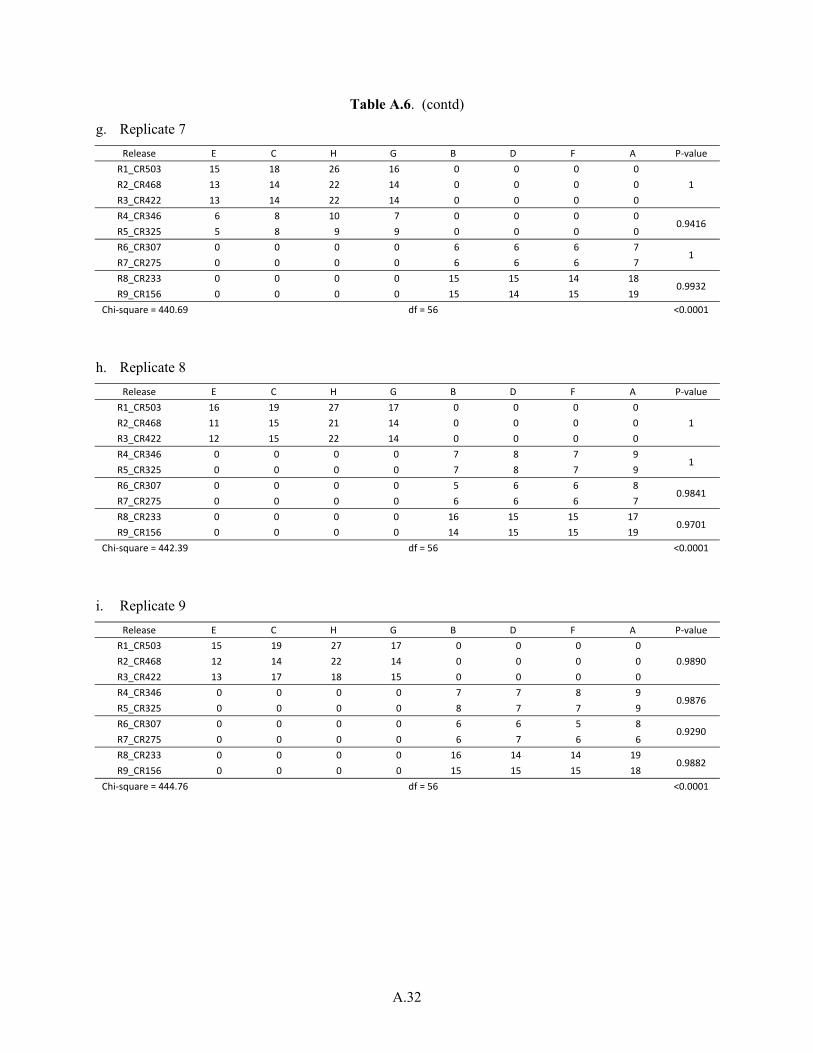
A.32
Table A.6. (contd)
g. Replicate 7
Release E C H G B D F A P-value R1_CR503 15 18 26 16 0 0 0 0
1 R2_CR468 13 14 22 14 0 0 0 0 R3_CR422 13 14 22 14 0 0 0 0 R4_CR346 6 8 10 7 0 0 0 0
0.9416 R5_CR325 5 8 9 9 0 0 0 0 R6_CR307 0 0 0 0 6 6 6 7
1 R7_CR275 0 0 0 0 6 6 6 7 R8_CR233 0 0 0 0 15 15 14 18
0.9932 R9_CR156 0 0 0 0 15 14 15 19
Chi-square = 440.69 df = 56 <0.0001
h. Replicate 8
Release E C H G B D F A P-value R1_CR503 16 19 27 17 0 0 0 0
1 R2_CR468 11 15 21 14 0 0 0 0 R3_CR422 12 15 22 14 0 0 0 0 R4_CR346 0 0 0 0 7 8 7 9
1 R5_CR325 0 0 0 0 7 8 7 9 R6_CR307 0 0 0 0 5 6 6 8
0.9841 R7_CR275 0 0 0 0 6 6 6 7 R8_CR233 0 0 0 0 16 15 15 17
0.9701 R9_CR156 0 0 0 0 14 15 15 19
Chi-square = 442.39 df = 56 <0.0001
i. Replicate 9
Release E C H G B D F A P-value R1_CR503 15 19 27 17 0 0 0 0
0.9890 R2_CR468 12 14 22 14 0 0 0 0 R3_CR422 13 17 18 15 0 0 0 0 R4_CR346 0 0 0 0 7 7 8 9
0.9876 R5_CR325 0 0 0 0 8 7 7 9 R6_CR307 0 0 0 0 6 6 5 8
0.9290 R7_CR275 0 0 0 0 6 7 6 6 R8_CR233 0 0 0 0 16 14 14 19
0.9882 R9_CR156 0 0 0 0 15 15 15 18
Chi-square = 444.76 df = 56 <0.0001
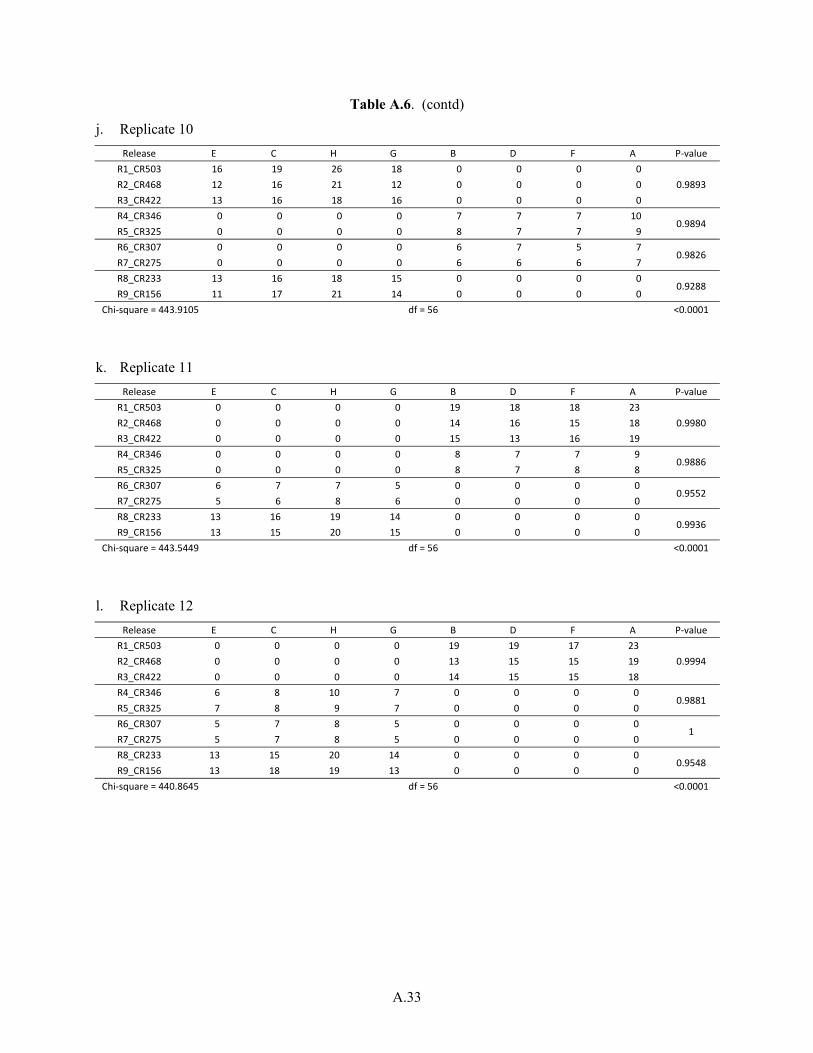
A.33
Table A.6. (contd)
j. Replicate 10
Release E C H G B D F A P-value R1_CR503 16 19 26 18 0 0 0 0
0.9893 R2_CR468 12 16 21 12 0 0 0 0 R3_CR422 13 16 18 16 0 0 0 0 R4_CR346 0 0 0 0 7 7 7 10
0.9894 R5_CR325 0 0 0 0 8 7 7 9 R6_CR307 0 0 0 0 6 7 5 7
0.9826 R7_CR275 0 0 0 0 6 6 6 7 R8_CR233 13 16 18 15 0 0 0 0
0.9288 R9_CR156 11 17 21 14 0 0 0 0
Chi-square = 443.9105 df = 56 <0.0001
k. Replicate 11
Release E C H G B D F A P-value R1_CR503 0 0 0 0 19 18 18 23
0.9980 R2_CR468 0 0 0 0 14 16 15 18 R3_CR422 0 0 0 0 15 13 16 19 R4_CR346 0 0 0 0 8 7 7 9
0.9886 R5_CR325 0 0 0 0 8 7 8 8 R6_CR307 6 7 7 5 0 0 0 0
0.9552 R7_CR275 5 6 8 6 0 0 0 0 R8_CR233 13 16 19 14 0 0 0 0
0.9936 R9_CR156 13 15 20 15 0 0 0 0
Chi-square = 443.5449 df = 56 <0.0001
l. Replicate 12
Release E C H G B D F A P-value R1_CR503 0 0 0 0 19 19 17 23
0.9994 R2_CR468 0 0 0 0 13 15 15 19 R3_CR422 0 0 0 0 14 15 15 18 R4_CR346 6 8 10 7 0 0 0 0
0.9881 R5_CR325 7 8 9 7 0 0 0 0 R6_CR307 5 7 8 5 0 0 0 0
1 R7_CR275 5 7 8 5 0 0 0 0 R8_CR233 13 15 20 14 0 0 0 0
0.9548 R9_CR156 13 18 19 13 0 0 0 0
Chi-square = 440.8645 df = 56 <0.0001
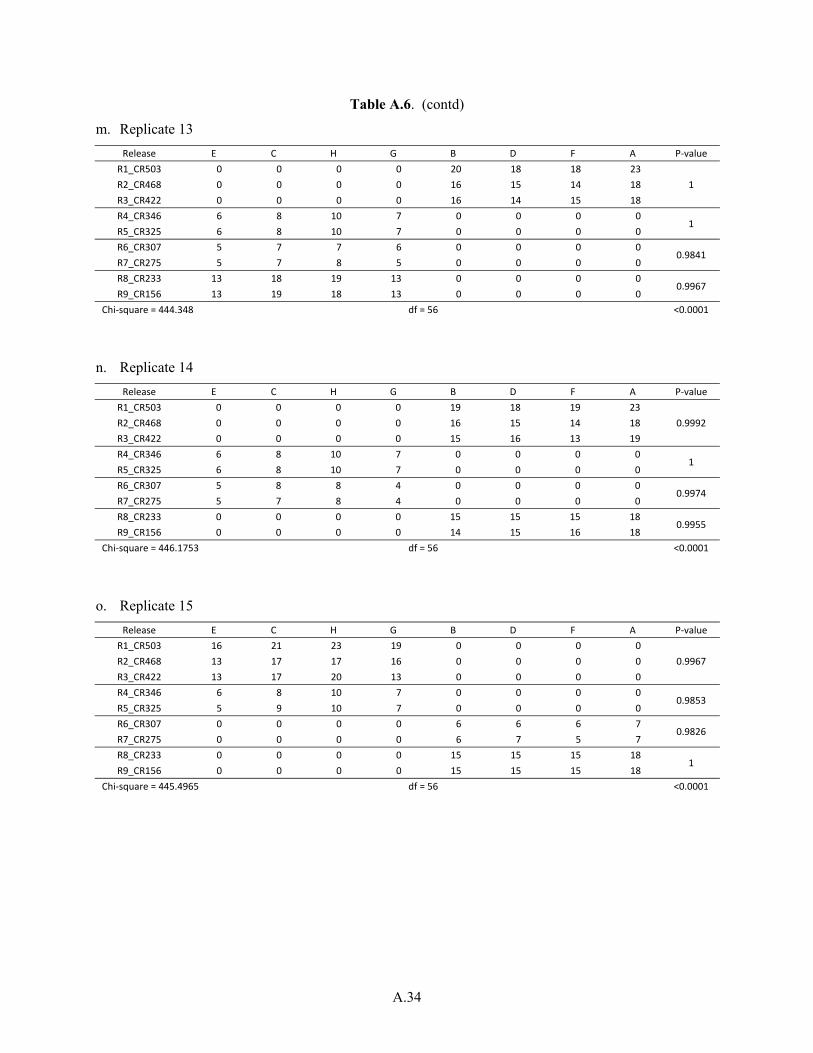
A.34
Table A.6. (contd)
m. Replicate 13
Release E C H G B D F A P-value R1_CR503 0 0 0 0 20 18 18 23
1 R2_CR468 0 0 0 0 16 15 14 18 R3_CR422 0 0 0 0 16 14 15 18 R4_CR346 6 8 10 7 0 0 0 0
1 R5_CR325 6 8 10 7 0 0 0 0 R6_CR307 5 7 7 6 0 0 0 0
0.9841 R7_CR275 5 7 8 5 0 0 0 0 R8_CR233 13 18 19 13 0 0 0 0
0.9967 R9_CR156 13 19 18 13 0 0 0 0
Chi-square = 444.348 df = 56 <0.0001
n. Replicate 14
Release E C H G B D F A P-value R1_CR503 0 0 0 0 19 18 19 23
0.9992 R2_CR468 0 0 0 0 16 15 14 18 R3_CR422 0 0 0 0 15 16 13 19 R4_CR346 6 8 10 7 0 0 0 0
1 R5_CR325 6 8 10 7 0 0 0 0 R6_CR307 5 8 8 4 0 0 0 0
0.9974 R7_CR275 5 7 8 4 0 0 0 0 R8_CR233 0 0 0 0 15 15 15 18
0.9955 R9_CR156 0 0 0 0 14 15 16 18
Chi-square = 446.1753 df = 56 <0.0001
o. Replicate 15
Release E C H G B D F A P-value R1_CR503 16 21 23 19 0 0 0 0
0.9967 R2_CR468 13 17 17 16 0 0 0 0 R3_CR422 13 17 20 13 0 0 0 0 R4_CR346 6 8 10 7 0 0 0 0
0.9853 R5_CR325 5 9 10 7 0 0 0 0 R6_CR307 0 0 0 0 6 6 6 7
0.9826 R7_CR275 0 0 0 0 6 7 5 7 R8_CR233 0 0 0 0 15 15 15 18
1 R9_CR156 0 0 0 0 15 15 15 18
Chi-square = 445.4965 df = 56 <0.0001
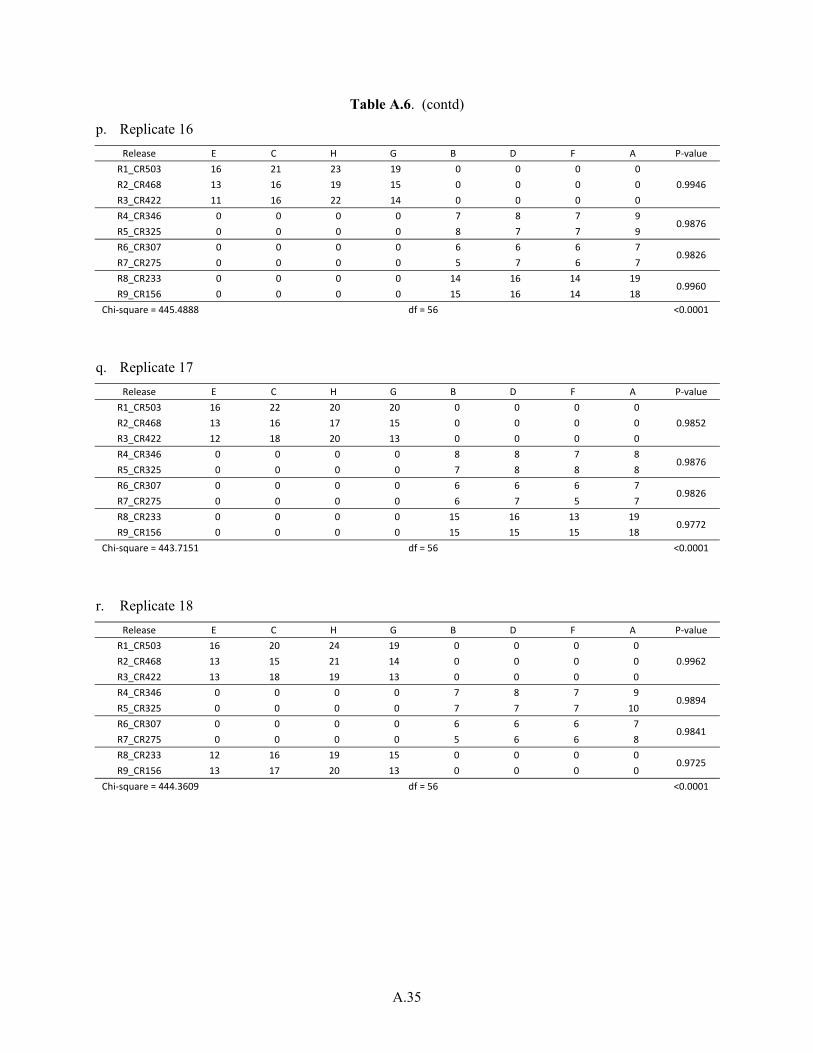
A.35
Table A.6. (contd)
p. Replicate 16
Release E C H G B D F A P-value R1_CR503 16 21 23 19 0 0 0 0
0.9946 R2_CR468 13 16 19 15 0 0 0 0 R3_CR422 11 16 22 14 0 0 0 0 R4_CR346 0 0 0 0 7 8 7 9
0.9876 R5_CR325 0 0 0 0 8 7 7 9 R6_CR307 0 0 0 0 6 6 6 7
0.9826 R7_CR275 0 0 0 0 5 7 6 7 R8_CR233 0 0 0 0 14 16 14 19
0.9960 R9_CR156 0 0 0 0 15 16 14 18
Chi-square = 445.4888 df = 56 <0.0001
q. Replicate 17
Release E C H G B D F A P-value R1_CR503 16 22 20 20 0 0 0 0
0.9852 R2_CR468 13 16 17 15 0 0 0 0 R3_CR422 12 18 20 13 0 0 0 0 R4_CR346 0 0 0 0 8 8 7 8
0.9876 R5_CR325 0 0 0 0 7 8 8 8 R6_CR307 0 0 0 0 6 6 6 7
0.9826 R7_CR275 0 0 0 0 6 7 5 7 R8_CR233 0 0 0 0 15 16 13 19
0.9772 R9_CR156 0 0 0 0 15 15 15 18
Chi-square = 443.7151 df = 56 <0.0001
r. Replicate 18
Release E C H G B D F A P-value R1_CR503 16 20 24 19 0 0 0 0
0.9962 R2_CR468 13 15 21 14 0 0 0 0 R3_CR422 13 18 19 13 0 0 0 0 R4_CR346 0 0 0 0 7 8 7 9
0.9894 R5_CR325 0 0 0 0 7 7 7 10 R6_CR307 0 0 0 0 6 6 6 7
0.9841 R7_CR275 0 0 0 0 5 6 6 8 R8_CR233 12 16 19 15 0 0 0 0
0.9725 R9_CR156 13 17 20 13 0 0 0 0
Chi-square = 444.3609 df = 56 <0.0001
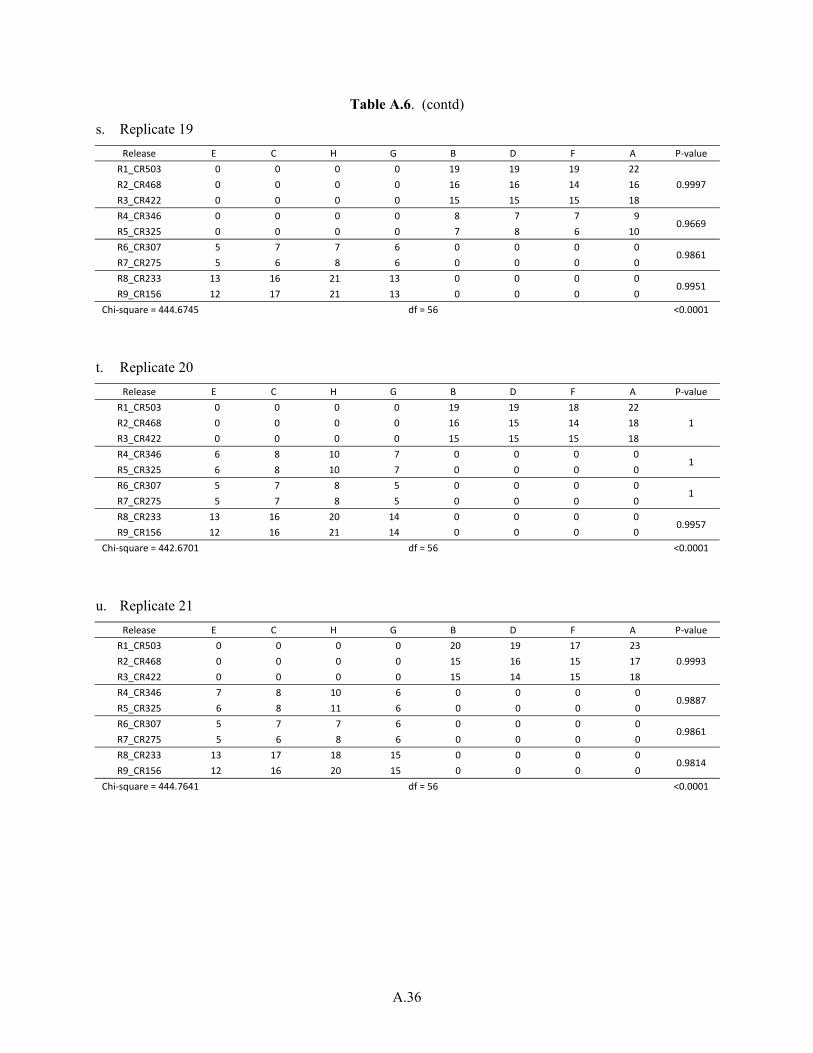
A.36
Table A.6. (contd)
s. Replicate 19
Release E C H G B D F A P-value R1_CR503 0 0 0 0 19 19 19 22
0.9997 R2_CR468 0 0 0 0 16 16 14 16 R3_CR422 0 0 0 0 15 15 15 18 R4_CR346 0 0 0 0 8 7 7 9
0.9669 R5_CR325 0 0 0 0 7 8 6 10 R6_CR307 5 7 7 6 0 0 0 0
0.9861 R7_CR275 5 6 8 6 0 0 0 0 R8_CR233 13 16 21 13 0 0 0 0
0.9951 R9_CR156 12 17 21 13 0 0 0 0
Chi-square = 444.6745 df = 56 <0.0001
t. Replicate 20
Release E C H G B D F A P-value R1_CR503 0 0 0 0 19 19 18 22
1 R2_CR468 0 0 0 0 16 15 14 18 R3_CR422 0 0 0 0 15 15 15 18 R4_CR346 6 8 10 7 0 0 0 0
1 R5_CR325 6 8 10 7 0 0 0 0 R6_CR307 5 7 8 5 0 0 0 0
1 R7_CR275 5 7 8 5 0 0 0 0 R8_CR233 13 16 20 14 0 0 0 0
0.9957 R9_CR156 12 16 21 14 0 0 0 0
Chi-square = 442.6701 df = 56 <0.0001
u. Replicate 21
Release E C H G B D F A P-value R1_CR503 0 0 0 0 20 19 17 23
0.9993 R2_CR468 0 0 0 0 15 16 15 17 R3_CR422 0 0 0 0 15 14 15 18 R4_CR346 7 8 10 6 0 0 0 0
0.9887 R5_CR325 6 8 11 6 0 0 0 0 R6_CR307 5 7 7 6 0 0 0 0
0.9861 R7_CR275 5 6 8 6 0 0 0 0 R8_CR233 13 17 18 15 0 0 0 0
0.9814 R9_CR156 12 16 20 15 0 0 0 0
Chi-square = 444.7641 df = 56 <0.0001
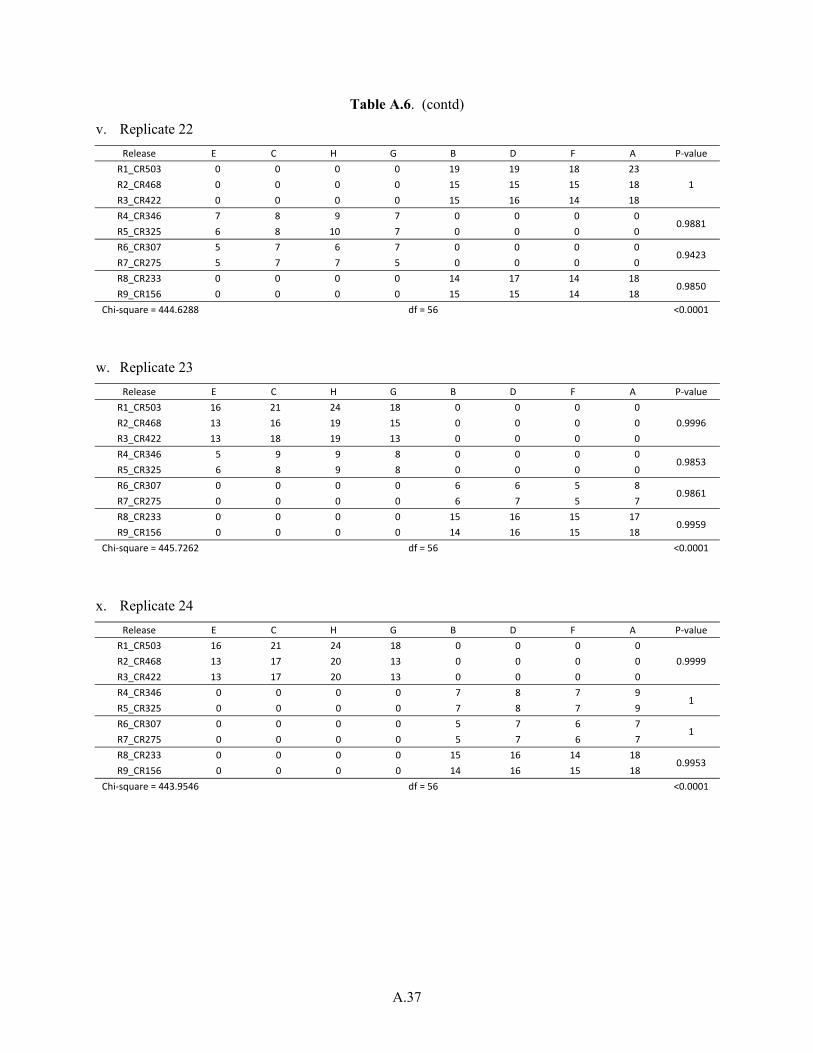
A.37
Table A.6. (contd)
v. Replicate 22
Release E C H G B D F A P-value R1_CR503 0 0 0 0 19 19 18 23
1 R2_CR468 0 0 0 0 15 15 15 18 R3_CR422 0 0 0 0 15 16 14 18 R4_CR346 7 8 9 7 0 0 0 0
0.9881 R5_CR325 6 8 10 7 0 0 0 0 R6_CR307 5 7 6 7 0 0 0 0
0.9423 R7_CR275 5 7 7 5 0 0 0 0 R8_CR233 0 0 0 0 14 17 14 18
0.9850 R9_CR156 0 0 0 0 15 15 14 18
Chi-square = 444.6288 df = 56 <0.0001
w. Replicate 23
Release E C H G B D F A P-value R1_CR503 16 21 24 18 0 0 0 0
0.9996 R2_CR468 13 16 19 15 0 0 0 0 R3_CR422 13 18 19 13 0 0 0 0 R4_CR346 5 9 9 8 0 0 0 0
0.9853 R5_CR325 6 8 9 8 0 0 0 0 R6_CR307 0 0 0 0 6 6 5 8
0.9861 R7_CR275 0 0 0 0 6 7 5 7 R8_CR233 0 0 0 0 15 16 15 17
0.9959 R9_CR156 0 0 0 0 14 16 15 18
Chi-square = 445.7262 df = 56 <0.0001
x. Replicate 24
Release E C H G B D F A P-value R1_CR503 16 21 24 18 0 0 0 0
0.9999 R2_CR468 13 17 20 13 0 0 0 0 R3_CR422 13 17 20 13 0 0 0 0 R4_CR346 0 0 0 0 7 8 7 9
1 R5_CR325 0 0 0 0 7 8 7 9 R6_CR307 0 0 0 0 5 7 6 7
1 R7_CR275 0 0 0 0 5 7 6 7 R8_CR233 0 0 0 0 15 16 14 18
0.9953 R9_CR156 0 0 0 0 14 16 15 18
Chi-square = 443.9546 df = 56 <0.0001
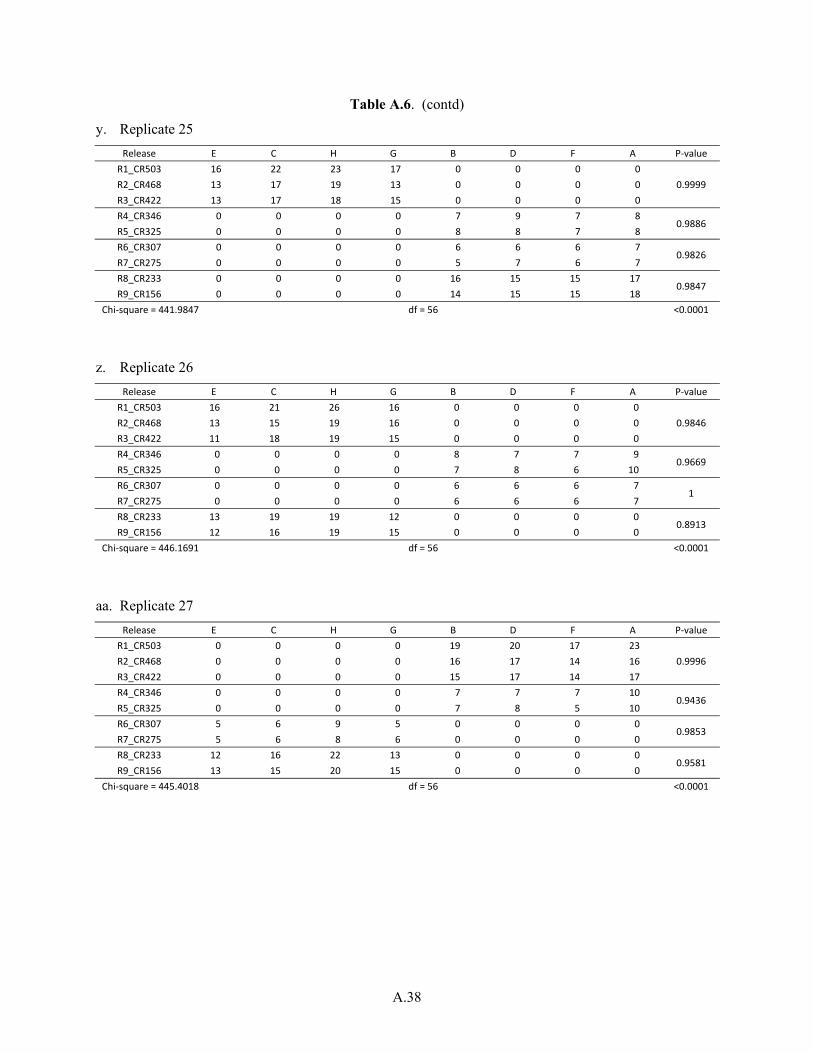
A.38
Table A.6. (contd)
y. Replicate 25
Release E C H G B D F A P-value R1_CR503 16 22 23 17 0 0 0 0
0.9999 R2_CR468 13 17 19 13 0 0 0 0 R3_CR422 13 17 18 15 0 0 0 0 R4_CR346 0 0 0 0 7 9 7 8
0.9886 R5_CR325 0 0 0 0 8 8 7 8 R6_CR307 0 0 0 0 6 6 6 7
0.9826 R7_CR275 0 0 0 0 5 7 6 7 R8_CR233 0 0 0 0 16 15 15 17
0.9847 R9_CR156 0 0 0 0 14 15 15 18
Chi-square = 441.9847 df = 56 <0.0001
z. Replicate 26
Release E C H G B D F A P-value R1_CR503 16 21 26 16 0 0 0 0
0.9846 R2_CR468 13 15 19 16 0 0 0 0 R3_CR422 11 18 19 15 0 0 0 0 R4_CR346 0 0 0 0 8 7 7 9
0.9669 R5_CR325 0 0 0 0 7 8 6 10 R6_CR307 0 0 0 0 6 6 6 7
1 R7_CR275 0 0 0 0 6 6 6 7 R8_CR233 13 19 19 12 0 0 0 0
0.8913 R9_CR156 12 16 19 15 0 0 0 0
Chi-square = 446.1691 df = 56 <0.0001
aa. Replicate 27
Release E C H G B D F A P-value R1_CR503 0 0 0 0 19 20 17 23
0.9996 R2_CR468 0 0 0 0 16 17 14 16 R3_CR422 0 0 0 0 15 17 14 17 R4_CR346 0 0 0 0 7 7 7 10
0.9436 R5_CR325 0 0 0 0 7 8 5 10 R6_CR307 5 6 9 5 0 0 0 0
0.9853 R7_CR275 5 6 8 6 0 0 0 0 R8_CR233 12 16 22 13 0 0 0 0
0.9581 R9_CR156 13 15 20 15 0 0 0 0
Chi-square = 445.4018 df = 56 <0.0001

A.39
Table A.6. (contd)
bb. Replicate 28
Release E C H G B D F A P-value R1_CR503 0 0 0 0 19 20 18 21
0.9998 R2_CR468 0 0 0 0 15 15 14 19 R3_CR422 0 0 0 0 15 16 14 18 R4_CR346 7 8 10 6 0 0 0 0
0.9847 R5_CR325 6 8 10 7 0 0 0 0 R6_CR307 5 6 7 7 0 0 0 0
0.9861 R7_CR275 5 6 8 6 0 0 0 0 R8_CR233 13 15 19 16 0 0 0 0
0.9819 R9_CR156 12 15 21 15 0 0 0 0
Chi-square = 444.2154 df = 56 <0.0001
cc. Replicate 29
Release E C H G B D F A P-value R1_CR503 0 0 0 0 19 20 17 23
1 R2_CR468 0 0 0 0 15 16 14 18 R3_CR422 0 0 0 0 15 15 15 18 R4_CR346 7 7 10 7 0 0 0 0
0.9861 R5_CR325 6 8 10 7 0 0 0 0 R6_CR307 5 6 8 6 0 0 0 0
0.9861 R7_CR275 5 7 7 6 0 0 0 0 R8_CR233 12 16 20 15 0 0 0 0
0.9881 R9_CR156 12 16 18 16 0 0 0 0
Chi-square = 443.5412 df = 56 <0.0001
dd. Replicate 30
Release E C H G B D F A P-value R1_CR503 0 0 0 0 19 21 17 22
0.9998 R2_CR468 0 0 0 0 14 17 15 17 R3_CR422 0 0 0 0 14 17 15 17 R4_CR346 6 8 9 7 0 0 0 0
0.9392 R5_CR325 6 6 10 8 0 0 0 0 R6_CR307 5 6 8 6 0 0 0 0
0.9795 R7_CR275 4 7 8 6 0 0 0 0 R8_CR233 0 0 0 0 14 16 14 19
0.9960 R9_CR156 0 0 0 0 15 16 14 18
Chi-square = 444.5203 df = 56 <0.0001

A.40
Table A.6. (contd)
ee. Replicate 31
Release E C H G B D F A P-value R1_CR503 18 22 26 21 0 0 0 0
0.9994 R2_CR468 12 13 19 15 0 0 0 0 R3_CR422 10 11 16 12 0 0 0 0 R4_CR346 5 6 7 6 0 0 0 0
0.9974 R5_CR325 5 6 8 6 0 0 0 0 R6_CR307 0 0 0 0 4 5 4 6
0.9773 R7_CR275 0 0 0 0 4 5 5 5 R8_CR233 0 0 0 0 12 13 13 17
0.9754 R9_CR156 0 0 0 0 12 15 12 16
Chi-square = 393.8158 df = 56 <0.0001
ff. Replicate 32
Release E C H G B D F A P-value R1_CR503 15 22 26 18 0 0 0 0
0.9986 R2_CR468 11 14 18 11 0 0 0 0 R3_CR422 8 12 17 11 0 0 0 0 R4_CR346 0 0 0 0 6 6 6 7
0.9951 R5_CR325 0 0 0 0 6 6 5 7 R6_CR307 0 0 0 0 5 5 4 5
0.9773 R7_CR275 0 0 0 0 4 5 4 6 R8_CR233 0 0 0 0 13 13 12 17
0.9773 R9_CR156 0 0 0 0 13 14 13 15
Chi-square = 381.9773 df = 56 <0.0001
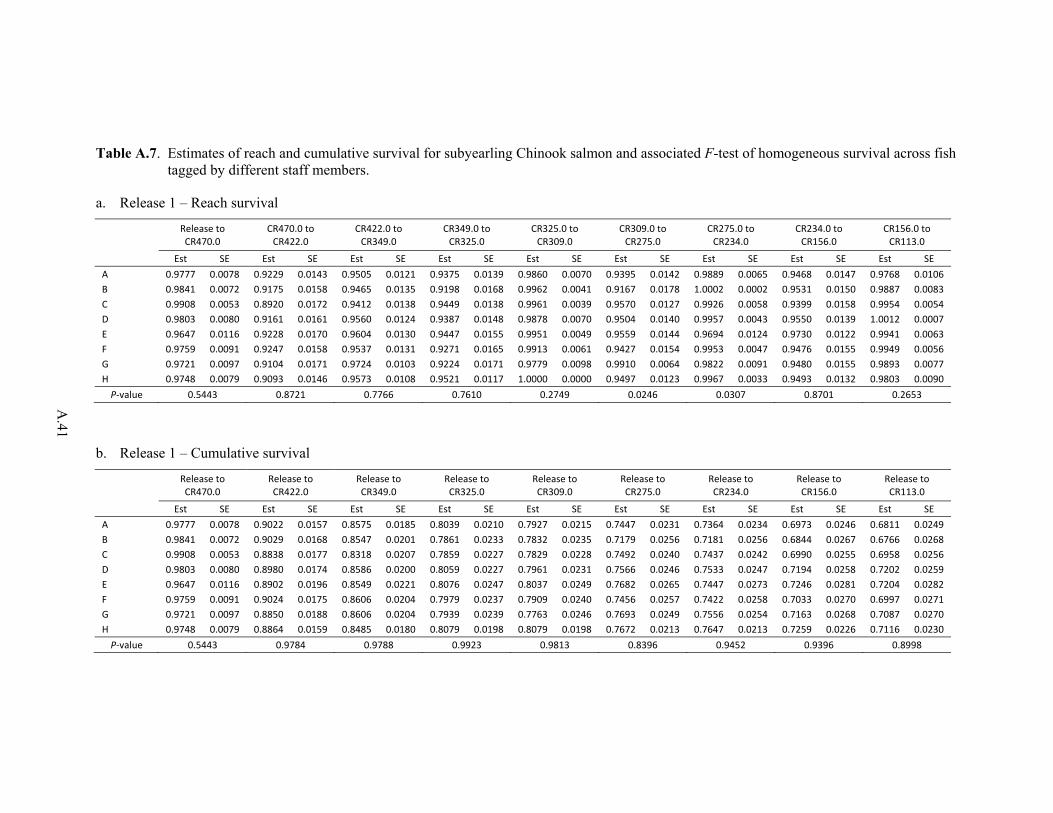
A.41
Table A.7. Estimates of reach and cumulative survival for subyearling Chinook salmon and associated F-test of homogeneous survival across fish tagged by different staff members.
a. Release 1 – Reach survival
Release to CR470.0
CR470.0 to CR422.0
CR422.0 to CR349.0
CR349.0 to CR325.0
CR325.0 to CR309.0
CR309.0 to CR275.0
CR275.0 to CR234.0
CR234.0 to CR156.0
CR156.0 to CR113.0
Est SE Est SE Est SE Est SE Est SE Est SE Est SE Est SE Est SE A 0.9777 0.0078 0.9229 0.0143 0.9505 0.0121 0.9375 0.0139 0.9860 0.0070 0.9395 0.0142 0.9889 0.0065 0.9468 0.0147 0.9768 0.0106 B 0.9841 0.0072 0.9175 0.0158 0.9465 0.0135 0.9198 0.0168 0.9962 0.0041 0.9167 0.0178 1.0002 0.0002 0.9531 0.0150 0.9887 0.0083 C 0.9908 0.0053 0.8920 0.0172 0.9412 0.0138 0.9449 0.0138 0.9961 0.0039 0.9570 0.0127 0.9926 0.0058 0.9399 0.0158 0.9954 0.0054 D 0.9803 0.0080 0.9161 0.0161 0.9560 0.0124 0.9387 0.0148 0.9878 0.0070 0.9504 0.0140 0.9957 0.0043 0.9550 0.0139 1.0012 0.0007 E 0.9647 0.0116 0.9228 0.0170 0.9604 0.0130 0.9447 0.0155 0.9951 0.0049 0.9559 0.0144 0.9694 0.0124 0.9730 0.0122 0.9941 0.0063 F 0.9759 0.0091 0.9247 0.0158 0.9537 0.0131 0.9271 0.0165 0.9913 0.0061 0.9427 0.0154 0.9953 0.0047 0.9476 0.0155 0.9949 0.0056 G 0.9721 0.0097 0.9104 0.0171 0.9724 0.0103 0.9224 0.0171 0.9779 0.0098 0.9910 0.0064 0.9822 0.0091 0.9480 0.0155 0.9893 0.0077 H 0.9748 0.0079 0.9093 0.0146 0.9573 0.0108 0.9521 0.0117 1.0000 0.0000 0.9497 0.0123 0.9967 0.0033 0.9493 0.0132 0.9803 0.0090
P-value 0.5443 0.8721 0.7766 0.7610 0.2749 0.0246 0.0307 0.8701 0.2653
b. Release 1 – Cumulative survival
Release to CR470.0
Release to CR422.0
Release to CR349.0
Release to CR325.0
Release to CR309.0
Release to CR275.0
Release to CR234.0
Release to CR156.0
Release to CR113.0
Est SE Est SE Est SE Est SE Est SE Est SE Est SE Est SE Est SE A 0.9777 0.0078 0.9022 0.0157 0.8575 0.0185 0.8039 0.0210 0.7927 0.0215 0.7447 0.0231 0.7364 0.0234 0.6973 0.0246 0.6811 0.0249 B 0.9841 0.0072 0.9029 0.0168 0.8547 0.0201 0.7861 0.0233 0.7832 0.0235 0.7179 0.0256 0.7181 0.0256 0.6844 0.0267 0.6766 0.0268 C 0.9908 0.0053 0.8838 0.0177 0.8318 0.0207 0.7859 0.0227 0.7829 0.0228 0.7492 0.0240 0.7437 0.0242 0.6990 0.0255 0.6958 0.0256 D 0.9803 0.0080 0.8980 0.0174 0.8586 0.0200 0.8059 0.0227 0.7961 0.0231 0.7566 0.0246 0.7533 0.0247 0.7194 0.0258 0.7202 0.0259 E 0.9647 0.0116 0.8902 0.0196 0.8549 0.0221 0.8076 0.0247 0.8037 0.0249 0.7682 0.0265 0.7447 0.0273 0.7246 0.0281 0.7204 0.0282 F 0.9759 0.0091 0.9024 0.0175 0.8606 0.0204 0.7979 0.0237 0.7909 0.0240 0.7456 0.0257 0.7422 0.0258 0.7033 0.0270 0.6997 0.0271 G 0.9721 0.0097 0.8850 0.0188 0.8606 0.0204 0.7939 0.0239 0.7763 0.0246 0.7693 0.0249 0.7556 0.0254 0.7163 0.0268 0.7087 0.0270 H 0.9748 0.0079 0.8864 0.0159 0.8485 0.0180 0.8079 0.0198 0.8079 0.0198 0.7672 0.0213 0.7647 0.0213 0.7259 0.0226 0.7116 0.0230
P-value 0.5443 0.9784 0.9788 0.9923 0.9813 0.8396 0.9452 0.9396 0.8998
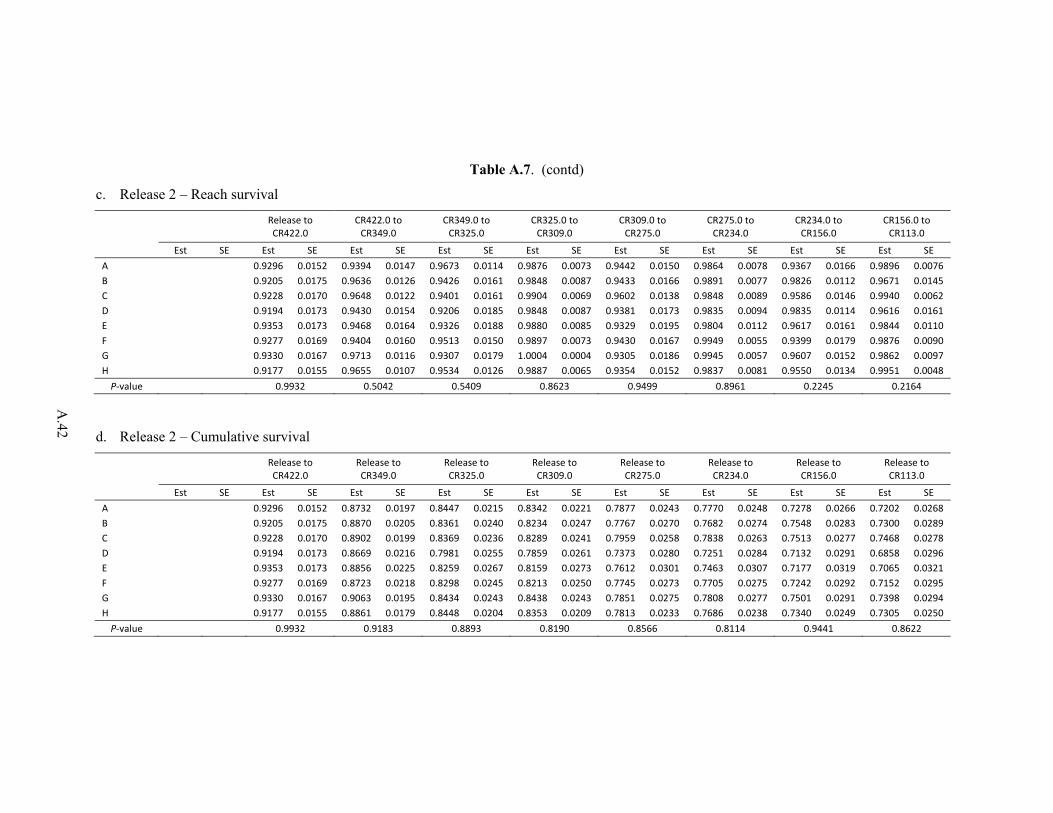
A.42
Table A.7. (contd)
c. Release 2 – Reach survival
Release to CR422.0
CR422.0 to CR349.0
CR349.0 to CR325.0
CR325.0 to CR309.0
CR309.0 to CR275.0
CR275.0 to CR234.0
CR234.0 to CR156.0
CR156.0 to CR113.0
Est SE Est SE Est SE Est SE Est SE Est SE Est SE Est SE Est SE A 0.9296 0.0152 0.9394 0.0147 0.9673 0.0114 0.9876 0.0073 0.9442 0.0150 0.9864 0.0078 0.9367 0.0166 0.9896 0.0076 B 0.9205 0.0175 0.9636 0.0126 0.9426 0.0161 0.9848 0.0087 0.9433 0.0166 0.9891 0.0077 0.9826 0.0112 0.9671 0.0145 C 0.9228 0.0170 0.9648 0.0122 0.9401 0.0161 0.9904 0.0069 0.9602 0.0138 0.9848 0.0089 0.9586 0.0146 0.9940 0.0062 D 0.9194 0.0173 0.9430 0.0154 0.9206 0.0185 0.9848 0.0087 0.9381 0.0173 0.9835 0.0094 0.9835 0.0114 0.9616 0.0161 E 0.9353 0.0173 0.9468 0.0164 0.9326 0.0188 0.9880 0.0085 0.9329 0.0195 0.9804 0.0112 0.9617 0.0161 0.9844 0.0110 F 0.9277 0.0169 0.9404 0.0160 0.9513 0.0150 0.9897 0.0073 0.9430 0.0167 0.9949 0.0055 0.9399 0.0179 0.9876 0.0090 G 0.9330 0.0167 0.9713 0.0116 0.9307 0.0179 1.0004 0.0004 0.9305 0.0186 0.9945 0.0057 0.9607 0.0152 0.9862 0.0097 H 0.9177 0.0155 0.9655 0.0107 0.9534 0.0126 0.9887 0.0065 0.9354 0.0152 0.9837 0.0081 0.9550 0.0134 0.9951 0.0048
P-value 0.9932 0.5042 0.5409 0.8623 0.9499 0.8961 0.2245 0.2164
d. Release 2 – Cumulative survival
Release to CR422.0
Release to CR349.0
Release to CR325.0
Release to CR309.0
Release to CR275.0
Release to CR234.0
Release to CR156.0
Release to CR113.0
Est SE Est SE Est SE Est SE Est SE Est SE Est SE Est SE Est SE A 0.9296 0.0152 0.8732 0.0197 0.8447 0.0215 0.8342 0.0221 0.7877 0.0243 0.7770 0.0248 0.7278 0.0266 0.7202 0.0268 B 0.9205 0.0175 0.8870 0.0205 0.8361 0.0240 0.8234 0.0247 0.7767 0.0270 0.7682 0.0274 0.7548 0.0283 0.7300 0.0289 C 0.9228 0.0170 0.8902 0.0199 0.8369 0.0236 0.8289 0.0241 0.7959 0.0258 0.7838 0.0263 0.7513 0.0277 0.7468 0.0278 D 0.9194 0.0173 0.8669 0.0216 0.7981 0.0255 0.7859 0.0261 0.7373 0.0280 0.7251 0.0284 0.7132 0.0291 0.6858 0.0296 E 0.9353 0.0173 0.8856 0.0225 0.8259 0.0267 0.8159 0.0273 0.7612 0.0301 0.7463 0.0307 0.7177 0.0319 0.7065 0.0321 F 0.9277 0.0169 0.8723 0.0218 0.8298 0.0245 0.8213 0.0250 0.7745 0.0273 0.7705 0.0275 0.7242 0.0292 0.7152 0.0295 G 0.9330 0.0167 0.9063 0.0195 0.8434 0.0243 0.8438 0.0243 0.7851 0.0275 0.7808 0.0277 0.7501 0.0291 0.7398 0.0294 H 0.9177 0.0155 0.8861 0.0179 0.8448 0.0204 0.8353 0.0209 0.7813 0.0233 0.7686 0.0238 0.7340 0.0249 0.7305 0.0250
P-value 0.9932 0.9183 0.8893 0.8190 0.8566 0.8114 0.9441 0.8622
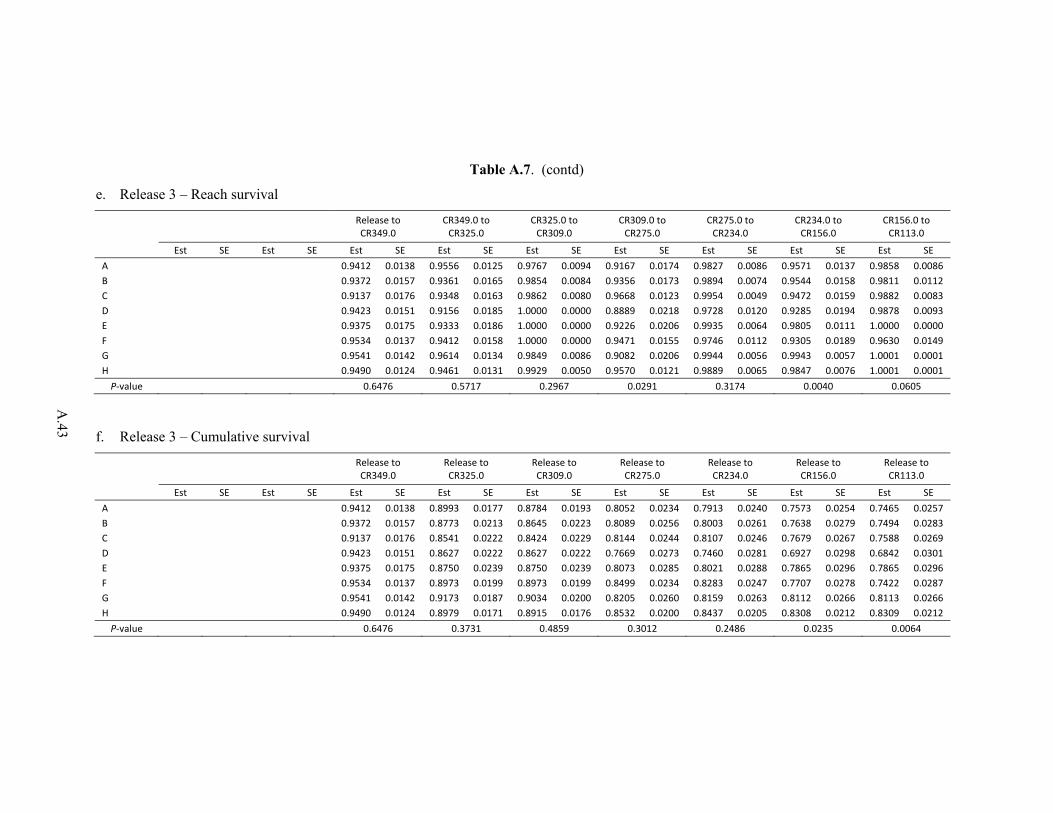
A.43
Table A.7. (contd)
e. Release 3 – Reach survival
Release to CR349.0
CR349.0 to CR325.0
CR325.0 to CR309.0
CR309.0 to CR275.0
CR275.0 to CR234.0
CR234.0 to CR156.0
CR156.0 to CR113.0
Est SE Est SE Est SE Est SE Est SE Est SE Est SE Est SE Est SE A 0.9412 0.0138 0.9556 0.0125 0.9767 0.0094 0.9167 0.0174 0.9827 0.0086 0.9571 0.0137 0.9858 0.0086 B 0.9372 0.0157 0.9361 0.0165 0.9854 0.0084 0.9356 0.0173 0.9894 0.0074 0.9544 0.0158 0.9811 0.0112 C 0.9137 0.0176 0.9348 0.0163 0.9862 0.0080 0.9668 0.0123 0.9954 0.0049 0.9472 0.0159 0.9882 0.0083 D 0.9423 0.0151 0.9156 0.0185 1.0000 0.0000 0.8889 0.0218 0.9728 0.0120 0.9285 0.0194 0.9878 0.0093 E 0.9375 0.0175 0.9333 0.0186 1.0000 0.0000 0.9226 0.0206 0.9935 0.0064 0.9805 0.0111 1.0000 0.0000 F 0.9534 0.0137 0.9412 0.0158 1.0000 0.0000 0.9471 0.0155 0.9746 0.0112 0.9305 0.0189 0.9630 0.0149 G 0.9541 0.0142 0.9614 0.0134 0.9849 0.0086 0.9082 0.0206 0.9944 0.0056 0.9943 0.0057 1.0001 0.0001 H 0.9490 0.0124 0.9461 0.0131 0.9929 0.0050 0.9570 0.0121 0.9889 0.0065 0.9847 0.0076 1.0001 0.0001
P-value 0.6476 0.5717 0.2967 0.0291 0.3174 0.0040 0.0605
f. Release 3 – Cumulative survival
Release to CR349.0
Release to CR325.0
Release to CR309.0
Release to CR275.0
Release to CR234.0
Release to CR156.0
Release to CR113.0
Est SE Est SE Est SE Est SE Est SE Est SE Est SE Est SE Est SE A 0.9412 0.0138 0.8993 0.0177 0.8784 0.0193 0.8052 0.0234 0.7913 0.0240 0.7573 0.0254 0.7465 0.0257 B 0.9372 0.0157 0.8773 0.0213 0.8645 0.0223 0.8089 0.0256 0.8003 0.0261 0.7638 0.0279 0.7494 0.0283 C 0.9137 0.0176 0.8541 0.0222 0.8424 0.0229 0.8144 0.0244 0.8107 0.0246 0.7679 0.0267 0.7588 0.0269 D 0.9423 0.0151 0.8627 0.0222 0.8627 0.0222 0.7669 0.0273 0.7460 0.0281 0.6927 0.0298 0.6842 0.0301 E 0.9375 0.0175 0.8750 0.0239 0.8750 0.0239 0.8073 0.0285 0.8021 0.0288 0.7865 0.0296 0.7865 0.0296 F 0.9534 0.0137 0.8973 0.0199 0.8973 0.0199 0.8499 0.0234 0.8283 0.0247 0.7707 0.0278 0.7422 0.0287 G 0.9541 0.0142 0.9173 0.0187 0.9034 0.0200 0.8205 0.0260 0.8159 0.0263 0.8112 0.0266 0.8113 0.0266 H 0.9490 0.0124 0.8979 0.0171 0.8915 0.0176 0.8532 0.0200 0.8437 0.0205 0.8308 0.0212 0.8309 0.0212
P-value 0.6476 0.3731 0.4859 0.3012 0.2486 0.0235 0.0064

A.44
Table A.7. (contd)
g. Release 4 – Reach survival
Release to CR325.0
CR325.0 to CR309.0
CR309.0 to CR275.0
CR275.0 to CR234.0
CR234.0 to CR156.0
CR156.0 to CR113.0
Est SE Est SE Est SE Est SE Est SE Est SE Est SE Est SE Est SE A 1.0000 0.0000 1.0000 0.0000 0.9167 0.0230 0.9932 0.0076 0.9535 0.0185 1.0003 0.0003 B 1.0000 0.0000 0.9916 0.0084 0.9576 0.0185 0.9735 0.0151 0.9545 0.0199 1.0004 0.0004 C 1.0000 0.0000 0.9921 0.0079 0.9440 0.0206 0.9831 0.0119 0.9741 0.0147 1.0000 0.0000 D 1.0000 0.0000 1.0000 0.0000 0.8908 0.0286 1.0002 0.0002 0.9830 0.0135 0.9787 0.0149 E 1.0000 0.0000 0.9898 0.0102 0.9691 0.0176 0.9894 0.0106 0.9469 0.0234 0.9891 0.0121 F 1.0000 0.0000 1.0000 0.0000 0.9483 0.0206 1.0000 0.0000 0.9737 0.0156 0.9897 0.0103 G 1.0000 0.0000 1.0000 0.0000 0.9459 0.0215 0.9905 0.0095 0.9712 0.0164 1.0000 0.0000 H 0.9935 0.0065 0.9934 0.0066 0.9404 0.0193 0.9932 0.0070 0.9722 0.0141 0.9919 0.0080
P-value 0.9966 0.9572 0.2388 0.5865 0.8045 0.6814
h. Release 4 – Cumulative survival
Release to CR325.0
Release to CR309.0
Release to CR275.0
Release to CR234.0
Release to CR156.0
Release to CR113.0
Est SE Est SE Est SE Est SE Est SE Est SE Est SE Est SE Est SE A 1.0000 0.0000 1.0000 0.0000 0.9167 0.0230 0.9104 0.0239 0.8681 0.0282 0.8683 0.0282 B 1.0000 0.0000 0.9916 0.0084 0.9496 0.0201 0.9244 0.0242 0.8824 0.0295 0.8827 0.0295 C 1.0000 0.0000 0.9921 0.0079 0.9365 0.0217 0.9206 0.0241 0.8968 0.0271 0.8968 0.0271 D 1.0000 0.0000 1.0000 0.0000 0.8908 0.0286 0.8909 0.0286 0.8758 0.0305 0.8571 0.0321 E 1.0000 0.0000 0.9898 0.0102 0.9592 0.0200 0.9490 0.0222 0.8986 0.0306 0.8888 0.0319 F 1.0000 0.0000 1.0000 0.0000 0.9483 0.0206 0.9483 0.0206 0.9233 0.0249 0.9138 0.0261 G 1.0000 0.0000 1.0000 0.0000 0.9459 0.0215 0.9369 0.0231 0.9099 0.0272 0.9099 0.0272 H 0.9935 0.0065 0.9869 0.0092 0.9281 0.0209 0.9218 0.0217 0.8961 0.0248 0.8889 0.0254
P-value 0.9966 0.9159 0.4336 0.6888 0.8919 0.8673

A.45
Table A.7. (contd)
i. Release 5 – Reach survival
Release to CR309.0
CR309.0 to CR275.0
CR275.0 to CR234.0
CR234.0 to CR156.0
CR156.0 to CR113.0
Est SE Est SE Est SE Est SE Est SE Est SE Est SE Est SE Est SE A 0.9931 0.0069 0.9510 0.0180 1.0002 0.0002 0.9787 0.0127 0.9840 0.0112 B 0.9832 0.0118 0.9402 0.0219 1.0015 0.0012 0.9252 0.0254 1.0000 0.0000 C 1.0000 0.0000 0.9187 0.0246 1.0002 0.0003 0.9732 0.0153 1.0003 0.0003 D 0.9918 0.0082 0.9752 0.0141 1.0000 0.0000 0.9658 0.0168 1.0003 0.0004 E 0.9892 0.0107 0.9130 0.0294 0.9881 0.0118 0.9639 0.0205 1.0015 0.0012 F 0.9910 0.0090 0.9545 0.0199 1.0000 0.0000 0.9631 0.0187 0.9891 0.0111 G 1.0000 0.0000 0.9561 0.0192 1.0004 0.0004 0.9630 0.0182 1.0000 0.0000 H 0.9809 0.0109 0.9610 0.0156 1.0002 0.0003 0.9667 0.0150 0.9936 0.0077
P-value 0.8337 0.4055 0.5798 0.6072 0.5697
j. Release 5 – Cumulative survival
Release to CR309.0
Release to CR275.0
Release to CR234.0
Release to CR156.0
Release to CR113.0
Est SE Est SE Est SE Est SE Est SE Est SE Est SE Est SE Est SE A 0.9931 0.0069 0.9444 0.0191 0.9446 0.0191 0.9245 0.0222 0.9097 0.0239 B 0.9832 0.0118 0.9244 0.0242 0.9257 0.0243 0.8565 0.0322 0.8565 0.0322 C 1.0000 0.0000 0.9187 0.0246 0.9189 0.0247 0.8943 0.0277 0.8945 0.0277 D 0.9918 0.0082 0.9672 0.0161 0.9672 0.0161 0.9341 0.0225 0.9345 0.0225 E 0.9892 0.0107 0.9032 0.0307 0.8925 0.0321 0.8602 0.0360 0.8615 0.0360 F 0.9910 0.0090 0.9459 0.0215 0.9459 0.0215 0.9110 0.0272 0.9011 0.0284 G 1.0000 0.0000 0.9561 0.0192 0.9565 0.0192 0.9211 0.0253 0.9211 0.0253 H 0.9809 0.0109 0.9427 0.0186 0.9429 0.0186 0.9115 0.0228 0.9056 0.0235
P-value 0.8337 0.5108 0.3564 0.3386 0.4658

A.46
Table A.7. (contd)
k. Release 6 – Reach survival
Release to CR275.0
CR275.0 to CR234.0
CR234.0 to CR156.0
CR156.0 to CR113.0
Est SE Est SE Est SE Est SE Est SE Est SE Est SE Est SE Est SE A 1.0000 0.0000 1.0000 0.0000 0.9474 0.0209 1.0000 0.0000 B 1.0000 0.0000 1.0000 0.0000 0.9780 0.0154 1.0000 0.0000 C 0.9905 0.0095 0.9905 0.0096 0.9916 0.0099 0.9895 0.0112 D 0.9894 0.0106 1.0002 0.0003 0.9795 0.0153 0.9879 0.0121 E 1.0000 0.0000 0.9753 0.0172 0.9873 0.0126 1.0000 0.0000 F 0.9775 0.0157 0.9774 0.0161 0.9654 0.0203 0.9867 0.0132 G 0.9889 0.0110 1.0000 0.0000 0.9775 0.0157 1.0000 0.0000 H 1.0000 0.0000 0.9923 0.0080 0.9590 0.0179 1.0005 0.0005
P-value 0.8550 0.6237 0.5666 0.9283
l. Release 6 – Cumulative survival
Release to CR275.0
Release to CR234.0
Release to CR156.0
Release to CR113.0
Est SE Est SE Est SE Est SE Est SE Est SE Est SE Est SE Est SE A 1.0000 0.0000 1.0000 0.0000 0.9474 0.0209 0.9474 0.0209 B 1.0000 0.0000 1.0000 0.0000 0.9780 0.0154 0.9780 0.0154 C 0.9905 0.0095 0.9810 0.0133 0.9728 0.0163 0.9626 0.0187 D 0.9894 0.0106 0.9896 0.0106 0.9693 0.0182 0.9576 0.0208 E 1.0000 0.0000 0.9753 0.0172 0.9630 0.0210 0.9630 0.0210 F 0.9775 0.0157 0.9555 0.0220 0.9224 0.0286 0.9101 0.0303 G 0.9889 0.0110 0.9889 0.0110 0.9667 0.0189 0.9667 0.0189 H 1.0000 0.0000 0.9923 0.0080 0.9516 0.0193 0.9520 0.0193
P-value 0.8550 0.4015 0.5931 0.4837

A.47
Table A.7. (contd)
m. Release 7 – Reach survival
Release to CR234.0
CR234.0 to CR156.0
CR156.0 to CR113.0
Est SE Est SE Est SE Est SE Est SE Est SE Est SE Est SE Est SE A 1.0000 0.0000 0.9729 0.0157 0.9901 0.0099 B 0.9886 0.0113 0.9770 0.0161 1.0006 0.0007 C 1.0001 0.0001 0.9911 0.0099 0.9792 0.0146 D 0.9607 0.0194 0.9700 0.0178 0.9881 0.0118 E 1.0000 0.0000 0.9872 0.0127 1.0000 0.0000 F 0.9891 0.0111 0.9773 0.0159 1.0001 0.0002 G 1.0000 0.0000 0.9667 0.0189 1.0000 0.0000 H 1.0010 0.0007 0.9597 0.0177 1.0000 0.0000
P-value 0.1548 0.8860 0.6569
n. Release 7 – Cumulative survival
Release to CR234.0
Release to CR156.0
Release to CR113.0
Est SE Est SE Est SE Est SE Est SE Est SE Est SE Est SE Est SE A 1.0000 0.0000 0.9729 0.0157 0.9633 0.0180 B 0.9886 0.0113 0.9659 0.0193 0.9665 0.0194 C 1.0001 0.0001 0.9912 0.0098 0.9706 0.0167 D 0.9607 0.0194 0.9319 0.0253 0.9208 0.0269 E 1.0000 0.0000 0.9872 0.0127 0.9872 0.0127 F 0.9891 0.0111 0.9667 0.0189 0.9668 0.0189 G 1.0000 0.0000 0.9667 0.0189 0.9667 0.0189 H 1.0010 0.0007 0.9606 0.0173 0.9606 0.0173
P-value 0.1548 0.4022 0.4429
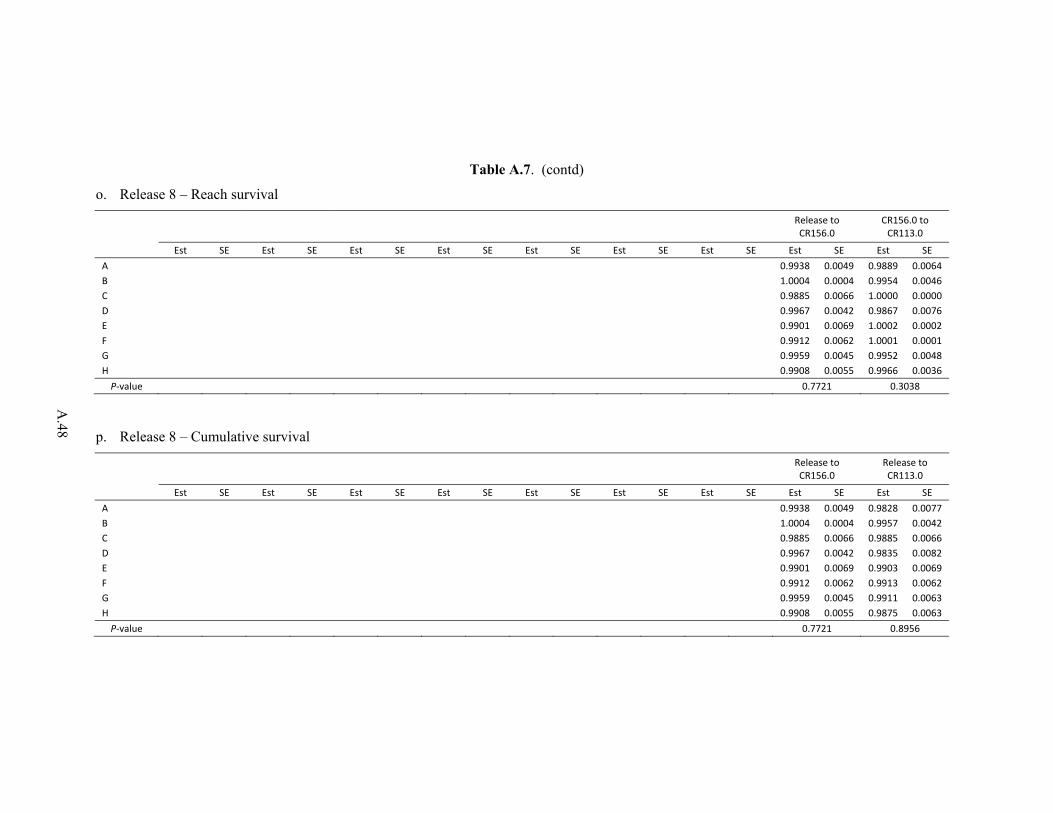
A.48
Table A.7. (contd)
o. Release 8 – Reach survival
Release to CR156.0
CR156.0 to CR113.0
Est SE Est SE Est SE Est SE Est SE Est SE Est SE Est SE Est SE A 0.9938 0.0049 0.9889 0.0064 B 1.0004 0.0004 0.9954 0.0046 C 0.9885 0.0066 1.0000 0.0000 D 0.9967 0.0042 0.9867 0.0076 E 0.9901 0.0069 1.0002 0.0002 F 0.9912 0.0062 1.0001 0.0001 G 0.9959 0.0045 0.9952 0.0048 H 0.9908 0.0055 0.9966 0.0036
P-value 0.7721 0.3038
p. Release 8 – Cumulative survival
Release to CR156.0
Release to CR113.0
Est SE Est SE Est SE Est SE Est SE Est SE Est SE Est SE Est SE A 0.9938 0.0049 0.9828 0.0077 B 1.0004 0.0004 0.9957 0.0042 C 0.9885 0.0066 0.9885 0.0066 D 0.9967 0.0042 0.9835 0.0082 E 0.9901 0.0069 0.9903 0.0069 F 0.9912 0.0062 0.9913 0.0062 G 0.9959 0.0045 0.9911 0.0063 H 0.9908 0.0055 0.9875 0.0063
P-value 0.7721 0.8956

A.49
Table A.7. (contd)
q. Release 9 – Reach survival
Release to
CR113.0
Est SE Est SE Est SE Est SE Est SE Est SE Est SE Est SE Est SE A 1.0000 0.0000 B 1.0001 0.0001 C 1.0003 0.0003 D 1.0000 0.0000 E 0.9900 0.0071 F 0.9914 0.0060 G 1.0000 0.0000 H 1.0001 0.0001
P-value 0.3604
r. Release 9 – Cumulative survival
Release to CR113.0
Est SE Est SE Est SE Est SE Est SE Est SE Est SE Est SE Est SE A 1.0000 0.0000 B 1.0001 0.0001 C 1.0003 0.0003 D 1.0000 0.0000 E 0.9900 0.0071 F 0.9914 0.0060 G 1.0000 0.0000 H 1.0001 0.0001
P-value 0.3604
A.50
A.2 Examination of Delayed Handling Effects
A.2.1 Spring Study
The purpose of these tests was to assess whether downstream reach survivals were affected by how far upstream yearling and subyearling Chinook salmon and juvenile steelhead were released. Results were used to determine which release groups were used in the construction of virtual-release groups at John Day Dam.
One of the 10 tests (i.e., 10%) of the reach survival comparisons was significant at α = 0.10 (Table A.8). In many instances, upriver releases of fish had equal or higher survival than fish released further downriver. Comparisons of cumulative survivals in reaches common to multiple release groups found 1 of 18 tests significant at α = 0.10 (i.e., 5.6%) (Table A.9). Once again, there was no relationship between time in-river and cumulative downriver survival.
Consequently, no evidence was found in the spring studies that would indicate delayed handling/tag effects. Therefore, fish from releases R1, . . ., R3 were used in forming the virtual-release group at John Day Dam.

A.51
Table A.8. Comparison of reach survivals between tag releases from different upstream locations for a) yearling Chinook salmon and b) steelhead during the 2012 spring JSATS survival study in the Columbia River. Newly released and previously released fish were not compared within a reach (shaded).
a. Yearling Chinook salmon
Reach
CR503 CR468 CR422 CR346 CR325 P (F-test) Est SE Est SE Est SE Est SE Est SE
Release to CR422 0.9060 0.0085 0.9288 0.0082 CR422 to CR349 0.9506 0.0063 0.9743 0.0052 0.9498 0.0070 0.0037 CR349 to CR325 0.9712 0.0049 0.9568 0.0063 0.9582 0.0060 1.0004 0.0024 0.1500 CR325 to CR309 0.9911 0.0029 0.9908 0.0031 0.9894 0.0032 0.9844 0.0040 0.9896 0.0041 0.4547 CR309 to CR234 0.9357 0.0076 0.9434 0.0075 0.9414 0.0074 0.9474 0.0074 0.9313 0.0083 0.5960 CR234 to CR156 (λ) 0.9271 0.0083 0.9367 0.0080 0.9274 0.0084 0.9530 0.0071 0.9369 0.0082 0.1412
b. Steelhead
Reach
CR503 CR468 CR422 CR346 CR325 P (F-test) Est SE Est SE Est SE Est SE Est SE
Release to CR422 0.8521 0.0095 0.9149 0.0081 CR422 to CR349 0.9489 0.0064 0.9335 0.0075 0.9366 0.0070 0.1183 CR349 to CR325 0.9724 0.0049 0.9783 0.0046 0.9685 0.0052 0.9860 0.0037 0.3637 CR325 to CR309 0.9984 0.0013 0.9950 0.0022 0.9926 0.0026 0.9940 0.0025 0.9751 0.0049 0.2897 CR309 to CR234 0.9574 0.0063 0.9523 0.0069 0.9645 0.0058 0.9599 0.0064 0.9459 0.0074 0.3157 CR234 to CR156 (λ) 0.9054 0.0092 0.9107 0.0094 0.9124 0.0089 0.9300 0.0084 0.9237 0.0088 0.2778

A.52
Table A.9. Comparison of cumulative survivals between tag releases from different upstream locations for a) yearling Chinook salmon and b) steelhead during the 2012 spring JSATS survival study in the Columbia River.
a. Yearling Chinook salmon
CR503 CR468 Reach Est SE Est SE P (F-test)
CR422 to CR349 0.9506 0.0063 0.9743 0.0051 0.0035 CR422 to CR325 0.9232 0.0078 0.9322 0.0078 0.4146 CR422 to CR309 0.9149 0.0082 0.9236 0.0083 0.4559 CR422 to CR234 0.8561 0.0104 0.8714 0.0105 0.3005
CR503 CR468 CR422
Reach Est SE Est SE Est SE P (F-test) CR349 to CR325 0.9712 0.0049 0.9568 0.0063 0.9581 0.0060 0.1482 CR349 to CR309 0.9625 0.0056 0.9480 0.0069 0.9480 0.0067 0.1831 CR349 to CR234 0.9005 0.0090 0.8943 0.0096 0.8925 0.0095 0.8182
CR503 CR468 CR422 CR346
Reach Est SE Est SE Est SE Est SE P (F-test) CR325 to CR309 0.9911 0.0029 0.9908 0.0031 0.9894 0.0032 0.9844 0.0040 0.4547 CR325 to CR234 0.9273 0.0080 0.9346 0.0079 0.9315 0.0079 0.9325 0.0082 0.9316
b. Steelhead
CR503 CR468 Reach Est SE Est SE P (F-test)
CR422 to CR349 0.9489 0.0064 0.9335 0.0075 0.1183 CR422 to CR325 0.9235 0.0077 0.9132 0.0085 0.3692 CR422 to CR309 0.9220 0.0078 0.9087 0.0087 0.2550 CR422 to CR234 0.8827 0.0095 0.8654 0.0104 0.2194
CR503 CR468 CR422
Reach Est SE Est SE Est SE P (F-test) CR349 to CR325 0.9724 0.0049 0.9783 0.0046 0.9685 0.0052 0.3637 CR349 to CR309 0.9708 0.0050 0.9735 0.0051 0.9613 0.0058 0.2333 CR349 to CR234 0.9303 0.0078 0.9271 0.0083 0.9272 0.0079 0.9496
CR503 CR468 CR422 CR346
Reach Est SE Est SE Est SE Est SE P (F-test) CR325 to CR309 0.9983 0.0013 0.9950 0.0022 0.9926 0.0026 0.9940 0.0025 0.3065 CR325 to CR234 0.9567 0.0064 0.9475 0.0072 0.9574 0.0063 0.9541 0.0067 0.7108

A.53
A.2.2 Summer Study
Both the tests of homogeneous reach survival and cumulative survivals were significant in the last four or so reaches (Table A.10 and Table A.11). Further examination of the cumulative survivals indicated release groups R1, R2, and R3 had depressed survivals in the reach CR325 and below. P-values for tests of homogeneous cumulative survival became nonsignificant when these release groups were omitted from analyses below CR325 (Table A.11).
Releases R1–R3 were used in the analyses conducted at McNary, John Day, and The Dalles dams but not in the Bonneville Dam survival analysis or for the associated Fish Accords at that dam. No other release groups required omission in forming virtual-release groups (i.e., V1) at the other three dams.
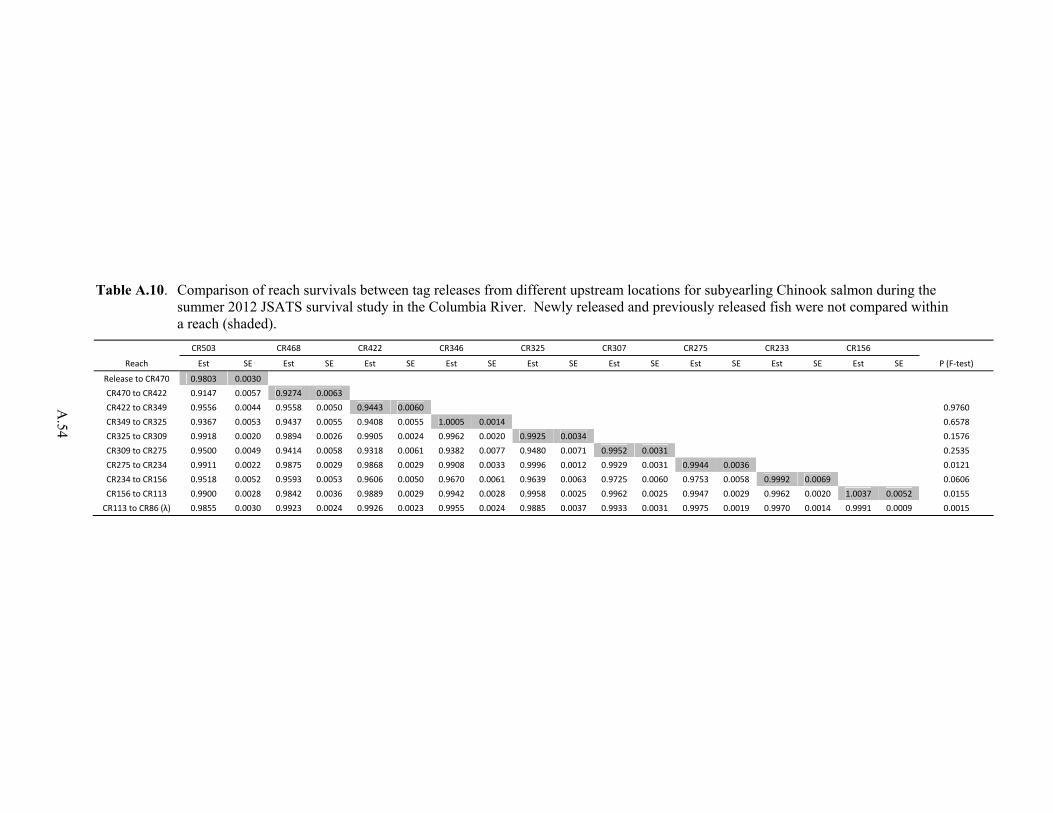
A.54
Table A.10. Comparison of reach survivals between tag releases from different upstream locations for subyearling Chinook salmon during the summer 2012 JSATS survival study in the Columbia River. Newly released and previously released fish were not compared within a reach (shaded).
CR503 CR468 CR422 CR346 CR325 CR307 CR275 CR233 CR156
Reach Est SE Est SE Est SE Est SE Est SE Est SE Est SE Est SE Est SE P (F-test)
Release to CR470 0.9803 0.0030 CR470 to CR422 0.9147 0.0057 0.9274 0.0063 CR422 to CR349 0.9556 0.0044 0.9558 0.0050 0.9443 0.0060 0.9760 CR349 to CR325 0.9367 0.0053 0.9437 0.0055 0.9408 0.0055 1.0005 0.0014 0.6578 CR325 to CR309 0.9918 0.0020 0.9894 0.0026 0.9905 0.0024 0.9962 0.0020 0.9925 0.0034 0.1576 CR309 to CR275 0.9500 0.0049 0.9414 0.0058 0.9318 0.0061 0.9382 0.0077 0.9480 0.0071 0.9952 0.0031 0.2535 CR275 to CR234 0.9911 0.0022 0.9875 0.0029 0.9868 0.0029 0.9908 0.0033 0.9996 0.0012 0.9929 0.0031 0.9944 0.0036 0.0121 CR234 to CR156 0.9518 0.0052 0.9593 0.0053 0.9606 0.0050 0.9670 0.0061 0.9639 0.0063 0.9725 0.0060 0.9753 0.0058 0.9992 0.0069 0.0606 CR156 to CR113 0.9900 0.0028 0.9842 0.0036 0.9889 0.0029 0.9942 0.0028 0.9958 0.0025 0.9962 0.0025 0.9947 0.0029 0.9962 0.0020 1.0037 0.0052 0.0155
CR113 to CR86 (λ) 0.9855 0.0030 0.9923 0.0024 0.9926 0.0023 0.9955 0.0024 0.9885 0.0037 0.9933 0.0031 0.9975 0.0019 0.9970 0.0014 0.9991 0.0009 0.0015

A.55
Table A.11. Comparison of cumulative survivals between tag releases from different upstream locations for subyearling Chinook salmon during the 2012 summer JSATS survival study in the Columbia River. P-values for tests of homogeneity were computed using all release groups, omitting release R1, omitting releases R1 and R2, or omitting releases R1, R2, and R3.
CR503 (R1) CR468 (R2)
Reach Est SE Est SE P
CR422 to CR349 0.9556 0.0048 0.9558 0.0050 0.9770
CR422 to CR325 0.8952 0.0069 0.9019 0.0071 0.4986
CR422 to CR309 0.8878 0.0072 0.8924 0.0074 0.6559
CR422 to CR275 0.8434 0.0082 0.8401 0.0087 0.7825
CR422 to CR234 0.8359 0.0086 0.8296 0.0090 0.6128
CR422 to CR156 0.7956 0.0095 0.7958 0.0097 0.9882
CR422 to CR113 0.7877 0.0098 0.7833 0.0099 0.7521
CR503 (R1) CR468 (R2) CR422 (R3)
Reach Est SE Est SE Est SE P P -r1
CR349 to CR325 0.9367 0.0053 0.9437 0.0055 0.9413 0.0055 0.6515 0.7577
CR349 to CR309 0.9290 0.0056 0.9337 0.0060 0.9323 0.0060 0.8445 0.8690
CR349 to CR275 0.8826 0.0070 0.8789 0.0078 0.8687 0.0081 0.4123 0.3644
CR349 to CR234 0.8747 0.0073 0.8680 0.0082 0.8573 0.0086 0.3048 0.3679
CR349 to CR156 0.8326 0.0084 0.8327 0.0091 0.8234 0.0098 0.7096 0.4868
CR349 to CR113 0.8243 0.0086 0.8195 0.0093 0.8143 0.0102 0.7530 0.7064
CR503 (R1) CR468 (R2) CR422 (R3) CR346 (R4)
Reach Est SE Est SE Est SE Est SE P P -r1 P -r1r2
CR325 to CR309 0.9918 0.0020 0.9894 0.0026 0.9905 0.0024 0.9962 0.0020 0.1576 0.0890 0.0681
CR325 to CR275 0.9422 0.0052 0.9314 0.0063 0.9230 0.0065 0.9346 0.0079 0.2191 0.4743 0.2568
CR325 to CR234 0.9338 0.0056 0.9197 0.0070 0.9108 0.0071 0.9259 0.0084 0.1304 0.3617 0.1698
CR325 to CR156 0.8888 0.0072 0.8823 0.0085 0.8749 0.0084 0.8954 0.0099 0.3672 0.2612 0.1144
CR325 to CR113 0.8799 0.0075 0.8684 0.0090 0.8652 0.0088 0.8902 0.0101 0.1761 0.1186 0.0620
CR503 (R1) CR468 (R2) CR422 (R3) CR346 (R4) CR325 (R5)
Reach Est SE Est SE Est SE Est SE Est SE P P -r1 P -r1r2 P -r1r2r3
CR309 to CR275 0.9500 0.0049 0.9414 0.0059 0.9318 0.0061 0.9382 0.0077 0.9480 0.0072 0.2597 0.3950 0.2602 0.3526
CR309 to CR234 0.9416 0.0054 0.9296 0.0065 0.9195 0.0066 0.9295 0.0083 0.9476 0.0074 0.0356 0.0493 0.0263 0.1036
CR309 to CR156 0.8962 0.0072 0.8917 0.0081 0.8832 0.0079 0.8989 0.0100 0.9133 0.0097 0.1633 0.1089 0.0706 0.3013
CR309 to CR113 0.8873 0.0076 0.8776 0.0085 0.8735 0.0082 0.8936 0.0103 0.9095 0.0102 0.0410 0.0258 0.0296 0.2727

A.56
Table A.11. (contd)
CR503 (R1) CR468 (R2) CR422 (R3) CR346 (R4) CR325 (R5) CR307 (R6)
Reach Est SE Est SE Est SE Est SE Est SE Est SE P P -r1 P -r1r2 P -r1r2r3
CR275 to CR234 0.9911 0.0023 0.9875 0.0030 0.9868 0.0029 0.9908 0.0033 0.9996 0.0012 0.9929 0.0031 0.0139 0.0091 0.0101 0.0557
CR275 to CR156 0.9434 0.0058 0.9474 0.0060 0.9479 0.0057 0.9581 0.0068 0.9635 0.0064 0.9656 0.0067 0.0490 0.1229 0.2070 0.7118
CR275 to CR113 0.9339 0.0063 0.9324 0.0067 0.9374 0.0062 0.9525 0.0072 0.9594 0.0068 0.9619 0.0070 0.0015 0.0045 0.0494 0.6166
CR503 (R1) CR468 (R2) CR422 (R3) CR346 (R4) CR325 (R5) CR307 (R6) CR275 (R7)
Reach Est SE Est SE Est SE Est SE Est SE Est SE Est SE P P -r1 P -r1r2 P -r1r2r3
CR234 to CR156 0.9518 0.0052 0.9594 0.0053 0.9606 0.0050 0.9671 0.0061 0.9639 0.0063 0.9725 0.0061 0.9753 0.0058 0.0623 0.2921 0.3769 0.5409
CR234 to CR113 0.9423 0.0057 0.9442 0.0060 0.9499 0.0056 0.9614 0.0066 0.9597 0.0066 0.9689 0.0065 0.9700 0.0064 0.0029 0.0207 0.1625 0.5917
CR503 (R1) CR468 (R2) CR422 (R3) CR346 (R4) CR325 (R5) CR307 (R6) CR275 (R7) CR233 (R8)
Reach Est SE Est SE Est SE Est SE Est SE Est SE Est SE Est SE P P -r1 P -r1r2 P -r1r2r3
CR156 to CR113 0.9902 0.0028 0.9841 0.0035 0.9889 0.0030 0.9942 0.0028 0.9957 0.0025 0.9963 0.0026 0.9947 0.0029 0.9961 0.0020 0.0161 0.0116 0.3612 0.9736

Appendix B –
Capture Histories Used in Estimating Dam Passage Survival
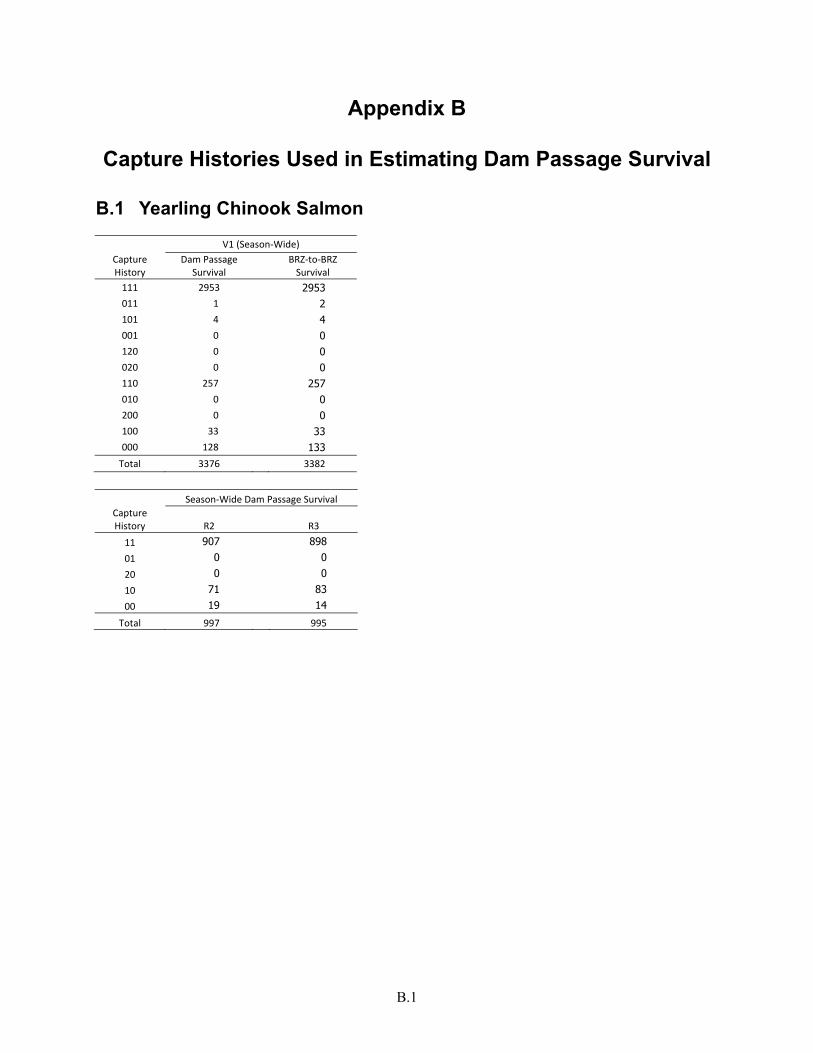
B.1
Appendix B
Capture Histories Used in Estimating Dam Passage Survival
B.1 Yearling Chinook Salmon
V1 (Season-Wide) Capture History
Dam Passage Survival
BRZ-to-BRZ Survival
111 2953 2953 011 1 2 101 4 4 001 0 0 120 0 0 020 0 0 110 257 257 010 0 0 200 0 0 100 33 33 000 128 133
Total 3376 3382
Season-Wide Dam Passage Survival
Capture History R2 R3
11 907 898
01 0 0
20 0 0
10 71 83
00 19 14
Total 997 995
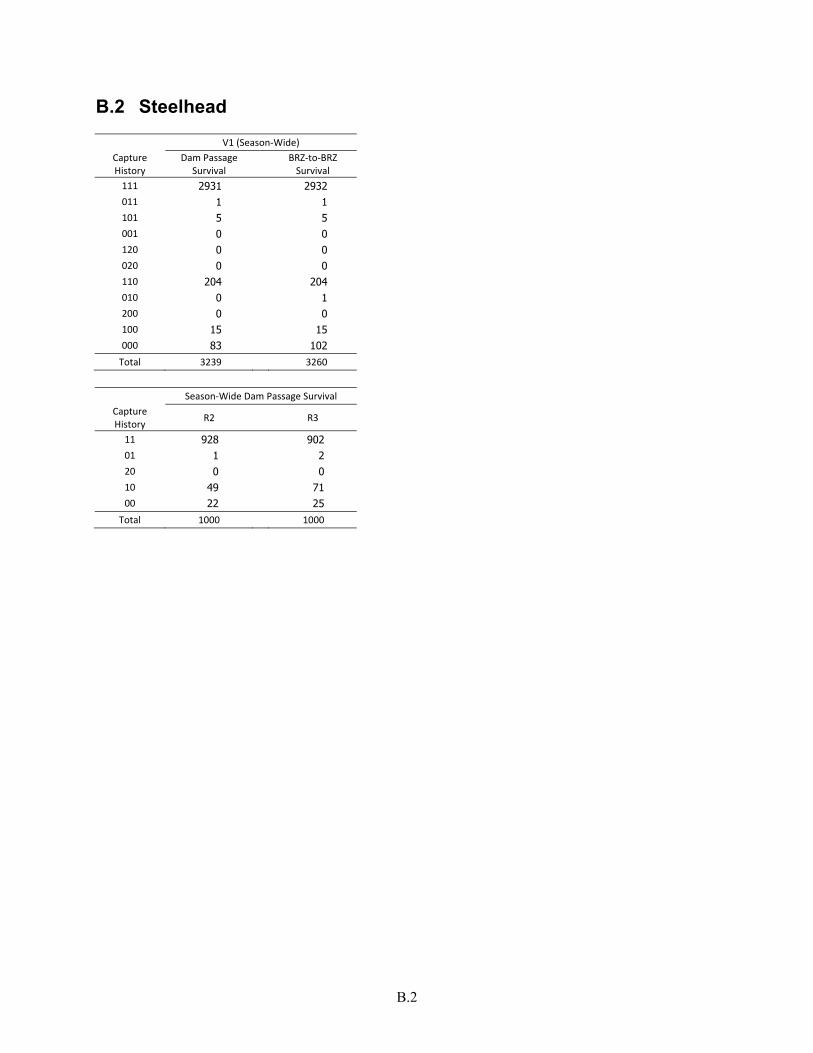
B.2
B.2 Steelhead
V1 (Season-Wide) Capture History
Dam Passage Survival
BRZ-to-BRZ Survival
111 2931 2932 011 1 1 101 5 5 001 0 0 120 0 0 020 0 0 110 204 204 010 0 1 200 0 0 100 15 15 000 83 102
Total 3239 3260
Season-Wide Dam Passage Survival
Capture History R2 R3
11 928 902 01 1 2 20 0 0 10 49 71 00 22 25
Total 1000 1000
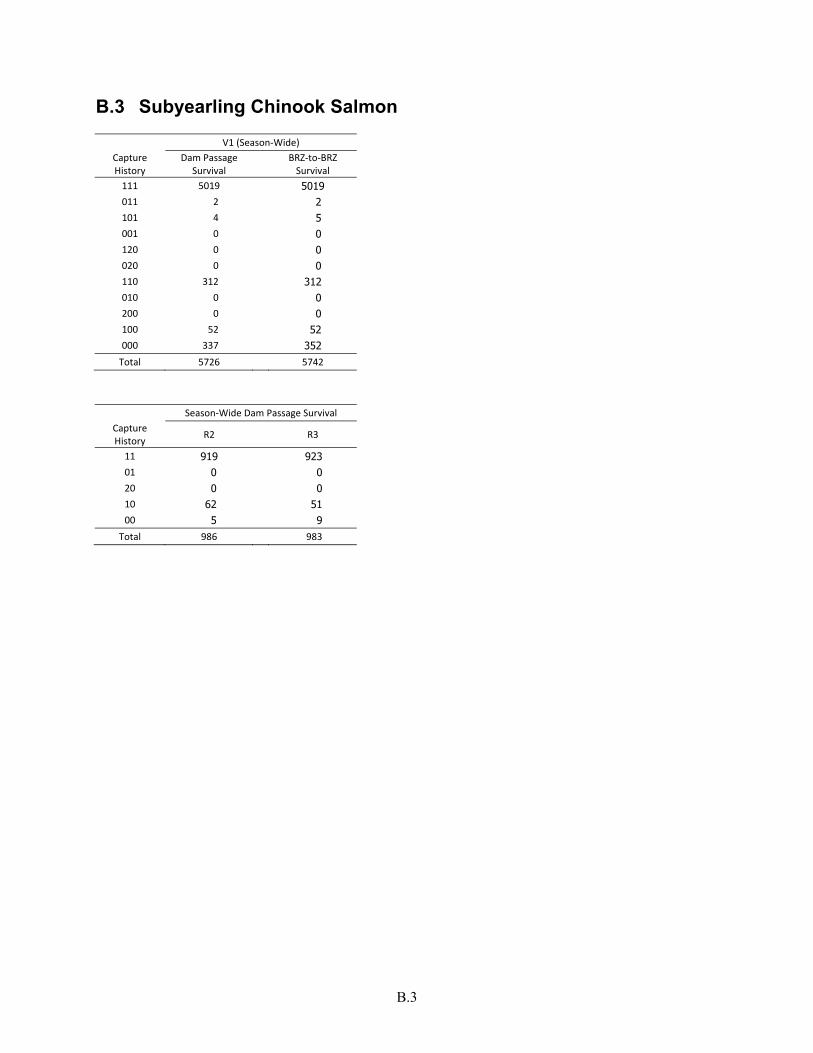
B.3
B.3 Subyearling Chinook Salmon
V1 (Season-Wide) Capture History
Dam Passage Survival
BRZ-to-BRZ Survival
111 5019 5019 011 2 2 101 4 5 001 0 0 120 0 0 020 0 0 110 312 312 010 0 0 200 0 0 100 52 52 000 337 352
Total 5726 5742
Season-Wide Dam Passage Survival Capture History R2 R3
11 919 923 01 0 0 20 0 0 10 62 51 00 5 9
Total 986 983

PNNL-22152
Distribution
No. of No. of Copies Copies
Distr.1
OFFSITE
3 Brad Eppard USACE Portland District P.O. Box 2946 Portland, OR 97204
Mike Langeslay (PDF)
USACE Portland District P.O. Box 2946 Portland, OR 97204
3 University of Washington
Columbia Basin Research Puget Sound Plaza 1325 4th Avenue, Suite 1820 Seattle, WA 98101
ATTN: AG Seaburg JR Skalski RL Townsend
ONSITE
5 Pacific Northwest National Laboratory
Tom Carlson (PDF) BPO James Hughes RCH Gary Johnson NBON Gene Ploskey* NBON Steve Schlahta (PDF) RCH Mark Weiland NBON Christa Woodley NBON PNNL Information Release (PDF) P8-55
*NBON copies sent to:
Gene Ploskey 390 Evergreen Drive P.O. Box 241 North Bonneville, WA 98639

Prepared for the U.S. Army Corps of Engineers, Portland District, under an Interagency Agreement with the U.S. Department of Energy Contract DE-AC05-76RL01830
Related Documents