COMPARITIVE STABILITY STUDIES ON RIFAMPICIN IN FIXED DOSE COMBINATIONS BETWEEN BLISTER AND STRIP PACKAGED MARKETED PRODUCTS A Dissertation submitted to THE TAMILNADU Dr.M.G.R. MEDICAL UNIVERSITY Chennai-600032 In partial fulfillment of the requirements for the award of degree of MASTER OF PHARMACY IN PHARMACEUTICS Submitted by REG. NO: 26105402 Under the Guidance of Dr. N. N. RAJENDRAN, M. Pharm., Ph.D., DEPARTMENT OF PHARMACEUTICS SWAMY VIVEKANANDHA COLLEGE OF PHARMACY ELAYAMPALAYAM TIRUCHENGODE-637205 TAMILNADU. MAY-2012 brought to you by CORE View metadata, citation and similar papers at core.ac.uk provided by ePrints@TNMGRM (Tamil Nadu Dr. M.G.R. Medical University)

Welcome message from author
This document is posted to help you gain knowledge. Please leave a comment to let me know what you think about it! Share it to your friends and learn new things together.
Transcript

COMPARITIVE STABILITY STUDIES ON RIFAMPICIN IN FIXED
DOSE COMBINATIONS BETWEEN BLISTER AND STRIP
PACKAGED MARKETED PRODUCTS
A Dissertation submitted to
THE TAMILNADU Dr.M.G.R. MEDICAL UNIVERSITY
Chennai-600032
In partial fulfillment of the requirements for the award of degree of
MASTER OF PHARMACY
IN
PHARMACEUTICS
Submitted by
REG. NO: 26105402
Under the Guidance of
Dr. N. N. RAJENDRAN, M. Pharm., Ph.D.,
DEPARTMENT OF PHARMACEUTICS
SWAMY VIVEKANANDHA COLLEGE OF PHARMACY
ELAYAMPALAYAM
TIRUCHENGODE-637205
TAMILNADU.
MAY-2012
brought to you by COREView metadata, citation and similar papers at core.ac.uk
provided by ePrints@TNMGRM (Tamil Nadu Dr. M.G.R. Medical University)

CERTIFICATESCERTIFICATESCERTIFICATESCERTIFICATES

SWAMY VIVEKANANDHA COLLEGE OF PHARMACYElayampalaym, Tiruchengode, 637205Namakkal (DT), Tamilnadu.Phone: 04288-234417 (8lines)Fax: 04288-234417
Dr. M. P. NARMADHA, M. Pharm., Ph.D.,
Principal
CERTIFICATE
This is to certify that the Dissertation entitled “COMPARITIVE STABILITY
STUDIES ON RIFAMPICIN IN FIXED DOSE COMBINATIONS BETWEEN
BLISTER AND STRIP PACKAGED MARKETED PRODUCTS’’ submitted to The
Tamilnadu Dr. M.G.R Medical University, Chennai, is a bonafide project work of
Reg. No: 26105402, in the Department of Pharmaceutics, Swamy Vivekanandha College
of Pharmacy, Tiruchengode for the partial fulfillment for the degree of Master of
Pharmacy under the guidance of Dr. N. N. RAJENDRAN, M. Pharm., Ph.D., Swamy
Vivekanandha College of Pharmacy, Tiruchengode.
Signature of the Principal
Dr. M. P. NARMADHA, M. Pharm., Ph.D.

SWAMY VIVEKANANDHA COLLEGE OF PHARMACYElayampalaym, Tiruchengode, 637205Namakkal (DT), Tamilnadu.Phone: 04288-2344178lines) Fax: 04288-234417
Dr. N. N. RAJENDRAN, M. Pharm., Ph.D.,
Director of P.G Studies and Research
CERTIFICATE
This is to certify that the Dissertation entitled “COMPARITIVE STABILITY
STUDIES ON RIFAMPICIN IN FIXED DOSE COMBINATIONS BETWEEN
BLISTER AND STRIP PACKAGED MARKETED PRODUCTS ’’ submitted to The
Tamilnadu Dr. M.G.R. Medical University, Chennai, is a bonafide project work of Reg.
No: 26105402, in the Department of Pharmaceutics, Swamy Vivekanandha College of
Pharmacy, Tiruchengode for the partial fulfillment for the degree of Master of Pharmacy
under the guidance of Dr. N. N. RAJENDRAN, M.Pharm., Ph.D.,Swamy
Vivekanandha College of Pharmacy, Tiruchengode.
Signature of Director of P.G. studies
Dr. N. N. RAJENDRAN, M. Pharm., Ph.D.

SWAMY VIVEKANANDHA COLLEGE OF PHARMACYElayampalaym, Tiruchengode, 637205Namakkal (DT), Tamilnadu.Phone: 04288-234417(8lines)Fax: 04288-234417
R. NATARAJAN, M .Pharm., (Ph.D).,
Head, Department of Pharmaceutics
CERTIFICATE
This is to certify that the Dissertation entitled “COMPARITIVE
STABILITY STUDIES ON RIFAMPICIN IN FIXED DOSE COMBINATIONS
BETWEEN BLISTER AND STRIP PACKAGED MARKETED PRODUCTS ’’
submitted to The Tamilnadu Dr. M.G.R. Medical University, Chennai, is a bonafide
project work of Reg. No: 26105402, carried out in the Department of Pharmaceutics,
Swamy Vivekanandha College of Pharmacy, Tiruchengode for the partial fulfillment for
the degree of Master of Pharmacy under my guidance.
This work is original and has not been submitted earlier for the award of any other
degree or diploma of this or any other university.
Signature of Head, Department of Pharmaceutics
R. NATARAJAN, M. Pharm., (Ph.D.)

SWAMY VIVEKANANDHA COLLEGE OF PHARMACYElayampalaym, Tiruchengode, 637205Namakkal (DT), Tamilnadu.Phone: 04288-234417(8lines)Fax: 04288-234417
Dr. N. N. RAJENDRAN, M. Pharm., Ph.D.,
Director of P.G Studies and Research
CERTIFICATE
This is to certify that the Dissertation entitled “COMPARITIVE
STABILITY STUDIES ON RIFAMPICIN IN FIXED DOSE COMBINATIONS
BETWEEN BLISTER AND STRIP PACKAGED MARKETED PRODUCTS ’’
submitted to The Tamilnadu Dr. M.G.R. Medical University, Chennai, is a bonafide
project work of Reg. No: 26105402, carried out in the Department of Pharmaceutics,
Swamy Vivekanandha College of Pharmacy, Tiruchengode for the partial fulfillment for
the degree of Master of Pharmacy under my guidance.
This work is original and has not been submitted earlier for the award of any other
degree or diploma of this or any other university.
Signature of guide
Dr. N. N. RAJENDRAN, M. Pharm., Ph.D.,

DEDICATED TO
MY PARENTS
BROTHER
AND
FRIENDS

ACKNOWLEDGEMENTACKNOWLEDGEMENTACKNOWLEDGEMENTACKNOWLEDGEMENT

ACKNOWLEDGEMENT
The Joyness, Satisfaction and euphoria that comes along with successful
completion of any work would be incomplete unless we mention names of the people
who made it possible, whose constant guidance and encouragement served as a beam of
light crowned out effects.
First and foremost I express bow down before Lord Almighty for his splendid
blessings and care in completing my project work and throughout my life till this very
second.
I render my sincere thanks to our honourable Chairman and Secretary,
VIDHYA RATNA, THIRU. DR. M. KARUNANIDHI, M.S., Ph.D, D.Litt., for
providing all facilities for my study and rendering his noble hand in the upliftment of
women education in all the disciplines.
I consider it as a great honour express my heartfelt appreciation to my guide
and Dr. N. N. RAJENDRAN, M. Pharm., Ph.D., Thank for his willingness to offer
continuous guidance, support and encouragement, which are driving forces for me to
complete this thesis. His vast knowledge, his attitude of research and skill of presentation
have been an invaluable resources to me. He is an admirable professor and will always be
a role model for me.
It is difficult to overstate my gratitude to Dr. M.P.NARMADHA, M.Pharm.,
Ph.D, Principal of this institution. Her enthusiasm and integral view on research and her
mission for providing ‘only high-quality work and not less’, has made a deep impression
on me. I owe him lots of gratitude for having me shown this way of research.
I am elated to place on record my profound sense of gratitude to Head of
department of pharmaceutics R. NATARAJAN, M.Pharm., (Ph.D). . I am grateful to both
for his caring supervision and enthusiastic involvement in this project and his supportive
suggestions and comments.

It would be unwise if I forget to express my sincere thank and gratitude to Mr.
K.MOHAN KUMAR, M.Pharm, (Ph.D.), Department of Pharmaceutics for their
immense support in all the all aspects of my study.
I express my profound sense of gratitude to Mrs. M.RANGA PRIYA,
M.Pharm, Department of Pharmaceutics for rendering her voluntary and friendly support
during my project.
I take this opportunity to tell my special thanks to Mr. M.Sekhar, Mrs. P.
Menaka, for their help and support in all my laboratory tests.
I owe my sincere thanks to my Parents, Sisters and Brother who cared for
my well-being and had spent their times in shaping my character, conduct and my life.
Without their moral support I am nothing and I dedicate all my achievements at their feet.
Friends are treasures to me and It is very difficult to overstate my thanks to all
my friends and colleagues M.Bhargavi, AnishaDas, B.Ragakeerthi, D.K.Sandeep, K.
Anusha, M.Anuradha, P.Tejaswi, K.Srividhya, K.Srihari, E.Suresh kumar,
A.Swetha, P.Gowthami,V.Pavani. It has been my happiest time to study, discuss, laugh
and play with them all.
Also, I would like to thank the Tamil Nadu Dr. M.G.R. Medical University
for providing a nice environment for learning.
I fell delighted to express my whole hearted gratitude to all those who gave
their helping hands in completing my course and my project successfully.
A. Brahmini
Reg.No:26105402

CONTENTS CONTENTS CONTENTS CONTENTS
S.NO CONTENTS PAGE

NO
1 Introduction 12 Review of literature 4
2.1 Epidemology of tuberculosis 52.2 Fixed dose combinations 62.3 Degradation of rifampicin 82.4 Methods adopted to prevent degradation of
rifampicin
9
2.5 Stability studies 102.6 TB drugs in development 133 Aim and objective 194 Plan of work 205 Drug profiles
5.1 Rifampicin 215.2 Isoniazid 245.3 Pyrazinamide 275.4 Ethambutol 306 Materials and instruments 337 Methodology 35
7.1 Physico chemical evaluation 357.2 Construction of standard curve for
Rifampicin35
7.3 In vitro dissolution study 378 Results 38
8.1 Physico chemical evaluations 388.2 Invitro drug release profile at before storage 438.3 Invitro drug release profile at 40C 46
8.4 Invitro drug release profile at 300C 568.5 Invitro drug release profile at 400C±75% RH 668.6 Percentage degradation at 40C 768.7 Percentage degradation at 300C 778.8 Percentage degradation at 400C±75% RH 789 Results and Discussion 80
10 Conclusion 8111 References 82

INTRODUCTIONINTRODUCTIONINTRODUCTIONINTRODUCTION
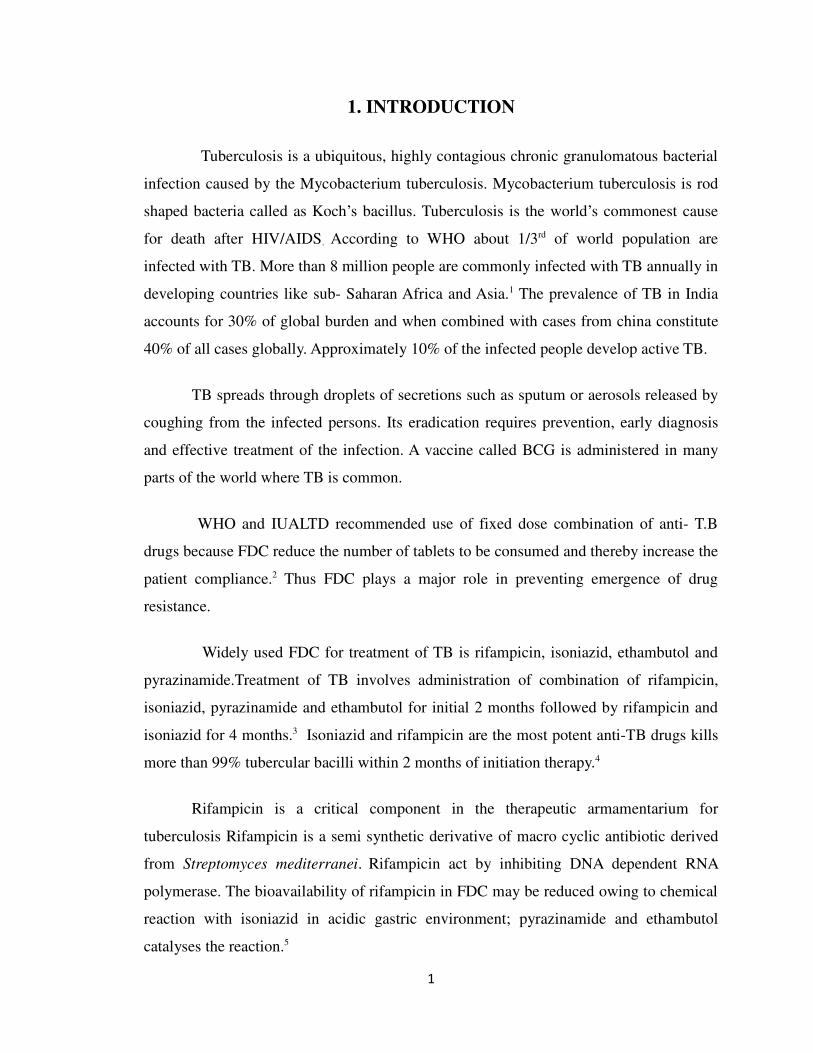
1. INTRODUCTION
Tuberculosis is a ubiquitous, highly contagious chronic granulomatous bacterial
infection caused by the Mycobacterium tuberculosis. Mycobacterium tuberculosis is rod
shaped bacteria called as Koch’s bacillus. Tuberculosis is the world’s commonest cause
for death after HIV/AIDS. According to WHO about 1/3rd of world population are
infected with TB. More than 8 million people are commonly infected with TB annually in
developing countries like sub- Saharan Africa and Asia.1 The prevalence of TB in India
accounts for 30% of global burden and when combined with cases from china constitute
40% of all cases globally. Approximately 10% of the infected people develop active TB.
TB spreads through droplets of secretions such as sputum or aerosols released by
coughing from the infected persons. Its eradication requires prevention, early diagnosis
and effective treatment of the infection. A vaccine called BCG is administered in many
parts of the world where TB is common.
WHO and IUALTD recommended use of fixed dose combination of anti- T.B
drugs because FDC reduce the number of tablets to be consumed and thereby increase the
patient compliance.2 Thus FDC plays a major role in preventing emergence of drug
resistance.
Widely used FDC for treatment of TB is rifampicin, isoniazid, ethambutol and
pyrazinamide.Treatment of TB involves administration of combination of rifampicin,
isoniazid, pyrazinamide and ethambutol for initial 2 months followed by rifampicin and
isoniazid for 4 months.3 Isoniazid and rifampicin are the most potent anti-TB drugs kills
more than 99% tubercular bacilli within 2 months of initiation therapy.4
Rifampicin is a critical component in the therapeutic armamentarium for
tuberculosis Rifampicin is a semi synthetic derivative of macro cyclic antibiotic derived
from Streptomyces mediterranei. Rifampicin act by inhibiting DNA dependent RNA
polymerase. The bioavailability of rifampicin in FDC may be reduced owing to chemical
reaction with isoniazid in acidic gastric environment; pyrazinamide and ethambutol
catalyses the reaction.5
1
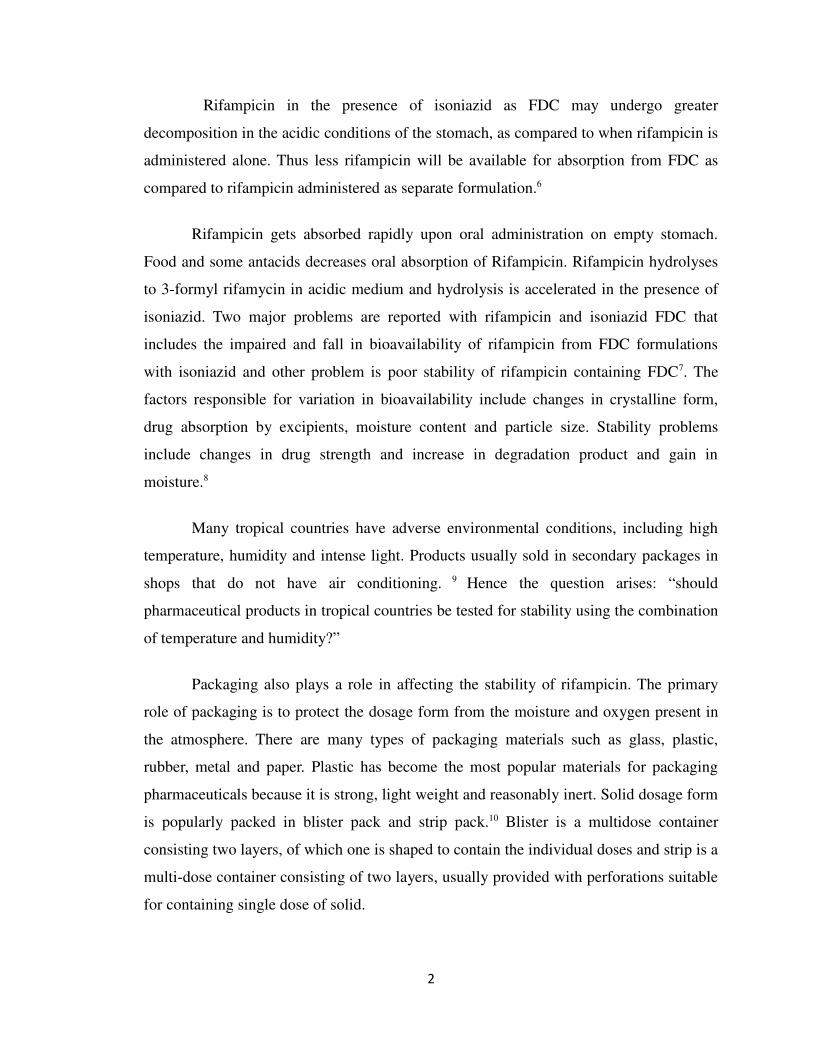
Rifampicin in the presence of isoniazid as FDC may undergo greater
decomposition in the acidic conditions of the stomach, as compared to when rifampicin is
administered alone. Thus less rifampicin will be available for absorption from FDC as
compared to rifampicin administered as separate formulation.6
Rifampicin gets absorbed rapidly upon oral administration on empty stomach.
Food and some antacids decreases oral absorption of Rifampicin. Rifampicin hydrolyses
to 3-formyl rifamycin in acidic medium and hydrolysis is accelerated in the presence of
isoniazid. Two major problems are reported with rifampicin and isoniazid FDC that
includes the impaired and fall in bioavailability of rifampicin from FDC formulations
with isoniazid and other problem is poor stability of rifampicin containing FDC7. The
factors responsible for variation in bioavailability include changes in crystalline form,
drug absorption by excipients, moisture content and particle size. Stability problems
include changes in drug strength and increase in degradation product and gain in
moisture.8
Many tropical countries have adverse environmental conditions, including high
temperature, humidity and intense light. Products usually sold in secondary packages in
shops that do not have air conditioning. 9 Hence the question arises: “should
pharmaceutical products in tropical countries be tested for stability using the combination
of temperature and humidity?”
Packaging also plays a role in affecting the stability of rifampicin. The primary
role of packaging is to protect the dosage form from the moisture and oxygen present in
the atmosphere. There are many types of packaging materials such as glass, plastic,
rubber, metal and paper. Plastic has become the most popular materials for packaging
pharmaceuticals because it is strong, light weight and reasonably inert. Solid dosage form
is popularly packed in blister pack and strip pack.10 Blister is a multidose container
consisting two layers, of which one is shaped to contain the individual doses and strip is a
multi-dose container consisting of two layers, usually provided with perforations suitable
for containing single dose of solid.
2

Previously studies were carried out to determine the stability of FDC anti-
tuberculosis products in commercial packages under ICH/WHO accelerated conditions
(400C/75% RH) and suggested barrier packaging to prevent catalytic role in the
interaction between isoniazid and rifampicin.3 In another study conducted in similar
conditions, it has been reported that strip products are more stable while blister products
showed both physical and chemical changes.11 Though marketed products of FDC anti-
TB drugs in strip or blister packages are considered stable based on the data obtained
from the official guide lines that recommend accelerated stability studies and ICH/WHO
accelerated conditions (400C/75% RH), in actual package the storage of these products in
the retail outlet at recommended conditions of storage are often overlooked and as such
bioavailability of these products particularly rifampicin is questionable. It is necessary to
examine whether these products in their original package are stable at varied temperature
and humidity conditions.
To ensure their bioavailability as claimed by pharmaceutical manufacturer,
therefore the present study aimed to investigate the stability of rifampicin from FDC
marketed products available in strip and blister packages by exposing them 400C,
400C/75% RH and to room temperature at 300± 20C for 60 days. The study may help to
understand the influence of packages on the stability of rifampicin from FDC products
when storage guidelines are over looked.
3

REVIEW OFREVIEW OFREVIEW OFREVIEW OF
LITERATURELITERATURELITERATURELITERATURE

2. REVIEW OF LITERATURE
Tuberculosis is one of the most chronic and infectious disease occurring world
wide ranging from developing countries to developed countries. Tuberculosis infection is
caused by Mycobacterium tuberculii. Mycobacterium tuberculii is gram positive aerobic
rod shaped acid fast bacillus. This Mycobacterium tuberculii was discovered by Robert
Koch in 24th march in 1882 and named it as Koch’s bacillus. 12Primary infection is usually
asymptomatic or latent with the development into lungs.
CLASSIFICATION OF ANTI-TUBERCULOSIS DRUGS:
Anti-Tuberculosis drugs are classified as:
1 .FIRST LINE GENERATION : First line class of drugs includes rifampicin,
Pyrazinamide, ethambutol and isoniazid.
2. SECOND LINE GENERATION : Second line class of drugs includes amikacin
and ethionamide
3. THIRD LINE GENERATION : Third line class include thioacetone, arginine,
macrolide and vitamin D
GENERALLY TWO TB RELATED CONDITIONS EXIST:
LATENT TUBERCULOSIS
People with latent TB are not sick because the TB germs in the body are not active.
The often prescribed medicine to prevent them from being infected by TB is giving
isoniazid for 9 months.
ACTIVE TUBERCULOSIS
4

This kind of TB occurs when the immune system is not capable of defending the
infection. When Mycobacterium tuberculii are active, it is called active tuberculosis.
Rifampicin, isoniazid, ethambutol and pyrazinamide are the preferred dosage regimen for
this kind of Tuberculosis.
2.1 EPIDEMOLOGY OF TUBERCULOSIS
Tuberculosis is the major cause of mortality and morbidity in many undeveloped
countries like Latin America, Asia and Africa. National institutes of health of United
States reported that about 17 billion people of world population are infected with TB
annually. Of all these people infected with mycobacterium tuberculosis, about 5% will
develop active TB disease and other 95% people will develop a latent infection that may
later progress to cause disease depending upon the status of immune system.13
There are several reasons for increasing incidence of tuberculosis with current
increase in cases of HIV. Part of reason is the development of multi drug resistant
tuberculosis mutants. Globally South East Asia accounts for the maximum of 33%
incidence of TB. This burden is increased by human immunodeficiency virus (HIV)
infection, which impairs the immune system and allows large numbers of people already
infected with tuberculosis to progress to active disease.
In South Africa around 10,000 people are infected with tuberculosis annually. In
a view of severity and spread of disease in 1993 W.H.O declared TB to be a global
emergency. In 2002 World Health Organization (W.H.O) notified 49,656 patients in
Thailand (WHO Report 2004) and 6,906 deaths (Health information Group, 2003).
250,000 deaths were due to TB/ HIV co-infection. WHO estimates 460,000 multi drug
resistant-TB cases occur each year.
The most populated countries of Asia have the largest number of cases: India,
China, Indonesia, Bangladesh and Pakistan together accounts for more than half of global
burden. There were 22 high burden countries, including Thailand that W.H.O particularly
noticed. It is feared that by 2020 about 200 million individuals will become sick and 70
million people will die in the developed countries.14
5

In a view to control TB W.H.O and IUALTD recommended a strategy for TB
control and named it as DOTS (Directly Observed Therapy). Every year W.H.O spends
billions of dollars in the issue of TB control. According to South African National
Tubercular Association (SANTA) DOTS spend 130 million US dollars in South Africa
for curing TB in 1998. BY the proper use of DOTS 500 million U.S dollars will be saved
in South Africa annually.15 DOTS have been introduced in Thailand since 1996, the
patient rate reduced after by applying DOTS therapy.
2.2 FIXED DOSE COMBINATIONS
Combination therapy refers to treatment with two or more drugs administered at
one time to ensure patient compliance to combine the requisite drugs physically into one
preparation is known as fixed dose combination. 16
ADVANTAGES:
• Better patient compliance.• Less chances to develop drug resistance.• Simplicity of treatment with minimal prescription errors
DISADVANTAGES:
• Young children may receive higher dose than required.•••• FDC is more expensive than individual components in terms of cost per tablet.
Fixed dose combinations from the who model list of essential medicines
6

Table 1: Fixed dose combinations from the WHO model list of essential medicines
W.H.O and IUALTD recommend use of fixed dose combinations. Anti-TB drugs
are generally given in the form of fixed dose combinations. Anti-TB FDC formulations
combine two or more first line anti-TB drugs like rifampicin, isoniazid, ethambutol and
pyrazinamide of fixed proportion in a single dosage form.2 The recommended strength for
fixed dose combinations by WHO is rifampicin 150mg, isoniazid 75mg, pyrazinamide
400mg and ethambutol 275mg.
Treatment of TB involves rifampicin, isoniazid, ethambutol and pyrazinamide for
initial 2 months followed by administration of rifampicin and isoniazid for 4 months
which act on mycobacterium tuberculii by varying methods including sterilization,
bacteriostatic and bactericidal.17 Rifampicin and isoniazid are the most powerful
7
bactericidal drugs against all strains of TB bacilli. Ethambutol is used in combination
with powerful drugs to prevent emergence of resistant to bacilli. Rifampicin act by
inhibiting DNA – dependent RNA polymerase by blocking RNA transcription. The
problem involved in the FDC is poor bioavailability of rifampicin. The reason for poor
bioavailability of rifampicin is change in crystalline form of rifampicin, drug adsorption
by excipients and formulation factors. 8
Isoniazid is a synthetic antimycobacterial and bactericidal agent for both
extracellular and intracellular organism and act by interfering with cell wall mycolic acid
synthesis.Pyrazinamide exhibits invitro bactericidal activity. 18
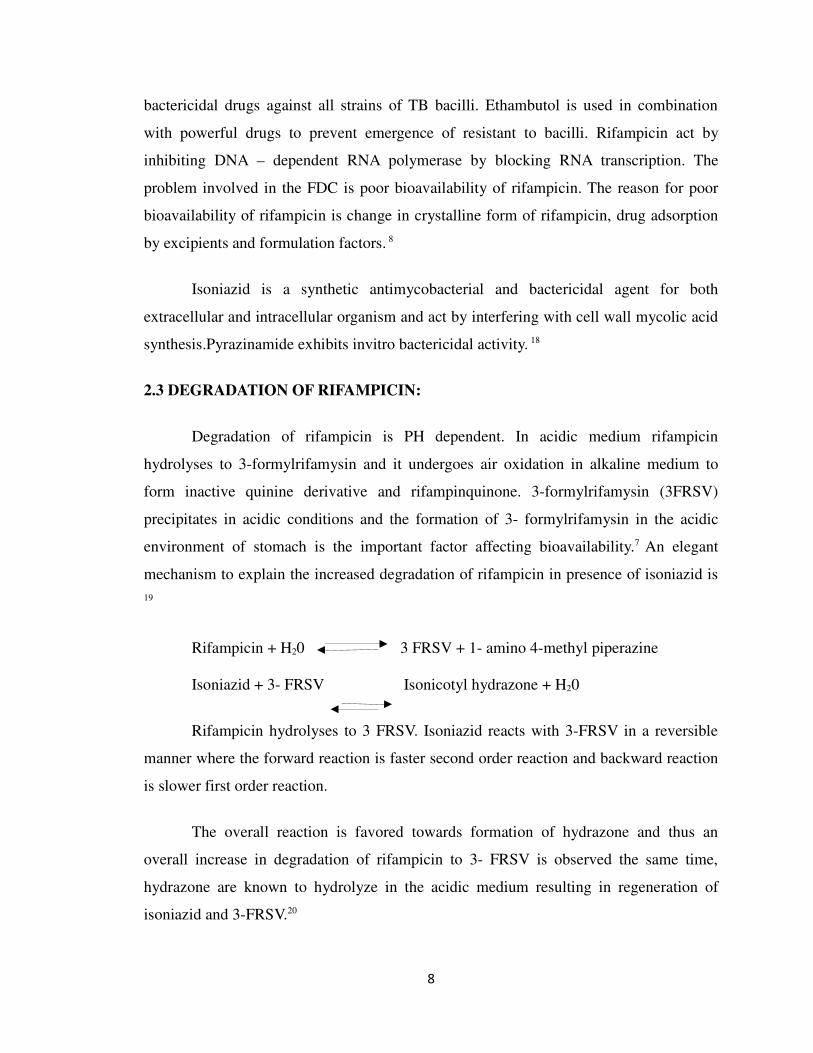
2.3 DEGRADATION OF RIFAMPICIN:
Degradation of rifampicin is PH dependent. In acidic medium rifampicin
hydrolyses to 3-formylrifamysin and it undergoes air oxidation in alkaline medium to
form inactive quinine derivative and rifampinquinone. 3-formylrifamysin (3FRSV)
precipitates in acidic conditions and the formation of 3- formylrifamysin in the acidic
environment of stomach is the important factor affecting bioavailability.7 An elegant
mechanism to explain the increased degradation of rifampicin in presence of isoniazid is
19
Rifampicin + H20 3 FRSV + 1- amino 4-methyl piperazine
Isoniazid + 3- FRSV Isonicotyl hydrazone + H20
Rifampicin hydrolyses to 3 FRSV. Isoniazid reacts with 3-FRSV in a reversible
manner where the forward reaction is faster second order reaction and backward reaction
is slower first order reaction.
The overall reaction is favored towards formation of hydrazone and thus an
overall increase in degradation of rifampicin to 3- FRSV is observed the same time,
hydrazone are known to hydrolyze in the acidic medium resulting in regeneration of
isoniazid and 3-FRSV.20
8

The decomposition of rifampicin in acidic conditions in absence of isoniazid stop
the formation of 3-formylrifamysin but in the presence of isoniazid, the reaction is
proceeded to form hydrazone between 3- formylrifamysin and isoniazid resulting
recovery of isoniazid but eventually causing loss of rifampicin. This indicates that
isoniazid remains unaffected and plays a role of a catalyst in the degradation of
rifampicin in acidic conditions to 3-FRSV. (4, 21) This explains the reason why the
bioavailability problem is confined to rifampicin alone but not to isoniazid.
In acidic medium 12.4% of rifampicin alone is degraded to 3-formyl rifamycin
within 1 hour and in the presence of isoniazid degradation of rifampicin is increased to
21.5%. This indicate that degradation of rifampicin to 3-formylrifamysin is almost twice
and two times faster in the presence of isoniazid than that of rifampicin alone.
2.4 METHODS ADOPTEDTO PREVENT DEGRADATION OF RIFAMPICIN:
Approaches to prevent degradation of rifampicin include enteric coating of solid
formulations or drug granules, use of alkaliniser at the time of administration of FDC
formulations, exploitation of formulation factors including addition of additives and
segregation of delivery of rifampicin and isoniazid.
The following approaches seem plausible. (i) Enteric coating of solid formulations
or drug granules. (ii) Use of alkaliniser at the time of administration of FDC
formulations. (iii) Exploitation of formulation factors, including addition of additives.8 A
novel formulation comprising of rifampicin and sodium lauryl sulphate prepared by co-
grinding method, proved effective to minimize the degradation of rifampicin in acidic
environment by its retarded release pattern. This segregation release pattern of rifampicin
in alkaline environment and isoniazid in acidic environment of GI tract prevents
degradation of rifampicin alone and its interaction with isoniazid.22
2.5 STABILITY STUDIES:
9

Stability is the capacity of drug to remain within specifications established to ensure
its identity, strength, quality and purity. The purpose of pharmaceutical stability testing is
to provide evidence on how the drug substance or drug product varies with time under the
influence of variety of environmental factors such as temperature, humidity and light.
Stability testing includes long term stability studies, intermediate stability studies
and accelerated stability studies. In long term stability study the product is stored at 250 C
± 20C/60% ± 5 RH for 12 months. In intermediate stability study the product is stored at
300C ± 20/65% ± 5% RH for 6 months and in accelerated stability studies the product is
stored at 400C ± 20/75% ± 5% RH for 6 months. 23
Table 2: The main objectives of stability testing are shown in the table below
Objective Type of study For use in
To select adequate (from the
view-point of stability)
formulations and container
closure
systems
Accelerated Development of
product
To determine shelf-life and
storage conditions
Accelerated and/or
long term
Development of
product and
registration dossierTo substantiate the claimed
shelf-life
Long term Registration dossier
To verify that no changeshave
been introduced in theformulation ormanufacturing
process that can adverselyaffect
the stability of the product
Accelerated and/or
long term
Post approval
changes and
quality assurance in
general, including
quality control
Accelerated testing
10

Studies designed to increase the rate of chemical degradation or physical change
of a drug substance or drug product by using exaggerated storage conditions as part of the
formal stability studies. Data from these studies, in addition to long term stability studies,
can be used to assess longer term chemical effects at non-accelerated conditions and to
evaluate the effect of short term excursions outside the label storage conditions such as
might occur during shipping .24
Stability problems include change in drug strength, increase in degradation
product, gain in moisture and chemical stability.(8) Chemical stability is generally
expressed in terms of rate constant (k) representing either product formation or drug
degradation. For any mechanism the rate of reaction (k) can be described by general rate
equation. 25
dα /dt = kf (α)
α = conversion of reaction
f (α) = the conversion function
For zero order reaction the reaction rate is independent of drug concentration
while for the first order reaction the rate depends linearly on drug concentration.
Zero order dα/dt = k
First order dα/dt = k (α)
Temperature dependence on the rate constant, k is usually expressed by Arrhenius
equation
K= Ake - Eα/RT
A = Pre exponential factor
Ea = Activation energy (cal/mole)
T= absolute temperature
R = gas constant
11

Chemical instability of fixed dose combination is found to occur due to two
reasons. One is direct interaction of rifampicin and isoniazid; the mechanism which
involves interaction of imine group of rifampicin with amino group of isoniazid to yield
hydrazone in solid formulation environment. The other reason is creation of an acidic
hydrolytic environment upon moisture gain by ethambutol hydrochloride. The two co
drugs present usually in fixed dose combinations accelerate the reaction between
rifampicin and isoniazid.5
HUMIDITY:
Humidity can have on effect on solid drug substances. Pharmaceutical solid forms
may contact with moisture during manufacturing process and storage at high relative
humidity. The amount of moisture that is sorbed is dependent on the chemical properties,
temperature, relative humidity and porosity of the packaging material. The excipients
used in solid dosage form affect the stability of the formulation. The more amorphous is
used in formulation the more water is sorbed. 26
PACKAGING:
The primary role of packaging is to protect the dosage form from the moisture and
oxygen present in the atmosphere. There are many types of packaging materials such as
glass, plastic, rubber, metal and paper. Plastic has become the most popular materials for
packaging pharmaceuticals because it is strong, light weight and reasonably inert. Solid
dosage form is popularly packed in blister pack and aluminum foil.
Two major factors which affect packaging are leachable impurities and
permeability of moisture and oxygen. Two blister packs one with polyvinylchloride and
another with polyvinyl chloride and laminate of polymonochlorotrifluroethylene were
backed with impermeable foil and used for packing. It was found that polyvinyl chloride
laminated with polymonochlorotrifluroethylene blister pack could protect solid dosage
form better than the other.10
2.6 TB DRUGS IN DEVELPOMENT:
12

The recent discovery of diarylquinone is a promising TB drug that shortens
therapy. Andries et.al identified diarylquinoline compound which is highly active against
Mycobacterium tuberculosis.
Flouroquinolines
These are broad spectrum of antibiotics currently used as second line drugs in TB
therapy. Moxifloxacin and Gatifloxacin are fluroquinolines.27 that has longer half life and
more active against mycobacterium tuberculosis than ofloxacin. Moxifloxacin has been
shown to kill a sub population of tubercle bacilli that has not been killed by rifampicin.
Moxifloxacin in combination with rifampicin and pyrazinamide kills bacteria more
effectively than standard regimen of INH +RIF + PZA
Rifampin derivative:
Rifampin derivatives include rifapentine 28, rifabutin and rifalazil. Rifalazil is
highly active against a range of intracellular bacteria including mycobacterium
tuberculosis.
Oxazolidones:
These are active against gram positive bacteria. This oxazolidones inhibit protein
synthesis at an early stage by binding to 23s rRNA of the 50s ribosomal unit.29
Nitroimidazopyran:
It acts by inhibiting mycolic acid which is the main component of cell wall and
protein synthesis.30
H.Bhutani et.al, 3 (2003) carried out a study to determine the physical and chemical
stability of anti- tuberculosis fixed dose combination products under accelerated climatic
conditions. In this study fixed dose combinations of rifampicin, isoniazid, pyrazinamide
and ethambutol products were stored for 3 months under ICH/WHO accelerated
conditions (40/75% RH) with and without original packaging in the presence and absence
13
of light. The unpackaged products underwent both physical and chemical changes. A
significant finding is that pyrazinamide and ethambutol play a catalytic role in the
interaction between isoniazid and rifampicin. This study suggested that unless fixed dose
combinations are packed in barrier packaging, anti-tuberculosis fixed dose formulations
are considered as unstable and consideration should be given to their development,
packaging and stability testing.
S.Singh et.al, 31 (2003) conducted study on pilot stability study on four fixed dose
combination anti tubercular products at 400C and 75% RH. The strip products were
stable, while blister products showed both physical and chemical changes. The products
in unpacked conditions showed severe ( 60 ) decomposition of rifampicin and the
main decomposition product is isonicotylhydrazine of 3- formylrifamysin. This study
suggested that attention should be paid to the detection and quantitation of the product in
marketed formulations. The packaging material used in manufacturing of fixed dose
combination products should also be of highest quality.
Saranjit Singh, et.al 8 2001has given critical review of probable reasons for the poor/
variable bioavailability of rifampicin from anti-tuberculosis fixed dose combination
products and likely solutions to the problems. Unfortunately the origin and cause of the
problem is not clearly understood though the GMP and crystalline changes are cited as
the principal reasons. The enhanced decomposition of rifampicin in the presence of
isoniazid in stomach after ingestion is indicated as the key factor behind the problem.
C.J Shishoo et.al, 6 (2001) conducted study on impaired bioavailability of rifampicin in
the presence of isoniazid from fixed dose combination. Bioavailability of rifampicin after
administration of single component rifampicin (450 mg) capsule and rifampicin-isoniazid
(RIF-INH) (450+300mg) single dose is noted. Cross-over test were conducted on six
healthy male volunteers and HPTLC method was developed to know the amount of
Rifampicin and its metabolite ,25-Desacetylrifampicin in urine. Significant decrease in
bioavailability of rifampicin from fixed dose combination capsules was observed. This
bioavailability study confirmed that stability of rifampicin in the presence of isoniazid in
14

acidic environment of stomach is the main factor for reduced bioavailability of rifampicin
from RIF-INH combination formulations. This study underlines the fact that there is a
urgent need to reconsider the formulation of fixed dose combination products in order to
minimize or avoid the decomposition of rifampicin in gastrointestinal tract
C.J Shishoo et.al, 7 (1999) conducted study on stability of rifampicin in dissolution
medium in presence of isoniazid. Rifampicin (RIF) hydrolyzes in acidic medium to form
insoluble and poorly absorbed 3-Formyl rifamycin SV (3-FRSV). This study describes
development of two principally different methods, Dual Wavelength UV–
Vis.spectrophotometry (DW spectrophotometer) and HPTLC, to determine 3-FRSV in
presence of RIF Using DWspectrophotometry, RIF was estimated by using wavelengths
475.0 and 507.0 nm and 3-FRSV was estimated using 457.0 and 492.0 nm. Both the
methods were found to be specific, accurate and reproducible. The proposed methods
were successfully applied to determine the rate of degradation of RIF to 3-FRSV in
dissolution medium (0.1 N HCl) and also two times stability of RIF in market
formulations of RIF and RIF with INH in dissolution in presence of isoniazid (INH). The
rate of degradation of RIF in presence of INH was almost two times more than that of
rifampicin alone medium. It has more than that of RIF alone. These methods were
utilized to study the stability of rifampicin in market formulations of rifampicin and
rifampicin with isoniazid.
It has been observed that RIF degrades by 12.4% to form 3-FRSV (RIF formulations)
while in presence of INH the degradation is catalyzed to about 21.5% (RIF_INH
formulations), in 45 min. Thus, lower concentration of RIF may be available for
absorption leading to poor bioavailability of RIF from combination dosage forms
(RIF_INH) as compared to formulations containing only RIF. It is proposed that specific
analytical method should be used to measure RIF in presence of dissolution medium.
Hemant Bhutani et.a,l5 (2005) conducted a study to know the Mechanistic explanation
to the catalysis by pyrazinamide and ethambutol in the reaction between rifampicin and
isoniazid in anti-TB FDCs. Rifampicin and isoniazid are known to interact with each
other in solid formulation environment to yield isonicotinyl hydrazone (HYD). In earlier
15
studies, this reaction was indicated to be catalyzed by pyrazinamide and ethambutol
hydrochloride, the two other co-drugs present in anti-tuberculosis fixed-dose combination
(FDC) formulations. The present study was carried out to understand the catalytic role of
pyrazinamide and ethambutol hydrochloride on the reaction between rifampicin and
isoniazid. Organic bases and amides similar in structure to pyrazinamide and ethambutol
hydrochloride were combined individually with rifampicin and isoniazid. The compounds
employed were pyrazine, piperdine, pyrollidine, pyridine, triethylamine,
diisopropylethylamine, picolinamide, benzamide, ethylenediamine, ethanolamine,
diethanolamine, and triethanolamine. An additional study was carried out in the presence
of free base of ethambutol. These mixtures were exposed to accelerated stability test
condition of 400 C/75% RH for 15 days. The drugs showed different extent of
degradation, yielding HYD, and in some cases degradation products of rifampicin. The
results confirmed the catalytic role of pyrazinamide and ethambutol hydrochloride. The
catalysis is postulated to involve intra molecular proton transfer during transhydrazone
formation process, entailing a tetrahedral mechanism.
Shrutidevi Agrawal et.al, 32 (2004) conducted a study on Dissolution test as a surrogate
for quality evaluation of rifampicin containing fixed dose combination formulations. Six
FDC formulations were used in this study, of which four had passed bioequivalence while
two failed. Formulations showed variable dissolution at different conditions and
dissolution at 50 rpm was most sensitive and differentiated the release profiles of
rifampicin under various pH conditions. It was possible to predict in vivo performance of
rifampicin from FDCs when in vitro rate and extent of release at various pH was
correlated with site, pH and concentration dependent absorption of rifampicin along with
gastric emptying time. It was also seen that dissolution conditions recommended in USP
for different types of FDCs were insensitive for the formulation changes. Based on this
comprehensive evaluation, a decision tree was proposed which will act as a guideline for
quality evaluation of FDC products and also provide a fundamental knowledge for
optimization of formulations failing in dissolution studies.
Satish Balkrishna Bhise et.al, 22 (2007) formulated and evaluated novel fixed dose
combination of anti-tuberculosis drugs. The solid mixtures of rifampicin and sodium
16

lauryl sulphate were prepared at molar ratio of 1:1 by co-grinding method. In vitro
dissolution studies were carried out in 0.1N HCl and phosphate buffer pH 6.8. Solid
mixtures prepared by co-grinding method were found to be useful in delaying the
dissolution of rifampicin in acidic medium .The release of rifampicin from novel fixed
dose combination formulation was 0% in 0.1N HCl up to two hours and faster release
within 15 minutes in alkaline pH was achieved, while Isoniazid was released completely
within 20 minutes in 0.1 N HCl. A novel formulation comprising of rifampicin and
sodium lauryl sulphate, prepared by co-grinding method proved effective to minimize the
degradation of rifampicin in acidic environment by its retarded release pattern. Thus this
approach is beneficial for the segregation of release pattern of rifampicin in alkaline
environment and isoniazid in the acidic environment of the GI tract, which will lead to
prevent the degradation of rifampicin alone & its interaction with isoniazid.
Mukesh C. Gohel et.al,33 (2007) developed a novel solid dosage Form of Rifampicin and
Isoniazid With improved functionality to minimize degradation of rifampicin in acidic
medium and to modulate the release of rifampicin in the stomach and isoniazid in the
intestine. Gastro retentive tablets of rifampicin (150 mg) were prepared by the wet
granulation method. Hard gelatin capsules (size 4) containing a compacted mass of
isoniazid (150 mg) and dicalcium phosphate (75 mg) were enteric coated. Two tablets of
rifampicin and 1 capsule (size 4) of isoniazid were put into a hard gelatin capsule. The in
vitro drug release and in vitro drug degradation studies were performed. Rifampicin was
released over 4 hours by zero-order kinetics from the novel dosage form. More than 90%
of isoniazid was released in alkaline medium in 30 minutes. The results of dissolution
studies revealed that a substantial amount of rifampicin was degraded from the immediate
release capsule containing rifampicin and isoniazid powder owing to drug accumulation
in the dissolution vessel and also to the presence of isoniazid. The degradation of
rifampicin to 3-formyl rifampicin SV (3FRSV) was arrested (3.6%-4.8% degradation of
rifampicin at 4 hours) because of the minimization of physical contact between the 2
drugs and controlled release of rifampicin in acidic medium. This study concludes that
the problem of rifampicin degradation can be alleviated to a certain extent by this novel
dosage formulation
17

Y. Ashokraj et.al, 34 (2006) conducted a study on Quality control of anti-tuberculosis
FDC formulations in the global market. Accelerated stability studies were perform to
determine the quality and performance of rifampicin containing fixed dose combination
formulations with respect to physical, chemical and dissolution properties at (400C / 75%
RH). All the formulations were found to be stable where extent of dissolution was within
10% of that of initial volume and all formulations passed the pharmacoepial limits for
assay and content uniformity. The study revealed that good quality of rifampicin
containing FDC that remain stable after 6 months accelerated stability testing are
available in market place.
2.7 BACK GROUND OF REVIEW:
This study reveals the importance of carrying out the accelerated stability studies
on marketed products of anti-tubercular FDC products containing rifampicin, isoniazid,
pyrazinamide and ethambutol. From the previous study it was found that unpackaged
FDC products undergo degradation more when compared to packaged FDC products and
it also revealed that type of packaging also has influence on the stability and concluded
that blister packs undergo more degradation when compared to strip packaging.31 By
considering all these factors the present study was focused to carry out the accelerated
stability study on marketed products of anti-tubercular FDC containing rifampicin,
isoniazid, ethambutol and pyrazinamide at different temperatures like 40C, 250C and at
400C with 75% RH for 60days and to determine the amount of rifampicin that gets
degraded from marketed FDC products containing rifampicin, isoniazid, ethambutol and
pyrazinamide.
18

AIM & OBJECTIVEAIM & OBJECTIVEAIM & OBJECTIVEAIM & OBJECTIVE
3. AIM AND OBJECTIVE
The aim of the present work is to carry out the accelerated stability study on
four marketed products of anti-tubercular fixed dose combinations containing same dose
of rifampicin, isoniazid, ethambutol and pyrazinamide at different temperatures like 40C,
250C and at 400C with 75% RH for 60days and to determine the amount of rifampicin
that get degraded from four marketed fixed dose combination products.
OBJECTIVE:
The objective of the present study is as follows
� To know the amount of rifampicin that gets degraded from marketed fixed dose
combination product� To select a better package for anti-tubercular fixed dose combination products that
minimize degradation� To choose a better formulation from the four different marketed fixed dose
combination products.
19

PLAN OF WORKPLAN OF WORKPLAN OF WORKPLAN OF WORK

4. PLAN OF WORK
20

PROFILESPROFILESPROFILESPROFILES

5. DRUG PROFILE
5.1 RIFAMPICIN:
Rifampicin is a semi synthetic antibiotic derivative of rifamycin group.
Compound is derived from Amycolatopsis rifamycinica.
Structure :
Rifampicin
Empirical Formula : C43H58N4O12
Molecular weight : 822.94
Chemical name
3-[[(4-Methyl-1-piperazinyl)imino]methyl]rifamycin or 5,6,9,17,19,21-
hexahydroxy - 23 - methoxy - 2,4,12,16,20,22 - heptamethyl - 8 - [N - (4 - methyl - 1
-piper-azinyl)formimidoyl] - 2,7 - (epoxypentadeca - [1,11,13]trienimino)naphtho[2,1 -
b]furan - 1,11(2H) - dione 21-acetate
Physical and chemical properties
Appearance : Red brown powder
Melting point : 183 – 1880C
Dose : 10mg/kg body weight in daily treatment
21

Solubility
Slightly soluble in water, soluble in ethylacetate and methanol and freely soluble in
chloroform. 35
Mechanism of action 36
Rifampicin act by inhibiting DNA dependent RNA polymerase activity in
susceptible cells. Rifampicin interacts with bacterial RNA polymerase but doesn’t inhibit
mammalian enzyme. At therapeutic levels, rifampin has bacterial activity against both
intracellular and extracellular mycobacterium tuberculosis. Bacterial resistance to
rifampin is caused by mutations leading to change in the structure of β subunit of RNA
polymerase.
PHARMACOKINETICS
Absorption
It is well absorbed from the gastrointestinal tract. Peak plasma concentration is
attained within 1.5 to 4 hours after oral administration. Absorption is reduced to 30%
when the drug is ingested with food.
Distribution
Rifampicin is widely distributed in to all most all body tissues and fluids
including cerebrospinal fluid barrier. About 90% of rifampicin binds to plasma proteins. 37
Rifampicin has high degree of placental transfer with a foetal to maternal serum level
ratio of 0.3.
Volume of distribution : 1.6 Liter / kg
Biological half life : 3 to 5 hours
22

Metabolism
It is metabolized by liver microsomal enzymes its active metabolite is
deacetylrifampicin. Formyl rifampicin is urinary metabolite that forms in urine.
Elimination
Rifampicin gets rapidly eliminated in bile and 30% of dose gets eliminated in
urine in unchanged form and around 60% of oral dose is excreted in faeces.
Drug interactions 38
1. Antacids containing aluminum hydroxide reduce the bioavailability of rifampicin
2. Isoniazid and rifampicin interaction has lead to hepatotoxicity3. Presence of food decreases the absorption of rifampicin4. Barbiturates and salicylates decrease the activity of rifampicin5. Para- amino salicylic acid granules delay rifampicin absorption
Adverse effects
1. Acute haemolytic anemia, hypersensitivity
2. Diarrhoea , peripheral neuritis and vomiting
3. Severe gastrointestinal side effects, rash , chills and fever
4 .Edema, dermatitis
5. Opthalamic use of rifampicin causes irritation to eyes and ocular pain
Use : Used in the treatment of tuberculosis
Storage : Stored in well closed container
5.2 ISONIAZID
23

Isoniazid was synthesized in 1912 at the German University of Prague by Meyer and
Mally(39)
STRUCTURE
Isoniazid
Empirical formulae : C6H7N
Molecular weight : 137.14
Chemical name : Isonicotinic acid hydrazide
Physical and chemical properties
Appearance : White crystalline powder
Melting point : 170 - 174
Dose : 5mgh/kg body weight daily and 10 mg/kg body weight in thrice
Weakly treatment
Solubility : Freely soluble in water and sparingly soluble in alcohol (40)
Mechanism of action
24

Isoniazid kills actively growing tuberculii bacilli by inhibiting the biosynthesis of
mycolic acid which is the major component of cell wall of mycobacterium tuberculosis.
(41) At therapeutic levels isoniazid is bacterial against actively growing intracellular and
extracellular mycobacterium tuberculosis.
PHARMACOKONETICS
Absorption
90% of drug gets absorbed upon oral administration and the presence of food
reduces the absorption. Time to attain peak plasma concentration is about 1 to 2 hours
Distribution
Isoniazid is widely distributed to all fluids and tissues including cerebrospinal
fluid, pleural and ascetic fluids, skin, sputum, muscles and lungs. It crosses the placenta
and distributed in to breast and milk. Protein binding is very low about 10%.
Volume of distribution : 0.57 to 0.76 L/kg
Biological Half life : 1-5hours
Metabolism
Metabolism occurs by liver, isoniazid is acetylated by liver in to active
metabolites which are excreted in urine. Acetyl isoniazid is further hydrolyzed to
isonicotinic acid and acetyl hydrazine. Non acetylated isoniazid is excreted unchanged in
urine.
Elimination
25

5 to 30% of drugs get excreted by renal excretion. Slow acetylaters excrete 25%
to 66% of dose in urine as isoniazid and rapid acetylaters excrete 5 to 37% of dose in
urine.
Drug interactions 42
1. Concomitant use of acetaminophen and isoniazid cause nephrotoxicity
2. Alaprozolam administration with isoniazid cause elevated plasma concentrations of
alaprozolam
3. Concomitant isoniazid therapy with BCG vaccine may inhibit efficacy of bcg vaccine
4. Antacids should not be administered with isoniazid
5. Administration of isoniazid with cycloserine cause increased CNS adverse effects
Adverse drug reactions
1. Peripheral neuropathy (43), seizures
2. Psychosis, optic neuropathy (44) and metabolic acidosis
3. Hypocalcemia, scaling and eczema
4. Memory loss, gynecomastia and vitamin B6 deficiency
Use : Used in treatment of tuberculosis
Storage : Should protect from moist and light. Stored at 200C to
250C
5.3 Pyrazinamide
26

The synthesis of pyrazinoic acid, the active metabolite of pyrazinamide
STRUCTURE :
Pyrazinamide
Empirical formulae : C5H5N30
Molecular weight : 123.11
Chemical name : Pyrazine -2- carboximide
Physical and chemical properties (45)
Appearance : White crystalline powder
Melting point : 1900C
Dose : Orally 15 to 30 mg/kg once daily
Solubility : Sparingly soluble in water
Mechanism of action
27

Pyrazinamide is a synthetic purine analog of nicotinamide and exhibits in vitro
bactericidal activity only at acidic PH. (46) Pyrazinamide is quite active against
intracellular bacilli in the acidic environment of macrophages. Because of its action
against intracellular bacilli, the organisms most likely to be responsible for relapse, it may
play an important role in decreasing relapses. Within tuberculous lesions, it has been
hypothesized that there may be 4 different populations of tubercle bacilli. Due to
variables in their environments within the body, these 4 populations may differ in their
metabolism and susceptibility to the ant tuberculosis drugs. One group of bacilli is felt to
be metabolically active (rapidly and continuously growing). This group of organisms is
believed to be killed readily by isoniazid, Rifampin, and streptomycin when used in
bactericidal doses. The second group of bacilli is thought to have intermittent spurts of
metabolic activity, during which time Rifampin is most capable of killing them. A third
group of bacilli is thought to be found in acidic environments, such as within
macrophages. Pyrazinamide appears to be especially effective against this particular
group. Pyrazinamide should be used only in combination with other ant tubercular drugs
in the treatment of M tuberculosis; resistance develops rapidly (within 6 to 8 weeks)
when pyrazinamide is used alone.
PHARMACOKINETICS
Absorption
When given orally drug is completely absorbed from gastrointestinal tract,
absorption is not influenced by food intake. After oral intake of 1500mg of pyrazinamide,
a peak level is obtained; the time taken to reach peak serum concentration is decreased by
antacids concentration.
Distribution
28

Pyrazinamide has excellent penetration in to cerebrospinal fluid ranging from 87
to 105% of corresponding serum concentration. Drug is distributed to all fluids, bile,
kidney, liver and lungs. 31% of drug binds to plasma proteins.
Volume of distribution : 0.57 to 0.74L/kg
Biological Half life : 9 to 10 hours
Metabolism
Pyrazinamide is hydrolised in liver to its major active metabolite , pyrazonoic
acid which further hydroxlated to main excretory product 5- hydroxypyrazinoic acid
.Approximately 1% to 14% of the drug is excreted as unchanged pyrazinamide, with the
remainder excreted as metabolites (Pyrazinoic acid, and 5-hydroxypyrazinoic acid).
Elimination
About 1 to 14% of drug excreted as unchanged pyrazinamide in urine, remaining
excreted as metabolites.
DRUG INTERACTIONS
1. Allopurinol increases plasma concentration of pyrazoic acid which is directly
responsible for renal urate secretion.2. Pyrazinamide might antagonistically effect the action of medications that have
uricosuric effect such as acetylsalicylic acid and probencid.3. A potentially serious interaction exist with zidovudine in combination therapy.
Adverse drug reactions
1. Pellagra, thrombocytopenia and prophyria
2. Interference of metabolism of purine occurs
3. Arthralgia, hepatotoxicity47
29

Use : Used in combination with anti- tubercular drug for
the treatment of tuberculosis
Storage : Stored in well closed container at controlled room
temperature at 15-300
5.4 ETHAMBUTOL
It is oral chemotherapeutic agent specifically active against actively growing
micro organisms
Structure:
Ethambutol
Empirical formulae : C10H24N2O2
Molecular weight : 277.23l
Chemical Name : 2, 2 (ethylene di amino) di-1-
butanol di hydro chloride.
Physical and chemical properties 48
30

Appearance : White crystalline powder
Melting point : 199 - 2040C
Solubility : Soluble in water and alcohol and slightly soluble
in chloroform
Dose : 15mg/kg body weight
Mechanism of action
Ethambutol diffuses in to actively growing mycobacterium tuberculosis such as
tubercle bacilli. Ethambutol appears to inhibit the synthesis of one or more metabolites 49,
thus causing impairment of cell metabolism, arrest multiplication and cause cell death.
PHARMACOKINETICS
Absorption 50
Absorption is rapid. Food doesn’t show any effect of absorption, following a
dosage of 25mg/kg body weight, a peak serum concentration of 4to 5mg/L is achieved
with in 2-4 hrs after administration.
Distribution
Ethambutol is distributed to tissues and body fluids except cerebrospinal fluid.
Ethambutol does not penetrate intact meninges, but 10 to 50% may penetrate the
meninges of patients with TB meningitis. About 30% of drug binds to plasma proteins.
Time taken to attain peak plasma concentration is about 2to 4 hours.
Volume of distribution : 1.6 lit/kg
Biological Half life : 3 to 4 hours
31
Elimination
Ethambutol gets eliminated by kidney 50 to 90% of drug is excreted as unchanged
form in urine. And 20 to 22 % get excreted in feaces. 80% of ethambutol is eliminated by
glomerular filtration and tubular secretion.
Drug interactions
1. Magnesium antacid reduces ethambutol resorption and lowers and delays respectively
Cmax and Tmax.
2. Ethionamide and isoniazid in combination increases ethambutol occular toxicity
Adverse drug reactions
1. Aplastic anaemia51, occular toxicity
2. Hallucination, loss of apetite
3. Dark urine, yellowing of skin
Use : Used in combination with anti-tubercular drug for
the treatment of tuberculosis.
Storage : Stored at 15 - 300C in well closed container.
32

MATERIALS MATERIALS MATERIALS MATERIALS
6. MATERIALS AND INSTRUMENTS
6.1 MATERIALS

Four fixed dose formulations manufactured by licensed firms and different
combinations of anti-tuberculosis drugs containing rifampicin, isoniazid, ethambutol and
pyrazinamide were purchased from chemist shops which are packed in blister and strip
packaging. The products are purchased in sufficient quantity to fulfill the study storage
plan.
Storage of samples:
Three blister (F1, F2, F3) and one strip (F4) packaged FDC products of equal
strength were procured and were investigated without cutting to avoid damage to
packaging material or channel formation during cutting. One strip/blister of each type
was kept in every storage condition and a minimum of three tablets were taken from the
same package were analyzed. One set of each package was stored under ambient
conditions at 250C, freezer at 40 C and stability chamber at 400C with 75% RH.
Table-2 Formulation code for different type of packages
Type of
package
Formulation code Dose
Blister F1 Rifampicin-150mg,Isoniazid-75mg,
Pyrazinamide-400mg Ethambutol- 275mg.
Blister F2 Rifampicin-150mg,Isoniazid-75mg,
Pyrazinamide-400mg Ethambutol- 275mg
Blister F3 Rifampicin-150mg,Isoniazid-75mg,
Pyrazinamide-400mg Ethambutol-275mg
Strip F4 Rifampicin-150mg,Isoniazid-75mg,
Pyrazinamide-400mg Ethambutol- 275mg
33

Equipment:
Table 3- The following equipments were used in the study
Instrument Manufacturer
Hardness tester Erweka GmbH Heusenstamm, Germany
Dissolution tester Electro lab, Mumbai, India
UV-VIS spectrophotometer Beckman 640i, Fullerton, CA, USA
Stability chamber WTC Binder , Tuttlingen, Germany
34

METHODOLOGYMETHODOLOGYMETHODOLOGYMETHODOLOGY

7. METHODOLOGY
7.1 Physical evaluation parameters: Marketed tablets containing fixed dose
combinations of rifampicin, isoniazid, pyrazinamide and ethambutol were evaluated for
physical parameters like hardness, weight variation and drug content.
Hardness test: For each formulation, the hardness of 3 tablets was determined by using
Monsanto hardness tester and standard deviations were calculated.
Weight variation test: To study weight variation, of tablet of each formulation were
weighed using an electronic balance and the test was performed according to the USP
official limits of percentage deviation of tablet are presented in the table 4.
%Maximum positive deviation= (WH-A/A) ×100
%Minimum negative deviation= (A-WL/A) ×100
Where,
WH= Highest weight in mg
WL= Lowest weight in mg
A= Average weight of tablet in mg
Table 4: USP official limits of weight variation test
Drug content uniformity
35
Average weight of
tablet(mg)
Maximum percentage
difference allowed
130 or less 10
130-324 7.5
More than 324 5

Standard preparation
An accurately weighed amount of pure rifampicin (100 mg) taken and transferred
into 100 ml volumetric flask. It was dissolved and made up to volume with pH 1.2 and
absorbance was measured at 476 nm.
Sample preparation
Tablets were weighed individually then placed in a mortar and powdered with a
pestle. An amount of powdered rifampicin (100 mg) was extracted in 0.1 N Hcl. The
absorbance was measured at 476 nm after suitable dilution.
Calculation
The amount of rifampicin present in tablet can be calculated using the formula
At/AsXSw/100X100/StXAv
Where,
At= Absorbance of sample preparation
As= Absorbance of standard preparation
Sw= Weight of rifampicin working standard
St = Weight of rifampicin tablet (mg)
Av = Average weight of tablet (mg)
7.2 Construction of standard curve for rifampicin:
Rifampicin is estimated spectrophotometrically at 475 nm.
Preparation of 0.1 N HCl 52
Dissolve 8.5 ml of concentrated HCl in 1000 ml of distilled water.
Preparation of standard drug solution
Stock solution
36

100 mg of was dissolved in 100 ml of 0.1 N HCl, to get a solution of 1000 µg/ml
concentration.
Standard solution
10 ml of stock solution was made to 100 ml with 0.1 N HCl thus giving a
concentration of 100 µg/ml. Aliquot of standard drug solution ranging from 0.5 ml, 1 ml,
1.5 ml, 2 ml and 2.5 ml were transferred into 10 ml volumetric flask and were diluted up
to the mark with 0.1 N HCl. Thus the final concentration ranges from 5-25 µg/ml.
Absorbance of each solution was measured at 475 nm against 0.1 N HCl as a blank. A
plot of concentrations of drug versus absorbance was plotted.
7.3In- vitro Dissolution study
Dissolution studies were performed for the fixed dose combination tablets by using
dissolution medium of 0.1N (HCl), 900 ml in USP dissolution apparatus II at 50 rpm and
370 ± 0.50C Tablets were weighed individually and subjected to dissolution testing. 5ml
sample was withdrawn at regular intervals ( 15, 30, 45 and 60 minutes ) and diluted to
1ml with dissolution medium and drug content was determined by using Uv-visible
spectrophotometer at 475nm.53An equal volume of fresh medium was replaced to
maintain the dissolution medium and the percentage degradation was calculated by using
the given formulae 5
PercentageDegradation=Initial concentration�Final concentration
Initial concentration×100
37

RESULTSRESULTSRESULTSRESULTS
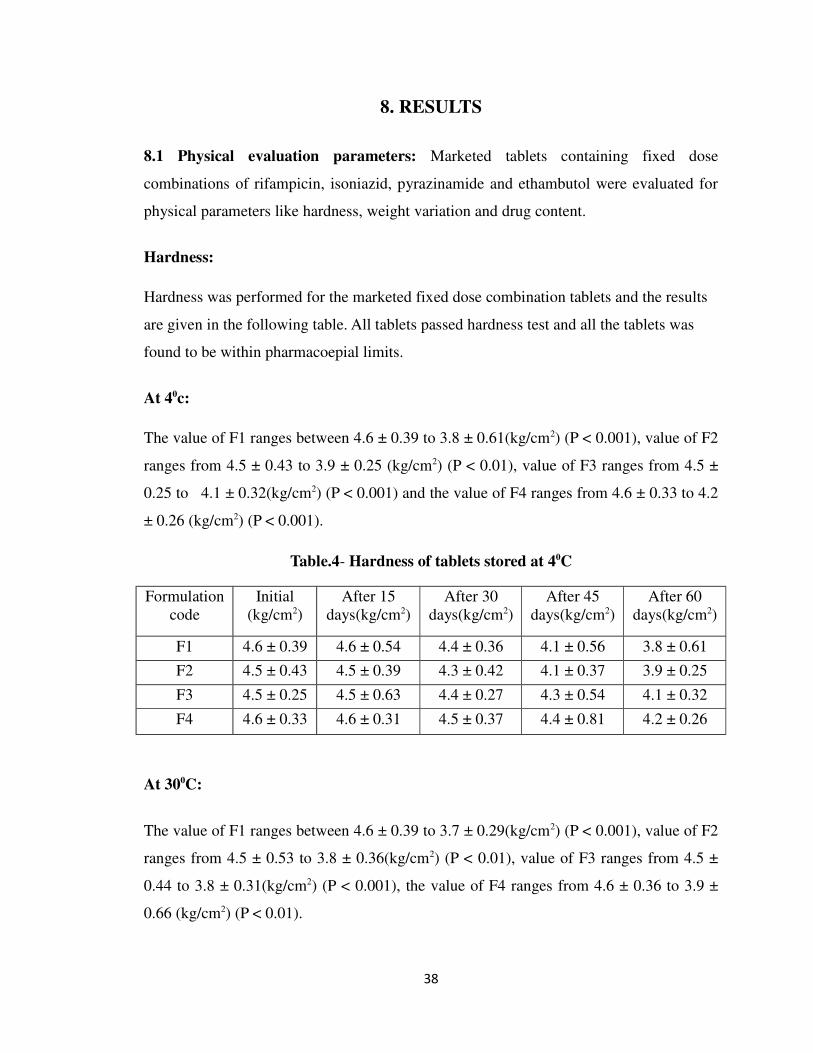
8. RESULTS
8.1 Physical evaluation parameters: Marketed tablets containing fixed dose
combinations of rifampicin, isoniazid, pyrazinamide and ethambutol were evaluated for
physical parameters like hardness, weight variation and drug content.
Hardness:
Hardness was performed for the marketed fixed dose combination tablets and the results
are given in the following table. All tablets passed hardness test and all the tablets was
found to be within pharmacoepial limits.
At 40c:
The value of F1 ranges between 4.6 ± 0.39 to 3.8 ± 0.61(kg/cm2) (P < 0.001), value of F2
ranges from 4.5 ± 0.43 to 3.9 ± 0.25 (kg/cm2) (P < 0.01), value of F3 ranges from 4.5 ±
0.25 to 4.1 ± 0.32(kg/cm2) (P < 0.001) and the value of F4 ranges from 4.6 ± 0.33 to 4.2
± 0.26 (kg/cm2) (P < 0.001).
Table.4- Hardness of tablets stored at 40C
Formulationcode
Initial(kg/cm2)
After 15days(kg/cm2)
After 30days(kg/cm2)
After 45days(kg/cm2)
After 60days(kg/cm2)
F1 4.6 ± 0.39 4.6 ± 0.54 4.4 ± 0.36 4.1 ± 0.56 3.8 ± 0.61
F2 4.5 ± 0.43 4.5 ± 0.39 4.3 ± 0.42 4.1 ± 0.37 3.9 ± 0.25
F3 4.5 ± 0.25 4.5 ± 0.63 4.4 ± 0.27 4.3 ± 0.54 4.1 ± 0.32
F4 4.6 ± 0.33 4.6 ± 0.31 4.5 ± 0.37 4.4 ± 0.81 4.2 ± 0.26
At 300C:
The value of F1 ranges between 4.6 ± 0.39 to 3.7 ± 0.29(kg/cm2) (P < 0.001), value of F2
ranges from 4.5 ± 0.53 to 3.8 ± 0.36(kg/cm2) (P < 0.01), value of F3 ranges from 4.5 ±
0.44 to 3.8 ± 0.31(kg/cm2) (P < 0.001), the value of F4 ranges from 4.6 ± 0.36 to 3.9 ±
0.66 (kg/cm2) (P < 0.01).
38

Table.5- Hardness of tablets stored at 300C
Formulationcode
Initial(kg/cm2)
After 15days(kg/cm2)
After 30days(kg/cm2)
After 45days(kg/cm2)
After 60days(kg/cm2)
F1 4.6 ± 0.62 4.4 ± 0.87 4.1 ± 0.58 3.9 ± 0.39 3.7 ± 0.29
F2 4.5 ± 0.53 4.3 ± 0.48 4.2 ± 0.29 4.1 ± 0.73 3.8 ± 0.36
F3 4.5 ± 0.44 4.4 ± 0.36 4.3 ± 0.77 4.0 ± 0.29 3.8 ± 0.31
F4 4.6 ± 0.36 4.5 ± 0.39 4.2 ± 0.23 4.2 ± 0.37 3.9 ± 0.66
AT 400C:
The value of F1 ranges between 4.6 ± 0.39 to 3.1 ± 0.22(kg/cm2) (P < 0.01), value of F2
ranges from 4.5 ± 0.53 to 3.3 ± 0.39(kg/cm2) (P < 0.001) value of F3 ranges from 4.5 ±
0.44 to 3.4 ± 0.43(kg/cm2), (P < 0.01), the value of F4 ranges from 4.6 ± 0.36 to 3.7 ±
0.64(kg/cm2) (P < 0.01).
Table.6- Hardness of tablets stored at 400C
Formulationcode
Initial(kg/cm2)
After 15days(kg/cm2)
After 30days(kg/cm2)
After 45days(kg/cm2)
After 60days(kg/cm2)
F1 4.6 ± 0.23 4.0 ± 0.33 3.7 ± 0.29 3.4 ± 0.65 3.1 ± 0.22
F2 4.5 ± 0.49 4.1 ± 0.57 3.8 ± 0.36 3.6 ± 0.40 3.3 ± 0.39
F3 4.5 ± 0.56 4.2 ± 0.42 3.9 ± 0.49 3.7 ± 0.58 3.4 ± 0.43
F4 4.6 ± 0.72 4.3 ± 0.73 4.1 ± 0.59 3.9 ± 0.39 3.7 ± 0.64
WEIGHT VARIATION:
Weight variation was performed for the marketed fixed dose combination tablets and
the results are given in the following table. The weight variation of all tablets was found
to be within the pharmacoepial limits of ± 5%.
AT 40C:
The value of F1 ranges between 1230 ± 36.05 to 1243 ± 20.81(mg) (P < 0.001), value of
F2 ranges between 1078 ± 25.65 to 1201 ± 38.18(mg) (P < 0.001), value of F3 ranges
39

from 1146 ± 45.09 to 1253 ± 30.50(mg) (P < 0.001), the value of F4 ranges from 1230 ±
36.05 to 1186 ±15.27(mg) (P < 0.001).
Table.7-Weight variation of tablets stored at 40C
Formulationcode
Initial(mg) After 15 days(mg)
After 30 days(mg)
After 45 days(mg)
After 60 days(mg)
FI 1230 ± 36.05 1230 ± 36.05 1246 ± 15.27 1246 ± 25.16 1243 ± 20.81
F2 1078 ± 25.65 1130 ± 75.49 1090 ± 26.45 1163 ± 65.06 1201 ± 38.18
F3 1146 ± 45.09 1150 ± 30.00 1150 ± 30.00 1126 ± 94.51 1253 ± 30.50
F4 1230 ± 36.05 1140 ± 90.00 1143 ± 15.27 1193 ± 32.14 1186 ±15.27
At 300C:
The value of F1 ranges between 1230 ± 36.05 to 1275 ± 51.00(mg) (P < 0.01) value of F2
ranges between 1078 ± 25.65 to 1201 ± 38.18 (mg) (P < 0.01) value of F3 ranges from
1146 ± 45.09 to 1241 ± 41.00(mg) (P < 0.001) the value of F4 ranges from 1230 ± 36.05
to 1148 ± 18.93(mg) (P < 0.01).
Table.8-Weight variation of tablets stored at 300C
Formulationcode
Initial(mg) After 15 days(mg)
After 30 days(mg)
After 45 days(mg)
After 60 days(mg)
FI 1230 ± 36.05 1236 ±25.16 1240 ± 36.05 1266 ± 30.55 1275 ± 51.00
F2 1078 ± 25.65 1140 ±55.67 1180 ± 55.67 1146 ± 41.63 1213 ± 35.11
F3 1146 ± 45.09 1193 ±25.16 1240 ± 30.00 1160 ± 26.45 1241 ± 41.00
F4 1230 ± 36.05 1173 ±25.16 1180 ± 26.45 1156 ± 51.31 1148 ± 18.93
AT 400C:
The value of F1 ranges between 1230 ± 36.05 to 1180 ± 18.53 (mg) (P < 0.001) value of
F2 ranges between 1078 ± 25.65 to 1230 ± 26.45(mg) (P < 0.001) value of F3 ranges
40

from 1146 ± 45.09 to 1330 ± 39.34(mg) (P < 0.001) the value of F4 ranges from 1230 ±
36.05 to 1220 ± 20.00(mg) (P < 0.001).
Table.9-Weight variation of tablets stored at 400C
Formulationcode
Initial(mg) After 15 days(mg)
After 30 days(mg)
After 45 days(mg)
After 60 days(mg)
FI 1230 ± 36.05 1245 ± 15.0 1196 ± 25.16 1181 ± 26.45 1180 ± 18.53
F2 1078 ± 25.65 1178 ± 20.20 1230 ± 20.00 1251 ± 17.51 1230 ± 26.45
F3 1146 ± 45.09 1243 ± 15.27 1093 ± 40.41 1146 ± 25.09 1330 ± 39.34
F4 1230 ± 36.05 1143 ± 25.16 1153 ± 45.09 1203 ± 25.16 1220 ± 20.00
DRUG CONTENT:
Drug content was performed for the marketed fixed dose combination tablets and the
results are given in the following table. The drug content of all the tablets was found to be
within the range of (80-110) %.
AT 40C:
The value of F1 ranges between 118 ± 0.375 to 96.3 ± 0.132(%) (P < 0.001) value of F2
ranges between 103 ± 0.195 to 97.5 ± 0.242(%) (P < 0.001) value of F3 ranges from 110
± 0.069 to 96.9 ± 0.139(%) (P < 0.001) the value of F4 ranges from 107 ± 0.129 to 91.2 ±
0.299(%) (P < 0.001).
Table.10- Drug content of tablets stored at 40C
Formulationcode
Initial (%) After 15 days(%)
After 30 days(%)
After45days (%)
After 60days (%)
FI 118 ± 0.375 110.4 ± 0.286 109.7 ± 0.692 102.4±0.236 96.3 ± 0.132
F2 103 ±0.195
100.7 ± 0.199 99.0 ± 0.329 98.1 ± 0.329 97.5 ± 0.242
F3 110 ± 0.069 103.2 ± 0.174 98.6 ± 0.192 96.9 ± 0.232 96.9 ± 0.139
F4 107 ±0.129
101.9 ± 0.261 97.4 ± 0.229 93.8 ± 0.189 91.2 ± 0.299
41

At 300C
The value of F1 ranges between 118 ± 0.375 to 91.2 ± 0.329(%) (P < 0.001) value of F2
ranges between 103 ± 0.242 to 90.8 ± 0.234(%) (P < 0.01) value of F3 ranges from 110 ±
0.329 to 91.7 ± 0.256 (%) (P < 0.001) the value of F4 ranges from 107 ± 0.295 to 90.6 ±
0.136 (%) (P < 0.01).
Table.11- Drug content of tablets stored at 300C
Formulationcode
Initial (%) After 15 days(%)
After 30days (%)
After 45days (%)
After 60days (%)
F1 118 ± 0.141 105 ± 0.163 99.3 ± 0.124 95.4 ± 0.149 91.2 ± 0.329
F2 103 ± 0.242 99.6 ± 0.121 96.7 ± 0.392 93.2 ± 0.126 90.8 ± 0.234
F3 110 ± 0.329 100.8 ±0.321
94.8 ± 0.369 94.8 ± 0.023 91.7 ± 0.256
F4 107 ± 0.295 98.9 ± 0.331 92.7 ± 0.135 92.7 ± 0.235 90.6 ± 0.136
AT 400C
The value of F1 ranges between 118 ± 0.375 to 87.6 ± 0.026(%) (P < 0.001) value of F2
ranges between 103 ± 0.234 to 85.4 ± 0.321 (%) (P < 0.001) value of F3 ranges from 110
± 0.322 to 88.3 ± 0.125(%) (P < 0.01) the value of F4 ranges from 107 ± 0.069 to 83.7 ±
0.312 (P < 0.01).
Formulationcode
Initial (%) After 15days (%)
After 30days (%)
After 45days (%)
After 60 days(%)
F1 118 ± 0.141 101 ± 0.163 97.8 ± 0.124 91.2 ± 0.062 87.6 ± 0.026
F2 103 ± 0.234 97 ± 0.223 94.1 ± 0.234 89.9 ± 0.139 85.4 ± 0.321
F3 110 ± 0.322 104.3± 0.121 98.8 ± 0.369 92.7 ± 0.392 88.3 ± 0.125
F4 107 ± 0.069 100.4 ±0.095 96.5 ± 0.251 80.3 ± 0.523 83.7 ± 0.312
Table.12- Drug content of tablets stored at 400 C
42

IN-VITRO DRUG RELEASE FOR MARKETED FIXED DOSE COMBINATION
TABLETS
Determination of standard curve for rifampicin in pH 0.1N HCL medium
Standard curve of rifampicin was determined by using UV- spectrophotometer at
476nm.Graph was plotted by taking absorbance (nm) on X axis versus concentration
(µg/ml) on Y-axis the results were shown in the table
Table.13 Standard curve of rifampicin in pH 0.1N HCL medium
Concentration (µg/ml) Absorbance ( nm)
5 0.079
10 0.14
20 0.3
30 0.44
40 0.58
50 0.69
Standard curve of rifampicin in 0.1N HCL
0 10 20 30 40 50 600
0.1
0.2
0.3
0.4
0.5
0.6
0.7
0.8
f(x) = 0.01x + 0.01
R² = 1
Standard Curve of Rifampicin 0.1 N HCL
Concentration (µg/ml)
Ab
sorb
ance
(nm
)
43

8.2 INVITRO DRUG RELEASE PROFILE BEFORE STORAGE
The stability of rifampicin was ascertained from the % release of drug at 60 minutes. As
rifampicin was absorbed maximum within an hour from acidic Environment of stomach
so the release is confined to 60 minutes.
Table.14 Invitro drug release profile for formulation F1 before storage
44
Time(min)Absorbance
(nm)Concentratio
n(µg/ml)Amount Of
DrugRelease(mg)
Cumulative%DrugRelease
15 0.052 3.77 34.0022.67 ± 0.012
30 0.08 5.72 51.4934.33 ± 0.009
45 0.115 8.27 74.5049.67 ± 0.816
60 0.148 10.62 95.6463.76 ± 1.724
**P<0.001
Time(min)Absorbance
(nm)Concentration
(µg/ml)Amount Of
DrugRelease(mg)
Cumulative%Drug Release
15 0.058 4.21 37.95 25.33 ± 0.062
30 0.084 6.05 54.48 36.32 ± 0.011
45 0.117 8.37 75.37 50.25 ± 0.016
60 0.149 10.71 96.4064.27 ± 0.571
**P<0.01

Table.16 Invitro drug release profile for formulation F2 before storage
Time(min) Absorbance(nm)
Concentration(µg/ml)
Amount OfDrug
Release(mg)
Cumulative %DrugRelease
15 0.064 4.58 41.29 27.53 ± 0.429
30 0.090 6.43 57.88 38.59 ± 0.436
45 0.119 8.57 77.19 51.46 ± 0.149
60 0.15 10.89 98.01 65.34 ± 0.277
**P<0.01
Table.17 Invitro drug release profile for formulation F4 before storage
Time(min) Absorbance(nm)
Concentration(µg/ml)
Amount OfDrug
Release(mg)
Cumulative%Drug Release
15 0.07 5.01 45.13 30.09 ± 0.530
30 0.096 6.92 62.31 41.84 ± 0.072
45 0.125 8.96 80.65 53.77 ± 0.294
60 0.16 11.46 103.2 68.8 ± 0.140
**P<0.01
45

0 10 20 30 40 50 60 700
10
20
30
40
50
60
70
80
Comparative study of marketed products before storage
f1
f2
f3
f4
Time(min)
C
um
ula
tiv
e %
dru
g r
ele
ase
Fig: 2
8.3 IN VITRO DRUG RELEASE PROFILE AT 40C
Table.18 In- vitro drug release profile for formulation F1 after 15 days at 40C
Time(min) Absorbance(nm)
Concentration(µg/ml)
Amount Of Drug Release(mg)
Cumulative %Drug Release
15 0.04 3.50 31.56 21.04 ± 0.394
30 0.075 5.42 48.79 32.53 ± 0.135
45 0.12 8.61 77.56 51.71 ± 0.179
60 0.145 10.41 93.76 62.51 ± 0.355
**P<0.001
46

Table.19 In vitro drug release profile for formulation F2 after 15 days at 40C
Time(min) Absorbance(nm)
Concentration(µg/ml)
Amount Of Drug Release(mg)
Cumulative %Drug Release
15 0.053 3.82 34.41 22.94 ± 0.140
30 0.079 5.65 50.92 33.95 ± 0.392
45 0.112 8.06 72.61 48.41 ± 0.364
60 0.147 10.5 94.56 63.04 ± 0.475
**P<0.01
Table.20 In vitro drug release profile for formulation F3 after 15 days at 40C
Time(min) Absorbance(nm)
Concentration(µg/ml)
Amount Of Drug Release(mg)
Cumulative %Drug Release
15 0.06 4.33 39.02 26.06 ± 0.129
30 0.08 6.2 55.86 37.24 ± 0.281
45 0.118 8.49 76.44 50.96 ± 0.156
60 0.149 10.7 96.34 64.23 ± 0.387
**P<0.01
47

Table.21 In vitro drug release profile for formulation F4 after 15 days at 40C
Time(min) Absorbance(nm)
Concentration(µg/ml)
Amount Of Drug Release(mg)
Cumulative %Drug Release
15 0.065 4.66 42.01 28.01 ± 0.125
30 0.094 6.76 60.84 40.56 ± 0.128
45 0.119 8.53 76.84 51.23 ± 0.162
60 0.131 11.38 102.42 68.28 ± 0.152
**P<0.01
The percentage drug release of rifampicin in 0.1N HCL before storage was found to be
68 % and after storage for 15 days at 40C there was no change in the percentage of drug
release this indicates that there was no degradation for after 15 days.
0 10 20 30 40 50 60 700
20
40
60
80
Comparative study of marketed products after 15 days
f1
f2
f3
f4
Time (min)
Cu
mu
lati
ve %
dru
g r
eleas
e
Fig.3
48

INVITRO DRUG RELEASE PROFILE AFTER 30 DAYS AT 40C
Table.22 In vitro drug release profile for formulation F1 after 30 days at 40C
Time(min) Absorbance(nm)
Concentration(µg/ml)
Amount OfDrug
Release(mg)
Cumulative%Drug Release
15 0.046 3.34 30.1 20.07 ± 0.212
30 0.075 5.18 46.02 31.08 ± 0.240
45 0.117 8.42 75.85 50.57 ± 0.183
60 0.144 10.34 93.06 62.04 ± 0.201
**P<0.01
Table.23 In vitro drug release profile for formulation F2 after 30 days at 40C
Time(min) Absorbance(nm)
Concentration(µg/ml)
Amount Of Drug Release(mg)
Cumulative %Drug Release
15 0.049 3.5 31.54 21.03 ± 0.181
30 0.074 5.34 48.09 32.06 ± 0.103
45 0.119 8.5 76.53 51.02 ± 0.201
60 0.145 10.42 93.78 62.52 ± 0.278
**P<0.01
49

Table.24 In vitro drug release profile for formulation F3 after 30 days at 40C
Time(min) Absorbance (nm)
Concentration(µg/ml)
Amount Of Drug Release(mg)
Cumulative %Drug Release
15 0.017 4.08 36.76 24.51 ± 0.013
30 0.081 5.84 52.56 35.04 ± 0.008
45 0.118 8.49 76.42 50.95 ± 0.140
60 0.148 10.58 95.22 63.48 ± 0.026
**P<0.01
Table.25 In vitro drug release profile for formulation F4 after 30 days at 40C
Time(min) Absorbance (nm)
Concentration(µg/ml)
Amount OfDrug
Release(mg)
Cumulative%Drug Release
15 0.065 4.65 41.89 27.93 ± 0.411
30 0.091 6.53 58.83 39.22 ± 0.132
45 0.116 8.34 75.12 50.08 ± 0.067
60 0.157 11.23 101.07 67.38 ± 0.430
**P<0.001
50

The percentage drug release of rifampicin after storage for 15 days at 40C was found to
be 68% and after 30 days the drug release was decreased to 63% due to degradation.
0 10 20 30 40 50 60 700
20
40
60
80
Comparative study of marketed products before storage after 30 days
f1
f2
f3
f4
Time ( min)
Cu
mu
lati
ve %
Dru
g r
ele
ase
Fig. 4
INVITRO DRUG RELEASE PROFILE AFTER 45 DAYS AT 40C
Table.26 In vitro drug release profile for formulation F1 after 45 days at 40C
Time(min) Absorbance(nm)
Concentration(µg/ml)
Amount Of Drug Release(mg)
Cumulative %Drug Release
15 0.051 3.7 33.37 22.25 ± 0.291
30 0.074 5.31 47.79 31.86 ± 0.121
45 0.12 8.59 77.38 51.59 ± 0.045
60 0.143 10.28 92.52 61.68 ± 0.406
**P<0.01
51

Table.27 In vitro drug release profile for formulation F1 after 45 days at 40C
Time(min) Absorbance(nm)
Concentration(µg/ml)
Amount Of Drug Release(mg)
Cumulative %Drug Release
15 0.054 3.86 34.77 23.18 ± 0.196
30 0.076 5.45 49.11 32.74 ± 0.134
45 0.121 8.71 78.45 52.30 ± 0.121
60 0.144 10.31 92.79 61.86 ± 0.172
**P<0.01
.
Table.28 In vitro drug release profile for formulation F3 after 45 days at 40C
Time(min) Absorbance (nm)
Concentration(µg/ml)
Amount Ofdrug
release(mg)
Cumulative %DrugRelease
15 0.056 4.03 37.27 24.18 ± 0.111
30 0.077 5.52 49.71 33.14 ± 0.286
45 0.124 8.87 79.90 53.27 ± 0.244
60 0.146 10.49 94.49 62.94 ±0.143
52

*** P< 0.001
Table.29 In vitro drug release profile for formulation F3 after 45 days at 40C
Time(min) Absorbance(nm)
Concentration(µg/ml)
Amount Of Drug Release(mg)
Cumulative %Drug Release
15 0.062 4.48 43.38 26.92 ± 0.081
30 0.09 6.44 58.02 38.68 ± 0.092
45 0.114 8.21 73.89 49.32 ± 0.084
60 0.165 11.18 100.62 67.08 ± 0.054
**P<0.01
The percentage drug release of rifampicin after storage for 45 days at 40C was reduced
further due to the formation of degradation.
0 10 20 30 40 50 60 700
20
40
60
80
Comparative study of marketed products before storage after 30 days after 45 days
f1
f2
f3
f4
Time (min)
Cu
mu
lati
ve %
Dru
g r
elea
se
53
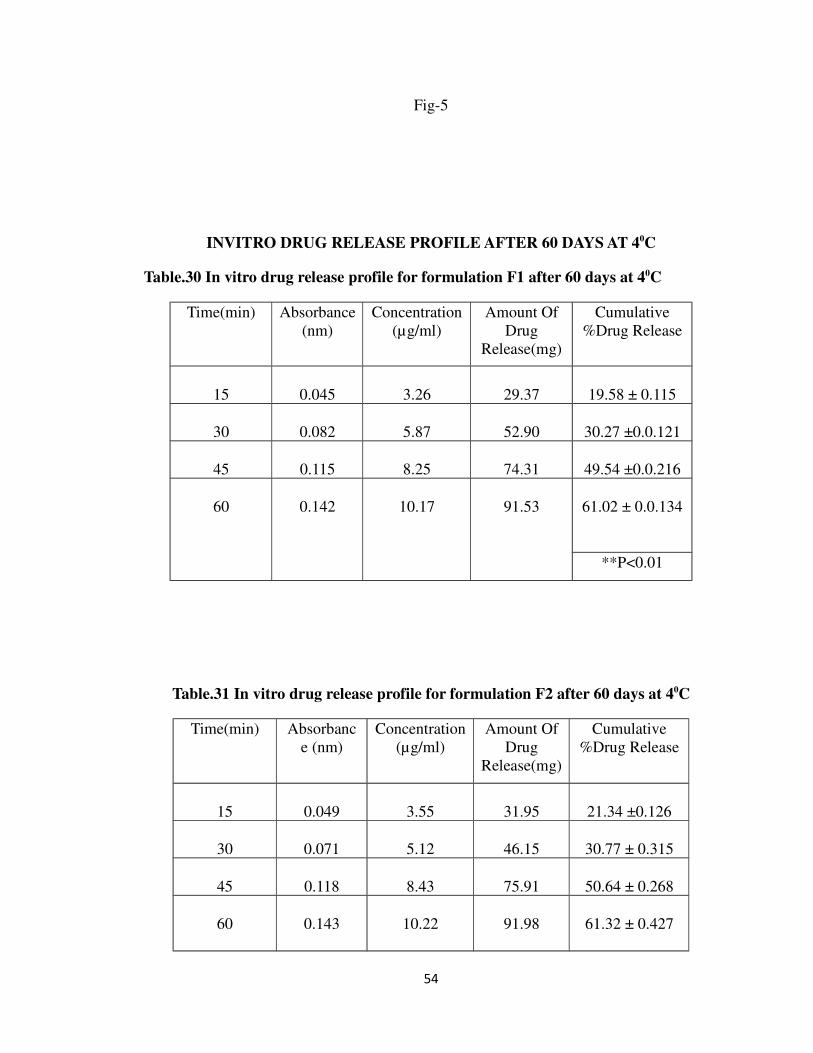
Fig-5
INVITRO DRUG RELEASE PROFILE AFTER 60 DAYS AT 40C
Table.30 In vitro drug release profile for formulation F1 after 60 days at 40C
Time(min) Absorbance(nm)
Concentration(µg/ml)
Amount OfDrug
Release(mg)
Cumulative%Drug Release
15 0.045 3.26 29.37 19.58 ± 0.115
30 0.082 5.87 52.90 30.27 ±0.0.121
45 0.115 8.25 74.31 49.54 ±0.0.216
60 0.142 10.17 91.53 61.02 ± 0.0.134
**P<0.01
Table.31 In vitro drug release profile for formulation F2 after 60 days at 40C
Time(min) Absorbance (nm)
Concentration(µg/ml)
Amount OfDrug
Release(mg)
Cumulative%Drug Release
15 0.049 3.55 31.95 21.34 ±0.126
30 0.071 5.12 46.15 30.77 ± 0.315
45 0.118 8.43 75.91 50.64 ± 0.268
60 0.143 10.22 91.98 61.32 ± 0.427
54

**P<0.001
Table.32 In vitro drug release profile for formulation F3 after 60 days at 40C
Time(min) Absorbance (nm)
Concentration(µg/ml)
Amount OfDrug
Release(mg)
Cumulative%Drug Release
15 0.055 3.93 35.37 23.58 ± 0.109
30 0.088 6.30 56.74 37.83 ± 0.542
45 0.12 8.62 77.44 51.63 ± 0.136
60 0.145 10.36 93.24 62.16 ± 0.251
**P<0.01
Table.33 In vitro drug release profile for formulation F4 after 60 days at 40C
Time(min) Absorbance(nm)
Concentration(µg/ml)
Amount Of Drug Release(mg)
Cumulative %Drug Release
15 0.063 4.56 41.1 27.40 ± 0.109
30 0.091 6.52 58.74 39.16 ± 0.458
45 0.117 8.39 75.51 50.34 ± 0.136
60 0.155 11.09 99.89 66.54 ± 0.251
**P<0.001
55

When compared to F1, F2, F3 andF4 formulations stored at 40c the percentage drug
release of rifampicin was found to be reduced more after 60 days and in F4 formulation
less amount of rifampicin get released due to less degradation because F4 formulation is
strip pack formulation.
0 10 20 30 40 50 60 700
10
20
30
40
50
60
70
Comparative study of marketed products before storage after 30 days after 60 days
f1
f2
f3
f4
Time (min)
cum
ula
tive
% D
rug
rele
ase
Fig-6
8.4 IN VITRO DRUG RELEASE PROFILE 30° C
Table.34 In vitro drug release profile for formulation F1 after 15 days at 300C
Time(min) Absorbance (nm)
Concentration(µg/ml)
Amount Of Drug Release(mg)
Cumulative %Drug Release
15 0.046 3.31 29.80 19.87 ± 0.213
30 0.072 5.15 46.41 30.94 ± 0.174
45 0.115 8.28 74.56 49.71 ± 0.571
60 0.144 10.32 92.88 61.92 ± 0.482
56

**P<0.01
Table.35 In vitro drug release profile for formulation F2 after 15 days at 300C
Time(min) Absorbance(nm)
Concentration(µg/ml)
Amount OfDrug
Release(mg)
Cumulative%Drug Release
15 0.049 3.5 31.5 21.04 ± 1.07
30 0.073 5.28 47.99 31.73 ± 0.954
45 0.117 8.28 75.48 50.32 ± 0.472
60 0.145 10.42 93.78 62.52 ± 0.218
**P<0.01
Table.36 In vitro drug release profile for formulation F3 after 15 days at 300C
Time(min) Absorbance (nm)
Concentration(µg/ml)
Amount OfDrug
Release(mg)
Cumulative%Drug Release
150.055 3.97 35.77 23.85 ± 0.189
30 0.081 5.79 52.11 34.74 ± 0.361
57

45 0.115 8.28 74.5 49.68 ± 0.437
60 0.147 10.52 94.68 63.12 ± 0.207
**P<0.01
Table.37 In vitro drug release profile for formulation F4 after 15 days at 300C
Time(min) Absorbance (nm)
Concentration(µg/ml)
Amount Of Drug Release(mg)
Cumulative %Drug Release
15 0.064 4.59 41.31 27.54 ± 0.115
30 0.092 6.58 59.29 39.53 ± 0.089
45 0.116 8.34 98.55 50.05 ± 0.673
60 0.157 11.23 101.07 67.38 ± 0.954
**P<0.01
The percentage drug release of rifampicin after storage for 15 days at 40C is found to be
68% and the percentage drug release after storage for 15 days at 300C is found to be 67%.
Fig-7
58
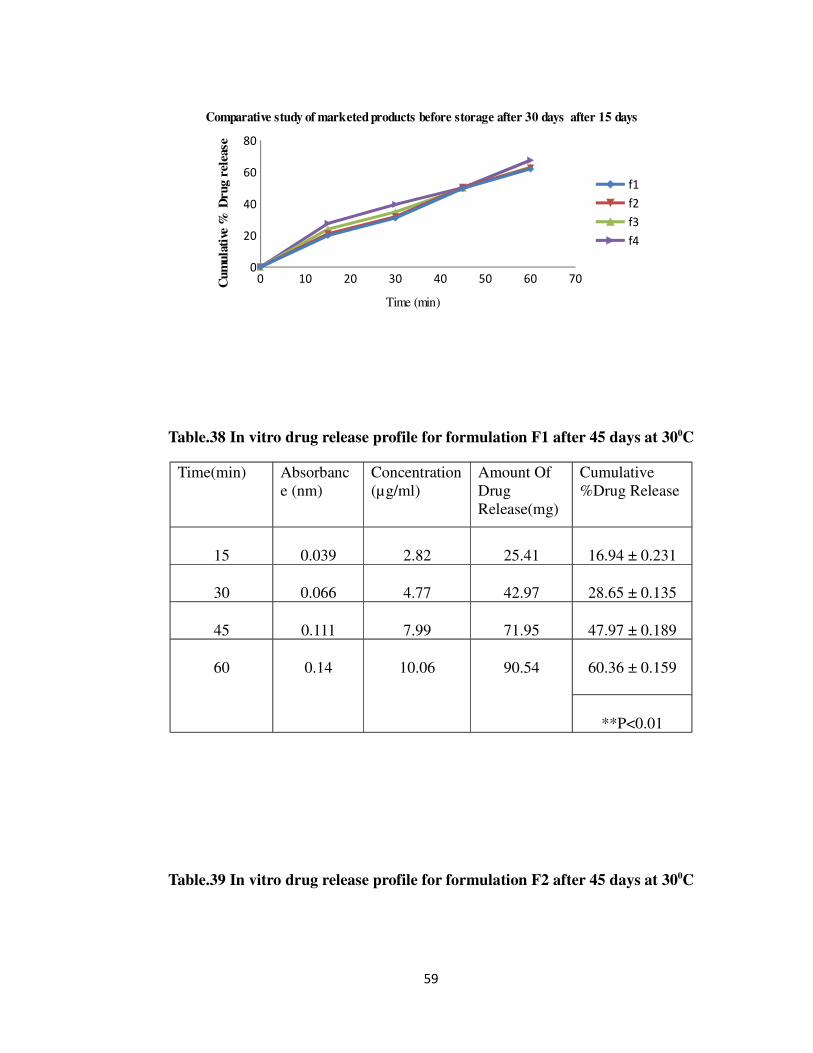
0 10 20 30 40 50 60 700
20
40
60
80
Comparative study of marketed products before storage after 30 days after 15 days
f1
f2
f3
f4
Time (min)
Cum
ula
tive
% D
rug r
elea
se
Table.38 In vitro drug release profile for formulation F1 after 45 days at 300C
Time(min) Absorbance (nm)
Concentration(µg/ml)
Amount Of Drug Release(mg)
Cumulative %Drug Release
15 0.039 2.82 25.41 16.94 ± 0.231
30 0.066 4.77 42.97 28.65 ± 0.135
45 0.111 7.99 71.95 47.97 ± 0.189
60 0.14 10.06 90.54 60.36 ± 0.159
**P<0.01
Table.39 In vitro drug release profile for formulation F2 after 45 days at 300C
59
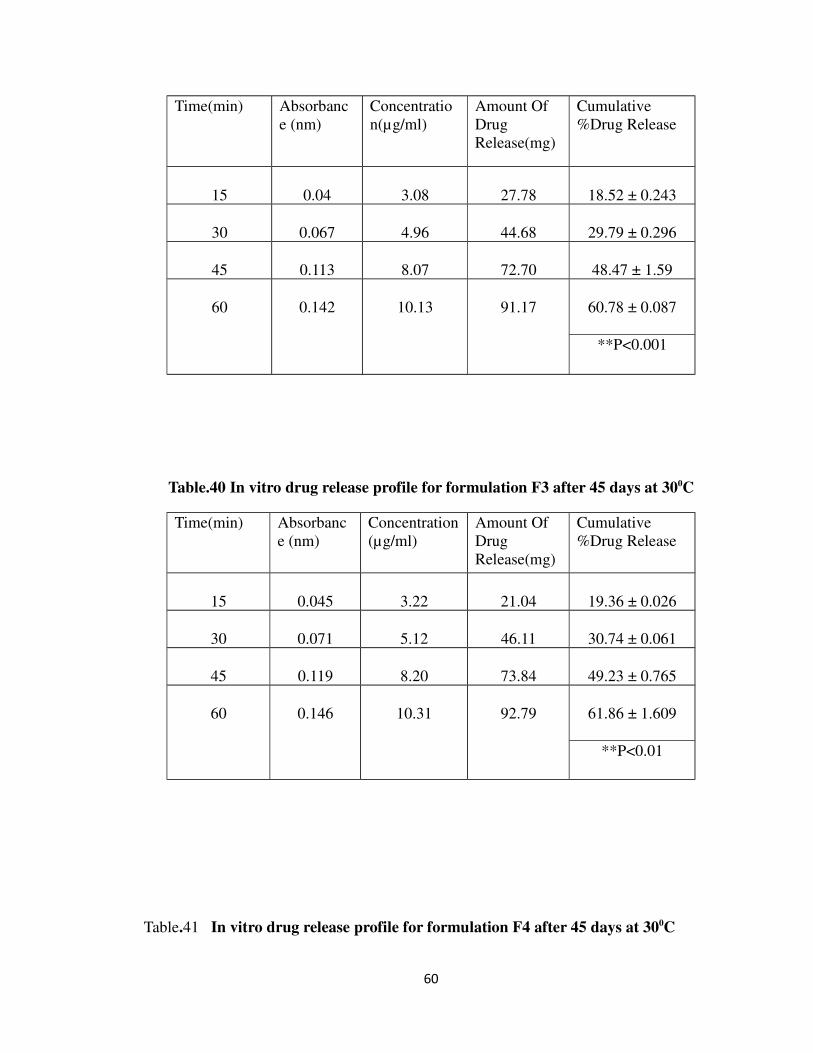
Time(min) Absorbance (nm)
Concentration(µg/ml)
Amount Of Drug Release(mg)
Cumulative %Drug Release
15 0.04 3.08 27.78 18.52 ± 0.243
30 0.067 4.96 44.68 29.79 ± 0.296
45 0.113 8.07 72.70 48.47 ± 1.59
60 0.142 10.13 91.17 60.78 ± 0.087
**P<0.001
Table.40 In vitro drug release profile for formulation F3 after 45 days at 300C
Time(min) Absorbance (nm)
Concentration(µg/ml)
Amount Of Drug Release(mg)
Cumulative %Drug Release
15 0.045 3.22 21.04 19.36 ± 0.026
30 0.071 5.12 46.11 30.74 ± 0.061
45 0.119 8.20 73.84 49.23 ± 0.765
60 0.146 10.31 92.79 61.86 ± 1.609
**P<0.01
Table.41 In vitro drug release profile for formulation F4 after 45 days at 300C
60

Time(min) Absorbance(nm)
Concentration(µg/ml)
Amount Of Drug Release(mg)
Cumulative %Drug Release
15 0.065 4.611 41.5 27.67 ± 2.18
30 0.088 6.35 57.18 38.12 ±1.609
45 0.118 8.46 76.2 50.8 ± 0.066
60 0.154 11 99 66.1 ± 1.327
**P<0.001
The percentage drug release of rifampicin after 30 days was found to be 66%
0 10 20 30 40 50 60 700
10
20
30
40
50
60
70
Comparative study of marketed products before storage after 30 days
f1
f2
f3
f4
Time (min)
Cu
mu
lati
ve %
Dru
g r
ele
ase
Fig-8
Table.42 In vitro drug release profile for formulation F1 after 45 days at 300C
Time(min) Absorbance(nm)
Concentration(µg/ml)
Amount OfDrug
Release(mg)
Cumulative%Drug Release
61

15 0.051 3.7 33.37 22.25 ± 0.273
30 0.074 5.31 47.79 31.86 ± 0.791
45 0.12 8.59 77.38 51.59 ± 0.198
60 0.143 10.28 92.52 61.68 ± 0.111
**P<0.01
Table.43 In vitro drug release profile for formulation F2 after 15 days at 300C
Time(min) Absorbance (nm)
Concentration(µg/ml)
Amount OfDrug
Release(mg)
Cumulative%Drug Release
15 0.054 3.86 34.77 23.18 ± 0.176
30 0.076 5.45 49.11 32.74 ± 0.329
45 0.121 8.71 78.45 52.30 ± 0.980
60 0.144 10.31 92.79 61.86 ± 0.876
**P<0.001
.
Table.44 In vitro drug release profile for formulation F3 after 45 days at 300C
62
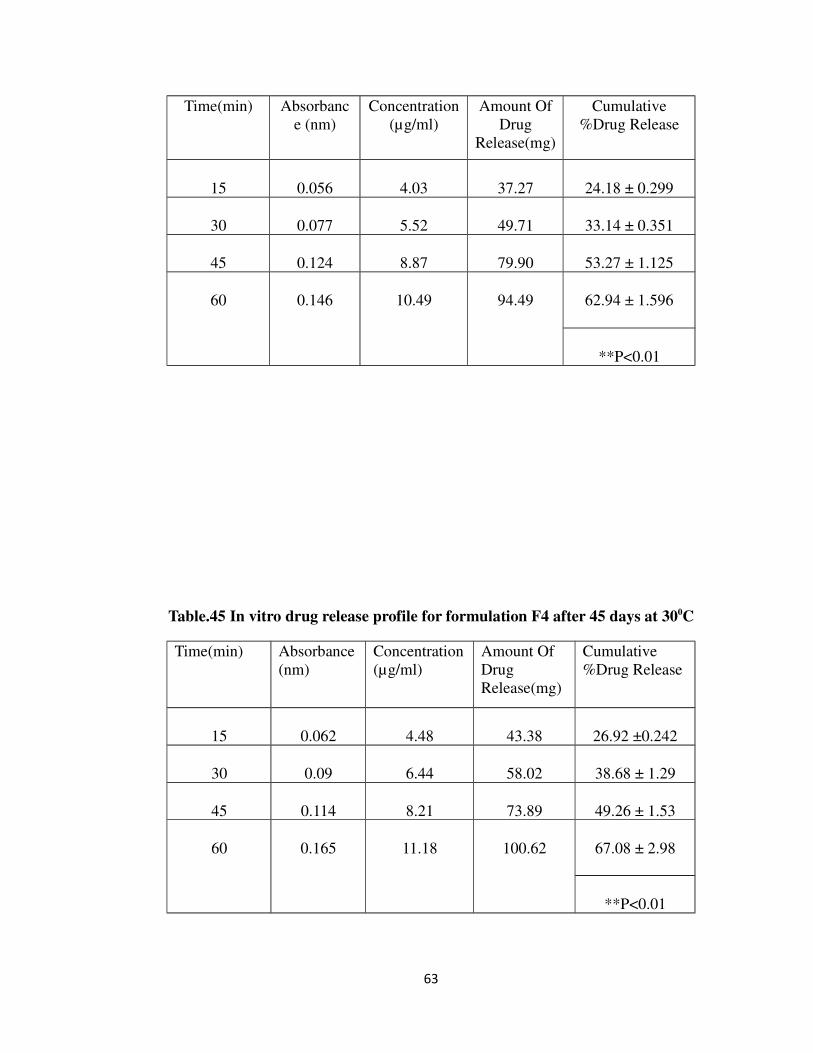
Time(min) Absorbance (nm)
Concentration(µg/ml)
Amount OfDrug
Release(mg)
Cumulative%Drug Release
15 0.056 4.03 37.27 24.18 ± 0.299
30 0.077 5.52 49.71 33.14 ± 0.351
45 0.124 8.87 79.90 53.27 ± 1.125
60 0.146 10.49 94.49 62.94 ± 1.596
**P<0.01
Table.45 In vitro drug release profile for formulation F4 after 45 days at 300C
Time(min) Absorbance(nm)
Concentration(µg/ml)
Amount Of Drug Release(mg)
Cumulative %Drug Release
15 0.062 4.48 43.38 26.92 ±0.242
30 0.09 6.44 58.02 38.68 ± 1.29
45 0.114 8.21 73.89 49.26 ± 1.53
60 0.165 11.18 100.62 67.08 ± 2.98
**P<0.01
63

When compared to percentage drug release for 30 days and 45 days there was no change
in the percentage of drug release.
0 10 20 30 40 50 60 700
20
40
60
80
Comparative study of marketed products before storage after 45 days
f1
f2
f3
f4
Time(min)
Cu
mu
lati
ve %
Dru
g r
ele
ase
Fig-9
Table.46 In vitro drug release profile for formulation F1 after 60 days at 300C
Time(min) Absorbance (nm)
Concentration(µg/ml)
Amount OfDrug
Release(mg)
Cumulative%Drug Release
15 0.046 3.32 29.91 19.94 ± 0.242
30 0.066 4.72 42.48 28.32 ± 2.98
45 0.11 7.86 70.77 47.18 ± 0.257
60 0.139 9.91 89.19 59.46 ± 1.29
**P<0.001
64

Table.47 In vitro drug release profile for formulation F2 after 60 days at 300C
Time(min) Absorbance(nm)
Concentration(µg/ml)
Amount OfDrug
Release(mg)
Cumulative%Drug Release
15 0.044 3.15 28.38 18.92 ± 0.181
30 0.064 4.62 41.59 27.73 ± 0.255
45 0.108 7.78 70.06 46.79 ± 0.462
60 0.138 9.86 88.74 59.16 ± 0.921
**P<0.01
Table.48 In vitro drug release profile for formulation F3 after 60 days at 300C
Time(min) Absorbance (nm)
Concentration(µg/ml)
Amount OfDrug
Release(mg)
Cumulative%Drug Release
15 0.047 3.40 30.61 20.41 ± 0.293
30 0.068 4.89 44.05 29.37 ± 0.114
45 0.113 8.10 72.93 48.62 ± 0.525
60 0.140 10.01 90.09 60.06 ± 0.139
**P<0.01
Table.49 In vitro drug release profile for formulation F4 after 60 days at 300C
65

Time(min) Absorbance(nm)
Concentration(µg/ml)
Amount Of Drug Release(mg)
Cumulative %Drug Release
15 0.057 4.08 36.73 24.49 ± 0.035
30 0.078 5.62 50.62 33.76 ± 0.352
45 0.121 8.71 78.45 52.30 ± 0.305
60 0.146 10.46 94.14 62.76 ± 0.237
**P<0.001
The percentage of drug release of rifampicin after 60 days was found to be 62% due to
more amount drug get degraded at 300C.When compared to 40C and 300C the degradation
was found to be more in 300C.
0 10 20 30 40 50 60 700
10
20
30
40
50
60
70
Comparative study of marketed products before storage after 60 days
f1
f2
f3
f4
Time(min)
Cu
mu
lati
ve%
Dru
g r
ele
ase
Fig-10
66

8.5 IN VITRO DRUG RELEASE PROFILE AT 400C
Table.50 In vitro drug release profile for formulation F1 after 15 days at 400C
Time(min) Absorbance (nm)
Concentration(µg/ml)
Amount OfDrug
Release(mg)
Cumulative%Drug Release
15 0.042 3.04 27.43 18.29 ± 0.092
30 0.070 5.04 45.36 30.24 ± 0.304
45 0.114 8.19 73.77 49.18 ± 0.275
60 0.141 10.13 91.17 60.78 ± 0.076
**P<0.001
Table.51 In vitro drug release profile for formulation F2 after 15 days at 400C
Time(min) Absorbance (nm)
Concentration(µg/ml)
Amount Of Drug Release(mg)
Cumulative %Drug Release
15 0.040 2.91 26.25 17.5 ± 0.038
30 0.064 4.93 44.41 29.61 ± 0.045
45 0.112 8 72.04 48.03 ± 0.083
60 0.141 10.11 90.99 60.66 ± 0.070
**P<0.01
67

Table.52 In vitro drug release profile for formulation F3 after 15 days at 400C
Time(min) Absorbance(nm)
Concentration(µg/ml)
Amount OfDrug
Release(mg)
Cumulative%Drug Release
15 0.034 2.46 31.15 20.77 ± 0.048
30 0.073 5.28 47.53 31.69 ± 0.039
45 0.116 8.34 75.09 50.06 ± 0.051
60 0.144 10.34 93.06 62.04 ± 0.042
**P<0.01
Table.53 In vitro drug release profile for formulation F4 after 15 days at 400C
Time(min) Absorbance (nm)
Concentration(µg/ml)
Amount Of Drug Release(mg)
Cumulative %Drug Release
15 0.066 4.78 43.02 28.68 ± 0.048
30 0.092 6.62 59.59 39.73 ± 0.348
45 0.121 8.71 78.39 52.26 ± 0.266
60 0.154 11 99 66.04 ± 0.362
**P<0.01
68

The percentage drug release of rifampicin after 15 days at 400C is found to be 66%.
0 10 20 30 40 50 60 700
10
20
30
40
50
60
70
Comparative study of marketed products before storage after days
f1
f2
f3
f4
Time ( min)
Cu
mu
lati
ve %
Dru
g r
ele
ase
Fig-11
Table.54 In vitro drug release profile for formulation F1 after 30 days at 400C
Time(min) Absorbance(nm)
Concentration(µg/ml)
Amount OfDrug
Release(mg)
Cumulative%Drug Release
15 0.040 2.88 25.96 17.39 ± 0.908
30 0.067 4.79 43.17 28.78 ± 0.168
45 0.111 7.96 71.76 47.84 ± 0.754
60 0.139 9.94 89.46 59.64 ± 0.958
**P<0.001
69

Table.55 In vitro drug release profile for formulation F2 after 30 days at 400C
Time(min) Absorbance(nm)
Concentration(µg/ml)
Amount OfDrug
Release(mg)
Cumulative%Drug Release
15 0.043 3.09 27.82 18.55 ± 0.121
30 0.069 4.94 44.46 19.64 ± 1.154
45 0.112 8.03 72.34 48.23 ± 0.329
60 0.14 9.98 89.82 59.88 ± 0.258
**P<0.01
Table.56 In vitro drug release profile for formulation F3 after 30 days at 400C
Time(min) Absorbance (nm)
Concentration(µg/ml)
Amount OfDrug
Release(mg)
Cumulative%Drug Release
15 0.04 3.2 28.83 19.22 ± 0.707
30 0.071 5.13 46.18 30.79 ± 0.383
45 0.115 8.28 74.56 49.71 ± 1.603
60 0.141 10.09 90.81 60.54 ± 0.923
**P<0.001
Table.57 In vitro drug release profile for formulation F3 after 30 days at 400C
70
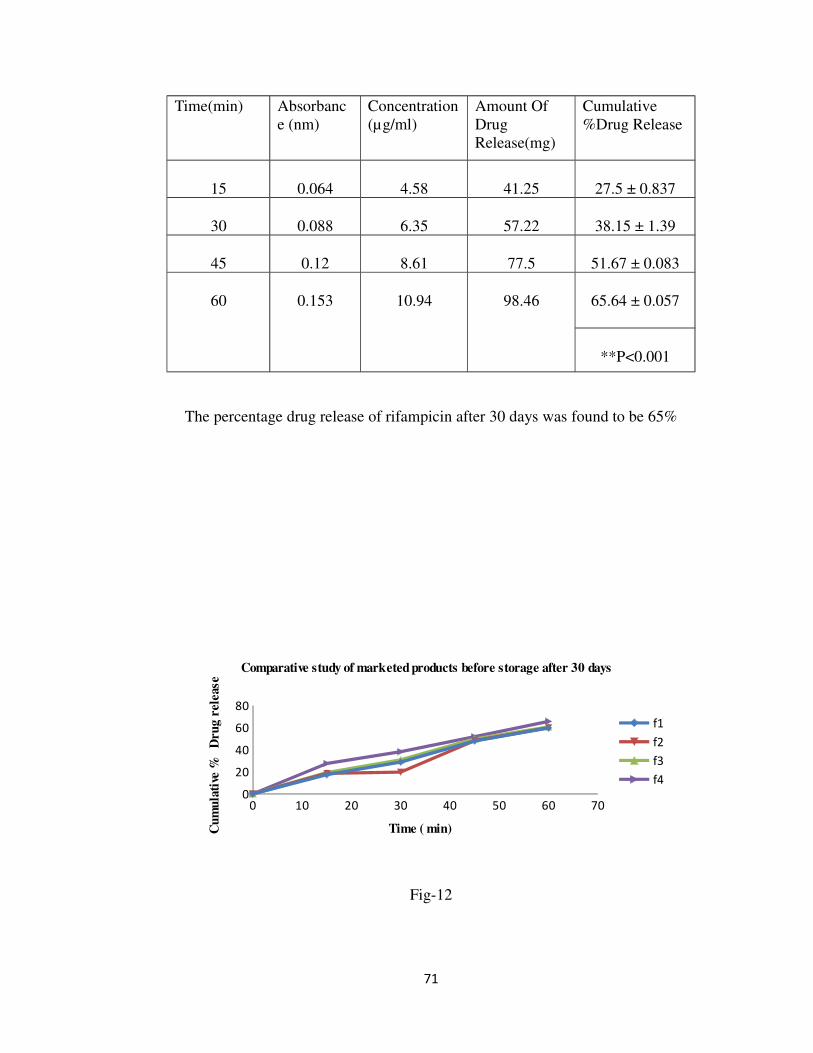
Time(min) Absorbance (nm)
Concentration(µg/ml)
Amount Of Drug Release(mg)
Cumulative %Drug Release
15 0.064 4.58 41.25 27.5 ± 0.837
30 0.088 6.35 57.22 38.15 ± 1.39
45 0.12 8.61 77.5 51.67 ± 0.083
60 0.153 10.94 98.46 65.64 ± 0.057
**P<0.001
The percentage drug release of rifampicin after 30 days was found to be 65%
0 10 20 30 40 50 60 700
20
40
60
80
Comparative study of marketed products before storage after 30 days
f1
f2
f3
f4
Time ( min)Cu
mu
lati
ve %
Dru
g r
eleas
e
Fig-12
71

Table.58 In vitro drug release profile for formulation F1 after 45 days at 400C
Time(min) Absorbance (nm)
Concentration(µg/ml)
Amount OfDrug
Release(mg)
Cumulative%Drug Release
15 0.044 3.21 28.89 19.26 ±0.547
30 0.067 4.81 43.30 88.87 ±0.321
45 0.11 7.911 71.20 47.42 ±0.145
60 0.138 9.89 89.01 59.34 ± 0.732
**P<0.01
Table.59 In vitro drug release profile for formulation F2 after 45 days at 400C
Time(min) Absorbance (nm)
Concentration(µg/ml)
Amount OfDrug
Release(mg)
Cumulative%Drug Release
15 0.042 3.06 77.54 18.36 ± 0.257
30 0.063 4.57 41.14 27.43 ± 0.236
45 0.107 7.71 69.45 46.30 ± 0.017
60 0.137 9.85 88.65 59.11 ± 0.997
**P<0.01
72

Table.60 In vitro drug release profile for formulation F3 after 45 days at 400C
Time(min) Absorbance (nm)
Concentration(µg/ml)
Amount Of Drug Release(mg)
Cumulative %Drug Release
150.045 3.25 29.23 19.52 ± 0.021
30 0.071 5.14 46.35 30.89 ± 0.063
45 0.074 5.30 74.76 49.82 ± 0.034
60 0.14 10.02 90.18 60.12 ± 0.134
**P<0.01
Table.61 In vitro drug release profile for formulation F4 after 45 days at 400C
Time(min) Absorbance (nm)
Concentration(µg/ml)
Amount OfDrug
Release(mg)
Cumulative%Drug Release
15 0.059 4.28 38.55 25.70 ± 0.048
30 0.084 6.03 54.27 36.18 ± 0.011
45 0.113 8.11 72.99 48.66 ± 0.031
60 0.149 10.69 96.21 64.14±0.048
**P<0.002
The percentage degradation of rifampicin was found to be 64% and drug release is
reduced more due to degradation of rifampicin is more after 45 days.
73

0 10 20 30 40 50 60 700
10
20
30
40
50
60
70
Comparative study of marketed products storage after 45 days
f1
f2
f3
f4
Time (min)
Cu
mu
lati
ve
% D
rug
re
lea
se
Fig-13
The percentage degradation of rifampicin was found to be 64% and drug release is
reduced more due to degradation of rifampicin is more after 45 days.
Table.62 In vitro drug release profile for formulation F1 after 60 days at 400C
Time(min) Absorbance(nm)
Concentration(µg/ml)
Amount OfDrug
Release(mg)
Cumulative%Drug Release
15 0.022 1.63 14.73 9.82 ± 0.237
30 0.046 3.32 29.91 19.94 ± 0.215
45 0.064 4.60 41.43 27.62 ± 0.228
60 0.085 6.13 55.2 36.89 ± 0.179
**P<0.01
74

Table.63 In vitro drug release profile for formulation F2 after 60 days at 400C
Time(min) Absorbance (nm)
Concentration(µg/ml)
Amount OfDrug
Release(mg)
Cumulative%Drug Release
15 0.024 1.77 16.0 10.67 ± 0.156
30 0.048 3.45 31.09 20.73 ± 0.024
45 0.068 4.91 44.20 29.47 ± 0.023
60 0.094 6.73 60.06 40.46 ± 0.051
**P<0.01
Table.64 In vitro drug release profile for formulation F3 after 60 days at 400C
Time(min) Absorbance(nm)
Concentration(µg/ml)
Amount OfDrug
Release(mg)
Cumulative%DrugRelease
15 0.042 3.0 27.06 18.04 ± 0.019
30 0.057 4.10 36.94 24.73 ± 0.026
45 0.076 5.46 49.21 32.81 ± 0.061
60 0.131 9.4 84.6 56.42 ± 0.110
**P<0.01
Table.65 In vitro drug release profile for formulation F4 after 60 days at 400C
75

Time(min) Absorbance(nm)
Concentration(µg/ml)
Amount Of DrugRelease(mg)
Cumulative%DrugRelease
15 0.028 2.07 18.69 12.46 ± 0.271
30 0.057 4.09 36.88 24.59 ± 0.233
45 0.074 5.29 47.69 31.75 ± 0.030
60 0.10 7.43 66.9 44.69 ± 0.165
**P<0.01
When compared to 15,30,45 and 60 days drug release at 60 days was found to be less
(44%) due to more amount of rifampicin get degraded due to gain in moisture by
ethambutol .
0 10 20 30 40 50 60 700
10
20
30
40
50
60
Comparative study of marketed products storage after 60 days
f1
f2
f3
f4
Time(min)
Cu
mu
lati
ve %
Dru
g r
elea
se
Fig-14
Table. 66 Comparative degradation of F1, F2, F3 and F4 formulations after 15, 30, 45
and 60 days at 40C
76

Formulationcode
Degradationafter 15 days (
%)
Degradation after30 days ( %)
Degradation after45 days ( %)
Degradationafter 60 days
(%)
F1 1.9 ± 0.165 2.6 ± 0.138 3.20 ± 0.283 4.23 ± 0.237
F2 1.96 ± 0.239 2.70 ± 0.319 3.73 ± 0.127 4.57 ± 0.521
F3 1.0 ± 0.168 2.12 ± 0.148 2.96 ± 0.693 4.16 ± 0.025
F4 1.69 ± 0.265 2.0 ± 0.293 2.44 ± 0.181 3.22 ± 0.179
**P<0.01
Fig-15
Fig-15
Table.67 Comparative degradation of F1, F2, F3 and F4 formulations after 15, 30, 45 and
60 days at 300
77
Formulationcode
Degradationafter 15 days
( %)
Degradationafter 30 days
( %)
Degradationafter 45 days
( %)
Degradationafter 60 days
(%)
F1 2.59 ± 0.261 5.27 ± 0.273 5.55 ± 0.069 6.68 ± 0.133
F2 2.70 ± 0.163 5.41 ± 0.076 6.53 ± 0.257 7.93 ± 0.192
F3 2.6 ± 0.242 4.62 ± 0.275 6.38 ± 0.174 7.40 ± 0.181
F4 2.27 ± 0.816 4.01 ± 0.525 4.97 ± 0.195 6.10 ± 0.056
**P<0.01

Fig-16
Table.68 Comparative degradation of F1, F2, F3 and F4 formulations after 15, 30,
45 and 60 days at 400C
78
Formulationcode
Degradationafter 15 days
(%)
Degradationafter 30 days
( %)
Degradationafter 45 days
( %)
Degradationafter 60 days
(%)
F1 11.6 ± 0.024 20 ± 0.154 39 ± 0.184 37.2 ± 0.179
F2 10.8 ± 0.312 16 ± 0.142 32 ± 0.199 38 ± 0.352
F3 8.8 ± 0.242 15 ± 0.359 33.85 ± 0.274 39 ± 0.251
F4 7.4 ± 0.139 13.3 ± 0.241 29 ± 0.349 34.2 ± 0.187
**P<0.01

79

DISCUSSIONDISCUSSIONDISCUSSIONDISCUSSION

RESULTS AND DISCUSSION
By comparing all four F1, F2, F3 and F4 formulations stored at different
temperatures like 40C, 300C and 400C with 75%RH. Formulations when stored at 40C
were found to having the hardness with in prescribed limits. Among the four
formulations, formulation F4 is found to be within the range of 4.2 to 4.6 and hence F4
formulation may be considered as the best formulation.
The percentage weight variation of all formulation was found to be within the
pharmacoepial limits. When compared to different temperatures for formulations stored
at 40C there was very less fall in drug content i.e. 91.2% which shows that the
degradation of drug is very low at 40C when compared to other temperatures
In- vitro stability studies:
Among all the four packaged formulations degradation of rifampicin was found to
be more in blister packages when compared to strip packages because blister packaged
tablets showed discoloration and bleeding inside package due to allowing the moisture to
ingress and resulted in higher degradation which was further supported by the previous
study.11 The another reason for degradation of rifampicin within formulation is due to the
formation hydrazine ( HYD ) which is the main degradation product whenever rifampicin
and isoniazid are combined together in FDC formulation and the another reason for rapid
degradation is due to hygroscopicty of ethambutol that is present in the four FDC.
By observing the above reasons among all FDC formulations which is packed in
strip package is found to be the best formulation since less amount of rifampicin was
degraded when compared to other formulation and there was no influence of light on
tablets packed in strips. Hence the strip products undergo less degradation when
compared to blister packages.
80

SUMMARYSUMMARYSUMMARYSUMMARY
& & & &
CONCLUSIONCONCLUSIONCONCLUSIONCONCLUSION
SUMMARY AND CONCLUSION

� A salient finding of this study is fixed dose combinations containing rifampicin,
isoniazid, pyrazinamide and ethambutol stored in freezer (40C) showed less
amount of degradation of rifampicin when compared to other temperatures like
300C and 400C with 75%RH.� This study showed that strip package undergo less degradation when compared to
blister package because strip packages show low moisture gain while blister
package show high moisture gain. � Therefore manufacturers should use packaging materials that provide strong
barriers.
81

REFERENCESREFERENCESREFERENCESREFERENCES
82

REFERENCES
1. Frieden TR, Sterling TR, Munsiff SS, Watt CJ, Dye C: Tuberculosis The
Lancet 2003; 362(9387):887-899
2. Blomberg B, Spinaci S, Fourie B, Laing R. The rationale for recommending
fixed-dose combination tablets for treatment of tuberculosis. Bull WHO
2001; 79: 61-68.
3. Bhutani, H., Mariappan, T.T., Singh, S., 2004. A study on the physical and
chemical stability of anti-tuberculosis fixed-dose combination (FDC)
products under accelerated climatic conditions. Int. J. Tuber. Lung Dis. 8,
1073-1080
4. Mitchison DA: Mechanism of drug action in short-course chemotherapy.
Bulletin International Union against Tuberculosis 1985, 65:30-7.5. Bhutani H, Singh S,Chakraborti A K, Jindal K C. Mechanistic explanation to
the catalysis by Pyrazinamide and Ethambutol of reaction between
Rifampicin and Isoniazid in anti-TB FDCs. J Pharm Biomed Anal 2005; 39:
892-8996. Shishoo C. J., Shah S.A., Rathod I.S., and Savale S.S., 2001. Impaired
bioavailability of rifampicin from fixed dose combination (FDC)
formulations with Isoniazid. Indian J. Pharm. Sci. 63 (6), 443-449.7. Shishoo, C.J., Shah, S.A., Rathod, I.S., Savale, S.S., Kotecha, J.S., Shah,
P.B., 1999. Stability of rifampicin in dissolution medium in presence of
isoniazid. Int. J. Pharm. 190, 109-23.8. Singh, S., Mariappan, T.T., Sankar, R., Sarda, N., Singh, B., 2001. A critical
review of the probable reasons for the poor/variable bioavailability of
rifampicin from anti-tubercular fixed-dose combination (FDC) products, and
the likely solutions to the problem. Int. J. Pharm. 228, 5–17.9. WHO Expert Committee on Specifications for Pharmaceutical Preparations
(1999: Geneva, Switzerland) WHO Expert Committee on Specifications for
Pharmaceutical Preparations: thirty-sixth report.
83

10. Amidon E. G and Middleton R.K.1988. Accelerated physical stability
testingand long term predictions of changes in crushing strength of tablets
storedin blister packages Int J.pharm., 45: 79-8911. Singh, S., Mohan, B., 2003. A pilot stability study on anti-tuberculosis four
drug fixed dose combination products. Int. J. Tuber. Lung Dis. 7, 298-30312. www.Tuberculosis.com13. WHO/HTM/TB/2008.40114. Panchagnula R, Agrawal S, Kaul CL. Fixed‐dose combinations in the
treatment tuberculosis. Ind J Pharm Sci, 2001; 63:1‐9.15. World Health Organization – Geneva 2003: Treatment of TB: Guidelines for
National Programmes.16. World Health Organization. Communicable Diseases Cluster: Fixed-dose
combination tablets for the treatment of tuberculosis. 1999.17. Heifets LB, Lindholm-Levy P: Comparison of bactericidal activities of
streptomycin, amikacin, kanamycin, and capreomycin against
Mycobacterium avium and M tuberculosis
18. Rieder HL. Epidemiologic basis of tuberculosis control. Paris: International
Union against Tuberculosis and Lung Disease, 1999; pp. 1-162.19. John Dewey Stability & Human bioavailability of novel rifampicin and
isoniazid FDC.20. Singh, S., Mariappan, T.T., Sharda, N., Kumar, S., Chakraborti, A.K., 2000.
The reason for an increase in decomposition of Rifampicin in the presence of
Isoniazid under acid conditions.Pharm. Pharmacol. Commun. 6, 405- 410.21. Savale, S.S., 2003. Dissolution study and its correlation with bioavailability
of the drugs.Ph.D. Thesis, Gujarat University, Ahmedabad22. Satish Balkrishna Bhise, Sevukarajan Mookkan Formulation and Evaluation
of Novel FDCs of Antitubercular Drugs ISSN: 0974-6943.23. ICH, 2003. Stability testing of the new drug substances and products, Q1A
(R2). Geneva, Switzerland.24. ICH Guidline on Stability Testing of New Drug Substances And
Products.Recommended for Adoption under Step 4 of the ICH Process on 8
November 2000 by the ICH Steering Committee.25. .Waterman C.K. and Adami C.R. 2005 Accelerated aging: prediction of
chemical stability of pharmaceuticals Int.J. Pharm., 293: 101-125.26. Airaksinen, S.T.T., 2005. Role of excipients in moisture sorption and physical
stability of solid pharmaceutical formulations.
84

27. Hu Y, Coates AR, Mitchison DA. Sterilising activites of fluroquinolones
against rifamintolerant populations of mycobacterium
tuberculosis.Antimicrob Agents Chemotheraphy 2003;47:653.28. Brogden RN, Fitton A. Rifabutin. A review of its antimicrobial activity,
pharmacokinetic properties and therapeutic efficacy. Drugs 1994; 47: 983-
1009.29. Eustice DC, Feldman PA, Zajac I, Slee AM. Mechanism of action of DuP
721: inhibition of an early event during initiation of protein synthesis.
Antimicrob Agents Chemother 1988; 32: 1218-22.30. Ashtekar DR, Costa-Perira R, Nagrajan K, Vishvanathan N, Bhatt AD, Rittel
W. In vitro and in vivo activities of the nitroimidazole CGI 17341 against
Mycobacterium tuberculosis. Antimicrob Agents Chemother 1993; 37: 183-6.31. Singh, S., Mohan, B., 2003. A pilot stability study on anti-tuberculosis four
drug fixed dose combination products. Int. J. Tuber. Lung Dis. 7, 298-303.32. Shrutidevi Agrawal, Ramesh Panchagnula 2004 Dissolution test as a
surrogate for quality evaluation ofrifampicin containing fixed dose
combination formulations International Journal of Pharmaceutics 287 (2004)
97–112.33. Mukesh C. Gohel and Krishnakant G. Sarvaiya 2007 A Novel Solid Dosage
Form of Rifampicin and Isoniazid With Improved Functionality34. Singh, S., Bhutani, H., Mariappan, T.T., 2006. Quality problems of anti-
tuberculosis fixed- dose combinations (FDCs): A way forward. Indian J.
Tuberc. 53, 201-205.35. Indian Pharmacopeia 2010 volume III page 2054-2055.36. Walter Wehrli.Rifampin: Mechanism of Action and Resistance.Rev Infect Dis
1983; 5:407-11.37. Van Scoy RE, Wilkowske CJ. Antituberculosis agents. Mayo Clin Proc
1987; 62:1129-36.38. R.S. Satoskar, S.D. Bhandarkar, Nirmala N. Rege. The pharmacology and
pharmacotherapeutics. 20th edition; page 737.39. Meyer H, Mally J. Über Hydrazinderivate der Pyridincarbonsäuren.
Monatsheftefür Chemie und verwandte Teile anderer Wissenschaften 1912;
23: 393-414.40. Indian Pharmacopeia 2010 volume II page 1515-1517.41. Winder FG, Collins PB. Inhibition by isoniazid of synthesis of mycolic acids
in Mycobacterium tuberculosis. J Gen Microbiol 1970; 63: 41-8.
85

42. Baciewicz AM & Self TH: Isoniazid interactions. South Med J 1985; 78:714-
718.43. Siskind MS, Thienemann D, Kirlin L. Isoniazid-induced neurotoxicity in
chronic dialysis patients: report of three cases and a review of the literature.
Nephron 1993; 64: 303-6.44. Jimenez-Lucho VE, Del Busto R, Odel J. Isoniazid and ethambutol as a cause
of optic neuropathy. Eur J Respir Dis 1987; 71: 42-5.45. Indian Pharmacopeia 2010 volume III page 2004-2005.46. Zhang Y, Scorpio A, Nikaido H, Sun Z. Role of acid pH and deficient efflux
of pyrazinoic acid in unique susceptibility of Mycobacterium tuberculosis to
pyrazinamide.J Bacteriol 1999; 181: 2044-9.47. Leonin TA, Julian EV, Baluis CR. A review of the hepatotoxic effects of anti-
TB drugs at the Veterans Memorial Medical Center. Chest 1979; 11: 140-8.48. Indian Pharmacopeia 2010 volume II page 1299-1301.49. Zhang Y, Telenti A. Genetics of drug resistance in Mycobacterium
tuberculosis. In: Hatfull GF, Jacobs WR, Jr., Eds. Molecular genetics of
mycobacteria. Washington, DC: ASM Press, 2000; 235-254.50. Peets EA, Sweeney WM, Place VA, Buyske DA. The absorption, excretion,
and metabolic fate of ethambutol in man. Am Rev Respir Dis 1965; 91: 51-8.51. Campbell IA, Ormerod LP. Ethambutol and the eye. (Correspondence).
Lancet 1988; 2: 1134.52. Indian Pharmacopeia 2010 volume I page 560.53. Benetton SA, Kedor-Hackmann ER, Santoro MI, Borges VM. Visible
spectrophotometric and first derivative UV spectrophotometric determination
of rifampicin and isoniazid in pharmaceutical preparation Talanta
1998;47:639-4354. Mariappan TT, Saranjit. Gastrointestinal permeability studies using
combinations of rifampicin and nucleoside analogue reverse transcriptase
inhibitors in rats Ind J. Pharmacol 2007;39,248-90.
86

87
Related Documents