TRMM Precipitation Radar reflectivity profiles compared to high-resolution airborne and ground-based radar measurements G. M. Heymsfield NASA Goddard Space Flight Center Greenbelt, Maryland B. Geerts Science Systems and Applications, Inc. Lanham, Maryland L. Tian Universities Space Research Associates Seabrook, Maryland To be submitted to Journal of Applied Meteorology Draft: 4/5/22 6:00 PM

Welcome message from author
This document is posted to help you gain knowledge. Please leave a comment to let me know what you think about it! Share it to your friends and learn new things together.
Transcript
TRMM Precipitation Radar reflectivity profiles compared to high-resolution airborne and ground-based radar
measurements
G. M. Heymsfield
NASA Goddard Space Flight Center
Greenbelt, Maryland
B. Geerts
Science Systems and Applications, Inc.
Lanham, Maryland
L. Tian
Universities Space Research Associates
Seabrook, Maryland
To be submitted to Journal of Applied Meteorology
Corresponding author address:
Gerald M. Heymsfield, NASA GSFC, Code 912, Greenbelt, MD 20771.
Draft: 5/18/23 3:14 PM

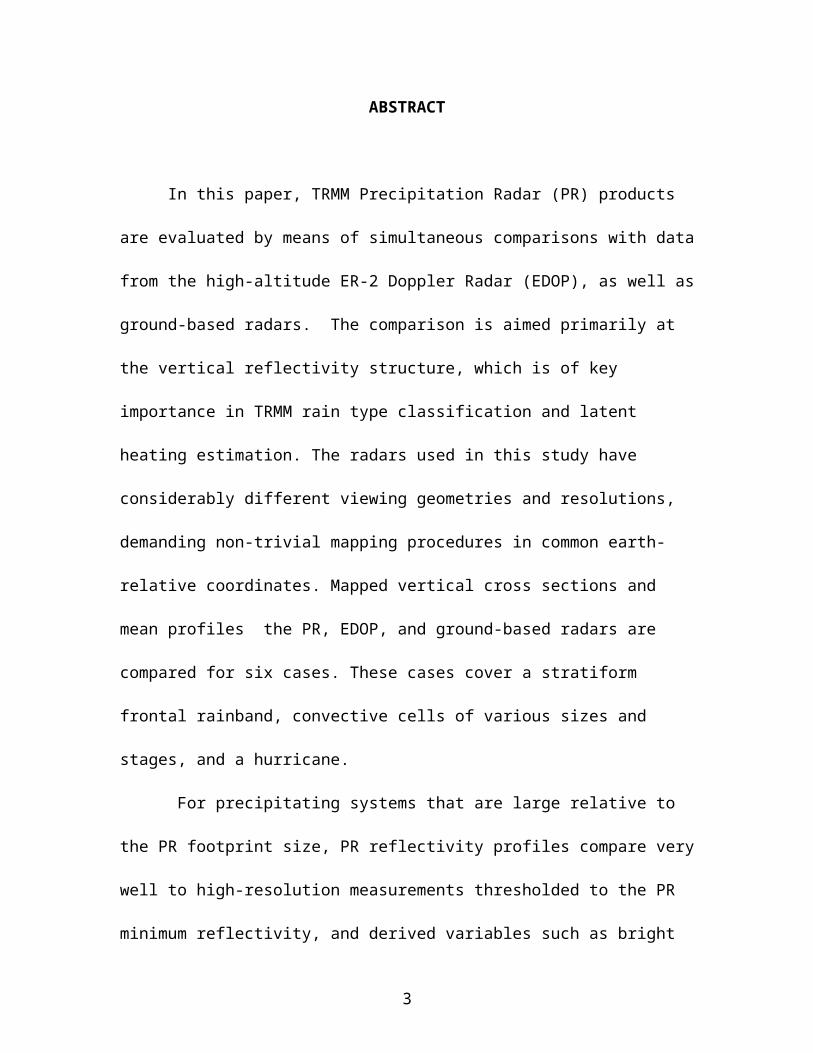
ABSTRACT
In this paper, TRMM Precipitation Radar (PR) products are evaluated by means
of simultaneous comparisons with data from the high-altitude ER-2 Doppler Radar
(EDOP), as well as ground-based radars. The comparison is aimed primarily at the
vertical reflectivity structure, which is of key importance in TRMM rain type
classification and latent heating estimation. The radars used in this study have
considerably different viewing geometries and resolutions, demanding non-trivial
mapping procedures in common earth-relative coordinates. Mapped vertical cross
sections and mean profiles the PR, EDOP, and ground-based radars are compared for six
cases. These cases cover a stratiform frontal rainband, convective cells of various sizes
and stages, and a hurricane.
For precipitating systems that are large relative to the PR footprint size, PR
reflectivity profiles compare very well to high-resolution measurements thresholded to
the PR minimum reflectivity, and derived variables such as bright band height and rain
types , even at high PR incidence angles. It was found that for, the PR reflectivity cells
small relis weaker than in reality. Some of these differences can be explained by non-
uniform beam filling. For other cases where strong reflectivity gradients occur within a
PR footprint, the reflectivity distribution is spread out due to filtering by the PR antenna
illumination pattern. In these cases, rain type classification may err and be biased
towards the stratiform type, and the average reflectivity tends to be underestimated. The
limited sensitivity of the PR implies that the upper regions of precipitation systems
remain undetected and that the PR storm top height estimate is unreliable, usually
2
underestimating the actual storm top height. This applies to all cases but the discrepancy
is larger for smaller cells where limited sensitivity is compounded by incomplete beam
filling. Users of level three TRMM PR products should be aware of this scale
dependency.
3

1. Introduction
The Tropical Rainfall Measuring Mission (TRMM) satellite carries a spaceborne
radar, providing real-time and climatological rainfall estimation (Kummerow et al 1998).
In 1998-99 several TRMM field campaigns were held to validate TRMM radar reflectivity
and passive microwave data over tropical precipitation systems. 1999 *****ne****).
The TEFLUN-A (TExas-FLorida UNderflight) campaign focused on springtime
mesoscale convective systems (MCSs) mainly in southeastern Texas. TEFLUN-B was
conducted in August-September 1998 in central Florida, in coordination with CAMEX-3
(Third Convection and Moisture Experiment). The latter focused on hurricanes, especially
during their landfall, whereas TEFLUN-B concentrated on central Florida convection,
which is largely organized by sea breeze circulations. Finally, TRMM-LBA (Land-
Biosphere-Atmosphere interaction in the Amazon) took place during the first two months
of 1999 in the southwestern quadrant of the Amazon Basin 1 . All experiments were amply
supported by surface data, in particular a network of raingauges and radiosondes, a
ground-based polarization radar, wind profilers, a cloud physics aircraft penetrating the
storms, and a high-altitude aircraft (NASA ER-2 and DC-8 [TEFLUN-B only]), flying
over the same storms. One of these aircraft, the ER-2, was equipped with visible, infrared
and microwave imagers, electric field detectors, an interferometer, and the dual-antenna
X-band ER-2 Doppler Radar (EDOP).
This study aims to assess how well the TRMM Precipitation Radar (PR) measures
the vertical structure of a variety of precipitating systems. Of key importance to PR
validation are TRMM-coincident aircraft flights over and within precipitating clouds,
1 ettp://www.cptec.inpe.b
4

especially if these clouds are located within the network of ground-based instruments.
Coordinated airborne/surface radar measurements provide high spatial and temporal
coverage of precipitation systems covered by a single TRMM pass, thereby improving our
understanding of how well TRMM measures rainfall from storms of various sizes,
intensities and evolutionary stages. In particular, the segregation between convective and
stratiform precipitation by means of TRMM-based criteria can be evaluated with high-
resolution data.
TRMM PR data are calibrated and geolocated, and reflectivities are corrected for
attenuation and partial beam filling. Furthermore, a range of qualitative and quantitative
attributes is derived from the PR reflectivity profiles. The relative reliability of these data
corrections and derived products can only be assessed through detailed validation efforts.
One validation approach is to statistically compare TRMM products to independent data
sets, such as ground radar, rain gauge, satellite IR, or sounding data. The statistical
approach is justified by the sparse sampling nature of the PR, both in space and in time,
making simultaneous comparisons too rare. Studies of this kind are facilitated by the
monthly-mean products (level 3) provided by the TRMM Science Data and Information
System (TSDIS). For instance, 3A-25 data are gridded monthly-mean PR-based rainfall
estimates for the global tropics. The two data sets in any statistical comparison comprise
distinct precipitation systems, but these 'individual' differences become insignificant when
sufficiently large samples are compared. The availability of a statistically large enough
sample of PR data is questionable in some regions and for some periods. More
importantly, the data sets used in statistical comparisons, in particular rain gauge data, are
5

only indirect measures of the PR measurements, thereby incorporating many uncertainties
which remain even when the averages match very well.
In this study we evaluate the TRMM PR products by means of simultaneous comparisons
against high-resolution reflectivity data in a small sample of storms. Of particular
importance are EDOP measurements. EDOP is a non-scanning instrument with two
antennas, one pointing to the nadir, the other pointing 33.5 forward (Heymsfield et al.
1996). EDOP is an excellent PR validation tool, because of its high vertical and
horizontal resolution, and also because, unlike ground-based radars, its nadir antenna has
essentially the same perspective as the PR (Figure 1). The purpose of this paper is not to
assess the accuracy of the PR calibration. Calibration tests are routinely undertaken by
the Japanese Space Agency (NASDA) to evaluate sensor consistency and drift. Recent
tests concluded that the PR is consistent with a calibration accuracy within 1 dBZ. EDOP
data themselves underwent rigorous calibration tests, before and after the field
experiments, and *erry the latest conclusion is that the EDOP reflectivities shown in this
paper are 1-3 dBZ higher than that of the PR. But the calibration issue is not the topic of
this paper. Rather, the PR's vantage point, wavelength and other radar characteristics are
significantly different from those of EDOP (Table 1), and these differences lead to
several important differences in radar observations.
(1) Horizontal resolution. EDOP's beamwidth is ~3.0, which in the nadir translates to
~0.5 km at 10 km altitude and ~1.0 km at sea level, when the ER-2 flies at 20 km
altitude. Such resolution is sufficient to see most precipitating convective cells (e.g.
LeMone and Zipser 1980). Shear-induced slopes in hydrometeor fallstreaks can often
be seen, as well as mammata-like anvil protuberances. The PR footprint size is about
6
4.3 km throughout the troposphere. Convective precipitation often falls from isolated
cells smaller than 4.3 km. Only about 5% of the convective updrafts (with at least 0.5
m s-1) over tropical oceans have a diameter of at least 4.3 km (Jorgensen and LeMone
1989). Goldhirsh and Musiani (1986) found that the median convective cell size for
summer storms near the mid-Atlantic coast of the United States is only 1.9 km. A
minor related difference is that the EDOP sampling rate is 0.5 sec, resulting in an
along-track sampling of about 100 m and an 80-90% overlap from one beam to the
next. This yields higher beam-to-beam continuity and better resolution, since the
pulse-volume averaged radar reflectivity represents a mean value at the center of the
radar beam. No such oversampling occurs for the PR.
(2) Sensitivity. The TRMM PR's noise level (floor) is at ~-111 dBm (Bolen and
Chandrasekar 1999); therefore the minimum detectable signal is approximately 18
dBZ. While this covers all rain rates down to about 0.4 mm hr-1 (assuming uniform
beam filling), EDOP has a much higher sensitivity, allowing it to see the lightest rain,
and most of the ice region of precipitating cloudsthe spatial variipitation sometimes is
rar the cloud top. The effects of limited horizontal resolution and low sensitivity
combine to exclude isolated, small storm cells from the PR's view. To be seen by the
PR, a cell with a diameter of 1 km needs to have an average reflectivity of at least 33
dBZ (Figure 4 in Bolen and Chandrasekar 1999). If the cell is located off-center in the
PR footprint, the required reflectivity would be even higher, as will be discussed in
Section 2b.
(3) Vertical resolution. The EDOP range resolution is 37.5 m, compared to 250 m for the
PR. This implies that the PR vertical resolution is equally-distributed over 250 m at
7

nadir, decreasing to a 1,580 m deep layer at the outer incidence angle (17o) where the
radar pulse-volume (a slice of 4.3 km x 250 m) is slanted at 17o from a level plane. As
a consequence, detailed EDOP-derived bright band (denoted BB) profiles can be used
to examine the ability of the PR to detect and characterize BBs at varying incidence
angles.
(4) Attenuation. At 13.8 GHz the PR reflectivity profile suffers from significant
attenuation in the lowest beam, both in convective and stratiform precipitation with
peak reflectivities greater than about 35 dBZ. This threshold decreases slightly with
increasing depth of the high-reflectivity layer, e.g. the path-integrated attenuation
(PIA) is 5 dB for a 5 km deep layer. Attenuation rate (dB per kilometer) at the EDOP
frequency (9.6 GHz) is about a factor of two less than at the TRMM frequency; for
many situations, EDOP has minimal attenuation for reflectivities below about 45
dBZ, or about 40 dBZ if these values are sustained through a deep layer, as
commonly occurs in tropical deep convection. In this study we use attenuation-
corrected PR reflectivity data (2A25) exceed 35 dBZ in all but one of the cases exam
45 dBZ in all cases.
Given these differences, one can treat EDOP cross-sections as high-resolution
'truth' for the TRMM PR. This implies that EDOP data can be 'degraded' to a PR
perspective, and that degraded EDOP data from the various TRMM field campaigns can
be used as a surrogate for the PR. This argument was a key motivation for the high-
altitude remote sensing aircraft participation in the TRMM field campaigns (Zipser et al.
1999). TRMM overpasses are relatively rare and do not document the lifecycle of
8
storms, therefore cloud microphysical modeling efforts aimed at improving TRMM
precipitation algorithms and derived latent heating profiles will benefit from EDOP data
as a complement to TRMM PR data. Furthermore, PR-observed features can be
extrapolated to finer scales and to higher hydrometeor sensitivity by means of an inverted
degrading process, however such process is not unambiguous. One such extrapolation is
the estimation of the storm top height from PR data.
Of the four differences listed above, the first two are the most important. There is
some concern that non-uniform beam filling (NUBF) has a systematic effect on PR
reflectivity and hence rainfall and latent heating estimates. This concern has been
addressed both with theoretical and observed echo patterns, however real TRMM data
have not been used until now. Durden et al (1998) used a scanning 13.8 GHz radar (the
Airborne Rain Mapping radar or ARMAR) aboard the NASA DC-8 to simulate PR
reflectivities in three dimensions. They found that degraded ARMAR data of tropical
oceanic convection tend to overestimate the reflectivity near the cloud tops and
underestimate the path-integrated attenuation. Amayenc et al (1996) also found some
biases due to NUBF using nadir-looking airborne radar data of a rainstorm off the East
Coast of the USA. Kozu and Iguhi (1999) proposed a correction to PR rainrate data due
to NUBF, based on the local fine-scale rainfall variability as observed using ship-based
radar data in the western equatorial Pacific. This variability can be correlated with a PR-
measurable quantity such as PIA, however this correlation is probably not universally
valid. In short, the de facto impact of sub-beam-scale convection and sharp reflectivity
gradients on PR rain estimation and classification is not well understood and has not been
analyzed by comparing PR data to high-resolution data.
9
In this paper, comparisons are made between the PR, EDOP, and ground-based
radars for six TRMM overpasses during TEFLUN and TRMM-LBA. The emphasis of
this study is on comparison of the vertical patt of EDOP and PR reflectivities, whereas
the ground radars provide an independent check on the PR measurements. Other data,
such as passive microwave measurements from the TRMM Microwave Imager (TMI)
and the ER-2 mounted Advanced Microwave Precipitation Radiometer (AMPR) (Spencer
et al., 1984), are only used in the interpretation of the PR-EDOP comparison. PR-derived
products, such as BB characteristics and precipitation classification, are assessed as well,
but the key PR variable in most other studies, i.e. surface rainrate, is not addressed here.
Because of the small size of some of the selected storms, and the different viewing
geometries and resolutions of the various radars, accurate mapping of these data to a
common coordinate system is required. Section 2 describes the details of this mapping
methodology. In Section 3, six examples are presented, covering a mainly stratiform
frontal rainband), a convective cell in its decaying stage, a small, growing convective
cell, a small mesoscale convective system (MCS), and a hurricane. Composite
reflectivity profiles in Section 4.
2. Methodology
2a. Viewing geometry, resolution, and beamfilling effects
Comparison of the PR with EDOP and ground-based radars involves data from
drastically different viewing geometries (Figure 1). Both the PR and EDOP have high
vertical resolution but blur the horizontal structure, while ground-based radars have
excellent slant-range resolution but blur the vertical structure. The ground radars
10
themselves, i.e. S-POL, TOGA, and WSR-88D, have somewhat different range
resolutions and beamwidths. Furthermore, the range gate values of reflectivity from the
different radars are located at different locations in space and time. Comparison of data
from these radars requires interpolation to a common reference frame with high accuracy
geo-location. Two approaches are possible, each of which has merits. The first approach
is to degrade all the data sets to the lowest common resolution volume. This volume has
the horizontal dimensions of the PR footprint and the range-dependent vertical depth of
the beam of the nearest ground radar. This allows for examination of differences
between data sets all on the same, lowest resolution scale. This approach is ideally suited
for calibration comparisons but it does not deal with the NUBF problem. The second
approach is to interpolate all the observations to the coordinates of the highest resolution
data (i.e., EDOP), in order to examine what reflectivity structures are present in each data
set relative to the high-resolution ‘truth’. The second approach is used in this paper, i.e.
PR and ground-based radar reflectivities are resampled to a dense. One exception is the
PR's vertical resolution, which is maintained at its nadir value (250 m). This approach is
generally analogous to routine meteorological interpolation of upper air and surface
observations to a grid for NWP model initialization. These data usually are widely-
spaced relative to grid intervals and thus the interpolation method can be important in
filtering and in reducing data aliasing (e.g., Trapp and Doswell 1999). The technique to
interpolate the PR and ground-based radars to an EDOP section is described in Appendix
A.
The largest cause of residual difference (i.e., not related to radar characteristics)
between correctly geo-interpolated radar data is the non-simultaneity of the radar
11

measurements. TRMM measurements of a storm are essentially instantaneous, while
ground-based radar volumes are collected in 3-5 minutes and EDOP data collected in ~8
min/100 km (Appendix B). During a time lag of a few minutes echo patterns can be
displaced significantly, such as in hurricane conditions, and/or they can evolve, which is
especially likely in small, short-lived convective cells. A better match than the ones
presented in this paper could be obtained by correcting the data to a common time, i.e.
the EDOP observation time. Temporal correction for advection is possible because of the
3-D radar data, however advectioimated, and evolution is the more common culprit of
differences in cases presented hereept the u. Such 'meteorological' (non-radar)
differences emphasize the importance of simulating PR data by means of EDOP data, as
discussed above. The details of the degrading process are described in Appendix B.1. In
essence EDOP data are gridded to a vertical section and then degraded to the TRMM
resolution by sampling it with a one-dimensional (along-track) representation of the PR
antenna illumination function. This process accentuates differences in horizontal
resolution between the PR and EDOP.
2b. Radar beam filtering.
It is well known that the radar antenna main and side-lobes cause distortion of a
meteorological target (Donaldson 1964). This is particularly true in sharp hydrometeor
gradient regions viewed by ground-based radars, or vertical edges of storms viewed by
the PR and EDOP. A more significant problem is the NUBF problems mentioned earlier.
Both of these problems can cause a significant misrepresentation of the reflectivity. For
simplicity, the filtering effects of a radar beam can be calculated in the following manner.
12

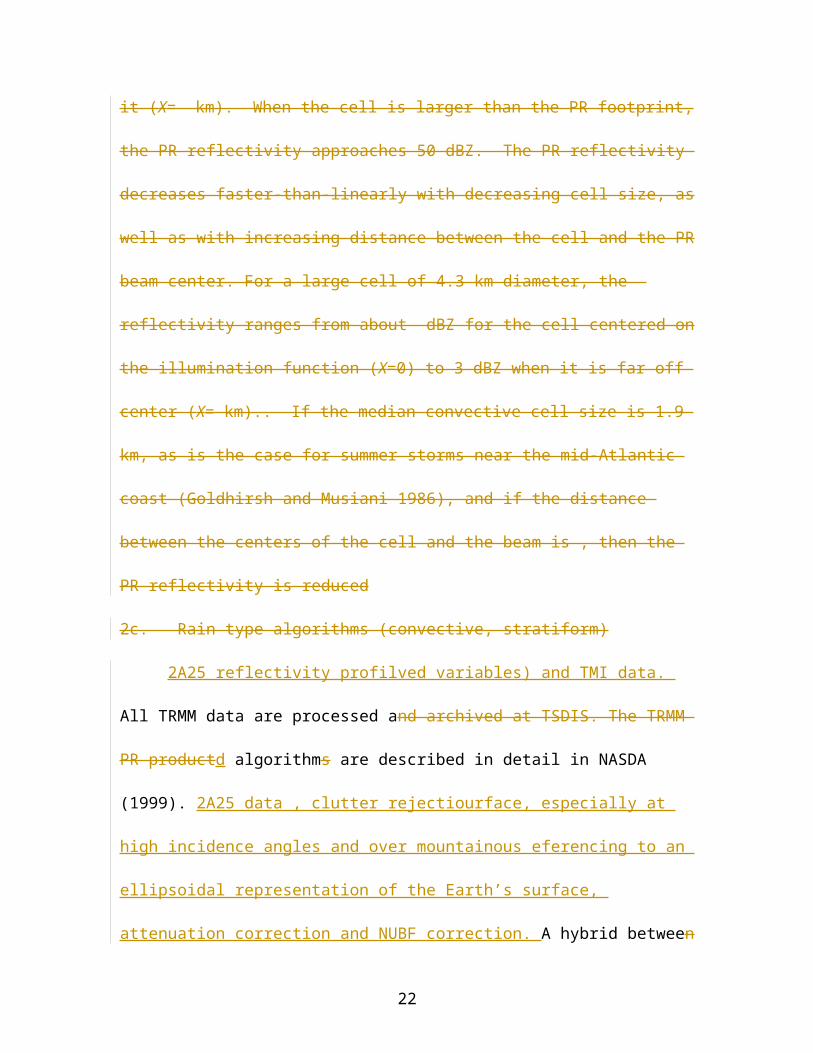
Assume the true and measured reflectivity are defined by Z and Zm, respectively, and the
two-way antenna illumination function is represented by I2() where are the two-
dimensional angles off the antenna boresight. Additionally, the reflectivity variations
along the slant range at range r are assumed constant, the circular radiation pattern ()
can be projected onto rectangular coordinates (x,y) in a beam-normal plane through the
relations x-X=r, and y-Y=r. Here (X,Y) are the coordinates of the beam's center at
range r, relative to the center of a storm cell (where x=y=0). We define () = (2x ,
2y)/r as the 3 dB (half-power) points of the radar antenna. Then the effects of beam
filtering of the true radar reflectivity field may be given by:
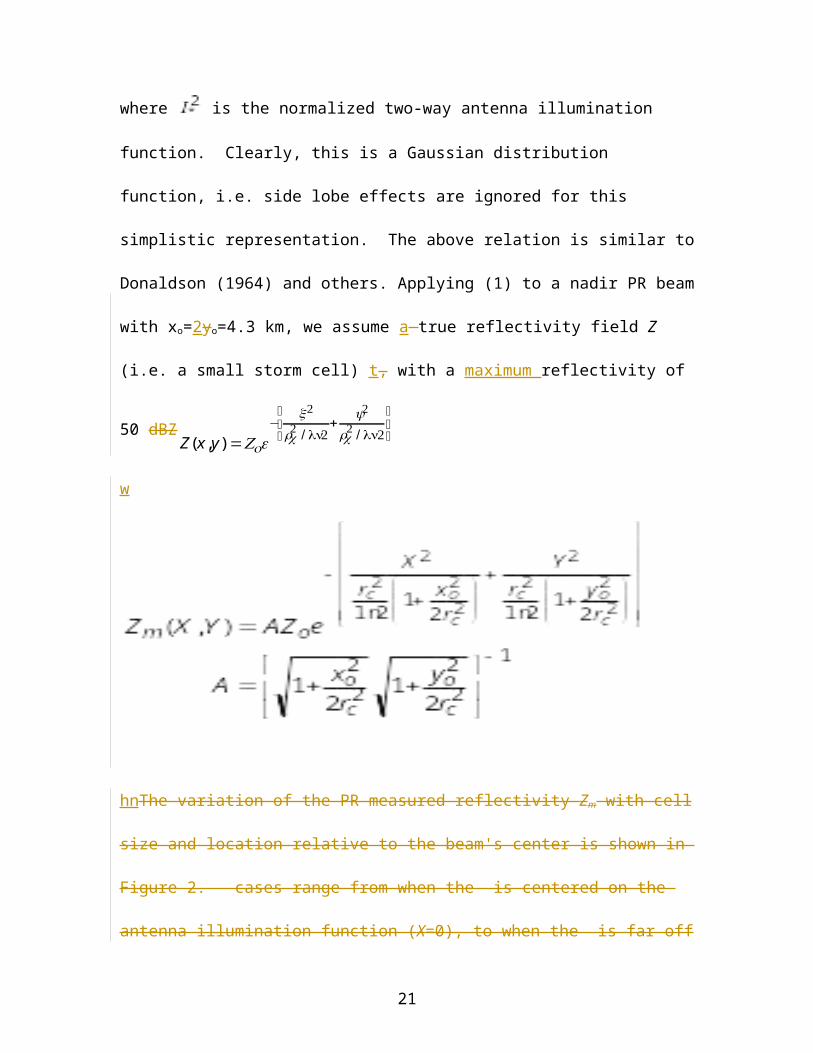
where is the normalized two-way antenna illumination function. Clearly, this is a
Gaussian distribution function, i.e. side lobe effects are ignored for this simplistic
representation. The above relation is similar to Donaldson (1964) and others. Applying
(1) to a nadir PR beam with xo=2yo=4.3 km, we assume a true reflectivity field Z (i.e. a
small storm cell) t, with a maximum reflectivity of 50 dBZ
Z(x,y) =Ze−
x2
rc2 / ln2
+y2
rc2 / ln2
⎡⎣⎢
⎤⎦⎥(2)
13
w
rtThe variation of the PR measured reflectivity Zm with cell size and location relative to
the beam's center is shown in Figure 2a. Four cases range from when the cell is centered
on the antenna illumination function (X=0), to when the cell is far off it (X= 3 km, which
is just below the maximum distance between a cell and the nearest PR beam center).
When the cell is larger than the PR footprint, the PR reflectivity approaches 50 dBZ. The
PR reflectivity decreases faster-than-linearly with decreasing cell size, as well as with
increasing distance between the cell and the PR beam center. For a large cell of 4.3 km
diameter, the PR measured reflectivity ranges from about 49 dBZ for the cell centered on
the illumination function (X=0) to 39 dBZ when it is far off center (X=3 km). For a
medium-size (2 km diameter) cell, the reflectivities range from 47 dBZ (X=0 km) to 21
dBZ (X=3 km). The latter is very close to the PR noise floor. Of course if the cell is on
the edge of one PR beam, the adjacent PR beam will measure a similar reflectivity from
the same cell, i.e. the cell is broadened. The effect of this filtering on rainrates can be
estimated by means of a Z-R relationship, e.g. Z=260 R1.38 , for central Florida convection
(Datta et al 1999). The maximum rainfall rate within the cell is 75 mm hr-1 . The PR
rainrate from a 2 km cell is about 43 mm hr-1 when the cell is centered (X=0) and 1 mm
hr-1 when the cell is far off-center (X=3 km) (Fig 2b). The average rainrate of the cell
14

over the PR footprint area in this case is about 20 mm hr-1 , i.e. less than the PR estimate
for a centered cell, but more than the PR estimate for a peripheral cell, even if this cell's
rain is sampled by four adjacent PR beams. . If the median convective cell size is 1.9 km,
as is the case for summer storms near the mid-Atlantic coast (Goldhirsh and Musiani
1986), and if the distance between the centers of the cell and the beam is 1.5 km [i.e., the
mean or most likely distance, 4.3/(22)], then the PR reflectivity is reduced about 11 dBZ
from the peak cell reflectivity, and the PR rainrate would be about 20% of the peak
rainrate in the cell.
2c. Rain type algorithms (convective, stratiform)
2A25 reflectivity profilved variables) and TMI data. All TRMM data are
processed and archived at TSDIS. The TRMM PR productd algorithms are described in
detail in NASDA (1999). 2A25 data are the result of ations starting with the raw PR
receiver data. These operations ility contr to an ellipsoidal representation of the Earth’s
surface, attenuation correction and NUBF correction. A hybrid between the Hitschfeld-
Borden method and the surface reference technique is used (Iguchi and Meneghini
1994)o .2A23 dataset ude the presence and height of a BB, the rain type classification,
and the storm top height.
Rainfall is classified as stratiform if a BB exists ('V method') and/or the horizontal
echo variation is small ('H method'). The 'H method' is an adaptation of the method by
Steiner et al (1995) to the PR resolution: a beam is convective if its maximum reflectivity
(Zmax) exceeds 40 dBZ or if Zmax stands out above the ambient echo. In the 'V method' rain
is classified as convective if no BB exists and if Zmax >39 dBZ. Clearly the accuracy of
15

the attenuation correction may significantly impact the rain classification. Both methods
yield three outcomes (convective, stratiform, and inconclusive), and a combination of the
H and V methods allows rainfall characterization in a probabilistic manner. For instance,
if both H and V methods classify a pixel as stratiform, the 2A23 rain type is 'stratiform
certain'. But if there is no BB yet the H method suggests stratiform rain, then the 2A23
rain type is 'probably stratiform' (Table 2). Sample tests indicate that the likelihood of
correct BB detection is abo
3.0 Comparison of TRMM with EDOP and ground radars
ER-2 flights coincided withTRMM overpasses over various types of precipitation
systems. DA and B, CAME-nine [check ???] TRMMs occurrede the2 fle PR swath o, but
only six ofently data-rich aneous for dtFor each of the six cases, the ER-2 flight line near
the time of the TRMM overpass was placed into the context of the horizontal radar echo
pattern.The 2 km altitude image from the TRMM PR is shown together with a low level
scan from the nearest ground radar in Figure 3 for all cases, covering a mainly stratiform
frontal rainband (a, b), a convective cell in its decaying stage (c, d), a small, growing
convective cell (e, f), a small mesoscale convective system (MCS) (g, h), and a hurricane
(i-l). For this purpose, several ground-based radars were used that collected data during
the TRMM overpasses. The S-band POLarization Radar (S-POL) radar from the
National Center for Atmospheric Research (NCAR) participated in TEFLUN-B and
TRMM-LBA. The TOGA radar supported by the Wallops Flight Facility participated in
TRMM-LBA. Finally, the WSR-88D operational radars at Fort Worth, TX (KFWS),
Melbourne, FL (KMLB), and Wilmington NC (KLTX), were used when possible to
16

provide additional data for comparisons. All the ground-based radars were S-band (3
GHz) Doppler radars with 1o beamwidth antennas with the exception of the TOGA radar
with a 1.6o beamwidth. The horizontal mapping procedures for ground radar and PR data
are described in Appendix A.2 and A.3 respectively. The temporal coincidences of all
relevant radars are listed in Table 3.
Comparison of vertical reflectivity cross-sections, which are the emphasis of this
paper, are presented in Figs. 4-9. The EDOP panel provides nadir reflectivity mapped
onto a cartesian (x, z) grid above ground level (AGL). Each vertical column represents
an ED at a particular surface latitude-longitude position. The vertical crground-based
radar (panel b)and PR (panel c) a were constructed using the mapping procedures
described in Appendix A. Figures 4-9 also show profiles of various derived quantities for
each case. These include: the brightness temperatures (10-85 GHz and 11 m) from the
TMI and VIRS (panel e), storm top height and BB height (2A23 product) (panel f), and
PR incidence angle together with rain type (also 2A23) (panel g). These figures will be
referred to in the subsequent discussion. The PR storm top height product (2A25) is the
height of the first (highest) echo above the PR noise level. This height will be compared
to the EDOP-estimated storm top, practically defined as the 0 dBZ contour. EDOP's
sensitivity generally wass well below 0 dBZ.
3a. Widespread stratiform rain(21 April 1998)
A broad rainband, associated with a well-defined cold front oriented WSW-
ENE, slowly propagates southeastward through central Texas on 21 April 1998. This
rainband is over 700 km long, aligned with the cold front, and largely stratiform. Its
cloud tops and rain rates decrease towards the northeast. The ER-2 flies along this
17

rainband which also coincides with the PR swath of the TRMM overpass at 634 UTC.
(All times hereafter are in UTC.) At this time there are three short convective lines to the
south and west of the ER-2 leg, most obvious in Figure 3a . These lines are oriented
normal to the broad rainband and move along it, advected by strong westerly wind at 500
mb. They appear more vigorous in the PR image than in the KFWS radar PPI. The
convective lines are at least 150 km from this WSR-88D radar, therefore their echo
strength is weakened by attenuation and partial beam filling.
The ER-2 was directed to start just to the east of the westernmost of these three
lines at 0624, thereby missing the two other lines to the north. By the time of the TRMM
overpass about 10 minutes later, the westernmost line has moved into the ER-2 section.
The PR reflectivity pattern matches EDOP's very well east of this line, as PR-EDOP
coincidence improves to the east (Fig 4a). Some details are missed by the PR such as the
sloping fallstreaks evident in the EDOP section below the freezing level. The fallstreaks
are the result of the presence of a 25 ms-1 westerly shear between 0-5 km evident in the
00 sounding 6 h earlier at Dallas Forth Worth. The storm top height in the PR section is
generally less than 1 km below the EDOP stormtop, however during TEFLUN A the
cloud top is likely higher than indicated since a EDOP sensitivity was reduced due to a
amplifier malfunction. The algorithm-derived heights of the storm top and the BB (as
shown in Figure 4f) verify well, and the rain east of the convective line (at the left edge
of the panels in Figure 4) is classified correctly in the stratiform group. Compared to
tropical stratiform rainfall systems (e.g. in hurricanes, section 3e), this rainband contains
a large amount of ice, as evidenced by the 85 GHz upwelling radiance. This is not
because of high cloud tops (merely 8 km) but because the freezing level (~3 km altitude)
18

is about 2 km lower than in the tropics. Over much of the rainband the 85 GHz
brightness temperature, as measured by the TMI and AMPR, is below 220 K.
McGaughey et al (1996) find that 220 K is the minimum 85 GHz brightness temperature
associated with ice scattering in stratiform regions of tropical oceanic systems. Passive
microwave temperatures from lower frequencies (especially 19 and 10 GHz) are only
marginally depressed (Figure 4e ).
3b. The trailing edge of a dissipating convective cell (13 August 1998)This case
illustrates a borderline feature for the PR, mainly in terms of sensitivitysensitivity,
and there is a significant reflectivity gradient across the EDOP section. The ambient
wind is weak at all levels on 13 August, and it is mainly westerly (<8 m s-1) below 10
km. Afternoon thunderstorms develop, mainly along outflow, sea breeze and river
breeze boundaries. About 15 km inland from the Banana River, a sequence of
short-lived thunderstorms builds discretely southward and dissipates from the
north. The ER-2 flies from west to east across the northern edge of a storm cell
(Figure 3c). The EDOP reflectivity is low at all levels (Figure 5a), and there is a
suggestion of a weak BB. The PR, recording this storm 1 (right) to 4 (left) minutes
later, can see the storm cell, even some of its decaying anvil (Figure 5c). The PR
storm top, just below 10 km, is about 2 km below the actual storm top (Figure 5f).
The PR can see the rain reaching the ground. This rain is classified correctly as
‘probably stratiform’, because of the H-method (the echo is too weak for it to 'stand
out'), not because a BB is detected. The BB is not detected because it is quite weak
and because the PR incidence angle is fairly large (8).
19

The PR only marginally detects the smaller but more intense shallow cells to the
west ( x<10 in Figure 5), about 4 minutes after the ER-2 passage. The AMPR brightness
temperatures at 10 and 19 GHz are lower than at 85 GHz for these cells, suggesting that
they contain very little ice. This PR detection failure may be affected by NUBF, however
the degraded EDOP image (Fig 5d) suggests that the PR should still capture a clear
signal. The more likely cause is the rapid decay of these shallow, isolated cells. In the
2225 S-POL volume, shown in Figs 3d and 5b, these cells are much stronger thanin the
2231 volume (not shown). Another factor may be.e., normal to the cross-section)
apparent in Fig 3c .
3c. Small convective cell (1 February 1999)
Many convective towers formed in the afternoon of 1 February 1999 over
Rondonia, Brazil, but they were generally small and short-lived. EDOP recorded 12 cells
with at least 40 dBZ at an altitude of 2 km during a 3 hour flight period (1730-2030).
With the exception of a 30 km wide storm overflown twice, the average diameter of these
cells was 5 km (measured between the 20 dB EDOP boundaries at 2 km), i.e. about the
size of the PR footprint. The sample is somewhat biased because the ER-2 targeted the
larger thunderstorms in the population. The tops of these storms were not very high, but
variable (5-9 km), and no spreading anvils nor stratiform regions formed. The minimum
85 GHz brightness temperatures of the first five of these cells was only 240-260 K
(AMPR failed at 1842). Organized deep convection did not develop on this day, probably
because of a lack of wind shear. Between 0-5 km, the wind was weak (less than 10 m s-1),
mainly from the northeast. Easterly shear of about 25 m s-1 existed between 5-11 km, and
this was evident in the shearing of the tops of some taller cells.
20
At the time of the TRMM overpass, the ER-2 flew near the western edge of a line
of convective cells, about 40 km long and 5-10 km wide. This line is captured both by the
S-POL PPI and the PR CAPPI in Figure 3e-f. The line is moving southward and growing
in length, but the cell at 30 km (visited twice by EDOP) is dissipating (Figure 6a) but still
has a narrow intense core with very few hydrometeors above 5 km and no anvil. The S-
POL section (Figure 6b) is almost identical to EDOP's, but with lower vertical resolution.
The PR detects this cell, located close to the TRMM nadir, about 6.6 min later (Figure
6c), but the maximum reflectivity is about 30 dB (as opposed to 45 dB) and the storm top
is near 5 km (as opposed to 12 km). The degraded EDOP (Figure 6d) shows a stronger
and slightly deeper echo pattern than the PR. The difference may be partly explained by
cell evolution. When the ER-2 returns along this section over this cell, about 6.8min after
the TRMM passage (not shown), the maximum reflectivity is still about 38 dB and the
echo top about 10 km. The minimum AMPR 85 GHz brightness temperature of this cell
is about 240 K, but the TMI brightness temperature traces don't record any significant
disturbance over the cell (Figure 6e). The VIRS does see the cell clearly, with a minimum
IR temperature just below 225 K (i.e. a storm top just above 11.5 km),. The main cell is
classified as 'other' and 'probably stratiform', not because of a BB, but because of low PR
maximum reflectivity. The size and strength of this feature, as revealed in EDOP
imagery, makes it clearly convective,.The weak cell to the north of the main cell along
this flight leg, near x=50 km in Fig 6a, offers a nice example of detection failure due to
the PR's sensitivity threshold. The degraded EDOP image (Fig 6d) suggests that the PR
should just detect it. The PR does not see it, probably because at the time of the TRMM
overpass (5 min later), this feature has weakened further, as suggested by the ER-2 return
21
flight along this leg and S-POL imagery. The only TRMM probe that records this weak
feature is the VIRS (Fig 6e). From a rainfall perspective, this weak feature is
insignificant, since most or all rain appears to evaporate before reaching the ground.
3d. Small MCS (23 February 1999)
A broken line of cells grew into a continuous line over 100 km long between 1900
and 2000 on 23 February. This line was oriented NNW-SSE and propagated
southeastward at first but later stalled. Convection along this line was most vigorous
between 2000 and 2030, then weakened and a trailing stratiform region formed to the
west. By 2200 all convection had disappeared and a ~3,000 km2 large area of stratiform
rain remained. This area expanded and intensified somewhat during the next half-hour,
and then dissipated during the next two hours. The ambient wind below 5 km altitude was
mostly northwesterly at 7-15 ms-1, an easterly jet was fat ~13 km. The easterly wind
above 7 km probably supported the formation of the westward-trailing stratiform region.
Figure 3g-h shows this line in a maturing stage. Convection is found mostly to the
south along the leading (eastern) side of the line, while the northwestern portion develops
into a stratiform region. The EDOP section essentially runs along the leading line of
convection. No BB is present in this section (Fig. 7), except in the far south where some
remnants of the shorter-lived southern portion of the line can be seen. The reflectivity
generally drops off rapidly above the freezing level in this section, and convection is not
very deep. The AMPR data indicate that much ice is transported to the west of the line
(i.e. into the page of Fig. 7a). The minimum AMPR 85 GHz brightness temperature is
about 160 K in this section, but 135 K over the stratiform region. Higher altitude CAPPIs
22

from the PR (not shown) confirm that at 8 km the echoes are strongest to the west of the
ER-2 track, while at 2 km they are strongest on the track or just to its east. This is
consistent with the observed growth of the stratiform region. The deepest echo in the
EDOP cross section ( Fig. 7a) are actually in the lee of an active cell to the east of the
line, so stratiform intensification processes (i.e. mesoscale updraft and ice growth above
the freezing level, Houze 1993) may be active in this part of the cross section.
The ground-based radars (Figs. 7b,c), especially TOGA (which is closer), match
the EDOP section well. The height, intensity, and structure of the PR echo also compares
well to degraded EDOP echo pattern, because th. The small discrepancies are mainly due
to across-line gradients (i.e. the third dimension)..
PR rainfall is classified as ‘certainly convective’ to the south and ‘probably
stratiform’ to the north (Fig. 7g). The classification as stratiform is not due to a BB
(neither the PR nor EDOP detect a BB) but to weak reflectivities. This northern (right-
hand) region appears convective from an EDOP perspective, because of high
reflectivities and their gradients, and an absence of a BB. However this region is just to
the east of a large area which clearly is stratiform. The PR storm top height (Fig. 7f) is
close to th other radars, except to the south (x<1), where stratiform and dissipating clouds
have higher tops (EDOP, TOGA, and S-POL in Figs. 7a-c) between 8-10 km. In fact
even the PR (Fig 7d) has higher topstel.
3. Hurricane Bonnie Pass 1 (26 August 1998)
EDOP data were collected during three TRMM passes over Hurricane Bonnie on
26 August 1998. At the time of the overpasses (1137-1451), Bonnie's central pressure
23
was steady at ~ 965 mb, and its maximum sustained surface winds were about 50 ms-1.
Bonnie made landfall near Wilmington NC around 0330 27 August. 2At the time of the
EDOP observations, Bonnie had one or more weak and ill-defined inner eyewalls and a
stronger and more continuous outer eyewall with a diameter of ~170 km. Only the first
and third TRMM passes are discussed here, because the PR swath of the second one
missed Bonnie's eye and only a short section of high-incidence PR data coincided with
the EDOP section. Note that the PR algorithms correctly detect and place the BB even at
high incidence angles.
The first TRMM pass, at 1137, is almost exactly over Bonnie's eye (Fig. 3i-j).
Several rain arcs can be seen in the region surrounded by the outer eyewall, and the PR
captures all but the finest features present on the WSR-88D PPI, such as the shallow
radial bands at the northwestern margin of the storm. The EDOP section lags the TRMM
section by 13-35 minutes.. The difference between the PR section (Fig. 8c) and the
corresponding degraded EDOP section (Fig. 8d) is largely due to this time lag, and is
most obvious inside of the outer eyewall, where echoes are more transient. A much
better fit could be obtained if advection of the hurricane is accounted for, but this
correction is beyond t of this discussion.
The EDOP section (Fig. 8a) displays some fine scale features which are beyond
the resolution or sensitivity of the PR. This includes: the spreading of the anvil outward
from the outer eyewall, thin rain columns within the outer eyewall, and low-level radial
confluence suggested by the inwardly curved fall streaks in the rain layer on both sides of
the eye (which is near x= km). Otherwise the PR-EDOP comparison is excellent for the
outer eyewall, including its BB and outward slant.
2 See the Preliminary Report by NHC at http://www.nhc.noaa.gov/1998bonnie.html.
24

In this section most rain is correctly classified as ‘certainly’ or ‘probably
stratiform’ (Fig. 8g). The PR storm tops of the deeper features are 2-4 km lower than
EDOP heights. The TMI 85 GHz brightness temperature associated with outer eyewall
(near x=190 km) is as low as 240 K (compared to 220 K for AMPR), whereas the more
shallow rain echoes within the outer eyewall remain undetected at 85 GHz, both in TMI
and AMPR data. The low 85 GHz temperatures and low reflectivities aloft implies an
absence of significant ice scattering in the inner rainbands This is common for tropical
systems (ref. Zipser ???*******possibly my 92 paper).
3f. Hurricane Bonnie Pass 3 (26 August 1998)
At 1450 Bonnie's outer eyewall has contracted slightly, and the inner rain arcs
have weakened a little (Fig. 3k-l). While most of the hurricane's rainfall field is northeast
of the eye, the outer eyewall is most intense towards the southwest. The ER-2 flies from
NE to SW across the eye, but the PR swath misses the northern part of the outer eyewall.
The EDOP cross section (Fig. 9a) confirms the asymmetry, with a highly tilted yet weak
northeast eyewall, a deeper southwest eyewall, with the eye centered near x=150 km.
Many hallow but intense echoes can be seen within the outer eyewall in the EDOP pass.
Ground radar and PR CAPPIs (Figs. 3k-l) also indicate that these cells have echo tops
that are close to 6 km, however some cells inside the outer eyewall are much deeper.
The PR section detects a deep cell (x=170 km in Fig. 9c) and when the ER-2 flies
overhead about 10 min later, this cell has largely been advected out of the cross section.
Therefore the degraded EDOP echo is weaker than the PR echo; otherwise the PR-EDOP
correspondence is quite good. The PR BB height is similarly to EDOPs except that it is
25

slightly higher within the eye than in the eyewall (Fig. 9f). This elevated BB height is due
to a higher 0oC isotherm in the eyewall. This feature can also be seen in pass 1 (Fig. 8f),
but it is not as pronounced. The cloud height derived from the PR is generally below the
EDOP and actual cloud height. This is apparent in the outer eyewall (x=170-200 km)
where the PR storm height is 2-4 km too low. Some fallstreaks below 5 km altitude (120
<x<km)) with a maximum reflectivity of ~25 dB are too thin and/orweak to be seen, so
no PR cloud height was assigned.
The rainfall classification scheme is excellent, even at high incidence angles.
Overall, aBB is detected correctly by the PR algorithm. Areas classified 'certainly
stratiform' (x=170-190 km) a clearly as stratiform in EDOP image, and for the two areas
classified as convective, EDOP does not reveal a BB. The 85 GHz brightness
temperatures measured by the TMI are only barely depressed by the shallow cells inside
of the outer eyewall, but they are as low as 205 K over the southwestern outer eyewall
(Fig. 9e). These data correspond well to those of AMPR.
4.0 Comparison of the statistics of the profiles.
Mean height profiles of reflectivity were constructed (Fig. 10) for the cross-
sections shown in Figures 4-9 These profiles were obtained by first converting
reflectivities in “dBZ” to linear units before averaging across each height level (0.0375 m
for EDOP and ground-based radars and 0.25 km intervals for the PR). To focus the
comparison on the same precipitation structures, reflectivity profiles from radars other
than the PR are thresholded to the PR's minimum detectable reflectivity of 17 dBZ. Mean
profiles for ground-based radars had to be truncated near the ground because the upward
26

slanting of the lowest beam away from the radar caused a bias in the averaging length at a
particular level. Much information is lost in the reduction of a precipitating system to a
mean profile, but the comparison of the first moment only from various radars is more
feasible than that of CFADs (contoured frequency by altitude diagram, Yuter and Houze
1995) or other distribution functions. The comparison of mean profiles is useful for
calibration purposes but the focus in this study is on the details of the profiles. For
instance, how does the thickness and the strength of the BB in the PR compare to that of
EDOP and that of ground radars? How does reflectivity change with height below the
BB, and what cloud microphysical consequences can be drawn ? How do profiles
compare in the case of NUBF ?The vertical filtering due to the PR's gate spacing and off-
nadir viewing results in a underestimation of the BB strength of 3-9 dBZ (Fig 10a and f).
The PR BB height matches that of EDOP very well, but it should be cautioned that the
bright band thickness in both the PR and EDOP is likely overestimated due to averaging
over an extensive region. EDOP often observes bright band thicknesses much less than
the 250 m pulse volume thickness. The effect of NUBF is illustrated well in the profiles
of Fig 10d: the PR estimate is 4-10 dBZ below that of EDOP and S-POL, and the
reflectivity-based cloud top is much lower. For small or rapidly evolving storms, a good
temporal match is essential. Figure 10c shows the collapse of the trailing part of central
Florida convection evidenced by the rapid 4-8 km altitude reflectivity decrease from
22:19 and 22:31 UTC. Part of the observed reflectivity differences in Fig. 10c are the
result of the flight line crossing a strong gradient region of reflectivity. The TRMM
footprint is relatively large and hence may sample this region differently than EDOP and
S-POL. The discrepancies in the hurricane cases (Fig 10f) are also largely due to non-
27

simultaneity; in this case advection mentioned earlier is likely the cause of some of the
differences. For all the cases presented, the best time coincidence occurred for the small
MCS on 23 February 1999 (Fig 10e). The reflectivity profile differences for this case are
largely due to calibration differences and also PR attenuation correction and NUBF
algorithms. Clearly the PR profile nicely matches the S-POL and EDOP traces
[********* Gerry ….when 2.5dBZ is subtracted from the latter].
5. Summary and Conclusions
2A25 product to data from higher-resolution, more sensitive radars, i.e. airborne
(i.e., EDOP) anoundadars. Io an earth-relative cartesian grid, as well as in the geo-locons
covered by Ebeam.fferent beam geometries, resolutions, earthrThis study has
intentionally not focused on calibration differences between radars since these differences
will mainly shift profiles by a constant reflectivity over most of the reflectivity dynamic
range. Instead, the emphasis is on the shape of the profiles and systematic differences
between them. The comparisons yield highly favorable agreement between EDOP and
the ground radars for extensive precipitation regions. However, in some regions, a
significant portion of the rainfall results from convection that is small relative to the PR
footprint. It is well known that PR reflectivity profiles and rainrate estimates depend on
storm size, and a correction for NUBF is applied operationally in obtaining the 2A25
product. Simple calculations show that the PR-measured reflectivity, and hence rainrate,
becomes increasingly reduced not only as the storm cell size decreases, but also as the
cell is displaced further from the PR beam center. The effects of beam filtering and
limited sensitivity compound to make small and/or weak cells entirely or partly
undetectable by the PR. Common to convection of all sizes are the high reflectivity
28

gradients along the storm's edge. PR broadening of such gradients results in an artificial
fringe around convective storms. In particular users of Level 3 (monthly-mean) TRMM
PR products should be aware of the strong scale dependency of PR estimates. At Level 3,
the scale dependency is impossible to assess because spatial information of individual
storms is lost in the processing from instantaneous to mean rainrates.
s a when a TRMM within a few tes ht-and-levef interest . In fact the differences in
presented reflectivity cross sections derm the vaeous sampling (allowing significant
advectionn). Six cases(A and B), CAX- isons. These cases represent various
meteorological situations: a broad, mostly stratiform raibna small MCS, a dstorm, and a
small yetaective celdrawn from this small sample of EDOP-TRHigh resolution EDOP
reflectivity sections show that the TRMM PR, given its resolution and sensitivity
threshold, captures most of the spectrum of sizes and intensities of precipitating systems
very well, in terms of both 2A25 vertical reflectivity structure and deduced variables.
EDOP (as well as other airborne radars such as ARMAR) reflectivities can be
degraded to provide a TRMM PR surrogate for simulation/retrieval studies. While
the viewing geometries of the EDOP and AMPR are different than those for the PR
and TMI on TRMM, the ER-2 can be focused on a specific storm of interest to
provide insight on the performance of TRMM during this situation.
The limited PR sensitivity results in thethe failure to detect weak precipitating
systems and small convective cells; storm top heights are also underestimated,
especially in tropical stratiform regions where reflectivity profiles fall off rapidly with
height.
29
Further work is aimed at a more detailed comparison and evaluation of TRMM products,
including attenuation and surface reference (o ), as well as microwave radiances.
Acknowledgements
This work was supported under NASAsprogra by Dr. Ramesh Kakar at NASA
Headquarters. There are a number of key people in field campaign operations that
deserve special credit. Dr. Ed Zipser and Ms. Robbie Hood worked jointly with the
primary author in directing ER-2 flights during the TEFLUN-B and CAMEX-3
campaigns, Dr. Steve Rutledge, Dr. Ed Zipser and Walt Peterson directed TRMM-LBA
ER-2 flights. Dr. Vivekanadan Dr. Ed Brandes, and others, were key in the S-POL radar
science direction during E.Dr. Steve Bidwell and Mr. Ed Zenker are greatly appreciated
for the superb engineering effort on the EDOP instrument. We are appreciative to Dr.
Bob Meneghini for many excellent science discussions, to Mr. Carlos Morales and Dr.
Liang for guidance on reading PR and other TRMM data sets. Radar data and assistance
was provided by Mr. Dave Wolff (TOGA) and Mr. Bob Rilling at NCAR (S-POL). Many
others answerethe many small questions rose due to the diverse nature of the data sets
used in this paper.
Appendix A: Mapping algorithms.
An accurate interpolation of all the radar data sets into a common (earth-relative)
coordinate system is essential before the various data sets can be compared. The
coordinates of the EDOP flight line images are chosen as this common frame of
reference, as described in section 2. The EDOP mapping is briefly described in
30

Appendix A.1. Ground-based radar and TRMM PR data are three-dimensional, an their
mapping onto the EDOP plane is described in Appendices A.2 and A.3 respectively. The
redistribution of two-dimensional (horizontal) TRMM data is described in A.4.
A.1 EDOP Coordinates and mapping.
The ER-2 tracks presented in this paper are relatively linear although occasionally
there are small aircraft heading adjustments (such as the 26 August 1998 pass 1) or other
more minor deviations in heading due to cross wind variations at altitude. Thus to retain
accuracy in the mapping of other data sets, each beam of EDOP data is assumed to be
normal to the earth’s surface and each gate has an associated position (, z) where is
latitude, is longitude, and z is height above the earth’s surface. This assumption is
quite good since the ER-2 is relatively stable during flight with roll excursions of less
than 0.25o (i.e 175 m on the ground) and pitch excursions of less than 1oThe
coordinates of gates in each beam at ~100 m intervals along the flight track are then
gridded in (x, z) such that pixels in a single vertical column represent a single dwell of
data, and the x axis represents dwells along the flight line. In all cases presented here the
height of the earth surface is less than 200 m above mean sea level, so EDOP heights are
not corrected to represent altitude above sea level.
A.2 Ground-based radar mapping.
Ground-based radar data are collected in spherical coordinates [(r, ) where r
is range, is azimuth, and is elevation] and are mapped to EDOP vertical sections
using the transformation equations developed in Heymsfield et al. (1983). These “small
31

range” equations are applicable to distances less than about 200 km from the radar and
can be summarized as follows:
where R is the local radius of the earth at the radar station, the effective earth radius
R’=4R/3, (x,y) the radar-relative horizontal location, and the subscript s refers to the radar
location. These approximations provide (, z) to within a few tenths of a km at 200
km from a radar. The topographic height of the radar above sea level is ignored.
Using the above equations, the (r, )location from a given radar is calculated
for each EDOP pixel. Then, for each pixel, a search is performed over the radar volume
scan for the 8 surrounding gates (4 each from the elevation scans above and below
)Interpolation is performed using trilinear interpolation, i.e., first the reflectivities are
interpolated bilinearly to (r, ) on each elevation scan, and then these values are linearly
interpolated along It should be noted that the reflectivites in “dBZ” are linearized
before the interpolation and converted back to dBZ after the interpolation. While better
interpolation schemes exist, the linear interpolation, also used in Heymsfield et al. (1983),
is simple to implement and provides reasonable results. Trapp and Doswell (1999)
address the ramifications of using bilinear versus Cressman and Barnes interpolation
which have more easily understandable filtering responses.
32
The ground-based radar PPIscans shown in Figure 3 are constructed using an
almost identical interpolation approach to the above and in Heymsfield et al. (1983). This
approach uses equations A1-A5 and interpolation to a regular latitude-longitude grid with
intervals of 0.01o in latitude and longitude.
A.3 TRMM PR mapping
The PR reflectivity data used in this study is based on the 2A25 product provided
by TSDIS. This product includes attenuation-corrected reflectivity and rain rate profiles,
and geolocation information. The reflectivity profiles have high vertical resolution (250
m) and coarser (~4 km) horizontal spacing. For simplicity, the PR profiles are assumed
vertically oriented even though they can be tilted up to about 17o scan angle. This
implies that an echo at the edge of the PR swath at 15 km altitude would be displaced
about 4 km (i.e. one PR pixel spacing) horizontally from the surface position of the
profile, towards the TRMM nadir position. In most cases, this is not a problem since the
PR scan angles are usually much smaller and the echo heights are less than 10 km. Thus,
each range gate has a (, z) location.
Interpolation is performed as follows. For each EDOP profile which has an
associated (, z) coordinate, a search is performed on the TRMM data for the four
profiles surrounding this () location are identified. Then Cressman interpolation
(Cressman, 1959) is applied to these profiles level by level in the PR profile at 250 m
intervals. The resulting interpolation function is given by:
33
where =5.0 km is the influence radius, d, the distance from the EDOP pixel location,
and Zedop and ZPR are the EDOP and PR reflectivities, respectively. This function is a
relatively simple objective analysis function, yet it captures most of the PR features well
in the interpolated vertical sections. This interpolation was compared with using the
nearest point to the EDOP pixel and the interpolation approach was superior. The radius
of influence was chosen as the minimum value for which d< for at least 4 PR pixels
anywhere. It is not much larger than the spacing between PR samples, so the Cressman
interpolation applied here is applying minimal smoothing of the data. Discontinuities in
the PR data displayed on the EDOP mesh arise from the jump from one PR beam to
another. These discontinuities are much smaller than the 'degraded' EDOP data because
the latter represent the PR resolution (Appendix B) and are not distributed on the fine
EDOP mesh.
The constant-altitude PR echo maps shown in Figure 3 are constructed using a
standard Delaunay triangulation scheme to map irregular gridded points to a regular
latitude-longitude grid with a grid mapping interval of 0.02 in latititude and longitude.
A.4 Mapping of two-dimensional TRMM parameters
Many of the TRMM parameters are located only by their latitude and longitude,
not by their altitude, for instance the TRMM Microwave Imager (TMI) brightness
temperatures (2B11), the Visible and Infrared Scanner (VIRS) infrared temperatures
(1B01), the path integrated attenuation (2A21), rain type (2A25), normalized surface
backscatter cross section (2A21), etc. Some of these variables do have a physical
altitude, e.g. infrared tempertures are representative of the cloud top. Lateral
34

displacements due to off-nadir TRMM scanning angles are ignored, even for the TMI
which scans at a constant 53. These quantities are interpolated to the EDOP profiles in
an identical fashion to the PR data, as described in section A.3, using the Cressman
weighting in (A6). The exception to this are discrete variables such as the rain type
(2A25). For these quantities, the TRMM pixel nearest the EDOP profile is used and no
interpolation is performed.
Appendix B: Simulating PR reflectivities using EDOP data
B.1 Technique
The simulation of spaceborne data using airborne radar data has been discussed
by Amayenc et al (1996) and Durden et al (1998), and a similar technique is used here.
First, EDOP data are corrected for aircraft motion. In particular, changes in aircraft pitch
renders the beams non-equidistant. Strictly speaking an inverse convolution of the EDOP
data is needed to remove the effects of EDOP range resolution, however EDOP's
resolution is high enough compared to that of the PR to treat EDOP data as representative
of a point. The next step in the simulation involves a convolution of the EDOP data with
a 1D (along-track) Gaussian weighting function. Finally, a reflectivity threshold is
applied, reflecting the limited sensitivity of the PR. Differences in frequency between the
PR and EDOP lead to differences in attenuation. It is assumed that the PR attenuation
correction (Iguchi and Meneghini 1994) is accurate and that EDOP reflectivities are not
significantly attenuated, in other words no further attenuation correction is performed in
the simulation process. Also, the effect of decreasing vertical resolution of the PR with
increasing scanning angle is ignored, and the degraded EDOP data have a 250 m vertical
35
resolution at any incidence angle. The data are not convoluted with a Gaussian function
in the vertical.
B.2 Limitations of degraded EDOP data as a surrogate for PR data
There are limitations to the representativness of degraded EDOP reflectivities as
surrogate PR data. A perfectly 'degraded' EDOP section will normally not perfectly
match the corresponding PR section for two reasons: lack of high-resolution information
about the third dimension (i.e. across the flight track of the ER-2), and non-simultaneity
of the observations. Simultaneous records will compare poorly when reflectivity contours
(on a map) are tightly packed along an ER-2 flight leg, i.e. when the ER-2 flies along
precipitation systems, rather than across them. The radar maps in Figure 3, as well as
passive visible, infrared and microwave data from scanning instruments on the ER-2 can
be used to assess cross-track variability. Non-simultaneity is often a more serious
problem: for instance it takes the ER-2 about 8 minutes to sample a 100 km long storm,
while it takes the TRMM satellite about 14 seconds to travel the same distance (Table 1).
Poor comparisons can be expected from rapidly evolving storms, and when a high
reflectivity gradient is advected across an ER-2 flight leg. Small thunderstorms are
especially difficult to compare because of NUBF and because they are typically short-
lived. For larger (stratiform) systems a larger time lag between EDOP and the PR is
acceptable.
36
References
Amayenc, P.M., J.P. Diguet, M. Marzoug, and T.Tani, 1996: A class of single- and dual-
frequency algorithms for rain-rate profiling from a spaceborne radar. Part II: Tests
from airborne radar measurements. J. Atmos. Oceanic Tech., 13, 142-164.
Bolen, S.M. and V. Chandrasekar, 1999: Comparison of satellite-based and ground-based
radar observations of precipitation. Preprints, 29nd Conference on Radar
Meteorology, Montreal, Canada, Amer. Meteor. Soc., 751-753.
Caylor, I. J., G. M. Heymsfield, S. W. Bidwell, and S. S. Ameen, 1995: Estimating
the rain rate profile in the presence of attenuation using EDOP airborne radar
observations. Preprints, 27th Radar Meteor. Conf., Amer. Meteor. Soc., Vail,
783-785.
Cressman, G. P., 1959: An operational objective analysis system. Mon. Wea. Rev.,
87, 367-374.
Datta, S., B. Roy, L. Jones, T. Kasparis, P.S. Ray, Z. Ding, and D. Charalampidis, 1999:
Evaluation of TRMM precipitation radar rainfall estimates using NEXRAD and rain
gauges in Central and South Florida. Preprints, 29nd Conference on Radar
Meteorology, Montreal, Canada, Amer. Meteor. Soc., 754-757.
Donaldson, R. J. Jr., 1964: A demonstration of antenna beam errors in radar reflectivity
patterns. J. Appl. Meteor., 3, 611-623.
Doviak, R. J., and D. S. Zrnic, 1993: Doppler Radar and Weather Observations,
Academic Press, New York, 267-268.
37

Durden, S.L., Z.S. Haddad, A. Kitiyakara, and F.K. Li, 1998: Effects of non-uniform
beam filling on rainfall retrieval for the TRMM precipitation radar. J. Atmos. Oceanic
Tech., 15, 635-646.
Goldhirsh, J. and B. Musiani, 1986: Rain cell size characteristics derived from radar
observations at Wallops Island, Virginia. IEEE. Trans. Geosci. Remote Sens., GE-24,
947-954.
Heymsfield, G. M., I. J. Caylor, J. M. Shepherd, W. S. Olson, S. W. Bidwell, W. C.
Boncyk, and S. Ameen, 1996a: Structure of Florida thunderstorms using high-altitude
aircraft radiometer and radar observations. J. Appl. Meteor., 10, 1736-1762.
____________, S. Bidwell, I. J. Caylor, S. Ameen, S. Nicholson, W. Boncyk, L. Miller,
D. Vandemark, P. E. Racette, and L. R. Dod, 1996b: The EDOP radar system on the
high altitude NASA ER-2 aircraft. J. Atmos. Oceanic Tech., 13, 795-809.
____________, K. K. Ghosh, and L. C. Chen, 1983: An interactive system for
compositing digital radar and satellite data. J. Clim. Appl. Meteor., 22, 705-713.
Houze, R. A., Jr., 1977: Structure and dynamics of a tropical squall line-system. Mon. Wea.
Rev., 105, 1540-1567.
Houze, R.A., Jr. 1993: Cloud dynamics. Academic Press, 573 pp.
Igushi,T. and R. Meneghini, 1994: Intercomparison of single-frequency methods for
retrieving a vertical rain profile from airborne or spaceborne radar data. J. Atmos.
Oceanic Tech., 11, 1507-1516.
Jorgensen, D. P. and M. A. LeMone, 1989: Vertical velocity characteristics of oceanic
convection. J. Atmos. Sci., 46, 621-640.
38

Kozu, T. and T. Igushi, 1999: Non-uniform beam-filling correction for spaceborne radar
rainfall measurement: implication from TOGA/COARE radar data analysis. J. Atmos.
Oceanic Tech., accepted.
Kummerow, C., W. Barnes, T. Kozu, J. Shiue, and J. Simpson, 1998: The Tropical
Rainfall Measuring Mission (TRMM) sensor package. J. Atmos. Oceanic Tech., 15,
809-817.
LeMone, M.A., and E.J. Zipser, 1980: Cumulonimbus vertical velocity events in GATE.
Part I: Diameter, intensity and mass flux. J. Atmos. Sci., 37, 2444-2457.
McGaughey, G., E.J. Zipser, R.W. Spencer and R.E. Hood, 1996: High-resolution
passive microwave observations of convective systems over the tropical Pacific
Ocean. J. Appl. Meteor., 35, 1921-1947.
Nakamura, K., 1991: Biases of rain retrieval algorithms for spaceborne radar caused by
nonuniformity of rain. J. Atmos. Oceanic Tech., 8, 363-373.
NASDA, 1999: TRMM PR Algorithm Instruction Manual V1.0, p. 52
Spencer, R., et al., 1994: AMPR PAPER ***************
Steiner, M. R.A. Houze Jr., S.E. Yuter, 1995: Climatological characterization of three-
dimensional storm structure from operational radar and raingauge data. J. Appl.
Meteor., 34, 1978-2007.
Testud, J. , P. Amayenc, X.K. Dou and T.F. Tani, 1996: Tests of rain profiling algorithms
for a spaceborne radar using raincell models and real data precipitation fields. J.
Atmos. Oceanic Tech. 13, 426-453.
39
Trapp R.J., and C.A. Dosell III, 1999: On the objective analysis of weather radar data.
Preprints, 29nd Conference on Radar Meteorology, Montreal, Canada, Amer. Meteor.
Soc., 248-251.
Yuter, S. E., and R. A. Houze, Jr., 1995: Three-dimensional kinematic and microphysical
evolution of Florida cumulonimbus. Part II: Frequency distributions of vertical
velocity, reflectivity, and differential reflectivity. Mon. Wea. Rev., 123, 1941-1958.
Zawadski, I., F. Fabry, R. de Elia, A. Caya and P. Vaillancourt, 1999: On quantitative
interpretation of radar measurements. Preprints, 29nd Conference on Radar
Meteorology, Montreal, Canada, Amer. Meteor. Soc., 784-786.
Zipser, E. J. et al., TRMM field campaigns, AGU meeting (Gerry need reference)
Zipser, E. J., 1977: Mesoscale and convective-scale downdrafts as distinct components of
squall-line structure. Mon. Wea. Rev., 105, 1568-1589.
40

Table 1. A comparison of some EDOP and TRMM PR parameters.
EDOP TRMM PR
Frequency (GHz) 9.6 13.8
Wavelength (cm) 3.12 2.17
Antenna fixed, nadir and forward (34) scanning to 17
Footprint at 5 km altitude (km) 0.76 4.3
Range resolution (m) 37.5 250
Time required to sample a 100 km
wide storm (along-track)
~8 min ~14 s
Minimum detectable signal (dBZ)
at 5 km altitude.
-5 18
Number of indep. samples per pixel ~300 64
.
41

Table 2. Definition of TRMM PR rain types as a combination of the outcome of two
tests, the H method and the V method. The order of the listing is the same as that in the
lower right corner of Figures 4-9.
PR rain type stratiform convective inconclusive
Strat cert H,V
Strat cert V H
Prob Strat H V
Maybe Strat V H
Convect cert H,V
Convect cert H V
Convect cert V H
Prob Convect H V
Maybe Convect H V
Maybe Convect V (BB not clear) H
Others H,V
42

Table 3. List of events with quasi-coincident TRMM-EDOP observations. Times are in
UTC. The EDOP times are the start/end of a straight-and-level flight leg. The TRMM
overpass time over the domains shown in Figure 3 may take 10-30 seconds, but the time
closest to the PR coverage of the feature of interest is shown. The ground-based radar
time is the start time of a volume scan.
Date Type of Event EDOP TRMM Ground Radar
21 April '98 frontal - mostly stratiform 06:24 - 06:45 06:33:45 KFWS 06:36:4613 August '98 decaying convective cell 22:25 - 22:30 22:29:52 S-POL 22::06
1 February '99 growing convective cell 18:17 - 18:21 18:25:47 S-POL 18:16:00
23 February '99 small MCS 20:56 - 21:03 21:00:47 TOGA 21:00:19
26 August '99 Hurricane Bonnie (Pass 1)
11:41 - 12:13 11:37:16 KLTX 11:36:10
26 August '99 Hurricane Bonnie (Pass 3)
14:47 - 15:12 14:50:30 KLTX 14:55:03
43

Figure Captions
Figure 1. A comparison of the PR, EDOP and ground radar geometries.
Figure 2. Scale dependency of PR reflectivity estimates. The curves show the variation of
PR-measured reflectivity as a function of the storm cell size, for various cell locations
relative to the center of the PR footprint. The horizontal shape of the storm cell is
assumed to be bell-sh with a maximum reflectivity of 50 dBZ. The PR beam
illumination function is also assumed to be Gaussian. The PR-est
Figure 3. Reflectivities from TRMM PR and ground-based radar mapped to common
earth coordinates. The left panel for each case (3a, c, e, g, i, and k) provides the 2 km
altitude 2A25 product. The right panel (3b, d, f, h, j, and l) displays the lowest
clutter-free radar elevation scan from the various radars. The ER-2 flight track with
start and end times (UTC) is indicated on the plot. Values exceeding 50 dBZ are
shown white, values less than 0 dBZ are black, and the background is gry. The 'X'
denotes the location of the relevant ground radar.
Figure 4. Composite of vertical reflectivity sections from (a) EDOP, (b) ground radar,
and (c) the PR, for 21 April 1998, mapped to coordinates of EDOP cross section (top
panel). Panel (d) shows a 'degraded' EDOP section, simulating the PR (Appendix B).
The time difference (Dt) between the EDOP profile and the PR overpass is labeled
below the EDOP image in minutes, where positive numbers indicate that the EDOP
vertical profile is later than the TRMM image. Panels (e-g) show various TRMM
products corresponding to this cross section. TMI microwave brightness temperatures
at 10, 19, 35, and 85.5 GHz, together with the VIRS infrared brightness temperature,
are shown in panel (e). PR-derived storm top and BB heights are shown in panel (f),
44

and the rain type classification is shown in panel (g) together with the PR incidence
angle.
Figure 5. As Fig 4, but for 13 August 1998.
Figure 6. As Fig 4, but for 1 February 1999.
Figure 7. As Fig 4, but for 23 February 1999. The TRMM simulation by means of EDOP
data is omitted, instead a reflectivity cross-section from a second ground radar is
shown.
Fig8. As Fig. 4, but for 26 August 1998 (pass 1).
Figure 9. As Fig 4, but for 26 August 1998 (pass 3).
Figure 10. Mean reflectivityprofiles derived from the vertical cross sections in Figures 4-
9. The averages are calculated over the entire section, except were shown (i.e. for 13
August). Ground radar profiles are identified also by the start time of the volume
scans. (a) 21 April 1998; (b) and (c), 13 August 1998; (d) 1 February 1999; (e) 23
February 1999; and (f) 26 August 1998.
45
Related Documents