Computerized Medical Imaging and Graphics 31 (2007) 63–70 Comparison between nuclear chromatin patterns of digitalized images of cells of the mammalian testicular and renal tissues: An imaging segmentation study Godwin N. Isitor ∗ , Ramona Thorne School of Veterinary Medicine, Faculty of Medical Sciences, The University of the West Indies, St. Augustine Campus, Trinidad and Tobago Received 27 July 2005; received in revised form 30 October 2006; accepted 31 October 2006 Abstract Testicular and renal tissue, obtained from adult cattle, pigs, rats, and human was processed by image digital segmentation and pixel texture analytical techniques for comparative evaluation of nuclear chromatin pattern of testicular primary spermatocytes and renal glomerular endothelial cells. The post mortem performed for the animals and the human subject were for reasons not related with either testicular or renal conditions. The objective was to establish a benchmark for identification of rapidly multiplying cells in images of sections of normal, as well as abnormal mammalian tissue. Based on the observed morphological and texture pattern of the nuclear chromatin of the testicular primary spermatocytes, it was determined that the renal glomerular endothelial cells exhibit similar nuclear chromatin morphology consistent with an ongoing rapid multiplication process. The nuclear chromatin of both cell types manifest identical mitotic figures which are strongly indicative of cellular proliferation. © 2006 Elsevier Ltd. All rights reserved. Keywords: Image processing; Image segmentation; Texture analysis; Digital imaging; Nuclear chromatin pattern; Medical imaging 1. Background Testicular tissue has long been associated with the produc- tion of male germ cells as well as the male sex hormone, while the kidney functions in filtration of excretory materials from the blood vascular system, and plays a major role in homeostasis. Typical photomicrographs of routinely prepared hematoxylin and eosin (H and E) sections of the testicular tissue readily present signs of rapidly multiplying cells in the germinal epithe- lium. This is particularly true for the primary spermatocytes which are characterized by presence of coarse nuclear chromatin indicative of chromosomes in various stages of coiling termed mitotic figures [1,2]. In contrast, H and E sections of typical cells of the renal tissue, such as the glomerular endothelial cells, do not present features attributable to rapid multiplication activ- ity. This is in spite of a report of high proliferation index of the glomerular endothelial cells in comparison with other intrinsic renal cell population [3]. ∗ Corresponding author. Tel.: +868 645 2641x4211/4206; fax: +868 645 7428. E-mail address: [email protected] (G.N. Isitor). Depending upon the depth of staining of the spermatogenic testicular cells and the overall image contrast, demonstration of mitotic figures within the cells may not always be evident in H and E-stained testicular sections. In most non-testicular normal and abnormal tissue, demonstration of mitotic figures within dividing cells is even more difficult. Image components of digitally unprocessed routinely prepared sections, in general, are often stacked together, resulting in masking of lots of finer structures within the cells. The advent of image processing with the aid of the computer has not only made it possible to visualize images as collection of pixels of varying intensity values, but has also rendered the ability to segment the image elements in such a manner as to enable revelations of finer details. The present investigation is aimed at a qualitative and quantitative evaluation of the nuclear chromatin texture of images of the testicular primary spermatocytes as a reliable benchmark for determination of divisional activities of cells, in general. It is also aimed at comparatively analyzing the nuclear chromatin pattern of the renal endothelial cells with those of the testicular primary spermatocytes. It is hoped that the study would furnish a reliable means for determination of cellular multiplication activity, 0895-6111/$ – see front matter © 2006 Elsevier Ltd. All rights reserved. doi:10.1016/j.compmedimag.2006.10.005

Welcome message from author
This document is posted to help you gain knowledge. Please leave a comment to let me know what you think about it! Share it to your friends and learn new things together.
Transcript
A
acTm
tT©
K
1
ttbTaplwimcdigr
0d
Computerized Medical Imaging and Graphics 31 (2007) 63–70
Comparison between nuclear chromatin patterns of digitalizedimages of cells of the mammalian testicular and renal tissues:
An imaging segmentation study
Godwin N. Isitor ∗, Ramona ThorneSchool of Veterinary Medicine, Faculty of Medical Sciences, The University of the West Indies, St. Augustine Campus, Trinidad and Tobago
Received 27 July 2005; received in revised form 30 October 2006; accepted 31 October 2006
bstract
Testicular and renal tissue, obtained from adult cattle, pigs, rats, and human was processed by image digital segmentation and pixel texturenalytical techniques for comparative evaluation of nuclear chromatin pattern of testicular primary spermatocytes and renal glomerular endothelialells. The post mortem performed for the animals and the human subject were for reasons not related with either testicular or renal conditions.he objective was to establish a benchmark for identification of rapidly multiplying cells in images of sections of normal, as well as abnormalammalian tissue.
Based on the observed morphological and texture pattern of the nuclear chromatin of the testicular primary spermatocytes, it was determinedhat the renal glomerular endothelial cells exhibit similar nuclear chromatin morphology consistent with an ongoing rapid multiplication process.he nuclear chromatin of both cell types manifest identical mitotic figures which are strongly indicative of cellular proliferation.2006 Elsevier Ltd. All rights reserved.
aging
toinwoas
hoaei
eywords: Image processing; Image segmentation; Texture analysis; Digital im
. Background
Testicular tissue has long been associated with the produc-ion of male germ cells as well as the male sex hormone, whilehe kidney functions in filtration of excretory materials from thelood vascular system, and plays a major role in homeostasis.ypical photomicrographs of routinely prepared hematoxylinnd eosin (H and E) sections of the testicular tissue readilyresent signs of rapidly multiplying cells in the germinal epithe-ium. This is particularly true for the primary spermatocyteshich are characterized by presence of coarse nuclear chromatin
ndicative of chromosomes in various stages of coiling termeditotic figures [1,2]. In contrast, H and E sections of typical
ells of the renal tissue, such as the glomerular endothelial cells,o not present features attributable to rapid multiplication activ-
ty. This is in spite of a report of high proliferation index of thelomerular endothelial cells in comparison with other intrinsicenal cell population [3].∗ Corresponding author. Tel.: +868 645 2641x4211/4206; fax: +868 645 7428.E-mail address: [email protected] (G.N. Isitor).
nsdctsm
895-6111/$ – see front matter © 2006 Elsevier Ltd. All rights reserved.oi:10.1016/j.compmedimag.2006.10.005
; Nuclear chromatin pattern; Medical imaging
Depending upon the depth of staining of the spermatogenicesticular cells and the overall image contrast, demonstrationf mitotic figures within the cells may not always be evidentn H and E-stained testicular sections. In most non-testicularormal and abnormal tissue, demonstration of mitotic figuresithin dividing cells is even more difficult. Image componentsf digitally unprocessed routinely prepared sections, in general,re often stacked together, resulting in masking of lots of finertructures within the cells.
The advent of image processing with the aid of the computeras not only made it possible to visualize images as collectionf pixels of varying intensity values, but has also rendered thebility to segment the image elements in such a manner as tonable revelations of finer details. The present investigations aimed at a qualitative and quantitative evaluation of theuclear chromatin texture of images of the testicular primarypermatocytes as a reliable benchmark for determination ofivisional activities of cells, in general. It is also aimed at
omparatively analyzing the nuclear chromatin pattern ofhe renal endothelial cells with those of the testicular primarypermatocytes. It is hoped that the study would furnish a reliableeans for determination of cellular multiplication activity,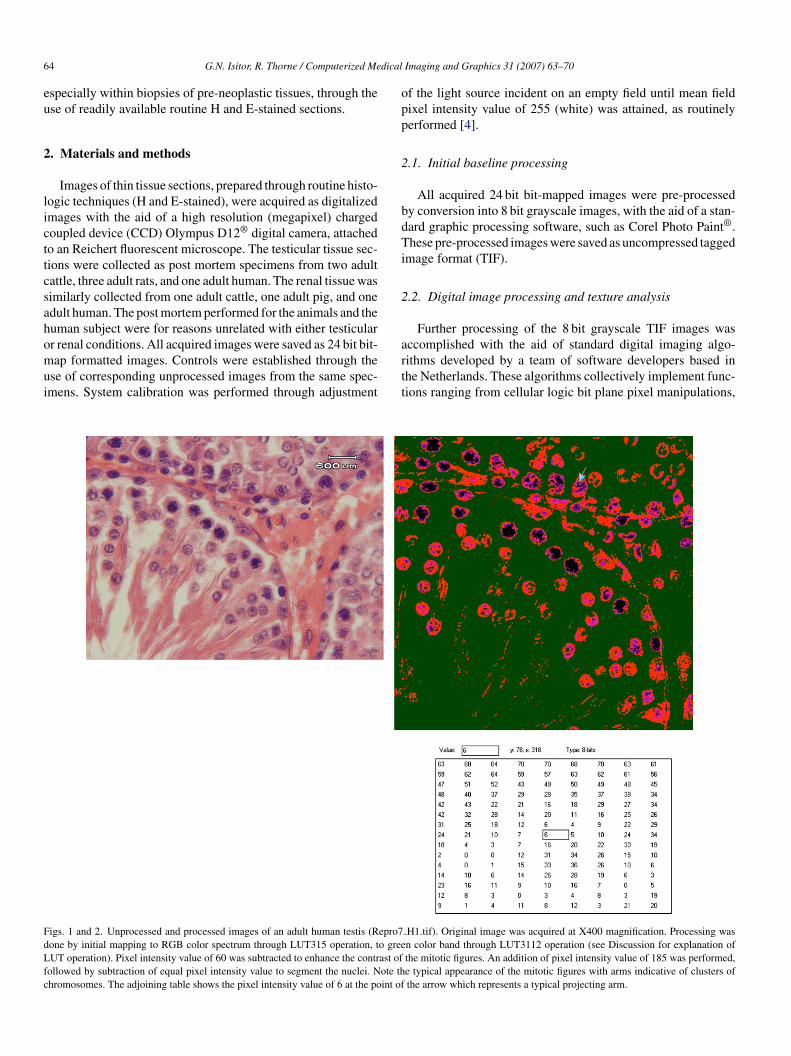
6 dical
eu
2
licttcsahomui
opp
2
bdTi
2
FdLfc
4 G.N. Isitor, R. Thorne / Computerized Me
specially within biopsies of pre-neoplastic tissues, through these of readily available routine H and E-stained sections.
. Materials and methods
Images of thin tissue sections, prepared through routine histo-ogic techniques (H and E-stained), were acquired as digitalizedmages with the aid of a high resolution (megapixel) chargedoupled device (CCD) Olympus D12® digital camera, attachedo an Reichert fluorescent microscope. The testicular tissue sec-ions were collected as post mortem specimens from two adultattle, three adult rats, and one adult human. The renal tissue wasimilarly collected from one adult cattle, one adult pig, and onedult human. The post mortem performed for the animals and theuman subject were for reasons unrelated with either testicular
r renal conditions. All acquired images were saved as 24 bit bit-ap formatted images. Controls were established through these of corresponding unprocessed images from the same spec-mens. System calibration was performed through adjustment
artt
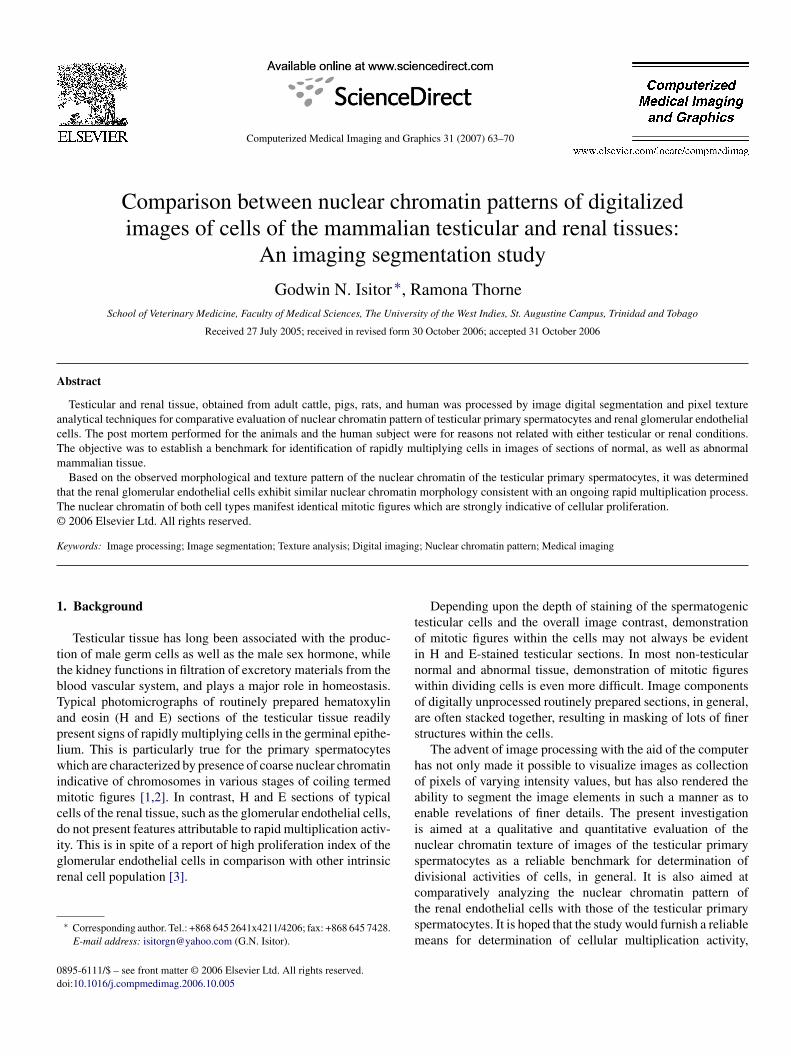
igs. 1 and 2. Unprocessed and processed images of an adult human testis (Repro7one by initial mapping to RGB color spectrum through LUT315 operation, to greeUT operation). Pixel intensity value of 60 was subtracted to enhance the contrast of
ollowed by subtraction of equal pixel intensity value to segment the nuclei. Note thhromosomes. The adjoining table shows the pixel intensity value of 6 at the point of
Imaging and Graphics 31 (2007) 63–70
f the light source incident on an empty field until mean fieldixel intensity value of 255 (white) was attained, as routinelyerformed [4].
.1. Initial baseline processing
All acquired 24 bit bit-mapped images were pre-processedy conversion into 8 bit grayscale images, with the aid of a stan-ard graphic processing software, such as Corel Photo Paint®.hese pre-processed images were saved as uncompressed tagged
mage format (TIF).
.2. Digital image processing and texture analysis
Further processing of the 8 bit grayscale TIF images was
ccomplished with the aid of standard digital imaging algo-ithms developed by a team of software developers based inhe Netherlands. These algorithms collectively implement func-ions ranging from cellular logic bit plane pixel manipulations,H1.tif). Original image was acquired at X400 magnification. Processing wasn color band through LUT3112 operation (see Discussion for explanation ofthe mitotic figures. An addition of pixel intensity value of 185 was performed,e typical appearance of the mitotic figures with arms indicative of clusters ofthe arrow which represents a typical projecting arm.
dical
tFtTvmootvmivospool
birbi7soat
udtip
F1tmtp
G.N. Isitor, R. Thorne / Computerized Me
o lookup table (LUT) color-mapping operations of the pixels.or our present purpose, the pre-processed images were mapped
o green or red sub-spectrum of the RGB visible color spectrum.his was followed by subtraction of determined pixel intensityalues for the purpose of enhancement of the nuclear chro-atin. Image segmentation was accomplished by an addition
f pixel intensity values of an average of 185 and subtractionf an equal amount of added pixel intensity value. The segmen-ation process involve an initial subtraction of pixel intensityalues, ranging from 20 to 90, to enhance the contrast of theitotic figures within the color sub-spectrum. The actual pixel
ntensity value subtracted is determined by on-screen pixel spotalue which is read by placement of the cursor on the regionf the mitotic figures. For instance, if it is determined that on-pot pixel intensity values of the mitotic figures in a givenre-processed image range between 62 and 70, the contrast
f the mitotic figures is subsequently enhanced by subtractionf a constant pixel intensity value of say 60. Thus, all cellu-ar structures with pixel intensities less than 60 are eliminatedcss
igs. 3 and 4. Another section of unprocessed and processed images of the human000× magnification. The rectangular area in the unprocessed image is shown as the phrough LUT315 operation, and mapping to green color band through LUT3112 oper
itotic figures. An addition of pixel intensity value of 185 was performed, followedypical appearance of the mitotic figures with radiating arms indicative of clusters ofoint of the arrow.
Imaging and Graphics 31 (2007) 63–70 65
y this subtraction process. Consequently, the remainder pixelntensities of values 2–10 for the mitotic figures would nowender the structure more contrasting and visible. Similarly,y addition of a constant pixel value of say 185–220 to themage, all structures with pixel intensity values in excess of0 are automatically eliminated since maximum pixel inten-ity of 255 (white) can only be presented in the image. Inrder to again retain the contrast of the mitotic figures, equalmount of the added pixel intensity should be subtracted fromhe image.
Direct graphical representation of pixel pattern of bothnprocessed and processed images in the form of frequencyistribution of the pixel intensities was accomplished on-screenhrough a module within the mix of the algorithms. Spot pixelntensity values were determined by placement of the cursor atarticular image location, and directly reading the value from
orresponding on-screen displayed table. The processed imagecreens were captured by means of standard image grabbingoftware, e.g., Corel Capture utility®.testicular seminiferous tubules (Repro44.tif). Original image was acquired atrocessed image. Processing was done by initial mapping to RGB color spectrumation. Pixel intensity value of 60 was subtracted to enhance the contrast of theby subtraction of equal pixel intensity value to segment the nuclei. Note thechromosomes. The adjoining table shows the pixel intensity value of 7 at the
66 G.N. Isitor, R. Thorne / Computerized Medical Imaging and Graphics 31 (2007) 63–70
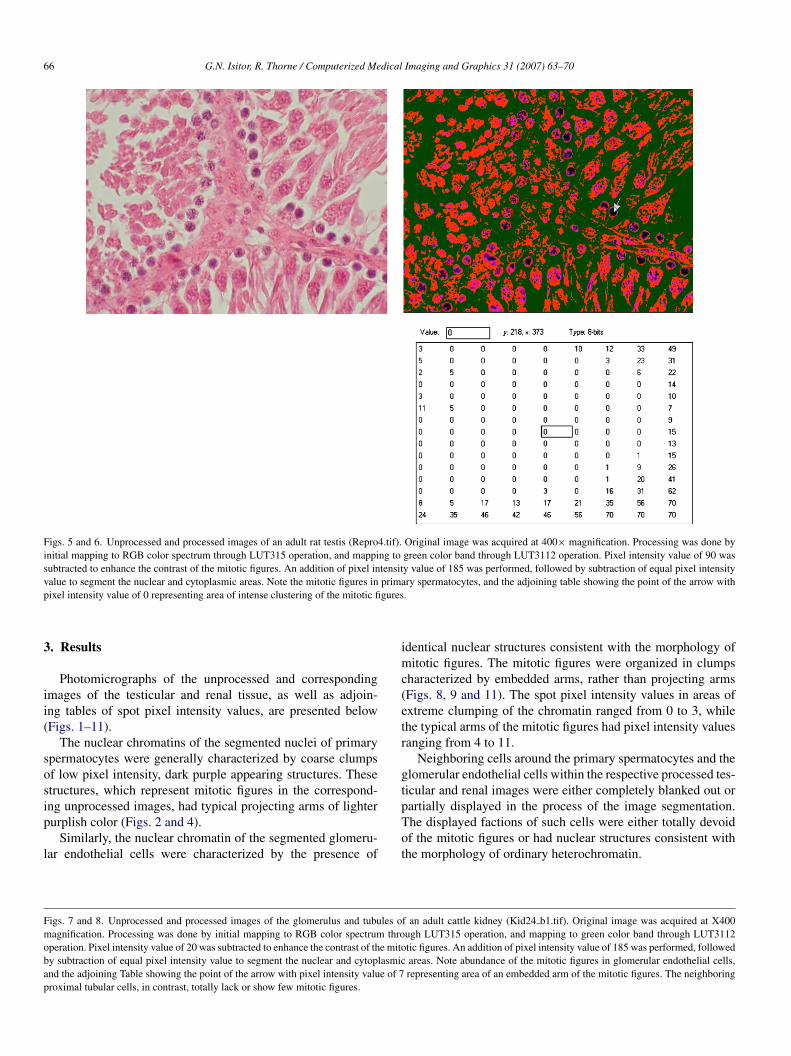
Figs. 5 and 6. Unprocessed and processed images of an adult rat testis (Repro4.tif). Original image was acquired at 400× magnification. Processing was done byinitial mapping to RGB color spectrum through LUT315 operation, and mapping to green color band through LUT3112 operation. Pixel intensity value of 90 wassubtracted to enhance the contrast of the mitotic figures. An addition of pixel intensity value of 185 was performed, followed by subtraction of equal pixel intensityv primap gures
3
ii(
sosip
l
imc(etr
gt
Fmobap
alue to segment the nuclear and cytoplasmic areas. Note the mitotic figures inixel intensity value of 0 representing area of intense clustering of the mitotic fi
. Results
Photomicrographs of the unprocessed and correspondingmages of the testicular and renal tissue, as well as adjoin-ng tables of spot pixel intensity values, are presented belowFigs. 1–11).
The nuclear chromatins of the segmented nuclei of primarypermatocytes were generally characterized by coarse clumpsf low pixel intensity, dark purple appearing structures. Thesetructures, which represent mitotic figures in the correspond-
ng unprocessed images, had typical projecting arms of lighterurplish color (Figs. 2 and 4).Similarly, the nuclear chromatin of the segmented glomeru-ar endothelial cells were characterized by the presence of
pTot
igs. 7 and 8. Unprocessed and processed images of the glomerulus and tubules oagnification. Processing was done by initial mapping to RGB color spectrum thro
peration. Pixel intensity value of 20 was subtracted to enhance the contrast of the mitoy subtraction of equal pixel intensity value to segment the nuclear and cytoplasmicnd the adjoining Table showing the point of the arrow with pixel intensity value of 7roximal tubular cells, in contrast, totally lack or show few mitotic figures.
ry spermatocytes, and the adjoining table showing the point of the arrow with.
dentical nuclear structures consistent with the morphology ofitotic figures. The mitotic figures were organized in clumps
haracterized by embedded arms, rather than projecting armsFigs. 8, 9 and 11). The spot pixel intensity values in areas ofxtreme clumping of the chromatin ranged from 0 to 3, whilehe typical arms of the mitotic figures had pixel intensity valuesanging from 4 to 11.
Neighboring cells around the primary spermatocytes and thelomerular endothelial cells within the respective processed tes-icular and renal images were either completely blanked out or
artially displayed in the process of the image segmentation.he displayed factions of such cells were either totally devoidf the mitotic figures or had nuclear structures consistent withhe morphology of ordinary heterochromatin.f an adult cattle kidney (Kid24 b1.tif). Original image was acquired at X400ugh LUT315 operation, and mapping to green color band through LUT3112tic figures. An addition of pixel intensity value of 185 was performed, followedareas. Note abundance of the mitotic figures in glomerular endothelial cells,representing area of an embedded arm of the mitotic figures. The neighboring
dical Imaging and Graphics 31 (2007) 63–70 67
4
ottnodcsc(gtahrs
atctfcic
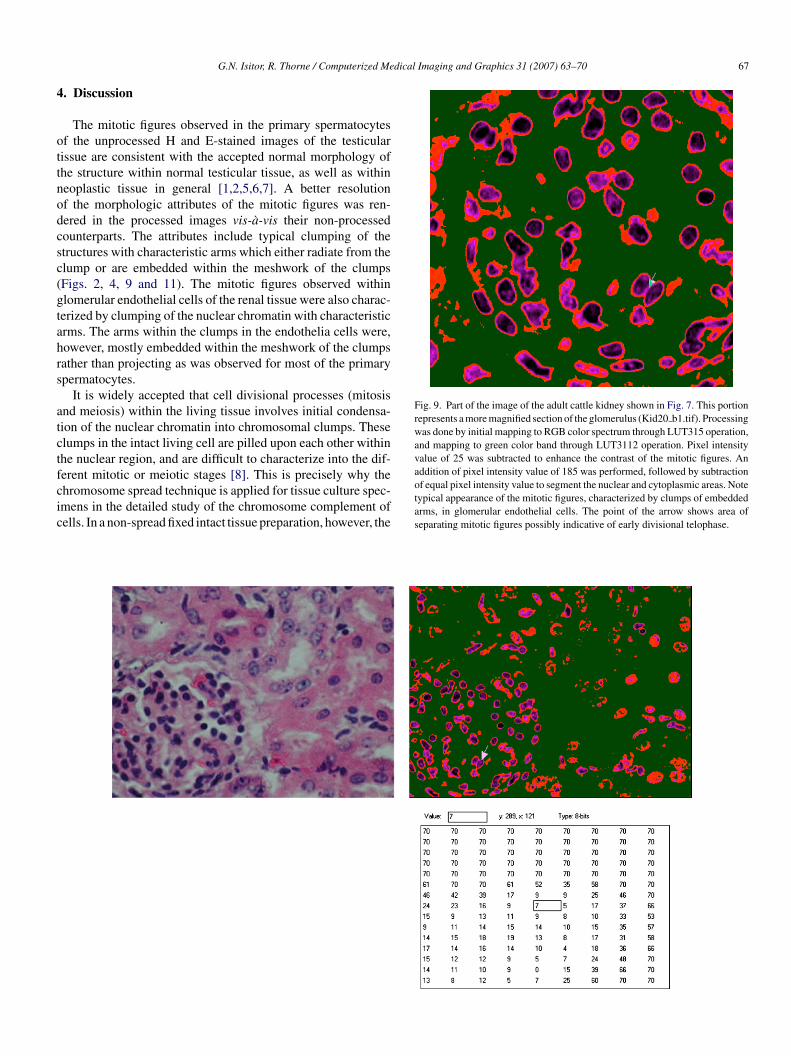
Fig. 9. Part of the image of the adult cattle kidney shown in Fig. 7. This portionrepresents a more magnified section of the glomerulus (Kid20 b1.tif). Processingwas done by initial mapping to RGB color spectrum through LUT315 operation,and mapping to green color band through LUT3112 operation. Pixel intensityvalue of 25 was subtracted to enhance the contrast of the mitotic figures. Anaddition of pixel intensity value of 185 was performed, followed by subtraction
G.N. Isitor, R. Thorne / Computerized Me
. Discussion
The mitotic figures observed in the primary spermatocytesf the unprocessed H and E-stained images of the testicularissue are consistent with the accepted normal morphology ofhe structure within normal testicular tissue, as well as withineoplastic tissue in general [1,2,5,6,7]. A better resolutionf the morphologic attributes of the mitotic figures was ren-ered in the processed images vis-a-vis their non-processedounterparts. The attributes include typical clumping of thetructures with characteristic arms which either radiate from thelump or are embedded within the meshwork of the clumpsFigs. 2, 4, 9 and 11). The mitotic figures observed withinlomerular endothelial cells of the renal tissue were also charac-erized by clumping of the nuclear chromatin with characteristicrms. The arms within the clumps in the endothelia cells were,owever, mostly embedded within the meshwork of the clumpsather than projecting as was observed for most of the primarypermatocytes.
It is widely accepted that cell divisional processes (mitosisnd meiosis) within the living tissue involves initial condensa-ion of the nuclear chromatin into chromosomal clumps. Theselumps in the intact living cell are pilled upon each other withinhe nuclear region, and are difficult to characterize into the dif-
erent mitotic or meiotic stages [8]. This is precisely why thehromosome spread technique is applied for tissue culture spec-mens in the detailed study of the chromosome complement ofells. In a non-spread fixed intact tissue preparation, however, theof equal pixel intensity value to segment the nuclear and cytoplasmic areas. Notetypical appearance of the mitotic figures, characterized by clumps of embeddedarms, in glomerular endothelial cells. The point of the arrow shows area ofseparating mitotic figures possibly indicative of early divisional telophase.
68 G.N. Isitor, R. Thorne / Computerized Medical Imaging and Graphics 31 (2007) 63–70
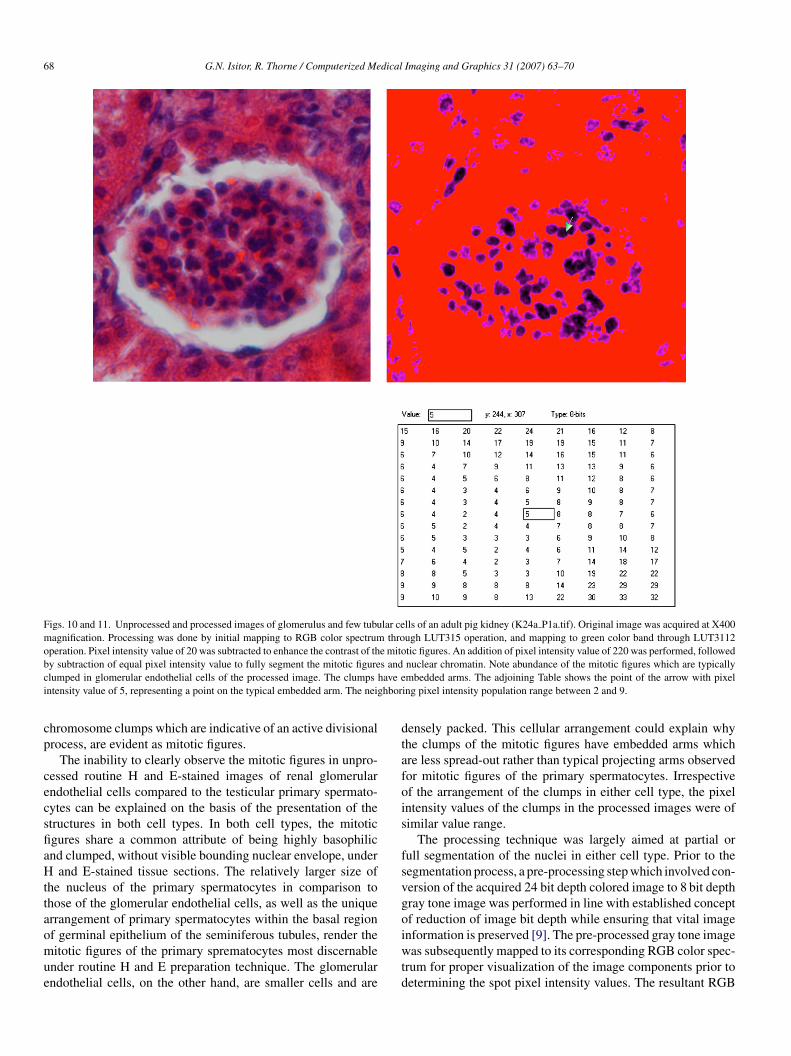
Figs. 10 and 11. Unprocessed and processed images of glomerulus and few tubular cells of an adult pig kidney (K24a P1a.tif). Original image was acquired at X400magnification. Processing was done by initial mapping to RGB color spectrum through LUT315 operation, and mapping to green color band through LUT3112operation. Pixel intensity value of 20 was subtracted to enhance the contrast of the mitotic figures. An addition of pixel intensity value of 220 was performed, followedb s andc have ei hbor
cp
cecsfiaHttaomue
dtafois
fsvgo
y subtraction of equal pixel intensity value to fully segment the mitotic figurelumped in glomerular endothelial cells of the processed image. The clumpsntensity value of 5, representing a point on the typical embedded arm. The neig
hromosome clumps which are indicative of an active divisionalrocess, are evident as mitotic figures.
The inability to clearly observe the mitotic figures in unpro-essed routine H and E-stained images of renal glomerularndothelial cells compared to the testicular primary spermato-ytes can be explained on the basis of the presentation of thetructures in both cell types. In both cell types, the mitoticgures share a common attribute of being highly basophilicnd clumped, without visible bounding nuclear envelope, under
and E-stained tissue sections. The relatively larger size ofhe nucleus of the primary spermatocytes in comparison tohose of the glomerular endothelial cells, as well as the uniquerrangement of primary spermatocytes within the basal region
f germinal epithelium of the seminiferous tubules, render theitotic figures of the primary sprematocytes most discernablender routine H and E preparation technique. The glomerularndothelial cells, on the other hand, are smaller cells and are
iwtd
nuclear chromatin. Note abundance of the mitotic figures which are typicallymbedded arms. The adjoining Table shows the point of the arrow with pixel
ing pixel intensity population range between 2 and 9.
ensely packed. This cellular arrangement could explain whyhe clumps of the mitotic figures have embedded arms whichre less spread-out rather than typical projecting arms observedor mitotic figures of the primary spermatocytes. Irrespectivef the arrangement of the clumps in either cell type, the pixelntensity values of the clumps in the processed images were ofimilar value range.
The processing technique was largely aimed at partial orull segmentation of the nuclei in either cell type. Prior to theegmentation process, a pre-processing step which involved con-ersion of the acquired 24 bit depth colored image to 8 bit depthray tone image was performed in line with established conceptf reduction of image bit depth while ensuring that vital image
nformation is preserved [9]. The pre-processed gray tone imageas subsequently mapped to its corresponding RGB color spec-rum for proper visualization of the image components prior toetermining the spot pixel intensity values. The resultant RGB
dical
ieptivFdirL#cfudLtfwrcfstcrst
on
Foos
pdsvpllattptfaeadHfats
rsope
G.N. Isitor, R. Thorne / Computerized Me
mage was then re-mapped into linear single sub-spectrum ofither green or red, followed by the segmentation process. Therogram algorithm that implements the color-mapping opera-ion uses a standard lookup table (LUT) values in which pixelntensity values in the gray tone images are equated to coloralues of the visible RGB spectrum, recorded within the table.or each LUT value, a combination of parameters is used toenote the underlying LUT function. Thus a typical functions represented by LUT [#1] [#2 [#3 [#4], etc.]], where #1 rep-esents image type (Window or Frame Grabber), #2 representsUT table-type parameter which depends on the display device,3 represents LUT pattern which could be single or combinedolor pattern, and #4 represents the specified spectrum. In aull RGB color spectrum mapping operation, for instance, thenderlying LUT315 operation denotes Window image [3], Win-ow LUT table-type [1], and full RGB colors [5]. Similarly,UT3112 represents Window image [3], Window LUT table-
ype [1], single RGB color [1], and the specified color [2]or green sub-spectrum. For the red sub-spectrum, the functionould be LUT3111. Note that the last digit value 1 represents
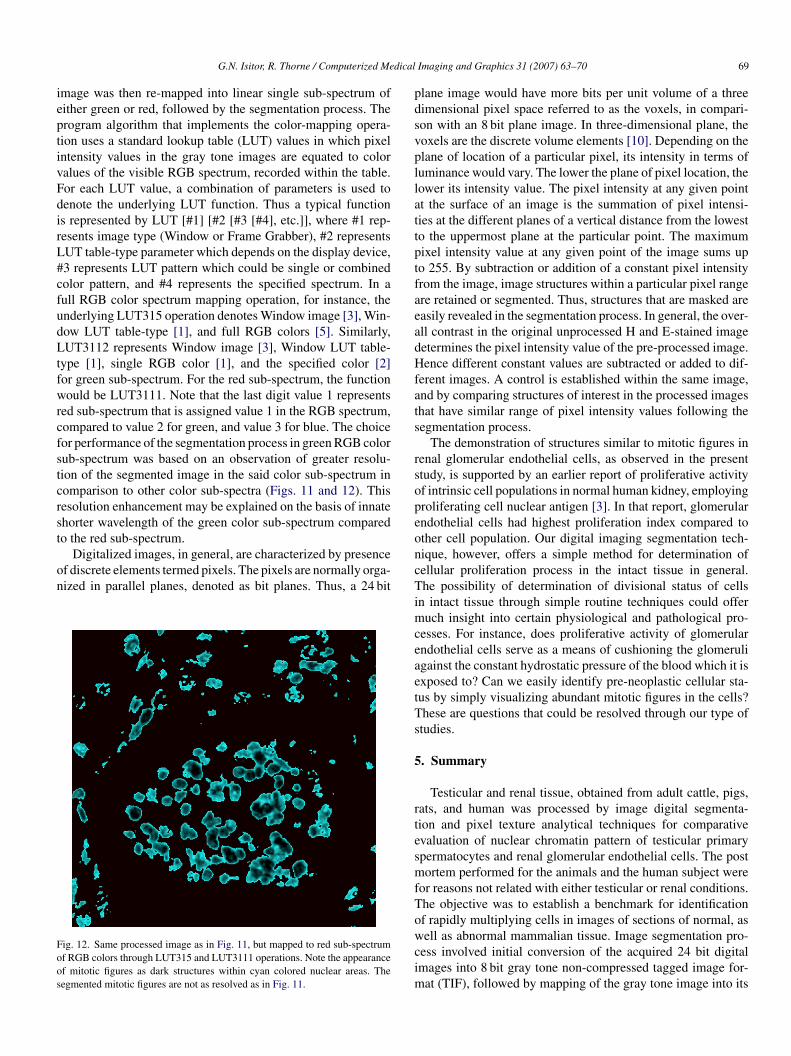
ed sub-spectrum that is assigned value 1 in the RGB spectrum,ompared to value 2 for green, and value 3 for blue. The choiceor performance of the segmentation process in green RGB colorub-spectrum was based on an observation of greater resolu-ion of the segmented image in the said color sub-spectrum inomparison to other color sub-spectra (Figs. 11 and 12). Thisesolution enhancement may be explained on the basis of innatehorter wavelength of the green color sub-spectrum compared
o the red sub-spectrum.Digitalized images, in general, are characterized by presencef discrete elements termed pixels. The pixels are normally orga-ized in parallel planes, denoted as bit planes. Thus, a 24 bit
ig. 12. Same processed image as in Fig. 11, but mapped to red sub-spectrumf RGB colors through LUT315 and LUT3111 operations. Note the appearancef mitotic figures as dark structures within cyan colored nuclear areas. Theegmented mitotic figures are not as resolved as in Fig. 11.
oncTimceaetTs
5
rtesmfTowcim
Imaging and Graphics 31 (2007) 63–70 69
lane image would have more bits per unit volume of a threeimensional pixel space referred to as the voxels, in compari-on with an 8 bit plane image. In three-dimensional plane, theoxels are the discrete volume elements [10]. Depending on thelane of location of a particular pixel, its intensity in terms ofuminance would vary. The lower the plane of pixel location, theower its intensity value. The pixel intensity at any given pointt the surface of an image is the summation of pixel intensi-ies at the different planes of a vertical distance from the lowesto the uppermost plane at the particular point. The maximumixel intensity value at any given point of the image sums upo 255. By subtraction or addition of a constant pixel intensityrom the image, image structures within a particular pixel rangere retained or segmented. Thus, structures that are masked areasily revealed in the segmentation process. In general, the over-ll contrast in the original unprocessed H and E-stained imageetermines the pixel intensity value of the pre-processed image.ence different constant values are subtracted or added to dif-
erent images. A control is established within the same image,nd by comparing structures of interest in the processed imageshat have similar range of pixel intensity values following theegmentation process.
The demonstration of structures similar to mitotic figures inenal glomerular endothelial cells, as observed in the presenttudy, is supported by an earlier report of proliferative activityf intrinsic cell populations in normal human kidney, employingroliferating cell nuclear antigen [3]. In that report, glomerularndothelial cells had highest proliferation index compared tother cell population. Our digital imaging segmentation tech-ique, however, offers a simple method for determination ofellular proliferation process in the intact tissue in general.he possibility of determination of divisional status of cells
n intact tissue through simple routine techniques could offeruch insight into certain physiological and pathological pro-
esses. For instance, does proliferative activity of glomerularndothelial cells serve as a means of cushioning the glomeruligainst the constant hydrostatic pressure of the blood which it isxposed to? Can we easily identify pre-neoplastic cellular sta-us by simply visualizing abundant mitotic figures in the cells?hese are questions that could be resolved through our type oftudies.
. Summary
Testicular and renal tissue, obtained from adult cattle, pigs,ats, and human was processed by image digital segmenta-ion and pixel texture analytical techniques for comparativevaluation of nuclear chromatin pattern of testicular primarypermatocytes and renal glomerular endothelial cells. The postortem performed for the animals and the human subject were
or reasons not related with either testicular or renal conditions.he objective was to establish a benchmark for identificationf rapidly multiplying cells in images of sections of normal, as
ell as abnormal mammalian tissue. Image segmentation pro-ess involved initial conversion of the acquired 24 bit digitalmages into 8 bit gray tone non-compressed tagged image for-
at (TIF), followed by mapping of the gray tone image into its
7 dical
csso
tieaos
A
Soaim
R
[
GaAicpotbtetrpb
Do2
0 G.N. Isitor, R. Thorne / Computerized Me
orresponding RGB color spectrum, and to green or red colorub-spectrum. This was subsequently followed to an arithmeticubtraction and addition of pixel constant values, based uponn-screen pixel spot color evaluation.
Based on the observed morphological and texture pattern ofhe nuclear chromatin of the testicular primary spermatocytes,t was determined that the renal glomerular endothelial cellsxhibit similar nuclear chromatin morphology consistent withn ongoing rapid multiplication process. The nuclear chromatinf both cell types manifest identical mitotic figures which aretrongly indicative of cellular proliferation.
cknowledgements
The authors are grateful to The University of the West Indies,t. Augustine Campus, for provision of grants for procurementf equipment which made this investigation possible. We alsocknowledge Mr. Ekkers and his team of Software Developersn the Netherlands for support with the digital imaging software
odules.
eferences
[1] Junqueira LC, Carneiro J. Basic histology. Text and atlas. Lange medicalbooks. 10th ed. McGraw-Hill; 2003. p. 433.
[2] Trainer TD. Histology of the normal testis. AJSP 1987;11:797–809.[3] Nadasdy T, Laszik Z, Blick KE, Johnson LD, Silva FG. Proliferative
activity of intrinsic cell populations in the normal human kidney. JASN1994;4:2032–9.
[4] Diamond J, Anderson NH, Bartels PH, Montironi R, Hamilton PW. Theuse of morphological characteristics and texture analysis in the identifi-cation of tissue composition in prostatic neoplasia. Hum Pathol 2004;35:1121–31.
[5] Batistatou A. Mitoses and cancer. Med Hypotheses 2004;63:281–2.
oHdlm
Imaging and Graphics 31 (2007) 63–70
[6] Darvishian F, Lin O. Myoepithelial cell-rich neoplasms: cytologic featuresof benign and malignant lesions. Cancer 2004;102:355–61.
[7] Reggeti F, Brisson B, Ruotsalo K, Southorn E, Bienzle D. Invasive epithelialmesothelioma in a dog. Vet Pathol 2005;42:77–81.
[8] Presnell JK, Schreibman MP. Humason’s animal tissue techniques. TheJohn Hopkins. 5th ed. Baltimore and London: University Press; 1997. p.414.
[9] Lakatos J, Bodor T, Zidarics Z, Nagy J. Data processing of digital record-ings of microscopic examination of urinary sediment. Clin Chim Acta2000;297:225–37.
10] Demiris A, Mayer A, Meinzer HP, 3-D visualization in medicine: anoverview. In: Roux C, Coatrieux JL, editors. Contemporary perspectivesin three-dimensional biomedical imaging. Ohmsha, Amsterdam, Berlin,Oxford, Tokyo, Washington, DC: IOS Press; 1997. p. 79–105.
odwin Isitor is presently a Professor of Veterinary and Microscopic Anatomyt the Faculty of Medical Sciences, The University of the West Indies (UWI), St.ugustine Campus, Trinidad, W.I. He has, for the past 30 years, been involved
n the teaching of anatomical courses at the undergraduate and postgraduateurricula. Within the past 12 years, he has also been involved in the teachingrogram of histology to medical, veterinary and dental students at the Facultyf Medical Sciences, UWI. He has, in the past, mostly employed ultrastruc-ural techniques in his research methodology. His current research focus isased on the application of digital imaging and texture analytical techniqueso diagnostic histology and cytology, as well as in radiology. He also currentlymploys fluorescence microscopy techniques in explorative cytology. In additiono his research activities, he has also authored a histology/embryology electronicesource, called CompuHistology, for undergraduate teaching and learning. Thisroduct is presently being released at its third incarnation as Version 3.0. He cane reached at [email protected].
r. Ramona Thorne graduated from the School of Veterinary Medicine, Facultyf Medical Sciences, The University of the West Indies, St. Augustine Campus in005. She is presently enrolled as a postgraduate student, under the supervision
f Prof. Isitor. She also works as a clinician at Jones Animal Clinic, Trinidad, W.I.er present research focus is in comparative cytological studies of normal andiseased tissues of domesticated mammals and birds, employing fluorescence,ight and electron microscopy techniques, as well as digital imaging analyticalethods.
Related Documents