Comparing Taxation, Transfers, and Redistribution in Brazil and the United States Sean Higgins (Tulane University, USA) Nora Lustig (Tulane University, USA) Whitney Ruble (Tulane University, USA) Timothy Smeeding (University of Wisconsin at Madison, USA) Paper Prepared for the IARIW-IBGE Conference on Income, Wealth and Well-Being in Latin America Rio de Janeiro, Brazil, September 11-14, 2013 Session 3: Taxation and Redistribution I Time: Thursday, September 12, 4:00-5:30

Welcome message from author
This document is posted to help you gain knowledge. Please leave a comment to let me know what you think about it! Share it to your friends and learn new things together.
Transcript
Comparing Taxation, Transfers, and Redistribution
in Brazil and the United States
Sean Higgins (Tulane University, USA)
Nora Lustig (Tulane University, USA)
Whitney Ruble (Tulane University, USA)
Timothy Smeeding (University of Wisconsin at Madison, USA)
Paper Prepared for the IARIW-IBGE Conference
on Income, Wealth and Well-Being in Latin America
Rio de Janeiro, Brazil, September 11-14, 2013
Session 3: Taxation and Redistribution I
Time: Thursday, September 12, 4:00-5:30
Comparing Taxation, Transfers, and Redistribution in Brazil and the United States
Sean Higginsa
Nora Lustigb
Whitney Rublea
Timothy Smeedingc
Draft
August 27, 2013
a Ph.D. Student, Department of Economics, Tulane University b Samuel Z. Stone Professor of Latin American Economics, Tulane University; Nonresident Fellow,
Center for Global Development and Inter-American Dialogue c Director, Institute for Research and Policy; Arts and Sciences Distinguished Professor of Public
Affairs and Economics, University of Wisconsin at Madison
1. Introduction
How much do the Western Hemisphere’s two largest economies and most populous
countries redistribute through social spending and taxes? Our motivations for comparing and
contrasting revenue collection and social spending in Brazil and the United States are many. In
addition to making up over half of the Western Hemisphere’s population, the two countries have
similar levels of taxation and social spending as a percent of GDP. Both countries are relatively
unequal given their levels of development: a quarter century ago, Brazil had one of the highest levels
of inequality in the world, while the US had one of the highest levels of inequality among developed
countries. In 1989, Brazil’s Gini coefficient made it the second most unequal country in the world,
second only to Sierra Leone (Ferreira, Leite, and Litchfield 2008); in 1985, the United States was the
second most unequal OECD country,1 second only to Turkey (OECD, 2011). Since then, inequality
has fallen substantially in Brazil while it has risen substantially in the United States. If trends
continue—and there is good reason to believe that they may2—the level of inequality in the two
countries could converge. Relations between the two countries appear to be increasing: for example,
the number of US citizens to be sent to Brazil as part of the Fulbright English teaching assistant
(ETA) program increased four-fold this year as part of a joint effort between the American and
Brazilian governments.
We perform comprehensive fiscal incidence analyses in the two countries, including direct
taxes, direct transfers, indirect taxes, indirect subsidies, and the value of in-kind benefits from
1 This refers to countries that were members of the OECD in 1985. 2 The factors contributing to increasing inequality in the United States show no signs of changing course (NEEDS CITATION). Although it is less clear whether income inequality in Brazil will continue to decline (Lustig, López-Calva, and Ortiz-Juárez, 2013), there are reasons to believe that it is very possible. Barros et al. (2010) argue that the factors contributing to the decline in inequality between 1977 and 2007 were beginning to experience decreasing marginal effectiveness. However, they note that the design of Brazilian social policy was far from optimal, and that there were therefore a number of avenues by which Brazil could maintain its recent fast pace of inequality decline without additional resources. Indeed, the Brazilian government has implemented at least one of Barros et al.’s suggestions by expanding the Bolsa Família conditional cash transfer program, and more recent data from 2008-2011 shows that inequality in Brazil has continued to decline.
government-provided health, education, and housing services. Our study is the only comprehensive
incidence analysis we are aware of for the United States for a relatively recent year; other studies
usually omit indirect taxes and in-kind benefits from education, health, and housing (e.g., Kim and
Lambert, 2009). The one study we are aware of that includes both indirect taxes and these in-kind
benefits (Garfinkel, Rainwater, and Smeeding, 2006) uses data from 2000 and is therefore not recent.
In addition, in the areas of estimating indirect taxes and education benefits, our study includes
methodological improvements. In the case of Brazil, a comprehensive incidence analysis was
undertaken in Higgins and Pereira (forthcoming). Comparing the revenue collection and social
spending systems in the two countries leads us to a number of new insights. Furthermore, by using
the consistent methodology described in Lustig and Higgins (2013) in the two countries, we ensure a
high degree of comparability.
Despite their converging trends over time, inequality is still much higher in Brazil than in the
United States, both before taxes and transfers and after. The market income Gini in the United
States is 45.4; it is reduced by 8.9 points by direct transfers, indirect subsidies, and direct and indirect
taxes, and by 16.3 points when in-kind benefits in the form of health (Medicare and Medicaid) and
education (public primary and secondary school, Head Start, and public daycare through CCDF and
TANF) are added to income. In Brazil, the market income Gini is a much higher 55.4, and is
reduced by 3.9 and 14.9 points, respectively, where health benefits in Brazil are in the form of free
care received at public health facilities and education incudes public primary and secondary school,
public pre-school, and free public daycare for low income families.
2. Income Concepts
We use definitions of five income concepts adapted from Lustig and Higgins (2013). Market
income includes wage and salary income, fringe benefits (including employer contributions to health
insurance), non-farm business income, farm income, retirement income, income from interest,
dividends, and rent, income from private transfers (child support, alimony, remittances, other),
income from contributory pensions from the social security system, imputed rent for owner-
occupied housing, and the value of own production. With respect to the social security pensions,
Lustig, Pessino, and Scott (forthcoming) explain that arguments exist for treating them as part of
market income because they are deferred income similar to personal savings, as well as for treating
them as a government transfer since there may not a deterministic link between the amount
contributed and the benefit received, and many systems run a deficit financed by general tax
revenues. Here, we treat them as part of market income.
Net market income equals market income minus individual income taxes and payroll taxes
(including those paid by the employer), corporate income taxes, and property taxes. Individual
income taxes and payroll taxes are assumed to be borne fully by labor in the formal sector. Since
gross labor income reported in the survey is net of taxes paid by the employer, we gross up market
income by adding taxes paid by the employer. Similarly, we gross up market income in the case of
corporate income taxes and property taxes. Corporate income taxes are assumed to fall partially on
capital, and to be partially shifted forward to labor and consumers. Due to the theoretical and
empirical uncertainty with respect to who bears the burden of the corporate income tax (Auerbach,
2005), this is a middle of the road approach. Property taxes are assumed to be borne fully by
property owners.
Disposable income equals net market income plus direct cash and food transfers. In the case of
Brazil, direct cash transfers include the flagship anti-poverty conditional cash transfer (CCT)
program Bolsa Família, the non-contributory pension program Benefício de Prestação Continuada
(BPC), public scholarships, unemployment benefits, special circumstances pensions, and other direct
transfers. These programs are described in detail in Higgins and Pereira (forthcoming). In the case of
the US, they include welfare or welfare-to-work payments, Temporary Assistance for Needy
Families (TANF), Aid to Families with Dependent Children (AFDC), Refugee Cash and Medical
Assistance program, General Assistance from the Bureau of Indian Affairs, Tribal Administered
General Assistance, non-contributory pensions from the Supplemental Security Income program,
veteran’s benefits, unemployment benefits, Pell grants (a type of public scholarship), and worker’s
compensation. We also treat the federal and state Earned Income Tax Credit (EITC) as a direct
transfer (and, hence, use pre-credit liabilities in the direct tax calculations). In Brazil, food transfers
include the Programa de Aquisição de Alimentos (PAA) milk transfer program; in the US, they
include the Supplemental Nutrition Assistance Program (SNAP; more commonly known as “food
stamps”), Special Supplemental Nutrition Program for Women, Infants, and Children (WIC), and
free and reduced-price school lunches for low-income families.
Post-fiscal income equals disposable income plus indirect subsidies minus indirect taxes. In both
countries, the indirect subsidies included in our analysis are household energy subsidies targeted to
low-income families. Allocating other government subsidies to individual households is intractable.
Indirect taxes are consumption taxes; in Brazil these include a state-level value-added tax (VAT) on
consumption and three federal VATs, while in the US they include federal and state sales and excise
taxes. We assume that the burden of indirect taxes entirely shifted forward to consumers.
Final income equals post-fiscal income plus the value of in-kind benefits in the form of public
health, education, and housing services. We value these services at government cost because our
objective is to analyze who receives the benefits of public spending. In Brazil, unlimited free access
to public health care facilities is guaranteed by the 1988 Constitution; individuals who attended
public health facilities are allocated the average government cost (in their state) of the treatment they
received. In the United States, social spending on health care takes the form of the Medicare and
Medicaid programs, which are imputed at their market value to those who are covered by the
programs. Education benefits are allocated to individuals who report attending a public daycare, pre-
school, primary, or secondary school, and are valued at the per-pupil government spending for that
education level. Public daycare programs (either in the form of free daycare centers or subsidy
vouchers) for low-income families exist in both countries; in the US they are funded by the Child
Care Development Fund (CCDF) and TANF. Public pre-school is also available to low-income
families in both countries—in the US this usually takes the form of participation in the Head Start
program. Although tertiary education is free at all public universities in Brazil and highly subsidized
at public universities in the US, the lack of data on who attends public universities in the US and the
difficulty in allocating data led us to omit tertiary spending from our analysis for both countries.
Each of these income concepts is aggregated at the household level and assumed to be
shared equally among the members of the household (relative to their needs). If we assume no
economies of scale within households, we would then divide household income by the number of
people in the household and use household per capita income in the analysis. If we assume
maximum economies of scale, so that the marginal cost of fulfilling the needs of any household
member after the first is zero, then we would simply use household aggregate income in the analysis.
Equivalence scales account for some degree of economies of scale within households between these
two extremes. In this study we use the square root scale suggested by Atkinson, Rainwater, and
Smeeding (1995). We apply the scale to both cash incomes and in-kind benefits; for a discussion of
the merits of this approach and its alternative (applying the equivalence scale to cash income but not
to in-kind benefits) see Garfinkel, Rainwater, and Smeeding (2006).
For the analysis in the United States, our primary data source is the March Annual Social and
Economic supplement of the Current Population Survey (CPS), 2011. To impute in-kind primary
and secondary education benefits, we also use data from the American Community Survey (ACS),
2011, and to impute benefits from the Head Start program we use the National Household
Education Survey (NHES), 2007. In Brazil, our primary survey is the Pesquisa de Orçamentos
Familiares (Family Expenditure Survey; POF), 2008-2009. To impute health benefits, we also use
data from the Pesquisa Nacional por Amostra de Domicílios (National Household Sample Survey;
PNAD), 2008.
3. Results
3.1 Progressivity and Inequality Reduction
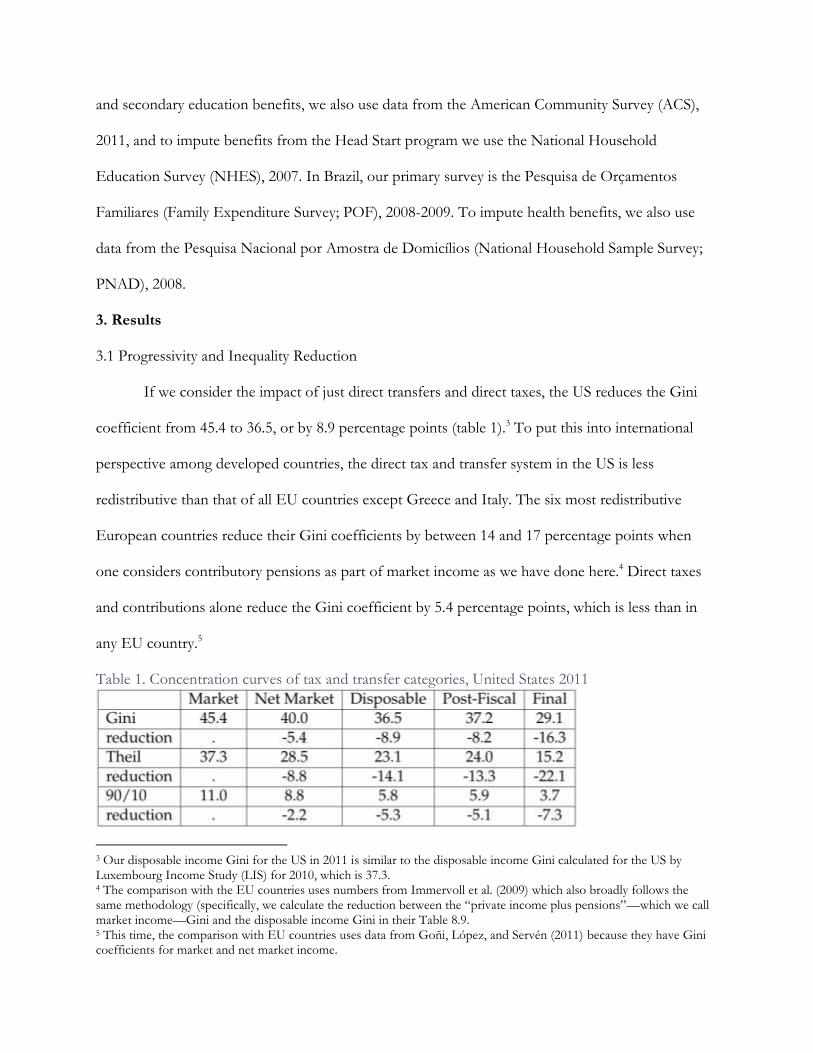
If we consider the impact of just direct transfers and direct taxes, the US reduces the Gini
coefficient from 45.4 to 36.5, or by 8.9 percentage points (table 1).3 To put this into international
perspective among developed countries, the direct tax and transfer system in the US is less
redistributive than that of all EU countries except Greece and Italy. The six most redistributive
European countries reduce their Gini coefficients by between 14 and 17 percentage points when
one considers contributory pensions as part of market income as we have done here.4 Direct taxes
and contributions alone reduce the Gini coefficient by 5.4 percentage points, which is less than in
any EU country.5
Table 1. Concentration curves of tax and transfer categories, United States 2011
3 Our disposable income Gini for the US in 2011 is similar to the disposable income Gini calculated for the US by Luxembourg Income Study (LIS) for 2010, which is 37.3. 4 The comparison with the EU countries uses numbers from Immervoll et al. (2009) which also broadly follows the same methodology (specifically, we calculate the reduction between the “private income plus pensions”—which we call market income—Gini and the disposable income Gini in their Table 8.9. 5 This time, the comparison with EU countries uses data from Goñi, López, and Servén (2011) because they have Gini coefficients for market and net market income.
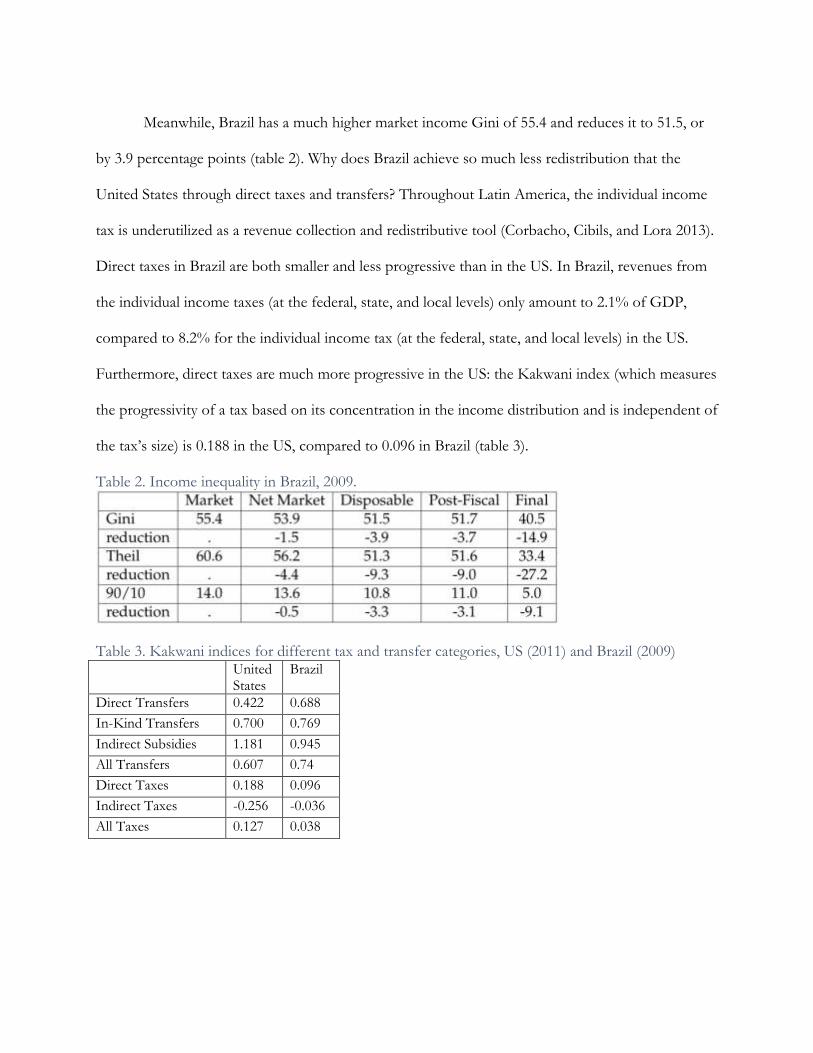
Meanwhile, Brazil has a much higher market income Gini of 55.4 and reduces it to 51.5, or
by 3.9 percentage points (table 2). Why does Brazil achieve so much less redistribution that the
United States through direct taxes and transfers? Throughout Latin America, the individual income
tax is underutilized as a revenue collection and redistributive tool (Corbacho, Cibils, and Lora 2013).
Direct taxes in Brazil are both smaller and less progressive than in the US. In Brazil, revenues from
the individual income taxes (at the federal, state, and local levels) only amount to 2.1% of GDP,
compared to 8.2% for the individual income tax (at the federal, state, and local levels) in the US.
Furthermore, direct taxes are much more progressive in the US: the Kakwani index (which measures
the progressivity of a tax based on its concentration in the income distribution and is independent of
the tax’s size) is 0.188 in the US, compared to 0.096 in Brazil (table 3).
Table 2. Income inequality in Brazil, 2009.
Table 3. Kakwani indices for different tax and transfer categories, US (2011) and Brazil (2009) United
States Brazil
Direct Transfers 0.422 0.688
In-Kind Transfers 0.700 0.769
Indirect Subsidies 1.181 0.945
All Transfers 0.607 0.74
Direct Taxes 0.188 0.096
Indirect Taxes -0.256 -0.036
All Taxes 0.127 0.038
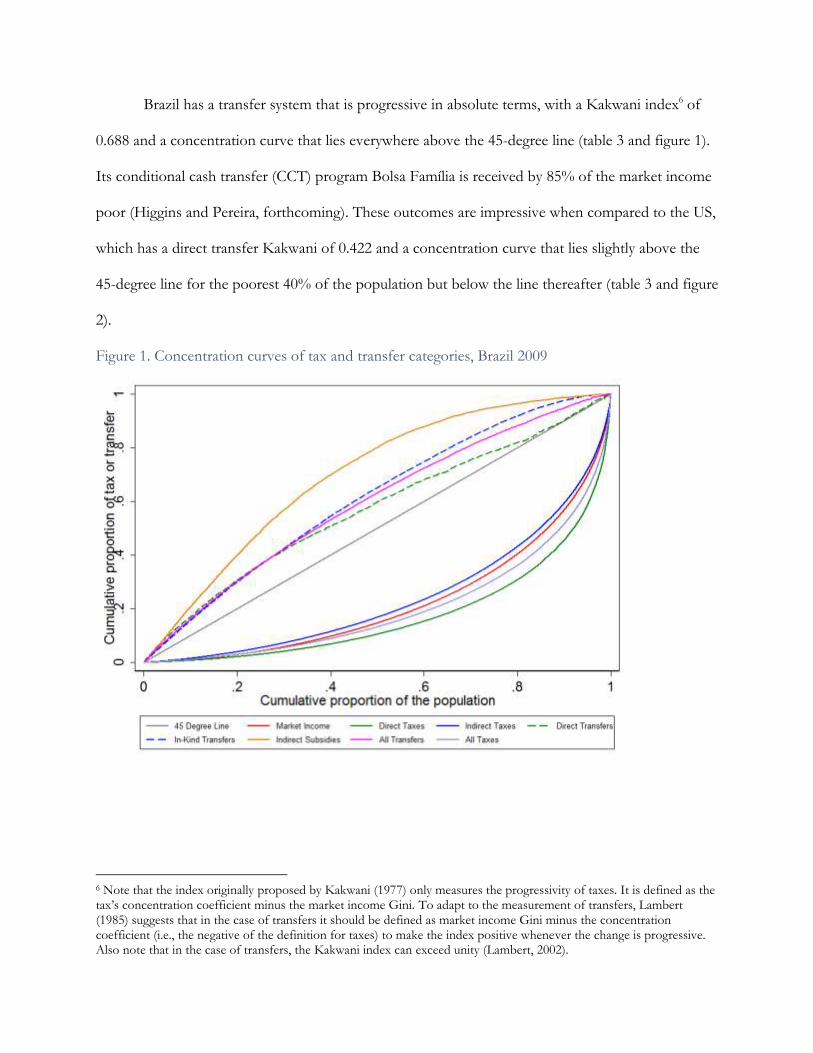
Brazil has a transfer system that is progressive in absolute terms, with a Kakwani index6 of
0.688 and a concentration curve that lies everywhere above the 45-degree line (table 3 and figure 1).
Its conditional cash transfer (CCT) program Bolsa Família is received by 85% of the market income
poor (Higgins and Pereira, forthcoming). These outcomes are impressive when compared to the US,
which has a direct transfer Kakwani of 0.422 and a concentration curve that lies slightly above the
45-degree line for the poorest 40% of the population but below the line thereafter (table 3 and figure
2).
Figure 1. Concentration curves of tax and transfer categories, Brazil 2009
6 Note that the index originally proposed by Kakwani (1977) only measures the progressivity of taxes. It is defined as the tax’s concentration coefficient minus the market income Gini. To adapt to the measurement of transfers, Lambert (1985) suggests that in the case of transfers it should be defined as market income Gini minus the concentration coefficient (i.e., the negative of the definition for taxes) to make the index positive whenever the change is progressive. Also note that in the case of transfers, the Kakwani index can exceed unity (Lambert, 2002).

Figure 2. Concentration curves of tax and transfer categories, United States 2011
The reason Brazil is not able to achieve more redistribution through its progressive transfers
is that its highly redistributive programs—such as its flagship CCT, non-contributory pension
program for the elderly poor, and milk transfer program—are small: combined, the three programs
make up less than 1% of GDP. Even for the poorest 10% of the population, they only increase
market income by 26.2%, 23.9%, and a paltry 0.2% of the population (table 4). This can be
compared to the United States where non-contributory pensions for the Supplemental Security
income program increases the market incomes of the bottom decile by 54.4% on average, while
food transfers (SNAP, WIC, and the school lunch program) increase their incomes by 47.1%. (table
5). Meanwhile, the majority of Brazil’s larger transfer programs, such as unemployment benefits, are
progressive only in relative terms.
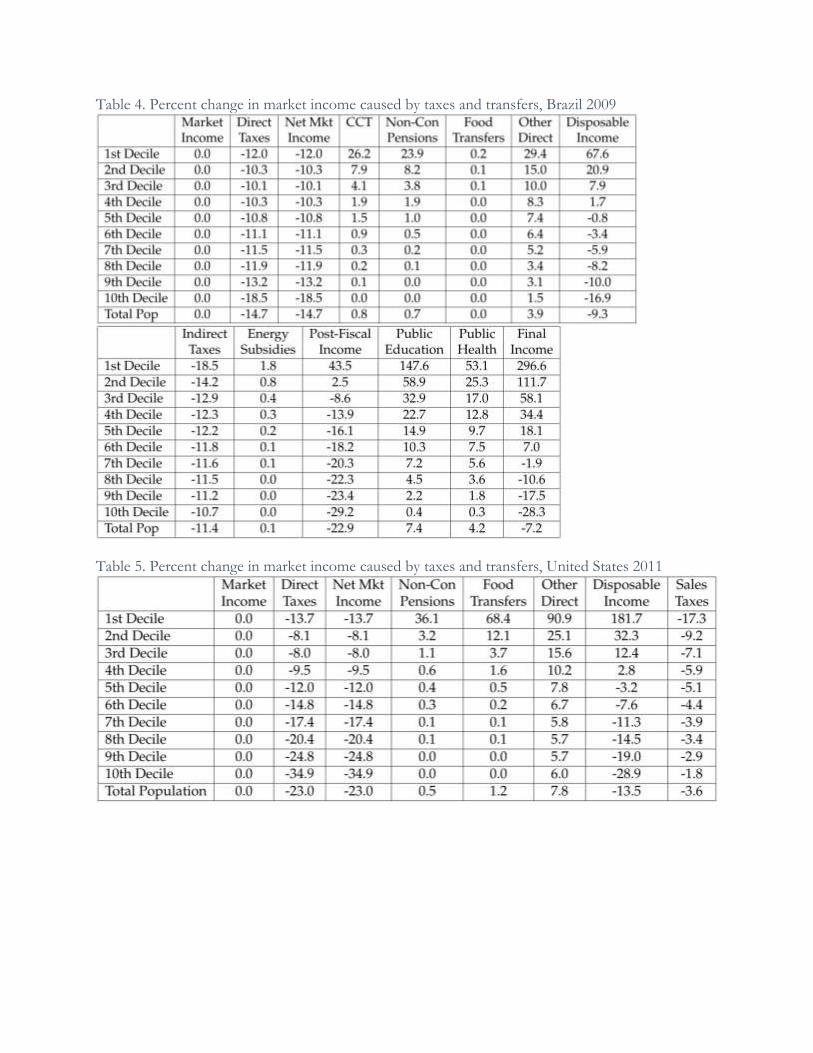
Table 4. Percent change in market income caused by taxes and transfers, Brazil 2009
Table 5. Percent change in market income caused by taxes and transfers, United States 2011
Finally, Engel, Galetovich, and Raddatz (1999) show that the higher initial income inequality
is—and it is much higher in Brazil than in the US—the more difficult it is to reduce income
inequality through progressive taxes and transfers. In sum, Brazil achieves much less redistribution
than the US due to a combination of factors: its direct taxes are both considerably smaller as a
percent of GDP and considerably less progressive, its highly progressive direct transfer programs are
small while its larger direct transfer programs are less progressive, and it begins with a more unequal
market income distribution.
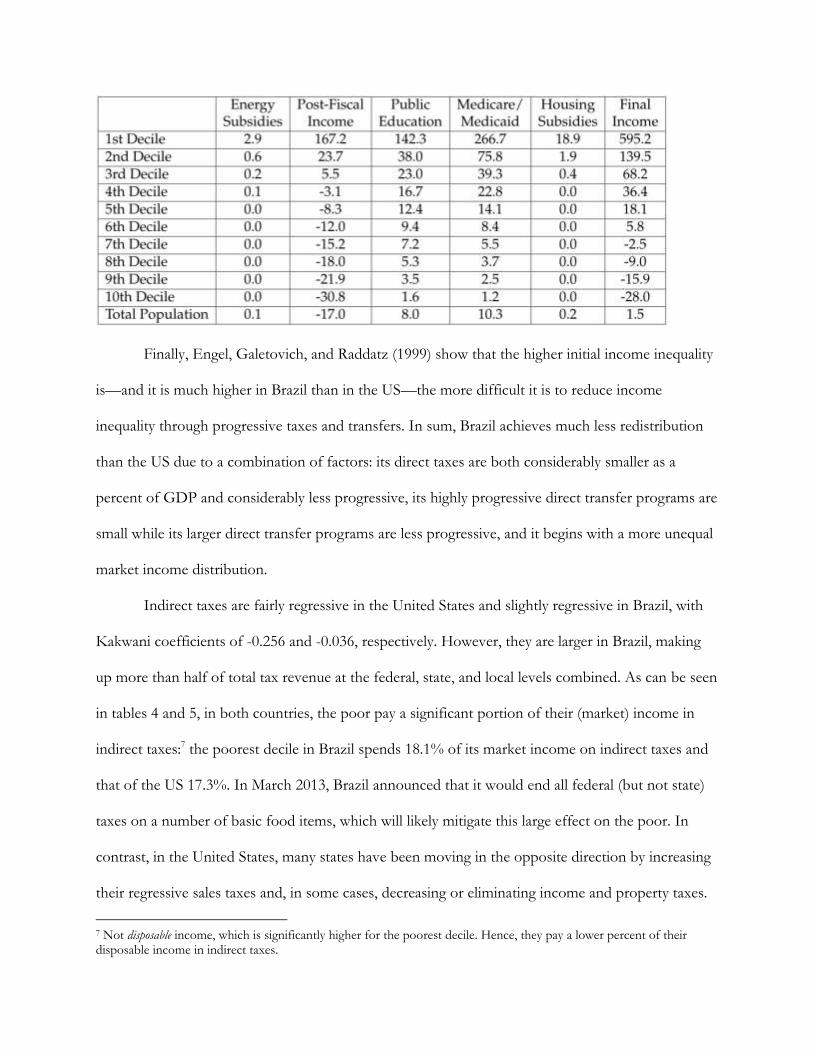
Indirect taxes are fairly regressive in the United States and slightly regressive in Brazil, with
Kakwani coefficients of -0.256 and -0.036, respectively. However, they are larger in Brazil, making
up more than half of total tax revenue at the federal, state, and local levels combined. As can be seen
in tables 4 and 5, in both countries, the poor pay a significant portion of their (market) income in
indirect taxes:7 the poorest decile in Brazil spends 18.1% of its market income on indirect taxes and
that of the US 17.3%. In March 2013, Brazil announced that it would end all federal (but not state)
taxes on a number of basic food items, which will likely mitigate this large effect on the poor. In
contrast, in the United States, many states have been moving in the opposite direction by increasing
their regressive sales taxes and, in some cases, decreasing or eliminating income and property taxes.
7 Not disposable income, which is significantly higher for the poorest decile. Hence, they pay a lower percent of their disposable income in indirect taxes.
These sales taxes place a large burden on the poor, and not only financially: Newman and O’Brien
(2011) exploit intra-state variation over time in the tax burden on the poor (in the US) and find that
a higher tax burden on the poor has a statistically and economically significant impact on mortality,
obesity, and violent crime.
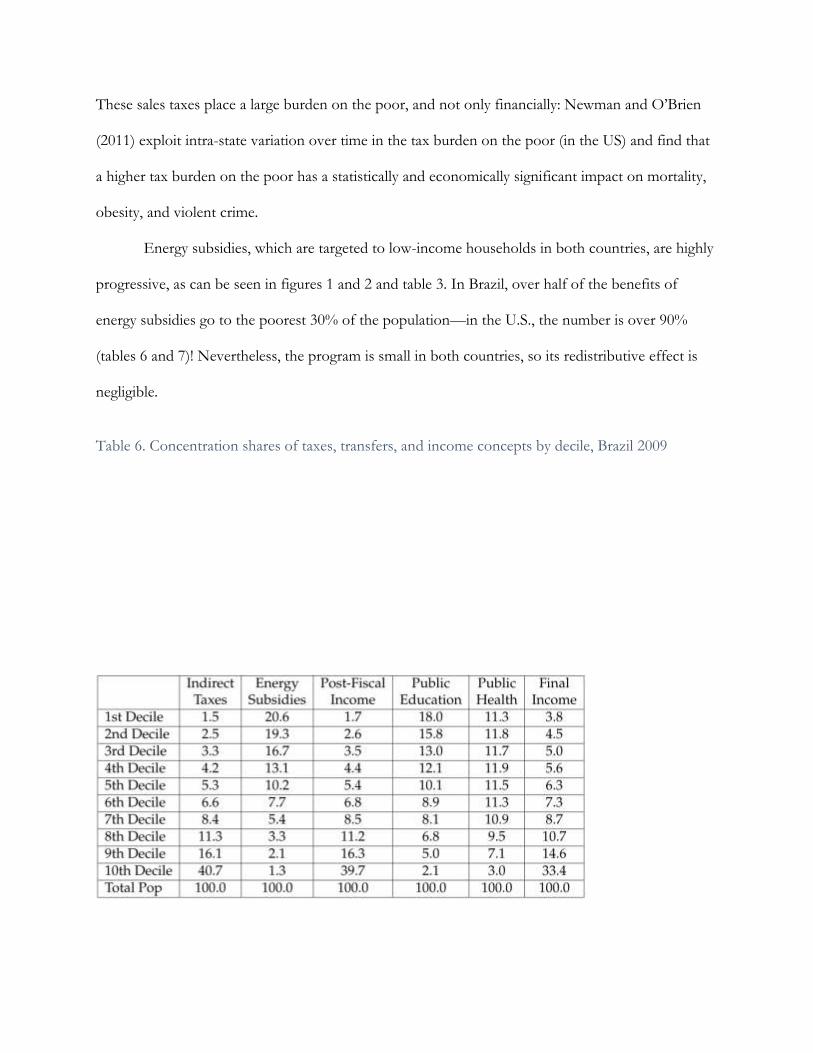
Energy subsidies, which are targeted to low-income households in both countries, are highly
progressive, as can be seen in figures 1 and 2 and table 3. In Brazil, over half of the benefits of
energy subsidies go to the poorest 30% of the population—in the U.S., the number is over 90%
(tables 6 and 7)! Nevertheless, the program is small in both countries, so its redistributive effect is
negligible.
Table 6. Concentration shares of taxes, transfers, and income concepts by decile, Brazil 2009
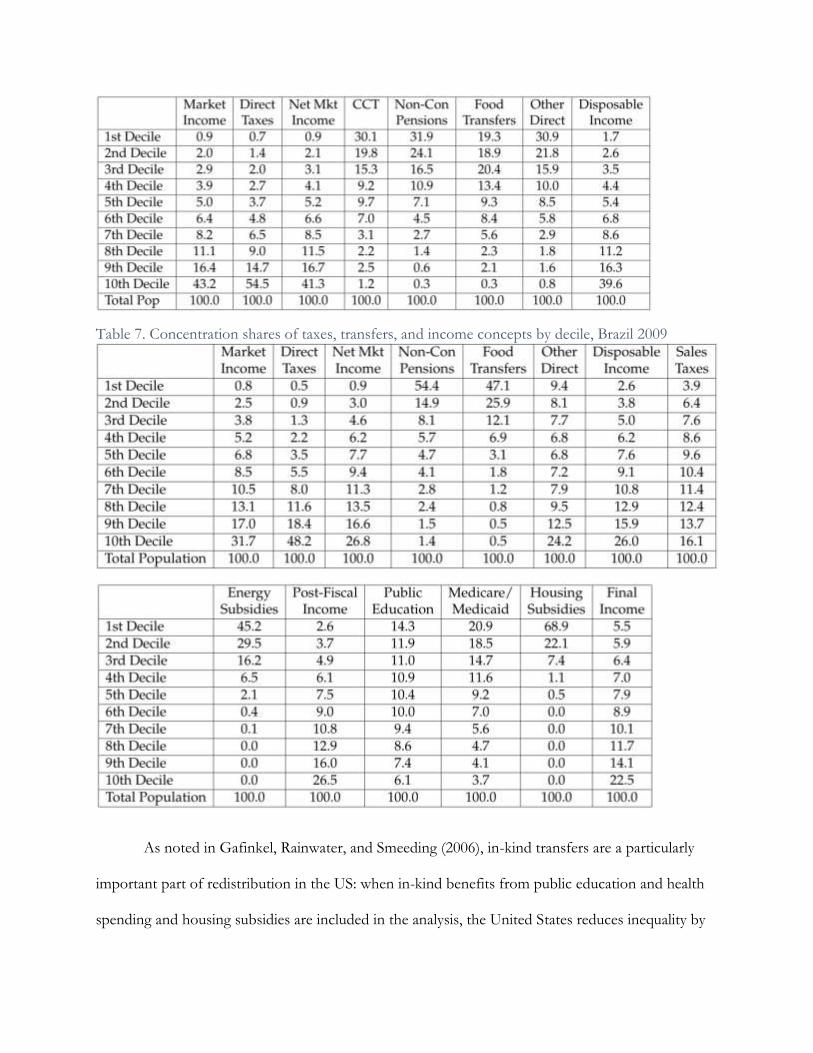
Table 7. Concentration shares of taxes, transfers, and income concepts by decile, Brazil 2009
As noted in Gafinkel, Rainwater, and Smeeding (2006), in-kind transfers are a particularly
important part of redistribution in the US: when in-kind benefits from public education and health
spending and housing subsidies are included in the analysis, the United States reduces inequality by

16.3 percentage points, from a market income Gini of 45.4 to a final income Gini of 29.1. Of this
16.3 point reduction, 8.1 percentage points are due to spending on education, health, and housing.
In Brazil as well, health and education spending is an important redistributive instrument: the
reduction between the market and final income Ginis is 14.9 percentage points, and the bulk of that
reduction—11.2 percentage points (compared to 8.1 in the US)—occurs when moving from post-
fiscal to final income (i.e., when adding health and education transfers). All three categories of public
health spending that we are able to analyze—preventative care, basic care, and inpatient care—are
progressive in absolute terms. Non-tertiary education spending has a Kakwani index of 0.821;
although we use non-tertiary education spending in this analysis to maintain comparability with the
U.S., even when it is included spending education remains progressive in absolute terms. We do not
include housing subsidies in our analysis for Brazil because the country’s main low-income housing
program, Minha Casa Minha Vida, did not exist at the time of the survey.
3.2 Poverty Reduction
Despite collecting sufficient revenue, neither the US nor Brazil are able to eliminate poverty.
Here, we use the Commitment to Equity diagnostic framework (Lustig, 2013)—designed to help
practitioners determine why poverty is not eliminated after transfers—to explore the question of
why for the US;8 this answers to this question for Brazil are discussed in Higgins and Pereira
(forthcoming) and rigorously analyzed using a diagnostic questionnaire in Lustig and Higgins
(forthcoming). Their main conclusions are that transfers to the nonpoor are too large (since the
poor receive a share of direct transfers approximately equal to, but not greater than, their
population), coverage of the poor is not universal (15% of the poor are not covered by at least one
8 Led by Nora Lustig, Commitment to Equity (CEQ) is a project of the Center for Inter-American Policy and Research and the Department of Economics at Tulane University and the Inter-American Dialogue. (http://www.commitmentoequity.org)
direct transfer program), and transfers are too small (the average transfer size per poor beneficiary is
less than the average poverty gap).
Driessen, Higgins, and Ruble (2013) show that the US is able to nearly eliminate poverty for
the poorest of the poor (those living on less than $4 per day [in 2005 dollars], which is a poverty line
frequently used for middle income countries, e.g. by CEDLAS and the World Bank [2012]).
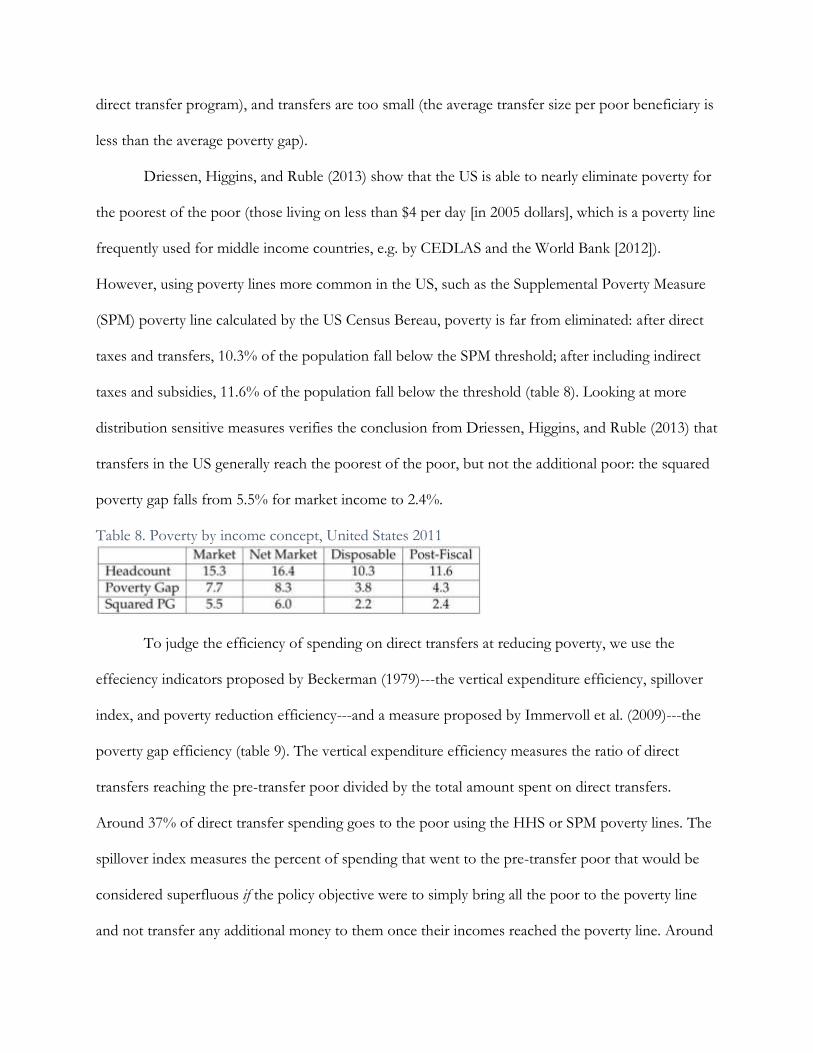
However, using poverty lines more common in the US, such as the Supplemental Poverty Measure
(SPM) poverty line calculated by the US Census Bereau, poverty is far from eliminated: after direct
taxes and transfers, 10.3% of the population fall below the SPM threshold; after including indirect
taxes and subsidies, 11.6% of the population fall below the threshold (table 8). Looking at more
distribution sensitive measures verifies the conclusion from Driessen, Higgins, and Ruble (2013) that
transfers in the US generally reach the poorest of the poor, but not the additional poor: the squared
poverty gap falls from 5.5% for market income to 2.4%.
Table 8. Poverty by income concept, United States 2011
To judge the efficiency of spending on direct transfers at reducing poverty, we use the
effeciency indicators proposed by Beckerman (1979)---the vertical expenditure efficiency, spillover
index, and poverty reduction efficiency---and a measure proposed by Immervoll et al. (2009)---the
poverty gap efficiency (table 9). The vertical expenditure efficiency measures the ratio of direct
transfers reaching the pre-transfer poor divided by the total amount spent on direct transfers.
Around 37% of direct transfer spending goes to the poor using the HHS or SPM poverty lines. The
spillover index measures the percent of spending that went to the pre-transfer poor that would be
considered superfluous if the policy objective were to simply bring all the poor to the poverty line
and not transfer any additional money to them once their incomes reached the poverty line. Around
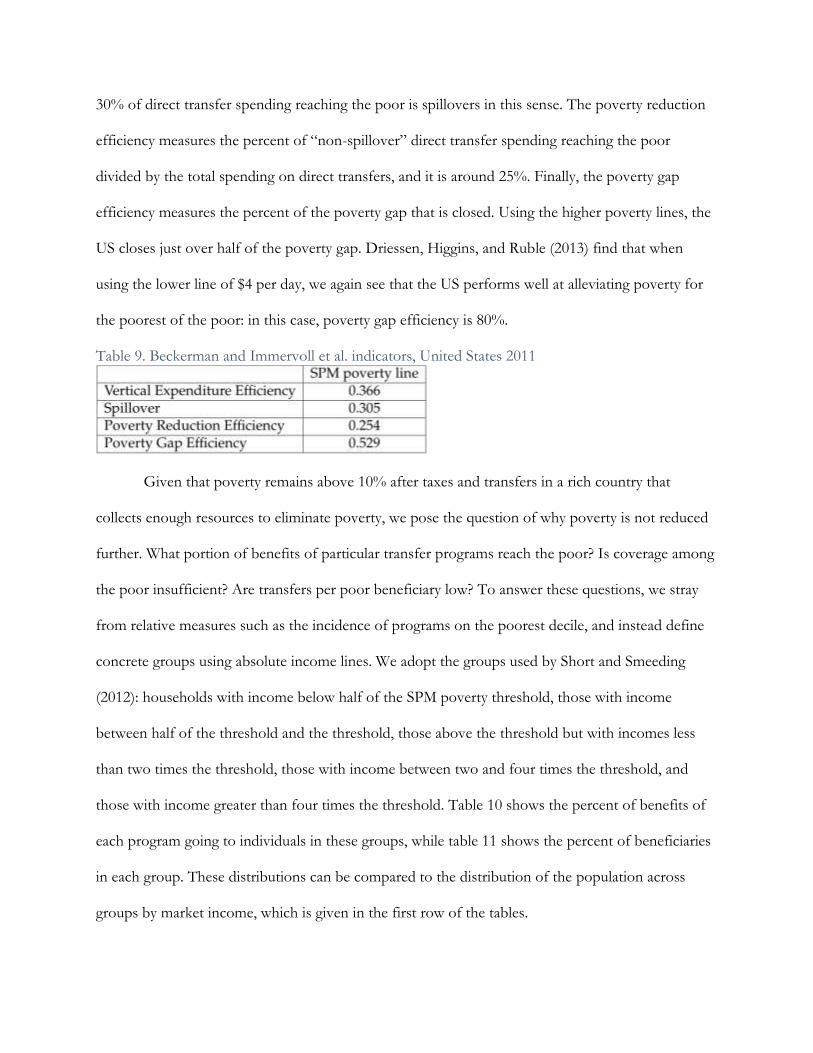
30% of direct transfer spending reaching the poor is spillovers in this sense. The poverty reduction
efficiency measures the percent of “non-spillover” direct transfer spending reaching the poor
divided by the total spending on direct transfers, and it is around 25%. Finally, the poverty gap
efficiency measures the percent of the poverty gap that is closed. Using the higher poverty lines, the
US closes just over half of the poverty gap. Driessen, Higgins, and Ruble (2013) find that when
using the lower line of $4 per day, we again see that the US performs well at alleviating poverty for
the poorest of the poor: in this case, poverty gap efficiency is 80%.
Table 9. Beckerman and Immervoll et al. indicators, United States 2011
Given that poverty remains above 10% after taxes and transfers in a rich country that
collects enough resources to eliminate poverty, we pose the question of why poverty is not reduced
further. What portion of benefits of particular transfer programs reach the poor? Is coverage among
the poor insufficient? Are transfers per poor beneficiary low? To answer these questions, we stray
from relative measures such as the incidence of programs on the poorest decile, and instead define
concrete groups using absolute income lines. We adopt the groups used by Short and Smeeding
(2012): households with income below half of the SPM poverty threshold, those with income
between half of the threshold and the threshold, those above the threshold but with incomes less
than two times the threshold, those with income between two and four times the threshold, and
those with income greater than four times the threshold. Table 10 shows the percent of benefits of
each program going to individuals in these groups, while table 11 shows the percent of beneficiaries
in each group. These distributions can be compared to the distribution of the population across
groups by market income, which is given in the first row of the tables.
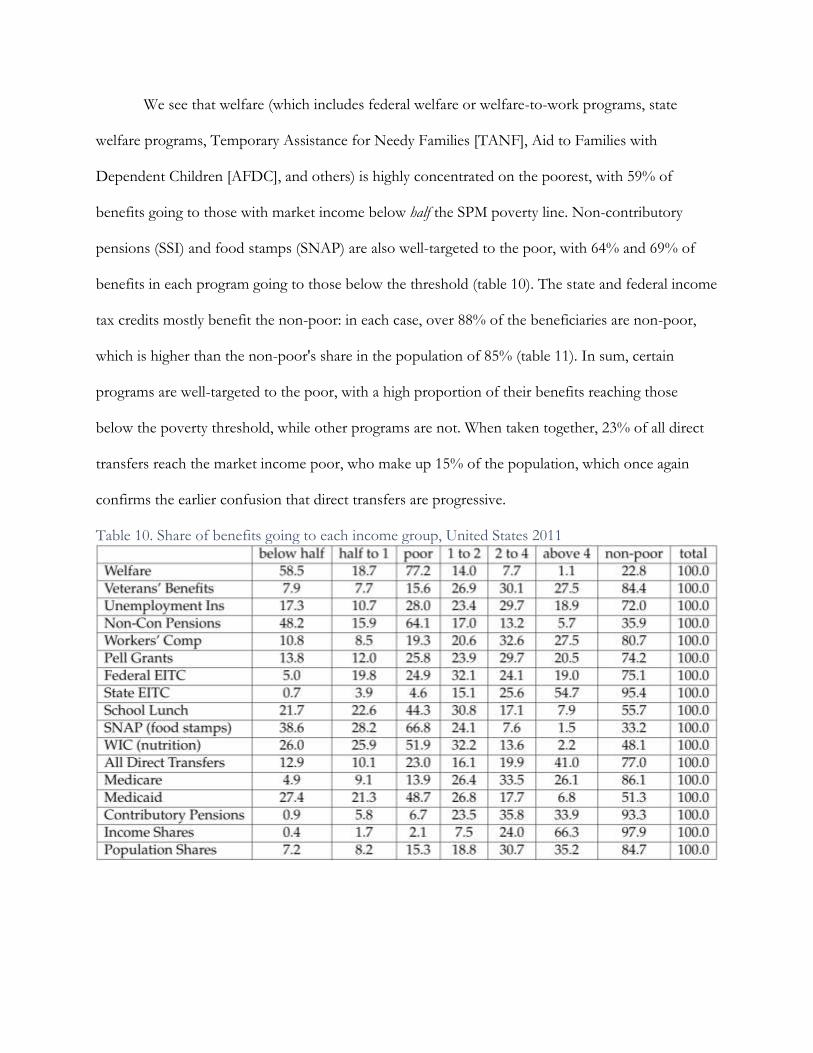
We see that welfare (which includes federal welfare or welfare-to-work programs, state
welfare programs, Temporary Assistance for Needy Families [TANF], Aid to Families with
Dependent Children [AFDC], and others) is highly concentrated on the poorest, with 59% of
benefits going to those with market income below half the SPM poverty line. Non-contributory
pensions (SSI) and food stamps (SNAP) are also well-targeted to the poor, with 64% and 69% of
benefits in each program going to those below the threshold (table 10). The state and federal income
tax credits mostly benefit the non-poor: in each case, over 88% of the beneficiaries are non-poor,
which is higher than the non-poor's share in the population of 85% (table 11). In sum, certain
programs are well-targeted to the poor, with a high proportion of their benefits reaching those
below the poverty threshold, while other programs are not. When taken together, 23% of all direct
transfers reach the market income poor, who make up 15% of the population, which once again
confirms the earlier confusion that direct transfers are progressive.
Table 10. Share of benefits going to each income group, United States 2011
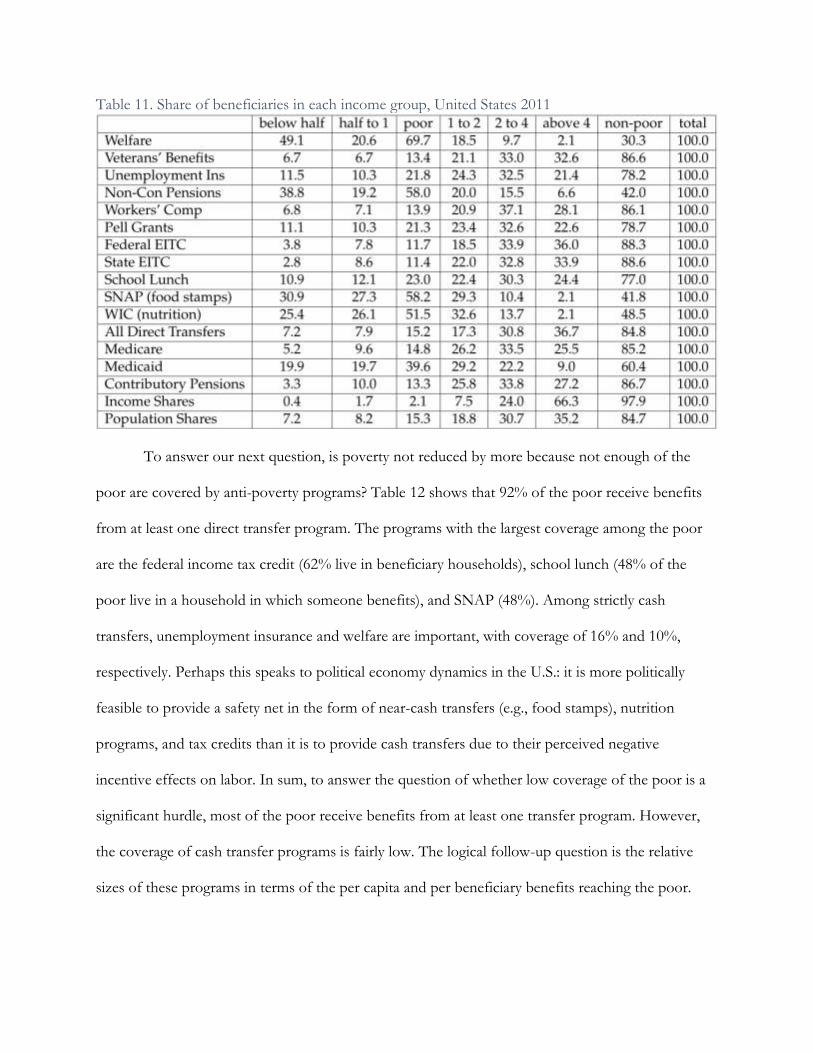
Table 11. Share of beneficiaries in each income group, United States 2011
To answer our next question, is poverty not reduced by more because not enough of the
poor are covered by anti-poverty programs? Table 12 shows that 92% of the poor receive benefits
from at least one direct transfer program. The programs with the largest coverage among the poor
are the federal income tax credit (62% live in beneficiary households), school lunch (48% of the
poor live in a household in which someone benefits), and SNAP (48%). Among strictly cash
transfers, unemployment insurance and welfare are important, with coverage of 16% and 10%,
respectively. Perhaps this speaks to political economy dynamics in the U.S.: it is more politically
feasible to provide a safety net in the form of near-cash transfers (e.g., food stamps), nutrition
programs, and tax credits than it is to provide cash transfers due to their perceived negative
incentive effects on labor. In sum, to answer the question of whether low coverage of the poor is a
significant hurdle, most of the poor receive benefits from at least one transfer program. However,
the coverage of cash transfer programs is fairly low. The logical follow-up question is the relative
sizes of these programs in terms of the per capita and per beneficiary benefits reaching the poor.
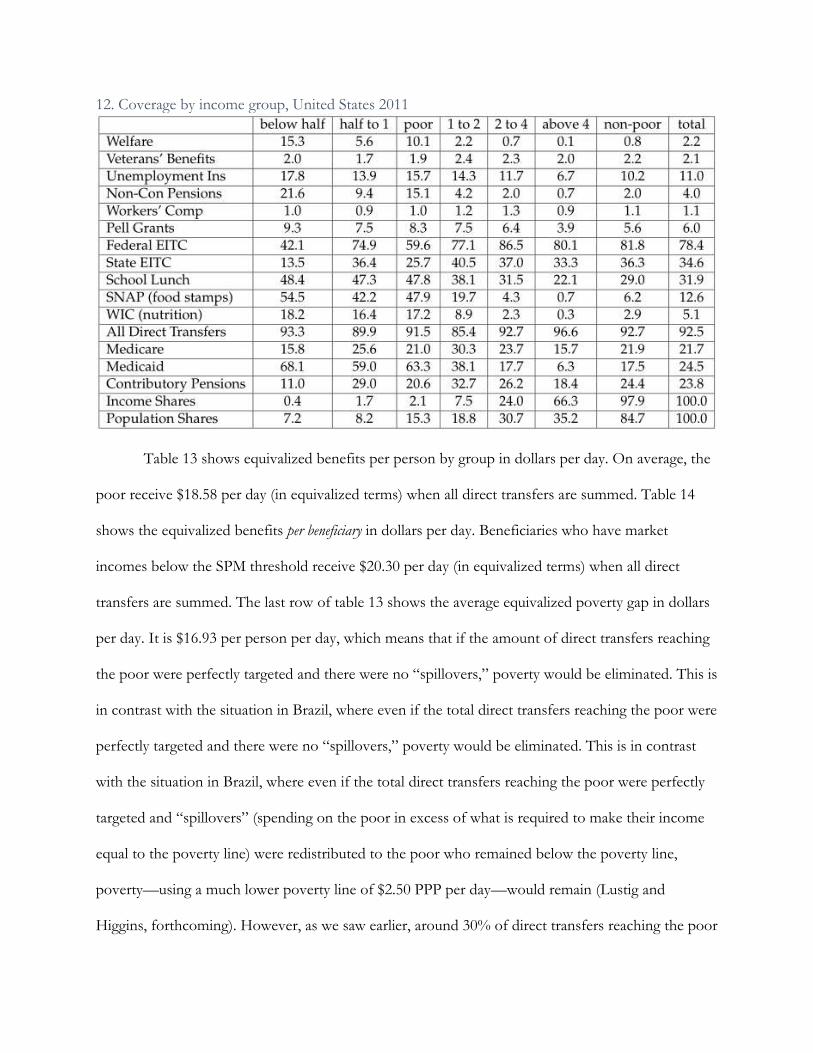
12. Coverage by income group, United States 2011
Table 13 shows equivalized benefits per person by group in dollars per day. On average, the
poor receive $18.58 per day (in equivalized terms) when all direct transfers are summed. Table 14
shows the equivalized benefits per beneficiary in dollars per day. Beneficiaries who have market
incomes below the SPM threshold receive $20.30 per day (in equivalized terms) when all direct
transfers are summed. The last row of table 13 shows the average equivalized poverty gap in dollars
per day. It is $16.93 per person per day, which means that if the amount of direct transfers reaching
the poor were perfectly targeted and there were no “spillovers,” poverty would be eliminated. This is
in contrast with the situation in Brazil, where even if the total direct transfers reaching the poor were
perfectly targeted and there were no “spillovers,” poverty would be eliminated. This is in contrast
with the situation in Brazil, where even if the total direct transfers reaching the poor were perfectly
targeted and “spillovers” (spending on the poor in excess of what is required to make their income
equal to the poverty line) were redistributed to the poor who remained below the poverty line,
poverty—using a much lower poverty line of $2.50 PPP per day—would remain (Lustig and
Higgins, forthcoming). However, as we saw earlier, around 30% of direct transfers reaching the poor

are “spillovers” and around 9% of the poor are entirely excluded from the safety net, explaining why
poverty remains despite sufficient funding.
13. Equivalized benefits per person per day by income group, United States 2011
14. Equivalized benefits per beneficiary per day by income group, United States 2011
References
Atkinson, Anthony B., Lee Rainwater, and Timothy M. Smeeding. 1995. Income distribution in
OECD countries: Evidence from the Luxembourg Income Study (LIS). Social Policy Studies
No. 18. Paris: Organization for Economic Cooperation and Development.
Barros, Ricardo, Mirela de Carvalho, Samuel Franco, and Rosane Mendonça. 2010. Markets, the
state, and the dynamics of inequality in Brazil. In Declining Inequality in Latin America: a
Decade of Progress?, Luis F. López-Calva and Nora Lustig, eds., 134-174. Washington,
D.C.: Brookings Institution Press.
Beckerman, Wilfred. 1979. “The impact of income maintenance payments on poverty in Britain,
1975. Economic Journal 89, 261-279.
CEDLAS (Centro de Estudios Distributivos, Laborales y Sociales) and World Bank. 2012. A guide
to the SEDLAC Socio-Economic Database for Latin America and the Caribbean.
http://sedlac.econo.unlp.edu.ar/download.php?file=archivos_upload_items_metodologia/
Guide_14_english.pdf
Corbacho, Ana, Vicente Fretes Cibils, and Eduardo Lora, eds. 2013. More than Revenue: Taxation
as a Development Tool. New York: Palgrave Macmillan.
Driessen, Grant, Sean Higgins, and Whitney Ruble. 2013. The incidence of taxes and transfers in the
United States. Mimeo.
Engel, Eduardo M. R. A., Alexander Galetovic, and Claudio E. Raddatz. 1999. Taxes and income
redistribution in Chile: some unpleasant redistributive arithmetic. Journal of Development
Economics 59: 155-192.
Ferreira, Francisco H. G., Phillippe G. Leite, and Julie A. Litchfield. 2008. The rise and fall of
Brazilian inequality: 1981-2004. Macroeconomic Dynamics 12 (2): 199-230.
Garfinkel, Irwin, Lee Rainwater, and Timothy M. Smeeding. 2006. A re-examination of welfare
states and inequality in rich nations: how in-kind transfers and indirect taxes change the
story. Journal of Policy Analysis and Management 25 (4): 897-919.
Goñi, Edward, J. Humberto López, and Luis Servén. 2011. Fiscal redistribution and income
inequality in Latin America. World Development 39 (9): 1558-1569.
Higgins, Sean and Claudiney Pereira. Forthcoming. The effects of Brazil’s taxation and social
spending on the distribution of household income. Public Finance Review.
Immervoll, Herwig, Horacio Levy, Jose Ricardo Nogueira, Cathal O’ Donoghue, and Rozane
Bezerra Siqueira. 2009. The impact of Brazil’s tax-benefit system on inequality and poverty.
In Klasen, Stephan and Nowak-Lehmann, Felicitas, eds., Poverty, Inequality, and Policy in
Latin Americ. MIT Press.
Kakwani, N.C. 1977. Measurement of tax progressivity: an international comparison.” The
Economic Journal 87 (345): 71-80.
Kim, Kinam and Peter J. Lambert. 2009. Redistributive effect of U.S. taxes and public transfers,
1994-2004. Public Finance Review 37 (1): 3-26.
Lambert, Peter. 1985. On the redistributive effect of taxes and benefits. Scottish Journal of Political
Economy 32 (1): 39-54.
_____. 2002. The Distribution and Redistribution of Income: Third Edition. Manchester United
Kingdom: Manchester University Press.
Lustig, Nora and Sean Higgins. Forthcoming. Commitment to Equity: A diagnostic framework to
assess governments’ fiscal policy. In Ravi Kanbur, Changyong Rhee, and Juzhong Zhuang,
eds., Inequality in East Asia and the Pacific. Routledge.
Lustig, Nora and Sean Higgins. 2013. Commitment to Equity (CEQ): Estimating the incidence of
social spending, subsidies, and taxes handbook. CEQ Working Paper No. 1.
http://www.commitmentoequity.org/publications_files/Methodology/CEQWPNo1%20Ha
ndbook%20Jan%202013.pdf
Lustig, Nora, Luis Felipe López-Calva, and Eduardo Ortiz-Juárez. 2013. Declining inequlaity in
Latin America in the 2000s: The cases of Argentina, Brazil, and Mexico. World Development
44 (1): 129-141.
Lustig, Nora, Carola Pessino, and John Scott. Forthcoming. The impact of taxes and social spending
on inequality and poverty in Argentina, Bolivia, Brazil, Mexico, Peru and Uruguay. Public
Finance Review.
Newman, Katherine and Rourke O’Brien. 2011. Taxing the Poor: Doing Damage to the Truly
Disadvantaged. Berkeley: University of California Press.
OECD (Organization for Economic Cooperation and Development). 2011. Divided We Stand: Why
Inequality Keeps Rising. OECD Publishing.
Short, Kathleen and Timothy Smeeding. 2012. Understanding income-to-threshold ratios using the
Supplemental Poverty Measure. U.S. Census Bureau SEHSD Working Paper.
Related Documents