Company Update June 2014 Starwood Waypoint Residential Trust (NYSE: SWAY) acquires, renovates, leases, maintains and manages single family homes. We also invest in non-performing loans to supplement growth and seek optimal resolutions for each loan by working with interested and qualified borrowers to find the most appropriate solutions to keep them in their home or, alternatively, converting loans into homes for rent or sale. We are focused on building a leading, nationally recognized brand based on a foundation of respect for our residents and the communities in which we operate. Our mission is to reinvent the home rental experience by providing quality homes, great service and rewarding lease programs that offer valuable benefits to our residents while generating attractive returns for our investors.

Welcome message from author
This document is posted to help you gain knowledge. Please leave a comment to let me know what you think about it! Share it to your friends and learn new things together.
Transcript

Company UpdateJune 2014
Starwood Waypoint Residential Trust (NYSE: SWAY) acquires, renovates, leases, maintains and managessingle family homes. We also invest in non-performing loans to supplement growth and seek optimalresolutions for each loan by working with interested and qualified borrowers to find the mostappropriate solutions to keep them in their home or, alternatively, converting loans into homes for rentor sale. We are focused on building a leading, nationally recognized brand based on a foundation ofrespect for our residents and the communities in which we operate. Our mission is to reinvent the homerental experience by providing quality homes, great service and rewarding lease programs that offervaluable benefits to our residents while generating attractive returns for our investors.

The statements herein that are not historical facts are forward-looking statements within the meaning of Section 27A of the Securities Act of 1933, asamended, and Section 21E of the Securities Exchange Act of 1934, as amended. These forward-looking statements are based on current expectations, estimates and projections about the industry and markets in which we operate, management’s beliefs and assumptions made by management. Such statements involve uncertainties that could significantly impact our financial results. Words such as “expects,” “anticipates,” “ intends,” “plans,” “believes,” “seeks,” “estimates,” variations of such words and similar expressions are intended to identify such forward-looking statements, which generally are not historical in nature. All statements that address operating performance, events or developments that we expect or anticipate will occur in the future — including statements relating to rent and occupancy growth, acquisition and disposition activity, renovation activity, general conditions in the geographic areas where we operate, our debt and financial position — are forward-looking statements. These statements are not guarantees of future performance and involve certain risks, uncertainties and assumptions that are difficult to predict. Although we believe the expectations reflected in any forward-looking statements are based on reasonable assumptions, we can give no assurance that our expectations will be attained and therefore, actual outcomes and results may differ materially from what is expressed or forecasted in such forward-looking statements. Some of the factors that may affect outcomes and results include, but are not limited to: (i) national, regional and local economic climates; (ii) changes in financial markets, and interest rates; (iii) increased or unanticipated competition for our homes; (iv) risks associated with acquisitions, dispositions and renovation of homes; (v) maintenance of REIT status and tax structuring; (vi) availability of financing and capital, the levels of debt that we maintain and our credit ratings; (vii) risks related to our investments in distressed and non-performing residential mortgage loans; (viii) environmental uncertainties, including risks of natural disasters; and (ix) those additional factors discussed in reports filed with the Securities and Exchange Commission by us under the heading “Risk Factors.” We undertake no duty to update any forward-looking statements appearing herein.
Forward Looking Statements
2

Market Overview

4
Favorable Demand/Supply Fundamentals
The single-family rental sector constitutes about one-third of total rental households. Many single-family homes are potential rental properties, including existing vacant homes, existing single-family rentals and non-performing loans.
Total Rental Homes (millions) Non-Current As % of Total Mortgages
2.7% 3.2%
1.0%0.7%
2.4%0.8%
2.7%
1.0%
0.0%
1.0%
2.0%
3.0%
4.0%
5.0%
6.0%
7.0%
8.0%
9.0%
10.0%
1Q14 Normal (1995-2005)
Pre-REO Foreclosure
90 Days Delinquent
60 DaysDelinquent
30 Days Delinquent
Differential equates to approximately
1.6 million mortgagesas of 1Q14
About 19% of US homeowners with mortgages remain underwater at Q1
The number of distressed mortgages remains well above historic norms.
Sources: Zelman & Associates Equity Research (March 2014), Zillow
8.8%
5.7%
4.5 million
2.9 million
14.4
12.3
12.7
1.9
1-unit
2-9 units:
10+ units
Other
Total 41.3 million rental homes
Continued constraints on home mortgage financing
Over $1 trillion in student debt
Increasing numbers of renters by choice
Key Demand Drivers

5
Single-Family vs. Multi-Family REITs
Note: Multi-Family REITs include AEC, AIV, AVB, CPT, EQR, ESS, HME, MAA, PPS, UDR, ELS, SUI, ACC, CCG and EDR. Single-Family Rental REITs include AMH, RESI, SBY ARPI and SWAY.(1) Market data from SNL as of 5/24/2014. Multi-Family market cap includes all publicly traded REITs listed above.(2) Represents physical occupancy at Q1 2014. Multi-Family REITs weighted by total assets and include only U.S. Apartment REITs. SWAY data represents stabilized portfolio. Waypoint data is legacy 2012-2013 average.(3) Multi-Family REIT data as of Q2 2013 from Green Street Advisors.(4) Multi-Family REIT data as of Q2 2013 from Green Street Advisors. Waypoint data based on legacy 2012-2013 average.Sources: Green Street Advisors, Company Data and SNL Financial.
Market Size (1) Occupancy (2)
Gross Turnover (3) NOI Margin (4)
57.5%
~30.0%
0%
10%
20%
30%
40%
50%
60%
70%Multi-Family REITs
SWAY
95.6% 96.4%95.0%
70%
75%
80%
85%
90%
95%
100%Multi-Family REITs
SWAY
Waypoint
62.0% 60.3% 62.5%
0%
20%
40%
60%
80%
100%
Multi-Family REITs
SWAY
Waypoint
~$93 bn
~$6bn
$0
$20
$40
$60
$80
$100
Multi-Family REITs
SFR
($ in billions)

About Starwood Waypoint
Two Market Leaders…Combined
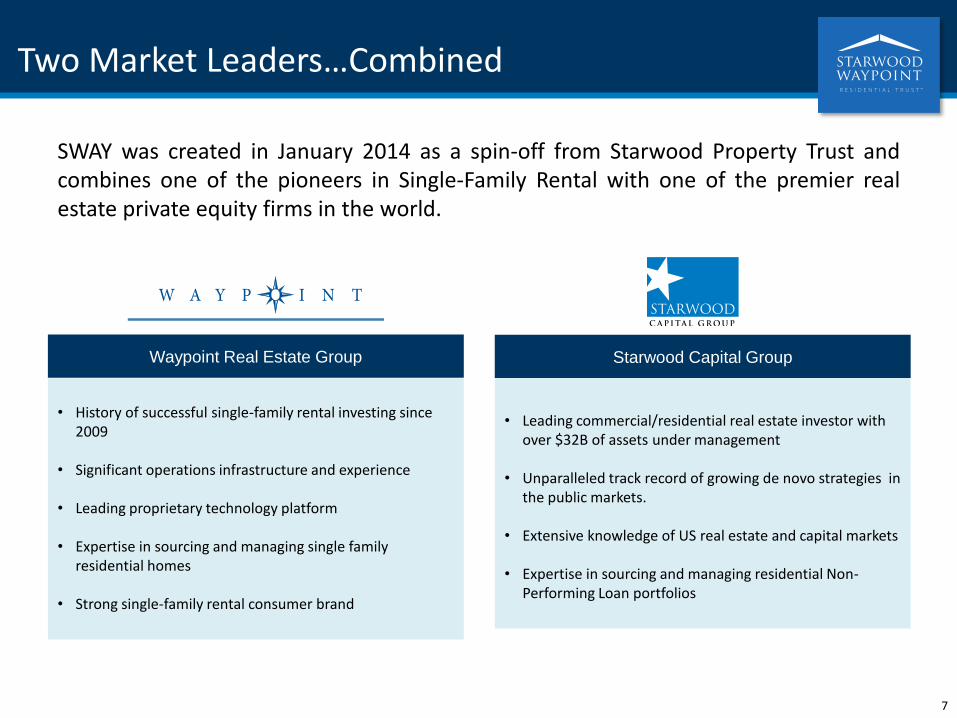
• Leading commercial/residential real estate investor with over $32B of assets under management
• Unparalleled track record of growing de novo strategies in the public markets.
• Extensive knowledge of US real estate and capital markets
• Expertise in sourcing and managing residential Non-Performing Loan portfolios
• History of successful single-family rental investing since 2009
• Significant operations infrastructure and experience
• Leading proprietary technology platform
• Expertise in sourcing and managing single family residential homes
• Strong single-family rental consumer brand
Starwood Capital GroupWaypoint Real Estate Group
SWAY was created in January 2014 as a spin-off from Starwood Property Trust andcombines one of the pioneers in Single-Family Rental with one of the premier realestate private equity firms in the world.
7
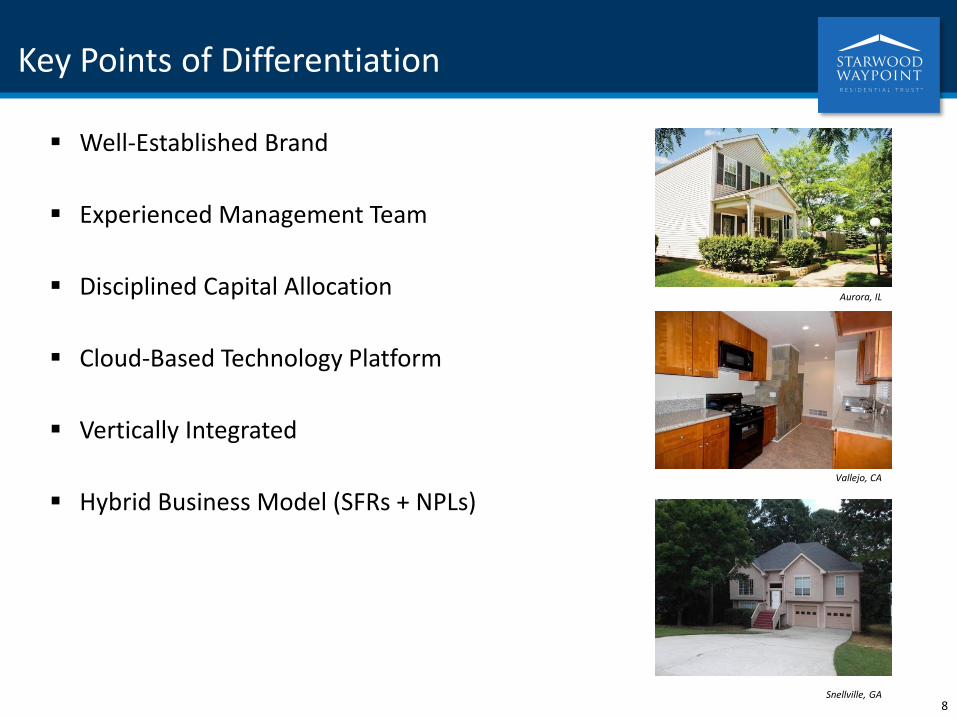
Key Points of Differentiation
Well-Established Brand
Experienced Management Team
Disciplined Capital Allocation
Cloud-Based Technology Platform
Vertically Integrated
Hybrid Business Model (SFRs + NPLs)
8
Aurora, IL
Vallejo, CA
Snellville, GA
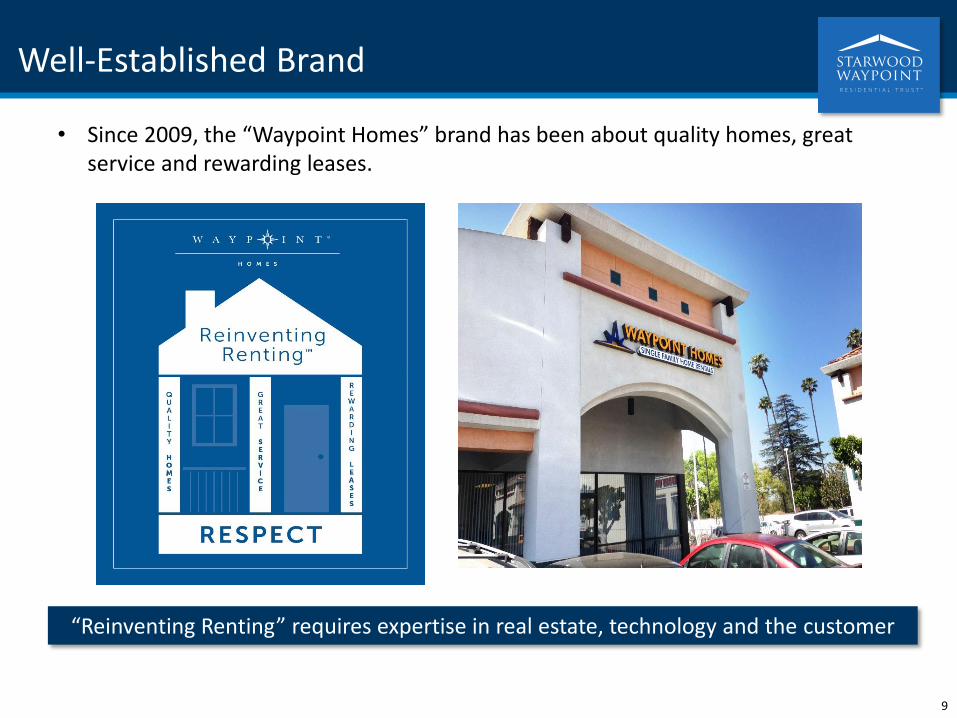
Well-Established Brand
• Since 2009, the “Waypoint Homes” brand has been about quality homes, great service and rewarding leases.
“Reinventing Renting” requires expertise in real estate, technology and the customer
9

Seasoned Executive Management Team
10
Barry Sternlicht
Chairman
– Starwood Capital Group (Chairman & CEO), Starwood Property Trust (Chairman & CEO), Société du Louvre (Chairman of the Board), Starwood Hotels & Resorts Worldwide, Inc. (former Chairman & CEO)
– Brown University (BA with honors, magna cum laude), Harvard Business School (MBA with distinction)
Gary BeasleyCo-Chief Executive Officer
– Geolo Capital (Partner), Joie de vivre Hotels (CEO), GreenVolts (President & CEO), ZipRealty (President & CFO), LaSalle Partners and Security Capital Group, KSL Resorts (VP of Acquisitions)
– Northwestern University (BA), Stanford Graduate School of Business (MBA)
Doug BrienCo-Chief Executive Officer
To Com
– Waypoint Homes (Co-Founder), Redwood Capital Management Group (Managing Partner); 15 years of real estate investing experience
– 12 years as NFL place kicker, 49ers Super Bowl Champion, Saints Team Captain, USOC Ethics Committee
– UC Berkeley (BA), Tulane University (MBA)
Colin WielChief Investment Officer
– Waypoint Homes (Co-Founder), Milo (Founder of e-commerce software engineering firm); 21 years of investment and real estate experience
– UC Berkeley (BS in Mechanical Engineering)
Nina TranChief Financial Officer
– Prologis, Inc. (Chief Global Process Officer), AMB Property Corporation (Chief Accounting Officer), PricewaterhouseCoopers (Senior Associate), Certified Public Accountant
– UC Davis and California State University, Hayward (BA), Stanford Executive Program
Scott GableChief Operating Officer
– Wells Fargo (EVP of Home & Consumer Finance Group), Hercules Technology Growth Capital (COO), United Commercial Bank (Head of Bank Operations), Booz Allen Hamilton (Consultant)
– Stanford (AB), Harvard Business School (MBA)
Ali NazarChief Technology Officer
– SalesTeamLive (Co-found, VP of Product Development), Digital Island/Cable & Wireless (Director of Product Management)
– UC Davis (BS)
Tamra BrowneChief Legal Officer
– AMB Property Corporation (SVP, General Counsel & Corporate Secretary), Morrison & Foerster LLP (corporate & securities attorney), Reid & Priest (corporate finance attorney)
– Middlebury College (BA), Stanford Law School (JD)
Charles YoungDivision Vice President -West
– Mesa Development (EVP), Goldman Sachs; 17 years of real estate development, investment and management experience
– Stanford University (AB and MBA)
David Zanaty
Division Vice President -East
– AIG Global Real Estate (VP of Development) CB Richard Ellis; 15 years of real estate investment and development experience
– Emory (BA), Georgia Tech (MS), Northwestern (MBA)
Southern California
Northern California
Denver
Dallas
Houston
Tampa Bay
Atlanta
Chicago
Orlando
South Florida
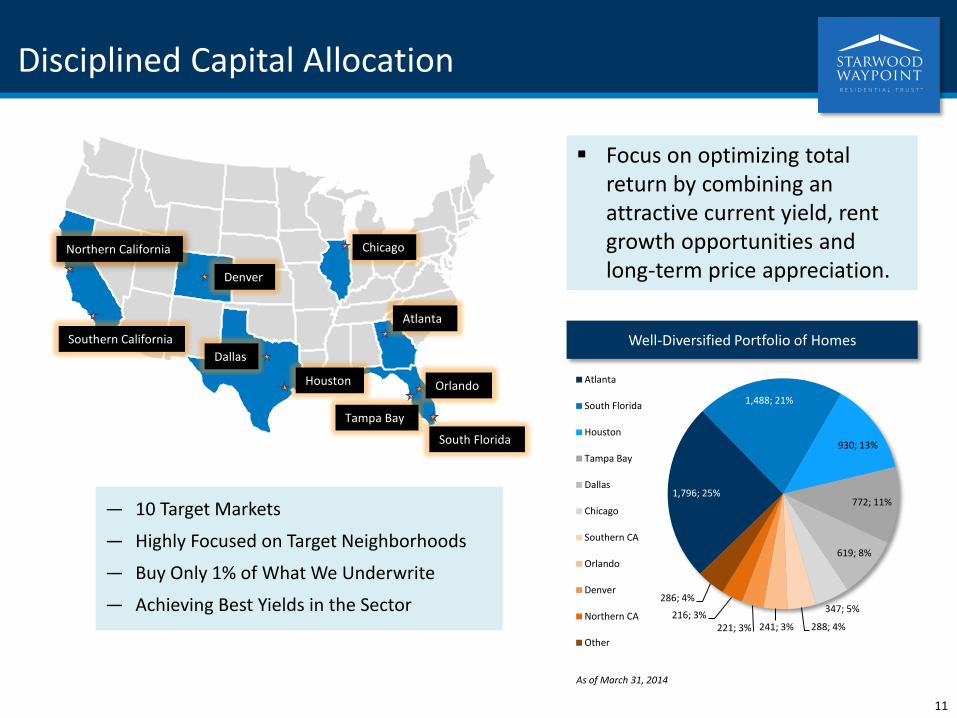
Disciplined Capital Allocation
— 10 Target Markets
— Highly Focused on Target Neighborhoods
— Buy Only 1% of What We Underwrite
— Achieving Best Yields in the Sector
1,796; 25%
1,488; 21%
930; 13%
772; 11%
619; 8%
347; 5%
288; 4%241; 3%221; 3%216; 3%
286; 4%
Atlanta
South Florida
Houston
Tampa Bay
Dallas
Chicago
Southern CA
Orlando
Denver
Northern CA
Other
Well-Diversified Portfolio of Homes
11
Focus on optimizing total return by combining an attractive current yield, rent growth opportunities and long-term price appreciation.
As of March 31, 2014

Compass: Our Cloud-Based Technology Platform
Achieving efficiencies using inexpensive and powerful cloud and mobile computing
Architecture designed for vertical integration
Sustainable and measurable competitive advantages
Culture of innovation a product of our Silicon Valley roots
Culture of Innovation
Resident Underwriting Algorithm 1.0
Learning Management System 1.0
Revenue Management System 1.0
Neighborhood Algorithm 1.0
Maintenance Resource Optimization Algorithm 1.0
Neighborhood Algorithm 2.0 & Electronic Leases
Compass Property Management Platform
Automated Metric Monitoring
Q4 2010
Q1 2011
Q1 2012
Q3 2012
Q1 2013
Q3 2013
Q4 2013
Q1 2014
12
Block-to-Block Intelligence Quality Control Field Closing Tools
Revenue Management Customer Service
Compass Drives Operating Efficiency and Scalability
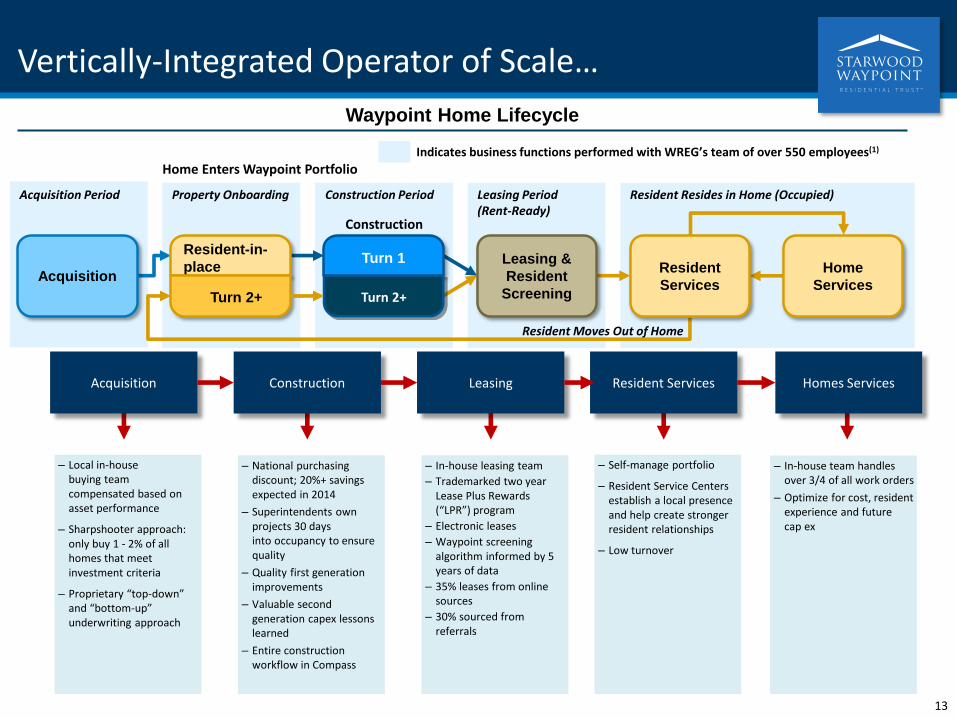
Vertically-Integrated Operator of Scale…
– Local in-house buying team compensated based on asset performance
– Sharpshooter approach: only buy 1 - 2% of all homes that meet investment criteria
– Proprietary “top-down” and “bottom-up” underwriting approach
– National purchasing discount; 20%+ savings expected in 2014
– Superintendents own projects 30 days into occupancy to ensure quality
– Quality first generation improvements
– Valuable second generation capex lessons learned
– Entire construction workflow in Compass
– In-house leasing team
– Trademarked two year Lease Plus Rewards (“LPR”) program
– Electronic leases
– Waypoint screening algorithm informed by 5 years of data
– 35% leases from online sources
– 30% sourced from referrals
– Self-manage portfolio
– Resident Service Centers establish a local presence and help create stronger resident relationships
– Low turnover
– In-house team handles over 3/4 of all work orders
– Optimize for cost, resident experience and futurecap ex
Acquisition Construction Leasing Resident Services Homes Services
13
Acquisition
Leasing &
Resident
Screening
Resident
Services
Home
Services
Construction
Turn 1
Turn 2+
Resident-in-
place
Turn 2+
Resident Resides in Home (Occupied)Leasing Period (Rent-Ready)
Construction Period
Home Enters Waypoint Portfolio
Property Onboarding
Indicates business functions performed with WREG’s team of over 550 employees(1)
Resident Moves Out of Home
Acquisition Period
Waypoint Home Lifecycle

…Supports Strong Leasing Activity
Longer leases, rent premium to market, and low voluntary turnover
— 75% of residents sign two-year leases
— Built-in 3% increase in Year 2
— 30% turnover and trending lower
Vertically integrated marketing
Proprietary rent pricing and promotions management system
Sophisticated resident screening based on 5 years of performance history
Historically lease 3% of total leads
14
93.6%96.3% 97.4%
65.1%
90.4% 92.2%
0%
20%
40%
60%
80%
100%
120%
Dec '13 Mar '14 April '14
Leased Homes 90 Days Past Initial Rent Ready
Leased Homes 180 Days or Longer
Lease Percentage of SFR Homes
Douglasville, GA

Hybrid Business Model
Acquiring properties through multiple channels while being dynamic and nimble in order to obtain the best risk-adjusted returns for shareholders
15
StabilityLeased Homes
Portfolio
Growth
Value-Add Development
Portfolio
Non-Performing Loans
Growing book of cash-flowing assets
Supports initiation of a dividend in the near future
Homes in renovation and lease-up phase
Provides meaningful upside opportunities to enhance value and downstream cash flow
Attractive channel to acquire single-family assets at 20-30% discount to Broker Price Opinion
Alternative resolutions generate high Return on Equity

Acquisition Activity

17
Targeted Home Selection Process
I. MSA
II. Neighborhood
III. Home
Rental yields
Expected job and economic growth
Projected Home Price Appreciation
Opportunity to achieve scale and concentration
Database of 400,000 neighborhoods
Focus on income, school quality, crime level
Proprietary “livability” analysis
Required risk-adjusted return
Accurate rent and capex underwriting
Meets required yield for MSA / neighborhood
Discount to Fair Market Value
Proprietary “livability” analysis
Local expertise

353 384 530 603
707
0
200
400
600
800
1,000
1,200
1,400
Jan 2014 Feb 2014 Mar 2014 Apr 2014
Portfolio Purchases
Single Asset Purchases
(1) Excludes 154 homes acquired through Prime Asset Fund VI, LLC (“Prime”) or other third-party managers that are not designated as rental homes.
Accelerating Acquisition Activity
Increasing supply of homes available for purchase
Sourcing from auctions, portfolios, one-off negotiated purchases
About one-third of NPL purchases convert to rental homes over time
Total Number of Rental Homes and NPLs (1)Total SFR Home Purchases (1)
18
1,7142,095
5,325
7,807
0
1,000
2,000
3,000
4,000
5,000
6,000
7,000
8,000
9,000
Dec '13 Apr '14
NPL SFR
Fort Worth, TXValrico, FL

19
NPL Strategy Generates Strong Returns
Targeted Total Return Avg. Timing
~ 1.25 – 1.40x5 – 9 months
7 – 15 months
Modifications (1)
(~ 5-10% of loans)
~ 1.25 – 1.35x
Note: Projections assume HPA at 5% per annum. Management estimates are not a guarantee of future results.(1) Assumes mortgage is held until refinance at 95% of value.(2) Average pool timeline (individual states vary from 3 – 30 months).
NPL acquisitions Short Payoffs(~ 5-10% of loans)
12 – 21 months ~ 1.20 – 1.30x Foreclosures /
Deeds-in-Lieu (2)
(~ 80-85% of loans)

20
Attractive Supply of Single Family Home NPLs
(US$bn)Total residential
mortgagesUS$ PD 90 days +
nonaccrual% PD 90 days +
nonaccrual
$340.7 $37.7 11.1%
340.6 35.3 10.4%
207.1 19.3 9.3%
125.6 9.2 7.3%
73.3 5.4 7.3%
51.8 3.8 7.4%
43.7 1.2 2.7%
41.2 1.4 3.3%
35.4 1.5 4.1%
$1,259.4 $114.8 9.1%
Top Banks by Residential Mortgage Exposure(1)
Other Potential Sources of NPLs
GSEs
Other Government Entities
(1) As of Q1-14. Source: Regulatory filings and SNL

Capital Management

Financial Flexibility
Strong and flexible balance sheet, with $770 million in undrawn debt capacity and commitments
Undrawn Capacity and Commitments:
$770 million
Drawn Capacity: $580 million
$500
$350
$500
$250
$0
$200
$400
$600
$800
$1,000
$1,200
$1,400
$1,600
$1,800
February: $500 millionsecured SFR facility (Citi)
March: $350 millionwarehouse NPL creditfacility (Deutsche Bank)
May: $500 million lendercommitments to upsizeSFR facility (syndication)
Future: $250 millionaccordion feature to SFRfacility syndication
Drawn Capacity
2014 Financing Activity Plenty of “Dry Powder”
22
April: $150 million share repurchase program
Evaluating a securitization program (Fall 2014)
($ in millions)
(1) As of May 30, 2014. Lenders have signed commitments for the upsizing and syndication of the Citi SFR facility; however, definitive documents with respect to such transaction have not been entered into as May 30, 2014.
(1)
$380
$200
Total Capacity and
Commitments
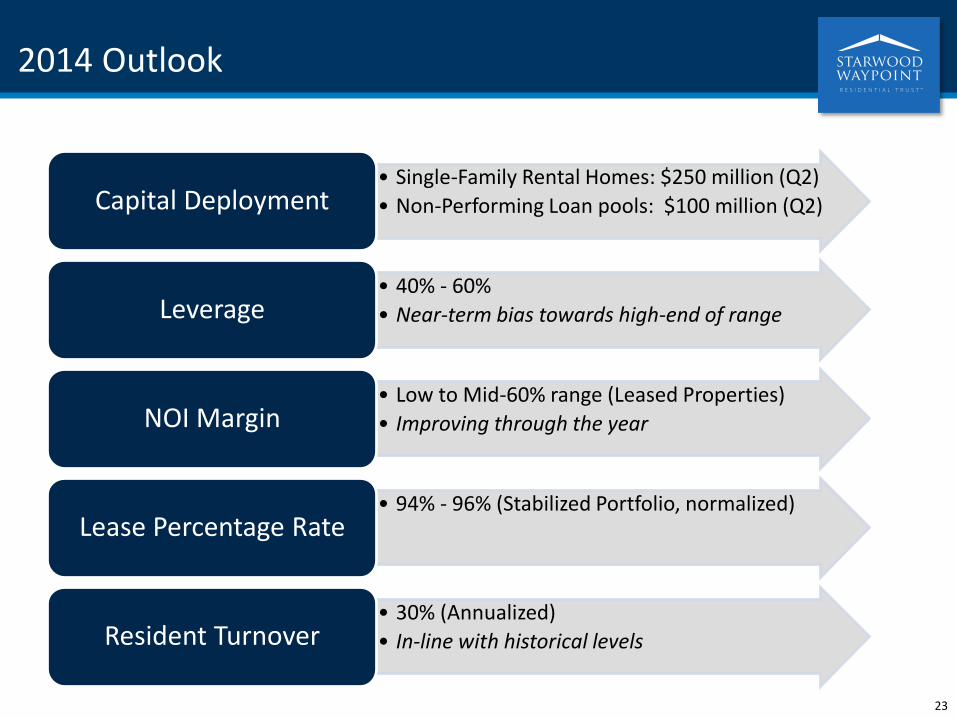
2014 Outlook
• Single-Family Rental Homes: $250 million (Q2)
• Non-Performing Loan pools: $100 million (Q2)Capital Deployment
• 40% - 60%
• Near-term bias towards high-end of rangeLeverage
• Low to Mid-60% range (Leased Properties)
• Improving through the yearNOI Margin
• 94% - 96% (Stabilized Portfolio, normalized)Lease Percentage Rate
• 30% (Annualized)
• In-line with historical levelsResident Turnover
23

Summary: Why Starwood Waypoint?
High quality portfolio of homes
— Carefully selected neighborhoods in 10 target markets
— Attractive opportunities to invest in SFR and NPL
Growing book of cash-flowing assets
— Anticipate positive Core FFO later this year
— Supports initiation of a dividend in the near future
Strong and flexible balance sheet
— $770 million of undrawn debt capacity and commitments
Experienced management team
— Proven technology platform
Partnership with Starwood Capital Group
— Provides resources, talent, ideas, deal flow
24
Humble, TX
Sarasota, FL
Adelanto, CA

Appendix

Total Rental Homes Portfolio - March 31, 2014
(1) Excludes 154 homes that were acquired through Prime or other third-party managers that are not designated as rental homes.(2) Includes acquisition costs and actual and estimated upfront renovation costs. Actual renovation costs may exceed estimated renovation costs, and we may acquire homes in the
future with different characteristics that result in higher renovation costs.
Markets
Stabilized
Homes
Non-
Stabilized
Homes
Total
Homes(1)
Total Homes
Leased (%)
Average
Acquisition
Cost
Average
Investment
per Home(2)
Aggregate
Investment
($ in millions)
Average
Home Size
(sq. ft.)
Weighted
Average Age
(year)
Average
Rent
Atlanta 1,131 665 1,796 66.0% 93,469$ 113,662$ 204.1$ 1,883 21 1,140$
South Florida 1,119 369 1,488 88.6% 130,499$ 150,303$ 223.5 1,585 45 1,549$
Houston 735 195 930 79.4% 126,139$ 136,731$ 127.2 2,064 29 1,479$
Tampa Bay 539 233 772 76.6% 106,872$ 121,919$ 94.1 1,482 40 1,239$
Dallas 480 139 619 77.9% 121,432$ 137,884$ 85.4 1,977 22 1,431$
Chicago 185 162 347 60.5% 123,015$ 146,143$ 50.7 1,564 41 1,638$
Southern California 202 86 288 72.2% 237,750$ 247,508$ 71.3 1,612 36 1,780$
Orlando 195 46 241 87.1% 123,451$ 139,278$ 33.6 1,711 36 1,297$
Denver 137 84 221 63.8% 172,617$ 198,633$ 43.9 1,407 30 1,701$
Northern California 192 24 216 90.7% 215,105$ 228,676$ 49.4 1,490 45 1,716$
Phoenix 154 49 203 81.8% 142,952$ 158,321$ 32.1 1,558 38 1,187$
Las Vegas 34 8 42 83.3% 155,717$ 167,376$ 7.0 1,966 27 1,290$
California Valley 39 2 41 87.8% 226,226$ 226,697$ 9.3 1,728 25 1,610$
Total/Average 5,142 2,062 7,204 76.6% 125,955$ 143,216$ 1,031.6$ 1,743 33 1,398$
Status
Total
Homes(1)
Total Homes
Leased (%)
Average
Acquisition
Cost
Average
Investment
per Home(2)
Aggregate
Investment
($ in millions)
Average
Home Size
(sq. ft.)
Weighted
Average Age
(year)
Average
Rent
Stabilized 5,142 96.4% 128,076$ 143,432$ 737.5$ 1,731 32 1,394$
Non-Stabilized 2,062 27.2% 120,666$ 142,677$ 294.1 1,771 33 1,409$
Total/Average 7,204 76.6% 125,955$ 143,216$ 1,031.6$ 1,743 33 1,398$
27

Non-Performing Loan Portfolio - March 31, 2014
27
Total Total Total
Loan Purchase Price Unpaid Principal Balance ("UPB") Broker Price Opinion ("BPO") Purchase Price Purchase Price Weighted Average
State Count ($ in millions) ($ in millions) ($ in millions) as % of UPB as % of BPO Loan-to-Value ("LTV")
Florida 730 $ 87.7 $ 184.0 $ 136.2 47.7% 64.4% 160.3%
New York 171 33.9 67.3 66.6 50.4% 50.9% 128.2%
California 165 47.2 69.3 74.1 68.1% 63.7% 107.3%
New Jersey 154 21.7 47.0 40.0 46.2% 54.3% 140.0%
Illinois 106 13.8 27.7 22.5 49.8% 61.3% 152.2%
Maryland 103 17.9 32.7 26.3 54.7% 68.1% 143.0%
Pennsylvania 67 6.4 11.3 10.2 56.6% 62.7% 132.8%
Georgia 55 7.0 12.0 11.2 58.3% 62.5% 127.0%
Other 544 66.9 109.9 104.0 60.9% 64.3% 121.0%
Total/Average 2,095 $ 302.5 $ 561.2 $ 491.1 53.9% 61.6% 137.8%
Total
Loan Purchase Price Total UPB Total BPO Purchase Price Purchase Price Weighted
Status Count ($ in millions) ($ in millions) ($ in millions) as % of UPB as % of BPO Average LTV
Foreclosure 1,263 $ 161.6 $ 341.2 $ 269.5 47.4% 60.0% 114.3%
Delinquent 594 113.0 170.2 176.3 66.4% 64.1% 151.3%
Performing 238 27.9 49.8 45.3 56.0% 61.6% 126.2%
Total/Average 2,095 $ 302.5 $ 561.2 $ 491.1 53.9% 61.6% 137.8%

Definitions and Reconciliations
Funds From Operations (“FFO”) and Core Funds from Operations (“Core FFO”). FFO is used by industry analysts and investors as a supplemental performance measure of an equity real estate investment trust (“REIT”). FFO is defined by the National Association of Real Estate Investment Trusts (“NAREIT”) as net income or loss (computed in accordance with accounting principles generally accepted in the United States) excluding gains or losses from sales of previously depreciated real estate assets, plus depreciation and amortization of real estate assets and adjustments for unconsolidated partnerships and joint ventures.
We believe that FFO is a meaningful supplemental measure of the operating performance of our single-family home business because historical cost accounting for real estate assets in accordance with GAAP assumes that the value of real estate assets diminishes predictably over time, as reflected through depreciation. Because real estate values have historically risen or fallen with market conditions, management considers FFO an appropriate supplemental performance measure because it excludes historical cost depreciation, as well as gains or losses related to sales of previously depreciated homes, from GAAP net income. By excluding depreciation and gains or losses on sales of real estate, management uses FFO to measure returns on its investments in real estate assets. However, because FFO excludes depreciation and amortization and captures neither the changes in the value of the homes that result from use or market conditions nor the level of capital expenditures to maintain the operating performance of the homes, all of which have real economic effect and could materially impact the our results from operations, the utility of FFO as a measure of our performance is limited.
We believe that Core FFO is a meaningful supplemental measure of our operating performance for the same reasons as FFO and adjusting for non-routine items that when excluded allows for more comparable periods. Our Core FFO begins with FFO as defined by the NAREIT White Paper and is adjusted for: acquisition fees expensed, non-recurring acquisition pursuit costs and property management costs; non-recurring costs associated with the separation, and other non-comparable items as applicable.
Management also believes that FFO/Core FFO, combined with the required GAAP presentations, is useful to investors in providing more meaningful comparisons of the operating performance of a company’s real estate between periods or as compared to other companies. FFO/Core FFO does not represent net income or cash flows from operations as defined by GAAP and is not intended to indicate whether cash flows will be sufficient to fund cash needs. It should not be considered an alternative to net income as an indicator of the REIT’s operating performance or to cash flows as a measure of liquidity. Our FFO/Core FFO may not be comparable to the FFO of other REITs due to the fact that not all REITs use the NAREIT or similar Core FFO definition. For a reconciliation of FFO and Core FFO to net loss attributable to common shareholders determined in accordance with GAAP please refer to page 10.
Stabilized Homes. We define the stabilized home portfolio to include homes from the first day of initial occupancy or subsequent occupancy after a renovation. Homes are considered stabilized even after subsequent resident turnover. However, homes may be removed from the stabilized homes portfolio and placed in the non-stabilized home portfolio due to renovation during the home lifecycle.
Total Home Portfolio Net Operating Income (“NOI”) and Leased Home Portfolio NOI. We define Total Home Portfolio NOI, as total property revenues less property operating and maintenance expenses and real estate taxes and insurance expenses (“property operating expenses”). We define Leased Home Portfolio NOI as the Total Home Portfolio NOI excluding property operating expenses on non-stabilized homes and vacant stabilized homes. We consider Total Home Portfolio NOI and Leased Home Portfolio NOI to be appropriate supplemental measures of operating performance to net income attributable to common shareholders because they reflect the operating performance of our homes without allocation of corporate level overhead or general and administrative costs and exclude property operating expenses on homes that are not producing revenue. A reconciliation of net loss attributable to common shareholders to Total Home Portfolio NOI and Leased Home Portfolio NOI is provided below:
Total Home Portfolio NOI and Leased Home Portfolio NOI should not be considered alternatives to net loss or net cash flows from operating activities, as determined in accordance with GAAP, as indications of our performance or as measures of liquidity. Although we use these non-GAAP measures for comparability in assessing their performance against other REITs, not all REITs compute the same non-GAAP measures. Accordingly, there can be no assurance that our basis for computing these non-GAAP measures are comparable with that of other REITs.
For the Three Months Ended
($ in thousands) March 31, 2014
Reconciliation of net loss to Stabilized Home Portfolio NOI
Net loss attributable to common shareholders $ (15,308)
Add (deduct) adjustments to get to total home portfolio NOI
Mortgage loan servicing costs 5,241
Non-performing loan management fees and expenses 2,006
General and administrative 5,815
Investment management fees 2,757
Separation costs 3,543
Acquisition pursuit costs and property management engagement costs 554
Interest expense, including amortization 1,500
Depreciation and amortization 5,473
Impairment of real estate 834
Gain (loss) on sales of investments in real estate, net 145
Gain on non-performing loans, net (1,843)
Gain on loan conversions, net (5,414)
Income tax expense 135
Net loss attributable to non-controlling interests (10)
Total home portfolio NOI 5,428
Add (deduct) adjustments to get to total leased home portfolio NOI
Property operating expenses on non-stabilized homes 2,204
Property operating expenses on vacant stabilized homes 355
Total leased portfolio NOI 7,987$
28
Related Documents